7788 J. Dairy Sci. 97:7788–7803 http://dx.doi.org/10.3168/jds.2014-8336 © American Dairy Science Association ® , 2014. ABSTRACT Diet composition defines the amount and type of nutrients absorbed by dairy cows. Endocrine-metabolic interactions can influence these parameters, and so nutrient availability for the mammary gland can signifi- cantly vary and affect milk yield and its composition. Six dairy cows in early and then late lactation received, for 28 d in a changeover design, 2 diets designed to provide, within the same stage of lactation, similar amounts of rumen fermentable material but either high starch plus sugar (HS) content or low starch plus sugar content (LS). All diets had similar dietary crude protein and calculated supply of essential amino acids. Dry matter intake within each stage of lactation was similar between groups. Milk yield was similar between groups in early lactation, whereas a higher milk yield was observed in late lactation when feeding HS. At the metabolic level, the main difference observed between the diets in both stages of lactation was lower blood glucose in cows fed LS. The lower glucose availability during consumption of LS caused substantial modifi- cations in the circulating and postprandial pattern of metabolic hormones. Feeding LS versus HS resulted in an increase in the ratio of bovine somatotropin to insulin. This increased mobilization of lipid reserves resulted in higher blood concentrations of nonesterified fatty acids and β-hydroxybutyrate, which contributed to the higher milk fat content in both stages of lacta- tion in the LS group. This greater recourse to body fat stores was confirmed by the greater loss of body weight during early lactation and the slower recovery of body weight in late lactation in cows fed LS. The lower insu- lin to glucagon ratio observed in cows fed LS in early and late lactation likely caused an increase in hepatic uptake and catabolism of amino acids, as confirmed by the higher blood urea concentrations. Despite the higher catabolism of amino acids in LS in early lacta- tion, similar milk protein output was observed for both diets, suggesting similar availability of amino acids for peripheral tissue and mammary gland. The latter could be the result of sparing of amino acids at the gut level due to starch that escaped from the rumen, and to the balanced amino acid profile of digestible protein. This last aspect appears worthy of further research, with the aim to enhance the efficiency of protein metabolism of dairy cows, reducing environmental nitrogen pollution without affecting milk yield potential. Key words: dairy cow, starch level, metabolism, milk composition INTRODUCTION The need to produce milk with a composition tailored to specific processing requirements has resulted in milk pricing based on its quality. This, in turn, has led to an increased interest in understanding the mechanisms affecting milk composition; namely, fat and protein synthesis and output, and to the mechanisms that alter the physico-chemical properties of milk, particularly the cheese-making features (Calamari et al., 2010; Bit- tante et al., 2012). Besides genetic improvement (Bittante et al., 2012), studies have concentrated on those characteristics of the diet that may increase nutrient availability and the rate of nutrient utilization by the mammary gland (Petitclerc et al., 2000). In ruminants, these studies are complex, as physico-chemical characteristics and dif- ferent combinations of feed can widely alter nutrient output from the rumen (Clark et al., 1992; Brito et al., 2007) and, in turn, modify the type and amount of nutrients that are absorbed and delivered by the portal-drained viscera into the bloodstream (Reynolds et al., 1994). Several studies have examined the effects of diet on milk fat (Palmquist et al., 1993; Chilliard et al., 2007) and protein (DePeters and Cant, 1992; Firkins et al., 2006), but less attention has been placed on the endo- Effect of dietary starch level and high rumen-undegradable protein on endocrine-metabolic status, milk yield, and milk composition in dairy cows during early and late lactation F. Piccioli-Cappelli,* 1 J. J. Loor ,† C. J. Seal,‡ A. Minuti,* and E. Trevisi* *Istituto di Zootecnica, Facoltà di Scienze Agrarie, Alimentari e Ambientali, Università Cattolica del Sacro Cuore, 29122 Piacenza, Italy †Mammalian NutriPhysioGenomics, Department of Animal Sciences and Division of Nutritional Sciences, University of Illinois, Urbana 61801 ‡Human Nutrition Research Centre, School of Agriculture, Food & Rural Development, Newcastle University, Newcastle upon Tyne, NE1 7RU United Kingdom Received May 7, 2014. Accepted September 11, 2014. 1 Corresponding author: [email protected]

Welcome message from author
This document is posted to help you gain knowledge. Please leave a comment to let me know what you think about it! Share it to your friends and learn new things together.
Transcript

7788
J. Dairy Sci. 97 :7788–7803http://dx.doi.org/ 10.3168/jds.2014-8336 © American Dairy Science Association®, 2014 .
ABSTRACT
Diet composition defines the amount and type of nutrients absorbed by dairy cows. Endocrine-metabolic interactions can influence these parameters, and so nutrient availability for the mammary gland can signifi-cantly vary and affect milk yield and its composition. Six dairy cows in early and then late lactation received, for 28 d in a changeover design, 2 diets designed to provide, within the same stage of lactation, similar amounts of rumen fermentable material but either high starch plus sugar (HS) content or low starch plus sugar content (LS). All diets had similar dietary crude protein and calculated supply of essential amino acids. Dry matter intake within each stage of lactation was similar between groups. Milk yield was similar between groups in early lactation, whereas a higher milk yield was observed in late lactation when feeding HS. At the metabolic level, the main difference observed between the diets in both stages of lactation was lower blood glucose in cows fed LS. The lower glucose availability during consumption of LS caused substantial modifi-cations in the circulating and postprandial pattern of metabolic hormones. Feeding LS versus HS resulted in an increase in the ratio of bovine somatotropin to insulin. This increased mobilization of lipid reserves resulted in higher blood concentrations of nonesterified fatty acids and β-hydroxybutyrate, which contributed to the higher milk fat content in both stages of lacta-tion in the LS group. This greater recourse to body fat stores was confirmed by the greater loss of body weight during early lactation and the slower recovery of body weight in late lactation in cows fed LS. The lower insu-lin to glucagon ratio observed in cows fed LS in early and late lactation likely caused an increase in hepatic uptake and catabolism of amino acids, as confirmed by the higher blood urea concentrations. Despite the
higher catabolism of amino acids in LS in early lacta-tion, similar milk protein output was observed for both diets, suggesting similar availability of amino acids for peripheral tissue and mammary gland. The latter could be the result of sparing of amino acids at the gut level due to starch that escaped from the rumen, and to the balanced amino acid profile of digestible protein. This last aspect appears worthy of further research, with the aim to enhance the efficiency of protein metabolism of dairy cows, reducing environmental nitrogen pollution without affecting milk yield potential. Key words: dairy cow , starch level , metabolism , milk composition
INTRODUCTION
The need to produce milk with a composition tailored to specific processing requirements has resulted in milk pricing based on its quality. This, in turn, has led to an increased interest in understanding the mechanisms affecting milk composition; namely, fat and protein synthesis and output, and to the mechanisms that alter the physico-chemical properties of milk, particularly the cheese-making features (Calamari et al., 2010; Bit-tante et al., 2012).
Besides genetic improvement (Bittante et al., 2012), studies have concentrated on those characteristics of the diet that may increase nutrient availability and the rate of nutrient utilization by the mammary gland (Petitclerc et al., 2000). In ruminants, these studies are complex, as physico-chemical characteristics and dif-ferent combinations of feed can widely alter nutrient output from the rumen (Clark et al., 1992; Brito et al., 2007) and, in turn, modify the type and amount of nutrients that are absorbed and delivered by the portal-drained viscera into the bloodstream (Reynolds et al., 1994).
Several studies have examined the effects of diet on milk fat (Palmquist et al., 1993; Chilliard et al., 2007) and protein (DePeters and Cant, 1992; Firkins et al., 2006), but less attention has been placed on the endo-
Effect of dietary starch level and high rumen-undegradable protein on endocrine-metabolic status, milk yield, and milk composition in dairy cows during early and late lactation F. Piccioli-Cappelli ,*1 J. J. Loor ,† C. J. Seal ,‡ A. Minuti ,* and E. Trevisi * * Istituto di Zootecnica, Facoltà di Scienze Agrarie, Alimentari e Ambientali, Università Cattolica del Sacro Cuore, 29122 Piacenza, Italy † Mammalian NutriPhysioGenomics, Department of Animal Sciences and Division of Nutritional Sciences, University of Illinois, Urbana 61801 ‡ Human Nutrition Research Centre, School of Agriculture, Food & Rural Development, Newcastle University, Newcastle upon Tyne, NE1 7RU United Kingdom
Received May 7, 2014. Accepted September 11, 2014. 1 Corresponding author: [email protected]

Journal of Dairy Science Vol. 97 No. 12, 2014
STARCH LEVEL, METABOLISM, AND MILK COMPOSITION 7789
crine-metabolic influences on milk composition. In fact, the latter could play an essential role in determining milk characteristics (Hart, 1983), but through different mechanisms. These mainly depend on the stage of lac-tation, which manifests in wide variations in hormone concentrations throughout lactation, as a consequence of natural changes in the energy balance of the dairy cow (Vernon 1989; Bertoni et al., 1995; Blum et al., 2000).
A classic example of the effect of the endocrine sys-tem on milk characteristics is the injection of recom-binant bST, one of the main hormones involved in the partitioning of nutrients in ruminants. When recombi-nant bST is injected into dairy cows, significant effects on milk yield (Burton et al., 1994) and composition (Bertoni et al., 1992) are observed. Insulin, another hormone important in nutrient partitioning, has been demonstrated to increase protein yield (Mackle et al., 1999) and decrease fat yield (Gaynor et al., 1995; Reyn-olds et al., 2001).
Knowledge of the effect of diet on the endocrine-metabolic system could aid in designing further studies to determine the efficiency of nutrient utilization for milk synthesis (Broderick, 2003; Firkins et al., 2006), which is needed to improve the sustainability of dairy production. Despite the fact that several studies have been conducted to clarify the role of nutrition on milk composition of dairy cows, few have investigated the relationship with the endocrine system and metabolism during lactation.
According to this framework, the aim of our research was to provide a comprehensive evaluation of metabol-ic, hormonal, and lactational responses in dairy cows in early and late lactation when fed diets with different energy content and rumen fermentability rate but with similar CP content and rumen degradability.
MATERIALS AND METHODS
Animals and Experimental Diets
The research was carried out using 6 multiparous Italian-Friesian dairy cows (age 6.3 ± 2.2 yr, 592 ± 77 kg of BW at the beginning of the trial) with average genetic merit (7,953 ± 640 kg of milk in the previ-ous lactation). Cows were housed in an artificially lit and cooled tiestall barn at the Università Cattolica del Sacro Cuore located in the Po Valley (Piacenza, Italy). The barn was maintained under almost constant climatic (about 20°C, 60–70% relative humidity, 14 h of light and 10 h of dark) and managerial conditions (operators, similar batches of feeds). The study was performed with the same cows, starting from 30 DIM for the early-lactation phase of the study and from 190
DIM for the late-lactation phase. This study complied with Italian laws on animal experimentation (DL n. 116, 27/01/1992) and ethics.
Cows were blocked into 2 homogeneous groups of 3 cows each in both lactation stages (in early lactation, homogeneous for milk yield and characteristics; in late lactation, also for days of pregnancy). The groups re-ceived alternately, for periods of 28 d, 2 different diets in a changeover experimental design. The 4 diets (2 fed in early and 2 fed in late lactation) were based on a forage mixture of corn silage, hay (alfalfa and perennial grass), and concentrate (Table 1). Theoretical energy and protein requirements of the cows were calculated according to NRC (2001), and, combining the different feed, the diets were designed to have rumen-ferment-able OM (Tamminga et al., 1994) equal to 12.2 kg/d in early and 10.3 kg/d in late lactation, but with different rates of carbohydrate fermentability. This was achieved with different contents of starch and sugars; that is, high in the high starch (HS) and low in the low starch (LS) diet (Table 1), with the aim of obtaining differ-ent ruminal production rates of propionic acid and a consequential chronic increase in circulating concentra-tions of insulin with HS diets (Bauman and Currie, 1980). The diets were similar in CP content (15.5% in both stages, Table 1), rumen soluble protein, and RUP. The latter was calculated according to Tamminga et al. (1994) to provide a level of available digestible protein at the intestine similar between diets within the same lactation stage; that is, 2 kg/d in early lactation and 1.5 kg/d in late lactation.
To provide the required RUP in both groups and in both stages of lactation, the proportions of corn gluten feed, linseed meal, fish meal, feather meal, nonrumi-nant blood meal (the study was performed before the European Community’s restriction on the use of animal sources in ruminant nutrition), and protected methio-nine and lysine were adjusted to provide a predicted AA profile of the intestinal digestible protein (rumen microbial protein plus RUP) similar to that of milk protein. In particular, total microbial protein yield was estimated according to Tamminga et al. (1994), whereas the AA composition was assumed from the literature. The AA composition of rumen microbial protein was an average of data reported by Clark et al. (1992) and Mantysaari et al. (1989); for AA composition of RUP, the feed data from Ganev et al. (1979) and Mantysaari et al. (1989) were used; for the rate of AA absorption in the gut and the rate of their availability to mammary gland for uptake and inclusion in milk protein, calcula-tions proposed by Riis et al. (1990) were used; and for AA composition of milk protein, an average of the data reported by Alais (1984), Evans and Patterson (1985), Mantysaari et al. (1989), and Rohr and Lebzien (1991)
7790 PICCIOLI-CAPPELLI ET AL.
Journal of Dairy Science Vol. 97 No. 12, 2014
was used. In addition, lysine (Relys, Vetagro SpA, Reg-gio Emilia, Italy; its lysine content was 50% on an as-fed basis, of which 35% was tested to be rumen bypass by nylon-bag technique) and methionine (Overmet 40%, Ascor Chimici s.r.l., Forli, Italy; its methionine content was 40% on an as-fed basis, of which 50% was tested to be rumen bypass by nylon-bag technique) balance was calculated according to NRC (2001).
Forages were offered ad libitum. The forages were fed at 12-h intervals (0730 h and 1930 h), and the concen-trates were fed at a ratio of 1 kg for every 3 kg of milk and distributed in 8 equal meals at 0130, 0430, 0700, 1030, 1230, 1530, 1900, and 2230 h, using an automatic feeder.
During the period intervening between the 2 stages of lactation, cows were fed a diet based on forage from the same batches used in the trials. The concentrate differed to provide a similar intake of CP (15.5% of DM) but with less RUP (34% CP) and an intermediate content of starch plus sugar (21% DM).
Feed Intake and Diet Composition
Feed intake of individual cows was measured daily during each experimental period. Gross analysis and nutritive value of feeds were evaluated in representative samples collected twice per week for the forages, and every 2 wk for corn silage and concentrates. Chemical
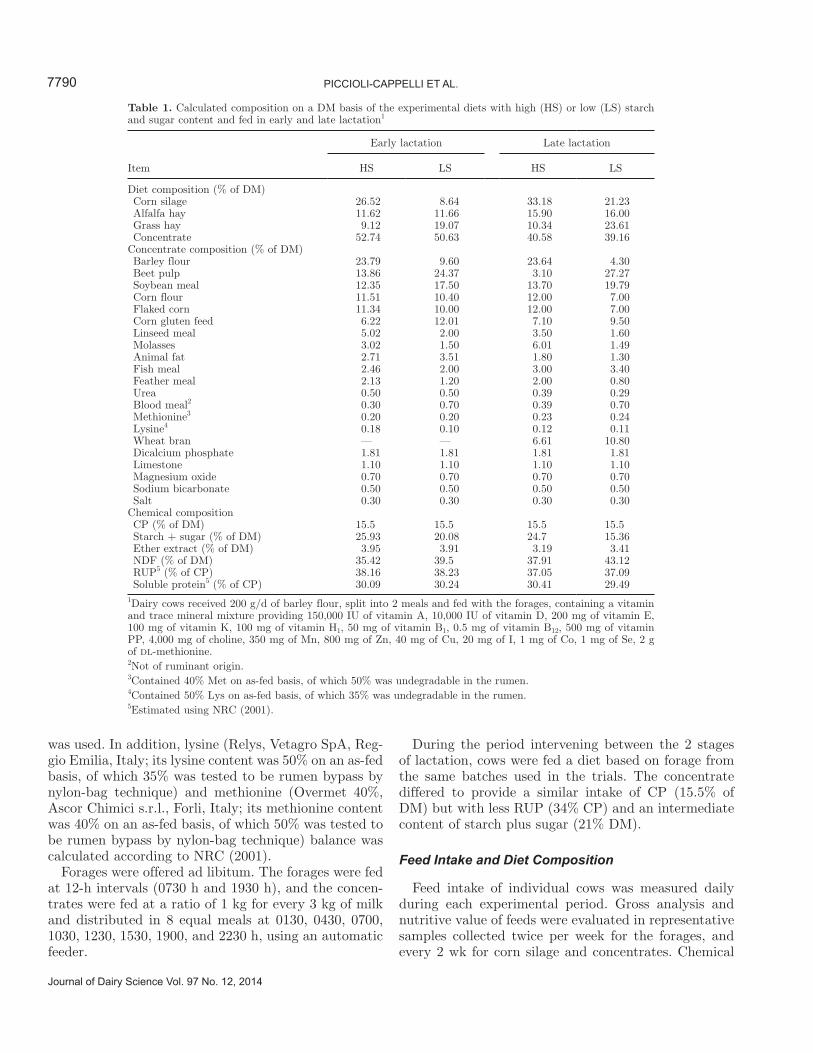
Table 1. Calculated composition on a DM basis of the experimental diets with high (HS) or low (LS) starch and sugar content and fed in early and late lactation1
Item
Early lactation Late lactation
HS LS HS LS
Diet composition (% of DM) Corn silage 26.52 8.64 33.18 21.23 Alfalfa hay 11.62 11.66 15.90 16.00 Grass hay 9.12 19.07 10.34 23.61 Concentrate 52.74 50.63 40.58 39.16Concentrate composition (% of DM) Barley flour 23.79 9.60 23.64 4.30 Beet pulp 13.86 24.37 3.10 27.27 Soybean meal 12.35 17.50 13.70 19.79 Corn flour 11.51 10.40 12.00 7.00 Flaked corn 11.34 10.00 12.00 7.00 Corn gluten feed 6.22 12.01 7.10 9.50 Linseed meal 5.02 2.00 3.50 1.60 Molasses 3.02 1.50 6.01 1.49 Animal fat 2.71 3.51 1.80 1.30 Fish meal 2.46 2.00 3.00 3.40 Feather meal 2.13 1.20 2.00 0.80 Urea 0.50 0.50 0.39 0.29 Blood meal2 0.30 0.70 0.39 0.70 Methionine3 0.20 0.20 0.23 0.24 Lysine4 0.18 0.10 0.12 0.11 Wheat bran — — 6.61 10.80 Dicalcium phosphate 1.81 1.81 1.81 1.81 Limestone 1.10 1.10 1.10 1.10 Magnesium oxide 0.70 0.70 0.70 0.70 Sodium bicarbonate 0.50 0.50 0.50 0.50 Salt 0.30 0.30 0.30 0.30Chemical composition CP (% of DM) 15.5 15.5 15.5 15.5 Starch + sugar (% of DM) 25.93 20.08 24.7 15.36 Ether extract (% of DM) 3.95 3.91 3.19 3.41 NDF (% of DM) 35.42 39.5 37.91 43.12 RUP5 (% of CP) 38.16 38.23 37.05 37.09 Soluble protein5 (% of CP) 30.09 30.24 30.41 29.491Dairy cows received 200 g/d of barley flour, split into 2 meals and fed with the forages, containing a vitamin and trace mineral mixture providing 150,000 IU of vitamin A, 10,000 IU of vitamin D, 200 mg of vitamin E, 100 mg of vitamin K, 100 mg of vitamin H1, 50 mg of vitamin B1, 0.5 mg of vitamin B12, 500 mg of vitamin PP, 4,000 mg of choline, 350 mg of Mn, 800 mg of Zn, 40 mg of Cu, 20 mg of I, 1 mg of Co, 1 mg of Se, 2 g of dl-methionine.2Not of ruminant origin.3Contained 40% Met on as-fed basis, of which 50% was undegradable in the rumen.4Contained 50% Lys on as-fed basis, of which 35% was undegradable in the rumen.5Estimated using NRC (2001).

Journal of Dairy Science Vol. 97 No. 12, 2014
STARCH LEVEL, METABOLISM, AND MILK COMPOSITION 7791
composition of the feeds was determined using standard procedures (AOAC International, 2012).
Health Status, BW, and BCS Evaluation
Incidence of health problems was accurately recorded for each cow throughout the entire experimental period. Cows were weighed at the beginning of each experi-mental period and on d 14 and 28 of each period. On the same days, BCS was evaluated using the 5-point scale proposed by Edmonson et al. (1989) by the same researcher throughout the study.
Blood Sampling and Analyses
Blood samples were harvested from the jugular vein into 10-mL heparinized vacuum tubes (Vacutainer, Becton Dickinson, Plymouth, UK), immediately before the morning meal (basal level) and every 3 to 4 d in the last 14 d of each experimental period, and used for the determination of metabolic profile and hormones (bST, insulin, glucagon, and thyroid hormones). At the end of each of the 28-d experimental periods, blood samples were collected before the morning concentrate and forage meal (time 0) and at 2, 4, 6, 8, and 12 h after the meal for the subsequent determination of glucose, urea, NEFA, BHBA, bST, insulin, and thyroid hormones. Blood samples were immediately placed in iced water until centrifugation. A small amount of blood was used for determination of packed cell volume (Centrifugette 4203, ALC International Srl, Cologno Monzese, Italy), and the remainder was centrifuged within 1 h of collection at 3,500 × g for 16 min at 4°C. Aliquots of the plasma obtained were frozen at −20°C until further analysis. Blood metabolites were analyzed at 37°C by clinical centrifuge-analyzer (Monarch 2000, Instrumentation Laboratory, Lexington, MA). Glucose, urea, total protein, creatinine, Ca, P, and lactic acid dehydrogenase were determined using standard kits purchased from Instrumentation Laboratory. For other metabolites, dedicated methods or kit were adapted to the same blood analyzer. Albumin was determined colorimetrically by reaction with bromocresol green using the method proposed by Friedman and Young (1997), whereas globulin was calculated as the differ-ence between total protein and albumin. Ceruloplasmin was determined following minor modification of the method proposed by Sunderman and Nomoto (1970); the acetate buffer was changed to 0.8 M, pH 6.4, and contained 0.31% Na-EDTA; BHBA was determined as described by Barnouin et al. (1986), without deprot-einization; triglycerides were determined by enzymatic method (GPO-Trinder; kit from Instrumentation Labo-ratory Co., Lexington, MA). Dedicated kits purchased
from Boehringer-Mannheim (Milan, Italy) were used for the determination of total cholesterol (Trinder en-zymatic method), aspartate aminotransferase (AST/GOT) and γ-glutamyl transpeptidase (GGT). Both GOT and GGT were determined at 25°C. Magnesium and NEFA were determined by adapting kits purchased from Wako Chemicals GmbH (Neuss, Germany). Zinc was determined using a commercial kit provided by Roche (Basel, Switzerland). Electrolytes (Na+, K+, and Cl−) were detected by the potentiometer method (ion selective electrode connected to Monarch 2000, Instru-mentation Laboratory).
Plasma concentration of bST was quantified by a heterologous double antibody radioimmunoassay us-ing materials and procedures obtained through the National Hormone and Peptide Program and the Na-tional Institute of Diabetes and Digestive and Kidney Diseases (Torrance CA). Highly purified bST (reagent AFP-11182B/AFP-9884C) was used for standards (useful concentration range: 0–100 ng/mL) and for iodination (by the iodogen method of Salacinski et al. (1981). Monkey anti-bovine bST serum (AFP-B55Bb) was used as the primary antibody (1:500,000 final tube dilution). Precipitation of the antigen-antibody complexes was obtained by a goat anti-human gamma-globulin (Jackson ImmunoResearch Labs, West Grove, PA) as second antibody (2.0% final dilution) together with normal human serum (0.2%) and diluted poly-ethylene glycol (PEG 6000, 3.0% final tube dilution). Spike, recovery, and linearity testing yielded results within the 85 to 120% range of expected concentra-tions. Inter- and intraassay coefficients of variation (CV) were 4.0 and 6.2%, respectively. Total circulating triiodothyronine (T3) and thyroxine (T4) in plasma were assayed by a commercially available solid-phase RIA (Coat-A-Count, Diagnostic Products Corp., Los Angeles, CA). Both free and protein-bound T3 and T4 were measured by the aid of blocking agents for thyroid-binding proteins, with no effect on hormones measurement by variations in total protein concentra-tion. The CV for the T3 assay were 3.6% (within assay) and 5.0% (between assay) and for T4 were 4.7% (within assay) and 5.9% (between assay).
Glucagon was analyzed by a commercially avail-able kit: a double-antibody RIA for human glucagon (Diagnostic Products Corp.) as human and bovine AA sequences are identical. The CV were 5.8% within assay and 7.9% between assay.
Insulin concentration in plasma was assayed by a double-antibody RIA kit for human insulin (DSL 1600; Diagnostic Systems Laboratories Inc., Webster, TX) that used a polyclonal antibody with high cross-reactivity to bovine insulin. For bovine plasma samples, the kit was validated by performing linearity testing in
7792 PICCIOLI-CAPPELLI ET AL.
Journal of Dairy Science Vol. 97 No. 12, 2014
which observed compared with expected results were in the range 85 to 115%. The intra- and interassay CV were 7.5 and 9.5%, respectively.
Milk Sampling and Analyses
Cows were milked twice daily at 0630 and 1630 h throughout lactation. Milk yield of individual cows was recorded at each milking. During the last 7 d of each experimental period, for each cow, a representative milk sample of evening and morning milkings was col-lected at 3- to 4-d intervals, and pooled on the weight of respective milk yield. These milk samples were used for the measurement of fat, protein, lactose and urea content. Fat, protein, and lactose were assessed by near infrared assay (Milko Scan 133B, Foss Electric, Hill-erød, Denmark). Urea was determined on skim milk by a spectrometric assay, using the IL Test Urea Nitrogen kit, purchased from Instrumentation Laboratory using the Monarch 2000 clinical auto-analyzer. Somatic cell count was determined using a Fossomatic automated somatic cell counter (Fossomatic 180, Foss Electric).
Statistical Analysis
The first 14 d of each period were for adaptation to diets and, consequently, only data collected during the last 14 d of each period were used for statistical analyses. Descriptive statistics are expressed as the mean ± standard error. Box-Cox transformations were performed for NEFA and AST/GOT concentrations; for all other parameters, normality of distribution was acceptable. For convenience, all descriptive data are presented in their untransformed form.
Data for BW, BCS, morning blood samples, and milk yield and composition were statistically analyzed using the MIXED procedure of SAS (release 9.1; SAS Insti-tute Inc., Cary, NC), with cow as a random variable and according to the following model:
Yijkl = μ + Ci + Dj + Tk + Sl + DSjl + eijkl,
where Yijkl = dependent variable, μ = overall mean, Ci = effect of the ith cow (6 cows), Dj = effect of the jth diet (HS, LS), Tk = effect of the kth sequence of diet (2 levels), Sl = effect of the lth stage of lactation (early and late lactation), DSjl = the interaction between the jth diet and the lth stage of lactation, and eijkl = re-sidual error.
Data for blood parameters collected during the day were analyzed as repeated measures in sampling time using the MIXED procedure of SAS (Littell et al., 2006). The model included cow, diet, hour (hours from first concentrate meal), and the interaction of diet and
hour. For the blood parameter with differences at time zero, data for each cow served as covariate.
The model used can be summarized as follows:
Yijklm = μ + Ci + Dj + Fk + Tl + DFjk
+ Sm + DSjm + eijklm,
where Yijklm = dependent variable, μ = overall mean, Ci = effect of the ith cow (6 cows), Dj = effect of the jth diet (HS, LS), Fk = effect of the kth hour (2, 4, 6, 8, 11, and 24 h after first meal of concentrate), DFjk = effect of the interaction between the jth diet and the kth hour to first meal of concentrate, Tl = effect of the lth sequence of diet (2 levels), Sm = effect of the mth stage of lactation (early and late lactation), DSjm the interaction between the jth diet and the mth stage of lactation, and eijklm = residual error.
The analysis was carried out using 3 covariance structures: autoregressive order, compound symmetry, and spatial power. These were ranked according to their Akaike information criterion, with the one having the lowest Akaike information criterion being eventu-ally chosen (Littell et al., 2006). For each treatment, least squares means were computed, and preplanned pairwise comparisons (PDIFF option; SAS Inst. Inc.) were conducted when the F-test of one of the main factors (time, diet, diet × time) was significant at P < 0.05. Statistical significance was designated as P < 0.05, and tendencies were declared at P < 0.10.
RESULTS
Composition of Diets and Nutrient Intakes
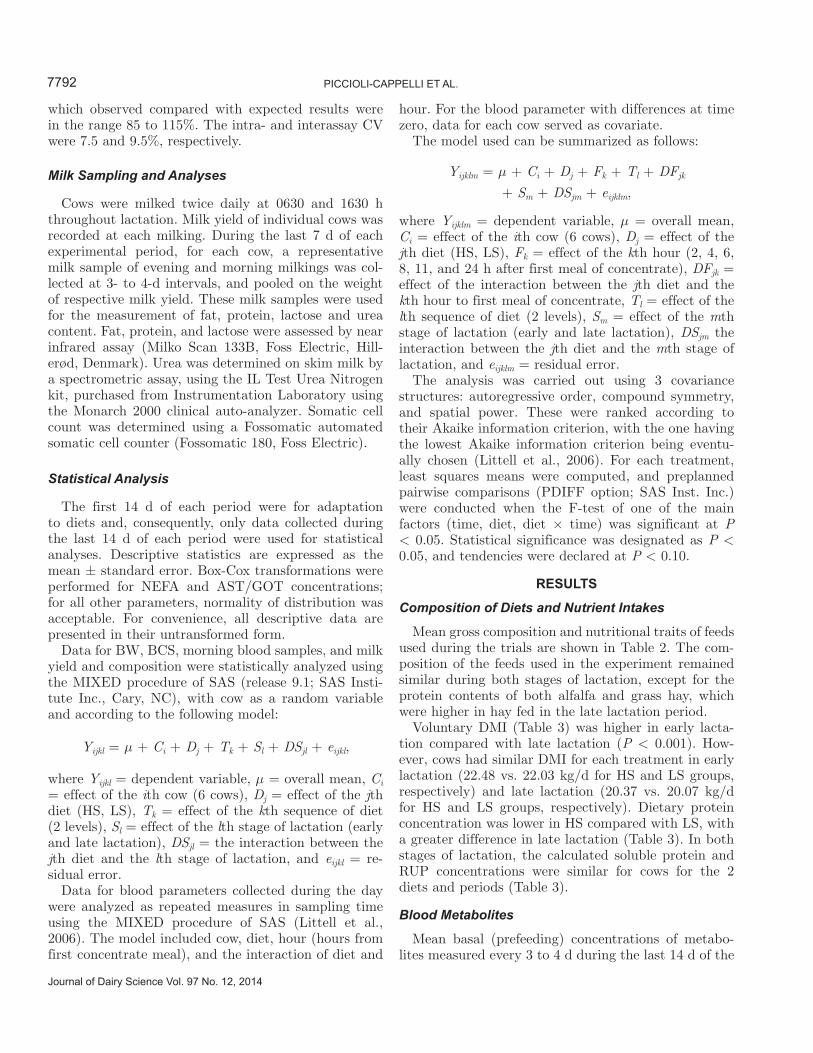
Mean gross composition and nutritional traits of feeds used during the trials are shown in Table 2. The com-position of the feeds used in the experiment remained similar during both stages of lactation, except for the protein contents of both alfalfa and grass hay, which were higher in hay fed in the late lactation period.
Voluntary DMI (Table 3) was higher in early lacta-tion compared with late lactation (P < 0.001). How-ever, cows had similar DMI for each treatment in early lactation (22.48 vs. 22.03 kg/d for HS and LS groups, respectively) and late lactation (20.37 vs. 20.07 kg/d for HS and LS groups, respectively). Dietary protein concentration was lower in HS compared with LS, with a greater difference in late lactation (Table 3). In both stages of lactation, the calculated soluble protein and RUP concentrations were similar for cows for the 2 diets and periods (Table 3).
Blood Metabolites
Mean basal (prefeeding) concentrations of metabo-lites measured every 3 to 4 d during the last 14 d of the
Journal of Dairy Science Vol. 97 No. 12, 2014
STARCH LEVEL, METABOLISM, AND MILK COMPOSITION 7793
study are shown in Table 4. Their mean concentrations during the day in LS and HS, measured on d 28 of the experimental periods, are shown in Table 5, and their daily patterns are shown in Figure 1.
Lactation stage did not affect basal plasma glucose concentrations (Table 4). In both stages of lactation, the basal concentration of glucose was higher (P < 0.05) in HS cows (Table 4). The average daily glucose concen-tration was higher when cows were fed the HS diet, but only in early lactation (Table 5). In early lactation, the pattern of change of glucose after the forage meal was most variable with the HS diet, and the concentration of glucose was always higher in HS compared with LS at 2, 4, and 6 h after the meal (P < 0.05; Figure 1). In late lactation, the pattern of glucose after the forage meal was similar between dietary treatments.
Basal and average daily concentrations of NEFA were significantly lower in late lactation. Feeding the LS diet resulted in significantly higher basal concentrations of NEFA, but only in early lactation (Table 4). The aver-age daily concentration of NEFA (Table 5) was higher with the LS diet in both stages of lactation. In early lactation, the concentration of NEFA after feeding was always higher in LS cows than in HS cows (P < 0.05 at 6 and 8 h after meal; Figure 1).
Basal plasma cholesterol concentrations were higher in early compared with late lactation (Table 4). The only effect of the diets on plasma cholesterol was ob-served in early lactation, where feeding the LS diet resulted in a higher concentration (Table 4; P < 0.05).
Basal concentration of BHBA was higher when cows were fed the LS diet. In early lactation, the difference between LS and HS was marked (P < 0.05; Table 4). During the day, the average concentration between the forage meals was also higher in LS compared with HS and in both stages of lactation (Table 5). Again, the differences were marked in early lactation (P < 0.05 at 2, 6, and 12 h after the main morning meal; Figure 1). Concentrations of triglycerides were higher in late compared with early lactation (P < 0.001, Table 4), but diet had no effect on this metabolite.
The basal plasma concentration of urea (Table 4) was lower in cows fed HS compared with LS in both stages of lactation, but was significant only in late lactation (P < 0.05). Feeding the LS diet resulted in higher av-erage daily concentrations of urea in plasma in both stages of lactation (Table 5): the highest concentrations were observed from 4 to 12 h after the morning forage meal (Figure 1).
The basal concentration of creatinine in plasma was higher in late compared with early lactation (P < 0.01). The only effect due to the different diets was the lower concentration observed when LS diet was fed in late lactation (Table 4).T
able
2. G
ross
com
posi
tion
and
nut
rition
al t
raits
of fee
ds u
sed
to c
ompo
se t
he d
iets
with
high
(H
S) a
nd low
(LS)
sta
rch
plus
sug
ar c
onte
nts
fed
in e
arly
and
lat
e la
ctat
ion
Item
Ear
ly lac
tation
Lat
e la
ctat
ion
Cor
n si
lage
Hay
Con
cent
rate
Cor
n si
lage
Hay
Con
cent
rate
Alfa
lfaG
rass
HS
LS
Alfa
lfaG
rass
HS
LS
DM
(%
)30
.07
90.3
390
.09
90.8
390
.84
34.2
089
.70
89.7
789
.98
91.0
7C
P (
% o
f D
M)
6.91
14.8
48.
2321
.03
21.1
36.
8918
.08
9.55
21.1
122
.10
Eth
er e
xtra
ct (
% o
f D
M)
2.58
1.46
1.27
6.38
6.80
2.49
1.20
1.41
5.95
5.81
Cru
de fib
er (
% o
f D
M)
23.3
832
.27
32.1
06.
077.
9022
.33
28.3
630
.96
4.72
8.05
Ash
(%
of D
M)
5.57
10.0
79.
538.
809.
186.
5410
.67
9.94
8.42
8.33
ND
F (
% o
f D
M)
52.3
750
.62
62.1
525
.35
28.0
850
.01
47.3
059
.63
22.1
727
.91
Star
ch +
sug
ar (
% o
f D
M)
24.4
54.
305.
5031
.87
23.7
223
.61
5.13
6.24
36.4
323
.76
NE
L (
Mca
l/kg
of D
M)
1.51
1.16
1.08
2.12
2.06
1.50
1.20
1.11
2.12
2.08

7794 PICCIOLI-CAPPELLI ET AL.
Journal of Dairy Science Vol. 97 No. 12, 2014
Blood Hormones
Mean basal concentrations of hormones measured ev-ery 3 to 4 d during the last 14 d of the study are shown in Table 4. The mean concentrations of blood hormones during the day in LS and HS, measured on d 28 of the experimental periods, are shown in Table 5, and their daily patterns are shown in Figure 2.
Basal and average daily concentrations of bST were lower in late than in early lactation (Table 4 and 5). In both stages of lactation, the basal concentration of bST was lower when the HS diet was fed (P < 0.05). Daily mean concentrations were similar between groups in early lactation, whereas bST concentrations tended to be lower when the LS diet was fed in late lactation (Table 5), with a significant difference at 4 h after the morning meal (Figure 2).
Basal and mean daily concentrations of insulin were lower in early compared with late lactation (P < 0.001). In both stages of lactation, the basal concentration of insulin tended to be lower when feeding the LS diet (P < 0.1; Table 4). Also, the mean daily concentration was lower when the LS diet was fed, and this effect was significant in both stages of lactation (P < 0.05; Table 5). In particular, the more marked differences between the diets were observed 2 and 4 h after the meal in early and late lactation, respectively (Figure 2).
The basal and average concentrations after forage meals of both of the thyroid hormones (T3 and T4) were lower in early lactation (P < 0.001; Table 4). The basal concentrations of these hormones were lower when the LS diet was fed but this only tended to be significant for T3 in early lactation (P < 0.1; Table 4). The average concentrations of plasma T3 were not affected by diet
Table 3. Mean DMI and characteristics of the 2 experimental diets with high (HS) and low (LS) starch plus sugar contents and fed to dairy cows in early and late lactation
Item
Early lactation Late lactation
HS LS HS LS
DMI (kg/d) 22.48 22.03 20.37 20.07Chemical composition NEL (Mcal/kg of DM) 1.58 1.56 1.53 1.49 CP (% of DM) 15.24 15.60 14.76 15.32 Starch + sugars (% of DM) 24.56 18.14 24.32 17.04 Ether extract (% of DM) 4.26 4.37 3.57 3.35 NDF (% of DM) 38.10 41.33 39.32 43.81Estimated RUP1 (% of CP) 36.80 36.30 35.58 34.48 Soluble protein1 (% of CP) 29.85 30.43 30.94 30.42 RUS2 (kg/d) 1.27 1.03 1.13 0.68 Methionine3 (%) 141 136 144 144 Lysine3 (%) 127 123 131 1341Reevaluated using NRC (2001) after feed analyses.2Rumen-undegradable starch, reevaluated using NRC (2001) after feed analyses.3Rate of requirement satisfied with the diets estimated using calculations reported by NRC (2001).
Table 4. Average basal value (prefeeding) of blood metabolites and hormones in dairy cows fed for 28 d diets with high (HS) and low (LS) starch plus sugar contents during early and late lactation (least squares means of samples collected every 3 to 4 d during last 14 d of the period)
Item
Early lactation Late lactation
SEM
P-value1
HS LS HS LS Stage Diet × stage
Glucose (mmol/L) 3.91a 3.63b 3.79a 3.67b 0.4678 NS †Cholesterol (mmol/L) 8.37a 9.02b 6.41 6.57 0.4678 *** †NEFA (mmol/L) 0.115a 0.192b 0.057 0.061 0.0182 *** *BHBA (mmol/L) 0.504a 0.799b 0.540 0.633 0.0785 NS †Triglycerides (mmol/L) 0.091 0.096 0.110 0.114 0.0064 *** NSCreatinine (μmol/L) 88.96 90.07 94.61a 91.80b 1.4574 ** *Urea (mmol/L) 4.93 5.16 4.77a 5.28b 0.1816 NS NSbST (ng/mL) 2.45a 2.96b 2.08a 2.57b 0.2170 * NSInsulin (mU/mL) 6.34a 5.36b 9.42c 8.62d 0.6384 *** NSTriiodothyronine (ng/mL) 1.26a 1.19b 1.41 1.37 0.0394 *** NSThyroxine (ng/mL) 43.51 40.67 54.12 51.69 2.1642 *** NSGlucagon (pg/mL) 81.87a 104.4b 107.8c 117.6d 8.3954 ** NSa,b; c,dLeast squares means in the same row and within a stage of lactation without a common superscript differ at P < 0.05 (a,b) or P < 0.1 (c,d).1Stage = stage of lactation; diet × stage = interaction between diet and stage of lactation.NS = P > 0.10; †P < 0.1; *P < 0.05; **P < 0.01; ***P < 0.001.

Journal of Dairy Science Vol. 97 No. 12, 2014
STARCH LEVEL, METABOLISM, AND MILK COMPOSITION 7795
(Table 5), whereas plasma T4 concentration was lower in LS in early lactation compared with HS (P < 0.05). Considering the pattern after the meal, the only differ-ence in the concentration of T4 was seen at 6 h after the forage meal, which was lower in LS compared with HS in early lactation (Figure 2).
Basal concentrations of glucagon were lower in early compared with late lactation (P < 0.01; Table 4). Feed-ing HS diets reduced glucagon concentrations in early lactation (P < 0.05) and tended (P = 0.08) to reduce glucagon concentrations in late lactation (Table 4).
BW and BCS
The data for BW and BCS and their variations are shown in Table 6. Average BW did not differ between lactation stages and dietary treatments. Differences were instead observed for mean daily BW variations; specifically, in early lactation, cows on the HS diet gained BW, whereas cows on the LS diet lost BW (P < 0.05). During late lactation, average daily BW gain increased with both dietary treatments and, although it resulted in numerically higher values for HS, the differ-ence was not significant (Table 6). Average values for BCS were higher (P < 0.01) in late lactation, but no differences between diets were observed.
Milk Yield and Characteristics
The changing pattern of milk production across lac-tation was similar regardless of diet (Figure 3) and was characterized by a slow decrease but with a less-steep decline in late lactation when the HS diet was fed. Con-sidering the last 14 d of treatments, the overall effect of this response was a similar milk yield between groups in early lactation and a higher (P < 0.05) milk yield for cows fed the HS diet in late lactation (Table 6).
In agreement with the predicted natural pattern of changes across lactation stage, milk fat content was higher during late lactation (P < 0.05), whereas total fat yield was higher in early lactation (P < 0.01; Table 6). Comparison of the diets revealed that the milk fat content of bulk samples was always higher (P < 0.10 in early and P < 0.05 in late lactation) for cows fed the LS diet. The opposite pattern of milk yield and fat content in response to diet resulted in an absence of difference for fat yield at both stages of lactation; for FCM, in contrast, a significant effect of dietary treatment, with a higher level for HS, was observed in late lactation (P < 0.05; Table 6).
Protein content and yield were similar between groups in early lactation, whereas both content and yield were significantly higher (P < 0.05) in late lactation with the HS dietary treatment (Table 6). Lactose content and yield were higher in early lactation. Moreover, lactose yield and content were similar between dietary treat-ments in early lactation, whereas both were lower (P < 0.05) in LS in late lactation (Table 6).
Milk urea content was lower in early compared with late lactation (P < 0.01; Table 6). In both stages of lactation, milk urea content was lower with the HS di-etary treatment (Table 6), but this was only significant in early lactation (P < 0.05). Somatic cell count was higher in late than in early lactation (P < 0.001), but diet had no effect on this parameter.
DISCUSSION
Diet
The higher DMI during early lactation is consistent with the increased nutrient requirements to maintain higher milk yield in this stage of lactation. We observed no significant differences in DMI between experimental
Table 5. Least squares means (not covaried) of average daily value (of sampling at 2, 4, 6, 8, 12 h after the a.m. forage meal) of blood metabolites and hormones in dairy cows fed for 28 d diets with high (HS) and low (LS) starch plus sugar contents
Item
Early lactation Late lactation
SEM
P-value1
HS LS HS LS Stage
Diet × Time
Early Late
Glucose (mmol/L) 3.90a 3.60b 3.70 3.75 0.0623 NS NS **Urea (mmol/L) 5.24a 5.76b 5.06a 5.52b 0.2337 NS ** NSNEFA (mmol/L) 0.034a 0.091b 0.039a 0.048b 0.0044 * NS *BHBA (mmol/L) 0.628a 0.895b 0.656c 0.714d 0.0955 NS NS †bST (ng/mL) 2.58 2.60 1.55c 1.84d 0.1971 ** NS NSInsulin (mU/mL) 9.16a 6.69b 14.18a 11.37b 1.2353 ** NS NSTriiodothyronine (ng/mL) 1.29 1.34 1.57 1.61 0.0612 *** † NSThyroxine (ng/mL) 45.00a 42.11b 54.95 54.32 2.3573 *** NS NSa,b; c,dLeast squares means in the same row and within a stage of lactation without a common superscript differ at P < 0.05 (a,b) or P < 0.1 (c,d).1Stage = stage of lactation; diet × time = interaction between diet and time for single stage of lactation.NS = P > 0.10; †P < 0.1; *P < 0.05; **P < 0.01; ***P < 0.001.

7796 PICCIOLI-CAPPELLI ET AL.
Journal of Dairy Science Vol. 97 No. 12, 2014
diets, despite the marked difference in forage intake (Table 1) and consequent NDF concentration of the diet (Table 3). This agrees with the suggestion of Al-len (2000) that, within the range of dietary NDF typi-cally fed to dairy cows, DMI is affected by digestibility of forage fiber, which in turn affects reticulo-rumen
distension rather than the specific ratio of forage to concentrate. In our experiment, the latter may have been limited between the diets by the feeding manage-ment and, in particular, by the regular distribution of feed over the day (i.e., chopped forages every 12 h and concentrates every 3 h), by the gradual (4–5 d) replace-
Figure 1. Daily pattern of changes in blood glucose, NEFA, BHBA, and urea (mean ± SEM) in dairy cows in early (�) and late (�) lactation fed for 28 d diets with high (HS; —) and low (LS; - - -) starch and sugar content; blood was collected on d 28. Significant difference between HS and LS diets within the same stage of lactation is denoted by § in early lactation and by # in late lactation for P < 0.05, and by (§) in early lactation and by (#) in late lactation for P < 0.1.White arrow indicates forage meal; black arrow indicates concentrate meal.

Journal of Dairy Science Vol. 97 No. 12, 2014
STARCH LEVEL, METABOLISM, AND MILK COMPOSITION 7797
ment at each dietary change, and by the equal palat-ability of the diets, which ensured adequate adaptation to the different diets.
During late lactation, at the levels of intake achieved, the diets provided adequate energy to meet estimated
requirements. In early lactation, in contrast, energy needs were close to balance only when cows were fed the HS diet and not when they were fed the LS diet (100.2 and 93.2% of NEL requirement for HS and LS, respectively).
Figure 2. Daily pattern of changes in blood bST, insulin, triiodothyronine (T3), and thyroxine (T4) (mean ± SEM), in dairy cows in early (�) and late (�) lactation fed for 28 d diets with high (HS; —) and low (LS; - - -) starch and sugar content; blood was collected on d 28. Significant difference between HS and LS diets within the same stage of lactation is denoted by § in early lactation and by # in late lactation for P < 0.05, and by (§) in early lactation and by (#) in late lactation for P < 0.1. White arrow indicates forage meal; black arrow indicates concentrate meal.

7798 PICCIOLI-CAPPELLI ET AL.
Journal of Dairy Science Vol. 97 No. 12, 2014
The difference in CP concentration of the diets was difficult to explain because, within each stage of lacta-tion, the hay and corn silage, as well as the grain flour and meal used to make up the concentrates, were the same. Nevertheless, as a consequence of the slightly higher DMI observed with the HS diet, the total in-take of dietary CP was similar between groups in both experimental periods. In accordance with the different milk yields for each stage of lactation, the CP require-ment (NRC, 2001) was met in late lactation with both diets, but not in early lactation (89.2 vs. 91.9% of requirement for HS and LS, respectively). Despite this, the suggested supply of methionine and lysine was achieved with both diets and in both stages of lactation (Table 3).
Blood Metabolites and Hormones
In early lactation, feeding HS compared with LS re-sulted in greater intake of starch plus sugars (1.52 kg/d more in HS than in LS diet), which explains the higher blood glucose concentrations in both the basal and the mean postprandial states (Tables 4 and 5, Figure 1). The starch and sugar content of the HS diet was likely to be more fermentable because it was derived from corn silage and barley flour (Table 1). As such, it is reasonable to expect that HS compared with LS led to changes in the ruminal fermentation pattern, with an increase in the production and availability of the glu-coneogenic precursor propionate (Bauman et al., 1971; Sutton et al., 2003; Agle et al., 2010). Using measured
DMI and the starch content of the diets, the differ-ences in estimated starch escaping the rumen across diets should not have modified the portal appearance of glucose (Parker, 1990). Our results are consistent with previous studies that have correlated ruminal pro-pionate production with higher glucose turnover and hepatic glucose release (Lomax and Baird, 1983; Seal et al., 1992). However, published blood glucose responses to diets differing in the ratio of forage to concentrate have not been consistent, even in dairy cows at similar stages of lactation, consuming similar DMI, and pro-ducing similar amounts of milk. For instance, similar to our results, Rulquin and Delaby (1997) observed higher blood glucose concentrations in early lactating cows fed higher amount of net energy. In contrast, neither Rigout et al. (2003), infusing propionate in the rumen (at 1.72 and 3.45 Mcal/d), nor Knowlton et al. (1998), infusing 1.5 kg/d of glucose (into rumen or abomasum), observed an increase in circulating blood glucose con-centrations.
The significant increase in insulin concentration from 4 to 6 h after the main morning meal observed in our experiment was similar to that observed by Blum et al. (2000) and, according to the findings of Bertoni et al. (1995), confirmed that the main factor increasing insulin concentration was the forage meals (Figure 2). This meal-dependent increase in insulin response was observed in all cows, even during early lactation. The increase was also observed when the LS diet was fed, which was characterized by a negative energy balance, as indicated by the BW decrease (Table 6). Neverthe-
Table 6. Mean BW, daily BW gain, BCS, milk yield, and milk composition for the last 14 of the 28 d of trial, of dairy cows in early and late lactation and fed diets with high (HS) and low (LS) starch content
Item
Early lactation Late lactation
SEM
P-value1
HS LS HS LS Stage
BW (kg) 593 593 605 613 26.09 NSBW gain (kg/d) 0.37a −0.08b 0.63 0.33 0.1874 *BCS2 2.26 2.24 2.46 2.53 0.0995 **Yield (kg/d) Milk 36.8 36.6 22.1a 20.6b 1.2602 *** 3.5% FCM 38.1 38.8 23.1a 22.2b 0.9540 *** Fat 1.36 1.41 0.83 0.82 0.0413 ** Protein 1.06 1.06 0.76a 0.68b 0.0365 ** Lactose 1.94 1.90 1.09a 1.01b 0.0646 ***Milk composition Fat (%) 3.69c 3.86d 3.79a 4.01b 0.1466 *Protein (%) 2.89 2.91 3.46a 3.35b 0.1180 ***Lactose (%) 5.26 5.19 4.92a 4.88b 0.0800 ***Urea N (mg/dL) 10.06a 12.17b 13.22 13.97 0.8730 **SCC (logN/mL) 1.78 1.77 2.18 2.15 0.1439 ***a,b; c,dLeast squares means in the same row and within a stage of lactation without a common superscript differ at P < 0.05 (a,b) or P < 0.1 (c,d).1Stage = stage of lactation.2Edmonson et al. (1989).NS = P > 0.10; *P < 0.05; **P < 0.01; ***P < 0.001.

Journal of Dairy Science Vol. 97 No. 12, 2014
STARCH LEVEL, METABOLISM, AND MILK COMPOSITION 7799
less, the amount of starch fed and stage of lactation influenced the amplitude of this postprandial insulin increase, with the highest increase of insulin concentra-tions observed in late lactating cows fed the HS diet (Figure 2).
Comparing differences between the stages of lacta-tion, it was evident that insulin concentration was lower during early lactation, when the responsiveness of insulin secretion to blood glucose concentration is expected to be lower. This and the contemporary lower responsiveness of peripheral tissues to the hor-mone (Vernon, 1989) could be the main determinants of the numerically higher blood glucose concentrations when cows were fed HS in early lactation. In contrast, improved insulin sensitivity during late lactation may explain the lack of significant differences in blood glu-
cose concentration between treatments at this stage of lactation. This improved insulin sensitivity could also explain the lower daily concentration of blood glucose in cows fed the HS diet in late lactation compared with early lactation (Tables 4 and 5), likely due to a greater uptake of the metabolite by body tissues, as confirmed by a higher rate of BW increase in these cows (Table 6).
As observed for insulin, the pattern of bST in plasma was also affected by the morning forage meal in both groups at both stages of lactation. Concentrations of bST decreased after the morning forage meals except for the HS diet in early lactation, when a slight increase was observed. Consistent with the lower concentration of insulin, blood bST concentration was higher when the LS diets was fed, confirming the more precarious energetic balance and the consequent higher catabolism of the peripheral tissues in those cows. Such a response was particularly evident when examining the basal concentrations (Table 4), where cows fed LS had higher bST concentrations compared with HS-fed animals.
During early lactation, blood bST concentrations are naturally higher with respect to late lactation (Hart, 1983; Blum et al., 2000), and this was also evident in the present experiment, particularly when comparing the bST concentrations over time (Table 6, Figure 2). The observed pattern is mainly due to the negative en-ergy balance of high-yielding cows, but it is interesting to note that, even though the HS diet met the theoreti-cal energy requirements in early lactation, blood bST concentrations remained higher. During late lactation, when the energy requirements of the cow were met or exceeded, the higher bST secretion observed when the LS diet was fed might have been linked to lower propionate production in the rumen (calculated intake of NFC was 84.7% of the requirement suggested by NRC, 2001); consequently, this may have led to lower propionate availability for glucose synthesis in the liver. In such a situation, insulin concentration is lower and bST higher to spare glucose oxidation by the peripheral tissues (Gluckman et al., 1987; Bauman, 2000).
The greater ratio of bST:insulin in plasma of cows when the LS diet was fed, which was more evident during early lactation but still appreciable during late lactation, likely led to greater reliance on lipid body stores, resulting in the higher concentrations of circu-lating NEFA. Such a response was observed by Rulquin and Delaby (1997) when restricting the feed intake to obtain a reduction of 13% of NEL. Blood cholesterol concentration is an index of circulating lipoproteins (Bruss, 1997). Therefore, the higher concentration of cholesterol observed in the LS group (Table 4) could also be taken as an indicator of greater mobilization and utilization of body lipid stores as a consequence of lower dietary energy availability. The higher lipid mo-
Figure 3. Pattern of change of milk yield (mean ± SEM) of dairy cows in early (top) and late (bottom) lactation fed diets with high starch (HS) and low starch (LS) contents.
7800 PICCIOLI-CAPPELLI ET AL.
Journal of Dairy Science Vol. 97 No. 12, 2014
bilization in cows fed LS may have resulted in greater hepatic synthesis of lipoproteins to metabolize more ef-fectively the circulating NEFA released during lipolysis in adipose tissue.
The higher plasma BHBA concentration in cows fed the LS diet in early lactation, along with NEFA and bST, indicate greater utilization of NEFA by the liver for the production of ketone bodies. The lack of difference between the diets in BHBA concentrations within the day was likely due to the fact that, although the basal BHBA concentration (before feeding) arises mainly from metabolism of NEFA, the postfeeding in-crease is the result of the latter plus the BHBA resulting from butyric acid absorbed by the rumen, which would be expected to be higher when the HS diet was fed, as recently observed by Argov-Argaman et al. (2012).
Although total N intake was slightly lower for the HS diet, the lower plasma urea concentration might not reflect changes in ruminal fermentation pattern because the greater intake of fermentable carbohydrate and degradable protein should have enhanced the syn-chrony of nitrogen and energy release into ruminal fluid. Hence, the HS diet should have guaranteed adequate microbial growth and ruminal protein synthesis (Nocek and Russell, 1988). The difference between diets; that is, the higher urea observed when cows were fed the LS diet, could arise from higher exogenous and endogenous ammonia production when the LS diet was fed. The LS diet was characterized by slightly higher dietary CP that, due to a lower availability of rapid fermented carbohydrates, may have determined greater ammonia absorption from the rumen. Moreover, lower propionate availability in liver when feeding the LS diet, and the consequent catabolic condition described above, would have resulted in a greater reliance on dietary and body reserve AA as glucose precursors (Rulquin and Delaby, 1997). During early lactation, this last response was further confirmed by the higher basal concentrations of glucagon in cows fed LS, which had low fermentability compared with HS (Table 3). When availability of pro-pionate is lower, glucagon stimulates gluconeogenesis from AA in the liver, with a higher rate of ammonia entry into the urea cycle (Hippen et al., 1999). Despite this, during early lactation, the cows on the LS diet had a milk protein yield similar to that of HS, which would indicate an adequate availability of AA. Total CP intake was similar between LS and HS through the 2 stages of lactation, which could explain the lack of effect of lactation stage on urea concentration (Tables 4 and 5). Nevertheless, milk protein yield was signifi-cantly lower in late than in early lactation (Table 6); consequently, in late lactation, the amount of AA that do not enter either milk protein yield or gluconeogen-esis (urea production) was likely addressed for protein
tissue synthesis. In fact, BW gain was higher in late lactation (Table 6). Greater synthesis of muscular protein at this stage of lactation is confirmed by the higher concentration of plasma creatinine (Finco, 1997; Baxmann et al., 2008). Interestingly, HS cows showed significantly higher concentrations of plasma creatinine compared with LS, which supports the greater BW gain (Table 6). This anabolic situation was favored by the higher concentration of insulin seen in late lactation (Tables 4 and 5).
Along with the higher plasma concentration of insu-lin and lower concentration of bST, the slightly higher concentration of thyroid hormones, particularly evident in early lactation for prefeeding concentration of T3 (Table 4; P < 0.10) and mean daily concentration of T4 (Table 5; P < 0.05), could be taken as additional evi-dence that cows fed HS had a greater degree of nutrient availability. A lower concentration of these hormones particularly during early lactation is consistent with observations of Blum et al. (2000) and reflects the nega-tive energy balance observed when the LS diet was fed.
The concentrations of other blood metabolites mea-sured to monitor health status (globulin, ceruloplas-min, and zinc) and liver functionality (GOT, GGT, and albumin) of the cows were all within the normal ranges reported by Bertoni and Trevisi (2013) for cows at both stages of lactation (Supplemental Table S1; http://dx.doi.org/10.3168/jds.2014-8336). This confirms that all dairy cows were in a good state of health during the experimental periods and that the diets fed did not affect liver functionality or overall health status.
Milk Yield
The pattern of milk yield over time was similar with both diets (Figure 3); that is, a gradual decrease over time but with a less-steep decline when the HS diet was fed, which was more evident during late lactation. The overall effects of this response were similar yields of milk during early lactation and a higher milk yield for cows fed the HS diet (Table 6) during late lactation (P < 0.05).
As observed in early lactation when the HS diet was fed (i.e., higher blood glucose but similar milk and lactose yields with respect to the LS diet), increasing the availability of glucose to the mammary gland does not necessarily result in greater milk yield. A possible explanation for this could be a limited capacity of the mammary gland to absorb glucose from the blood dur-ing early lactation, when the mRNA of the main insu-lin-independent glucose transporters GLUT1 (Bionaz and Loor, 2011; Mattmiller et al., 2011), GLUT3, and GLUT8 (Bionaz and Loor, 2011) are already at maxi-mal expression. Conversely, expression of these trans-

Journal of Dairy Science Vol. 97 No. 12, 2014
STARCH LEVEL, METABOLISM, AND MILK COMPOSITION 7801
porters decreases from peak to late lactation (Bionaz and Loor, 2011), whereas that of the insulin-dependent GLUT4 transporter increases due to the higher blood insulin concentration in blood (Mattmiller et al., 2011).
A balanced AA supply may also have contributed to limit the difference in milk yield between groups. For instance, Bach et al. (2000), feeding cows diets with the same level of energy but with 15% CP (DM basis) with low or high EAA profile and diets with 18% CP (DM basis) with low or high EAA profile, observed a tendency for greater milk yield in cows fed diets with the higher EAA profile. Those data suggest that in our experiment during early lactation, the milk yield of cows receiving the LS diet could also be sustained by enhancing the availability of EAA.
Milk Characteristics
Milk fat content was higher during late lactation, in agreement with the predicted pattern of changes across lactation (Walstra and Jenness, 1984). The consistently higher milk fat content with similar fat yield regardless of stage of lactation in cows fed the LS diet seems to confirm the theory of McGuire et al. (1995) that insu-lin has little role in the control of milk fat synthesis. However, it is likely that the different concentrations of circulating NEFA during early and late lactation between the groups would have affected the fatty acid composition of milk fat (Rulquin and Delaby, 1997). The higher fat content in the milk of the cows of the LS group in late lactation is noteworthy as it could affect cheese making.
When the current experiment was planned, we calcu-lated, according to Tamminga et al. (1994) and NRC (2001), that the theoretical flux of digestible protein to the gut would be similar between diets [i.e., in early lactation, 2 kg/d of gut-digestible protein (Tamminga et al., 1994) and 2.83 kg/d for HS and 2.91 kg/d for LS of MP (NRC, 2001)]. The purpose was to potentially maintain a higher flux of EAA to the small intestine, sparing EAA from deamination in gut tissues due to the availability of luminal glucose derived from starch escaping ruminal fermentation (Table 3). This could have contributed to the lack of difference in protein yield in the LS and HS cows in early lactation.
Previous studies have reported that increasing the availability of glucose in the gut may result in decreased gut tissue metabolism and increased portal appearance of AA (Piccioli-Cappelli et al., 1997). Furthermore, milk protein yield could also have been supported by match-ing the EAA profile of the digestible protein to the EAA profile of milk protein, as observed in the studies of Rulquin and Delaby (1997) and Bach et al. (2000). The higher milk protein content and yield observed in
late lactation when the HS diet was fed could be at-tributed in part to greater mammary protein synthesis as a result of higher insulin concentration (McGuire et al., 1995).
CONCLUSIONS
At the metabolic level, the main difference observed between the LS and HS diets in both stages of lactation was a marked difference in the concentration of cir-culating glucose, which determined substantial modifi-cations in the circulating and postprandial pattern of metabolic hormones, with corresponding variations in the blood concentration of other metabolites. In par-ticular, feeding the LS diet compared with the HS diet resulted in an increase in the ratio of bST to insulin, which determined greater mobilization of lipid reserves, resulting in higher blood concentrations of NEFA and BHBA. This caused an increase in the availability of precursors for mammary gland fat synthesis, which resulted in higher milk fat content when cows were fed the LS diet. Moreover, feeding the LS diet decreased the insulin:glucagon ratio, with a consequent increase in urea yield from catabolism of amino acids. Despite this effect, the milk protein output was similar between diets in early lactation, because cows fed the LS diet supported the synthesis of milk protein through higher mobilization of body reserves and the high availability of dietary EAA. This last aspect appears worthy of further research, with the aim to identify the interac-tion between fermentability of the diet and appropriate intestinal availability of AA, to enhance the efficiency of protein metabolism of dairy cows and to improve the utilization of dietary protein, reducing environmental nitrogen pollution without affecting milk yield poten-tial.
ACKNOWLEDGMENTS
This project was partially supported by MiPAAF-FIL-IGRANA project (D.M. 25741/7303/11-01/12/2011).
REFERENCES
Agle, M., A. N. Hristov, S. Zaman, C. Schneider, P. M. Ndegwa, and V. K. Vaddella. 2010. Effect of dietary concentrate on rumen fermentation, digestibility, and nitrogen losses in dairy cows. J. Dairy Sci. 93:4211–4222.
Alais, C. 1984. Scienza del latte. Principi di tecnologia del latte e dei derivati. Ed. Tecniche Nuove, Milano, Italy.
Allen, M. S. 2000. Effects of diet on short-term regulation of feed in-take by lactating dairy cattle. J. Dairy Sci. 83:1598–1624. http://dx.doi.org/10.3168/jds.S0022-0302(00)75030-2.
AOAC International. 2012. Official Methods of Analysis. 19th ed. AOAC International Gaithersburg, MD.
Argov-Argaman, N., O. Eshel, U. Moallem, H. Lehrer, Z. Uni, and A. Arieli. 2012. Effect of dietary carbohydrates on rumen epithelial metabolism of nonlactating heifers. J. Dairy Sci. 95:3977–3986.

7802 PICCIOLI-CAPPELLI ET AL.
Journal of Dairy Science Vol. 97 No. 12, 2014
Bach, A., G. B. Huntington, S. Calsamiglia, and M. D. Stern. 2000. Nitrogen metabolism of early lactation cows fed diets with two dif-ferent levels of protein and different amino acid profiles. J. Dairy Sci. 83:2585–2595.
Barnouin, J., N. E. Idilbi, Y. Chilliard, J. P. Chacornac, and R. Le-faivre. 1986. Micro-dosage automatisé sans déprotéinisation du 3-hydroxybutyrate plasmatique chez les bovins. Ann. Rech. Vet. 17:129–139.
Bauman, D. E. 2000. Regulation of nutrient partitioning during lac-tation: homeostasis and homeoresis revisited. Pages 311–328 in Ruminant Physiology: Digestion, Metabolism, Growth and Repro-duction. CABI International, Wallingford, UK.
Bauman, D. E., and W. B. Currie. 1980. Partitioning of nutrients dur-ing pregnancy and lactation: A review of mechanisms involving homeostasis and homeorhesis. J. Dairy Sci. 63:1514–1529.
Bauman, D. E., C. L. Davis, and H. F. Bucholtz. 1971. Propionate production in the rumen of cows fed either a control or high-grain, low-fiber diet. J. Dairy Sci. 54:1282–1287.
Baxmann, A. C., M. S. Ahmed, N. C. Marques, V. B. Menon, A. B. Pereira, G. M. Kirsztajn, and I. P. Heilberg. 2008. Influence of muscle mass and physical activity on serum and urinary creatinine and serum cystatin C. Clin. J. Am. Soc. Nephrol. 3:348–354. http://dx.doi.org/10.2215/CJN.02870707.
Bertoni, G., R. Lombardelli, and V. Cappa. 1995. Metabolite and hor-mone diurnal variations in the physiological phases of dairy cows. Zoot. Nutr. Anim. 21:271–283.
Bertoni, G., F. Piccioli Cappelli, R. Lombardelli, M. G. Maianti, and E. Brambilla. 1992. Variations of milk yield and composi-tion induced by treatment with rBST: 1. Effects of daily injection throughout a period of 21 days. Sci. Tecn. Latt. Cas. 43:18–33.
Bertoni, G., and E. Trevisi. 2013. Use of the Liver Activity Index and other metabolic variables in the assessment of metabolic health in dairy herds. Vet. Clin. North Am. Food Anim. Pract. 29:413–431. http://dx.doi.org/10.1016/j.cvfa.2013.04.004.
Bionaz, M., and J. J. Loor. 2011. Gene networks driving bovine mam-mary protein synthesis during the lactation cycle. Bioinform. Biol. Insights. 5:83–98. http://dx.doi.org/10.4137/BBI.S7003.
Bittante, G., M. Penasa, and A. Cecchinato. 2012. Invited review: Genetics and modelling of milk coagulation properties. J. Dairy Sci. 95:6843–6870.
Blum, J. W., R. M. Bruckmaier, P. Y. Vacher, A. M. Ünger, and F. Jans. 2000. Twenty-four-hour patterns of hormones and metabo-lites in week 9 and 19 of lactation in high-yielding dairy cows fed triglycerides and free fatty acids. J. Vet. Med. A Physiol. Pathol. Clin. Med. 47:43–60.
Brito, A. F., G. A. Broderick, and S. M. Reynal. 2007. Effects of dif-ferent protein supplements on omasal nutrient flow and microbial protein synthesis in lactating dairy cows. J. Dairy Sci. 90:1828–1841.
Broderick, G. A. 2003. Effects of varying dietary protein and energy levels on the production of lactating dairy cows. J. Dairy Sci. 86:1370–1381.
Bruss, M. L. 1997. Lipids and ketones. Pages 83–115 in Clinical Bio-chemistry of Domestic Animals. 5th ed. J. J. Kaneko, J. W. Har-vey, and M. L. Bruss, ed. Academic Press, San Diego, CA.
Burton, J. L., B. W. McBride, E. Block, D. R. Glimm, and J. J. Ken-nelly. 1994. A review of bovine growth hormone. Can. J. Anim. Sci. 74:167–201.
Calamari, L., F. Piccioli-Cappelli, P. Bani, M. G. Maianti, and G. Bertoni. 2010. Effect of feeding dairy cows diets with different fermentable energy on milk cheese-making features. Pages 679–680 in 3rd EAAP Int. Symp.: Energy and Protein Metabolism and Nutrition, Parma, Italy. G. M. Crovetto, ed. EAAP publication No. 127. EAAP, Rome, Italy.
Chilliard, Y., F. Glasser, A. Ferlay, L. Bernard, J. Rouel, and M. Doreau. 2007. Diet, rumen biohydrogenation and nutritional qual-ity of cow and goat milk fat. Eur. J. Lipid Sci. Technol. 109:828–855.
Clark, J. H., T. H. Klusmeyer, and R. M. Cameron. 1992. Microbial protein synthesis and flows of nitrogen fractions to the duodenum of dairy cows. J. Dairy Sci. 75:2304–2323.
DePeters, E. J., and P. Cant. 1992. Nutritional factors influencing the nitrogen composition of bovine milk: A review. J. Dairy Sci. 75:2043–2070.
Edmonson, A. J., I. J. Lean, L. D. Weaver, T. Farver, and G. Webster. 1989. A body condition scoring chart for Holstein dairy cows. J. Dairy Sci. 72:68–78.
Evans, E. H., and R. J. Patterson. 1985. Use of dynamic modeling seen as good way to formulate crude protein, amino acid requirements for cattle diets. Feedstuffs 57:24.
Finco, D. R. 1997. Kidney function. Pages 441–484 in Clinical Bio-chemistry of Domestic Animals. J. J. Kaneko, J. W. Harvey, and M. L. Bruss, ed. 5th ed. Academic Press, San Diego, CA.
Firkins, J. L., A. N. Hristov, M. B. Hall, G. A. Varga, and N. R. St-Pierre., 2006. Integration of ruminal metabolism in dairy cattle. J. Dairy Sci. 89(E. Suppl.):E31–E51.
Friedman, R. B., and D. S. Young. 1997. Effects of disease on clinical laboratory tests. Page 1068. 3rd rev ed. American Association for Clinical Chemistry Press, Washington, DC.
Ganev, G., E. R. Ørskov, and R. Smart. 1979. The effect of roughage or concentrate feeding and rumen retention time on total degrada-tion of protein in the rumen. J. Agric. Sci. 93:651–656.
Gaynor, P. J., D. R. Waldo, A. V. Capuco, R. A. Erdman, L. W. Dou-glass, and B. B. Teter. 1995. Milk fat depression, the glucogenic theory, and trans-C18:1 fatty acids. J. Dairy Sci. 78:2008–2015.
Gluckman, P. D., B. H. Breier, and S. R. Davis. 1987. Physiology of the somatotropic axis with particular references to the ruminant. J. Dairy Sci. 70:442–466.
Hart, I. C. 1983. Endocrine control of nutrient partition in lactating ruminants. Proc. Nutr. Soc. 42:181–194.
Hippen, A. R., P. She, J. W. Young, D. C. Beitz, G. L. Lindberg, L. F. Richardson, and R. W. Tucker. 1999. Metabolic responses of dairy cows and heifers to various intravenous dosages of glucagon. J. Dairy Sci. 82:1128–1138.
Knowlton, K. F., T. E. Dawson, B. P. Glenn, G. B. Huntington, and R. A. Erdman. 1998. Glucose metabolism and milk yield of cows infused abomasally or ruminally with starch. J. Dairy Sci. 81:3248–3258.
Littell, R. C., G. A. Milliken, W. W. Stroup, R. D. Wolfinger, and O. Schabenberger. 2006. SAS for Mixed Models. 2nd ed. SAS Insti-tute Inc., Cary, NC.
Lomax, M. A., and G. D. Baird. 1983. Blood flow and nutrient ex-change across the liver and gut of the dairy cow. Br. J. Nutr. 49:481–496.
Mackle, T. R., D. A. Dwyer, K. L. Ingvartsen, P. Y. Chouinard, J. M. Lynch, D. M. Barbano, and D. E. Bauman. 1999. Effects of insulin and amino acids on milk protein concentration and yield from dairy cows. J. Dairy Sci. 82:1512–1524.
Mantysaari, P. E., C. J. Sniffen, and J. D. O’Connor. 1989. An ap-plication model to balance amino acids for dairy cattle. Feedstuffs 61:13.
Mattmiller, S. A., C. M. Corl, J. C. Gandy, J. J. Loor, and L. M. Sordillo. 2011. Glucose transporter and hypoxia-associated gene expression in the mammary gland of transition dairy cattle. J. Dairy Sci. 94:2912–2922.
McGuire, M. A., J. M. Griinari, D. A. Dwyer, and D. E. Bauman. 1995. Role of insulin in the regulation of mammary synthesis of fat and protein. J. Dairy Sci. 78:816–824.
NRC. 2001. Nutrient Requirements of Dairy Cattle. 7th rev. ed. Natl. Acad. Sci., Washington, DC.
Nocek, J. E., and J. B. Russell. 1988. Protein and energy as an inte-grated system. Relationship of ruminal protein and carbohydrate availability to microbial synthesis and milk production. J. Dairy Sci. 71:2070–2107.
Palmquist, D. L., A. D. Beaulieu, and D. M. Barbano. 1993. Feeds and animal factors influencing milk fat composition. J. Dairy Sci. 76:1753–1771.
Parker, D. S. 1990. Manipulation of the functional activity of the gut by dietary and other means (antibiotics/probiotics) in ruminants. J. Nutr. 120:639–648.

Journal of Dairy Science Vol. 97 No. 12, 2014
STARCH LEVEL, METABOLISM, AND MILK COMPOSITION 7803
Petitclerc, D., P. Lacasse, C. L. Girard, P. J. Boettcher, and E. Block. 2000. Genetic, nutritional, and endocrine support of milk synthesis in dairy cows. J. Anim. Sci. 78:59–77.
Piccioli Cappelli, F., C. J. Seal, and D. S. Parker. 1997. Glucose and [13C]leucine metabolism by the portal-drained viscera of sheep fed on dried grass with acute intravenous and intraduodenal infusion of glucose. Br. J. Nutr. 78:931–946.
Reynolds, C. K., S. B. Cammell, D. J. Humphries, D. E. Beever, J. D. Sutton, and J. R. Newbold. 2001. Effects of postrumen starch infusion on milk production and energy metabolism in dairy cows. J. Dairy Sci. 84:2250–2259.
Reynolds, C. K., D. L. Harmon, and M. J. Cecava. 1994. Absorp-tion and delivery of nutrients for milk protein synthesis by portal-drained viscera. J. Dairy Sci. 77:2787–2808.
Rigout, S., C. Hurtaud, S. Lemosquet, A. Bach, and H. Rulquin. 2003. Lactational effect of propionic acid and duodenal glucose in cows. J. Dairy Sci. 86:243–253.
Riis, P. M., A. Danfær, T. Hvelplund, A. Madsen, M. O. Nielsen, P. Henning Petersen, K. Sejrsen, and S. H. Thilsted. 1990. A model for efficient use of new information within physiology, nutrition and breeding of dairy cows. Report from the National Institute of Animal Science, Tjele, Foulum, Denmark.
Rohr, K., and P. Lebzien. 1991. Present knowledge of amino acid requirements for maintenance and production. Pages 127–138 in Proc. 6th Int. Symp. Protein Metabolism and Nutrition. Herning, Denmark.
Rulquin, H., and L. Delaby. 1997. Effects of the energy balance of dairy cows on lactational responses to rumen-protected methio-nine. J. Dairy Sci. 80:2513–2522.
Salacinski, P. R. P., C. Mclean, J. E. C. Sykes, V. V. Clement-Jones, and P. J. Lowry. 1981. Iodination of proteins, glycoproteins and peptides using a solid-phase oxidising agent, 1,3,4,6-tetrachloro-3α,6α-diphenyl glicoluril (Iodogen). Anal. Biochem. 117:136–146.
Seal, C. J., D. S. Parker, and P. J. Avery. 1992. The effect of for-age and forage-concentrate diets on rumen fermentation and me-tabolism of nutrients by mesenteric- and portal-drained viscera in growing steers. Br. J. Nutr. 67:355–370.
Sunderman, F. W., and S. Nomoto. 1970. Measurement of human serum ceruloplasmin by its p-phenylenediamine oxidase activity. Clin. Chem. 16:903–910.
Sutton, J. D., M. S. Dhanoa, S. V. Morant, J. France, D. J. Napper, and E. Schuller. 2003. Rates of production of acetate, propionate, and butyrate in the rumen of lactating dairy cows given normal and low-roughage diets. J. Dairy Sci. 86:3620–3633.
Tamminga, S., W. M. Van Straalen, A. P. J. Subnel, R. G. M. Mei-jer, A. Steg, C. J. G. Wever, and M. C. Block. 1994. The Dutch protein evaluation system: The DVE/OEB-system. Livest. Prod. Sci. 40:139–155.
Vernon, R. G. 1989. Endocrine control of metabolic adaptation during lactation. Proc. Nutr. Soc. 48:23–32.
Walstra, P., and R. Jenness. 1984. Dairy Chemistry and Physics. John Wiley & Sons, New York, NY.
Related Documents