Bioinformatics and Biology Insights ORIGINAL RESEARCH Bioinformatics and Biology Insights 2010:4 19 OPEN ACCESS Full open access to this and thousands of other papers at http://www.la-press.com. Bioinformatics and Biology Insights 2010:4 19–31 This article is available from http://www.la-press.com. © the author(s), publisher and licensee Libertas Academica Ltd. This is an open access article. Unrestricted non-commercial use is permitted provided the original work is properly cited. Effect of Diet Supplementation on the Expression of Bovine Genes Associated with Fatty Acid Synthesis and Metabolism Sandeep J. Joseph 1 , Kelly R. Robbins 1 , Enrique Pavan 5 , Scott L. Pratt 4 , Susan K. Duckett 4 and Romdhane Rekaya 1,2,3 1 Rhodes Center for Animal and Dairy Science, 2 Department of Statistics, 3 Institute of Bioinformatics, University of Georgia, Athens, Georgia, 30602, USA. 4 Department of Animal and Veterinary Sciences, Clemson University, Clemson, SC, 29634, USA. 5 Instituto Nacional de Tecnología Agropecuaria, Balcarce, Argentina. Email: [email protected] Abstract: Conjugated linoleic acids (CLA) are of important nutritional and health benefit to human. Food products of animal origin are their major dietary source and their concentration increases with high concentrate diets fed to animals. To examine the effects of diet supplementation on the expression of genes related to lipid metabolism, 28 Angus steers were fed either pasture only, pasture with soybean hulls and corn oil, pasture with corn grain, or high concentrate diet. At slaughter, samples of subcutaneous adipose tissue were collected, from which RNA was extracted. Relative abundance of gene expression was measured using Affymetrix GeneChip Bovine Genome array. An ANOVA model nested within gene was used to analyze the background adjusted, normalized average difference of probe-level intensities. To control experiment wise error, a false discovery rate of 0.01 was imposed on all contrasts. Expression of several genes involved in the synthesis of enzymes related to fatty acid metabolism and lipogenesis such as stearoyl-CoA desaturase (SCD), fatty acid synthetase (FASN), lipoprotein lipase (LPL), fatty-acyl elongase (LCE) along with several trancription factors and co-activators involved in lipogenesis were found to be differentially expressed. Confirmatory RT-qPCR was done to validate the microarray results, which showed satisfactory correspondence between the two platforms. Results show that changes in diet by increasing dietary energy intake by supplementing high concentrate diet have effects on the transcription of genes encoding enzymes involved in fat metabolism which in turn has effects on fatty acid content in the carcass tissue as well as carcass quality. Corn supplementation either as oil or grain appeared to significantly alter the expression of genes directly associated with fatty acid synthesis. Keywords: affymetrix bovine array, fatty acid metabolism, RT-qPCR, conjugated linoleic acid, stearoyl-CoA desaturase, fatty acid synthase, acetyl-coenzyme A carboxylase

Welcome message from author
This document is posted to help you gain knowledge. Please leave a comment to let me know what you think about it! Share it to your friends and learn new things together.
Transcript
Bioinformatics and Biology Insights
O r I g I n a l r e s e a r c h
Bioinformatics and Biology Insights 2010:4 19
Open AccessFull open access to this and thousands of other papers at
http://www.la-press.com.
Bioinformatics and Biology Insights 2010:4 19–31
This article is available from http://www.la-press.com.
© the author(s), publisher and licensee libertas academica ltd.
This is an open access article. Unrestricted non-commercial use is permitted provided the original work is properly cited.
effect of Diet supplementation on the expression of Bovine Genes Associated with Fatty Acid synthesis and Metabolism
sandeep J. Joseph1, Kelly r. robbins1, enrique Pavan5, scott l. Pratt4, susan K. Duckett4 and romdhane rekaya1,2,3
1rhodes center for animal and Dairy science, 2Department of statistics, 3Institute of Bioinformatics, University of georgia, athens, georgia, 30602, Usa. 4Department of animal and Veterinary sciences, clemson University, clemson, sc, 29634, Usa. 5Instituto nacional de Tecnología agropecuaria, Balcarce, argentina. email: [email protected]
Abstract: Conjugated linoleic acids (CLA) are of important nutritional and health benefit to human. Food products of animal origin are their major dietary source and their concentration increases with high concentrate diets fed to animals. To examine the effects of diet supplementation on the expression of genes related to lipid metabolism, 28 Angus steers were fed either pasture only, pasture with soybean hulls and corn oil, pasture with corn grain, or high concentrate diet. At slaughter, samples of subcutaneous adipose tissue were collected, from which RNA was extracted. Relative abundance of gene expression was measured using Affymetrix GeneChip Bovine Genome array. An ANOVA model nested within gene was used to analyze the background adjusted, normalized average difference of probe-level intensities. To control experiment wise error, a false discovery rate of 0.01 was imposed on all contrasts. Expression of several genes involved in the synthesis of enzymes related to fatty acid metabolism and lipogenesis such as stearoyl-CoA desaturase (SCD), fatty acid synthetase (FASN), lipoprotein lipase (LPL), fatty-acyl elongase (LCE) along with several trancription factors and co-activators involved in lipogenesis were found to be differentially expressed. Confirmatory RT-qPCR was done to validate the microarray results, which showed satisfactory correspondence between the two platforms. Results show that changes in diet by increasing dietary energy intake by supplementing high concentrate diet have effects on the transcription of genes encoding enzymes involved in fat metabolism which in turn has effects on fatty acid content in the carcass tissue as well as carcass quality. Corn supplementation either as oil or grain appeared to significantly alter the expression of genes directly associated with fatty acid synthesis.
Keywords: affymetrix bovine array, fatty acid metabolism, RT-qPCR, conjugated linoleic acid, stearoyl-CoA desaturase, fatty acid synthase, acetyl-coenzyme A carboxylase
Joseph et al
20 Bioinformatics and Biology Insights 2010:4
IntroductionFood products of animal origin contribute signifi-cantly to the total nutrients in the human diet. Food products from ruminants are the major dietary source of conjugated linoleic acids (CLA) that are impor-tant for human health. The cis-9, trans-11 CLA iso-mer has been suggested to be an anticarcinogen, which reduced tumor proliferation in mice with experimentally induced epidermal carcinogenesis.1 Cis-9, trans-11 CLA isomer and trans-11 vaccenic acid (TVA) are produced in the rumen as intermediates in the biohydrogenation of dietary linoleic acid to stearic acid.2 Since only a small amount of the cis-9, trans-11 CLA is available for absorption in the small intestine, the major source of this CLA isomer in the adipose tissue of ruminants is from the conversion of trans-11 vaccenic acid to cis-9, trans-11 CLA in the adipose tissue by stearoyl-CoA desaturase (SCD).3 Noci et al4 observed a linear relationship between trans- vaccenic acid and cis-9, trans-11 CLA in the fat of beef cattle. Daniel et al5 concluded that high concentrate diets increase SCD gene expression in comparison to forage diets and suggested that the increase in cis-9, trans-11 CLA with forage diets would be due to an increase in the amount of TVA coming from the rumen. Thus, one way to increase cis-9, trans-11 CLA in beef products would be to increase production of TVA in the rumen by supplementing cattle with high levels of lipids rich in linoleic acids. However this type of supplementation would also increase the proportion of polyunsaturated fatty acids (PUFA) in beef fat6 and PUFA have been described to depress SCD gene expression. In addition, lipid supplementation could reduce lipogenesis by reducing enzyme activity, enzyme gene expression, or both, where as supplementation with glucogenic precursors (grains) would have the opposite effect.7 Recently, Pavan et al8 and Pavan and Duckett9 found that supplementation of corn oil to high concentrate diets or grazing cattle increases carcass fatness and alters fatty acid composition of adipose tissues including cis-9 trans-11 CLA.
According to Pegorier et al10 there is evidence suggesting that dietary constituents such as fatty acids and glucose regulate gene expression in humans. Such studies have also been done in ruminants, where Bonnet et al11 found that lipoprotein lipase activity and mRNA are up regulated in adipose tissues and
cardiac muscle of sheep that were re-fed (190% of metabolizable energy requirement) after a period of under- feeding (7 d at 22% of metabolizable energy requirement). Loor et al12 studied the changes in hepatic gene expression using longitudinal transcript and metabolic profiling. Lehnert et al13 used cDNA microarrays for studying the effects of chronic and severe under-nutrition on the gene expression of bovine skeletal muscles. Microarray technology has been widely used for genome-wide expression profiling of thousands of genes that help bovine researchers to monitor genetic mechanisms regulating a variety of preferred traits involving disease resistance, nutrient partitioning, mammary development, muscle growth and stress tolerance.14 Knowledge of the genes involved in digestion, absorption, and nutrient metabolism would allow researchers to develop optimal nutritional regimes for cattle of particular genetic backgrounds reared in a variety of environments. Such genomic information could be used to develop breeding strategies that promote animal health, well-being and food safety. The objective of this trial was to determine the effect of isoenergetic supplementation with different energy sources on the transcription of genes involved in fat metabolism at subcutaneous adipose tissue of grazing beef steers.
Materials and MethodsFeeding trialsTwenty-eight Angus steers (289 ± 3.8 kg) were ran-domly assigned to four dietary treatments. Dietary treatments included 2 isocaloric supplementation treatments to steers grazing endophyte-free tall fescue, corn grain (PC; 0.52% of body weight [BW]) or corn oil (PO; 0.10% of BW) plus soybean hulls (0.45% of BW soybean hulls) as a carrier, no supplementation to steers grazing endophyte-free tall fescue (P), or a high concentrate diet (C; 80% corn grain, 2.6% soybean meal, 2.4% minerals, and 15% Bermuda grass hay). Steers on PC, PO and P were managed together under a rotational grazing system for 197 d; where as, C steers were maintained on an adjacent tall fescue pasture for the initial 105 d and then fed a high concentrate diet for 92 d. Additional information on experimen-tal design, diet composition, animal performance and carcass quality is provided in Pavan and Duckett.9
Diet supplementation and gene expression in bovines
Bioinformatics and Biology Insights 2010:4 21
rna isolationAt slaughter, samples of s.c. adipose tissue (head tail) were obtained immediately after exsanguination, frozen in liquid nitrogen and then stored at -60 ºC. Several research studies have shown that nutritional effects on fatty acid composition are similar among intramuscular and subcutaneous adipose tissue.9,15,16 Both depots are actively being deposited during the finishing phase as evidenced by increases in external and marbling fat and the enzyme levels are similar between the two depots as well.17 Moreover RNA must be extracted from the tissue as soon as possible in order to have high quality RNA and s.c adipose tissue makes this task easier.
Total cellular RNA (tcRNA) was extracted from the s.c. adipose tissue (2 g) using TRIzol reagent (Gibco Invitrogen, Carlsbad, CA) according to manufacturer’s protocol. Following tcRNA extraction, Qiagen RNEasy MinElute Cleanup Kits were used for RNA cleanup, and a Quant-IT kit (Invitrogen, Carlsbad, CA) was used for RNA quantification. Purity and integrity of isolated RNA was confirmed by visualization of 18 S and 28 S ribosomal bands of individual samples sub-jected to denaturing slab gel electrophoresis in 1.2% ethidium bromide-stained agarose gel and 260/280 absorbance ratios. All tcRNA samples used in this experiment exhibited 260:280 ratios . 1.8.
MicroarrayFor microarray analysis, tcRNA was pooled by treatment on an equal weight basis for all individual samples in a treatment group. The Affymetrix GeneChip Bovine Genome array was used for hybridization of the extracted mRNA’s according to the Affymetrix protocol at Medical College of Georgia, Genomics facility. The GeneChip Bovine Genome Array contained 24,027 probe sets, representing over 23,000 transcripts. The array was scanned and the gene expression data was generated using the Affymetrix software.
statistical analysis of microarray dataStatistical analysis was performed for each gene s eparately using the following simple linear model:
y T eijk i ij ijk= + +µ
where yijk is the base-2 logarithm of background adjusted and normalized average difference of signal intensity for gene i in array k; µi is the overall mean expression of gene i, Tij is dietary supplement j ( j = 1,2,3,4) on gene i, and eijk is the residual term.
F-ratios were computed for all possible contrasts between the treatment levels using the contrast statement in SAS. In order to control experiment wise error rates, a false discovery rate (FDR) criteria was employed. The Benjamini Hochberg method18 was used to identify genes differentially expressed at a given FDR level. The process is summarized in the following steps:
1. After selecting a significance level, αe, genes were sorted by P-values from the most to the least significant.
2. Threshold values were calculated for each test as:
threshold i ei R
=*α for i = 1 to R
where R is the total number of tests (also the total number of genes) and i is the sorted position of the test.
3. Each P-value was then compared to its respective threshold, starting with the most significant P-value, until a P-value greater than the threshold value was encountered. All following contrast was then considered to be insignificant. For this study an FDR of 0.01 was used to identify potentially differentially expressed genes.
Least square estimates of both treatments for each single gene was calculated using the LSMEANS statement of SAS. The fold-change for each gene was calculated by taking the ratio of the least square estimates for all the four treatment comparisons to determine the magnitude of change in gene activity corresponding to each diet supplement.
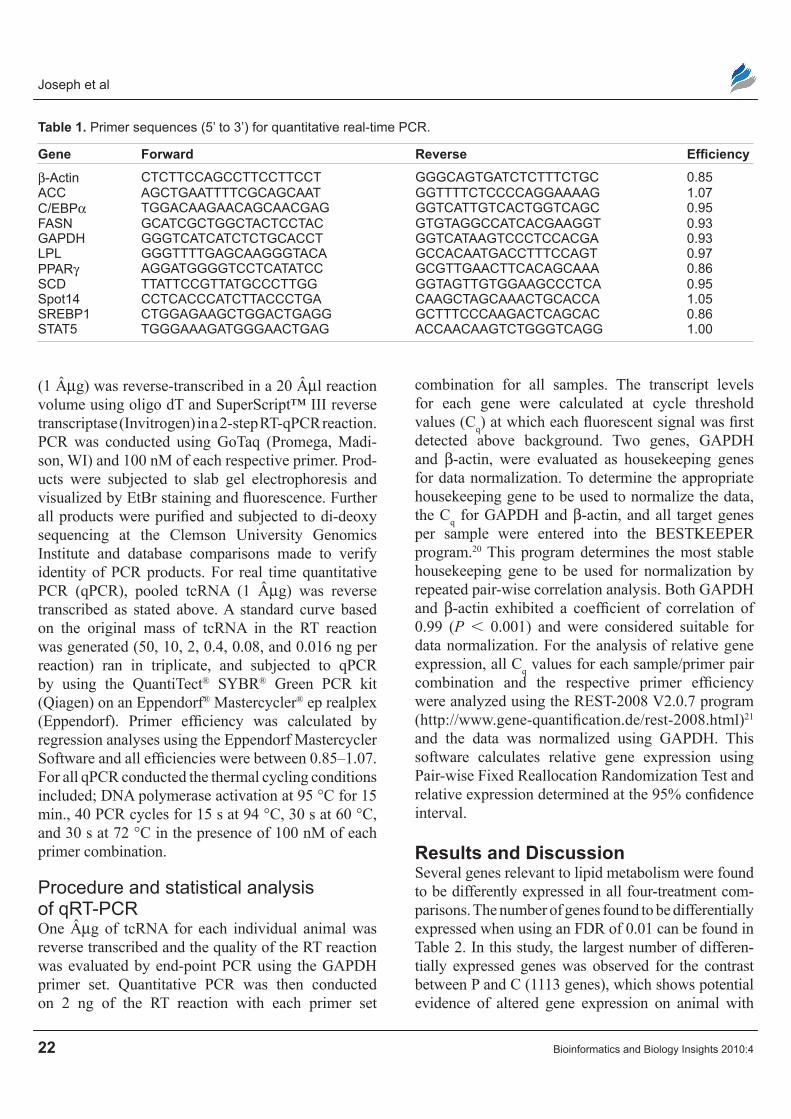
Relative quantification of lipogenic gene expression by real-time PcrPCR primers that span intron/exon junctions were designed using Primer3 software.19 Primer sequences for both end-point and real time quantitative PCR effi-ciencies are presented in Table 1. Primer sets were evaluated first by using end-point PCR. Pooled tcRNA
Joseph et al
22 Bioinformatics and Biology Insights 2010:4
(1 µg) was reverse-transcribed in a 20 µl reaction volume using oligo dT and SuperScript™ III reverse transcriptase (Invitrogen) in a 2-step RT-qPCR reaction. PCR was conducted using GoTaq (Promega, Madi-son, WI) and 100 nM of each respective primer. Prod-ucts were subjected to slab gel electrophoresis and visualized by EtBr staining and fluorescence. Further all products were purified and subjected to di-deoxy sequencing at the Clemson University Genomics Institute and database comparisons made to verify identity of PCR products. For real time quantitative PCR (qPCR), pooled tcRNA (1 µg) was reverse transcribed as stated above. A standard curve based on the original mass of tcRNA in the RT reaction was generated (50, 10, 2, 0.4, 0.08, and 0.016 ng per reaction) ran in triplicate, and subjected to qPCR by using the QuantiTect® SYBR® Green PCR kit (Qiagen) on an Eppendorf® Mastercycler® ep realplex (Eppendorf). Primer efficiency was calculated by regression analyses using the Eppendorf Mastercycler Software and all efficiencies were between 0.85–1.07. For all qPCR conducted the thermal cycling conditions included; DNA polymerase activation at 95 °C for 15 min., 40 PCR cycles for 15 s at 94 °C, 30 s at 60 °C, and 30 s at 72 °C in the presence of 100 nM of each primer combination.
Procedure and statistical analysis of qrT-PcrOne µg of tcRNA for each individual animal was reverse transcribed and the quality of the RT reaction was evaluated by end-point PCR using the GAPDH primer set. Quantitative PCR was then conducted on 2 ng of the RT reaction with each primer set
combination for all samples. The transcript levels for each gene were calculated at cycle threshold values (Cq) at which each fluorescent signal was first detected above background. Two genes, GAPDH and β-actin, were evaluated as housekeeping genes for data normalization. To determine the appropriate housekeeping gene to be used to normalize the data, the Cq for GAPDH and β-actin, and all target genes per sample were entered into the BESTKEEPER program.20 This program determines the most stable housekeeping gene to be used for normalization by repeated pair-wise correlation analysis. Both GAPDH and β-actin exhibited a coefficient of correlation of 0.99 (P , 0.001) and were considered suitable for data normalization. For the analysis of relative gene expression, all Cq values for each sample/primer pair combination and the respective primer efficiency were analyzed using the REST-2008 V2.0.7 program (http://www.gene-quantification.de/rest-2008.html)21 and the data was normalized using GAPDH. This software calculates relative gene expression using Pair-wise Fixed Reallocation Randomization Test and relative expression determined at the 95% confidence interval.
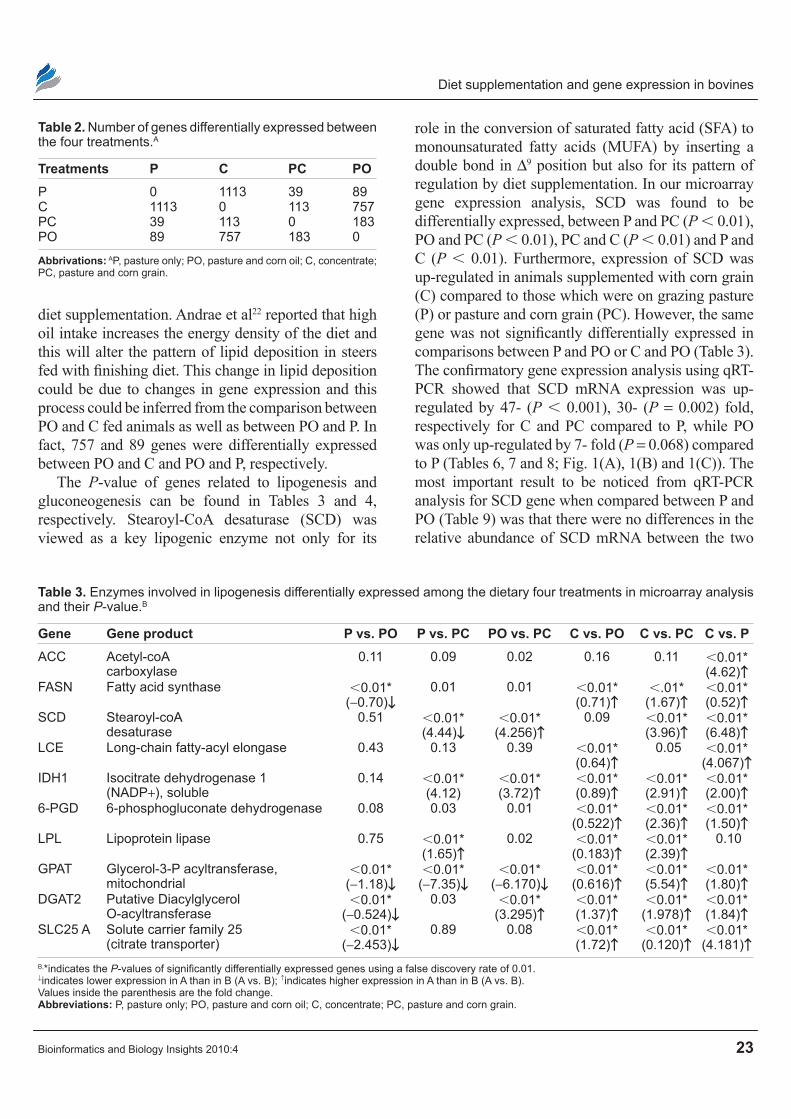
Results and DiscussionSeveral genes relevant to lipid metabolism were found to be differently expressed in all four- treatment com-parisons. The number of genes found to be differentially expressed when using an FDR of 0.01 can be found in Table 2. In this study, the largest number of differen-tially expressed genes was observed for the contrast between P and C (1113 genes), which shows potential evidence of altered gene expression on animal with
Table 1. Primer sequences (5’ to 3’) for quantitative real-time Pcr.
Gene Forward Reverse Efficiency
β-actin cTcTTccagccTTccTTccT gggcagTgaTcTcTTTcTgc 0.85acc agcTgaaTTTTcgcagcaaT ggTTTTcTccccaggaaaag 1.07c/eBPα Tggacaagaacagcaacgag ggTcaTTgTcacTggTcagc 0.95Fasn gcaTcgcTggcTacTccTac gTgTaggccaTcacgaaggT 0.93gaPDh gggTcaTcaTcTcTgcaccT ggTcaTaagTcccTccacga 0.93lPl gggTTTTgagcaagggTaca gccacaaTgaccTTTccagT 0.97PParγ aggaTggggTccTcaTaTcc gcgTTgaacTTcacagcaaa 0.86scD TTaTTccgTTaTgcccTTgg ggTagTTgTggaagcccTca 0.95spot14 ccTcacccaTcTTacccTga caagcTagcaaacTgcacca 1.05sreBP1 cTggagaagcTggacTgagg gcTTTcccaagacTcagcac 0.86sTaT5 TgggaaagaTgggaacTgag accaacaagTcTgggTcagg 1.00
Diet supplementation and gene expression in bovines
Bioinformatics and Biology Insights 2010:4 23
diet supplementation. Andrae et al22 reported that high oil intake increases the energy density of the diet and this will alter the pattern of lipid deposition in steers fed with finishing diet. This change in lipid deposition could be due to changes in gene expression and this process could be inferred from the comparison between PO and C fed animals as well as between PO and P. In fact, 757 and 89 genes were differentially expressed between PO and C and PO and P, respectively.
The P-value of genes related to lipogenesis and gluconeogenesis can be found in Tables 3 and 4, respectively. Stearoyl-CoA desaturase (SCD) was viewed as a key lipogenic enzyme not only for its
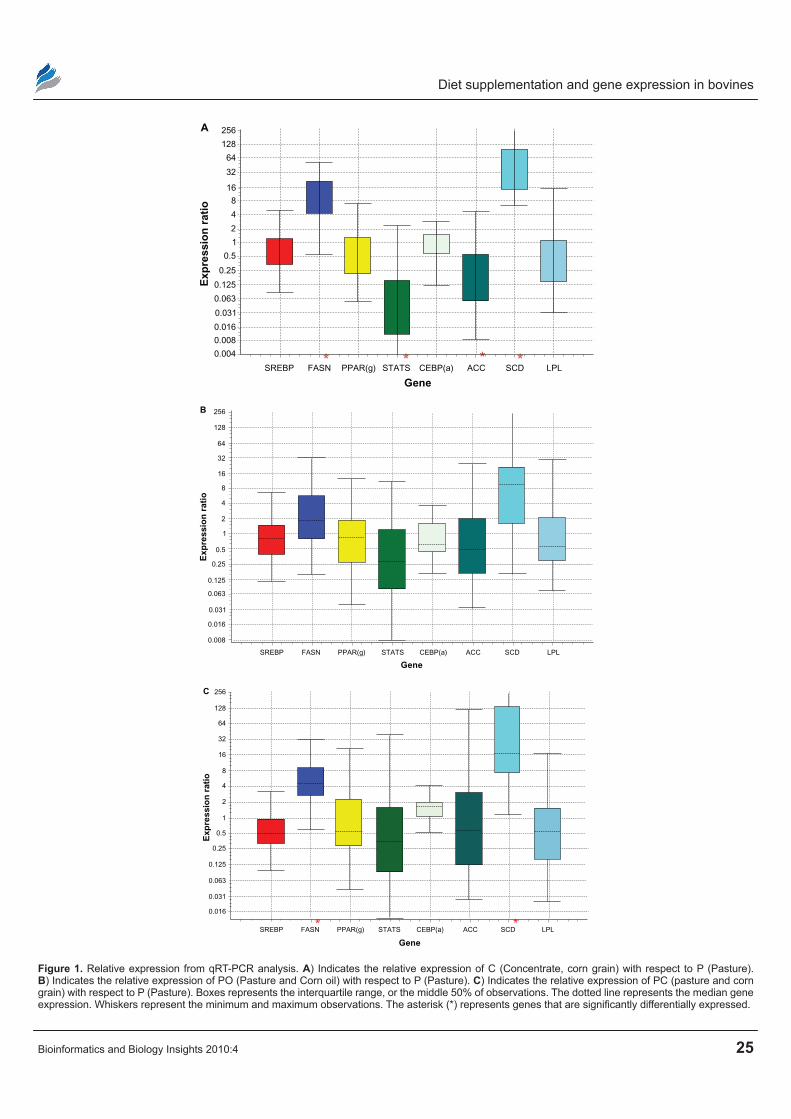
role in the conversion of saturated fatty acid (SFA) to monounsaturated fatty acids (MUFA) by inserting a double bond in ∆9 position but also for its pattern of regulation by diet supplementation. In our microarray gene expression analysis, SCD was found to be differentially expressed, between P and PC (P , 0.01), PO and PC (P , 0.01), PC and C (P , 0.01) and P and C (P , 0.01). Furthermore, expression of SCD was up-regulated in animals supplemented with corn grain (C) compared to those which were on grazing pasture (P) or pasture and corn grain (PC). However, the same gene was not significantly differentially expressed in comparisons between P and PO or C and PO (Table 3). The confirmatory gene expression analysis using qRT-PCR showed that SCD mRNA expression was up-regulated by 47- (P , 0.001), 30- (P = 0.002) fold, respectively for C and PC compared to P, while PO was only up-regulated by 7- fold (P = 0.068) compared to P (Tables 6, 7 and 8; Fig. 1(A), 1(B) and 1(C)). The most important result to be noticed from qRT-PCR analysis for SCD gene when compared between P and PO (Table 9) was that there were no differences in the relative abundance of SCD mRNA between the two
Table 2. number of genes differentially expressed between the four treatments.a
Treatments p c pc pOP 0 1113 39 89c 1113 0 113 757Pc 39 113 0 183PO 89 757 183 0
Abbrivations: aP, pasture only; PO, pasture and corn oil; c, concentrate; Pc, pasture and corn grain.
Table 3. enzymes involved in lipogenesis differentially expressed among the dietary four treatments in microarray analysis and their P-value.B
Gene Gene product p vs. pO p vs. pc pO vs. pc c vs. pO c vs. pc c vs. pacc acetyl-coa
carboxylase0.11 0.09 0.02 0.16 0.11 ,0.01*
(4.62)↑Fasn Fatty acid synthase ,0.01*
(-0.70)↓0.01 0.01 ,0.01*
(0.71)↑,.01*
(1.67)↑,0.01* (0.52)↑
scD stearoyl-coa desaturase
0.51 ,0.01* (4.44)↓
,0.01* (4.256)↑
0.09 ,0.01* (3.96)↑
,0.01* (6.48)↑
lce long-chain fatty-acyl elongase 0.43 0.13 0.39 ,0.01* (0.64)↑
0.05 ,0.01* (4.067)↑
IDh1 Isocitrate dehydrogenase 1 (naDP+), soluble
0.14 ,0.01* (4.12)
,0.01* (3.72)↑
,0.01* (0.89)↑
,0.01* (2.91)↑
,0.01* (2.00)↑
6-PgD 6-phosphogluconate dehydrogenase 0.08 0.03 0.01 ,0.01* (0.522)↑
,0.01* (2.36)↑
,0.01* (1.50)↑
lPl lipoprotein lipase 0.75 ,0.01* (1.65)↑
0.02 ,0.01* (0.183)↑
,0.01* (2.39)↑
0.10
gPaT glycerol-3-P acyltransferase, mitochondrial
,0.01* (-1.18)↓
,0.01* (-7.35)↓
,0.01* (-6.170)↓
,0.01* (0.616)↑
,0.01* (5.54)↑
,0.01* (1.80)↑
DgaT2 Putative Diacylglycerol O-acyltransferase
,0.01* (-0.524)↓
0.03 ,0.01* (3.295)↑
,0.01* (1.37)↑
,0.01* (1.978)↑
,0.01* (1.84)↑
slc25 a solute carrier family 25 (citrate transporter)
,0.01* (-2.453)↓
0.89 0.08 ,0.01* (1.72)↑
,0.01* (0.120)↑
,0.01* (4.181)↑
B,*indicates the P-values of significantly differentially expressed genes using a false discovery rate of 0.01.↓indicates lower expression in a than in B (a vs. B); ↑indicates higher expression in a than in B (a vs. B).Values inside the parenthesis are the fold change.Abbreviations: P, pasture only; PO, pasture and corn oil; c, concentrate; Pc, pasture and corn grain.
Joseph et al
24 Bioinformatics and Biology Insights 2010:4
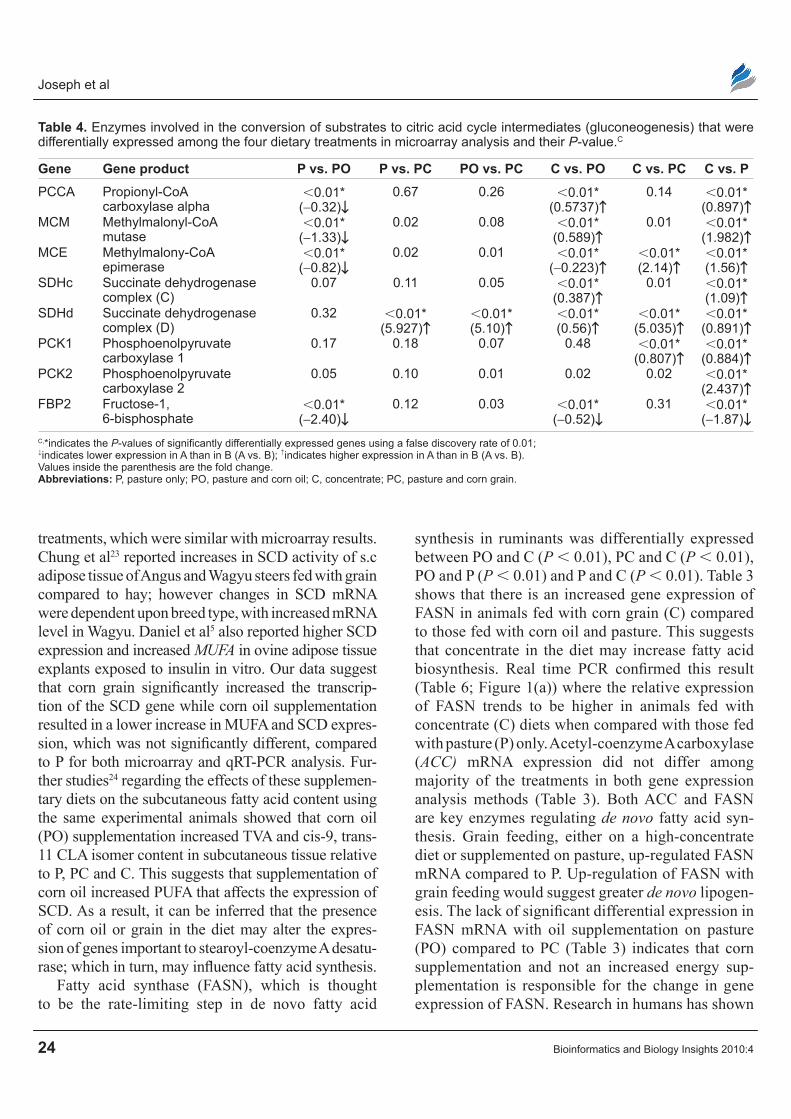
Table 4. enzymes involved in the conversion of substrates to citric acid cycle intermediates (gluconeogenesis) that were differentially expressed among the four dietary treatments in microarray analysis and their P-value.c
Gene Gene product p vs. pO p vs. pc pO vs. pc c vs. pO c vs. pc c vs. pPcca Propionyl-coa
carboxylase alpha,0.01*
(-0.32)↓0.67 0.26 ,0.01*
(0.5737)↑0.14 ,0.01*
(0.897)↑McM Methylmalonyl-coa
mutase,0.01*
(-1.33)↓0.02 0.08 ,0.01*
(0.589)↑0.01 ,0.01*
(1.982)↑Mce Methylmalony-coa
epimerase,0.01*
(-0.82)↓0.02 0.01 ,0.01*
(-0.223)↑,0.01* (2.14)↑
,0.01* (1.56)↑
sDhc succinate dehydrogenase complex (c)
0.07 0.11 0.05 ,0.01* (0.387)↑
0.01 ,0.01* (1.09)↑
sDhd succinate dehydrogenase complex (D)
0.32 ,0.01* (5.927)↑
,0.01* (5.10)↑
,0.01* (0.56)↑
,0.01* (5.035)↑
,0.01* (0.891)↑
PcK1 Phosphoenolpyruvate carboxylase 1
0.17 0.18 0.07 0.48 ,0.01* (0.807)↑
,0.01* (0.884)↑
PcK2 Phosphoenolpyruvate carboxylase 2
0.05 0.10 0.01 0.02 0.02 ,0.01* (2.437)↑
FBP2 Fructose-1, 6-bisphosphate
,0.01* (-2.40)↓
0.12 0.03 ,0.01* (-0.52)↓
0.31 ,0.01* (-1.87)↓
c,*indicates the P-values of significantly differentially expressed genes using a false discovery rate of 0.01; ↓indicates lower expression in a than in B (a vs. B); ↑indicates higher expression in a than in B (a vs. B).Values inside the parenthesis are the fold change.Abbreviations: P, pasture only; PO, pasture and corn oil; c, concentrate; Pc, pasture and corn grain.
treatments, which were similar with microarray results. Chung et al23 reported increases in SCD activity of s.c adipose tissue of Angus and Wagyu steers fed with grain compared to hay; however changes in SCD mRNA were dependent upon breed type, with increased mRNA level in Wagyu. Daniel et al5 also reported higher SCD expression and increased MUFA in ovine adipose tissue explants exposed to insulin in vitro. Our data suggest that corn grain significantly increased the transcrip-tion of the SC D gene while corn oil supplementation resulted in a lower increase in MUFA and SCD expres-sion, whic h was not significantly different, compared to P for both microarray and qRT-PCR analysis. Fur-ther studies24 regarding the effects of these supplemen-tary diets on the subcutaneous fatty acid content using the same experimental animals showed that corn oil (PO) supplementation increased TVA and cis-9, trans-11 CLA isomer content in subcutaneous tissue relative to P, PC and C. This suggests that supplementation of corn oil increased PU FA that affects the expression of SCD. As a result, it can be inferred that the presence of corn oil or grain in the diet may alter the expres-sion of genes important to stearoyl-coenzyme A desatu-rase; which in turn, may influence fatty acid synthesis.
Fatty acid synthase (FASN), which is thought to be the rate-limiting step in de novo fatty acid
synthesis in ruminants was differentially expressed between PO and C (P , 0.01), PC and C (P , 0.01), PO and P (P , 0.01) and P and C (P , 0.01). Table 3 shows that there is an increased gene expression of FASN in animals fed with corn grain (C) compared to those fed with corn oil and pasture. This suggests that concentrate in the diet may increase fatty acid biosynthesis. Real time PCR confirmed this result (Table 6; Figure 1(a)) where the relative expression of FASN trends to be higher in animals fed with concentrate ( C) diets when compared with those fed with pasture (P) only. Acetyl-coenzyme A carboxylase (ACC) mRNA expression did not differ among majority of the treatments in both gene expression analysis methods (Table 3). Both ACC and FASN are key enzymes regulating de novo fatty acid syn-thesis. Grain feeding, either on a high-concentrate diet or supplemented on pasture, up-regulated FASN mRNA compared to P. Up-regulation of FASN with grain feeding would suggest greater de novo lipogen-esis. The lack of significant differential expression in FASN mRNA with oil supplementation on pasture (PO) compared to PC (Table 3) indicates that corn supplementation and not an increased energy sup-plementation is responsible for the change in gene expression of FASN. Research in humans has shown
Diet supplementation and gene expression in bovines
Bioinformatics and Biology Insights 2010:4 25
Figure 1. relative expression from qrT-Pcr analysis. A) Indicates the relative expression of c (concentrate, corn grain) with respect to P (Pasture). B) Indicates the relative expression of PO (Pasture and corn oil) with respect to P (Pasture). c) Indicates the relative expression of Pc (pasture and corn grain) with respect to P (Pasture). Boxes represents the interquartile range, or the middle 50% of observations. The dotted line represents the median gene expression. Whiskers represent the minimum and maximum observations. The asterisk (*) represents genes that are significantly differentially expressed.
Exp
ress
ion
rat
io
Gene
B 256
128
64
32
16
8
4
2
1
0.5
0.25
0.125
0.063
0.031
0.016
0.008
SREBP FASN PPAR(g) STATS CEBP(a) ACC SCD LPL
Exp
ress
ion
rat
io
Gene
C 256
128
64
32
16
8
4
2
1
0.5
0.25
0.125
0.063
0.031
0.016
SREBP FASN PPAR(g) STATS CEBP(a) ACC SCD LPL* *
Exp
ress
ion
rat
io
Gene
A 256
128
64
32
16
8
4
2
1
0.5
0.25
0.125
0.063
0.031
0.016
0.008
0.004
SREBP FASN PPAR(g) STATS CEBP(a) ACC SCD LPL****
Joseph et al
26 Bioinformatics and Biology Insights 2010:4
that increased expression of FASN in adipose tissue is linked to excess fat accumulation and impaired insulin sensitivity.25 Geetha et al26 investigated the effects of exogenous fatty acid treatment on the function of ACC and FASN in mammary cells and found that, increasing concentrations of exogenous oleic acid and TVA caused inhibition of ACC and FASN activities. Among the two monounsaturated fatty acids, TVA was much more powerful inhibitor of ACC and FASN, when compared with oleic acid. Similar effects are also observed in this study, as the gene expression of FASN (Table 3) in adipose tissue has been found to be lower in corn oil fed animals (C and PO) because corn oil does contain oleic acid (28.5% of total fatty acids in corn oil).
Lipoprotein lipase (LPL), a lipolytic enzyme involved in the metabolism of triacylglycerol-rich lipoprotein particles, which generate free fatty acids, was found to be differentially expressed between P and PC (P , 0.01), C and PO (P , 0.01) and C and PC (P , 0.01). While LPL was not found to be differentially expressed between P and C as well as P and PO, which shows correspondence with the results obtained from qRT-PCR (Tables 3 and 9). This enzyme has the direct opposite function of FASN, which mediates the synthesis of fatty acids.
The gene that codes for long-chain fatty-acyl elongase (LCE) enzyme was also differentially expressed between C and PO (P , 0.01) and C and P (P , 0.01) (Table 3). Moon et al27 suggested that mouse LCE expression is increased by sterol regulatory element-binding proteins (SREBPs) and that the enzyme is a component of the mammalian elongation system that converts palmitic to stearic acid by enhancing the addition of 2-carbon units to palmitic acid. LCE promotes increased production of stearic acid which is a saturated fatty acid. Our results indicate that there was an increased relative expression of LCE in animals fed with corn grain than with pasture or corn oil, suggesting that corn grain increases the production of saturated fatty acids in ruminants.
Furthermore, the glycerol phosphate acyltranferase (GPAT) gene which is involved in synthesis of trig-lycerides was found to be differentially expressed in almost all the dietary treatment comparisons. Several other genes responsible for the production of fatty acid-binding proteins were identified as differentially
expressed in P vs. PC and C vs. PC comparisons. Studies by Peterson et al28 found a coordinated change in the mRNA abundance for genes that code for ACC, FASN and GPAT when they induced milk fat depression (MFD) with a high concentrate/low forage diet and examined the milk composition.
Genes responsible for the production of enzymes involved in the conversion of substrates to cit-ric acid cycle intermediates (gluconeogenesis) are shown in Table 4. Potential genes involved in this process like propionyl—CoA carboxylase alpha (PCCA), methylmalonyl—CoA mutase (MUT), methylmalonyl—CoA epimerase (MCE), succinate dehydrogenase complex (SDH), phosphoenolpyru-vate carboxylase 1 (PCK1), phosphoenolpyruvate car-boxylase 2 (PCK2) and fructose—1,6-bisphosphate (FBP2) were found to be differentially expressed among the various treatment comparisons. PCCA, MCM, MCE and FBP2 genes were found to be down regulated in animals fed with corn oil compared to pasture fed animals. Propionyl—CoA carboxy-lase alpha enzyme plays a vital role in propionate metabolism, where it catalyses the intermediate step between propionyl-CoA and methylmalonyl CoA. Methylmalonyl—CoA mutase functions in propano-ate metabolism where it activates the intermediate step between methylmalonyl—CoA and succinyl—CoA, where as succinate dehydrogenase complex catalyses the conversion of succinyl—CoA to succinate. The enzymes, PCK1 and PCK2 that plays an important role in pyruvate metabolism by catalyzing the con-version of phosphoenol pyruvate to oxaloacetate, was also expressed higher in animals fed with corn grain. It appears that corn oil may decrease expression of some gluconeogenic enzymes compared to those steers that were fed with non-supplemented feed, where as those steers fed with corn grain would have a higher expression of gluconeogenic enzymes with respect to the grazing treatments.
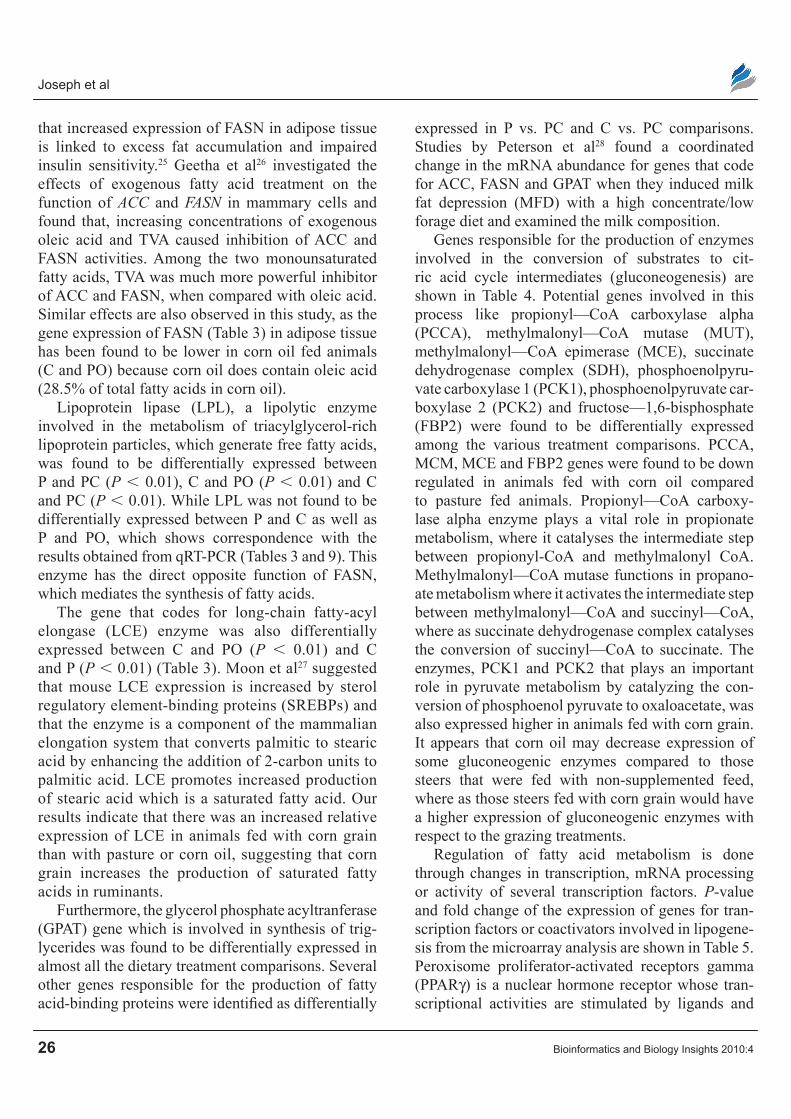
Regulation of fatty acid metabolism is done through changes in transcription, mRNA processing or activity of several transcription factors. P-value and fold change of the expression of genes for tran-scription factors or coactivators involved in lipogene-sis from the microarray analysis are shown in Table 5. Peroxisome proliferator-activated receptors gamma (PPARγ) is a nuclear hormone receptor whose tran-scriptional activities are stimulated by ligands and
Diet supplementation and gene expression in bovines
Bioinformatics and Biology Insights 2010:4 27
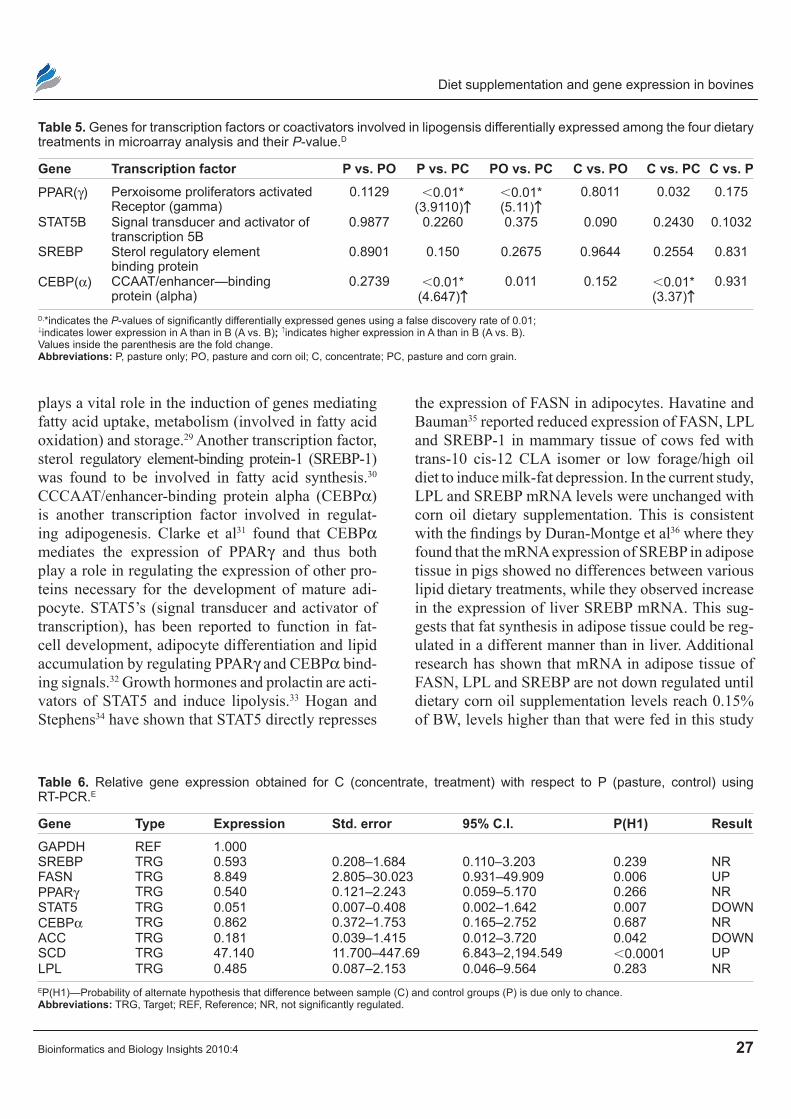
plays a vital role in the induction of genes mediating fatty acid uptake, metabolism (involved in fatty acid oxidation) and storage.29 Another transcription factor, sterol regulatory element-binding protein-1 (SREBP-1) was found to be involved in fatty acid synthesis.30 CCCAAT/enhancer-binding protein alpha (CEBPα) is another transcription factor involved in regulat-ing adipogenesis. Clarke et al31 found that CEBPα mediates the expression of PPARγ and thus both play a role in regulating the expression of other pro-teins necessary for the development of mature adi-pocyte. STAT5’s (signal transducer and activator of transcription), has been reported to function in fat-cell development, adipocyte differentiation and lipid accumulation by regulating PPARγ and CEBPα bind-ing signals.32 Growth hormones and prolactin are acti-vators of STAT5 and induce lipolysis.33 Hogan and Stephens34 have shown that STAT5 directly represses
the expression of FASN in adipocytes. Havatine and Bauman35 reported reduced expression of FASN, LPL and SREBP-1 in mammary tissue of cows fed with trans-10 cis-12 CLA isomer or low forage/high oil diet to induce milk-fat depression. In the current study, LPL and SREBP mRNA levels were unchanged with corn oil dietary supplementation. This is consistent with the findings by Duran-Montge et al36 where they found that the mRNA expression of SREBP in adipose tissue in pigs showed no differences between various lipid dietary treatments, while they observed increase in the expression of liver SREBP mRNA. This sug-gests that fat synthesis in adipose tissue could be reg-ulated in a different manner than in liver. Additional research has shown that mRNA in adipose tissue of FASN, LPL and SREBP are not down regulated until dietary corn oil supplementation levels reach 0.15% of BW, levels higher than that were fed in this study
Table 5. genes for transcription factors or coactivators involved in lipogensis differentially expressed among the four dietary treatments in microarray analysis and their P-value.D
Gene Transcription factor p vs. pO p vs. pc pO vs. pc c vs. pO c vs. pc c vs. p
PPar(γ) Perxoisome proliferators activated receptor (gamma)
0.1129 ,0.01* (3.9110)↑
,0.01* (5.11)↑
0.8011 0.032 0.175
sTaT5B signal transducer and activator of transcription 5B
0.9877 0.2260 0.375 0.090 0.2430 0.1032
sreBP sterol regulatory element binding protein
0.8901 0.150 0.2675 0.9644 0.2554 0.831
ceBP(α) ccaaT/enhancer—binding protein (alpha)
0.2739 ,0.01* (4.647)↑
0.011 0.152 ,0.01* (3.37)↑
0.931
D,*indicates the P-values of significantly differentially expressed genes using a false discovery rate of 0.01; ↓indicates lower expression in a than in B (a vs. B); ↑indicates higher expression in a than in B (a vs. B). Values inside the parenthesis are the fold change.Abbreviations: P, pasture only; PO, pasture and corn oil; c, concentrate; Pc, pasture and corn grain.
Table 6. relative gene expression obtained for c (concentrate, treatment) with respect to P (pasture, control) using rT-Pcr.e
Gene Type expression std. error 95% c.I. p(H1) ResultgaPDh reF 1.000sreBP Trg 0.593 0.208–1.684 0.110–3.203 0.239 nrFasn Trg 8.849 2.805–30.023 0.931–49.909 0.006 UPPParγ Trg 0.540 0.121–2.243 0.059–5.170 0.266 nrsTaT5 Trg 0.051 0.007–0.408 0.002–1.642 0.007 DOWnceBPα Trg 0.862 0.372–1.753 0.165–2.752 0.687 nracc Trg 0.181 0.039–1.415 0.012–3.720 0.042 DOWnscD Trg 47.140 11.700–447.69 6.843–2,194.549 ,0.0001 UPlPl Trg 0.485 0.087–2.153 0.046–9.564 0.283 nreP(h1)—Probability of alternate hypothesis that difference between sample (c) and control groups (P) is due only to chance.Abbreviations: TRG, Target; REF, Reference; NR, not significantly regulated.
Joseph et al
28 Bioinformatics and Biology Insights 2010:4
(Duckett and Pratt, unpublished data). PPAR(γ) and CEBP(α) in microarray analysis were found to be differentially expressed in the comparison between P and PC with a reduced gene activity in PC, where as RT-PCR results (Fig. 1c) of the same comparison confirmed the microarray detection of PPARγ, but the gene expression for both were found to be unchanged. PPAR(γ) and CEBP(α) were found to be differentially expressed in microarray analysis between PO and PC with increased gene activity in PO and in all other comparisons (P and PO, C and PO, C and PC and C and P) they were not found differentially expressed (Table 5) as well in the confirmatory qRT-PCR analy-sis (Tables 6,7 and 8).
Validation of high throughput methods like microarray using qRT-PCR has become a routine
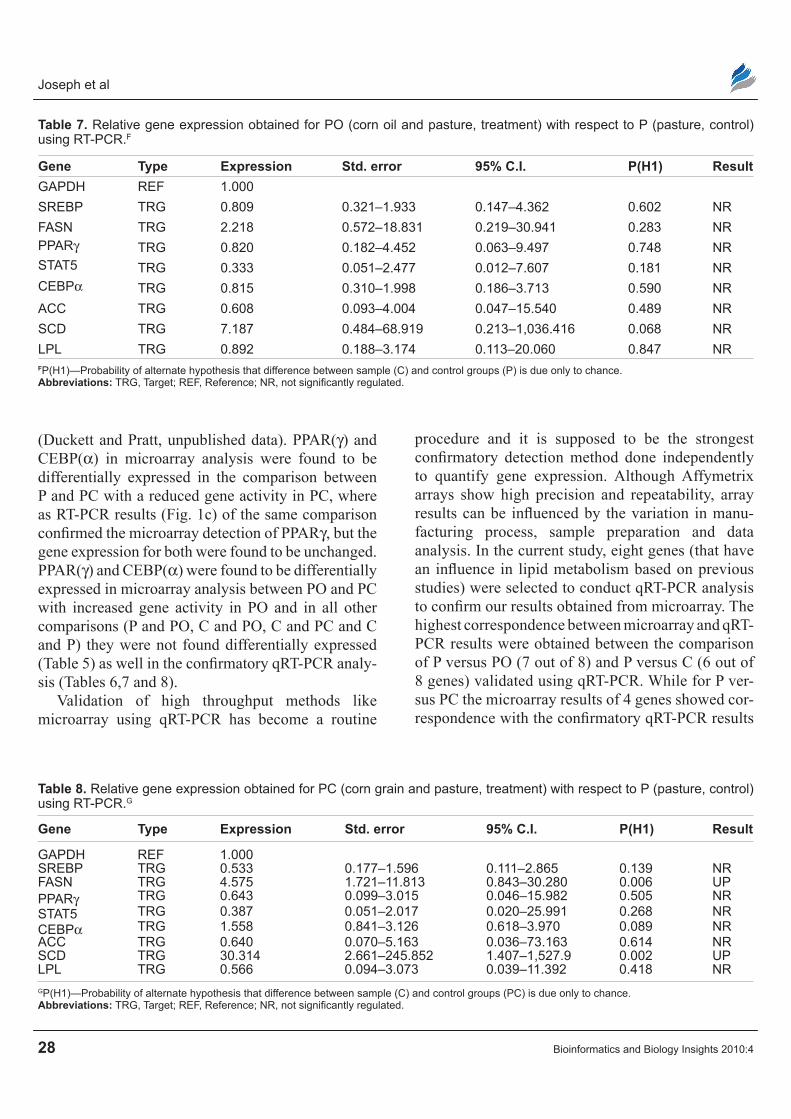
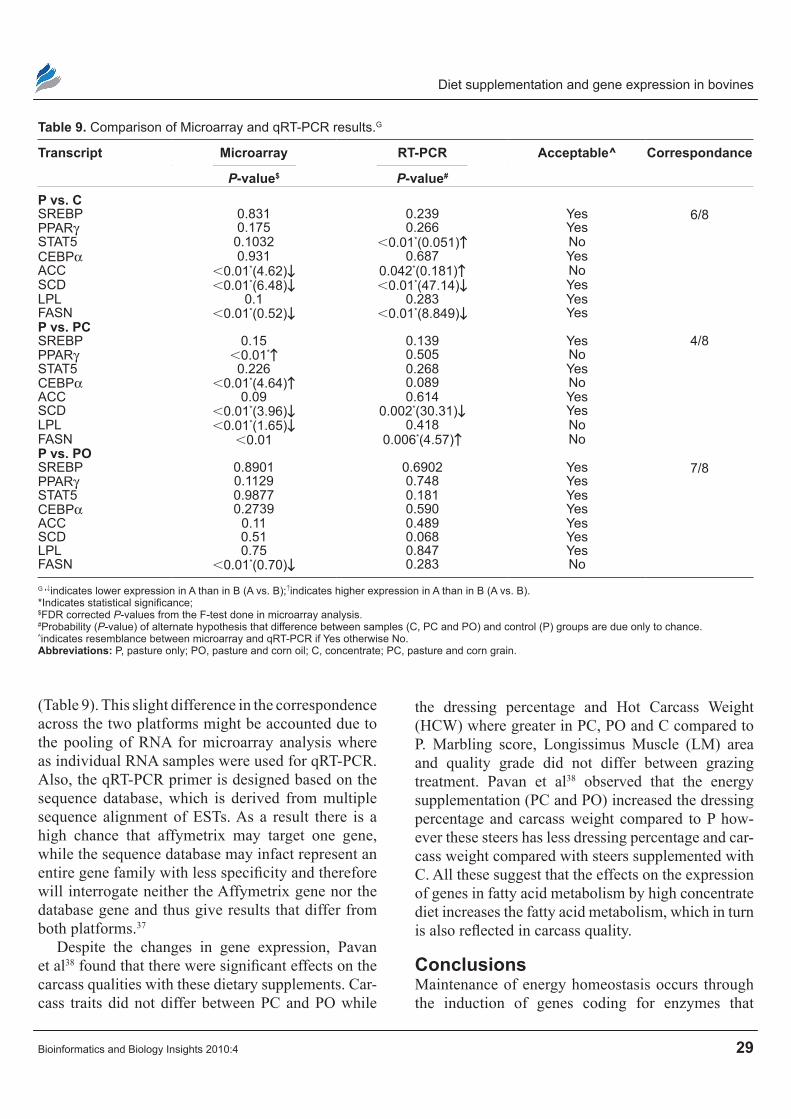
procedure and it is supposed to be the strongest confirmatory detection method done independently to quantify gene expression. Although Affymetrix arrays show high precision and repeatability, array results can be influenced by the variation in manu-facturing process, sample preparation and data analysis. In the current study, eight genes (that have an influence in lipid metabolism based on previous studies) were selected to conduct qRT-PCR analysis to confirm our results obtained from microarray. The highest correspondence between microarray and qRT-PCR results were obtained between the comparison of P versus PO (7 out of 8) and P versus C (6 out of 8 genes) validated using qRT-PCR. While for P ver-sus PC the microarray results of 4 genes showed cor-respondence with the confirmatory qRT-PCR results
Table 7. relative gene expression obtained for PO (corn oil and pasture, treatment) with respect to P (pasture, control) using rT-Pcr.F
Gene Type expression std. error 95% c.I. p(H1) ResultgaPDh reF 1.000sreBP Trg 0.809 0.321–1.933 0.147–4.362 0.602 nrFasn Trg 2.218 0.572–18.831 0.219–30.941 0.283 nrPParγ Trg 0.820 0.182–4.452 0.063–9.497 0.748 nrsTaT5 Trg 0.333 0.051–2.477 0.012–7.607 0.181 nrceBPα Trg 0.815 0.310–1.998 0.186–3.713 0.590 nracc Trg 0.608 0.093–4.004 0.047–15.540 0.489 nrscD Trg 7.187 0.484–68.919 0.213–1,036.416 0.068 nrlPl Trg 0.892 0.188–3.174 0.113–20.060 0.847 nrFP(h1)—Probability of alternate hypothesis that difference between sample (c) and control groups (P) is due only to chance.Abbreviations: TRG, Target; REF, Reference; NR, not significantly regulated.
Table 8. relative gene expression obtained for Pc (corn grain and pasture, treatment) with respect to P (pasture, control) using rT-Pcr.g
Gene Type expression std. error 95% c.I. p(H1) Result
gaPDh reF 1.000sreBP Trg 0.533 0.177–1.596 0.111–2.865 0.139 nrFasn Trg 4.575 1.721–11.813 0.843–30.280 0.006 UPPParγ Trg 0.643 0.099–3.015 0.046–15.982 0.505 nrsTaT5 Trg 0.387 0.051–2.017 0.020–25.991 0.268 nrceBPα Trg 1.558 0.841–3.126 0.618–3.970 0.089 nracc Trg 0.640 0.070–5.163 0.036–73.163 0.614 nrscD Trg 30.314 2.661–245.852 1.407–1,527.9 0.002 UPlPl Trg 0.566 0.094–3.073 0.039–11.392 0.418 nrgP(h1)—Probability of alternate hypothesis that difference between sample (c) and control groups (Pc) is due only to chance.Abbreviations: TRG, Target; REF, Reference; NR, not significantly regulated.
Diet supplementation and gene expression in bovines
Bioinformatics and Biology Insights 2010:4 29
(Table 9). This slight difference in the correspondence across the two platforms might be accounted due to the pooling of RNA for microarray analysis where as individual RNA samples were used for qRT-PCR. Also, the qRT-PCR primer is designed based on the sequence database, which is derived from multiple sequence alignment of ESTs. As a result there is a high chance that affymetrix may target one gene, while the sequence database may infact represent an entire gene family with less specificity and therefore will interrogate neither the Affymetrix gene nor the database gene and thus give results that differ from both platforms.37
Despite the changes in gene expression, Pavan et al38 found that there were significant effects on the carcass qualities with these dietary supplements. Car-cass traits did not differ between PC and PO while
the dressing percentage and Hot Carcass Weight (HCW) where greater in PC, PO and C compared to P. Marbling score, Longissimus Muscle (LM) area and quality grade did not differ between grazing treatment. Pavan et al38 observed that the energy supplementation (PC and PO) increased the dressing percentage and carcass weight compared to P how-ever these steers has less dressing percentage and car-cass weight compared with steers supplemented with C. All these suggest that the effects on the expression of genes in fatty acid metabolism by high concentrate diet increases the fatty acid metabolism, which in turn is also reflected in carcass quality.
conclusionsMaintenance of energy homeostasis occurs through the induction of genes coding for enzymes that
Table 9. comparison of Microarray and qrT-Pcr results.g
Transcript Microarray RT-pcR Acceptable^ correspondance
P-value$ P-value#
p vs. c6/8sreBP 0.831 0.239 Yes
PParγ 0.175 0.266 YessTaT5 0.1032 ,0.01*(0.051)↑ noceBPα 0.931 0.687 Yesacc ,0.01*(4.62)↓ 0.042*(0.181)↑ noscD ,0.01*(6.48)↓ ,0.01*(47.14)↓ YeslPl 0.1 0.283 YesFasn ,0.01*(0.52)↓ ,0.01*(8.849)↓ Yesp vs. pcsreBP 0.15 0.139 Yes 4/8PParγ ,0.01*↑ 0.505 nosTaT5 0.226 0.268 YesceBPα ,0.01*(4.64)↑ 0.089 noacc 0.09 0.614 YesscD ,0.01*(3.96)↓ 0.002*(30.31)↓ YeslPl ,0.01*(1.65)↓ 0.418 noFasn ,0.01 0.006*(4.57)↑ nop vs. pO
7/8sreBP 0.8901 0.6902 YesPParγ 0.1129 0.748 YessTaT5 0.9877 0.181 YesceBPα 0.2739 0.590 Yesacc 0.11 0.489 YesscD 0.51 0.068 YeslPl 0.75 0.847 YesFasn ,0.01*(0.70)↓ 0.283 nog ,↓indicates lower expression in a than in B (a vs. B);↑indicates higher expression in a than in B (a vs. B).*Indicates statistical significance; $FDr corrected P-values from the F-test done in microarray analysis.#Probability (P-value) of alternate hypothesis that difference between samples (c, Pc and PO) and control (P) groups are due only to chance.^indicates resemblance between microarray and qrT-Pcr if Yes otherwise no.Abbreviations: P, pasture only; PO, pasture and corn oil; c, concentrate; Pc, pasture and corn grain.
Joseph et al
30 Bioinformatics and Biology Insights 2010:4
regulate specific rate limiting steps in lipid and energy metabolism. Consequently, the metabolic effects of CLA are presumed to involve changes in gene expression. Control of lipid homeostasis in response to the body’s energy requirements is pri-marily exerted through transcription factors of the nuclear hormone receptor family. These receptors bind small, lipophilic molecules that modulate recep-tor activation state. The results of this study showed that diet composition could have a significant impact on the expression of several genes crucially important to fatty acid and lipid metabolism. Corn supplemen-tation either as oil or grain appeared to significantly alter the expression of genes directly associated with fatty acid synthesis. Based on previous studies, our results suggest that the effects of gene expression on different concentrate dietary supplements on adipose tissue are different from those found in other tissues. These results were confirmed with qRT-PCR that showed satisfactory correspondence across the two platforms.
AcknowledgmentsThe funding for this study was provided through the seed grant by the College of Agriculture and Environmental Sciences at University of Georgia, Athens, GA, USA.
DisclosuresThis manuscript has been read and approved by all authors. This paper is unique and is not under consideration by any other publication and has not been published elsewhere. The authors and peer reviewers of this paper report no conflicts of interest. The authors confirm that they have permission to reproduce any copyrighted material.
References 1. Lee KW, Lee HJ, Cho HY, Kim YJ. Role of the conjugated linoleic acid in
the prevention of Cancer Critical Reviews in Food Science and Nutrition. 2005;45(2):135–44.
2. Bauman DE, Barbano DM, Dwyer DA, Griinari JM. Technical note: production of butter with enhanced conjugated linoleic acid for use in biomedical studies with animal models. Journal of Dairy Science. 2000;83(11):2422–5.
3. Duckett SK, Andrae JG, Owens FN. Effect of high-oil corn or added corn oil on ruminal biohydrogenation of fatty acids and conjugated linoleic acid formation in beef steers fed finishing diets. Journal of Animal Science. 2002;80:3353–60.
4. Noci F, Monahan FJ, French P, Moloney AP. The fatty acid composition of mus-cle fat and subcutaneous adipose tissue of pasture-fed beef heifers: influence of the duration of grazing. Journal of Animal Science. 2005;83:1167–78.
5. Daniel ZC, Wynn RJ, Salter AM, Buttery PJ. Differing effects of forage and concentrate diets on the oleic acid and conjugated linoleic acid content of sheep tissues: the role of stearoyl-CoA desaturase. Journal of Animal Sci-ence. 2004;82:747–58.
6. Scollan N, Hocquette J, Nuernberg K, Dannenberger D, Richardson I, Molo-ney A. Innovations in beef production systems that enhance the nutritional and health value of beef lipids and their relationship with meat quality. Meat Science. 2006;74:17–33.
7. Rangan VS, Smith S. Fatty acid synthesis in eucukaryotes. In: Biochemistry of lipids, lipoproteins and membranes, 4th edition (eds. by Vance DE and Vance JE), 2004; pp. 151–80. Elsevier, Paris.
8. Pavan E, Duckett SK. Corn oil supplementation to steers grazing endophyte-free tall fescue. II. Effects on longissimus muscle and subcutaneous adipose fatty acid composition and stearoyl-CoA desaturase activity and expression. Journal of Animal Science. 2007;85:1731–40.
9. Pavan E, Duckett SK, Andrae JG. Corn oil supplementation to steers grazing endophyte-free tall fescue. I. Effects on in vivo digestibility, performance, and carcass traits. Journal of Animal Science. 2007;85:1330–9.
10. Pegorier JP, Le May C, Girard J. Control of gene expression by fatty acids. Journal of Nutrition. 2004;134:2444S–9S.
11. Bonnet M, Leroux C, Faulconnier Y, et al. Lipoprotein lipase activity and mRNA are up-regulated by refeeding in adipose tissue and cardiac muscle of sheep. Journal of Nutrition. 2000;130:749–56.
12. Loor JJ, Dann HM, Guretzky NAJ, et al. Plane of nutrition prepartum alters hepatic gene expression and function in dairy cows as assessed by longitudinal transcript and metabolic profiling. Physiological Genomics. 2006;27:29–41.
13. Lehnert SA, Byrne KA, Reverter A, et al. Gene expression profiling of bovine skeletal muscle in response to and during recovery from chronic and severe under-nutrition. Journal of Animal Science. 2006;84:3239–50.
14. Band MR, Olmstead C, Everts RE, et al. A 3800 gene microarray for cattle functional genomics: comparison of gene expression in spleen, placenta, and brain. Animal Biotechnology. 2002;13:163–72.
15. Gillis MH, Duckett SK, Sackmann JR. Effects of supplemental rumen-protected conjugated linoleic acid or corn oil on lipid content and palatability in beef cattle. Journal of Animal Science. 2007;85:1504–10.
16. Realini CE, Duckett SK, Hill NS, et al. Effect of endophyte type on carcass traits, meat quality, and fatty acid composition of beef cattle grazing tall fescue. Journal of Animal Science. 2005;83:430–9.
17. Schoonmaker JP, Fluharty FL, Loerch SC. Effect of source and amount of energy and rate of growth in the growing phase on adipocyte cellularity and lipogenic enzyme activity in the intramuscular and subcutaneous fat depots of Holstein steers. Journal of Animal Science. 2004;82:137–48.
18. Benjamini Y, Hochberg Y. Controlling the false discovery rate: a practical and powerful approach to multiple testing. Journal of Royal Statistical Soci-ety. Series B (Methodological). 1995;57:289–300.
19. Rozen S, Skaletsky H. Primer3 on the WWW for general users and for biologist programmers. In: Krawetz S, Misener S, (editors). Bioinformat-ics Methods and Protocols: Methods in Molecular Biology. Humana Press, Totowa, NJ. 200; p 365–86
20. Pfaffl MW, Tichopad A, Prgomet C, Neuvians TP. Determination of stable housekeeping genes, differentially regulated target genes and sample integ-rity: BestKeeper-Excel-based tool using pair-wise correlations. Biotech.Let-ters. 2004;26:509–15.
21. Pfaffl MW, Horgan GW, Dempfle L. Relative expression software tool (REST) for group-wise comparison and statistical analysis of relative expression results in real-time PCR. Nucleic Acids Research. 2002;30:e36.
22. Andrae JG, Duckett SK, Hunt CW, Pritchard GT, Owens FN. Effects of feeding high—oil corn to beef steers on carcass characteristics and meat quality. Journal of Animal Science. 2001;79,582–8.
23. Chung KY, Lunt DK, Kawachi H, Yano H, Smith SB. Lipogenesis and stearoyl-CoA desaturase gene expression and enzyme activity in adipose tissue of short- and long-fed Angus and Wagyu steers fed corn- or hay-based diets. Journal of Animal Science. 2007;85,380–7.
24. Duckett SK, Pratt SL, Pavan E. Corn oil or corn grain supplementation to steers grazing endophyte-free tall fescue. II. Effects on subcutaneous fatty acid content and lipogenic gene expression. Journal of Animal Science. 2009;87:1120–8.
Diet supplementation and gene expression in bovines
Bioinformatics and Biology Insights 2010:4 31
publish with Libertas Academica and every scientist working in your field can
read your article
“I would like to say that this is the most author-friendly editing process I have experienced in over 150 publi-
cations. Thank you most sincerely.”
“The communication between your staff and me has been terrific. Whenever progress is made with the manuscript, I receive notice. Quite honestly, I’ve never had such complete communication with a
journal.”
“LA is different, and hopefully represents a kind of sci-entific publication machinery that removes the hurdles
from free flow of scientific thought.”
Your paper will be:• available to your entire community
free of charge• Fairly and quickly peer reviewed• Yours! You retain copyright
http://www.la-press.com
25. Berndt J, Kovacs P, Ruschke K, et al. Fatty acid synthase gene expres-sion in human adipose tissue: association with obesity and type 2 diabetes. Diabetologia. 2007;50:1472–80.
26. Geetha CJ, Herbein JH. Healthier dairy fat using trans-vaccenic acid. Nutri-tion and Food Science. 2000;30:304–9.
27. Moon YA, Shah NA, Mohapatra S, Warrington JA, Horton JD. Identifi-cation of a mammalian long chain fatty acyl elongase regulated by sterol regulatory element-binding proteins. Journal of Biological Chemistry. 2001;276:45358–66.
28. Peterson DG, Matitashvili EA, Bauman DE. Diet-induced milk fat depres-sion in dairy cows results in increased trans-10, cis-12 CLA in milk fat and coordinate suppression of mRNA abundance for mammary enzymes involved in milk fat synthesis. Journal of Nutrition. 2003;133:3098–3102.
29. Kersten S, Seydoux J, Peters JM, Gonzalez FJ, Desvergne B, Wrahli W. Peroxisome proliferator-activated receptor alpha mediates the adap-tive response to fasting. The Journal of Clinical Investigation. 1999;103: 1489–98.
30. Yahagi N, Shimano H, Hasty AH, et al. A crucial role of sterol regula-tory element-binding protein-1 in the regulation of lipogenic gene expres-sion by polyunsaturated fatty acids. The Journal of Biological Chemistry. 1999;274:35840–4.
31. Clarke SL, Robinson CE, Gimble JM. CAAT/enhancer binding proteins directly modulate transcription from the peroxisome proliferators-activated receptor gamma 2 promotor. Biochemical and Biophysical Research Com-munications. 1997;240:99–103.
32. Floyd ZE, Stephens JM. STAT5 A promotes adipogenesis in nonprecursor cells and associates with the glucocorticoid receptor during adipocyte dif-ferentiation. Diabetes. 2003;52:308–14.
33. Coulter AA, Stephens JM. STAT5 activators modulate acyl CoA oxidase (AOX) expression in adipocytes and STAT5 A binds to the AOX pro-moter in vitro. Biochemical and Biophysical Research Communinications. 2006;344:1342–45.
34. Hogan JC, Stephens JM. The regulation of fatty acid synthase by STAT5 A. Diabetes. 2005;54:1968–75.
35. Harvatine KJ, Bauman DE. SREBP1 and thyroid hormone responsive spot 14 (S14) are involved in the regulation of bovine mammary lipid synthesis during diet-induced milk fat depression and treatment with CLA. Journal of Nutrition. 2006;136:2468–74.
36. Duran-Montge P, Theil PK, Lauridsen C, Esteve-Garcia E. Dietary fat source affects metabolism of fatty acids in pigs as evaluated by altered expression of lipogenic genes in liver and adipose tissues. Animal. 2009;4:535–42.
37. Larkin JE, Frank BC, Gavras H, Quackenbush J. Independence and repro-ducibility across microarray platforms. Nature Methods. 2005;2:337–44.
38. Pavan E, Duckett SK. Corn Oil or Corn Grain Supplementation to Steers Grazing Endophyte-Free Tall Fescue. I. Effects on in vivo dige-stability, performance and carcass traits. Journal of Animal Science. 2008;86:3215–23.
Related Documents