PROCESS ENGINEERING Misr J. Ag. Eng., October 2019 - 1227 - EFFECT OF DESIGN AND OPERATING PARAMETERS ON MEASURED AND PREDICTED PRESSURE DROP IN CYCLONE Sabbah, F. M. * , M. A. Abdel-Hadi ** , S. M. Radwan ** and A. S. El-Sayed ** ABSTRACT In this study, many design parameters in cyclone such as cone height (30, 50 and 70 cm), vortex finder length (0, 10, 20, 30 and 40 cm) and dipleg length (25, 40 and 55 cm) were investigated under operating parameters via inlet air velocity (14, 16, 18 and 20 m/s) to find out the pressure drop (ΔP) of the cyclone empirically and predictively. The ΔP between inlet and outlet of the cyclone was measured experimentally by differential inclined manometer, while some mathematical models were used to predict ΔP of cyclone based on Shepherd and Lapple (1939), Barth (1956), Casal and Martinez-Benet (1983), Dirgo (1988) and Coker (1993). Some statistical indicators were used to compare and validate the measured with predicted results. As a result of this experiment, the maximum empirical ∆P were 161.3, 181.7 and 250.8 Pa recorded at inlet air velocity of 20 m/s, cone heights of 30, 50 and 70 cm under vortex finder lengths of 40, 40 and 0 cm and dipleg lengths of 55, 25 and 25 cm, respectively. Meanwhile, the minimum ∆P were 60.2, 63,6 and 80.6 Pa recorded at inlet air velocity of 14 m/s, cone heights of 30, 50 and 70 cm under vortex finder lengths of 10, 30 and 40 cm and dipleg lengths of 25, 55 and 55 cm, respectively. Furthermore, the best models to predict the pressure drop were Shepherd & Lapple, Coker and Dirgo, respectively. The Shepherd & Lapple model was more validation with cone heights of 50, 30 and 70 cm, respectively. Meanwhile, the predicted model Coker was more validation with cone heights of 30, 50 and 70 cm, respectively. While, Dirgo model was more validation to experimental data at vortex finder length of 20 cm then 30 and 10 cm, respectively. Key words: Cyclone, Pressure drop, Inlet air velocity, Cone height, Vortex finder length, dipleg length. * Ph.D. Student, Agric. Eng. Dept., Faculty of Agric., Suez Canal Univ. ** Prof., Agric. Eng. Dept., Faculty of Agric., Suez Canal Univ., 41522 Ismailia, Egypt. Misr J. Ag. Eng., 36 (4): 1227 - 1248

Welcome message from author
This document is posted to help you gain knowledge. Please leave a comment to let me know what you think about it! Share it to your friends and learn new things together.
Transcript

PROCESS ENGINEERING
Misr J. Ag. Eng., October 2019 - 1227 -
EFFECT OF DESIGN AND OPERATING
PARAMETERS ON MEASURED AND PREDICTED
PRESSURE DROP IN CYCLONE
Sabbah, F. M.*, M. A. Abdel-Hadi
**, S. M. Radwan
** and A. S. El-Sayed
**
ABSTRACT
In this study, many design parameters in cyclone such as cone height (30,
50 and 70 cm), vortex finder length (0, 10, 20, 30 and 40 cm) and dipleg
length (25, 40 and 55 cm) were investigated under operating parameters
via inlet air velocity (14, 16, 18 and 20 m/s) to find out the pressure drop
(ΔP) of the cyclone empirically and predictively. The ΔP between inlet
and outlet of the cyclone was measured experimentally by differential
inclined manometer, while some mathematical models were used to
predict ΔP of cyclone based on Shepherd and Lapple (1939), Barth
(1956), Casal and Martinez-Benet (1983), Dirgo (1988) and Coker
(1993). Some statistical indicators were used to compare and validate the
measured with predicted results. As a result of this experiment, the
maximum empirical ∆P were 161.3, 181.7 and 250.8 Pa recorded at inlet
air velocity of 20 m/s, cone heights of 30, 50 and 70 cm under vortex
finder lengths of 40, 40 and 0 cm and dipleg lengths of 55, 25 and 25 cm,
respectively. Meanwhile, the minimum ∆P were 60.2, 63,6 and 80.6 Pa
recorded at inlet air velocity of 14 m/s, cone heights of 30, 50 and 70 cm
under vortex finder lengths of 10, 30 and 40 cm and dipleg lengths of 25,
55 and 55 cm, respectively. Furthermore, the best models to predict the
pressure drop were Shepherd & Lapple, Coker and Dirgo, respectively.
The Shepherd & Lapple model was more validation with cone heights of
50, 30 and 70 cm, respectively. Meanwhile, the predicted model Coker
was more validation with cone heights of 30, 50 and 70 cm, respectively.
While, Dirgo model was more validation to experimental data at vortex
finder length of 20 cm then 30 and 10 cm, respectively.
Key words: Cyclone, Pressure drop, Inlet air velocity, Cone height,
Vortex finder length, dipleg length.
* Ph.D. Student, Agric. Eng. Dept., Faculty of Agric., Suez Canal Univ.
** Prof., Agric. Eng. Dept., Faculty of Agric., Suez Canal Univ., 41522 Ismailia, Egypt.
Misr J. Ag. Eng., 36 (4): 1227 - 1248

PROCESS ENGINEERING
- 1228 -
NOMENCLATURE a : cyclone inlet height, m.
A : cross-sectional areas of the inlet, m2.
b : cyclone inlet width, m.
co : mass ratio of dust feeding the cyclone to the gas flow rate, dimensionless.
D : cyclone vortex finder (exit pipe) diameter, m.
Db : cyclone cone-tip or dust outlet or dipleg diameter, m.
Dc : cyclone body (cylindrical part) diameter, m.
Eu : Euler number, dimensionless.
f : friction factor (f = 0.05).
g : gravity acceleration 9.81 m/ sec2.
h1 : cyclone cylindrical part (body) height, m.
h2 : cyclone conical part height, m.
h3 : cyclone dust outlet (dipleg) length, m.
HCS : height of the control surface extending from the bottom of the vortex finder to the
cyclone bottom or core length, as shown in Fig. (3), m.
Ht : cyclone total height (total height), m.
Hv : inlet velocity heads, m.
k : cyclone pressure drop constant, dimensionless.
K : The vortex finder entrance factor (K = 4.4).
n : number of measurements (statistics).
P1 : pressure at air inlet, Pascal.
P2 : pressure at air outlet, Pascal.
Psi : static pressure at inlet, N/m2.
Pso : static pressure in outlet, N/m2.
Q : gas volume flow rate, m3/h or m
3/s.
q : term in Stairmands pressure drop model.
R : cyclone radius (Dc/2), m.
Rin : radial position of the center of the inlet for a slot inlet as shown in Fig (3), m.
Rx : radius of vortex finder (D/2), m.
S : cyclone vortex finder or gas outlet length, m.
vi : average air velocity at the cyclone inlet, m/sec.
vx : mean axial velocity in the vortex.
vθcs : tangential velocity at the control surface CS.
x : experimental value.
x1 : distance movement of liquid (water) in above inclined tube, m.
x2 : distance movement of liquid (water) in below inclined tube, m.
y : predicted value.
y1 : vertical distance corresponding to x1, m.
y2 : vertical distance corresponding to x2, m.
Z : pressure head (difference in water levels), m.
α : manometer inclined angle, degree.
ΔP : pressure drop in the cyclone, N/m2.
ΔPbody : loss the pressure in the cyclone body, N/m2.
ξc : pressure drop coefficient, dimensionless.
ρg : gas density (air) 1.18, Kg/m3.
ρw : density of water, 1000 kg/m3.
φ : constant, dimensionless.
▼ : reference level.

PROCESS ENGINEERING
- 1229 -
INTRODUCTION
he cyclone is one of the most important air purifiers and
separation of solids from the air stream and most common in
many agricultural processing industries and post-harvest
operations. It is simple to install, low manufacturing and maintenance
costs, no moving parts and the ability to operate under difficult operating
conditions such as high temperature and pressure. In spite of the
simplicity of install, the prediction of pressure drop inside the cyclone is
very complex due to the interaction between designs and operating
parameters. A great number of research projects have been dedicated to
investigation of these parameters for distinct cyclone shapes under
various operating conditions (Hoffmann et al., 1992).
It is desirable to operate at the lowest flow rate possible for which the
collection efficiency of the cyclone is acceptable in order to reduce
operating costs of the cyclone, which are a function of both inlet velocity
and pressure drop. Thereby, the optimal design and operating parameters
will be evaluated based on collection efficiency and pressure drop
(Faulkner and Shaw, 2006).
The pressure drop across the cyclone is directly related to the inlet air
velocity required to operate a cyclone device. Schnell and Brown (2002)
presented that, inlet air velocity is a prime factor affecting the pressure
drop and hence the cyclone efficiency. Efficiency increases with an
increase inlet velocity as centrifugal force increases, but this also
increases the pressure drop which is not favorable. While, Chuah et al.
(2003) concluded that pressure drop is a function of the square of inlet
velocity, so too high a velocity will cause excessive pressure drop. On the
other hand, too low a velocity would cause a low efficiency. A very high
inlet velocity would decrease the collection efficiency because of
increased turbulence and re-entrainment of particles. Generally, it was
found that the optimum operating velocity was around 18 m/s.
Furthermore, Abdel-Hadi (2014) reported that the optimum practicable
cyclone inlet velocity was 18.5 m/s.
Demir et al. (2016) used the nine modifications of Stairmand High-
Efficiency type cyclone (Stairmand HE) with various cylindrical and
conical heights to investigate their effects on pressure drop and flow field
T

PROCESS ENGINEERING
- 1230 -
within cyclones. The experimental results indicated that, the designer
should be aware of that the body and conical heights have significant
effects on cyclone pressure drop. For a body height of less than 1.5Dc and
a conical height of less than 2.5Dc, pressure drop is more sensitive to
conical height. On the other hand, body height is more effective on
pressure drop when conical height is less than 2.5Dc and body height is
greater than 1.5Dc. Therefore, increasing both body and conical heights
together leads to reduced pressure drops with higher costs of construction.
The pressure drop in a cyclone is the difference of static pressure between
the inlet and outlet, which can be written as follows according to (Chen
and Shi, 2007):
(1)
The static pressure at the inlet cross-section is uniformly distributed
because there is no swirling motion. It can be easily measured with a
pressure tapping on the wall. But the static pressure at the wall outlet is
quite different from its cross- sectional average due to the strong swirling
flow. The dynamic pressure stored in the swirling motion can be
significant. The determination of the static pressure downstream of a
cyclone, hence the pressure drop becomes more complicated and difficult.
There are two steps to calculate of cyclone pressure drop. The first step is
to calculate the pressure drop in the number of inlet velocity heads (Hv)
then calculate the pressure drop (Shepherd & Lapple, 1939 and
Kanshio, 2015).
(2)
(3)
The main objective of this study was to investigate the effect of cyclone
design (cone height, cyclone total height, vortex finder length, dipleg
length) and operating parameter (inlet air velocity) on the pressure drop to
determine the appropriate design of the cyclone with inlet velocity.
Moreover, to assess the predictive validity of some literature correlations
in comparison with the measured pressure drop to the better use with the
existing theories.

PROCESS ENGINEERING
- 1231 -
MATERIALS AND METHODS
Experimental Unit
The experimental unit was fabricated from galvanized steel sheet of 1.5
mm thickness; cutting and welding were by laser technology. The
dimension and specification of the experimental unit are tabulated in
Table (1) and the overview of cyclone annexed to the inclined water-
manometer for measuring experimental pressure drop shown in Fig. (1).
Table (1): Dimension and specification of the experimental unit.
Parameter Description Values Unit
Dc Cyclone body diameter 30 cm
h1 Cyclone cylindrical part height 50 cm b Cyclone inlet width 7.2 cm a Cyclone inlet height 7.2 cm D Vortex finder diameter 9.2 cm Db Dipleg diameter 7.7 cm
Fig. (1): The overview of cyclone annexed to the inclined water-manometer.
1 Set of input dust. 5 Cyclone conical part.
2 Air supply unit. 6 Cyclone cylindrical part.
3 Inclined differential manometer. 7 Cyclone air and dust inlet.
4 Dipleg (dust outlet). 8 Vortex finder (air outlet).
PROCESS ENGINEERING
- 1232 -
Table (2) explains the parameters under study to determine the suitable
cyclone design and inlet air velocity.
Table (2): The experimental parameters under study.
Parameter Description Values Unit
h2 Cyclone conical part height 30, 50 and 70 cm h3 Dipleg length 25, 40 and 55 cm Ht Cyclone total height 80, 100 and 120 cm S Vortex finder length 0, 10, 20, 30 and 40 cm vi Inlet air velocity 14, 16, 18 and 20 m/s
Pressure Drop Measurements
The cyclone static pressure drop (ΔP) is usually calculated as the pressure
difference between the inlet and the pressure across the vortex finder exit
(Hoekstra, 2000). To get the best accuracy (resolution) the differential
inclined manometer was used for measurement the pressure drop. The
differential inclined manometer made from the silicone tube internal and
external diameter of 6.5 and 9.5 mm, respectively, and filled with gage
fluid (water). It was set at an angle 10o (α) to the horizontal and annexed
between the air inlet and outlet (vortex finder) as shown as in Fig. (1 and
2).
Fig. (2): The differential inclined manometer (Clifford et al., 2009).
The practically differential pressure (pressure drop, ΔP) between the inlet
and outlet corresponding to a vertical difference of levels y1 and y2 gives
move of the meniscus x1and x2 along the slope. To calculate a vertical
difference of levels y1 and y2 used the following equations according to
(Clifford et al., 2009).

PROCESS ENGINEERING
- 1233 -
(4)
(5)
(6)
(7)
Dewil et al. (2008) reported that, the static pressure drop (ΔP) between
the gas inlet and outlet of a cyclone is proportional to the square of the
flow rate (Q), with a proportionality resistance coefficient (ξc) defined on
the basis of the inlet velocity (vi = Q/ab), thus:
(8)
Table (3) summarized the models equations which descripted the inlet
velocity heads (Hv) or pressure drop coefficient (ξc) of empirical and
theoretical models according to (Cortés and Gil, 2007).
Table (3): The pressure drop coefficient (ξc) models according to
(Cortés and Gil, 2007).
Reference Equation Remarks
Empirical models
Shepherd &
Lapple (1939) (
) (9)
Coker (1993) (
) (10)
Casal and
Martinez-Benet
(1983)
(
)
(11)
Theoretical model
Dirgo (1988) (
)(
⁄
⁄ ⁄ ⁄ )
(12)
Barth (1956) suggested another theoretical model of (ξc) based on the
equilibrium-orbit model and divided the pressure drop in the cyclone into
three consists:
1- Loss the pressure at the inlet (this loss could be avoided by good
design).
2- Loss the pressure in the cyclone body (ΔPbody), it can be estimated as
the following:

PROCESS ENGINEERING
- 1234 -
[
(
)
(
)
] (13)
Where:
(14)
(15)
(16)
(17)
(
)
(18)
3- Loss the pressure in the vortex finder (ΔPx), can be estimated using
a semi- empirical approach as following:
[ ] *(
)
(
)
+ (19)
Therefore the total pressure drop is calculated as:
(20)
Hoffmann & Stein (2008) explained the item the height of control
surface (Hcs) according to the equilibrium-orbit theory in the following
Fig. (3)
Fig. (3): A- The control surface concept in the equilibrium-orbit
model and B- the inlet flow pattern for tangential inlet cyclone
(B) according to (Hoffmann and Stein, 2008).
b
HCS
Particle
D
dc
a
Control surface CS
b
Rin
vi
R
A B
PROCESS ENGINEERING
- 1235 -
Statistical indicators for empirical models
The models validation parameters were used to assess the measured data
of pressure drop in comparison with predictive validity of some literature
correlations to put the data into better use with the existing theories. Four
general statistical indicators for empirical models were chosen to evaluate
the prediction ability of the pressure drop predicted models. These
indicators are mean relative deviation (MRD, %), a relative standard error
of prediction (RSEP, %), root mean square error (RMSE) and Pearson
correlation coefficient (r), respectively.
- Mean relative deviation (MRD, %) (Chen and Morey, 1989).
*∑| |
+
(21)
The mean relative deviation modulus (MRD, %) is widely adopted
throughout the literature with a minimum value indicative of a good fit
for predicting models (Van den Berg et al., 1981).
- Relative standard error of prediction (RSEP, %) (Ghasemi and Niazi,
2005).
√∑
∑
(22)
Model accuracy is considered excellent when (RSEP) < 10 %, good if 10
% < (RSEP) < 20 %, fair if 20 % < (RSEP) < 30 % and poor if (RSEP) >
30 % (Li et al., 2013).
- Root mean square error (RMSE) (Jachner et al., 2007).
√∑ ( )
(23)
- Pearson correlation coefficient (r) according to (Spatz, 2008).
∑ ∑ ∑
√ ∑ ∑ √ ∑ ∑ (24)
In general, maximum value of the Pearson correlation coefficient (r) is
indicating a better fit of the predicted model. In other hand the minimum
values of mean relative deviation (MRD, %), a relative standard error of
prediction (RSEP, %) and root mean square error (RMSE) selected as a
best fit model (Tantar et al., 2014).
PROCESS ENGINEERING
- 1236 -
RESULTS AND DISCUSSION
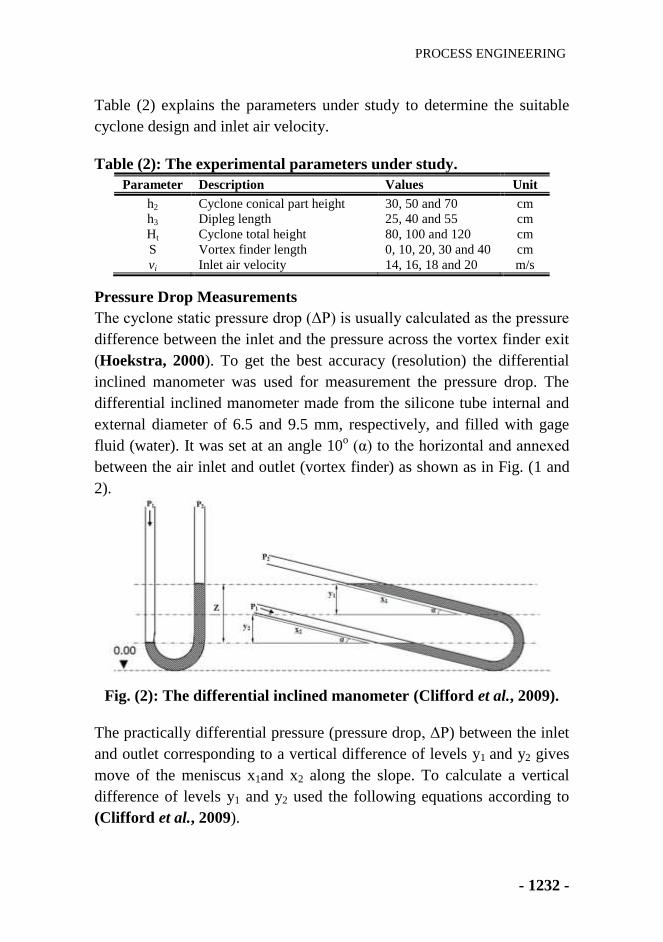
Measured Pressure Drop
In general, in obtaining results the experimental ∆P increase with increase
inlet air velocity and cone height and the results were agree with (Chuah
et al., 2006 and Juengcharoensukying et al., 2017). Fig. (4) illustrated
the relationship between inlet air velocity and pressure drop under the
different cone heights, vortex finder lengths and dipleg lengths.
Fig. (4): Effect of inlet air velocity on measured pressure drop at
different cone heights, vortex finder lengths and dipleg
lengths.
The maximum ∆P were 161.3, 181.7 and 250.8 Pa recorded at inlet air
velocity of 20 m/s, cone heights of 30, 50 and 70 cm under vortex finder
lengths of 40, 40 and 0 cm and dipleg lengths of 55, 25 and 25 cm,
respectively. Meanwhile, the minimum ∆P were 60.2, 63,6 and 80.6 Pa
0
50
100
150
200
250
300
14 16 18 20 m/sec
Pre
ssu
re d
rop
(ΔP
), P
a.
Air velocity
0
50
100
150
200
250
300
14 16 18 20 m/secP
ress
ure
dro
p (Δ
P),
Pa.
Air velocity
0
50
100
150
200
250
300
14 16 18 20 m/sec
Pre
ssu
re d
rop
(ΔP
), P
a.
Air velocity
0
50
100
150
200
250
300
14 16 18 20 m/sec
Pre
ssu
re d
rop
(ΔP
), P
a.
Air velocity
0
50
100
150
200
250
300
14 16 18 20 m/sec
Pre
ssu
re d
rop
(ΔP
), P
a.
Air velocity
0
50
100
150
200
250
300
14 16 18 20 m/sec
Pre
ssu
re d
rop
(ΔP
), P
a.
Air velocity
0
50
100
150
200
250
300
14 16 18 20 m/sec
Pre
ssu
re d
rop
(ΔP
), P
a.
Air velocity
0
50
100
150
200
250
300
14 16 18 20 m/sec
Pre
ssu
re d
rop
(ΔP
), P
a.
Air velocity
0
50
100
150
200
250
300
14 16 18 20 m/sec
Pre
ssu
re d
rop
(ΔP
), P
a.
Air velocity
0
50
100
150
200
250
300
14 16 18 20 m/sec
Pre
ssu
re d
rop
(ΔP
), P
a.
Air velocity
0
50
100
150
200
250
300
14 16 18 20 m/sec
Pre
ssu
re d
rop
(ΔP
), P
a.
Air velocity
0
50
100
150
200
250
300
14 16 18 20 m/sec
Pre
ssu
re d
rop
(ΔP
), P
a.
Air velocity
0
50
100
150
200
250
300
14 16 18 20 m/sec
Pre
ssu
re d
rop
(ΔP
), P
a.
Air velocity
0
50
100
150
200
250
300
14 16 18 20 m/sec
Pre
ssu
re d
rop
(ΔP
), P
a.
Air velocity
0
50
100
150
200
250
300
14 16 18 20 m/sec
Pre
ssu
re d
rop
(ΔP
), P
a.
Air velocity
cone height, 30 cmcone height, 50 cmcone height, 70 cm
Dipleg length, 25 cm
40 cm 55 cm
Vortex finder, 0 cm
10 cm
20 cm
30 cm
40 cm
∆
P,
Pa.
Air velocity Air velocity Air velocity
◊ Cone height, 30 cm
○ Cone height, 50 cm
□ Cone height, 70 cm
∆P
, P
a.
∆P
, P
a.
∆P
, P
a.
∆P
, P
a.

PROCESS ENGINEERING
- 1237 -
recorded at inlet air velocity of 14 m/s, cone heights of 30, 50 and 70 cm
under vortex finder lengths of 10, 30 and 40 cm and dipleg lengths of 25,
55 and 55 cm, respectively. The results showed that the pressure drop was
increased with increasing the cyclone size according to (Azadi et al.,
2010). Also the observed results showed that, the effect of both vortex
finder length and dipleg length on ∆P was tiny effect and neglected, these
results agree with (Elsayed, 2011).
Predicted Pressure Drop
The accurate prediction of cyclone ∆P is very important because it relates
directly to operating costs and overall collection efficiency. The most
widely used models for the pressure drop coefficient (ξc) are Shepherd &
Lapple (1939); Barth (1956); Casal & Martinez-Benet (1983); Dirgo
(1988) and Coker (1993). These five theories above-mentioned were
applied in equation (8) to predict the ∆P according to (Dewil et al., 2008)
and validate them to the experimentally ∆P, which measured by the
inclined differential manometer. Table (4) showed some statistical
indicators to validate predicted with measured values of ∆P.
Table (4): Some statistical indicators to validate predicted with
measured values of pressure drop.
Statistics
parameters Experiment
Shepherd
& Lapple
Coker
Dirgo
Barth
Casal &
Martinez
Mean 120.6 117.9 69.8 96.6 625.8 404.5
Std. deviation 46.4 30.6 18.1 59.3 162.5 105.0
R - 0.86260 0.86260 0.33538 0.86151 0.86259
MRD, % - 15.4 39.1 39.0 446.1 252.9
RSEP, % - 19.6 46.5 51.2 402.8 226.2
RMSE - 25.4 60.1 66.2 520.3 292.1
The Barth and Casal & Martinez-Benet models were given an extreme
result comparing with measured ∆P because it has lower values of the
Pearson correlation coefficient (r) and at the same time has the highest
values of (MRD, %), (RSEP, %) and (RMSE) as shown in Table (4)
according to (Tantar et al., 2014).
As shown in Table (4) bold values refer to the more accurately model
Shepherd & Lapple regarding particular indicator then Coker and
Dirgo, respectively. The Shepherd & Lapple model has the highest
value of (r) 0.86260 and the lowest value of MRD %, RSEP and RMSE,

PROCESS ENGINEERING
- 1238 -
which were 15.4, 19.6 and 25.4, respectively. Figures (5, 6 and 7)
illustrate the comparison between the best three models and the
experimental results.
Fig. (5): The measured and predicted pressure drop at different
coefficient models (ξc) under the cone height of 30 cm at
different dipleg lengths and vortex finder lengths.
Dipleg length, 25 cm 40 cm 55 cm
Vortex finder, 0 cm
10 cm
20 cm
30 cm
40 cm
. .
∆P
, P
a.
∆P
, P
a.
∆P
, P
a.
∆P
, P
a.
∆P
, P
a.
Air velocity Air velocity Air velocity

PROCESS ENGINEERING
- 1239 -
In general the ∆P of cyclone under cone heights of 30, 50 and 70 cm were
increased with increasing the inlet air velocity. In Fig. (5) the measured
values were closer to the Shepherd & Lapple model while, the Dirgo
model was equal zero Pascal at vortex finder length zero cm because the
model including the effect of vortex finder length. Meanwhile, increasing
the vortex finder length lead to the increasing the predicted values of
Dirgo model corresponding on measured ∆P at vortex finder length of 10
cm and corresponding on Shepherd & Lapple model at vortex finder
length of 20 cm then rise above both measured ∆P and Shepherd &
Lapple model under vortex finder lengths of 30 and 40 cm.
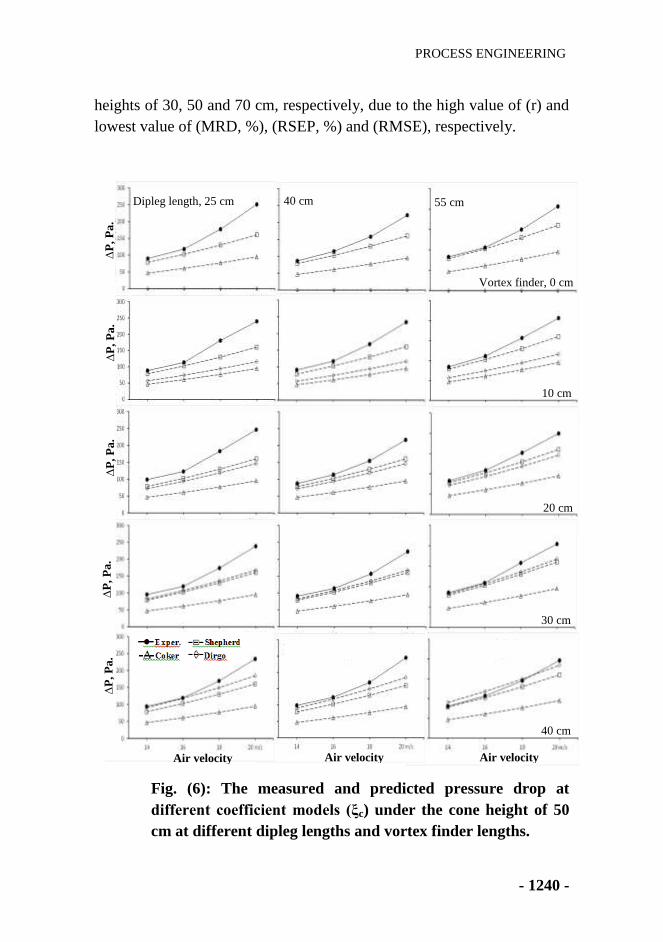
Fig. (6) illustrate the ∆P of cyclone under cone height of 50 cm. The
experimental measured values were closer to the Shepherd & Lapple
model especially at inlet air velocity of 18 m/s. While, the Dirgo model
was equal zero Pascal at vortex finder length of zero cm and
corresponding on Shepherd & Lapple model at vortex finder length of
20 cm. Generally, the predicted value of Dirgo model increasing with
increase the vortex finder length.
Fig. (7) presented the ∆P of the cyclone under the cone height 70 cm. The
experimental measured values were higher than the predicted values of all
models and it was closer to Shepherd & Lapple model at inlet air
velocities of 14 and 16 m/s after that, by increasing inlet air velocity from
16 to 20 m/s increasing the gap between the measured and predicted
values. The values of Shepherd & Lapple model were closer to Dirgo
model at vortex finder lengths of 20 and 30 cm at all inlet air velocity.
To assess the effect of cone height on ∆P and put the data into better use;
the data were validated with predicted ∆P models. Table (5 and 6)
focused the comparison between the best predicted of ∆P models and
experiment results under different cone heights and dipleg length,
respectively.
Table (5) presented the correlation between the best predicted models and
experimental ∆P under the cone heights of 30, 50 and 70 cm; the
statistical values seem that the Shepherd & Lapple model was more
validation comparing with other models. At the same time, this model
was more validation with cone heights of 50, 30 and 70 cm, respectively.
Meanwhile, the predicted model Coker was more validation with cone
PROCESS ENGINEERING
- 1240 -
heights of 30, 50 and 70 cm, respectively, due to the high value of (r) and
lowest value of (MRD, %), (RSEP, %) and (RMSE), respectively.
Fig. (6): The measured and predicted pressure drop at
different coefficient models (ξc) under the cone height of 50
cm at different dipleg lengths and vortex finder lengths.
Dipleg length, 25 cm 40 cm 55 cm
Vortex finder, 0 cm
10 cm
20 cm
30 cm
40 cm
∆P
, P
a.
∆P
, P
a.
∆P
, P
a.
∆P
, P
a.
∆P
, P
a.
Air velocity Air velocity Air velocity

PROCESS ENGINEERING
- 1241 -
Fig. (7): The measured and predicted pressure drop at different
coefficient models (ξc) under the cone height of 70 cm at
different dipleg lengths and vortex finder lengths.
Vortex finder, 0 cm
Dipleg length, 25 cm 55 cm
10 cm
20 cm
30 cm
40 cm
40 cm
∆P
, P
a.
∆P
, P
a.
∆P
, P
a.
∆P
, P
a.
∆P
, P
a.
Air velocity Air velocity Air velocity
PROCESS ENGINEERING
- 1242 -
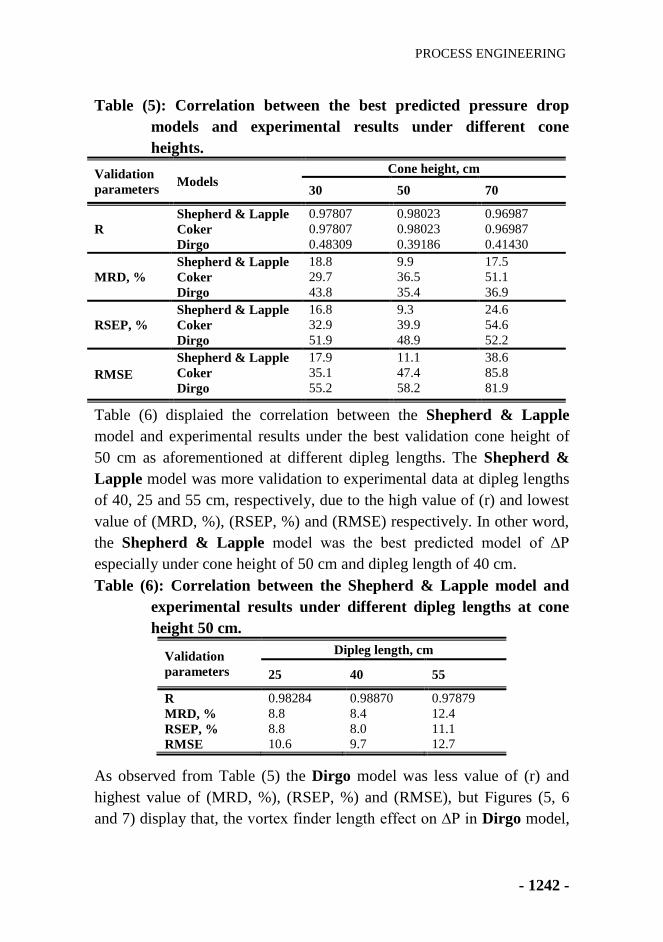
Table (5): Correlation between the best predicted pressure drop
models and experimental results under different cone
heights.
Validation
parameters Models
Cone height, cm
30 50 70
R
Shepherd & Lapple 0.97807 0.98023 0.96987
Coker 0.97807 0.98023 0.96987
Dirgo 0.48309 0.39186 0.41430
MRD, %
Shepherd & Lapple 18.8 9.9 17.5
Coker 29.7 36.5 51.1
Dirgo 43.8 35.4 36.9
RSEP, %
Shepherd & Lapple 16.8 9.3 24.6
Coker 32.9 39.9 54.6
Dirgo 51.9 48.9 52.2
RMSE
Shepherd & Lapple 17.9 11.1 38.6
Coker 35.1 47.4 85.8
Dirgo 55.2 58.2 81.9
Table (6) displaied the correlation between the Shepherd & Lapple
model and experimental results under the best validation cone height of
50 cm as aforementioned at different dipleg lengths. The Shepherd &
Lapple model was more validation to experimental data at dipleg lengths
of 40, 25 and 55 cm, respectively, due to the high value of (r) and lowest
value of (MRD, %), (RSEP, %) and (RMSE) respectively. In other word,
the Shepherd & Lapple model was the best predicted model of ∆P
especially under cone height of 50 cm and dipleg length of 40 cm.
Table (6): Correlation between the Shepherd & Lapple model and
experimental results under different dipleg lengths at cone
height 50 cm.
Validation
parameters
Dipleg length, cm
25 40 55
R 0.98284 0.98870 0.97879
MRD, % 8.8 8.4 12.4
RSEP, % 8.8 8.0 11.1
RMSE 10.6 9.7 12.7
As observed from Table (5) the Dirgo model was less value of (r) and
highest value of (MRD, %), (RSEP, %) and (RMSE), but Figures (5, 6
and 7) display that, the vortex finder length effect on ∆P in Dirgo model,

PROCESS ENGINEERING
- 1243 -
where ∆P was increased with increase vortex finder length. Thus to
determine the best correlation of Dirgo model under the vortex finder
length the statistics values were focused in Table (7).
Table (7): Correlation between the predicted pressure drop of Dirgo
model and experimental results under different vortex finder
lengths.
Validation
parameters
Vortex finder length, cm
0 10 20 30 40
r - 0.00085 0.00094 0.00094 0.00090
MRD, % 100.0 20.8 17.9 25.2 31.2
RSEP, % 100.0 34.3 23.2 24.6 29.2
RMSE 128.9 43.8 30.2 31.5 38.1
Table (7) illustrated that, The Dirgo model was more validation to
experimental data at vortex finder lengths of 20, 30 and 10 cm,
respectively, due to it has the high value of (r) and lowest value of (MRD,
%), (RSEP, %) and (RMSE), respectively. While the vortex finder 40 and
zero cm were lowest validation to Dirgo model.
CONCLUSIONS
- The obtained results inducted that, the experimental pressure drop
increased with increase inlet air velocity and cone height.
- The maximum ∆P were 161.3, 181.7 and 250.8 Pa recorded at inlet air
velocity of 20 m/s, cone heights of 30, 50 and 70 cm under vortex
finder lengths of 40, 40 and 0 cm and dipleg lengths of 55, 25 and 25
cm, respectively. Meanwhile, the minimum ∆P were 60.2, 63,6 and
80.6 Pa recorded at inlet air velocity of 14 m/s, cone heights of 30, 50
and 70 cm under vortex finder lengths of 10, 30 and 40 cm and dipleg
lengths of 25, 55 and 55 cm, respectively.
- The observed results showed that, the effect of both vortex finder length
and dipleg length on ∆P was tiny effect and neglected.
- The Barth and Casal & Martinez-Benet models were given an extreme
result comparing with measured pressure drop.
- The best model to predict the pressure drop was Shepherd & Lapple,
Coker and Dirgo, respectively. The Shepherd & Lapple model has
PROCESS ENGINEERING
- 1244 -
the highest value of (r) 0.86260 and lowest value of MRD, RSEP %
and RMSE which are 15.4, 19.6 and 25.4, respectively.
- Shepherd & Lapple model was more validation comparing with other
models. In the same time, the model was more validation with cone
heights of 50, 30 and 70 cm, respectively. Meanwhile, the predicted
model Coker was more validation with cone heights of 30, 50 and 70
cm, respectively.
- Dirgo model was more validation to experimental data at vortex finder
length of 20 cm then 30 and 10 cm, respectively.
REFERENCES
Abdel-Hadi, M. A. (2014): Effect of cyclone inlet velocity and vortex
finder height on coarse wheat bran dust separation. Misr J. Ag.
Eng., 31(3): 1001-1024.
Azadi M.; M. Azadi and A. Mohebbi (2010): A CFD study of the effect
of cyclone size on its performance parameters. Journal of
Hazardous Materials, 182(1-3): 835-841.
Barth, W. (1956): Design and layout of the cyclone separator on the
basis of new investigations. Brennstow-Wäerme-Kraft (BWK),
8(4): 1-9. Germany.
Casal, J. and J. M. Martinez-Benet (1983): A better way to calculate
cyclone pressure drop. Chemical Engineering, 90(2): 99-100.
Chen, C. C. and R. V. Morey (1989): Comparison of four EMC/ERH
equations. Trans. Amer. Soc. Agr. Eng., 32: 983-989.
Chen, J. and M. Shi (2007): A universal model to calculate cyclone
pressure drop. Powder Technology, (171): 184-191.
Chuah, T. G.; J. Gimbun and T. S. Y. Choong (2006): A CFD study of
the effect of cone dimensions on sampling aerocyclones
performance and hydrodynamics. Powder Technology, 162: 126-
132.
Chuah, T. G.; J. Gimbun; T. S. Y. Choong and A. Fakhru’l-razi
(2003): Numerical prediction of cyclone pressure drop. Journal of
Chemical Engineering and Environment, 2(2): 67-71.
Clifford, M.; R. Brooks; A. Howe; A. Kennedy; S. McWilliam; S.
Pickering; P. Shayler and P. Shipway (2009): An introduction
PROCESS ENGINEERING
- 1245 -
to Mechanical engineering, Part 1. ISBN: 978 0 340 93995 6.
PP:511.
Coker, A. K. (1993): Understand cyclone design. Chemical Engineering
Progress, 28: 51-55.
Cortés, C. and A. Gil (2007): Modeling the gas and particle flow inside
cyclone separators. Progress in Energy and Combustion Science,
33(5): 409-452.
Demir, S.; A. Karadeniz and M. Aksel (2016): Effects of cylindrical
and conical heights on pressure and velocity fields in cyclones.
Powder Technology, 295: 209-217.
Dewil, R.; J. Baeyens and B. Caerts (2008): CFB cyclones at high
temperature: operational results and design assessment.
Particuology, 6(3): 149-156.
Dirgo, J. (1988): Relationships between cyclone dimensions and
performance. Ph.D. Thesis, Havarad University, USA.
Elsayed, K. (2011): Analysis and optimization of cyclone separators
geometry using RANS and LES methodologies. Ph.D. Thesis,
Department of Mechanical Engineering, Faculty of Engineering,
Vrije University. Brussel, Belgium.
Faulkner, W. B. and B. W. Shaw (2006): Efficiency and pressure drop
of cyclones across a range of inlet velocities. Applied Engineering
in Agriculture, American Society of Agricultural and Biological
Engineers ISSN 0883−8542, 22(1): 155-161.
Ghasemi, J. and A. Niazi (2005): Tow- and three- way chemometrics
methods applied for spectrophotometric determination of
lorazepam in pharmaceutical formulations and biological fluids.
Analytic Chimica Acta, 533: 169-177.
Hoekstra, A. J. (2000): Gas flow field and collection efficiency of
cyclone separators. Ph.D. Thesis, Technical University Delft.
Netherland.
Hoffmann, A. C., and L. E. Stein, L. E. (2008): Gas cyclones and swirl
tubes: principles, design and operation. ISBN 978-3-540-74694.
22nd
Edition, Springer Berlin Heidelberg, Germany.

PROCESS ENGINEERING
- 1246 -
Hoffmann, A. C.; A. van Santen and R. W. K. Allen (1992): Effects of
geometry and solid loading on the performance of gas cyclones.
Powder Technol. 70: 83-91.
Jachner, S.; K. G. van den Boogaart and T. Petzoldt (2007): Statistical
Methods for the Qualitative Assessment of Dynamic Models with
Time Delay (R Package qualV). Journal of Statistical Software,
22(8): 1-30.
Juengcharoensukying, J.; K. Poochinda and B. Chalermsinsuwan
(2017): Effects of Cyclone Vortex Finder and Inlet Angle on Solid
Separation Using CFD Simulation. Energy Procedia, 138: 1116-
1121.
Kanshio, S. (2015): Multiphase flow in pipe cyclonic separator. Ph.D.
Thesis, Oil and Gas Engineering Centre, Cranfield University.
UK.
Li, M. F; X. P. Tang; W. Wu and H. B. Liu (2013): General models for
estimating daily global solar radiation for different solar radiation
zones in mainland China. Energy Convers Manag., 70: 139-48.
Schnell, K. B. and C. A. Brown (2002): Cyclone design. Air pollution
control technology, Chapter 21. Handbook, Edited by Frank, K.,
CRC Press LLC, Florida, USA.
Shepherd, C. B. and C. E. Lapple, C. E. (1939): Air Pollution Control:
A Design Approach, In Cyclones. 2nd
Edition, Woveland Press
Inc., Illinois, USA. Pp 127-139.
Spatz, C. (2008): Basic statistics: Tales of distributions. 9th
Edition,
Belmont, CA: Thomson Wadsworth, ISBN- 10: 0-495-50218-9.
USA.
Tantar, A. A.; E. Tantar; P. Bouvry; P. Del Moral; P. Legrand; C. A.
C. Coello and O. Schütze (2014): EVOLVE-A Bridge between
Probability, Set Oriented Numerics and Evolutionary
Computation. Springer International Publishing Switzerland. e-
ISBN 978-3-319-07494-8. PP: 414.
Van den Berg, C.; S. Bruin; In L. B. Rockland and F. Stewart (1981):
Water activity :influences on food quality. New York: Academic
Press, Pp: 147-177. USA.
PROCESS ENGINEERING
- 1247 -
انمهخص انعربي
تأثير انعىامم انتصميميت وانتشغيهيت عه فرق انضغظ انمقاس وانمتنبأ بو
داخم انضيكهىن
فاته محمذ عه صباح *
محمذ عه عبذ انهادي، **
،
محمذ عبذ انحق رضىانشريف **عادل صانم انضيذو
**
شيػا ااء أوصشا اصثح ذياس فص ااد ذميح ااء يؼرثش اغيى أ أظضج
ارشوية إخفاض تثغاغح ارصيغ يراص .اصاػاخ ػياخ ا تؼذ احصاد اؼذيذ في
امذسج وا ا رحشوح،لا ذظذ ت أظضاء تغيطح، خااخ ذىايف اصياح يى ذصيؼ
إلا أ ، تغاغح ذشويث اشغ ػ .اعغػ في ظشف ذشغي صؼثح ص اسذفاع اؼ ػ
اؼا ارصييح ظد اؼذيذظشا غايح ؼمذيى ارثؤ تفشق اعغػ داخ اغيى
ان اؼذيذ ذضاي لا .تارا فشق اعغػ داخ اغيى اؤششج ػ ػيح ارذفكارشغييح
(ΔPفشق اعغػ ) ذلغ ف إ ذذف اغيى اري حي اذساعاخ ارعشيثيح اظشيح
تي ذخ خشض ااء ف اغيى تاعطح ايرش ائ ΔPلياط لذ ذ ف اغيى.
01فشل ذ ذشويث ائلا تضايح ο
ز اايرش ذ ذصيؼ امياط ضيادج دلح ػ الأفم ره
ذد دساعح تؼط ػ ارا. 2,2 3,2خاسظ اذاخ ا أثب عييى لطش
/ز(، أسذفاع 01 01، 03، 01اؼا ارشغييح ارصييح ص عشػح دخي ااء )
، 01، 01، 1اصح اريغىتيح خشض ااء )ع(، غي 01 21، 01اعضء اخشغ )
فشق ظغػ ع(. رميي 22 11، 02ع( غي فرحح خشض ااد اعؼح ) 11 01
تؼط ΔPذ اعرخذا تؼط اارض اشياظيح رثؤ وا .احذج ارعشيثيح ( فΔPارشغي )
عح.اماييظ الإحصائيح ماسح ارحمك غ ارائط اما
-انتانيت: وقذ تىصهت انذراصت إن اننتائج
اخشغ. اسذفاعشػح دخي ااء فشق اعغػ اماط يضداد غ صيادج ع -
ػذ اتاعىاي ذ ذغعي 021,1 010,0، 030,0( واد P∆ألص ليح فشق اعغػ ) -
ع ػذ غي اصح 01 21، 01ز، أسذفاع اخشغ / 01عشػح دخي ااء
، 22 فتحة خروج المواد المجمعةع غي صفش 11، 11اريغىتيح خشض ااء
تاعىاي 11,3 30,3، 31,0( واد P∆ع، ػ ارا. تيا، أل ليح ـ ) 02 02
ع ػذ 01 21، 01شغ /ز، أسذفاع اخ 01ػذ عشػح دخي ااء اذ ذغعي
فتحة خروج المواد ع غي 11 01، 01غي اصح اريغىتيح خشض ااء
ع، ػ ارا. 22 22، 02 المجمعة
الإصماعيهيت، مصر. 22544 - جامعت قناة انضىيش -كهيت انزراعت -قضم انهنذصت انزراعيت -* طانبت دكتىراه
جامعت قناة انضىيش. -كهيت انزراعت -قضم انهنذصت انزراعيت -انزراعيت ** أصتار انهنذصت

PROCESS ENGINEERING
- 1248 -
طول الوصلة التليسكوبية لخروج الهواء وطول فتحة خروج المواد المجمعة وا ذأشيش ولا -
.ضئيل ومهمل
رائط رطشفح ماسح تفشق Barth Casal & Martinez-Benetأػطد ارض -
اعغػ اماط.
Shepherd & Lapple رض رثؤ تفشق اعغػ داخ اغيى رضأفع -
Coker Dirgo .رض حيس أػط ، ػ اراShepherd & Lapple أػ
أل ليح مايظ الإحصائيح 1.13031( r)ؼا الإسذثاغ مياط الإحصائ ليح
25.4 19.6، 15.4 وادار (RMSE) (% ,RSEP)، (% ,MRD)الاخش
ػ ارا.
أوصش اارض ذحميما رثؤ تفشق اعغػ داخ اغيى Shepherd & Lappleرض -
ماسح تاارض الأخش. ف فظ الد وا زا ارض أوصش ذحميما رثؤ تفشق
وا Cokerا، رض ع، ػ ارا. تي 01 01 21اعغطغ أسذفاع اخشغ
ع، ػ ارا. 01 21 01أوصش ذحميما رثؤ تفشق اعغػ غ أسذفاع اخشغ
طول الوصلة التليسكوبية لخروج وا أوصش ذحميما رثؤ تارائط اماعح ػذ Dirgoرض -
ع، ػ ارا. 01 01ش 01 الهواء
Related Documents