EFFECT OF CREDIT MANAGEMENT PRACTICES ON THE PERFORMANCE OF SMALL AND MEDIUM ENTERPRISES IN THE TRANSPORT AND LOGISTICS INDUSTRY IN NAIROBI, KENYA. BY CHARITY ANZAZI BUNGULE D66/71927/2014 A RESEARCH PROJECT SUBMITTED IN PARTIAL FULFILMENT OF THE REQUIREMENTS FOR THE AWARD OF THE DEGREE OF MASTER OF SCIENCE IN ENTREPRENUERSHIP AND INNOVATION MANAGEMENT SCHOOL OF BUSINESS UNIVERSITY OF NAIROBI NOVEMBER, 2016

Welcome message from author
This document is posted to help you gain knowledge. Please leave a comment to let me know what you think about it! Share it to your friends and learn new things together.
Transcript

EFFECT OF CREDIT MANAGEMENT PRACTICES ON THE
PERFORMANCE OF SMALL AND MEDIUM ENTERPRISES IN
THE TRANSPORT AND LOGISTICS INDUSTRY IN NAIROBI,
KENYA.
BY
CHARITY ANZAZI BUNGULE
D66/71927/2014
A RESEARCH PROJECT SUBMITTED IN PARTIAL FULFILMENT
OF THE REQUIREMENTS FOR THE AWARD OF THE DEGREE
OF MASTER OF SCIENCE IN ENTREPRENUERSHIP AND
INNOVATION MANAGEMENT
SCHOOL OF BUSINESS
UNIVERSITY OF NAIROBI
NOVEMBER, 2016

ii
DECLARATION
I hereby declare that this research project is my original work and it has not been
submitted to any other college or university for academic credit.
Signature …………………………………. Date…………………………………
Charity Anzazi Bungule
D66/71927/2014
This research project has been submitted for examination with my approval as the
candidate’s university supervisor.
Signature …………………………………. Date……………………………………
Dr. Bitange Ndemo
Lecturer, Department of Business Administration
School of Business
University of Nairobi

iii
ACKNOWLEDGEMENT
I thank God for His unceasing love in granting me the opportunity to pursue my master’s
degree and the ability to successfully undertake the research. I also express my sincere
gratitude to my supervisor, Dr. Bitange Ndemo, for his invaluable guidance throughout
the research work without which it would have been a rocky road to trade on. Finally, I
also appreciate the University of Nairobi for the offering a flexible programme to allow
even for the employed to fulfil their academic dreams.

iv
DEDICATION
Jeremiah 29:11, “For I know the plans I have for you, declares the Lord, plans to prosper
you and not to harm you, plans to give you hope and a future”, I dedicate this project to
my God who has always been faithful and opened up doors for me that I never thought
existed. Indeed, it has come to pass.
To my mum, Mrs P.S. Deche, my rock, my greatest cheer leader. Thank you for believing
in me and encouraging me to be the best that I can be. “Usome yale yote yenye sikuweza
kusoma”, you always said.
To my Husband, Kelvin Abincha Moturi. Thank you for being selfless and for the
sacrifices you had to make to see me through my post graduate. Your support during this
period has been amazing. I do not take it for granted.
To my son, Leroy Moturi Abincha, my little sunshine. You are the reason I never gave up
even when things got though.

v
TABLE OF CONTENTS
DECLARATION............................................................................................................... ii
ACKNOWLEDGEMENT ............................................................................................... iii
DEDICATION.................................................................................................................. iv
LIST OF TABLES .......................................................................................................... vii
LIST OF ABBREVIATIONS ....................................................................................... viii
ABSTRACT ...................................................................................................................... ix
CHAPTER ONE ............................................................................................................... 1
INTRODUCTION............................................................................................................. 1
1.1 Background .......................................................................................................... 1
1.2 Research Problem ................................................................................................. 7
1.3 Research Objectives ............................................................................................. 8
1.4 Value of the Study ................................................................................................ 8
CHAPTER TWO ............................................................................................................ 10
LITERATURE REVIEW .............................................................................................. 10
2.1 Introduction ........................................................................................................ 10
2.2 Theoretical Literature ......................................................................................... 10
2.3 Empirical Literature ........................................................................................... 15
2.4 Chapter Summary and Gaps ............................................................................... 21
CHAPTER THREE ........................................................................................................ 22
RESEARCH METHODOLOGY .................................................................................. 22
3.1 Introduction ........................................................................................................ 22
3.2 Research Design ................................................................................................. 22
3.3 Population........................................................................................................... 22
3.4 Sample ................................................................................................................ 23
3.5 Data Collection ................................................................................................... 23
3.6 Data Analysis ..................................................................................................... 24
CHAPTER FOUR ........................................................................................................... 25
DATA ANALYSIS AND FINDINGS ............................................................................ 25
4.1 Introduction ........................................................................................................ 25
4.2 Demographic Analysis ....................................................................................... 26

vi
4.3 Credit Management Practices............................................................................. 29
4.4 Credit Management Practices and Performance ................................................ 31
CHAPTER FIVE ............................................................................................................ 37
SUMMARY, CONCLUSION, AND RECOMMENDATIONS ................................. 37
5.1 Introduction ........................................................................................................ 37
5.2 Summary ............................................................................................................ 37
5.3 Conclusion .......................................................................................................... 38
5.4 Recommendations .............................................................................................. 38
5.5 Suggestions for Further Research ...................................................................... 39
REFERENCES ................................................................................................................ 40
APPENDICES ................................................................................................................. 44
Appendix I: Research Questionnaire ....................................................................... 44
Appendix II: List of Transport and logistics Companies in Nairobi ......................... 47

vii
LIST OF TABLES
Table 4.1: Title of respondents..................................................................................... 26
Table 4.2: Gender of respondents ................................................................................ 26
Table 4.3: Length of time the company has been operational ..................................... 27
Table 4.4: Respondents’ highest levels of education ................................................... 27
Table 4.5: Whether the respondents have any professional training ........................... 27
Table 4.6: Markets served by the business................................................................... 28
Table 4.7: Local or foreign ownership ......................................................................... 28
Table 4.8: Family or non-family business.................................................................... 28
Table 4.9: Are you directly responsible for credit management in the organisation? . 29
Table 4.10: Do you have any other person responsible for credit management? .......... 29
Table 4.11: Do you possess certification in credit management? .................................. 30
Table 4.12: How often does your business extend credit sales to clients? .................... 30
Table 4.13: Credit management practices adopted by transport & logistics companies 31
Table 4.14: Performance of transport and logistics companies ..................................... 31
Table 4.15: Correlation matrix ....................................................................................... 33
Table 4.16: Regression models ...................................................................................... 34

viii
LIST OF ABBREVIATIONS
CEO Chief Executive Officer
CI Confidence Interval
CRB Credit Reference Bureau
EAC East African Community
GDP Gross Domestic Product
GMM Gaussian Mixture Model
GPT General Purpose Technology
JKIA Jomo Kenyatta International Airport
LP Long Play
OLS Ordinary Least Squares
PwC PriceWaterhouse Coopers
R&D Research & Development
ROI Return on Investment
SME Small and Medium Enterprises
SPSS Statistical Package for Social Sciences
US United States of America

ix
ABSTRACT
The failure rate of SMEs globally is estimated by experts to be between 70 and 80
percent. It is substantially higher for countries in sub-Saharan Africa. Most Kenyan
transport and logistics companies have been unable to maintain that balance due to the
competitive nature of the industry and hence some of the companies have been forced to
close shop or downsize. Thus, their survival rate has tended to worsen and credit
management may be one of the courses of such low survival rates of these firms. The
objectives of this study were to examine the credit management practices of SMEs in the
transport and logistics sector and to establish the effect of credit management practices on
the performance of SMEs in Nairobi County, Kenya. This study adopted a descriptive
design. The population of the study was 1,133 transport and logistics companies within
Nairobi. Simple random sampling technique was used to select a sample of 287 firms for
the study. Primary data was collected via a questionnaire designed based on the
objectives of the study. The sampled target respondents were managers/owners of the
transport and logistics companies. Face to face interviews were conducted. Descriptive
analysis was used to summarize some of the initial results especially the demographics as
well as to analyze objective one. OLS regression analysis was used to analyze objective
two. The study revealed that the most common credit management practice was checking
customer credit worthiness before granting trade credit followed by offering discounts for
early payment and use of customer’s audited accounts to extend trade credit. As to the
relationship between credit management practices on performance, the results were
mixed. No single practice had a uniform and stable effect on all the four parameters of
performance used in the study. For instance, checking credit worthiness of customer
before extending credit had a negative effect on sales volume and sales growth while it
had a positive effect on financial results and ROI. The use of CRB to check for credit
worthiness before extending credit had positive effects on sales growth and volume but
negative effects on financial results and ROI. The study concludes that transport and
logistics companies in Nairobi employ very limited credit management practices. The
study also concludes that while the relationship between credit management practices and
performance is mixed in this study, there is a pattern emerging where when credit
management practices lead to an improvement in sales (volume and growth), it
negatively impacts the overall performance of the firm (financial results and ROI). This is
true for all the credit management practices used in this study except for customization
according to solvency risk, credit insurance for sales, and conducting formal analysis for
reasons for late payment. The study recommends as follows. First, the transport and
logistics companies in the SME sector should embrace better credit management
practices by employing qualified personnel to be in charge of credit management.
Secondly, the transport and logistics companies in the SME sector should decide, at a
strategic level, what is important between better sales or better overall performance of the
firms. Lastly, it is important that other firms borrow from the results of this study for
practical purposes. Further, for policy purposes, it is important that employees be trained
and certified in credit management in order to improve this important discipline in
institutions.

1
CHAPTER ONE
INTRODUCTION
1.1 Background
There has been an increasing attention towards small and medium enterprises (SMEs)
from scholars and practitioners globally in the recent past due to their significant
contribution to economies in both developing and developed economies (Asiedu &
Freeman, 2007). They are a backbone of many economies. In Europe, for instance, SMEs
accounted for almost 85% of net new jobs by 2010 (Uwonda, Okello, & Okello, 2013).
This is also true in the United States where in 2012, the SMEs accounted for almost half
the number of employees in the economy. According to Caruso (2015), 51.9 percent of
all employees were employed by large businesses while the rest were divided between
very small enterprises, small enterprises and medium enterprises. Thus, about 56.1
million people were employed by the SMEs in the US by 2012 census data. This is more
than double the number that were employed by the SMEs in US by 2004 according to
Kozlow (2006). Currently, SMEs in US contribute to over half of non-farm GDP.
Other than Europe and US, SMEs also play an important role in Asia especially in
creating employment for the masses and as a source of economic growth. SMES are also
a source of foreign currencies in Asian countries. For instance in Indonesia, SMEs are
important for creating employment, generating foreign currencies via exports to other
countries in Africa, America, and Europe, as well as their ability to grow into larger
enterprises through internationalization (Tambunan, 2009). In India, SMEs create the
highest employment to the masses through industries accounting for the highest
employment growth and share of industrial production and exports (Kumar, 2014).

2
Nowhere else are SMES as important as they are in Africa. SMEs are the biggest job
creators in all African economies and an engine of national economic growths. They are
also touted as the seeds of big businesses playing the role of suppliers of large enterprises
in Africa. However, small businesses are not only suppliers but also consumers of
products (Abor & Quartey, 2010). In the national economies in Africa, SMEs account for
half of the GDP; are more productive than large companies, innovate more, have more
impact on social and cultural issues, and play a major part in the future of Africa’s
economic growth (Uwonda et al., 2013).
SMEs play a significant role in East Africa through alleviation of poverty and
participation in the global economy through import-export trade. This has helped develop
the national economies. For example, SMEs account for about 90% of the private sector
in Kenya. They are also a major source of employment and wealth creation to the masses
especially the women and youth and unskilled or low-skilled workers. They are also a
major contributor to tax revenues and are supplies to larger corporations in terms of
supply of goods and services (Ernst & Young, 2009).
1.1.1 Credit Management in SMEs
Credit (or trade credit) management is the center of a business entity for both short and
long-term survival. Credit management both the short term and long terms financial aims
(Uwonda et. al, 2013, p. 69). It brings together efforts concerned with payment for goods
or services consumed, collection of cash from clients who have consumed products or
services on credit and general liquidity management (Aminu, 2012, p. 58).
3
According to Muller (2008), SMEs must understand credit management if they intend to
manage their cash flows. The author noted that credit management helps SMEs to project
their cash flow requirements. This helps them optimise their reveues and expenditure
timing and amounts. Further, Yaqub & Husain (2010) noted that in order for small
businesses to grow, they must address factors that lead to their failure such as cash flow
problems. This can be done through better credit management practices.
There are numerous objectives of credit management. According to Aminu (2012) credit
management seeks to accelerate cash inflows, delay cash outflows, invest excess cash to
earn a return, borrow cash at the best rates available, and maintain an optimal cash level.
With better credit and cash flow management practices, a business is capable of holding
the right amount of cash and give the business an opportunity to make and receive
payments in time. The objective of credit management is to ensure that a business
identifies its needs in good time in order to avoid cash flow crisis (Horner, 2013).
1.1.2 Credit Management and Performance
Trade credit, on the supply side, is an investment in terms of accounts receivable. There
are a number of benefits that accrue to a business that uses trade credit. First, it reduces
the operational costs. As Ferri (1981) noted, it also increases operating flexibility. By
relaxing the credit terms, businesses can reduce storage costs for some merchandise with
uncertain demands as well as reduce costs related to changes in production levels when
demand fluctuates (García-Teruel and Martínez-Solano, 2010).

4
Secondly, trade credit leads to increased sales. As Meltzer (1960) noted, businesses use
trade credit to boost sales. Businesses use trade credit and not direct price reduction in
order to increase sales particulary during the period of cash crunch. While most SMEs do
not have high profit margins, they regard trade credit as a way to increase sales and
profitability (García-Teruel and Martínez-Solano, 2014).
Another reason for businesses to prefer use of trade credit, according to Hill et al. (2012),
is interest income. Clients that pay early are provided discounts which is considered an
implit interest rate for late payment. Usually, the implicit rate of return on trade credit is
about 40%. This shows that trade credit is is usually a lucrative investment for businesses
especially in instances where the customer default risk is low (Hill et al. 2012).
Finally, as Wilner (2000) noted, trade credit also helps SMEs to establish a long
commercial relationship with their clients. Trade credit normaly increase customers’
dependence on their suppliers and this leads to a higher implicit interest rate (Hermes et
al. 2011). Further, trade credit can be regarded as a switching barrier as buyers may lose
access to this financial service if they switch from one supplier to another. This is
because suppliers usually offer credit to those businesses that that have an established
relationship with (Hermes et al. 2011). This forces suppliers to be tied with clients in a
stable commercial relationship bound together by trade credit.
Trade credit is not always a rosy affair as it also has some detrimental effects for
suppliers. As Emery (1984) noted, there is a trade-off between the benefits and costs on
trade credit and, thus, proposed optimal trade credit policy as a way of addressing this

5
trade-off. Empirical studies have examined the relationship between trade credit (or credit
management) and firm performance. For instance, Hill and Lockhart (2012) and García-
Teruel and Martínez-Solano (2014) found that trade credit had a positive relationship
with firm performance while Kestens et al (2012) concluded that for firms that during the
2008 financial crisis, those companies that extended more trade credit to their clients than
before performed better during the crisis as their profitability significantly rose.
Further, Amuzu (2010) sought to establish a link between business success or failure
credit management practices of SMEs. According to Peng & Jiahai (2006), cash flow
problems are inherent in SMEs due to the fact that they operate with inadequate cash
reserves which is exacerbated by poor credit management practices. Uwonda et. al,
(2013) noted that one of the issues that affect SMEs in Uganda is poor credit policy
which points towards poor credit management practices in SMEs in Uganda.
1.1.3 Transport and logistics Industry in Kenya
Historically, the development of trade and transport and logistics in Kenya began from
the port of Mombasa through the Uganda railway. This is a common feature of growth of
trade and transport and logistics in sub-Saharan Africa and remains, to this date, even
after road transport took over from the rail transport. Currently, most of the cities and
economic activities are located or close to the Northern corridor. Therefore, transport and
logistics in Kenya is all about operators moving goods along the Northern corridor. By
2005, World Bank estimated that about 10 million tons of goods were moved along the
corridor by various transport means including trucks, rail and pipeline (World Bank,
2005).

6
In spite of the simplicity in the transport and logistics routing in Kenya, there are
contrasts to the story. On one hand, the nation is tending to overwhelming difficulties on
the public sector side to get up to speed with infrastructural investment and reforms that it
has been dismissing for two decades, and actualize modernization ventures at the
Customs, or privatize the railroads. Then again, a somewhat productive private sector
came up and could create inventive solutions notwithstanding a poor investment
atmosphere (Gichuru, 2012).
The most well-known and reported case is the development of an exceptionally proficient
air-transport which gives a five-star connection amongst Kenya and the other markets.
Kenya has turned into a pioneer in the field since private businesses, local and foreign
investors alike, have possessed the capacity to build up an exceptionally effective supply
network, maximizing the use of JKIA. The cycle from the farms to Europe can take as
little as 24 hours. This achievement was made conceivable by private investors and
worldwide liberalization of air-transport (Netherlands-African Business Council, 2014).
According to PwC (2015), the performance of Kenya’s transport and logistics sector has
been deteriorating over the years. Once ranked 76th
globally in 2007, Kenya is now
ranked 122nd
out of 155 countries. While global shipments, infrastructure and transport
and logistics competences have increased since 2007, there has been a decline in
customs, track & trace and timeliness since then. However, the time to import goods and
documents is comparable to the other sub-Saharan countries but the costs are still higher
in Kenya.

7
1.2 Research Problem
The failure rate of SMEs globally is estimated by experts to be between 70 and 80
percent. It is substantially higher for countries in sub-Saharan Africa. According to
Uwonda et al. (2013), millions of money is lost on SMEs through avoidable mistakes
such as those of poor credit management. Aminu (2012) noted that most SMEs are run by
people who do not have an idea of how to run a business and, therefore, lack the
appreciation of businesses fundamentals. While the problems that affect SMEs are
numerous, Abor & Quartey (2010) revealed that credit management is one that denies the
SMEs cash flows to run the businesses smoothly. When businesses extend credit, the
assumption is always that the buyers will pay promptly (Muller, 2008). This, however, is
not always the case.
Most Kenyan transport and logistics companies have been unable to maintain that
balance due to the competitive nature of the industry and hence some of the companies
have been forced to close shop or downsize (Netherlands-African Business Council,
2014). Thus, their survival rate has tended to worsen (Gichuru, 2012) and credit
management may be one of the courses of such low survival rates of these firms.
Loveline, Uchenna, & Karubi (2014) assessed the challenges facing women-owned
enterprises and noted that credit management issue was a significant challenge. From the
study, the results showed that small businesses were severely hurt by the inability of
some of their trade creditors to pay up their debts on time thus affected their working
capital. In Kenya, studies on credit management have only focused on the management of
credit facilities provided by financial institutions and working capital management

8
practices of firms in general. None has so far examined this issue in terms of how it
affects the survival of SMEs or the performance. This is a gap that the present study
sought to bridge by analyzing how the credit management practices of transport and
logistics SMEs within Nairobi County affects their performance.
1.3 Research Objectives
The objectives of this study were:
i. To determine the credit management practices of small and medium
enterprises in the transport and logistics sector in Nairobi county, Kenya.
ii. To establish the effect of credit management practices on the performance of
SMEs in the transport and logistics sector in Nairobi county, Kenya.
1.4 Value of the Study
The expected outcome is to be able to show how innovative credit management practices
can significantly improve the business performance of transport and logistics companies.
This will be beneficial especially to those entrepreneurs in the transport and logistics
industry in Kenya as they will understand how better practices of credit management are
instrumental to the survival of their businesses.
The study will also be important to policy makers in the transport and logistics sector in
terms of coming up with policies that will enhance the development of the sector by
addressing some of the skills deficiencies in the sector, especially the credit management
skills. Together with the education sector, policies may be geared towards strengthening
this skill set within individuals to enhance the business survival rates of SMEs.

9
The study is also valuable to researchers in the field of entrepreneurship as it seeks to
document how credit management challenge affects survival of businesses and how
better practices can be linked to better performance of the SMEs in terms of their
performance. Future studies can be based on this study.

10
CHAPTER TWO
LITERATURE REVIEW
2.1 Introduction
This chapter presents the literature review. The chapter begins with a theoretical review
of literature where theories of entrepreneurship are reviewed. Then, a review of empirical
literature on the credit risk management practices and performance is made. Finally, a
chapter summary is provided with research gaps.
2.2 Theoretical Literature
This section reviews two broad theoretical foundations. The first is the review of
Schumpeter’s theory. Secondly, this section reviews the theories related to innovation
and implementation cycles. Under this, the works of Shleifer (1986), Schmookler (1966)
and Francois & Lloyd-Ellis (2003) are reviewed alongside the limitations of
Schumpeter’s theory of business cycles.
2.2.1 Theory of Business Cycles and Creative Destruction
This theory was proposed by Schumpeter, first in 1927 and later in 1939. At the time, he
was a standout amongst the most compelling early authors about business cycles,
entrepreneurship and innovation (Parker, 2012). In the expressions of one of the
considerable financial experts of the twentieth century, Schumpeter contended that
business cycles are the repetitive changes in the rate at which advancements are brought
into the economy, in the force with which business visionaries practice their sui generis
capacity of beating deterrents to new combinations' (Kuznets, 1940). As per Schumpeter,
history contains a couple of surprising scenes in which gatherings of incredibly capable
business people present progressive advancements which change existing innovations.

11
Amid these scenes, economies become emphatically and encounter blasts. Be that as it
may, the dispersion of these advancements in the long run urge imitators to swarm into
the market and contend away the spearheading business visionaries' benefits. Schumpeter
contended that such imitators set up the new request as another harmony for the
economy. The economy backs off and stagnates, until another arrangement of
spearheading business visionaries disturbs the harmony again with another arrangement
of progressive developments which renders the past ones old. This accelerates the
following blast, and the cycle rehashes itself. Schumpeter recommended that this
procedure of entrepreneurial development is in charge of the standard and generally
watched changes in monetary movement which he called the "typical" business cycle.
The substitution of old advancements absolutely benefits the business visionaries
presenting the new ones, to the detriment of officeholders whose creation is attached to
more seasoned advances which now get to be out of date. Schumpeter called this
procedure 'creative destruction'. There are various cases of imaginative pulverization,
including the substitution of steam trains by diesel and electric trains; of the transmit by
the phone; and of vinyl LP's by smaller plates. Financial analysts have as of late
examined troublesome Schumpeterian advancements and inventive demolition in more
formal settings (Aghion and Howitt, 1998).
Despite the fact that the creative destruction idea has stood the trial of time, various
consequent scholars have censured Schumpeter's record of business cycles. Kuznets
(1940) was an early pundit, who brought up that Schumpeter significantly neglects to

12
clarify how unequal entrepreneurial capacities convert into "buncing" of developments
through time which offers ascend to blasts and retreats (1940, 262–263). One plausibility
is the entry of major mechanical leaps forward that impact all segments – a general
purpose technology (GPT). Yet, there is no logical motivation behind why GPTs ought to
touch base in customary cycles; and there is no confirmation that they do by and by
either. That makes challenges for Schumpeter's endeavors to connection consistent
business cycles to the entry of sporadic GPTs. As Kuznets called attention to, it is
workable for GPTs to be connected with 'long wave' cycles, however it is difficult to
maintain this contention for fleeting high-recurrence cycles which are of essential
enthusiasm to scientists and approach producers. Another issue with Schumpeter'
hypothesis is that, radical GPT propels separated, developments have a tendency to rise
consistently after some time. Ensuing scholars have perceived this constraint and have
grown more sensible models (Parker, 2012).
2.2.2 Innovation and Implementation Cycles
As noted before, Schumpeter's (1939) hypothesis of business cycles experiences two
noteworthy downsides. To start with, it produces cycles practically by presumption: leap
forward developments are accepted to happen sporadically and to be packed together in
time. In addition, these cycles are completely supply driven and exogenous; neither
request, nor request desires, assume a part. Second, Schumpeter's hypothesis identifies
with longwave cycles, instead of to the short-wave business cycles which have a
tendency to be of more noteworthy financial, commonsense, and arrangement intrigue.
Shleifer (1986) proposed a basic model which addresses both of these worries. In his
model, firms deliver utilization merchandise which buyers request in equivalent extents.

13
Despite the fact that a firm produces a development, it might defer its commercialization
(i.e., advancement) until a later date. It is expected that developments can be postponed
without the hazard that another firm will execute it first (however just until the following
thought touches base to the segment Υ periods later). Without development, firms inside
a division are Bertrand contenders. Subsequently cost is driven down to negligible cost,
which is the wage rate, standardized to solidarity. All organizations make zero benefits
(Parker, 2012).
Dissimilar to Schumpeter (1939), Shleifer joins developments to request. Dissimilar to
Schmookler (1966), this connection is not a reaction to genuine request conditions, but
instead is a reaction to forward-looking interest desires. Shleifer's model can offer ascent
to various patterned equilibria. Business visionaries' self-fulfilling desires figure out
which specific harmony acquires and along these lines to what extent a subsidence
endures. The distinctive equilibria are Pareto positioned; the most beneficial balance,
which one may anticipate that business visionaries will pick, require not be the most
proficient one. Shleifer went ahead to demonstrate that an educated adjustment
arrangement, financed by a dynamic expense on returns in the blast, can in some cases
raise welfare; however, in the event that huge blasts are important to repay business
visionaries for high altered development costs, such an approach can have the
unreasonable impact of debilitating any execution thus halting all mechanical advance
(Parker, 2012).

14
The indeterminacy of the different equilibria proposes a deficiency in Shleifer's model.
Another downside of that model is its solid suspicions of intense however costless
impersonation, exogenous creation, and the difficulty of capacity. As Francois and Lloyd-
Ellis (2003) call attention to, if business people can store their yield, they ought to
contract work, deliver and after that store yield when expenses are low (i.e., amid
subsidences) – and offer the yield when request is high (i.e., amid blasts). Clearly, this
would undermine the presence of execution cycles as Shleifer considered them. The
model of Francois and Lloyd-Ellis (2003) sums up Shleifer's in a few vital regards,
unwinding the suppositions about extraordinary and costless impersonation and non-
stockpiling. In any case, from our point of view, maybe the most imperative component
of Francois and Lloyd-Ellis (2003) is that their business people effectively give exertion
towards growing new developments (which diminishes one-for-one from creation time).
Rich however the Francois-Lloyd-Ellis model is, it dubiously predicts that more
development movement happens in retreats than in blasts. Truth be told, Barlevy (2007)
refers to proof demonstrating that research and development (R&D) spending is
unequivocally ace recurrent: most R&D assets are spent amid blasts. That may seem
astonishing given that the open door cost of assets, for example, R&D exertion are lower
amid retreats, when creation work gets a lower result. As Barlevy (2007) clarifies, this
advantage of intertemporal smoothing can be overpowered by a balancing expected cost
of deferral, prompting professional cyclicality. This normal cost mirrors the danger of
allocation of the business person's development by opponents if the business person does
the R&D in retreats and defers the arrival of the advancement to the blast.

15
2.3 Empirical Literature
The empirical review in this section is based on a number of studies globally, regionally,
and locally on credit management. Some of the literature also stems from works in cash
management as well as those from working capital management. The issue of SMEs
giving out credit to their customers is a cross-cutting theme in all the three concepts
hence the reason for borrowing literature from these areas. More specifically, there are a
few studies that have focused on trade credit as a form of credit management practice and
such literature is also reviewed.
2.3.1 Credit management Practices of Entrepreneurs
Uwonda et. al, (2013) in a study on cash flow management in SMEs in Uganda found
that on average, most SMEs monitored their cash flows. Further results showed that most
SMEs matched their cash flows and that most SMEs also checked their credit policies
routinely. These results show that there is a semblance of some organized form of credit
management practice among SMEs in Uganda in terms of having in place a credit policy
which is constantly reviewed as well as having an estimation of optimal cash flows
within the business.
Wu, Firth, & Rui (2014) examined the relationship between trust and trade credit among
Chinese firms. The study argued for and found that private businesses that had higher
social trust used trade credit from suppliers more. The same businesses also extended
more trade credit as opposed to the businesses with lower trust. Higher trust businesses
also collected and paid receivables and payables respectively more quickly. This suggests
that for SMEs to offer trade credit to their customers, trust is key.

16
Ndagijimana & Okech (2014) investigated the factors that affect working capital
management practice in SMEs in Nairobi. The study specifically assessed how the
working capital is affected by both accounts receivables and payables. The results
showed that accounts receivable had a significant positive effect on working capital
management practices in the SMEs. Further, the study also revealed that trade credit was
offered by SMEs and customers took from two weeks to four months to pay up. These
long trade credit periods affected the cash flows and therefore the operations of suppliers
of trade credit. This study reveals some of the credit management practices within the
working capital that are carried out by SMEs in Kenya.
Scheers (2010) examined the challenges facing family-owned SMEs dealing in groceries
in South Africa to understand the extent to which the business owners or managers felt
that a number of selected problems affected the success of their businesses. One of the
significant findings was that management qualification affected business success. The
results also showed that inadequate credit management was a problem experienced by
about a third of the businesses. This is directly reflective of the lack of credit
management skills within the businesses.
A study by Uwonda et. al, (2013) examined the utilization of cash flow by small
businesses in Northern Uganda. Data was gathered from a sample of 120 SMEs in the
service sector. This study highlighted the limitations that SMEs face in utilization of cash
flow especially in areas such as cash flow projection. The study also found out that most

17
of the managers had diplomas and certificates from colleges. Only 9 percent of the
managers had degrees.
Cant & Wiid (2013) sought to determine the extent to which SMEs in South Africa
experienced challenges that negatively impacted the success of the businesses. The
survey focused on 81 SMEs. The study found that one of the key challenges faced by the
entrepreneurs was lack of skills in various fields to which the authors recommended that
there was need to enhance the skills and capabilities of SMEs in order for them to
succeed. The study also found that in terms of levels of education, only 24 percent of the
managers/owners had degrees. This calls into question their credit management skills.
In a study by Loveline et. al, (2014) in Kuching-Sarawak, the authors assessed the
challenges experienced by women entrepreneurs in Malaysia. From a survey of 31
respondents, the study one of the challenges was the inability to employ skillful workers.
This, coupled with the challenge of credit management as some of the clients do not pay
in time and therefore hurt their cash flows, shows that skills are a hindrance to the
success of small businesses.
2.3.2 Effect of Credit Management Practices on the Performance
Padachi (2006) sough to study the working capital management trends and how working
capital impacts on firm performance. The focus was on small manufacturing firms in
Mauritius. A sample of 58 firms was used and a panel data collected from 1998 to 2003.
The regression results revealed that investing highly in receivables leads to dampened
profitability. This study, therefore, shows that trade credit may have a negative effect on

18
the performance of SMEs and firms should be careful not to over-invest in trade credit as
this may hurt their cash flows and hence their operations in general. This may lead to
their failure eventually.
Garcia-Teruel & Martinez-Solano (2007) studied the effect of working capital
management on the profitability of Spanish SMEs. The study collected panel data from
8,872 SMEs from 1996 to 2002. The results demonstrated that it is possible for managers
to create value for their businesses by lowering the number of day’s accounts receivable.
Equally, the study revealed that firms’ profitability can be improved if the cash
conversion cycle can be shortened.
Garcia-Teruel & Martinez-Solano (2010) tested whether the trade credit decisions follow
a model of partial adjustment. Using a sample of 2,922 SMEs in Spain and employing a
dynamic panel data model as well as the Gaussian Mixture Model (GMM) method of
estimation, the study revealed that firms have a target trade credit level and all decisions
taken are meant to achieve that targeted level. The study also found that a positive sales
growth, firm size, economic growth, and internal funds generation capacity, are important
determinants of trade credit granted by firms.
Kestens, Van Cauwenberge, & Bauwhede (2012) investigated how trade credit was
impacted by the 2008 financial crisis. The study also tested whether trade credit changes
mitigated the impact of the crisis on firm profitability. The study documented that the
impact of the crisis on trade credit was higher when the availability of trade credit

19
decreased. Finally, the study revealed that the crisis had a negative impact on firm
performance. This effect was lower for firms giving more trade credit and higher for
firms receiving more trade credit. This shows that during crises, SMEs that offer more
trade credit benefit more through improved financial performance than those that receive
more trade credit.
Banos-Caballero, Garcia-Teruel, & Martinez-Solano (2012) analyzed the relation
between working capital management and profitability for SMEs in Spain. This study
examined whether there was a non-linear relationship between profitability and working
capital management practices of small businesses. The study found a concave
relationship between the two variables. This means that there is an optimal working
capital level for SMEs at which point their profitability is maximized. This suggests that
SMEs also have an optimal level of debt sales that they should keep in order to enjoy the
benefits.
Ferrando & Mulier (2012) sought to examine whether firms trade credit can be used by
firms to manage growth. Using a sample of 600,000 small businesses in Europe for the
period 1993-2009, the study showed that firms manage their growth by using trade credit.
The study noted that for countries where trade credit is more pronounced, the marginal
impact on growth is lower but the overall impact is larger. Further, the study revealed
that firms that are prone to financial market limitations may bank on the trade credit path
in order to manage their growth.

20
Gul, et al., (2013) investigated the impact of working capital management on
performance of small businesses in Pakistan. The study covered a period of seven years
from 2006 to 2012. The panel data analysis revealed that average collection period had an
inverse relation with performance. This suggests that trade credit has an adverse effect on
the financial performance of SMEs.
Martinez-Sola, Garcia-Teruel, & Martinez-Solano (2014) studied the implications of
trade credit to profitability for a sample of 11,337 manufacturing SMEs in Spain during
the 2000–2007 period. The results showed that an increase in receivables can lead to
improved firm performance. Thus, SMEs can improve their overall profitability by giving
more trade credit, according to the findings of this study.
Afrifa (2015) examined the relationship between trade credit and firm performance. Panel
data regression analysis was used in the estimation of functions relating the effects of
trade credit channel and net trade credit on performance. The results of a panel of 1,708
firms over the period 2003-2012 show a positive relation between net trade credit and
firm performance; and a positive relationship between performance and trade credit. The
results were further strengthened by interacting size and cash flow with trade credit.
Overall, the findings provide evidence that the performance of net trade credit and trade
credit channel are higher for larger and/or less financially constraint firms.
21
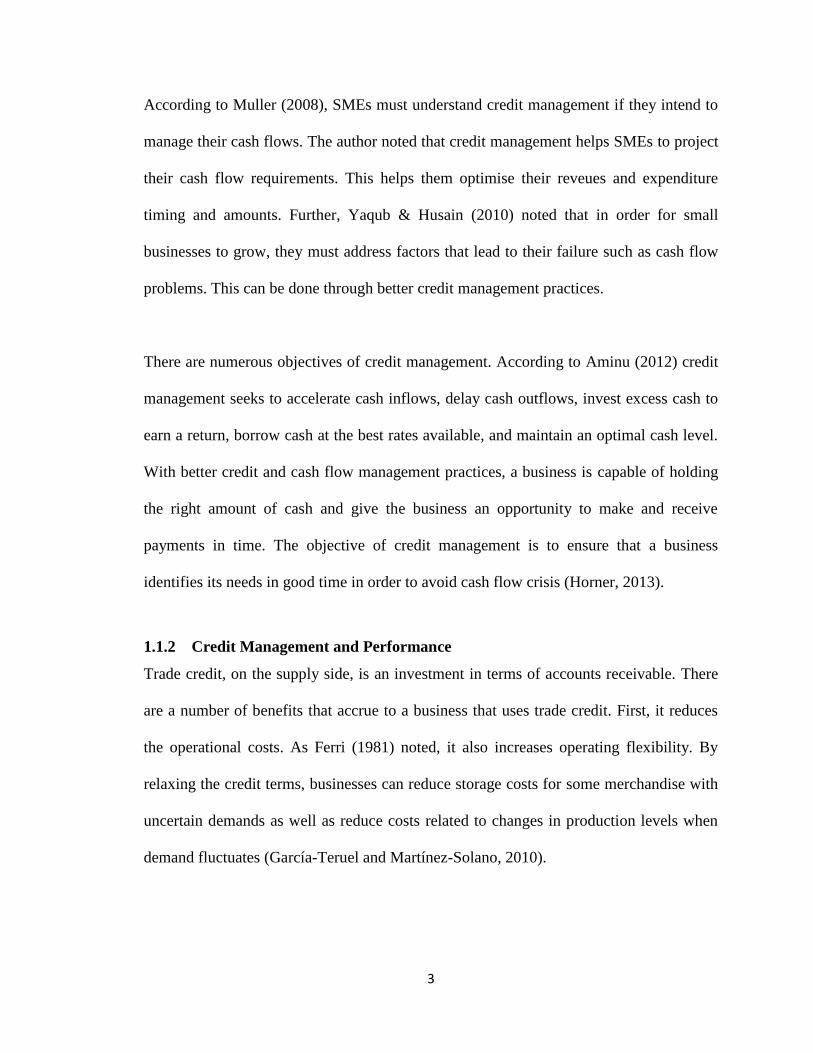
Ohman & Yazdanfar (2016) examined the impact of trade credit as a funding source on
profitability among small and medium-sized enterprises (SMEs). A large cross-sectional
panel data set covering 15,897 Swedish SMEs in five industry sectors from 2009 to 2012
was analysed using several statistical techniques. The study provides empirical evidence
that the use of trade credit significantly and negatively affects firm profitability,
indicating that SMEs with lower accounts payable are more profitable. Furthermore,
liquidity level and firm size are positively related to profitability, while firm age is
negatively related to profitability.
2.4 Chapter Summary and Gaps
The empirical review clearly shows some of the credit management practices related to
trade credit (or more specifically the accounts receivables) in SMEs across the world. The
review has also shown some of skill challenges that SMEs face. The chapter has also
reviewed specific empirical link between credit management practices (accounts
payables) and SME performance.
From the review, this matter has not received the attention it deserves from
entrepreneurship scholars and little is known on how making of credit sales, and
management of the same thereof, affects the business survival of SMEs in Kenya. This is
a gap in literature that the present study seeks to bridge. This will be done by examining
how various credit management practices influence the performance of SMEs. In effect,
this will show how credit management affects performance.

22
CHAPTER THREE
RESEARCH METHODOLOGY
3.1 Introduction
This chapter presents the research methodology adopted for this study. First, the research
design is discussed followed by the population of the study. The sample is then discussed
followed by data collection tools and techniques. Finally, data analysis procedure is
presented.
3.2 Research Design
This study used a descriptive design. According to Given (2007, p. 42), a descriptive
design is important as a way of providing answers five pertinent questions in a research
problem – who, what, when, where, and how. This research design usually used to get
information on the status of the occurrence and to describe "what exists" with respect to
conditions in a situation (Given, 2007). Since this study sought to examine the
relationship between credit management practices and performance, this design was best
suited to explore the relationship.
3.3 Population
The population of the study was drawn from transport and logistics companies within
Nairobi. According to Businesslist, an online directory for businesses in Kenya, Nairobi
has 1,133 transport and logistics companies. Most of these businesses fall within the
SME sector save for a few global firms. The directory does not categorize the firms in
terms of ownership (whether foreign or local) or size. Further, there is no other
comprehensive directory available listing transport and logistics companies in Kenya that

23
is known to the author at the moment. Therefore, the assumption made in this study was
that this number suffices as the population of the study.
3.4 Sample
This study used a random sampling technique to select the sample for the study. Random
sampling provides every transport and logistics business in Nairobi with the same chance
of being selected. Using a sample size calculator at surveysystem.com, the appropriate
sample size for this study was 287 businesses (confidence level = 95%; CI = ±5;
population = 1,133). Thus, a list of 287 businesses was randomly selected from the
population based on the list available at the Businesslist directory.
3.5 Data Collection
The study intended to collect primary data from the businesses. Thus, a questionnaire was
designed based on the objectives of the study and emanating from the literature review.
The target respondents were managers/owners of the transport and logistics companies
sampled. The questionnaire was piloted in order to check for validity on 10 companies
that did not form the final sample. The results of the pilot were used to amend the
questionnaire before final administration. Reliability of the measures was tested using
Cronbach’s alpha (split-half method) and a value of 0.7 or above was used as a threshold
to retain reliable measures for analysis. Enumerators were trained and deployed to collect
the data from the respondents. This means that face to face interviews were conducted
with the respondents as the enumerators filled in the questionnaires. A period of two
weeks was used to collect the data.

24
3.6 Data Analysis
Data was entered into SPSS and cleaned before analysis. Descriptive analysis was used to
summarize some of the initial results especially the demographics. This technique was
also used to analyze objective 1. For objective 2, Ordinary Least Squares (OLS)
regression analysis was used. The results are interpreted at 95% level of significance. The
dependent variable was the performance while the independent variable was credit
management practices. Performance was measured using a number of subjective
measures within the questionnaire. Further, credit management practices was measured as
the mean values of specific practices adopted by the transport and logistics businesses as
responded to in the questionnaire.

25
CHAPTER FOUR
DATA ANALYSIS AND FINDINGS
4.1 Introduction
This chapter presents the results of the study. The presentation begins with the results of
demographic analysis. This includes the title of the respondents, their gender, number of
years the firms have operated, respondents’ highest levels of education, professional
training, markets served by the organisations, and ownership (whether foreign or not and
whether family-owned or not).
The chapter then presents the results on the first objective: credit management practices.
This includes results on whether the respondents are directly responsible for credit
management or whether someone else is, whether they have specific certifications in
credit management, the frequency with which the firms extend credit sales to clients, and
a myriad other credit management practices as were picked from prior literature.
Finally, this chapter presents the results on the relationship between credit management
practices and firm performance. This section begins with the presentation of results on
firm performance followed by the results of a correlation analysis between all the
variables in the study. Then, the regression results are presented using the four
performance models: sales volume, sales growth, overall financial results, and return on
investments.

26
4.2 Demographic Analysis
Table 4.1 shows the results on whether the respondents were the business owners, Chief
Executive Officers (CEOs) or both. The results show that one third of the respondents
were owners of the businesses surveyed, half of them were CEOs while 17% were both
owners and managers.
Table 4.1: Title of respondents
Frequency Percent
Owner 64 33.3
CEO 96 50.0
Owner/CEO 32 16.7
Total 192 100.0
Table 4.2 shows the distribution of respondents by gender. The results show that 75%
were male while only 25% were female. This shows that most of the owners and CEOs of
the transport and logistics companies in Nairobi are male.
Table 4.2: Gender of respondents
Frequency Percent
Male 144 75.0
Female 48 25.0
Total 192 100.0
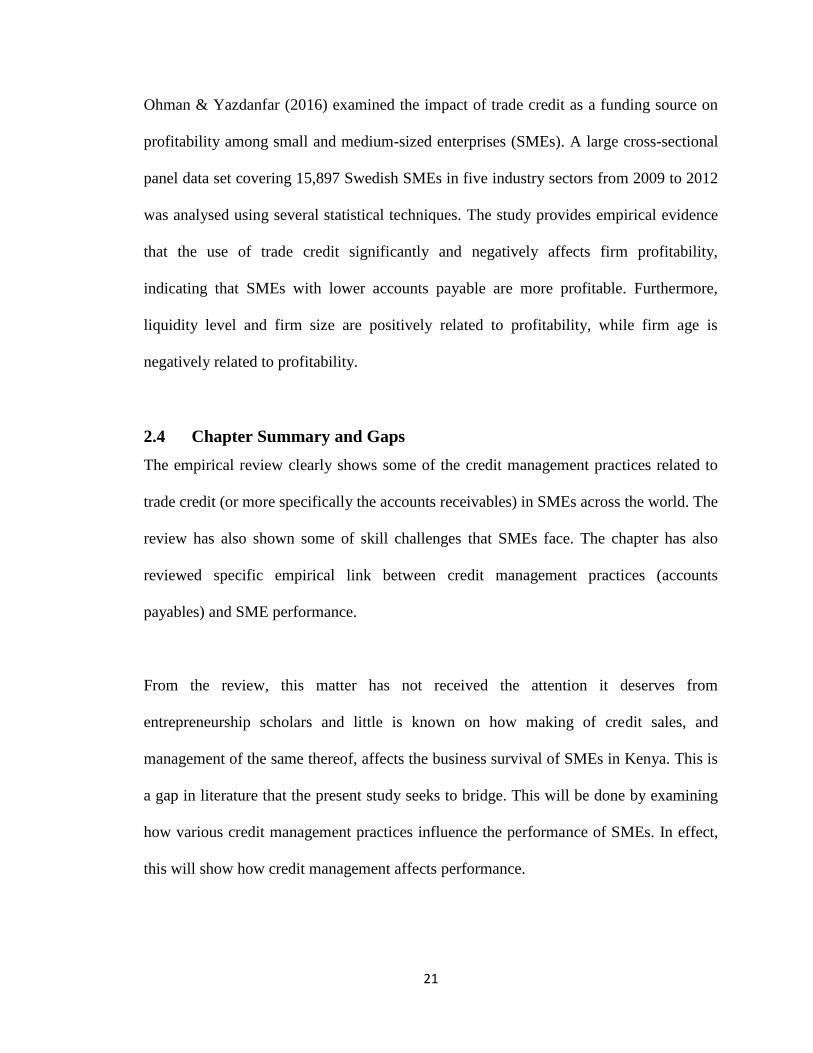
Table 4.3 shows the results on the length of time the companies had been operating in
Kenya. As shown, 17% had been operational for a year or less, 33% for one to three
years, 33% for four to seven years, and 17% for more than 10 years. The results suggest
that half of the businesses had survived beyond three years – an impeccable achievement
for most SMEs in Kenya.
27
Table 4.3: Length of time the company has been operational
Frequency Percent
< 1 year 32 16.7
1 - 3 years 64 33.3
4 - 7 years 64 33.3
> 10 years 32 16.7
Total 192 100.0
Table 4.4 shows the distribution of respondents by their highest levels of education. The
results show that 8% had secondary education, 17% had college education and 75% had
university degrees. This shows that a majority of the respondents had at least a degree
and were, therefore, highly educated to manage the businesses and especially the credit
management issues.
Table 4.4: Respondents’ highest levels of education
Frequency Percent
Secondary schooling 16 8.3
College schooling 32 16.7
University degree 144 75.0
Total 192 100.0
Table 4.5 shows the results on whether the respondents had any professional training.
The results show that 83% of the respondents had professional training while 17% did not
have any professional training. These trainings were in areas such as accounting, human
resources, and supply chain management.
Table 4.5: Whether the respondents have any professional training
Frequency Percent
Yes 160 83.3
No 32 16.7
Total 192 100.0
The respondents were asked to state the markets they served. Table 4.6 shows that 17%
served the Kenyan market only, 33% served the East African market, another 33% served

28
African market while 17% served the global market. Thus, half of the transport and
logistics companies can be considered as being global firms as they serve markets beyond
Kenya and East African Community (EAC).
Table 4.6: Markets served by the business
Frequency Percent
Only in Kenya 32 16.7
Within EAC 64 33.3
Within Africa 64 33.3
Globally 32 16.7
Total 192 100.0
Table 4.7 shows the ownership of the companies in terms of foreign or local ownership.
As shown, 42% were foreign owned while 58% were locally owned.
Table 4.7: Local or foreign ownership
Frequency Percent
Foreign owned 80 41.7
Locally owned 112 58.3
Total 192 100.0
Table 4.8 shows that 75% of the transport and logistics firms were family owned while
25% were not family owned. This suggests that most of the firms were still family
controlled and, therefore, may lack professionalism required to run businesses especially
where credit control is important to the survival of the business.
Table 4.8: Family or non-family business
Frequency Percent
Family owned 144 75.0
Non-family owned 48 25.0
Total 192 100.0

29
4.3 Credit Management Practices
This section presents the results on credit management practices. Table 4.9 shows the
results on whether the respondents were directly responsible for credit management in
their organisations. The study found that 67% were while 33% were not. Thus, a majority
of the respondents were directly responsible for credit management in their organisations.
Table 4.9: Are you directly responsible for credit management in the
organisation?
Frequency Percent
Yes 128 66.7
No 64 33.3
Total 192 100.0
For those who said they were not directly responsible for credit management in their
organisations, 62% had someone else within the institution responsible for the same
while 38% did not have anyone else responsible. This shows that in some firms, no one
was directly responsible for credit management.
Table 4.10: Do you have any other person responsible for credit management?
Frequency Percent
Yes 40 62.5
No 24 37.5
Total 64 100
The respondents were also asked whether they possessed any certification in credit
management. Table 4.11 shows that only 25% of the respondents did possess the
certification while 75% did not. Those that possessed the certification were mostly from
foreign firms where such certifications are available from their parent countries.

30
Table 4.11: Do you possess certification in credit management?
Frequency Percent
Yes 48 25.0
No 144 75.0
Total 192 100.0
Table 4.12 shows the frequency with which the transport and logistics firms surveyed
extended credit sales to clients. As shown, 25% of the firms always did so, 42% did so
very often, 25% did so sometimes while 8% never did so. This suggests that most of the
firms in the survey extended credit sales to their clients.
Table 4.12: How often does your business extend credit sales to clients?
Frequency Percent
Rarely 16 8.3
Sometimes 48 25.0
Very often 80 41.7
Always 48 25.0
Total 192 100.0
Table 4.13 shows the credit management practices adopted by the transport and logistics
firms in Nairobi. The most common practice was checking customer credit worthiness
before granting trade credit (mean = 4.50). This was followed by offering discounts for
early payment (mean = 3.42). Some firms also used customer’s audited accounts to
extend trade credit (mean = 3.33).

31
Table 4.13: Credit management practices adopted by transport and logistics
companies
Mean SD
Check customer credit worthiness before granting trade credit 4.5000 .50131
Offer discounts for early payment 3.4167 1.32370
Use customer’s audited accounts to extend trade credit 3.3333 1.31577
Categorize customer accounts according to late payment risk 2.5833 1.50160
Check customer credit worthiness from credit reference bureaus 2.2500 1.36524
Conduct formal analysis into reasons for late payment 2.2500 1.01300
Customize customer accounts according to solvency risk 2.1667 1.21652
Use factoring services 2.1667 1.34722
Have credit insurance for sales 2.0833 1.44474
4.4 Credit Management Practices and Performance
This section presents the results on the relationship between credit management practices
and the performance of SMEs in the transport and logistics sector in Nairobi. Table 4.14
shows the summary performance of the organisations. The performance, as shown, was
moderate to low as revealed by the mean scores for all the four performance indicators.
Table 4.14: Performance of transport and logistics companies
Performance Mean SD
Return on investment 3.3333 1.43747
Sales volume 3.1667 1.21652
Overall financial results 2.9167 1.25883
Sales growth 2.5833 1.60931
Table 4.15 shows the correlation matrix for the interrelationship between the dependent
and independent variables used in the study. Of particular interest is the relationship
among the independent variables. The results show that the correlations are generally
below 0.8 hence can be regarded as low. This means that there are no serial correlations
between the independent variables hence the variables can be placed in one model and
regressed through OLS method to examine how they affect the performance of surveyed
organisations.
32
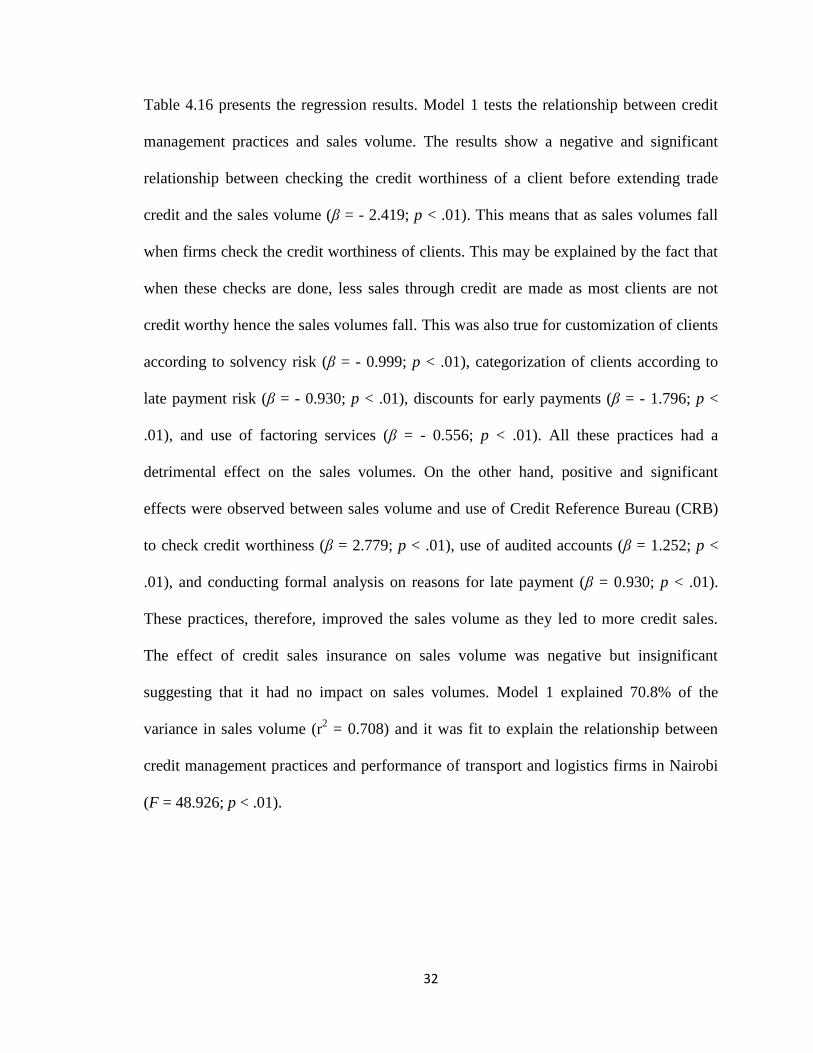
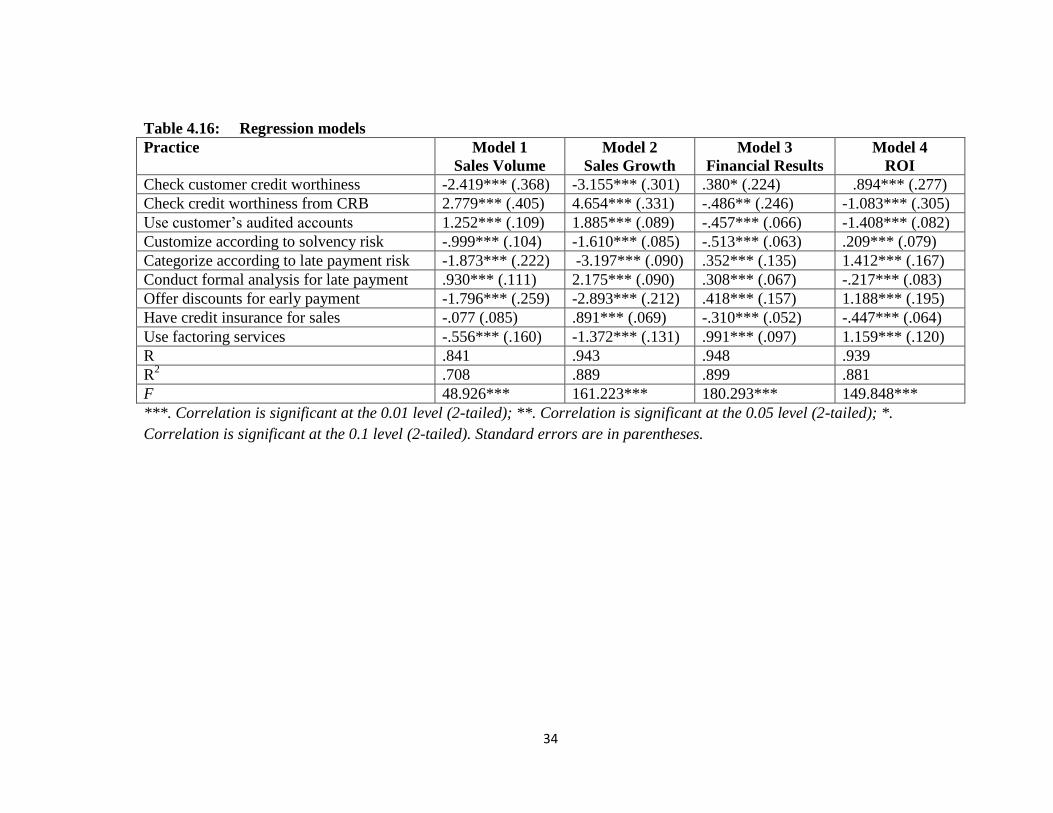
Table 4.16 presents the regression results. Model 1 tests the relationship between credit
management practices and sales volume. The results show a negative and significant
relationship between checking the credit worthiness of a client before extending trade
credit and the sales volume (β = - 2.419; p < .01). This means that as sales volumes fall
when firms check the credit worthiness of clients. This may be explained by the fact that
when these checks are done, less sales through credit are made as most clients are not
credit worthy hence the sales volumes fall. This was also true for customization of clients
according to solvency risk (β = - 0.999; p < .01), categorization of clients according to
late payment risk (β = - 0.930; p < .01), discounts for early payments (β = - 1.796; p <
.01), and use of factoring services (β = - 0.556; p < .01). All these practices had a
detrimental effect on the sales volumes. On the other hand, positive and significant
effects were observed between sales volume and use of Credit Reference Bureau (CRB)
to check credit worthiness (β = 2.779; p < .01), use of audited accounts (β = 1.252; p <
.01), and conducting formal analysis on reasons for late payment (β = 0.930; p < .01).
These practices, therefore, improved the sales volume as they led to more credit sales.
The effect of credit sales insurance on sales volume was negative but insignificant
suggesting that it had no impact on sales volumes. Model 1 explained 70.8% of the
variance in sales volume (r2 = 0.708) and it was fit to explain the relationship between
credit management practices and performance of transport and logistics firms in Nairobi
(F = 48.926; p < .01).

33
Table 4.15: Correlation matrix
1 2 3 4 5 6 7 8 9 10 11 12
1. Sales volume 1
2. Sales growth .891**
1
3. Overall financial results .392**
.479**
1
4. Return on investment .255**
.169* .525
** 1
5. Check customer credit worthiness
before granting trade credit
-.137 -.052 -
.199**
-.116 1
6. Check customer credit worthiness
from credit reference bureaus
.177* .238
** .207
** .598
** .061 1
7. Use customer’s audited accounts to
extend trade credit
.279**
.303**
-.034 .074 -.127 .700**
1
8. Customize customer accounts
according to solvency risk
-
.189**
-
.264**
-
.538**
-.032 .137 .429**
.384**
1
9. Categorize customer accounts
according to late payment risk
.038 .066 .114 .453**
.056 .787**
.749**
.313**
1
10. Conduct formal analysis into reasons
for late payment
.510**
.527**
.542**
.345**
.082 .015 -
.189**
-.102 -.096 1
11. Offer discounts for early payment .373**
.436**
.423**
.455**
-
.442**
.545**
.305**
-.043 .088 .234**
1
12. Have credit insurance for sales -
.246**
-.093 -.180* .027 -
.289**
.414**
.558**
.135 .518**
-
.701**
.113 1
13. Use factoring services .239**
.264**
.305**
.490**
-
.248**
.797**
.772**
.290**
.738**
-.153* .384
** .638
**
**. Correlation is significant at the 0.01 level (2-tailed); *. Correlation is significant at the 0.05 level (2-tailed).
34
Table 4.16: Regression models
Practice Model 1
Sales Volume
Model 2
Sales Growth
Model 3
Financial Results
Model 4
ROI
Check customer credit worthiness -2.419*** (.368) -3.155*** (.301) .380* (.224) .894*** (.277)
Check credit worthiness from CRB 2.779*** (.405) 4.654*** (.331) -.486** (.246) -1.083*** (.305)
Use customer’s audited accounts 1.252*** (.109) 1.885*** (.089) -.457*** (.066) -1.408*** (.082)
Customize according to solvency risk -.999*** (.104) -1.610*** (.085) -.513*** (.063) .209*** (.079)
Categorize according to late payment risk -1.873*** (.222) -3.197*** (.090) .352*** (.135) 1.412*** (.167)
Conduct formal analysis for late payment .930*** (.111) 2.175*** (.090) .308*** (.067) -.217*** (.083)
Offer discounts for early payment -1.796*** (.259) -2.893*** (.212) .418*** (.157) 1.188*** (.195)
Have credit insurance for sales -.077 (.085) .891*** (.069) -.310*** (.052) -.447*** (.064)
Use factoring services -.556*** (.160) -1.372*** (.131) .991*** (.097) 1.159*** (.120)
R .841 .943 .948 .939
R2 .708 .889 .899 .881
F 48.926*** 161.223*** 180.293*** 149.848***
***. Correlation is significant at the 0.01 level (2-tailed); **. Correlation is significant at the 0.05 level (2-tailed); *.
Correlation is significant at the 0.1 level (2-tailed). Standard errors are in parentheses.

35
In model 2 in Table 4.16, the relationship between credit management practices and sales
growth was tested. The results show that there was a positive and significant relationship
between sales growth and checking credit worthiness through CRB (β = 4.654; p < .01),
use of audited accounts to extend credit (β = 1.885; p < .01), conducting formal analysis
for reasons for late payments (β = 2.175; p < .01), and having credit insurance for sales (β
= 0.891; p < .01). This means that the use of these practices led to an improvement in
sales growth. On the other hand, there was a negative and significant relationship
between sales growth and checking of customer credit worthiness (β = - 3.155; p < .01),
customizing clients according to solvency risks (β = - 1.610; p < .01), categorizing
according to late payment risk (β = - 3.197; p < .01), offering discounts for early payment
(β = - 2.893; p < .01), and use of factoring services (β = - 1.372; p < .01). These practices
were, therefore, detrimental on the growth of sales of transport and logistics firms in
Nairobi. This model explained 88.9% of the variance in sales growth (r2 = 0.889) and was
fit to explain the relationship between credit management practices and sales growth (F =
161.223; p < .01).
Table 4.16 also shows the results of model 3 depicting the relationship between credit
management practices and overall financial results of the transport and logistics
companies in Nairobi. The results show that checking of credit worthiness of customers,
categorizing customers according to late payment risk, conducting formal analysis for
reasons for late payment offering discounts for early payment, and use of factoring had
positive effects on the overall financial results of the transport and logistics companies
surveyed. This shows that the adoption of these practices led to improved financial
results. However, checking credit worthiness through CRB, use of customer audited

36
reports, customizing clients according to solvency risks, and credit insurance for sales
had negative effects on the overall financial results. This suggests that these practices
were detrimental to the bottom line of these companies. The model explained 89.9% of
the variance in financial results (r2 = 0.899) and it was fit to explain the relationship
between credit management practices and financial results (F = 180.293; p < .01).
Model 4 tested the relationship between credit management practices and return on
investment (ROI) of the surveyed transport and logistics firms in Nairobi. The study
found that there was a positive and significant relationship between ROI and checking of
customer credit worthiness, customizing clients according to solvency risk, categorizing
clients according to late payment risk, offering discounts for early payment, and use of
factoring services. These indicate that there were some benefits on ROI for using these
particular practices. Further, the results show a negative relationship between ROI and
checking credit worthiness through CRB, use of audited accounts, conducting formal
analysis for reasons for late payment, and having credit insurance for sales. These
practices were seen to hurt ROI of transport and logistics companies in Nairobi. The
model used in the study explained 88.1% of the variance in ROI (r2 = 0.881) and was fit
to explain the relationship between credit management practices and ROI (F= 149.848; p
< .01)
37
CHAPTER FIVE
SUMMARY, CONCLUSION, AND RECOMMENDATIONS
5.1 Introduction
This chapter presents the summary of research findings, the conclusions made from the
findings, recommendations for policy and practice, and suggestions for further research.
5.2 Summary
This study sought to examine the credit management practices adopted by transport and
logistics companies in Nairobi as well assess the relationship between those practices and
performance of the organisations. Primary data was gathered from firms in Nairobi
County. In terms of credit management practices, the results showed that 67% of the
respondents were directly responsible for credit management in their organisations while
62% of those who were not directly responsible for credit management in their
organisations had someone else within the institution responsible for the same. The study
also found that only 25% of the respondents did possessed credit management
certification.
The study revealed that the most common credit management practice was checking
customer credit worthiness before granting trade credit (mean = 4.50), followed by
offering discounts for early payment (mean = 3.42) and use of customer’s audited
accounts to extend trade credit (mean = 3.33). As to the relationship between credit
management practices on performance, the results were mixed. No single practice had a
uniform and stable effect on all the four parameters of performance used in the study. For
instance, checking credit worthiness of customer before extending credit had a negative
effect on sales volume and sales growth while it had a positive effect on financial results

38
and ROI. The use of CRB to check for credit worthiness before extending credit had
positive effects on sales growth and volume but negative effects on financial results and
ROI.
5.3 Conclusion
The study concludes that transport and logistics companies in Nairobi employ very
limited credit management practices. However, this can be justified by the fact that most
of these companies do not have the requisite expertise in terms of qualified credit
managers to help them manage credit sales better. Thus, the practices used as ad hoc at
best.
The study also concludes that while the relationship between credit management
practices and performance is mixed in this study, there is a pattern emerging where when
credit management practices lead to an improvement in sales (volume and growth), it
negatively impacts the overall performance of the firm (financial results and ROI). This is
true for all the credit management practices used in this study except for customization
according to solvency risk, conducting formal analysis for reasons for late payment, and
credit insurance for sales.
5.4 Recommendations
First, the study recommends that the transport and logistics companies in the SME sector
should embrace better credit management practices by employing qualified personnel to
be in charge of credit management. These personnel will ensure that better practices are
adopted in order to improve on both sales and the companies’ overall profitability.

39
Secondly, the study recommends that transport and logistics companies in the SME
sector should decide, at a strategic level, what is important between better sales or better
overall performance of the firms. At the moment, credit management practices that
improve on sales lead to poor overall performance and vice versa. It should be
noteworthy to work on a way to enhance both measures of performance in order for the
credit management as a practice to have a positive impact on the firms.
Lastly, it is important that other firms borrow from the results of this study for practical
purposes. Further, for policy purposes, it is important that employees be trained and
certified in credit management in order to improve this important discipline in
institutions.
5.5 Suggestions for Further Research
More research is needed in this area especially to identify how credit management
practices influence the performance of other firms not in the transport and logistics
business as well as those outside Nairobi. This will help provide a basis for application of
these results to other institutions.
Secondly, further research should be carried out to identify other factors may help explain
the relationship between credit management practices and firm performance. These
intervening factors may explain why the results in the present study are mixed.

40
REFERENCES
Abor, J., & Quartey, P. (2010). Issues in SME Development in Ghana and South Africa.
International Research Journal of Finance and Economics(39), 218-228.
Afrifa, G. A. (2015, August 13). Trade Credit and Firm Performance. Retrieved from
SSRN: http://papers.ssrn.com/sol3/papers.cfm?abstract_id=2643816
Aghion, P., & Howitt, P. (1998). Market structure and the growth process. Review of
Economic Dynamics, 1(1), 276-305.
Aminu, Y. (2012). Determinants of IMs as a Component of Working Capital in Ensuring
Corporate Profitability: A Conceptual Approach. Research Journal of Finance
and Accounting, 3(11), 58−61.
Amuzu, M. S. (2010). Cash flow ratio as a measure of performance of listed companies
in emerging economies: The Ghana Example. Turks and Caisos Island: St.
Clements University.
Asiedu, E., & Freeman, J. A. (2007). The Effect of Globalization on the Performance of
Small- and Medium-Sized Enterprises in the United States: Does Owners'
Race/Ethnicity Matter. American Economic Review, 97(2), 368-372.
Banos-Caballero, S., Garcia-Teruel, P. J., & Martinez-Solano, P. (2012). How does
working capital management affect the profitability of Spanish SMEs? Small
Business Economics, 39(2), 517-529.
Barlevy, G. (2007). On the cyclicality of research and development. American Economic
Review, 97(4), 1131-1164.
Cant, M. C., & Wiid, J. A. (2013). Establishing The Challenges Affecting South African
SMEs. International Business & Economics Research Journal, 12(6), 707-716.
Caruso, A. (2015). Statistics of US Businesses: Employment and Payroll Summary 2012.
Washington DC: US Census Bureau.
Ernst & Young. (2009). Study on the Promotion of Micro Small and Medium Enterprises
(MSMEs) in the East African Region. Nairobi: Ernst & Young.
Ferrando, A., & Mulier, K. (2012). Do firms use the trade credit channel to manage
growth? Frankfurt: European Central Bank. Retrieved from
https://www.ecb.europa.eu/pub/pdf/scpwps/ecbwp1502.pdf?b3f759c3bda2048d23
f62bad122d186d

41
Francois, P., & Lloyd-Ellis, H. (2003). Animal spirits through creative destruction.
American Economic Review, 93(3), 530-550.
Garcia-Teruel, P. J., & Martinez-Solano, P. (2007). Effects of working capital
management on SME profitability. International Journal of Managerial Finance,
3(2), 164-177.
Garcia-Teruel, P. J., & Martinez-Solano, P. (2010). A Dynamic Approach to Accounts
Receivable: a Study of Spanish SMEs. European Financial Management, 16(3),
400-421.
Gichuru, M. M. (2012). Critical success factors in business process outsourcing of
transport and logistics companies in Kenya. Nairobi: University of Nairobi.
Given, L. M. (2007). Descriptive Research. In N. J. Salkind, & K. Rasmussen,
Encyclopedia of Measurement and Statistics (pp. 251-254). Thousand Oaks, CA:
Sage.
Gul, S., Khan, M. B., Rehman, S. U., Khan, M. T., Khan, M., & Khan, W. (2013).
Working Capital Management and Performance of SME Sector. European
Journal of Business and Management, 1, 60-69.
Horner, D. (2013). Accounting for Non-Accountants. London: Kogan Page.
Kestens, K., Van Cauwenberge, P., & Bauwhede, H. V. (2012). Trade credit and
company performance during the 2008 financial crisis. Accounting & Finance,
52(4), 1125-1151.
Kozlow, R. (2006). Globalization, Offshoring, and Multinational Companies: What Are
the Questions, and How Well Are We Doing in Answering Them? American
Economic Association Allied Social Science Associations Annual Meeting (pp. 1-
24). Boston: Bureau of Economic Analysis.
Kumar, R. M. (2014). Growth and Performance of MSMEs in India. The International
Journal of Business & Management, 2(5), 73-78.
Kuznets, S. (1940). Schumpeter’s business cycles. American Economic Review, 30, 257–
271.
Loveline, A. A., Uchenna, O. I., & Karubi, N. P. (2014). Women Entrepreneurship in
Malaysia: An Empirical Assessment of the Challenges Faced by Micro and Small
Business Owners in Kuching-Sarawak. International Journal of Humanities
Social Sciences and Education, 1(4), 48-58.

42
Martinez-Sola, C., Garcia-Teruel, P. J., & Martinez-Solano, P. (2014). Trade credit and
SME profitability. Small Business Economics, 42(3), 561-577.
Muller, T. A. (2008). Managing Cash Flows. Dynamic Business Magazine.
Ndagijimana, J. P., & Okech, T. C. (2014). Determinants of Working Capital
Management Practices in Small and Medium Enterprises in Nairobi. International
Journal of Business and Social Science, 5(12), 160-164.
Netherlands-African Business Council. (2014). Market Study: Maritime Infrastructure &
Transport and logistics Kenya. The Hague: NA-BC.
Ohman, P., & Yazdanfar, D. (2016). The impact of trade credit use on firm profitability:
empirical evidence from Sweden. Journal of Advances in Management Research,
13(2), 116-129.
Padachi, K. (2006). Trends in Working Capital Management and its Impact on Firms’
Performance: An Analysis of Mauritian Small Manufacturing Firms.
International Review of Business Research Papers, 2(2), 45-58.
Parker, S. C. (2012). Theories of Entrepreneurship, Innovation and Business Cycle.
Journal of Economic Surveys, 26(3), 377-394.
Peng, H., & Jiahai, T. (2006). Cash Flow Mismanagement May Deteriorate SME’s
Financial Status. The Eighth West Lake International Conferenceon SMB (pp.
348-352). SEI.
PwC. (2015). Kenya: Transportation and Logisics. Online: PricewaterhouseCoopers.
Reddy, D. R., & Kameswari, P. (2004). Working capital management practices in pharma
industry: A case study of Cipla Limited. Management Accountant, 638-644.
Scheers, L. (2010). Scheers, L (2010). Challenges of small family groceries shops in
South Africa. World Journal of Entrepreneurship, Management and Sustainable
Development, 6(3), 221-231.
Schmookler, J. (1966). Invention and Economic Growth. Cambridge, MA: Harvard
University Press.
Schumpeter, J. A. (1927). The explanation of the business cycle. Economica, 21, 26-311.
Schumpeter, J. A. (1939). Business Cycles: A Theoretical, Historical and Statistical
Analysis of the Capitalist Process. New York: McGraw-Hill.
Shleifer, A. (1986). Implementation cycles. Journal of Political Economy, 94(6), 1163-
1190.

43
Tambunan, T. (2009). Export-oriented small and medium industry clusters in Indonesia.
Journal of Enterprising Communities: People and Places in the Global Economy,
3(1), 25-58.
Uwonda, G., Okello, N., & Okello, N. G. (2013). Cash flow management utilization by
Small Medium Enterprises (SMEs) in Northern Uganda. Journal of Accounting,
Auditing, Economics and Finance, 1(5), 67-80.
World Bank. (2005). Kenya: Issues in Trade and Transport and logistics. Washington
DC: World Bank.
Wu, W., Firth, M., & Rui, O. M. (2014). Trust and the Provision of Trade Credit. Journal
of Banking & Finance, 39(C), 146-159.
Yaqub, M. Z., & Husain, D. (2010). Micro-entrepreneurs: Motivations Challenges and
Success Factors. International Research Journal of Finance and Economics, 56,
22-28.

44
APPENDICES
Appendix I: Research Questionnaire
Section I: General information
1. Name of the business
………………………………………………………………………………………
…
2. What title best describes you in relation to this organisation?
Owner [ ]
CEO [ ]
Owner/CEO [ ]
Other [ ]
3. What is your gender?
Male [ ]
Female [ ]
4. How long has the business been operational?
Under 1 year [ ]
1 year – 3 years [ ]
4 years – 7 years [ ]
8 years – 10 years [ ]
Above 10 years [ ]
5. What is your level education?
No formal schooling [ ]
Primary schooling [ ]
Secondary schooling [ ]
College schooling [ ]
University degree [ ]
6. If college schooling or university degree, what is your specialization?
……………………………………………………………………
7. Do you have any professional training?
Yes [ ]
No [ ]
8. If Yes in 7 above, what is your professional training?
…………………………………………………………………………………

45
9. How many employees does the organisation have?
………………………………………………………………….
10. In which markets does this business operate?
Only in Kenya [ ]
Within EAC [ ]
Within Africa [ ]
Globally [ ]
11. What is the majority ownership of this business in terms of local or foreign
ownership?
Foreign owned [ ]
Locally owned [ ]
12. This company is …
Family owned [ ]
Non-family owned [ ]
Section II: Credit management practices
13. Are you directly responsible for credit management in this organization?
Yes [ ]
No [ ]
14. If no in 13 above, do you have any person in the organization
Yes [ ]
No [ ]
15. Do you possess certification in credit management?
Yes [ ]
No [ ]
16. How often does your business extend credit sales to its clients?
Always [ ]
Very often [ ]
Sometimes [ ]
Rarely [ ]
Never [ ]
17. What is your credit period in days?
……………………………………………………………………….

46
18. To what extent do you agree with the following statements regarding credit
management practices in your organization? Key: 1 = strongly disagree; 2 =
disagree; 3 = undecided; 4 = agree; 5 = strongly agree
Practice 1 2 3 4 5
Check customer credit worthiness before granting trade credit
Check customer credit worthiness from credit reference bureaus
Use customer’s audited accounts to extend trade credit
Customize customer accounts according to solvency risk
Categorize customer accounts according to late payment risk
Conduct formal analysis into reasons for late payment
Offer discounts for early payment
Have credit insurance for sales
Use factoring services
Part III: Performance
19. How do you rate the performance of your organization over the last three year as
compared to others in the industry in terms of the following parameters? Key: 1 =
very poor; 2 = below average; 3 = average; 4 = above average; 5 = excellent)
Practice 1 2 3 4 5
Sales volume
Sales growth
Overall financial results
Return on investment

47
Appendix II: List of Transport and logistics Companies in Nairobi
1. Hellman’s Perishables Transport and logistics
2. Destiny Cargo Forwarders
3. Crystal Spark Company
4. Around Africa Tours and Travel
5. Nellions Moving & Relocations Ltd
6. Guangnai Trading Company Ltd
7. Cargo Elegance Transport and logistics
(Source: BusinessList, 2016. http://www.businesslist.co.ke/category/transport and
logistics/city:nairobi)
Related Documents