Volume 123, Article No. 123016 (2018) https://doi.org/10.6028/jres.123.016 Journal of Research of the National Institute of Standards and Technology 1 How to cite this article: Lucon E, Splett J (2018) Effect of Charpy Striker Configuration on Low- and High-Energy NIST Verification Specimens. J Res Natl Inst Stan 123:123016. https://doi.org/10.6028/jres.123.016 Effect of Charpy Striker Configuration on Low- and High-Energy NIST Verification Specimens Enrico Lucon and Jolene Splett National Institute of Standards and Technology, Boulder, CO 80305, USA [email protected] [email protected] Charpy machines can be equipped with strikers having two different configurations, corresponding to an edge radius of 2 mm or 8 mm. Both striker types are covered by ASTM E23 and ISO 148-1. The effect of striker type on Charpy absorbed energy has been extensively investigated in the past, and clear evidence has been published showing that when using 8 mm strikers, absorbed energy (KV) tends to increase for specimens with KV ≥ 200 J. In this paper, we investigate how striking edge radius affects certified values and uncertainties for National Institute of Standards and Technology (NIST) low-energy and high-energy verification specimens. Test data from two low-energy and two high-energy Charpy lots, analyzed in a statistically rigorous manner, were somewhat contradictory and led to the decision to separately certify low-energy and high-energy lots for use with 2 mm and 8 mm strikers. This agrees with previous findings by other NIST researchers, who recommended individual certifications for the two strikers at all energy levels. Key words: certified absorbed energy; Charpy test; impact hammer; striker edge radius; uncertainties. Accepted: August 23, 2018 Published: September 12, 2018 https://doi.org/10.6028/jres.123.016 1. Introduction The simplest mechanical test that can be conducted to characterize the fracture resistance of metallic materials at dynamic (impact) loading rates is the Charpy impact test. This test is generally conducted and evaluated in accordance with two international test standards, ASTM E23 [1] and ISO 148-1 [2]. The two standards specify the dimensions of both the specimen and the parts of the machine that are in contact with the specimen during the test, namely, anvils, supports, and striker. The striker is the part of the swinging hammer that impacts the specimen on the side opposite to the notch (Fig. 1). There are two possible configurations of the Charpy striker 1 that differ with regard to radius of the striking edge: 2 mm and 8 mm (Fig. 2). Both configurations are covered by ASTM E23 and ISO 148-1, 1 Certain commercial equipment, instruments, or materials are identified in this paper to foster understanding. Such identification does not imply recommendation or endorsement by the National Institute of Standards and Technology, nor does it imply that the materials or equipment identified are necessarily the best available for the purpose.

Welcome message from author
This document is posted to help you gain knowledge. Please leave a comment to let me know what you think about it! Share it to your friends and learn new things together.
Transcript
Volume 123, Article No. 123016 (2018) https://doi.org/10.6028/jres.123.016
Journal of Research of the National Institute of Standards and Technology
1 How to cite this article:
Lucon E, Splett J (2018) Effect of Charpy Striker Configuration
on Low- and High-Energy NIST Verification Specimens.
J Res Natl Inst Stan 123:123016. https://doi.org/10.6028/jres.123.016
Effect of Charpy Striker Configuration on
Low- and High-Energy NIST Verification
Specimens
Enrico Lucon and Jolene Splett
National Institute of Standards and Technology,
Boulder, CO 80305, USA
Charpy machines can be equipped with strikers having two different configurations, corresponding to an edge radius of 2 mm or
8 mm. Both striker types are covered by ASTM E23 and ISO 148-1. The effect of striker type on Charpy absorbed energy has been
extensively investigated in the past, and clear evidence has been published showing that when using 8 mm strikers, absorbed energy
(KV) tends to increase for specimens with KV ≥ 200 J. In this paper, we investigate how striking edge radius affects certified values and uncertainties for National Institute of Standards and Technology (NIST) low-energy and high-energy verification specimens. Test
data from two low-energy and two high-energy Charpy lots, analyzed in a statistically rigorous manner, were somewhat contradictory
and led to the decision to separately certify low-energy and high-energy lots for use with 2 mm and 8 mm strikers. This agrees with
previous findings by other NIST researchers, who recommended individual certifications for the two strikers at all energy levels.
Key words: certified absorbed energy; Charpy test; impact hammer; striker edge radius; uncertainties.
Accepted: August 23, 2018
Published: September 12, 2018
https://doi.org/10.6028/jres.123.016
1. Introduction
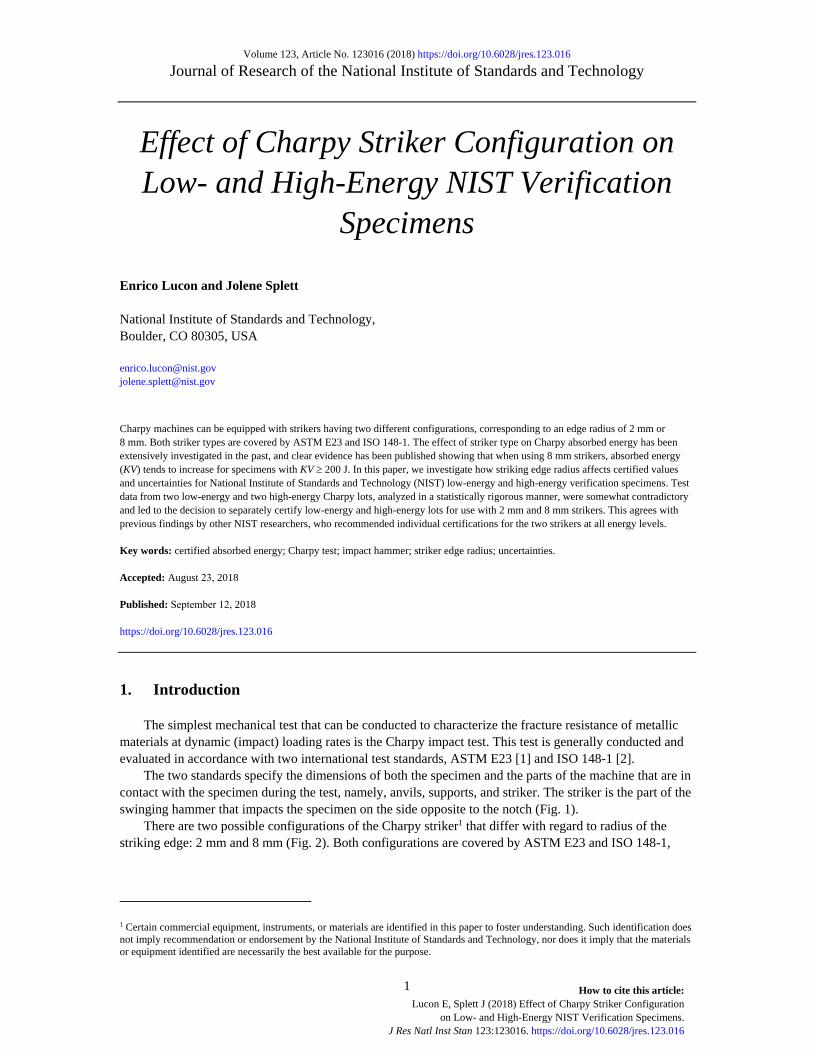
The simplest mechanical test that can be conducted to characterize the fracture resistance of metallic
materials at dynamic (impact) loading rates is the Charpy impact test. This test is generally conducted and
evaluated in accordance with two international test standards, ASTM E23 [1] and ISO 148-1 [2].
The two standards specify the dimensions of both the specimen and the parts of the machine that are in
contact with the specimen during the test, namely, anvils, supports, and striker. The striker is the part of the
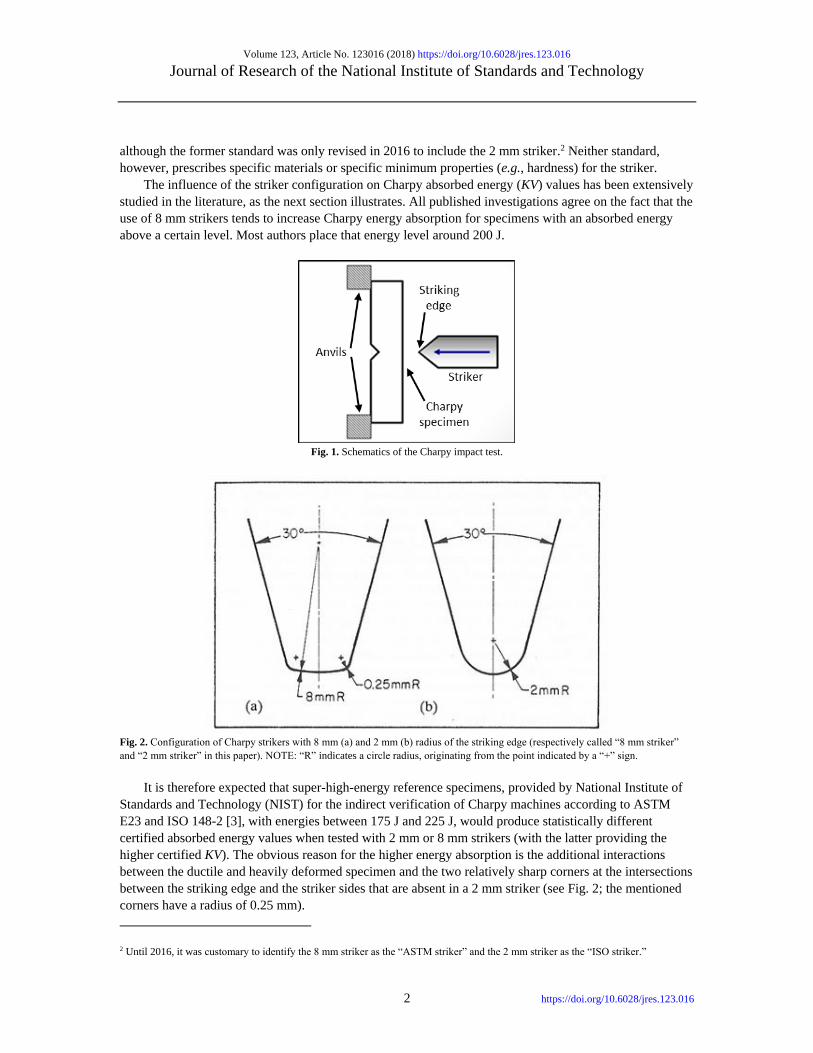
swinging hammer that impacts the specimen on the side opposite to the notch (Fig. 1).
There are two possible configurations of the Charpy striker1 that differ with regard to radius of the
striking edge: 2 mm and 8 mm (Fig. 2). Both configurations are covered by ASTM E23 and ISO 148-1,
1 Certain commercial equipment, instruments, or materials are identified in this paper to foster understanding. Such identification does
not imply recommendation or endorsement by the National Institute of Standards and Technology, nor does it imply that the materials
or equipment identified are necessarily the best available for the purpose.
Volume 123, Article No. 123016 (2018) https://doi.org/10.6028/jres.123.016
Journal of Research of the National Institute of Standards and Technology
2 https://doi.org/10.6028/jres.123.016
although the former standard was only revised in 2016 to include the 2 mm striker.2 Neither standard,
however, prescribes specific materials or specific minimum properties (e.g., hardness) for the striker.
The influence of the striker configuration on Charpy absorbed energy (KV) values has been extensively
studied in the literature, as the next section illustrates. All published investigations agree on the fact that the
use of 8 mm strikers tends to increase Charpy energy absorption for specimens with an absorbed energy
above a certain level. Most authors place that energy level around 200 J.
Fig. 1. Schematics of the Charpy impact test.
Fig. 2. Configuration of Charpy strikers with 8 mm (a) and 2 mm (b) radius of the striking edge (respectively called “8 mm striker”
and “2 mm striker” in this paper). NOTE: “R” indicates a circle radius, originating from the point indicated by a “+” sign.
It is therefore expected that super-high-energy reference specimens, provided by National Institute of
Standards and Technology (NIST) for the indirect verification of Charpy machines according to ASTM
E23 and ISO 148-2 [3], with energies between 175 J and 225 J, would produce statistically different
certified absorbed energy values when tested with 2 mm or 8 mm strikers (with the latter providing the
higher certified KV). The obvious reason for the higher energy absorption is the additional interactions
between the ductile and heavily deformed specimen and the two relatively sharp corners at the intersections
between the striking edge and the striker sides that are absent in a 2 mm striker (see Fig. 2; the mentioned
corners have a radius of 0.25 mm).
2 Until 2016, it was customary to identify the 8 mm striker as the “ASTM striker” and the 2 mm striker as the “ISO striker.”
Volume 123, Article No. 123016 (2018) https://doi.org/10.6028/jres.123.016
Journal of Research of the National Institute of Standards and Technology
3 https://doi.org/10.6028/jres.123.016
It is unlikely that a significant influence of striker configuration would be observed for NIST reference
specimens at the low-energy (around 17 J) and the high-energy (around 100 J) levels, since several authors
have claimed that below 150 J to 200 J, the effect of the striker radius is negligible.
In 2017, NIST started providing specimens for the indirect verification of machines equipped with
2 mm strikers, following the 2016 revision of ASTM E23. In this investigation, we tested four lots of
NIST-certified specimens (two low-energy and two high-energy lots) on our three reference machines
equipped with 2 mm and 8 mm strikers. The outcome of this investigation will guide the decision to
separately certify low-energy and high-energy lots with 2 mm and 8 mm strikers in the future.
2. Influence of Striker Configuration in the Literature
The earliest reference we found on the influence of striker type on Charpy results was by Towers in
1983 [4], who observed an influence of striker type at a level of 0.75 J/mm2 (absorbed energy per unit
ligament area), corresponding to an absolute value of KV = 60 J for a standard Charpy specimen having a
ligament cross section of 80 mm2. He claimed that above this threshold, KV increases with the radius of the
striking edge.
In 1990, Fink [5] reported the following best-fit correlation3 between the two striker types in the range
KV = 15 J to 190 J:
𝐾𝑉2 mm = 1.0420 𝐾𝑉8 mm + 0.5160 J. (1)
During the same ASTM symposium in 1990, Naniwa et al. [6] raised the threshold to a considerably
higher absorbed energy level (200 J), adding that no difference between strikers was observed in terms of
shear fracture appearance, lateral expansion, and transition temperature below that level.
Several investigations on this same topic were presented during the ASTM Symposium on Pendulum
Impact Machines, held in Montreal, Canada, in 1994:
(a) Ruth [7], who used low-, high-, and super-high-energy NIST-certified specimens, stated that “the
energy absorbed by the tests using the (…) 2 mm striker was considerably higher than the energy
absorbed in tests using the (…) 8 mm striker at the 16 J level.” The reported difference in terms of
mean energy was 0.71 J, or 4.2 % of the average of KV8 mm and KV2 mm. The opposite was observed
at the super-high-energy level, where KV8 mm was higher than KV2 mm by 9.8 J, or 5.0 %. At the high-
energy level, the difference (KV2 mm − KV8 mm) was 0.6 J, or 0.6 %.
(b) Nanstad and Sokolov [8] also tested NIST specimens and reported “close agreement” at 16 J and
102 J, but also an 11 % lower absorbed energy for the 2 mm striker at the super-high-energy (217 J)
level.
(c) Siewert and Vigliotti [9] confirmed that differences are small (less than one standard deviation) up
to 100 J, whereas larger deviations (about 10 J) are observed at 200 J. Interestingly, they claimed:
“It is unlikely that a general relationship can be developed that will allow one machine to be
certified for both strikers from a test with only one striker (except perhaps for low energies, where
the difference is least).”
In 2000, McCowan et al. [10] compared test results on reference specimens of various energy levels
obtained by four international laboratories that certified Charpy verification specimens. Limited differences
were found below approximately 200 J, while data above that threshold indicated a higher absorption energy
for 8 mm strikers. The authors also concluded that “(…) since our results do not show a predictable
relationship for the striker radius effect, (…) separate certifications for 2 and 8 mm tests are needed for
verification specimens made from 4340 steel.”4
3 The coefficient of determination of the regression line was 0.9987, and the standard error was 1.36. 4 4340 is the steel used by NIST for the production of low- and high-energy verification specimens.
Volume 123, Article No. 123016 (2018) https://doi.org/10.6028/jres.123.016
Journal of Research of the National Institute of Standards and Technology
4 https://doi.org/10.6028/jres.123.016
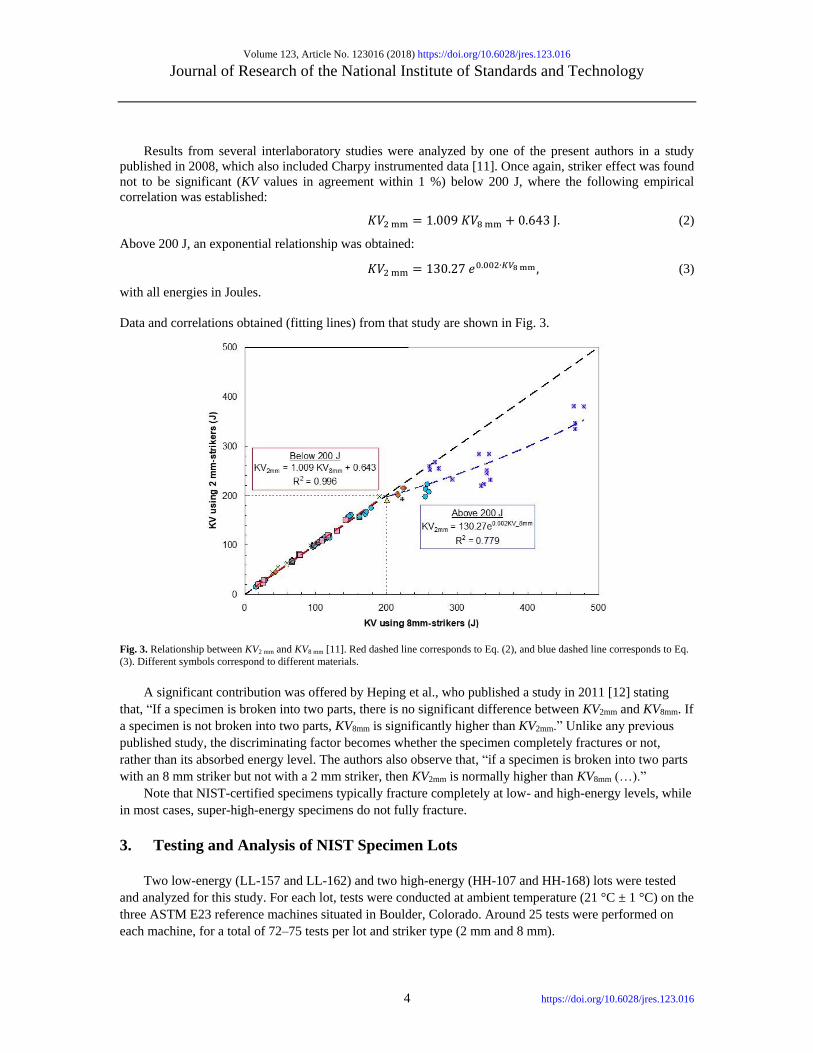
Results from several interlaboratory studies were analyzed by one of the present authors in a study
published in 2008, which also included Charpy instrumented data [11]. Once again, striker effect was found
not to be significant (KV values in agreement within 1 %) below 200 J, where the following empirical
correlation was established:
𝐾𝑉2 mm = 1.009 𝐾𝑉8 mm + 0.643 J. (2)
Above 200 J, an exponential relationship was obtained:
𝐾𝑉2 mm = 130.27 𝑒0.002∙𝐾𝑉8 mm , (3)
with all energies in Joules.
Data and correlations obtained (fitting lines) from that study are shown in Fig. 3.
Fig. 3. Relationship between KV2 mm and KV8 mm [11]. Red dashed line corresponds to Eq. (2), and blue dashed line corresponds to Eq.
(3). Different symbols correspond to different materials.
A significant contribution was offered by Heping et al., who published a study in 2011 [12] stating
that, “If a specimen is broken into two parts, there is no significant difference between KV2mm and KV8mm. If
a specimen is not broken into two parts, KV8mm is significantly higher than KV2mm.” Unlike any previous
published study, the discriminating factor becomes whether the specimen completely fractures or not,
rather than its absorbed energy level. The authors also observe that, “if a specimen is broken into two parts
with an 8 mm striker but not with a 2 mm striker, then KV2mm is normally higher than KV8mm (…).”
Note that NIST-certified specimens typically fracture completely at low- and high-energy levels, while
in most cases, super-high-energy specimens do not fully fracture.
3. Testing and Analysis of NIST Specimen Lots
Two low-energy (LL-157 and LL-162) and two high-energy (HH-107 and HH-168) lots were tested
and analyzed for this study. For each lot, tests were conducted at ambient temperature (21 °C ± 1 °C) on the
three ASTM E23 reference machines situated in Boulder, Colorado. Around 25 tests were performed on
each machine, for a total of 72–75 tests per lot and striker type (2 mm and 8 mm).

Volume 123, Article No. 123016 (2018) https://doi.org/10.6028/jres.123.016
Journal of Research of the National Institute of Standards and Technology
5 https://doi.org/10.6028/jres.123.016
For each series of tests, the following summary statistics are presented in Table 1:
• number of tests performed, n;
• mean energy, 𝐾𝑉̅̅ ̅̅ ;
• standard deviation, s;
• standard error,5 SE;
• minimum and maximum values of absorbed energy, KV;
• coefficient of variation,6 CV.
Several outliers were encountered when testing LL-157 and LL-162, because low-energy specimens,
when tested at ambient temperature, have a tendency to remain close to the anvils and can sometimes jam
between the machine and the swinging hammer, therefore leading to artificially high values of absorbed
energy [13]. The occurrence of jamming was confirmed by the visual examination of the broken specimen
halves. Moreover, Grubbs’ statistical test [14] was performed on the individual data sets to confirm that
those “dubious” results are indeed outliers, and they were subsequently excluded from further analyses.
The number of outliers was higher when 8 mm strikers were used, which could be explained by the more
limited clearance between striker, anvils, and specimen.
Table 1. Results from tests performed on low-energy and high-energy lots with 2 mm and 8 mm strikers.
Lot Machine Striker
Type n
𝑲𝑽̅̅ ̅̅
(J)
s
(J)
SE
(J)
Min KV
(J)
Max KV
(J)
CV
(%)
LL-157
1 2 mm 25 19.38 0.43 0.09 18.41 20.31 2.2
1 8 mm 25 19.00 0.56 0.11 17.97 20.31 3.0
2 2 mm 25 18.16 0.41 0.08 17.39 18.89 2.2
2 8 mm 23 17.37 0.42 0.09 16.58 17.98 2.4
3 2 mm 24 19.20 0.59 0.12 18.22 20.31 3.1
3 8 mm 25 18.67 0.52 0.10 17.65 19.80 2.8
LL-162
1 2 mm 25 19.42 0.72 0.14 18.41 21.36 3.7
1 8 mm 24 19.41 0.69 0.14 18.06 20.75 3.6
2 2 mm 24 17.82 0.67 0.14 16.26 19.27 3.7
2 8 mm 22 17.85 0.77 0.16 16.77 19.69 4.3
3 2 mm 26 19.13 0.63 0.12 17.28 20.30 3.3
3 8 mm 24 19.18 0.58 0.12 18.09 20.32 3.0
HH-107
1 2 mm 25 109.47 4.59 0.92 99.44 119.32 4.2
1 8 mm 25 109.03 5.49 1.10 99.08 121.99 5.0
2 2 mm 25 122.50 6.52 1.30 107.83 134.24 5.3
2 8 mm 25 114.10 5.04 1.01 105.12 124.12 4.4
3 2 mm 25 108.84 4.59 0.92 101.65 120.45 4.2
3 8 mm 25 108.19 5.22 1.04 100.52 117.47 4.8
HH-168
1 2 mm 25 101.63 2.40 0.48 96.61 106.16 2.4
1 8 mm 25 101.66 4.02 0.80 94.28 109.22 3.9
2 2 mm 25 100.92 2.81 0.56 95.04 108.58 2.8
2 8 mm 25 101.55 3.00 0.60 95.92 109.15 3.0
3 2 mm 24 100.76 2.39 0.49 96.99 106.55 2.4
3 8 mm 23 99.95 3.20 0.67 94.06 106.91 3.2
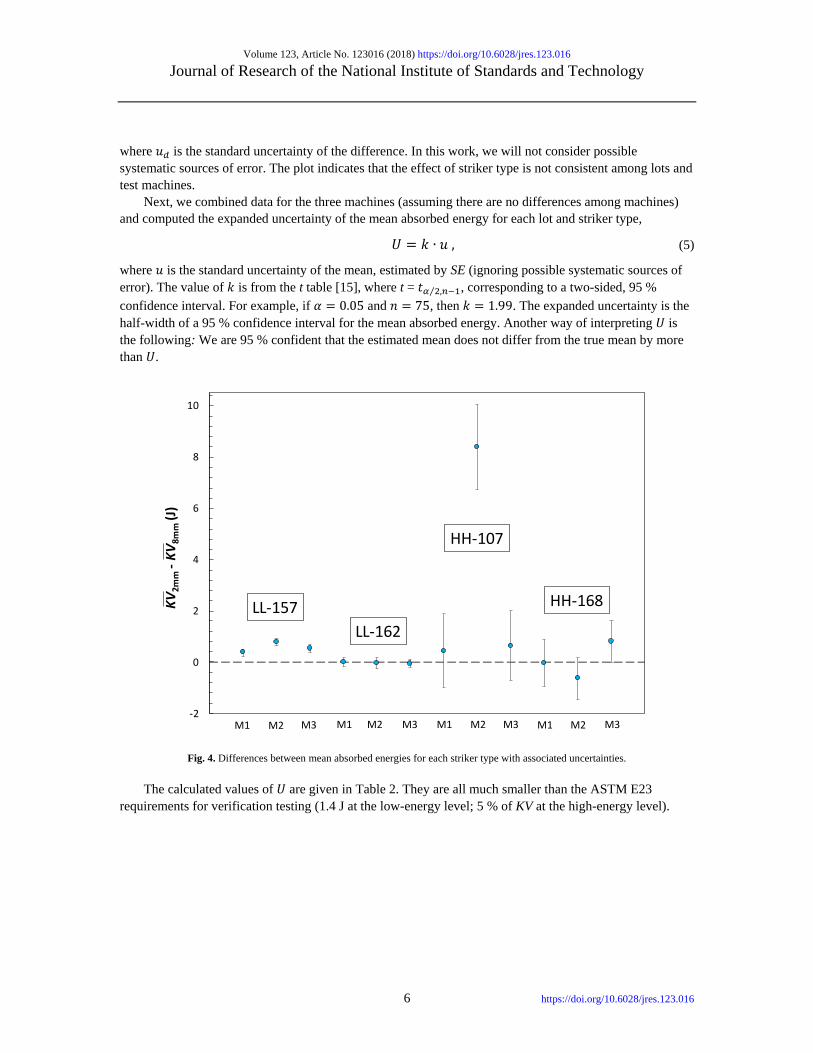
The differences between mean absorbed energies for 2 mm and 8 mm strikers, along with associated
error bars, are plotted in Fig. 4. The error bars, corresponding to ± 2 ∙ 𝑢𝑑, were calculated from the
standard errors SE for each striker type in Table 1 using:
𝑢𝑑 = √𝑆𝐸2mm2 + 𝑆𝐸8mm
2 , (4)
5 The standard error is calculated as the ratio between the standard deviation and the square root of the number of tests. 6 The coefficient of variation is calculated, in %, as the ratio between the standard deviation and the mean value.
Volume 123, Article No. 123016 (2018) https://doi.org/10.6028/jres.123.016
Journal of Research of the National Institute of Standards and Technology
6 https://doi.org/10.6028/jres.123.016
where 𝑢𝑑 is the standard uncertainty of the difference. In this work, we will not consider possible
systematic sources of error. The plot indicates that the effect of striker type is not consistent among lots and
test machines.
Next, we combined data for the three machines (assuming there are no differences among machines)
and computed the expanded uncertainty of the mean absorbed energy for each lot and striker type,
𝑈 = 𝑘 ∙ 𝑢 , (5)
where 𝑢 is the standard uncertainty of the mean, estimated by SE (ignoring possible systematic sources of
error). The value of 𝑘 is from the t table [15], where t = 𝑡𝛼 2⁄ ,𝑛−1, corresponding to a two-sided, 95 %
confidence interval. For example, if 𝛼 = 0.05 and 𝑛 = 75, then 𝑘 = 1.99. The expanded uncertainty is the
half-width of a 95 % confidence interval for the mean absorbed energy. Another way of interpreting 𝑈 is
the following: We are 95 % confident that the estimated mean does not differ from the true mean by more
than 𝑈.
Fig. 4. Differences between mean absorbed energies for each striker type with associated uncertainties.
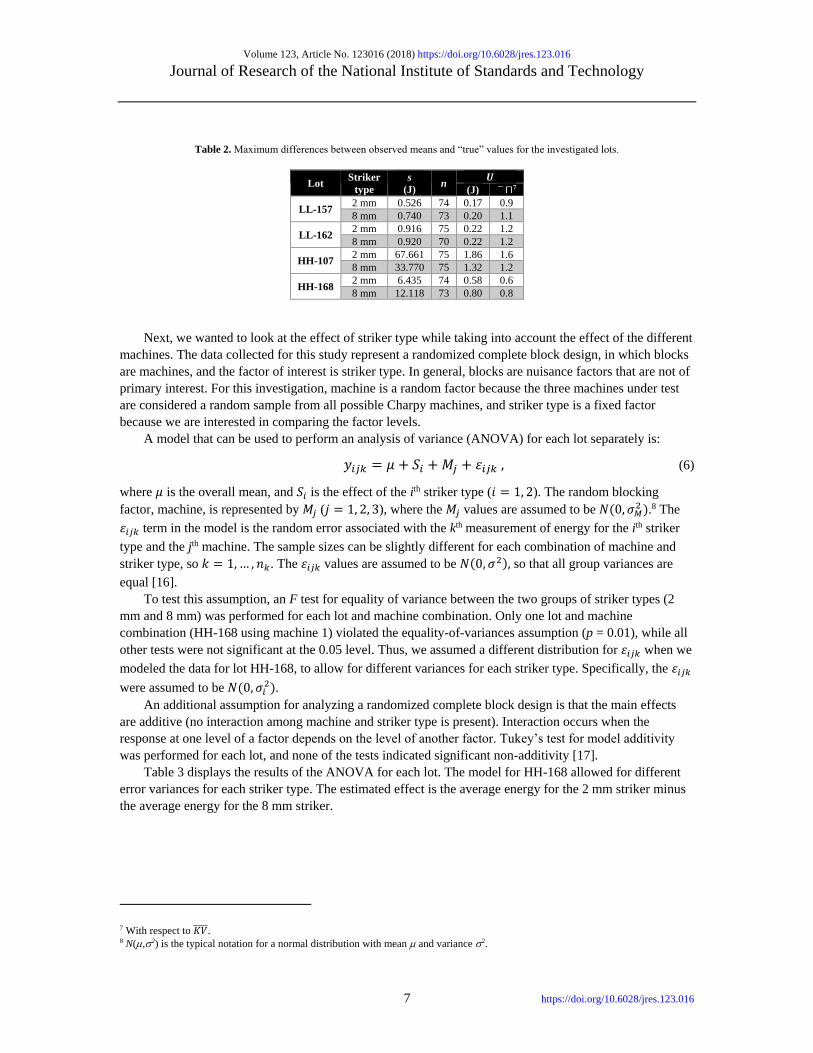
The calculated values of 𝑈 are given in Table 2. They are all much smaller than the ASTM E23
requirements for verification testing (1.4 J at the low-energy level; 5 % of KV at the high-energy level).
-2
0
2
4
6
8
10
KV
2mm
-KV
8m
m(J
)
M1 M2 M3 M1 M1 M1M2 M2 M2M3 M3 M3
LL-157
LL-162
HH-107
HH-168
Volume 123, Article No. 123016 (2018) https://doi.org/10.6028/jres.123.016
Journal of Research of the National Institute of Standards and Technology
7 https://doi.org/10.6028/jres.123.016
Table 2. Maximum differences between observed means and “true” values for the investigated lots.
Lot Striker
type
s
(J) n
𝑼
(J) 7
LL-157 2 mm 0.526 74 0.17 0.9
8 mm 0.740 73 0.20 1.1
LL-162 2 mm 0.916 75 0.22 1.2
8 mm 0.920 70 0.22 1.2
HH-107 2 mm 67.661 75 1.86 1.6
8 mm 33.770 75 1.32 1.2
HH-168 2 mm 6.435 74 0.58 0.6
8 mm 12.118 73 0.80 0.8
Next, we wanted to look at the effect of striker type while taking into account the effect of the different
machines. The data collected for this study represent a randomized complete block design, in which blocks
are machines, and the factor of interest is striker type. In general, blocks are nuisance factors that are not of
primary interest. For this investigation, machine is a random factor because the three machines under test
are considered a random sample from all possible Charpy machines, and striker type is a fixed factor
because we are interested in comparing the factor levels.
A model that can be used to perform an analysis of variance (ANOVA) for each lot separately is:
𝑦𝑖𝑗𝑘 = 𝜇 + 𝑆𝑖 + 𝑀𝑗 + 𝜀𝑖𝑗𝑘 , (6)
where 𝜇 is the overall mean, and 𝑆𝑖 is the effect of the ith striker type (𝑖 = 1, 2). The random blocking
factor, machine, is represented by 𝑀𝑗 (𝑗 = 1, 2, 3), where the 𝑀𝑗 values are assumed to be 𝑁(0, 𝜎𝑀2 ).8 The
𝜀𝑖𝑗𝑘 term in the model is the random error associated with the kth measurement of energy for the ith striker
type and the jth machine. The sample sizes can be slightly different for each combination of machine and
striker type, so 𝑘 = 1, … , 𝑛𝑘. The 𝜀𝑖𝑗𝑘 values are assumed to be 𝑁(0, 𝜎2), so that all group variances are
equal [16].
To test this assumption, an F test for equality of variance between the two groups of striker types (2
mm and 8 mm) was performed for each lot and machine combination. Only one lot and machine
combination (HH-168 using machine 1) violated the equality-of-variances assumption (p = 0.01), while all
other tests were not significant at the 0.05 level. Thus, we assumed a different distribution for 𝜀𝑖𝑗𝑘 when we
modeled the data for lot HH-168, to allow for different variances for each striker type. Specifically, the 𝜀𝑖𝑗𝑘
were assumed to be 𝑁(0, 𝜎𝑖2).
An additional assumption for analyzing a randomized complete block design is that the main effects
are additive (no interaction among machine and striker type is present). Interaction occurs when the
response at one level of a factor depends on the level of another factor. Tukey’s test for model additivity
was performed for each lot, and none of the tests indicated significant non-additivity [17].
Table 3 displays the results of the ANOVA for each lot. The model for HH-168 allowed for different
error variances for each striker type. The estimated effect is the average energy for the 2 mm striker minus
the average energy for the 8 mm striker.
7 With respect to 𝐾𝑉̅̅ ̅̅ . 8 N(,2) is the typical notation for a normal distribution with mean and variance 2.
Volume 123, Article No. 123016 (2018) https://doi.org/10.6028/jres.123.016
Journal of Research of the National Institute of Standards and Technology
8 https://doi.org/10.6028/jres.123.016
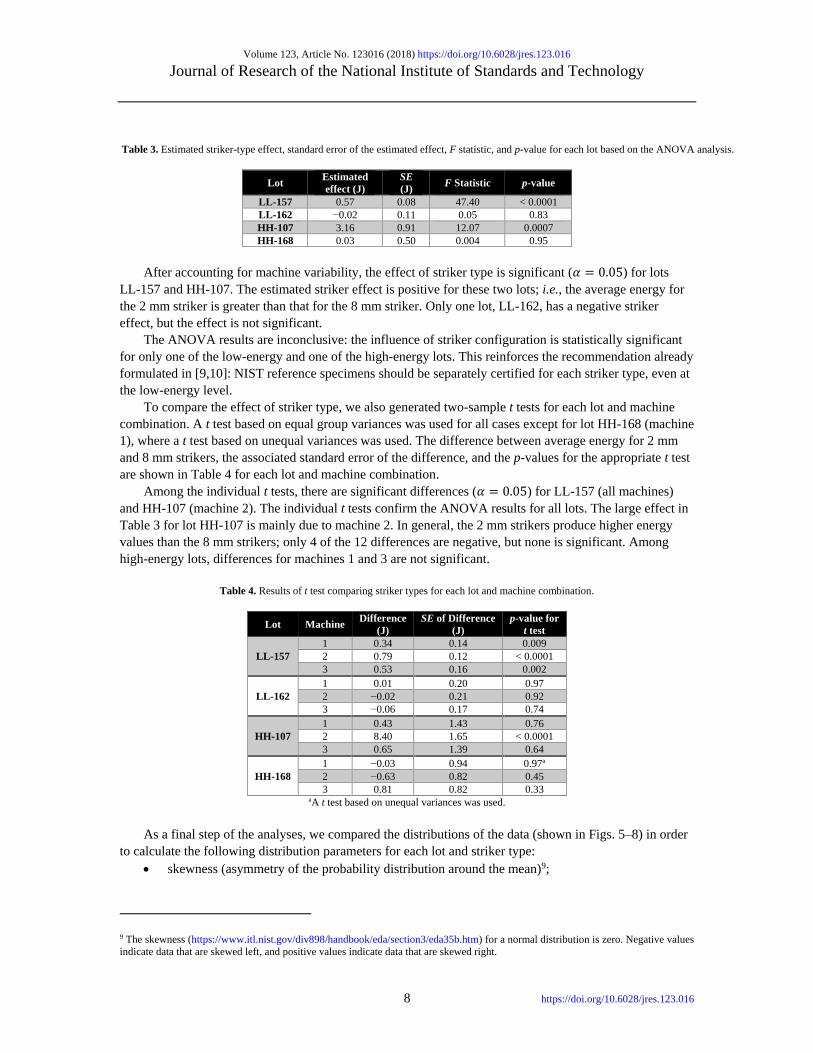
Table 3. Estimated striker-type effect, standard error of the estimated effect, F statistic, and p-value for each lot based on the ANOVA analysis.
Lot Estimated
effect (J)
SE
(J) F Statistic p-value
LL-157 0.57 0.08 47.40 < 0.0001
LL-162 −0.02 0.11 0.05 0.83
HH-107 3.16 0.91 12.07 0.0007
HH-168 0.03 0.50 0.004 0.95
After accounting for machine variability, the effect of striker type is significant (𝛼 = 0.05) for lots
LL-157 and HH-107. The estimated striker effect is positive for these two lots; i.e., the average energy for
the 2 mm striker is greater than that for the 8 mm striker. Only one lot, LL-162, has a negative striker
effect, but the effect is not significant.
The ANOVA results are inconclusive: the influence of striker configuration is statistically significant
for only one of the low-energy and one of the high-energy lots. This reinforces the recommendation already
formulated in [9,10]: NIST reference specimens should be separately certified for each striker type, even at
the low-energy level.
To compare the effect of striker type, we also generated two-sample t tests for each lot and machine
combination. A t test based on equal group variances was used for all cases except for lot HH-168 (machine
1), where a t test based on unequal variances was used. The difference between average energy for 2 mm
and 8 mm strikers, the associated standard error of the difference, and the p-values for the appropriate t test
are shown in Table 4 for each lot and machine combination.
Among the individual t tests, there are significant differences (𝛼 = 0.05) for LL-157 (all machines)
and HH-107 (machine 2). The individual t tests confirm the ANOVA results for all lots. The large effect in
Table 3 for lot HH-107 is mainly due to machine 2. In general, the 2 mm strikers produce higher energy
values than the 8 mm strikers; only 4 of the 12 differences are negative, but none is significant. Among
high-energy lots, differences for machines 1 and 3 are not significant.
Table 4. Results of t test comparing striker types for each lot and machine combination.
Lot Machine Difference
(J)
SE of Difference
(J)
p-value for
t test
LL-157
1 0.34 0.14 0.009
2 0.79 0.12 < 0.0001
3 0.53 0.16 0.002
LL-162
1 0.01 0.20 0.97
2 −0.02 0.21 0.92
3 −0.06 0.17 0.74
HH-107
1 0.43 1.43 0.76
2 8.40 1.65 < 0.0001
3 0.65 1.39 0.64
HH-168
1 −0.03 0.94 0.97a
2 −0.63 0.82 0.45
3 0.81 0.82 0.33 aA t test based on unequal variances was used.
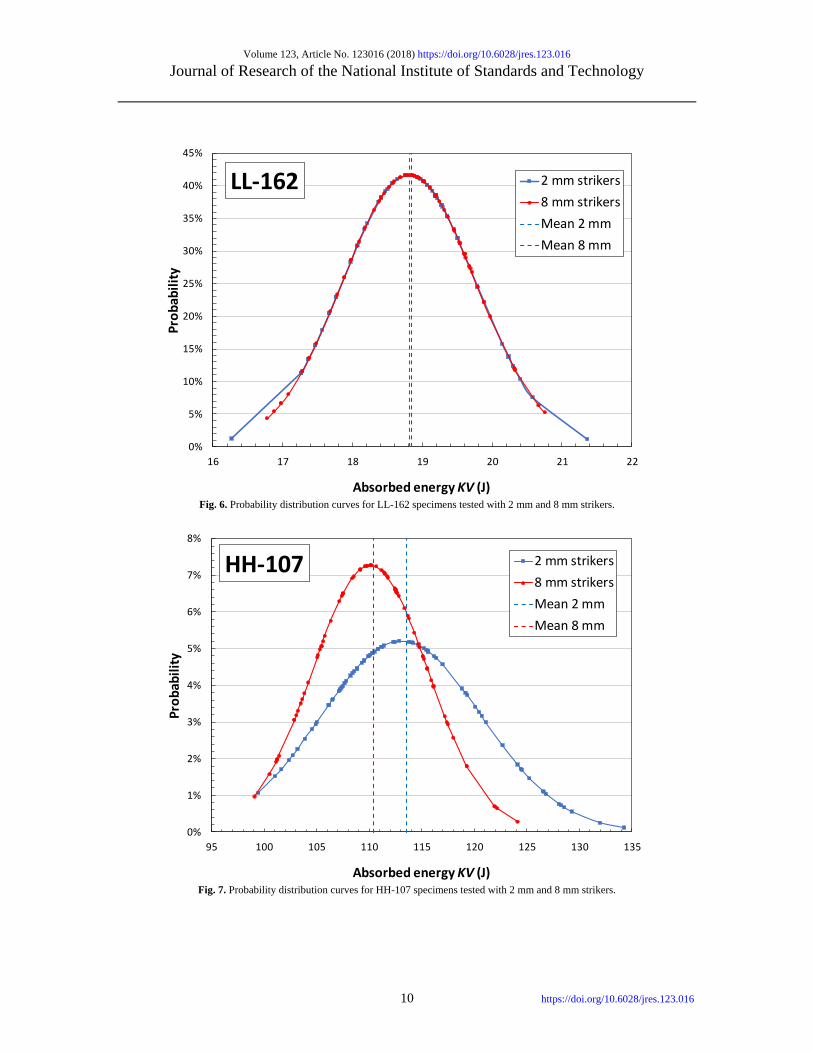
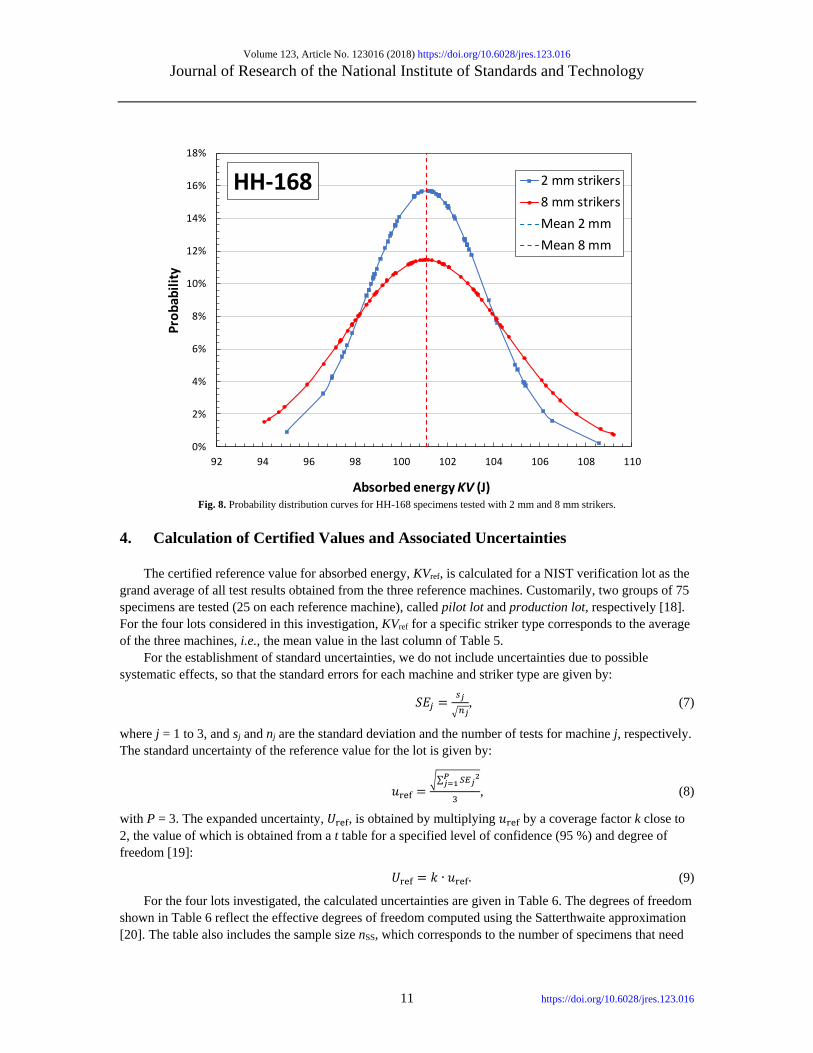
As a final step of the analyses, we compared the distributions of the data (shown in Figs. 5–8) in order
to calculate the following distribution parameters for each lot and striker type:
• skewness (asymmetry of the probability distribution around the mean)9;
9 The skewness (https://www.itl.nist.gov/div898/handbook/eda/section3/eda35b.htm) for a normal distribution is zero. Negative values
indicate data that are skewed left, and positive values indicate data that are skewed right.

Volume 123, Article No. 123016 (2018) https://doi.org/10.6028/jres.123.016
Journal of Research of the National Institute of Standards and Technology
9 https://doi.org/10.6028/jres.123.016
• kurtosis (thickness or “heaviness” of the probability distribution along its tails)10;
• median (value separating the higher half from the lower half of the probability distribution); and
• mean, 𝐾𝑉̅̅ ̅̅ .
The values of the parameters for the verification lots tested are collected in Table 5. It is interesting to note
that, based on skewness, the probability distributions for the low-energy lots are skewed left (i.e., the tail of
the distribution is longer on the left-hand side than on the right-hand side), while those for the high-energy
lots are skewed right. Most of the distributions were found to be “light-tailed” (kurtosis < 3). Lots LL-157
(Fig. 5) and HH-107 (Fig. 7) display the largest discrepancies between distributions for the two striker
types, and they confirm the results of the ANOVA.
Table 5. Statistical parameters for the probability distribution curves obtained for the lots tested.
Lot Striker
type Skewness Kurtosis
Median
(J)
𝑲𝑽̅̅ ̅̅
(J)
LL-157 2 mm −0.12 2.28 18.92 18.91
8 mm −0.13 2.40 18.43 18.34
LL-162 2 mm −0.14 3.03 18.97 18.79
8 mm −0.33 2.58 18.93 18.81
HH-107 2 mm 0.63 2.57 111.16 113.60
8 mm 0.14 2.43 110.64 110.44
HH-168 2 mm 0.34 3.35 101.19 101.10
8 mm 0.29 2.83 100.93 101.05
In Figs. 5–8, the coordinates of each symbol are the obtained value of absorbed energy (x-axis) and the
corresponding probability that KV falls at or below this value (y-axis).
Fig. 5. Probability distribution curves for LL-157 specimens tested with 2 mm and 8 mm strikers.
10 The kurtosis (https://www.itl.nist.gov/div898/handbook/eda/section3/eda35b.htm) for a normal distribution is 3. Values greater than
3 indicate a “heavy-tailed” distribution, and values smaller than 3 indicate a “light-tailed” distribution.
0%
10%
20%
30%
40%
50%
60%
16 17 18 19 20 21
Pro
bab
ilit
y
Absorbed energy KV (J)
2 mm strikers
8 mm strikers
Mean 2 mm
Mean 8 mm
LL-157
Volume 123, Article No. 123016 (2018) https://doi.org/10.6028/jres.123.016
Journal of Research of the National Institute of Standards and Technology
10 https://doi.org/10.6028/jres.123.016
Fig. 6. Probability distribution curves for LL-162 specimens tested with 2 mm and 8 mm strikers.
Fig. 7. Probability distribution curves for HH-107 specimens tested with 2 mm and 8 mm strikers.
0%
5%
10%
15%
20%
25%
30%
35%
40%
45%
16 17 18 19 20 21 22
Pro
bab
ilit
y
Absorbed energy KV (J)
2 mm strikers
8 mm strikers
Mean 2 mm
Mean 8 mm
LL-162
0%
1%
2%
3%
4%
5%
6%
7%
8%
95 100 105 110 115 120 125 130 135
Pro
bab
ilit
y
Absorbed energy KV (J)
2 mm strikers
8 mm strikers
Mean 2 mm
Mean 8 mm
HH-107
Volume 123, Article No. 123016 (2018) https://doi.org/10.6028/jres.123.016
Journal of Research of the National Institute of Standards and Technology
11 https://doi.org/10.6028/jres.123.016
Fig. 8. Probability distribution curves for HH-168 specimens tested with 2 mm and 8 mm strikers.
4. Calculation of Certified Values and Associated Uncertainties
The certified reference value for absorbed energy, KVref, is calculated for a NIST verification lot as the
grand average of all test results obtained from the three reference machines. Customarily, two groups of 75
specimens are tested (25 on each reference machine), called pilot lot and production lot, respectively [18].
For the four lots considered in this investigation, KVref for a specific striker type corresponds to the average
of the three machines, i.e., the mean value in the last column of Table 5.
For the establishment of standard uncertainties, we do not include uncertainties due to possible
systematic effects, so that the standard errors for each machine and striker type are given by:
𝑆𝐸𝑗 =𝑠𝑗
√𝑛𝑗, (7)
where j = 1 to 3, and sj and nj are the standard deviation and the number of tests for machine j, respectively.
The standard uncertainty of the reference value for the lot is given by:
𝑢ref =√∑ 𝑆𝐸𝑗
2𝑃𝑗=1
3, (8)
with P = 3. The expanded uncertainty, 𝑈ref, is obtained by multiplying 𝑢ref by a coverage factor k close to
2, the value of which is obtained from a t table for a specified level of confidence (95 %) and degree of
freedom [19]:
𝑈ref = 𝑘 ∙ 𝑢ref. (9)
For the four lots investigated, the calculated uncertainties are given in Table 6. The degrees of freedom
shown in Table 6 reflect the effective degrees of freedom computed using the Satterthwaite approximation
[20]. The table also includes the sample size nSS, which corresponds to the number of specimens that need
0%
2%
4%
6%
8%
10%
12%
14%
16%
18%
92 94 96 98 100 102 104 106 108 110
Pro
bab
ilit
y
Absorbed energy KV (J)
2 mm strikers
8 mm strikers
Mean 2 mm
Mean 8 mm
HH-168
Volume 123, Article No. 123016 (2018) https://doi.org/10.6028/jres.123.016
Journal of Research of the National Institute of Standards and Technology
12 https://doi.org/10.6028/jres.123.016
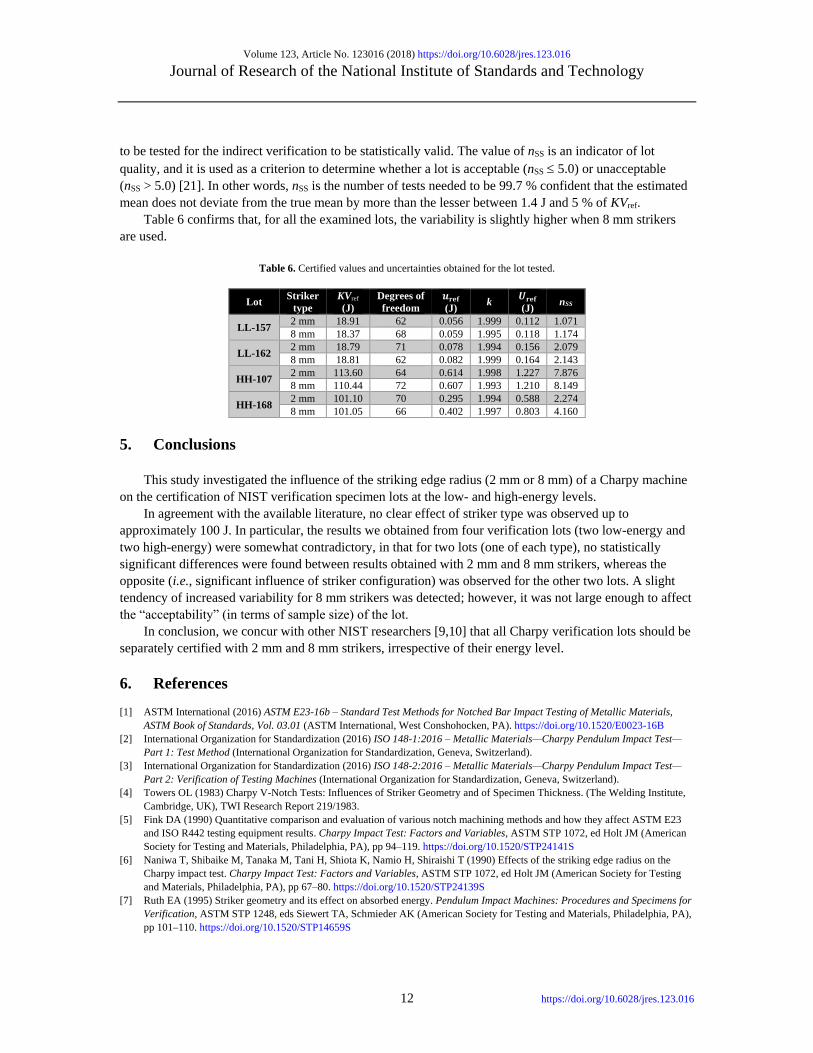
to be tested for the indirect verification to be statistically valid. The value of nSS is an indicator of lot
quality, and it is used as a criterion to determine whether a lot is acceptable (nSS 5.0) or unacceptable
(nSS > 5.0) [21]. In other words, nSS is the number of tests needed to be 99.7 % confident that the estimated
mean does not deviate from the true mean by more than the lesser between 1.4 J and 5 % of KVref.
Table 6 confirms that, for all the examined lots, the variability is slightly higher when 8 mm strikers
are used.
Table 6. Certified values and uncertainties obtained for the lot tested.
Lot Striker
type
KVref
(J)
Degrees of
freedom
𝒖𝐫𝐞𝐟
(J) k
𝑼𝐫𝐞𝐟
(J) nSS
LL-157 2 mm 18.91 62 0.056 1.999 0.112 1.071
8 mm 18.37 68 0.059 1.995 0.118 1.174
LL-162 2 mm 18.79 71 0.078 1.994 0.156 2.079
8 mm 18.81 62 0.082 1.999 0.164 2.143
HH-107 2 mm 113.60 64 0.614 1.998 1.227 7.876
8 mm 110.44 72 0.607 1.993 1.210 8.149
HH-168 2 mm 101.10 70 0.295 1.994 0.588 2.274
8 mm 101.05 66 0.402 1.997 0.803 4.160
5. Conclusions
This study investigated the influence of the striking edge radius (2 mm or 8 mm) of a Charpy machine
on the certification of NIST verification specimen lots at the low- and high-energy levels.
In agreement with the available literature, no clear effect of striker type was observed up to
approximately 100 J. In particular, the results we obtained from four verification lots (two low-energy and
two high-energy) were somewhat contradictory, in that for two lots (one of each type), no statistically
significant differences were found between results obtained with 2 mm and 8 mm strikers, whereas the
opposite (i.e., significant influence of striker configuration) was observed for the other two lots. A slight
tendency of increased variability for 8 mm strikers was detected; however, it was not large enough to affect
the “acceptability” (in terms of sample size) of the lot.
In conclusion, we concur with other NIST researchers [9,10] that all Charpy verification lots should be
separately certified with 2 mm and 8 mm strikers, irrespective of their energy level.
6. References
[1] ASTM International (2016) ASTM E23-16b – Standard Test Methods for Notched Bar Impact Testing of Metallic Materials,
ASTM Book of Standards, Vol. 03.01 (ASTM International, West Conshohocken, PA). https://doi.org/10.1520/E0023-16B
[2] International Organization for Standardization (2016) ISO 148-1:2016 – Metallic Materials—Charpy Pendulum Impact Test—
Part 1: Test Method (International Organization for Standardization, Geneva, Switzerland).
[3] International Organization for Standardization (2016) ISO 148-2:2016 – Metallic Materials—Charpy Pendulum Impact Test—
Part 2: Verification of Testing Machines (International Organization for Standardization, Geneva, Switzerland).
[4] Towers OL (1983) Charpy V-Notch Tests: Influences of Striker Geometry and of Specimen Thickness. (The Welding Institute,
Cambridge, UK), TWI Research Report 219/1983.
[5] Fink DA (1990) Quantitative comparison and evaluation of various notch machining methods and how they affect ASTM E23
and ISO R442 testing equipment results. Charpy Impact Test: Factors and Variables, ASTM STP 1072, ed Holt JM (American
Society for Testing and Materials, Philadelphia, PA), pp 94–119. https://doi.org/10.1520/STP24141S
[6] Naniwa T, Shibaike M, Tanaka M, Tani H, Shiota K, Namio H, Shiraishi T (1990) Effects of the striking edge radius on the
Charpy impact test. Charpy Impact Test: Factors and Variables, ASTM STP 1072, ed Holt JM (American Society for Testing
and Materials, Philadelphia, PA), pp 67–80. https://doi.org/10.1520/STP24139S
[7] Ruth EA (1995) Striker geometry and its effect on absorbed energy. Pendulum Impact Machines: Procedures and Specimens for
Verification, ASTM STP 1248, eds Siewert TA, Schmieder AK (American Society for Testing and Materials, Philadelphia, PA),
pp 101–110. https://doi.org/10.1520/STP14659S
Volume 123, Article No. 123016 (2018) https://doi.org/10.6028/jres.123.016
Journal of Research of the National Institute of Standards and Technology
13 https://doi.org/10.6028/jres.123.016
[8] Nanstad RK, Sokolov MA (1995) Charpy impact test results on five materials and NIST verification specimens using
instrumented 2-mm and 8-mm strikers. Pendulum Impact Machines: Procedures and Specimens for Verification, ASTM STP
1248, eds Siewert TA, Schmieder AK (American Society for Testing and Materials, Philadelphia, PA), pp 111–139.
https://doi.org/10.1520/STP14660S
[9] Siewert TA, Vigliotti DP (1995) The effect of Charpy V-notch striker radii on the absorbed energy. Pendulum Impact Machines:
Procedures and Specimens for Verification, ASTM STP 1248, eds Siewert TA, Schmieder AK (American Society for Testing
and Materials, Philadelphia, PA), pp 140–152. https://doi.org/10.1520/STP14661S
[10] McCowan CN, Pauwels J, Revise G, Nakano H (2000) International comparison of impact verification programs. Pendulum
Impact Testing: A Century of Progress, ASTM STP 1380, eds Siewert TA, Manahan MP Sr (ASTM International, West
Conshohocken, PA), pp 73–89. https://doi.org/10.1520/STP14387S
[11] Lucon E (2008) Influence of striking edge radius (2 vs. 8 mm) on instrumented Charpy data and absorbed energies. International
Journal of Fracture 153(1):1–14. https://doi.org/10.1007/s10704-008-9283-6
[12] Heping L, Xing Z, Weicheng X (2011) Correlation between Charpy absorbed energy using 2 mm and 8 mm strikers. Journal of
ASTM International 8(9):1–4. https://doi.org/10.1520/JAI103470
[13] Lucon E, McCowan CN, Santoyo RL (2015) Certification of NIST room temperature low-energy and high-energy Charpy
verification specimens. Journal of Research of the National Institute of Standards and Technology 120:316–328.
https://doi.org/10.6028/jres.120.020
[14] Grubbs F (1969) Procedures for detecting outlying observations in samples. Technometrics 11(1):1–21. Available at
http://www.jstor.org/stable/1266761
[15] Student (Gossett WS) (1908) The probable error of a mean. Biometrika 6(1):1–25. https://doi.org/10.2307/2331554
[16] McPherson G (1990) Statistics in Scientific Investigation: Its Basis, Application and Interpretation (Springer Science+Business
Media, LLC, New York). https://doi.org/10.1007/978-1-4757-4290-9
[17] Kirk RE (2017) Experimental Design: Procedures for Behavioral Sciences (SAGE Publications, Inc., Thousand Oaks, CA), 4th
Ed. https://doi.org/10.4135/9780857020994.n2
[18] McCowan CN, Siewert TA, Vigliotti DP (2003) The NIST Charpy V-notch verification program: Overview and operating
procedures. Charpy Verification Program: Reports Covering 1989–2002. (National Institute of Standards and Technology,
Gaithersburg, MD), NIST Technical Note (TN) 1500-9, Materials Reliability Series. https://doi.org/10.6028/NIST.TN.1500-9
[19] Splett JD, McCowan CN, Wang C-M, Iyer HK (2007) NIST Recommended Practice Guide: Computing Uncertainty for Charpy
Impact Machine Test Results. (National Institute of Standards and Technology, Gaithersburg, MD), NIST Special Publication
(SP) 960-18. https://doi.org/10.6028/NBS.SP.960-18e1
[20] Joint Committee for Guides in Metrology (2008) JCGM 100:2008, Evaluation of Measurement Data—Guide to the Expression
of Uncertainty in Measurement (GUM 1995 with minor corrections) (Joint Committee for Guides in Metrology, Paris, France).
Available at https://www.bipm.org/utils/common/documents/jcgm/JCGM_100_2008_E.pdf
[21] Lucon E (2018) New Software for the Statistical Analysis and Qualification of NIST Charpy Verification Specimen Lots.
(National Institute of Standards and Technology, Gaithersburg, MD), NIST Internal Report (NISTIR) 8211.
https://doi.org/10.6028/NIST.IR.8211
About the authors: Enrico Lucon is the Charpy project leader in the Fatigue and Fracture Group of the
Advanced Chemicals and Materials Division, NIST (Boulder, CO).
Jolene Splett is a mathematical statistician in the Statistical Engineering Division of the NIST
Information Technology Laboratory (Boulder, CO).
The National Institute of Standards and Technology is an agency of the U.S. Department of Commerce.
Related Documents