1 Effect of Body Position on Vocal Tract Acoustics: Acoustic Pharyngometry and Vowel Formants Houri K. Vorperian Waisman Center, University of Wisconsin-Madison 1500 Highland Ave # 427, Madison, WI 53711 Sara L. Kurtzweil Speech Pathology, Marshfield Center 1000 N. Oak Avenue, Marshfield, WI 54449 Marios Fourakis Department of Communication Sciences and Disorders, University of Wisconsin-Madison 1975 Willow Drive, Madison, WI 53706 Ray D. Kent Waisman Center, University of Wisconsin-Madison 1500 Highland Ave # 491, Madison, WI 53711 Katelyn K. Tillman Waisman Center, University of Wisconsin-Madison 1500 Highland Ave # 429, Madison, WI 53711 Diane Austin Waisman Center, University of Wisconsin-Madison 1500 Highland Ave # 429, Madison, WI 53711

Welcome message from author
This document is posted to help you gain knowledge. Please leave a comment to let me know what you think about it! Share it to your friends and learn new things together.
Transcript

1
Effect of Body Position on Vocal Tract Acoustics: Acoustic Pharyngometry and Vowel Formants
Houri K. Vorperian
Waisman Center, University of Wisconsin-Madison
1500 Highland Ave # 427, Madison, WI 53711
Sara L. Kurtzweil
Speech Pathology, Marshfield Center
1000 N. Oak Avenue, Marshfield, WI 54449
Marios Fourakis
Department of Communication Sciences and Disorders, University of Wisconsin-Madison
1975 Willow Drive, Madison, WI 53706
Ray D. Kent
Waisman Center, University of Wisconsin-Madison
1500 Highland Ave # 491, Madison, WI 53711
Katelyn K. Tillman
Waisman Center, University of Wisconsin-Madison
1500 Highland Ave # 429, Madison, WI 53711
Diane Austin
Waisman Center, University of Wisconsin-Madison
1500 Highland Ave # 429, Madison, WI 53711
vorperian
Typewritten Text
Accepted for publication in JASA - June 30, 1015 EPub 2015 Aug 17. PMCID: PMC4545056

2
ABSTRACT
The anatomic basis and articulatory features of speech production are often studied with imaging studies
that are typically acquired in the supine body position. It is important to determine if changes in body
orientation to the gravitational field alter vocal tract dimensions and speech acoustics. The purpose of this
study was to assess the effect of body position (upright versus supine) on (1) oral and pharyngeal
measurements derived from acoustic pharyngometry and (2) acoustic measurements of fundamental
frequency (F0) and the first four formant frequencies (F1-F4) for the quadrilateral point vowels. Data
were obtained for 27 male and female participants, aged 17 to 35 years. Acoustic pharyngometry showed
a statistically significant effect of body position on volumetric measurements, with smaller values in the
supine than upright position, but no changes in length measurements. Acoustic analyses of vowels
showed significantly larger values in the supine than upright position for the variables of F0, F3, and the
Euclidean distance from the centroid to each corner vowel in the F1-F2-F3 space. Changes in body
position affected measurements of vocal tract volume but not length. Body position also affected the
aforementioned acoustic variables, but the main vowel formants were preserved.
PACS numbers: 43.70.Aj, 43.70.Jt
3
I. INTRODUCTION
Speech and singing can be produced in a variety of body positions, such as upright, supine, prone
and at various angles of recline. This report specifically addresses speech in the upright and supine
positions. Although most laboratory studies of speech pertain to the upright position, imaging methods
often place the speaker in a supine position, or more rarely, a prone position. Studies of vocal tract
anatomy or function using magnetic resonance imaging (MRI) generally have placed the speaker in a
supine position (Fitch & Giedd, 1999; Steiner, Richmond, Marshall, & Gray, 2012; Vorperian et al.,
2009). The question arises if differences in body position affect the configuration and/or function of the
articulators while producing speech or at rest. If so, then generalization of imaging results across body
positions may be limited.
Changes that occur with altered body position may be attributable to gravitational effects exerted
on the tissues of the vocal tract. There may also be changes in musculoskeletal relationships that are at
least partly accommodations to gravitational effects but may reflect other aspects of structural
relationships such as head-body alignment. The observed effects of body position on the speech
articulators can be compensatory (the speaker makes adjustments in response to altered position) or non-
compensatory (no adjustments are made to different orientations to gravity). The effects of body position
on vocal tract adjustments during speech and singing have been determined primarily by the methods of
imaging, acoustic pharyngometry (also referred to as acoustic reflectometry), electromyography, tongue
pressure recordings, and acoustic measurements (primarily of formant frequencies). Published studies
have been conducted almost exclusively on adults, the assumed speakers in the following summary unless
specified otherwise.
The results of imaging and acoustic pharyngometry investigations into positional effects vary
somewhat across studies and across individuals. One of the most consistent observations is that the
pharyngeal (nasopharyngeal and/or oropharyngeal) cavity is smaller in the supine as opposed to the
upright position during speech, as determined from acoustic pharyngometry (APh; Jan, Marshall &

4
Douglas, 1994), computed tomography (CT; Sutthiprapaporn et al., 2008), magnetic resonance imaging
(MRI; Engwall, 2006; Kitamura et al., 2005; Traser, Burdumy, Richter, Vicari, & Echternach, 2014),
ultrasound (Stone et al., 2007; Wrench, Cleland & Scobbie, 2011), x-ray microbeam (Tiede, Masaki &
Vatikiotis-Bateson, 2000), and videofluoroscopy (Bae, Perry, & Kuehn, 2014). This effect can be
explained by gravity pulling the tongue root posteriorly when the subject is in the supine position, thereby
reducing the size of the pharynx. Similar effects have been observed during respiration. In a study of tidal
nasal breathing with computed tomography (supine body position) and cone beam computed tomography
(upright body position), the cross-sectional area of the upper airway was larger, especially in the region
between the hard palate and bottom of the uvula in the upright than in the supine body position (Van
Holsbeke et al., 2014). This difference in airway geometry was accompanied by functional changes in
airway resistance, with larger effects for men than women.
The gravitational influences may not have general effects on lingual function. In a recent study of
tongue pressures generation in speech tasks (phoneme repetitions) and nonspeech tasks (isometric
contractions), no significant differences were observed between upright and supine body positions
(Dietsch, Cirstea, Auer, Jr., & Searl, 2013). Either muscle activation for these tasks was unaffected by
body position, or the degree of activation was adjusted for configurational differences related to body
position.
Studies of the effects of body position on velar position and function are not so easily
summarized. First, as Perry (2011) points out, most studies were concerned with sleep apnea and not with
speech or singing. Vocal activities may result in a different response to gravity than is observed during
rest breathing or a task such as swallowing. A further complication is that results vary across studies and
sometimes across subjects within a study. The results are summarized here by task: rest breathing,
swallowing, and vocal tasks of speech or singing. Studies of rest breathing have shown that the supine
position resulted in (1) a thicker and longer velum, along with an increase in uvular width (Pae et al.,
1994; Yildirim et al., 1991) (2) a more posterior position of the velum (Bae, et al., 2014; Smith &
Battagel, 2004; Sutthiprapaporn et al., 2008), or (3) no significant differences in several measures of
5
velopharyngeal structures (Kollara & Perry, 2013; Perry, 2011). For swallowing, changes in body
position have been reported to affect the temporal pattern of movement (Perry, Bae, & Kuehn, 2012) and
velopharyngeal closing pressure (Nakayama et al., 2013). For speech, recent MRI studies by Perry
(2011), reporting on adults, and Kollara and Perry (2013), reporting on children between 4 and 8 years
old, concluded that there were minimal effects of gravity on measures of velar thickness, velar height,
levator muscle length, angles of origin, and pharyngeal dimensions. In an electromyographic study, Moon
and Canady (1995) observed a reduced level of muscle activity in the levator veli palatine for phonation
in the supine as opposed to the upright position. In a MRI study of untrained singers, Traser et al. (2014)
observed elongation of the uvula in the upright position.
Effects of body position also have been reported for the jaw and larynx. Compared to the upright
position, the jaw is more protruded in the supine position during speech (Shiller, Ostry, & Gribble, 1999)
and singing (Traser, Burdumy, Richter, Vicari, & Echternach., 2013), which may be a compensation for
pharyngeal constriction, similar to the way in which mandibular advancement is used as a treatment for
obstructive sleep apnea (Ferguson, Cartwright, Rogers, & Schmidt-Nowara, 2006). The larynx is elevated
(i.e. more caudal or shorter distance from cranial reference point to laryngeal reference point) in the
supine position during speech (Kitamura et al., 2005) and singing (Traser et al., 2013) but apparently not
during nonvocal states (Yildirim et al., 1991). Laryngeal elevation is related to several factors, including
activation of the suprahyoidal and infrahyoidal muscles, neck and head posture, and tracheal pull on
laryngeal structures (Traser et al., 2013). At least some of these effects are responses to the gravitational
field, but some may be associated with musculo-skeletal repositioning during postural changes.
In summary, there is general consensus that a supine body position differs from an upright
position where during respiration, the pharyngeal cavity is smaller in the supine than in the upright
position; and where during speech and singing, the tongue root is retracted (reducing the lumen of the
pharynx), the jaw protruded, the larynx elevated, and the effects on the velopharynx variable (ranging
from no effect to velar thickening and lengthening, and a posterior position of the velum).
6
Generally, acoustic studies have measured vowel formant frequencies (or more rarely, formant
bandwidth) for speech produced in upright versus supine position (cf. Steiner et al., 2012). Weir,
McCutcheon, and Flege (1993) measured the first three formant frequencies for the four corner vowels (/i/
/u/ /ae/ /a/) produced by 10 male speakers. The sole significant difference between upright and supine
positions was a higher F1 frequency for the vowel /i/ in the supine position. Stone et al. (2007) measured
the F1 and F2 frequencies of three vowels (/i/ as in “feet”, /ae/ as in “hat”, and /a/ as in “hot”) produced
by 13 speakers. They reported no significant differences for words of continuous speech but some
significant differences for isolated production of sustained consonants and vowels. Shiller et al. (1999)
also measured F1 and F2 frequencies, focusing on two vowels in a consonant-vowel-consonant context
with a carrier phrase produced by six speakers. Both F1 and F2 were higher in supine than upright body
position for vowel /ae/ and less reliably for //. In another study of F1 and F2 frequencies for the vowels
/i/ /u/ and /a/, no significant differences were observed between vowels produced in upright versus supine
positions by 12 subjects, although F1 frequencies tended to be higher in the supine position (Bae et al.,
2014). Tiede et al. (2000) reported acoustic data from two Japanese male speakers for sustained vowels
(/i/ /u/ /a/ /e/ /o/) and running speech in upright and supine positions. No consistent differences were
found in formant frequencies or bandwidths between body positions or type of speech material. Stone et
al. (2007) and Tiede et al. (2000) concluded from their data that the physiological effects of gravity on the
acoustic properties of speech are negligible. Buchaillard, Perrier and Payan (2009) concluded similarly
from a biomechanical model of the tongue and oral cavity. However, Shiller et al. (1999) reached the
very different conclusion that “subjects do not completely compensate for differences in gravitational
load” (p. 9079) and contrasted the motor control of speech with arm movements, for which such
compensation has been demonstrated.
In summary, acoustic differences between upright and supine body positions are small or variable
across studies. A general conclusion is hindered by the differences in speech sounds used across studies
and by the limitation of the acoustic data to the first two or three formants.
7
Questions remain on the anatomic and acoustic consequences of positional change, especially
related to the degree to which subjects compensate for changes in orientation relative to gravity.
Particularly needed is a combination of anatomic and acoustic measurements for both sexes. Therefore,
the purpose of this study was to assess the effect of body position (upright versus supine) on (1) oral and
pharyngeal anatomic measurements derived from acoustic pharyngometry (APh; oral and pharyngeal
cavity length and volume of the vocal tract); and (2) acoustic measurements for the extreme vowels of the
traditional quadrilateral, of fundamental frequency (F0), the first four formant frequencies (F1, F2, F3,
and F4), formant bandwidths (B2 for F2, and B3 for F3), and computed Euclidean distances from a
neutral vowel (in the F1-F2-F3 acoustic space). The centroid was calculated to be an approximation of a
neutral vowel. Data were obtained for both male and female adults to assess possible sex differences. For
the APh portion of the study, we hypothesized that the supine body position would yield smaller anatomic
measures of the pharyngeal cavity volume but not its length (a pure effect of gravity pulling the tongue
root posteriorly). For the acoustic portion of the study, we hypothesized that body position will not affect
any of the acoustic measurements (F0, F1, F2, F3, F4, B2 and B3) due to compensation in speech
production.
II. METHODS
A. Participants
Participants in this study included 27 adults (thirteen males and fourteen females) between the
ages of 17 and 35 years. All participants were white native speakers of American English with no known
difficulties with voice, speech, language, or hearing as determined by self-report during a phone
interview, except for one female participant with a mild high frequency hearing loss. Participants were
recruited with IRB (Institutional Review Board) approved flyers posted on University campus.
B. Procedures
After participants gave consent to participate, anthropometric data were collected including
participants’ sex, race, age, weight, and height (Table 1). Next, speech audio recordings followed by APh
8
measurements were collected first in the upright body position and then in the supine body position for
participant ease. Despite data collection order of speech acoustics recordings followed by APh, the
description of methods is reversed for expository and explanatory convenience in describing the results;
therefore, APh is presented first, followed by the speech acoustics thus maintaining the anatomic–acoustic
presentation order throughout this paper. All data collection was performed with two examiners present in
the testing room. Participants received monetary compensation.
1. Acoustic Pharyngometry - Anatomic measurements
The Eccovision® acoustic pharyngometer (Sleep Group Solutions, 2009) was used to obtain
anatomic measurements of the vocal tract in the upright and supine body positions. The acoustic
pharyngometer (APh), also known as an acoustic reflectometer, is a noninvasive FDA approved unit that
uses sound echoes to measure the geometry of the oral and pharyngeal cavities/upper airway. It has been
in use for several decades as an accurate, non-invasive method of examining the upper airway (Hoffstein
& Zamel (1984), D'Urzo, Lawson, Vassal, Rebuck, Slutsky, & Hoffstein (1987), D'Urzo, Rubinstein,
Lawson, Vassal, Rebuck, Slutsky, & Hoffstein (1988), Hoffstein & Fredberg (1991); Marshall et al.
(1993)) both clinically to investigate adults and children with sleep related disorders (Brown, McClean,
Boucher, Zamel, & Hoffstein, 1987; Gelardi et al, 2007; Jung, Cho, Grunstein, & Yee, 2004; Marshall et
al., 1993; Monahan, Kirchner, & Redline, 2005), and more recently in speech research to study changes
or differences in vocal tract dimensions related to aging (Xue, Jiang, Lin, Glassenberg, & Mueller, 1999),
race (Xue & Hao, 2006;), as well as in atypically developing speakers with Down Syndrome (Xue, Kaine,
& Ng 2010). The APh technique is similar to that of an active sonar and entails emitting pulses of sounds
of known frequency and amplitude into the vocal tract, then using the amplitude and arrival times of the
reflected acoustic waves to construct the area-distance function of the upper airway, specifically the
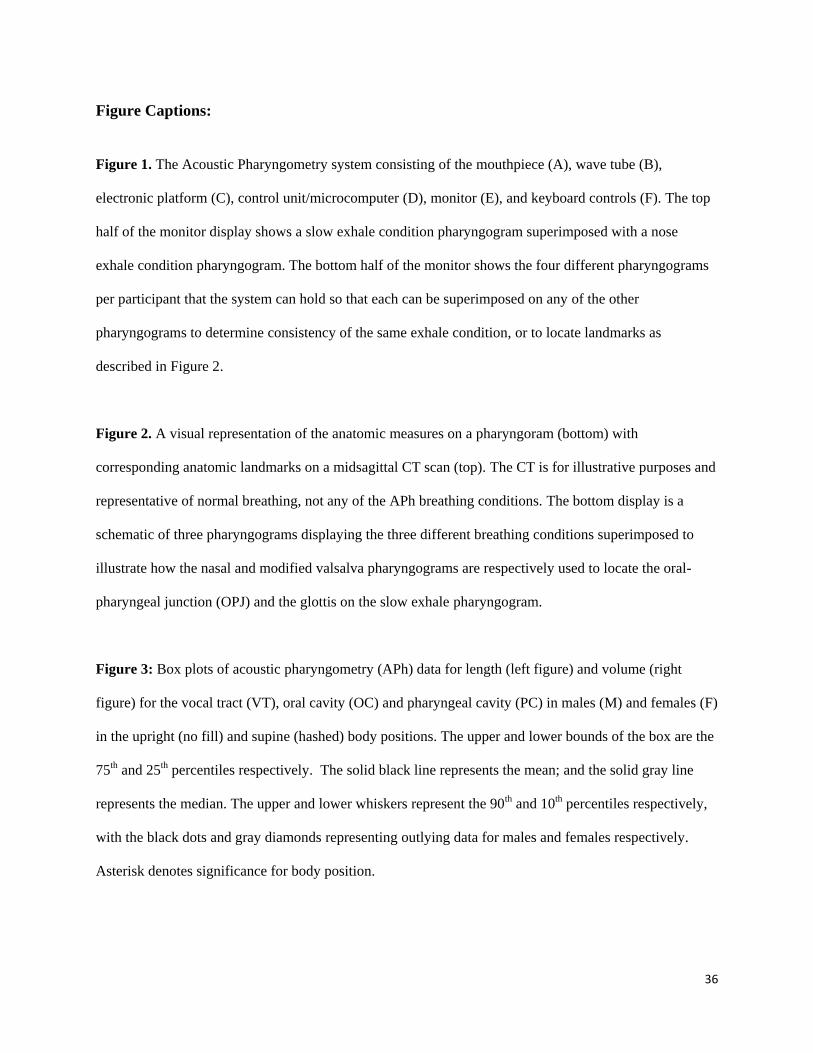
cross-sectional area of the upper airway as a function of the distance from the glottis to the teeth. Figure
1 shows the APh system consisting of a mouthpiece (A) that is attached to the wave tube (B), which has
an integrated electronic platform (C), and in turn is connected to the control unit/a microcomputer (D)
that is connected to a monitor (E) to display the pharyngogram, as well as a keyboard (F) to type

9
commands and filenames for data acquisition i.e. perform the acoustic scan. As the participant is gently
exhaling through A and B, the electronic platform (C) that contains one sound generator and two
microphones emits the acoustic signal (filtered tapping). The resulting acoustic wave, captured by first of
the two microphones, travels down the uniform wave tube (B) and fitted mouthpiece (A) and into the
vocal tract lumen. Fractions of the wave are reflected back at each point of discontinuity in the lumen and
recorded by the second microphone. The control unit/microcomputer (D), equipped with analog-to-digital
and digital-to-analog converters, processes the time of arrival and the amplitude of the reflected sound
waves, and uses the monitor (E, as seen in Figure 1) to display the pharyngogram, a two-dimensional
graphic representation of the cross-sectional area of the lumen (cm2) as a function of airway distance
(cm). The control unit also calculates volume (cc) from the summation of cross sectional area
measurements.
Insert Figure 1
The acoustic pharyngometry data collection procedure used in this study was one based on the
acoustic pharyngometer’s operator manual (Sleep Group Solutions, 2009) as well as numerous
communications with the manufacturer. A detailed protocol documenting the use of the acoustic
pharyngometry equipment for data acquisition and analysis was developed, and a licensed version of the
protocol is available online (Vorperian, 2013). To summarize, acoustic pharyngometry data collection
entailed having the participants position the flange of the mouthpiece against their teeth with their lips
over the flange to form an airtight seal (similar to an athletic mouth guard). The mouthpiece also
contained a crossbar to guide the tongue to a relaxed, downward position. Each participant was instructed
to exhale slowly using each of the following three breathing conditions: 1) Oral exhale condition –
participant inhaled through the nose and slowly exhaled through the mouth; this condition was performed
several times until the pharyngograms were consistent (< +6% difference between trials) since this slow
exhale condition pharyngogram was used to make the at-rest vocal tract length and volume
10
measurements. 2) Nose exhale condition – participant inhaled through the nose and slowly exhaled back
through the nose; the region of airway constriction seen at the base of the initial peak of this
pharyngogram was used to mark the location of the oral pharyngeal junction (OPJ) on the slow oral
exhale pharyngogram once the two pharyngograms were superimposed. 3) Modified valsalva condition –
participant inhaled through the nose and slowly exhaled through the mouth against a partially constricted
glottis; the pharyngogram of this modified valsalva breathing condition was similarly used to mark the
location of the glottis on the slow oral exhale pharyngogram once the two pharyngograms were
superimposed. The OPJ and glottis marks were used to segment and measure the oral and pharyngeal
portions of vocal tract length (OCL-APh and PCL-APh ) and volume (OCV-APh and PCV-APh), where
the OPJ and glottis marks denoted the endpoints of the oral and pharyngeal cavities respectively (see
Figure 2). Thus, a total of six APh measures were made that included the following three length (L)
measurements: VTL-APh (vocal tract length), OCL-APh (oral cavity length), PCL-APh (pharyngeal
cavity length); and the following three volume (V) measurements: VTV-APh (vocal tract volume), OCV-
APh (oral cavity volume), and PCV-APh (pharyngeal cavity volume).
Insert Figure 2.
2. Speech acoustic recordings and measurements:
Speech recordings were made using a SHURE SM48 microphone and PMD 660 Marantz solid
state recorder. The microphone, stabilized with a floor stand, was adjusted to the height of the participant
and placed 15 cm from the participant’s mouth. The microphone was connected directly to the Marantz
recorder, which digitized the speech samples at a 48 kHz sampling rate and 16-bit quantization onto the
recording medium, a SanDisk Ultra II flashcard. The sound files were transferred to a computer for
editing and analysis using the speech acoustic analysis software package TF32 (Milenkovic, 2010). The
stimuli were real words of American English containing the four corner vowels in consonant-vowel-
consonant or consonant-vowel context. Words were used, as opposed to sustained vowels, to avoid the
11
problem of hyper-articulation (Engwall, 2006). Stimuli selection took into account word familiarity to
younger participants, and high phonological neighborhood density which reportedly maximizes vowel
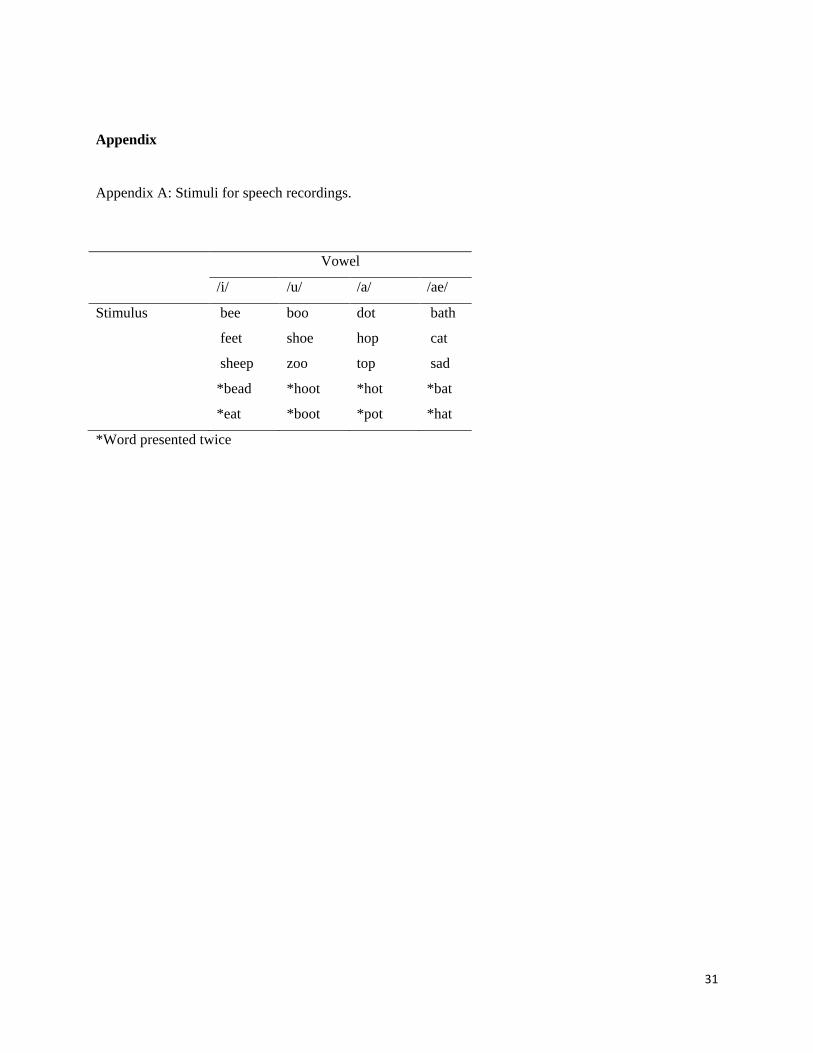
space (Munson & Solomon, 2004). The corner vowels were /u/ as in “hoot,” /a/ as in “hot,” /i/ as in
“feet,” and /ae/ as in “hat.” For each corner vowel there were five stimuli (see Appendix A for the full list
of word stimuli), with two of these words elicited twice. Thus there were 28 stimuli per body position
and 56 stimuli per person (4 vowels x 7 words x 2 body positions). A laptop running the TOCS+
Platform program (Hodge & Daniels, 2007) was used to present the stimuli, both visually and auditorily,
where the same set of 28 words was delivered to each participant in both the upright and supine body
positions in random order in each body position.
Participants were seated in the upright body position first. One of the two examiners adjusted the
microphone to the participant’s seated height and distance from the lips as specified above. Each
participant was instructed to keep his or her loudness at the same level throughout the speech recording
session, to refrain from smiling or laughing, and to count from one to ten in a natural voice while the
same examiner adjusted the recording level on the Marantz. Feedback regarding production loudness was
given and the target recording level was adjusted to be between 6 to 12 dB below the maximum level.
Participants were then instructed to repeat the words they heard. The targeted recording levels were
maintained throughout the recording sessions. In the upright body position, the stimuli were photographs
presented to each participant visually on the computer monitor with the stimulus word written under it
while an adult male audio recording of the stimulus word played over the computer’s external speakers.
For speech recordings in the supine body position, participants lay on a cot with a supportive neck pillow.
The microphone setup and recording process was the same as in the upright position except that in the
supine position, the stimuli were presented only in audio form to ensure that each participant maintained
the desired body position with a line of vision straight up at the ceiling. Participants were instructed to
inform the examiner if they were unsure of a stimulus and the examiner presented it again as needed.
The continuous speech recording from each participant was segmented into separate wave files
for each stimulus word. A total of 1489 words (out of a possible 1512) were segmented. The 23 missing
12
stimuli were due to participant error using the TOCS+Platform program. Each of the segmented word
files was analyzed using the acoustic analysis software TF32 and the following measurements were made:
fundamental frequency, formant frequencies F1-F4, and formant bandwidths B2 and B3.
The acoustic measurements of formant frequencies F1-F4 were made from a 100 ms segment that
began at 10% of the total vowel duration. The analysis segment was selected for each word/waveform to
capture the steady state of the vowel. Software output values using linear predictive coding (LPC)
formant tracking for the 100 ms segment were edited manually for formant tracking errors and the
average per formant was used as the F1 through F4 values. The formant values of all seven words per
vowel were then averaged, such that each participant had an average F1 for /a/, /ae/, /i/, and /u/ in the
upright body position and an average F1 for each of the four vowels in the supine body position, and so
on for the other formant frequencies. Fundamental frequency measurement was accomplished with
TF32’s pitch extraction performed on the selected 100 ms segment.
Formant bandwidth was measured manually from LPC spectra with a Hamming window placed
over the middle 20 ms interval of the 100 ms analysis segment. Manual measurements were used because
of questionable accuracy of formant bandwidths derived from LPC analyses (Burris, Vorperian, Fourakis,
Kent & Bolt, 2014). The bandwidths of only the second and third formant bandwidths (B2 and B3) were
measured because we believed that these could be measured with satisfactory reliability and would be
sufficient to detect bandwidth changes related to differences in body position. Formant bandwidths are
determined by several factors that conceivably could be affected by the gravitational orientation of the
vocal tract. These include radiation, friction and heat conduction losses, and dissipation in the walls of the
vocal tract (Fant, 1972; Fleischer, Pinkert, Mattheus, Mainka, & Murbe, 2014). We assumed that
measurement of two formant bandwidths would be adequate to determine if bandwidths are affected by
body position although it is possible that such effects are formant specific. The bandwidths B2 and B3
were manually calculated as the width between ± 3dB of the F2 and F3 formant peaks, respectively,
allowing a ± 0.5dB margin of error. Due to narrowness of the formant peak or weakness of the formant,
the bandwidth sometimes could not be measured, or the bandwidth could be measured only on one side.
13
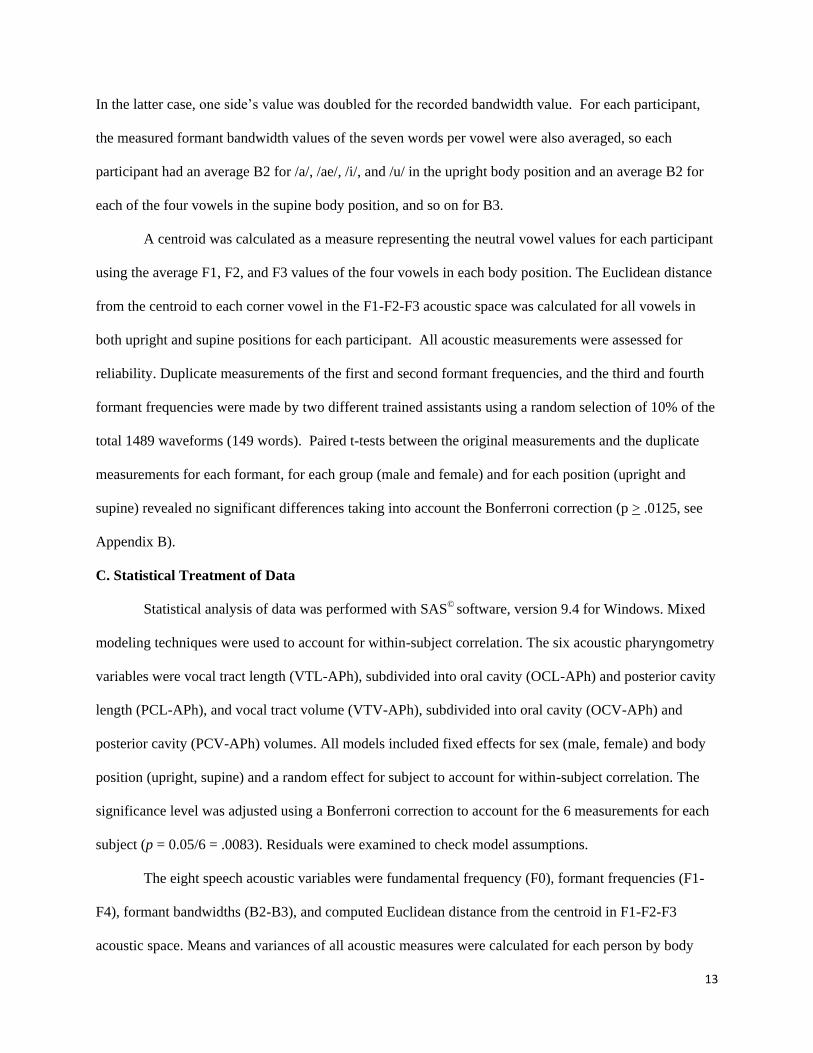
In the latter case, one side’s value was doubled for the recorded bandwidth value. For each participant,
the measured formant bandwidth values of the seven words per vowel were also averaged, so each
participant had an average B2 for /a/, /ae/, /i/, and /u/ in the upright body position and an average B2 for
each of the four vowels in the supine body position, and so on for B3.
A centroid was calculated as a measure representing the neutral vowel values for each participant
using the average F1, F2, and F3 values of the four vowels in each body position. The Euclidean distance
from the centroid to each corner vowel in the F1-F2-F3 acoustic space was calculated for all vowels in
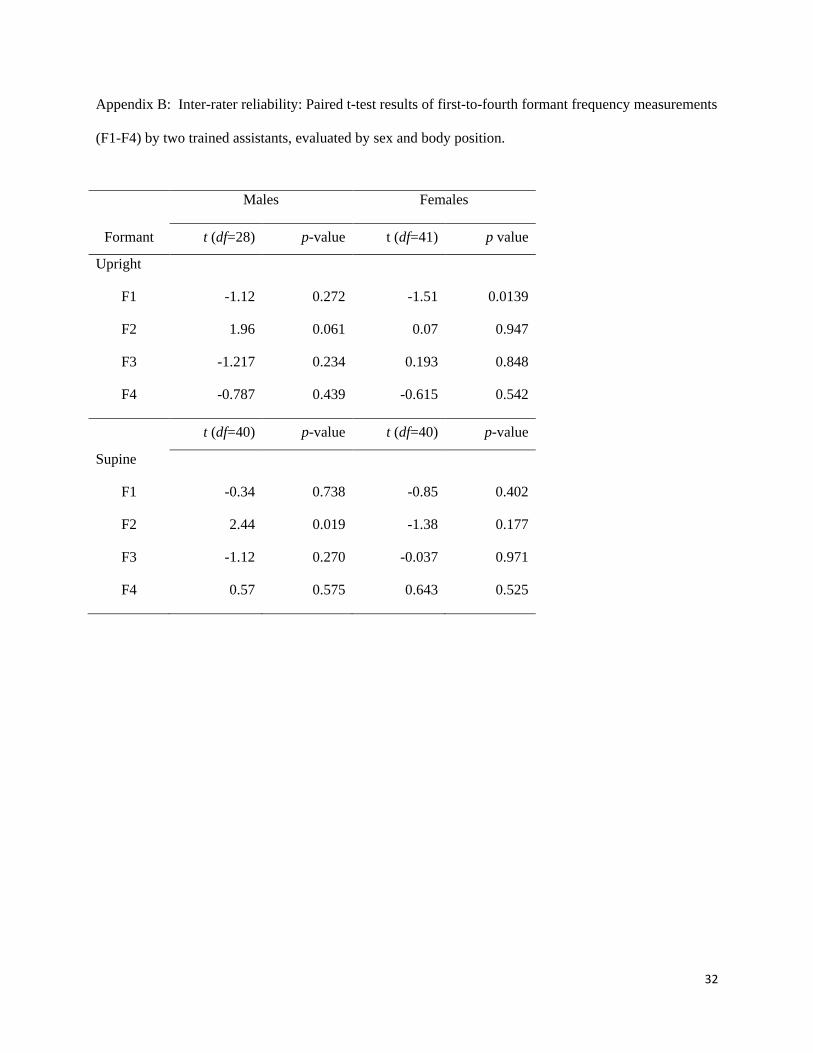
both upright and supine positions for each participant. All acoustic measurements were assessed for
reliability. Duplicate measurements of the first and second formant frequencies, and the third and fourth
formant frequencies were made by two different trained assistants using a random selection of 10% of the
total 1489 waveforms (149 words). Paired t-tests between the original measurements and the duplicate
measurements for each formant, for each group (male and female) and for each position (upright and
supine) revealed no significant differences taking into account the Bonferroni correction (p > .0125, see
Appendix B).
C. Statistical Treatment of Data
Statistical analysis of data was performed with SAS© software, version 9.4 for Windows. Mixed
modeling techniques were used to account for within-subject correlation. The six acoustic pharyngometry
variables were vocal tract length (VTL-APh), subdivided into oral cavity (OCL-APh) and posterior cavity
length (PCL-APh), and vocal tract volume (VTV-APh), subdivided into oral cavity (OCV-APh) and
posterior cavity (PCV-APh) volumes. All models included fixed effects for sex (male, female) and body
position (upright, supine) and a random effect for subject to account for within-subject correlation. The
significance level was adjusted using a Bonferroni correction to account for the 6 measurements for each
subject (p = 0.05/6 = .0083). Residuals were examined to check model assumptions.
The eight speech acoustic variables were fundamental frequency (F0), formant frequencies (F1-
F4), formant bandwidths (B2-B3), and computed Euclidean distance from the centroid in F1-F2-F3
acoustic space. Means and variances of all acoustic measures were calculated for each person by body

14
position and vowel type. These means were used for modeling and to calculate Euclidean distance. All
models included fixed effects for sex (male, female), body position (upright, supine), and vowel type (/i/
high-front, /ae/ low-front, /u/ high-back, /a/ low-back). An unstructured covariance matrix was used to
model within-subject correlation and to accommodate unequal vowel type and body position variances.
The significance level was adjusted using a Bonferroni correction to account for the 8 measurements for
each subject (p = 0.05/8 = .0063). Residuals were examined to check model assumptions. Individual
variances were averaged by sex, vowel type, and body position and were used to describe differences in
variability by body position.
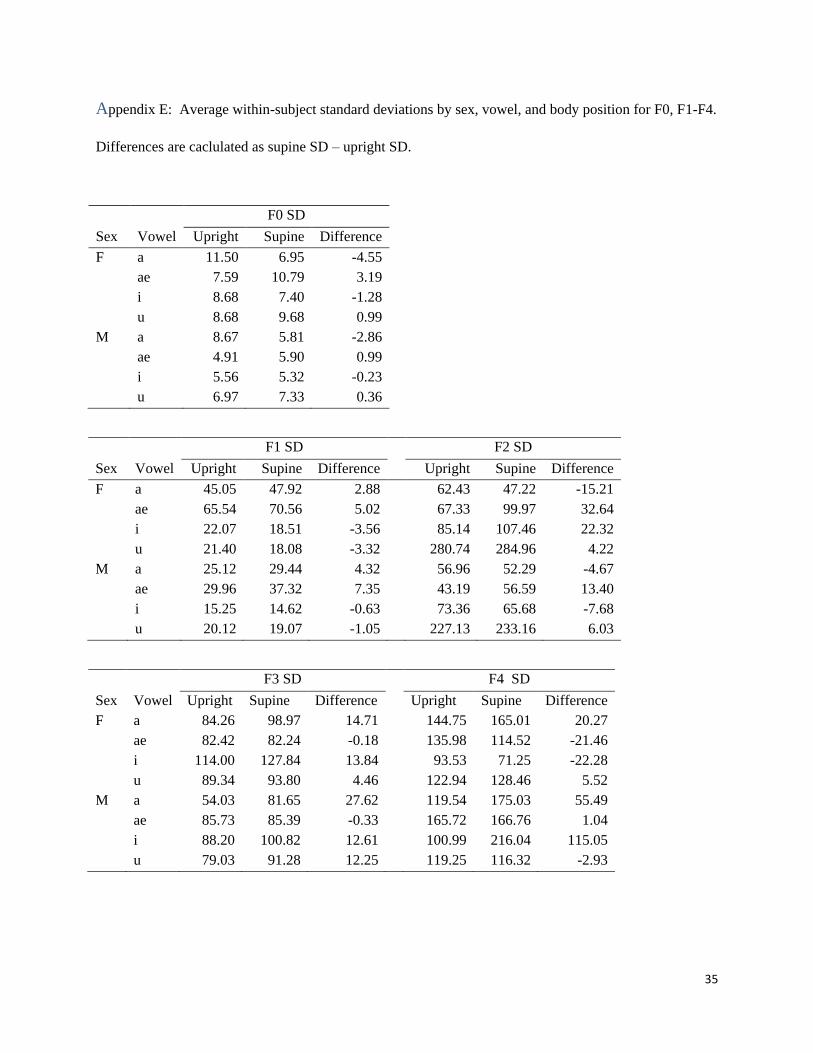
To examine whether the variability of acoustic measures differed by body position, within-person
variances of F0, F1, F2, F3 and F4 were calculated for each person by body position and vowel type.
Standard deviations were estimated by taking square root of the mean of the individual variances grouped
by sex, vowel type and body position. Differences between supine and upright standard deviations were
calculated.
III. RESULTS
A. Anatomy: Acoustic Pharyngometry (APh)
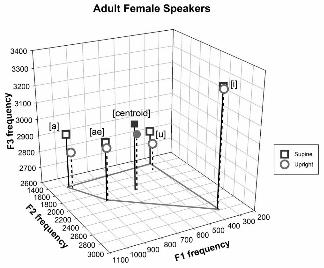
Figure 3 is a boxplot display of the anatomic data on length and volume of the oral, pharyngeal
and vocal tract cavities as derived from APh for all participants in the upright and supine body positions.
Aside from the apparent and expected sex differences in anatomic measures where male participants’
length and volume values were larger than female participants’ values, Figure 3 shows that body position
affects volume but not length measurements where volumetric measurements are smaller in the supine
position (hashed boxes) than in the upright position (open boxes).
Insert Figure 3
15
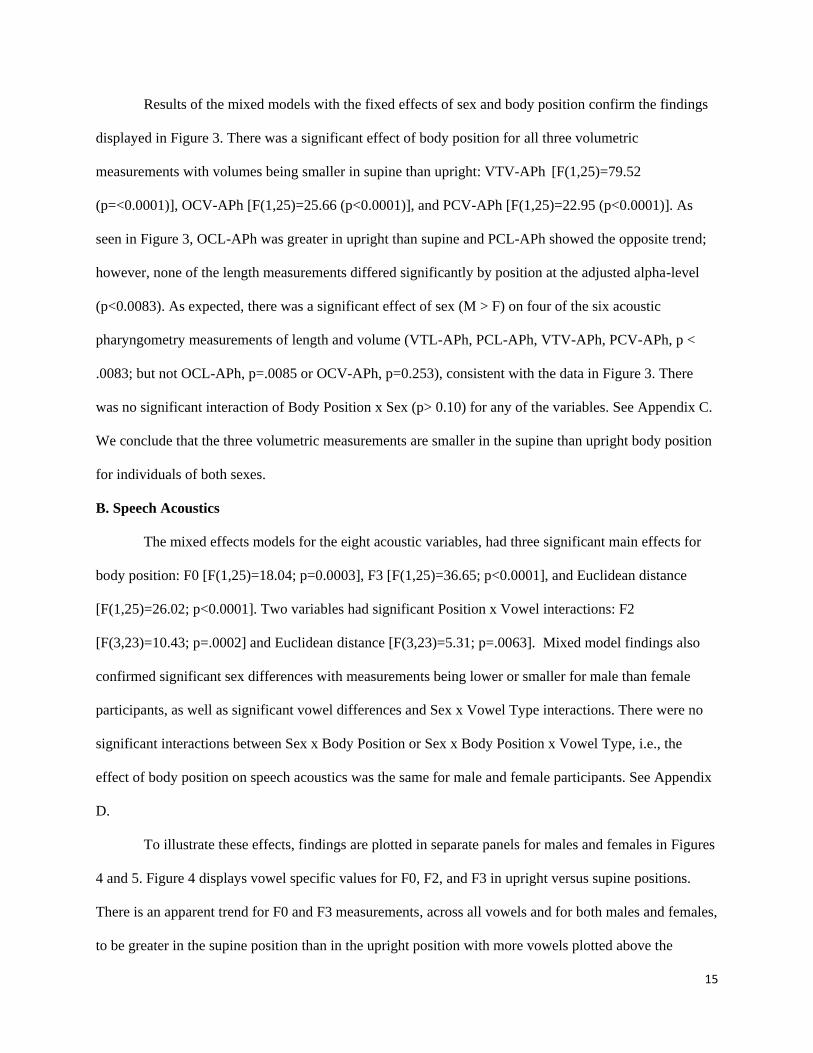
Results of the mixed models with the fixed effects of sex and body position confirm the findings
displayed in Figure 3. There was a significant effect of body position for all three volumetric
measurements with volumes being smaller in supine than upright: VTV-APh [F(1,25)=79.52
(p=<0.0001)], OCV-APh [F(1,25)=25.66 (p<0.0001)], and PCV-APh [F(1,25)=22.95 (p<0.0001)]. As
seen in Figure 3, OCL-APh was greater in upright than supine and PCL-APh showed the opposite trend;
however, none of the length measurements differed significantly by position at the adjusted alpha-level
(p<0.0083). As expected, there was a significant effect of sex (M > F) on four of the six acoustic
pharyngometry measurements of length and volume (VTL-APh, PCL-APh, VTV-APh, PCV-APh, p <
.0083; but not OCL-APh, p=.0085 or OCV-APh, p=0.253), consistent with the data in Figure 3. There
was no significant interaction of Body Position x Sex (p> 0.10) for any of the variables. See Appendix C.
We conclude that the three volumetric measurements are smaller in the supine than upright body position
for individuals of both sexes.
B. Speech Acoustics
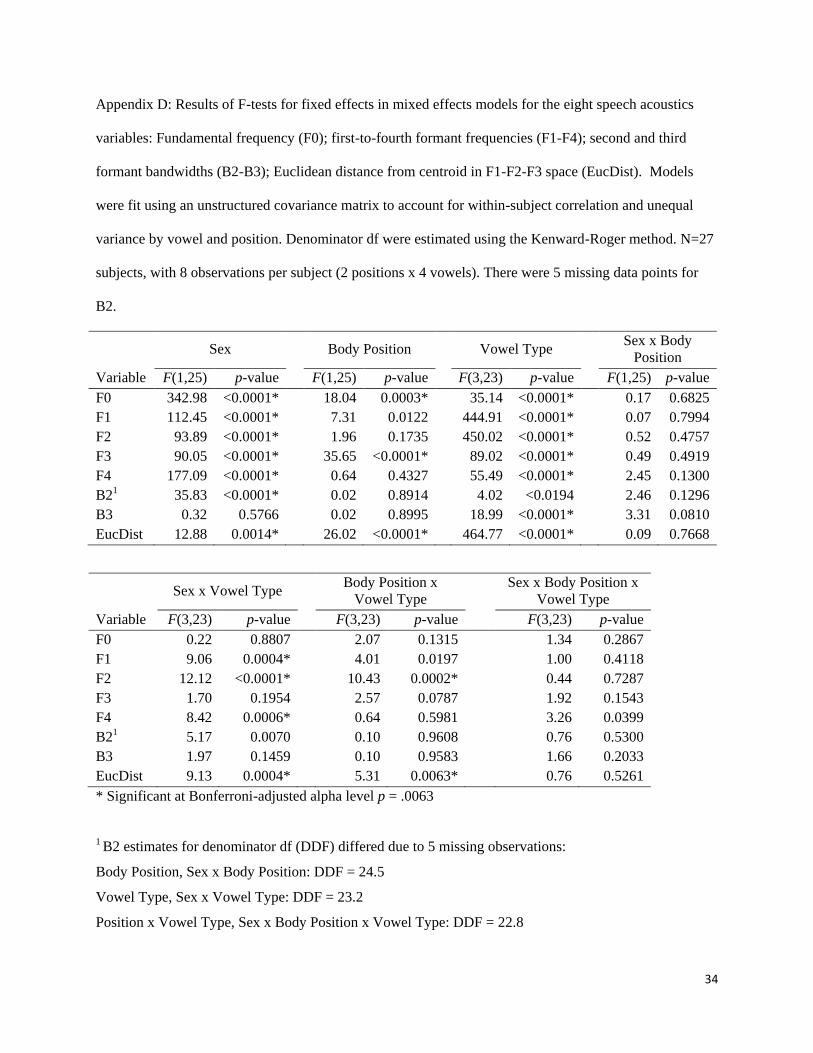
The mixed effects models for the eight acoustic variables, had three significant main effects for
body position: F0 [F(1,25)=18.04; p=0.0003], F3 [F(1,25)=36.65; p<0.0001], and Euclidean distance
[F(1,25)=26.02; p<0.0001]. Two variables had significant Position x Vowel interactions: F2
[F(3,23)=10.43; p=.0002] and Euclidean distance [F(3,23)=5.31; p=.0063]. Mixed model findings also
confirmed significant sex differences with measurements being lower or smaller for male than female
participants, as well as significant vowel differences and Sex x Vowel Type interactions. There were no
significant interactions between Sex x Body Position or Sex x Body Position x Vowel Type, i.e., the
effect of body position on speech acoustics was the same for male and female participants. See Appendix
D.
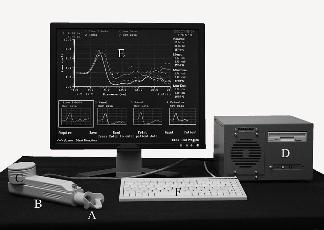
To illustrate these effects, findings are plotted in separate panels for males and females in Figures
4 and 5. Figure 4 displays vowel specific values for F0, F2, and F3 in upright versus supine positions.
There is an apparent trend for F0 and F3 measurements, across all vowels and for both males and females,
to be greater in the supine position than in the upright position with more vowels plotted above the

16
diagonal reference line. The Body Position x Vowel Type interaction for F2 can be seen in the middle
panels, with more /i/, /a/ and /ae/ vowels above the line (supine > upright) and more /u/ vowels below the
line (supine < upright) for both sexes.
Insert Figure 4
Insert Figure 5
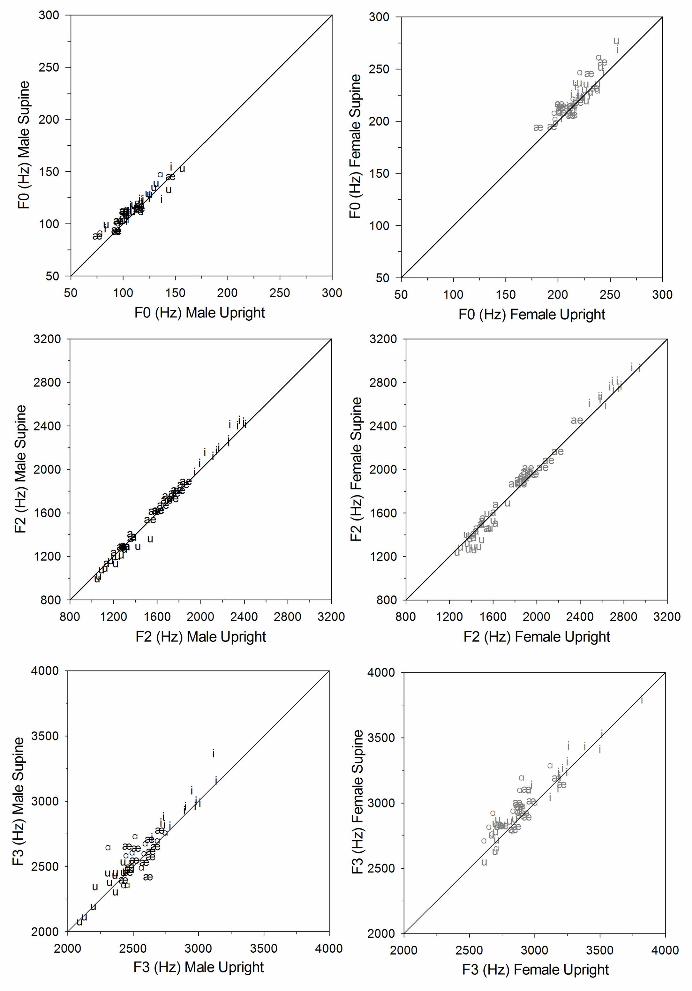
Figure 5 is a 3D display of the vowel quadrilateral using the first three formants and showing the
centroid for each position in males (5a) and females (5b). Aside from further illustrating that F3
frequencies were higher in the supine than the upright body position, it shows that the Euclidean distance
was greater in supine than upright body position for all vowels and both sexes (significant effect of body
position). The magnitude of the differences from the centroid varied by vowel type (significant Body
Position x Vowel Type interaction), with /u/ showing the largest differences and /a/ showing the smallest.
The significant Sex x Vowel Type interaction [F(3,23)=9.31; p=.0004] is due to differences in distances
between vowels for males and females.
Differences in variability in supine versus upright productions for F0 and F1-F4 were examined
by taking the difference of the average standard deviation by sex, vowel, and body position for each
measure. Women tended to have larger standard deviations than men. Also noted were differences in the
variability by vowel type. However, there were no systematic trends for standard deviations to be greater
in one body position than another.
To summarize, the supine body position resulted in an increased F0, F3, and Euclidean distance
in the F1-F2-F3 acoustic space, with a significant Vowel Type x Body Position interaction for F2 and
Euclidean distance. There were no systematic differences in variability of F0 or F1-F4 by body position.
17
IV. DISCUSSION
This study examined the effect of body position on vocal tract acoustics using the methods of
acoustic pharyngometry and acoustic measures of vowel production, as an approach to assess the
feasibility of using data from medical imaging studies obtained in the supine body position to address
speech production in the upright body position. We hypothesized that for the APh portion of the study,
the supine body position would yield smaller anatomic measures of the pharyngeal cavity volume but not
its length. For the acoustic portion of the study, we hypothesized that body position would not affect any
of the measurements of vowel production (F0, F1, F2, F3, F4, B2 and B3). Findings for acoustic
pharyngometry revealed all three oral, pharyngeal, and vocal tract volumes to be significantly smaller in
the supine position compared to the upright position. As for acoustic analyses of vowels, findings showed
statistically significant effects of body position for three of the eight acoustic measures, with higher
frequencies in the supine than upright position for the variables of F0 and F3, and greater Euclidean
distance from the centroid to each corner vowel in the F1-F2-F3 space.
The significant effect of body position on vocal tract volume, specifically the pharyngeal cavity
volume-APh, is comparable to the findings in several other studies (Bae et al., 2014; Jan et al., 1994;
Stone et al., 2007; Sutthiprapaporn et al. 2008; Wrench et al., 2011). However, for the volumes of both
the oral and pharyngeal cavities to be smaller in the supine body position makes it difficult to determine
the possible effect of one cavity over the other on the acoustic measures. An interpretation of these results
is that participants compensate for gravitational effects on the volume of the pharyngeal cavity by making
compensatory changes in the volume of the oral cavity, thereby preserving the relative dimensions of
these portions of the vocal tract. Alternatively, the APh mouthpiece may have interfered with
compensation of gravitational effect.
These anatomical results are specific to a vocal tract in the upright versus supine body position,
so these results reflect primarily the effect of gravity and not articulatory compensations made to achieve
a desired phonetic target in the face of gravitational changes. The acoustic data reflect both gravity and
compensations made to achieve vowel production in each gravitational orientation. As noted in the review
18
of previous studies, articulatory adjustments are most likely to be seen in the naso- and oro-pharyngeal
region, the jaw, and the larynx. These adjustments are made to preserve the basic acoustic properties of
speech.
Concerning the cause of the increased F0 in the supine position, we can only speculate. One
possibility is the differential influence of tracheal pull, which is expected to be greater in the upright than
supine body position. However, we did not see evidence in either the APh or acoustic data of a change in
the position of the larynx that would affect F0 by means such as those described by Honda, Harai,
Masaki, and Shimada (1999). Presumably, tracheal pull would draw the larynx caudally, therefore
increasing the length of the vocal tract. Apparently, then, the increased F0 in the supine position occurred
without an appreciable change in larynx position. Possibly, the reduced tracheal pull in the supine
position facilitates a cricoid rotation that lengthens the vocal folds, thereby increasing F0. In addition,
upright and supine body positions may have differential effects on the external frame function related to
F0 control. Sonninen (1968) described the various extrinsic tension mechanisms operating on the vocal
folds, including tracheal pull, the sternothyroid muscle, the thyrohyomandibular muscle chain, and the
functional chain composed of the arytenoid cartilage, aryepiglottic muscle, epiglottis, tongue, hyoid, and
mandible. These mechanisms may have different influences on F0 control, depending on body position.
The general lack of an effect of body position on the main vowel formants F1 and F2 frequencies
agrees with the results of Weir et al. (1993), Tiede et al. (2000), Stone et al. (2007), and Bae et al. (2014)
but not those of Shiller et al. (1999). The preponderance of the formant-frequency data from acoustic
studies indicates that speakers achieve a high degree of compensation for changes in gravitational
orientation. This conclusion is consistent with reports that speech production is little affected by
weightlessness as experienced by astronauts (Nixon & Waggoner, 1962) although one report described
nasal speech associated with this condition (Kerwin, 1975). Present findings of no main effect of body
position on F2, but an interaction of body position and vowel type on F2 indicate that body position
perturbs the production of some vowels more than others, and hence there may be more compensation in
the production of those vowels.
19
Body position affected only one formant in particular. F3 had significantly higher values in the
supine position than the upright position. Although the observed increase in F3 may be due to chance
given that no other formants were affected, it appears from Figure 4 that many speakers of both sexes
have a higher F3 frequency values in the supine position where F3 values for most vowels fall above the
solid diagonal line that references perfect consistency between the two body positions. Figure 5 also
illustrates the higher F3 frequencies in the supine than upright body position, confirming the validity of
this result. This increased frequency may reflect an altered configuration in the vocal tract. F3 of the
vowel /a/ was most affected of the four corner vowels, which could mean that the back vowel was
produced with further backing in the supine position, or there was a constriction in the oral or pharyngeal
cavities leading to an increase of this formant value. F3 frequency has been related to the anterior region
of the vocal tract (Fant & Pauli, 1974). It would seem that if the tongue is retracted in the supine position,
the effect most likely would be to increase the size of the front cavity, which would be expected to
decrease rather than increase the F3 frequency. Additional imaging studies are warranted to assess
changes in vocal tract configuration in the upright and supine positions for the articulation of specific
vowels and to determine the bases for changes in F3 frequency.
The Euclidean distance from the centroid to the corner vowels in the F1-F2-F3 space was
significantly greater in the supine than in the upright position, but the differences between upright and
supine productions varied by vowel and sex, with /u/ showing the greatest difference and /a/ the smallest.
Body position especially affected the high vowels /i/ and /u/ for both sexes, suggesting that tongue height
was accomplished somewhat differently between the upright and supine positions. Alternatively, if the
same muscle forces were used to produce the high vowels in both body positions, the reduced
gravitational effect in the supine position may have allowed a more extreme position of the tongue.
To our knowledge, previous acoustic studies of the effects of body position on vowel production
have not addressed whether the variability of F0 or formant measures is affected. Given that speech is
routinely produced in the upright position, it would not be surprising if the acoustic measures showed

20
greater variability in the supine than upright position. However, we observed no consistent differences in
variability, which can be interpreted to mean that the precision of speech motor control for vowel
production is not affected by alteration in body position, at least for the two positions studied here. This
finding also implies that there is no order effect (upright recording always preceding supine recordings),
which was a limitation in study design.
It appears from our data and from most previous reports that adult speakers of both sexes can
compensate fairly effectively for changes in orientation to gravity, thereby achieving main vowel formant
patterns that do not change significantly with body position. Previous studies using a variety of
techniques have shown that articulatory adjustments are most likely to be seen in the naso- and oro-
pharyngeal region, the jaw, and the larynx. These adjustments apparently are made to preserve the basic
acoustic properties of speech and are interpreted as evidence of compensation for gravitational effects.
The adjustments are likely to be interdependent, for example, in the supine body position, protrusion of
the mandible may help to counteract the gravitational pull on the tongue that reduces the pharyngeal
lumen.
Given the methodologies used in this study, it is not feasible to assert Kollara and Perry’s (2013)
findings that imaging data obtained in the supine body position can be translated to speech production in
the upright position. However, a major conclusion is that data obtained from one body position can be
generalized with caution to another body position; and that additional investigations are warranted on the
following issues:
(1) Determining if and how, children compensate for gravitational effects on the various
components of the vocal tract. The only published data for children pertain to velar function (Kollara &
Perry, 2013). Possibly, compensation for changes in orientation to gravitational field requires motor
control strategies that are developed with experience.
(2) Establishing the extent to which data from the vocal activities of speech and singing are
comparable to nonvocal activities such as rest breathing and swallowing. As indicated in the introduction,
somewhat different results have been reported for vocal versus nonvocal tasks. By virtue of their external

21
target of an acoustic product, vocal tasks may involve specialized strategies that may not be used in
nonvocal tasks.
(3) Determining if individuals with compromised sensory or motor function of the aerodigestive
tract are limited in compensation for changes in the gravitational field.
(4) Exploring the effect of body position on F3 using the rhotic consonant /r/ and related r-colored
vowels (such as the vowel in the General American pronunciation of the word bird). The acoustic marker
of /r/ and r-colored vowels is a marked decrease in F3 frequency; for example, the F3 for /r/ is about 80%
of the value averaged over a speaker’s vowels (Hagiwara, 1995; Hamilton, Boyce, Scholl, & Douglas,
2014). This phonetically specific lowering of F3, in combination with the variability of /r/ articulation
(Alwan, Narayanan, & Haker, 1997; Westbury, Hashi, & Lindstrom, 1998; Zhou et al., 2008), may be
useful in further determining the effects of body position on this particular formant.
This study using acoustic pharyngometry and measures of vowel acoustics shows that the vocal
tract configuration is affected by body position, presumably because of adjustments to orientation in the
gravitational field. Information on these adjustments is needed to allow comparisons of data obtained in
supine and upright positions, especially because imaging data often are obtained in the supine position.
22
Acknowledgments
This work was supported, in part, by National Institutes of Health (NIH) Grants R01 DC006282 from the
National Institute on Deafness and Other Communicative Disorders (NIDCD), and Core Grant P-30
HD0335 from the National Institute of Child Health and Human Development (NICHD). S.K. was a
former undergraduate student at the University of Wisconsin-Madison. We thank Carlyn Burris, Erin H.
Douglas, and Jennifer J. Lewandowski for assistance with data collection and analysis; Sevahn K.
Vorperian for Figure 1 photograph; also, Reid B. Durtschi, Daniel C. Reilly, Simon M. Lank and
Benjamin M. Doherty for assistance with figures.
23
References
Alwan, A., Narayanan, S., & Haker, K. (1997). Toward articulatory-acoustic models for liquid
approximants based in MRI and EPG data. Part II. The rhotics. Journal of the Acoustical Society
of America, 101, 1078-1089.
Bae, Y., Perry, J. L., & Kuehn, D. P. (2014). Videofluoroscopic investigation of body position on
articulatory positioning. Journal of Speech, Language, and Hearing Research, 57, 1135-1147.
Brown, I. B., McClean, P.A., Boucher, R., Zamel, N., & Hoffstein, V. (1987). Changes in pharyngeal
cross-sectional area with posture and application of continuous positive airway pressure in
patients with obstructive sleep apnea. American Review of Respiratory Disease, 136, 628-632.
Buchaillard, S., Perrier, P., & Payan, Y. (2009). A biomechanical model of cardinal vowel production:
Muscle activations and the impact of gravity on tongue positioning. Journal of the Acoustical
Society of America, 126, 2033-2051.
Burris, C., Vorperian, H. K., Fourakis, M., Kent, R. D., & Bolt, D. M. (2014). Quantitative and
descriptive comparison of four acoustic analysis systems: Vowel measurements. Journal of
Speech, Language, and Hearing Research, 57, 26–45. doi:10.1044/1092-4388(2013/12-0103)
Dietsch, A. M., Cirstea, C. M., Auer, E. T., Jr., & Searl, J. P. (2013). Effects of body position and sex
group on tongue pressure generation. International Journal of Oral Myology, 39, 12-22.
D'Urzo, A. D., Lawson, V. G., Vassal, K. P., Rebuck, A. S., Slutsky, A. S., Hoffstein, V. (1987). Airway
area by acoustic response measurements and computerized tomography. American Review of
Respiratory Disease, 135, 392-395.
D'Urzo, A. D., Rubinstein, I., Lawson, V. G., Vassal, K. P., Rebuck, A. S., Slutsky, A. S., Hoffstein, V.
(1988). Comparison of glottic areas measured by acoustic reflections vs. computerized
tomography. Journal of Applied Physiology, 64(1), 367-370.
24
Engwall, O. (2006). Assessing magnetic resonance imaging measurements: Effects of sustenation,
gravitation, and coarticulation. In J. Harrington & M. Tabain (Eds.), Speech production: Models,
phonetic processes, and techniques (pp. 301-314). New York: Psychology Press.
Fant, G., (1972). Vocal tract wall effects, losses, and resonance bandwidths. Speech Transmission
Laboratory Quarterly Progress and Status Reports, 13 (2-3), 28-52. Stockholm: KTH, Royal
Institute of Technology. http://ww.speech.kth.se/qpsr.
Fant, G., & Pauli, S. (1974). Spatial characteristics of vocal tract resonance modes. In G. Fant (Ed.),
Proceedings of Speech Communications Seminar: Speech communication, Vol. 2 (pp. 121-132).
Stockholm, SCS-74.
Ferguson, K.A., Cartwright, R., Rogers, R., & Schmidt-Nowara, W. (2006). Oral appliances for snoring
and obstructive sleep apnea: A review. Sleep, 29, 244-262.
Fitch, W.T., & Giedd, J. (1999). Morphology and development of the human vocal tract: A study using
magnetic resonance imaging. Journal of the Acoustical Society of America, 106, 1511-1522.
Fleischer, M., Pinkert, S., Mattheus, W., Mainka, A., & Murbe, D. (2014). Formant frequencies and
bandwidths of the vocal transfer function are affected by the mechanical impedance of the vocal
tract wall. Biomechanics and Modeling in Mechanobiology. Advance online publication. doi
10.1007/s10237-014-0632-2
Gelardi, M., Del Giudice, A. M., Cariti, F., Cassano, M., Farras, A. C., Fiorella, M. L., et al. (2007).
Acoustic pharyngometry: Clinical and instrumental correlations in sleep disorders. Brazilian
Journal of Otorhinolaryngology, 73(2), 257-265.
Hagiwara, Robert. (1995). Acoustic realizations of American /r/ as produced by women and men
(Working Papers in Phonetics No. 90). University of California, Los Angeles, Department of
Linguistics. Retrieved from: https://escholarship.org/uc/item/8779b7gq
25
Hamilton, S., Boyce, S., Scholl, L., & Douglas, K. (2014). An acoustic threshold for third formant in
American English. Journal of the Acoustical Society of America, 135, 2389.
Hodge, M., & Daniels, J. (2007). TOCS+ Intelligibility Measures. Edmonton, Alberta, Canada:
University of Alberta.
Hoffstein, V., & Fredberg, J. J. (1991). The acoustic reflection technique for non-invasive assessment of
upper airway area.. European Respiratory Journal, 4(5), 602-611.
Hoffstein, V., & Zamel, N. (1984). Tracheal stenosis measured by the acoustic reflection technique. The
American Review of Respiratory Disease, 130(3), 472-475.
Honda, K., Hirai, H., Masaki, S., & Shimada, Y. (1999). Role of vertical larynx movement and cervical
lordosis in F0 control. Language and Speech, 42, 401-411.
Jan, M. A., Marshall, I., & Douglas, N. J. (1994). Effect of posture on upper airway dimensions in normal
human. American Journal of Respiratory and Critical Care Medicine, 149, 145-148.
Jung, D. G., Cho, H. Y., Grunstein, R. R., & Yee, B. (2004). Predictive value of Kushida Index and
acoustic pharyngometry for the evaluation of upper airway in subjects with or without obstructive
sleep apnea. Journal of Korean Medical Science, 19(5), 662-667.
Kerwin, J. P. (1975). Weigtlessness: A case history. Acta Astronautica, 2, 85-87.
Kitamura, T., Takemoto, H., Honda, K., Shimada, Y., Fujimoto, I., Syakudo, Y., et al. (2005). Difference
in vocal tract shape between upright and supine postures: Observations by an open-type MRI
scanner. Acoustical Science and Technology, 26, 465-468.
Kollara, L., & Perry, J. L. (2014). Effects of gravity on the velopharyngeal structures in children using
upright magnetic resonance imaging. Cleft Palate-Craniofacial Journal, 51(6), 669-76.

26
Marshall, I., Maran, N. J., Martin, S., Jan, M. A., Rimmington, J. E., Best, J. J., et al. (1993). Acoustic
reflectometry for airway measurements in man: Implementation and validation. Physiological
Measurement, 14(2), 157-169.
Milenkovic, P. (2010). TF32, Time-frequency analysis software program for 32-bit Windows (Alpha).
Madison, WI: Author. Retrieved January 21, 2010 from http://userpages.chorus.net/cspeech/
Monahan, K., Kirchner, H. L., & Redline, S. (2005). Oropharyngeal dimensions in adults: Effect of
ethnicity, gender, and sleep apnea. Journal of Clinical Sleep Medicine, 1(3), 257-263.
Moon, J., & Canady, J. (1995). Effects of gravity on velopharyngeal muscle activity during speech. The
Cleft Palate-Craniofacial Journal, 32, 371-375.
Munson, B., & Solomon, N.P. (2004). The effect of phonological neighborhood density on vowel
articulation. Journal of Speech, Language, and Hearing Research, 47, 1048-1058.
Nakayama, E., Tohara, H., Hiraba, H., Sanpei, R., Wakasa, H., Ohno, S., et al. (2013). Effects of reclining
posture on velopharyngeal closing pressure during swallowing and phonation. Oral
Rehabilitation, 40, 450-456.
Nixon, C. W., & Waggoner, C. R. (1962). Speech during weightlessness (MLR Technical Documentary
Report 62-45). Wright-Patterson Air Force Base, Ohio.
Pae, E. K., Lowe, A. A., Sasaki, K., Price, C., Tsuchiya, M., & Fleetham, J.A. (1994). A cephalometric
and electromyographic study of upper airway structures in the upright and supine positions.
American Journal of Orthodontics and Dentofacial Orthopedics, 106, 52-59.
Perry, J. L. (2011). Variations in velopharyngeal structures between upright and supine positions using
upright magnetic resonance imaging. Cleft Palate-Craniofacial Journal, 48, 123-133
Perry, J. L., Bae, Y., & Kuehn, D. P. (2012). Effect of posture on deglutitive biomechanics in healthy
individuals. Dysphagia, 27, 70-80.

27
Shiller, D. M., Ostry, D. J., & Gribble, P. L. (1999). Effects of gravitational load on jaw
movements in speech. The Journal of Neuroscience, 19, 9073-9080.
Sleep Group Solutions. (2009). Acoustic Pharyngometer Operator Manual, 1-26. North Miami Beach,
Florida.
Smith, A., & Battagel, J. (2004). Non-apneic snoring and the orthodontist: Radiographic pharyngeal
dimension changes with supine posture and mandibular protrusion. Journal of Orthodontics, 31,
124-131.
Sonninen, A. (1968). The external frame function in the control of pitch in the human voice. Annals of the
New York Academy of Sciences, 155, 68-90.
Steiner, I., Richmond, K., Marshall, I., & Gray, C.D. (2012). The magnetic resonance imaging subset of
the mngu0 articulatory corpus. Journal of the Acoustical Society of America, 131, 106-111.
Stone, M., Stock, G., Bunin, K., Kumar, K., Epstein, M., Kambhamettu, C., Li, M., Parthasarathy, V., &
Prince, J. (2007). Comparison of speech production in upright and supine position. The Journal
of Acoustical Society of America, 122, 532-541.
Sutthiprapaporn, P., Tanimoto, K., Ohtsuka, M., Nagasaki, T., Iida, Y., & Katsumata, A. (2008).
Positional changes of oropharyngeal structures due to gravity in the upright and supine
body positions. Dentomaxillofacial Radiology, 37, 130-136.
Tiede, M. K., Masaki, S., & Vatikiotis-Bateson, E. (2000). Contrasts in speech articulation observed in
sitting and supine conditions. Proceedings of the 5th Speech Production Seminar, May 1-4, 2000,
Kloster Seeon, Bavaria, Germany (pp. 25-28).
Traser, L., Burdumy, M, Richter, B., Vicari, M., & Echtenach, M. (2013). The effect of supine and
upright position on vocal tract configurations during singing: A comparative study in professional
tenors. Journal of Voice, 27, 141-148.
28
Traser, L., Burdumy, M., Richter, B., Vicari, M., & Echternach, M. (2014). Weight-bearing MR imaging
as an option in the study of gravitational effects on the vocal tract of untrained subjects in singing
phonation. PLoS ONE, 9, e112405. doi: 10.1371/journal.pone.0112405
Van Holsbeke, C. S., Verhulst, S. L., Vos, W. G., De Backer, J. W., Vinchurkar, S. C., Verdonck, P. R.,
van Doorn, J.W.D., Nadjmi, N., & De Backer, W.A. (2014). Change in upper airway geometry
between upright and supine position during tidal nasal breathing. Journal of Aerosol Medicine
and Pulmonary Drug Delivery, 27, 51-57.
Vorperian, H.K. (2013). VTLab acoustic pharyngometry (APh) protocol. (Last updated January 15, 2014)
Waisman Center, University of Wisconsin-Madison.
http://www.waisman.wisc.edu/vocal/links.html
Vorperian, H.K., Wang, S., Chung, M.K., Schimek, E.M., Durtschi, R.B., Kent, R.D., Ziegert, A.J., &
Gentry, L.R. (2009). Anatomic development of the oral and pharyngeal portions of the vocal
tract: An imaging study. Journal of the Acoustical Society of America, 125, 1666-1678.
Weir, A. D., McCutcheon, M. J., & Flege, J. E. (1993). A comparison of formant frequencies for vowels
pronounced in the supine and upright positions. Proceedings of the 12th Southern Biomedical
Engineering Conference (pp. 188-190). doi: 10.1109/SBEC.1993.247406
Westbury, J. R., Hashi, M., & Lindstrom, M. J. (1998). Differences among speakers in lingual articulation
for American English /ɹ/. Speech Communication, 26, 203-226.
Wrench, A., Cleland, H., & Scobbie, J.M. (2011). An ultrasound protocol for comparing tongue contours:
Upright vs. supine. In W. S. Lee & E. Zee, Proceedings of the 17th International Congress of
Phonetic Sciences, Hong Kong (pp. 17-21). www.icphs2011.hk
Xue, A., Jiang, J., Lin, E., Glassenberg, R., & Mueller, P. B. (1999). Age-related changes in human vocal
tract configurations and the effects on speakers' vowel formant frequencies: A pilot study.
Logopedics Phoniatrics Vocology, 24, 132-137.
29
Xue, S. A. , & Hao, J. G. (2006). Normative standards for vocal tract dimensions by race as measured by
acoustic pharyngometry. Journal of Voice, 20(3), 391-400.
Xue, S. A., Kaine, L., & Ng, M. L. (2010). Quantification of vocal tract configuration of older children
with Down syndrome: A pilot study. International Journal of Pediatric Otorhinolaryngology, 74,
378-383.
Yildirim, N. Fitzpatrick, M., Whyte, K., Jalleh, R., Wightman, A., & Douglas, N. (1991). The effect of
posture on upper airway dimensions in normal subjects and in patients with the sleep
apnea/hypopnea syndrome. American Review of Respiratory Disorders, 144, 845-847.
Zhou, X., Espy-Wilson, C. Y., Boyce, S., Tiede, M., Holland, C., & Choe, A. (2008). A magnetic
resonance imaging-based articulatory and acoustic study of “retroflex” and “bunched” American
English /r/. Journal of the Acoustical Society of America, 123, 4466-4481.
30
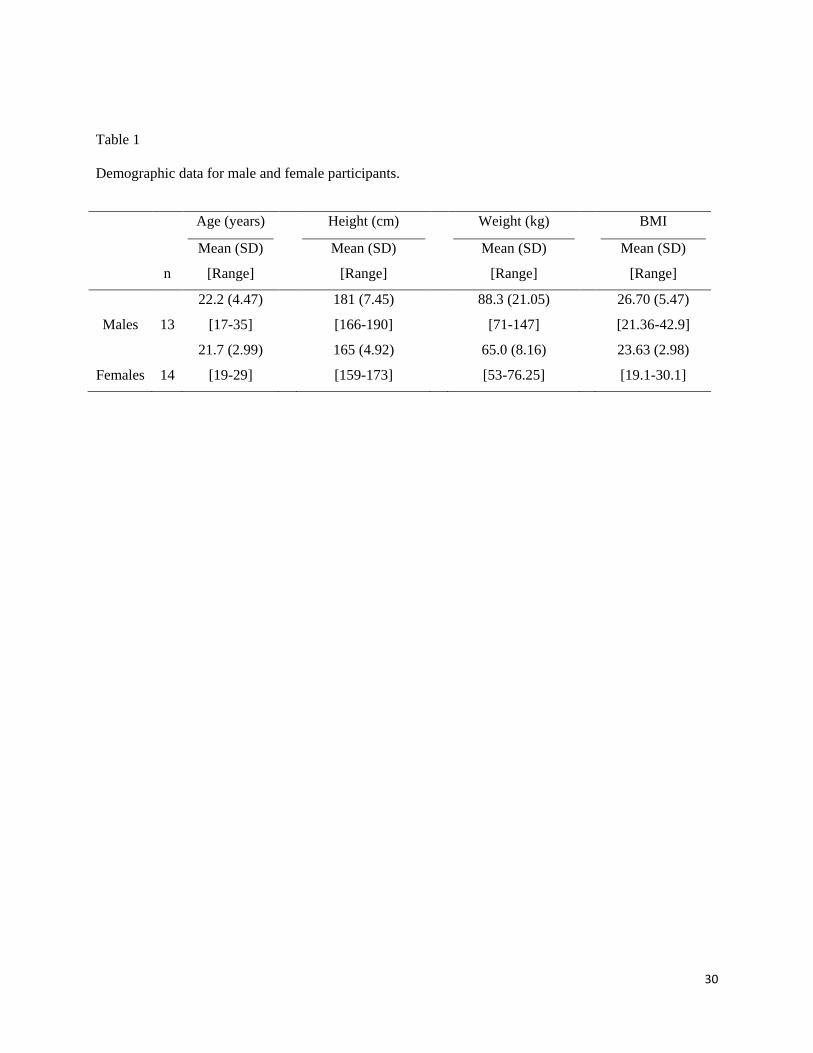
Table 1
Demographic data for male and female participants.
n
Age (years)
Mean (SD)
[Range]
Height (cm)
Mean (SD)
[Range]
Weight (kg)
Mean (SD)
[Range]
BMI
Mean (SD)
[Range]
Males 13
22.2 (4.47)
[17-35]
181 (7.45)
[166-190]
88.3 (21.05)
[71-147]
26.70 (5.47)
[21.36-42.9]
Females 14
21.7 (2.99)
[19-29]
165 (4.92)
[159-173]
65.0 (8.16)
[53-76.25]
23.63 (2.98)
[19.1-30.1]
31
Appendix
Appendix A: Stimuli for speech recordings.
Vowel
/i/ /u/ /a/ /ae/
Stimulus bee
feet
sheep
*bead
*eat
boo
shoe
zoo
*hoot
*boot
dot
hop
top
*hot
*pot
bath
cat
sad
*bat
*hat
*Word presented twice
32
Appendix B: Inter-rater reliability: Paired t-test results of first-to-fourth formant frequency measurements
(F1-F4) by two trained assistants, evaluated by sex and body position.
Males Females
Formant t (df=28) p-value t (df=41) p value
Upright
F1 -1.12 0.272 -1.51 0.0139
F2 1.96 0.061 0.07 0.947
F3 -1.217 0.234 0.193 0.848
F4 -0.787 0.439 -0.615 0.542
t (df=40) p-value t (df=40) p-value
Supine
F1 -0.34 0.738 -0.85 0.402
F2 2.44 0.019 -1.38 0.177
F3 -1.12 0.270 -0.037 0.971
F4 0.57 0.575 0.643 0.525

33
Appendix C: Results of mixed effects models for six acoustic pharyngometry (APh) length and volume
measurements. All models included a random effect for subject. N=27 subjects (14 female, 13 male), with
2 observations per subject (2 positions). Vocal Tract Length-APh (VTL-APh) = Oral Cavity Length-APh
(OCL-APh) + Pharyngeal Cavity Length-APh (PCL-APh); Vocal Tract Volume-APh (VTV-APh) = Oral
Cavity Volume-APh (OCV-APh) + Pharyngeal Cavity VolumeAPh (PCV-APh).
Sex Body Position Sex x Body Position
Variable F(1,25) p-value F(1,25) p-value F(1,25) p-value
VTL-APh 31.46 <0.0001* 2.65 0.1162 0.01 0.9097
OCL-APh 8.15 0.0085 6.50 0.0173 0.81 0.3772
PCL-APh 14.33 0.0009* 7.72 0.0102 0.38 0.5442
VTV-APh 14.86 0.0007* 79.62 <0.0001* 2.45 0.1302
OCV-APh 1.37 0.2532 25.66 <0.0001* 0.04 0.8513
PCV-APh 19.88 0.0002* 22.95 <0.0001* 2.52 0.1249
* Significant at Bonferroni-adjusted alpha level, p = .0083.
34
Appendix D: Results of F-tests for fixed effects in mixed effects models for the eight speech acoustics
variables: Fundamental frequency (F0); first-to-fourth formant frequencies (F1-F4); second and third
formant bandwidths (B2-B3); Euclidean distance from centroid in F1-F2-F3 space (EucDist). Models
were fit using an unstructured covariance matrix to account for within-subject correlation and unequal
variance by vowel and position. Denominator df were estimated using the Kenward-Roger method. N=27
subjects, with 8 observations per subject (2 positions x 4 vowels). There were 5 missing data points for
B2.
Sex Body Position Vowel Type Sex x Body
Position
Variable F(1,25) p-value F(1,25) p-value F(3,23) p-value F(1,25) p-value
F0 342.98 <0.0001* 18.04 0.0003* 35.14 <0.0001* 0.17 0.6825
F1 112.45 <0.0001* 7.31 0.0122 444.91 <0.0001* 0.07 0.7994
F2 93.89 <0.0001* 1.96 0.1735 450.02 <0.0001* 0.52 0.4757
F3 90.05 <0.0001* 35.65 <0.0001* 89.02 <0.0001* 0.49 0.4919
F4 177.09 <0.0001* 0.64 0.4327 55.49 <0.0001* 2.45 0.1300
B21 35.83 <0.0001* 0.02 0.8914 4.02 <0.0194 2.46 0.1296
B3 0.32 0.5766 0.02 0.8995 18.99 <0.0001* 3.31 0.0810
EucDist 12.88 0.0014* 26.02 <0.0001* 464.77 <0.0001* 0.09 0.7668
Sex x Vowel Type
Body Position x
Vowel Type
Sex x Body Position x
Vowel Type
Variable F(3,23) p-value F(3,23) p-value F(3,23) p-value
F0 0.22 0.8807 2.07 0.1315 1.34 0.2867
F1 9.06 0.0004* 4.01 0.0197 1.00 0.4118
F2 12.12 <0.0001* 10.43 0.0002* 0.44 0.7287
F3 1.70 0.1954 2.57 0.0787 1.92 0.1543
F4 8.42 0.0006* 0.64 0.5981 3.26 0.0399
B21 5.17 0.0070 0.10 0.9608 0.76 0.5300
B3 1.97 0.1459 0.10 0.9583 1.66 0.2033
EucDist 9.13 0.0004* 5.31 0.0063* 0.76 0.5261
* Significant at Bonferroni-adjusted alpha level p = .0063
1 B2 estimates for denominator df (DDF) differed due to 5 missing observations:
Body Position, Sex x Body Position: DDF = 24.5
Vowel Type, Sex x Vowel Type: DDF = 23.2
Position x Vowel Type, Sex x Body Position x Vowel Type: DDF = 22.8
35
Appendix E: Average within-subject standard deviations by sex, vowel, and body position for F0, F1-F4.
Differences are caclulated as supine SD – upright SD.
F0 SD
Sex Vowel Upright Supine Difference
F a 11.50 6.95 -4.55
ae 7.59 10.79 3.19
i 8.68 7.40 -1.28
u 8.68 9.68 0.99
M a 8.67 5.81 -2.86
ae 4.91 5.90 0.99
i 5.56 5.32 -0.23
u 6.97 7.33 0.36
F1 SD F2 SD
Sex Vowel Upright Supine Difference Upright Supine Difference
F a 45.05 47.92 2.88 62.43 47.22 -15.21
ae 65.54 70.56 5.02 67.33 99.97 32.64
i 22.07 18.51 -3.56 85.14 107.46 22.32
u 21.40 18.08 -3.32 280.74 284.96 4.22
M a 25.12 29.44 4.32 56.96 52.29 -4.67
ae 29.96 37.32 7.35 43.19 56.59 13.40
i 15.25 14.62 -0.63 73.36 65.68 -7.68
u 20.12 19.07 -1.05 227.13 233.16 6.03
F3 SD F4 SD
Sex Vowel Upright Supine Difference Upright Supine Difference
F a 84.26 98.97 14.71 144.75 165.01 20.27
ae 82.42 82.24 -0.18 135.98 114.52 -21.46
i 114.00 127.84 13.84 93.53 71.25 -22.28
u 89.34 93.80 4.46 122.94 128.46 5.52
M a 54.03 81.65 27.62 119.54 175.03 55.49
ae 85.73 85.39 -0.33 165.72 166.76 1.04
i 88.20 100.82 12.61 100.99 216.04 115.05
u 79.03 91.28 12.25 119.25 116.32 -2.93
36
Figure Captions:
Figure 1. The Acoustic Pharyngometry system consisting of the mouthpiece (A), wave tube (B),
electronic platform (C), control unit/microcomputer (D), monitor (E), and keyboard controls (F). The top
half of the monitor display shows a slow exhale condition pharyngogram superimposed with a nose
exhale condition pharyngogram. The bottom half of the monitor shows the four different pharyngograms
per participant that the system can hold so that each can be superimposed on any of the other
pharyngograms to determine consistency of the same exhale condition, or to locate landmarks as
described in Figure 2.
Figure 2. A visual representation of the anatomic measures on a pharyngoram (bottom) with
corresponding anatomic landmarks on a midsagittal CT scan (top). The CT is for illustrative purposes and
representative of normal breathing, not any of the APh breathing conditions. The bottom display is a
schematic of three pharyngograms displaying the three different breathing conditions superimposed to
illustrate how the nasal and modified valsalva pharyngograms are respectively used to locate the oral-
pharyngeal junction (OPJ) and the glottis on the slow exhale pharyngogram.
Figure 3: Box plots of acoustic pharyngometry (APh) data for length (left figure) and volume (right
figure) for the vocal tract (VT), oral cavity (OC) and pharyngeal cavity (PC) in males (M) and females (F)
in the upright (no fill) and supine (hashed) body positions. The upper and lower bounds of the box are the
75th and 25th percentiles respectively. The solid black line represents the mean; and the solid gray line
represents the median. The upper and lower whiskers represent the 90th and 10th percentiles respectively,
with the black dots and gray diamonds representing outlying data for males and females respectively.
Asterisk denotes significance for body position.

37
Figure 4. Scatterplots of the acoustic variables with significant effects for body position: F0 main effect
(top panel), F3 main effect (lower panel), and F2 interaction effect (middle panel; also used for
calculating Euclidean distance with main effect). The diagonal solid lines (y = x) indicate the
reference of perfect consistency between the two body positions.
Figure 5. 3D display of the vowel quadrilateral using the first three formants, as well as the 3D Euclidean
distance from the centroid to each of the corner vowels in the F1-F2-F3 vowel acoustic space for male
speakers (left) and female speakers (right).


Related Documents