Australian Journal of Commerce Study SCIE Journals Australian Society for Commerce Industry & Engineering www.scie.org.au 50 Effect of Alphabetical Ballot Ordering on Voting Behaviour: The Case of Mauritius Muzzammil Hosenally 1* Nashad Auchoybur 2 1. Department of Economics and Statistics, University of Mauritius, Reduit 2. Department of Economics and Statistics, University of Mauritius, Reduit * E-mail of the corresponding author: [email protected] Abstract This paper examines the effect of Ballot Paper Ordering on the vote share of candidates at the General Elections in Mauritius. General linear regression was applied to the results of the 2010 National Assembly Elections. Several explanatory variables were considered, including the rank of the candidate on the ballot paper. The beta coefficient associated with the latter variable was found to be statistically significant and suggests that alphabetical ballot paper ordering can negatively affect the vote share of candidates appearing at later stages on the ballot. With the objective to improve fairness during elections and promote democracy, we recommend that the order in which candidates‟ names appear on the ballot paper should be on a rotational basis instead of the actual alphabetical order. Keywords: Ballot Paper Ordering, Linear Regression 1. Introduction And Background 1.1. Introduction Often referred to as „Donkey voting‟ in the electoral jargon, the ordering of a candidate on the ballot paper has long sought to influence the voter‟s choice during elections. Theories behind human behaviour suggest that in the absence of an a priori decision before going to the polls, voters have a tendency to choose a candidate whose name appears earlier on the ballot paper. A recent paper published by the „Parlimentary Affairs‟ of the United Kingdom revealed how alphabetical ballots advantaged candidates whose surnames appeared „at or near the top of the ballot paper‟. The authors (Webber et al, 2014) analyzed results across several elections and reported that in 2011, 161 candidates were elected, to some extent, as a result of alphabetical ballot. While several authors have pondered over the effect of ballot paper ordering, Joanne Miller and Jon Krosnick‟s (1988) work on “The impact of candidate name order on election outcomes” is most cited in the literature. The authors argued that voters who, in a way, feel obliged to cast a vote following several campaigns on „the duty of the citizen‟, “may be influenced by the order in which candidates‟ names appear on the ballot” and thus giving advantage to the candidate whose name is listed first on the ballot. Using data from the 1992 state legislative elections in Ohio, the authors showed that the candidates listed first on the ballot obtained on average 2.5% of votes more than those listed after. Miller and Krosnick (1988) believed that it is just a natural human behaviour to choose the first answer given many possibilities. In the absence of information about the candidates nominated for an election, voters have a tendency to shift to other decision making criteria such as association with a candidate‟s name and if a decision is still not yet reached, ballot order comes into consideration (King and Leigh, 2009). The „Theory of Donkey Voting‟ is consistent with various phenomena which involve cases where the human being is confronted with a set of choice. As cited by Cronbach (1950) in Regan (2012), students are biased towards choosing the first option from multiple choice questions when they are uncertain about the right answer. Other experiments include cases where consumers are asked to state their favourite beer, where Coney (1977) and Dean (1980) show that the respondents are biased towards the one appearing first on the list. Koppell and Steen (2004) as cited in Amy King and Andrew Leigh (2009) refer to the ballot order effect as „recency effect‟ and „primary effect‟. Ho and Imai (2008) as cited in Amy King and Andrew Leigh (2009) showed that candidates listed first on the ballot paper increased their votes by approximately 3.3 percent during „nonpartisan‟ elections while candidates listed first during the first tour of Presidential elections increased their share of votes

Welcome message from author
This document is posted to help you gain knowledge. Please leave a comment to let me know what you think about it! Share it to your friends and learn new things together.
Transcript
Australian Journal of Commerce Study SCIE Journals
Australian Society for Commerce Industry & Engineering www.scie.org.au
50
Effect of Alphabetical Ballot Ordering on Voting Behaviour:
The Case of Mauritius
Muzzammil Hosenally1* Nashad Auchoybur2 1. Department of Economics and Statistics, University of Mauritius, Reduit 2. Department of Economics and Statistics, University of Mauritius, Reduit
* E-mail of the corresponding author: [email protected] Abstract
This paper examines the effect of Ballot Paper Ordering on the vote share of candidates at the General Elections in Mauritius. General linear regression was applied to the results of the 2010 National Assembly Elections. Several explanatory variables were considered, including the rank of the candidate on the ballot paper. The beta coefficient associated with the latter variable was found to be statistically significant and suggests that alphabetical ballot paper ordering can negatively affect the vote share of candidates appearing at later stages on the ballot. With the objective to improve fairness during elections and promote democracy, we recommend that the order in which candidates‟ names appear on the ballot paper should be on a rotational basis instead of the actual alphabetical order. Keywords: Ballot Paper Ordering, Linear Regression 1. Introduction And Background 1.1. Introduction
Often referred to as „Donkey voting‟ in the electoral jargon, the ordering of a candidate on the ballot paper has long sought to influence the voter‟s choice during elections. Theories behind human behaviour suggest that in the absence of an a priori decision before going to the polls, voters have a tendency to choose a candidate whose name appears earlier on the ballot paper. A recent paper published by the „Parlimentary Affairs‟ of the United Kingdom revealed how alphabetical ballots advantaged candidates whose surnames appeared „at or near the top of the ballot paper‟. The authors (Webber et al, 2014) analyzed results across several elections and reported that in 2011, 161 candidates were elected, to some extent, as a result of alphabetical ballot. While several authors have pondered over the effect of ballot paper ordering, Joanne Miller and Jon Krosnick‟s (1988) work on “The impact of candidate name order on election outcomes” is most cited in the literature. The authors argued that voters who, in a way, feel obliged to cast a vote following several campaigns on „the duty of the citizen‟, “may be influenced by the order in which candidates‟ names appear on the ballot” and thus giving advantage to the candidate whose name is listed first on the ballot. Using data from the 1992 state legislative elections in Ohio, the authors showed that the candidates listed first on the ballot obtained on average 2.5% of votes more than those listed after. Miller and Krosnick (1988) believed that it is just a natural human behaviour to choose the first answer given many possibilities. In the absence of information about the candidates nominated for an election, voters have a tendency to shift to other decision making criteria such as association with a candidate‟s name and if a decision is still not yet reached, ballot order comes into consideration (King and Leigh, 2009). The „Theory of Donkey Voting‟ is consistent with various phenomena which involve cases where the human being is confronted with a set of choice. As cited by Cronbach (1950) in Regan (2012), students are biased towards choosing the first option from multiple choice questions when they are uncertain about the right answer. Other experiments include cases where consumers are asked to state their favourite beer, where Coney (1977) and Dean (1980) show that the respondents are biased towards the one appearing first on the list. Koppell and Steen (2004) as cited in Amy King and Andrew Leigh (2009) refer to the ballot order effect as „recency effect‟ and „primary effect‟. Ho and Imai (2008) as cited in Amy King and Andrew Leigh (2009) showed that candidates listed first on the ballot paper increased their votes by approximately 3.3 percent during „nonpartisan‟ elections while candidates listed first during the first tour of Presidential elections increased their share of votes
Australian Journal of Commerce Study SCIE Journals
Australian Society for Commerce Industry & Engineering www.scie.org.au
51
by approximately 2 to 4 percent. The special characteristic of the Australian vote that a fine is imposed on the person who does not vote makes it worth giving due consideration to the concept of „donkey voting‟ in that country. Being levied a fine on citizens who do not vote, this obligation to vote is believed to increase the ballot order effect and Mackerras (1970) showed that political parties firmly believed in the capacity of ballot paper ordering to influence the elections to such an extent that they “would choose candidates with surnames early in the alphabet”. Several studies such as Kelley and McAllister‟s “Ballot Paper Cues and the Vote in Australia and Britain”‟ (1984) compelled Australian authorities to shift from alphabetical ordering of candidates‟ name to random ordering. Kelley and McAllister used data from 1974, 1977 and 1980 Australian federal elections and 1974 British elections to show that „having a surname in the first third of the alphabet was worth an addition of 1.3 percentage points for Australian candidates but had no effect on candidates in the British election.‟ (King and Leigh, 2009). Robson and Walsh (1974) established strong relationship between the fact being listed first on the ballot favours the candidate appearing first on the ballot paper, in particular, those candidates within political parties which have presented more than one candidate at the elections. The study was based on the Irish 1973 General Elections. Ned Augenblick and Scott Nicholson (2012) found that while being faced with several options before a choice pushes the decision maker to shift to a „shortcut‟ while making a choice. Thus, as a result of „choice fatigue‟, in an election, voters are influenced and choose candidates whose names are listed first on the ballot paper. 1.2. The Mauritian Context
Mauritius is small Republic Island of approximately 2040 km2 located off the south coast of the African continent. On 12 March 1968, the Island shifted from a state of British colonization to a state of independence and later in 1992, moved to the state of Republic. Its parliamentary democracy is based on an adapted Westminster First Past the Post (FPP) system to ensure the representation of multi-ethnic societies which is a dissociable reality of the demographic characteristic of its inhabitants. The elections for members of the National Assembly are held every five years whereby three (3) members from each of the 20 constituencies of the mainland (Mauritius) and two members from the 21st constituency (Rodrigues Island) are elected. Moreover, to ensure representativeness of minorities within the composition of the Parliamentary, the constitution of Mauritius makes provision for eight additional seats using the controversial Best Loser System. The history of Mauritian elections is dominated by the coalition of parties into two major alliances generally grabbing more than 90% of the total vote casts (91.7% in 2010). However, alliances vary across time, not necessarily constituting of same parties at each election. The National Assembly Elections Regulations 1968 which sets the legal framework for the concerned elections also makes provision for the printing of ballot papers. Section 19, through form 6, ensures that “The candidates shall be listed from top to bottom in alphabetical order.” The year 2013 was marked by the announcement of the government leader to present a „white paper‟ on electoral reforms, the obligation to declare ethnic belonging at the legislative elections being the bone of contention between major political parties, NGOs and associations. The latter principle was deemed to be in contradiction to article 25 of the International Covenant on Civil and Political Rights by the Commission of the Human Rights and thus pushed the government to come forward with promises that electoral reform would be initiated through the publication of a „White Paper‟. 2. Materials and Methods
2.1. The Data and Relevance of Variables
The data was taken from the results of the 2010 Mauritian National Elections published on the official website of the Electoral Supervisory Commission containing the name of the candidate, party from which the candidate comes from, community belonging, total number of votes obtained and corresponding percentage. In total, 529 candidates ran for office in 2010 within the 21 constituencies of the Republic. However, only candidates from the mainland (i.e. Mauritius) were considered for the purpose of the analysis given that the voting behaviour in Rodrigues is relatively different and thus bringing down the total number of observations to 519. In each constituency, the data was rearranged in alphabetical order of candidate name in order to enable
Australian Journal of Commerce Study SCIE Journals
Australian Society for Commerce Industry & Engineering www.scie.org.au
52
giving a rank starting from one to 𝑛, where n represents the number of candidates in the respective constituency. Obviously, the latter varies from constituency to constituency. Ignoring Rodrigues Island (Constituency number 21, where only 10 candidates competing for office), the mainland, Mauritius, had on average 26 candidates per constituency, with a corresponding standard deviation of 6.3. The categorical variable „party‟ was coded as one, two, three and four representing the alliance PTR-PMSD-MSM, MMM-UN-MMSD, FSM and others respectively. Other parties account for a very low percentage of total vote casts and it would be useless to code each party separately as this does affect the overall final results of this study. Incumbency is one of the aspects which have been thoroughly studied at an election, and the Mauritian legislative elections were not spared from this phenomenon. In fact, an important characteristic of the Mauritian General Elections is the presence of a „leader‟ in each constituency. Although the three candidates who gather higher percentage of vote casts are all elected to the represent the people at the Parliamentary, an additional variable identifying these constituency leaders is added to the data. The reason for this is that these „traditional constituency leaders‟ have, across the years, developed a certain power and popularity within these localities and the percentage of votes they gain is often much higher than their acolytes. (Citing a few, Anil Baichoo, Arvind Boolell, Navin Ramgoolam, Rajesh Bhagwan, Paul Berenger etc.) While Mauritius is reputed for being multi-cultural and multi-ethnic Island, the demographic characteristics of the candidates are among the most determining, if not the most determining factor for the percentage of vote casts a candidate at the elections would get. The present electoral system obliges the candidate to state the community to which he/her belongs. The „official‟ communities for the purpose of elections are the Hindus, General Population, Muslims and Sino Mauritian. Thus, another variable „community‟ was coded as one, two, three and four to represent the Hindus, General Population, Muslims and Sino Mauritians respectively in the model. 2.2. Model Formulation
Cause and effect relationships are often investigated using simple linear regression. The dependent variable (or response) is regressed on a single explanatory variable using past data and the fitted regression model is used to predict values of the response based on the explanatory variable. Parameter estimates of α and β in the regression model shown below are obtained using the Method of Least Squares (Or alternatively Maximum Likelihood Estimation):
𝒚𝒊 = 𝜶 + 𝜷𝒙𝒊 + 𝒆𝒊, (1)
𝑤𝑒𝑟𝑒 𝑒𝑖~𝑁(0, 𝜎2) 𝑖. 𝑒. 𝑡𝑒 𝑒𝑟𝑟𝑜𝑟 𝑡𝑒𝑟𝑚𝑠 𝑎𝑟𝑒 𝑎𝑠𝑠𝑢𝑚𝑒𝑑 𝑡𝑜 𝑏𝑒 𝑛𝑜𝑟𝑚𝑎𝑙𝑙𝑦 𝑑𝑖𝑠𝑡𝑟𝑖𝑏𝑢𝑡𝑒𝑑 𝑤𝑖𝑡 𝑚𝑒𝑎𝑛 0 𝑎𝑛𝑑 𝑐𝑜𝑛𝑠𝑡𝑎𝑛𝑡 𝑣𝑎𝑟𝑖𝑎𝑛𝑐𝑒 In many situations, the response variable which is of interest is not explained by a single explanatory variable but several independent ones. The simple linear model is then easily extended to accommodate more than one explanatory variable. Multiple linear regression has the flexibility of accommodating explanatory variables which are categorical in nature. However, the latter technique has got numerous assumptions to be satisfied before ensuring that the model can be used to make predictions, namely that error terms are assumed to be normally distributed with mean zero and constant variance, linear relationship is assumed to exist between the response and explanatory variables, absence of both multicollinearity and heteroscedasticity, among others. Multiple linear regression was, coupled with simple descriptive analysis, used to assess the effect of ballot paper ordering on the proportion of votes a candidate gathers at the elections. Four variations of the response variable were considered, namely the candidates‟ actual vote count, the candidates‟ share of votes expressed as the proportion of votes obtained out of the total number of votes in their respective constituencies plus their corresponding natural logarithms. Fitting a model which attempts to explain the vote share of candidates without interaction terms would simply be inadequate in a Mauritian context. Quoting William Turner‟s famous „Birds of a feather flock together‟ in a translated version, Mauritians, as well as several nations across the world have a tendency to regroup themselves depending on the community to which they belong. A clear-cut example is the high presence of the Muslim and Chinese community in constituency number two. (Port Louis South and Port Louis Central) or constituency number three (Port Louis Maritime and Port Louis East). Moreover, it is common knowledge that parties at an election would never postulate, for instance, a member from the Hindu community in constituencies where Muslims reside in majority. Raj
Australian Journal of Commerce Study SCIE Journals
Australian Society for Commerce Industry & Engineering www.scie.org.au
53
Mathur pointed out that: ‘National political parties do sponsor Muslim candidates in areas where that community constitutes a
sizeable section of the population and one or two Chinese candidate(s) in a Port Louis constituency
where the Chinese represent an important ethnic group. Parties, however, go much further in their
choice of candidates for particular constituencies.’
In figures, the last time that a Non-Muslim candidate was elected in constituency number 3 dates back to 1967, where a member from Sino Mauritian was elected. Thus, the presence of an interaction term between community and constituency is fully justified. Throughout the years, political parties have established their „bastion‟ within several constituencies. As an example, the constituency in which the present leader of the opposition was elected is known to be one where candidates from the Left Socialist political party or an alliance involving the latter are generally elected. As an indication, since 1976, all three candidates elected first past the post (excluding those elected through „best loser system‟) were part of either an alliance/party in which the MMM was involved. Thus, the interaction term between constituency and party is fully justified here. The intent of this paper being to evidence the effect of alphabetical ballot ordering and given the varying nature of constituencies, it is deemed worthwhile to include an interaction term between these two variables in the model. Thus, the proposed initial model is as follows:
𝒀 = 𝑿𝜷 + 𝜺 (2) Where: Y is an n-dimensional column vector that vertically lists the y values, representing either the count of votes or the proportion of votes or eventually, the log transformed proportion of votes (natural logarithms) The X matrix is a matrix in which each row gives the x-variable data for a different observation. The first column equals 1 for all observations and the subsequent columns represent the following variables. 𝑋1 𝑖𝑠 𝑡𝑒 𝑚𝑎𝑖𝑛 𝑒𝑓𝑓𝑒𝑐𝑡 𝑜𝑓 𝑝𝑎𝑟𝑡𝑦
𝑋2 𝑖𝑠 𝑡𝑒 𝑚𝑎𝑖𝑛 𝑒𝑓𝑓𝑒𝑐𝑡 𝑜𝑓 𝑐𝑜𝑚𝑚𝑢𝑛𝑖𝑡𝑦
𝑋3 𝑖𝑠 𝑡𝑒 𝑚𝑎𝑖𝑛 𝑒𝑓𝑓𝑒𝑐𝑡 𝑜𝑓 𝑒𝑎𝑑
𝑋4 𝑖𝑠 𝑡𝑒 𝑚𝑎𝑖𝑛 𝑒𝑓𝑓𝑒𝑐𝑡 𝑜𝑓 𝑐𝑜𝑛𝑠𝑡𝑖𝑡𝑢𝑒𝑛𝑐𝑦
𝑋5 𝑖𝑠 𝑚𝑎𝑖𝑛 𝑒𝑓𝑓𝑒𝑐𝑡 𝑜𝑓 𝑟𝑎𝑛𝑘𝑖𝑛𝑔 𝑜𝑓 𝑏𝑎𝑙𝑙𝑜𝑡 𝑝𝑎𝑝𝑒𝑟 𝑋1𝑋4 𝑖𝑠 𝑡𝑒 𝑖𝑛𝑡𝑒𝑟𝑎𝑐𝑡𝑖𝑜𝑛 𝑏𝑒𝑡𝑤𝑒𝑒𝑛 𝑝𝑎𝑟𝑡𝑦 𝑎𝑛𝑑 𝑐𝑜𝑛𝑠𝑡𝑖𝑡𝑢𝑒𝑛𝑐𝑦 𝑋2𝑋4 𝑖𝑠 𝑡𝑒 𝑖𝑛𝑡𝑒𝑟𝑎𝑐𝑡𝑖𝑜𝑛 𝑏𝑒𝑡𝑤𝑒𝑒𝑛 𝑐𝑜𝑚𝑚𝑢𝑛𝑖𝑡𝑦 𝑎𝑛𝑑 𝑐𝑜𝑛𝑠𝑡𝑖𝑡𝑢𝑒𝑛𝑐𝑦 𝑋4 𝑋5 𝑖𝑠 𝑡𝑒 𝑖𝑛𝑡𝑒𝑟𝑎𝑐𝑡𝑖𝑜𝑛 𝑡𝑒𝑟𝑚 𝑏𝑒𝑡𝑤𝑒𝑒𝑛 𝑐𝑜𝑛𝑠𝑡𝑖𝑡𝑢𝑒𝑛𝑐𝑦 𝑎𝑛𝑑 𝑟𝑎𝑛𝑘 Given the creation of dummy variables to cater for categorical variables, a single variable listed above may represent several columns, for instance, 𝑋2, which is the main effect of community consists of three columns since 3 dummy variables are created given that the variable takes 4 original values (1=Hindu, 2=Christian, 3=Muslim, 4=Sino-Mauritian). 2.3. Mutlicollinearity One of the assumptions of multiple linear regression, as mentioned above, is that multicollinearity should not be present in the fitted model. Multicollinearity occurs when explanatory variables are related to each other, possible consequences being that parameters are wrongly estimated, leading to wrong interpretations (See for instance, Belsley and Kuh, 1980). Variance Inflation Factors (VIF) are often used to determine the level of collinearity present between explanatory variables, but the statistic is not applicable to cases where the response variables are categorical. Thus, Pearson‟s Chi-Squared statistics were used to determine the level of association present between explanatory variables in cases where VIF was not appropriate. 3. Results and Discussions
3.1. Exploratory Data Analysis
Out of the 20 constituencies of the mainland, we note that 9 of them (42.9%) produced final results containing a candidate with surnames starting with either the alphabet “A” or “B” at the head. This
Australian Journal of Commerce Study SCIE Journals
Australian Society for Commerce Industry & Engineering www.scie.org.au
54
observation cannot be regarded as a mere coincidence. If the first letter of the candidate‟s surname was not an issue, this percentage would turn out to be roughly in the region of 7-8%, calculated as (100 ×2
13) assuming that the distribution of surname‟s first letter is uniform (which is not the case, discussed
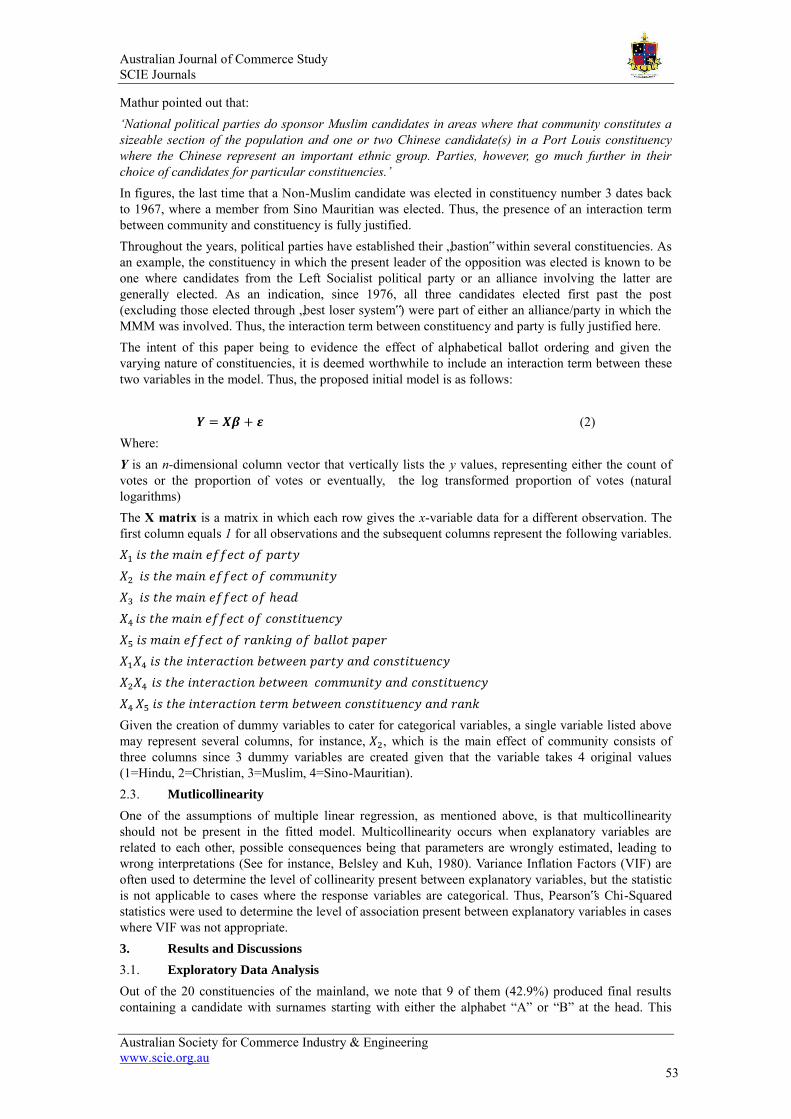
in conclusions). Figure 1 below shows the scatter plot between vote share obtained by candidates (calculated as the number of votes obtained divided by the total number of vote casts in their respective constituency) versus the rank of the candidate as the name appeared on the ballot. The fitted regression line (assuming a linear relationship) suggests that as rank increases, the proportion of votes for the candidate tends to decrease. This is an indication that ballot paper ordering could have an effect of the share of votes obtained by the candidates. It should be noted that for this scatter plot, candidates with vote share less than 10% were ignored.
Figure 1: Scatter plot between vote share versus candidate’s rank on ballot
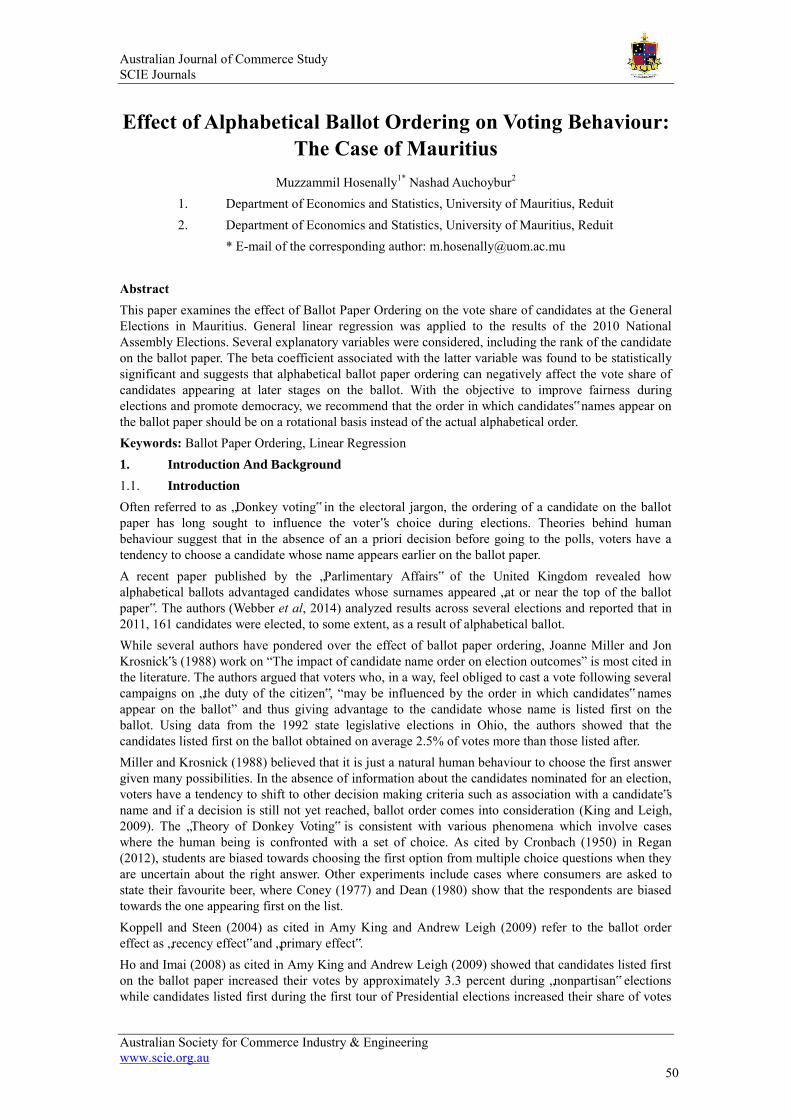
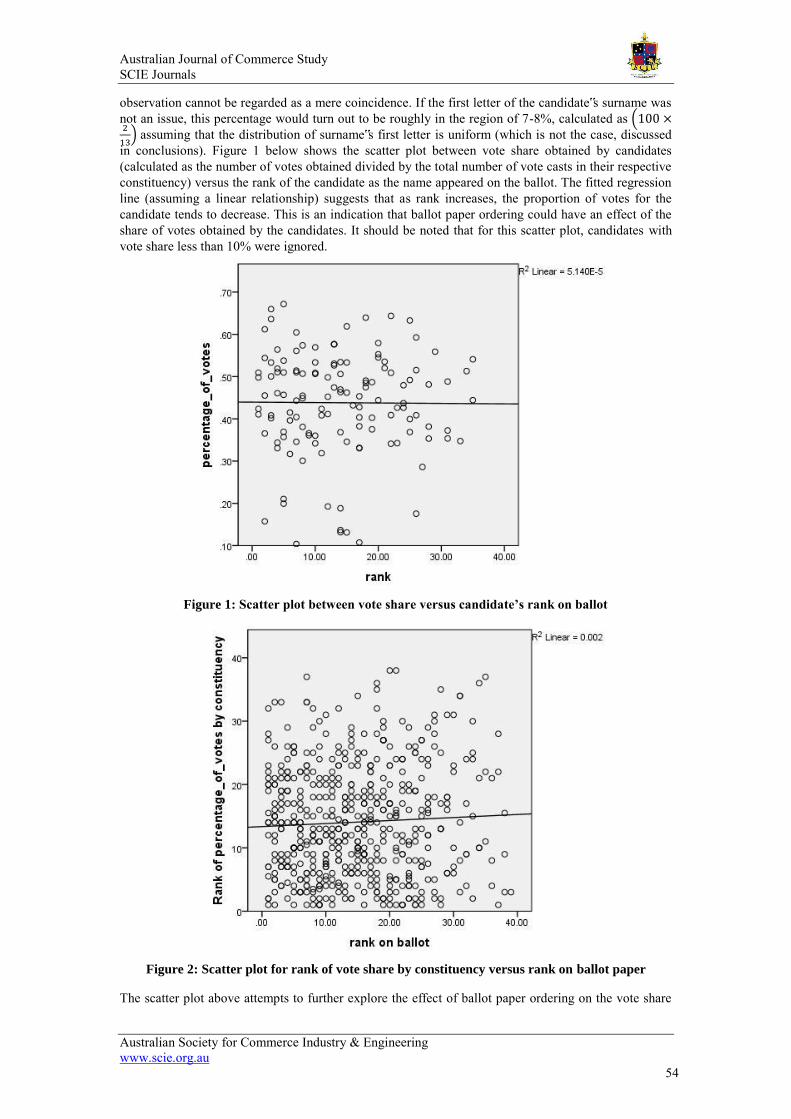
Figure 2: Scatter plot for rank of vote share by constituency versus rank on ballot paper
The scatter plot above attempts to further explore the effect of ballot paper ordering on the vote share
Australian Journal of Commerce Study SCIE Journals
Australian Society for Commerce Industry & Engineering www.scie.org.au
55
acquired by the candidates at the 2010 National Assembly Elections. The rank of the candidates in the final results of their respective constituencies was plotted versus the candidates‟ rank on the ballot paper. The scatter plot in Figure 2 above suggests that the ranking of the candidates in the final elections (which determines whether they will be elected or not) is affected by the rank on ballot paper. The ranking slightly increases as the ballot paper ranking goes higher, thus disadvantaging candidates appearing at later stages on the ballot paper. 3.2. Detecting multicollinearity
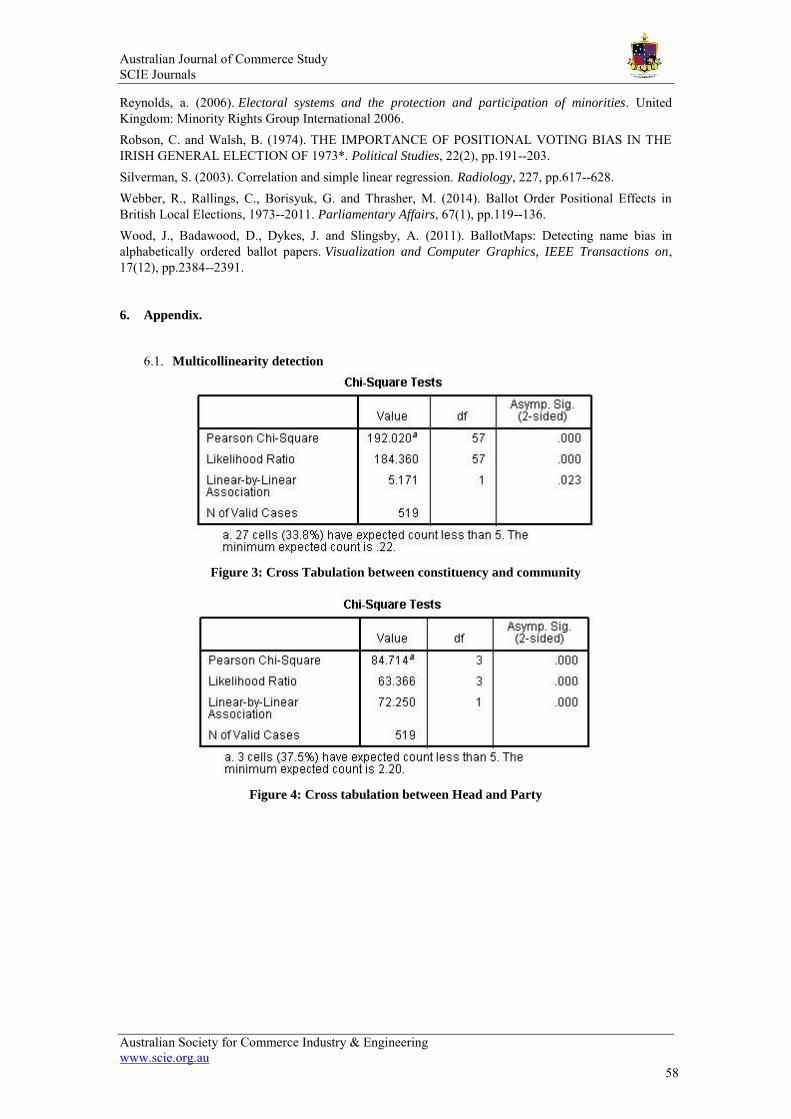
The presence of multicollinearity among the explanatory variables was investigated using a series of Pearson‟s Chi Squared Test for the categorical variables and the Variance Inflation Factor (VIF) for the rank variable. The findings (See Figure 3, Figure 4 and Figure 5) reveal that strong association is present between constituency & community, between Head (Imcumbency) & Party Affiliation and between Community and Party Affiliation. Details of the results can be found in the appendix. The diagnostics reveal that at least two variables should be omitted from the model. Among community and constituency, constituency was removed and the also, the variable „Head‟ was removed, considering that Party Belonging is a much more important variable than the former. VIF calculated as 1.03 was not very alarming and thus the variable „rank‟ was kept in the model. 3.3. Model selection
In order to cater for the variation in the total number of vote casts per constituency (due to the varying number of inhabitants within), the „proportion of votes within constituency‟ and the log of the latter were investigated as potential dependent variables instead of using the original count itself. Best results in terms of a combination of explained variation R2 and normality of residuals were obtained with the model with 𝑙𝑛 (𝑣𝑜𝑡𝑒 𝑠𝑎𝑟𝑒) as the response variable. Thus, from this point onwards, we only consider taking 𝑙𝑛(𝑣𝑜𝑡𝑒 𝑠𝑎𝑟𝑒) as the response variable and disregard „proportion of votes within constituency‟ as a potential ones. Explanatory variables at this stage were constituency, rank,
party affiliation and all two-way interactions. Results for the various models fitted are displayed below, coupled with diagnostic tests reported in the appendix. Model one starts with constituency, rank, party affiliation and all two way interactions. Several models are proposed, R2 varying between 0.887 and 0.931. The final model contains only the following variables: constituency, rank, party affiliation, the interaction term between constituency &
rank and the interaction term between constituency & party.
Model Features How to improve New model
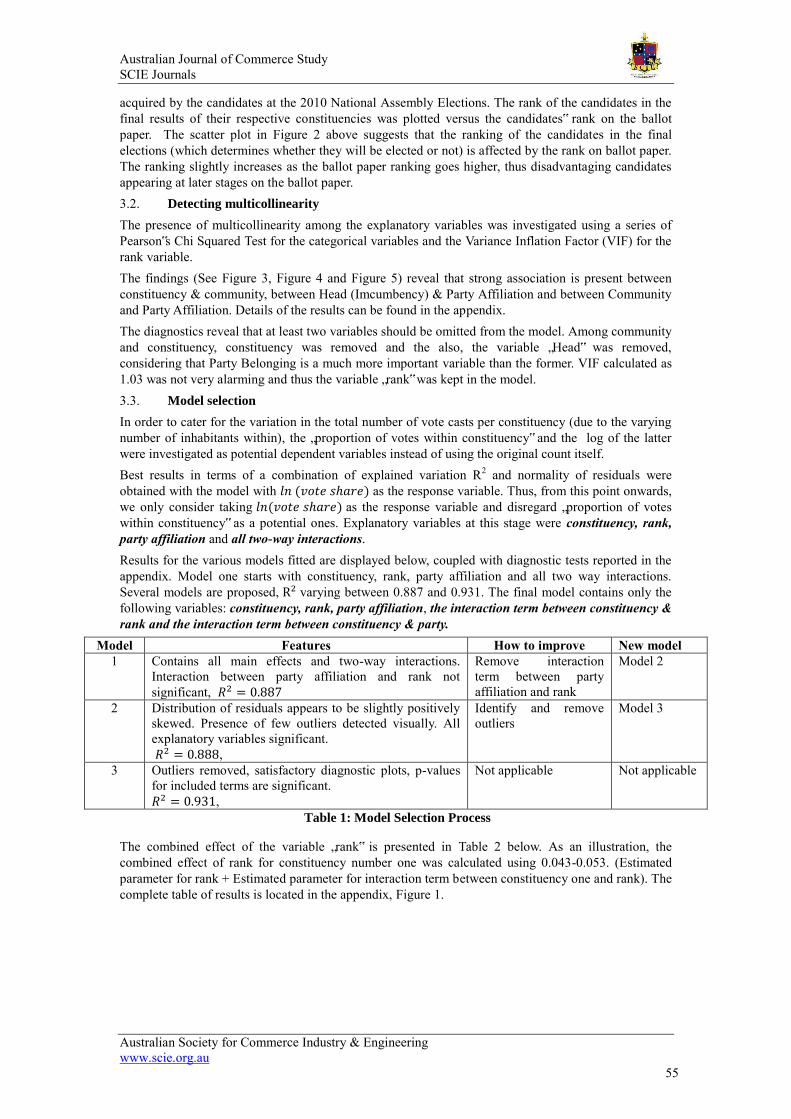
1 Contains all main effects and two-way interactions. Interaction between party affiliation and rank not significant, 𝑅2 = 0.887
Remove interaction term between party affiliation and rank
Model 2
2 Distribution of residuals appears to be slightly positively skewed. Presence of few outliers detected visually. All explanatory variables significant. 𝑅2 = 0.888,
Identify and remove outliers
Model 3
3 Outliers removed, satisfactory diagnostic plots, p-values for included terms are significant. 𝑅2 = 0.931,
Not applicable Not applicable
Table 1: Model Selection Process
The combined effect of the variable „rank‟ is presented in Table 2 below. As an illustration, the combined effect of rank for constituency number one was calculated using 0.043-0.053. (Estimated parameter for rank + Estimated parameter for interaction term between constituency one and rank). The complete table of results is located in the appendix, Figure 1.
Australian Journal of Commerce Study SCIE Journals
Australian Society for Commerce Industry & Engineering www.scie.org.au
56
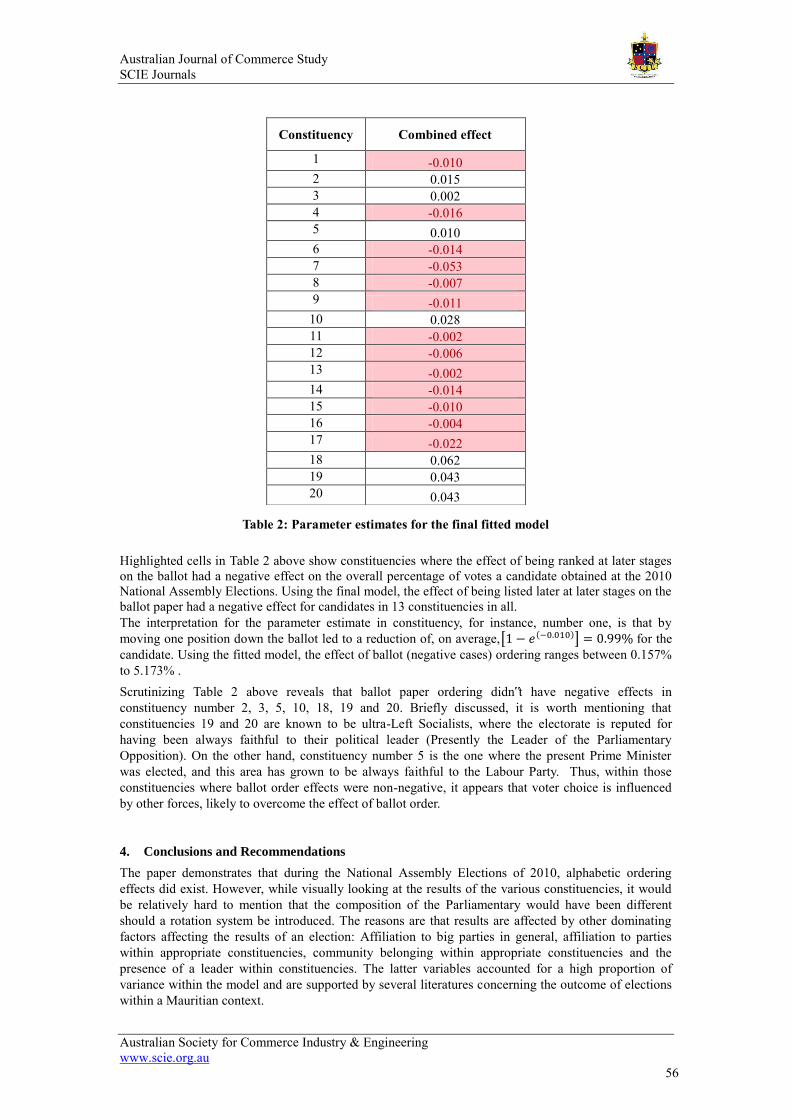
Table 2: Parameter estimates for the final fitted model
Highlighted cells in Table 2 above show constituencies where the effect of being ranked at later stages on the ballot had a negative effect on the overall percentage of votes a candidate obtained at the 2010 National Assembly Elections. Using the final model, the effect of being listed later at later stages on the ballot paper had a negative effect for candidates in 13 constituencies in all. The interpretation for the parameter estimate in constituency, for instance, number one, is that by moving one position down the ballot led to a reduction of, on average,[1 − 𝑒(−0.010)] = 0.99% for the candidate. Using the fitted model, the effect of ballot (negative cases) ordering ranges between 0.157% to 5.173% . Scrutinizing Table 2 above reveals that ballot paper ordering didn‟t have negative effects in constituency number 2, 3, 5, 10, 18, 19 and 20. Briefly discussed, it is worth mentioning that constituencies 19 and 20 are known to be ultra-Left Socialists, where the electorate is reputed for having been always faithful to their political leader (Presently the Leader of the Parliamentary Opposition). On the other hand, constituency number 5 is the one where the present Prime Minister was elected, and this area has grown to be always faithful to the Labour Party. Thus, within those constituencies where ballot order effects were non-negative, it appears that voter choice is influenced by other forces, likely to overcome the effect of ballot order.
4. Conclusions and Recommendations
The paper demonstrates that during the National Assembly Elections of 2010, alphabetic ordering effects did exist. However, while visually looking at the results of the various constituencies, it would be relatively hard to mention that the composition of the Parliamentary would have been different should a rotation system be introduced. The reasons are that results are affected by other dominating factors affecting the results of an election: Affiliation to big parties in general, affiliation to parties within appropriate constituencies, community belonging within appropriate constituencies and the presence of a leader within constituencies. The latter variables accounted for a high proportion of variance within the model and are supported by several literatures concerning the outcome of elections within a Mauritian context.
Constituency Combined effect
1 -0.010 2 0.015 3 0.002 4 -0.016 5 0.010 6 -0.014 7 -0.053 8 -0.007 9 -0.011
10 0.028 11 -0.002 12 -0.006 13 -0.002 14 -0.014 15 -0.010 16 -0.004 17 -0.022 18 0.062 19 0.043 20 0.043
Australian Journal of Commerce Study SCIE Journals
Australian Society for Commerce Industry & Engineering www.scie.org.au
57
The only probable constituency where ballot ordering could have had a serious effect appears to constituency number 14. Within the latter area, the third candidate who was elected holds a surname starting with the letter „A‟ and was ranked first on the ballot while the name candidate who came fourth (best loser) appears 14th on the ballot. This constituency is one with high variation in the results in terms of elected parties and communities, the dominating factors at an election within the Mauritian context. The fitted model suggests that every position down the ballot costs the candidate 1.37% of total votes. The results imply that that the candidate who scored highest vote share just after the elected candidate has been disadvantaged, for every step down the ballot, by approximately 631 votes. Adjusting both candidates‟ vote by this value might definitely have brought some changes to the composition of the National Assembly. Figures speak for themselves, it would be hard to imagine that 43% of constituencies produced a „head of the list‟ having candidates‟ surnames starting with letters A or B just out of luck. Party leaders, being well versed with voter behaviour, are well aware of the underlying theories and prefer to present candidates with these name characteristics to make out of the most of this advantage. Moreover, these candidates acquire a certain artificial popularity across time and turn out to be constituency leaders, a higher vote share after each election. As a recommendation for further research, the data for earlier elections can be analyzed to further bring to light the issue of ballot ordering in a Mauritian context, bearing in mind that the coalitions among parties vary across time. Thus, in an attempt to increase fairness during the National Assembly Elections and promote democracy, it is recommended that the order in which candidates‟ names appear on ballot papers rotate so that candidates bearing names starting with letters occurring earlier on the alphabet do not have a competitive advantage compared to other candidates.
5. References
Augenblick, N. and Nicholson, S. (2012). Ballot position, choice fatigue, and voter behavior. Augenblick, N. and Nicholson, S. (2012). Ballot position, choice fatigue, and voter behavior. Belsley, D. and Kuh, E. (1980). Regression Diagnostics: identifying influential data and sources of collinearity/by David A. Belsley, Edwin Kuh, Roy E. Welsch.. Wiley Serie in Probability and
Statistics.. Cronbach, L. (1950). Further evidence on response sets and test design. Educational and psychological
measurement. Hedges, L., Hedberg, E. and others, (2007). Intraclass correlations for planning group randomized experiments in rural education. Journal of Research in Rural Education, 22(10), pp.1--15. Kelley, J. and McAllister, I. (1984). Ballot paper cues and the vote in Australia and Britain: alphabetic voting, sex, and title. Public Opinion Quarterly, 48(2), pp.452--466. King, A. and Leigh, A. (2009). Are Ballot Order Effects Heterogeneous?*. Social Science Quarterly, 90(1), pp.71--87. Mathur, R. (1997). Party cooperation and the electoral system in Mauritius. Electoral Systems in
Divided Societies: The Fiji Constitution Review, pp.135--46. Meredith, M. and Salant, Y. (2013). On the causes and consequences of ballot order effects. Political
Behavior, 35(1), pp.175--197. Miller, J. and Krosnick, J. (1998). The impact of candidate name order on election outcomes. Public
Opinion Quarterly, pp.291--330.
NATIONAL ASSEMBLY ELECTIONS REGULATIONS 1968, 4th Sch - Act 12/68 - sections 44 and 85 - 11 May 1968 Ngo, T. and La Puente, C. (n.d.). The Steps to Follow in a Multiple Regression Analysis. Citeseer. O‟brien, R. (2007). A caution regarding rules of thumb for variance inflation factors. Quality \&
Quantity, 41(5), pp.673--690. Regan, J. (2012). Ballot order effects: an analysis of Irish general elections.
Australian Journal of Commerce Study SCIE Journals
Australian Society for Commerce Industry & Engineering www.scie.org.au
58
Reynolds, a. (2006). Electoral systems and the protection and participation of minorities. United Kingdom: Minority Rights Group International 2006. Robson, C. and Walsh, B. (1974). THE IMPORTANCE OF POSITIONAL VOTING BIAS IN THE IRISH GENERAL ELECTION OF 1973*. Political Studies, 22(2), pp.191--203. Silverman, S. (2003). Correlation and simple linear regression. Radiology, 227, pp.617--628. Webber, R., Rallings, C., Borisyuk, G. and Thrasher, M. (2014). Ballot Order Positional Effects in British Local Elections, 1973--2011. Parliamentary Affairs, 67(1), pp.119--136. Wood, J., Badawood, D., Dykes, J. and Slingsby, A. (2011). BallotMaps: Detecting name bias in alphabetically ordered ballot papers. Visualization and Computer Graphics, IEEE Transactions on, 17(12), pp.2384--2391.
6. Appendix.
6.1. Multicollinearity detection
Figure 3: Cross Tabulation between constituency and community
Figure 4: Cross tabulation between Head and Party
Australian Journal of Commerce Study SCIE Journals
Australian Society for Commerce Industry & Engineering www.scie.org.au
59
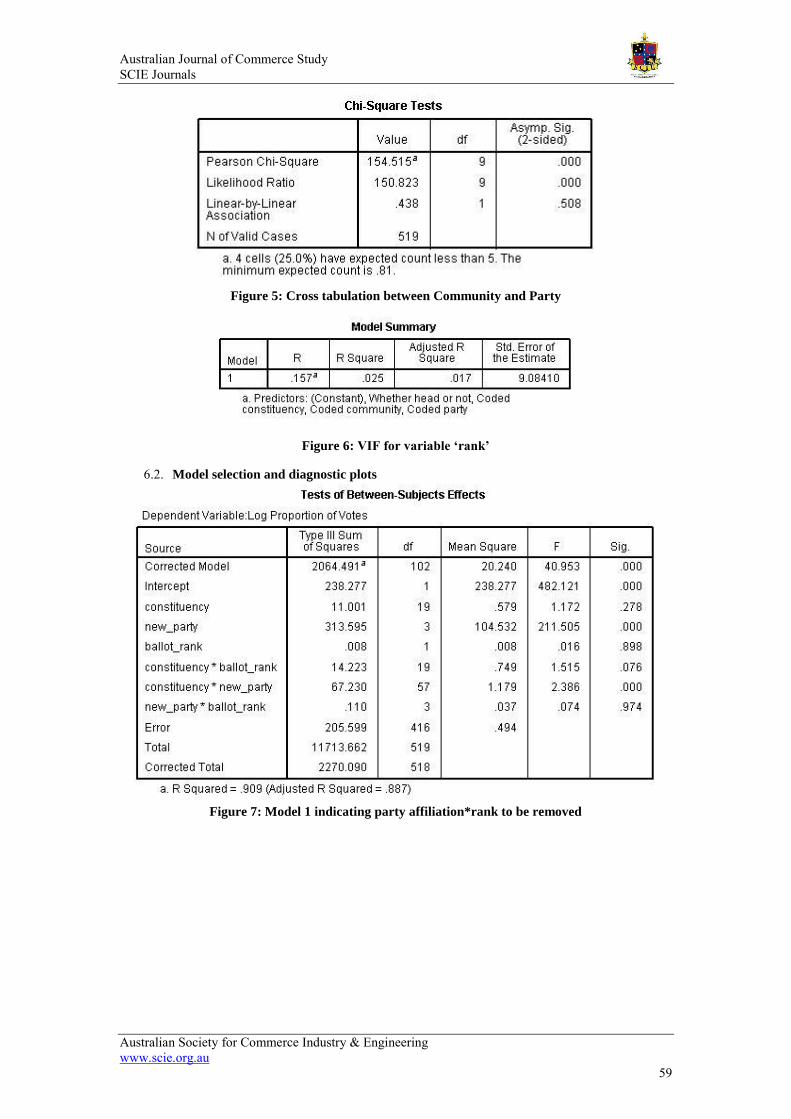
Figure 5: Cross tabulation between Community and Party
Figure 6: VIF for variable ‘rank’
6.2. Model selection and diagnostic plots
Figure 7: Model 1 indicating party affiliation*rank to be removed
Australian Journal of Commerce Study SCIE Journals
Australian Society for Commerce Industry & Engineering www.scie.org.au
60
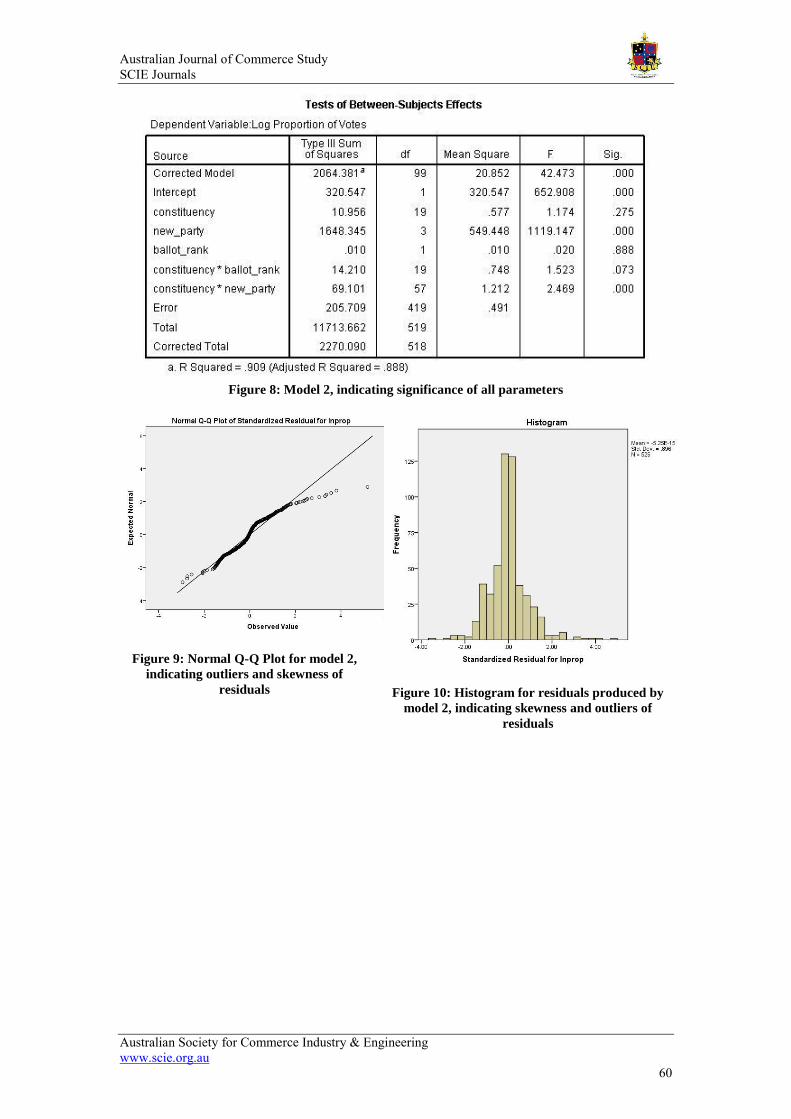
Figure 8: Model 2, indicating significance of all parameters
Figure 9: Normal Q-Q Plot for model 2,
indicating outliers and skewness of
residuals
Figure 10: Histogram for residuals produced by
model 2, indicating skewness and outliers of
residuals
Australian Journal of Commerce Study SCIE Journals
Australian Society for Commerce Industry & Engineering www.scie.org.au
61
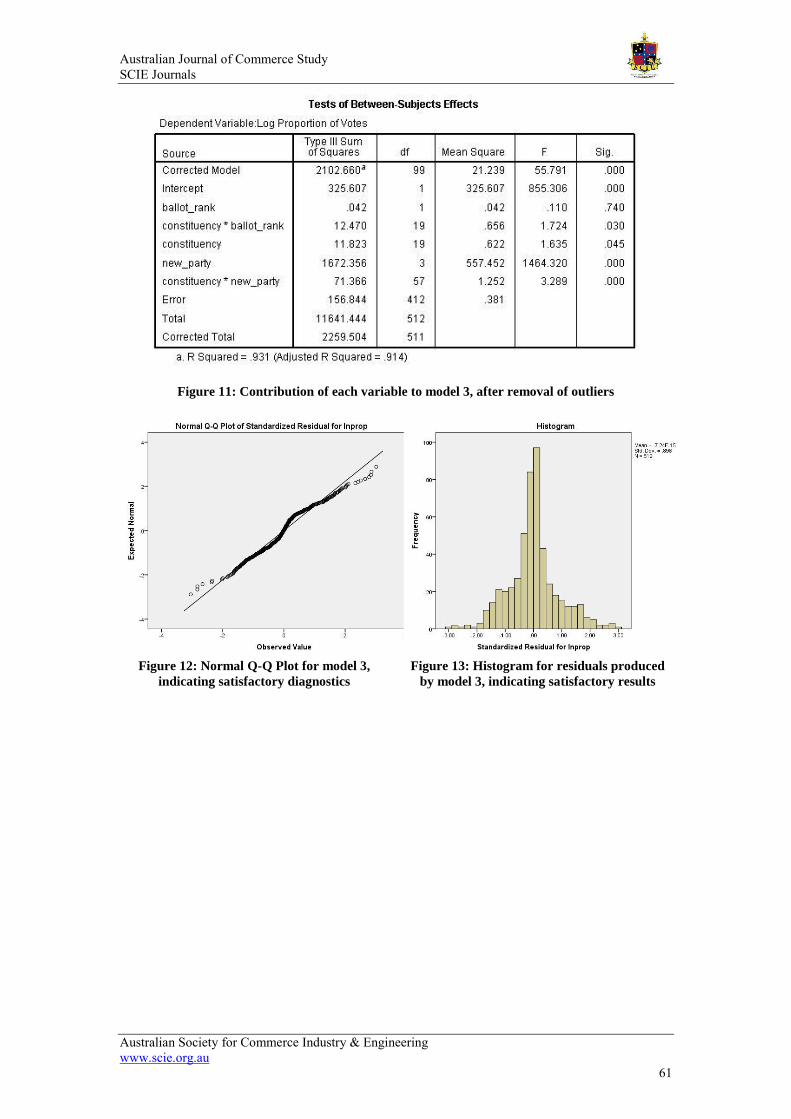
Figure 11: Contribution of each variable to model 3, after removal of outliers
Figure 12: Normal Q-Q Plot for model 3,
indicating satisfactory diagnostics
Figure 13: Histogram for residuals produced
by model 3, indicating satisfactory results
Australian Journal of Commerce Study SCIE Journals
Australian Society for Commerce Industry & Engineering www.scie.org.au
62
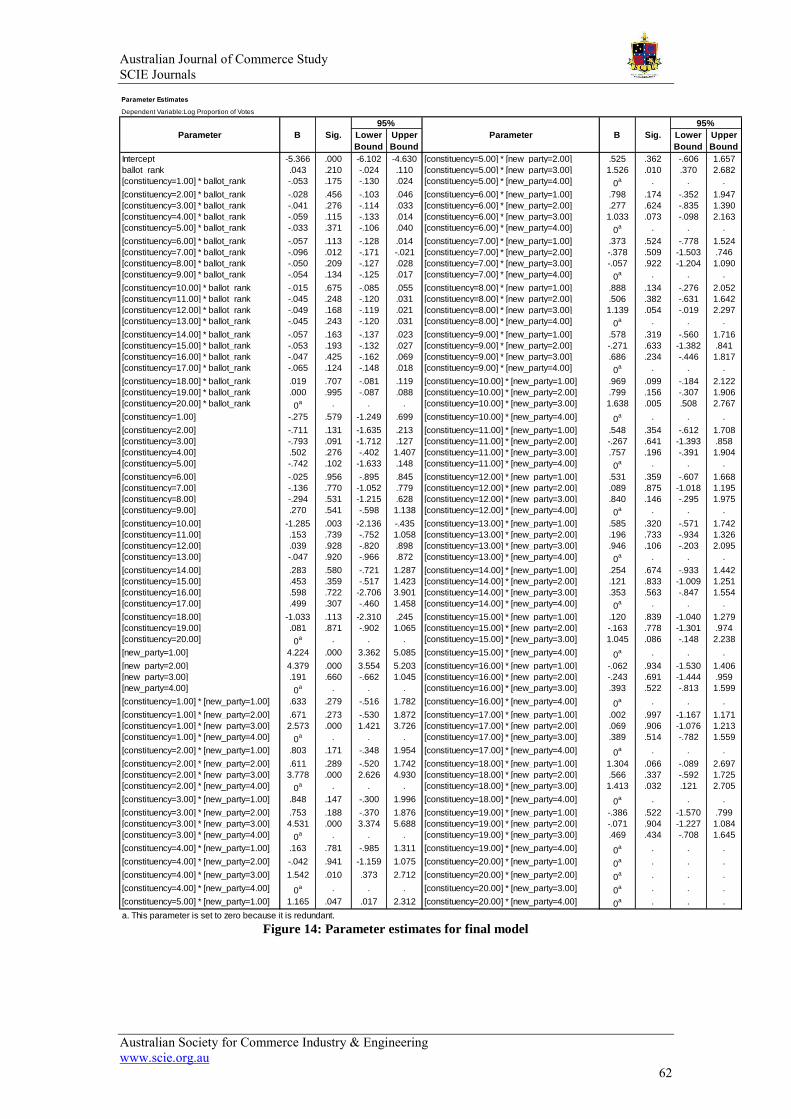
Figure 14: Parameter estimates for final model
Lower
Bound
Upper
Bound
Lower
Bound
Upper
Bound
Intercept -5.366 .000 -6.102 -4.630 [constituency=5.00] * [new_party=2.00] .525 .362 -.606 1.657
ballot_rank .043 .210 -.024 .110 [constituency=5.00] * [new_party=3.00] 1.526 .010 .370 2.682
[constituency=1.00] * ballot_rank -.053 .175 -.130 .024 [constituency=5.00] * [new_party=4.00] 0a . . .
[constituency=2.00] * ballot_rank -.028 .456 -.103 .046 [constituency=6.00] * [new_party=1.00] .798 .174 -.352 1.947
[constituency=3.00] * ballot_rank -.041 .276 -.114 .033 [constituency=6.00] * [new_party=2.00] .277 .624 -.835 1.390
[constituency=4.00] * ballot_rank -.059 .115 -.133 .014 [constituency=6.00] * [new_party=3.00] 1.033 .073 -.098 2.163
[constituency=5.00] * ballot_rank -.033 .371 -.106 .040 [constituency=6.00] * [new_party=4.00] 0a . . .
[constituency=6.00] * ballot_rank -.057 .113 -.128 .014 [constituency=7.00] * [new_party=1.00] .373 .524 -.778 1.524
[constituency=7.00] * ballot_rank -.096 .012 -.171 -.021 [constituency=7.00] * [new_party=2.00] -.378 .509 -1.503 .746
[constituency=8.00] * ballot_rank -.050 .209 -.127 .028 [constituency=7.00] * [new_party=3.00] -.057 .922 -1.204 1.090
[constituency=9.00] * ballot_rank -.054 .134 -.125 .017 [constituency=7.00] * [new_party=4.00] 0a . . .
[constituency=10.00] * ballot_rank -.015 .675 -.085 .055 [constituency=8.00] * [new_party=1.00] .888 .134 -.276 2.052
[constituency=11.00] * ballot_rank -.045 .248 -.120 .031 [constituency=8.00] * [new_party=2.00] .506 .382 -.631 1.642
[constituency=12.00] * ballot_rank -.049 .168 -.119 .021 [constituency=8.00] * [new_party=3.00] 1.139 .054 -.019 2.297
[constituency=13.00] * ballot_rank -.045 .243 -.120 .031 [constituency=8.00] * [new_party=4.00] 0a . . .
[constituency=14.00] * ballot_rank -.057 .163 -.137 .023 [constituency=9.00] * [new_party=1.00] .578 .319 -.560 1.716
[constituency=15.00] * ballot_rank -.053 .193 -.132 .027 [constituency=9.00] * [new_party=2.00] -.271 .633 -1.382 .841
[constituency=16.00] * ballot_rank -.047 .425 -.162 .069 [constituency=9.00] * [new_party=3.00] .686 .234 -.446 1.817
[constituency=17.00] * ballot_rank -.065 .124 -.148 .018 [constituency=9.00] * [new_party=4.00] 0a . . .
[constituency=18.00] * ballot_rank .019 .707 -.081 .119 [constituency=10.00] * [new_party=1.00] .969 .099 -.184 2.122
[constituency=19.00] * ballot_rank .000 .995 -.087 .088 [constituency=10.00] * [new_party=2.00] .799 .156 -.307 1.906
[constituency=20.00] * ballot_rank 0a . . . [constituency=10.00] * [new_party=3.00] 1.638 .005 .508 2.767
[constituency=1.00] -.275 .579 -1.249 .699 [constituency=10.00] * [new_party=4.00] 0a . . .
[constituency=2.00] -.711 .131 -1.635 .213 [constituency=11.00] * [new_party=1.00] .548 .354 -.612 1.708
[constituency=3.00] -.793 .091 -1.712 .127 [constituency=11.00] * [new_party=2.00] -.267 .641 -1.393 .858
[constituency=4.00] .502 .276 -.402 1.407 [constituency=11.00] * [new_party=3.00] .757 .196 -.391 1.904
[constituency=5.00] -.742 .102 -1.633 .148 [constituency=11.00] * [new_party=4.00] 0a . . .
[constituency=6.00] -.025 .956 -.895 .845 [constituency=12.00] * [new_party=1.00] .531 .359 -.607 1.668
[constituency=7.00] -.136 .770 -1.052 .779 [constituency=12.00] * [new_party=2.00] .089 .875 -1.018 1.195
[constituency=8.00] -.294 .531 -1.215 .628 [constituency=12.00] * [new_party=3.00] .840 .146 -.295 1.975
[constituency=9.00] .270 .541 -.598 1.138 [constituency=12.00] * [new_party=4.00] 0a . . .
[constituency=10.00] -1.285 .003 -2.136 -.435 [constituency=13.00] * [new_party=1.00] .585 .320 -.571 1.742
[constituency=11.00] .153 .739 -.752 1.058 [constituency=13.00] * [new_party=2.00] .196 .733 -.934 1.326
[constituency=12.00] .039 .928 -.820 .898 [constituency=13.00] * [new_party=3.00] .946 .106 -.203 2.095
[constituency=13.00] -.047 .920 -.966 .872 [constituency=13.00] * [new_party=4.00] 0a . . .
[constituency=14.00] .283 .580 -.721 1.287 [constituency=14.00] * [new_party=1.00] .254 .674 -.933 1.442
[constituency=15.00] .453 .359 -.517 1.423 [constituency=14.00] * [new_party=2.00] .121 .833 -1.009 1.251
[constituency=16.00] .598 .722 -2.706 3.901 [constituency=14.00] * [new_party=3.00] .353 .563 -.847 1.554
[constituency=17.00] .499 .307 -.460 1.458 [constituency=14.00] * [new_party=4.00] 0a . . .
[constituency=18.00] -1.033 .113 -2.310 .245 [constituency=15.00] * [new_party=1.00] .120 .839 -1.040 1.279
[constituency=19.00] .081 .871 -.902 1.065 [constituency=15.00] * [new_party=2.00] -.163 .778 -1.301 .974
[constituency=20.00] 0a . . . [constituency=15.00] * [new_party=3.00] 1.045 .086 -.148 2.238
[new_party=1.00] 4.224 .000 3.362 5.085 [constituency=15.00] * [new_party=4.00] 0a . . .
[new_party=2.00] 4.379 .000 3.554 5.203 [constituency=16.00] * [new_party=1.00] -.062 .934 -1.530 1.406
[new_party=3.00] .191 .660 -.662 1.045 [constituency=16.00] * [new_party=2.00] -.243 .691 -1.444 .959
[new_party=4.00] 0a . . . [constituency=16.00] * [new_party=3.00] .393 .522 -.813 1.599
[constituency=1.00] * [new_party=1.00] .633 .279 -.516 1.782 [constituency=16.00] * [new_party=4.00] 0a . . .
[constituency=1.00] * [new_party=2.00] .671 .273 -.530 1.872 [constituency=17.00] * [new_party=1.00] .002 .997 -1.167 1.171
[constituency=1.00] * [new_party=3.00] 2.573 .000 1.421 3.726 [constituency=17.00] * [new_party=2.00] .069 .906 -1.076 1.213
[constituency=1.00] * [new_party=4.00] 0a . . . [constituency=17.00] * [new_party=3.00] .389 .514 -.782 1.559
[constituency=2.00] * [new_party=1.00] .803 .171 -.348 1.954 [constituency=17.00] * [new_party=4.00] 0a . . .
[constituency=2.00] * [new_party=2.00] .611 .289 -.520 1.742 [constituency=18.00] * [new_party=1.00] 1.304 .066 -.089 2.697
[constituency=2.00] * [new_party=3.00] 3.778 .000 2.626 4.930 [constituency=18.00] * [new_party=2.00] .566 .337 -.592 1.725
[constituency=2.00] * [new_party=4.00] 0a . . . [constituency=18.00] * [new_party=3.00] 1.413 .032 .121 2.705
[constituency=3.00] * [new_party=1.00] .848 .147 -.300 1.996 [constituency=18.00] * [new_party=4.00] 0a . . .
[constituency=3.00] * [new_party=2.00] .753 .188 -.370 1.876 [constituency=19.00] * [new_party=1.00] -.386 .522 -1.570 .799
[constituency=3.00] * [new_party=3.00] 4.531 .000 3.374 5.688 [constituency=19.00] * [new_party=2.00] -.071 .904 -1.227 1.084
[constituency=3.00] * [new_party=4.00] 0a . . . [constituency=19.00] * [new_party=3.00] .469 .434 -.708 1.645
[constituency=4.00] * [new_party=1.00] .163 .781 -.985 1.311 [constituency=19.00] * [new_party=4.00] 0a . . .
[constituency=4.00] * [new_party=2.00] -.042 .941 -1.159 1.075 [constituency=20.00] * [new_party=1.00] 0a . . .
[constituency=4.00] * [new_party=3.00] 1.542 .010 .373 2.712 [constituency=20.00] * [new_party=2.00] 0a . . .
[constituency=4.00] * [new_party=4.00] 0a . . . [constituency=20.00] * [new_party=3.00] 0
a . . .
[constituency=5.00] * [new_party=1.00] 1.165 .047 .017 2.312 [constituency=20.00] * [new_party=4.00] 0a . . .
Parameter B Sig.
95%
a. This parameter is set to zero because it is redundant.
Parameter Estimates
Dependent Variable:Log Proportion of Votes
Parameter B Sig.
95%
Related Documents