EFFECT OF ABOLITION OF PRIMARY EDUCATION SCHOOL FEES ON PUPIL PARTICIPATION AND PERFORMANCE BY MELAP SITATI X50/64164/2011 A Research Project Submitted in Partial Fulfillment of the Requirements for the Award of the Degree of Masters of Arts in Economics, in the School of Economics, University of Nairobi. November, 2014

Welcome message from author
This document is posted to help you gain knowledge. Please leave a comment to let me know what you think about it! Share it to your friends and learn new things together.
Transcript
EFFECT OF ABOLITION OF PRIMARY EDUCATION SCHOOL FEES
ON PUPIL PARTICIPATION AND PERFORMANCE
BY
MELAP SITATI
X50/64164/2011
A Research Project Submitted in Partial Fulfillment of the Requirements for the Award of
the Degree of Masters of Arts in Economics, in the School of Economics, University of
Nairobi.
November, 2014
ii | P a g e
DECLARATION
This Research Project is my original work and has not been presented for a degree in any other
University.
Melap Sitati
Reg No: X50/64614/2011
Signed ____________________________________________
Date ______________________________________________
This Research Project has been submitted for examination with our approval as university
supervisors:
Prof. Jane Kabubo-Mariara
Signed _______________________________________________
Date ________________________________________________
Dr. Thomas Ongoro
Signed ______________________________________________
Date _______________________________________________

iii | P a g e
DEDICATION
With great gratitude and profound humility, I dedicate this work to my family (Philip, Sandra
and Angela) for bearing with my absence, encouragement, support and for believing in me.
Indeed you all inspired me to have a reason to study.

iv | P a g e
ACKNOWLEDGEMENT
First and foremost, thanks giving to Almighty God who gives me strength to live through all
circumstances. Secondly, I would like to profoundly thank my supervisors Prof. Jane Kabubo-
Mariara and Dr. Thomas Ongoro for their tireless support and comments. I salute you for your
insightful scholarly input which was the driving force to the completion of this study.
I am deeply indebted to my parents who sacrificed to ensure I get good education. I would not be
where I am without your financial support. I am also indebted to my dear husband for proof-
reading part of the work and believing in me. Sandra and Angela, thanks for coping with my
absence from home.
Last but not least, my thanks go to Jessica, Rachael, Josephine Munyasa and all those other
people who have contributed to this work directly or indirectly. To all of you I am deeply
grateful and honored.
v | P a g e
ABSTRACT
Since the inception of Free Primary Education (FPE), the Government has made significant
investment in providing access to basic education through provision of capitation grants,
infrastructure development, teacher employment and training and provision of instructional
material. The FPE programme has seen increased pupil participation since its implementation.
Despite the effort made by the government to achieve goals of education for all and the
millennium development goal on universal primary education, a number of challenges still exist.
Among the challenges include congested classrooms, very high pupil teacher ratio in some
regions and poor learning facilities.
The paper examines the effect of abolition of primary education fees on school participation and
performance in Kenya. The study provides comparison of pupil participation and performance in
the period preceding the introduction of FPE in 2003 and after the introduction of FPE to the
year 2013. Participation is measured by the gross enrollment in primary schools while
performance is measured by the KCPE test scores over these two periods. The study uses panel
data for the period 1998-2013 from all counties in Kenya. The study uses fixed effects model to
assess the effect of abolition of fees on pupil participation and performance in KCPE
examination.
The study found that since the inception of FPE, pupil participation has increased tremendously
on one hand and national performance is still below average mark of 250. The study also found
regional disparities in terms of performance and pupil participation.
To ensure pupil participation in primary education, the study recommends removing all costs
relating to schooling so that education is completely free. To ensure equality in access to
education, the government should implement affirmative policies to bring the disadvantaged
regions at par with the rest of the country. This may include; setting up mobile schools, provision
of low cost boarding school, enhancing school feeding programmes and setting up an
equalization fund for education.
The study also recommends that the government should improve existing infrastructure by
increasing number of classrooms, textbooks and teachers to ensure improved performance.
vi | P a g e
TABLE OF CONTENTS DECLARATION .................................................................................................................................................. ii
DEDICATION ..................................................................................................................................................... iii
ACKNOWLEDGEMENT ................................................................................................................................... iv
ABSTRACT ......................................................................................................................................................... v
TABLE OF CONTENTS ..................................................................................................................................... vi
List of Tables....................................................................................................................................................... vii
List of Figures .................................................................................................................................................... viii
List of Acronyms ................................................................................................................................................. ix
1. CHAPTER ONE: INTRODUCTION ............................................................................................................... 1
1.1 Background ................................................................................................................................................. 1
1.2 Statement of the Problem ............................................................................................................................ 6
1.3 Research Objectives .................................................................................................................................... 8
1.4 Justification of the Study ............................................................................................................................ 9
1.5 Organization of the Study ........................................................................................................................... 9
2. CHAPTER TWO: LITERATURE REVIEW .................................................................................................. 10
2.1Theoretical Literature ................................................................................................................................ 10
2.2 Empirical Literature .................................................................................................................................. 12
2.3 Overview of Literature .............................................................................................................................. 19
3. CHAPTER THREE: METHODOLOGY ........................................................................................................ 20
3.1 Theoretical Framework ............................................................................................................................. 20
3.2 Model Specification .................................................................................................................................. 22
3.3 Definition and Measurement of Variables................................................................................................. 23
3.4 Sources of Data used in the Study ............................................................................................................ 25
4. CHAPTER FOUR: RESULTS AND DISCUSSION ...................................................................................... 26
4.1 Descriptive Statistics ................................................................................................................................. 26
4.2 Hausman Test Results ............................................................................................................................... 26
4.3 Correlation Analysis ................................................................................................................................. 27
4.3 Results of the Fixed Effects Model ........................................................................................................... 30
5. CHAPTER FIVE: CONCLUSION AND POLICY RECOMMENDATIONS................................................ 38
5.1 Summary and Conclusion ......................................................................................................................... 38
5.2 Policy Implications ................................................................................................................................... 39
5.3 Limitations and Areas for Further Research ............................................................................................. 40
REFERENCES ................................................................................................................................................... 41
vii | P a g e
List of Tables
Table 1.1: National Mean Scores by Candidature in KCPE, 2003-2013 ...................................................... 3
Table 3.1: Variable Definition and Hypothesized Relationships. ............................................................... 23
Table 4.1: Descriptive Statistics.................................................................................................................. 26
Table 4.2: Hausman Test Results ................................................................................................................ 27
Table 4.3: Correlation Matrix ...................................................................................................................... 27
Table 4.4: Mean Comparison Test .............................................................................................................. 28
Table 4.5: Fixed Effects Results for Pupil Participation: Dependent Variable is Number of Pupils .......... 30
Table 4.6: Fixed Effects Results for Performance: Dependent variable is County Mean Score ................ 34
Table A. 1: Budget Expenditure on Education and Per Capita Spending (KES) in Primary Schools ........ 46
Table A.2: Enrolment Trends in Kenyan Primary Schools ......................................................................... 47
Table A.3: County results on pupil participation ........................................................................................ 48
Table A.4: Regression Results of Pupil Participation ................................................................................. 49
Table A.5: County Results on Performance ................................................................................................ 50
Table A.6: Regression Results of Performance using OLS ........................................................................ 51
Table A.7: County Order of Merit in KCPE ............................................................................................... 55
viii | P a g e
List of Figures
Figure 1.1: Trend in pupil teacher ratio between 2002 and 2013 ................................................................. 5
Figure 4.1: Scatter Diagram on Correlation ................................................................................................ 28
Figure 4.2: Scatter Diagram on change in enrolment and KCPE mean score (2003-2013) ........................ 29
Figure 4.3: Trend in Pupil Class Ratio between 2003-2013 ....................................................................... 31
Figure 4.4: Variations in pupil teacher ratio across counties ...................................................................... 32
Figure A.1: Trend in County Mean Scores ................................................................................................. 52
Figure A.2: Performance in ASAL Areas ................................................................................................... 53
Figure A.3: County Performance in KCPE in Quintiles ............................................................................. 54

ix | P a g e
List of Acronyms
ASAL Arid and Semi-Arid Land
EFA Education for All
EPF Education Production Function
FPE Free Primary Education
FE Fixed Effects
FY Financial Year
GDP Gross Domestic Product
GER Gross Enrolment Rate
GoK Government of Kenya
KCPE Kenya Certificate of Primary Education
KES Kenya Shillings
KIHBS Kenya Integrated Household Budget Survey
KNEC Kenya National Examination Council
MDGs Millennium Development Goals
MoEST Ministry of Education, Science and Technology
NER Net Enrolment Rate
OLS Ordinary Least Square
PTA Parents Teacher Association
PTR Pupil Teacher Ratio
PBR Pupil Book Ratio
TIMSS Third International Mathematics and Science Study
TSC Teacher Service Commission
UNESCO United Nations Educational, Scientific and Cultural Organization
UPE Universal Primary Education
WMS Welfare Monitoring Survey

1. CHAPTER ONE: INTRODUCTION
1.1 Background
The World Conference on Education for All (EFA) (1990) held in Jomtien agreed to universalize
primary education and massively reduce illiteracy by end of 2000. From this conference, which
was later supported by the World Education Forum held on 26th
to 28th
April 2000, in Dakar,
countries reaffirmed the commitment to provide EFA. The United Nations Millennium
Development Goal (MDG) number two aims to provide Universal Primary Education (UPE) by
2015. All these forums stressed that education is a fundamental human right and pushed
countries to strengthen their efforts to improve education in order to ensure the basic learning
needs for all were met (UNESCO, 2000)1. The Government of Kenya was a signatory to the
commitments of these two international conferences and considers attainment of UPE as a
critical component of the National Development Strategy.
As part of international effort to achieve UPE by 2015, many African countries have followed
suit in implementing the fee abolition policy. For instance, Uganda introduced Free Primary
Education (FPE) in 1997, Tanzania in 2002, Malawi in 1994, and Kenya in 2003 among others.
This is because they value the importance of education as an engine to spur development. Thus
governments and households are investing immensely to ensure that education becomes
accessible to all and also for them to reap the benefits of human capital in economic growth. It is
evident that education is absolutely beneficial to society and needs to be reinforced to each
person throughout life (World Bank 20112).
The Dakar Framework for Action did not establish financing targets for education. As a result,
there is a wide difference in governments spending on education. For instance, the financing and
provision of education in Kenya is a partnership between the government, households and
communities, donors and private investors. Private education is entirely financed by the
households and the private sector. There are no clear standards of sharing the education costs
1http://unesdoc.unesco.org/images/0012/001211/121147e.pdf accessed on 17th March, 2014.
2 http://go.worldbank.org/F5K8Y429G0 accessed on 17th March, 2014.
2 | P a g e
across the stakeholders, resulting into high education cost burden on all the stakeholders,
especially households and the government (GOK, 2008).
The Constitution of Kenya 2010 provides that every Kenyan child has the right of access to basic
education. In 2003, Kenya introduced FPE in all public primary schools. Among the objectives
of FPE is to increase enrolment, transition and completion rates; to reduce expenditures by
households on primary education (GOK, 2012a). The FPE programme is meant to reduce the
cost of education previously borne by households which hindered children especially from poor
backgrounds to access education. In this regard the effort put in provision of free primary
education by the government is noticeable in the budgetary allocations to the education sector.
The Government has made significant investment in providing access to basic education through
provision of capitation grants, infrastructure development, teacher employment and training,
instructional material development, among others. It spends about 6.5% of its GDP on education
and these budgetary resources have been growing in real terms maintaining an average of 20
percent share of the budget (GOK, 2012b).
The total expenditure in education grew from around Kenya Shillings (KES) 65 billion in the
Financial Year (FY) 2002/03 to roughly KES 253 billion in the FY 2013/14, with primary
education receiving around KES 22.8 billion to approximately KES 99 billion in the same
financial years respectively (See Appendix Table A1).
At inception of FPE, the government started paying one thousand and twenty shillings (KES.
1,020) for each child per annum as capitation grant. The average annual unit cost of primary
education is estimated at KES 11,000 per child. Households pay various costs such as boarding
and tuition fees for up to KES 13 billion and spends KES 24 billion for the purchase of uniforms,
school supplies, transport services or extra-tuition. The net expenditure of households amounts to
KES 109.5 billions, totaling 33.6% of total government expenditure (GOK 2013).
As the government continues to commit more resources to the education sector, it is imperative
that expected outcomes and outputs are achieved, i.e. pupil participation and performance.
Households being the main financial partner of government, have to take care of Parents’
Teachers Association (PTA) charges, cost of uniforms, medication, development fees,
examination fees, sports fees, boarding fee, lunch, transportation and other school fees/levies. All
3 | P a g e
these expenditures constitute a cost burden of schooling on households despite the free schooling
intervention which is aimed at reducing the household cost burden of financing education. These
indirect costs pose a negative effect on school participation.
The direct outcome of FPE was increased school participation. Prior to free fee policy, school
enrolments were very low. A study by Bedi et al. (2002) and Kimalu et al. (2001) showed that
Gross Enrolment Rate (GER) dropped from 98 percent in 1989 to 89 percent in 2002 ( GoK
2001). According to the World Bank, (2004) free fee policy in African countries led to a surge in
enrolment, pushing the gross enrolment rate to just over 100%. Enrolment increased from 6
million pupils in the year 2000 to almost 11 million pupils in 2013 (See Appendix Table A2).
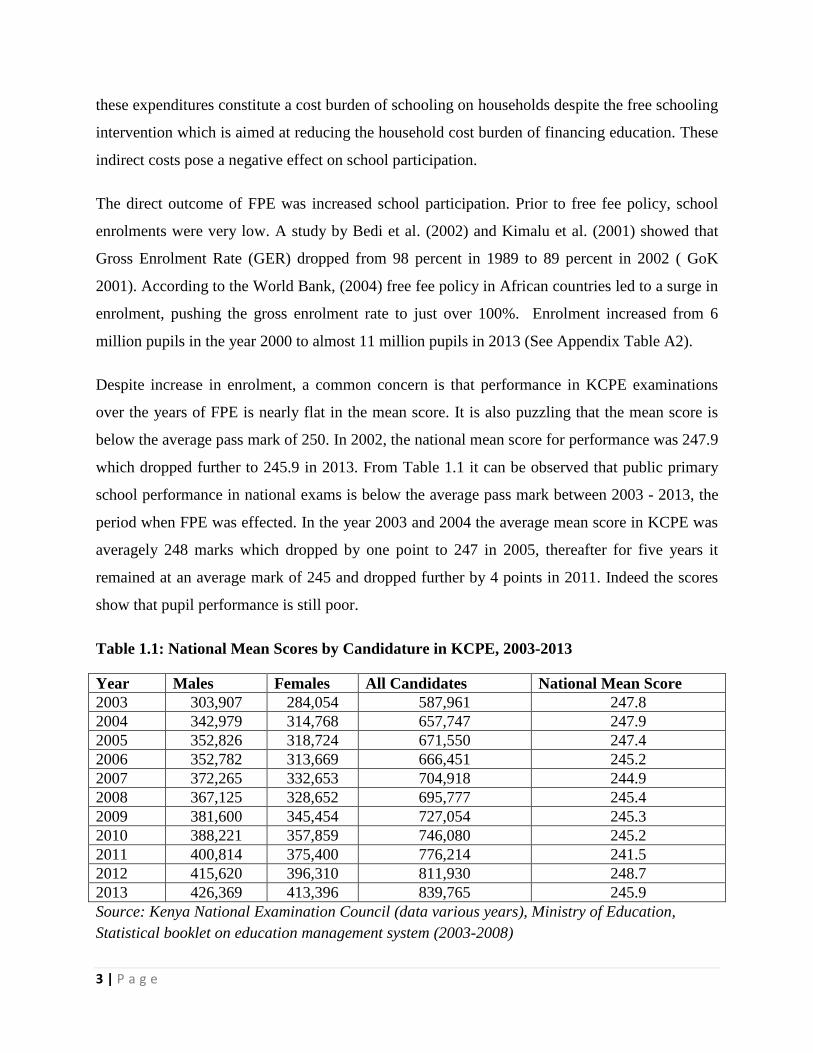
Despite increase in enrolment, a common concern is that performance in KCPE examinations
over the years of FPE is nearly flat in the mean score. It is also puzzling that the mean score is
below the average pass mark of 250. In 2002, the national mean score for performance was 247.9
which dropped further to 245.9 in 2013. From Table 1.1 it can be observed that public primary
school performance in national exams is below the average pass mark between 2003 - 2013, the
period when FPE was effected. In the year 2003 and 2004 the average mean score in KCPE was
averagely 248 marks which dropped by one point to 247 in 2005, thereafter for five years it
remained at an average mark of 245 and dropped further by 4 points in 2011. Indeed the scores
show that pupil performance is still poor.
Table 1.1: National Mean Scores by Candidature in KCPE, 2003-2013
Year Males Females All Candidates National Mean Score
2003 303,907 284,054 587,961 247.8
2004 342,979 314,768 657,747 247.9
2005 352,826 318,724 671,550 247.4
2006 352,782 313,669 666,451 245.2
2007 372,265 332,653 704,918 244.9
2008 367,125 328,652 695,777 245.4
2009 381,600 345,454 727,054 245.3
2010 388,221 357,859 746,080 245.2
2011 400,814 375,400 776,214 241.5
2012 415,620 396,310 811,930 248.7
2013 426,369 413,396 839,765 245.9
Source: Kenya National Examination Council (data various years), Ministry of Education,
Statistical booklet on education management system (2003-2008)
4 | P a g e
Even though, abolition of school fees has led to a positive increase in enrolment, other important
barriers to school participation and pupil performance remain. In particular, while enrolment is
now high on average, there are still regions where enrolment remains an issue especially in arid
and semi-arid regions and over 1 million children are still out of school. Additionally, irregular
attendance amongst those who are enrolled is a major problem across the country. From the
Uwezo report Kenya (2013), it is noted that some learner’s ability to read and write in primary
schools is still below average. This is a pointer to the low quality education offered in schools
thus there is need to examine the causes of poor performance.
Challenges of free primary education
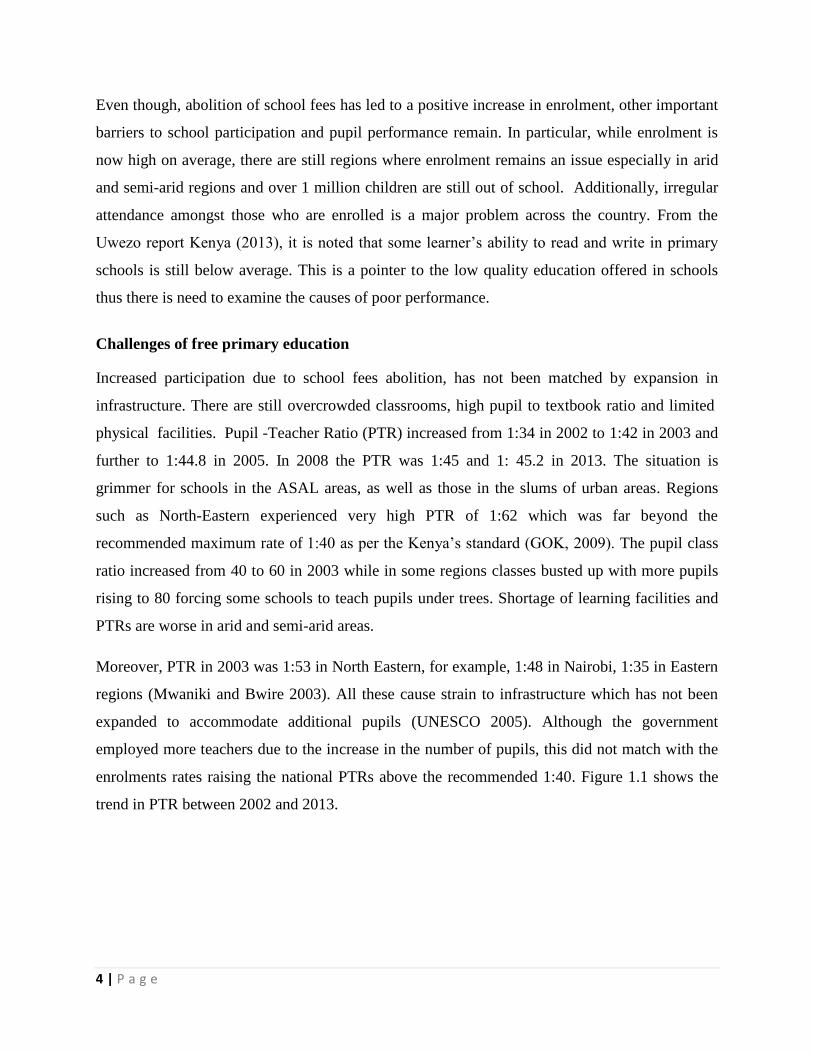
Increased participation due to school fees abolition, has not been matched by expansion in
infrastructure. There are still overcrowded classrooms, high pupil to textbook ratio and limited
physical facilities. Pupil -Teacher Ratio (PTR) increased from 1:34 in 2002 to 1:42 in 2003 and
further to 1:44.8 in 2005. In 2008 the PTR was 1:45 and 1: 45.2 in 2013. The situation is
grimmer for schools in the ASAL areas, as well as those in the slums of urban areas. Regions
such as North-Eastern experienced very high PTR of 1:62 which was far beyond the
recommended maximum rate of 1:40 as per the Kenya’s standard (GOK, 2009). The pupil class
ratio increased from 40 to 60 in 2003 while in some regions classes busted up with more pupils
rising to 80 forcing some schools to teach pupils under trees. Shortage of learning facilities and
PTRs are worse in arid and semi-arid areas.
Moreover, PTR in 2003 was 1:53 in North Eastern, for example, 1:48 in Nairobi, 1:35 in Eastern
regions (Mwaniki and Bwire 2003). All these cause strain to infrastructure which has not been
expanded to accommodate additional pupils (UNESCO 2005). Although the government
employed more teachers due to the increase in the number of pupils, this did not match with the
enrolments rates raising the national PTRs above the recommended 1:40. Figure 1.1 shows the
trend in PTR between 2002 and 2013.
5 | P a g e
Figure 1.1: Trend in pupil teacher ratio between 2002 and 2013
Another challenge FPE has faced is understaffing and lack of teacher motivation. Increased
enrollment at the primary school level has created serious understaffing in a majority of schools.
Some schools in some areas are forced to employ untrained teachers whose qualification and
competency are questionable. This has adverse implications on the morale of teachers and
quality of education due to capacity constraints. Given a large number of pupils per teacher, it
becomes difficult for teachers to give adequate assignments to the pupils, as teaching workload
and marking become overwhelming (UNESCO, 2005). World Bank Report (1986)
acknowledges that teacher satisfaction is largely related to achievement. Contented teachers
would concentrate therefore enhancing academic performance of their pupils.
Absenteeism by both teachers and pupils is also a challenge. High teachers’ rate of absenteeism
yields poor academic results for pupils. When teachers absent themselves from school
frequently, pupils go unattended and do not do well in examinations. Absenteeism by teachers
reduces the amount of instructional time and this result in the syllabi not being completed. This
in return results to lower output of work by the pupils (Ubogu, 2004). On a given day, more than
35
40
45
50
PT
R
2000 2005 2010 2015YEAR
PTR PTR
6 | P a g e
10 out of 100 teachers and children are not in school (Uwezo report, 2012). For pupils,
absenteeism also affects performance negatively. The effect of absenteeism and irregular school
attendance is that materials taught is difficult to understand when studied on one’s own.
Continued loss of classes results to loss of content and knowledge. Assignments and exercises
would not be properly and correctly done leading to poor performance.
Quite a number of pupils absent themselves from school due to various reasons, among them are:
distance from the school, child labor, lack of basic needs, regional conflicts and health issues.
Insecurity, nomadic lifestyle and food shortage has affected school attendance and pupil
participation in ASAL areas. Therefore these regions have not fully reaped the benefits of FPE
(Ogola, 2010).
Kenya Integrated Household Budget Survey (KIHBS) 2006 reported that 19.8 per cent of the
pupils from households interviewed lacked money for school expenses despite the abolition of
school fees. 29.1% of households reported that their parents did not let them go to school, 22.4
per cent households reported that pupils had to help at home. About 9.9 per cent of school age
children had never attended school due to ill health, involving the child or a member of the
family. This is a major challenge because it affects pupil participation and performance. Child
labor is a hinderance for pupils to access education. According to a Child Labor Analytical
Report, conducted by Kenya National Bureau of Statistics in 2008, in the FY 2005/06 about one
million children were reported to be working which constitute 52.2% of children aged 5 to 14
years. These was more severe in marginalised regions where poverty levels are high.
Accountability is another challenge facing implementation of FPE (Ogola 2010). The weak
accountability system is also accentuated by the weak financial and education management
information systems and reporting of government and non-government spending. This makes it
difficult to determine actual spending on education by various government and non-government
agencies; and households at both national and sub-national levels.
1.2 Statement of the Problem
To ensure every Kenyan child get access to education, the government implemented the FPE
programme in 2003. With implementation of FPE programme, there was consensus that the
programme increased education opportunities for Kenyan children as it opened the doors for
7 | P a g e
pupils from poor households who would have missed a chance to receive education (Ogola
2010). This is backed by evidence on increased pupil participation in public primary schools
from around 6.1 million in 2002 to 6.9 million in 2003 suggesting that the costs of schooling
constituted a significant obstacle to more widespread primary school attendance by the poor
households (GoK 2012a).
However, while FPE has increased participation, it has at the same time created several
problems. A sudden increase in pupil population is likely to have far-reaching implications in
terms of existing physical facilities and human resources. This does not augur well for the
government objective to provide quality education. As a result of the high increase in the number
of pupils, classrooms are congested and hence the problem of strain on teaching and learning
facilities. All these factors affect performance of pupils which is an outcome of schooling. The
Uwezo report Kenya, (2012), indicates that around a million children in primary schools could
neither read nor write. This reflects poor performance experienced across the country. In addition
there still exists a wide regional disparity in terms of school participation and performance across
the country (GOK 2008a).
By 2008 it was noted that over 1.5 million eligible children were reported to be still out of school
(GOK 2008a). The most pronounced disparities exist in ASAL regions. The factors differ in
different regions because of such parameters as different socio-economic status of different
regions, leadership trends of the region and the geographical location (Sifuna 2005b). The
2013/14 Education For All (EFA) Global Monitoring Report demonstrates that MDG goal 2 on
UPE will not be fully achieved globally by 2015, since millions of children are not accessing
education and also the performance is poor.
There seems to be a gap between the intents of the FPE in Kenya and the observed achievement
so far since some children are out of school and the performance is still below average. In
Kenya, there is a dearth in research on the topic at national level. Most empirical studies in
Kenya have focused mainly on a sub-sample population datasets for particular regions. For
instance, Kimenyi et al. (2010) who examined impact of FPE on enrolment trends and
accountability focused only on school participation in Nairobi region. Ogola (2010) investigated
the challenges in implementing FPE with a focus only on performance. Kabubo-Mariara and
8 | P a g e
Mwabu (2007) focused on determinants of school enrolment and education attainment. Olwande
et al. (2010) evaluated the impact of FPE program. Tooley, et al. (2008) investigated the impact
of FPE in Kibera slums.
Although Ngware et al. (2007) focused on both school participation and performance, they give a
limited scope in terms of geographical coverage. Kanina (2012) also investigated technical
efficiency in Kenya public primary schools for sampled districts. All these studies used sub-
sample data from particular regions, thus the conclusions drawn from these studies may not be
valid to guide in policy interventions at national level. This study addresses these gaps and
investigates the effect of abolition of primary school fees on pupil participation and performance
in Kenyan public schools at national level.
This study addresses the following research questions:
(i) Does abolition of school fees result to deterioration of pupil participation in primary
education?
(ii) Does abolition of school fees result to deterioration of performance in public primary
education?
(iii) What policy options would improve participation and performance in public primary
education?
1.3 Research Objectives
The main objective of the study is to examine the effect of abolition of school fees on primary
pupil participation and performance in public primary schools in Kenya.
The specific objectives of the study are to:
1. Investigate the effects of abolition of school fees on pupil participation in public primary
schools.
2. Examine the effects of abolition of school fees on performance in public primary schools;
and
3. Suggest policy implications for improving pupil participation and performance in public
primary schools.
9 | P a g e
1.4 Justification of the Study
Knowledge of school participation and performance as well as the possible causes of poor
performance in the education sector at national level can assist in formulation of government
policies that will guide in achieving better results. The study could help policy makers, scholars,
stakeholders, teachers, parents and students to identify the problems and give recommendations
on improving outputs in the education sector in tandem with increased government expenditure.
The study could also add to data and literature on effects of FPE in Kenya. The study also forms
a basis for further research for scholars interested in the subject.
1.5 Organization of the Study
Following this introduction, the rest of the project is structured as follows: chapter two presents a
review of theoretical and empirical literature pertinent to the study as well as an overview of the
same. Chapter three is methodology which outlines the theoretical framework, model
specification, definition and measurement of variables and sources of data used in the study.
Chapter four presents results and discussions while five provides summary, conclusion and
policy interventions.
10 | P a g e
2. CHAPTER TWO: LITERATURE REVIEW
This chapter gives a review of theoretical and empirical literature on the effects of abolition of
primary education school fees and other factors on pupil participation and performance. It also
gives a summary of the literature review highlighting the key issues in the literature and indicates
potential contribution of this study to the existing literature in Kenya.
2.1Theoretical Literature
The human capital theory suggests that schooling is considered as one of the most important
means of raising worker productivity (Becker, 1962). According to Schultz (1961), human
capital is the capacity to adapt with the changing environment and thus education leads to an
improvement in the quality and level of production which is associated with higher average level
of human capital formation and lower wage inequality. Mincer, (1976) shows that one way of
investing in human capital is through education, because education links life cycle earnings to
the human capital.
Therefore, individuals make choices of investing in human capital based on rational benefits and
costs that include a return on investment. Human capital is seen through schooling which raises a
person’s income after netting out indirect and direct costs of schooling, The benefits of schooling
have to be comparable with these foregone earnings, thus should lead to a proportional increase
in earnings in the future (Gertler and Glewwe, 1990).
As a result of benefits from education, people are investing in education to maximize earnings
(Becker, 1962). For instance knowledge and technical skills, for example, lead to greater
productivity, higher incomes and generation of valuable ideas which are beneficial and vital to a
nation's growth. Returns to schooling are a useful measure of productivity of education and
incentive for individuals to invest in their own human capital. Thus public policy needs to heed
this evidence in the design of policies and crafting incentives that both promote investment and
ensure that low income families make those investments (Psacharopoulos and Patrinos, (2004).
In addition to private benefits derived from education, investing in education also derives high
social returns (World Bank, 1995; Psacharopoulos, 1994). Public education not only rewards the
11 | P a g e
educated individuals, but education it as well creates a range of benefits that are shared by
society at large. There is strong emphasis on primary education, because it is proved to be the
most socially profitable of the three levels of education in developing countries (Mingat 1995;
Becker, 1975). The social rates of return include crime reduction, better health, increased citizen
participation on the growth and productivity of the overall economy (Behrman and Knowles
1999).
The social return to education is very important for assessing the efficiency of public investment
in education. Becker (1975) shows that public agencies spend in education to attain the social
returns benefits. This is evident as governments are heavily involved in the financing and
delivery of education and training because of high social rates of return (Mincer, 1976; Becker,
1962; Schultz, 1961; Behrman and Knowles, 1999; Psacharopoulos and Patrinos, 2004). In this
regard, Governments have implemented free fee policies or subsidized education in many
countries (Becker, 1962). These subsidies cater for direct costs of schooling and are based on
various inputs in the education process.
According to Hanushek (1971, 1979); Summers and Wolfe (1977) and Hamilton (1983),
education financing should be considered as a fixed input in the production process. Other inputs
include number of teachers, number of classes, quality of teachers, learning and teaching
facilities. These inputs are converted to produce a range of outputs through the education
process. Education outputs can be categorized as literacy, numeracy and test scores among
others. Different scholars will use diverse outputs. Mincer (1970) and Psacharopoulos and
Patrinos (2004) use school attainment as an output measure of individual skill.
Borrowing from the equilibrium model on demand and supply and using the model in the
education context, high prices on school fees lowers pupil participation on the demand side,
whereas on the supply side, subsidized education systems and high income for households
increases enrollment (Becker, 1962). By eliminating school fees FPE is expected to increase
enrolment.
From the theoretical review, education is seen to have both private benefits and high social
returns. The governments’ objective in subsidizing education is to ensure that every child, of
school going age accesses quality education. However, many children do not have equal
12 | P a g e
opportunities to learn and are not likely to attend school full time since the government only
subsidizes direct operating costs of primary educational institutions. Thus households are left to
care for the indirect costs which have a significant hindrance to pupil participation in education
(Olwande et al. 2010).
Moreover, as long as acquisition of education requires households to spend on indirect costs,
children from poor families would be barred from participating in schooling since these costs are
a significant determinant of pupil participation in schools. These indirect costs are a burden that
is often greatest for the poorest families which in turn defeats the aim of FPE. These issues raise
critical questions on whether the FPE programme will achieve universal and equitable access to
primary education for all.
2.2 Empirical Literature
Participation
There exist a number of studies on the effects of subsidized fees in public primary schools on
enrolment and performance. However these studies produce mixed results. Some studies showed
significant relationship between cost of schooling and school participation. An analysis by World
Bank strategies in education, tuition fees and education levies have been censured for reduced
enrolments (World Bank, 1995). The government is the principal, if not the sole, provider of
education in most developing economies.
Thus many governments offer educational opportunities at subsidized costs or at no cost, in order
to promote enrollment. Gupta et al. (1999) study on the effects of higher spending on education
and health care used ordinary least square (OLS) regression on a cross sectional data from 50
developing economies. The findings point out that greater public spending on primary education
has a positive impact on gross enrolment. The results also showed that enrollment is affected by
factors such as household income, urbanization, adult illiteracy, access to safe sanitation and
water, and health thus cost of schooling alone cannot be the single-most important factor.
Using panel data for four African countries (South Africa, Algeria, Nigeria and Egypt) from
1990 to 2002, Anyanwu and Erhijakpor (2007) investigated the relationship between government
expenditure on education and enrolment at the primary and secondary school levels. Results
13 | P a g e
provided support for the positive relationship between government expenditure on education and
education attainment.
Huijsman, et al. (1986) empirical analysis of college enrolment in the Netherlands, found that
enrolment rates of first-year students over the period from 1950 until 1982 were positively
affected by financial aid but no significant influence was found for tuition fees. This result is
supported by Canton and de Jong (2005) who studied enrolment of students as a percentage of
the number of qualified secondary school graduates between the period of 1950 to 1999. While
financial support for students is shown to have a positive impact on enrollment rates, no
significant influence was found for tuition fees.
In Uganda, Deininger (2003) found that the introduction of free primary education was
associated with a significant increase of school participation in primary education by the poor
and that the school fees decreased significantly. He also found that school attendance increased
dramatically for girls aged 6 to 8 years and that the household expenditure on primary schooling
decreased by about 60 percent between 1992 and 1999. Although there was empirical evidence
indicating a significant increase in enrollments just after the adoption of universal primary
education, it was too early to evaluate the impacts of the UPE on the overall educational
attainments.
Kabubo-Mariara and Mwabu (2007) focused on determinants of school enrolment and education
attainment in Kenya and used probit and ordered probit methods to model enrolment and
attainment respectively. Their study found out that cost of schooling is one of the factors of
schooling which hinder students from accessing and completing education. The study also found
that besides cost of schooling, other factors that affect demand for education in Kenya include;
education level of a parent, distance to school, cognitive ability and child characteristics.
Olwande et al. (2010) evaluated the impact of FPE program using panel data from about 1500
rural Kenya households from 2000 to 2007, to analyze enrolment trends, grade progression and
transition rates. The study found that increase in enrolment was attributed to the FPE programme
implementation and the primary education sensitization programme. They also found that grade
progression could indicate declining quality of primary education as a result of overcrowding,
high pupil teacher ratio and inadequate primary school infrastructure which was not matched by
14 | P a g e
increased enrolment. Ogola (2010) looked at ways of overcoming the obstacles that face FPE in
the Kenyan public primary schools. Using Ordinary Least Squares (OLS) method he found that
enrolment increased tremendously especially at the inception of FPE since pupils who had
dropped out of school due to school fees challenges and those who had never accessed school
were the primary entrants thus an increased gross enrollment rate.
Despite the government’s spending on education to ensure every child accesses education, the
funding is not adequate to meet all the schooling costs. This possibility has led to households to
supplement the remaining cost of schooling which is not easy for poor households since they
consider provision of free primary education as a goal in itself. Even under the FPE policies, the
remaining private costs of education are still impediments for enrolment. The FPE policy only
subsidizes direct schooling costs, leaving other costs to be borne by households and families.
Klees, (1984); Cornea, Jolly and Stewart, (1987), argues that raising fees will reduce educational
attainment among the poor and thus aggravate inequality.
There is a positive relationship between household income and schooling (Glick and Sahn, 2000,
Reche et al. 2012). This is because it may be hard for poor households to afford the direct and
indirect costs of schooling and also such households may be constrained in their ability to
borrow to cover the costs. Normally, a household would not send its children to school if it falls
into poverty. In fact due to low level of incomes many parents pull children out of schools. Child
labor prevents children from benefiting fully from school by increasing the opportunity cost of
education and reducing child schooling (Ray, 2000).
From the literature reviewed it is evident that an increase in enrolment is associated with
subsidized schooling cost. Kanina (2012) investigated the technical efficiency and the changes in
total factor productivity of public primary schools Kenya and found that FPE significantly
increased pupil participation although enrolment levels should be addressed by increasing the
number of classes as well as the number of teachers. However there are also a number of studies
that find negative influence of direct costs on enrolment. For instance, in analyzing impact of
Free Primary Education in Kenya: Bold et al. (2011) examined enrolment trends and
accountability. The study found that while inequality in education access declined with
15 | P a g e
implementation of FPE, there has been massive transfer of pupils from public schools to private
which has been attributed to decline in education quality in public schools.
Tooley, et al. (2008) in the Impact of free primary education in Kibera slums of Nairobi in
Kenya corroborates Bold et al. (2011) findings by reporting that children from the slum were not
reaping the expected benefits of FPE. Instead, parents are opting to enroll their children in
private schools where they are required to pay tuition fees. The argument is that public schools
started performing poorly after the introduction of FPE in 2003.
The evidence that subsidized education affects enrolment either positively or negatively is
however not as clear- cut as one might think in light of literature reviewed so far. Some studies
found negative significant enrolment (Bold et al. 2011; Tooley, et al. 2008) whereas other studies
positive significant enrolment (Olwande, et al. 2010; Ogola, 2010; Deininger, 2003; Kabubo-
Mariara and Mwabu 2007).
Different methods and techniques have been applied in the empirical studies above. These
techniques have their strengths and weaknesses. Some studies have used only descriptive
statistics in analysis, (Bold et al. 2011; Reche, et al. 2012). Nonetheless descriptive statistics
show association and does not show the causal relationship between FPE and variables. The
descriptive statistics may however form the basis of the initial description of the data as part of a
more extensive statistical analysis which may provide insight to policy makers and scholars in
order to improve the weak areas. Other studies combined descriptive statistics and OLS
regression analysis, (Deininger, 2003; Huijsman, et al. 1986; Gupta, et al. 1999; and Canton and
de Jong, 2005). Kabubo-Mariara and Mwabu (2007) used descriptive statistics and probit
ordered probit method. Olwande, et al. (2010) used descriptive statistics and propensity score
matching in their analysis.
Most of the studies on subsidized education have used secondary data. This is because secondary
data enables researchers to analyze information over extended time periods. This kind of
information is not readily available in primary data sources. For instance Bold et al. (2011) used
survey data by KIHBS 2005/06 for analysis of education expenditure and enrolment and test-
score data from the Kenya Certificate of Primary Education (KCPE) exam. On the other hand
primary data addresses specific research issues. Primary data enables the researcher to have a
16 | P a g e
higher level of control over how the information is collected. Olwande et al. (2010) used primary
data of the school going age children from about 1500 rural households to analyze the effect of
FPE while Ngware et al. (2007) used primary data on various variables including availability and
use of textbooks, teacher in-service training, teacher pre-service training, class size from a total
of 448 primary schools in Kenya.
For a better understanding on the effects of FPE on the education outcomes, some researchers
chose to use data from several surveys. For instance Kabubo-Mariara and Mwabu (2007) used
Welfare Monitoring Survey (WMS III) data collected from a sample of 50,713 individuals from
10,873 households. Reche et al. (2012) used a sample survey in a sample of 6 head teachers, 51
teachers and 146 standard eight pupils in public day primary schools in Mwimbi Division,
Tharaka Nithi county from 2005 to 2013. Tooley, et al. (2008) used survey data from Nairobi,
Kibera slums. Other studies used cross country data (Anyanwu and Erhijakpor, 2007; Gupta et
al. 1999).
From the literature reviewed, there is a gap in the studies on the effects of abolishing school fees
on school participation and performance in public primary schools. Because the studies carried
out in Kenya either sampled a particular region or used a different methodologies and also
produced mixed results. Thus this study will examine the effects of abolishing school fees in
public primary schools on participation and performance in all counties in Kenya to give a
national perspective.
Performance
From the literature review, there are various factors that contribute to pupil performance; among
them; learning materials and facilities, health, safety, cognitive ability, teacher characteristics,
parental involvement and behavioral characteristics of individuals which are pre-conditions that
can hamper or improve performance (Hanushek, 1986; Hattie’s, 2003; Woolley and Grogan-
Taylor 2005; Wossmann, 2000, 2012;Boissiere, 2004 and Bowen et al. 2008).
Parental involvement in public schools has been documented as academically beneficial on early
children’s literacy and participation (Quiocho and Daoud, 2006; Bowen et al 2008; Brannon,
2008:57; Avvisati et al. 2010). When parents understand the importance of education, they will

17 | P a g e
work in consultation with the teachers in order to understand their children better. This
relationship between parents, teachers and pupils will realize good performance and higher
school participation. Most studies have found that in subsidized education systems, parents
participation in school managagent and accountability goes down (Epstein et al. 2001 and Kimu,
2012). Since FPE was implemented, parental involvement in public schools education has gone
down especially in management and accountability (Kimu, 2012).
Kimu (2012) shows that before FPE, parents catered for all education costs; hence they were
fully involved in the education system in terms of management and accountability. With FPE in
Kenya, parents and communities feel that they have no stake in school governance now that the
government is responsible for everything. Under such an environment, parents become passive
in decision making and school activities which might lead to low performance and high levels of
pupil dropout.
Poor performance is also associated with limited learning materials and facilities (Riddell and
Nyagura1991). Riddell and Nyagura (1991) study focused on the causes of poor achievement in
Zimbabwe. They show thatadequate learning materials and facilities such as availability of
sufficient textbooks and well trained and experienced instructors will improve pupil
performance. Hanushek, (1986); Wossmann, (2000) and Boissiere, (2004) found that teachers
and class size appears to be the most important ingredient that affect performance. These results
suggest that larger class sizes are associated with better achievement.
Using a combination of inputs among them developed curriculum, sufficient materials for
instructing students, ample time for teaching and learning will improve performance (Levin and
Lockheed 1991). Monk (1994) supports the importance of teachers in subject preparation and
argues that teachers who have taken course work in pedagogy will have a positive impact on
pupils’ performance.
In Kenya, Ngware et al. (2007) applied an educational production function using KCPE mean
score as the output while inputs included pupil teacher ratio, pupil toilet ratio, class size,
textbook pupil ratio, utilization of textbooks, existence of school feeding programme, number of
permanent classrooms, teacher qualification and student characteristics to analyze factors
determining performance of primary schools in Kenya. Using OLS regression, results indicated
18 | P a g e
that textbooks utilization, teacher characteristics, school facilities and existence of school feeding
programmes had a major effect on students’ performance in the KCPE. Pupil teacher ratio had a
negative effect on performance. For pupils from poor areas, the existence of school feeding
programme was positively related to improve KCPE scores.
Glewwe, et al. (2002) study on textbooks and test scores in Kenya found that the provision of
textbooks to Kenyan schools increased test scores by about 0.2 standard deviations with a greater
impact among students who had access to textbooks comparing to those students who did not
have access to textbooks. They also mention that Kenyan textbooks are written in English and
reflect a curriculum designed for elite families in Nairobi, which may be more difficult for rural
children to understand.
A study by Chuck, (2009), investigated how FPE impacts academic performance in Nairobi
Public Schools. The data used in this study covered from 2001 to 2009. Using OLS, the study
shows that FPE has benefited schools but has exacerbated disparities in education offered at
various public primary schools. Schools located in middle-income areas with the potential to
offer quality education, saw an increase in performance. Different areas have different factors
that affect performance. For instance in ASAL areas, pupils might not attend classes because of
various factors besides FPE. Among these factors are: distance to school, lack of transport, lack
of food etc. which affects performance negatively (Chuck, 2009). Thus it is important to
understand the dynamism of these areas and study each on its own.
Reche, et al. (2012) on the factors contributing to poor performance in Kenya primary education
found that understaffing, inadequate monitoring by head teachers, inadequate learning resources,
high teacher turnover rate, inadequate prior preparation, lack of motivation for teachers, huge
workload, nonattendance by both pupils and teachers, pupils lateness, lack of support from
parents all contribute to poor performance in primary national examination.
Some studies found a negative relationship between abolishing school fees and performance
(Noss, 1991; Mingat& Tan, 1992). Lee and Barro (1997) study on schooling quality in a cross
section of countries, showed that pupil-teacher ratio has a negative and significant impact on
achievement. Resources alone are no guarantee for higher outputs of education (Todd and
Wolfing, 2003; Alton-Lee, 2002; and Bowen, 2008).
19 | P a g e
2.3 Overview of Literature
Different studies have been conducted investigating the relationship between abolishing school
fees and education outcomes (participation and performance). In Kenya, researchers have based
their studies using different methodologies on a particular population (Kimenyi et al. 2010;
Ngware et al. 2007; Reche et al. 2012; Kabubo-Mariara and Mwabu 2007; Sifuna 2005b; Ogola,
2010; and Olwande et al. 2010) to investigate the effects of FPE. However, these studies
produce mixed results in their empirical findings. This makes it difficult to generalize the results
to the entire country. There is need for national level empirical studies to examine the effect of
abolishing school fees on primary education and its implications on the overall performance
using test scores and school participation in Kenya. This study will address this gap and gives
insight for policy formulation at national level.
20 | P a g e
3. CHAPTER THREE: METHODOLOGY
This chapter presents the methodology and data that are used in the study. It provides theoretical
and empirical framework of the model and how the data obtained is presented and analyzed.
3.1 Theoretical Framework
Two of the first basic models on the production of human capital are found in Becker (1962) and
Mincer (1958), which link the life-cycle of earnings to the investment in human capital. Parents
plan for the total investment in a child's education based on assumptions about future costs and
benefits. A model of the demand for schooling is applied by specifying the utility obtained from
each schooling option (Gertler and Glewwe 1990). Every household is assumed to have a utility
function that depends on the human capital of its children and the consumption of goods and
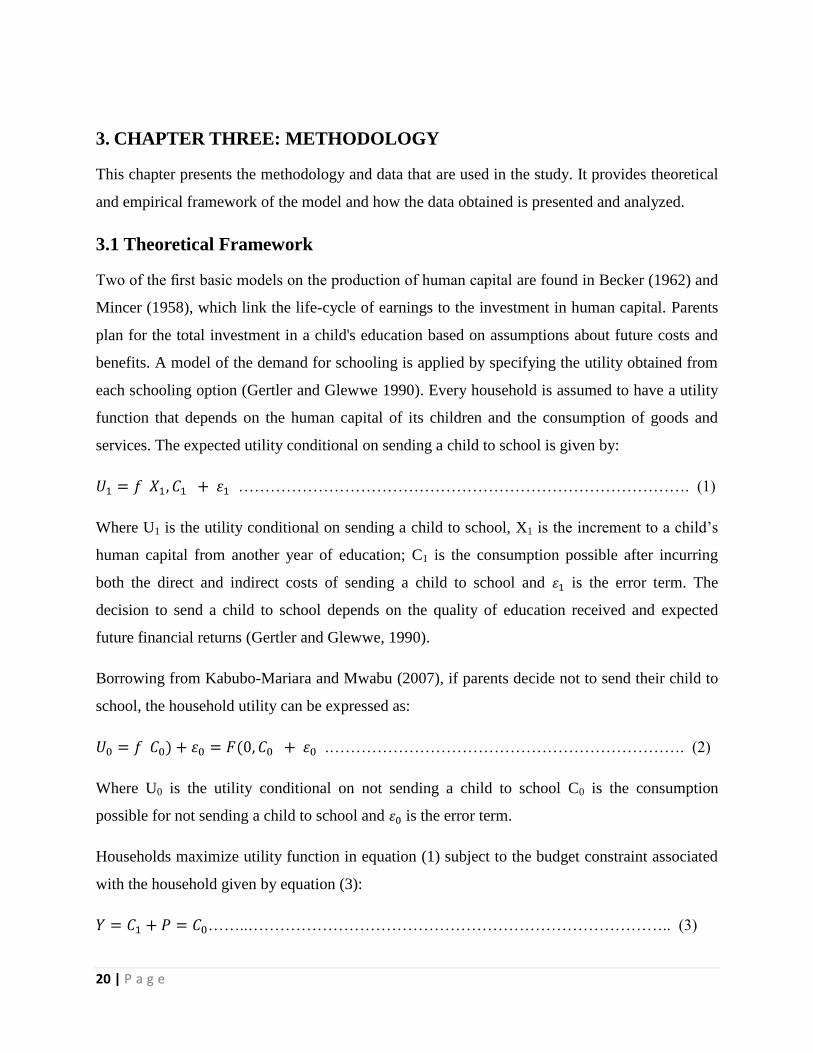
services. The expected utility conditional on sending a child to school is given by:
…………………………………………………………………………. (1)
Where U1 is the utility conditional on sending a child to school, X1 is the increment to a child’s
human capital from another year of education; C1 is the consumption possible after incurring
both the direct and indirect costs of sending a child to school and is the error term. The
decision to send a child to school depends on the quality of education received and expected
future financial returns (Gertler and Glewwe, 1990).
Borrowing from Kabubo-Mariara and Mwabu (2007), if parents decide not to send their child to
school, the household utility can be expressed as:
.…………………………………………………………. (2)
Where U0 is the utility conditional on not sending a child to school C0 is the consumption
possible for not sending a child to school and is the error term.
Households maximize utility function in equation (1) subject to the budget constraint associated
with the household given by equation (3):
……..…………………………………………………………………….. (3)
21 | P a g e
Where P includes both direct and indirect costs of sending the child to school, and Y is the
household disposable income.
The unconditional utility maximization problem can be derived by combining (1) and (2), given
the constraints defined in (3), to obtain:
………………………………………………………………………… (4)
Where U* is maximum utility, and , and are the conditional utility functions specified in (2)
and (3).
To achieve desired utility from education, Schultz (1961) and Becker (1962) showed that it is
important to include the production process in schooling. A production function states the
quantity of output that a firm can produce is a function of the quantity of inputs to production
which a firm employs. In education context, the common inputs used include parental
characteristics and early home environment, teacher characteristics, socioeconomic factors and
pupil characteristics. Thus the production function can be expressed in linear form as:
………………………………………………………………………. (5)
Where Q represents education outcomes
represents the education inputs (i.e. cost, socio economic characteristics among
others).
This modification yields a theoretical economic model of the behavior of schools that gives
observations related to school organization, management and governance, which are important to
the delivery of quality education services. Following Todd and Wolpin (2003), this framework
specifies a level of achievement measured by students’ test scores, as the typical output, and
characteristics of the teaching and learning environment as typical inputs.
22 | P a g e
3.2 Model Specification
This study examines the effects of abolition of school fees on participation and performance of
pupils in public primary schools in Kenya.
We first start by identifying the primary schooling performance indicators and compare their
effects on pupil performance in public primary schools. We also analyze the impact of FPE on
pupil participation.
To examine the relationship of primary schooling outcome and cost of schooling, the study
adopts a modified model applied by Ngware et al. (2007) in examining the effects of FPE in
Kenya.
The performance model 1 can be represented in a mathematical expression as:
………………….. (6)
Where: i denotes county level (i=1….., n) and t denotes time period.
Z is county i KCPE mean score, analogous to Q in equation (5)
PTR represents pupil teacher ratio for county i
PBR represents pupil book ratio for county i
NS represents number of schools in county i
GH represents class size for county i
is a dummy variable for FPE where D=1 from 2003-2013, otherwise =0 from 1998 -2002
is an error term
Since this study uses panel data, the cross- section units consist of all counties hence the use of
fixed effects model. Fixed effects regression helps us control for omitted variables that differ
between cases but are constant over time. It allows us to use the changes in the variables over
time to estimate the effects of the independent variables on our dependent variable. As a result,
the estimated coefficients cannot be biased because of omitted time invariant characteristics. We
23 | P a g e
run Hausman test to investigate whether the error terms are correlated and that those time-
invariant characteristics are unique to the individual counties and should not be correlated with
other individual characteristics.
Since our dependent variables are two (performance and pupil participation), we run another
model for pupil participation.
Our model 2 is represented as:
…………………………… (7)
Where:
W represents pupil participation in county i at time t, analogous to Q in equation (5), all the other
variables are as earlier defined.
3.3 Definition and Measurement of Variables
This subsection presents the definition of variables used in the analysis, measurement and the
expected signs.
Dependent Variable
The study focuses on effects of abolishing school fees in public primary schools on pupil
participation and performance. In this study, the dependent variables are performance which is
measured by KCPE mean scores and pupil participation which is measured by number of pupils.
Independent Variables
Selected explanatory factors included in this study are: pupil teacher ratio, pupil textbook ratio,
class size and number of schools. Other factors that are known to affect school participation and
performance such as household characteristics are not included in this study because data was
not available at the county level.
Variable definitions and expected signs are presented in table 3.1.
Table 3.1: Variable Definition and Hypothesized Relationships.

24 | P a g e
Variable Measurement Expected sign and literature source
Pupil-teacher
ratio
Proxy for teacher
quality.
This is the average number of pupils per teacher. It’s
computed by dividing the total number of pupils in a
county by the number of teachers in the county. A
lower pupil teacher ratio has a positive correlation with
pupil performance. It is expected that quality and
adequate number of teachers will improve performance
(Todd and Wolfing 2003; Ngware et al. 2007; Olwande
et al. 2010; Reche et al. 2012 )
Pupil-textbook
ratio
Proxy for quality of
education
This is the average number of books per pupils in a
county. It is expected that if there are more books, then
performance would improve (Gupta, et al. 1999;
Glewwe, et al. 2002; Ngware, et al. 2007; Chuck, 2009)
Class size Proxy for quality of
education
This is the number of pupils per classroom in a county
in a school. It’s computed by dividing the total number
of pupils in the county by the number of classrooms in
the county and it is often expressed as a ratio of pupils
to classes. Classes refer to the streams in place with an
average enrolment of 40 pupils. It is expected that a
class with 40 or less pupils will have better
performance than bigger classes, since the teacher will
attend to each pupil (Hanushek, 1986; Wossmann,
2000; Boissiere, 2004; Ngware et al. 2007; Kanina,
2012).
Primary
schools
Number of schools This refers to the total number of schools in a county
County size Number of pupils
enrolled in primary
schools
This refers to the total number of pupils in a county
Source: Author’s construction
25 | P a g e
3.4 Sources of Data used in the Study
The study uses secondary data from three different sources. Data on county enrolment, number
of public primary schools, number of textbooks and class size for the period 1998 to 2013 was
obtained from the Ministry of Education, Science and Technology. Data on pupil performance in
KCPE for the period 1998-2013 was provided by the Kenya National Examination Council
(KNEC) and data on teachers from the Teachers Service Commission (TSC).
26 | P a g e
4. CHAPTER FOUR: RESULTS AND DISCUSSION
This chapter discusses and presents the results of the study. First, summary descriptive statistics
of the data are presented. Next, Hausman results of primary schooling outcomes (pupil
performance and participation) followed by the regression results using the fixed effects model
analysis are presented and discussed.
4.1 Descriptive Statistics
Overview of the summary statistics of the variables used in the analysis is presented in table 4.1.
Table 4.1: Descriptive Statistics
Variable Mean Std. Dev Min Max
County mean score 131.8 110.9 109.6 287.1
No of pupils 154979.0 106732.3 10428.0 623485.0
No of teachers 3806.0 2448.3 189.0 24362.0
No of schools 393.0 247.1 49.0 2463.0
No of classes 4194.0 2606.8 540.0 11016.0
Pupil teacher ratio 43.5 39.9 10.9 1074.4
Textbook pupil ratio 1.5 6.5 1.2 1.10
The study was based on 47 counties over a period of 16 (Years) (752 observations). It is
observed that the county KCPE mean score was estimated at 131.8 where the lowest county
KCPE mean score was 109.6 and the maximum was 287.1. Before 2003, average KCPE mean
scores was 350 marks out of 700 marks. Thus this study has weighted the KCPE mean score to
reflect the average of 250 marks out of 500 marks. This suggests a wide variability in
performance of pupils across counties in Kenya. The average number of pupils per county is
154,979 with 10,428 and 623,485 as the least and maximum number of pupils in a county
respectively. These statistics probably reflect the differences in population densities across
Kenya. The average number of teachers per county is 3, 806 with 189 and 24,362 as the least and
maximum number of teachers in a county respectively. This illustrates a wide disparity that
exists in pupil teacher ratio across the counties in Kenya.
4.2 Hausman Test Results
We run Hausman test to investigate whether the error terms are correlated and that those time-
invariant characteristics are unique to the individual counties and should not be correlated with
27 | P a g e
other individual characteristics. The null hypothesis is that the preferred model is fixed effects
vs. the alternative, the random effects. It basically tests whether the unique errors i are
correlated with the regressors, the null hypothesis is that they are. We run a fixed effects model
and save the estimates, then run a random model and save the estimates, then perform the test.
The results were obtained using xtreg command in Stata as tabulated in table 4.2.
Table 4.2: Hausman Test Results
Coefficients
(b)
Fixed
(B)
Random
(b-B)
Difference
sqrt(diag
(V_b-V_B))S.E.
No of schools -.0344 -.0332 -.0012 .0577
No of pupils .0003 .0002 .0001 .0001
No of classes .0351 -.0067 .0418 .0081
No of teachers .0066 .0048 .0018 .0008
b = consistent under Ho and Ha;
B = inconsistent under Ha, efficient under Ho;
Test: Ho: difference in coefficients not systematic
chi2(4) = 38.15
Prob>chi2 = 0.0000
Since Prob>chi2 = 0.0000 is less than 0.05 (i.e. significant) then we use fixed effects model to
test for (heterogeneity) unobserved variables that do not change over time.
4.3 Correlation Analysis
Table 4.3: Correlation Matrix
Performance No of pupils PTR Pupil class ratio No of schools FPE
Performance 1.0000
Number of pupils -0.0194 1.0000
Pupil teacher ratio 0.0574* 0.0643
* 1.0000
Pupil class ratio 0.0626* 0.1070
* 0.1711* 1.0000
No of schools 0.0659* 0.8306**
-0.0512 -0.0653 1.0000
FPE 0.3348* 0.1231
* 0.01072 0.1902 0.0484 1.0000
*and ** represents low and high levels of correlation between number of pupils which is a
measure of pupil participation and independent variables respectively. Results show that all
independent variables are positively correlated to the number of pupils (dependent variable). The
correlation between number of schools and the dependent variable is very high thus we expect
28 | P a g e
that number of schools has a high level of significance on pupil participation and performance.
FPE also has a positive impact on number of pupils. We expect any interventions put in place to
enhance FPE will have a significant impact on pupil participation.
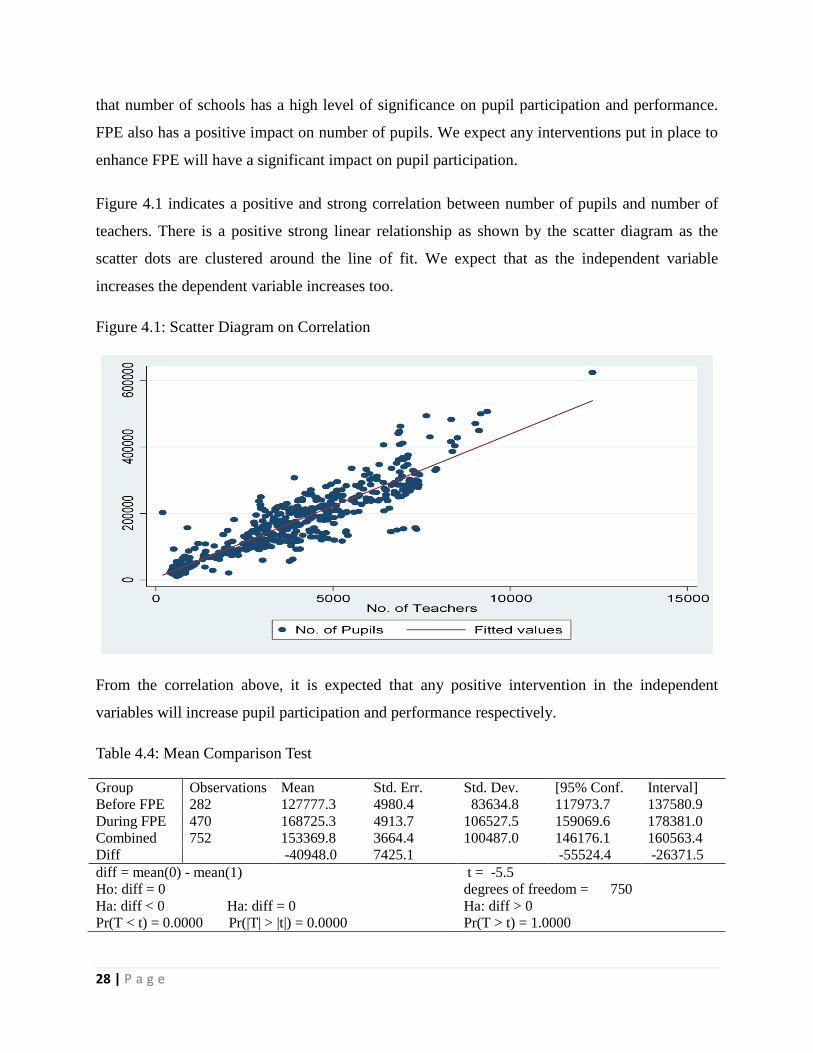
Figure 4.1 indicates a positive and strong correlation between number of pupils and number of
teachers. There is a positive strong linear relationship as shown by the scatter diagram as the
scatter dots are clustered around the line of fit. We expect that as the independent variable
increases the dependent variable increases too.
Figure 4.1: Scatter Diagram on Correlation
From the correlation above, it is expected that any positive intervention in the independent
variables will increase pupil participation and performance respectively.
Table 4.4: Mean Comparison Test
Group Observations Mean Std. Err. Std. Dev. [95% Conf. Interval]
Before FPE 282 127777.3 4980.4 83634.8 117973.7 137580.9
During FPE 470 168725.3 4913.7 106527.5 159069.6 178381.0
Combined 752 153369.8 3664.4 100487.0 146176.1 160563.4
Diff -40948.0 7425.1 -55524.4 -26371.5
diff = mean(0) - mean(1) t = -5.5
Ho: diff = 0 degrees of freedom = 750
Ha: diff < 0 Ha: diff = 0 Ha: diff > 0
Pr(T < t) = 0.0000 Pr(|T| > |t|) = 0.0000 Pr(T > t) = 1.0000
29 | P a g e
It is useful to compare the two distinct periods of before and after FPE was implemented to see
the effect of FPE on pupil participation. From table 4.4, we conclude that there is a difference
between enrolment before FPE and during implementation of FPE programme. We also note that
enrolment increased more during the period of FPE implementation. The results show that the
difference between pre and post FPE in enrolment is statistically significant. The number of
pupils enrolled increased between 2003 and 2013 by average 168,725 pupils, or an average
growth of 26% controlling for other observable factors. The increase in the number of pupils in
absolute terms between 1995 and 2002 has a mean of 127,777 which is equivalent to 3.8%.
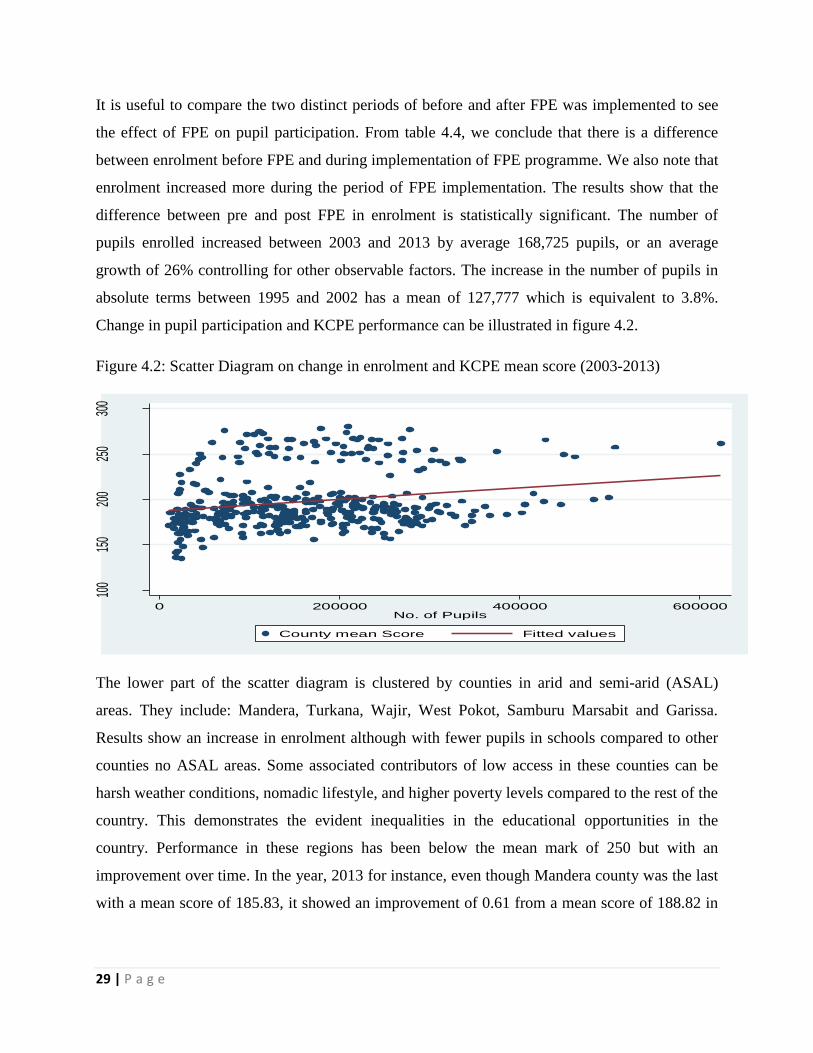
Change in pupil participation and KCPE performance can be illustrated in figure 4.2.
Figure 4.2: Scatter Diagram on change in enrolment and KCPE mean score (2003-2013)
The lower part of the scatter diagram is clustered by counties in arid and semi-arid (ASAL)
areas. They include: Mandera, Turkana, Wajir, West Pokot, Samburu Marsabit and Garissa.
Results show an increase in enrolment although with fewer pupils in schools compared to other
counties no ASAL areas. Some associated contributors of low access in these counties can be
harsh weather conditions, nomadic lifestyle, and higher poverty levels compared to the rest of the
country. This demonstrates the evident inequalities in the educational opportunities in the
country. Performance in these regions has been below the mean mark of 250 but with an
improvement over time. In the year, 2013 for instance, even though Mandera county was the last
with a mean score of 185.83, it showed an improvement of 0.61 from a mean score of 188.82 in
100
150
200
250
300
0 200000 400000 600000No. of Pupils
County mean Score Fitted values
30 | P a g e
2012, a further improvement of 54.09 from a mean score of 134.79 in 2003. We can explain that
these counties started with a lower base mean score.
The middle part of figure 4.6 shows where most of the counties’ cluster. It appears clearly that
many recorded most improvement in the number of pupils taking KCPE examination and the
performance in the KCPE. From our model, the results suggest that FPE led to poor performance
in public primary schools in Kenya.
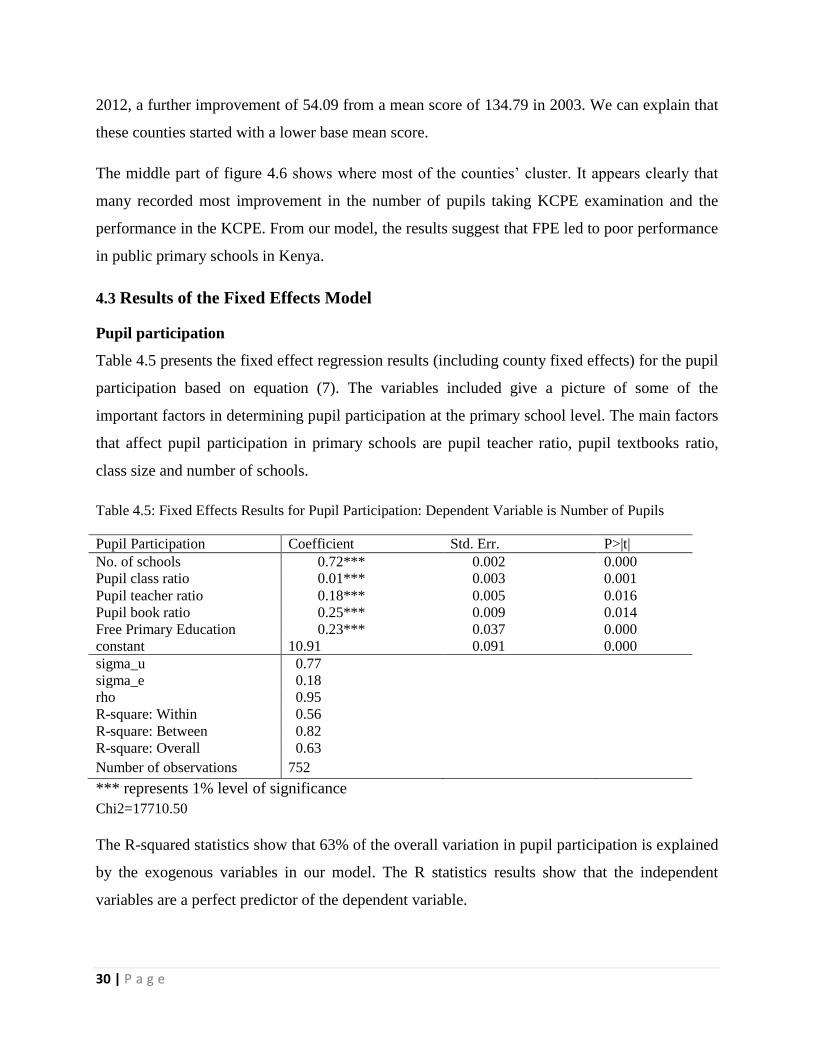
4.3 Results of the Fixed Effects Model
Pupil participation
Table 4.5 presents the fixed effect regression results (including county fixed effects) for the pupil
participation based on equation (7). The variables included give a picture of some of the
important factors in determining pupil participation at the primary school level. The main factors
that affect pupil participation in primary schools are pupil teacher ratio, pupil textbooks ratio,
class size and number of schools.
Table 4.5: Fixed Effects Results for Pupil Participation: Dependent Variable is Number of Pupils
Pupil Participation Coefficient Std. Err. P>|t|
No. of schools 0.72*** 0.002 0.000
Pupil class ratio 0.01*** 0.003 0.001
Pupil teacher ratio 0.18*** 0.005 0.016
Pupil book ratio 0.25*** 0.009 0.014
Free Primary Education 0.23*** 0.037 0.000
constant 10.91 0.091 0.000
sigma_u 0.77
sigma_e 0.18
rho 0.95
R-square: Within 0.56
R-square: Between 0.82
R-square: Overall 0.63
Number of observations 752
*** represents 1% level of significance
Chi2=17710.50
The R-squared statistics show that 63% of the overall variation in pupil participation is explained
by the exogenous variables in our model. The R statistics results show that the independent
variables are a perfect predictor of the dependent variable.
31 | P a g e
When all of the other variables equal zero, the predicted value for pupil participation is 10.91.
The introduction of FPE in 2003 to 2013, has led to increase in number of pupils at one percent
level of significance. From the results, there is a positive relationship between FPE and number
of pupils. The coefficient of FPE is 0.23, so for every unit increase in FPE, we expect a 0.23
increase in number of pupils holding other variables. From the literature review, it is expected
that FPE programme will increase pupil participation. Thus these results are in line with findings
of Boissiere, (2004); Ngware et al. (2007); Ogola, (2010): Olwande, et al. (2010): and Kanina,
(2012). We find that with introduction of FPE, pupil participation increased.
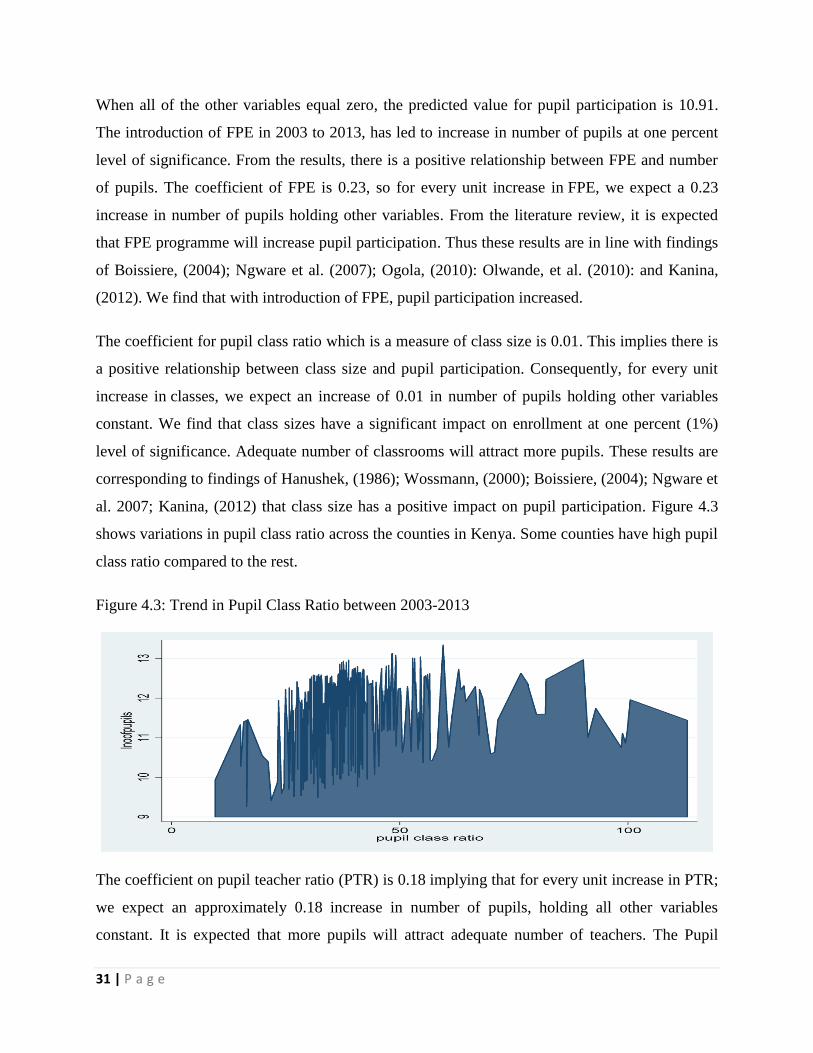
The coefficient for pupil class ratio which is a measure of class size is 0.01. This implies there is
a positive relationship between class size and pupil participation. Consequently, for every unit
increase in classes, we expect an increase of 0.01 in number of pupils holding other variables
constant. We find that class sizes have a significant impact on enrollment at one percent (1%)
level of significance. Adequate number of classrooms will attract more pupils. These results are
corresponding to findings of Hanushek, (1986); Wossmann, (2000); Boissiere, (2004); Ngware et
al. 2007; Kanina, (2012) that class size has a positive impact on pupil participation. Figure 4.3
shows variations in pupil class ratio across the counties in Kenya. Some counties have high pupil
class ratio compared to the rest.
Figure 4.3: Trend in Pupil Class Ratio between 2003-2013
The coefficient on pupil teacher ratio (PTR) is 0.18 implying that for every unit increase in PTR;
we expect an approximately 0.18 increase in number of pupils, holding all other variables
constant. It is expected that more pupils will attract adequate number of teachers. The Pupil
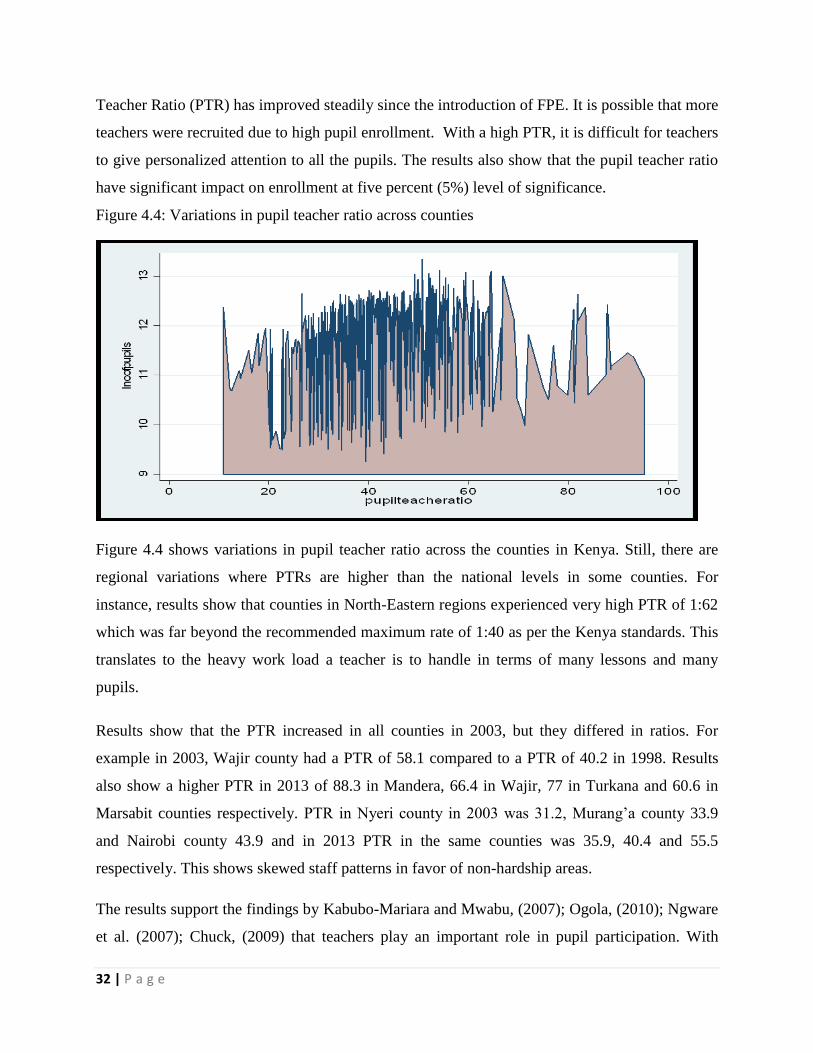
32 | P a g e
Teacher Ratio (PTR) has improved steadily since the introduction of FPE. It is possible that more
teachers were recruited due to high pupil enrollment. With a high PTR, it is difficult for teachers
to give personalized attention to all the pupils. The results also show that the pupil teacher ratio
have significant impact on enrollment at five percent (5%) level of significance.
Figure 4.4: Variations in pupil teacher ratio across counties
Figure 4.4 shows variations in pupil teacher ratio across the counties in Kenya. Still, there are
regional variations where PTRs are higher than the national levels in some counties. For
instance, results show that counties in North-Eastern regions experienced very high PTR of 1:62
which was far beyond the recommended maximum rate of 1:40 as per the Kenya standards. This
translates to the heavy work load a teacher is to handle in terms of many lessons and many
pupils.
Results show that the PTR increased in all counties in 2003, but they differed in ratios. For
example in 2003, Wajir county had a PTR of 58.1 compared to a PTR of 40.2 in 1998. Results
also show a higher PTR in 2013 of 88.3 in Mandera, 66.4 in Wajir, 77 in Turkana and 60.6 in
Marsabit counties respectively. PTR in Nyeri county in 2003 was 31.2, Murang’a county 33.9
and Nairobi county 43.9 and in 2013 PTR in the same counties was 35.9, 40.4 and 55.5
respectively. This shows skewed staff patterns in favor of non-hardship areas.
The results support the findings by Kabubo-Mariara and Mwabu, (2007); Ogola, (2010); Ngware
et al. (2007); Chuck, (2009) that teachers play an important role in pupil participation. With
33 | P a g e
implementation of FPE programme, the number of teachers increased but they were not able to
balance out the increase in enrolment.
The coefficient for Pupil Book Ratio (PBR) is 0.25. The results show that the PBR is significant
at one percent (1%). The results show there is a positive and significant relationship between
PBR and pupil participation. So, for every unit increase in textbooks, we expect a 0.25 increase
in number of pupils holding other variables constant. It is expected that with FPE programme the
government should increase the number of textbooks to match the increased pupil participation.
The government policy on textbooks is to achieve a PBR of 1:2 for lower primary and 1:1 for
upper primary across all counties. The results show that this has not been fully met but there is
an improvement in the ratios. This is because before FPE, parents paid for textbooks which were
a disadvantage to pupils whose parents were most likely unable to buy textbooks especially
pupils from poor households as their parents. With FPE in place, most pupils can access
textbooks although there is still a challenge of loss and tear which is different across schools.
This result is in agreement with results in the literature (Gupta, et al.1999; Glewwe, et al. 2002;
Ngware, et al. 2007; Kabubo-Mariara and Mwabu 2007).
There is a positive relationship between number of schools and number of pupils at one percent
(1%) level of significance. Number of schools has a positive impact on pupil participation across
counties. Hence, for every unit increase in number of schools, we expect a 151.50 increase in
number of pupils holding other variables constant. This probably implies that the schools provide
space to accommodate pupils who are accessing education.
Generally FPE has seen increased pupil participation in the country. However, primary school
enrolment varies across counties. Appendix Table A.3 gives an overview of pupil participation
across counties using xtreg command in Stata. From the results, pupils in Nyandarua, Nyeri and
Uasin Gishu counties are more likely to participate in school than pupils in Kakamega, Bungoma
and Nairobi counties, other factors held constant. In the year 2013, Kakamega county registered
a higher enrolment of 7.2% of the national enrolment figure followed by Bungoma and Nairobi
with a percentage of 5.2 and 4.9 % respectively. The results also show that Lamu county and
Isiolo county have the least enrolment of 0.2% each whereas Tana River, Marsabit and Garissa
registered an enrolment of 0.4% each.
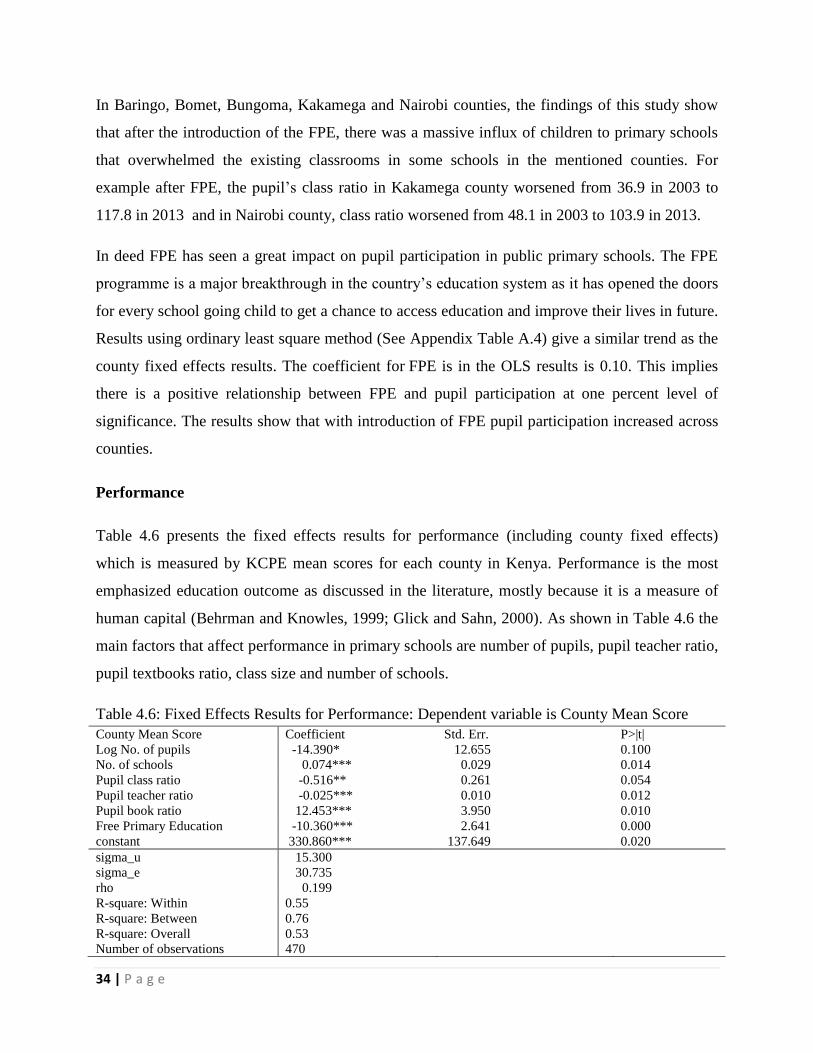
34 | P a g e
In Baringo, Bomet, Bungoma, Kakamega and Nairobi counties, the findings of this study show
that after the introduction of the FPE, there was a massive influx of children to primary schools
that overwhelmed the existing classrooms in some schools in the mentioned counties. For
example after FPE, the pupil’s class ratio in Kakamega county worsened from 36.9 in 2003 to
117.8 in 2013 and in Nairobi county, class ratio worsened from 48.1 in 2003 to 103.9 in 2013.
In deed FPE has seen a great impact on pupil participation in public primary schools. The FPE
programme is a major breakthrough in the country’s education system as it has opened the doors
for every school going child to get a chance to access education and improve their lives in future.
Results using ordinary least square method (See Appendix Table A.4) give a similar trend as the
county fixed effects results. The coefficient for FPE is in the OLS results is 0.10. This implies
there is a positive relationship between FPE and pupil participation at one percent level of
significance. The results show that with introduction of FPE pupil participation increased across
counties.
Performance
Table 4.6 presents the fixed effects results for performance (including county fixed effects)
which is measured by KCPE mean scores for each county in Kenya. Performance is the most
emphasized education outcome as discussed in the literature, mostly because it is a measure of
human capital (Behrman and Knowles, 1999; Glick and Sahn, 2000). As shown in Table 4.6 the
main factors that affect performance in primary schools are number of pupils, pupil teacher ratio,
pupil textbooks ratio, class size and number of schools.
Table 4.6: Fixed Effects Results for Performance: Dependent variable is County Mean Score
County Mean Score Coefficient Std. Err. P>|t|
Log No. of pupils -14.390* 12.655 0.100
No. of schools 0.074*** 0.029 0.014
Pupil class ratio -0.516** 0.261 0.054
Pupil teacher ratio -0.025*** 0.010 0.012
Pupil book ratio 12.453*** 3.950 0.010
Free Primary Education -10.360*** 2.641 0.000
constant 330.860*** 137.649 0.020
sigma_u 15.300
sigma_e 30.735
rho 0.199
R-square: Within 0.55
R-square: Between 0.76
R-square: Overall 0.53
Number of observations 470
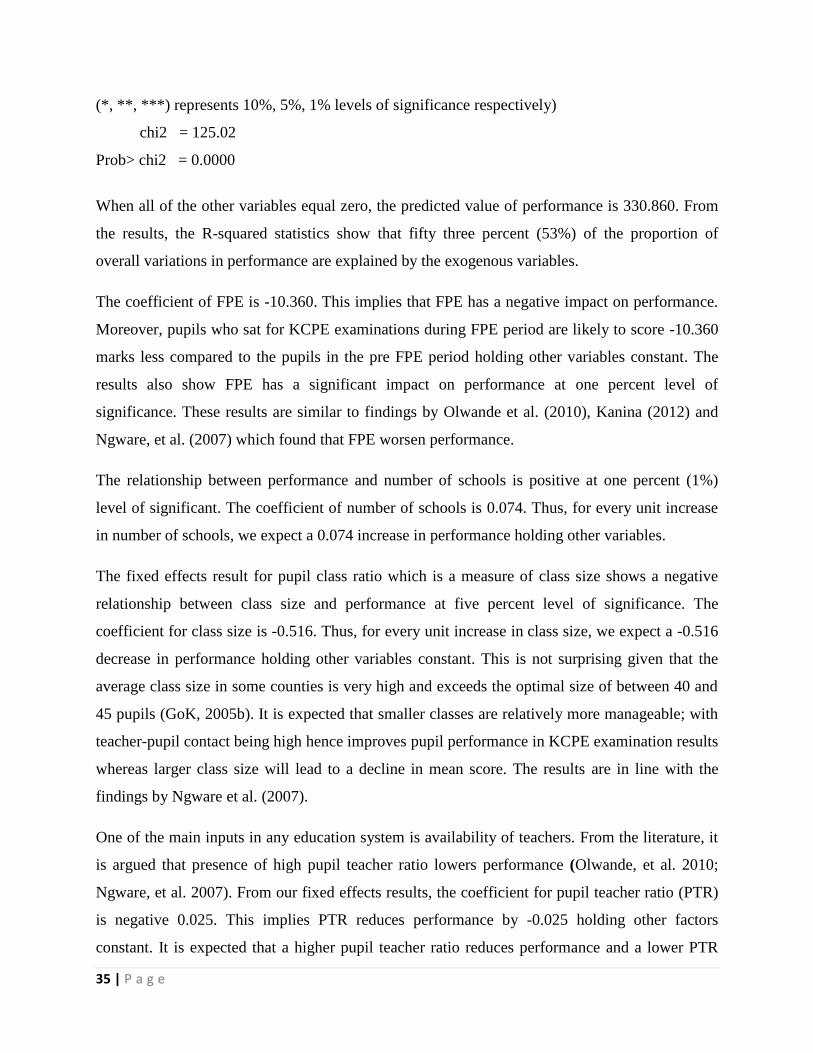
35 | P a g e
(*, **, ***) represents 10%, 5%, 1% levels of significance respectively)
chi2 = 125.02
Prob> chi2 = 0.0000
When all of the other variables equal zero, the predicted value of performance is 330.860. From
the results, the R-squared statistics show that fifty three percent (53%) of the proportion of
overall variations in performance are explained by the exogenous variables.
The coefficient of FPE is -10.360. This implies that FPE has a negative impact on performance.
Moreover, pupils who sat for KCPE examinations during FPE period are likely to score -10.360
marks less compared to the pupils in the pre FPE period holding other variables constant. The
results also show FPE has a significant impact on performance at one percent level of
significance. These results are similar to findings by Olwande et al. (2010), Kanina (2012) and
Ngware, et al. (2007) which found that FPE worsen performance.
The relationship between performance and number of schools is positive at one percent (1%)
level of significant. The coefficient of number of schools is 0.074. Thus, for every unit increase
in number of schools, we expect a 0.074 increase in performance holding other variables.
The fixed effects result for pupil class ratio which is a measure of class size shows a negative
relationship between class size and performance at five percent level of significance. The
coefficient for class size is -0.516. Thus, for every unit increase in class size, we expect a -0.516
decrease in performance holding other variables constant. This is not surprising given that the
average class size in some counties is very high and exceeds the optimal size of between 40 and
45 pupils (GoK, 2005b). It is expected that smaller classes are relatively more manageable; with
teacher-pupil contact being high hence improves pupil performance in KCPE examination results
whereas larger class size will lead to a decline in mean score. The results are in line with the
findings by Ngware et al. (2007).
One of the main inputs in any education system is availability of teachers. From the literature, it
is argued that presence of high pupil teacher ratio lowers performance (Olwande, et al. 2010;
Ngware, et al. 2007). From our fixed effects results, the coefficient for pupil teacher ratio (PTR)
is negative 0.025. This implies PTR reduces performance by -0.025 holding other factors
constant. It is expected that a higher pupil teacher ratio reduces performance and a lower PTR
36 | P a g e
improves performance since PTR is related to teacher contact with pupils during in teaching and
learning. With the introduction of FPE, teachers were employed across the counties but the
number did not match the pupil participation increase. This has seen deterioration in performance
at primary school level. The results support findings in the literature (Olwande, et al. (2010) and
Ngware et al. (2007)).
The coefficient of pupil book ratio is 12.453. So, an increase in PBR by 1 percent improves
performance by 12.453 holding other factors constant. It is expected that lower pupil book ratio
impacts positively on KCPE performance indicating that the extent to which textbooks are
available and utilized by pupils improves performance. Results show that the effect of pupil book
ratio on KCPE mean score is positive and statistically significant at one percent. The FPE
programme has a component of provision of textbooks that is aimed at increasing pupils’ access
to a textbook. Thus, greater availability of textbooks provided to schools for pupils to access, has
seen improved performance. The positive impact of textbooks on performance supports findings
in the literature that lower pupil book ratio can improve performance (Gupta, et al. (1999),
Glewwe, et al. (2002), Ngware, et al. (2007) and Kabubo-Mariara and Mwabu (2007)).
The results show that number of pupils has a negative effect on performance at ten percent level
of significance. The coefficient of number of pupils is -14.390, meaning that for every unit
increase in pupils, performance decreased by -14.390 holding other variables constant. With
inception of FPE, there was a massive increase in number of pupils which was not matched by
expansion in the teaching and learning environment. This causes a strain to teaching and learning
facilities which has seen a decrease in performance.
Generally the results show that FPE has had a negative effect on performance (See Appendix
Table A.5). Results show that even for those counties that registered improved performance, the
performance is not significantly different from zero. This could be explained by factors like
insufficient learning and teaching material, teacher characteristics and parental involvement that
have been presented in the literature review. The results also show that pupils in Busia, Vihiga
and Mombasa counties are more likely to perform better in KCPE than pupils in Nairobi and
Kirinyaga counties other factors held constant. The results also show variability in performance
37 | P a g e
across the counties in Kenya (see appendix figure A.1). The performance is still below the
average mark of 250 in most counties.
ASAL areas recorded the lowest performance compared to other counties. Performance in these
counties is below the mean mark of 250 (see appendix figure A.2). This suggests that
infrastructure development, poverty, insecurity and socio economic environment have a great
impact on performance. Just like the ASAL areas, coastal region counties (Kwale, Mombasa,
Taita Taveta, Tana River, Kilifi and Lamu) also show low performance. Kilifi County recorded
the highest decrease in its mean score in 2013. Some associated contributors of poor
performance in these counties can be their higher poverty levels compared to the rest of the
country. Figure A.3 in the appendix shows performance in KCPE in quintiles.
Results show that Nairobi County attained a mean score of 280.9 and 265.6 in KCPE in 2012
and 2013 respectively. These scores are above the mean mark of 250. This could be because
Nairobi County has better infrastructure, quality teachers and the economic status of parents is
better compared to other areas. Kirinyaga county also had KCPE mean score of 272.1 in 2012
and 274.58 in 2013 which is also above the average national mean score. This can be explained
by good learning and teaching facilities in the county.
Results using ordinary least square method (See Appendix Table A.6) are consistent with the
county fixed effect results. The coefficient for FPE is -10.360 and significant at ten percent. This
implies there is a negative relationship between FPE and performance. The results show that
with introduction of FPE, performance declined in most counties, but there was a positive effect
of FPE on performance in some counties such as Busia, Vihiga, Nairobi and Kirinyaga counties.
38 | P a g e
5. CHAPTER FIVE: CONCLUSION AND POLICY RECOMMENDATIONS
5.1 Summary and Conclusion
Implementation of FPE programme in Kenya is a big milestone towards the achievement of
MDG goal two on provision of universal primary education by 2015. FPE in Kenya has proved
EFA goals can succeed, now and in years to come. According to the human capital theory,
education is a key instrument for the Country’s social-economic development. It’s therefore
necessary that investment in this sector attains maximum possible benefits. Despite the effort
made by the government to achieve national and international goal on universal primary
education, a number of challenges exist which are a threat to FPE success. Among the challenges
include congested classrooms, very high pupil teacher ratio in some regions and poor learning
facilities.
There are also concerns regarding the overall impact of FPE on enrolment and performance of
education in public primary schools. This study examines the effect of abolition of primary
education fees on school participation and performance in Kenya, using panel data for the period
1990-2013. The data was sourced from the Ministry of Education, Science and Technology,
Kenya National Examination Council and Teachers Service Commission (TSC). Fixed effects
models for participation and performance are estimated. The study investigates whether pupil
textbook ratio, pupil teacher ratio, class size and number of schools have an effect on pupil
participation and performance in KCPE examination. The results show that since FPE
implementation, pupil participation has increased tremendously but performance at national level
is still below the average mark of 250.
The study findings show that the increase in primary school enrolment rates can largely be
attributed to the FPE program. The study also shows availability of textbooks for pupils, lower
pupil teacher ratio, lower class-size, and enough primary schools, positively increase pupil
participation. The study also shows regional disparities in terms of pupil participation. These
results are consistent with the findings by Huijsman, et al. (1986); Deininger, (2003); Gupta, et
al. (1999); Glewwe, et al. (2002); Ngware, et al. (2007); Kabubo-Mariara and Mwabu (2007);
and Olwande, et al. (2010) that subsidizing primary education is associated with a significant
increase in pupil participation.
39 | P a g e
Another key finding of this study is that performance in KCPE is still low. This may be caused
by high pupil book ratio, high pupil teacher ratio and large class size. Therefore, in order to
improve KCPE performance in primary schools, the government needs to ensure that the
increase in number of pupils is matched by infrastructure, teaching and learning materials. The
results support findings in the literature (Hattie’s, 2003; Woolley and Grogan-Taylor 2005;
Boissiere, 2004; Bowen et al. 2008; Ogola, 2010: Olwande et al. 2010: Ngware et al. 2007;
Kanina, 2012; and Kabubo-Mariara and Mwabu 2007).
The results also show variations in pupil participation and performance across the counties in
Kenya. Despite increase in pupil participation across counties, there are still skewed patterns. For
instance pupil participation in Baringo, Bungoma, Kakamega and Nairobi Counties increased
significantly with implementation of FPE whereas pupil participation and performance in ASAL
areas is still below the national average gross enrolment figure. This may be caused by other
costs related to schooling, harsh weather conditions, regional conflicts, insecurity, nomadic
lifestyle and food shortage.
Performance is also seen to vary across counties. Counties with better infrastructure, adequate
teachers and better access to textbooks are seen to achieve a mean mark above 250 in KCPE
examinations. For example Nairobi and Kirinyaga counties whereas counties in marginalized
regions have recorded a lower mean mark in KCPE which is below the average of 250 marks.
These disparities could be because of levels of poverty, inadequate teaching and learning
materials, child labor, lack of basic needs and health issues.
5.2 Policy Implications
FPE was a milestone to achieve the overall goal of universal pupil participation in primary
education. Despite FPE implementation, there are still education related direct and indirect costs
that may hinder pupil participation. Thus the study recommends removing all costs related to
primary education so that primary education is completely free.
Pupil participation varies across counties in Kenya. To ensure equality in access to education, the
government should implement affirmative policies to bring the disadvantaged regions at par with
the rest of the country. This may include; setting up mobile schools especially for pastoralists,

40 | P a g e
provision of low cost boarding school in marginalized areas and setting up an equalization fund
for education. In addition addressing insecurity and poverty in these regions will greatly help to
enhance pupil participation in education in these regions.
Since inception of FPE, there was pressure on teaching and learning facilities since increase in
pupil participation did not match the existing infrastructure. This has seen a negative effect on
performance. The study recommends improving infrastructure by increasing the number of
classes and schools to enhance pupil participation. Increasing number of schools will not only
give enough room for pupils but also this will shorten the distance from the school especially in
marginalized areas.
To ensure improved performance in KCPE results, the study recommends availing enough
textbooks for pupils and increasing the number of quality teachers to help take care of the ever-
increasing demand of free primary education.
In addition, the study recommends policies that will ensure efficient utilization of existing
facilities and resources without incurring extra costs. This may include addressing teacher
absenteeism, adoption of ICT in delivery of curriculum among others.
Lastly this study recommends teacher motivation as an important policy in achieving improved
performance in KCPE examinations. Teacher motivation may be done through better terms of
employment, awards and recognition.
5.3 Limitations and Areas for Further Research
The major limitation of the study is the availability of county level data to analyze other possible
determinants of education outcomes. This study could therefore not analyze the effect of socio
economic variables as well as environmental variables on performance and pupil participation.
This study focused on effect of FPE on public primary schools. The areas for further research in
this field include comparing private and public schools to determine whether there are
differences in performance and what other factors besides FPE affect performance. This is an
important factor for policy formulation.
41 | P a g e
REFERENCES
Adrienne, C. (2009). Disparities in the system: The effects of Free Primary Education on the
quality of education in Nairobi Public Primary Schools: SIT Kenya: Development, health and
society.http://digitalcollections.sit.edu/cgi/viewcontent.cgi?article=1715&context=isp_collection
Accessed 17th
March 2014.
Anand, S., &Ravallion, M. (1993). Human Development in Poor Countries: On the Role of
Public Services. Journal of Economics Perspectives, 7(1), 135-50.
Anyanwu, J. C., &Erhijakpor, A. E. O. (2007). Education Expenditures and School enrolment in
Africa: illustrations from Nigeria and the other SAWE Countries. Paper presented at the 50th
Anniversary and Annual Conference of the Nigerian Economic Society, Abuja, Nigeria.
Avvisati, F, G., and Maurin, G. (2010). Getting Parents Involved: a Field Experiment in
Deprived Schools. Mimeo J-PAL Europe, CEPR Discussion Paper 8020, 2010.
Becker, G. S. (1975). Human Capital. A Theoretical and Empirical Analysis with Special
Reference to Education. Second Edition: Chicago: University of Chicago Press.
Becker, G.S, (1962). Investment in Human Capital: A Theoretical Analysis. The Journal of
Political Economy. 70(5): 9-49.
Behrman, J. R. and J. C. Knowles (1999). Household Income and Child Schooling in
Vietnam.World Bank Economic Review 13(2): 211-56
Boissiere, M. (2004).Determinants of Primary Education Outcomes in Developing
Countries.Background Paper for the Evaluation of the World Bank’s Support to Primary
Education.
Bold, T., Kimenyi, M., Mwabu, G. and Sandefur, J. (2011). Why did abolishing fees not increase
public school enrollment in Kenya?Working Paper 271: Center for Global Development
Working Paper Series.
Brannon, D. (2008) “Transforming teacher education through parent involvement in high-need
schools.”Journal on Innovations and Educational Leadership. Retrieved
fromhttp://www.acifund.org/aci-center/journal/article/transforming-teacher-education-through-
parent-involvement-high-need-schools.Accessed 19th
May, 2014.
Bruns B., mingat A. &Ramahatra R. (2003). Achieving Universal Primary Education by 2015:
A Chance for Every Child- Business & Economics.
Bryn Mawr College & Thomas P. Vartanian (2010).Secondary Data Analysis- Social Science:
Oxford University Press.
Caldwell, J. C. (1978). A theory of fertility: From high plateau to destabilization. Population and
Development Review, 4(4), 553–577.
42 | P a g e
Canton, E., and F. de Jong (2005): “The demand for higher education in The Netherlands, 1950-
1999,” Economics of Education Review, 24, 651–663.
Center for Public Policy Priorities. (1999). Measuring Up: The State of Texas
Education.February 26, 1999 No. 74 (http://www.cppp.org/products/policypages).
Coleman, J. S., Campbell, E. Q., Hobson, C. J., McPartland, F., Mood, A. M., Weinfeld, F. D.,
etal. (1966). Equality of educational opportunity Washington. DC: U.S. Government Printing
Office.
Connelly, R. (1992). The effect of child care costs on married women’s labor force participation.
The Review of Economics and Statistics, 74(1), 83–90.
Cooper, S.T., and Cohn, E. (1997), Estimation of a Frontier Production Function for the South
Carolina Educational Process: Economics of Education Review, 16(3), 313-27.
Deininger, K. (2003). Does Cost of Schooling Affect Enrollment by the Poor? Universal Primary
Education in Uganda. Economics of Education Review, 22, 291-305).
Education and Development (2011). Retrieved from: http://go.worldbank.org/F5K8Y429G0,
accessed on 5th
September, 2012.
Epstein, J. L., Sanders, M. G., Simon, B. S., Salinas, K. C., Jansorn, N. R., & Van Voorhis,
F.(2001). Developing and sustaining research-based programs of school, family, and community
partnerships: Summary of five years of NNPS research.
Fuller, B (1987), What School Factors Raise Achievement in the Third World? Review of
Educational Research No. 57 p 255-292
.
Gertler, P. and Glewwe, P. (1990). The Willingness to Pay for Education in Developing
Countries.Journal of Public Economics 42: 251-275.
Glewwe P., Kremer M. and Moulin S. (2002), Textbooks and Test Scores: Evidence from a
Prospective Evaluation in Kenya. Working paper, Harvard University, November.
Glewwe, P. & Patrinos, H. A. (1999). The role of the private sector in education in Vietnam:
Evidence from the Vietnam living standards survey. World Development, 27(5), 887–902.
Glick, P. and D.E. Sahn. 2000. “Schooling of girls and boys in a West African country: The
effects of parental education, income and household structure”. Economics of Education Review,
19: 6387.
Glick, P., &Sahn, D. E. (2000). Schooling of girls and boys in a West African country: The
effects of parental education, income, and household structure. Economics of Education Review,
19(1), 63–87.
Government of Kenya (2005).Sessional Paper No.1 of 2005 on Education, Training and
Research. Government Printer, Nairobi, Kenya. ”5th
March 2014
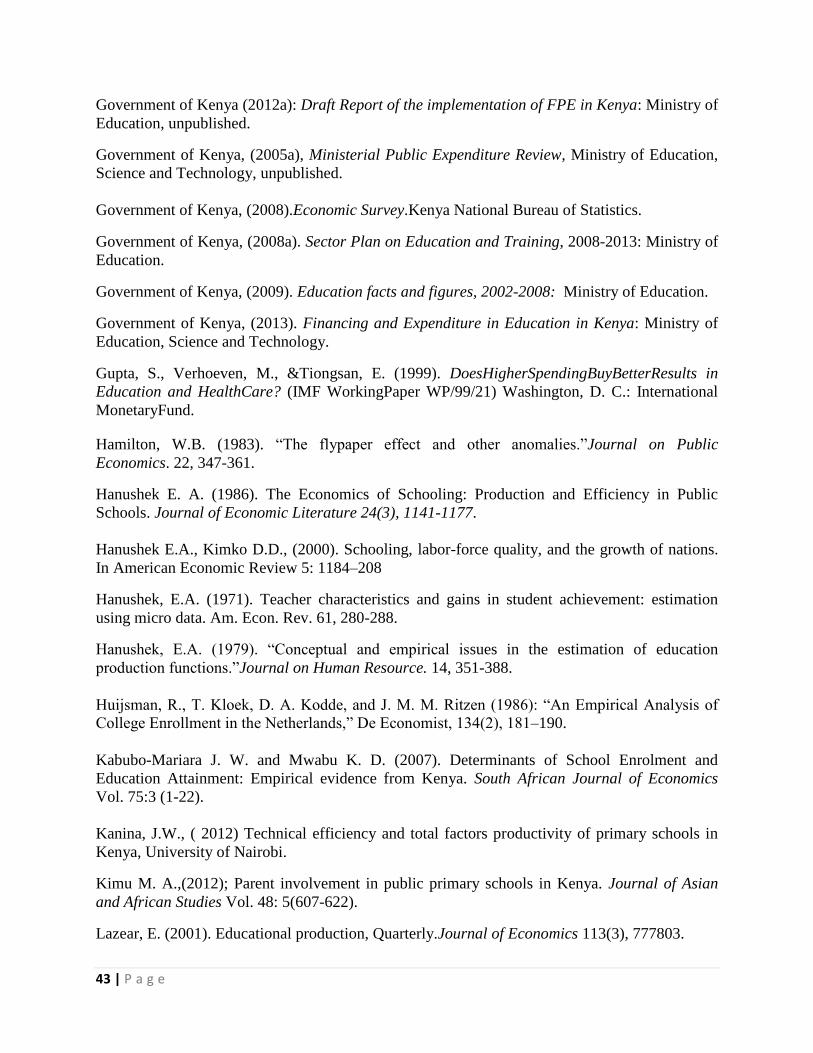
43 | P a g e
Government of Kenya (2012a): Draft Report of the implementation of FPE in Kenya: Ministry of
Education, unpublished.
Government of Kenya, (2005a), Ministerial Public Expenditure Review, Ministry of Education,
Science and Technology, unpublished.
Government of Kenya, (2008).Economic Survey.Kenya National Bureau of Statistics.
Government of Kenya, (2008a). Sector Plan on Education and Training, 2008-2013: Ministry of
Education.
Government of Kenya, (2009). Education facts and figures, 2002-2008: Ministry of Education.
Government of Kenya, (2013). Financing and Expenditure in Education in Kenya: Ministry of
Education, Science and Technology.
Gupta, S., Verhoeven, M., &Tiongsan, E. (1999). DoesHigherSpendingBuyBetterResults in
Education and HealthCare? (IMF WorkingPaper WP/99/21) Washington, D. C.: International
MonetaryFund.
Hamilton, W.B. (1983). “The flypaper effect and other anomalies.”Journal on Public
Economics. 22, 347-361.
Hanushek E. A. (1986). The Economics of Schooling: Production and Efficiency in Public
Schools. Journal of Economic Literature 24(3), 1141-1177.
Hanushek E.A., Kimko D.D., (2000). Schooling, labor-force quality, and the growth of nations.
In American Economic Review 5: 1184–208
Hanushek, E.A. (1971). Teacher characteristics and gains in student achievement: estimation
using micro data. Am. Econ. Rev. 61, 280-288.
Hanushek, E.A. (1979). “Conceptual and empirical issues in the estimation of education
production functions.”Journal on Human Resource. 14, 351-388.
Huijsman, R., T. Kloek, D. A. Kodde, and J. M. M. Ritzen (1986): “An Empirical Analysis of
College Enrollment in the Netherlands,” De Economist, 134(2), 181–190.
Kabubo-Mariara J. W. and Mwabu K. D. (2007). Determinants of School Enrolment and
Education Attainment: Empirical evidence from Kenya. South African Journal of Economics
Vol. 75:3 (1-22).
Kanina, J.W., ( 2012) Technical efficiency and total factors productivity of primary schools in
Kenya, University of Nairobi.
Kimu M. A.,(2012); Parent involvement in public primary schools in Kenya. Journal of Asian
and African Studies Vol. 48: 5(607-622).
Lazear, E. (2001). Educational production, Quarterly.Journal of Economics 113(3), 777803.
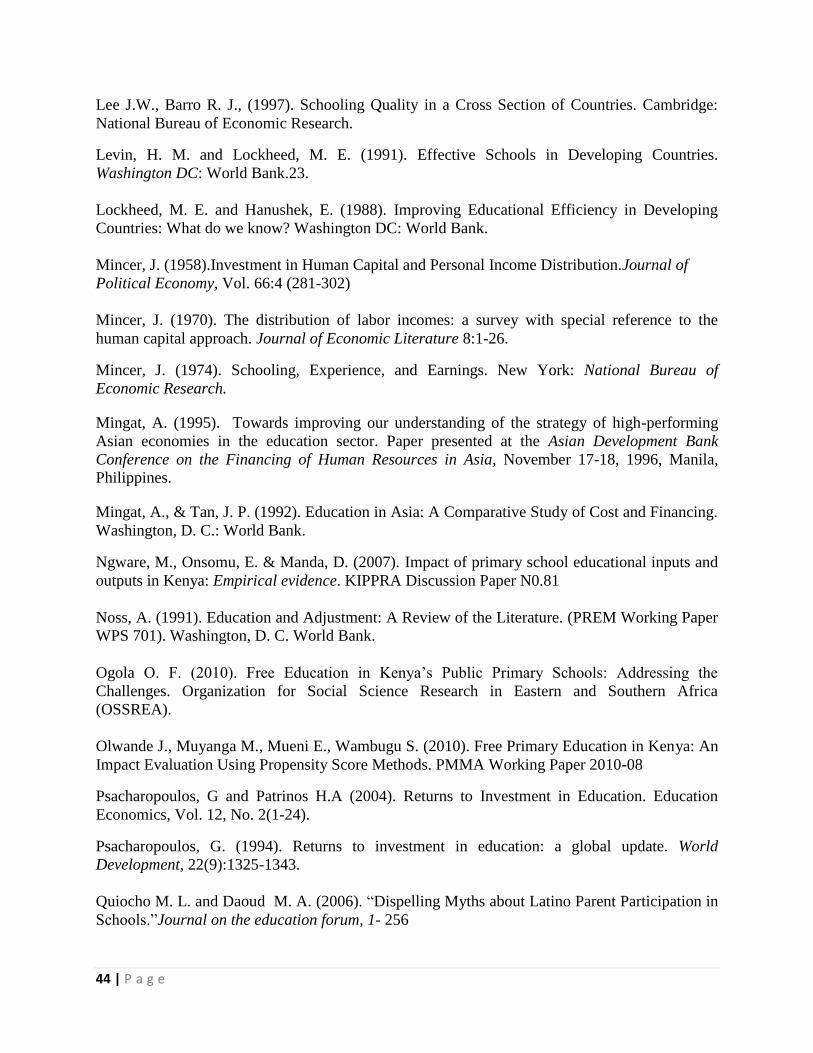
44 | P a g e
Lee J.W., Barro R. J., (1997). Schooling Quality in a Cross Section of Countries. Cambridge:
National Bureau of Economic Research.
Levin, H. M. and Lockheed, M. E. (1991). Effective Schools in Developing Countries.
Washington DC: World Bank.23.
Lockheed, M. E. and Hanushek, E. (1988). Improving Educational Efficiency in Developing
Countries: What do we know? Washington DC: World Bank.
Mincer, J. (1958).Investment in Human Capital and Personal Income Distribution.Journal of
Political Economy, Vol. 66:4 (281-302)
Mincer, J. (1970). The distribution of labor incomes: a survey with special reference to the
human capital approach. Journal of Economic Literature 8:1-26.
Mincer, J. (1974). Schooling, Experience, and Earnings. New York: National Bureau of
Economic Research.
Mingat, A. (1995). Towards improving our understanding of the strategy of high-performing
Asian economies in the education sector. Paper presented at the Asian Development Bank
Conference on the Financing of Human Resources in Asia, November 17-18, 1996, Manila,
Philippines.
Mingat, A., & Tan, J. P. (1992). Education in Asia: A Comparative Study of Cost and Financing.
Washington, D. C.: World Bank.
Ngware, M., Onsomu, E. & Manda, D. (2007). Impact of primary school educational inputs and
outputs in Kenya: Empirical evidence. KIPPRA Discussion Paper N0.81
Noss, A. (1991). Education and Adjustment: A Review of the Literature. (PREM Working Paper
WPS 701). Washington, D. C. World Bank.
Ogola O. F. (2010). Free Education in Kenya’s Public Primary Schools: Addressing the
Challenges. Organization for Social Science Research in Eastern and Southern Africa
(OSSREA).
Olwande J., Muyanga M., Mueni E., Wambugu S. (2010). Free Primary Education in Kenya: An
Impact Evaluation Using Propensity Score Methods. PMMA Working Paper 2010-08
Psacharopoulos, G and Patrinos H.A (2004). Returns to Investment in Education. Education
Economics, Vol. 12, No. 2(1-24).
Psacharopoulos, G. (1994). Returns to investment in education: a global update. World
Development, 22(9):1325-1343.
Quiocho M. L. and Daoud M. A. (2006). “Dispelling Myths about Latino Parent Participation in
Schools.”Journal on the education forum, 1- 256
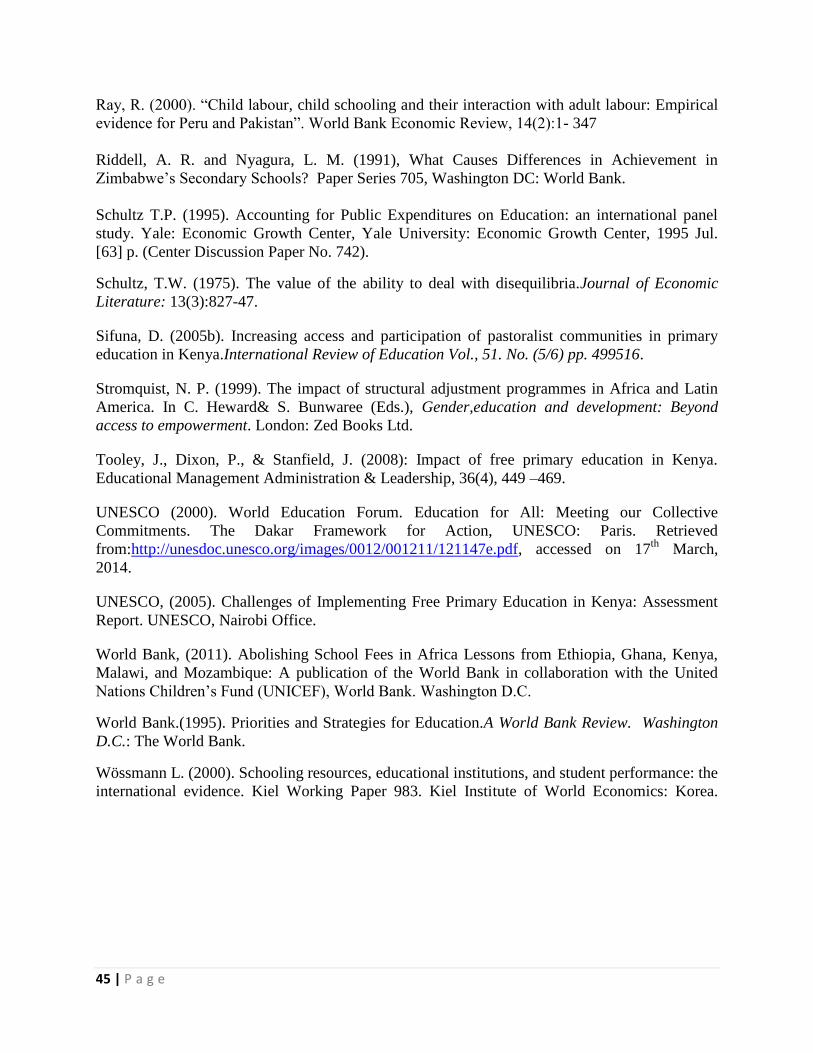
45 | P a g e
Ray, R. (2000). “Child labour, child schooling and their interaction with adult labour: Empirical
evidence for Peru and Pakistan”. World Bank Economic Review, 14(2):1- 347
Riddell, A. R. and Nyagura, L. M. (1991), What Causes Differences in Achievement in
Zimbabwe’s Secondary Schools? Paper Series 705, Washington DC: World Bank.
Schultz T.P. (1995). Accounting for Public Expenditures on Education: an international panel
study. Yale: Economic Growth Center, Yale University: Economic Growth Center, 1995 Jul.
[63] p. (Center Discussion Paper No. 742).
Schultz, T.W. (1975). The value of the ability to deal with disequilibria.Journal of Economic
Literature: 13(3):827-47.
Sifuna, D. (2005b). Increasing access and participation of pastoralist communities in primary
education in Kenya.International Review of Education Vol., 51. No. (5/6) pp. 499516.
Stromquist, N. P. (1999). The impact of structural adjustment programmes in Africa and Latin
America. In C. Heward& S. Bunwaree (Eds.), Gender,education and development: Beyond
access to empowerment. London: Zed Books Ltd.
Tooley, J., Dixon, P., & Stanfield, J. (2008): Impact of free primary education in Kenya.
Educational Management Administration & Leadership, 36(4), 449 –469.
UNESCO (2000). World Education Forum. Education for All: Meeting our Collective
Commitments. The Dakar Framework for Action, UNESCO: Paris. Retrieved
from:http://unesdoc.unesco.org/images/0012/001211/121147e.pdf, accessed on 17th
March,
2014.
UNESCO, (2005). Challenges of Implementing Free Primary Education in Kenya: Assessment
Report. UNESCO, Nairobi Office.
World Bank, (2011). Abolishing School Fees in Africa Lessons from Ethiopia, Ghana, Kenya,
Malawi, and Mozambique: A publication of the World Bank in collaboration with the United
Nations Children’s Fund (UNICEF), World Bank. Washington D.C.
World Bank.(1995). Priorities and Strategies for Education.A World Bank Review. Washington
D.C.: The World Bank.
Wössmann L. (2000). Schooling resources, educational institutions, and student performance: the
international evidence. Kiel Working Paper 983. Kiel Institute of World Economics: Korea.
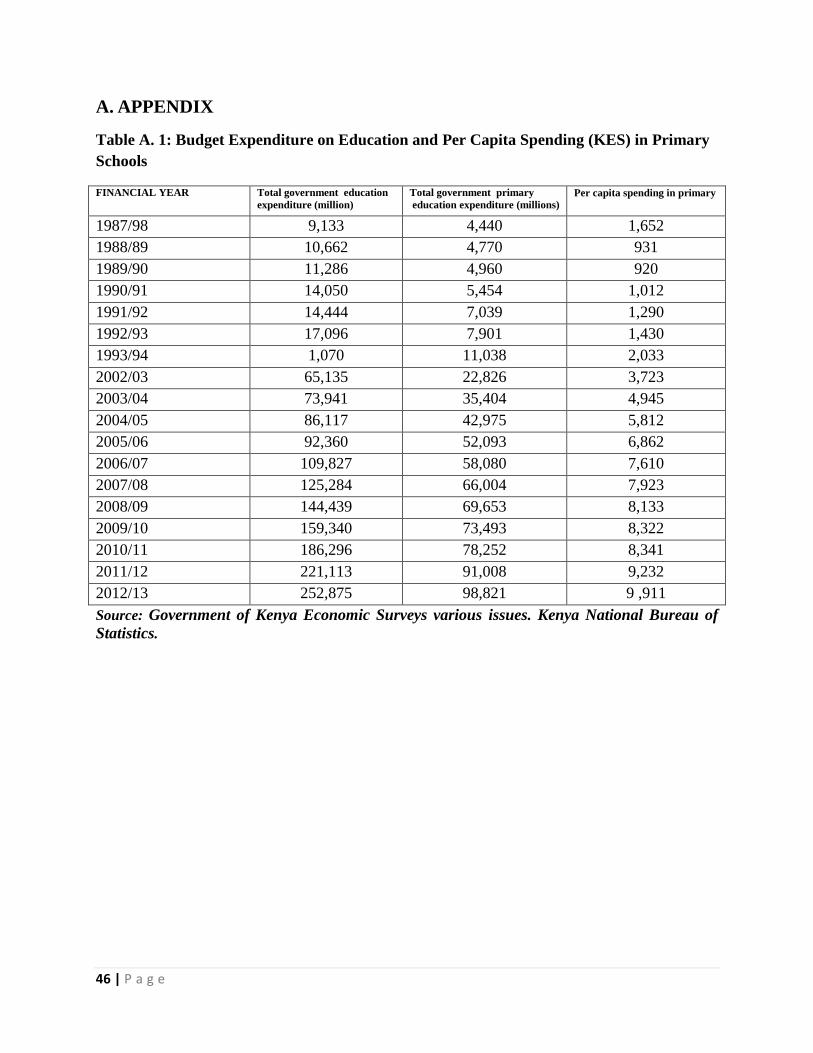
46 | P a g e
A. APPENDIX
Table A. 1: Budget Expenditure on Education and Per Capita Spending (KES) in Primary
Schools
FINANCIAL YEAR Total government education
expenditure (million)
Total government primary
education expenditure (millions)
Per capita spending in primary
1987/98 9,133 4,440 1,652
1988/89 10,662 4,770 931
1989/90 11,286 4,960 920
1990/91 14,050 5,454 1,012
1991/92 14,444 7,039 1,290
1992/93 17,096 7,901 1,430
1993/94 1,070 11,038 2,033
2002/03 65,135 22,826 3,723
2003/04 73,941 35,404 4,945
2004/05 86,117 42,975 5,812
2005/06 92,360 52,093 6,862
2006/07 109,827 58,080 7,610
2007/08 125,284 66,004 7,923
2008/09 144,439 69,653 8,133
2009/10 159,340 73,493 8,322
2010/11 186,296 78,252 8,341
2011/12 221,113 91,008 9,232
2012/13 252,875 98,821 9 ,911
Source: Government of Kenya Economic Surveys various issues. Kenya National Bureau of
Statistics.
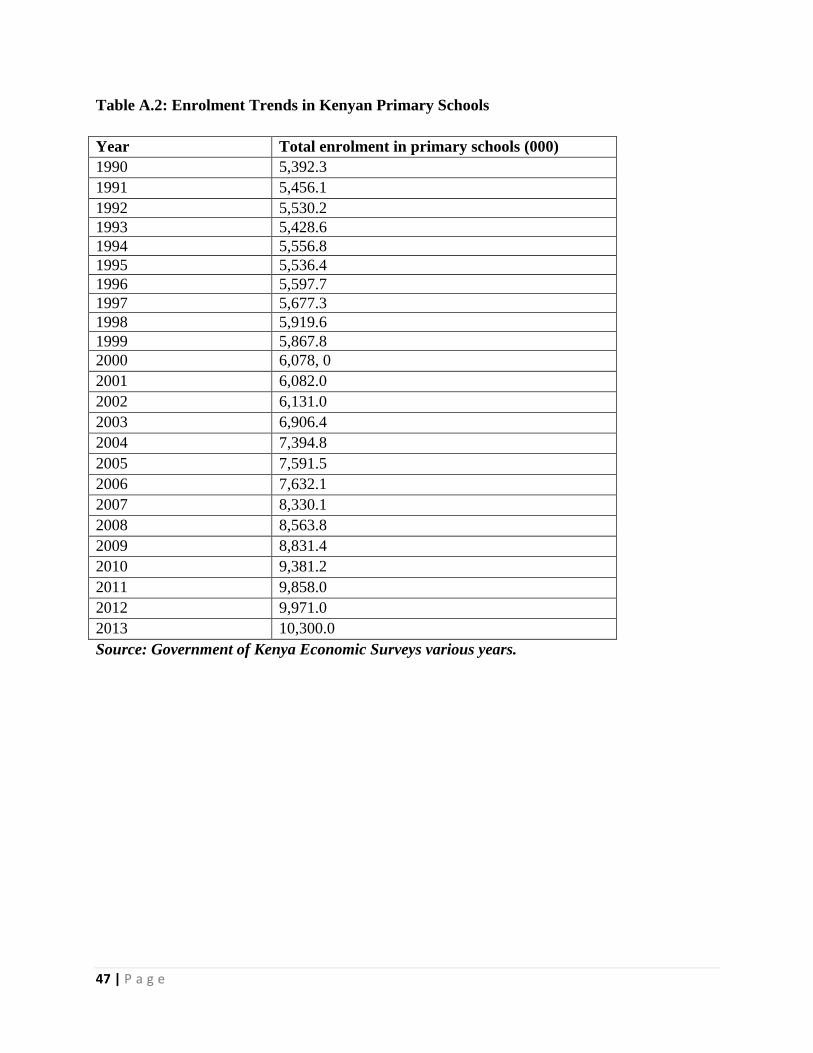
47 | P a g e
Table A.2: Enrolment Trends in Kenyan Primary Schools
Year Total enrolment in primary schools (000)
1990 5,392.3
1991 5,456.1
1992 5,530.2
1993 5,428.6
1994 5,556.8
1995 5,536.4
1996 5,597.7
1997 5,677.3
1998 5,919.6
1999 5,867.8
2000 6,078, 0
2001 6,082.0
2002 6,131.0
2003 6,906.4
2004 7,394.8
2005 7,591.5
2006 7,632.1
2007 8,330.1
2008 8,563.8
2009 8,831.4
2010 9,381.2
2011 9,858.0
2012 9,971.0
2013 10,300.0
Source: Government of Kenya Economic Surveys various years.
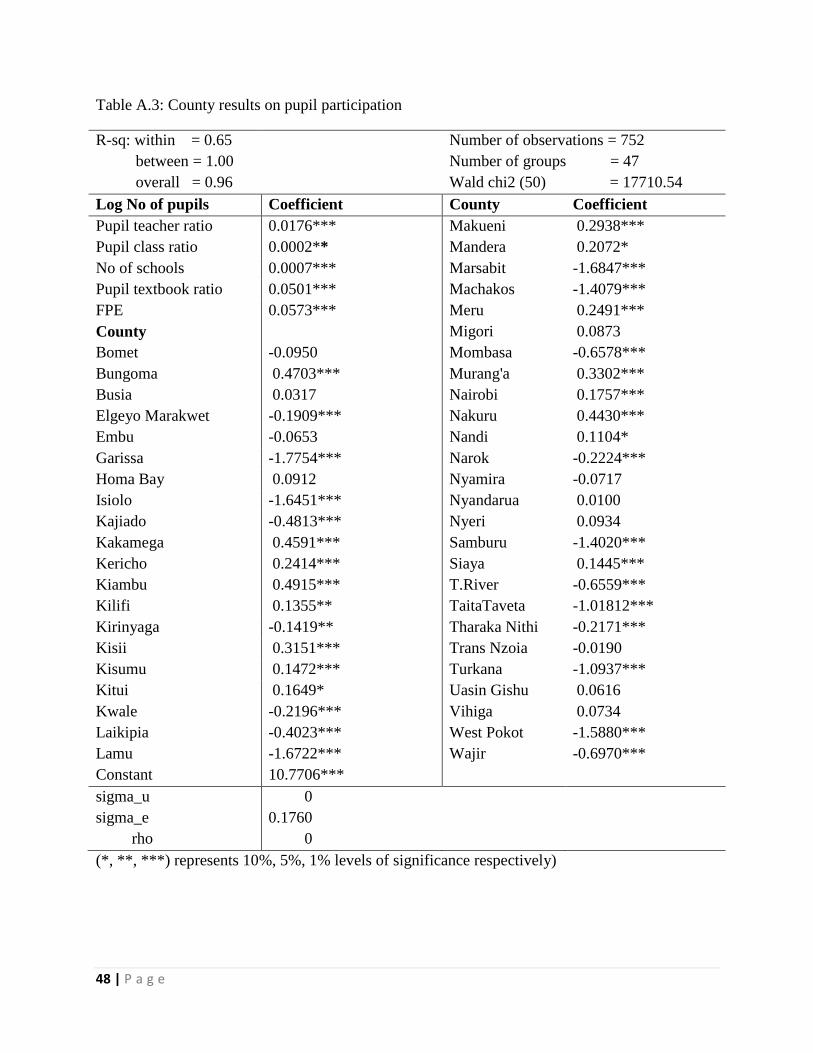
48 | P a g e
Table A.3: County results on pupil participation
R-sq: within = 0.65
between = 1.00
overall = 0.96
Number of observations = 752
Number of groups = 47
Wald chi2 (50) = 17710.54
Log No of pupils Coefficient County Coefficient
Pupil teacher ratio 0.0176*** Makueni 0.2938***
Pupil class ratio 0.0002** Mandera 0.2072*
No of schools 0.0007*** Marsabit -1.6847***
Pupil textbook ratio 0.0501*** Machakos -1.4079***
FPE 0.0573*** Meru 0.2491***
County Migori 0.0873
Bomet -0.0950 Mombasa -0.6578***
Bungoma 0.4703*** Murang'a 0.3302***
Busia 0.0317 Nairobi 0.1757***
Elgeyo Marakwet -0.1909*** Nakuru 0.4430***
Embu -0.0653 Nandi 0.1104*
Garissa -1.7754*** Narok -0.2224***
Homa Bay 0.0912 Nyamira -0.0717
Isiolo -1.6451*** Nyandarua 0.0100
Kajiado -0.4813*** Nyeri 0.0934
Kakamega 0.4591*** Samburu -1.4020***
Kericho 0.2414*** Siaya 0.1445***
Kiambu 0.4915*** T.River -0.6559***
Kilifi 0.1355** TaitaTaveta -1.01812***
Kirinyaga -0.1419** Tharaka Nithi -0.2171***
Kisii 0.3151*** Trans Nzoia -0.0190
Kisumu 0.1472*** Turkana -1.0937***
Kitui 0.1649* Uasin Gishu 0.0616
Kwale -0.2196*** Vihiga 0.0734
Laikipia -0.4023*** West Pokot -1.5880***
Lamu -1.6722*** Wajir -0.6970***
Constant 10.7706***
sigma_u
sigma_e
rho
0
0.1760
0
(*, **, ***) represents 10%, 5%, 1% levels of significance respectively)
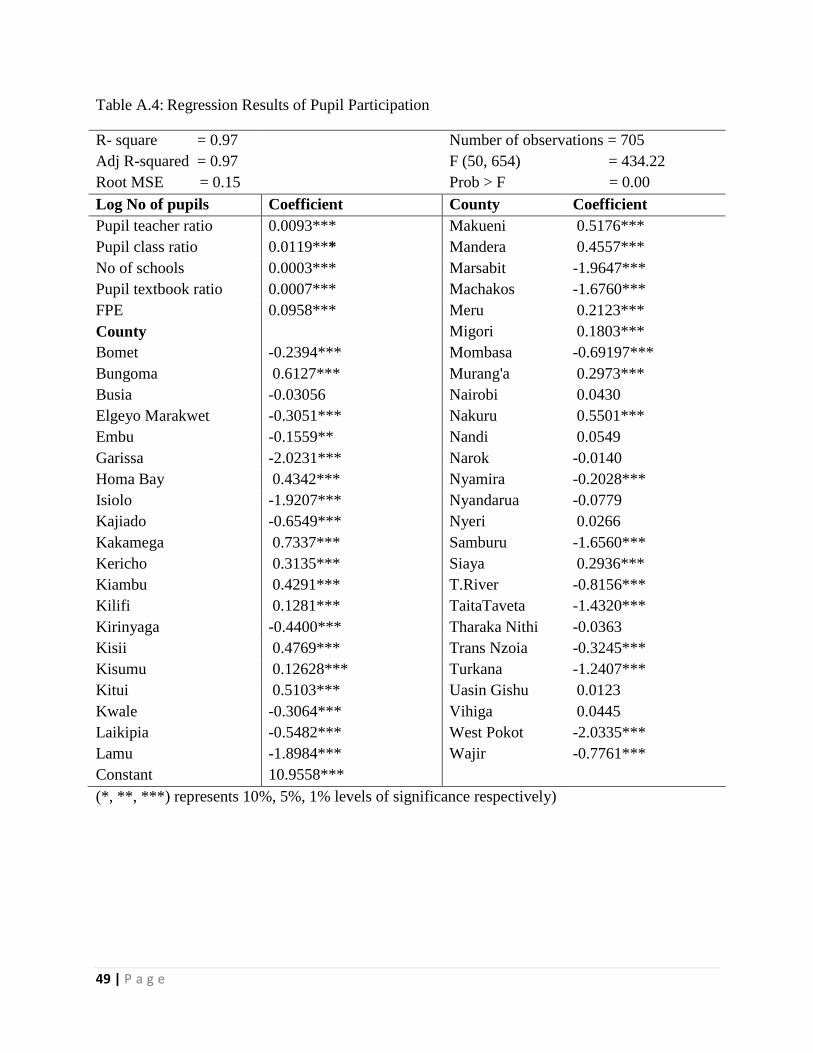
49 | P a g e
Table A.4: Regression Results of Pupil Participation
R- square = 0.97
Adj R-squared = 0.97
Root MSE = 0.15
Number of observations = 705
F (50, 654) = 434.22
Prob > F = 0.00
Log No of pupils Coefficient County Coefficient
Pupil teacher ratio 0.0093*** Makueni 0.5176***
Pupil class ratio 0.0119*** Mandera 0.4557***
No of schools 0.0003*** Marsabit -1.9647***
Pupil textbook ratio 0.0007*** Machakos -1.6760***
FPE 0.0958*** Meru 0.2123***
County Migori 0.1803***
Bomet -0.2394*** Mombasa -0.69197***
Bungoma 0.6127*** Murang'a 0.2973***
Busia -0.03056 Nairobi 0.0430
Elgeyo Marakwet -0.3051*** Nakuru 0.5501***
Embu -0.1559** Nandi 0.0549
Garissa -2.0231*** Narok -0.0140
Homa Bay 0.4342*** Nyamira -0.2028***
Isiolo -1.9207*** Nyandarua -0.0779
Kajiado -0.6549*** Nyeri 0.0266
Kakamega 0.7337*** Samburu -1.6560***
Kericho 0.3135*** Siaya 0.2936***
Kiambu 0.4291*** T.River -0.8156***
Kilifi 0.1281*** TaitaTaveta -1.4320***
Kirinyaga -0.4400*** Tharaka Nithi -0.0363
Kisii 0.4769*** Trans Nzoia -0.3245***
Kisumu 0.12628*** Turkana -1.2407***
Kitui 0.5103*** Uasin Gishu 0.0123
Kwale -0.3064*** Vihiga 0.0445
Laikipia -0.5482*** West Pokot -2.0335***
Lamu -1.8984*** Wajir -0.7761***
Constant 10.9558***
(*, **, ***) represents 10%, 5%, 1% levels of significance respectively)
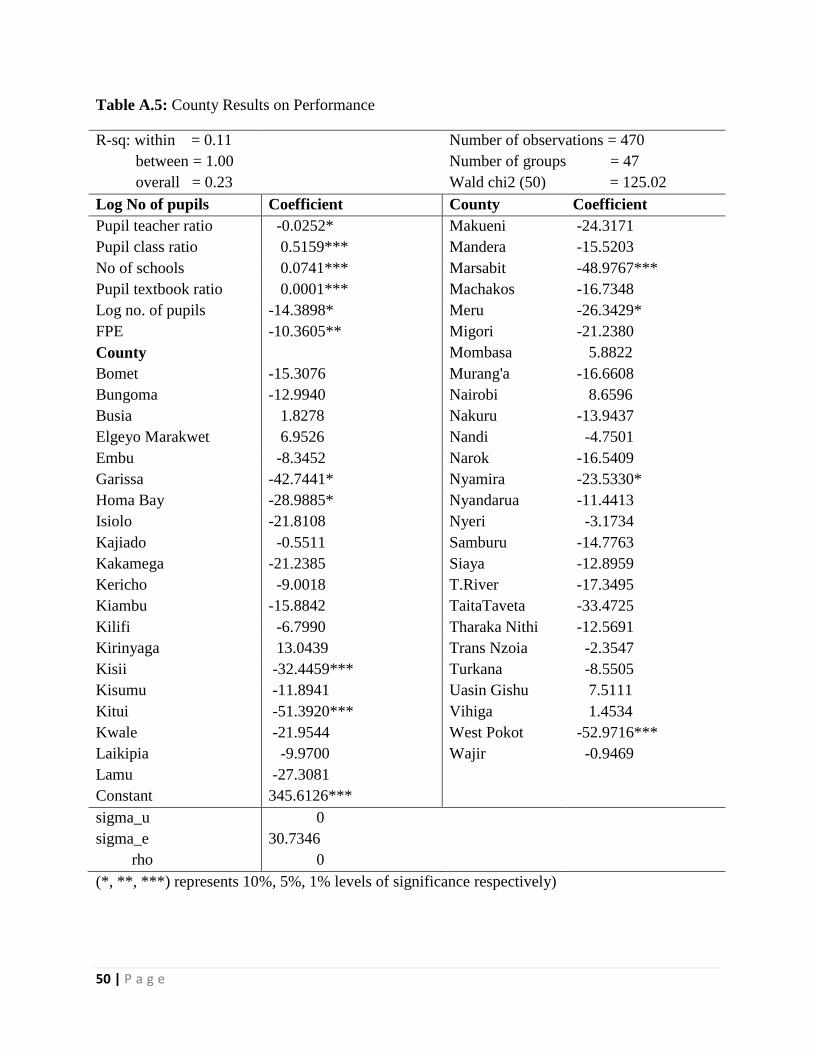
50 | P a g e
Table A.5: County Results on Performance
R-sq: within = 0.11
between = 1.00
overall = 0.23
Number of observations = 470
Number of groups = 47
Wald chi2 (50) = 125.02
Log No of pupils Coefficient County Coefficient
Pupil teacher ratio -0.0252* Makueni -24.3171
Pupil class ratio 0.5159*** Mandera -15.5203
No of schools 0.0741*** Marsabit -48.9767***
Pupil textbook ratio 0.0001*** Machakos -16.7348
Log no. of pupils -14.3898* Meru -26.3429*
FPE -10.3605** Migori -21.2380
County Mombasa 5.8822
Bomet -15.3076 Murang'a -16.6608
Bungoma -12.9940 Nairobi 8.6596
Busia 1.8278 Nakuru -13.9437
Elgeyo Marakwet 6.9526 Nandi -4.7501
Embu -8.3452 Narok -16.5409
Garissa -42.7441* Nyamira -23.5330*
Homa Bay -28.9885* Nyandarua -11.4413
Isiolo -21.8108 Nyeri -3.1734
Kajiado -0.5511 Samburu -14.7763
Kakamega -21.2385 Siaya -12.8959
Kericho -9.0018 T.River -17.3495
Kiambu -15.8842 TaitaTaveta -33.4725
Kilifi -6.7990 Tharaka Nithi -12.5691
Kirinyaga 13.0439 Trans Nzoia -2.3547
Kisii -32.4459*** Turkana -8.5505
Kisumu -11.8941 Uasin Gishu 7.5111
Kitui -51.3920*** Vihiga 1.4534
Kwale -21.9544 West Pokot -52.9716***
Laikipia -9.9700 Wajir -0.9469
Lamu -27.3081
Constant 345.6126***
sigma_u
sigma_e
rho
0
30.7346
0
(*, **, ***) represents 10%, 5%, 1% levels of significance respectively)
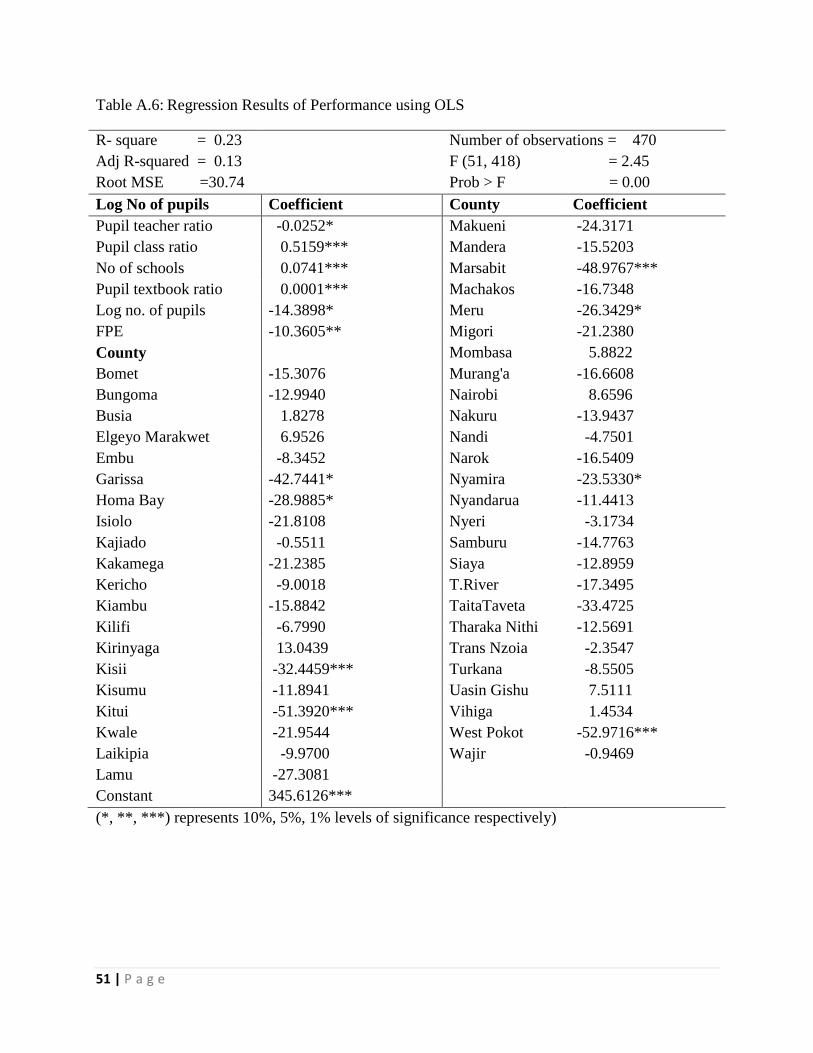
51 | P a g e
Table A.6: Regression Results of Performance using OLS
R- square = 0.23
Adj R-squared = 0.13
Root MSE =30.74
Number of observations = 470
F (51, 418) = 2.45
Prob > F = 0.00
Log No of pupils Coefficient County Coefficient
Pupil teacher ratio -0.0252* Makueni -24.3171
Pupil class ratio 0.5159*** Mandera -15.5203
No of schools 0.0741*** Marsabit -48.9767***
Pupil textbook ratio 0.0001*** Machakos -16.7348
Log no. of pupils -14.3898* Meru -26.3429*
FPE -10.3605** Migori -21.2380
County Mombasa 5.8822
Bomet -15.3076 Murang'a -16.6608
Bungoma -12.9940 Nairobi 8.6596
Busia 1.8278 Nakuru -13.9437
Elgeyo Marakwet 6.9526 Nandi -4.7501
Embu -8.3452 Narok -16.5409
Garissa -42.7441* Nyamira -23.5330*
Homa Bay -28.9885* Nyandarua -11.4413
Isiolo -21.8108 Nyeri -3.1734
Kajiado -0.5511 Samburu -14.7763
Kakamega -21.2385 Siaya -12.8959
Kericho -9.0018 T.River -17.3495
Kiambu -15.8842 TaitaTaveta -33.4725
Kilifi -6.7990 Tharaka Nithi -12.5691
Kirinyaga 13.0439 Trans Nzoia -2.3547
Kisii -32.4459*** Turkana -8.5505
Kisumu -11.8941 Uasin Gishu 7.5111
Kitui -51.3920*** Vihiga 1.4534
Kwale -21.9544 West Pokot -52.9716***
Laikipia -9.9700 Wajir -0.9469
Lamu -27.3081
Constant 345.6126***
(*, **, ***) represents 10%, 5%, 1% levels of significance respectively)
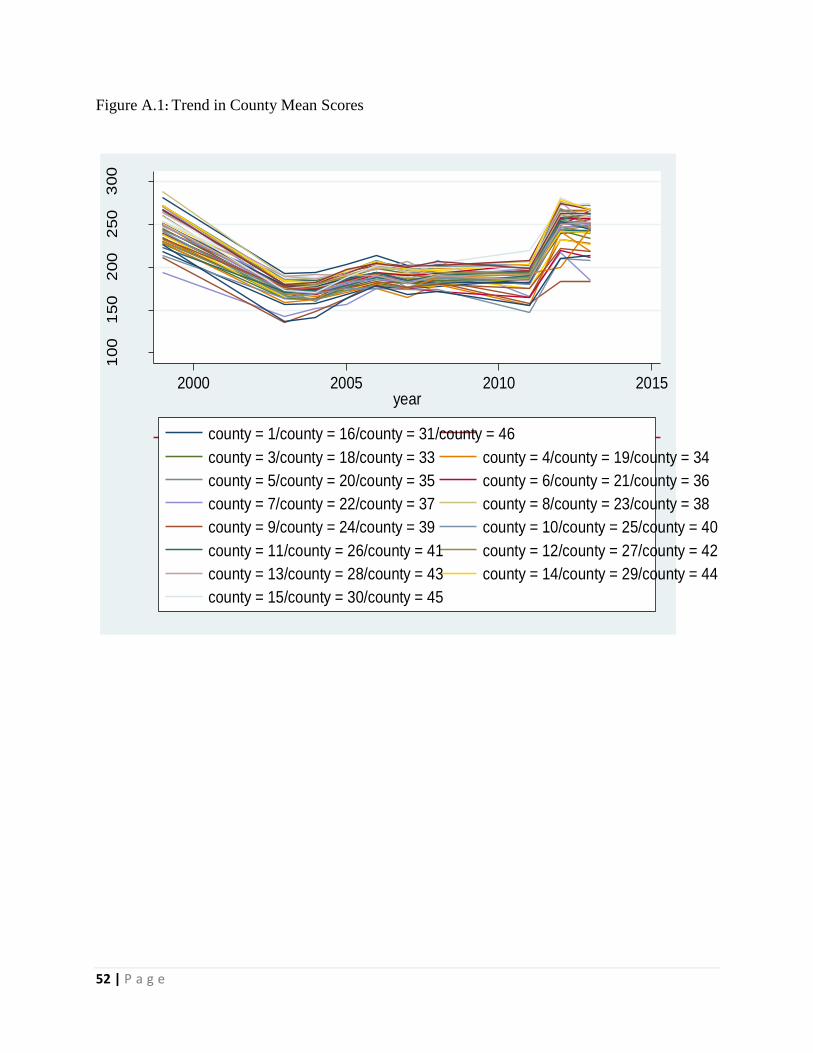
52 | P a g e
Figure A.1: Trend in County Mean Scores
100
150
200
250
300
Cou
nty
me
an
Sco
re
2000 2005 2010 2015year
county = 1/county = 16/county = 31/county = 46
county = 3/county = 18/county = 33 county = 4/county = 19/county = 34
county = 5/county = 20/county = 35 county = 6/county = 21/county = 36
county = 7/county = 22/county = 37 county = 8/county = 23/county = 38
county = 9/county = 24/county = 39 county = 10/county = 25/county = 40
county = 11/county = 26/county = 41 county = 12/county = 27/county = 42
county = 13/county = 28/county = 43 county = 14/county = 29/county = 44
county = 15/county = 30/county = 45
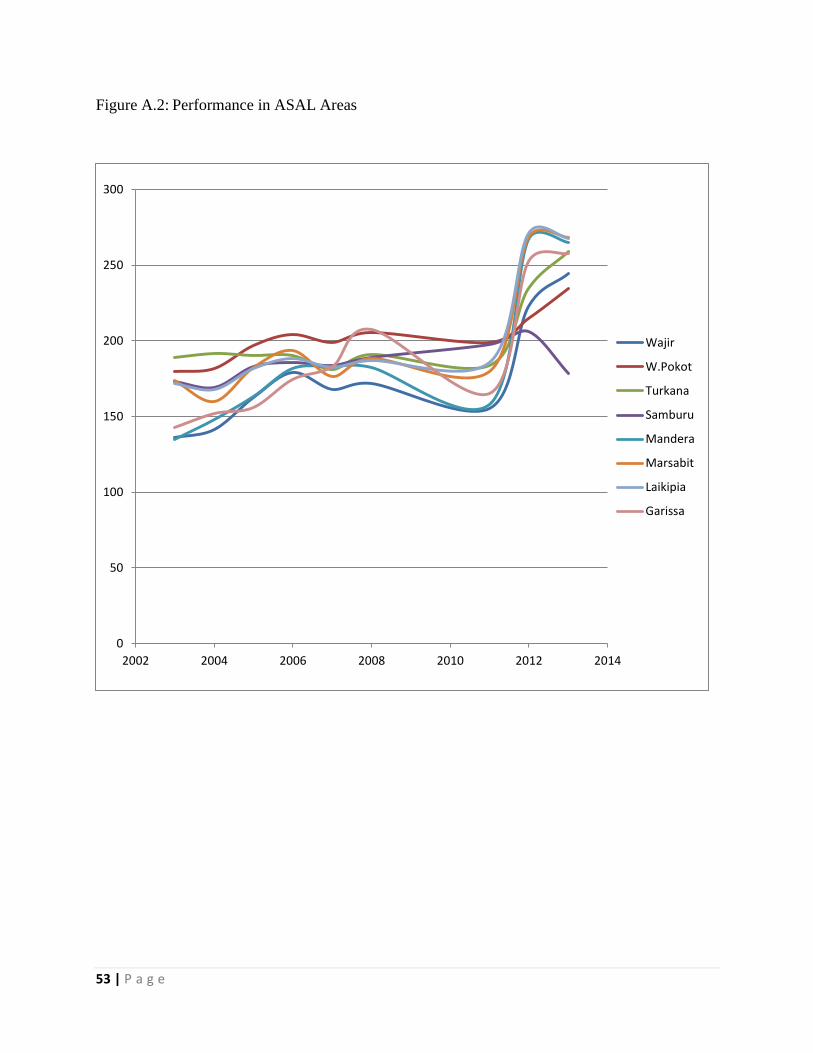
53 | P a g e
Figure A.2: Performance in ASAL Areas
0
50
100
150
200
250
300
2002 2004 2006 2008 2010 2012 2014
Wajir
W.Pokot
Turkana
Samburu
Mandera
Marsabit
Laikipia
Garissa
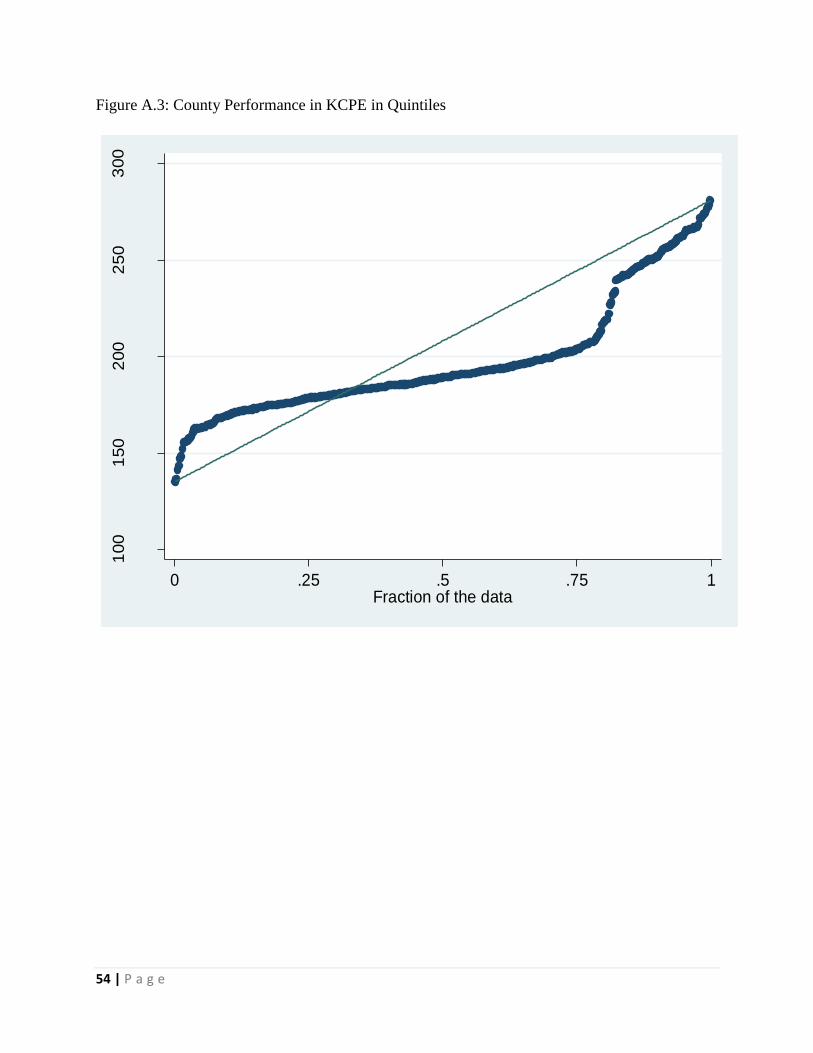
54 | P a g e
Figure A.3: County Performance in KCPE in Quintiles
100
150
200
250
300
Qua
ntile
s o
f C
ou
nty
me
an
Sco
re
0 .25 .5 .75 1Fraction of the data
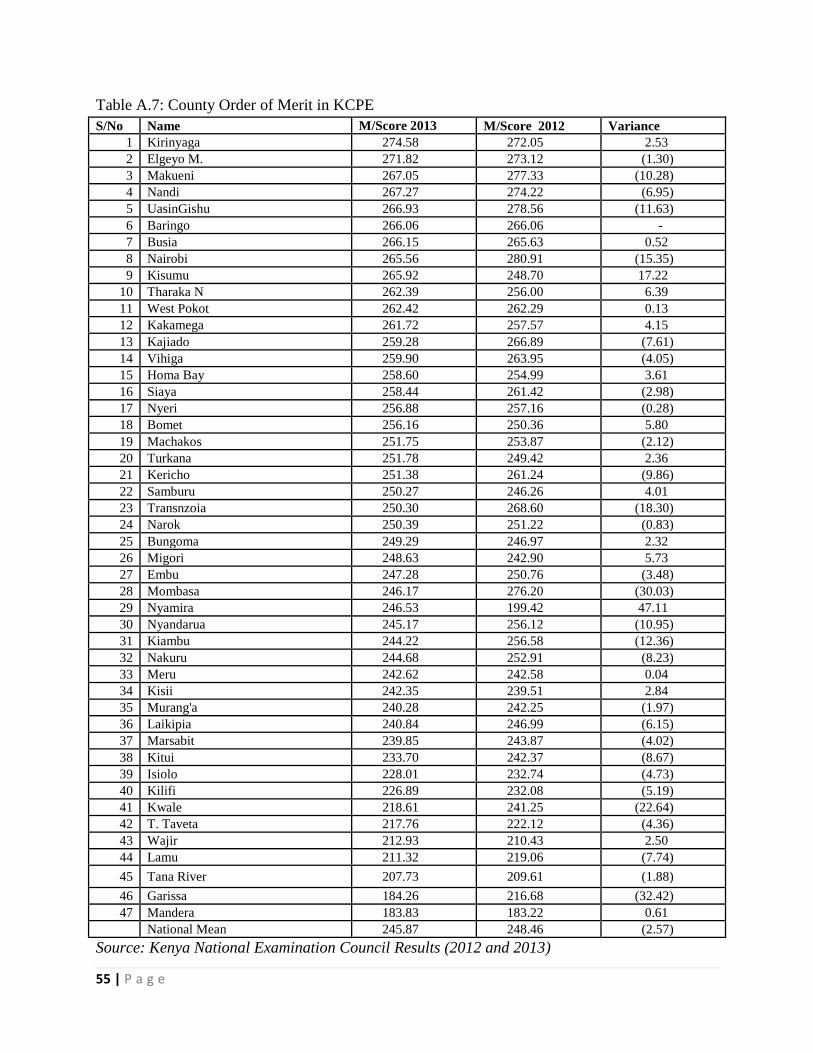
55 | P a g e
Table A.7: County Order of Merit in KCPE
S/No Name M/Score 2013 M/Score 2012 Variance
1 Kirinyaga 274.58 272.05 2.53
2 Elgeyo M. 271.82 273.12 (1.30)
3 Makueni 267.05 277.33 (10.28)
4 Nandi 267.27 274.22 (6.95)
5 UasinGishu 266.93 278.56 (11.63)
6 Baringo 266.06 266.06 -
7 Busia 266.15 265.63 0.52
8 Nairobi 265.56 280.91 (15.35)
9 Kisumu 265.92 248.70 17.22
10 Tharaka N 262.39 256.00 6.39
11 West Pokot 262.42 262.29 0.13
12 Kakamega 261.72 257.57 4.15
13 Kajiado 259.28 266.89 (7.61)
14 Vihiga 259.90 263.95 (4.05)
15 Homa Bay 258.60 254.99 3.61
16 Siaya 258.44 261.42 (2.98)
17 Nyeri 256.88 257.16 (0.28)
18 Bomet 256.16 250.36 5.80
19 Machakos 251.75 253.87 (2.12)
20 Turkana 251.78 249.42 2.36
21 Kericho 251.38 261.24 (9.86)
22 Samburu 250.27 246.26 4.01
23 Transnzoia 250.30 268.60 (18.30)
24 Narok 250.39 251.22 (0.83)
25 Bungoma 249.29 246.97 2.32
26 Migori 248.63 242.90 5.73
27 Embu 247.28 250.76 (3.48)
28 Mombasa 246.17 276.20 (30.03)
29 Nyamira 246.53 199.42 47.11
30 Nyandarua 245.17 256.12 (10.95)
31 Kiambu 244.22 256.58 (12.36)
32 Nakuru 244.68 252.91 (8.23)
33 Meru 242.62 242.58 0.04
34 Kisii 242.35 239.51 2.84
35 Murang'a 240.28 242.25 (1.97)
36 Laikipia 240.84 246.99 (6.15)
37 Marsabit 239.85 243.87 (4.02)
38 Kitui 233.70 242.37 (8.67)
39 Isiolo 228.01 232.74 (4.73)
40 Kilifi 226.89 232.08 (5.19)
41 Kwale 218.61 241.25 (22.64)
42 T. Taveta 217.76 222.12 (4.36)
43 Wajir 212.93 210.43 2.50
44 Lamu 211.32 219.06 (7.74)
45 Tana River 207.73 209.61 (1.88)
46 Garissa 184.26 216.68 (32.42)
47 Mandera 183.83 183.22 0.61
National Mean 245.87 248.46 (2.57)
Source: Kenya National Examination Council Results (2012 and 2013)
Related Documents


