Effect of a 16 week combined strength and plyometric training program followed by a detraining period on athletic performance in pubertal volleyball players This is an Accepted Manuscript of an article published in the Journal of Strength and Conditioning Research and can be accessed at http://dx.doi.org/10.1519/JSC.0000000000002461 Introduction Volleyball is a complex sport with technical, tactical and athletic demands that require a variety of explosive physical attributes (speed, power and strength) and specific motor skills (37). Because of this, participants need to train and prepare to cope with the demands of play (37). For that reason, identifying optimal training methods to increase explosive performance is crucial to optimize performance in adolescent volleyball players. Both plyometric and strength training are recognized as important components of fitness programs and are safe methods for improving explosive actions in young players (23, 38). Systematic strength training can be used to elicit increases in maximum strength and muscle hypertrophy (24) whereas plyometric training can enhance the functionality of the stretch-shortening cycle (SSC) and muscle power capacity (25). The combination of strength and plyometric training is growing in popularity. This blend of modalities is attractive to coaches as it is a time-effective method of combining two essential forms of training. Indeed, there is evidence to suggest that it may be superior to the independent (or isolated) effect of strength or plyometric training alone. Though combined training studies conducted in young players are scarce, Faigenbaum et al. (6) suggested that the addition of plyometric training to a strength training program may be more beneficial than strength training alone for enhancing selected measures of upper and lower body power in adolescent boys.

Welcome message from author
This document is posted to help you gain knowledge. Please leave a comment to let me know what you think about it! Share it to your friends and learn new things together.
Transcript
Effect of a 16 week combined strength and plyometric training program followed by a
detraining period on athletic performance in pubertal volleyball players
This is an Accepted Manuscript of an article published in the Journal of Strength and
Conditioning Research and can be accessed at http://dx.doi.org/10.1519/JSC.0000000000002461
Introduction
Volleyball is a complex sport with technical, tactical and athletic demands that require
a variety of explosive physical attributes (speed, power and strength) and specific motor skills
(37). Because of this, participants need to train and prepare to cope with the demands of play
(37). For that reason, identifying optimal training methods to increase explosive performance
is crucial to optimize performance in adolescent volleyball players.
Both plyometric and strength training are recognized as important components of
fitness programs and are safe methods for improving explosive actions in young players (23,
38). Systematic strength training can be used to elicit increases in maximum strength and
muscle hypertrophy (24) whereas plyometric training can enhance the functionality of the
stretch-shortening cycle (SSC) and muscle power capacity (25). The combination of strength
and plyometric training is growing in popularity. This blend of modalities is attractive to
coaches as it is a time-effective method of combining two essential forms of training. Indeed,
there is evidence to suggest that it may be superior to the independent (or isolated) effect of
strength or plyometric training alone. Though combined training studies conducted in young
players are scarce, Faigenbaum et al. (6) suggested that the addition of plyometric training to
a strength training program may be more beneficial than strength training alone for enhancing
selected measures of upper and lower body power in adolescent boys.

Research suggests that the effectiveness of training to enhance sprinting and jumping
performance may be influenced by maturation in young boys (32, 33). Lloyd et al., reported
that pre-pubertal boys benefitted more from plyometric training, while adolescents responded
more favorably to a combined plyometric and traditional strength training stimulus (25).
These authors proposed that maturity-dependent responses were indicative of “synergistic
adaptation”, which refers to the symbiotic relationship between specific adaptations of an
imposed training demand and concomitant growth and maturity-related adaptations (25).
However, the aforementioned study was limited in that the researchers investigated only the
short-term effects of different combinations of power and resistance training on athletic
performance in youth. Indeed, the available literature concerning long-term training dose
responses in youth is relatively scarce. The current study differs from that of Lloyd et al. (25)
in that it occurs over a much longer period of time and involves a detraining component that
could serve to highlight the retention of gains resulting from a reduced dose.
Considering that the timing and tempo of maturation differs between individuals, the
large variation in responsiveness to the combination of strength and power training seen in
adults may be more pronounced within a youth population (15). Furthermore, the influence of
detraining on athletic performance gains has received little attention among youth and is not
completely understood. High levels of fitness during an in-season period are the result of
several physiological adaptations in response to regular physical training. However, coaches
believe that a significant reduction in fitness levels can occur if players stop training even for
a short period of time. Indeed, detraining can cause a partial or complete loss of training-
induced adaptations in response to an insufficient training stimulus (18). However, there have
been few studies conducted to determine the effects of long-term detraining (more than 12
weeks of insufficient training stimulus) on adolescent players’ fitness level (29).

Given the growing popularity of youth strength and conditioning programs, it is
important to ascertain the most efficient method for enhancing motor performance and
limiting detraining effects in adolescents. This information would be useful to physical
educators, sport coaches and health care providers, particularly given the variable training
responses during growth and maturation.
On the basis of these observations of current practice and literature, the aim of this
study was to determine the effect of a combined strength and plyometric training program, or
plyometric training alone, on athletic performance and how a period of detraining might
modify the adaptations in response to training stimuli.
Method
Experimental approach to the problem
This study was designed to assess the effects of a 16-week pre-season plyometric
training program on the athletic performance of young male volleyball players (aged 14 years
old). Three groups (2 experimental groups; combined training group [CTG], plyometric
training group [PTG] and control group [CG]) were selected. The CTG performed combined
strength and plyometric training, twice weekly, along with their regular volleyball practice.
The PTG performed a plyometric training program, twice weekly, also with the regular
volleyball practice. The CG continued regular volleyball practice alone.
All subjects were tested on squat jump (SJ), countermovement jump (CMJ),
multibound test for 15s (MBT), 5-m and 10-m sprint time, medicine ball throw (MT) and
flexibility (SR) before and after the 16-week in-season training program. Subsequent to this
period, the subjects of the two experimental groups underwent 16 weeks of detraining. To
address the previously presented hypotheses, it was our goal to identify and compare the
effects of detraining or reduced training periods on the functional performance levels of
young male volleyball players. All subjects were tested on the same variables, after a 16-week

in-season detraining/reduced training periods. Outcome variables were compared over time
and between groups.
Subjects:
Sixty eight adolescent volleyball players (age: 14.6±0.6 yrs; height:176.5±6.4 cm;
body mass : 66.5±12.2 kg) from a first division Tunisian volleyball club (Sidi Bousaid Club,
Marsa Club and Carthage Club, Tunisia) volunteered to participate in this study. All
participants were from similar socio-economic backgrounds and had the same daily school-
training schedules. None were involved in any after-school activities or any formalized
strength and conditioning programs. No subjects dropped out of the intervention due to any
type of injury, but eight players were excluded from the study because they were absent from
the post-intervention testing session. As a result, the training program was completed by 20
players in each group.
To estimate the maturity status of participants, a maturity index (i.e., timing of
maturation) was calculated according to Mirwald et al. (30). This is a non-invasive and
practically approved method to predict years to/from peak-height-velocity (PHV) as a
measure of maturity, using anthropometric variables (30). Legal guardians and subjects
provided informed consent and assent after thorough explanation of the objectives and scope
of the research project, including the procedures, risks, and benefits of the study. The protocol
was fully approved by the local Institutional Review Board and procedures were in
accordance with the Declaration of Helsinki. No player had any history of musculoskeletal,
neurological or orthopedic disorders that might impair his ability to execute plyometric or
strength training.
Procedure
All procedures were carried out during the second half of the competitive volleyball
season (February to May and September 2016). One week before the commencement of the
study, all subjects participated in 2 orientation sessions to familiarize themselves with the
general environment, equipment and experimental procedures with a view to minimizing the
learning effect during the course of the intervention. Subjects were assessed for upper and
lower-body explosive strength, respectively, before and after a 16-week combined strength
and plyometric or plyometric-only training program, and also after detraining and reduced
training periods. This procedure allowed for the assessment of the following variables: (a)
thigh muscle volume, (b) squat jump (SJ), (c) countermovement jump (CMJ), (d) Multiple
Bounds jumps test (MBJ) (e) medicine ball throw (MT), (f) Sprint (5 and 10-m) and (g) Sit
and reach (SR). Tests followed a general warm-up that consisted of running, calisthenics, and
stretching. All tests were assessed after 2 trials with a 60-second rest between trials. Three
trials were carried out and the best value was considered for statistical analysis.
Assessment of the lower limb muscle volume:
Muscle volume of the lower limbs (thigh) were calculated before and after the training
period based on leg circumferences (three sites: distal, middle, and proximal), and skinfold
measurements (21).
Muscle power tests
For the SJ, participants were instructed to assume a squat stance on the infrared timing
system (Optojump Next, Microgate, Bolzano, Italy), while lightly interlocking their hands
behind their head to control for arm assistance. Participants were told to jump as explosively
as possible, and as high as possible, for the three repetitions performed. There was a passive
rest of 1 min between two successive repetitions. Test-retest demonstrated high intra-session
reliability of the SJ (ICC = 0.99; SEM = 7.93) (5).
CMJ has been shown to be a reliable and valid measure of lower limb power in
pediatric populations (4) (typical error of measurement range from 0.3 to 3.2%). During the

test, participants were instructed to jump as high as possible. Verbal encouragement was
provided before each trial. Three repetitions were performed using an infrared timing system
(Optojump Next, Microgate, Bolzano, Italy). There was a passive rest of 1 min between two
successive repetitions.
The MBJ test has been shown to be valid and reliable in measuring vertical leg muscle
power in youth (34). Jumping conditions were identical to the CMJ test with players required
to jump for maximal height repeatedly for 15 seconds. Each player performed the test only
once and mean height jumped (cm) was recorded (34). Participants were required to perform
these jumps without any rest period. Jump height was measured with an infrared timing
system Optojump (Next, Microgate, Bolzano, Italy).
Upper-body muscular power was estimated using an overhead MBT. Players stood 1
step length behind a line marked on the ground facing the throwing direction with a 3-kg
medicine ball held in both hands behind the head. Participants were instructed to plant the
front foot with the toe behind the line and throw the medicine ball overhead as far forward as
possible. Each throw was measured from inside the line to the nearest mark made by the fall
of the medicine ball. Throwing distance was measured to the nearest 1 cm, with the greatest
value obtained from 2 trials used in the analysis. The intra-class correlation coefficient for
test-retest reliability and typical error of measurement for the overhead MBT test were 0.96
and 5.4%, respectively (11).
The SR test is a valid test to asses trunk flexibility in both children (beta = 1.089, R2 =
0.281, p = 0.001) and adolescents (beta = 0.690, R2 = 0.333, p = 0.004) (3). Participants sat
on the floor using a 30.5 cm wooden box with their legs together and fully extended. For
each participant, the examiner positioned the wooden box so that it was touching the soles of
the participant’s feet which were aligned with the 22cm mark. Participants were instructed to
place one hand on top of the other with palms facing down and to keep the knees and elbows

extended. They were then instructed to reach forward along the measuring tape as far as
possible and to hold the terminal position for 6 seconds. Participants repeated the testing
procedures until their scores stabilized to within 1 cm for 3 successive efforts.
Sprint
Infrared photoelectric cells with polarizing filters and a handheld computer (Globus
Italia, Codogne, Italy) were placed at the start mark and 5-m and 10-m marks to measure the
5-m (S5m) and the 10-m (S10m) sprint times to 0.01 of a second. The starting position was
standardized for all subjects. Each started in a standing position (split stance) with the toe of
the preferred foot forward 0.3-m behind the starting gate. This was intended to allow some
forward lean and to provide triggering of the timing system as soon as the subject moved. The
photocells were set approximately 0.6 m above the floor, which was typically around hip level
to capture the trunk movement rather than a false trigger from a limb. The participants were
not permitted to use a ‘‘rolling’’ start, to eliminate momentum, and they were instructed to
sprint with maximum effort when they were ready. The intra-class correlation coefficient for
test-retest reliability and typical error of measurement for the 10-m sprint test were 0.98 and
5.2%, respectively (16).
Training program
The 16-week in-season training program consisted of a series of plyometric exercises.
Sessions took place twice weekly on nonconsecutive days. A standardized warm up including
jogging, dynamic stretching exercises, calisthenics, and preparatory exercises (e.g.,
fundamental weightlifting exercises specific to the training program) was provided for all
experimental groups before the beginning of each training session. Each training session
ended with 5 minutes of cool-down activities including dynamic stretching. After the pre-
training testing session, participants were randomly assigned to one of the three groups: two
experimental groups (combined strength and plyometric group [CTG], plyometric group
[PTG]) or control group (CG). The control group did not participate in any training program
and was limited to normal daily activities only. Groups were matched for age, maturation
status, and physical characteristics. The groups did not significantly differ in any pre-
experimental measures meaning that post-training differences could not be attributed to
unequal group composition or to pre-experimental biases.
The PTG followed a structured plyometric training program using bodyweight as
resistance. According to the training guidelines for pediatric populations (1, 23, 25), the
plyometric training was performed with 3 to 5 sets of 8 to 10 repetitions. Plyometric drills
lasted approximately 5 to 10 seconds and at least 90 seconds of rest was allowed after each set
(Table 1). To minimize the risk of injury, all sessions progressed from low to moderate to
high intensity drills, thus gradually imposing a greater eccentric stress on the musculo-
tendinous unit. The intensity of the program was increased in accordance with previous
plyometric training guidelines (1). Training volume was defined by the number of foot
contacts made during each session. The progressive overload principle was incorporated into
the program by increasing the number of foot contacts and varying the complexity of
exercises (hurdle jump and drop jump) for all rapid stretch shortening cycle (SCC) exercises.
Owing to the relative lack of plyometric training experience, verbal feedback focused on
ingraining correct take-off and landing mechanics. Additionally, and even in the early stages
of the program, subjects were exposed to repeated submaximal hopping in an effort to
maximize the likelihood of simultaneous development of fast elastic recoil and stretch reflex
utilization.
The CTG group trained with additional loads or free weights using slower speed
movements. The eccentric, isometric, concentric contraction pacing for the CTR was 1s-1s-1s,
respectively. The CTG performed strength exercises (i.e. half squat) followed by plyometric
exercises in each session. In addition, the CTR replaced 50% of the rapid SSC plyometric
exercises with a combination of strength exercises. Thus the CTG would have approximately
half of its training program involving strength exercise and half involving rapid SSC takeoffs.
The strength training program employed exercises with an intensity between 40 and 70% of 1
RM with 1 to 2 sets of 8 to 12 repetitions. The intensity was progressively increased over the
16-week training period from 40 to 70°/° of 1 RM. Each strength training session was
preceded by a 10-minute warm up and lasted ~35 minutes. The strength training exercises
were half squat, Bulgarian split squat, bench press and behind-the-neck press. The plyometric
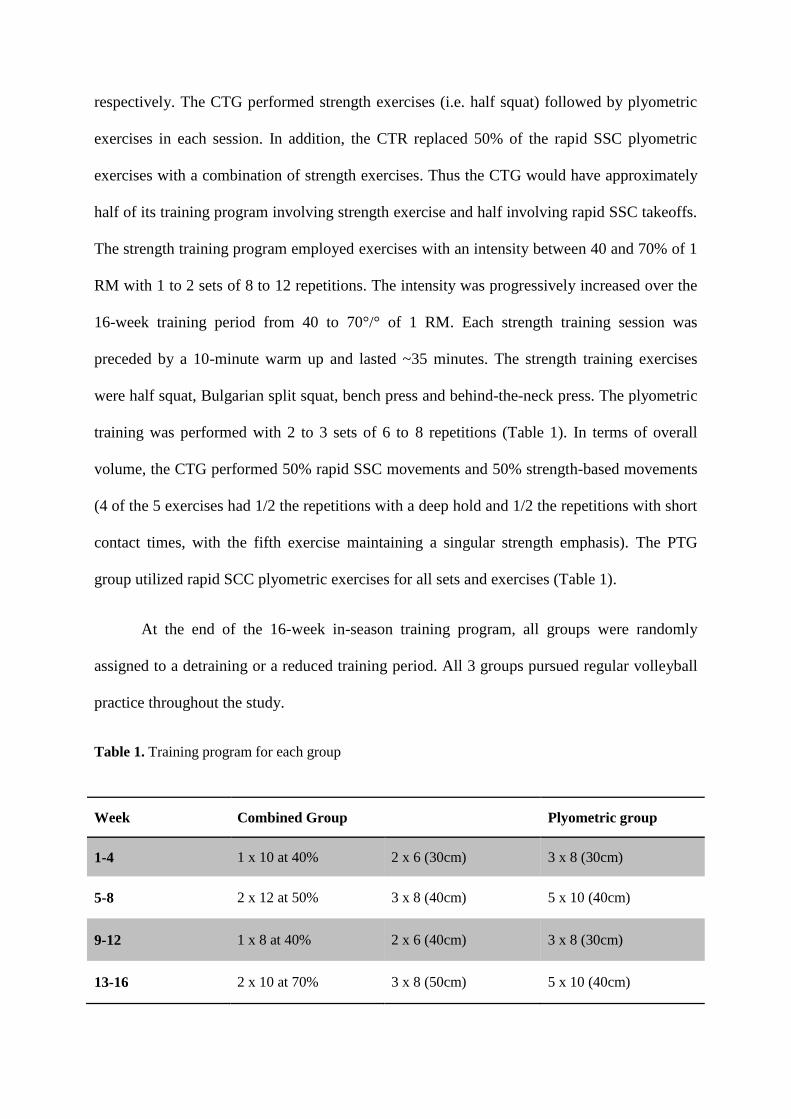
training was performed with 2 to 3 sets of 6 to 8 repetitions (Table 1). In terms of overall
volume, the CTG performed 50% rapid SSC movements and 50% strength-based movements
(4 of the 5 exercises had 1/2 the repetitions with a deep hold and 1/2 the repetitions with short
contact times, with the fifth exercise maintaining a singular strength emphasis). The PTG
group utilized rapid SCC plyometric exercises for all sets and exercises (Table 1).
At the end of the 16-week in-season training program, all groups were randomly
assigned to a detraining or a reduced training period. All 3 groups pursued regular volleyball
practice throughout the study.
Table 1. Training program for each group
Week Combined Group Plyometric group
1-4 1 x 10 at 40% 2 x 6 (30cm) 3 x 8 (30cm)
5-8 2 x 12 at 50% 3 x 8 (40cm) 5 x 10 (40cm)
9-12 1 x 8 at 40% 2 x 6 (40cm) 3 x 8 (30cm)
13-16 2 x 10 at 70% 3 x 8 (50cm) 5 x 10 (40cm)

Statistical Analyses
Data were analyzed using Statistica for Windows software (version 6.0; StatSoft, Inc,
Tulsa, OK, USA). Data distribution normality was confirmed with the Shapiro-Wilk W-test.
Means and SDs were calculated using standard statistical methods. Independent samples T-
tests were executed to analyze differences between the two experimental groups for age,
APHV, MO and anthropometrics (height, weight, BMI, % body fat). ). A three-way analysis
of variance (ANOVA) with repeated measures (Group × Time) was used to analyze
anthropometric and performance variables after training (pre and post intervention) and after
the detraining period. When the ANOVA revealed significant main effects or interactions, a
Newman–Keuls post hoc test was applied to test the discrimination between means. The
statistical significance level was set at p<0.05. Results are presented in the text and tables as
means ± SDs. The change (increase or decrease) of all physical performance values at post-
training and detraining was evaluated by calculating the delta percentage for each parameter
(i.e; Delta SJ% as DSJ% = 100* (Post-Training-Pre-training)/Pre-training); Delta SJ% as
DSJ% = 100* (Detraining-Post-training)/Post-training). Effect sizes were interpreted using
previously outlined ranges (<0.2 = trivial; 0.2-0.6 = small, 0.6-1.2 = moderate, 1.2-2.0 =
large, 2.0-4.0 = very large, >4.0 = extremely large) (17). The smallest effect was classified as
0.2 of the between-subject standard deviation (17).
Results
Morphological characteristics
Forty participants completed the training program and attended all training sessions.
None reported any training or test-related injury. Table 2 describes pre-intervention results for
all outcome variables. There were no statistically significant differences in pre-training values

between the two experimental groups. The independent samples t-test showed no statistical
differences for age (p=0.99) height (p=0.58), mass (p=0.79), BMI (p=0.66), MO (p=0.79),
%body fat (p=0.66) and APHV (p=0.34). Subjects’ anthropometric characteristics and muscle
volumes are presented in Tables 3 and 4. A two-way ANOVA showed a significant main
effect of Time factor (p<0.001) and group-by-time interaction (p<0.01) for the estimated
measures of percent body fat. Both experimental groups experienced a significant decline
over the training period for body fat % (7.8%; p<0.01 and 7.5%; p<0.01 in the CTG and PTG
respectively), followed by a significant increase over the detraining period (9.5%; p<0.001
and 7%; p<0.05 in the CTG and PTG respectively). The CG showed no change in these
characteristics.
Statistical analysis showed a significant main effect of time (p<0.001), a significant
main effect of group (p<0.05) and a significant group by time interaction (p<0.001) on muscle
volume. The post hoc analysis revealed that both combined training (34.6%; p<0.001) and
plyometric training (13.9%, p<0.01) significantly increased thigh muscle volume. However,
the CG showed no changes. After detraining, three-way ANOVA demonstrated that the CTG
showed significant decreases in thigh muscle volume (21.19%; p<0.001). However, the PTG
and CG showed no changes.
Table 2. Morphological characteristics of the two experimental groups in pre-training
Combined group Plyometric group p-value
Age (years) 14.7±0.6 14.6±0.5 0.99
Height (cm) 177±7.7 178.1±4.5 0.58
weight (kg) 68.7±11.2 67.9±9.7 0.79
BMI (kg/m2) 21.8±2.8 21.4±3 0.66
Body Fat (%) 20.5±4 19.9±4.5 0.79
MO (years) 0.81±0.5 0.98±0.6 0.66
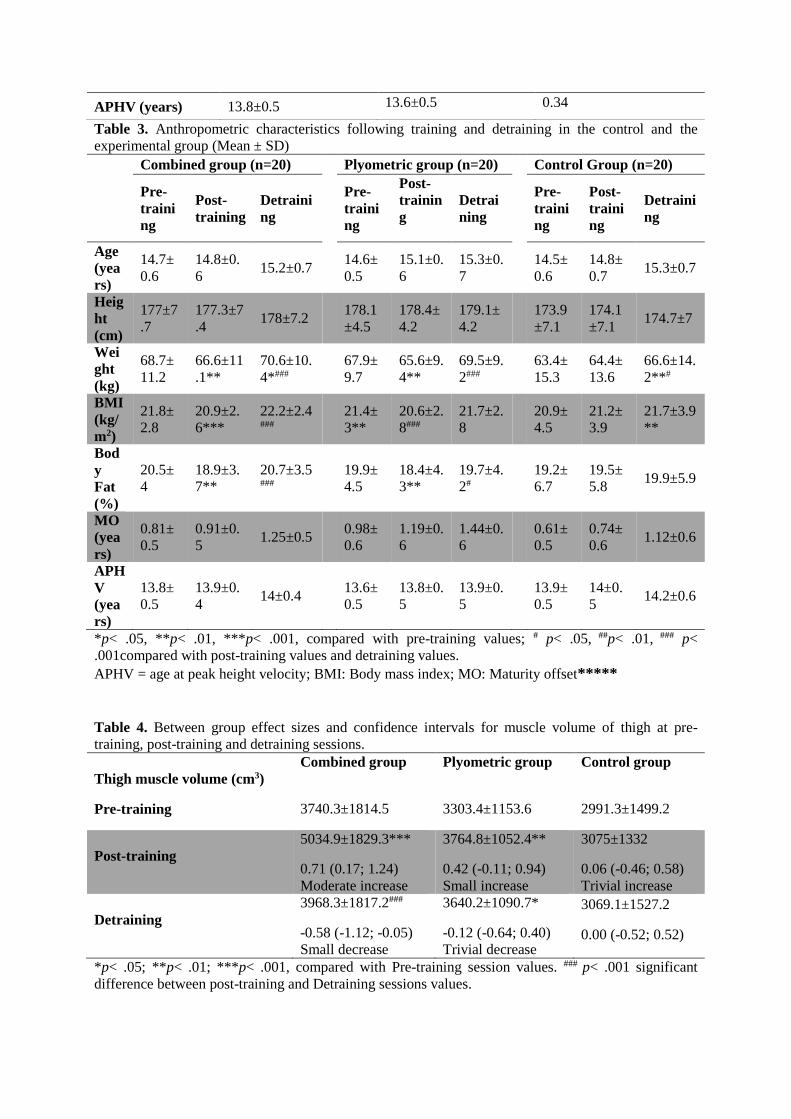
Table 3. Anthropometric characteristics following training and detraining in the control and the
experimental group (Mean ± SD)
Combined group (n=20) Plyometric group (n=20) Control Group (n=20)
Pre-
traini
ng
Post-
training
Detraini
ng
Pre-
traini
ng
Post-
trainin
g
Detrai
ning
Pre-
traini
ng
Post-
traini
ng
Detraini
ng
Age
(yea
rs)
14.7±
0.6
14.8±0.
6 15.2±0.7
14.6±
0.5
15.1±0.
6
15.3±0.
7
14.5±
0.6
14.8±
0.7 15.3±0.7
Heig
ht
(cm)
177±7
.7
177.3±7
.4 178±7.2
178.1
±4.5
178.4±
4.2
179.1±
4.2
173.9
±7.1
174.1
±7.1 174.7±7
Wei
ght
(kg)
68.7±
11.2
66.6±11
.1**
70.6±10.
4*###
67.9±
9.7
65.6±9.
4**
69.5±9.
2###
63.4±
15.3
64.4±
13.6
66.6±14.
2**#
BMI
(kg/
m2)
21.8±
2.8
20.9±2.
6***
22.2±2.4###
21.4±
3**
20.6±2.
8###
21.7±2.
8
20.9±
4.5
21.2±
3.9
21.7±3.9
**
Bod
y
Fat
(%)
20.5±
4
18.9±3.
7**
20.7±3.5###
19.9±
4.5
18.4±4.
3**
19.7±4.
2# 19.2±
6.7
19.5±
5.8 19.9±5.9
MO
(yea
rs)
0.81±
0.5
0.91±0.
5 1.25±0.5
0.98±
0.6
1.19±0.
6
1.44±0.
6
0.61±
0.5
0.74±
0.6 1.12±0.6
APH
V
(yea
rs)
13.8±
0.5
13.9±0.
4 14±0.4
13.6±
0.5
13.8±0.
5
13.9±0.
5
13.9±
0.5
14±0.
5 14.2±0.6
*p< .05, **p< .01, ***p< .001, compared with pre-training values; # p< .05, ##p< .01, ### p<
.001compared with post-training values and detraining values.
APHV = age at peak height velocity; BMI: Body mass index; MO: Maturity offset*****
Table 4. Between group effect sizes and confidence intervals for muscle volume of thigh at pre-
training, post-training and detraining sessions.
Combined group Plyometric group Control group
Thigh muscle volume (cm3)
Pre-training 3740.3±1814.5 3303.4±1153.6 2991.3±1499.2
Post-training
5034.9±1829.3***
0.71 (0.17; 1.24)
Moderate increase
3764.8±1052.4**
0.42 (-0.11; 0.94)
Small increase
3075±1332
0.06 (-0.46; 0.58)
Trivial increase
Detraining
3968.3±1817.2###
-0.58 (-1.12; -0.05)
Small decrease
3640.2±1090.7*
-0.12 (-0.64; 0.40)
Trivial decrease
3069.1±1527.2
0.00 (-0.52; 0.52)
*p< .05; **p< .01; ***p< .001, compared with Pre-training session values. ### p< .001 significant
difference between post-training and Detraining sessions values.
APHV (years) 13.8±0.5 13.6±0.5 0.34

Effect sizes
Effect sizes and their descriptors for all performance parameters are shown in Tables 5
(within-group) and 6 (between-group).
Muscle power
Vertical jumps tests
Significant main effects of time on SJ (p<0.001), CMJ (p<0.001) and MBJ (p<0.001)
and a significant group by time interaction on SJ (p <0.001), CMJ (p<0.001) and MBJ
(p<0.05) were observed. However, no significant effect of group on jump tests was observed.
Post-hoc results showed that there were no statistically significant differences in pre-training
values between groups. The post-hoc analysis revealed that combined training significantly
increased SJ by 2.05 cm (7.07%; p<0.001), CMJ by 2.04cm (6.27%; p<0.001) and MBJ by
2.43 cm (9.13%; p<0.001). Similarly, the plyometric training significantly increased SJ by
1.21 cm (4.12%, p<0.05), CMJ by 1.1 cm (3.39%, p<0.001) and MBJ by 1.19 cm (4.41%;
p<0.01). Differences were found in the improvements between experimental groups in CMJ
(p<0.01) and MBJ (p<0.05) after training in favor of the combined group. The CG showed no
changes
A three-way ANOVA demonstrated that the CTG showed significant decreases in SJ
by 2.11cm (6.79%; p<0.001), in CMJ by 2.35 cm (6.8%; p<0.001) and in MBJ by 2.86 cm
(9.87%; p<0.001). Similarly, the PTG showed significant regression in SJ by 1.64 cm
(5.36%; p<0.001), in CMJ by 1.48 (4.38%; p<0.001) and MBJ by 1.64 cm (4.22%; p<0.001).
However, the CG showed no changes.
Medicine ball throw
Significant main effects for group (p<0.05) and time factors (p<0.001) as well as a
significant group by time interaction (p<0.001) on MBT were observed. Statistical analysis
showed that there were no statistically significant differences in pre-training values between

groups. The post hoc analysis revealed that the combined training significantly increased
(14.99%; p<0.001) MBT by 0.78 cm. Likewise, the plyometric training significantly
increased (6.70%; p<0.001) MBT by 0.35 cm. However, the CG group showed no changes in
MBT. Differences were found in the improvements between experimental groups in MBT
(ES: 0.67; p<0.001) after training in favor of the CTG. Three-way ANOVA demonstrated that
the CTG showed significant decreases of 0.64cm (10.74%; p<0.01) while the PTG showed a
regression of 0.23 cm (4.01%; p<0.001) in MBT.

Table 5. Within-group analysis pre-training, post-training and detraining means, effect sizes, confidence limits, and effect description for performance data
Variables Group Pre-
training Post-training Detraining Training effect Detraining effect
Effect size Confidence
limits
Effect
description Effect size
Confidence
limits
Effect
description
SJ
(cm)
CTG 29±5.9 31.1±5.5*** 29±5.9### 0.35 -0.16 to 0.89 Small
increase -0.37 -0.89 to 0.15
Small
decrease
PTG 29.4±3.8 30.6±3.9* 28.9±4.6 ### 0.31 -0.21 to 0.84 Small
increase -0.40 -0.93 to 0.12
Small
decrease
CG 29.8±5.9 29.4±5.4 28.8±5.8 0.02 -0.50 to 0.54 Trivial increase -0.10 -062 to 0.42 Trivial
decrease
CMJ (cm)
CTG 32.5±5.9 34.5±5.7*** 32.2±5.6### 0.35 -0.17 to 0.88 Small
increase -0.41 -0.94 to 0.11
Small
decrease
PTG 32.6±6.8 33.7±6.8*** 32.2±6.7### 0.16 0.38 to 0.68 Trivial increase -0.22 -0.74 to 0.30 Small
decrease
CG 32.2±6 32.4 ±5.8 32±5.8*# 0.04 -0.48 to 0.56 Trivial increase -0.07 -0.59 to 0.45 Trivial
decrease
MBJ (cm)
CTG 26.6±5.1 29±5.8*** 26.1±4.5### 0.44 -0.08 to 0.97 Small
increase -0.53 -1.06 to 0.00
Small
decrease
PTG 27 ±6 29.2±6.2** 26.5±6.5### 0.36 -0.17 to 0.88 Small
increase -0.42 -0.94 to 0.11
Small
decrease
CG 26.3±4.6 26.5±4.5 25.9±4.7 0.05 -0.47 to 0.57 Trivial increase -0.13 -0.65 to 0.39 Trivial
decrease
S5m
(s)
CTG 0.8±0.1 0.8±0.1*** 0.8±0.1### -0.69 -1.22 to -0.15 Moderate
increase 1.10 0.54 to 1.66
Large
decrease
PTG 0.8±0.1 0.8±0.1* 0.8±0.1## -0.46 -0.99 to 0.07 Small
increase 0.52 -0.01 to 1.05
Small
decrease
CG 0.8±0.1 0.8±0.1 0.8±0.1 0.00 -0.52 to 0.52 Trivial increase 0.13 -0.40 to 0.65 Trivial
Decrease
S10m
(s)
CTG 1.9±0.1 1.8±0.1*** 1.9±0.1### -0.31 -0.83 to 0.22 Small
increase 0.69 0.16 to 1.23 Moderate decrease
PTG 1.8±0.1 1.8±0.1* 1.9±0.1### -0.3 -0.82 to 0.23 Small
increase 0.48 -0.05 to 1.01
Small
Decrease
CG 1.9±0.2 1.9±0.1 1.9±0.2 0.06 0.46 to 0.58 Trivial increase 0.12 -0.40 to 0.65 Trivial
decrease
MBT CTG 5.2±0.6 6±0.5*** 5.4±0.6### 1.32 0.75 to 1.89 Large -1.14 -1.70 to -0.58 Large

(m) increase decrease
PTG 5.3±0.5 5.6±0.5*** 5.4±0.4 ## 0.70 0.16 to 1.23 Moderate
increase -0.49 -1.02 to 0.04
Small
decrease
CG 5.13±0.6 5.2±0.6 5.1±0.6 0.05 -0.47 to 0.57 Trivial increase -0.19 -0.71 to 0.33 Trivial
decrease
SR
(cm)
CTG -3.2±9 -2.1±8.7** -2.5±8.5* 0.12 -0.40 to 0.64 Trivial increase -0.04 -.056 to 0.48 Trivial
decrease
PTG -3.1±8.4 -2.1±8.2** -2.3±8.6* 0.11 -0.41 to 0.63 Trivial increase -0.02 -0.54 to 0.50 Trivial
decrease
CG -3.5±10.1 -3.3±10.5 -3.2±9.6 0.02 -0.50 to 0.54 Trivial increase 0.00 -0.52 to 0.53 Trivial
decrease
*p< .05, **p< .01, ***p< .001, compared with pre-training values; # p< .05, ##p< .01, ### p< .001compared with post-training and detraining values.
Abbreviations: Squat jump (SJ); countermovement jump (CMJ); multi jump (MBJ); Sprint times at 5 m (S5m) and at 10 m (S10m); medicine ball throw (MBT), sit and reach
(SR); CTG: Combined training group; PTG: Plyometric training group; CG: Control group

Speed
A three-way ANOVA showed significant main effects of time on S5m (p<0.001) and
S10m (p<0.001), as well as a significant group by time interaction on S5m (p<0.05) and
S10m (p<0.05). However, no significant effects of group factor for any sprint tests (S5m,
p=0.56; S10m, p=0.46) were found.
Statistical analysis showed that there were no statistically significant differences in
pre-training values between groups. The post hoc analysis revealed that the combined training
significantly improved S5m and S10m by 0.05 seconds (6.47%; p<0.001) and 0.07 seconds
(3.47%; p<0.001) respectively. Similarly, plyometric training significantly improved 5m
sprint and 10m sprint by 0.04 seconds (4.35%, p<0.05) and 0.04 seconds (2.39%, p<0.05)
respectively. The CG showed no changes.
After detraining, the CTG, via a three-way ANOVA, demonstrated significant
decreases in 5m and 10m sprint performance by 0.08 seconds (10.93%; p<0.001) and 0.09
(4.8%; p<0.001) respectively. Similarly, the PTG showed significant regression in 5m and
10m sprint performance by 0.04 seconds (5.53%; p<0.01) and 0.06 seconds (3.42%; p<0.001)
respectively. However, the CG showed no changes.
Sit and reach test
A significant main effect of time on the SR test (p<0.001) was observed. However, there were
no significant effects for group or group by time interaction on the SR test.
Our results showed that there were no statistically significant differences in pre-
training values between groups. The post hoc analysis revealed that, after training, both
experimental groups showed a significant (p<0.001) increase in SR. This performance was
still increased at detraining (p<0.001) compared to pre and post-training.
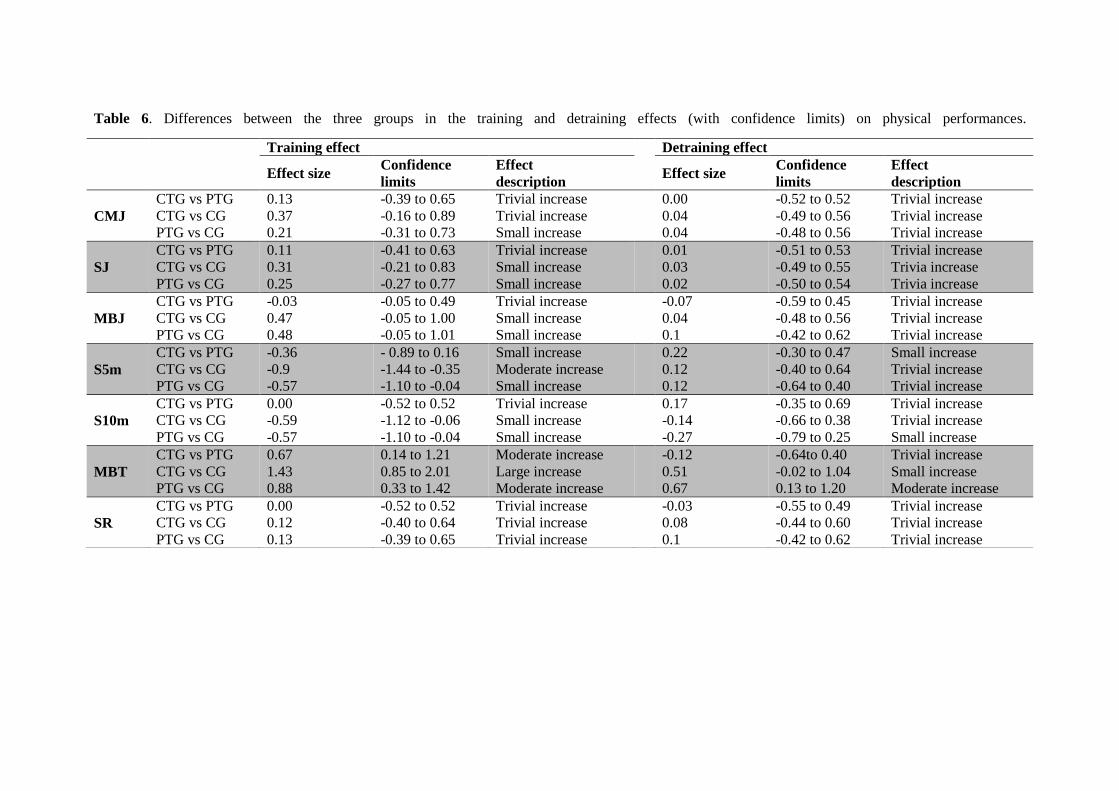
Table 6. Differences between the three groups in the training and detraining effects (with confidence limits) on physical performances.
Training effect Detraining effect
Effect size Confidence
limits
Effect
description Effect size
Confidence
limits
Effect
description
CMJ
CTG vs PTG
CTG vs CG
PTG vs CG
0.13
0.37
0.21
-0.39 to 0.65
-0.16 to 0.89
-0.31 to 0.73
Trivial increase
Trivial increase
Small increase
0.00
0.04
0.04
-0.52 to 0.52
-0.49 to 0.56
-0.48 to 0.56
Trivial increase
Trivial increase
Trivial increase
SJ
CTG vs PTG
CTG vs CG
PTG vs CG
0.11
0.31
0.25
-0.41 to 0.63
-0.21 to 0.83
-0.27 to 0.77
Trivial increase
Small increase
Small increase
0.01
0.03
0.02
-0.51 to 0.53
-0.49 to 0.55
-0.50 to 0.54
Trivial increase
Trivia increase
Trivia increase
MBJ
CTG vs PTG
CTG vs CG
PTG vs CG
-0.03
0.47
0.48
-0.05 to 0.49
-0.05 to 1.00
-0.05 to 1.01
Trivial increase
Small increase
Small increase
-0.07
0.04
0.1
-0.59 to 0.45
-0.48 to 0.56
-0.42 to 0.62
Trivial increase
Trivial increase
Trivial increase
S5m
CTG vs PTG
CTG vs CG
PTG vs CG
-0.36
-0.9
-0.57
- 0.89 to 0.16
-1.44 to -0.35
-1.10 to -0.04
Small increase
Moderate increase
Small increase
0.22
0.12
0.12
-0.30 to 0.47
-0.40 to 0.64
-0.64 to 0.40
Small increase
Trivial increase
Trivial increase
S10m
CTG vs PTG
CTG vs CG
PTG vs CG
0.00
-0.59
-0.57
-0.52 to 0.52
-1.12 to -0.06
-1.10 to -0.04
Trivial increase
Small increase
Small increase
0.17
-0.14
-0.27
-0.35 to 0.69
-0.66 to 0.38
-0.79 to 0.25
Trivial increase
Trivial increase
Small increase
MBT
CTG vs PTG
CTG vs CG
PTG vs CG
0.67
1.43
0.88
0.14 to 1.21
0.85 to 2.01
0.33 to 1.42
Moderate increase
Large increase
Moderate increase
-0.12
0.51
0.67
-0.64to 0.40
-0.02 to 1.04
0.13 to 1.20
Trivial increase
Small increase
Moderate increase
SR
CTG vs PTG
CTG vs CG
PTG vs CG
0.00
0.12
0.13
-0.52 to 0.52
-0.40 to 0.64
-0.39 to 0.65
Trivial increase
Trivial increase
Trivial increase
-0.03
0.08
0.1
-0.55 to 0.49
-0.44 to 0.60
-0.42 to 0.62
Trivial increase
Trivial increase
Trivial increase
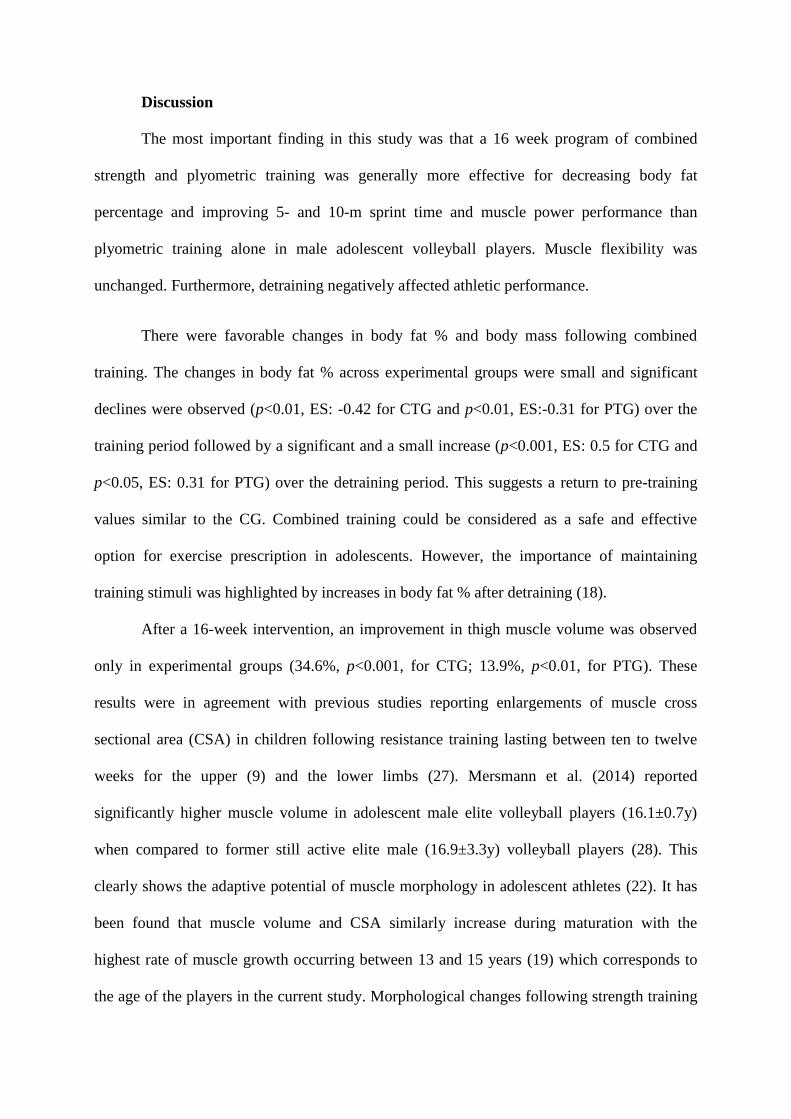
Discussion
The most important finding in this study was that a 16 week program of combined
strength and plyometric training was generally more effective for decreasing body fat
percentage and improving 5- and 10-m sprint time and muscle power performance than
plyometric training alone in male adolescent volleyball players. Muscle flexibility was
unchanged. Furthermore, detraining negatively affected athletic performance.
There were favorable changes in body fat % and body mass following combined
training. The changes in body fat % across experimental groups were small and significant
declines were observed (p<0.01, ES: -0.42 for CTG and p<0.01, ES:-0.31 for PTG) over the
training period followed by a significant and a small increase (p<0.001, ES: 0.5 for CTG and
p<0.05, ES: 0.31 for PTG) over the detraining period. This suggests a return to pre-training
values similar to the CG. Combined training could be considered as a safe and effective
option for exercise prescription in adolescents. However, the importance of maintaining
training stimuli was highlighted by increases in body fat % after detraining (18).
After a 16-week intervention, an improvement in thigh muscle volume was observed
only in experimental groups (34.6%, p<0.001, for CTG; 13.9%, p<0.01, for PTG). These
results were in agreement with previous studies reporting enlargements of muscle cross
sectional area (CSA) in children following resistance training lasting between ten to twelve
weeks for the upper (9) and the lower limbs (27). Mersmann et al. (2014) reported
significantly higher muscle volume in adolescent male elite volleyball players (16.1±0.7y)
when compared to former still active elite male (16.9±3.3y) volleyball players (28). This
clearly shows the adaptive potential of muscle morphology in adolescent athletes (22). It has
been found that muscle volume and CSA similarly increase during maturation with the
highest rate of muscle growth occurring between 13 and 15 years (19) which corresponds to
the age of the players in the current study. Morphological changes following strength training

include an increase in muscle fiber size, potential hyperplasia and changes in fiber-type
composition and connective tissue (22).
The combined training significantly decreased S5-m and S10-m by 0.05 seconds (ES:
0.69; 6.47%; p<0.001) and 0.07 seconds (ES: 0.31; 3.47%; p<0.001) respectively. These
results agreed with those in a previous study showing a significant improvement in 30 m
sprint (3.5%, 0.15 s, p<0.05) after a 13-week combined strength and speed training in youth
(20). It has been reported that short-distance sprinting is highly dependent on the ability to
generate muscular power in the extension of the ankle, knee, and hip joints (8). Therefore, in
the present study, combining the half squat and the Bulgarian split squat with vertical jumps
seems to have provided the greatest effect in sprint performance because these exercises
consisted of simultaneous triple-extension at these joints. This could be explained by the
possible transfer of gains in leg muscular power to sprint performance which was previously
reported by Gorostiaga et al. (1999) (12). Children experience a natural increase in neural
coordination and central nervous system maturation during childhood (26) which, in
combination with the fast muscle actions demonstrated during plyometric training, may
provide an augmented training response (10).
Our results revealed that, compared with pre-training, the CTG significantly increased
muscle power performance by 2.05 cm, (ES: 0.35; 7.07%; p<0.001) for SJ, 2.04cm (ES: 0.35;
6.27%; p<0.001) for CMJ, 2.43 cm (ES: 0.44; 9.13%; p<0.001) for MBJ and 0.78 cm (ES:
1.32; 14.99%; p<0.001) for the MBT. These findings were in agreement with those of a study
in which an improvement in vertical jump height after explosive strength or plyometric
training was 5.1%, or approximately 2 cm (31). Studies (13, 31) in young soccer players have
shown the beneficial effects of strength training combined with plyometric exercises on CMJ
(1.2–5.1 %; ES: 0.28–0.35). Ingle, Sleap [18) found significant improvements in dynamic

strength and throwing performance in 12 year old boys. Santos et al. (39) found
improvements in measures of lower and upper body explosive strength in 14-15 years old
male basketball players. Overall, the present study demonstrates that the varied stimulus for
the CTG increased a wider range of motor performance outcomes whereas improvements
from independent forms of plyometric training or traditional strength training appear to be
more task specific. On this, adaptations in lower body power probabaly occur because of
improved stored elastic energy utilization resulting in a higher jump and increased flight time
(and thus reduced ground time) (7). Previous studies showed no improvement in vertical jump
after strength training when slow or normal muscle action speed was used (13). These results
suggest that the speed of movement could be as, or more, important than the load and
positively affects the jump performance of adolescent volleyball players. On the whole, the
importance of a varied training stimulus is emphasized.
In addition to the above points, several researchers (25, 35) have demonstrated a
performance spurt in strength and power development around 0.5 to 1.0 years after PHV,
similar to that shown in this study. As mentioned above, improvements in muscle power
performance may be attributed to the rise of hormone levels (testosterone and growth
hormones) associated with puberty around PHV (1). Radnor et al. (36) demonstrated that
combined training and traditional strength training resulted in more positive responders in
tasks that required higher levels of reactive strength and maximal running velocity in post-
PHV boys. By comparison, in a pre-PHV group, plyometric training and combined training
resulted in more positive responders than traditional strength training in sprinting. These
researchers showed that individual responsiveness to stimuli are training mode dependent
with adaptations being specific to the type of training stimulus that is applied (25). Combined
training typically involves relatively slower movement velocities involving both concentric
and eccentric muscle actions (25) whereas our plyometric training program incorporated a
number of exercises which stressed the SSC, a rapid muscle action using eccentric-concentric
coupling (25).
Also likely to affect adaptations are variations in individual responses to training
which could potentially be explained by differences in the timing, tempo and magnitude of
maturation (2). Lloyd et al. (25) showed that the effectiveness of combined strength and
plyometric training in enhancing sprinting and jumping performance in young boys may be
influenced by maturation. Authors reported that pre-PHV boys benefitted more from
plyometric training, while boys who were post-PHV responded more favorably to a combined
plyometric and traditional strength training intervention (25). Maturity-dependent responses
are indicative of “synergistic adaptation”, which refers to the symbiotic relationship between
specific adaptations of an imposed training demand and concomitant growth and maturity-
related adaptations (36).
Following detraining in the combined strength and plyometric training groups, all
motor performance parameters returned to baseline values after 16 weeks. Consequently,
between-group differences were not expected following detraining. Our results were in line
with those of Ingle et al. 2006 reporting a detraining effect in vertical jump, chest strength and
40-m sprint time performances after a 12-week program of complex training and detraining in
pre-pubescent basketball players (18). The force production of strength-trained athletes has
been shown to decline by between 7 and 12% during periods of inactivity ranging from 8 to
12 weeks, in addition to reductions in fiber cross-sectional area and muscle mass (14).
Similarly, in our study a decline of 6 to 11% was found during the 16-week detraining period
though this could potentially be upheld through growth and maturation of the subjects. This
could potentially distort the real effect of detraining. Mechanisms responsible for the effect of
detraining on anaerobic performance characteristics have yet to be elucidated although for

dynamic strength performance reduced motor unit activation and losses in motor coordination
(40) have been suggested.
Practical application
The current study shows that 16 weeks of upper and lower body combined training resulted in
larger improvements in strength, power, throwing and sprinting performances in adolescent
volleyball players. Combining a number of elements into one training session seems to be a
safe training modality in this age cohort. Given the long-term nature of the current study, it
should be stressed that the resistance training stimulus should be varied, combining strength
with plyometric workouts to facilitate continued progressive neuromuscular adaptation.
Practitioners should include specific strength and power exercises such as bilateral and
unilateral, vertical and horizontal, and strength exercises to optimally enhance all aspects of
explosive athletic performance. In this sense, our recommendations demonstrate the
possibility for the coaches to safely choose a multidimensional, progressive combined
strength and plyometric training program, with each workout lasting 30 minutes.
Following 16 weeks of detraining/reduced training, the previously achieved performance
levels were retained. That volleyball is a sport with an emphasis on strength and power
components allows for the maintenance of neuromuscular adaptation attained by way of
previous application of specific training programs. Nevertheless, simultaneous to volleyball
practice, the application of an abbreviated combined strength and plyometric training program
allows the athletes not only to maintain previously achieved gains, but also to achieve further
development of strength, jumping, throwing and sprinting abilities. Thus, if total training time
is scarce, the coach may choose to omit strength and power training stimuli in the knowledge
that previously attained strength and power levels can be maintained. Nevertheless, the coach
must be mindful that the absence of a combined strength and plyometric training program

throughout the youth volleyball season may not be an optimal strategy owing to potentially
impaired continuous development. Indeed, the small gains obtained through regular volleyball
practice were reflective of those prior to the intervention. On that basis, young athletes’
coaches are advised to retain combined strength and plyometric training in their training
routines with a view to maintaining, and enhancing, physical development in an optimal
fashion.
References
1. Behm DG, Faigenbaum AD, Falk B, and Klentrou P. Canadian Society for Exercise
Physiology position paper: resistance training in children and adolescents. Appl Physiol Nutr
Metab 2008;33:547-61.
2. Cameron N and Demerath EW. Critical periods in human growth and their relationship to
diseases of aging. Am J Phys Anthropol 2002;Suppl 35:159-84.
3. Castro-Pinero J, Chillon P, Ortega FB, Montesinos JL, Sjostrom M, and Ruiz JR. Criterion-
related validity of sit-and-reach and modified sit-and-reach test for estimating hamstring
flexibility in children and adolescents aged 6-17 years. Int J Sports Med 2009;30:658-62.
4. Chaouachi A, Othman AB, Hammami R, Drinkwater EJ, and Behm DG. The combination of
plyometric and balance training improves sprint and shuttle run performances more often than
plyometric-only training with children. J Strength Cond Res 2014;28:401-12.
5. Comfort P, Stewart A, Bloom L, and Clarkson B. Relationships between strength, sprint, and
jump performance in well-trained youth soccer players. J Strength Cond Res 2014;28:173-7.
6. Faigenbaum AD, McFarland JE, Keiper FB, Tevlin W, Ratamess NA, Kang J, and Hoffman
JR. Effects of a short-term plyometric and resistance training program on fitness performance
in boys age 12 to 15 years. J Sports Sci Med 2007;6:519-25.
7. Fatouros IG, Jamurtas AZ, Leontsini D, Taxildaris K, Aggelousis N, Kostopoulos N, and
Buckenmeyer P. Association Evaluation of Plyometric Exercise Training, Weight Training,
and Their Combination on Vertical Jumping Performance and Leg Strength. J Strength Cond
Res 2000;14:470-476.
8. Frick U, Schmidtbleicher D, and Stutz R. Muscle activation during acceleration phase in sprint
running with special reference to starting posture. Paper presented at the XVth Congress of
International Society of Biomechanics, Jyvaskyla, Finland 1995;
9. Fukunaga T, Funato K, and Ikegawa S. The effects of resistance training on muscle area and
strength in prepubescent age. Ann Physiol Anthropol 1992;11:357-64.
10. Fukutani A, Takei S, Hirata K, Miyamoto N, Kanehisa H, and Kawakami Y. Influence of the
intensity of squat exercises on the subsequent jump performance. J Strength Cond Res
2014;28:2236-43.
11. Gabbett T, Georgieff B, Anderson S, Cotton B, Savovic D, and Nicholson L. Changes in skill
and physical fitness following training in talent-identified volleyball players. J Strength Cond
Res 2006;20:29-35.
12. Gorostiaga EM, Izquierdo M, Iturralde P, Ruesta M, and Ibanez J. Effects of heavy resistance
training on maximal and explosive force production, endurance and serum hormones in
adolescent handball players. Eur J Appl Physiol Occup Physiol 1999;80:485-93.
13. Gorostiaga EM, Izquierdo M, Ruesta M, Iribarren J, Gonzalez-Badillo JJ, and Ibanez J.
Strength training effects on physical performance and serum hormones in young soccer
players. Eur J Appl Physiol 2004;91:698-707.
14. Hakkinen K, Alen M, and Komi PV. Changes in isometric force- and relaxation-time,
electromyographic and muscle fibre characteristics of human skeletal muscle during strength
training and detraining. Acta Physiol Scand 1985;125:573-85.
15. Hammami R, Chaouachi A, Makhlouf I, Granacher U, and Behm DG. Associations Between
Balance and Muscle Strength, Power Performance in Male Youth Athletes of Different
Maturity Status. Pediatr Exerc Sci 2016;28:521-534.

16. Hammami R, Granacher U, Makhlouf I, Behm DG, and Chaouachi A. Sequencing Effects of
Balance and Plyometric Training on Physical Performance in Youth Soccer Athletes. J
Strength Cond Res 2016;30:3278-3289.
17. Hopkins WG, Marshall SW, Batterham AM, and Hanin J. Progressive statistics for studies in
sports medicine and exercise science. Med Sci Sports Exerc 2009;41:3-13.
18. Ingle L, Sleap M, and Tolfrey K. The effect of a complex training and detraining programme
on selected strength and power variables in early pubertal boys. J Sports Sci 2006;24:987-97.
19. Kanehisa H, Ikegawa S, Tsunoda N, and Fukunaga T. Strength and cross-sectional areas of
reciprocal muscle groups in the upper arm and thigh during adolescence. Int J Sports Med
1995;16:54-60.
20. Kotzamanidis C, Chatzopoulos D, Michailidis C, Papaiakovou G, and Patikas D. The effect of
a combined high-intensity strength and speed training program on the running and jumping
ability of soccer players. J Strength Cond Res 2005;19:369-75.
21. Layec G, Venturelli M, Jeong EK, and Richardson RS. The validity of anthropometric leg
muscle volume estimation across a wide spectrum: from able-bodied adults to individuals with
a spinal cord injury. J Appl Physiol (1985) 2014;116:1142-7.
22. Legerlotz K, Marzilger R, Bohm S, and Arampatzis A. Physiological Adaptations following
Resistance Training in Youth Athletes-A Narrative Review. Pediatr Exerc Sci 2016;28:501-
520.
23. Lesinski M, Prieske O, and Granacher U. Effects and dose-response relationships of resistance
training on physical performance in youth athletes: a systematic review and meta-analysis. Br
J Sports Med 2016;50:781-95.
24. Lloyd RS, Faigenbaum AD, Stone MH, Oliver JL, Jeffreys I, Moody JA, Brewer C, Pierce
KC, McCambridge TM, Howard R, Herrington L, Hainline B, Micheli LJ, Jaques R, Kraemer
WJ, McBride MG, Best TM, Chu DA, Alvar BA, and Myer GD. Position statement on youth
resistance training: the 2014 International Consensus. Br J Sports Med 2014;48:498-505.

25. Lloyd RS, Radnor JM, De Ste Croix MB, Cronin JB, and Oliver JL. Changes in Sprint and
Jump Performances After Traditional, Plyometric, and Combined Resistance Training in Male
Youth Pre- and Post-Peak Height Velocity. J Strength Cond Res 2016;30:1239-47.
26. Loturco I, Winckler C, Kobal R, Cal Abad CC, Kitamura K, Verissimo AW, Pereira LA, and
Nakamura FY. Performance changes and relationship between vertical jump measures and
actual sprint performance in elite sprinters with visual impairment throughout a Parapan
American games training season. Front Physiol 2015;6:323.
27. Mersch FJ and Stoboy H. Strength training and muscle hypertrophy in children, in: Children
and Exercise XIII. Champaign, USA: Human Kinetics 1989;
28. Mersmann F, Bohm S, Schroll A, Boeth H, Duda G, and Arampatzis A. Evidence of
imbalanced adaptation between muscle and tendon in adolescent athletes. Scand J Med Sci
Sports 2014;24:e283-9.
29. Meylan CM, Cronin JB, Oliver JL, Hopkins WG, and Contreras B. The effect of maturation
on adaptations to strength training and detraining in 11-15-year-olds. Scand J Med Sci Sports
2014;24:e156-64.
30. Mirwald RL, Baxter-Jones AD, Bailey DA, and Beunen GP. An assessment of maturity from
anthropometric measurements. Med Sci Sports Exerc 2002;34:689-94.
31. Moore CA and Fry AC. Nonfunctional overreaching during off-season training for skill
position players in collegiate American football. J Strength Cond Res 2007;21:793-800.
32. Moran J, Sandercock G, Rumpf MC, and Parry DA. Variation in Responses to Sprint Training
in Male Youth Athletes: A Meta-analysis. Int J Sports Med 2017;38:1-11.
33. Moran JJ, Sandercock GR, Ramirez-Campillo R, Meylan CM, Collison JA, and Parry DA.
Age-Related Variation in Male Youth Athletes' Countermovement Jump After Plyometric
Training: A Meta-Analysis of Controlled Trials. J Strength Cond Res 2017;31:552-565.
34. Mujika I and Padilla S. Detraining: loss of training-induced physiological and performance
adaptations. Part II: Long term insufficient training stimulus. Sports Med 2000;30:145-54.
35. Philippaerts RM, Vaeyens R, Janssens M, Van Renterghem B, Matthys D, Craen R, Bourgois
J, Vrijens J, Beunen G, and Malina RM. The relationship between peak height velocity and
physical performance in youth soccer players. J Sports Sci 2006;24:221-30.
36. Radnor JM, Lloyd RS, and Oliver JL. Individual Response to Different Forms of Resistance
Training in School-Aged Boys. J Strength Cond Res 2017;31:787-797.
37. Saeed KK. Effect of complex training with low-intensity loading interval on certain physical
variables among volleyball infants (10-12 ages). Educ&Sport/Sci 2013;1:16-21.
38. Saez de Villarreal E, Suarez-Arrones L, Requena B, Haff GG, and Ferrete C. Effects of
Plyometric and Sprint Training on Physical and Technical Skill Performance in Adolescent
Soccer Players. J Strength Cond Res 2015;29:1894-903.
39. Santos EJ and Janeira MA. Effects of complex training on explosive strength in adolescent
male basketball players. J Strength Cond Res 2008;22:903-9.
40. Van Praagh E and Franc¸a NM. Measuring maximal short-term power output during growth.
Human Kinetics 1998;155–83.
Related Documents