EET 150 Introduction to EET Lab Activity 8 Function Generator Introduction Fall 2017 1 lab8_ET150.docx Required Parts, Software and Equipment Parts Figure 1 Component /Value Quantity Resistor 10 kΩ, ¼ Watt, 5% Tolerance 1 Resistor 22 kΩ, ¼ Watt, 5% Tolerance 1 Equipment Required On-Campus Students Solderless Experimenters' Board Hookup wire (22 AWG) Wire cutter/stripper Function Generator Oscilloscope 10x Scope Probe BNC-Alligator Leads cable Optional 2 Banana jack leads red/black On-Line Students Analog Discovery 2: Arbitrary Waveform Generator (AWG). Two channel oscilloscope Optional BNC adapter board for Analog Discovery 2 Digilent 410-263 available at: http://store.digilentinc.com/bnc-adapter-board-for-the-analog-discovery/ 1 BNC to alligator lead test cable 2 10x scope probes Digilent 460-004 or equivalent available at: http://store.digilentinc.com/bnc-oscilloscope-x1-x10-probes-pair/ 2 Banana jack leads red/black BNC-Alligator Leads cable Software On-Campus Students MS Word On-Line Students Waveforms 2015 for Analog Discovery 2 Available for download at : http://store.digilentinc.com/waveforms-2015-download-only/ MS Word

Welcome message from author
This document is posted to help you gain knowledge. Please leave a comment to let me know what you think about it! Share it to your friends and learn new things together.
Transcript

EET 150 Introduction to EET
Lab Activity 8 Function Generator Introduction
Fall 2017 1 lab8_ET150.docx
Required Parts, Software and Equipment
Parts
Figure 1
Component /Value Quantity
Resistor 10 kΩ, ¼ Watt, 5% Tolerance 1
Resistor 22 kΩ, ¼ Watt, 5% Tolerance 1
Equipment
Required
On-Campus Students
Solderless Experimenters' Board Hookup wire (22 AWG) Wire cutter/stripper Function Generator Oscilloscope 10x Scope Probe BNC-Alligator Leads cable
Optional
2 Banana jack leads red/black
On-Line Students
Analog Discovery 2: Arbitrary Waveform Generator (AWG). Two channel oscilloscope
Optional BNC adapter board for Analog Discovery 2 Digilent 410-263 available at: http://store.digilentinc.com/bnc-adapter-board-for-the-analog-discovery/ 1 BNC to alligator lead test cable 2 10x scope probes Digilent 460-004 or equivalent available at: http://store.digilentinc.com/bnc-oscilloscope-x1-x10-probes-pair/ 2 Banana jack leads red/black
BNC-Alligator Leads cable Software
On-Campus Students
MS Word
On-Line Students Waveforms 2015 for Analog Discovery 2 Available for download at : http://store.digilentinc.com/waveforms-2015-download-only/ MS Word

Fall 2017 2 lab8_ET150.docx
Introduction
Function generators are commonly used to supply different signals to circuits for testing and design purposes. The signal waveform can have various shapes, frequencies, and amplitudes. Students can use the function generator to inject a known signal into a system and see how it changes through the system. A designer can verify the circuit design by comparing the resulting waveforms to the expected results from circuit calculations and circuit simulations. A technician can troubleshoot circuit faults by tracing the path of the injected signal through the circuit until it is lost. In that way the fault can be isolated to a single stage of a multistage system.
Objective
The objective of this lab is to further students’ knowledge of function generator usage. Students will be able to measure the peak voltage, period, and frequencies of different wave forms from the signal generator. Students will record the characteristics of the different waveforms.
Procedure:
1. Construct the circuit shown in Figure 1 below on the SEB.
Figure 1. Test Circuit 1.
2. On-Campus Students: Set the function generators output impedance to high Z. Push the utility button, push the output button, and then select high Z.
On-line Students: Setup the Analog Discovery 2 module according to the procedures shown in the video.
3. Set the output frequency to 1 kHz and amplitude to 200 mV peak-to-peak (p-p). Select the sine wave function from the function generator controls. Measure the resulting output with the oscilloscope.
On-Campus Students: Sketch and measure manually the waveform from points A to C and from B to C. Use the graph pages and tables in Appendix A in the end of this handout to
R210k
R122k
1kHz
A B C

Fall 2017 3 lab8_ET150.docx
document the measurements. Measure the peak-to-peak amplitude of the signal and its period. Compute the frequency from the measured period using the formula below.
T
1f
Where: T = period in seconds (S) f= frequency in Hertz (Hz)
Enter these measurements and calculations in Table 1 of Appendix A. Review presentation slides for the details of these measurements if necessary. On-line Students: Use the scope input of the AD2 and the WaveForms 2015 software to display the scope output. Display the signal from points A to C and from points B to C. Export the WaveForms display for both measurements to Appendix B of the Word version of this document. Place the images in the space provided. See the tutorial video on exporting the display for more details. Use the AD2 and WaveForms scope measurement functions to find the, peak-to-peak amplitude, the signal period and frequency. Enter these measurements and calculations in Table 1 of Appendix B.
4. Adjust the function generator frequency to 10 kHz and amplitude to 250 mVp-p. Select the square wave function. Measure the resulting output with the oscilloscope.
On-Campus Students: Sketch and measure manually the waveform from points A to C and from B to C. Use the graph pages and tables in Appendix A at the end of this handout to document the measurements. Measure the peak-to-peak amplitude of the signal and its period. Compute the frequency from the measured period using the formula from step 3. Enter these measurements and calculations in Table 2 of Appendix A. On-line Students: Use the scope input of the AD2 and the WaveForms 2015 software to display the scope output. Display the signal from points A to C and from points B to C. Export the WaveForms display for both measurements to Appendix B of the Word version of this document. Place the images in the space provided. See the tutorial video on exporting the display for more details. Use the AD2 and WaveForms scope measurement functions to find the, peak-to-peak amplitude, the signal period and frequency. Enter these measurements and calculations in Table 2 of Appendix B.
5. Adjust the frequency to 100 Hz and amplitude to 100 mVp-p. Select the triangle wave function. Measure the resulting output with the oscilloscope.
On-Campus Students: Sketch and measure manually the waveform from points A to C and from B to C. Use the graph pages and tables in Appendix A end of this handout to

Fall 2017 4 lab8_ET150.docx
document the measurements. Measure the peak-to-peak amplitude of the signal and its period. Compute the frequency from the measured period using the formula from step 3. Enter these measurements and calculations in Table 3 of Appendix A. On-line Students: Use the scope input of the AD2 and the WaveForms 2015 software to display the scope output. Display the signal from points A to C and from points B to C. Export the WaveForms display for both measurements to Appendix B of the Word version of this document. Place the images in the space provided. See the tutorial video on exporting the display for more details. Use the AD2 and WaveForms scope measurement functions to find the, peak-to-peak amplitude, the signal period and frequency. Enter these measurements and calculations in Table 3 of Appendix B.
Discussion Points
Describe the different wave functions of the function generator.

Fall 2017 5 lab8_ET150.docx
Appendix A On-campus Student Measurements and Graphs
Table 1 - Sine Wave Measurements
Test Points Voltage (Vpp) Period (Seconds) Frequency (Hz)
A-C
B-C
Sine Wave Sketch A-C
Channel 1 Volts/div ______ Channel 2 Volts/div _______ Time/div __________

Fall 2017 6 lab8_ET150.docx
Appendix A On-campus Student Measurements and Graphs
Sine Wave Sketch B-C
Channel 1 Volts/div ______ Channel 2 Volts/div _______ Time/div __________

Fall 2017 7 lab8_ET150.docx
Appendix A On-campus Student Measurements and Graphs
Table 2 - Square Wave Measurements
Test Points Voltage (Vpp) Period (Seconds) Frequency (Hz)
A-C
B-C
Square Wave Sketch A-C
Channel 1 Volts/div ______ Channel 2 Volts/div _____ Time/div __________
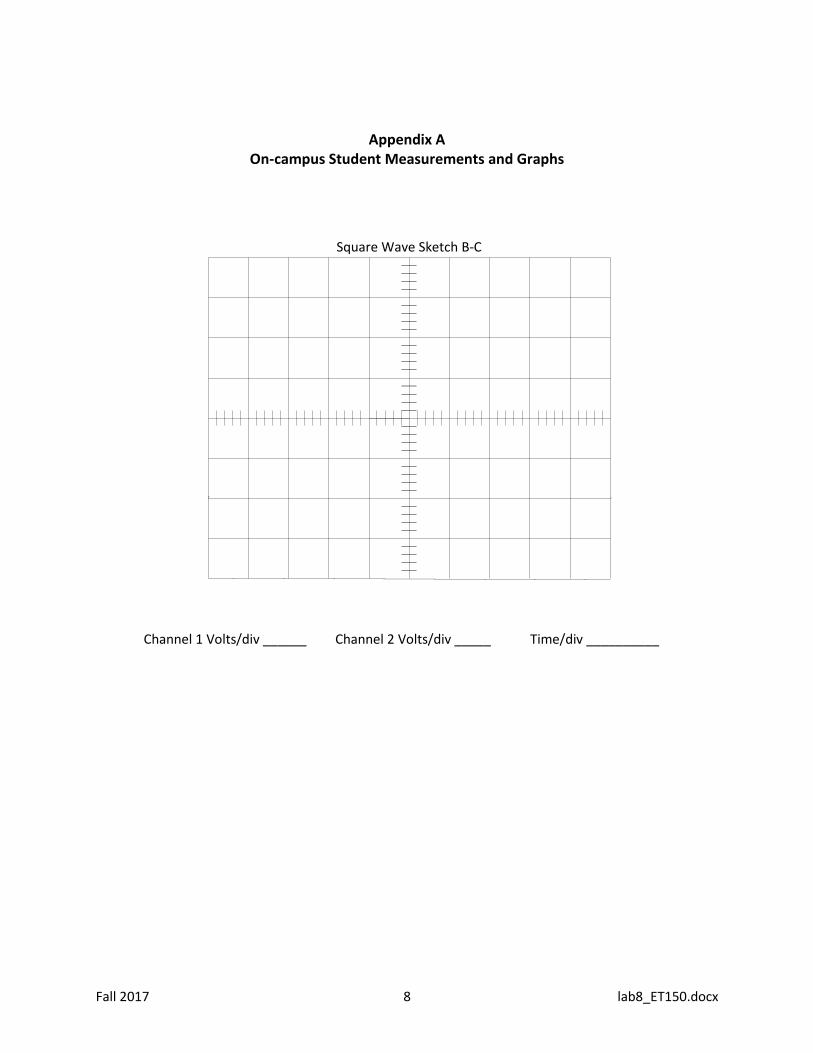
Fall 2017 8 lab8_ET150.docx
Appendix A On-campus Student Measurements and Graphs
Square Wave Sketch B-C
Channel 1 Volts/div ______ Channel 2 Volts/div _____ Time/div __________

Fall 2017 9 lab8_ET150.docx
Appendix A On-campus Student Measurements and Graphs
Table 3 - Triangle Wave Measurements
Test Points Voltage (Vpp) Period (Seconds) Frequency (Hz)
A-C
B-C
Triangle Wave Sketch A-C
Channel 1 Volts/div ______ Channel 2 Volts/div _____ Time/div __________

Fall 2017 10 lab8_ET150.docx
Appendix A On-campus Student Measurements and Graphs
Triangle Wave Sketch B-C
Channel 1 Volts/div ______ Channel 2 Volts/div _____ Time/div __________
Fall 2017 11 lab8_ET150.docx
Appendix B On-Line Student Measurements and Graphs
Table 1 - Sine Wave Measurements
Test Points Voltage (Vpp) Period (Seconds) Frequency (Hz)
A-C
B-C
Sine Wave Scope Measurement A-C
Remove this box and add the scope plot from Waveforms

Fall 2017 12 lab8_ET150.docx
Appendix B On-Line Student Measurements and Graphs
Sine Wave Scope Measurement B-C
Remove this box and add the scope plot from Waveforms

Fall 2017 13 lab8_ET150.docx
Appendix B On-Line Student Measurements and Graphs
Table 2 - Square Wave Measurements
Test Points Voltage (Vpp) Period (Seconds) Frequency (Hz)
A-C
B-C
Square Wave Scope Measurement A-C
Remove this box and add the scope plot from Waveforms

Fall 2017 14 lab8_ET150.docx
Appendix B On-Line Student Measurements and Graphs
Square Wave Scope Measurement B-C
Remove this box and add the scope plot from Waveforms

Fall 2017 15 lab8_ET150.docx
Appendix B On-Line Student Measurements and Graphs
Table 3 - Triangle Wave Measurements
Test Points Voltage (Vpp) Period (Seconds) Frequency (Hz)
A-C
B-C
Triangle Wave Scope Measurement A-C
Remove this box and add the scope plot from Waveforms

Fall 2017 16 lab8_ET150.docx
Appendix B On-Line Student Measurements and Graphs
Triangle Wave Scope Measurement B-C
Remove this box and add the scope plot from Waveforms
Related Documents