EEG potentials predict upcoming emergency brakings during simulated driving This article has been downloaded from IOPscience. Please scroll down to see the full text article. 2011 J. Neural Eng. 8 056001 (http://iopscience.iop.org/1741-2552/8/5/056001) Download details: IP Address: 134.226.252.160 The article was downloaded on 04/10/2011 at 15:21 Please note that terms and conditions apply. View the table of contents for this issue, or go to the journal homepage for more Home Search Collections Journals About Contact us My IOPscience

Welcome message from author
This document is posted to help you gain knowledge. Please leave a comment to let me know what you think about it! Share it to your friends and learn new things together.
Transcript

EEG potentials predict upcoming emergency brakings during simulated driving
This article has been downloaded from IOPscience. Please scroll down to see the full text article.
2011 J. Neural Eng. 8 056001
(http://iopscience.iop.org/1741-2552/8/5/056001)
Download details:
IP Address: 134.226.252.160
The article was downloaded on 04/10/2011 at 15:21
Please note that terms and conditions apply.
View the table of contents for this issue, or go to the journal homepage for more
Home Search Collections Journals About Contact us My IOPscience
IOP PUBLISHING JOURNAL OF NEURAL ENGINEERING
J. Neural Eng. 8 (2011) 056001 (11pp) doi:10.1088/1741-2560/8/5/056001
EEG potentials predict upcomingemergency brakings during simulateddrivingStefan Haufe1,2, Matthias S Treder1, Manfred F Gugler3,Max Sagebaum4, Gabriel Curio3 and Benjamin Blankertz1,2,4
1 Machine Learning Group, Department of Computer Science, Berlin Institute of Technology,Franklinstraße 28/29, D-10587 Berlin, Germany2 Bernstein Focus Neurotechnology, Berlin, Germany3 Neurophysics Group, Department of Neurology, Campus Benjamin Franklin, Charite UniversityMedicine Berlin, D-12203 Berlin, Germany4 Intelligent Data Analysis Group, Fraunhofer Institute FIRST, Kekulestraße 7, D-12489 Berlin,Germany
E-mail: [email protected]
Received 8 March 2011Accepted for publication 1 July 2011Published 28 July 2011Online at stacks.iop.org/JNE/8/056001
AbstractEmergency braking assistance has the potential to prevent a large number of car crashes.State-of-the-art systems operate in two stages. Basic safety measures are adopted onceexternal sensors indicate a potential upcoming crash. If further activity at the brake pedal isdetected, the system automatically performs emergency braking. Here, we present the resultsof a driving simulator study indicating that the driver’s intention to perform emergency brakingcan be detected based on muscle activation and cerebral activity prior to the behaviouralresponse. Identical levels of predictive accuracy were attained using electroencephalography(EEG), which worked more quickly than electromyography (EMG), and using EMG, whichworked more quickly than pedal dynamics. A simulated assistance system using EEG andEMG was found to detect emergency brakings 130 ms earlier than a system relying only onpedal responses. At 100 km h−1 driving speed, this amounts to reducing the braking distanceby 3.66 m. This result motivates a neuroergonomic approach to driving assistance. Our EEGanalysis yielded a characteristic event-related potential signature that comprised componentsrelated to the sensory registration of a critical traffic situation, mental evaluation of the sensorypercept and motor preparation. While all these components should occur often during normaldriving, we conjecture that it is their characteristic spatio-temporal superposition in emergencybraking situations that leads to the considerable prediction performance we observed.
S Online supplementary data available from stacks.iop.org/JNE/8/056001/mmedia
(Some figures in this article are in colour only in the electronic version)
In our increasingly complex world, many safety-criticalsystems are operated by computers. Wherever human controlis required, it may constitute a safety risk as human failures canhave dramatic consequences. Traffic accidents, for instance,rank third among the causes of death in the USA and are largelycaused by human errors [1].
Driving assistance systems aim to complement humancontrol and can prevent failures in several ways. A recentdevelopment is hybrid approaches combining informationfrom vehicle/surround sensors and human behaviour. Basicsafety measures are adopted once external (radar or laser)sensors indicate a potential upcoming crash. If further ‘panic’
1741-2560/11/056001+11$33.00 1 © 2011 IOP Publishing Ltd Printed in the UK
J. Neural Eng. 8 (2011) 056001 S Haufe et al
activity at the brake pedal is detected, it is interpreted as thedriver’s confirmation of the criticality of the situation. Thisallows the system to go into an emergency braking procedureas soon as the brake pedal is touched by the driver, which savestime. However, the brake pedal response is only the very lastevent in the cascade of behavioural responses triggered duringan emergency braking situation. Consequently, there havebeen attempts to retrieve the driver’s braking intent earlier byconsidering additional behavioural inputs, such as gas pedalrelease, steering angle, foot position and head movements[2, 3].
This study takes the next two steps in monitoring humanbehaviour during driving. First, by measuring myoelectric(EMG) activity caused by muscle tension in the lower leg, wedetect leg motion before it can be registered by pedal sensors.The existence of a characteristic EMG pattern precedingcrashes has recently been noted [4], but no evaluation of itspredictiveness regarding emergency braking detection has yettaken place. Second, more interestingly, for the first timewe tap the driver’s intention at the time and locus of its verygeneration—the human brain. Observable behaviour in anemergency braking situation is preceded by a cascade of neuralevents, including sensory registration, mental evaluation andmotor preparation. As witnessed by the recent expansion of thefield of neuroergonomics (for an overview, see [5]), monitoringcerebral activity during realistic tasks affords unprecedentedinsights into human functioning. The advent of powerfulmachine learning and signal processing techniques, largelydeveloped in the context of brain–computer interfacing, makesit possible to reliably decode and track mental states non-invasively in real time using electroencephalography (EEG)[6–9].
To date, neurophysiological research for safety-criticalapplications has mainly focused on the detection of fatigue[10–17] and high mental workload [18]. The present studyis the first one to investigate EEG correlates of intendedemergency braking. We conducted a driving simulator study(N = 18) in which participants had to follow a computer-controlled lead vehicle within 20 m distance at a speed of100 km h−1. The simulation included sharp curves and denseoncoming traffic to make the driving task both realistic anddemanding. Occasionally, emergency braking situations wereinduced by means of a rapid braking of the lead vehicle.
Under a unified analysis framework, we assessedthe extent to which features derived from different inputchannels characterize emergency braking situations. Besidesneurophysiological recordings, these channels also comprisedthe technical parameters used in commercial assistivesystems5,6. The results reported here were obtained infour consecutive steps. First, univariate features wereinvestigated, leading to the discovery of a characteristicevent-related potential (ERP) signature preceding executedemergency brakings. Using a classification approach, wethen assessed how much better critical traffic situations canbe distinguished from normal driving when the prediction isbased on multivariate spatio-temporal instead of univariate
5 http://en.wikipedia.org/wiki/Precrash_system.6 http://en.wikipedia.org/wiki/Brake_Assist.
features. Both analyses were carried out separately foreach channel and each stage of emergency braking situation.Thus, it is possible to compare channels in terms of theirpredictiveness at each stage. In the third step, we investigatedpotential redundancy among input channels by comparingthe performance of a model that integrates all channels tothat of models that exclude EEG and/or EMG. In the laststep, we applied prototypical emergency braking intentiondetectors, either integrating neurophysiology or not, to the datain a pseudo-online fashion. This gives us the opportunity toestimate and compare the utility of both approaches in practice.
1. Material and methods
1.1. Experimental setup
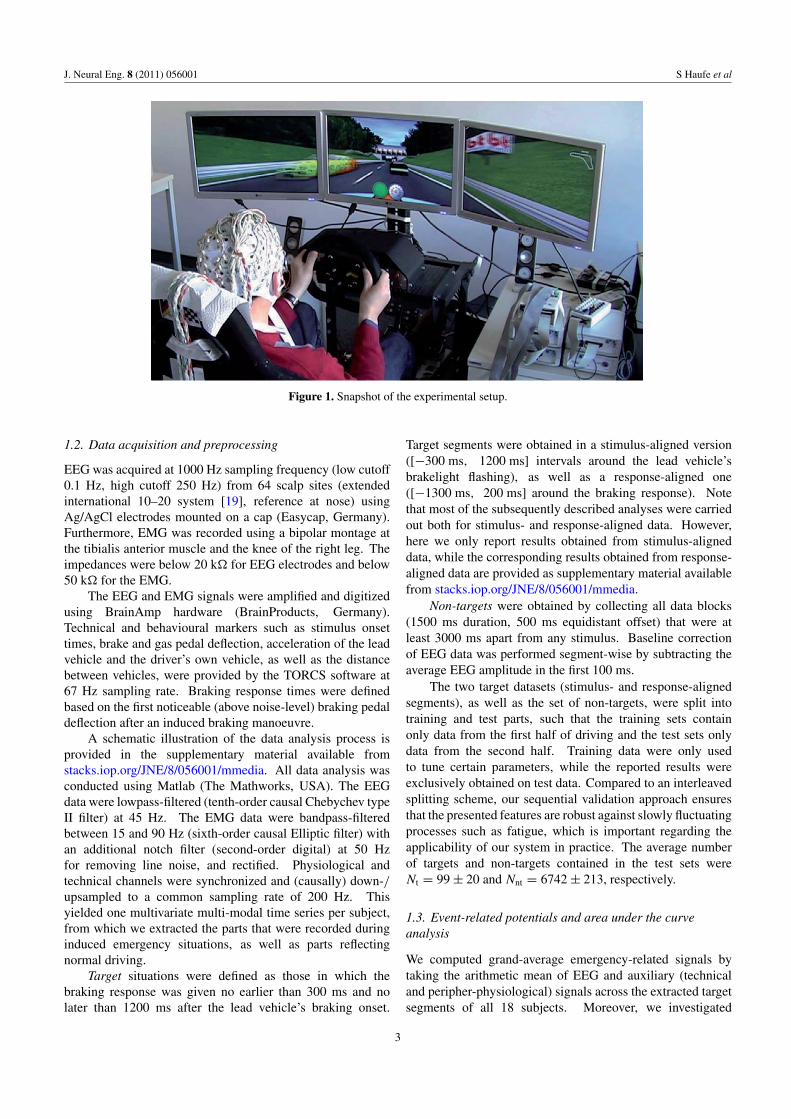
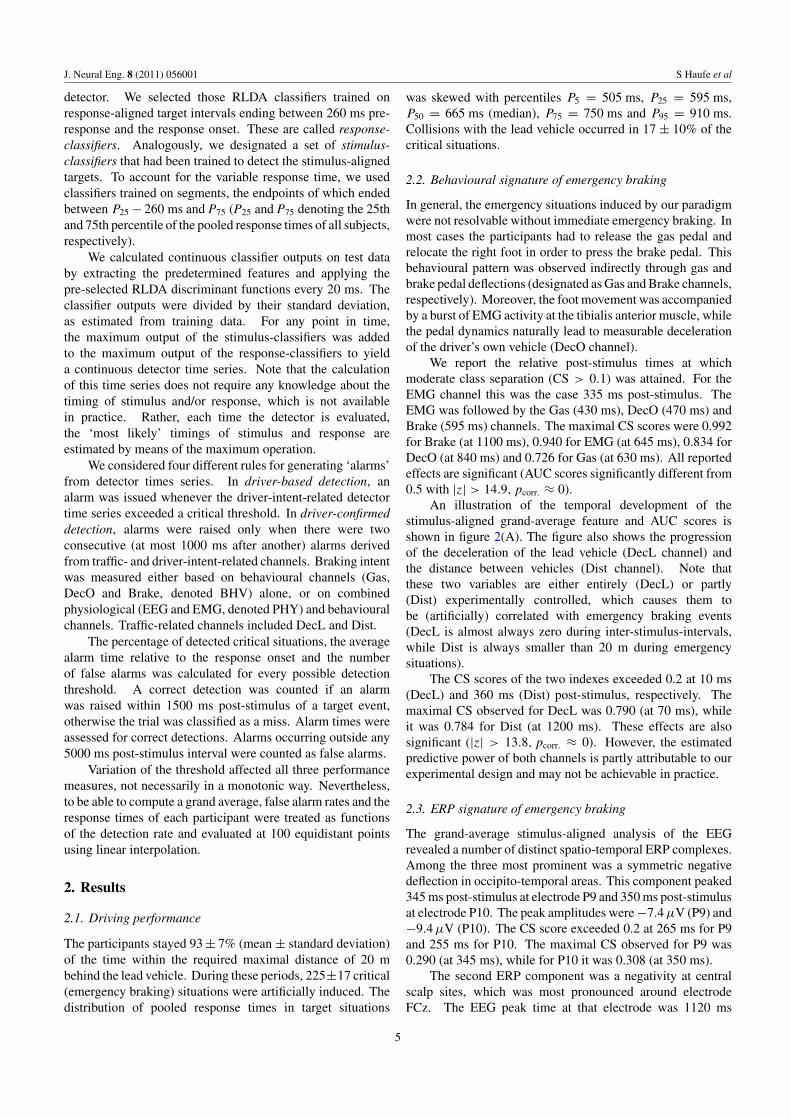
Eighteen healthy right-handed participants (age 30.6 ±5.4 years, four females) participated in the study. All possesseda driver’s licence and had normal or corrected-to-normalvision. Subjects were paid for their participation. Theexperiment was conducted in accordance with the Declarationof Helsinki and written informed consent was given byall participants. The participants were seated in a drivingsimulator rack (Virtual Performance Parts, Germany) in frontof a wide screen composed of three 19′′ monitors (theexperimental apparatus can be seen in figure 1). On the screen,a customized version of the open-source racing softwareTORCS (The Open Racing Car Simulator7) was shown.
The participants’ task was to drive a virtual racing carusing the steering wheel and gas/brake pedals (automaticclutch), and to tightly follow a computer-controlled leadvehicle at a driving speed of 100 km h−1. While the participantswere within the desired maximal distance of 20 m, thelead vehicle occasionally (20–40 s inter-stimulus-interval,randomized) decelerated abruptly to between 60 and 80 km h−1
(randomized). The manoeuvre was accompanied by a flashingof the brakelights. The driver was instructed to performimmediate emergency braking in these situations in order toavoid a crash. In the following, we refer to the onset of thelead vehicle’s braking (and brakelight flashing) as the stimulus,while the first notable post-stimulus brake pedal deflectionis called the response. Three seconds after a deceleration,the lead vehicle accelerated again to 100 km h−1. When thedistance between both vehicles exceeded 100 m (e.g. aftercrashes), the lead vehicle would wait for the driver’s ownvehicle to catch up. The lead vehicle would only ever brake toinduce an emergency situation. The distance between vehicleswas indicated by a coloured circle next to the speedometer,which was green for distances under 20 m and otherwiseyellow.
The setting included oncoming traffic, such that theparticipants did not have the opportunity to avoid a potentialaccident by switching to the neighbouring lane. Three blocks(45 min each) of driving were conducted with rest periods of10–15 min in between.
7 http://torcs.sourceforge.net/.
2
J. Neural Eng. 8 (2011) 056001 S Haufe et al
Figure 1. Snapshot of the experimental setup.
1.2. Data acquisition and preprocessing
EEG was acquired at 1000 Hz sampling frequency (low cutoff0.1 Hz, high cutoff 250 Hz) from 64 scalp sites (extendedinternational 10–20 system [19], reference at nose) usingAg/AgCl electrodes mounted on a cap (Easycap, Germany).Furthermore, EMG was recorded using a bipolar montage atthe tibialis anterior muscle and the knee of the right leg. Theimpedances were below 20 k� for EEG electrodes and below50 k� for the EMG.
The EEG and EMG signals were amplified and digitizedusing BrainAmp hardware (BrainProducts, Germany).Technical and behavioural markers such as stimulus onsettimes, brake and gas pedal deflection, acceleration of the leadvehicle and the driver’s own vehicle, as well as the distancebetween vehicles, were provided by the TORCS software at67 Hz sampling rate. Braking response times were definedbased on the first noticeable (above noise-level) braking pedaldeflection after an induced braking manoeuvre.
A schematic illustration of the data analysis process isprovided in the supplementary material available fromstacks.iop.org/JNE/8/056001/mmedia. All data analysis wasconducted using Matlab (The Mathworks, USA). The EEGdata were lowpass-filtered (tenth-order causal Chebychev typeII filter) at 45 Hz. The EMG data were bandpass-filteredbetween 15 and 90 Hz (sixth-order causal Elliptic filter) withan additional notch filter (second-order digital) at 50 Hzfor removing line noise, and rectified. Physiological andtechnical channels were synchronized and (causally) down-/upsampled to a common sampling rate of 200 Hz. Thisyielded one multivariate multi-modal time series per subject,from which we extracted the parts that were recorded duringinduced emergency situations, as well as parts reflectingnormal driving.
Target situations were defined as those in which thebraking response was given no earlier than 300 ms and nolater than 1200 ms after the lead vehicle’s braking onset.
Target segments were obtained in a stimulus-aligned version([−300 ms, 1200 ms] intervals around the lead vehicle’sbrakelight flashing), as well as a response-aligned one([−1300 ms, 200 ms] around the braking response). Notethat most of the subsequently described analyses were carriedout both for stimulus- and response-aligned data. However,here we only report results obtained from stimulus-aligneddata, while the corresponding results obtained from response-aligned data are provided as supplementary material availablefrom stacks.iop.org/JNE/8/056001/mmedia.
Non-targets were obtained by collecting all data blocks(1500 ms duration, 500 ms equidistant offset) that were atleast 3000 ms apart from any stimulus. Baseline correctionof EEG data was performed segment-wise by subtracting theaverage EEG amplitude in the first 100 ms.
The two target datasets (stimulus- and response-alignedsegments), as well as the set of non-targets, were split intotraining and test parts, such that the training sets containonly data from the first half of driving and the test sets onlydata from the second half. Training data were only usedto tune certain parameters, while the reported results wereexclusively obtained on test data. Compared to an interleavedsplitting scheme, our sequential validation approach ensuresthat the presented features are robust against slowly fluctuatingprocesses such as fatigue, which is important regarding theapplicability of our system in practice. The average numberof targets and non-targets contained in the test sets wereNt = 99 ± 20 and Nnt = 6742 ± 213, respectively.
1.3. Event-related potentials and area under the curveanalysis
We computed grand-average emergency-related signals bytaking the arithmetic mean of EEG and auxiliary (technicaland peripher-physiological) signals across the extracted targetsegments of all 18 subjects. Moreover, we investigated
3
J. Neural Eng. 8 (2011) 056001 S Haufe et al
how well univariate features—that is, single-time single-sensor readings—classify segments as targets or non-targets. This was done by evaluating the area under thespecificity–sensitivity (i.e. receiver-operating characteristics)curve (AUC), obtained by varying the detection threshold [20].The AUC is a non-parametric statistic, which is equivalent toMann–Whitney U and Wilcoxon’s rank-sum tests for assessingdifferences in two populations, and Kendall’s τ measuringcorrelation between feature values and binary class labels [21].Besides, it is an estimate of the probability that a randomlychosen target has a higher feature value than a randomly chosennon-target [20, 21].
To compute AUC scores, non-targets was sampled fromthe normal driving periods and compared to the targets. TheAUC is symmetric around 0.5. That is, scores above (below)0.5 indicate that targets have higher (lower) feature values thannon-targets, while 0.5 is attained for completely uninformativefeatures. Grand-average AUC scores were calculated as thearithmetic mean across subjects.
Based on the AUC, we defined a class separation (CS)score CS = 2|AUC − 0.5|, which varies between 0 for no CSand 1 for perfect CS.
1.4. Classification
We were also interested in the area under curve attainableat each stage of emergency braking when the (spatio-)temporal dynamics in the preceding interval could be usedfor prediction. To this end, we constructed additionalsets of target segments with a constant length of1500 ms. The endpoints of these segments were variedin steps of 20 ms from −200 to 1180 ms relative tothe stimulus and from −1200 to 180 ms relative to theresponse. Furthermore, separate datasets were created forthe seven channels EEG, EMG, Gas, Brake, deceleration oflead vehicle and own vehicle (abbreviated DecL and DecO)and distance (Dist), the combination of the two traffic-relatedchannels DecL and Dist, as well as for four combinationsof channels reflecting the driver’s emergency braking intent.These combinations were EEG+EMG+Gas+Brake+DecO,EMG+Gas+Brake+DecO (no EEG), EEG+Gas+Brake+DecO(no EMG) and Gas+Brake+DecO (no physiology at all).
For each channel and target/non-target combination,ten discriminating time intervals (not necessarily of equallength) were determined using a heuristic based on bi-serial correlation scores [22]. EEG electrodes showingextraordinarily high spectral power (in a broad 5–40 Hzfrequency band) or abnormally high variability in power ontraining data were discarded. The criterion used to identifyabnormal observations was based on the interquartile range.The average signals of the remaining electrodes in the selectedtime intervals were stacked into feature vectors and fed intoregularized linear discriminant analysis (RLDA) [23, 24]classifiers, along with the corresponding class label.
The discriminant function of RLDA has the form y(x) =w�x +b, where x is a feature vector and w = �−1(μ2 − μ1) isa vector that is orthogonal to the class-separating hyperplane.The vectors μ1/2 and the matrix � are empirical estimators ofthe two feature class means and the common feature covariance
matrix, while the scalar b is the decision threshold. Withoutloss of generality, we define μ1 to be the mean of the non-targetsamples and μ2 to be the mean of the targets. We applied thetransformation w ← 2w/[w�(μ2−μ1)] and set b = 1−w�μ2in order to achieve that y(μ1) = −1 and y(μ2) = 1.
To mitigate numerical instability when inverting singularor poorly conditioned covariance matrices, the shrinkagetechnique [25, 26] was applied. That is, the true covariancematrix was approximated by a convex combination ofthe empirical covariance and the identity matrix. The shrinkagecoefficient was chosen such that the mean-squared-errorbetween � and the true unknown covariance matrix wasminimized [27, 28].
Data from the first half of driving were used for selectingtime intervals and for estimating class means and covariancematrices. The trained discriminant functions were applied tothe corresponding test data and the resulting outputs were usedto calculate unbiased estimates of the AUC.
1.5. Statistical testing
For sufficiently large numbers of targets and non-targets(Nt + Nnt > 10), the AUC is approximately normal distributedwith variance Var(AUC, Nt, Nnt) = [AUC(1 − AUC) + (Nt −1)(Q1−AUC2)+(Nnt−1) (Q2−AUC2)]/[NtNnt], where Q1 =AUC/(2−AUC) and Q2 = 2AUC2/(1+AUC) [21]. We usedthis to test whether AUC scores are significantly different from0.5 in the grand average. This was done by calculating subject-wise z-scores zk = (AUCk − 0.5)/
√[Var(0.5, Nt, Nnt)],
summing them up to a grand-average z-score z = (z1 + z2 +. . . + z18)/
√18 and performing a two-sided z-test to obtain
grand-average p-values. Differences between two AUC scores,AUCk,j and AUCk,i , were tested by treating zk,ji = (AUCk,j −AUCk,i)/
√[Var(AUCk,j , Nt, Nnt) + Var(AUCk,i , Nt, Nnt)] as
standard normal distributed quantities and proceeding asabove to obtain grand-average z-scores and p-values. Inorder to compare one AUC score to multiple others, theminimal absolute value of the z-scores obtained in the binarycomparisons was used to calculate the p-value.
The p-values obtained in exploratory analyses wereBonferroni-corrected to account for multiple hypothesistesting [29]. The correction factor used in the ERP analysiswas 280 (time instants) × 57 (electrodes) = 15 960. In theanalysis of auxiliary (non-neural) parameters it was 280 (timeinstants). All p-values smaller than 10−10 are reported asp ≈ 0. Statistical significance is assumed if (corrected)p-values are smaller than 0.05.
1.6. Pseudo-online emergency braking detection
We constructed driver-specific emergency braking detectorsthat were designed to work on continuous data withoutknowledge about the timing of stimulus and response. Sincestimulus-related signal components (such as the VEP inducedby the brake-light flashing) are best recognized by classifierstrained on stimulus-aligned target intervals, and response-related signal components (such as motor readiness potential)are best recognized by classifiers trained on response-alignedtarget intervals, both types of classifier were used for the
4
J. Neural Eng. 8 (2011) 056001 S Haufe et al
detector. We selected those RLDA classifiers trained onresponse-aligned target intervals ending between 260 ms pre-response and the response onset. These are called response-classifiers. Analogously, we designated a set of stimulus-classifiers that had been trained to detect the stimulus-alignedtargets. To account for the variable response time, we usedclassifiers trained on segments, the endpoints of which endedbetween P25 − 260 ms and P75 (P25 and P75 denoting the 25thand 75th percentile of the pooled response times of all subjects,respectively).
We calculated continuous classifier outputs on test databy extracting the predetermined features and applying thepre-selected RLDA discriminant functions every 20 ms. Theclassifier outputs were divided by their standard deviation,as estimated from training data. For any point in time,the maximum output of the stimulus-classifiers was addedto the maximum output of the response-classifiers to yielda continuous detector time series. Note that the calculationof this time series does not require any knowledge about thetiming of stimulus and/or response, which is not availablein practice. Rather, each time the detector is evaluated,the ‘most likely’ timings of stimulus and response areestimated by means of the maximum operation.
We considered four different rules for generating ‘alarms’from detector times series. In driver-based detection, analarm was issued whenever the driver-intent-related detectortime series exceeded a critical threshold. In driver-confirmeddetection, alarms were raised only when there were twoconsecutive (at most 1000 ms after another) alarms derivedfrom traffic- and driver-intent-related channels. Braking intentwas measured either based on behavioural channels (Gas,DecO and Brake, denoted BHV) alone, or on combinedphysiological (EEG and EMG, denoted PHY) and behaviouralchannels. Traffic-related channels included DecL and Dist.
The percentage of detected critical situations, the averagealarm time relative to the response onset and the numberof false alarms was calculated for every possible detectionthreshold. A correct detection was counted if an alarmwas raised within 1500 ms post-stimulus of a target event,otherwise the trial was classified as a miss. Alarm times wereassessed for correct detections. Alarms occurring outside any5000 ms post-stimulus interval were counted as false alarms.
Variation of the threshold affected all three performancemeasures, not necessarily in a monotonic way. Nevertheless,to be able to compute a grand average, false alarm rates and theresponse times of each participant were treated as functionsof the detection rate and evaluated at 100 equidistant pointsusing linear interpolation.
2. Results
2.1. Driving performance
The participants stayed 93 ± 7% (mean ± standard deviation)of the time within the required maximal distance of 20 mbehind the lead vehicle. During these periods, 225±17 critical(emergency braking) situations were artificially induced. Thedistribution of pooled response times in target situations
was skewed with percentiles P5 = 505 ms, P25 = 595 ms,P50 = 665 ms (median), P75 = 750 ms and P95 = 910 ms.Collisions with the lead vehicle occurred in 17 ± 10% of thecritical situations.
2.2. Behavioural signature of emergency braking
In general, the emergency situations induced by our paradigmwere not resolvable without immediate emergency braking. Inmost cases the participants had to release the gas pedal andrelocate the right foot in order to press the brake pedal. Thisbehavioural pattern was observed indirectly through gas andbrake pedal deflections (designated as Gas and Brake channels,respectively). Moreover, the foot movement was accompaniedby a burst of EMG activity at the tibialis anterior muscle, whilethe pedal dynamics naturally lead to measurable decelerationof the driver’s own vehicle (DecO channel).
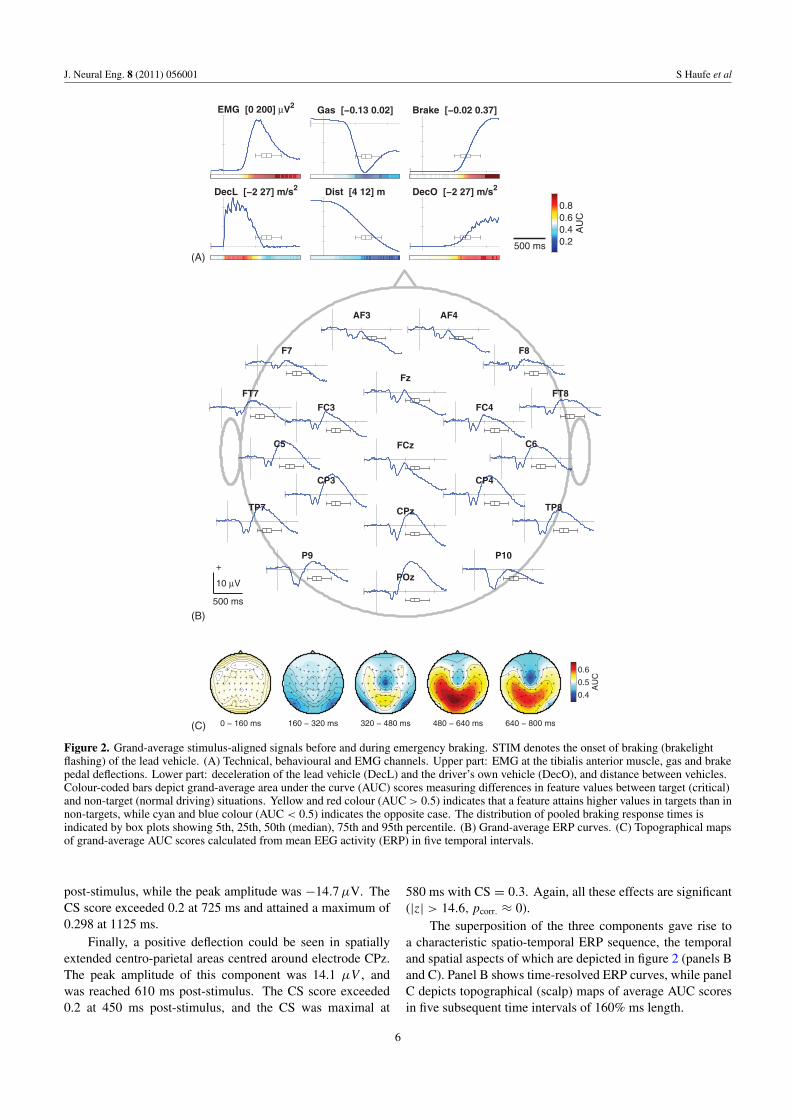
We report the relative post-stimulus times at whichmoderate class separation (CS > 0.1) was attained. For theEMG channel this was the case 335 ms post-stimulus. TheEMG was followed by the Gas (430 ms), DecO (470 ms) andBrake (595 ms) channels. The maximal CS scores were 0.992for Brake (at 1100 ms), 0.940 for EMG (at 645 ms), 0.834 forDecO (at 840 ms) and 0.726 for Gas (at 630 ms). All reportedeffects are significant (AUC scores significantly different from0.5 with |z| > 14.9, pcorr. ≈ 0).
An illustration of the temporal development of thestimulus-aligned grand-average feature and AUC scores isshown in figure 2(A). The figure also shows the progressionof the deceleration of the lead vehicle (DecL channel) andthe distance between vehicles (Dist channel). Note thatthese two variables are either entirely (DecL) or partly(Dist) experimentally controlled, which causes them tobe (artificially) correlated with emergency braking events(DecL is almost always zero during inter-stimulus-intervals,while Dist is always smaller than 20 m during emergencysituations).
The CS scores of the two indexes exceeded 0.2 at 10 ms(DecL) and 360 ms (Dist) post-stimulus, respectively. Themaximal CS observed for DecL was 0.790 (at 70 ms), whileit was 0.784 for Dist (at 1200 ms). These effects are alsosignificant (|z| > 13.8, pcorr. ≈ 0). However, the estimatedpredictive power of both channels is partly attributable to ourexperimental design and may not be achievable in practice.
2.3. ERP signature of emergency braking
The grand-average stimulus-aligned analysis of the EEGrevealed a number of distinct spatio-temporal ERP complexes.Among the three most prominent was a symmetric negativedeflection in occipito-temporal areas. This component peaked345 ms post-stimulus at electrode P9 and 350 ms post-stimulusat electrode P10. The peak amplitudes were −7.4 μV (P9) and−9.4 μV (P10). The CS score exceeded 0.2 at 265 ms for P9and 255 ms for P10. The maximal CS observed for P9 was0.290 (at 345 ms), while for P10 it was 0.308 (at 350 ms).
The second ERP component was a negativity at centralscalp sites, which was most pronounced around electrodeFCz. The EEG peak time at that electrode was 1120 ms
5
J. Neural Eng. 8 (2011) 056001 S Haufe et al
(A)
AU
C
0.20.40.60.8
EMG [0 200] µV2
DecO [−2 27] m/s2Dist [4 12] mDecL [−2 27] m/s2
Brake [−0.02 0.37]Gas [−0.13 0.02]
500 ms
(B)
10 µV
+
500 ms
AF3
TP8TP7
POz
P9 P10
Fz
FT8FT7
FCz
FC4FC3
F8F7
CPz
CP4CP3
C6C5
AF4
(C)
AU
C
0.4
0.5
0.6
0 − 160 ms 160 − 320 ms 320 − 480 ms 480 − 640 ms 640 − 800 ms
Figure 2. Grand-average stimulus-aligned signals before and during emergency braking. STIM denotes the onset of braking (brakelightflashing) of the lead vehicle. (A) Technical, behavioural and EMG channels. Upper part: EMG at the tibialis anterior muscle, gas and brakepedal deflections. Lower part: deceleration of the lead vehicle (DecL) and the driver’s own vehicle (DecO), and distance between vehicles.Colour-coded bars depict grand-average area under the curve (AUC) scores measuring differences in feature values between target (critical)and non-target (normal driving) situations. Yellow and red colour (AUC > 0.5) indicates that a feature attains higher values in targets than innon-targets, while cyan and blue colour (AUC < 0.5) indicates the opposite case. The distribution of pooled braking response times isindicated by box plots showing 5th, 25th, 50th (median), 75th and 95th percentile. (B) Grand-average ERP curves. (C) Topographical mapsof grand-average AUC scores calculated from mean EEG activity (ERP) in five temporal intervals.
post-stimulus, while the peak amplitude was −14.7 μV. TheCS score exceeded 0.2 at 725 ms and attained a maximum of0.298 at 1125 ms.
Finally, a positive deflection could be seen in spatiallyextended centro-parietal areas centred around electrode CPz.The peak amplitude of this component was 14.1 μV , andwas reached 610 ms post-stimulus. The CS score exceeded0.2 at 450 ms post-stimulus, and the CS was maximal at
580 ms with CS = 0.3. Again, all these effects are significant(|z| > 14.6, pcorr. ≈ 0).
The superposition of the three components gave rise toa characteristic spatio-temporal ERP sequence, the temporaland spatial aspects of which are depicted in figure 2 (panels Band C). Panel B shows time-resolved ERP curves, while panelC depicts topographical (scalp) maps of average AUC scoresin five subsequent time intervals of 160% ms length.
6
J. Neural Eng. 8 (2011) 056001 S Haufe et al
(A)
(B)
−200 STIM 200 400 600 800 1000 1200
0.5
0.6
0.7
0.8
0.9
1
Acc
urac
y [A
UC
]
Time [ms]
DecLDistEEGEMGGasDecOBrake
−200 STIM 200 400 600 800 1000 1200
0.5
0.6
0.7
0.8
0.9
1
Acc
urac
y [A
UC
]
Time [ms]
EEG+EMG+Gas+DecO+BrakeEMG+Gas+DecO+BrakeEEG+Gas+DecO+BrakeGas+DecO+Brake
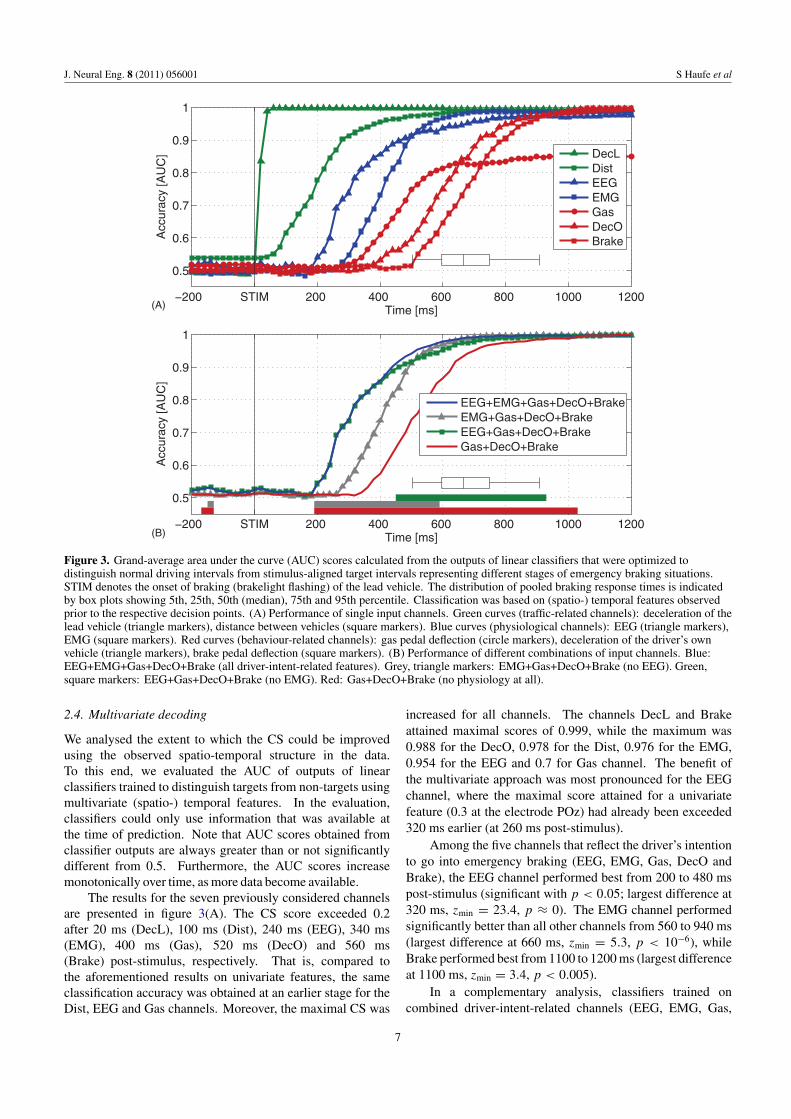
Figure 3. Grand-average area under the curve (AUC) scores calculated from the outputs of linear classifiers that were optimized todistinguish normal driving intervals from stimulus-aligned target intervals representing different stages of emergency braking situations.STIM denotes the onset of braking (brakelight flashing) of the lead vehicle. The distribution of pooled braking response times is indicatedby box plots showing 5th, 25th, 50th (median), 75th and 95th percentile. Classification was based on (spatio-) temporal features observedprior to the respective decision points. (A) Performance of single input channels. Green curves (traffic-related channels): deceleration of thelead vehicle (triangle markers), distance between vehicles (square markers). Blue curves (physiological channels): EEG (triangle markers),EMG (square markers). Red curves (behaviour-related channels): gas pedal deflection (circle markers), deceleration of the driver’s ownvehicle (triangle markers), brake pedal deflection (square markers). (B) Performance of different combinations of input channels. Blue:EEG+EMG+Gas+DecO+Brake (all driver-intent-related features). Grey, triangle markers: EMG+Gas+DecO+Brake (no EEG). Green,square markers: EEG+Gas+DecO+Brake (no EMG). Red: Gas+DecO+Brake (no physiology at all).
2.4. Multivariate decoding
We analysed the extent to which the CS could be improvedusing the observed spatio-temporal structure in the data.To this end, we evaluated the AUC of outputs of linearclassifiers trained to distinguish targets from non-targets usingmultivariate (spatio-) temporal features. In the evaluation,classifiers could only use information that was available atthe time of prediction. Note that AUC scores obtained fromclassifier outputs are always greater than or not significantlydifferent from 0.5. Furthermore, the AUC scores increasemonotonically over time, as more data become available.
The results for the seven previously considered channelsare presented in figure 3(A). The CS score exceeded 0.2after 20 ms (DecL), 100 ms (Dist), 240 ms (EEG), 340 ms(EMG), 400 ms (Gas), 520 ms (DecO) and 560 ms(Brake) post-stimulus, respectively. That is, compared tothe aforementioned results on univariate features, the sameclassification accuracy was obtained at an earlier stage for theDist, EEG and Gas channels. Moreover, the maximal CS was
increased for all channels. The channels DecL and Brakeattained maximal scores of 0.999, while the maximum was0.988 for the DecO, 0.978 for the Dist, 0.976 for the EMG,0.954 for the EEG and 0.7 for Gas channel. The benefit ofthe multivariate approach was most pronounced for the EEGchannel, where the maximal score attained for a univariatefeature (0.3 at the electrode POz) had already been exceeded320 ms earlier (at 260 ms post-stimulus).
Among the five channels that reflect the driver’s intentionto go into emergency braking (EEG, EMG, Gas, DecO andBrake), the EEG channel performed best from 200 to 480 mspost-stimulus (significant with p < 0.05; largest difference at320 ms, zmin = 23.4, p ≈ 0). The EMG channel performedsignificantly better than all other channels from 560 to 940 ms(largest difference at 660 ms, zmin = 5.3, p < 10−6), whileBrake performed best from 1100 to 1200 ms (largest differenceat 1100 ms, zmin = 3.4, p < 0.005).
In a complementary analysis, classifiers trained oncombined driver-intent-related channels (EEG, EMG, Gas,
7
J. Neural Eng. 8 (2011) 056001 S Haufe et al
−2500 STIM RESP 2500 5000
0
5
THR
Am
plitu
de [A
U]
Time [ms]
TrafficPhysiology+BehaviourBehaviour
0
2
4
6
8
10
Fal
se A
larm
Rat
e [1
/h]
0 10 20 30 40 50 60 70 80 90 100−300
−200
−100
RESP
100
Detection Rate [%] )dlohserhT woL()dlohserhT hgiH(
Ala
rm T
ime
[ms]
Driver−based: Physiology+BehaviourDriver−based: BehaviourDriver−confirmed: Physiology+BehaviourDriver−confirmed: Behaviour
(A)
(B)
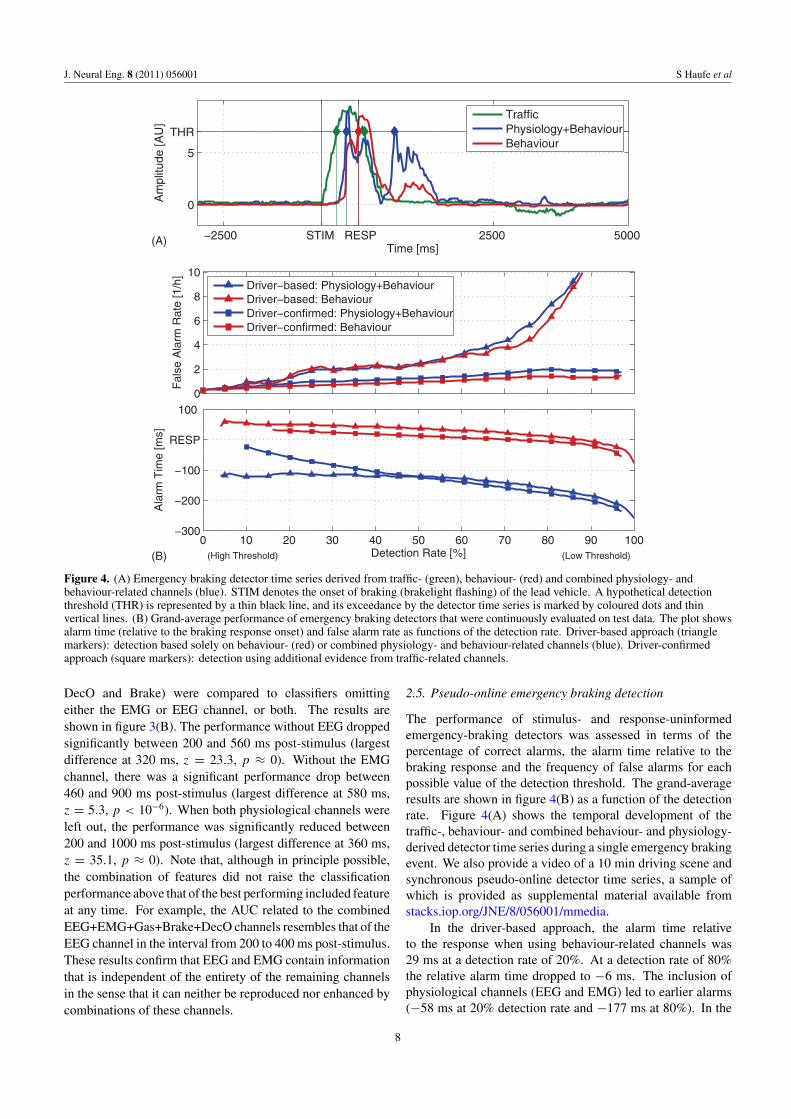
Figure 4. (A) Emergency braking detector time series derived from traffic- (green), behaviour- (red) and combined physiology- andbehaviour-related channels (blue). STIM denotes the onset of braking (brakelight flashing) of the lead vehicle. A hypothetical detectionthreshold (THR) is represented by a thin black line, and its exceedance by the detector time series is marked by coloured dots and thinvertical lines. (B) Grand-average performance of emergency braking detectors that were continuously evaluated on test data. The plot showsalarm time (relative to the braking response onset) and false alarm rate as functions of the detection rate. Driver-based approach (trianglemarkers): detection based solely on behaviour- (red) or combined physiology- and behaviour-related channels (blue). Driver-confirmedapproach (square markers): detection using additional evidence from traffic-related channels.
DecO and Brake) were compared to classifiers omittingeither the EMG or EEG channel, or both. The results areshown in figure 3(B). The performance without EEG droppedsignificantly between 200 and 560 ms post-stimulus (largestdifference at 320 ms, z = 23.3, p ≈ 0). Without the EMGchannel, there was a significant performance drop between460 and 900 ms post-stimulus (largest difference at 580 ms,z = 5.3, p < 10−6). When both physiological channels wereleft out, the performance was significantly reduced between200 and 1000 ms post-stimulus (largest difference at 360 ms,z = 35.1, p ≈ 0). Note that, although in principle possible,the combination of features did not raise the classificationperformance above that of the best performing included featureat any time. For example, the AUC related to the combinedEEG+EMG+Gas+Brake+DecO channels resembles that of theEEG channel in the interval from 200 to 400 ms post-stimulus.These results confirm that EEG and EMG contain informationthat is independent of the entirety of the remaining channelsin the sense that it can neither be reproduced nor enhanced bycombinations of these channels.
2.5. Pseudo-online emergency braking detection
The performance of stimulus- and response-uninformedemergency-braking detectors was assessed in terms of thepercentage of correct alarms, the alarm time relative to thebraking response and the frequency of false alarms for eachpossible value of the detection threshold. The grand-averageresults are shown in figure 4(B) as a function of the detectionrate. Figure 4(A) shows the temporal development of thetraffic-, behaviour- and combined behaviour- and physiology-derived detector time series during a single emergency brakingevent. We also provide a video of a 10 min driving scene andsynchronous pseudo-online detector time series, a sample ofwhich is provided as supplemental material available fromstacks.iop.org/JNE/8/056001/mmedia.
In the driver-based approach, the alarm time relativeto the response when using behaviour-related channels was29 ms at a detection rate of 20%. At a detection rate of 80%the relative alarm time dropped to −6 ms. The inclusion ofphysiological channels (EEG and EMG) led to earlier alarms(−58 ms at 20% detection rate and −177 ms at 80%). In the
8
J. Neural Eng. 8 (2011) 056001 S Haufe et al
driver-confirmed approach, alarm times were determined bythe later (driver-related) detector time series and hence similarto those of the solely driver-based approach. The observedalarm times were 50 ms (BHV) and −110 ms (BHV+PHY)at 20% detection rate. At 80% detection rate, we measured12 ms (BHV) and −160 ms (BHV+PHY). The inclusion ofEEG and EMG channels yielded an improvement of relativealarm time (measured as the mean value across all detectionrates occurring) of 167 ± 85 ms for the driver-based approachand 132 ± 55 ms for the driver-confirmed approach.
Omitting EEG/EMG channels did not lead to significantlydifferent false alarm rates. In the driver-based approach,it increased from 1.37 h−1 (at 20% detection rate) to7.05 h−1 (at 80% detection rate) for combined physiologicaland behaviour-related channels and from 1.45 to 5.91 h−1 forsolely behaviour-related channels. The false alarm rate waslower in the driver-confirmed approach: it did not exceed1.96 h−1 for combined physiological and behaviour-relatedchannels and 1.49 h−1 for solely behaviour-related channels,even in regimes with high detection rates.
3. Discussion
3.1. Neurophysiological relevance
The present investigation revealed a characteristic spatio-temporal ERP pattern observable before and during emergencybrakings. This signature was found to be a superposition of atleast three ERP components reflecting the cognitive processesbetween stimulus perception and actual braking. Theneurophysiological relevance of the individual componentscan be deduced from their spatio-temporal properties asfollows.
The lead vehicle’s braking manoeuvre involves flashingbrakelights, which is a strong visual stimulus. Moreover, dueto the rapidly decreasing distance to the braking vehicle infront, the visual input is magnified continuously over time.The initial negative deflection observed in occipito-temporalEEG electrodes may therefore be attributed to visual stimulusperception.
A broad parieto-occipital positivity is typical for a P300component. Classically related to higher-order processingof an ‘oddball’ stimulus [30, 31], the occurrence of aP300 complex is explained here by the relative rareness andimportance of the critical traffic situation.
Finally, the central negativity is attributed to planningprocesses in the motor system before and during theact of switching the right foot from gas to brakingpedal. The preparatory (pre-movement) component of thisnegativity was first described in [32], where it was called‘Bereitschaftspotential’ (readiness potential). The later part ofthe signal (starting from EMG onset) is better described as a‘movement-related potential’. In our case the Bereitschafts-and movement-related potentials are observed at centralelectrodes. This is consistent with the assumed generatorsin the foot-area of the motor cortex [33].
Normal driving situations frequently require sensoryregistration of stimuli, processing of unexpected situations or
motor preparation/execution. However, in our experiment theexcellent predictive power of EEG-derived features indicatedthat it is mainly the sequence of these overlapping cerebralprocesses that robustly characterizes critical traffic situations.
3.2. Relevance for driving assistance systems
Assistance systems that require the driver to (re)act beforeinitiating a safety program currently rely on behaviouralmarkers such as brake pedal deflection and gas pedal release.While this approach ensures that safety measures are nottaken against the driver’s will, waiting for the driver’sresponse can lead to a slow response in emergency situations.Therefore, in order to obtain a faster confirmation, our studysuggests that it is feasible to detect a driver’s intention tobrake, which naturally precedes any observable actions. Infact, we found that EEG and EMG recordings reach thepredictive accuracy of behavioural channels at earlier stagesof the emergency situation. In principle, this paves theway for a neuroergonomic approach to driving assistance,including peripher-physiological sensors. We evaluated asimplistic implementation of such a system in our simulationenvironment and estimated that the time saved is around130 ms. While this seems to be a tiny improvement, itmay actually have a significant impact on accident prevention.Consider, for example, driving a car in dense traffic at100 km h−1. If an emergency braking manoeuvre is detected130 ms earlier, the braking distance will be reduced by asmuch as 3.66 m, or the length of a compact car.
This study was conducted in an idealized simulationenvironment. Real-world driving, of course, yields amuch more dynamic scenario comprising more complexand more diversified traffic situations. These may include,for example, switching traffic lights or changing speedlimits. The distinction between normal and exceptional trafficevents are more intricate under these circumstances. We arecurrently planning a real-world driving study using a similarexperimental setup to test the transferability of our result tothis setting.
A crucial issue to be investigated is the feasibility ofconducting EEG and EMG measurements under realisticconditions. While myoelectricity is a very strong signal thatis readily acquired using only two electrodes, the situation ismore difficult for brain wave recordings. The EEG systemhas to cope with a multitude of artefacts that are strongerthan the neural signals. For example, there are mechanicalartefacts induced by electrode motion, which can resultfrom unsteady direction of motion of the vehicle (e.g. whenentering a sharp curve) or by head and body movements ofthe driver. Moreover, electrical activity of head muscles,e.g. caused by chewing, raising eyebrows or eye blinkingmight be more prevalent during real driving than under ourcontrolled conditions. Presently, it is unclear whether (a) thesignal quality in real-world recordings will be significantlydegraded compared to the laboratory setting, (b) this wouldalso lead to deteriorating detection performance and (c) in thiscase, advanced data analysis methods such as independentcomponent analysis artefact reduction [34–36] may help to
9
J. Neural Eng. 8 (2011) 056001 S Haufe et al
overcome such problems. Our current system does not includeany artefact-removal strategy apart from the omission of EEGsensors with apparent bad signal quality.
Another issue regarding EEG technology concerns itspractical applicability. Current systems are based on electrodecaps that are uncomfortable to wear, unattractive and involvethe application of abrasive gel to the skin. Furthermore, a64-electrode system as used here requires time-consumingpreparation. However, significant advances have been maderecently, e.g. in the development of dry electrodes [37]. Withrespect to wearing comfort, new miniature electrodes thatcan be mounted capless (using only one droplet of gel perelectrode) promise to be virtually unnoticeable in practice[38]. Moreover, commercial wireless EEG systems are alreadyavailable.
4. Conclusion
In this study, we have demonstrated the viability ofa neuroergonomic approach to driving assistance whichallows us to reduce response times by detecting a driver’sintention to brake before any actions become observable. Theimplementation of this system in practice depends on advancesin engineering and data analysis that are the focus of ongoingresearch.
Acknowledgments
We acknowledge financial support by the BMBF grant nos01GQ0850, 01GQ0851, 01IB001A, DFG grant no MU 987/3-2 and the FP7-ICT Programme of the European Community,under the PASCAL2 Network of Excellence, ICT-216886.We thank Klaus-Robert Muller for valuable discussions, ArneEwald for help in conducting experiments and Paul von Bunaufor proofreading the manuscript.
References
[1] Subramanian R 2007 Motor vehicle traffic crashes as a leadingcause of death in the USA, 2004 NHTSA-Report DOT HS810 742
[2] Trivedi M M and Cheng S Y 2007 Holistic sensing and activedisplays for intelligent driver support systems Computer40 60–8
[3] McCall J C and Trivedi M M 2007 Driver behavior andsituation aware brake assistance for intelligent vehiclesProc. IEEE 95 374–87
[4] Behr M, Poumarat G, Serre T, Arnoux P J, Thollon Land Brunet C 2010 Posture and muscular behaviour inemergency braking: an experimental approach Accid. Anal.Prev. 42 797–801
[5] Parasuraman R and Rizzo M 2008 Neuroergonomics: TheBrain at Work 1st edn (New York: Oxford University Press)
[6] Blankertz B, Dornhege G, Krauledat M, Muller K-R and CurioG 2007 The non-invasive Berlin brain–computer interface:fast acquisition of effective performance in untrainedsubjects NeuroImage 37 539–50
[7] Muller K-R, Tangermann M, Dornhege G, Krauledat M, CurioG and Blankertz B 2008 Machine learning for real-timesingle-trial EEG-analysis: from brain–computer interfacingto mental state monitoring J. Neurosci. Methods 167 82–90
[8] Blankertz B et al 2010 The Berlin brain–computer interface:non-medical uses of BCI technology Front. Neurosci. 4 198
[9] Haufe S, Tomioka R, Dickhaus T, Sannelli C, Blankertz B,Nolte G and Muller K-R 2011 Large-scale EEG/MEGsource localization with spatial flexibility NeuroImage54 851–859
[10] Beatty J, Greenberg A, Deibler W P and O’Hanlon J F 1974Operant control of occipital theta rhythm affectsperformance in a radar monitoring task Science 183 871–3
[11] Kecklund G and Akerstedt T 1993 Sleepiness in long distancetruck driving: an ambulatory EEG study of night drivingErgonomics 36 1007–17
[12] Makeig S and Inlow M 1993 Lapses in alertness: coherence offluctuations in performance and EEG spectrumElectroencephalogr. Clin. Neurophysiol. 86 23–35
[13] Makeig S and Jung T-P 1996 Tonic, phasic, and transient EEGcorrelates of auditory awareness in drowsiness Cogn. BrainRes. 4 15–25
[14] Jung T P, Makeig S, Stensmo M and Sejnowski T J 1997Estimating alertness from the EEG power spectrum IEEETrans. Biomed. Eng. 44 60–9
[15] Lal Saroj K L and Craig A 2001 A critical review of thepsychophysiology of driver fatigue Biol. Psychol. 55 173–94
[16] Papadelis C, Chen Z, Kourtidou-Papadeli C, Bamidis P D,Chouvarda I, Bekiaris E and Maglaveras N 2007Monitoring sleepiness with on-board electrophysiologicalrecordings for preventing sleep-deprived traffic accidentsClin. Neurophysiol. 118 1906–22
[17] Schmidt E A, Schrauf M, Simon M, Fritzsche M, Buchner Aand Kincses W E 2009 Drivers’ misjudgement of vigilancestate during prolonged monotonous daytime driving Accid.Anal. Prev. 41 1087–93
[18] Kohlmorgen J, Dornhege G, Braun M, Blankertz B,Muller K-R, Curio G, Hagemann K, Bruns A, Schrauf Mand Kincses W 2007 Improving human performance in areal operating environment through real-time mentalworkload detection Toward Brain–Computer Interfacinged G Dornhege, J del R Millan, T Hinterberger, DMcFarland and K-R Muller (Cambridge, MA: MIT Press)pp 409–422
[19] Sharbrough F, Chatrian G E, Lesser R P, Luders H, Nuwer Mand Picton T W 1991 American ElectroencephalographicSociety guidelines for standard electrode positionnomenclature J. Clin. Neurophysiol. 8 200–2
[20] Fawcett T 2006 An introduction to ROC analysis PatternRecognit. Lett. 27 861–74
[21] Hanley J A and McNeil B J 1982 The meaning and use of thearea under a receiver operating characteristic (ROC) curveRadiology 143 29–36
[22] Blankertz B, Tomioka R, Lemm S, Kawanabe M and MullerK-R 2008 Optimizing spatial filters for robust EEGsingle-trial analysis IEEE Signal Proc. Mag. 25 41–56
[23] Fisher R A 1936 The use of multiple measurements intaxonomic problems Ann. Eugen. 7 179–88
[24] Duda R O, Hart P E and Stork D G 2000 Pattern Classification(New York: Wiley)
[25] Friedman J H 1989 Regularized discriminant analysis J. Am.Stat. Assoc. 84 165–75
[26] Blankertz B, Lemm S, Treder M S, Haufe S and Muller K-R2010 Single-trial analysis and classification of ERPcomponents—a tutorial NeuroImage
[27] Ledoit O and Wolf M 2004 A well-conditioned estimator forlarge-dimensional covariance matrices J. Multivariate Anal.88 365–411
[28] Schafer J and Strimmer K 2005 A shrinkage approach tolarge-scale covariance matrix estimation and implicationsfor functional genomics Stat. Appl. Genet. Mol. Biol. 4 32
[29] Bonferroni C E 1936 Teoria statistica delle classi e calcolodelle probabilita Pubblicazioni del R Istituto Superiore di
10

J. Neural Eng. 8 (2011) 056001 S Haufe et al
Scienze Economiche e Commerciali di Firenze8 3–62
[30] Chapman R M and Bragdon H R 1964 Evoked responses tonumerical and non-numerical visual stimuli while problemsolving Nature 203 1155–7
[31] Sutton S, Braren M, Zubin J and John E R 1965Evoked-potential correlates of stimulus uncertainty Science150 1187–8
[32] Kornhuber H H and Deecke L 1965 Hirnpotentialanderungenbei Willkurbewegungen und passiven Bewegungen desMenschen: Bereitschaftspotential und reafferente PotentialePflugers Arch. 284 1–17
[33] Penfield W and Boldrey E 1937 Somatic motor and sensoryrepresentation in the cerebral cortex of man as studied byelectrical stimulation Brain 60 389–443
[34] Vigario R, Jousmaki V, Hamalainen M, Hari R and Oja E1998 Independent component analysis for identification of
artifacts in magnetoencephalographic recordings (Proc.NIPS vol 10) (Cambridge, MA: MIT Press) pp 229–35
[35] Jung T P, Makeig S, Humphries C, Lee T W, McKeown M J,Iragui V and Sejnowski T J 2000 Removingelectroencephalographic artifacts by blind source separationPsychophysiology 37 163–78
[36] Ziehe A, Muller K-R, Nolte G, Mackert B-M and Curio G2000 Artifact reduction in magnetoneurography based ontime-delayed second-order correlations IEEE Trans.Biomed. Eng. 47 75–87
[37] Popescu F, Fazli S, Badower Y, Blankertz B andMuller K R 2007 Single trial classification of motorimagination using 6 dry EEG electrodes PLoS ONE2 e637
[38] Nikulin V V, Kegeles J and Curio G 2010 Miniaturizedelectroencephalographic scalp electrode for optimalwearing comfort Clin. Neurophysiol. 121 1007–14
11
Related Documents