Educational Master Plan 2017

Welcome message from author
This document is posted to help you gain knowledge. Please leave a comment to let me know what you think about it! Share it to your friends and learn new things together.
Transcript
EducationalMaster Plan
2017
DRAFTDRAFTDRAFT
// Table of ContentsLake Tahoe Community College: Educational Master Plan
Lake Tahoe Community College Board of Trustees 1
Welcome to Lake Tahoe Community College Message from the Superintendent-President 2 Senior Leadership Team 3 Vision Statement 4 Mission Statement 4 Beliefs 4 History 4
Building a College: LTCC’s Forty-Three-Year History 4LTCC Today: Challenges and Solutions 5Measure F Bond Campaign 5Creative Academic Programming,
Varied Revenue Streams 6Leadership through the Years 7
Educational Master Planning Methodology Overview 8 EMP Planning Process 8 Defi nition of EMP 8 EMP Purpose 8 EMP Goal 9 EMP and Accreditation Compliance 9 EMP and Participatory Governance 9
District Organizational Structure LTCC Governance Structure 10 LTCC District Organizational Chart 11
Internal Environmental Scan Overview 12 Student Demographic Profi le 12
Overall Headcount 13 Section and Headcount Trends 14 Gender Profi le 15 Race and Ethnicity 16 Student Age Profi le 18 Student Goals 19 Full-Time vs. Part-Time Enrollment 20 Face-to-Face Student 21 Student Success Rate 22 Student Achievement 23 Transfers 24 Online Education 25 Online Full-Time Equivalent Student 25 Online-Only Student Geographical Distribution 26 South Bay Regional Public Safety Training Consortium (JPA) 27 Incarcerated Students Program 28
External Environmental Scan Overview 29 The U.S. Economy 30 The California Economy 32 The Local Economy & Region 34 Overview of El Dorado County 34 Overview of the City of South Lake Tahoe 36 The Effective Service Area 39 Overview 39 Demographic Profile 39 Population by Age 41 Race and Ethnicity 42 Educational Attainment 43 Employment Profile 44 Summary 47
Table of Contents
// Table of ContentsLake Tahoe Community College: Educational Master Plan
Unique Programs Offered by LTCC Overview 48 ADVANCE 48 CONNECT - Community Education 48 Foster and Kinship Care Education 48 Incarcerated Student Program 48 Intensive Spanish Summer Institute 48 South Bay Regional Public Safety Training Consortium (JPA) 49 Tahoe Parents Nursery School 49 TRiO - Educational Talent Search Program 49 TRiO - Upward Bound Program 49
Instructional Areas Overview 50 Academic Programs 50
Student Support Services Overview 119 Bookstore 119 CalWORKs 119 Career Center 119 Child Development Center 119 Clubs and Organizations 119 Counseling / Advising 119 Disability Resource Center 119 Equity Program 120 Extended Opportunity Programs and Services / Cooperative Agencies Resources for Education 120 Fitness Education Center 120 Guidance and Planning for Success 120 Food Service 120 Housing 120 Intercollegiate Athletics / Soccer 120 International Student Program 121 Job Training Skills, Internships, and Work Experience 121 Library Services 121 Media Services 121
One-Stop Enrollment Services Center 121 Transfer Center 122 Veterans Services 122
Forecast for Future Growth Overview 123 Key Historical Trends 123 Current Status 125 Existing Program of Instruction 126 Distribution of the Curriculum 129 Distribution of FTES 130 Curriculum Balance 130 Current Space Holdings 131 Forecast Considerations 132 Growth Forecast 133 Application of Forecasted Growth 134 Measuring Progress 143 Qualifi cation for Space 144 Space Requirements to Support the Programs of Instruction 145 Space Requirements for the Entire College 145
Summary Observations & Recommendations Observations & Suggestions 147 Focus Relentlessly on Students' End Goals 147 Always Design and Decide with the Student in Mind 149 Pair High Expectations with High Support 149 Foster the Use of Data, Inquiry, and Evidence 150 Take Ownership of Goals and Performance 152 Enable Action and Thoughtful Innovation 153 Lead the Work of Partnering Across Systems 154
Acknowledgements 155
// Board of Trustees
// 1
Lake Tahoe Community College: Educational Master Plan
Lake Tahoe Community CollegeBoard of Trustees
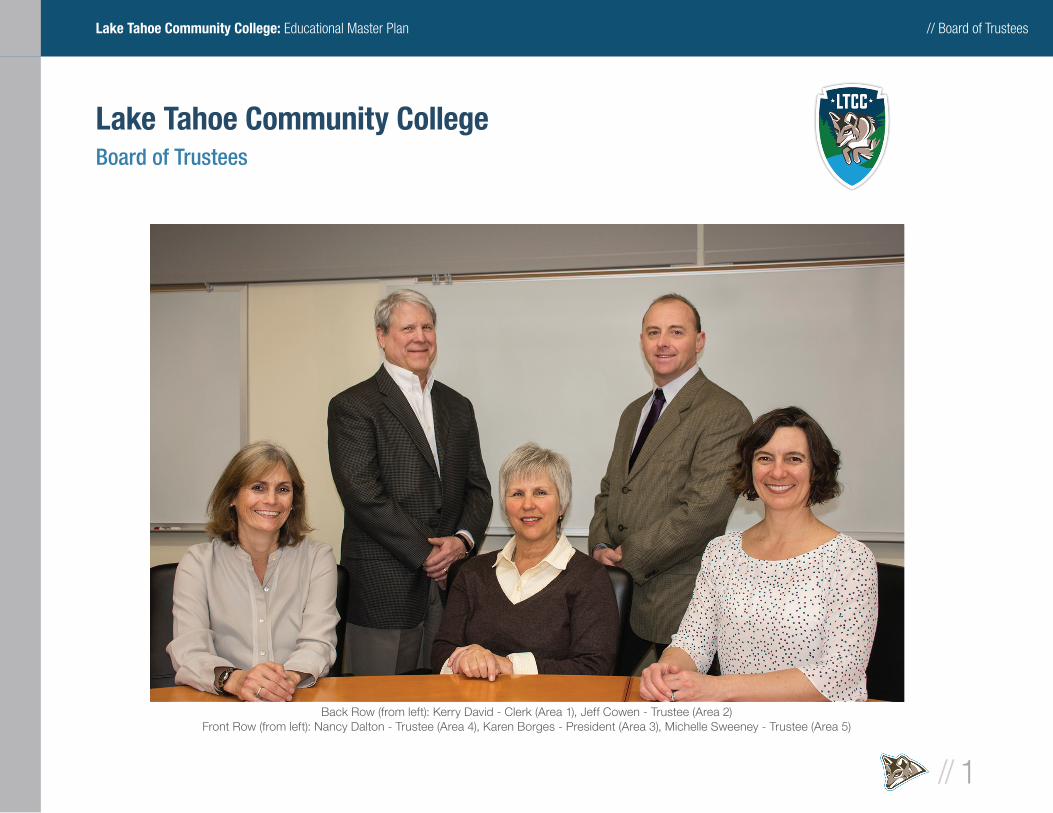
Back Row (from left): Kerry David - Clerk (Area 1), Jeff Cowen - Trustee (Area 2)Front Row (from left): Nancy Dalton - Trustee (Area 4), Karen Borges - President (Area 3), Michelle Sweeney - Trustee (Area 5)
// Welcome to Lake Tahoe Community College
// 2
Lake Tahoe Community College: Educational Master Plan
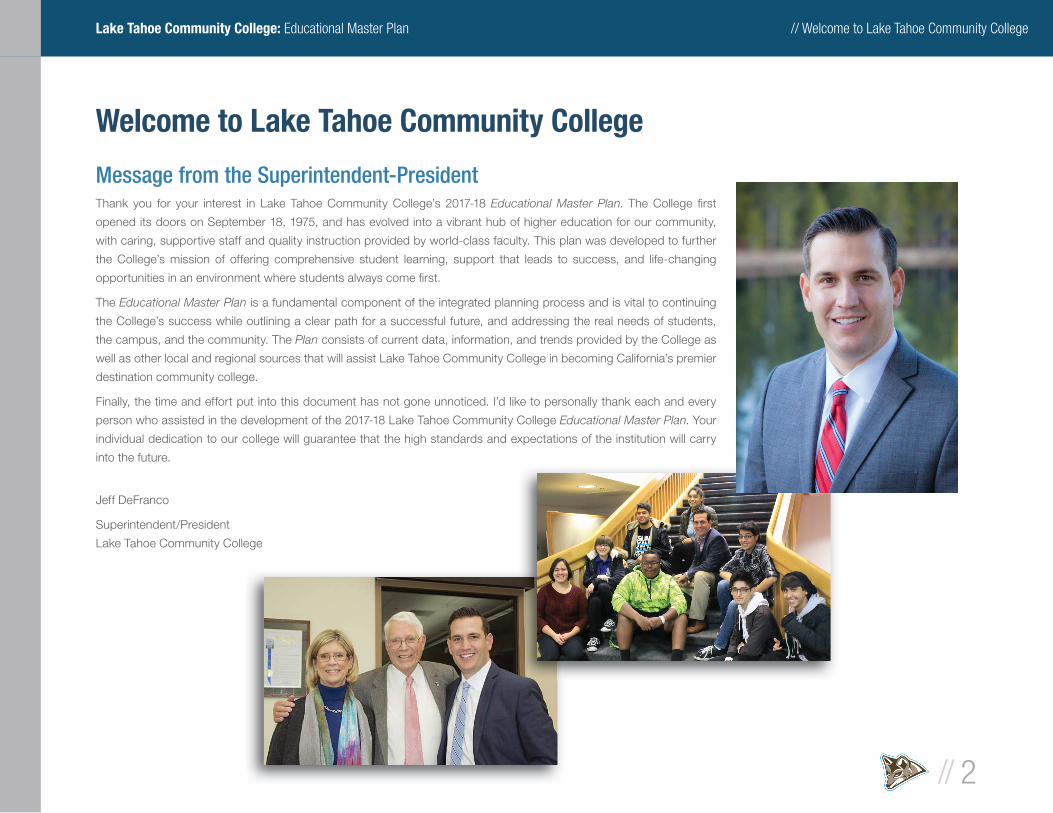
Message from the Superintendent-PresidentThank you for your interest in Lake Tahoe Community College’s 2017-18 Educational Master Plan. The College fi rst
opened its doors on September 18, 1975, and has evolved into a vibrant hub of higher education for our community,
with caring, supportive staff and quality instruction provided by world-class faculty. This plan was developed to further
the College’s mission of offering comprehensive student learning, support that leads to success, and life-changing
opportunities in an environment where students always come fi rst.
The Educational Master Plan is a fundamental component of the integrated planning process and is vital to continuing
the College’s success while outlining a clear path for a successful future, and addressing the real needs of students,
the campus, and the community. The Plan consists of current data, information, and trends provided by the College as
well as other local and regional sources that will assist Lake Tahoe Community College in becoming California’s premier
destination community college.
Finally, the time and effort put into this document has not gone unnoticed. I’d like to personally thank each and every
person who assisted in the development of the 2017-18 Lake Tahoe Community College Educational Master Plan. Your
individual dedication to our college will guarantee that the high standards and expectations of the institution will carry
into the future.
Jeff DeFranco
Superintendent/President
Lake Tahoe Community College
Welcome to Lake Tahoe Community College
// Welcome to Lake Tahoe Community College
// 3
Lake Tahoe Community College: Educational Master Plan
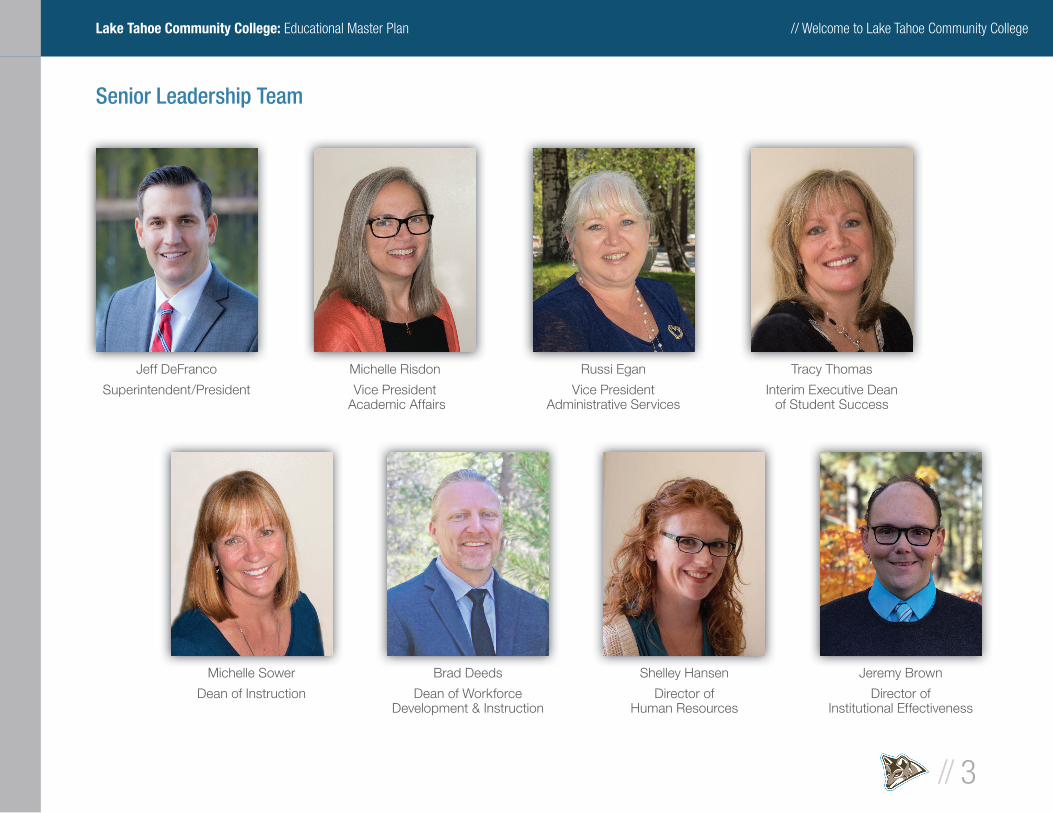
Jeff DeFranco
Superintendent/President
Brad Deeds
Dean of Workforce Development & Instruction
Michelle Risdon
Vice President Academic Affairs
Senior Leadership Team
Michelle Sower
Dean of Instruction
Russi Egan
Vice PresidentAdministrative Services
Tracy Thomas
Interim Executive Deanof Student Success
Jeremy Brown
Director ofInstitutional Effectiveness
Shelley Hansen
Director of Human Resources
// Welcome to Lake Tahoe Community College
// 4
Lake Tahoe Community College: Educational Master Plan
Vision Statement“California’s Premier Destination Community College”
Mission StatementLake Tahoe Community College serves our local, regional, and global
communities by promoting comprehensive learning, success, and life-
changing opportunities. Through quality instruction and student support, our
personalized approach to teaching and learning empowers students to achieve
their educational and personal goals.
BeliefsWe at Lake Tahoe Community College believe:
§ Students come fi rst
§ An educated citizenry is fundamental
§ Learning enhances the quality of life
§ Innovation, integrity, high standards and the pursuit of excellence are essential
§ Diversity enriches
§ We make a difference
History
Building a College: LTCC’s Forty-Three-Year HistoryThe alpine town of South Lake Tahoe, located on Lake Tahoe’s southern end,
fi rst expressed an interest in hosting a community college in 1964. One year
later, on March 5, 1974, voters approved the formation of a community college
district with 66% of the vote. The new district encompassed the area that lies in
the southern portion of the Lake Tahoe Basin, with the lake forming much of the
northern boundary, the Sierra Crest creating the western border, the eastern
portion made out of the California–Nevada state line, and to the south the line
dividing El Dorado and Alpine Counties.
On the same day, voters also selected a four-member Board of Trustees to
supervise the new college district: Roberta Mason, Dr. Will Cluff, Rev. Donald
Swanson, and Dr. Frederick “Fritz” Wenck. Temporary board member Gene
Bellisario stepped in to fi ll the fi fth vacant seat that had been reserved for a
board member from Alpine County, which voted not to join the new district.
Bellisario served for a few months until June 1974, when William Patrick Conlon
won the seat in a special election. A few months later, the Board of Trustees
hired Dr. James Duke in September 1974 as the College’s fi rst superintendent/
president.
LTCC opened its doors for the fi rst time on September 18, 1975, in a converted
motel on Highway 50. In its fi rst year, 119 classes were offered to 1,407 students.
The fi rst graduating class in the spring of 1976 consisted of eleven students.
The acquisition of a site for a permanent campus was pursued in earnest in
1979. The purchase of a parcel on Al Tahoe Boulevard owned by the Shell Oil
Company was negotiated, and on December 27, 1979, the title to the 164-acre
plot in the center of South Lake Tahoe was recorded in the name of Lake Tahoe
Community College.
The west part of campus was opened in the fall of 1982. It provided space for a
library and three more classrooms in addition to what the Highway 50 campus
provided. Eventually an expanded art lab and an intimate collegiate theatre
were also included at the new site. This allowed for more classroom space at
the original converted motel campus.
On July 8, 1986, a groundbreaking ceremony was held on the permanent
campus site on Al Tahoe Boulevard, and construction began on the fi rst phase
of the College’s master plan. The College moved into its present location on Al
Tahoe Boulevard in October 1988.
The Child Development Center opened in September 1993 to provide care for
forty-six children and serve as a teaching lab for the Early Childhood Education
Program. A new Technology Wing was dedicated on January 2, 1996, and the
college theatre opened in March 1996. In June 2005, the theatre was named
after LTCC’s fi rst president, Dr. James Duke.
// Welcome to Lake Tahoe Community College
// 5
Lake Tahoe Community College: Educational Master Plan
With everything but Physical Education now located on the main Al Tahoe
campus, the Board of Trustees decided to lease four portable classrooms.
These “Garden Classrooms” were in place for the fall quarter of 1996, bringing
the entire College to one location for the fi rst time.
In 2002, the Physical Education building and Student Center opened. The
26,000-square-foot Physical Education building includes a gymnasium, the
Fitness Education Center, a dance studio, and locker rooms. The Culinary Arts
Program moved into its own teaching kitchen in the 10,000-square-foot Student
Center, attached to the Main Building on campus.
In 2006, a new 27,000-square-foot library and the Haldan Art Gallery opened.
The library was renamed the Roberta Mason Library in 2014, to honor LTCC’s
fi rst Board of Trustees president, Roberta Mason.
LTCC Today: Challenges and SolutionsIn many ways, both the city of South Lake Tahoe and Lake Tahoe Community
College are unique. Compared with other community college districts in the
state, LTCC is relatively young: in March 2017, the College celebrated its forty-
third birthday, while the town of South Lake Tahoe itself turned fi fty-two. Because
of the relatively small size of both the school and the town, there is a strong
community connection to the College that is unique in the California community
college system. The College’s campus is a go-to in this small alpine town for
educational needs, cultural events, sports, theatrical productions, concerts, art
exhibits, lectures, fi lms, poetry readings, and many more free or low-cost events
that simply would not be available to residents without LTCC’s existence.
In addition to being small, South Lake Tahoe is also very much a resort town that
depends on visitors to sustain its businesses. There is a transient population,
mostly consisting of younger people, who come from outside the Tahoe Basin
seeking seasonal work in hospitality, tourism, and recreation. They often
do not put down long-term roots due to a critical lack of affordable housing,
underemployment issues, and the perception of limited promising career
opportunities. Currently, the housing crisis in particular is a major challenge for
LTCC in attracting students from outside the basin.
As a tourist town, the city of South Lake Tahoe can be susceptible to both
regional and national economic shifts. When the country’s economy sank in
2008, the city’s did as well—a consequence of relying on tourist spending for
economic growth. While the College did see a boost to its FTES during these
years, which is a response typical to education during an economic downturn,
those numbers have greatly softened as the economy has improved and more
people have gone back to work.
Changes to repeatability at the state level also contributed to a decline in FTES
in the past fi ve years. Community members who had taken arts and humanities
and physical education classes repeatedly over many years found themselves
unable to continue to do so, which had a negative effect on LTCC’s FTES. At
around the same time, the Good Neighbor partnership between California and
Nevada that made tuition affordable for Tahoe Basin residents living across the
state line was brought to an end, which further contributed to the overall FTES
decline at LTCC.
The College recognizes that in adapting its vision to become “California’s premier
destination community college” a few years ago, it was laying the groundwork for
a possible solution to these and other evolving local realities. LTCC recognizes
that it cannot survive on the local population alone. LTCC will continue to
position itself as an important hub in its community, providing valuable job
training, transfer opportunities, continuing education, and enriching events to
local residents. But in order to both sustain itself and fl ourish, LTCC must offer
meaningful and relevant academic programs that contribute to local workforce
development and attract bright students from outside the Tahoe Basin who are
seeking a great education in a unique environment.
Measure F Bond CampaignTo become California’s premier destination community college, LTCC had
another important hurdle to clear: turning its original and now aging campus
facilities into a modern center of learning. In 2014, after twenty-six years of
heavy use by students, staff, the community, and the mountain environment,
the College’s campus was showing signs of wear and tear. Classroom and lab
technology was quickly becoming outdated; the HVAC systems were proving
// Welcome to Lake Tahoe Community College
// 6
Lake Tahoe Community College: Educational Master Plan
ineffi cient and costly to operate; and leaky roofs and deteriorating electrical,
lighting, heating, ventilation, and security systems were badly in need of repair
or replacement. These problems were beginning to show signs of impacting the
quality of instruction, learning, job training, and career advancement at LTCC.
The need for a bond campaign to help LTCC remain competitive and to protect
the taxpayers’ original investment in the College became clear.
Measure F, a $55 million bond effort, successfully passed in November 2014
with nearly 58% of the vote. Bond funds are currently being used to upgrade and
repair existing college facilities and infrastructure and also to give rise to several
new buildings in support of existing and future academic programs and student
support services. Shortly after the bond measure passed, LTCC received
a nearly $6 million donation from a local private citizen to further improve the
campus with the addition of a University Center, with a groundbreaking taking
place in June 2017. Beginning in the fall of 2018, the Lisa Maloff University Center
will make it possible for the fi rst time for South Lake Tahoe residents to earn a
four-year degree without leaving home. LTCC has already partnered with Sierra
Nevada College (in Incline Village, NV) to offer competitively priced bachelor’s
degree programs in global business management and psychology. In fall 2018,
Brandman University will offer a 4-year degree in Liberal Studies leading to a
multiple subject teaching credential, with more school partnerships and degree
options to come.
Creative Academic Programming, Varied Revenue StreamsIn addition to bringing baccalaureate degree options to campus, in the past
few years LTCC has launched several new academic initiatives to broaden
its student base, provide access to higher learning to more people, and to
diversify its revenue streams and create better economic stability to ride
through rough budgetary times. Some of these new programs include the
following:
South Bay Regional Public Safety Consortium: LTCC is now a partner in the
South Bay Regional Public Safety Consortium, fi rst created in 1994 by Gavilan
College and Evergreen Valley College through a Chancellor’s Offi ce grant. Since
its launch, nine additional colleges have joined this innovative partnership to
support public safety training within their local communities. The consortium
provides training to approximately 2,700 full-time equivalent students each year,
including professionals from more than seventy city and county agencies. The
consortium operates under a Joint Powers Agreement with the nine community
colleges and certifi es training in law enforcement, fi re services, emergency
medical training, dispatch, and more. LTCC’s participation in this consortium
focuses on its fi re curriculum.
Incarcerated Student Program (ISP): The ISP at LTCC offers inmates in
partnering California State correctional facilities access to higher education. This
program gives inmates the opportunity to earn an associate of arts for transfer
(AA-T) in sociology through an enhanced, one-on-one correspondence-based
curriculum. Based on the belief that higher education provides inmates with
a pathway to a more productive future and a greater likelihood of postrelease
employment, the mission of LTCC’s ISP is to provide structured, positive support
in the pursuit of higher education for the incarcerated population and to deliver
socially transformative higher education programs for incarcerated students.
LTCC’s pilot ISP launched in 2015, and in spring 2017 the program’s substantive
change proposal received approval from the Accrediting Commission for
Community and Junior Colleges. The program has graduated 7 students as of
winter 2018 and expects 4 more graduates in the spring.
Environmental Technology and Sustainability (ETS): ETS is a relatively new
program at LTCC designed to immerse students in the unique environment
of the Lake Tahoe Basin. The program takes an interdisciplinary approach to
students of environmental science and sustainability. As a national treasure,
Lake Tahoe provides a spectacular natural classroom for students preparing for
diverse fi elds in environmental management and restoration, natural resources
conservation, and sustainability.
Dual-Enrollment Program: LTCC has a rich partnership with the Lake Tahoe
Unifi ed School District (LTUSD), currently offering courses to local high school
students through a dual-enrollment agreement. All fi rst-year students at South
Tahoe High School participate in a fi ve-unit course focused on creating a ten-
year educational and career plan through the “Get Focused, Stay Focused”
curriculum. In subsequent years, students revisit and revise their plans in 1- to
1.5-unit courses. These courses are also uniquely adapted to the Lake Tahoe
resort environment with a focus on hospitality, tourism, recreation, and retail
// Welcome to Lake Tahoe Community College
// 7
Lake Tahoe Community College: Educational Master Plan
opportunities. Additionally, the College collaborates with LTUSD to offer a digital
media arts course and an emergency medical responder course through dual
enrollment and has developed a strategic vision that includes a 4+1 model for
high school students to complete an AA in 5 years.
Distance Education and the Online Education Initiative (OEI): LTCC offers a robust
Distance Education Program, with eleven degrees and certifi cates available
online. LTCC now uses Canvas as its learning management system, and as a
full-launch college with California’s Online Education Initiative (OEI), LTCC was
one of the only colleges statewide to “go live” with courses on the OEI exchange
in spring 2017. Through the OEI, LTCC has been fortunate to gain access to
multiple support services for all students, both online and face-to-face, including
Cranium Cafe for online counseling, NetTutor for twenty-four-hour a day tutoring
services, online readiness training for students, as well as instructional design
and accessibility support for faculty through the OEI.
Athletics: In Fall 1994, LTCC’s men’s and women’s cross-country running teams
fi rst competed in the Golden Valley Conference. Thanks to LTCC’s Kokanee
mascot, cries of “Go Fish!” from fans became common. In the fall of 1995,
women’s volleyball was added to the intercollegiate athletic program, and the
men’s cross-country team won fi rst place in the Golden Valley Conference.
In 1999, the College added an intercollegiate Nordic ski team to its program.
After years without any college athletics, sports returned once again to campus
with the successful launch of the men’s and women’s intercollegiate soccer
teams in fall 2014. With the new teams came a new logo and mascot—the
LTCC Coyote. Both teams are in the Golden Valley Conference. In its fi rst two
seasons (2014 and 2015), the men’s team won the Golden Valley Conference
twice and advanced all the way to the state semifi nals in 2015. The women’s
team advanced to the playoffs in its fi rst season (2014) and is in the process of
rebuilding after a coaching switch. With the early success of its soccer programs
in place, LTCC is now exploring additional athletics programs to bring to campus
that enjoy a level of popularity at our local high school, helping to create a natural
pathway for talented student athletes to pursue their on-fi eld dreams at their
local community college.
Through these and other initiatives, LTCC has responded to local and regional
conditions and forces by continuing to offer a comprehensive array of programs—
similar to colleges much larger than LTCC—and by offering programs that serve
the identifi ed needs of the community, that make good sense geographically,
and that play into the region’s strengths and reputation.
Leadership through the YearsOn June 30, 1990, Dr. James W. Duke, LTCC’s founding president, retired after
overseeing the construction of the fi rst permanent building for the College on Al
Tahoe Boulevard. Dr. Guy Lease was selected as his successor and leader of the
next phase of construction at LTCC. After seventeen years of exemplary service
and overseeing the construction of several new building phases of the College,
Dr. Lease retired in 2007.
The College then hired Dr. Paul T. Killpatrick in July 2008 as the College’s third
president. Dr. Killpatrick served the College for two years before moving on to
another community college presidency in Washington State.
The College’s fourth superintendent/president, Dr. Kindred Murillo, was hired
in July 2011. Dr. Murillo spearheaded the successful bond campaign, bringing
$55 million in funding to campus for the next ten years. Dr. Murillo also oversaw
the acquisition of the nearly $6 million donation for the Lisa Maloff University
Center coming to LTCC’s campus in 2018 and the development of a partnership
with Sierra Nevada College in Incline Village, NV, to provide bachelor’s degree
programs on campus. Dr. Murillo left LTCC to take a presidency position at
Southwestern College in January 2017.
LTCC then hired its fi fth superintendent/president, Jeff DeFranco. Mr. DeFranco
had previously served as vice president of administrative services at LTCC since
2013 before taking on this new position. As a lifelong educator committed to
supporting quality instructional programs and student success, he has worked
in multiple educational settings, including K-12, community college, and four-year
institutions. Before joining LTCC in 2012, Mr. DeFranco worked for Springfi eld
School District in Oregon for nine years as a senior level district administrator.
His roles have included leadership and oversight of fi scal, facility, technology,
bonds, grants, development, government affairs, and public relations functions
for educational organizations.
// Educational Master Planning Methodology
// 8
Lake Tahoe Community College: Educational Master Plan
OverviewThe Lake Tahoe Community College Educational Master Plan (the Plan) was
developed through a collaborative effort and included the review and analysis
of existing college documents as well as the development of new data. The
process began in winter 2017 and concluded in 2018. During the development
of the Plan, multiple on-campus meetings were held, which included the
opportunity for stakeholder input: the review of data with administration, faculty,
staff, and a period for comments and revisions. The Plan uses the “baseline”
quarter of fall 2016 for the purposes of future planning.
EMP Planning ProcessSetting realistic objectives in a timely manner is an essential component to
successful planning. Effective planning also addresses a variety of issues facing
the College as it meets the needs of the College’s local community. Current
economic conditions and planning will be essential in allowing the College to
continue to meet the needs of the students and community. Furthermore, the
objectives set must be measurable and quantifi able.
Components such as the economy may highlight specifi c needs of particular
instructional programs over other programs. When implementing successful
planning, the College must consider that not all instructional programs and
disciplines grow at the same rate. As a result, master planning must look
forward to the future, necessary adjustments can then be made to the College’s
instruction as needed to support these programs.
With effi cient planning comes the need to incorporate a system that allows
decision makers the ability to measure success. Good planning also requires
documentation of the institution's needs. As discussed, proper planning will
guide the curriculum to meet the projected future needs of the College’s
student population. It will place the necessary emphasis on technology and
develop a plan that will allow the College to offer the most current technological
resources for its students.
Maintaining a balance between growth and preserving varied program offerings
is essential. The consideration of these issues and others presented throughout
this plan give the College an opportunity to incorporate programs to meet the
rapidly changing needs of the community it serves.
Once the future needs in program areas have been established, the planning
process turns to the current facilities provided on campus. These facilities are
assessed, reviewing the current amount and type of space the College has and
will need in the future. This assessment will ensure the continued ability of the
College to meet the needs of its student population. After determining space
needs, the focus shifts to evaluating various options to fi nance the additional
facilities deemed necessary.
Defi nition of EMPAn Educational Master Plan is defi ned as, “a part of the College’s Master Plan
that defi nes the education goals of the College as well as the current and future
curriculum to achieve those goals. The Educational Master Plan precedes and
traditionally guides the Facilities Master Plan.”
Source: Community College League of California
EMP PurposeThe purpose of the Lake Tahoe Community College 2017-18 Educational Master
Plan (the Plan) is to offer the essential data and foundation upon which the
instructional program and support service needs can be addressed and met in
the future. It will also assist in the creation or update of other important College
plans. These include plans for technology, facilities (capital expenditures),
personnel, fi nance, budget, and others.
Educational Master Planning Methodology
// Educational Master Planning Methodology
// 9
Lake Tahoe Community College: Educational Master Plan
The Plan should be a fl exible document, to be reviewed annually as the economy
fl uctuates, students' needs change, and new educational trends develop. Inherent
in this logic is the fact that institutional change takes time. Some of the Plan’s
data and other components may become dated before full dissemination occurs.
The success of the integrated planning process will depend on a commitment to
adherence and implementation from all stakeholders at the College.
EMP GoalBringing together the educational components of the College is the goal of the
Plan. The Plan will further articulate a long-range plan that will aid in the decision
making for the future and support Lake Tahoe Community College in forecasting
support services and educational programs that will be required to sustain the
College’s future needs. The Plan delivers data for refi ning the College services to
students and the community.
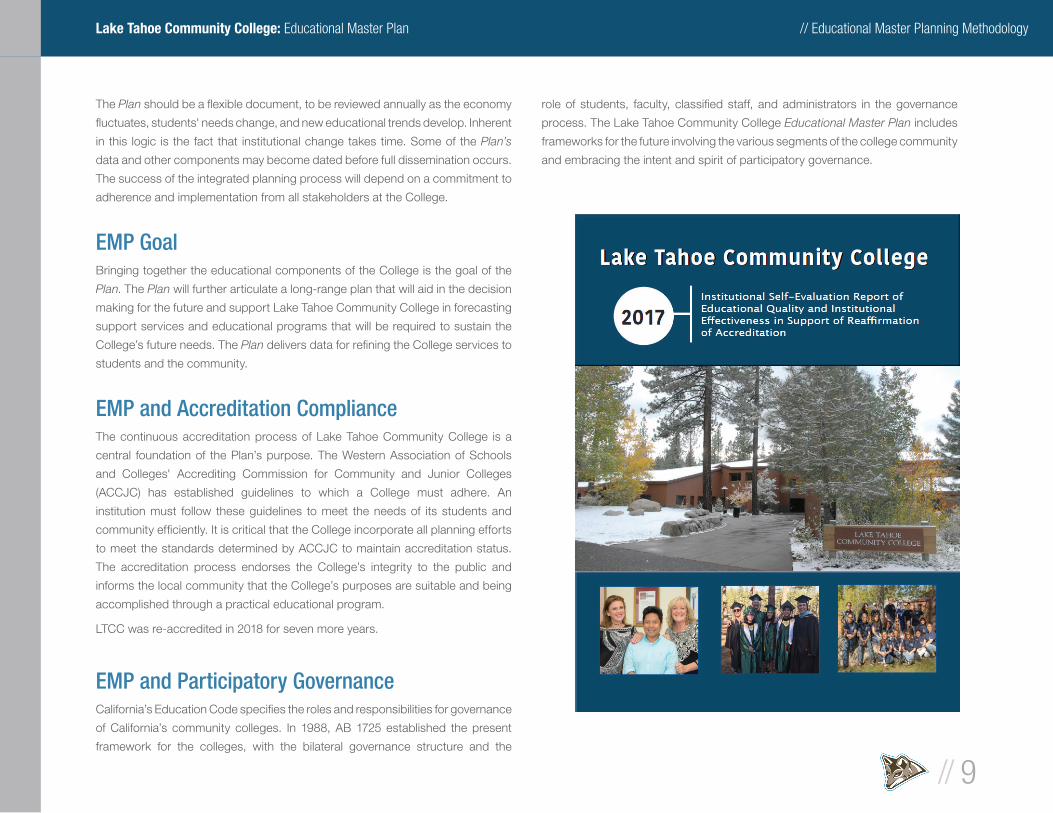
EMP and Accreditation ComplianceThe continuous accreditation process of Lake Tahoe Community College is a
central foundation of the Plan’s purpose. The Western Association of Schools
and Colleges' Accrediting Commission for Community and Junior Colleges
(ACCJC) has established guidelines to which a College must adhere. An
institution must follow these guidelines to meet the needs of its students and
community effi ciently. It is critical that the College incorporate all planning efforts
to meet the standards determined by ACCJC to maintain accreditation status.
The accreditation process endorses the College’s integrity to the public and
informs the local community that the College’s purposes are suitable and being
accomplished through a practical educational program.
LTCC was re-accredited in 2018 for seven more years.
EMP and Participatory Governance California’s Education Code specifi es the roles and responsibilities for governance
of California’s community colleges. In 1988, AB 1725 established the present
framework for the colleges, with the bilateral governance structure and the
role of students, faculty, classifi ed staff, and administrators in the governance
process. The Lake Tahoe Community College Educational Master Plan includes
frameworks for the future involving the various segments of the college community
and embracing the intent and spirit of participatory governance.
// District Organizational Structure
// 10
Lake Tahoe Community College: Educational Master Plan
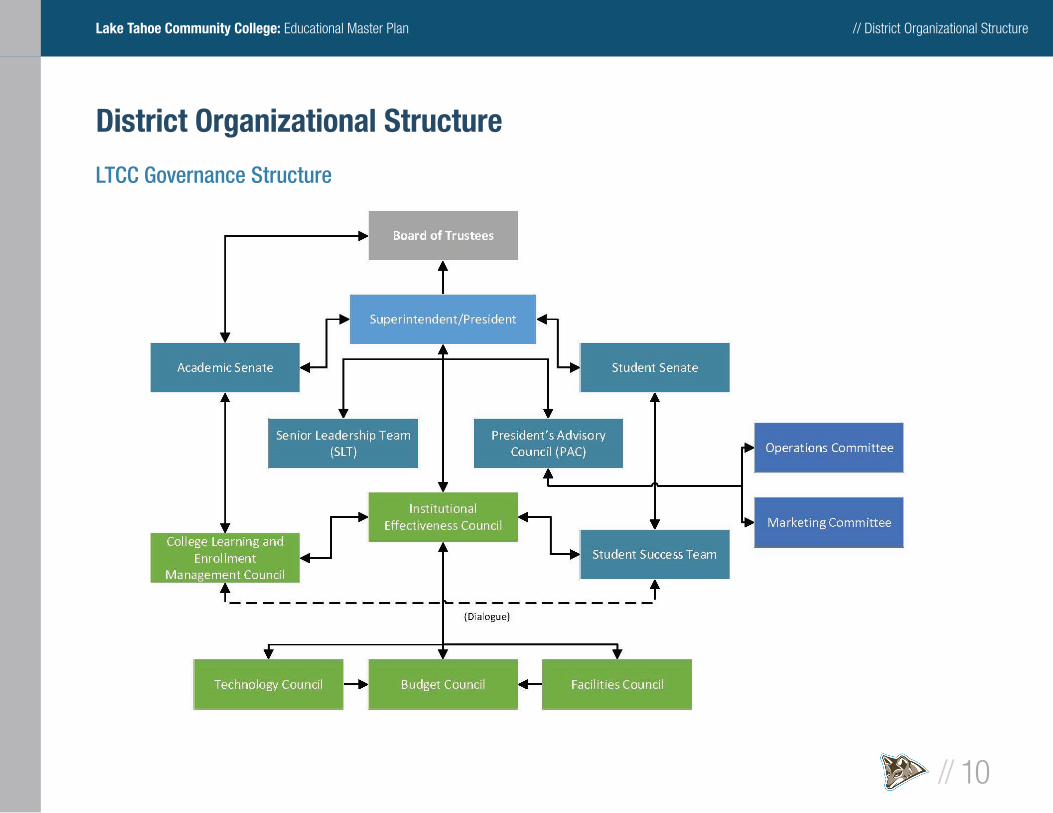
District Organizational Structure
LTCC Governance Structure
// District Organizational Structure
// 11
Lake Tahoe Community College: Educational Master Plan
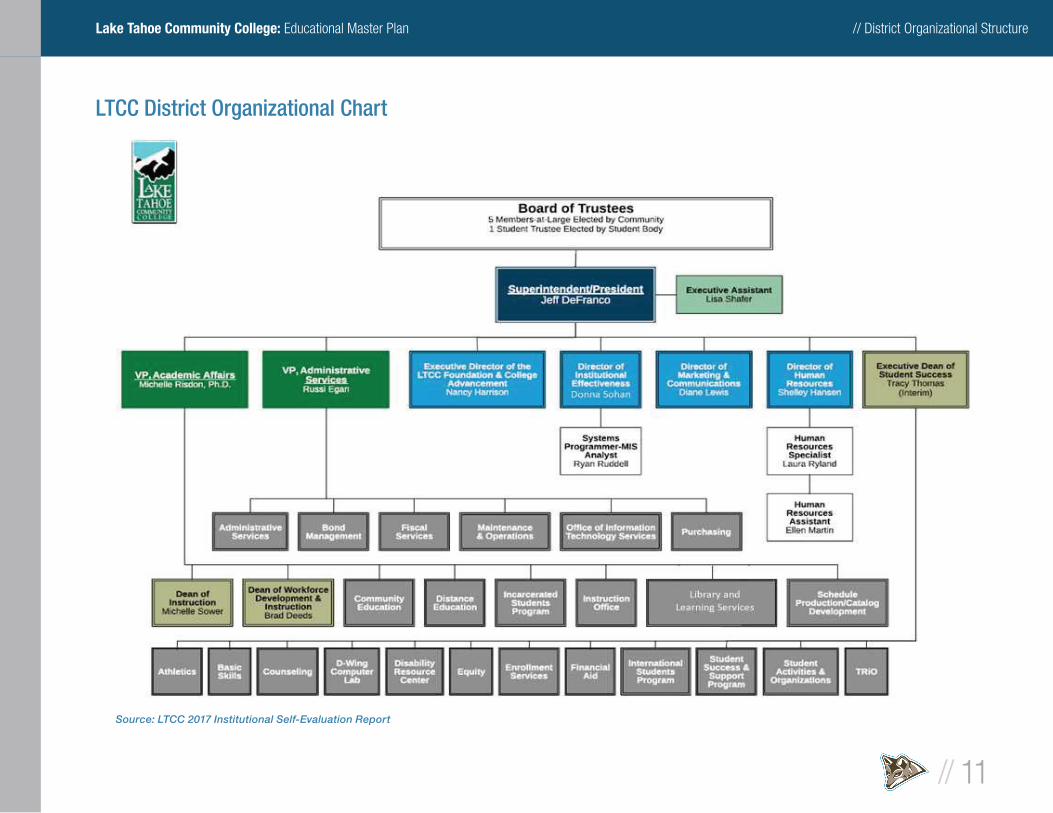
LTCC District Organizational Chart
Source: LTCC 2017 Institutional Self-Evaluation Report
// Internal Environmental Scan
// 12
Lake Tahoe Community College: Educational Master Plan
Internal Environmental Scan
OverviewThis section of the Educational Master Plan will give attention to local
demographics and student characteristics that are signifi cant to Lake Tahoe
Community College District. The data has been provided by the 2017 College
Fact Book, prepared by the Offi ce of Institutional Effectiveness.
Student Demographic Profi leThe Offi ce of Institutional Effectiveness has developed a robust set of data
regarding students who attend classes through the College. The following
section contains key demographic information and noteworthy program details
that further describe the characteristics of these students.
// Internal Environmental Scan
// 13
Lake Tahoe Community College: Educational Master Plan
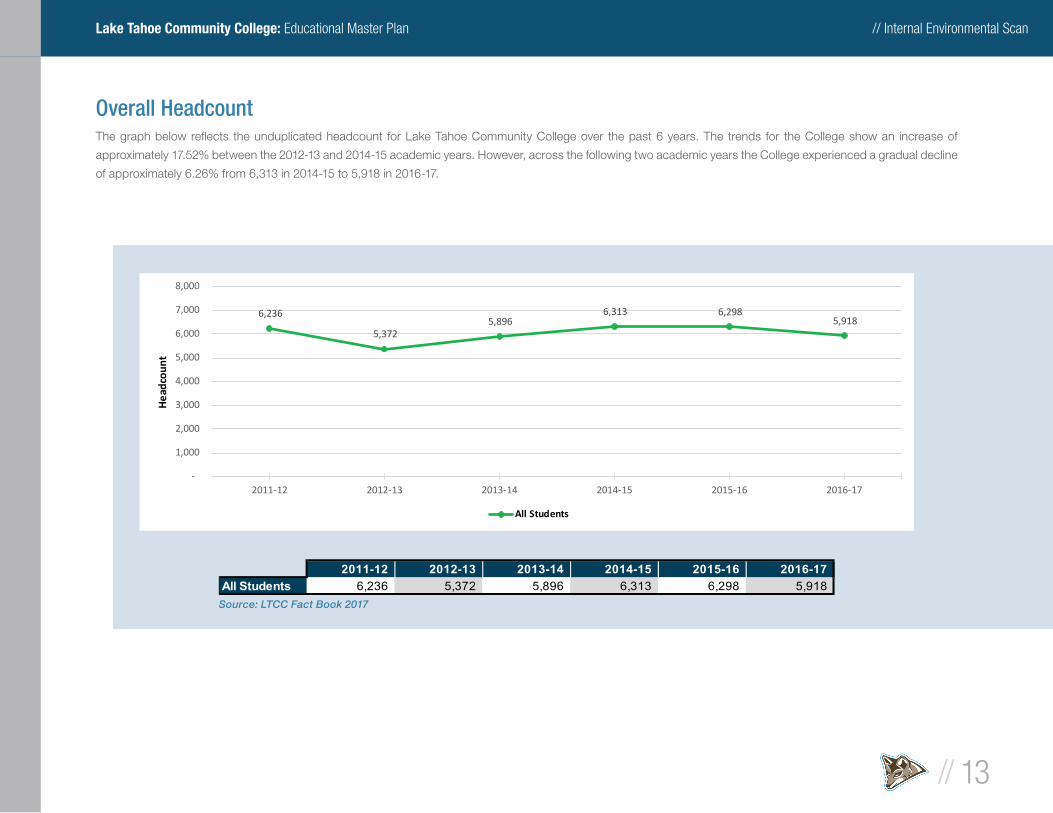
Overall HeadcountThe graph below refl ects the unduplicated headcount for Lake Tahoe Community College over the past 6 years. The trends for the College show an increase of
approximately 17.52% between the 2012-13 and 2014-15 academic years. However, across the following two academic years the College experienced a gradual decline
of approximately 6.26% from 6,313 in 2014-15 to 5,918 in 2016-17.
Source: LTCC Fact Book 2017
2011-12 2012-13 2013-14 2014-15 2015-16 2016-17All Students 6,236 5,372 5,896 6,313 6,298 5,918
6,236
5,372 5,896
6,313 6,298 5,918
-
1,000
2,000
3,000
4,000
5,000
6,000
7,000
8,000
2011-12 2012-13 2013-14 2014-15 2015-16 2016-17
Hea
dcou
nt
All Students
// Internal Environmental Scan
// 14
Lake Tahoe Community College: Educational Master Plan
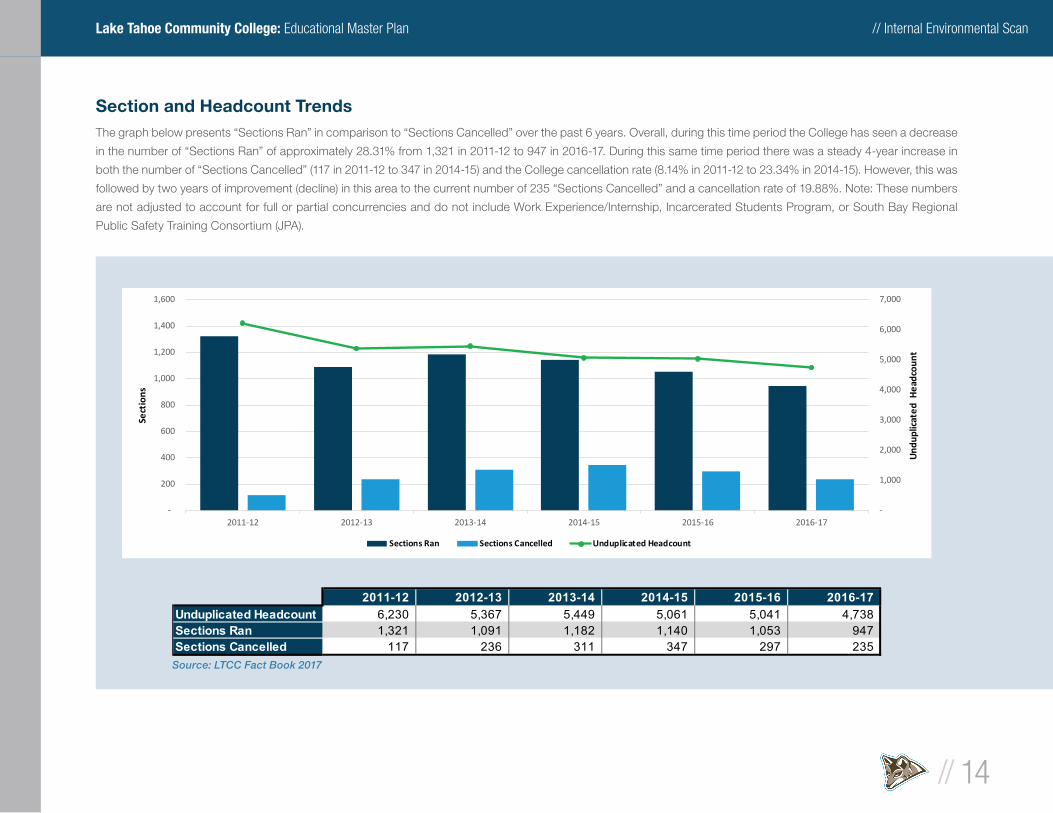
Section and Headcount TrendsThe graph below presents “Sections Ran” in comparison to “Sections Cancelled” over the past 6 years. Overall, during this time period the College has seen a decrease
in the number of “Sections Ran” of approximately 28.31% from 1,321 in 2011-12 to 947 in 2016-17. During this same time period there was a steady 4-year increase in
both the number of “Sections Cancelled” (117 in 2011-12 to 347 in 2014-15) and the College cancellation rate (8.14% in 2011-12 to 23.34% in 2014-15). However, this was
followed by two years of improvement (decline) in this area to the current number of 235 “Sections Cancelled” and a cancellation rate of 19.88%. Note: These numbers
are not adjusted to account for full or partial concurrencies and do not include Work Experience/Internship, Incarcerated Students Program, or South Bay Regional
Public Safety Training Consortium (JPA).
Source: LTCC Fact Book 2017
2011-12 2012-13 2013-14 2014-15 2015-16 2016-17Unduplicated Headcount 6,230 5,367 5,449 5,061 5,041 4,738 Sections Ran 1,321 1,091 1,182 1,140 1,053 947 Sections Cancelled 117 236 311 347 297 235
-
1,000
2,000
3,000
4,000
5,000
6,000
7,000
-
200
400
600
800
1,000
1,200
1,400
1,600
2011-12 2012-13 2013-14 2014-15 2015-16 2016-17
Und
uplic
ated
Hea
dcou
nt
Sect
ions
Sections Ran Sections Cancelled Unduplicated Headcount
// Internal Environmental Scan
// 15
Lake Tahoe Community College: Educational Master Plan
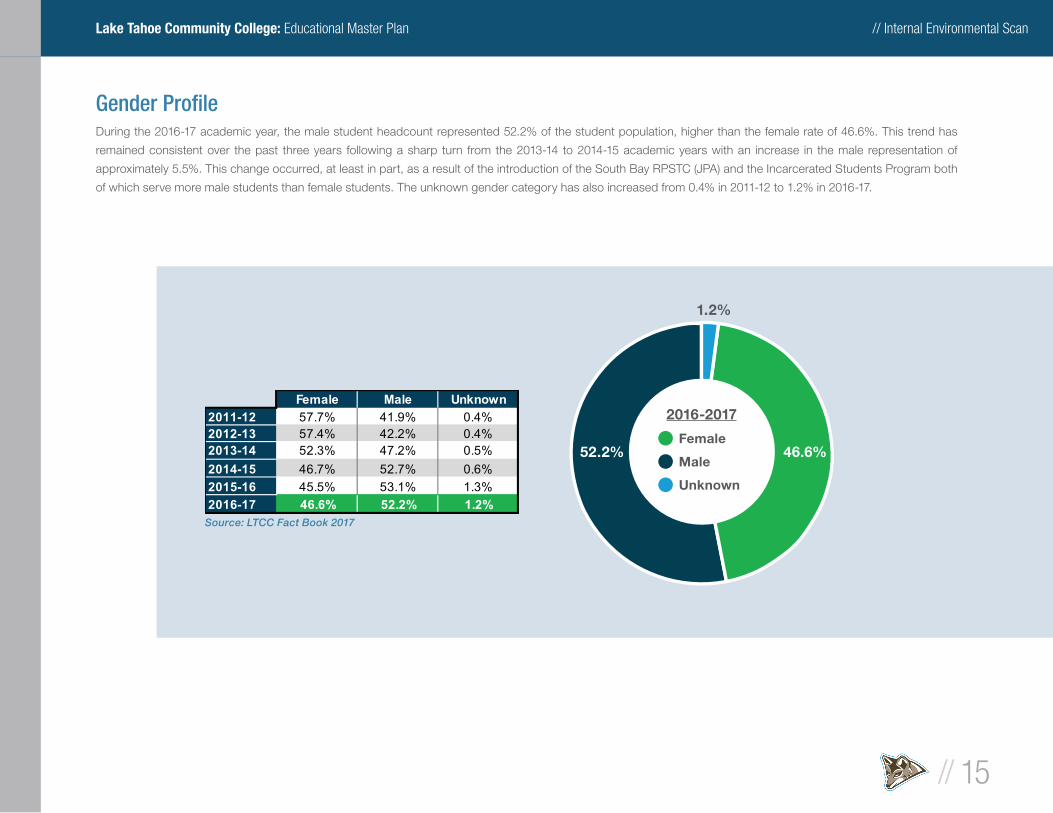
Gender Profi leDuring the 2016-17 academic year, the male student headcount represented 52.2% of the student population, higher than the female rate of 46.6%. This trend has
remained consistent over the past three years following a sharp turn from the 2013-14 to 2014-15 academic years with an increase in the male representation of
approximately 5.5%. This change occurred, at least in part, as a result of the introduction of the South Bay RPSTC (JPA) and the Incarcerated Students Program both
of which serve more male students than female students. The unknown gender category has also increased from 0.4% in 2011-12 to 1.2% in 2016-17.
Source: LTCC Fact Book 2017
52.2% 46.6%
1.2%
2016-2017
Female
Male
Unknown
Female Male Unknown2011-12 57.7% 41.9% 0.4%2012-13 57.4% 42.2% 0.4%2013-14 52.3% 47.2% 0.5%2014-15 46.7% 52.7% 0.6%2015-16 45.5% 53.1% 1.3%2016-17 46.6% 52.2% 1.2%
// Internal Environmental Scan
// 16
Lake Tahoe Community College: Educational Master Plan
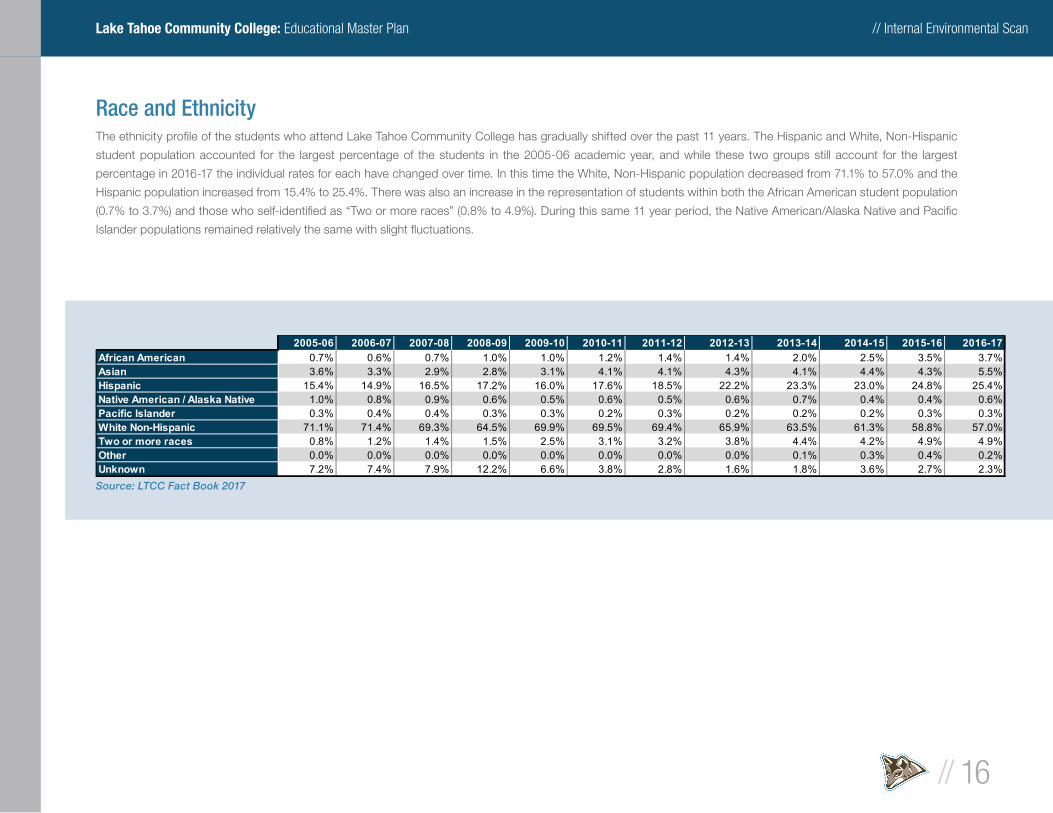
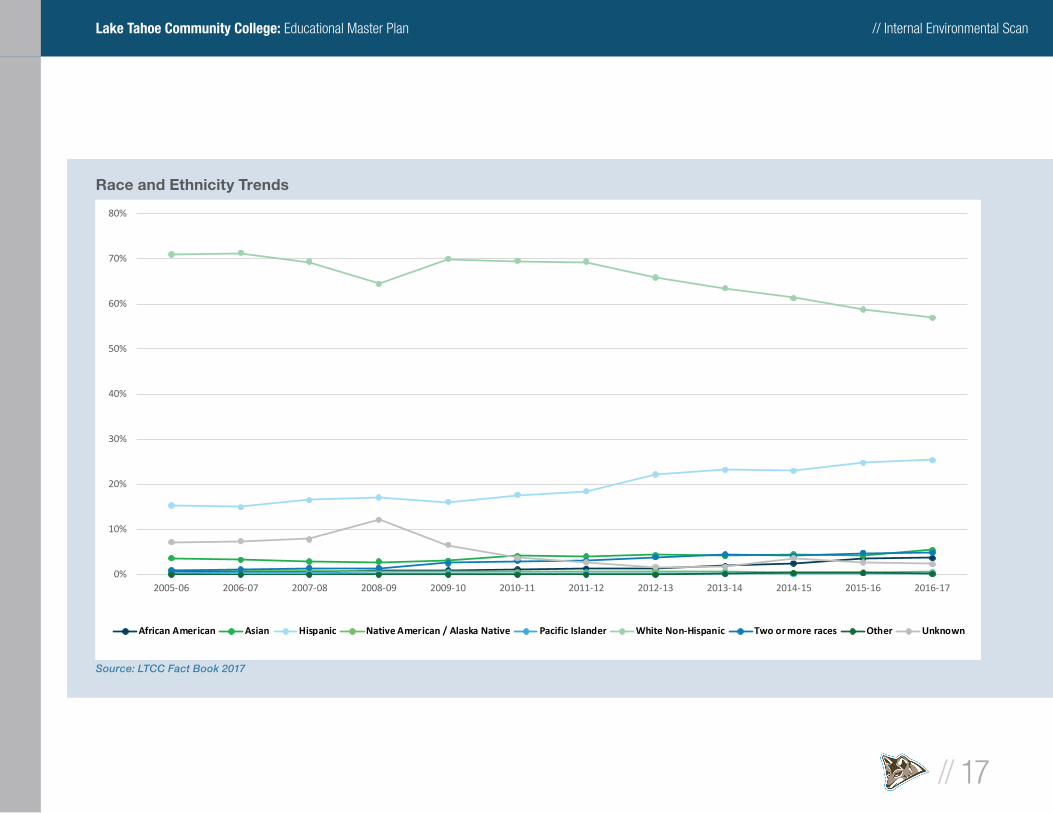
Race and EthnicityThe ethnicity profi le of the students who attend Lake Tahoe Community College has gradually shifted over the past 11 years. The Hispanic and White, Non-Hispanic
student population accounted for the largest percentage of the students in the 2005-06 academic year, and while these two groups still account for the largest
percentage in 2016-17 the individual rates for each have changed over time. In this time the White, Non-Hispanic population decreased from 71.1% to 57.0% and the
Hispanic population increased from 15.4% to 25.4%. There was also an increase in the representation of students within both the African American student population
(0.7% to 3.7%) and those who self-identifi ed as “Two or more races” (0.8% to 4.9%). During this same 11 year period, the Native American/Alaska Native and Pacifi c
Islander populations remained relatively the same with slight fl uctuations.
Source: LTCC Fact Book 2017
2005-06 2006-07 2007-08 2008-09 2009-10 2010-11 2011-12 2012-13 2013-14 2014-15 2015-16 2016-17African American 0.7% 0.6% 0.7% 1.0% 1.0% 1.2% 1.4% 1.4% 2.0% 2.5% 3.5% 3.7%Asian 3.6% 3.3% 2.9% 2.8% 3.1% 4.1% 4.1% 4.3% 4.1% 4.4% 4.3% 5.5%Hispanic 15.4% 14.9% 16.5% 17.2% 16.0% 17.6% 18.5% 22.2% 23.3% 23.0% 24.8% 25.4%Native American / Alaska Native 1.0% 0.8% 0.9% 0.6% 0.5% 0.6% 0.5% 0.6% 0.7% 0.4% 0.4% 0.6%Pacific Islander 0.3% 0.4% 0.4% 0.3% 0.3% 0.2% 0.3% 0.2% 0.2% 0.2% 0.3% 0.3%White Non-Hispanic 71.1% 71.4% 69.3% 64.5% 69.9% 69.5% 69.4% 65.9% 63.5% 61.3% 58.8% 57.0%Two or more races 0.8% 1.2% 1.4% 1.5% 2.5% 3.1% 3.2% 3.8% 4.4% 4.2% 4.9% 4.9%Other 0.0% 0.0% 0.0% 0.0% 0.0% 0.0% 0.0% 0.0% 0.1% 0.3% 0.4% 0.2%Unknown 7.2% 7.4% 7.9% 12.2% 6.6% 3.8% 2.8% 1.6% 1.8% 3.6% 2.7% 2.3%
// Internal Environmental Scan
// 17
Lake Tahoe Community College: Educational Master Plan
Race and Ethnicity Trends
Source: LTCC Fact Book 2017
0%
10%
20%
30%
40%
50%
60%
70%
80%
2005-06 2006-07 2007-08 2008-09 2009-10 2010-11 2011-12 2012-13 2013-14 2014-15 2015-16 2016-17
African American Asian Hispanic Native American / Alaska Native Pacific Islander White Non-Hispanic Two or more races Other Unknown
// Internal Environmental Scan
// 18
Lake Tahoe Community College: Educational Master Plan
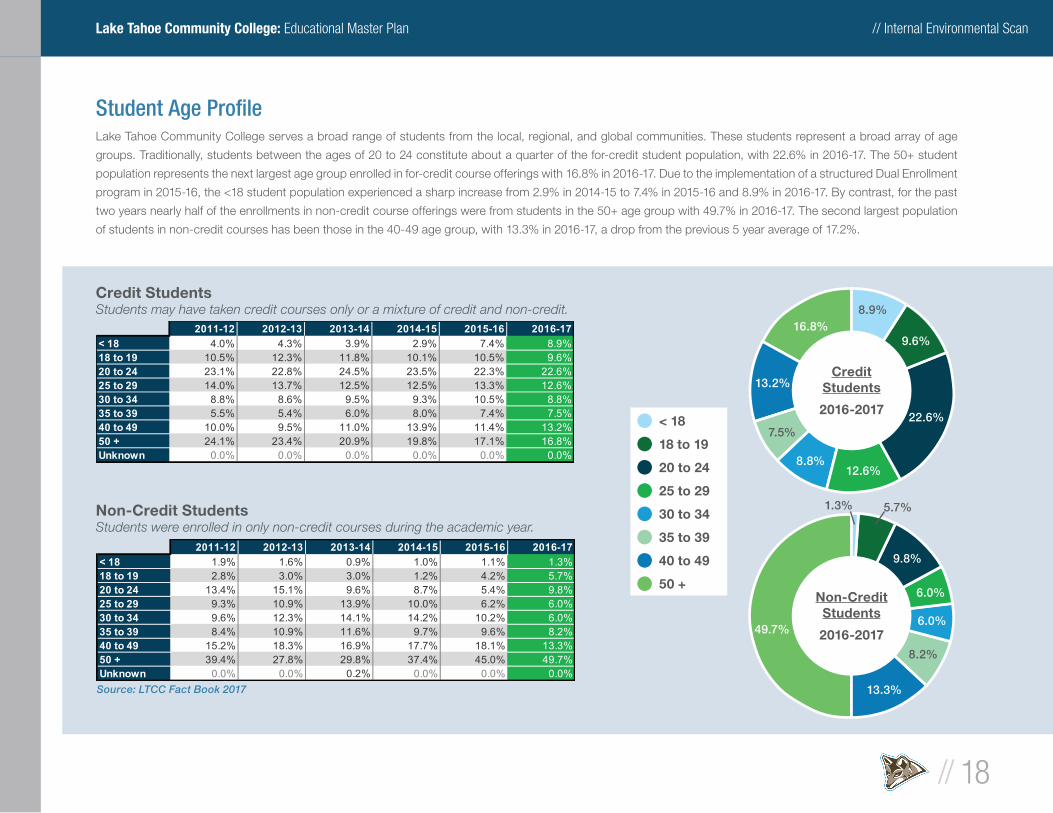
Student Age Profi leLake Tahoe Community College serves a broad range of students from the local, regional, and global communities. These students represent a broad array of age
groups. Traditionally, students between the ages of 20 to 24 constitute about a quarter of the for-credit student population, with 22.6% in 2016-17. The 50+ student
population represents the next largest age group enrolled in for-credit course offerings with 16.8% in 2016-17. Due to the implementation of a structured Dual Enrollment
program in 2015-16, the <18 student population experienced a sharp increase from 2.9% in 2014-15 to 7.4% in 2015-16 and 8.9% in 2016-17. By contrast, for the past
two years nearly half of the enrollments in non-credit course offerings were from students in the 50+ age group with 49.7% in 2016-17. The second largest population
of students in non-credit courses has been those in the 40-49 age group, with 13.3% in 2016-17, a drop from the previous 5 year average of 17.2%.
Source: LTCC Fact Book 2017
< 18
18 to 19
20 to 24
25 to 29
30 to 34
35 to 39
40 to 49
50 +
Credit StudentsStudents may have taken credit courses only or a mixture of credit and non-credit.
Non-Credit StudentsStudents were enrolled in only non-credit courses during the academic year.
CreditStudents
2016-201722.6%
8.8%
13.2%
12.6%
16.8%9.6%
8.9%
7.5%
Non-CreditStudents
2016-201749.7%
5.7%
8.2%
9.8%
6.0%
6.0%
13.3%
1.3%
2011-12 2012-13 2013-14 2014-15 2015-16 2016-17< 18 4.0% 4.3% 3.9% 2.9% 7.4% 8.9%18 to 19 10.5% 12.3% 11.8% 10.1% 10.5% 9.6%20 to 24 23.1% 22.8% 24.5% 23.5% 22.3% 22.6%25 to 29 14.0% 13.7% 12.5% 12.5% 13.3% 12.6%30 to 34 8.8% 8.6% 9.5% 9.3% 10.5% 8.8%35 to 39 5.5% 5.4% 6.0% 8.0% 7.4% 7.5%40 to 49 10.0% 9.5% 11.0% 13.9% 11.4% 13.2%50 + 24.1% 23.4% 20.9% 19.8% 17.1% 16.8%Unknown 0.0% 0.0% 0.0% 0.0% 0.0% 0.0%
2011-12 2012-13 2013-14 2014-15 2015-16 2016-17< 18 1.9% 1.6% 0.9% 1.0% 1.1% 1.3%18 to 19 2.8% 3.0% 3.0% 1.2% 4.2% 5.7%20 to 24 13.4% 15.1% 9.6% 8.7% 5.4% 9.8%25 to 29 9.3% 10.9% 13.9% 10.0% 6.2% 6.0%30 to 34 9.6% 12.3% 14.1% 14.2% 10.2% 6.0%35 to 39 8.4% 10.9% 11.6% 9.7% 9.6% 8.2%40 to 49 15.2% 18.3% 16.9% 17.7% 18.1% 13.3%50 + 39.4% 27.8% 29.8% 37.4% 45.0% 49.7%Unknown 0.0% 0.0% 0.2% 0.0% 0.0% 0.0%
// Internal Environmental Scan
// 19
Lake Tahoe Community College: Educational Master Plan
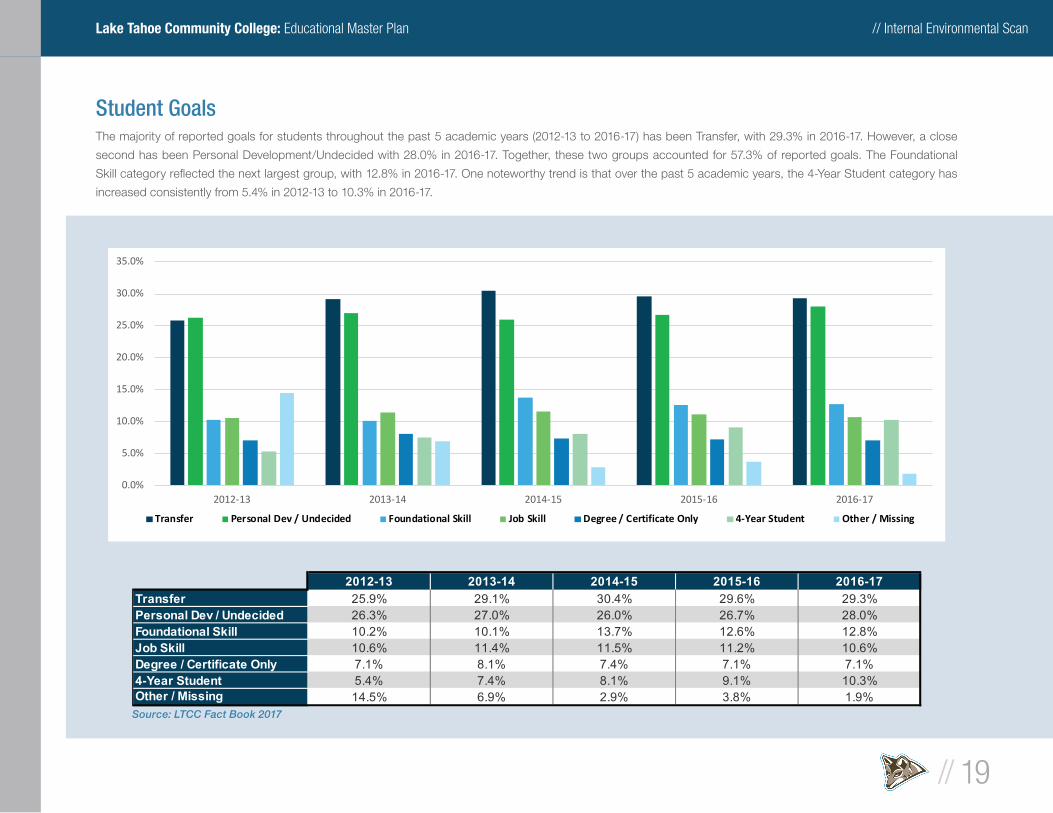
Student GoalsThe majority of reported goals for students throughout the past 5 academic years (2012-13 to 2016-17) has been Transfer, with 29.3% in 2016-17. However, a close
second has been Personal Development/Undecided with 28.0% in 2016-17. Together, these two groups accounted for 57.3% of reported goals. The Foundational
Skill category refl ected the next largest group, with 12.8% in 2016-17. One noteworthy trend is that over the past 5 academic years, the 4-Year Student category has
increased consistently from 5.4% in 2012-13 to 10.3% in 2016-17.
Source: LTCC Fact Book 2017
2012-13 2013-14 2014-15 2015-16 2016-17Transfer 25.9% 29.1% 30.4% 29.6% 29.3%Personal Dev / Undecided 26.3% 27.0% 26.0% 26.7% 28.0%Foundational Skill 10.2% 10.1% 13.7% 12.6% 12.8%Job Skill 10.6% 11.4% 11.5% 11.2% 10.6%Degree / Certificate Only 7.1% 8.1% 7.4% 7.1% 7.1%4-Year Student 5.4% 7.4% 8.1% 9.1% 10.3%Other / Missing 14.5% 6.9% 2.9% 3.8% 1.9%
0.0%
5.0%
10.0%
15.0%
20.0%
25.0%
30.0%
35.0%
2012-13 2013-14 2014-15 2015-16 2016-17
Transfer Personal Dev / Undecided Foundational Skill Job Skill Degree / Certificate Only 4-Year Student Other / Missing
// Internal Environmental Scan
// 20
Lake Tahoe Community College: Educational Master Plan
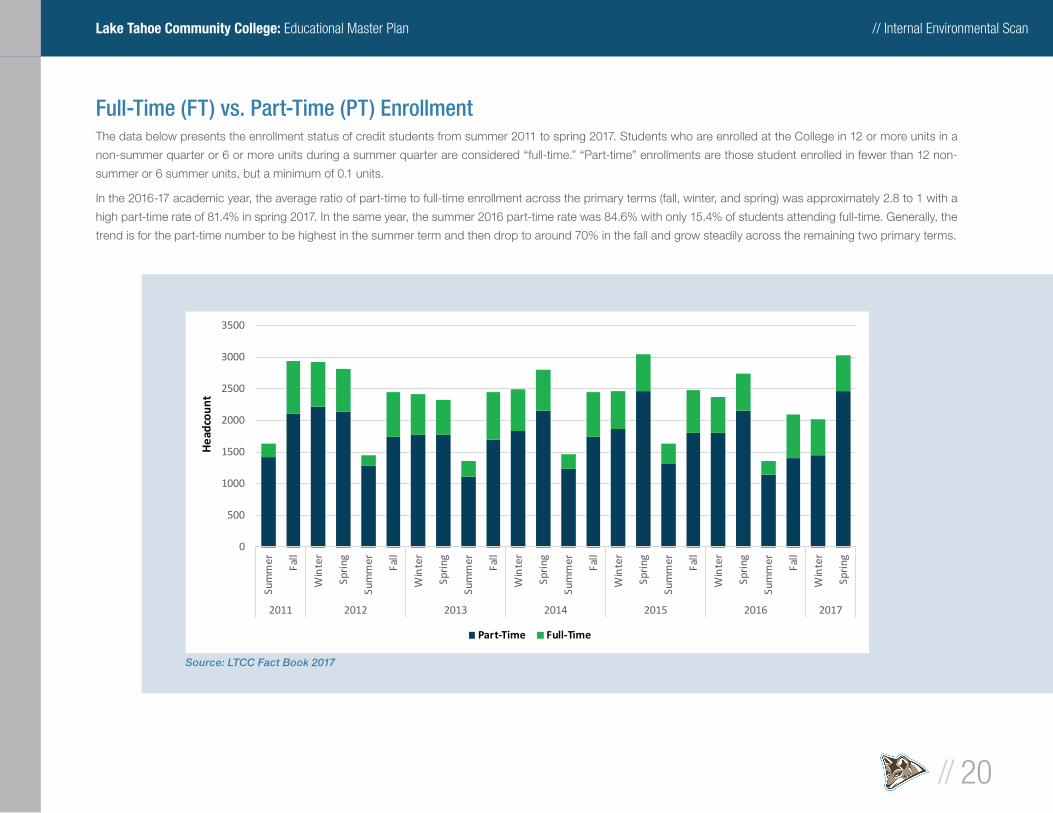
Full-Time (FT) vs. Part-Time (PT) Enrollment The data below presents the enrollment status of credit students from summer 2011 to spring 2017. Students who are enrolled at the College in 12 or more units in a
non-summer quarter or 6 or more units during a summer quarter are considered “full-time.” “Part-time” enrollments are those student enrolled in fewer than 12 non-
summer or 6 summer units, but a minimum of 0.1 units.
In the 2016-17 academic year, the average ratio of part-time to full-time enrollment across the primary terms (fall, winter, and spring) was approximately 2.8 to 1 with a
high part-time rate of 81.4% in spring 2017. In the same year, the summer 2016 part-time rate was 84.6% with only 15.4% of students attending full-time. Generally, the
trend is for the part-time number to be highest in the summer term and then drop to around 70% in the fall and grow steadily across the remaining two primary terms.
Source: LTCC Fact Book 2017
0
500
1000
1500
2000
2500
3000
3500
Sum
mer Fall
Win
ter
Spri
ng
Sum
mer Fall
Win
ter
Spri
ng
Sum
mer Fall
Win
ter
Spri
ng
Sum
mer Fall
Win
ter
Spri
ng
Sum
mer Fall
Win
ter
Spri
ng
Sum
mer Fall
Win
ter
Spri
ng
2011 2012 2013 2014 2015 2016 2017
Hea
dcou
nt
Part-Time Full-Time
// Internal Environmental Scan
// 21
Lake Tahoe Community College: Educational Master Plan
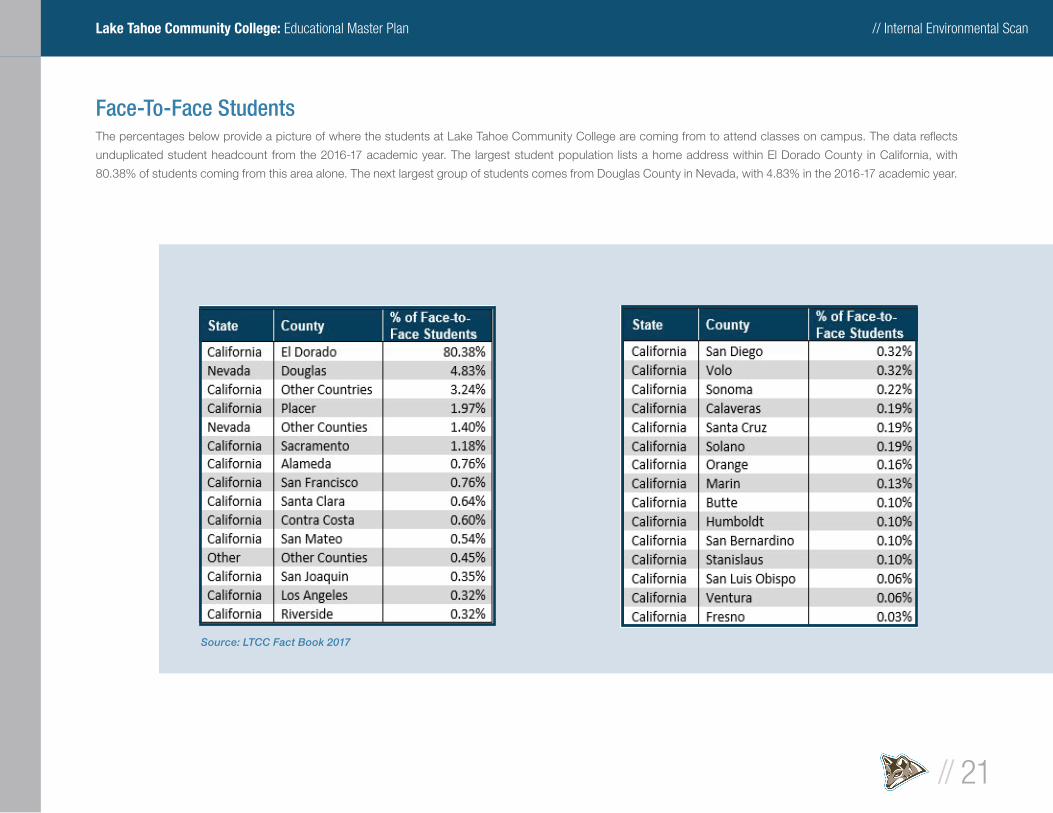
Face-To-Face StudentsThe percentages below provide a picture of where the students at Lake Tahoe Community College are coming from to attend classes on campus. The data refl ects
unduplicated student headcount from the 2016-17 academic year. The largest student population lists a home address within El Dorado County in California, with
80.38% of students coming from this area alone. The next largest group of students comes from Douglas County in Nevada, with 4.83% in the 2016-17 academic year.
Source: LTCC Fact Book 2017
// Internal Environmental Scan
// 22
Lake Tahoe Community College: Educational Master Plan
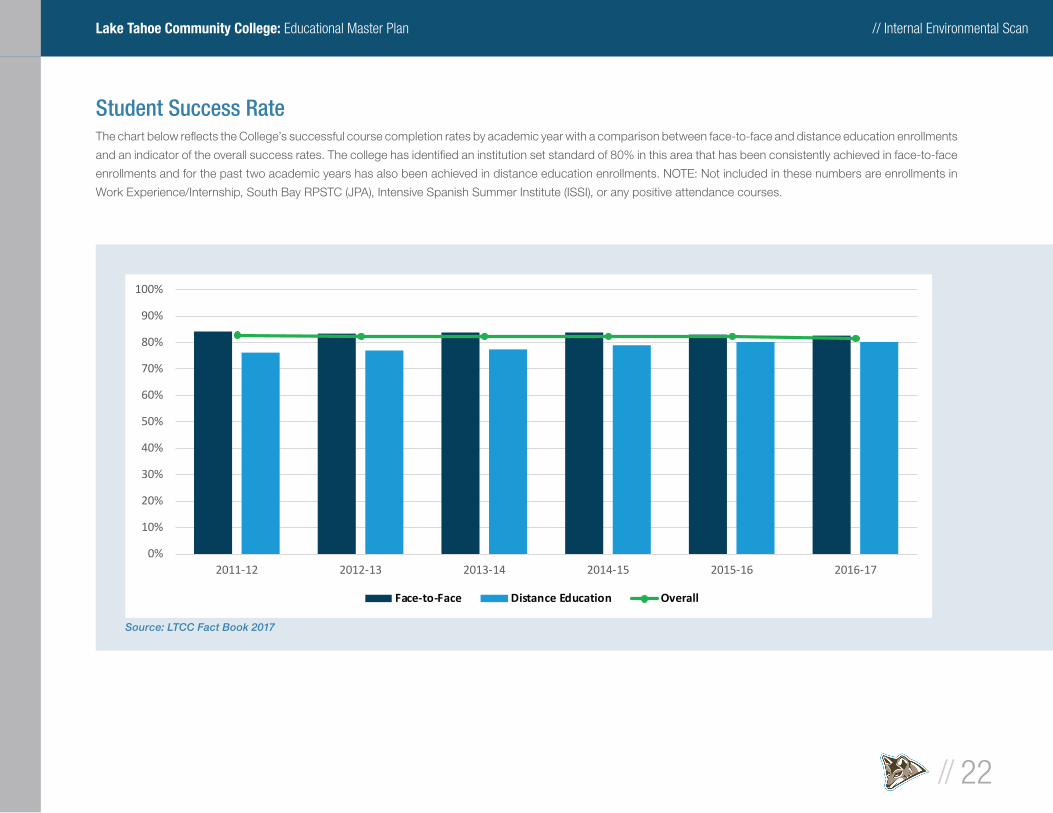
Student Success RateThe chart below refl ects the College’s successful course completion rates by academic year with a comparison between face-to-face and distance education enrollments
and an indicator of the overall success rates. The college has identifi ed an institution set standard of 80% in this area that has been consistently achieved in face-to-face
enrollments and for the past two academic years has also been achieved in distance education enrollments. NOTE: Not included in these numbers are enrollments in
Work Experience/Internship, South Bay RPSTC (JPA), Intensive Spanish Summer Institute (ISSI), or any positive attendance courses.
Source: LTCC Fact Book 2017
0%
10%
20%
30%
40%
50%
60%
70%
80%
90%
100%
2011-12 2012-13 2013-14 2014-15 2015-16 2016-17
Face-to-Face Distance Education Overall
// Internal Environmental Scan
// 23
Lake Tahoe Community College: Educational Master Plan
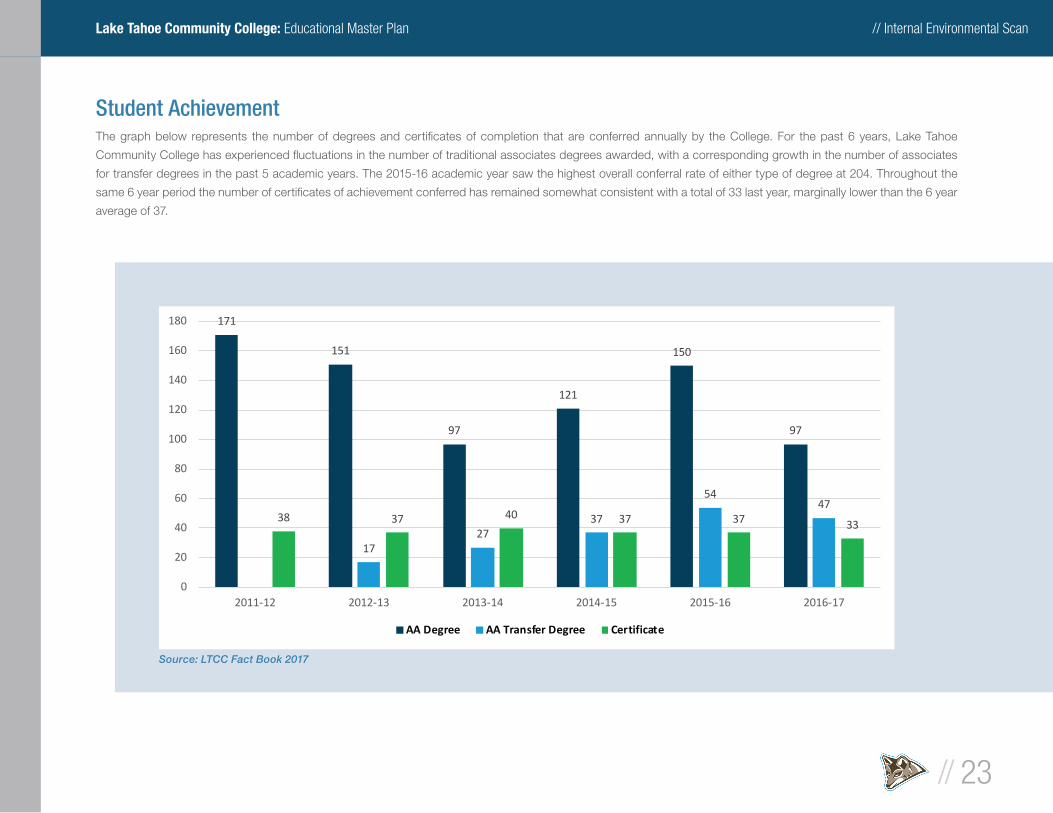
Student AchievementThe graph below represents the number of degrees and certifi cates of completion that are conferred annually by the College. For the past 6 years, Lake Tahoe
Community College has experienced fl uctuations in the number of traditional associates degrees awarded, with a corresponding growth in the number of associates
for transfer degrees in the past 5 academic years. The 2015-16 academic year saw the highest overall conferral rate of either type of degree at 204. Throughout the
same 6 year period the number of certifi cates of achievement conferred has remained somewhat consistent with a total of 33 last year, marginally lower than the 6 year
average of 37.
Source: LTCC Fact Book 2017
171
151
97
121
150
97
1727
37
5447
38 37 40 37 37 33
0
20
40
60
80
100
120
140
160
180
2011-12 2012-13 2013-14 2014-15 2015-16 2016-17
AA Degree AA Transfer Degree Certificate
// Internal Environmental Scan
// 24
Lake Tahoe Community College: Educational Master Plan
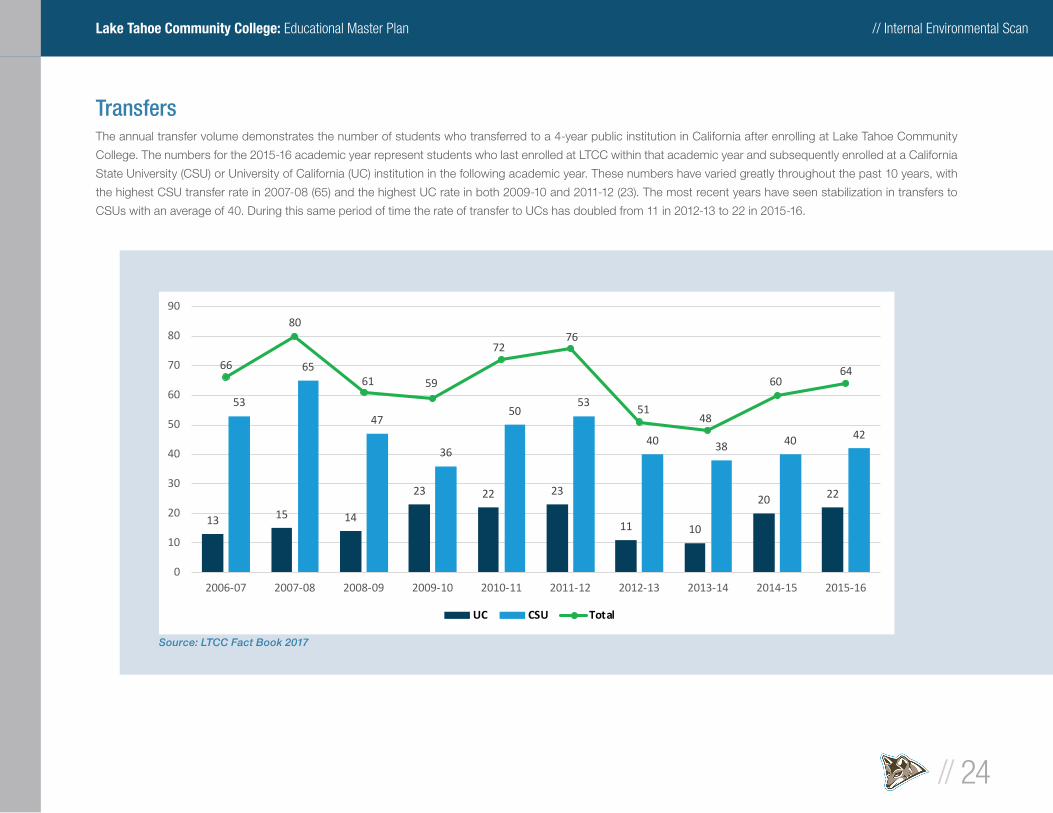
TransfersThe annual transfer volume demonstrates the number of students who transferred to a 4-year public institution in California after enrolling at Lake Tahoe Community
College. The numbers for the 2015-16 academic year represent students who last enrolled at LTCC within that academic year and subsequently enrolled at a California
State University (CSU) or University of California (UC) institution in the following academic year. These numbers have varied greatly throughout the past 10 years, with
the highest CSU transfer rate in 2007-08 (65) and the highest UC rate in both 2009-10 and 2011-12 (23). The most recent years have seen stabilization in transfers to
CSUs with an average of 40. During this same period of time the rate of transfer to UCs has doubled from 11 in 2012-13 to 22 in 2015-16.
13 15 14
23 22 23
11 10
20 22
53
65
47
36
5053
40 38 40 42
66
80
61 59
7276
5148
6064
0
10
20
30
40
50
60
70
80
90
2006-07 2007-08 2008-09 2009-10 2010-11 2011-12 2012-13 2013-14 2014-15 2015-16
UC CSU Total
Source: LTCC Fact Book 2017
// Internal Environmental Scan
// 25
Lake Tahoe Community College: Educational Master Plan
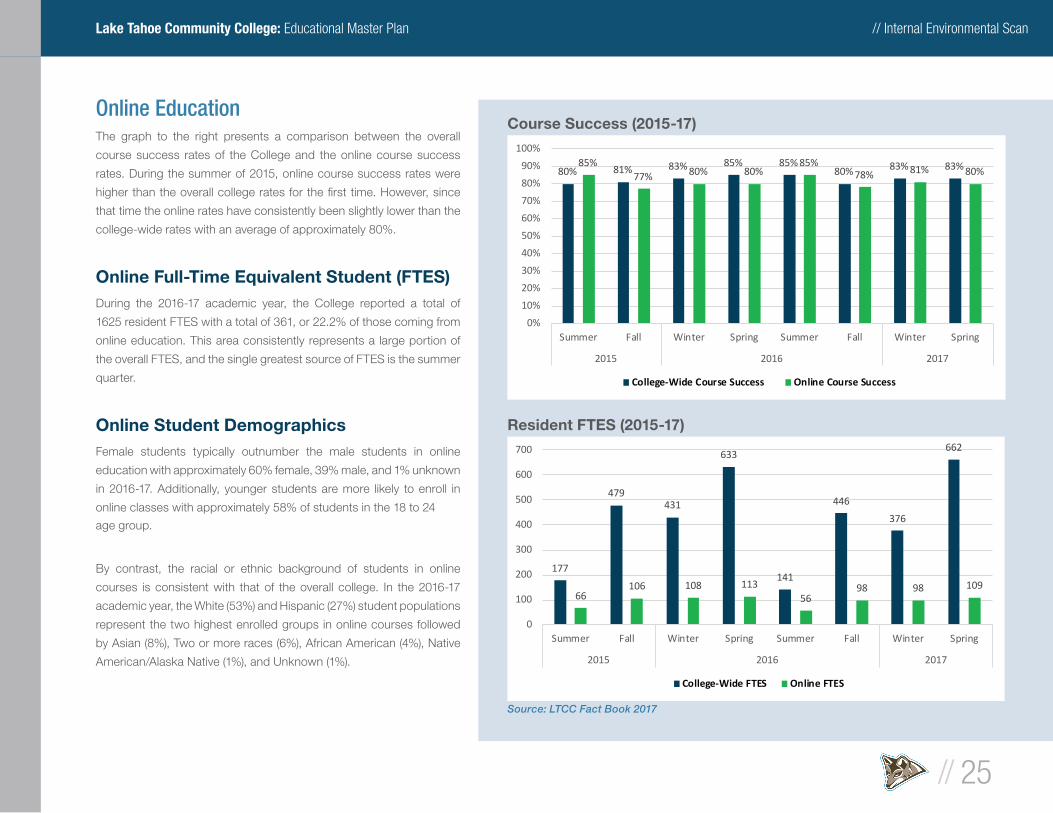
Online EducationThe graph to the right presents a comparison between the overall
course success rates of the College and the online course success
rates. During the summer of 2015, online course success rates were
higher than the overall college rates for the fi rst time. However, since
that time the online rates have consistently been slightly lower than the
college-wide rates with an average of approximately 80%.
Online Full-Time Equivalent Student (FTES)During the 2016-17 academic year, the College reported a total of
1625 resident FTES with a total of 361, or 22.2% of those coming from
online education. This area consistently represents a large portion of
the overall FTES, and the single greatest source of FTES is the summer
quarter.
Online Student DemographicsFemale students typically outnumber the male students in online
education with approximately 60% female, 39% male, and 1% unknown
in 2016-17. Additionally, younger students are more likely to enroll in
online classes with approximately 58% of students in the 18 to 24
age group.
By contrast, the racial or ethnic background of students in online
courses is consistent with that of the overall college. In the 2016-17
academic year, the White (53%) and Hispanic (27%) student populations
represent the two highest enrolled groups in online courses followed
by Asian (8%), Two or more races (6%), African American (4%), Native
American/Alaska Native (1%), and Unknown (1%).
Source: LTCC Fact Book 2017
Course Success (2015-17)
Resident FTES (2015-17)
80% 81% 83% 85% 85%80% 83% 83%85%
77% 80% 80%85%
78% 81% 80%
0%
10%
20%
30%
40%
50%
60%
70%
80%
90%
100%
Summer Fall Winter Spring Summer Fall Winter Spring
2015 2016 2017
College-Wide Course Success Online Course Success
177
479431
633
141
446
376
662
66106 108 113
5698 98 109
0
100
200
300
400
500
600
700
Summer Fall Winter Spring Summer Fall Winter Spring
2015 2016 2017
College-Wide FTES Online FTES
// Internal Environmental Scan
// 26
Lake Tahoe Community College: Educational Master Plan
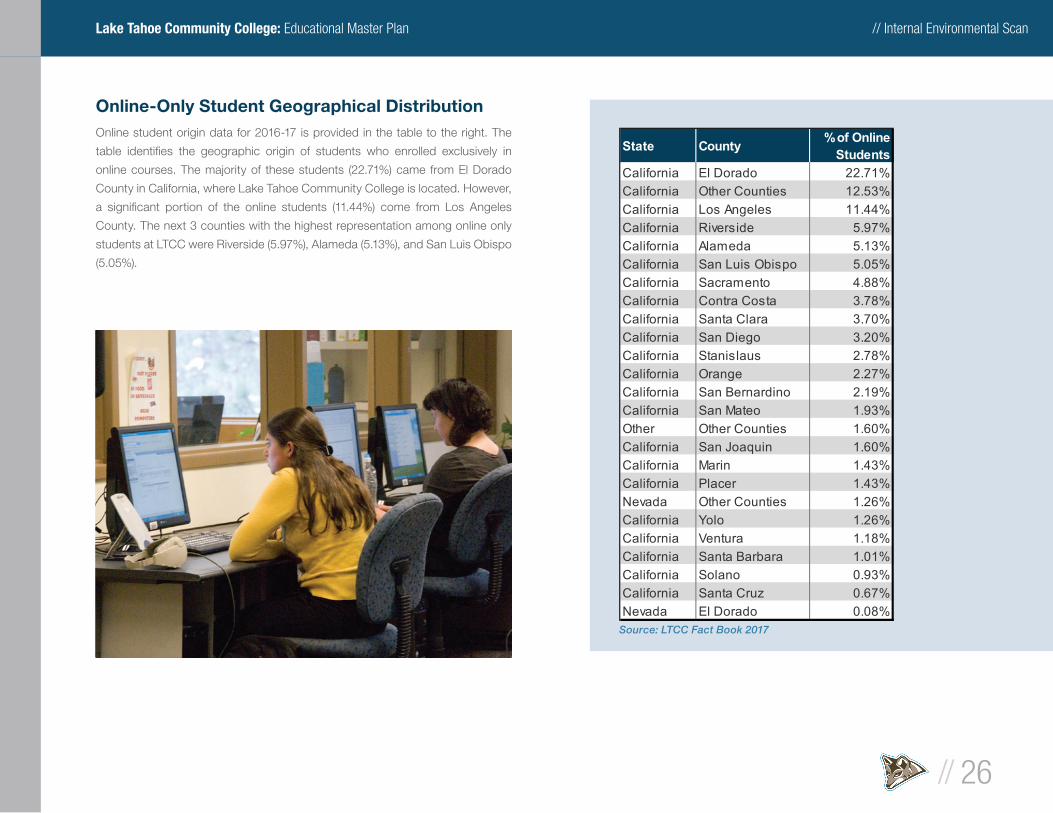
Online-Only Student Geographical DistributionOnline student origin data for 2016-17 is provided in the table to the right. The
table identifi es the geographic origin of students who enrolled exclusively in
online courses. The majority of these students (22.71%) came from El Dorado
County in California, where Lake Tahoe Community College is located. However,
a signifi cant portion of the online students (11.44%) come from Los Angeles
County. The next 3 counties with the highest representation among online only
students at LTCC were Riverside (5.97%), Alameda (5.13%), and San Luis Obispo
(5.05%).
Source: LTCC Fact Book 2017
State County % of OnlineStudents
California El Dorado 22.71%California Other Counties 12.53%California Los Angeles 11.44%California Riverside 5.97%California Alameda 5.13%California San Luis Obispo 5.05%California Sacramento 4.88%California Contra Costa 3.78%California Santa Clara 3.70%California San Diego 3.20%California Stanislaus 2.78%California Orange 2.27%California San Bernardino 2.19%California San Mateo 1.93%Other Other Counties 1.60%California San Joaquin 1.60%California Marin 1.43%California Placer 1.43%Nevada Other Counties 1.26%California Yolo 1.26%California Ventura 1.18%California Santa Barbara 1.01%California Solano 0.93%California Santa Cruz 0.67%Nevada El Dorado 0.08%
// Internal Environmental Scan
// 27
Lake Tahoe Community College: Educational Master Plan
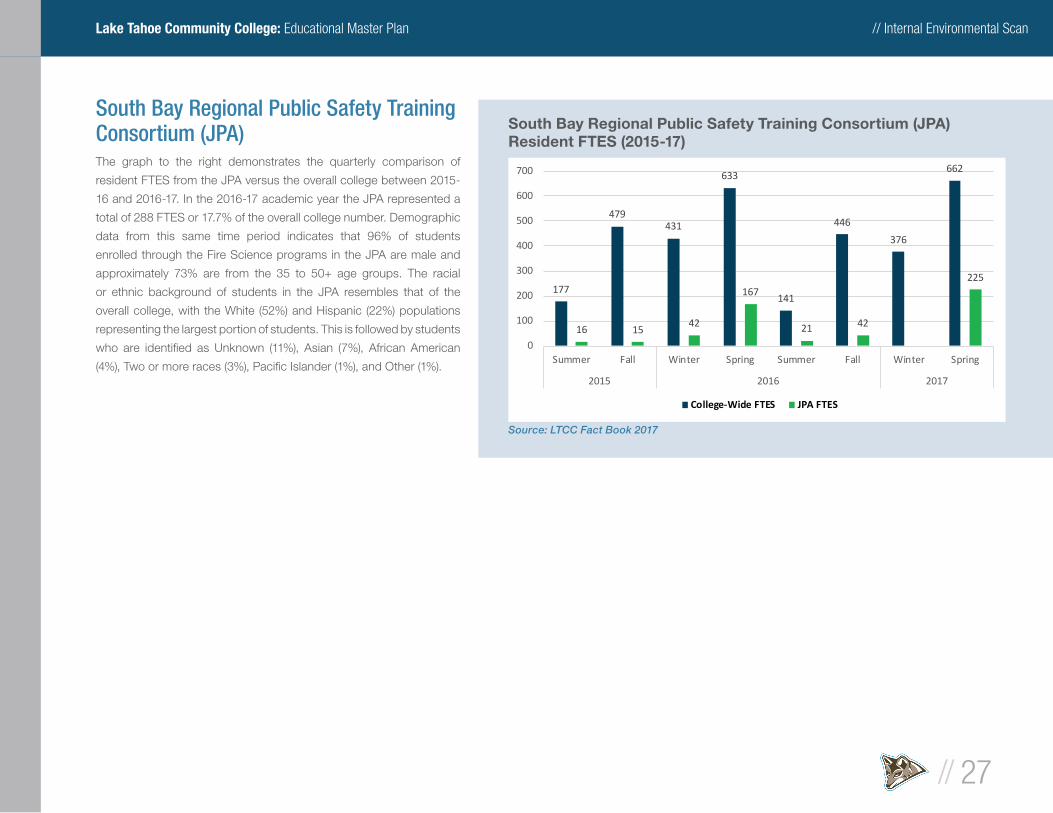
South Bay Regional Public Safety Training Consortium (JPA)The graph to the right demonstrates the quarterly comparison of
resident FTES from the JPA versus the overall college between 2015-
16 and 2016-17. In the 2016-17 academic year the JPA represented a
total of 288 FTES or 17.7% of the overall college number. Demographic
data from this same time period indicates that 96% of students
enrolled through the Fire Science programs in the JPA are male and
approximately 73% are from the 35 to 50+ age groups. The racial
or ethnic background of students in the JPA resembles that of the
overall college, with the White (52%) and Hispanic (22%) populations
representing the largest portion of students. This is followed by students
who are identifi ed as Unknown (11%), Asian (7%), African American
(4%), Two or more races (3%), Pacifi c Islander (1%), and Other (1%).
Source: LTCC Fact Book 2017
South Bay Regional Public Safety Training Consortium (JPA)Resident FTES (2015-17)
177
479431
633
141
446
376
662
16 1542
167
21 42
225
0
100
200
300
400
500
600
700
Summer Fall Winter Spring Summer Fall Winter Spring
2015 2016 2017
College-Wide FTES JPA FTES
// Internal Environmental Scan
// 28
Lake Tahoe Community College: Educational Master Plan
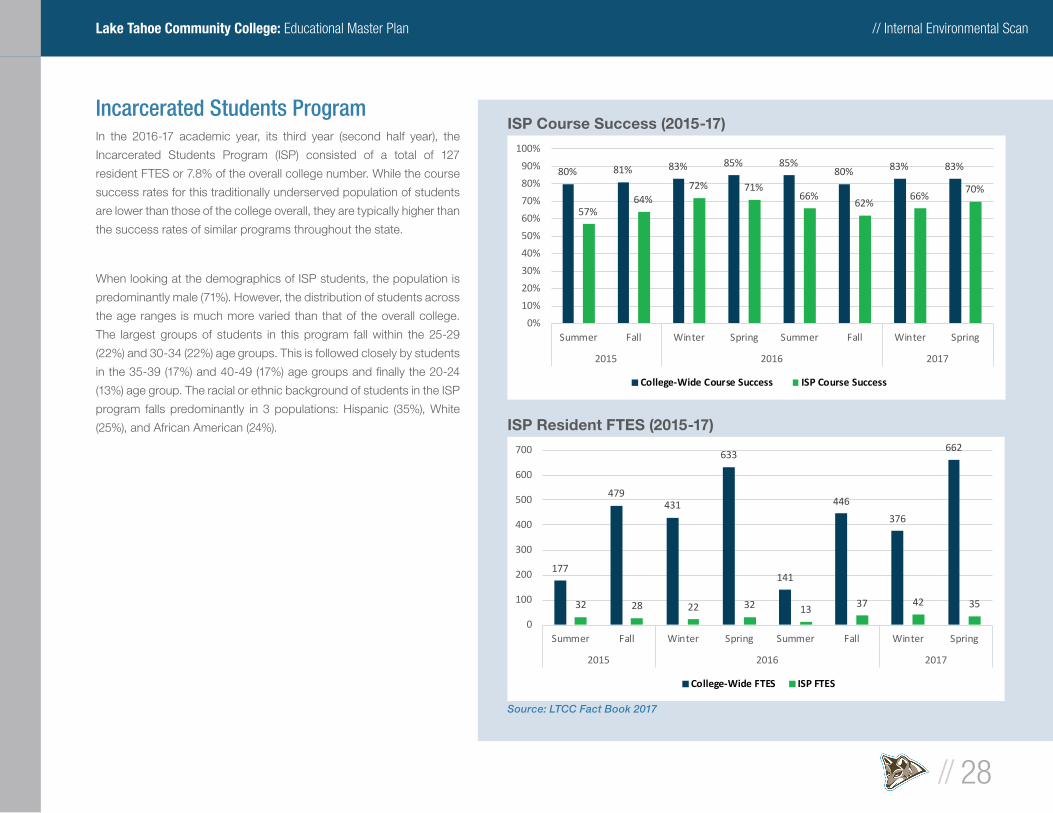
Incarcerated Students ProgramIn the 2016-17 academic year, its third year (second half year), the
Incarcerated Students Program (ISP) consisted of a total of 127
resident FTES or 7.8% of the overall college number. While the course
success rates for this traditionally underserved population of students
are lower than those of the college overall, they are typically higher than
the success rates of similar programs throughout the state.
When looking at the demographics of ISP students, the population is
predominantly male (71%). However, the distribution of students across
the age ranges is much more varied than that of the overall college.
The largest groups of students in this program fall within the 25-29
(22%) and 30-34 (22%) age groups. This is followed closely by students
in the 35-39 (17%) and 40-49 (17%) age groups and fi nally the 20-24
(13%) age group. The racial or ethnic background of students in the ISP
program falls predominantly in 3 populations: Hispanic (35%), White
(25%), and African American (24%).
Source: LTCC Fact Book 2017
ISP Course Success (2015-17)
ISP Resident FTES (2015-17)
80% 81% 83% 85% 85%80% 83% 83%
57%64%
72% 71%66%
62%66%
70%
0%
10%
20%
30%
40%
50%
60%
70%
80%
90%
100%
Summer Fall Winter Spring Summer Fall Winter Spring
2015 2016 2017
College-Wide Course Success ISP Course Success
177
479431
633
141
446
376
662
32 28 22 32 13 37 42 35
0
100
200
300
400
500
600
700
Summer Fall Winter Spring Summer Fall Winter Spring
2015 2016 2017
College-Wide FTES ISP FTES
// External Environmental Scan
// 29
Lake Tahoe Community College: Educational Master Plan
OverviewA review of Lake Tahoe Community College’s external environment is a critical
component of the Educational Master Plan. It gives a viewpoint of the conditions
that exist outside the control of the College. Conditions at the national, state, and
most notably, the local levels will have an impact on the planning, development
and direction of the College. While the future cannot be predicted, an in-depth
analysis of the characteristics and trends that exist can assist in identifying the
opportunities or constraints that might become crucial in planning the College’s
future.
During the development of the External Environmental Scan, numerous data
resources were utilized. Those resources included the following:
§ Department of Education / Department of Labor (US)
§ Department of Finance (CA)
§ California Community College Chancellor’s Offi ce Data Mart
§ Environmental System Research Institute (ESRI)
§ Kyser Center for Economic Research
§ Lake Tahoe Community College Planning Documents / Student Information
§ Lake Tahoe Community College Fact Book
§ City of Lake Tahoe, CA Fiscal Year 2016-2017 Annual Budget
§ South Lake Tahoe Visitor Authority Tourism Forum
§ Tahoe Regional Planning Agency (TRPA) 2016 Annual Report
§ Chamber of Commerce
§ Tahoe Daily Tribune
§ Visit Reno Tahoe
§ Tahoe Prosperity Center
§ ACCJC
These sources were used to provide the most accurate and consistent data in
evaluating the “Effective Service Area.” For the External Scan, the greatest focus
was placed on the area that will have a signifi cant impact on the College – i.e. the
local area that serves the students of Lake Tahoe Community College. The Scan
references this area as the “Effective Service Area” of the College.
External Environmental Scan
// External Environmental Scan
// 30
Lake Tahoe Community College: Educational Master Plan
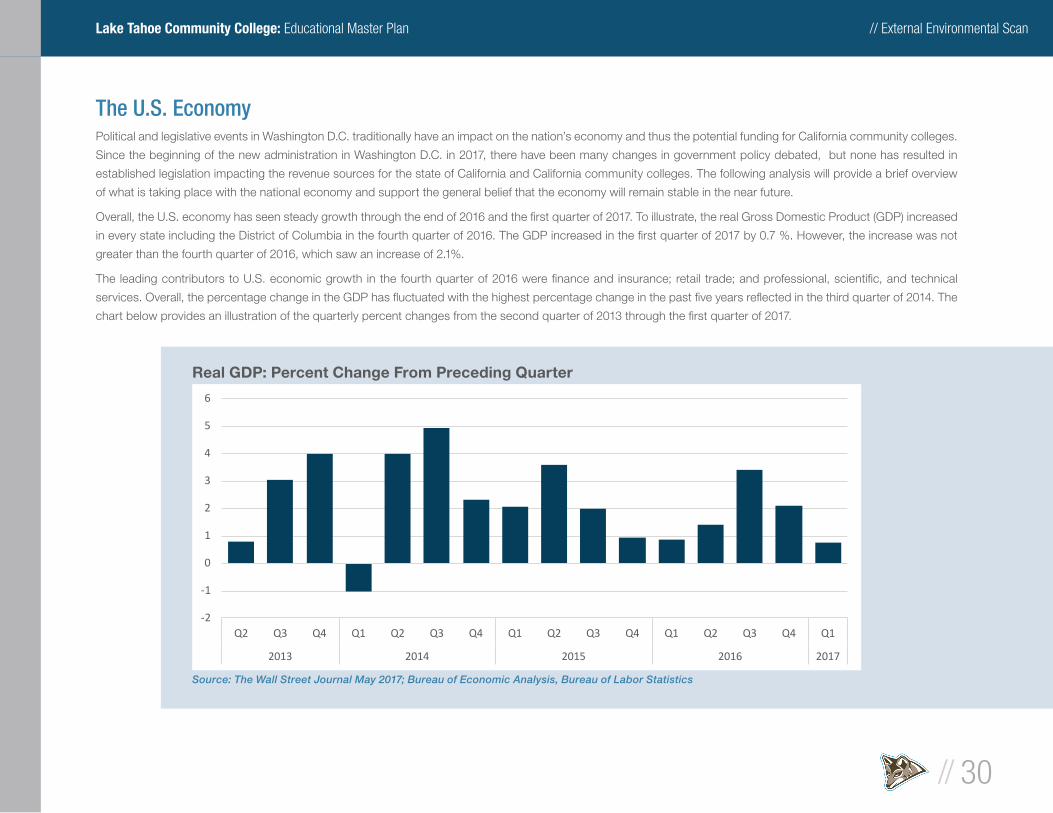
The U.S. EconomyPolitical and legislative events in Washington D.C. traditionally have an impact on the nation’s economy and thus the potential funding for California community colleges.
Since the beginning of the new administration in Washington D.C. in 2017, there have been many changes in government policy debated, but none has resulted in
established legislation impacting the revenue sources for the state of California and California community colleges. The following analysis will provide a brief overview
of what is taking place with the national economy and support the general belief that the economy will remain stable in the near future.
Overall, the U.S. economy has seen steady growth through the end of 2016 and the fi rst quarter of 2017. To illustrate, the real Gross Domestic Product (GDP) increased
in every state including the District of Columbia in the fourth quarter of 2016. The GDP increased in the fi rst quarter of 2017 by 0.7 %. However, the increase was not
greater than the fourth quarter of 2016, which saw an increase of 2.1%.
The leading contributors to U.S. economic growth in the fourth quarter of 2016 were fi nance and insurance; retail trade; and professional, scientifi c, and technical
services. Overall, the percentage change in the GDP has fl uctuated with the highest percentage change in the past fi ve years refl ected in the third quarter of 2014. The
chart below provides an illustration of the quarterly percent changes from the second quarter of 2013 through the fi rst quarter of 2017.
Source: The Wall Street Journal May 2017; Bureau of Economic Analysis, Bureau of Labor Statistics
-2
-1
0
1
2
3
4
5
6
Q2 Q3 Q4 Q1 Q2 Q3 Q4 Q1 Q2 Q3 Q4 Q1 Q2 Q3 Q4 Q1
2013 2014 2015 2016 2017
Real GDP: Percent Change From Preceding Quarter
// External Environmental Scan
// 31
Lake Tahoe Community College: Educational Master Plan
During the fi rst quarter of 2017, the current-dollar Personal Income (PI) increased
to $161.9 billion, compared with an increase of $154.6 billion in the fourth quarter
of 2016. Disposable Personal Income (DPI) also increased in the fi rst quarter of
2017 to 3.4% or $121.0 billion compared with an increase of 4.1% or $141.6 billion
in the fourth quarter of 2016. The most current PI fi gures refl ect a 0.2% or $40.0
billion increase for March 2017.
The most current data regarding employment refl ects that the jobless claims as
of May 2017 were 232,000. Jobless claims have been below 300,000 for 115
consecutive weeks, the longest duration that claims have been under 300,000
since 1970. As of April 2017, the national unemployment rate was 4.4%. The
percentage has consistently decreased since January 2017. This fi gure is also
lower than the year over year percent of 5.0% for April 2016 and represents a
-0.6% year over year decrease. The total non-farm payroll employed for April 2017
increased by 211,000. Job gains took place in healthcare and social assistance,
leisure and hospitality, mining and fi nancial activities. In April 2017, employment
in healthcare and social assistance increased by 37,000. For the same time
frame, leisure and hospitality added 55,000 jobs. Employment in mining rose by
9,000 for April 2017. Finally, employment in fi nancial activities added 19,000 jobs.
Accounting for most of the gain in this sector was insurance carriers and related
activities with 14,000 for the same time period.
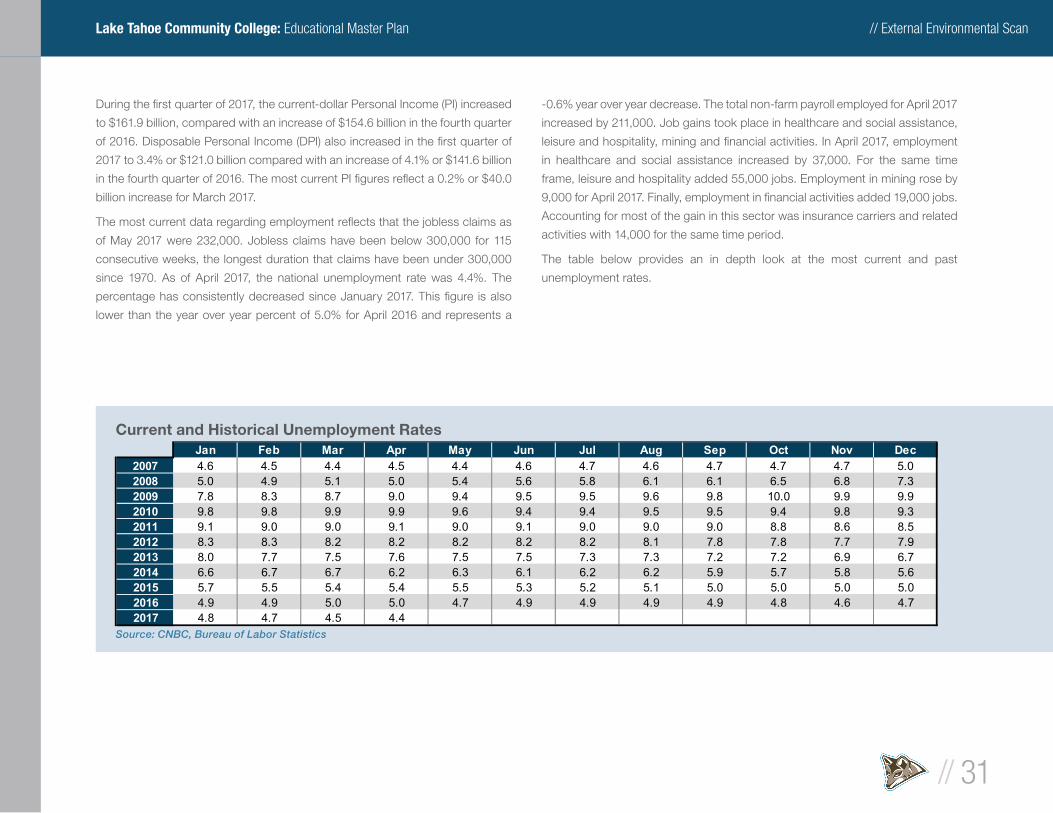
The table below provides an in depth look at the most current and past
unemployment rates.
Jan Feb Mar Apr May Jun Jul Aug Sep Oct Nov Dec2007 4.6 4.5 4.4 4.5 4.4 4.6 4.7 4.6 4.7 4.7 4.7 5.02008 5.0 4.9 5.1 5.0 5.4 5.6 5.8 6.1 6.1 6.5 6.8 7.32009 7.8 8.3 8.7 9.0 9.4 9.5 9.5 9.6 9.8 10.0 9.9 9.92010 9.8 9.8 9.9 9.9 9.6 9.4 9.4 9.5 9.5 9.4 9.8 9.32011 9.1 9.0 9.0 9.1 9.0 9.1 9.0 9.0 9.0 8.8 8.6 8.52012 8.3 8.3 8.2 8.2 8.2 8.2 8.2 8.1 7.8 7.8 7.7 7.92013 8.0 7.7 7.5 7.6 7.5 7.5 7.3 7.3 7.2 7.2 6.9 6.72014 6.6 6.7 6.7 6.2 6.3 6.1 6.2 6.2 5.9 5.7 5.8 5.62015 5.7 5.5 5.4 5.4 5.5 5.3 5.2 5.1 5.0 5.0 5.0 5.02016 4.9 4.9 5.0 5.0 4.7 4.9 4.9 4.9 4.9 4.8 4.6 4.72017 4.8 4.7 4.5 4.4
Source: CNBC, Bureau of Labor Statistics
Current and Historical Unemployment Rates
// External Environmental Scan
// 32
Lake Tahoe Community College: Educational Master Plan
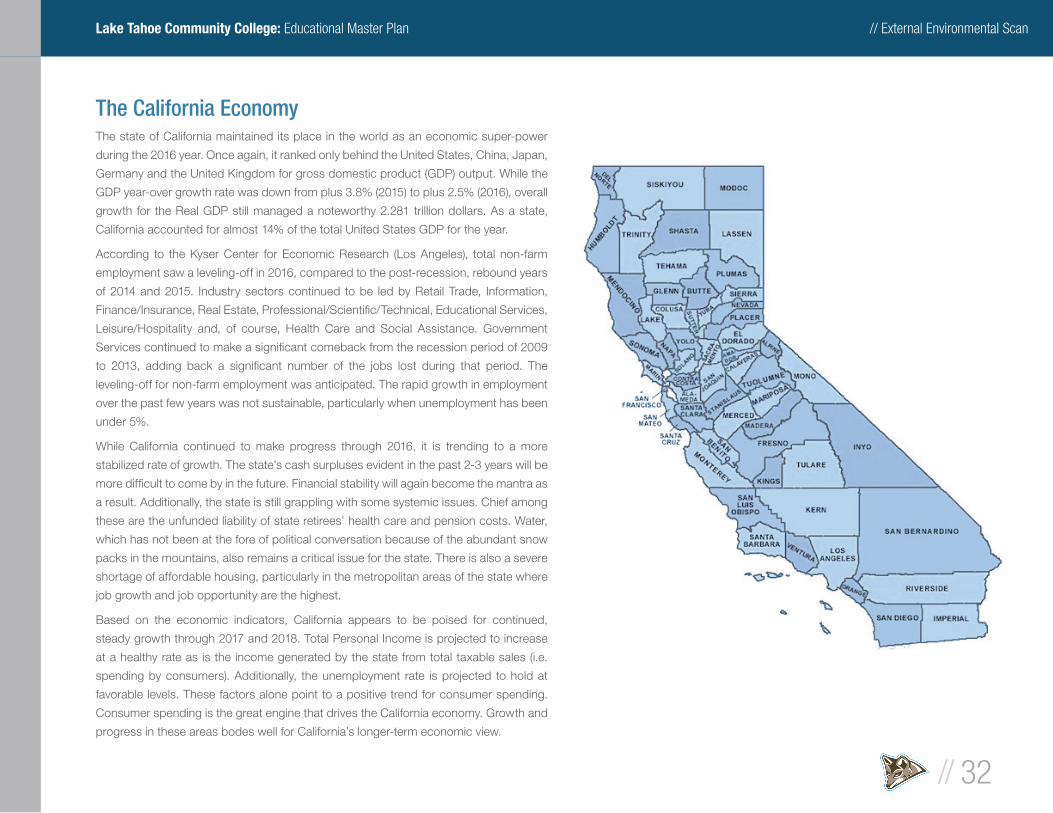
The California EconomyThe state of California maintained its place in the world as an economic super-power
during the 2016 year. Once again, it ranked only behind the United States, China, Japan,
Germany and the United Kingdom for gross domestic product (GDP) output. While the
GDP year-over growth rate was down from plus 3.8% (2015) to plus 2.5% (2016), overall
growth for the Real GDP still managed a noteworthy 2.281 trillion dollars. As a state,
California accounted for almost 14% of the total United States GDP for the year.
According to the Kyser Center for Economic Research (Los Angeles), total non-farm
employment saw a leveling-off in 2016, compared to the post-recession, rebound years
of 2014 and 2015. Industry sectors continued to be led by Retail Trade, Information,
Finance/Insurance, Real Estate, Professional/Scientifi c/Technical, Educational Services,
Leisure/Hospitality and, of course, Health Care and Social Assistance. Government
Services continued to make a signifi cant comeback from the recession period of 2009
to 2013, adding back a signifi cant number of the jobs lost during that period. The
leveling-off for non-farm employment was anticipated. The rapid growth in employment
over the past few years was not sustainable, particularly when unemployment has been
under 5%.
While California continued to make progress through 2016, it is trending to a more
stabilized rate of growth. The state’s cash surpluses evident in the past 2-3 years will be
more diffi cult to come by in the future. Financial stability will again become the mantra as
a result. Additionally, the state is still grappling with some systemic issues. Chief among
these are the unfunded liability of state retirees’ health care and pension costs. Water,
which has not been at the fore of political conversation because of the abundant snow
packs in the mountains, also remains a critical issue for the state. There is also a severe
shortage of affordable housing, particularly in the metropolitan areas of the state where
job growth and job opportunity are the highest.
Based on the economic indicators, California appears to be poised for continued,
steady growth through 2017 and 2018. Total Personal Income is projected to increase
at a healthy rate as is the income generated by the state from total taxable sales (i.e.
spending by consumers). Additionally, the unemployment rate is projected to hold at
favorable levels. These factors alone point to a positive trend for consumer spending.
Consumer spending is the great engine that drives the California economy. Growth and
progress in these areas bodes well for California’s longer-term economic view.
// External Environmental Scan
// 33
Lake Tahoe Community College: Educational Master Plan
Based on the indicators, California’s economy is promising. Many regions in the state are close to regaining all of the jobs lost during the recession. Expanding the
gains to a larger share of the population is the next big step. Meeting this challenge will require attracting skilled workers to the state, increasing college enrollment and
completion rates, upgrading the state’s physical infrastructure, and carefully managing the state’s fi nances.
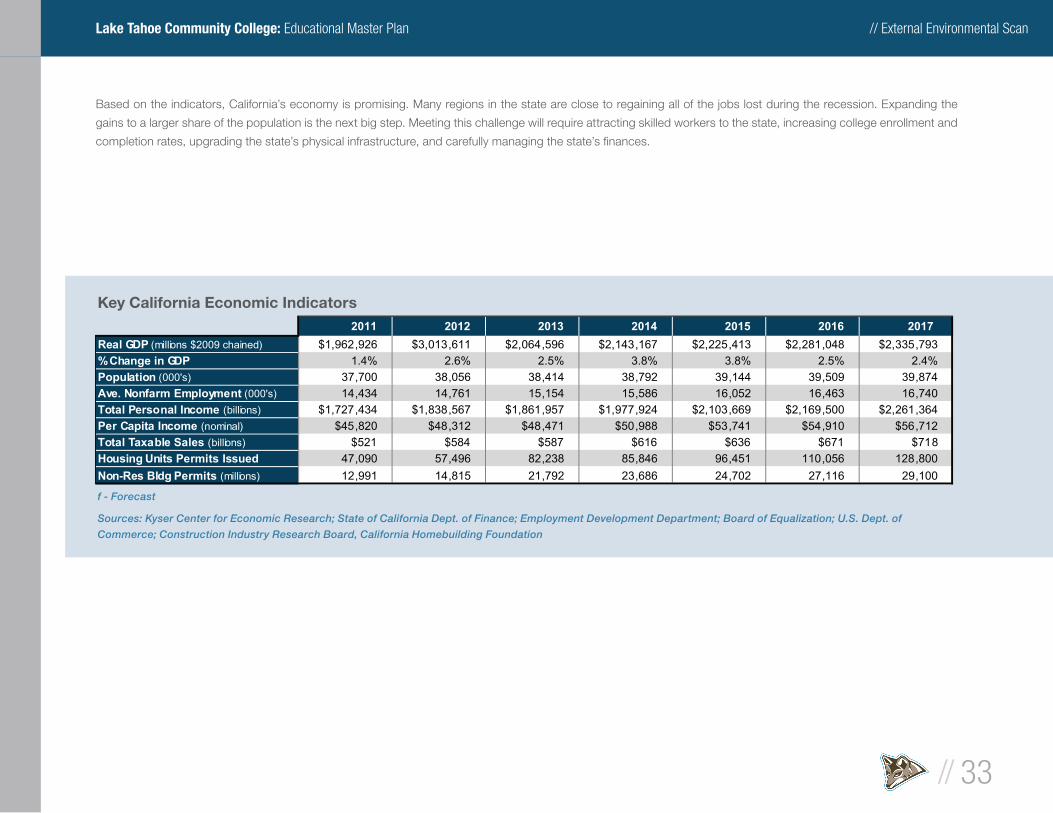
f - Forecast
Sources: Kyser Center for Economic Research; State of California Dept. of Finance; Employment Development Department; Board of Equalization; U.S. Dept. of
Commerce; Construction Industry Research Board, California Homebuilding Foundation
Key California Economic Indicators 2011 2012 2013 2014 2015 2016 2017
Real GDP (millions $2009 chained) $1,962,926 $3,013,611 $2,064,596 $2,143,167 $2,225,413 $2,281,048 $2,335,793% Change in GDP 1.4% 2.6% 2.5% 3.8% 3.8% 2.5% 2.4%Population (000's) 37,700 38,056 38,414 38,792 39,144 39,509 39,874Ave. Nonfarm Employment (000's) 14,434 14,761 15,154 15,586 16,052 16,463 16,740Total Personal Income (billions) $1,727,434 $1,838,567 $1,861,957 $1,977,924 $2,103,669 $2,169,500 $2,261,364Per Capita Income (nominal) $45,820 $48,312 $48,471 $50,988 $53,741 $54,910 $56,712Total Taxable Sales (billions) $521 $584 $587 $616 $636 $671 $718Housing Units Permits Issued 47,090 57,496 82,238 85,846 96,451 110,056 128,800Non-Res Bldg Permits (millions) 12,991 14,815 21,792 23,686 24,702 27,116 29,100
// External Environmental Scan
// 34
Lake Tahoe Community College: Educational Master Plan
The Local Economy & Region
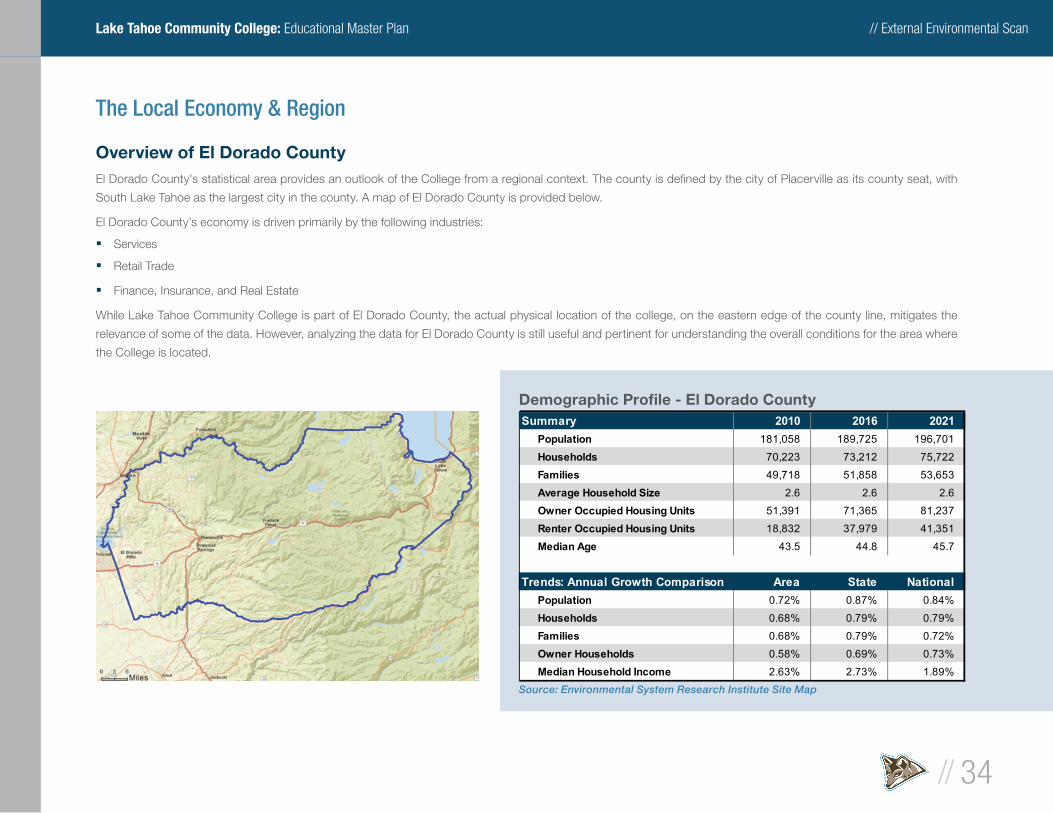
Overview of El Dorado CountyEl Dorado County's statistical area provides an outlook of the College from a regional context. The county is defi ned by the city of Placerville as its county seat, with
South Lake Tahoe as the largest city in the county. A map of El Dorado County is provided below.
El Dorado County’s economy is driven primarily by the following industries:
§ Services
§ Retail Trade
§ Finance, Insurance, and Real Estate
While Lake Tahoe Community College is part of El Dorado County, the actual physical location of the college, on the eastern edge of the county line, mitigates the
relevance of some of the data. However, analyzing the data for El Dorado County is still useful and pertinent for understanding the overall conditions for the area where
the College is located.
Source: Environmental System Research Institute Site Map
Demographic Profi le - El Dorado CountySummary 2010 2016 2021
Population 181,058 189,725 196,701
Households 70,223 73,212 75,722
Families 49,718 51,858 53,653
Average Household Size 2.6 2.6 2.6
Owner Occupied Housing Units 51,391 71,365 81,237
Renter Occupied Housing Units 18,832 37,979 41,351
Median Age 43.5 44.8 45.7
Trends: Annual Growth Comparison Area State NationalPopulation 0.72% 0.87% 0.84%
Households 0.68% 0.79% 0.79%
Families 0.68% 0.79% 0.72%
Owner Households 0.58% 0.69% 0.73%
Median Household Income 2.63% 2.73% 1.89%
// External Environmental Scan
// 35
Lake Tahoe Community College: Educational Master Plan
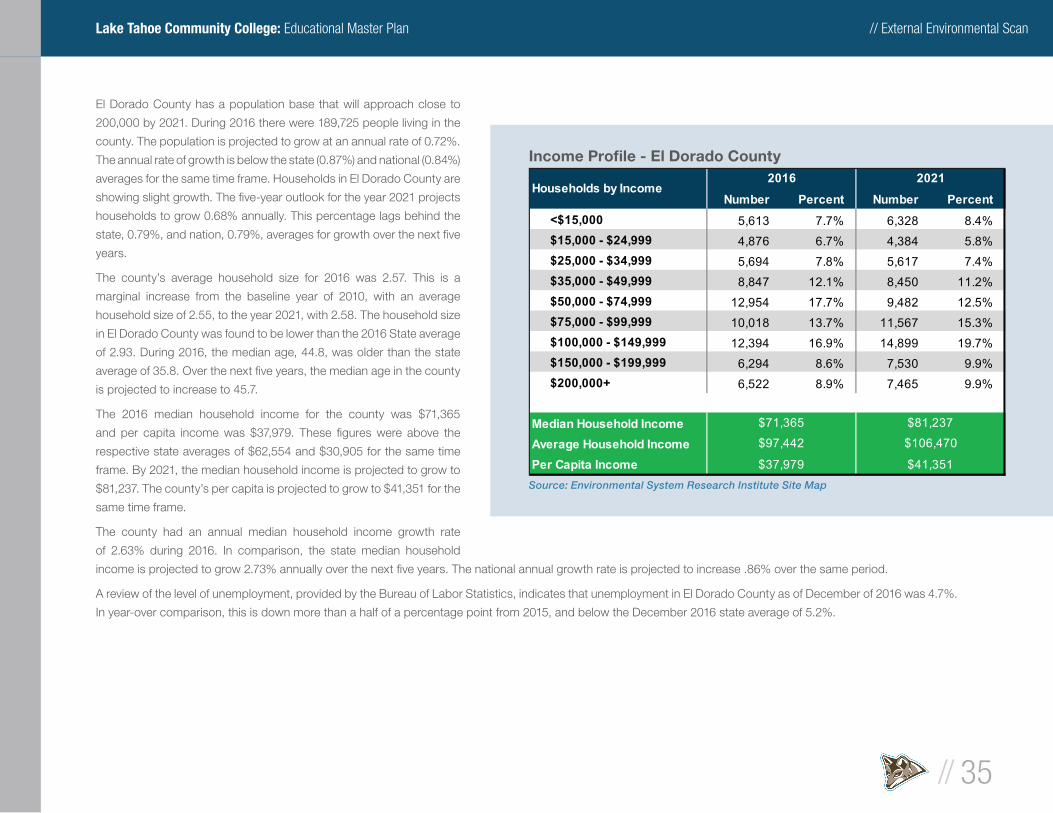
El Dorado County has a population base that will approach close to
200,000 by 2021. During 2016 there were 189,725 people living in the
county. The population is projected to grow at an annual rate of 0.72%.
The annual rate of growth is below the state (0.87%) and national (0.84%)
averages for the same time frame. Households in El Dorado County are
showing slight growth. The fi ve-year outlook for the year 2021 projects
households to grow 0.68% annually. This percentage lags behind the
state, 0.79%, and nation, 0.79%, averages for growth over the next fi ve
years.
The county’s average household size for 2016 was 2.57. This is a
marginal increase from the baseline year of 2010, with an average
household size of 2.55, to the year 2021, with 2.58. The household size
in El Dorado County was found to be lower than the 2016 State average
of 2.93. During 2016, the median age, 44.8, was older than the state
average of 35.8. Over the next fi ve years, the median age in the county
is projected to increase to 45.7.
The 2016 median household income for the county was $71,365
and per capita income was $37,979. These fi gures were above the
respective state averages of $62,554 and $30,905 for the same time
frame. By 2021, the median household income is projected to grow to
$81,237. The county’s per capita is projected to grow to $41,351 for the
same time frame.
The county had an annual median household income growth rate
of 2.63% during 2016. In comparison, the state median household
income is projected to grow 2.73% annually over the next fi ve years. The national annual growth rate is projected to increase .86% over the same period.
A review of the level of unemployment, provided by the Bureau of Labor Statistics, indicates that unemployment in El Dorado County as of December of 2016 was 4.7%.
In year-over comparison, this is down more than a half of a percentage point from 2015, and below the December 2016 state average of 5.2%.
Source: Environmental System Research Institute Site Map
Number Percent Number Percent<$15,000 5,613 7.7% 6,328 8.4%$15,000 - $24,999 4,876 6.7% 4,384 5.8%$25,000 - $34,999 5,694 7.8% 5,617 7.4%$35,000 - $49,999 8,847 12.1% 8,450 11.2%$50,000 - $74,999 12,954 17.7% 9,482 12.5%$75,000 - $99,999 10,018 13.7% 11,567 15.3%$100,000 - $149,999 12,394 16.9% 14,899 19.7%$150,000 - $199,999 6,294 8.6% 7,530 9.9%$200,000+ 6,522 8.9% 7,465 9.9%
Median Household IncomeAverage Household IncomePer Capita Income
Households by Income
$41,351
$71,365
$97,442
$37,979
20212016
$81,237
$106,470
Income Profi le - El Dorado County
// External Environmental Scan
// 36
Lake Tahoe Community College: Educational Master Plan
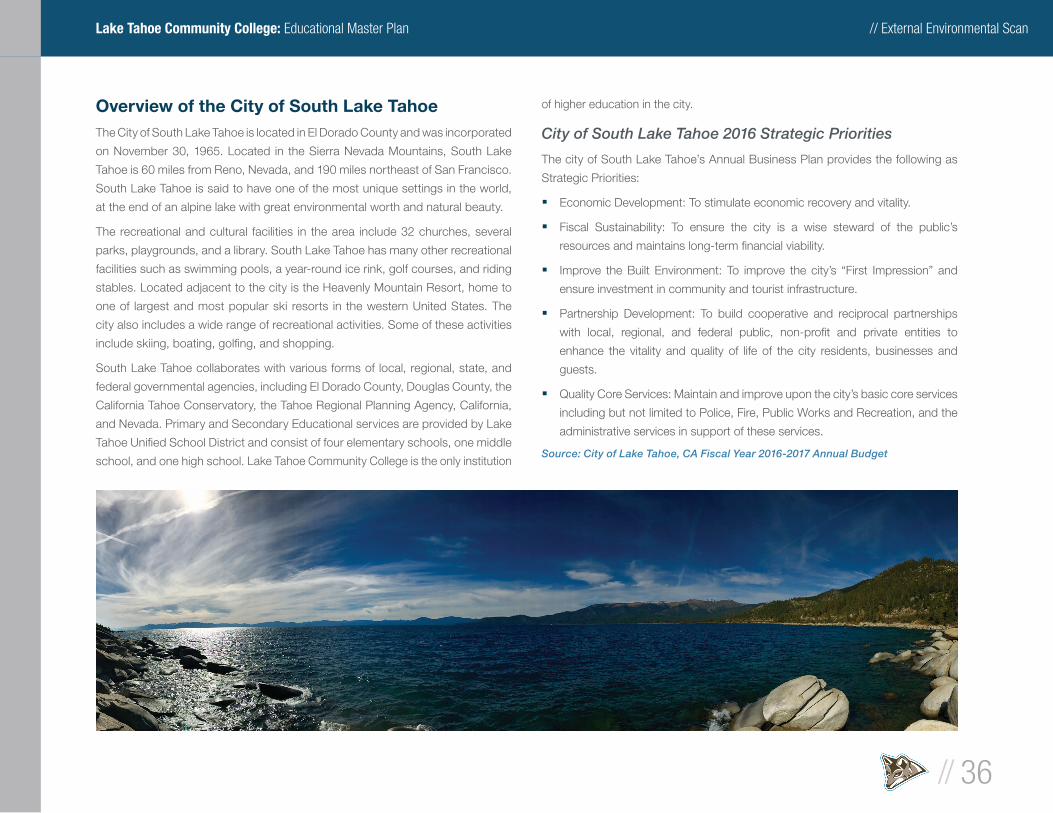
Overview of the City of South Lake TahoeThe City of South Lake Tahoe is located in El Dorado County and was incorporated
on November 30, 1965. Located in the Sierra Nevada Mountains, South Lake
Tahoe is 60 miles from Reno, Nevada, and 190 miles northeast of San Francisco.
South Lake Tahoe is said to have one of the most unique settings in the world,
at the end of an alpine lake with great environmental worth and natural beauty.
The recreational and cultural facilities in the area include 32 churches, several
parks, playgrounds, and a library. South Lake Tahoe has many other recreational
facilities such as swimming pools, a year-round ice rink, golf courses, and riding
stables. Located adjacent to the city is the Heavenly Mountain Resort, home to
one of largest and most popular ski resorts in the western United States. The
city also includes a wide range of recreational activities. Some of these activities
include skiing, boating, golfi ng, and shopping.
South Lake Tahoe collaborates with various forms of local, regional, state, and
federal governmental agencies, including El Dorado County, Douglas County, the
California Tahoe Conservatory, the Tahoe Regional Planning Agency, California,
and Nevada. Primary and Secondary Educational services are provided by Lake
Tahoe Unifi ed School District and consist of four elementary schools, one middle
school, and one high school. Lake Tahoe Community College is the only institution
of higher education in the city.
City of South Lake Tahoe 2016 Strategic Priorities
The city of South Lake Tahoe’s Annual Business Plan provides the following as
Strategic Priorities:
§ Economic Development: To stimulate economic recovery and vitality.
§ Fiscal Sustainability: To ensure the city is a wise steward of the public’s
resources and maintains long-term fi nancial viability.
§ Improve the Built Environment: To improve the city’s “First Impression” and
ensure investment in community and tourist infrastructure.
§ Partnership Development: To build cooperative and reciprocal partnerships
with local, regional, and federal public, non-profi t and private entities to
enhance the vitality and quality of life of the city residents, businesses and
guests.
§ Quality Core Services: Maintain and improve upon the city’s basic core services
including but not limited to Police, Fire, Public Works and Recreation, and the
administrative services in support of these services.
Source: City of Lake Tahoe, CA Fiscal Year 2016-2017 Annual Budget
// External Environmental Scan
// 37
Lake Tahoe Community College: Educational Master Plan
South Lake Tahoe Recreation and Tourism
There is an abundance of recreational opportunities in South Lake Tahoe that
are highly valued by residents and visitors, with the major drivers of the local
economy being recreational services. The Tahoe Regional Planning Agency
(TRPA) Bi-State Compact recognizes that “maintaining recreational values is
critical to the social and economic health of the Region.” As such, these resources
add to the quality of life in the South Lake Tahoe area. Tourism in South Lake
Tahoe has great economic impact on the future growth for the area. To illustrate,
in 2015, tourism state-wide brought in $121.2 billion in revenue and accounted
for $1.06 million jobs.
Outlined below are Key Accomplishments for Tahoe Regional Planning Agency
(TRPA) 2016:
§ Shoreline Strategic Initiative: Launched a consensus-based planning process
with the Consensus Building Institute a third-party mediation fi rm, to convene
stakeholders and identify major shoreline planning issues.
§ Developmental Rights Initiative: Work program, launched the initiative with a
stakeholder assessment to identify key issues and a work program that outline
budgets, schedules and a collaborative approach.
§ Transportation System: Adopted the 2016 Active Transportation Plan in
March. Outreach: more than 800 people, including 100 Hispanic community
members, provided input and ideas at public workshops for the 2017 update
of Regional Transportation.
§ Long Term Planning: At the recommendation of the Placer County Planning
Commission, with input from stakeholders throughout the basin including
the Tahoe Regional Planning Agency, the Tahoe Basin Area Plan and Tahoe
City Lodge Project were approved to promote environmental restoration and
responsible redevelopment of town centers.
§ Environmental Improvement Division: Co-led the Tahoe Interagency Executives
Steering Committee’s work to manage the Environmental Improvements
Program (EIP) and secure funding for restoration program.
§ Forest and Vegetation Management Program: Formed the Lake Tahoe Basin
Tree Mortality Force and developed an incident plan to coordinate work and
build partnerships to better address the advancing threat of bark beetles in the
Tahoe Basin.
§ Aquatic Resources Program: Treated 5.77 acres of invasive weeds at six
locations, Crystal Shores, the Truckee River, downstream of the dam in Tahoe
City, the lake side of the dam, Lakeside Beach, and Marina Fleur du Lac and
Glenbrook.
§ External Affairs: The passage of the Lake Tahoe Restoration Act in 2016 was
a major milestone for the Lake Tahoe region. TRPA played an integral role in
convening the partnerships essential to the bill’s successful outcome.
Source: Tahoe Regional Planning Agency (TRPA) 2016 Annual Report
Lake Tahoe Community College benefi ts from the area’s outdoor recreational
activities and tourism and the opportunities it presents to the College. The
popular Wilderness Education program provides growth potential because
of these natural resources unique to the region. Tourism continues to be a
major economic driver and also presents its own opportunities for the College
to partner with local businesses to develop and expand on those available
relationships. Both the outdoor recreation and tourism currently existing in the
College service area could assist in increasing the level of WSCH/ FTES with
additional course offerings and career opportunities for its students.
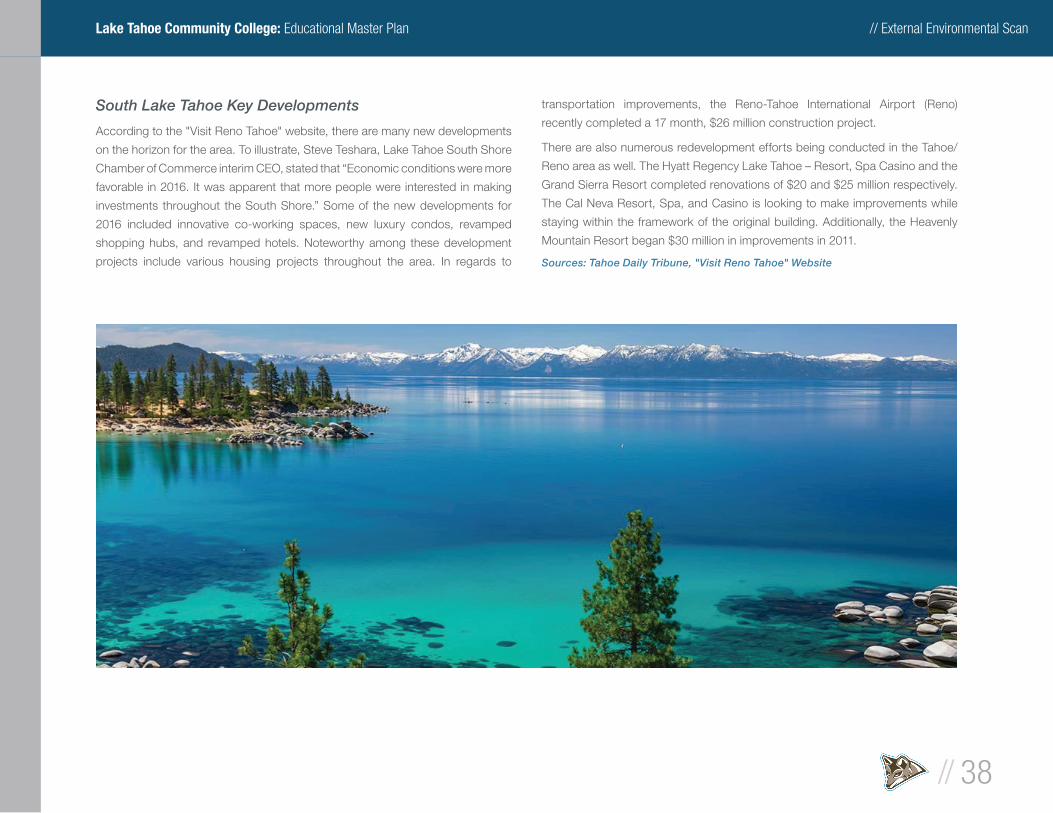
// External Environmental Scan
// 38
Lake Tahoe Community College: Educational Master Plan
South Lake Tahoe Key Developments
According to the "Visit Reno Tahoe" website, there are many new developments
on the horizon for the area. To illustrate, Steve Teshara, Lake Tahoe South Shore
Chamber of Commerce interim CEO, stated that “Economic conditions were more
favorable in 2016. It was apparent that more people were interested in making
investments throughout the South Shore.” Some of the new developments for
2016 included innovative co-working spaces, new luxury condos, revamped
shopping hubs, and revamped hotels. Noteworthy among these development
projects include various housing projects throughout the area. In regards to
transportation improvements, the Reno-Tahoe International Airport (Reno)
recently completed a 17 month, $26 million construction project.
There are also numerous redevelopment efforts being conducted in the Tahoe/
Reno area as well. The Hyatt Regency Lake Tahoe – Resort, Spa Casino and the
Grand Sierra Resort completed renovations of $20 and $25 million respectively.
The Cal Neva Resort, Spa, and Casino is looking to make improvements while
staying within the framework of the original building. Additionally, the Heavenly
Mountain Resort began $30 million in improvements in 2011.
Sources: Tahoe Daily Tribune, "Visit Reno Tahoe" Website
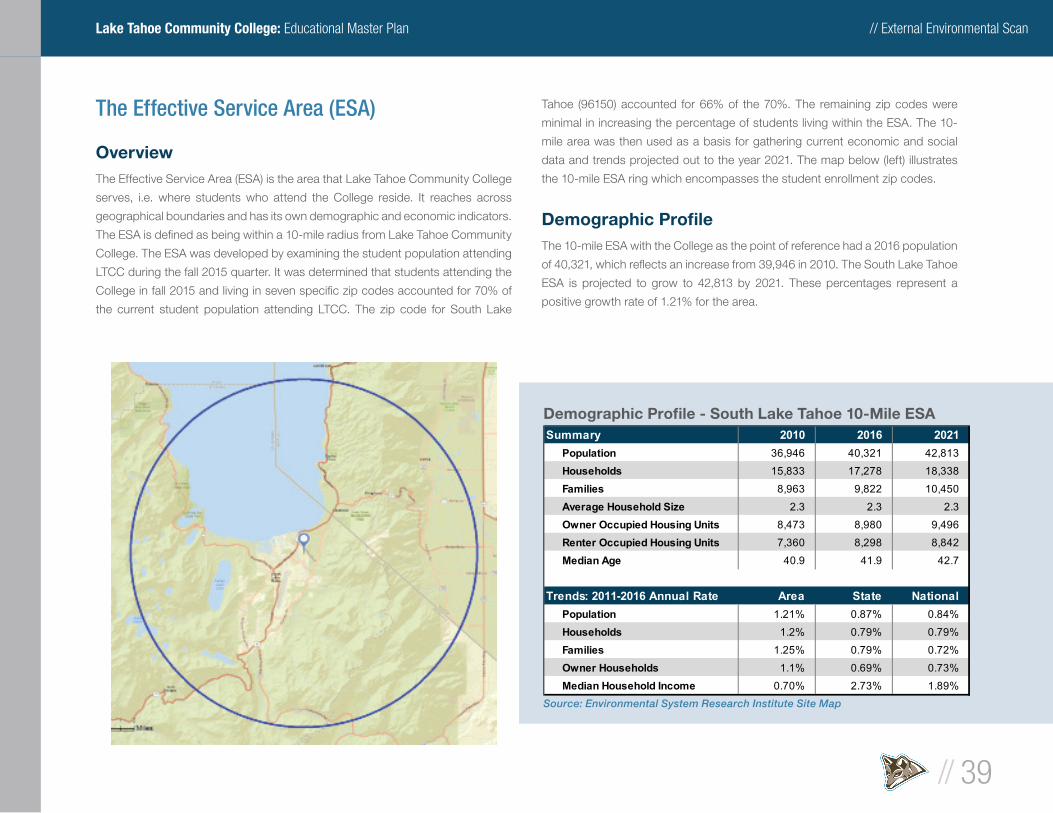
// External Environmental Scan
// 39
Lake Tahoe Community College: Educational Master Plan
The Effective Service Area (ESA)
OverviewThe Effective Service Area (ESA) is the area that Lake Tahoe Community College
serves, i.e. where students who attend the College reside. It reaches across
geographical boundaries and has its own demographic and economic indicators.
The ESA is defi ned as being within a 10-mile radius from Lake Tahoe Community
College. The ESA was developed by examining the student population attending
LTCC during the fall 2015 quarter. It was determined that students attending the
College in fall 2015 and living in seven specifi c zip codes accounted for 70% of
the current student population attending LTCC. The zip code for South Lake
Tahoe (96150) accounted for 66% of the 70%. The remaining zip codes were
minimal in increasing the percentage of students living within the ESA. The 10-
mile area was then used as a basis for gathering current economic and social
data and trends projected out to the year 2021. The map below (left) illustrates
the 10-mile ESA ring which encompasses the student enrollment zip codes.
Demographic Profi le The 10-mile ESA with the College as the point of reference had a 2016 population
of 40,321, which refl ects an increase from 39,946 in 2010. The South Lake Tahoe
ESA is projected to grow to 42,813 by 2021. These percentages represent a
positive growth rate of 1.21% for the area.
Source: Environmental System Research Institute Site Map
Demographic Profi le - South Lake Tahoe 10-Mile ESASummary 2010 2016 2021
Population 36,946 40,321 42,813
Households 15,833 17,278 18,338
Families 8,963 9,822 10,450
Average Household Size 2.3 2.3 2.3
Owner Occupied Housing Units 8,473 8,980 9,496
Renter Occupied Housing Units 7,360 8,298 8,842
Median Age 40.9 41.9 42.7
Trends: 2011-2016 Annual Rate Area State NationalPopulation 1.21% 0.87% 0.84%
Households 1.2% 0.79% 0.79%
Families 1.25% 0.79% 0.72%
Owner Households 1.1% 0.69% 0.73%
Median Household Income 0.70% 2.73% 1.89%
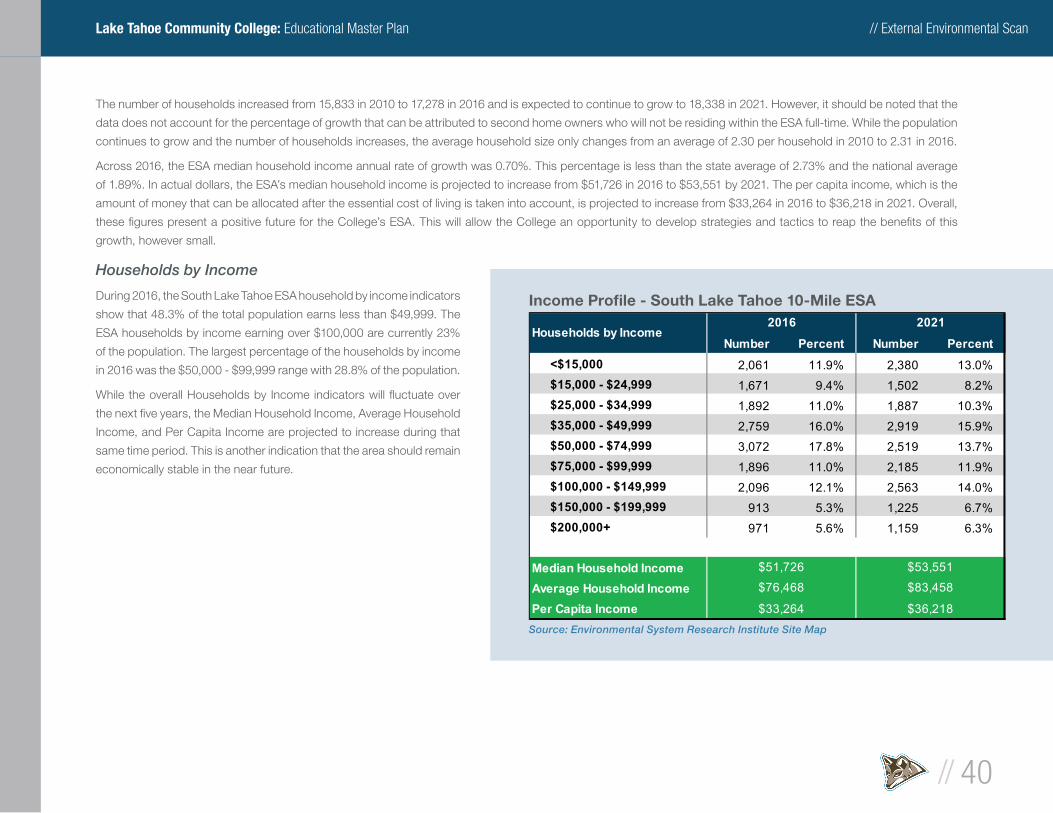
// External Environmental Scan
// 40
Lake Tahoe Community College: Educational Master Plan
The number of households increased from 15,833 in 2010 to 17,278 in 2016 and is expected to continue to grow to 18,338 in 2021. However, it should be noted that the
data does not account for the percentage of growth that can be attributed to second home owners who will not be residing within the ESA full-time. While the population
continues to grow and the number of households increases, the average household size only changes from an average of 2.30 per household in 2010 to 2.31 in 2016.
Across 2016, the ESA median household income annual rate of growth was 0.70%. This percentage is less than the state average of 2.73% and the national average
of 1.89%. In actual dollars, the ESA’s median household income is projected to increase from $51,726 in 2016 to $53,551 by 2021. The per capita income, which is the
amount of money that can be allocated after the essential cost of living is taken into account, is projected to increase from $33,264 in 2016 to $36,218 in 2021. Overall,
these fi gures present a positive future for the College’s ESA. This will allow the College an opportunity to develop strategies and tactics to reap the benefi ts of this
growth, however small.
Households by Income
During 2016, the South Lake Tahoe ESA household by income indicators
show that 48.3% of the total population earns less than $49,999. The
ESA households by income earning over $100,000 are currently 23%
of the population. The largest percentage of the households by income
in 2016 was the $50,000 - $99,999 range with 28.8% of the population.
While the overall Households by Income indicators will fl uctuate over
the next fi ve years, the Median Household Income, Average Household
Income, and Per Capita Income are projected to increase during that
same time period. This is another indication that the area should remain
economically stable in the near future.
Source: Environmental System Research Institute Site Map
Income Profi le - South Lake Tahoe 10-Mile ESA
Number Percent Number Percent<$15,000 2,061 11.9% 2,380 13.0%$15,000 - $24,999 1,671 9.4% 1,502 8.2%$25,000 - $34,999 1,892 11.0% 1,887 10.3%$35,000 - $49,999 2,759 16.0% 2,919 15.9%$50,000 - $74,999 3,072 17.8% 2,519 13.7%$75,000 - $99,999 1,896 11.0% 2,185 11.9%$100,000 - $149,999 2,096 12.1% 2,563 14.0%$150,000 - $199,999 913 5.3% 1,225 6.7%$200,000+ 971 5.6% 1,159 6.3%
Median Household IncomeAverage Household IncomePer Capita Income
$76,468 $83,458
$33,264 $36,218
Households by Income2016 2021
$51,726 $53,551
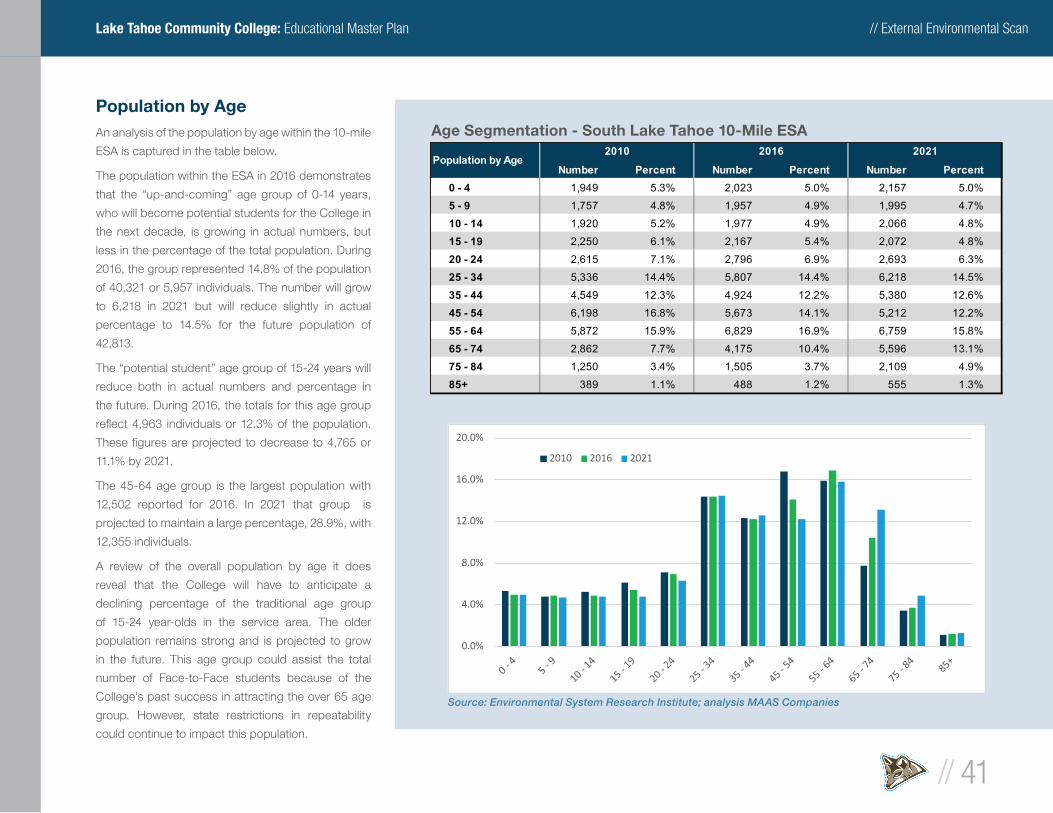
// External Environmental Scan
// 41
Lake Tahoe Community College: Educational Master Plan
Population by AgeAn analysis of the population by age within the 10-mile
ESA is captured in the table below.
The population within the ESA in 2016 demonstrates
that the “up-and-coming” age group of 0-14 years,
who will become potential students for the College in
the next decade, is growing in actual numbers, but
less in the percentage of the total population. During
2016, the group represented 14.8% of the population
of 40,321 or 5,957 individuals. The number will grow
to 6,218 in 2021 but will reduce slightly in actual
percentage to 14.5% for the future population of
42,813.
The “potential student” age group of 15-24 years will
reduce both in actual numbers and percentage in
the future. During 2016, the totals for this age group
refl ect 4,963 individuals or 12.3% of the population.
These fi gures are projected to decrease to 4,765 or
11.1% by 2021.
The 45-64 age group is the largest population with
12,502 reported for 2016. In 2021 that group is
projected to maintain a large percentage, 28.9%, with
12,355 individuals.
A review of the overall population by age it does
reveal that the College will have to anticipate a
declining percentage of the traditional age group
of 15-24 year-olds in the service area. The older
population remains strong and is projected to grow
in the future. This age group could assist the total
number of Face-to-Face students because of the
College’s past success in attracting the over 65 age
group. However, state restrictions in repeatability
could continue to impact this population.
Source: Environmental System Research Institute; analysis MAAS Companies
Number Percent Number Percent Number Percent0 - 4 1,949 5.3% 2,023 5.0% 2,157 5.0%
5 - 9 1,757 4.8% 1,957 4.9% 1,995 4.7%
10 - 14 1,920 5.2% 1,977 4.9% 2,066 4.8%
15 - 19 2,250 6.1% 2,167 5.4% 2,072 4.8%
20 - 24 2,615 7.1% 2,796 6.9% 2,693 6.3%
25 - 34 5,336 14.4% 5,807 14.4% 6,218 14.5%
35 - 44 4,549 12.3% 4,924 12.2% 5,380 12.6%
45 - 54 6,198 16.8% 5,673 14.1% 5,212 12.2%
55 - 64 5,872 15.9% 6,829 16.9% 6,759 15.8%
65 - 74 2,862 7.7% 4,175 10.4% 5,596 13.1%
75 - 84 1,250 3.4% 1,505 3.7% 2,109 4.9%
85+ 389 1.1% 488 1.2% 555 1.3%
2010 2016 2021Population by Age
0.0%
4.0%
8.0%
12.0%
16.0%
20.0%
2010 2016 2021
Age Segmentation - South Lake Tahoe 10-Mile ESA
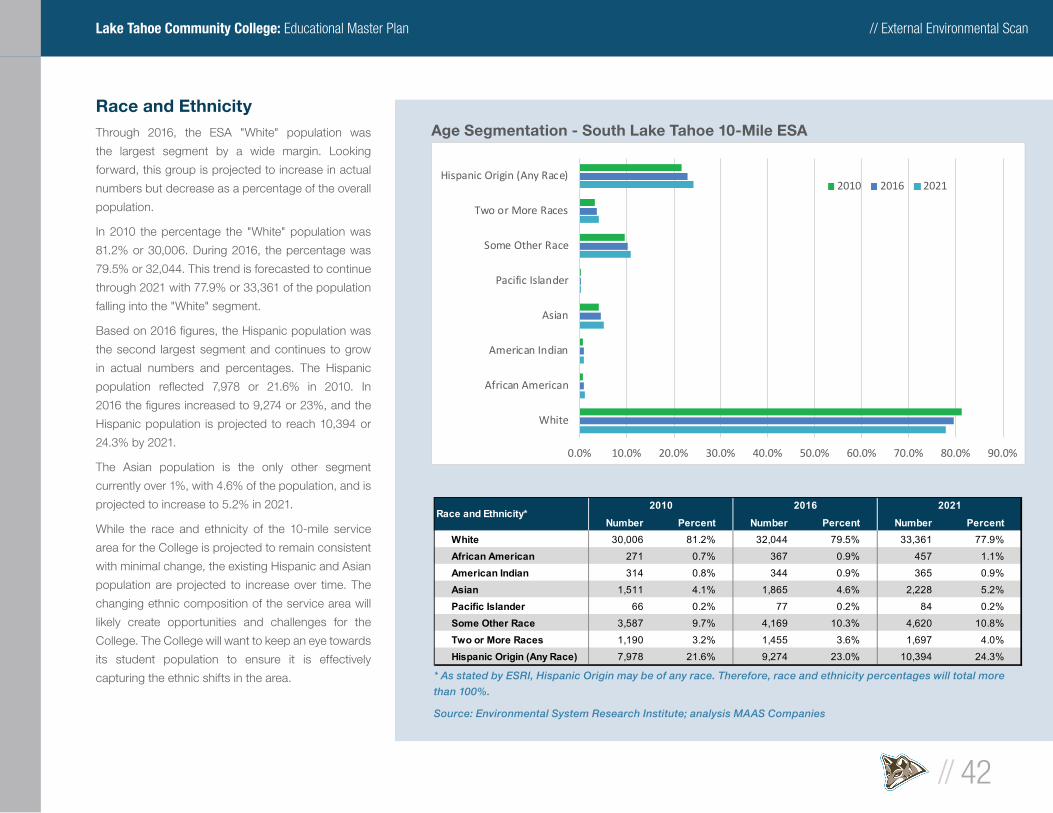
// External Environmental Scan
// 42
Lake Tahoe Community College: Educational Master Plan
Race and EthnicityThrough 2016, the ESA "White" population was
the largest segment by a wide margin. Looking
forward, this group is projected to increase in actual
numbers but decrease as a percentage of the overall
population.
In 2010 the percentage the "White" population was
81.2% or 30,006. During 2016, the percentage was
79.5% or 32,044. This trend is forecasted to continue
through 2021 with 77.9% or 33,361 of the population
falling into the "White" segment.
Based on 2016 fi gures, the Hispanic population was
the second largest segment and continues to grow
in actual numbers and percentages. The Hispanic
population refl ected 7,978 or 21.6% in 2010. In
2016 the fi gures increased to 9,274 or 23%, and the
Hispanic population is projected to reach 10,394 or
24.3% by 2021.
The Asian population is the only other segment
currently over 1%, with 4.6% of the population, and is
projected to increase to 5.2% in 2021.
While the race and ethnicity of the 10-mile service
area for the College is projected to remain consistent
with minimal change, the existing Hispanic and Asian
population are projected to increase over time. The
changing ethnic composition of the service area will
likely create opportunities and challenges for the
College. The College will want to keep an eye towards
its student population to ensure it is effectively
capturing the ethnic shifts in the area. * As stated by ESRI, Hispanic Origin may be of any race. Therefore, race and ethnicity percentages will total more
than 100%.
Source: Environmental System Research Institute; analysis MAAS Companies
Age Segmentation - South Lake Tahoe 10-Mile ESA
0.0% 10.0% 20.0% 30.0% 40.0% 50.0% 60.0% 70.0% 80.0% 90.0%
White
African American
American Indian
Asian
Pacific Islander
Some Other Race
Two or More Races
Hispanic Origin (Any Race)2010 2016 2021
Number Percent Number Percent Number PercentWhite 30,006 81.2% 32,044 79.5% 33,361 77.9%
African American 271 0.7% 367 0.9% 457 1.1%
American Indian 314 0.8% 344 0.9% 365 0.9%
Asian 1,511 4.1% 1,865 4.6% 2,228 5.2%
Pacific Islander 66 0.2% 77 0.2% 84 0.2%
Some Other Race 3,587 9.7% 4,169 10.3% 4,620 10.8%
Two or More Races 1,190 3.2% 1,455 3.6% 1,697 4.0%
Hispanic Origin (Any Race) 7,978 21.6% 9,274 23.0% 10,394 24.3%
Race and Ethnicity*2010 2016 2021
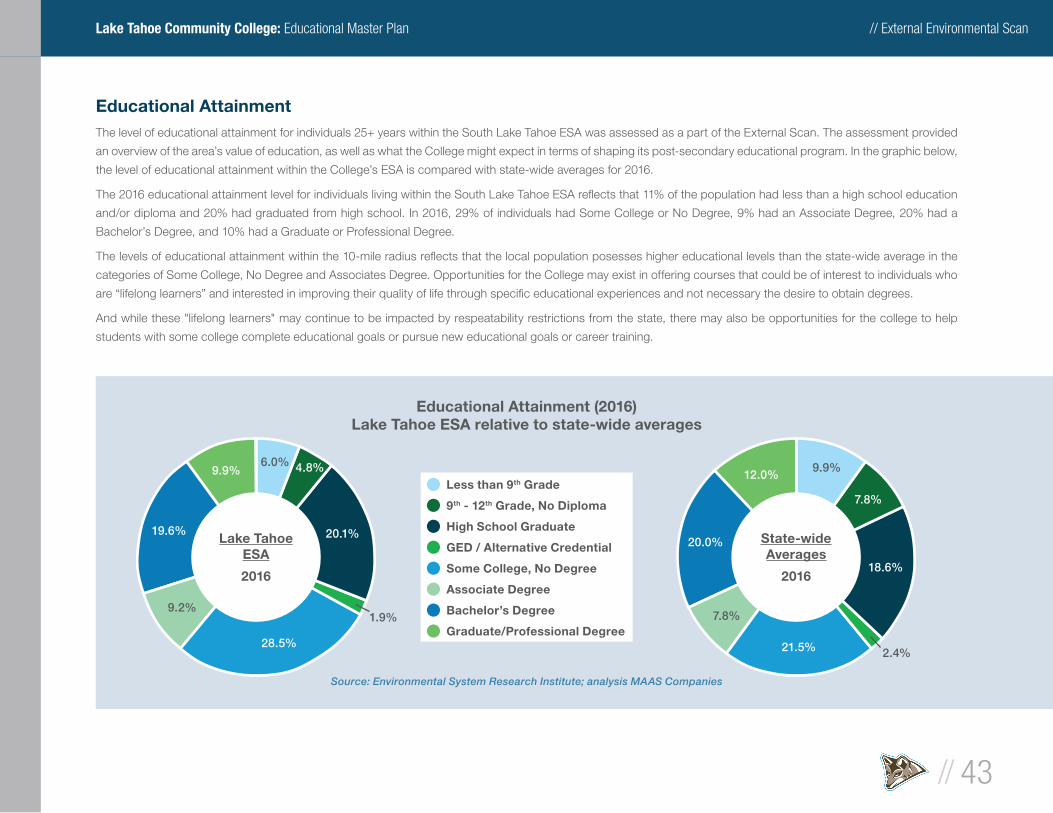
// External Environmental Scan
// 43
Lake Tahoe Community College: Educational Master Plan
Educational AttainmentThe level of educational attainment for individuals 25+ years within the South Lake Tahoe ESA was assessed as a part of the External Scan. The assessment provided
an overview of the area’s value of education, as well as what the College might expect in terms of shaping its post-secondary educational program. In the graphic below,
the level of educational attainment within the College’s ESA is compared with state-wide averages for 2016.
The 2016 educational attainment level for individuals living within the South Lake Tahoe ESA refl ects that 11% of the population had less than a high school education
and/or diploma and 20% had graduated from high school. In 2016, 29% of individuals had Some College or No Degree, 9% had an Associate Degree, 20% had a
Bachelor’s Degree, and 10% had a Graduate or Professional Degree.
The levels of educational attainment within the 10-mile radius refl ects that the local population posesses higher educational levels than the state-wide average in the
categories of Some College, No Degree and Associates Degree. Opportunities for the College may exist in offering courses that could be of interest to individuals who
are “lifelong learners” and interested in improving their quality of life through specifi c educational experiences and not necessary the desire to obtain degrees.
And while these "lifelong learners" may continue to be impacted by respeatability restrictions from the state, there may also be opportunities for the college to help
students with some college complete educational goals or pursue new educational goals or career training.
Less than 9th Grade
9th - 12th Grade, No Diploma
High School Graduate
GED / Alternative Credential
Some College, No Degree
Associate Degree
Bachelor’s Degree
Graduate/Professional Degree
State-wideAverages
2016
21.5%
20.0%
12.0%
7.8%
18.6%
7.8%
9.9%
2.4%
Lake TahoeESA
2016
4.8%
20.1%19.6%
9.9%
28.5%
9.2%1.9%
6.0%
Source: Environmental System Research Institute; analysis MAAS Companies
Educational Attainment (2016)Lake Tahoe ESA relative to state-wide averages
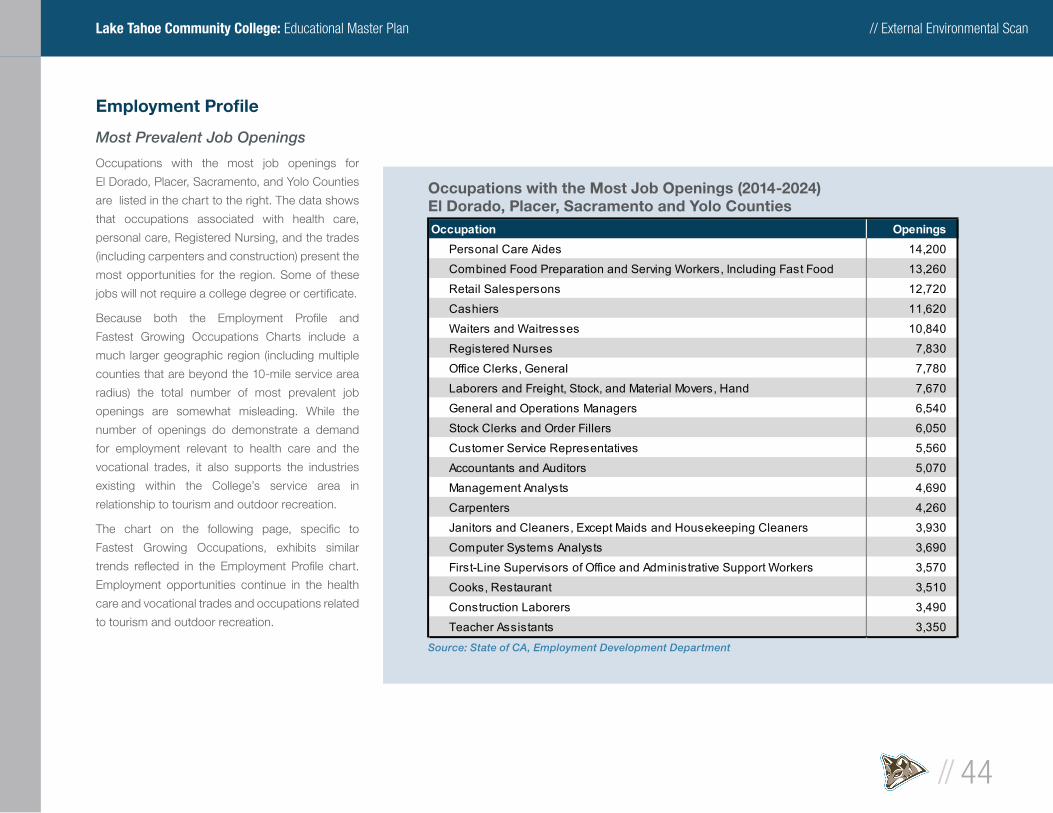
// External Environmental Scan
// 44
Lake Tahoe Community College: Educational Master Plan
Employment Profi le
Most Prevalent Job Openings
Occupations with the most job openings for
El Dorado, Placer, Sacramento, and Yolo Counties
are listed in the chart to the right. The data shows
that occupations associated with health care,
personal care, Registered Nursing, and the trades
(including carpenters and construction) present the
most opportunities for the region. Some of these
jobs will not require a college degree or certifi cate.
Because both the Employment Profi le and
Fastest Growing Occupations Charts include a
much larger geographic region (including multiple
counties that are beyond the 10-mile service area
radius) the total number of most prevalent job
openings are somewhat misleading. While the
number of openings do demonstrate a demand
for employment relevant to health care and the
vocational trades, it also supports the industries
existing within the College’s service area in
relationship to tourism and outdoor recreation.
The chart on the following page, specifi c to
Fastest Growing Occupations, exhibits similar
trends refl ected in the Employment Profi le chart.
Employment opportunities continue in the health
care and vocational trades and occupations related
to tourism and outdoor recreation.
Occupation OpeningsPersonal Care Aides 14,200
Combined Food Preparation and Serving Workers, Including Fast Food 13,260
Retail Salespersons 12,720
Cashiers 11,620
Waiters and Waitresses 10,840
Registered Nurses 7,830
Office Clerks, General 7,780
Laborers and Freight, Stock, and Material Movers, Hand 7,670
General and Operations Managers 6,540
Stock Clerks and Order Fillers 6,050
Customer Service Representatives 5,560
Accountants and Auditors 5,070
Management Analysts 4,690
Carpenters 4,260
Janitors and Cleaners, Except Maids and Housekeeping Cleaners 3,930
Computer Systems Analysts 3,690
First-Line Supervisors of Office and Administrative Support Workers 3,570
Cooks, Restaurant 3,510
Construction Laborers 3,490
Teacher Assistants 3,350
Source: State of CA, Employment Development Department
Occupations with the Most Job Openings (2014-2024)El Dorado, Placer, Sacramento and Yolo Counties
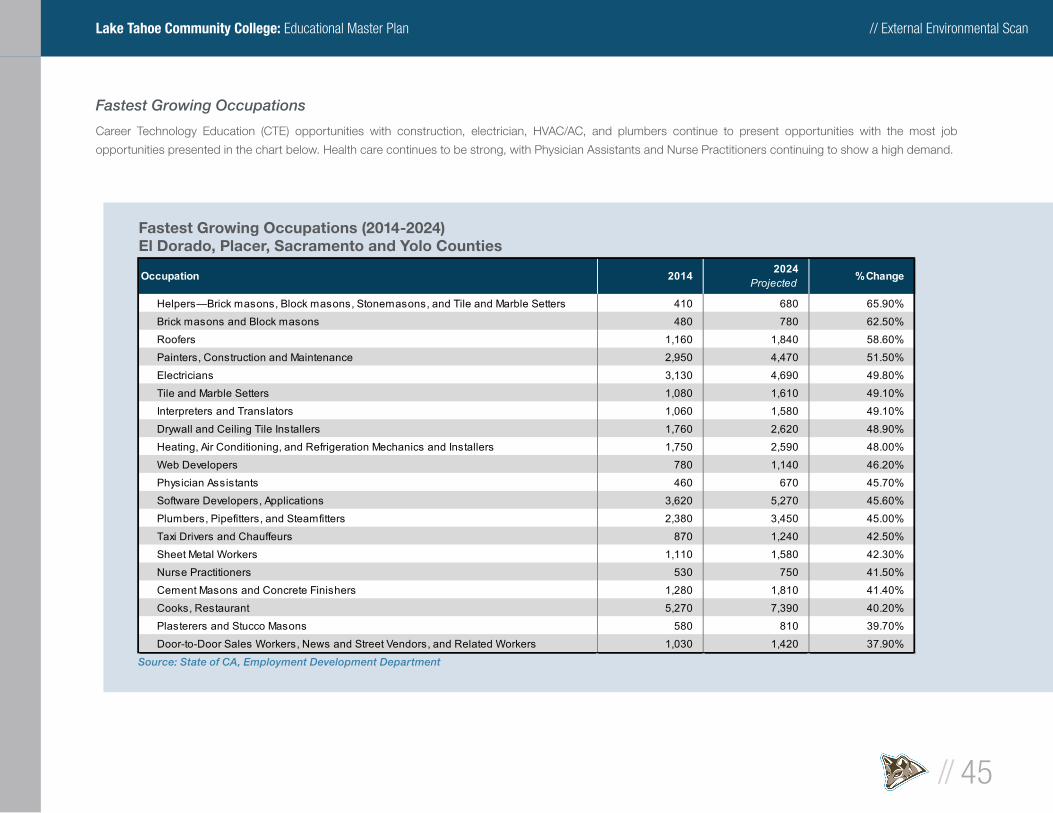
// External Environmental Scan
// 45
Lake Tahoe Community College: Educational Master Plan
Fastest Growing Occupations
Career Technology Education (CTE) opportunities with construction, electrician, HVAC/AC, and plumbers continue to present opportunities with the most job
opportunities presented in the chart below. Health care continues to be strong, with Physician Assistants and Nurse Practitioners continuing to show a high demand.
Source: State of CA, Employment Development Department
Fastest Growing Occupations (2014-2024)El Dorado, Placer, Sacramento and Yolo Counties
Helpers—Brick masons, Block masons, Stonemasons, and Tile and Marble Setters 410 680 65.90%
Brick masons and Block masons 480 780 62.50%
Roofers 1,160 1,840 58.60%
Painters, Construction and Maintenance 2,950 4,470 51.50%
Electricians 3,130 4,690 49.80%
Tile and Marble Setters 1,080 1,610 49.10%
Interpreters and Translators 1,060 1,580 49.10%
Drywall and Ceiling Tile Installers 1,760 2,620 48.90%
Heating, Air Conditioning, and Refrigeration Mechanics and Installers 1,750 2,590 48.00%
Web Developers 780 1,140 46.20%
Physician Assistants 460 670 45.70%
Software Developers, Applications 3,620 5,270 45.60%
Plumbers, Pipefitters, and Steamfitters 2,380 3,450 45.00%
Taxi Drivers and Chauffeurs 870 1,240 42.50%
Sheet Metal Workers 1,110 1,580 42.30%
Nurse Practitioners 530 750 41.50%
Cement Masons and Concrete Finishers 1,280 1,810 41.40%
Cooks, Restaurant 5,270 7,390 40.20%
Plasterers and Stucco Masons 580 810 39.70%
Door-to-Door Sales Workers, News and Street Vendors, and Related Workers 1,030 1,420 37.90%
Occupation 2014 2024Projected % Change
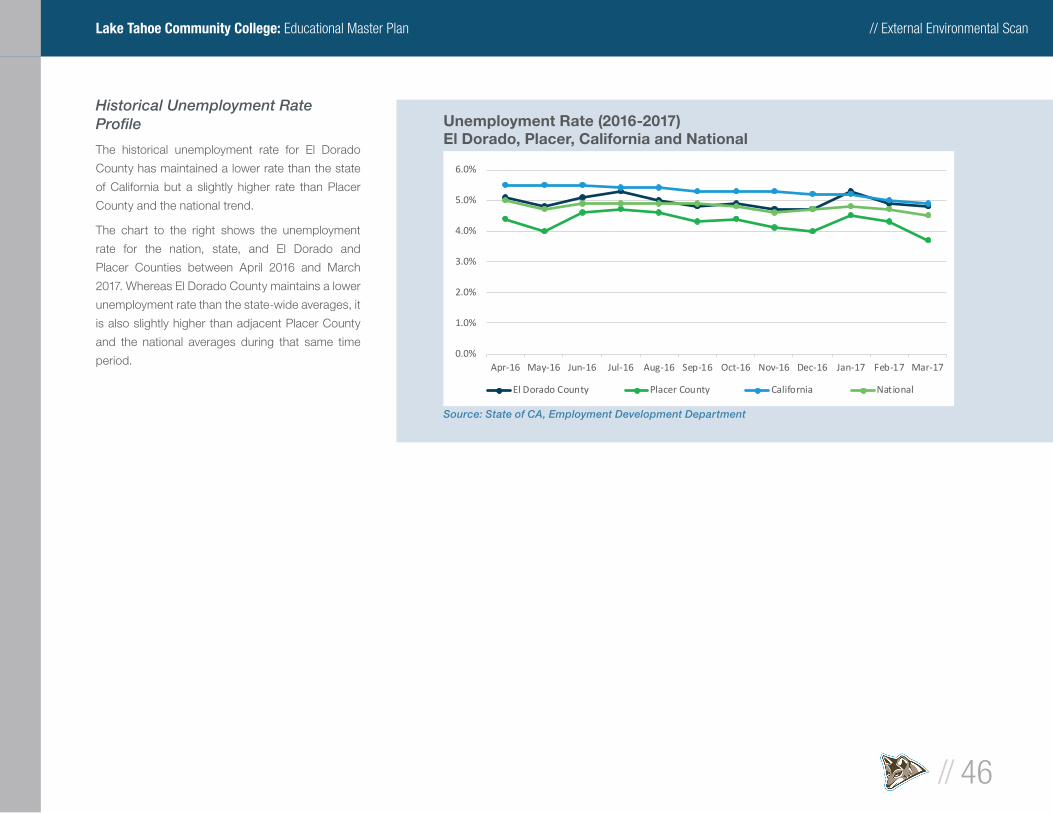
// External Environmental Scan
// 46
Lake Tahoe Community College: Educational Master Plan
Historical Unemployment Rate Profi le
The historical unemployment rate for El Dorado
County has maintained a lower rate than the state
of California but a slightly higher rate than Placer
County and the national trend.
The chart to the right shows the unemployment
rate for the nation, state, and El Dorado and
Placer Counties between April 2016 and March
2017. Whereas El Dorado County maintains a lower
unemployment rate than the state-wide averages, it
is also slightly higher than adjacent Placer County
and the national averages during that same time
period.0.0%
1.0%
2.0%
3.0%
4.0%
5.0%
6.0%
Apr-16 May-16 Jun-16 Jul-16 Aug-16 Sep-16 Oct-16 Nov-16 Dec-16 Jan-17 Feb-17 Mar-17
El Dorado County Placer County California National
Source: State of CA, Employment Development Department
Unemployment Rate (2016-2017)El Dorado, Placer, California and National
// External Environmental Scan
// 47
Lake Tahoe Community College: Educational Master Plan
SummaryThe economies of the United States and California are reported as stable. Unless
natural disasters or world events cause a devastating impact on the economic
markets, those two economies should not have a signifi cant adjustment that
would result in California Community Colleges being fi nancially impacted in the
near future.
The larger El Dorado County area was examined to identify any potential
opportunities or trends that would assist the College. Because of distance and
geographical boundaries presented by the larger county, opportunities specifi c
to the College were limited. The College’s unique location on the border of
Nevada and California was also reviewed, and it is determined that opportunities
are limited as well for attracting face-to-face students to LTCC. The most direct
impact on LTCC and its student population will come from the local region within
the 10-mile effective service area of the College.
The 10-mile radius represents the vast majority of students (70%) currently
attending LTCC with most of those students (66%) living within the City of South
Lake Tahoe. Industries and employment opportunities that are unique to the Lake
Tahoe area will continue to present the greatest opportunities for the College in
supporting course offerings.
The area population shows a minimal amount of overall growth with a larger
percentage of older individuals and less of the traditional age group that are
typical candidates to attend college. The area is generally well educated in
comparison to the state-wide averages for individuals attending college and
receiving some level of degrees.
Industries focusing on tourism and outdoor recreation dominate the area and
continue to present many opportunities for the College. Taking advantage of these
assets and continuing to partner with existing employers in providing assistance
in developing the local workforce and economy continue to be of value to the
College and ESA. Many of the employment opportunities in the fastest growing
segments may not require a college education, but jobs in the vocational fi elds
still desire a workforce that is improving itself through specifi c certifi cate training.
The opportunities specifi c to the College’s outdoor wilderness curriculum also
appear positive pertaining to future growth.
The external section of conditions associated with population, industry, and
employment opportunities combined with the internal review of the current
student population are key components in developing the potential growth rate
that is utilized in determining future curriculums, growth projections, and future
space needs.
// Unique Programs
// 48
Lake Tahoe Community College: Educational Master Plan
OverviewIn addition to traditional academic and vocational course offerings, Lake Tahoe
Community College provides a variety of nontraditional learning opportunities
across the spectrum of disciplines. These programs are unique because of the
format in which they are offered. Many emphasize hands on, experiential learning
experiences or are designed as short-term, intensive learning opportunities.
Also, some of these programs target particular learners for enriching educational
experiences.
ADVANCEADVANCE is a collaborative network of local organizations, government offi ces,
and employers working together to support adults in meeting educational, career,
and other personal goals. These goals can include completing a high school
credential, entering college or career training, improving current employment,
and even connecting job seekers with high-demand and local industry needs.
CONNECT - Community EducationCONNECT - Community Education is a Lake Tahoe Community College program
serving the community by providing educational workshops to meet the needs
and interests of both the young and young at heart who want to embark on
a new learning journey. The program was originally created to offer a solution
to repeatability restrictions for life-long learners and has grown exponentially to
serve the community of South Lake Tahoe. Workshops are offered in addition to
the College’s instructional programs; credits are not given for these workshops
and there are no grades or tests. The program is self-supporting and is not
funded by taxpayers’ dollars.
Foster and Kinship Care EducationLTCC offers not-for-credit workshops in Foster and Kinship Care Education
(FKCE). Workshops are offered in both English and Spanish. Both programs are
designed to support foster parents, relative caregivers, and non-relative caregivers.
Sessions consist of lectures, video segments, and dynamic group processes.
Topics focus on 1) parenting skills; 2) ages and stages of child development; 3)
accessing community resources; 4) positive discipline; 5) diversity training; and
6) other specialized topics regarding local issues. Registration is conducted on
a walk-in basis only.
Incarcerated Student ProgramThe Incarcerated Student Program (ISP) was fi rst approved as a pilot program
by LTCC’s Board of Trustees in 2015. In spring of 2017, LTCC’s Substantive
Change Proposal received approval from the Accrediting Commission for
Community and Junior Colleges (ACCJC). The Incarcerated Student Program
was introduced to serve inmates of California’s correctional facilities and promote
their educational success. Higher education provides inmates with a pathway to
a more productive future and a greater likelihood of post-release employment.
Incarcerated students can earn their Associate’s Degree for Transfer (AA-T) in
Sociology through an Enhanced One-On-One pedagogical approach facilitated
through Lake Tahoe Community College.
Intensive Spanish Summer InstituteEach August, Lake Tahoe Community College is transformed into a Mexican
pueblo offering students an immersion experience in Spanish language and
culture during the Intensive Spanish Summer Institute (ISSI). This exciting and
interactive program has been recognized as an Outstanding Community College
Program by the California Community College Board of Governors. ISSI is for
Unique Programs Offered by Lake Tahoe Community College
// Unique Programs
// 49
Lake Tahoe Community College: Educational Master Plan
anyone – from beginning to superior level students – interested in learning the
language and cultures of Spanish-speaking countries. During the week-long
Institute, students can earn up to 4.0 quarter units of credit in courses designed
to promote the development of fl uency in Spanish.
South Bay Regional Public Safety Training Consortium (JPA)As a member of the South Bay Regional Public Safety Training Consortium, Lake
Tahoe Community College offers courses for students who are interested in Fire
Science and related public safety careers. The Consortium is funded by member
colleges to provide vocational-specifi c training that may require special facilities
or training conditions, or are presented outside of the regular schedule of college
courses. The application and registration process is completed at the South Bay
Regional Public Safety Training Center located near Evergreen Valley College
in San Jose. Although open to the public, the majority of these courses are
intended to serve those who are already employed in the fi re service or related
public safety careers.
The 2014-2020 LTCC Facilities Master Plan includes a vision for a state-funded
capital project to construct a Regional Public Safety Training Center on the LTCC
campus. This instructional center will be designed to allow for the integration and
expansion of existing programs in support of Fire Science, Emergency Medical
Technician (EMT), Paramedic, Criminal Justice, and Wilderness Education.
Pending available funding, the proposed facility includes an active municipal
fi re station, which would provide opportunities to host on-site training for the
Fire Science, Fire Academy, and Fire Offi cer programs. This signifi cant fi nancial
investment on the part of the community and the college (through General
Obligation Bond Measure F) demonstrates the strong commitment to public
safety programs as a part of LTCC’s core mission and strategic priorities.
Continued support of the Consortium program is consistent with LTCC’s core
mission and priorities, touching on all four of the strategic issues identifi ed in the
college’s Strategic Plan.
Tahoe Parents Nursery SchoolTahoe Parents Nursery School (TPNS), affi liated with LTCC, is a parent
participation preschool that has been a part of the Lake Tahoe community for 48
years. TPNS is a fully licensed preschool serving children two years nine months
through fi ve years of age. The program operates Monday through Thursday from
9:00 a.m. to 12:00 noon, September through June. TPNS enriches the lives of
children and their families through a developmentally appropriate preschool,
which is enhanced by a quality parent education program. TPNS offers a wide
variety of experiences designed to enhance physical, social, emotional, and
cognitive development.
TRiO - Educational Talent Search ProgramEducational Talent Search (ETS) is a program designed to assist middle and high
school students on their journey to college. The program works to improve the
academic strengths and college readiness of students in grades 6-12. Adults who
have dropped out of high school or college and who are interested in reentering
school may also participate in ETS. The free services staff provide to eligible
students and their families include: educational counseling and support, tutoring,
workshops, fi eld trips, college tours, and more.
TRiO - Upward Bound ProgramUpward Bound (UB) is a program that provides fundamental support to high
school students in their preparation for college. The goal of UB is to increase
the rate at which participants complete high school and enroll in and graduate
from institutions of higher education. UB serves students between the ages of
13 and 19 and who are low income, potentially the fi rst in their families to go to
college, or at-risk youth. UB participants receive free tutoring, academic advising,
and workshops focusing on study skills, career exploration, fi nancial literacy,
and college application processes. In addition, the program offers instructional
support through Saturday and summer classes as well as trips to four-year
colleges.
// Instructional Areas
// 50
Lake Tahoe Community College: Educational Master Plan
OverviewThe following are the instructional areas offered at Lake Tahoe Community College. If a degree or certifi cate is associated with the area, it is noted, and the
Student Learning Outcomes are listed in the LTCC Catalog.
Academic Programs
Addiction Studies
Overview
The Addiction Studies degree is designed to prepare students for entry-
level employment in alcohol and drug treatment programs and to provide
continuing education for health care and human services professionals. The
curriculum provides a broad base of knowledge regarding approaches to drug
education and prevention, treatment issues, counseling skills, ethical issues,
and practical knowledge about drugs and their effects. Students will gain basic
competencies in counseling, case management, record keeping, and treatment
planning. The Addiction Studies program includes core courses in psychology,
sociology, and counseling provide students with a broad understanding of
the roots of addiction. When combined with nine units of fi eld experience, the
Addiction Studies program meets the education requirements established by
the California Consortium for Addiction Programs and Professionals (CCAPP).
Department Considerations
The Addiction Studies program is designed to provide training, background and
fi eldwork in substance use disorders counseling, and to prepare students to
begin entry-level jobs in the fi eld to earn practical hours before sitting for one of
the state certifying exams through the California Association for Alcohol and Drug
Educators (CAADE). The Addiction Studies program is also certifi ed by CAADE.
The body that registers and certifi es addiction treatment counselors for the state
(the Addiction Counselor Certifi cation Board of California-ACCBC) for CAADE-
approved schools has lost its accreditation as of December 1, 2107. Regulation
specifi es that an alcohol and other drug counselor registered or certifi ed with a
certifi cation organization that is no longer approved by the Department of Health
Care Services (DHCS) must register with one of the other DHCS approved
certifying organizations within six (6) months of receiving written notifi cation or
prior to the expiration of his/her certifi cation (whichever is sooner). As of December
2017, the leadership of CAADE, ACCBC, and CCAPP have initiated meetings to
make sure the transfer process is effi cient, and to ensure that every counselor
is recognized for his or her level of education and experience. All organizations
are confi dent that registrations and certifi cations can be transferred successfully
within the six-month requirement imposed by DHCS.
Instructional Areas
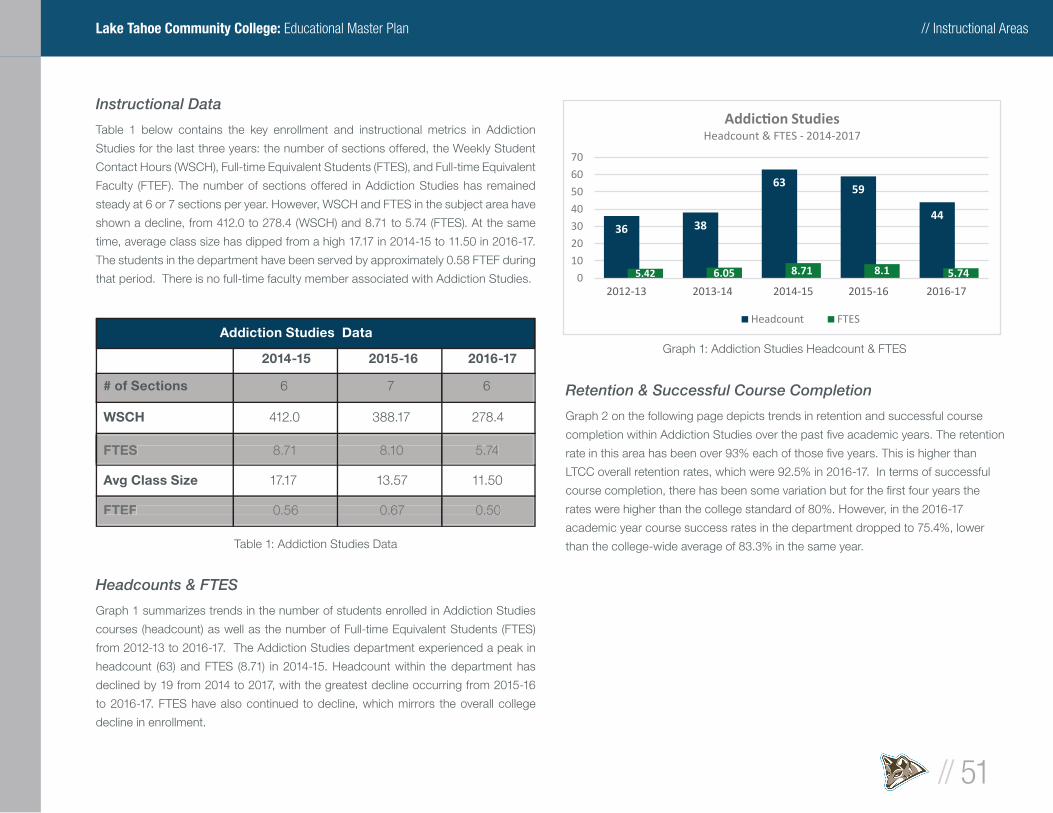
// Instructional Areas
// 51
Lake Tahoe Community College: Educational Master Plan
Instructional Data
Table 1 below contains the key enrollment and instructional metrics in Addiction
Studies for the last three years: the number of sections offered, the Weekly Student
Contact Hours (WSCH), Full-time Equivalent Students (FTES), and Full-time Equivalent
Faculty (FTEF). The number of sections offered in Addiction Studies has remained
steady at 6 or 7 sections per year. However, WSCH and FTES in the subject area have
shown a decline, from 412.0 to 278.4 (WSCH) and 8.71 to 5.74 (FTES). At the same
time, average class size has dipped from a high 17.17 in 2014-15 to 11.50 in 2016-17.
The students in the department have been served by approximately 0.58 FTEF during
that period. There is no full-time faculty member associated with Addiction Studies.
Headcounts & FTES
Graph 1 summarizes trends in the number of students enrolled in Addiction Studies
courses (headcount) as well as the number of Full-time Equivalent Students (FTES)
from 2012-13 to 2016-17. The Addiction Studies department experienced a peak in
headcount (63) and FTES (8.71) in 2014-15. Headcount within the department has
declined by 19 from 2014 to 2017, with the greatest decline occurring from 2015-16
to 2016-17. FTES have also continued to decline, which mirrors the overall college
decline in enrollment.
Retention & Successful Course Completion
Graph 2 on the following page depicts trends in retention and successful course
completion within Addiction Studies over the past fi ve academic years. The retention
rate in this area has been over 93% each of those fi ve years. This is higher than
LTCC overall retention rates, which were 92.5% in 2016-17. In terms of successful
course completion, there has been some variation but for the fi rst four years the
rates were higher than the college standard of 80%. However, in the 2016-17
academic year course success rates in the department dropped to 75.4%, lower
than the college-wide average of 83.3% in the same year.
Addiction Studies Data
2014-15 2015-16 2016-17
# of Sections 6 7 6
WSCH 412.0 388.17 278.4
FTES 8.71 8.10 5.74
Avg Class Size 17.17 13.57 11.50
FTEF 0.56 0.67 0.50
FTESFTES 8.71 8.10 5.74 8.71 8.10 5.74 8.71 8.10 5.74 8.71 8.10 5.74 8.71 8.10 5.74 8.71 8.10 5.74 8.71 8.10 5.74 8.71 8.10 5.74
FTEFFTEF 0.56 0.67 0.50 0.56 0.67 0.50 0.56 0.67 0.50 0.56 0.67 0.50 0.56 0.67 0.50 0.56 0.67 0.50 0.56 0.67 0.50 0.56 0.67 0.50
36 38
63 59
44
5.42 6.05 8.71 8.1 5.740
10
20
30
40
50
60
70
2012-132 013-14 2014-152 015-16 2016-17
Headcount & FTES - 2014-2017
Headcount FTES
Table 1: Addiction Studies Data
Graph 1: Addiction Studies Headcount & FTES
2012-13 2013-14 2014-15 2015-16 2016-17
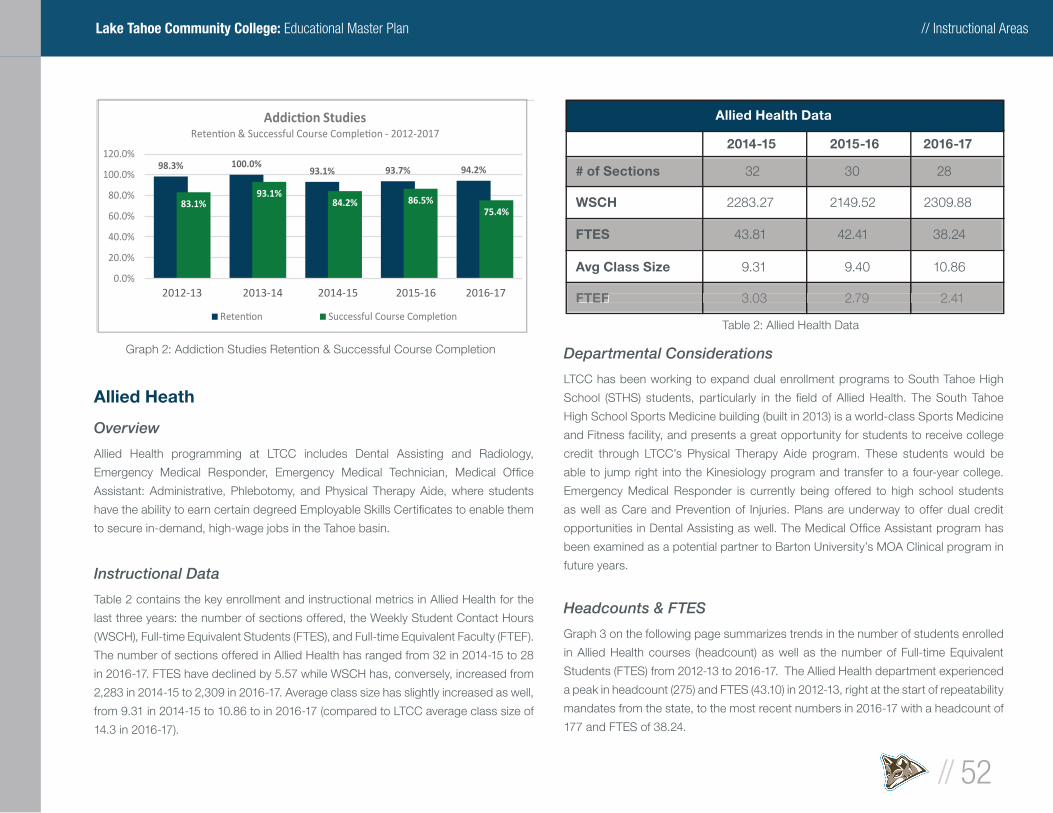
// Instructional Areas
// 52
Lake Tahoe Community College: Educational Master Plan
Allied Heath
Overview
Allied Health programming at LTCC includes Dental Assisting and Radiology,
Emergency Medical Responder, Emergency Medical Technician, Medical Offi ce
Assistant: Administrative, Phlebotomy, and Physical Therapy Aide, where students
have the ability to earn certain degreed Employable Skills Certifi cates to enable them
to secure in-demand, high-wage jobs in the Tahoe basin.
Instructional Data
Table 2 contains the key enrollment and instructional metrics in Allied Health for the
last three years: the number of sections offered, the Weekly Student Contact Hours
(WSCH), Full-time Equivalent Students (FTES), and Full-time Equivalent Faculty (FTEF).
The number of sections offered in Allied Health has ranged from 32 in 2014-15 to 28
in 2016-17. FTES have declined by 5.57 while WSCH has, conversely, increased from
2,283 in 2014-15 to 2,309 in 2016-17. Average class size has slightly increased as well,
from 9.31 in 2014-15 to 10.86 to in 2016-17 (compared to LTCC average class size of
14.3 in 2016-17).
Departmental Considerations
LTCC has been working to expand dual enrollment programs to South Tahoe High
School (STHS) students, particularly in the fi eld of Allied Health. The South Tahoe
High School Sports Medicine building (built in 2013) is a world-class Sports Medicine
and Fitness facility, and presents a great opportunity for students to receive college
credit through LTCC’s Physical Therapy Aide program. These students would be
able to jump right into the Kinesiology program and transfer to a four-year college.
Emergency Medical Responder is currently being offered to high school students
as well as Care and Prevention of Injuries. Plans are underway to offer dual credit
opportunities in Dental Assisting as well. The Medical Offi ce Assistant program has
been examined as a potential partner to Barton University’s MOA Clinical program in
future years.
Headcounts & FTES
Graph 3 on the following page summarizes trends in the number of students enrolled
in Allied Health courses (headcount) as well as the number of Full-time Equivalent
Students (FTES) from 2012-13 to 2016-17. The Allied Health department experienced
a peak in headcount (275) and FTES (43.10) in 2012-13, right at the start of repeatability
mandates from the state, to the most recent numbers in 2016-17 with a headcount of
177 and FTES of 38.24.
98.3% 100.0%93.1% 93.7% 94.2%
83.1%93.1%
84.2% 86.5%75.4%
0.0%
20.0%
40.0%
60.0%
80.0%
100.0%
120.0%
2012-132 013-14 2014-152 015-16 2016-17
- 2012-2017
Graph 2: Addiction Studies Retention & Successful Course Completion
Allied Health Data
2014-15 2015-16 2016-17
# of Sections 32 30 28
WSCH 2283.27 2149.52 2309.88
FTES 43.81 42.41 38.24
Avg Class Size 9.31 9.40 10.86
FTEF 3.03 2.79 2.41FTEFFTEF 3.03 2.79 2.41 3.03 2.79 2.41 3.03 2.79 2.41 3.03 2.79 2.41 3.03 2.79 2.41 3.03 2.79 2.41 3.03 2.79 2.41 3.03 2.79 2.41
Table 2: Allied Health Data
2012-13 2013-14 2014-15 2015-16 2016-17

// Instructional Areas
// 53
Lake Tahoe Community College: Educational Master Plan
Retention & Successful Course Completion
Graph 4 below depicts trends in retention and successful course completion within
Allied Health over the past fi ve academic years. Retention rates in Allied Health have
been over 95% in all fi ve years, compared with overall LTCC retention rates of 92.5%
in 2016-17. In terms of successful course completion, Allied Health is similarly strong
over the last fi ve years, from a low of 86% in 2012-13 to 93.4% in 2016-17 (vs. a
college-wide average of 83.3% for 2016-17).
Anthropology
Overview
The Anthropology department provides students with an introduction to the fi eld
of anthropology—cultural, physical/biological, archaeology, and anthropological
linguistics—with an emphasis on the applications of the discipline to contexts of
everyday life. Anthropology is very relevant as it offers students a perspective of
understanding humans from the past and the present. The curriculum provides
a strong social sciences foundation applicable to many undergraduate programs,
and prepares students for a broad range of public and private sector employment in
anthropology-related fi elds.
Instructional Data
Table 3 below contains the key enrollment and instructional metrics in Anthropology
for the last three years: the number of sections offered, the Weekly Student Contact
Hours (WSCH), Full-time Equivalent Students (FTES), and Full-time Equivalent Faculty
(FTEF). The number of sections offered in the department has remained steady at 14
for each of the past two years. The department WSCH has declined year over year
from 1,044 in 2014-15 to 856 in 2016-17. However, during this same time period there
was a slight increase in both FTES and average class size in 2015-16, followed by a
drop from 25.79 to 22.58 (FTES) and 22.0 to 20.07 (average class size). With one full-
time faculty member in Anthropology and Sociology, the overall FTEF in Anthropology
has declined from 1.41 in 2014-15 to 1.16 in 2016-17.
275242
218 230
177
43.1 48.2 43.814 2.41 38.240
50
100
150
200
250
300
2012-132 013-14 2014-152 015-16 2016-17
Allied HealthHeadcount & FTES - 2014-2017
Headcount FTES
Graph 3: Allied Health Headcount & FTES
Graph 4: Allied Health Retention & Successful Course Completion
Anthropology Data
2014-15 2015-16 2016-17
# of Sections 16 14 14
WSCH 1044.0 972.0 856.0
FTES 24.27 25.43 22.58
Avg Class Size 18.25 22.0 20.07
FTEF 1.41 1.21 1.16
FTESFTES 24.27 25.43 22.58 24.27 25.43 22.58 24.27 25.43 22.58 24.27 25.43 22.58 24.27 25.43 22.58 24.27 25.43 22.58 24.27 25.43 22.58 24.27 25.43 22.58
# of Sections# of Sections 16 14 14 16 14 14 16 14 14 16 14 14 16 14 14 16 14 14 16 14 14 16 14 14
FTEFFTEF 1.41 1.21 1.16 1.41 1.21 1.16 1.41 1.21 1.16 1.41 1.21 1.16 1.41 1.21 1.16 1.41 1.21 1.16 1.41 1.21 1.16 1.41 1.21 1.16
Table 3: Anthropology Data
» 2012-13 2013-14 2014-15 2015-16 2016-17
» 2012-13 2013-14 2014-15 2015-16 2016-17
4
95.4% 96.4% 95.0% 95.7% 96.6%
86.0%90.4% 94.0% 93.3% 93.4%
0.0%
20.0%
40.0%
60.0%
80.0%
100.0%
2012-132 013-14 2014-152 015-16 2016-17
Allied Health- 2012-2017
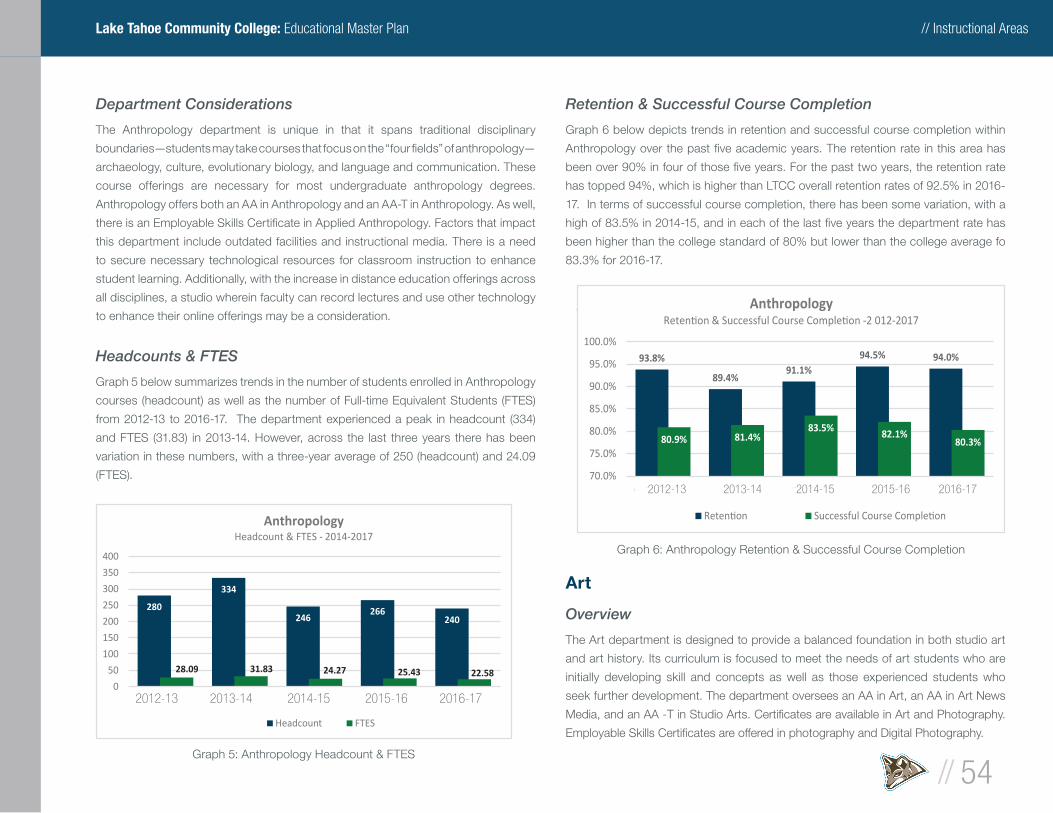
// Instructional Areas
// 54
Lake Tahoe Community College: Educational Master Plan
Department Considerations
The Anthropology department is unique in that it spans traditional disciplinary
boundaries—students may take courses that focus on the “four fi elds” of anthropology—
archaeology, culture, evolutionary biology, and language and communication. These
course offerings are necessary for most undergraduate anthropology degrees.
Anthropology offers both an AA in Anthropology and an AA-T in Anthropology. As well,
there is an Employable Skills Certifi cate in Applied Anthropology. Factors that impact
this department include outdated facilities and instructional media. There is a need
to secure necessary technological resources for classroom instruction to enhance
student learning. Additionally, with the increase in distance education offerings across
all disciplines, a studio wherein faculty can record lectures and use other technology
to enhance their online offerings may be a consideration.
Headcounts & FTES
Graph 5 below summarizes trends in the number of students enrolled in Anthropology
courses (headcount) as well as the number of Full-time Equivalent Students (FTES)
from 2012-13 to 2016-17. The department experienced a peak in headcount (334)
and FTES (31.83) in 2013-14. However, across the last three years there has been
variation in these numbers, with a three-year average of 250 (headcount) and 24.09
(FTES).
Retention & Successful Course Completion
Graph 6 below depicts trends in retention and successful course completion within
Anthropology over the past fi ve academic years. The retention rate in this area has
been over 90% in four of those fi ve years. For the past two years, the retention rate
has topped 94%, which is higher than LTCC overall retention rates of 92.5% in 2016-
17. In terms of successful course completion, there has been some variation, with a
high of 83.5% in 2014-15, and in each of the last fi ve years the department rate has
been higher than the college standard of 80% but lower than the college average fo
83.3% for 2016-17.
Art
Overview
The Art department is designed to provide a balanced foundation in both studio art
and art history. Its curriculum is focused to meet the needs of art students who are
initially developing skill and concepts as well as those experienced students who
seek further development. The department oversees an AA in Art, an AA in Art News
Media, and an AA -T in Studio Arts. Certifi cates are available in Art and Photography.
Employable Skills Certifi cates are offered in photography and Digital Photography.
280
334
246266
240
28.09 31.83 24.27 25.43 22.580
50
100
150
200
250
300
350
400
2012-132 013-14 2014-152 015-16 2016-17
AnthropologyHeadcount & FTES - 2014-2017
Headcount FTES
Graph 5: Anthropology Headcount & FTES
93.8%
89.4%91.1%
94.5% 94.0%
80.9% 81.4%83.5% 82.1%
80.3%
70.0%
75.0%
80.0%
85.0%
90.0%
95.0%
100.0%
2012-132 013-14 2014-152 015-16 2016-17
Anthropology-2 012-2017
Graph 6: Anthropology Retention & Successful Course Completion
» 2012-13 2013-14 2014-15 2015-16 2016-17
» 2012-13 2013-14 2014-15 2015-16 2016-17
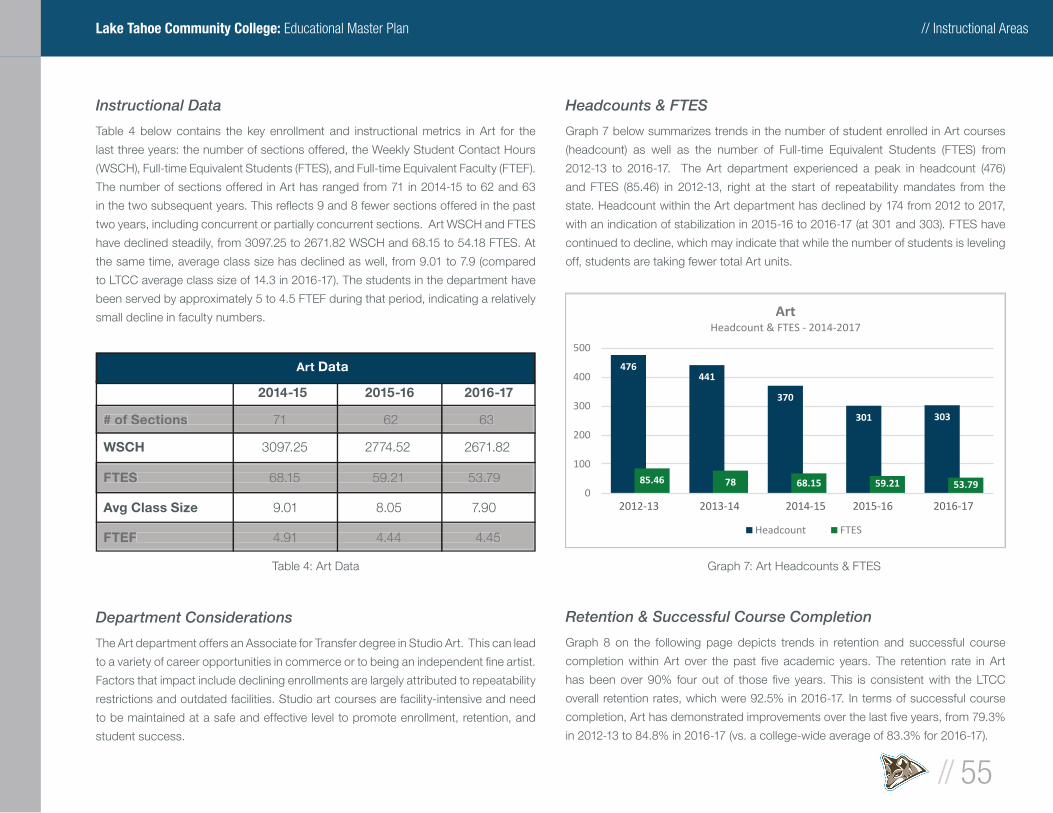
// Instructional Areas
// 55
Lake Tahoe Community College: Educational Master Plan
Instructional Data
Table 4 below contains the key enrollment and instructional metrics in Art for the
last three years: the number of sections offered, the Weekly Student Contact Hours
(WSCH), Full-time Equivalent Students (FTES), and Full-time Equivalent Faculty (FTEF).
The number of sections offered in Art has ranged from 71 in 2014-15 to 62 and 63
in the two subsequent years. This refl ects 9 and 8 fewer sections offered in the past
two years, including concurrent or partially concurrent sections. Art WSCH and FTES
have declined steadily, from 3097.25 to 2671.82 WSCH and 68.15 to 54.18 FTES. At
the same time, average class size has declined as well, from 9.01 to 7.9 (compared
to LTCC average class size of 14.3 in 2016-17). The students in the department have
been served by approximately 5 to 4.5 FTEF during that period, indicating a relatively
small decline in faculty numbers.
Department Considerations
The Art department offers an Associate for Transfer degree in Studio Art. This can lead
to a variety of career opportunities in commerce or to being an independent fi ne artist.
Factors that impact include declining enrollments are largely attributed to repeatability
restrictions and outdated facilities. Studio art courses are facility-intensive and need
to be maintained at a safe and effective level to promote enrollment, retention, and
student success.
Headcounts & FTES
Graph 7 below summarizes trends in the number of student enrolled in Art courses
(headcount) as well as the number of Full-time Equivalent Students (FTES) from
2012-13 to 2016-17. The Art department experienced a peak in headcount (476)
and FTES (85.46) in 2012-13, right at the start of repeatability mandates from the
state. Headcount within the Art department has declined by 174 from 2012 to 2017,
with an indication of stabilization in 2015-16 to 2016-17 (at 301 and 303). FTES have
continued to decline, which may indicate that while the number of students is leveling
off, students are taking fewer total Art units.
Retention & Successful Course Completion
Graph 8 on the following page depicts trends in retention and successful course
completion within Art over the past fi ve academic years. The retention rate in Art
has been over 90% four out of those fi ve years. This is consistent with the LTCC
overall retention rates, which were 92.5% in 2016-17. In terms of successful course
completion, Art has demonstrated improvements over the last fi ve years, from 79.3%
in 2012-13 to 84.8% in 2016-17 (vs. a college-wide average of 83.3% for 2016-17).
Art Data
2014-15 2015-16 2016-17
# of Sections 71 62 63
WSCH 3097.25 2774.52 2671.82
FTES 68.15 59.21 53.79
Avg Class Size 9.01 8.05 7.90
FTEF 4.91 4.44 4.45
# of Sections# of Sections 71 62 63 71 62 63 71 62 63 71 62 63 71 62 63 71 62 63 71 62 63 71 62 63
FTESFTES 68.15 59.21 53.79 68.15 59.21 53.79 68.15 59.21 53.79 68.15 59.21 53.79 68.15 59.21 53.79 68.15 59.21 53.79 68.15 59.21 53.79 68.15 59.21 53.79
FTEFFTEF 4.91 4.44 4.45 4.91 4.44 4.45 4.91 4.44 4.45 4.91 4.44 4.45 4.91 4.44 4.45 4.91 4.44 4.45 4.91 4.44 4.45 4.91 4.44 4.45
Table 4: Art Data
476441
370
301 303
85.46 78 68.15 59.21 53.790
100
200
300
400
500
2012-132 013-14 2014-152 015-16 2016-17
ArtHeadcount & FTES - 2014-2017
Headcount FTES
Graph 7: Art Headcounts & FTES
» 2012-13 2013-14 2014-15 2015-16 2016-17
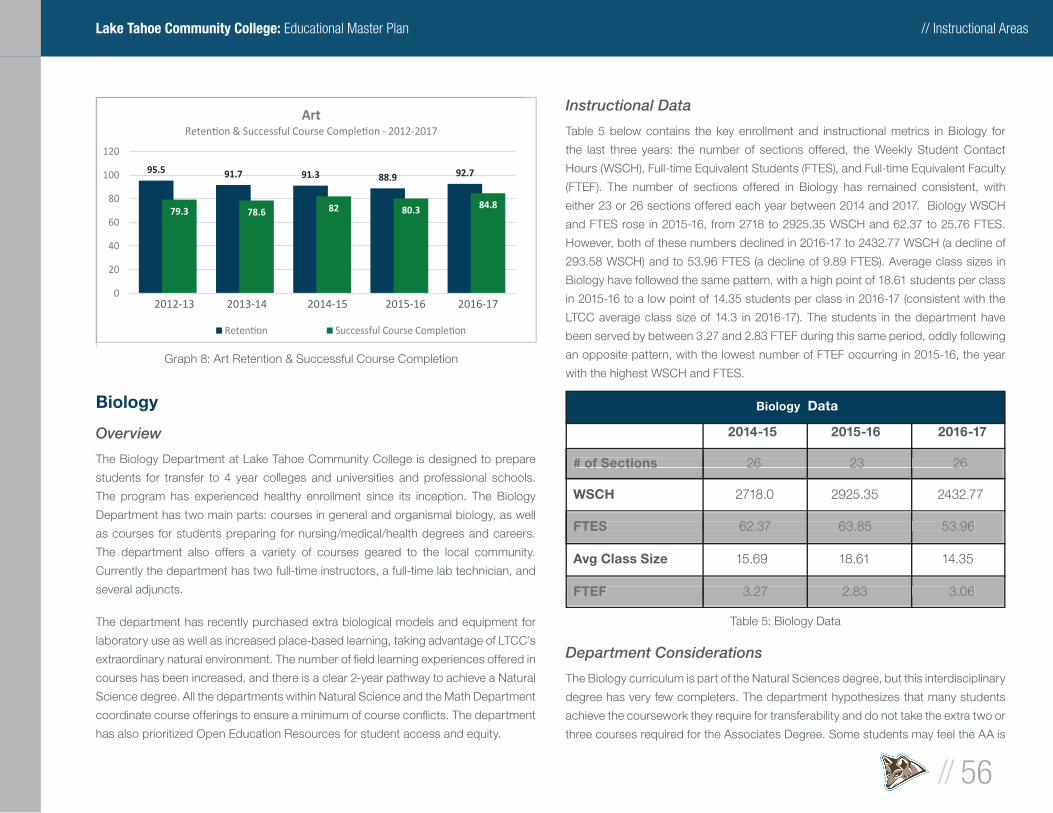
// Instructional Areas
// 56
Lake Tahoe Community College: Educational Master Plan
Biology
Overview
The Biology Department at Lake Tahoe Community College is designed to prepare
students for transfer to 4 year colleges and universities and professional schools.
The program has experienced healthy enrollment since its inception. The Biology
Department has two main parts: courses in general and organismal biology, as well
as courses for students preparing for nursing/medical/health degrees and careers.
The department also offers a variety of courses geared to the local community.
Currently the department has two full-time instructors, a full-time lab technician, and
several adjuncts.
The department has recently purchased extra biological models and equipment for
laboratory use as well as increased place-based learning, taking advantage of LTCC’s
extraordinary natural environment. The number of fi eld learning experiences offered in
courses has been increased, and there is a clear 2-year pathway to achieve a Natural
Science degree. All the departments within Natural Science and the Math Department
coordinate course offerings to ensure a minimum of course confl icts. The department
has also prioritized Open Education Resources for student access and equity.
Instructional Data
Table 5 below contains the key enrollment and instructional metrics in Biology for
the last three years: the number of sections offered, the Weekly Student Contact
Hours (WSCH), Full-time Equivalent Students (FTES), and Full-time Equivalent Faculty
(FTEF). The number of sections offered in Biology has remained consistent, with
either 23 or 26 sections offered each year between 2014 and 2017. Biology WSCH
and FTES rose in 2015-16, from 2718 to 2925.35 WSCH and 62.37 to 25.76 FTES.
However, both of these numbers declined in 2016-17 to 2432.77 WSCH (a decline of
293.58 WSCH) and to 53.96 FTES (a decline of 9.89 FTES). Average class sizes in
Biology have followed the same pattern, with a high point of 18.61 students per class
in 2015-16 to a low point of 14.35 students per class in 2016-17 (consistent with the
LTCC average class size of 14.3 in 2016-17). The students in the department have
been served by between 3.27 and 2.83 FTEF during this same period, oddly following
an opposite pattern, with the lowest number of FTEF occurring in 2015-16, the year
with the highest WSCH and FTES.
Department Considerations
The Biology curriculum is part of the Natural Sciences degree, but this interdisciplinary
degree has very few completers. The department hypothesizes that many students
achieve the coursework they require for transferability and do not take the extra two or
three courses required for the Associates Degree. Some students may feel the AA is
95.5 91.7 91.3 88.9 92.7
79.3 78.6 82 80.3 84.8
0
20
40
60
80
100
120
2012-132 013-14 2014-15 2015-16 2016-17
Art- 2012-2017
Graph 8: Art Retention & Successful Course Completion
Biology Data
2014-15 2015-16 2016-17
# of Sections 26 23 26
WSCH 2718.0 2925.35 2432.77
FTES 62.37 63.85 53.96
Avg Class Size 15.69 18.61 14.35
FTEF 3.27 2.83 3.06
# of Sections# of Sections 26 23 26 26 23 26 26 23 26 26 23 26 26 23 26 26 23 26 26 23 26 26 23 26
FTESFTES 62.37 63.85 53.96 62.37 63.85 53.96 62.37 63.85 53.96 62.37 63.85 53.96 62.37 63.85 53.96 62.37 63.85 53.96 62.37 63.85 53.96 62.37 63.85 53.96
FTEFFTEF 3.27 2.83 3.06 3.27 2.83 3.06 3.27 2.83 3.06 3.27 2.83 3.06 3.27 2.83 3.06 3.27 2.83 3.06 3.27 2.83 3.06 3.27 2.83 3.06
Table 5: Biology Data
» 2012-13 2013-14 2014-15 2015-16 2016-17
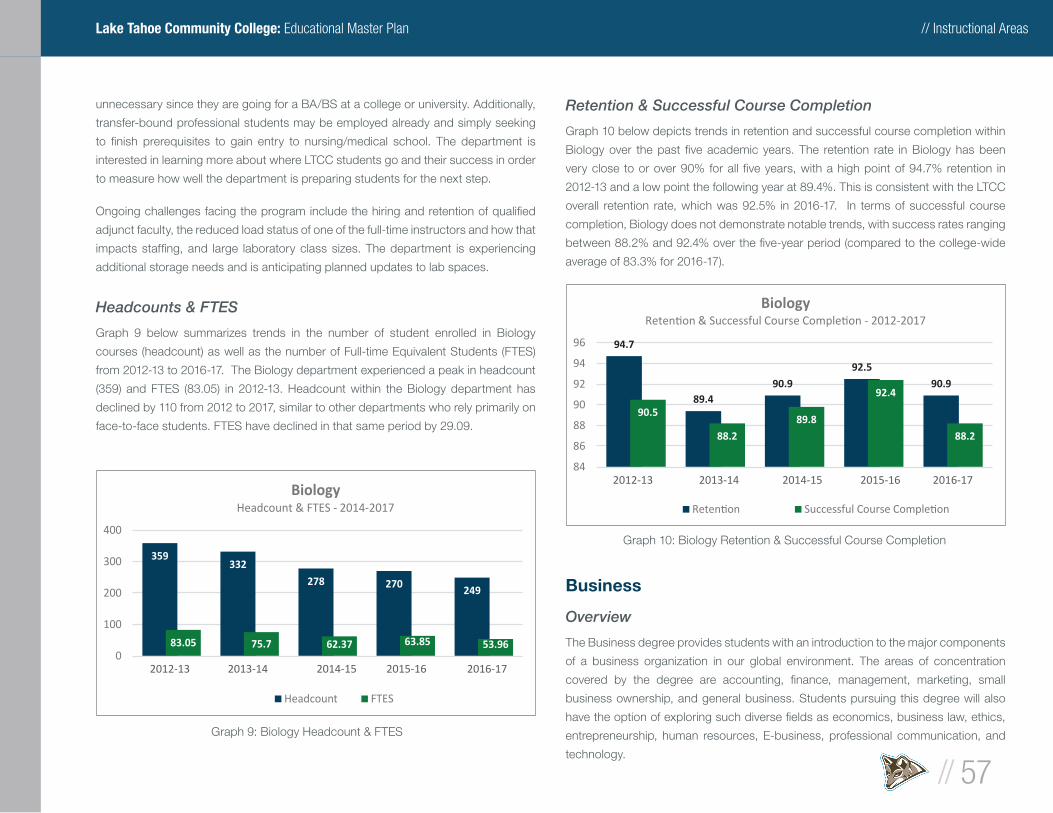
// Instructional Areas
// 57
Lake Tahoe Community College: Educational Master Plan
unnecessary since they are going for a BA/BS at a college or university. Additionally,
transfer-bound professional students may be employed already and simply seeking
to fi nish prerequisites to gain entry to nursing/medical school. The department is
interested in learning more about where LTCC students go and their success in order
to measure how well the department is preparing students for the next step.
Ongoing challenges facing the program include the hiring and retention of qualifi ed
adjunct faculty, the reduced load status of one of the full-time instructors and how that
impacts staffi ng, and large laboratory class sizes. The department is experiencing
additional storage needs and is anticipating planned updates to lab spaces.
Headcounts & FTES
Graph 9 below summarizes trends in the number of student enrolled in Biology
courses (headcount) as well as the number of Full-time Equivalent Students (FTES)
from 2012-13 to 2016-17. The Biology department experienced a peak in headcount
(359) and FTES (83.05) in 2012-13. Headcount within the Biology department has
declined by 110 from 2012 to 2017, similar to other departments who rely primarily on
face-to-face students. FTES have declined in that same period by 29.09.
Retention & Successful Course Completion
Graph 10 below depicts trends in retention and successful course completion within
Biology over the past fi ve academic years. The retention rate in Biology has been
very close to or over 90% for all fi ve years, with a high point of 94.7% retention in
2012-13 and a low point the following year at 89.4%. This is consistent with the LTCC
overall retention rate, which was 92.5% in 2016-17. In terms of successful course
completion, Biology does not demonstrate notable trends, with success rates ranging
between 88.2% and 92.4% over the fi ve-year period (compared to the college-wide
average of 83.3% for 2016-17).
Business
Overview
The Business degree provides students with an introduction to the major components
of a business organization in our global environment. The areas of concentration
covered by the degree are accounting, fi nance, management, marketing, small
business ownership, and general business. Students pursuing this degree will also
have the option of exploring such diverse fi elds as economics, business law, ethics,
entrepreneurship, human resources, E-business, professional communication, and
technology.
359332
278 270 249
83.05 75.7 62.37 63.85 53.960
100
200
300
400
2012-132 013-14 2014-152 015-16 2016-17
BiologyHeadcount & FTES - 2014-2017
Headcount FTES
Graph 9: Biology Headcount & FTES
94.7
89.490.9
92.5
90.9
90.5
88.2
89.8
92.4
88.2
84
86
88
90
92
94
96
2012-132 013-14 2014-152 015-16 2016-17
Biology- 2012-2017
Graph 10: Biology Retention & Successful Course Completion
» 2012-13 2013-14 2014-15 2015-16 2016-17
» 2012-13 2013-14 2014-15 2015-16 2016-17
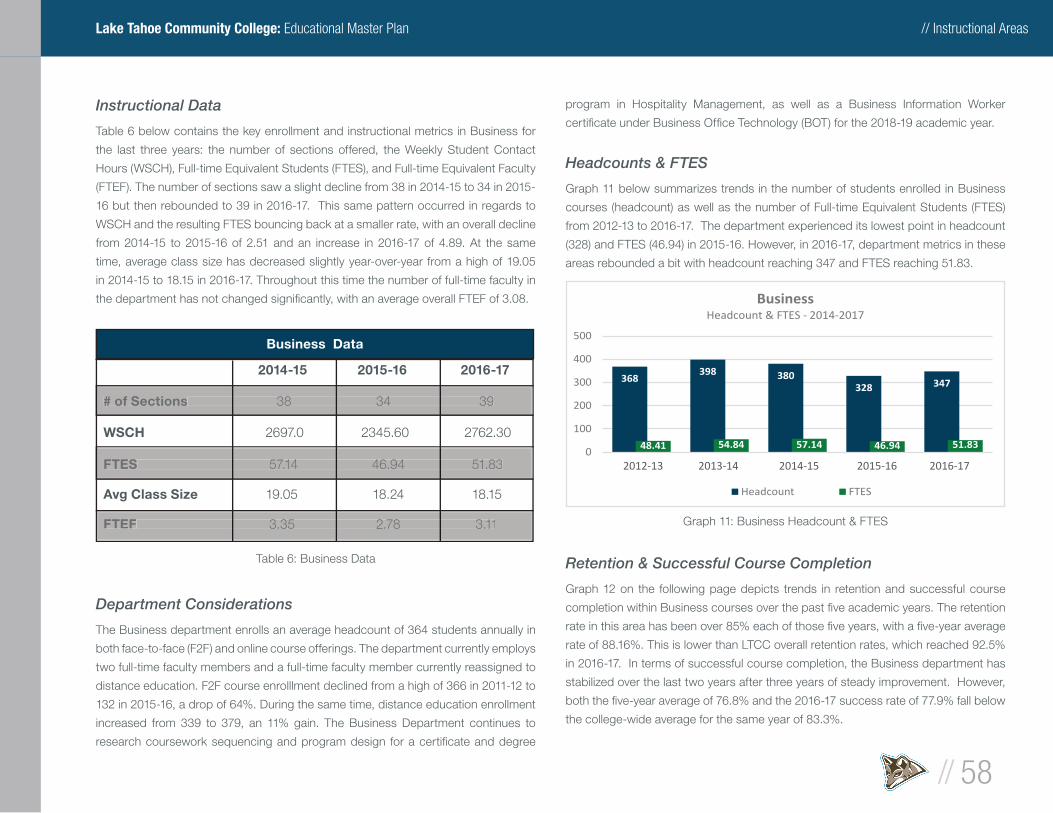
// Instructional Areas
// 58
Lake Tahoe Community College: Educational Master Plan
Instructional Data
Table 6 below contains the key enrollment and instructional metrics in Business for
the last three years: the number of sections offered, the Weekly Student Contact
Hours (WSCH), Full-time Equivalent Students (FTES), and Full-time Equivalent Faculty
(FTEF). The number of sections saw a slight decline from 38 in 2014-15 to 34 in 2015-
16 but then rebounded to 39 in 2016-17. This same pattern occurred in regards to
WSCH and the resulting FTES bouncing back at a smaller rate, with an overall decline
from 2014-15 to 2015-16 of 2.51 and an increase in 2016-17 of 4.89. At the same
time, average class size has decreased slightly year-over-year from a high of 19.05
in 2014-15 to 18.15 in 2016-17. Throughout this time the number of full-time faculty in
the department has not changed signifi cantly, with an average overall FTEF of 3.08.
Department Considerations
The Business department enrolls an average headcount of 364 students annually in
both face-to-face (F2F) and online course offerings. The department currently employs
two full-time faculty members and a full-time faculty member currently reassigned to
distance education. F2F course enrolllment declined from a high of 366 in 2011-12 to
132 in 2015-16, a drop of 64%. During the same time, distance education enrollment
increased from 339 to 379, an 11% gain. The Business Department continues to
research coursework sequencing and program design for a certifi cate and degree
program in Hospitality Management, as well as a Business Information Worker
certifi cate under Business Offi ce Technology (BOT) for the 2018-19 academic year.
Headcounts & FTES
Graph 11 below summarizes trends in the number of students enrolled in Business
courses (headcount) as well as the number of Full-time Equivalent Students (FTES)
from 2012-13 to 2016-17. The department experienced its lowest point in headcount
(328) and FTES (46.94) in 2015-16. However, in 2016-17, department metrics in these
areas rebounded a bit with headcount reaching 347 and FTES reaching 51.83.
Retention & Successful Course Completion
Graph 12 on the following page depicts trends in retention and successful course
completion within Business courses over the past fi ve academic years. The retention
rate in this area has been over 85% each of those fi ve years, with a fi ve-year average
rate of 88.16%. This is lower than LTCC overall retention rates, which reached 92.5%
in 2016-17. In terms of successful course completion, the Business department has
stabilized over the last two years after three years of steady improvement. However,
both the fi ve-year average of 76.8% and the 2016-17 success rate of 77.9% fall below
the college-wide average for the same year of 83.3%.
Business Data
2014-15 2015-16 2016-17
# of Sections 38 34 39
WSCH 2697.0 2345.60 2762.30
FTES 57.14 46.94 51.83
Avg Class Size 19.05 18.24 18.15
FTEF 3.35 2.78 3.11
# of Sections# of Sections 38 34 39 38 34 39 38 34 39 38 34 39 38 34 39 38 34 39 38 34 39 38 34 39
FTESFTES 57.14 46.94 51.83 57.14 46.94 51.83 57.14 46.94 51.83 57.14 46.94 51.83 57.14 46.94 51.83 57.14 46.94 51.83 57.14 46.94 51.83 57.14 46.94 51.83
FTEFFTEF 3.35 2.78 3.11 3.35 2.78 3.11 3.35 2.78 3.11 3.35 2.78 3.11 3.35 2.78 3.11 3.35 2.78 3.11 3.35 2.78 3.11 3.35 2.78 3.11
Table 6: Business Data
368398 380
328 347
48.41 54.84 57.14 46.94 51.830
100
200
300
400
500
2012-132 013-14 2014-152 015-16 2016-17
BusinessHeadcount & FTES - 2014-2017
Headcount FTES
Graph 11: Business Headcount & FTES
» 2012-13 2013-14 2014-15 2015-16 2016-17
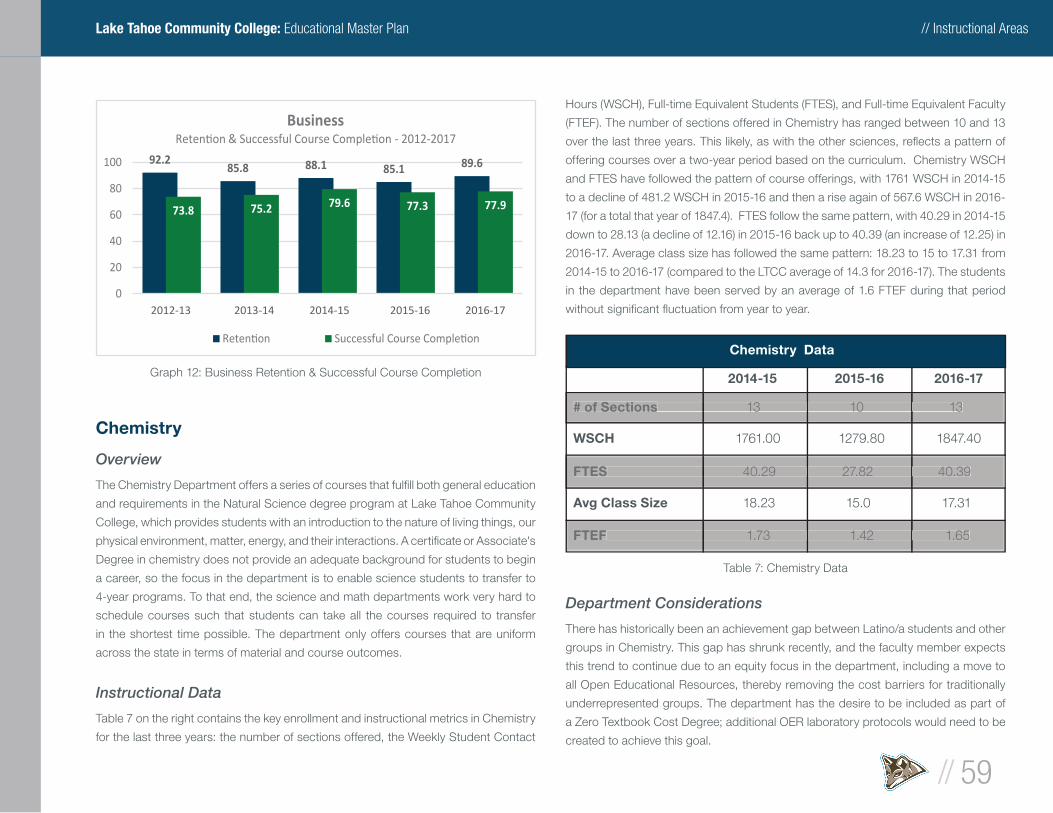
// Instructional Areas
// 59
Lake Tahoe Community College: Educational Master Plan
Chemistry
Overview
The Chemistry Department offers a series of courses that fulfi ll both general education
and requirements in the Natural Science degree program at Lake Tahoe Community
College, which provides students with an introduction to the nature of living things, our
physical environment, matter, energy, and their interactions. A certifi cate or Associate's
Degree in chemistry does not provide an adequate background for students to begin
a career, so the focus in the department is to enable science students to transfer to
4-year programs. To that end, the science and math departments work very hard to
schedule courses such that students can take all the courses required to transfer
in the shortest time possible. The department only offers courses that are uniform
across the state in terms of material and course outcomes.
Instructional Data
Table 7 on the right contains the key enrollment and instructional metrics in Chemistry
for the last three years: the number of sections offered, the Weekly Student Contact
Hours (WSCH), Full-time Equivalent Students (FTES), and Full-time Equivalent Faculty
(FTEF). The number of sections offered in Chemistry has ranged between 10 and 13
over the last three years. This likely, as with the other sciences, refl ects a pattern of
offering courses over a two-year period based on the curriculum. Chemistry WSCH
and FTES have followed the pattern of course offerings, with 1761 WSCH in 2014-15
to a decline of 481.2 WSCH in 2015-16 and then a rise again of 567.6 WSCH in 2016-
17 (for a total that year of 1847.4). FTES follow the same pattern, with 40.29 in 2014-15
down to 28.13 (a decline of 12.16) in 2015-16 back up to 40.39 (an increase of 12.25) in
2016-17. Average class size has followed the same pattern: 18.23 to 15 to 17.31 from
2014-15 to 2016-17 (compared to the LTCC average of 14.3 for 2016-17). The students
in the department have been served by an average of 1.6 FTEF during that period
without signifi cant fl uctuation from year to year.
Department Considerations
There has historically been an achievement gap between Latino/a students and other
groups in Chemistry. This gap has shrunk recently, and the faculty member expects
this trend to continue due to an equity focus in the department, including a move to
all Open Educational Resources, thereby removing the cost barriers for traditionally
underrepresented groups. The department has the desire to be included as part of
a Zero Textbook Cost Degree; additional OER laboratory protocols would need to be
created to achieve this goal.
92.285.8 88.1 85.1 89.6
73.8 75.2 79.6 77.3 77.9
0
20
40
60
80
100
2012-132 013-14 2014-152 015-16 2016-17
Business- 2012-2017
Graph 12: Business Retention & Successful Course Completion
Chemistry Data
2014-15 2015-16 2016-17
# of Sections 13 10 13
WSCH 1761.00 1279.80 1847.40
FTES 40.29 27.82 40.39
Avg Class Size 18.23 15.0 17.31
FTEF 1.73 1.42 1.65
# of Sections# of Sections 13 10 13 13 10 13 13 10 13 13 10 13 13 10 13 13 10 13 13 10 13 13 10 13
FTESFTES 40.29 27.82 40.39 40.29 27.82 40.39 40.29 27.82 40.39 40.29 27.82 40.39 40.29 27.82 40.39 40.29 27.82 40.39 40.29 27.82 40.39 40.29 27.82 40.39
FTEFFTEF 1.73 1.42 1.65 1.73 1.42 1.65 1.73 1.42 1.65 1.73 1.42 1.65 1.73 1.42 1.65 1.73 1.42 1.65 1.73 1.42 1.65 1.73 1.42 1.65
Table 7: Chemistry Data
» 2012-13 2013-14 2014-15 2015-16 2016-17
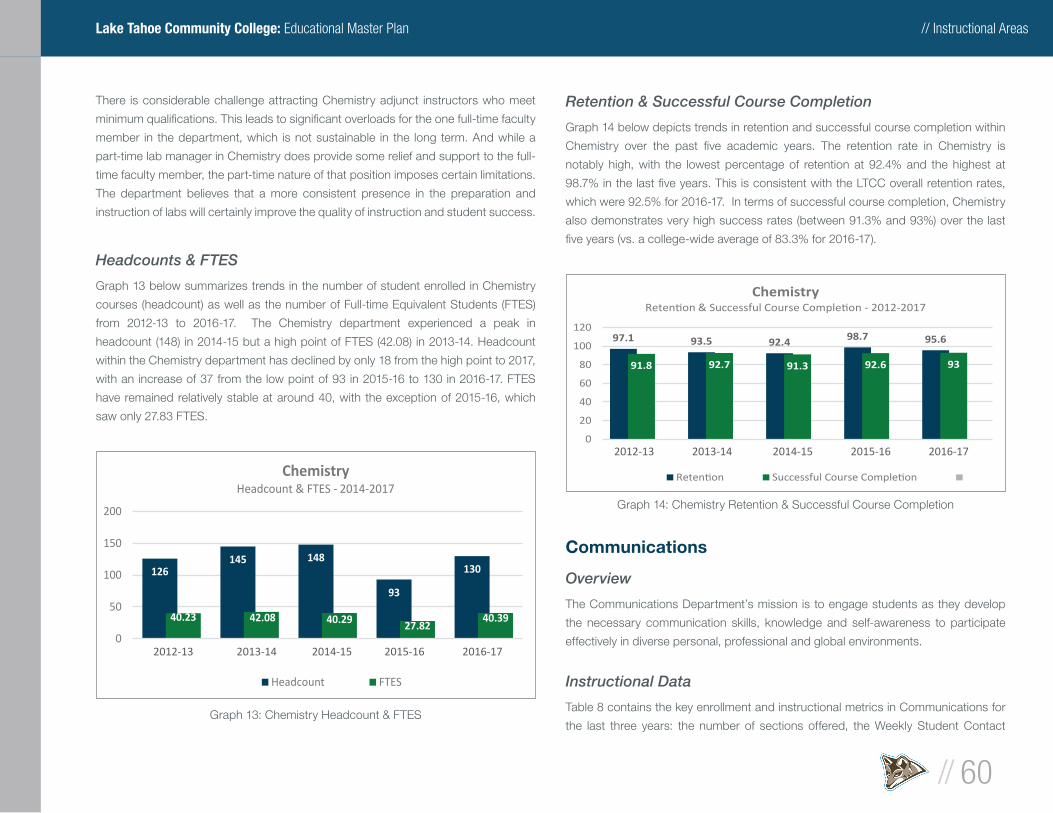
// Instructional Areas
// 60
Lake Tahoe Community College: Educational Master Plan
There is considerable challenge attracting Chemistry adjunct instructors who meet
minimum qualifi cations. This leads to signifi cant overloads for the one full-time faculty
member in the department, which is not sustainable in the long term. And while a
part-time lab manager in Chemistry does provide some relief and support to the full-
time faculty member, the part-time nature of that position imposes certain limitations.
The department believes that a more consistent presence in the preparation and
instruction of labs will certainly improve the quality of instruction and student success.
Headcounts & FTES
Graph 13 below summarizes trends in the number of student enrolled in Chemistry
courses (headcount) as well as the number of Full-time Equivalent Students (FTES)
from 2012-13 to 2016-17. The Chemistry department experienced a peak in
headcount (148) in 2014-15 but a high point of FTES (42.08) in 2013-14. Headcount
within the Chemistry department has declined by only 18 from the high point to 2017,
with an increase of 37 from the low point of 93 in 2015-16 to 130 in 2016-17. FTES
have remained relatively stable at around 40, with the exception of 2015-16, which
saw only 27.83 FTES.
Retention & Successful Course Completion
Graph 14 below depicts trends in retention and successful course completion within
Chemistry over the past fi ve academic years. The retention rate in Chemistry is
notably high, with the lowest percentage of retention at 92.4% and the highest at
98.7% in the last fi ve years. This is consistent with the LTCC overall retention rates,
which were 92.5% for 2016-17. In terms of successful course completion, Chemistry
also demonstrates very high success rates (between 91.3% and 93%) over the last
fi ve years (vs. a college-wide average of 83.3% for 2016-17).
Communications
Overview
The Communications Department’s mission is to engage students as they develop
the necessary communication skills, knowledge and self-awareness to participate
effectively in diverse personal, professional and global environments.
Instructional Data
Table 8 contains the key enrollment and instructional metrics in Communications for
the last three years: the number of sections offered, the Weekly Student Contact
126145 148
93
130
40.23 42.08 40.29 27.8240.39
0
50
100
150
200
2012-132 013-14 2014-152 015-16 2016-17
ChemistryHeadcount & FTES - 2014-2017
Headcount FTES
Graph 13: Chemistry Headcount & FTES
97.1 93.5 92.4 98.7 95.6
91.8 92.7 91.3 92.6 93
0
20
40
60
80
100
120
2012-132 013-14 2014-152 015-16 2016-17
Chemistry- 2012-2017
Graph 14: Chemistry Retention & Successful Course Completion
» 2012-13 2013-14 2014-15 2015-16 2016-17
» 2012-13 2013-14 2014-15 2015-16 2016-17
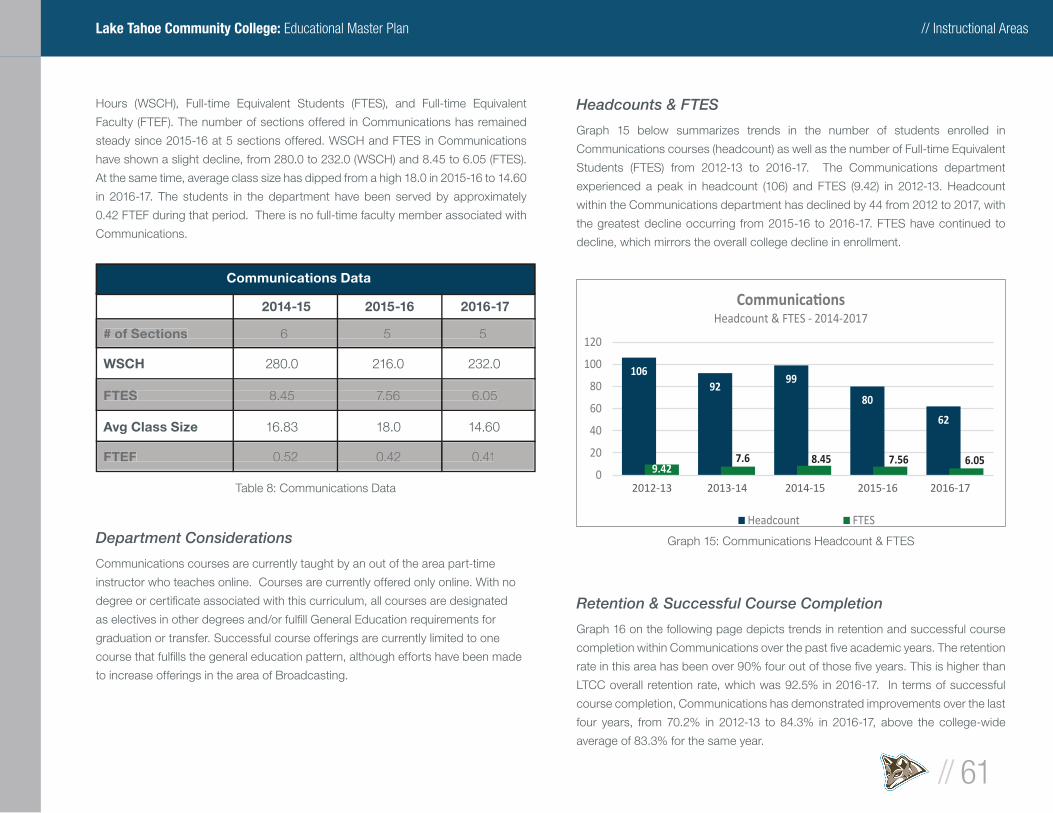
// Instructional Areas
// 61
Lake Tahoe Community College: Educational Master Plan
Headcounts & FTES
Graph 15 below summarizes trends in the number of students enrolled in
Communications courses (headcount) as well as the number of Full-time Equivalent
Students (FTES) from 2012-13 to 2016-17. The Communications department
experienced a peak in headcount (106) and FTES (9.42) in 2012-13. Headcount
within the Communications department has declined by 44 from 2012 to 2017, with
the greatest decline occurring from 2015-16 to 2016-17. FTES have continued to
decline, which mirrors the overall college decline in enrollment.
Retention & Successful Course Completion
Graph 16 on the following page depicts trends in retention and successful course
completion within Communications over the past fi ve academic years. The retention
rate in this area has been over 90% four out of those fi ve years. This is higher than
LTCC overall retention rate, which was 92.5% in 2016-17. In terms of successful
course completion, Communications has demonstrated improvements over the last
four years, from 70.2% in 2012-13 to 84.3% in 2016-17, above the college-wide
average of 83.3% for the same year.
Hours (WSCH), Full-time Equivalent Students (FTES), and Full-time Equivalent
Faculty (FTEF). The number of sections offered in Communications has remained
steady since 2015-16 at 5 sections offered. WSCH and FTES in Communications
have shown a slight decline, from 280.0 to 232.0 (WSCH) and 8.45 to 6.05 (FTES).
At the same time, average class size has dipped from a high 18.0 in 2015-16 to 14.60
in 2016-17. The students in the department have been served by approximately
0.42 FTEF during that period. There is no full-time faculty member associated with
Communications.
Department Considerations
Communications courses are currently taught by an out of the area part-time
instructor who teaches online. Courses are currently offered only online. With no
degree or certifi cate associated with this curriculum, all courses are designated
as electives in other degrees and/or fulfi ll General Education requirements for
graduation or transfer. Successful course offerings are currently limited to one
course that fulfi lls the general education pattern, although efforts have been made
to increase offerings in the area of Broadcasting.
Communications Data
2014-15 2015-16 2016-17
# of Sections 6 5 5
WSCH 280.0 216.0 232.0
FTES 8.45 7.56 6.05
Avg Class Size 16.83 18.0 14.60
FTEF 0.52 0.42 0.41
# of Sections# of Sections 6 5 5 6 5 5 6 5 5 6 5 5 6 5 5 6 5 5 6 5 5 6 5 5
FTESFTES 8.45 7.56 6.05 8.45 7.56 6.05 8.45 7.56 6.05 8.45 7.56 6.05 8.45 7.56 6.05 8.45 7.56 6.05 8.45 7.56 6.05 8.45 7.56 6.05
FTEFFTEF 0.52 0.42 0.41 0.52 0.42 0.41 0.52 0.42 0.41 0.52 0.42 0.41 0.52 0.42 0.41 0.52 0.42 0.41 0.52 0.42 0.41 0.52 0.42 0.41
Table 8: Communications Data
10692
99
80
62
9.427.6 8.45 7.56 6.05
0
20
40
60
80
100
120
2012-132 013-14 2014-152 015-16 2016-17
Headcount & FTES - 2014-2017
Headcount FTES
Graph 15: Communications Headcount & FTES
» 2012-13 2013-14 2014-15 2015-16 2016-17
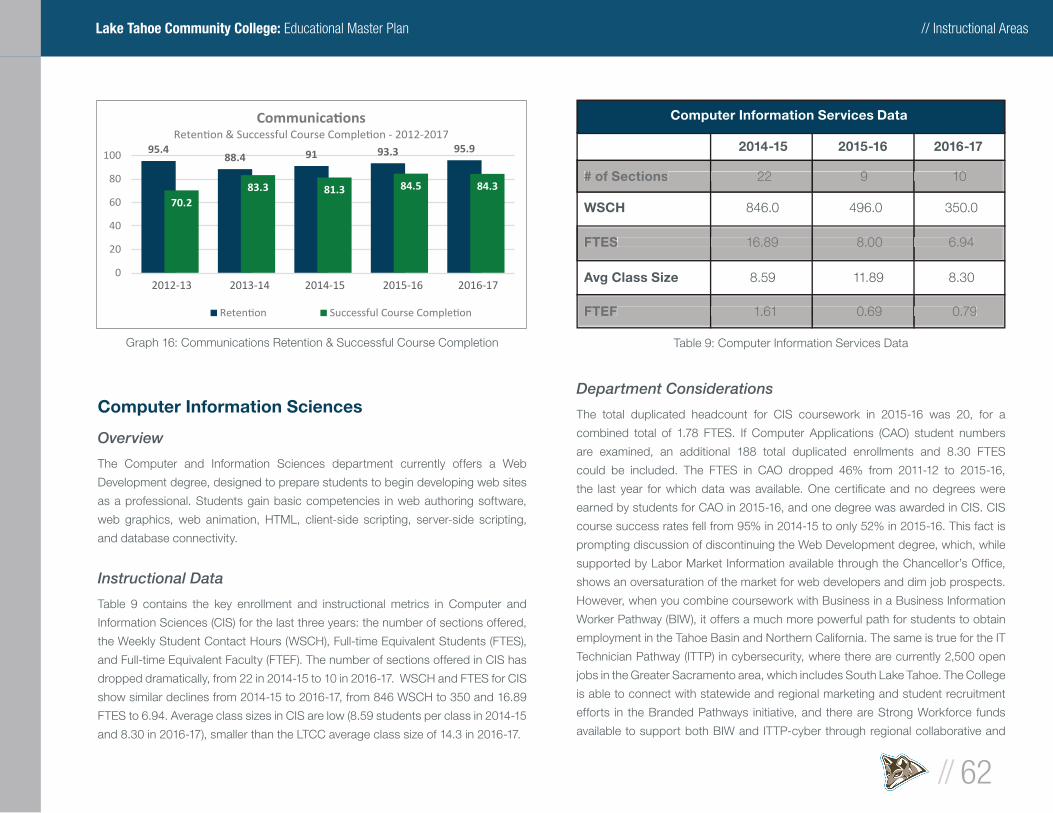
// Instructional Areas
// 62
Lake Tahoe Community College: Educational Master Plan
Computer Information Sciences
Overview
The Computer and Information Sciences department currently offers a Web
Development degree, designed to prepare students to begin developing web sites
as a professional. Students gain basic competencies in web authoring software,
web graphics, web animation, HTML, client-side scripting, server-side scripting,
and database connectivity.
Instructional Data
Table 9 contains the key enrollment and instructional metrics in Computer and
Information Sciences (CIS) for the last three years: the number of sections offered,
the Weekly Student Contact Hours (WSCH), Full-time Equivalent Students (FTES),
and Full-time Equivalent Faculty (FTEF). The number of sections offered in CIS has
dropped dramatically, from 22 in 2014-15 to 10 in 2016-17. WSCH and FTES for CIS
show similar declines from 2014-15 to 2016-17, from 846 WSCH to 350 and 16.89
FTES to 6.94. Average class sizes in CIS are low (8.59 students per class in 2014-15
and 8.30 in 2016-17), smaller than the LTCC average class size of 14.3 in 2016-17.
Department Considerations
The total duplicated headcount for CIS coursework in 2015-16 was 20, for a
combined total of 1.78 FTES. If Computer Applications (CAO) student numbers
are examined, an additional 188 total duplicated enrollments and 8.30 FTES
could be included. The FTES in CAO dropped 46% from 2011-12 to 2015-16,
the last year for which data was available. One certifi cate and no degrees were
earned by students for CAO in 2015-16, and one degree was awarded in CIS. CIS
course success rates fell from 95% in 2014-15 to only 52% in 2015-16. This fact is
prompting discussion of discontinuing the Web Development degree, which, while
supported by Labor Market Information available through the Chancellor’s Offi ce,
shows an oversaturation of the market for web developers and dim job prospects.
However, when you combine coursework with Business in a Business Information
Worker Pathway (BIW), it offers a much more powerful path for students to obtain
employment in the Tahoe Basin and Northern California. The same is true for the IT
Technician Pathway (ITTP) in cybersecurity, where there are currently 2,500 open
jobs in the Greater Sacramento area, which includes South Lake Tahoe. The College
is able to connect with statewide and regional marketing and student recruitment
efforts in the Branded Pathways initiative, and there are Strong Workforce funds
available to support both BIW and ITTP-cyber through regional collaborative and
95.488.4 91 93.3 95.9
70.283.3 81.3 84.5 84.3
0
20
40
60
80
100
2012-132 013-14 2014-152 015-16 2016-17
- 2012-2017
Graph 16: Communications Retention & Successful Course Completion
Computer Information Services Data
2014-15 2015-16 2016-17
# of Sections 22 9 10
WSCH 846.0 496.0 350.0
FTES 16.89 8.00 6.94
Avg Class Size 8.59 11.89 8.30
FTEF 1.61 0.69 0.79
# of Sections# of Sections 22 9 10 22 9 10 22 9 10 22 9 10 22 9 10 22 9 10 22 9 10 22 9 10
FTESFTES 16.89 8.00 6.94 16.89 8.00 6.94 16.89 8.00 6.94 16.89 8.00 6.94 16.89 8.00 6.94 16.89 8.00 6.94 16.89 8.00 6.94 16.89 8.00 6.94
FTEFFTEF 1.61 0.69 0.79 1.61 0.69 0.79 1.61 0.69 0.79 1.61 0.69 0.79 1.61 0.69 0.79 1.61 0.69 0.79 1.61 0.69 0.79 1.61 0.69 0.79
Table 9: Computer Information Services Data
» 2012-13 2013-14 2014-15 2015-16 2016-17
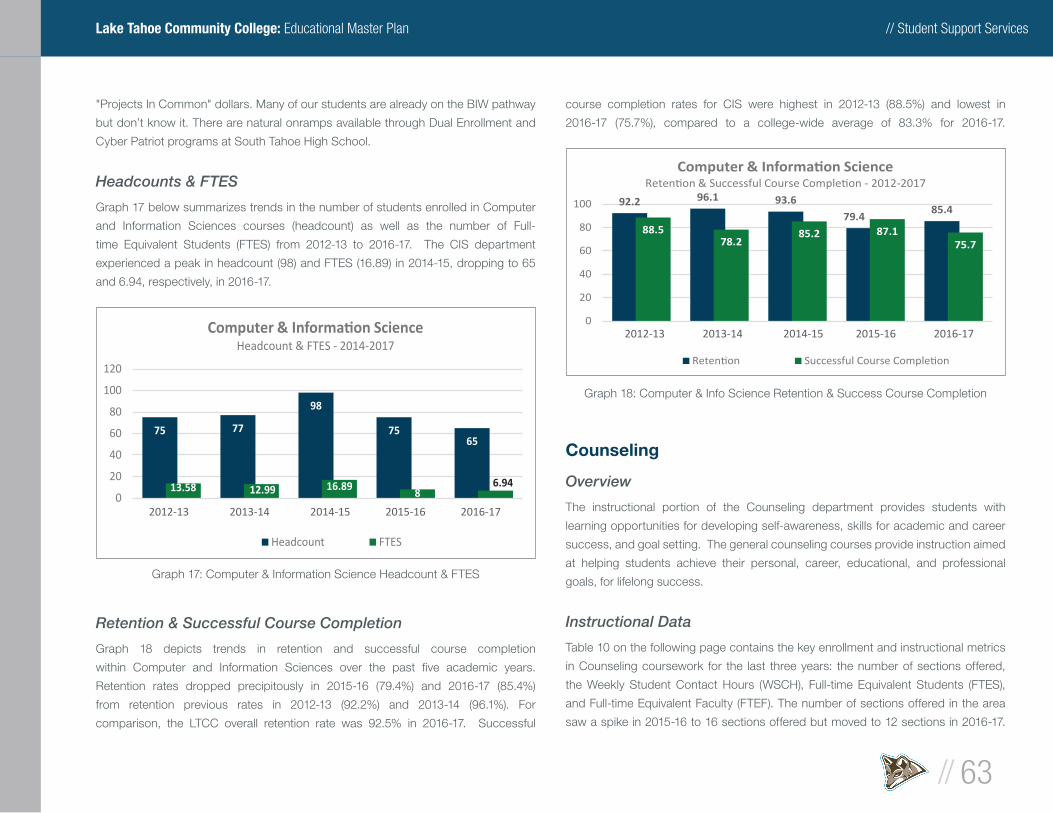
// Student Support Services
// 63
Lake Tahoe Community College: Educational Master Plan
"Projects In Common" dollars. Many of our students are already on the BIW pathway
but don’t know it. There are natural onramps available through Dual Enrollment and
Cyber Patriot programs at South Tahoe High School.
Headcounts & FTES
Graph 17 below summarizes trends in the number of students enrolled in Computer
and Information Sciences courses (headcount) as well as the number of Full-
time Equivalent Students (FTES) from 2012-13 to 2016-17. The CIS department
experienced a peak in headcount (98) and FTES (16.89) in 2014-15, dropping to 65
and 6.94, respectively, in 2016-17.
Retention & Successful Course Completion
Graph 18 depicts trends in retention and successful course completion
within Computer and Information Sciences over the past fi ve academic years.
Retention rates dropped precipitously in 2015-16 (79.4%) and 2016-17 (85.4%)
from retention previous rates in 2012-13 (92.2%) and 2013-14 (96.1%). For
comparison, the LTCC overall retention rate was 92.5% in 2016-17. Successful
course completion rates for CIS were highest in 2012-13 (88.5%) and lowest in
2016-17 (75.7%), compared to a college-wide average of 83.3% for 2016-17.
Counseling
Overview
The instructional portion of the Counseling department provides students with
learning opportunities for developing self-awareness, skills for academic and career
success, and goal setting. The general counseling courses provide instruction aimed
at helping students achieve their personal, career, educational, and professional
goals, for lifelong success.
Instructional Data
Table 10 on the following page contains the key enrollment and instructional metrics
in Counseling coursework for the last three years: the number of sections offered,
the Weekly Student Contact Hours (WSCH), Full-time Equivalent Students (FTES),
and Full-time Equivalent Faculty (FTEF). The number of sections offered in the area
saw a spike in 2015-16 to 16 sections offered but moved to 12 sections in 2016-17.
75 77
98
7565
13.58 12.99 16.898
6.940
20
40
60
80
100
120
2012-132 013-14 2014-152 015-16 2016-17
Headcount & FTES - 2014-2017
Headcount FTES
Graph 17: Computer & Information Science Headcount & FTES
92.2 96.1 93.6
79.485.4
88.578.2
85.2 87.175.7
0
20
40
60
80
100
2012-132 013-14 2014-152 015-16 2016-17
- 2012-2017
Graph 18: Computer & Info Science Retention & Success Course Completion
» 2012-13 2013-14 2014-15 2015-16 2016-17
» 2012-13 2013-14 2014-15 2015-16 2016-17
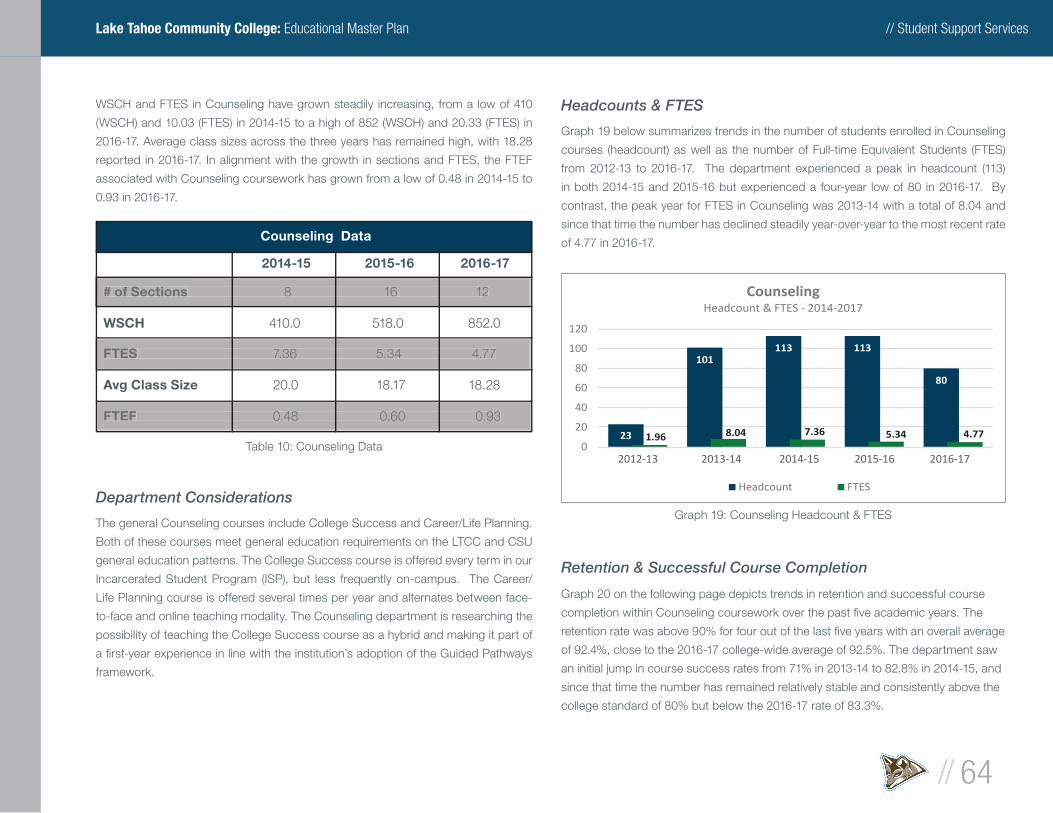
// Student Support Services
// 64
Lake Tahoe Community College: Educational Master Plan
WSCH and FTES in Counseling have grown steadily increasing, from a low of 410
(WSCH) and 10.03 (FTES) in 2014-15 to a high of 852 (WSCH) and 20.33 (FTES) in
2016-17. Average class sizes across the three years has remained high, with 18.28
reported in 2016-17. In alignment with the growth in sections and FTES, the FTEF
associated with Counseling coursework has grown from a low of 0.48 in 2014-15 to
0.93 in 2016-17.
Department Considerations
The general Counseling courses include College Success and Career/Life Planning.
Both of these courses meet general education requirements on the LTCC and CSU
general education patterns. The College Success course is offered every term in our
Incarcerated Student Program (ISP), but less frequently on-campus. The Career/
Life Planning course is offered several times per year and alternates between face-
to-face and online teaching modality. The Counseling department is researching the
possibility of teaching the College Success course as a hybrid and making it part of
a fi rst-year experience in line with the institution’s adoption of the Guided Pathways
framework.
Headcounts & FTES
Graph 19 below summarizes trends in the number of students enrolled in Counseling
courses (headcount) as well as the number of Full-time Equivalent Students (FTES)
from 2012-13 to 2016-17. The department experienced a peak in headcount (113)
in both 2014-15 and 2015-16 but experienced a four-year low of 80 in 2016-17. By
contrast, the peak year for FTES in Counseling was 2013-14 with a total of 8.04 and
since that time the number has declined steadily year-over-year to the most recent rate
of 4.77 in 2016-17.
Retention & Successful Course Completion
Graph 20 on the following page depicts trends in retention and successful course
completion within Counseling coursework over the past fi ve academic years. The
retention rate was above 90% for four out of the last fi ve years with an overall average
of 92.4%, close to the 2016-17 college-wide average of 92.5%. The department saw
an initial jump in course success rates from 71% in 2013-14 to 82.8% in 2014-15, and
since that time the number has remained relatively stable and consistently above the
college standard of 80% but below the 2016-17 rate of 83.3%.
Counseling Data
2014-15 2015-16 2016-17
# of Sections 8 16 12
WSCH 410.0 518.0 852.0
FTES 7.36 5.34 4.77
Avg Class Size 20.0 18.17 18.28
FTEF 0.48 0.60 0.93
# of Sections# of Sections 8 16 12 8 16 12 8 16 12 8 16 12 8 16 12 8 16 12 8 16 12 8 16 12
FTESFTES 7.36 5.34 4.77 7.36 5.34 4.77 7.36 5.34 4.77 7.36 5.34 4.77 7.36 5.34 4.77 7.36 5.34 4.77 7.36 5.34 4.77 7.36 5.34 4.77
FTEFFTEF 0.48 0.60 0.93 0.48 0.60 0.93 0.48 0.60 0.93 0.48 0.60 0.93 0.48 0.60 0.93 0.48 0.60 0.93 0.48 0.60 0.93 0.48 0.60 0.93
Table 10: Counseling Data23
101113 113
80
1.96 8.04 7.36 5.34 4.770
20
40
60
80
100
120
2012-132 013-14 2014-152 015-16 2016-17
CounselingHeadcount & FTES - 2014-2017
Headcount FTES
Graph 19: Counseling Headcount & FTES
» 2012-13 2013-14 2014-15 2015-16 2016-17

// Student Support Services
// 65
Lake Tahoe Community College: Educational Master Plan
Criminal Justice
Overview
The Criminal Justice program is designed to acquaint pre-service and in-service
students with the principles and practices of criminal justice systems in America. The
program is both academic and professional in that it is an interdisciplinary approach
to relating intellectual issues and practitioner perspectives to the challenge of crime
in a free society. Consequently, the program provides preparation for employment
with a related agency and/or transfer to a four-year college or university. Students
completing the Criminal Justice program will be prepared to work in a variety of
positions such as municipal police offi cers, county deputy sheriffs, probation or
correctional offi cers, game wardens, state park offi cers, and private security offi cers.
Instructional Data
Table 11 on the right contains the key enrollment and instructional metrics in
Criminal Justice for the last three years: the number of sections offered, the Weekly
Student Contact Hours (WSCH), Full-time Equivalent Students (FTES), and Full-time
Equivalent Faculty (FTEF). The number of sections offered in the department has
grown each year, going from 9 sections in 2014-15 to 15 sections offered in 2016-17.
Similarly, WSCH and FTES in Criminal Justice have shown consistent growth, from
533.0 to a high of 723.4 (WSCH) and from 11.85 to 16.16 (FTES) in the last three years.
Conversely, throughout this time average class size dropped from a high of 16.11 in
2014-15 to a low of 13.00 in 2016-17. FTEF dropped slightly in 2015-16 but reach a high
of 1.14 in 2016-17. There is no full-time faculty member associated with Criminal Justice.
Department Considerations
The College offers an AA in Criminal Justice, an AA-T in the Administrators of Justice, and
a certifi cate in Criminal Justice. In 2015-16, six associate’s degrees and six certifi cates
were awarded in Administration of Justice and Criminal Justice, respectively. Recent
demand has been strong for Criminal Justice, since the announcement from the
California Department of Corrections and Rehabilitation (CDCR) that online coursework
is available for state corrections employees through LTCC. The College saw a spike
in interest in the spring of 2017, when an email was sent out to over 60,000 CDCR
employees on April 1st. The College hired additional adjunct faculty and has added an
additional 3-4 courses per academic quarter since, and total duplicated enrollments
have been over 100 per quarter since Spring of 2017. (It is important to note that
CDCR employees are interested in more than just Criminal Justice, which could be
a contributing factor to recent overall increases in distance education enrollments.)
Criminal Justice Data
2014-15 2015-16 2016-17
# of Sections 9 11 15
WSCH 533.0 644.50 723.4
FTES 11.85 13.98 16.16
Avg Class Size 16.11 17.0 13.0
FTEF 0.87 0.78 1.14
# of Sections# of Sections 9 11 15 9 11 15 9 11 15 9 11 15 9 11 15 9 11 15 9 11 15 9 11 15
FTESFTES 11.85 13.98 16.16 11.85 13.98 16.16 11.85 13.98 16.16 11.85 13.98 16.16 11.85 13.98 16.16 11.85 13.98 16.16 11.85 13.98 16.16 11.85 13.98 16.16
FTEFFTEF 0.87 0.78 1.14 0.87 0.78 1.14 0.87 0.78 1.14 0.87 0.78 1.14 0.87 0.78 1.14 0.87 0.78 1.14 0.87 0.78 1.14 0.87 0.78 1.14
Table 11: Criminal Justice Data
91.3 94.387.6
95.7 92.9
71.4 7182.8 82 81
0
20
40
60
80
100
2012-132 013-14 2014-152 015-16 2016-17
Counseling- 2012-2017
Graph 20: Counseling Retention & Successful Course Completion
» 2012-13 2013-14 2014-15 2015-16 2016-17
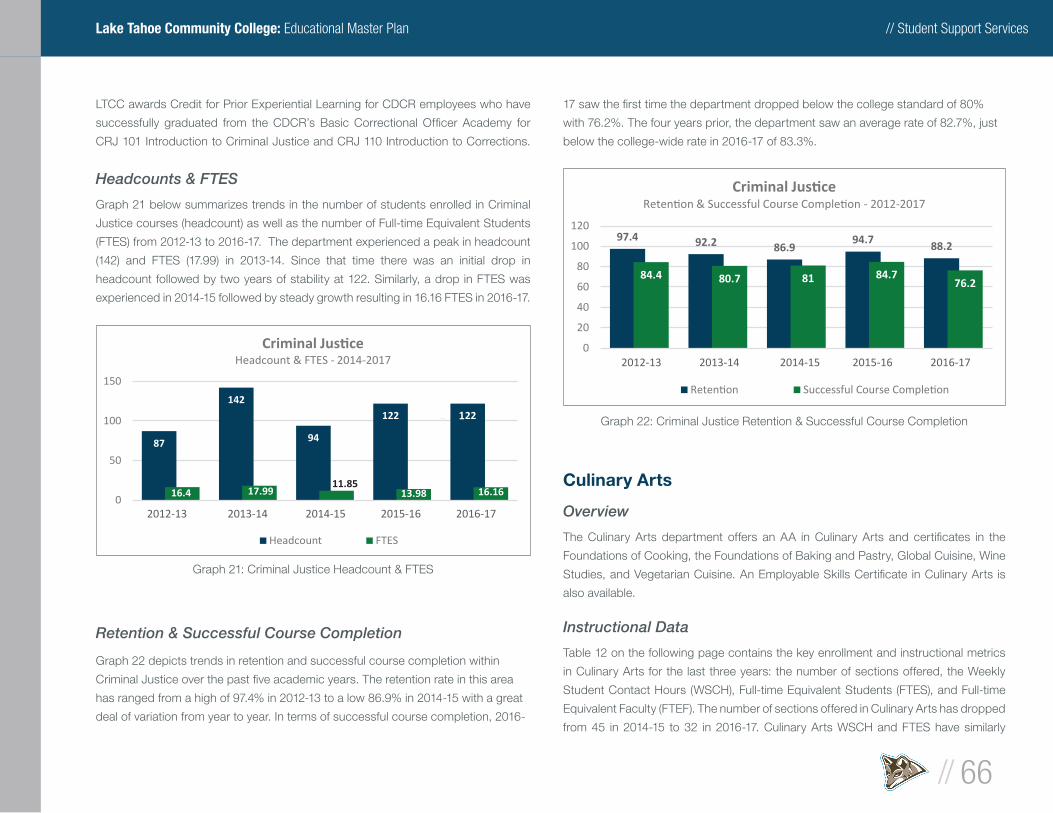
// Student Support Services
// 66
Lake Tahoe Community College: Educational Master Plan
LTCC awards Credit for Prior Experiential Learning for CDCR employees who have
successfully graduated from the CDCR’s Basic Correctional Offi cer Academy for
CRJ 101 Introduction to Criminal Justice and CRJ 110 Introduction to Corrections.
Headcounts & FTES
Graph 21 below summarizes trends in the number of students enrolled in Criminal
Justice courses (headcount) as well as the number of Full-time Equivalent Students
(FTES) from 2012-13 to 2016-17. The department experienced a peak in headcount
(142) and FTES (17.99) in 2013-14. Since that time there was an initial drop in
headcount followed by two years of stability at 122. Similarly, a drop in FTES was
experienced in 2014-15 followed by steady growth resulting in 16.16 FTES in 2016-17.
Retention & Successful Course Completion
Graph 22 depicts trends in retention and successful course completion within
Criminal Justice over the past fi ve academic years. The retention rate in this area
has ranged from a high of 97.4% in 2012-13 to a low 86.9% in 2014-15 with a great
deal of variation from year to year. In terms of successful course completion, 2016-
17 saw the fi rst time the department dropped below the college standard of 80%
with 76.2%. The four years prior, the department saw an average rate of 82.7%, just
below the college-wide rate in 2016-17 of 83.3%.
Culinary Arts
Overview
The Culinary Arts department offers an AA in Culinary Arts and certifi cates in the
Foundations of Cooking, the Foundations of Baking and Pastry, Global Cuisine, Wine
Studies, and Vegetarian Cuisine. An Employable Skills Certifi cate in Culinary Arts is
also available.
Instructional Data
Table 12 on the following page contains the key enrollment and instructional metrics
in Culinary Arts for the last three years: the number of sections offered, the Weekly
Student Contact Hours (WSCH), Full-time Equivalent Students (FTES), and Full-time
Equivalent Faculty (FTEF). The number of sections offered in Culinary Arts has dropped
from 45 in 2014-15 to 32 in 2016-17. Culinary Arts WSCH and FTES have similarly
87
142
94
1221 22
16.4 17.9911.85
13.98 16.160
50
100
150
2012-132 013-14 2014-152 015-16 2016-17
Headcount & FTES - 2014-2017
Headcount FTES
Graph 21: Criminal Justice Headcount & FTES
97.4 92.2 86.994.7 88.2
84.4 80.7 81 84.776.2
0
20
40
60
80
100
120
2012-132 013-14 2014-152 015-16 2016-17
- 2012-2017
Graph 22: Criminal Justice Retention & Successful Course Completion
» 2012-13 2013-14 2014-15 2015-16 2016-17
» 2012-13 2013-14 2014-15 2015-16 2016-17
» 1
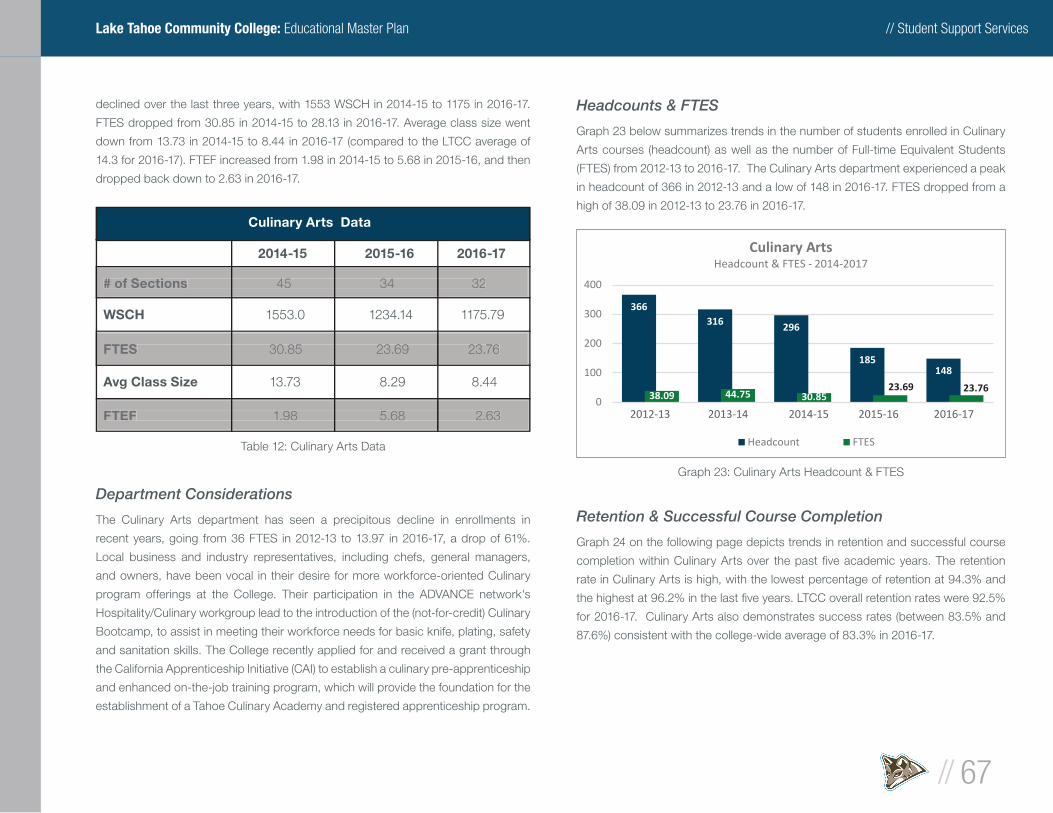
// Student Support Services
// 67
Lake Tahoe Community College: Educational Master Plan
declined over the last three years, with 1553 WSCH in 2014-15 to 1175 in 2016-17.
FTES dropped from 30.85 in 2014-15 to 28.13 in 2016-17. Average class size went
down from 13.73 in 2014-15 to 8.44 in 2016-17 (compared to the LTCC average of
14.3 for 2016-17). FTEF increased from 1.98 in 2014-15 to 5.68 in 2015-16, and then
dropped back down to 2.63 in 2016-17.
Department Considerations
The Culinary Arts department has seen a precipitous decline in enrollments in
recent years, going from 36 FTES in 2012-13 to 13.97 in 2016-17, a drop of 61%.
Local business and industry representatives, including chefs, general managers,
and owners, have been vocal in their desire for more workforce-oriented Culinary
program offerings at the College. Their participation in the ADVANCE network's
Hospitality/Culinary workgroup lead to the introduction of the (not-for-credit) Culinary
Bootcamp, to assist in meeting their workforce needs for basic knife, plating, safety
and sanitation skills. The College recently applied for and received a grant through
the California Apprenticeship Initiative (CAI) to establish a culinary pre-apprenticeship
and enhanced on-the-job training program, which will provide the foundation for the
establishment of a Tahoe Culinary Academy and registered apprenticeship program.
Headcounts & FTES
Graph 23 below summarizes trends in the number of students enrolled in Culinary
Arts courses (headcount) as well as the number of Full-time Equivalent Students
(FTES) from 2012-13 to 2016-17. The Culinary Arts department experienced a peak
in headcount of 366 in 2012-13 and a low of 148 in 2016-17. FTES dropped from a
high of 38.09 in 2012-13 to 23.76 in 2016-17.
Retention & Successful Course Completion
Graph 24 on the following page depicts trends in retention and successful course
completion within Culinary Arts over the past fi ve academic years. The retention
rate in Culinary Arts is high, with the lowest percentage of retention at 94.3% and
the highest at 96.2% in the last fi ve years. LTCC overall retention rates were 92.5%
for 2016-17. Culinary Arts also demonstrates success rates (between 83.5% and
87.6%) consistent with the college-wide average of 83.3% in 2016-17.
Culinary Arts Data
2014-15 2015-16 2016-17
# of Sections 45 34 32
WSCH 1553.0 1234.14 1175.79
FTES 30.85 23.69 23.76
Avg Class Size 13.73 8.29 8.44
FTEF 1.98 5.68 2.63
# of Sections# of Sections 45 34 32 45 34 32 45 34 32 45 34 32 45 34 32 45 34 32 45 34 32 45 34 32
FTESFTES 30.85 23.69 23.76 30.85 23.69 23.76 30.85 23.69 23.76 30.85 23.69 23.76 30.85 23.69 23.76 30.85 23.69 23.76 30.85 23.69 23.76 30.85 23.69 23.76
FTEFFTEF 1.98 5.68 2.63 1.98 5.68 2.63 1.98 5.68 2.63 1.98 5.68 2.63 1.98 5.68 2.63 1.98 5.68 2.63 1.98 5.68 2.63 1.98 5.68 2.63
Table 12: Culinary Arts Data
366316 296
185148
38.09 44.75 30.8523.69 23.76
0
100
200
300
400
2012-132 013-14 2014-152 015-16 2016-17
Culinary ArtsHeadcount & FTES - 2014-2017
Headcount FTES
Graph 23: Culinary Arts Headcount & FTES
» 2012-13 2013-14 2014-15 2015-16 2016-17
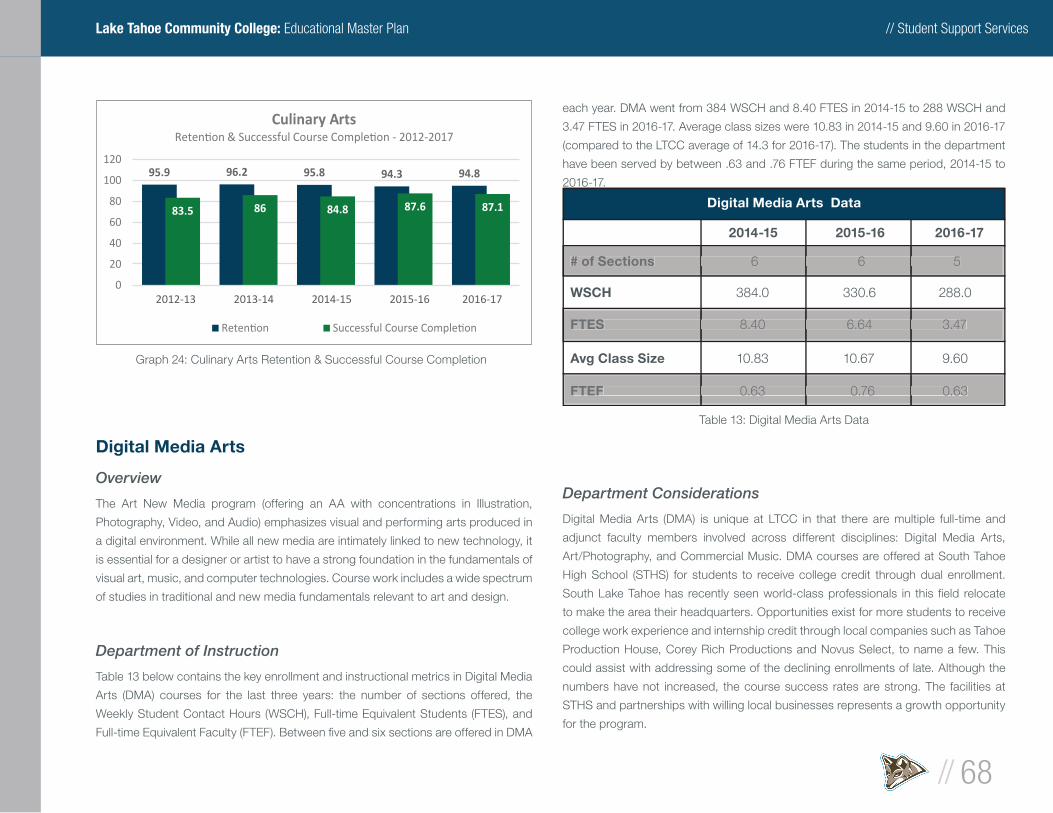
// Student Support Services
// 68
Lake Tahoe Community College: Educational Master Plan
Digital Media Arts
Overview
The Art New Media program (offering an AA with concentrations in Illustration,
Photography, Video, and Audio) emphasizes visual and performing arts produced in
a digital environment. While all new media are intimately linked to new technology, it
is essential for a designer or artist to have a strong foundation in the fundamentals of
visual art, music, and computer technologies. Course work includes a wide spectrum
of studies in traditional and new media fundamentals relevant to art and design.
Department of Instruction
Table 13 below contains the key enrollment and instructional metrics in Digital Media
Arts (DMA) courses for the last three years: the number of sections offered, the
Weekly Student Contact Hours (WSCH), Full-time Equivalent Students (FTES), and
Full-time Equivalent Faculty (FTEF). Between fi ve and six sections are offered in DMA
each year. DMA went from 384 WSCH and 8.40 FTES in 2014-15 to 288 WSCH and
3.47 FTES in 2016-17. Average class sizes were 10.83 in 2014-15 and 9.60 in 2016-17
(compared to the LTCC average of 14.3 for 2016-17). The students in the department
have been served by between .63 and .76 FTEF during the same period, 2014-15 to
2016-17.
Department Considerations
Digital Media Arts (DMA) is unique at LTCC in that there are multiple full-time and
adjunct faculty members involved across different disciplines: Digital Media Arts,
Art/Photography, and Commercial Music. DMA courses are offered at South Tahoe
High School (STHS) for students to receive college credit through dual enrollment.
South Lake Tahoe has recently seen world-class professionals in this fi eld relocate
to make the area their headquarters. Opportunities exist for more students to receive
college work experience and internship credit through local companies such as Tahoe
Production House, Corey Rich Productions and Novus Select, to name a few. This
could assist with addressing some of the declining enrollments of late. Although the
numbers have not increased, the course success rates are strong. The facilities at
STHS and partnerships with willing local businesses represents a growth opportunity
for the program.
95.9 96.2 95.8 94.3 94.8
83.5 86 84.8 87.6 87.1
0
20
40
60
80
100
120
2012-132 013-14 2014-152 015-16 2016-17
Culinary Arts- 2012-2017
Graph 24: Culinary Arts Retention & Successful Course Completion
Digital Media Arts Data
2014-15 2015-16 2016-17
# of Sections 6 6 5
WSCH 384.0 330.6 288.0
FTES 8.40 6.64 3.47
Avg Class Size 10.83 10.67 9.60
FTEF 0.63 0.76 0.63
# of Sections# of Sections 6 6 5 6 6 5 6 6 5 6 6 5 6 6 5 6 6 5 6 6 5 6 6 5
FTESFTES 8.40 6.64 3.47 8.40 6.64 3.47 8.40 6.64 3.47 8.40 6.64 3.47 8.40 6.64 3.47 8.40 6.64 3.47 8.40 6.64 3.47 8.40 6.64 3.47
FTEFFTEF 0.63 0.76 0.63 0.63 0.76 0.63 0.63 0.76 0.63 0.63 0.76 0.63 0.63 0.76 0.63 0.63 0.76 0.63 0.63 0.76 0.63 0.63 0.76 0.63
Table 13: Digital Media Arts Data
» 2012-13 2013-14 2014-15 2015-16 2016-17
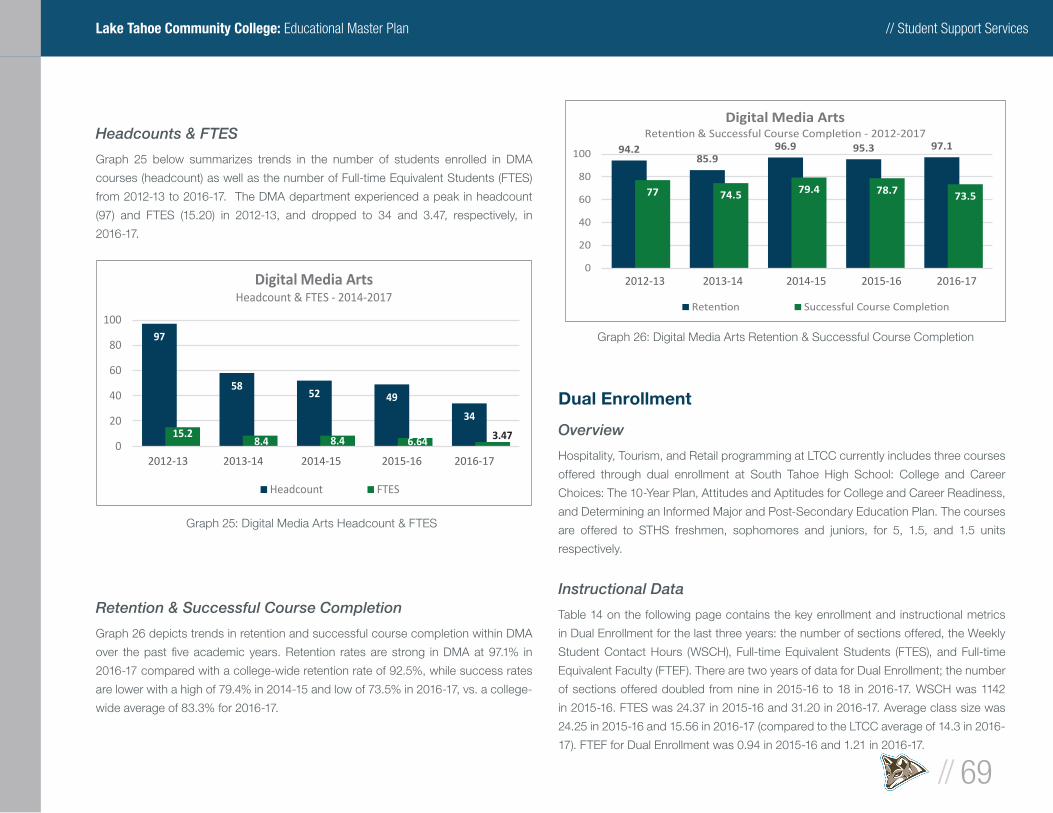
// Student Support Services
// 69
Lake Tahoe Community College: Educational Master Plan
Headcounts & FTES
Graph 25 below summarizes trends in the number of students enrolled in DMA
courses (headcount) as well as the number of Full-time Equivalent Students (FTES)
from 2012-13 to 2016-17. The DMA department experienced a peak in headcount
(97) and FTES (15.20) in 2012-13, and dropped to 34 and 3.47, respectively, in
2016-17.
Retention & Successful Course Completion
Graph 26 depicts trends in retention and successful course completion within DMA
over the past fi ve academic years. Retention rates are strong in DMA at 97.1% in
2016-17 compared with a college-wide retention rate of 92.5%, while success rates
are lower with a high of 79.4% in 2014-15 and low of 73.5% in 2016-17, vs. a college-
wide average of 83.3% for 2016-17.
Dual Enrollment
Overview
Hospitality, Tourism, and Retail programming at LTCC currently includes three courses
offered through dual enrollment at South Tahoe High School: College and Career
Choices: The 10-Year Plan, Attitudes and Aptitudes for College and Career Readiness,
and Determining an Informed Major and Post-Secondary Education Plan. The courses
are offered to STHS freshmen, sophomores and juniors, for 5, 1.5, and 1.5 units
respectively.
Instructional Data
Table 14 on the following page contains the key enrollment and instructional metrics
in Dual Enrollment for the last three years: the number of sections offered, the Weekly
Student Contact Hours (WSCH), Full-time Equivalent Students (FTES), and Full-time
Equivalent Faculty (FTEF). There are two years of data for Dual Enrollment; the number
of sections offered doubled from nine in 2015-16 to 18 in 2016-17. WSCH was 1142
in 2015-16. FTES was 24.37 in 2015-16 and 31.20 in 2016-17. Average class size was
24.25 in 2015-16 and 15.56 in 2016-17 (compared to the LTCC average of 14.3 in 2016-
17). FTEF for Dual Enrollment was 0.94 in 2015-16 and 1.21 in 2016-17.
97
5852 49
34
15.28.4 8.4 6.64 3.47
0
20
40
60
80
100
2012-132 013-14 2014-152 015-16 2016-17
Digital Media ArtsHeadcount & FTES - 2014-2017
Headcount FTES
Graph 25: Digital Media Arts Headcount & FTES
94.285.9
96.9 95.3 97.1
77 74.5 79.4 78.7 73.5
0
20
40
60
80
100
2012-132 013-14 2014-152 015-16 2016-17
Digital Media Arts- 2012-2017
Graph 26: Digital Media Arts Retention & Successful Course Completion
» 2012-13 2013-14 2014-15 2015-16 2016-17
» 2012-13 2013-14 2014-15 2015-16 2016-17
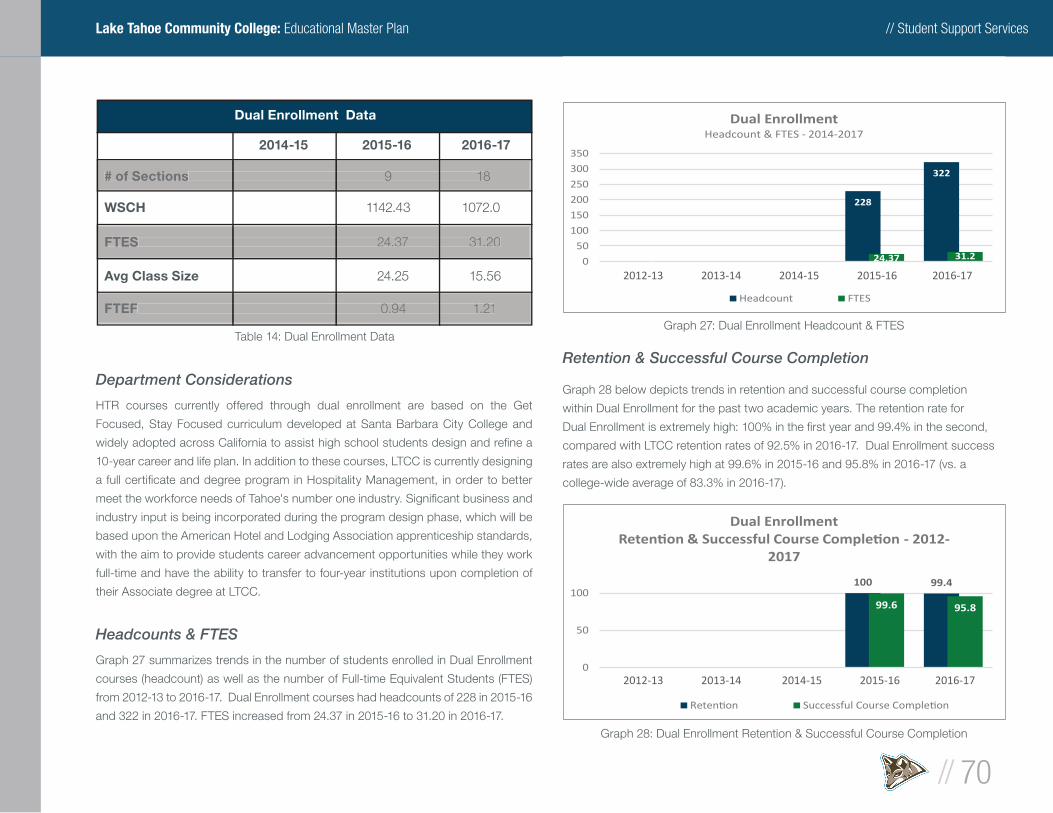
// Student Support Services
// 70
Lake Tahoe Community College: Educational Master Plan
00 0
228
322
0 0 024.37 31.20
50
100
150
200
250
300
350
2012-132 013-14 2014-152 015-16 2016-17
Dual EnrollmentHeadcount & FTES - 2014-2017
Headcount FTES
Department Considerations
HTR courses currently offered through dual enrollment are based on the Get
Focused, Stay Focused curriculum developed at Santa Barbara City College and
widely adopted across California to assist high school students design and refi ne a
10-year career and life plan. In addition to these courses, LTCC is currently designing
a full certifi cate and degree program in Hospitality Management, in order to better
meet the workforce needs of Tahoe's number one industry. Signifi cant business and
industry input is being incorporated during the program design phase, which will be
based upon the American Hotel and Lodging Association apprenticeship standards,
with the aim to provide students career advancement opportunities while they work
full-time and have the ability to transfer to four-year institutions upon completion of
their Associate degree at LTCC.
Headcounts & FTES
Graph 27 summarizes trends in the number of students enrolled in Dual Enrollment
courses (headcount) as well as the number of Full-time Equivalent Students (FTES)
from 2012-13 to 2016-17. Dual Enrollment courses had headcounts of 228 in 2015-16
and 322 in 2016-17. FTES increased from 24.37 in 2015-16 to 31.20 in 2016-17.
Retention & Successful Course Completion
Graph 28 below depicts trends in retention and successful course completion
within Dual Enrollment for the past two academic years. The retention rate for
Dual Enrollment is extremely high: 100% in the fi rst year and 99.4% in the second,
compared with LTCC retention rates of 92.5% in 2016-17. Dual Enrollment success
rates are also extremely high at 99.6% in 2015-16 and 95.8% in 2016-17 (vs. a
college-wide average of 83.3% in 2016-17).
Dual Enrollment Data
2014-15 2015-16 2016-17
# of Sections 9 18
WSCH 1142.43 1072.0
FTES 24.37 31.20
Avg Class Size 24.25 15.56
FTEF 0.94 1.21
# of Sections# of Sections 9 18 9 18 9 18 9 18 9 18 9 18 9 18 9 18
FTESFTES 24.37 31.20 24.37 31.20 24.37 31.20 24.37 31.20 24.37 31.20 24.37 31.20 24.37 31.20 24.37 31.20
FTEFFTEF 0.94 1.21 0.94 1.21 0.94 1.21 0.94 1.21 0.94 1.21 0.94 1.21 0.94 1.21 0.94 1.21
Table 14: Dual Enrollment Data
000
100 99.4
00 0
99.6 95.8
0
50
100
2012-132 013-14 2014-152 015-16 2016-17
Dual Enrollment- 2012-
2017
Graph 28: Dual Enrollment Retention & Successful Course Completion
Graph 27: Dual Enrollment Headcount & FTES
» 2012-13 2013-14 2014-15 2015-16 2016-17
» 2012-13 2013-14 2014-15 2015-16 2016-17
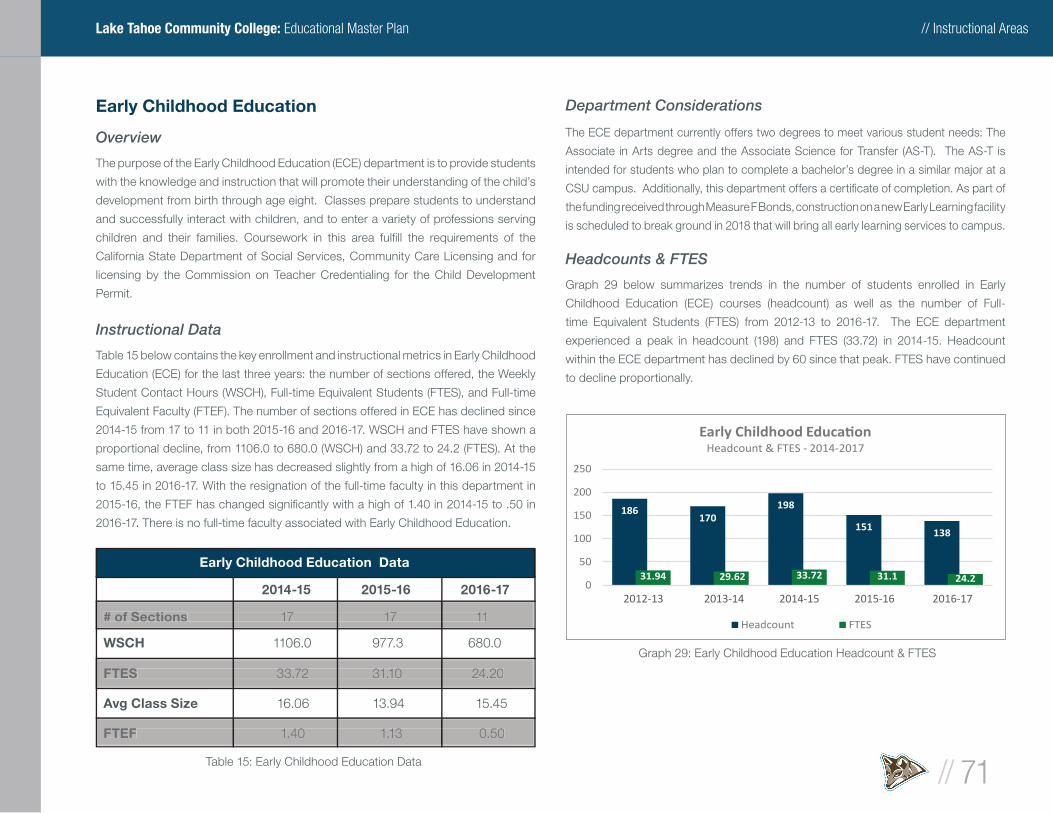
// Instructional Areas
// 71
Lake Tahoe Community College: Educational Master Plan
Early Childhood Education
Overview
The purpose of the Early Childhood Education (ECE) department is to provide students
with the knowledge and instruction that will promote their understanding of the child’s
development from birth through age eight. Classes prepare students to understand
and successfully interact with children, and to enter a variety of professions serving
children and their families. Coursework in this area fulfi ll the requirements of the
California State Department of Social Services, Community Care Licensing and for
licensing by the Commission on Teacher Credentialing for the Child Development
Permit.
Instructional Data
Table 15 below contains the key enrollment and instructional metrics in Early Childhood
Education (ECE) for the last three years: the number of sections offered, the Weekly
Student Contact Hours (WSCH), Full-time Equivalent Students (FTES), and Full-time
Equivalent Faculty (FTEF). The number of sections offered in ECE has declined since
2014-15 from 17 to 11 in both 2015-16 and 2016-17. WSCH and FTES have shown a
proportional decline, from 1106.0 to 680.0 (WSCH) and 33.72 to 24.2 (FTES). At the
same time, average class size has decreased slightly from a high of 16.06 in 2014-15
to 15.45 in 2016-17. With the resignation of the full-time faculty in this department in
2015-16, the FTEF has changed signifi cantly with a high of 1.40 in 2014-15 to .50 in
2016-17. There is no full-time faculty associated with Early Childhood Education.
Department Considerations
The ECE department currently offers two degrees to meet various student needs: The
Associate in Arts degree and the Associate Science for Transfer (AS-T). The AS-T is
intended for students who plan to complete a bachelor’s degree in a similar major at a
CSU campus. Additionally, this department offers a certifi cate of completion. As part of
the funding received through Measure F Bonds, construction on a new Early Learning facility
is scheduled to break ground in 2018 that will bring all early learning services to campus.
Headcounts & FTES
Graph 29 below summarizes trends in the number of students enrolled in Early
Childhood Education (ECE) courses (headcount) as well as the number of Full-
time Equivalent Students (FTES) from 2012-13 to 2016-17. The ECE department
experienced a peak in headcount (198) and FTES (33.72) in 2014-15. Headcount
within the ECE department has declined by 60 since that peak. FTES have continued
to decline proportionally.
Early Childhood Education Data
2014-15 2015-16 2016-17
# of Sections 17 17 11
WSCH 1106.0 977.3 680.0
FTES 33.72 31.10 24.20
Avg Class Size 16.06 13.94 15.45
FTEF 1.40 1.13 0.50
# of Sections# of Sections 17 17 11 17 17 11 17 17 11 17 17 11 17 17 11 17 17 11 17 17 11 17 17 11
FTESFTES 33.72 31.10 24.20 33.72 31.10 24.20 33.72 31.10 24.20 33.72 31.10 24.20 33.72 31.10 24.20 33.72 31.10 24.20 33.72 31.10 24.20 33.72 31.10 24.20
FTEFFTEF 1.40 1.13 0.50 1.40 1.13 0.50 1.40 1.13 0.50 1.40 1.13 0.50 1.40 1.13 0.50 1.40 1.13 0.50 1.40 1.13 0.50 1.40 1.13 0.50
Table 15: Early Childhood Education Data
186170
198
151 138
31.94 29.62 33.72 31.1 24.20
50
100
150
200
250
2012-132 013-14 2014-152 015-16 2016-17
Headcount & FTES - 2014-2017
Headcount FTES
Graph 29: Early Childhood Education Headcount & FTES
» 2012-13 2013-14 2014-15 2015-16 2016-17
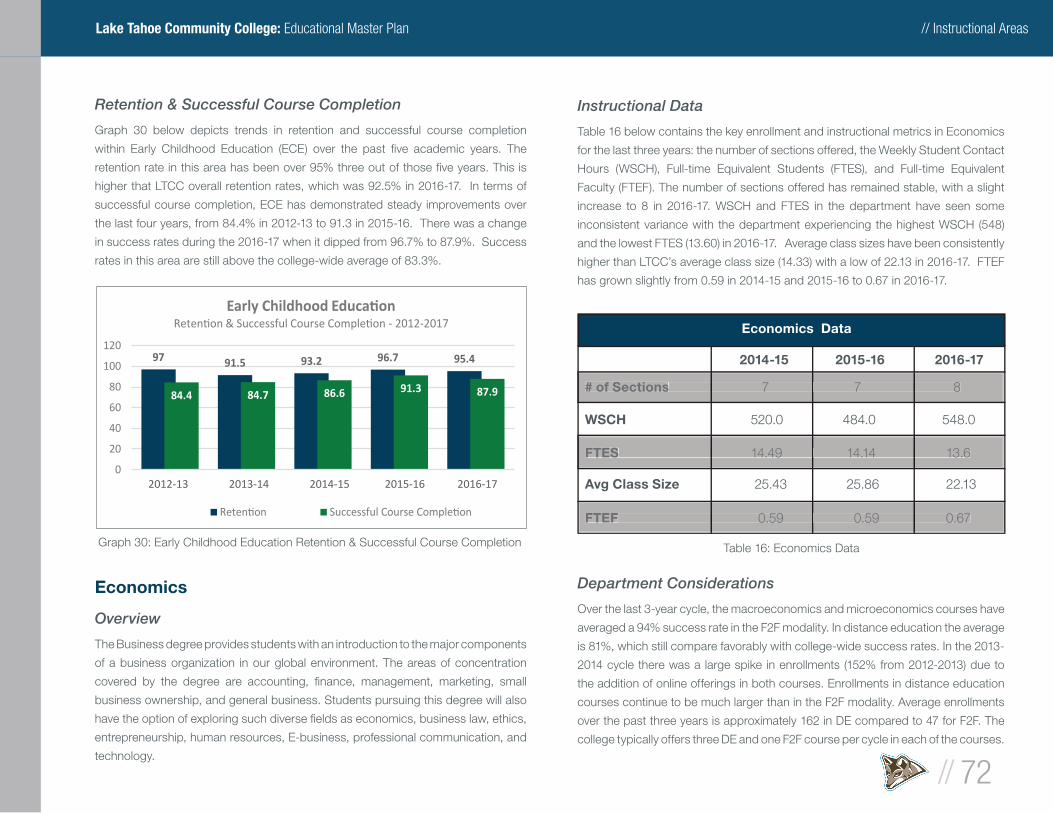
// Instructional Areas
// 72
Lake Tahoe Community College: Educational Master Plan
Retention & Successful Course Completion
Graph 30 below depicts trends in retention and successful course completion
within Early Childhood Education (ECE) over the past fi ve academic years. The
retention rate in this area has been over 95% three out of those fi ve years. This is
higher that LTCC overall retention rates, which was 92.5% in 2016-17. In terms of
successful course completion, ECE has demonstrated steady improvements over
the last four years, from 84.4% in 2012-13 to 91.3 in 2015-16. There was a change
in success rates during the 2016-17 when it dipped from 96.7% to 87.9%. Success
rates in this area are still above the college-wide average of 83.3%.
Economics
Overview
The Business degree provides students with an introduction to the major components
of a business organization in our global environment. The areas of concentration
covered by the degree are accounting, fi nance, management, marketing, small
business ownership, and general business. Students pursuing this degree will also
have the option of exploring such diverse fi elds as economics, business law, ethics,
entrepreneurship, human resources, E-business, professional communication, and
technology.
Instructional Data
Table 16 below contains the key enrollment and instructional metrics in Economics
for the last three years: the number of sections offered, the Weekly Student Contact
Hours (WSCH), Full-time Equivalent Students (FTES), and Full-time Equivalent
Faculty (FTEF). The number of sections offered has remained stable, with a slight
increase to 8 in 2016-17. WSCH and FTES in the department have seen some
inconsistent variance with the department experiencing the highest WSCH (548)
and the lowest FTES (13.60) in 2016-17. Average class sizes have been consistently
higher than LTCC’s average class size (14.33) with a low of 22.13 in 2016-17. FTEF
has grown slightly from 0.59 in 2014-15 and 2015-16 to 0.67 in 2016-17.
Department Considerations
Over the last 3-year cycle, the macroeconomics and microeconomics courses have
averaged a 94% success rate in the F2F modality. In distance education the average
is 81%, which still compare favorably with college-wide success rates. In the 2013-
2014 cycle there was a large spike in enrollments (152% from 2012-2013) due to
the addition of online offerings in both courses. Enrollments in distance education
courses continue to be much larger than in the F2F modality. Average enrollments
over the past three years is approximately 162 in DE compared to 47 for F2F. The
college typically offers three DE and one F2F course per cycle in each of the courses.
97 91.5 93.2 96.7 95.4
84.4 84.7 86.6 91.3 87.9
0
20
40
60
80
100
120
2012-132 013-14 2014-152 015-16 2016-17
- 2012-2017
Graph 30: Early Childhood Education Retention & Successful Course Completion
Economics Data
2014-15 2015-16 2016-17
# of Sections 7 7 8
WSCH 520.0 484.0 548.0
FTES 14.49 14.14 13.6
Avg Class Size 25.43 25.86 22.13
FTEF 0.59 0.59 0.67
# of Sections# of Sections 7 7 8 7 7 8 7 7 8 7 7 8 7 7 8 7 7 8 7 7 8 7 7 8
FTESFTES 14.49 14.14 13.6 14.49 14.14 13.6 14.49 14.14 13.6 14.49 14.14 13.6 14.49 14.14 13.6 14.49 14.14 13.6 14.49 14.14 13.6 14.49 14.14 13.6
FTEFFTEF 0.59 0.59 0.67 0.59 0.59 0.67 0.59 0.59 0.67 0.59 0.59 0.67 0.59 0.59 0.67 0.59 0.59 0.67 0.59 0.59 0.67 0.59 0.59 0.67
Table 16: Economics Data
» 2012-13 2013-14 2014-15 2015-16 2016-17
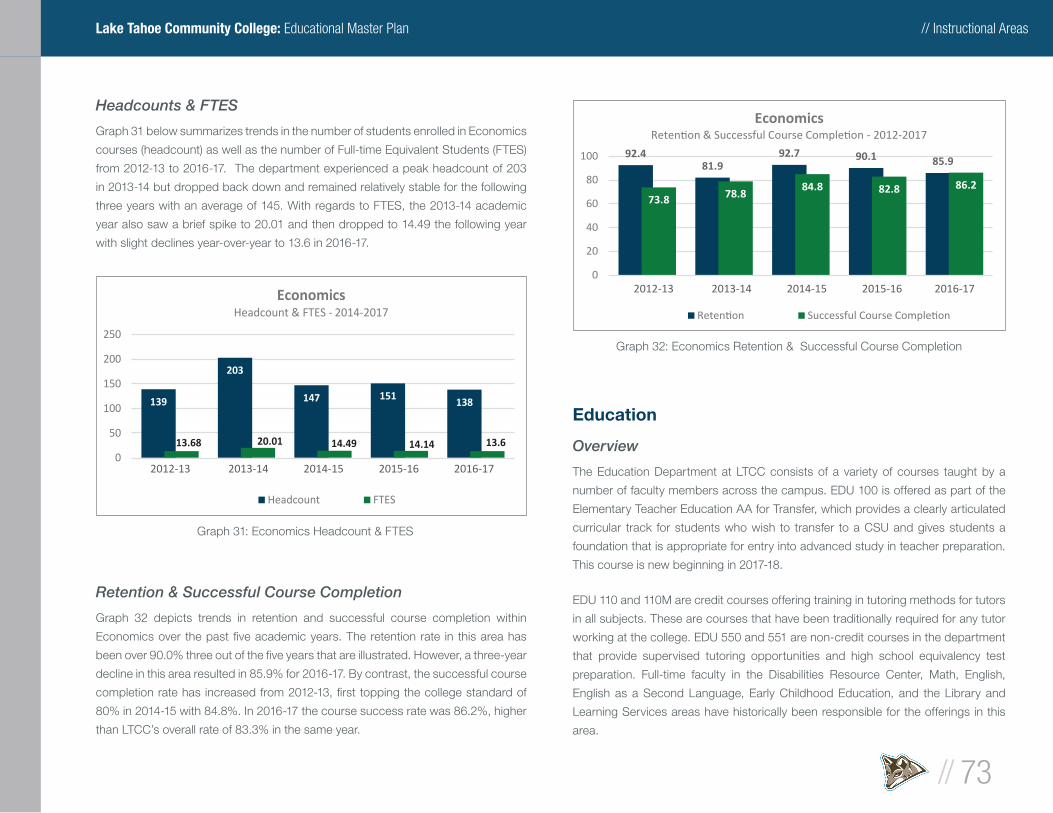
// Instructional Areas
// 73
Lake Tahoe Community College: Educational Master Plan
Headcounts & FTES
Graph 31 below summarizes trends in the number of students enrolled in Economics
courses (headcount) as well as the number of Full-time Equivalent Students (FTES)
from 2012-13 to 2016-17. The department experienced a peak headcount of 203
in 2013-14 but dropped back down and remained relatively stable for the following
three years with an average of 145. With regards to FTES, the 2013-14 academic
year also saw a brief spike to 20.01 and then dropped to 14.49 the following year
with slight declines year-over-year to 13.6 in 2016-17.
Retention & Successful Course Completion
Graph 32 depicts trends in retention and successful course completion within
Economics over the past fi ve academic years. The retention rate in this area has
been over 90.0% three out of the fi ve years that are illustrated. However, a three-year
decline in this area resulted in 85.9% for 2016-17. By contrast, the successful course
completion rate has increased from 2012-13, fi rst topping the college standard of
80% in 2014-15 with 84.8%. In 2016-17 the course success rate was 86.2%, higher
than LTCC’s overall rate of 83.3% in the same year.
Education
Overview
The Education Department at LTCC consists of a variety of courses taught by a
number of faculty members across the campus. EDU 100 is offered as part of the
Elementary Teacher Education AA for Transfer, which provides a clearly articulated
curricular track for students who wish to transfer to a CSU and gives students a
foundation that is appropriate for entry into advanced study in teacher preparation.
This course is new beginning in 2017-18.
EDU 110 and 110M are credit courses offering training in tutoring methods for tutors
in all subjects. These are courses that have been traditionally required for any tutor
working at the college. EDU 550 and 551 are non-credit courses in the department
that provide supervised tutoring opportunities and high school equivalency test
preparation. Full-time faculty in the Disabilities Resource Center, Math, English,
English as a Second Language, Early Childhood Education, and the Library and
Learning Services areas have historically been responsible for the offerings in this
area.
139
203
147 151 138
13.68 20.01 14.49 14.14 13.60
50
100
150
200
250
2012-132 013-14 2014-152 015-16 2016-17
EconomicsHeadcount & FTES - 2014-2017
Headcount FTES
Graph 31: Economics Headcount & FTES
92.481.9
92.7 90.1 85.9
73.8 78.884.8 82.8 86.2
0
20
40
60
80
100
2012-132 013-14 2014-152 015-16 2016-17
Economics- 2012-2017
Graph 32: Economics Retention & Successful Course Completion
» 2012-13 2013-14 2014-15 2015-16 2016-17
» 2012-13 2013-14 2014-15 2015-16 2016-17
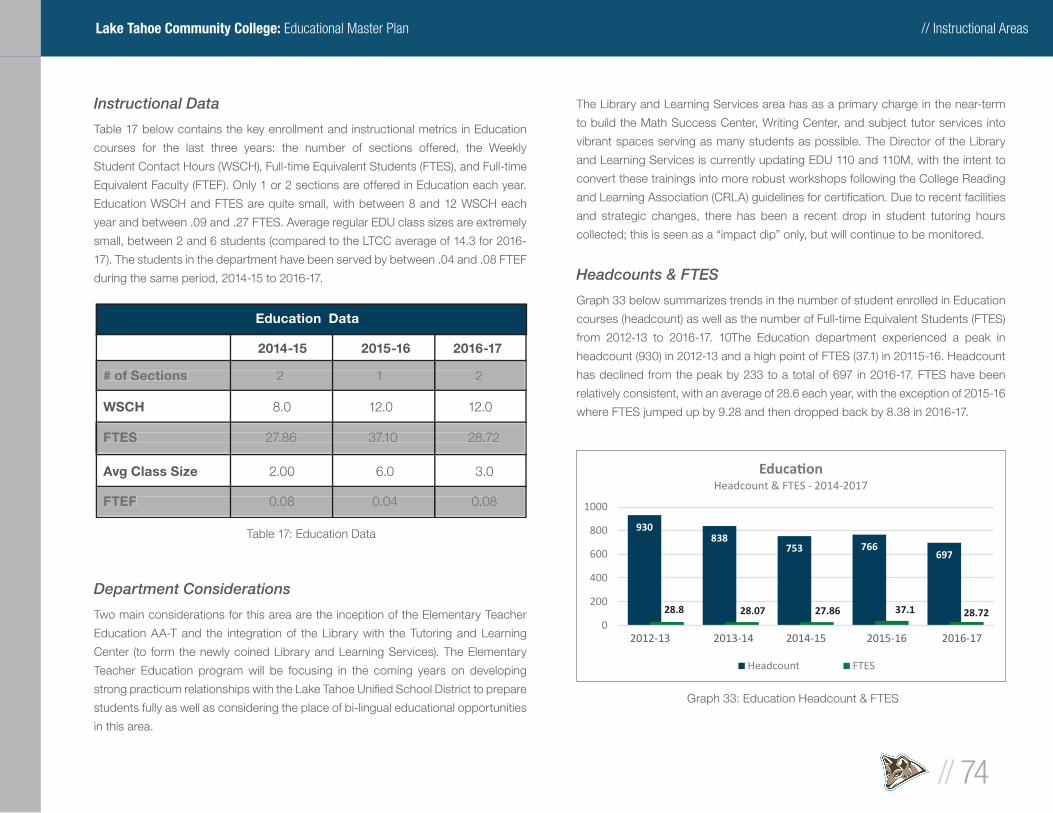
// Instructional Areas
// 74
Lake Tahoe Community College: Educational Master Plan
Instructional Data
Table 17 below contains the key enrollment and instructional metrics in Education
courses for the last three years: the number of sections offered, the Weekly
Student Contact Hours (WSCH), Full-time Equivalent Students (FTES), and Full-time
Equivalent Faculty (FTEF). Only 1 or 2 sections are offered in Education each year.
Education WSCH and FTES are quite small, with between 8 and 12 WSCH each
year and between .09 and .27 FTES. Average regular EDU class sizes are extremely
small, between 2 and 6 students (compared to the LTCC average of 14.3 for 2016-
17). The students in the department have been served by between .04 and .08 FTEF
during the same period, 2014-15 to 2016-17.
Department Considerations
Two main considerations for this area are the inception of the Elementary Teacher
Education AA-T and the integration of the Library with the Tutoring and Learning
Center (to form the newly coined Library and Learning Services). The Elementary
Teacher Education program will be focusing in the coming years on developing
strong practicum relationships with the Lake Tahoe Unifi ed School District to prepare
students fully as well as considering the place of bi-lingual educational opportunities
in this area.
The Library and Learning Services area has as a primary charge in the near-term
to build the Math Success Center, Writing Center, and subject tutor services into
vibrant spaces serving as many students as possible. The Director of the Library
and Learning Services is currently updating EDU 110 and 110M, with the intent to
convert these trainings into more robust workshops following the College Reading
and Learning Association (CRLA) guidelines for certifi cation. Due to recent facilities
and strategic changes, there has been a recent drop in student tutoring hours
collected; this is seen as a “impact dip” only, but will continue to be monitored.
Headcounts & FTES
Graph 33 below summarizes trends in the number of student enrolled in Education
courses (headcount) as well as the number of Full-time Equivalent Students (FTES)
from 2012-13 to 2016-17. 10The Education department experienced a peak in
headcount (930) in 2012-13 and a high point of FTES (37.1) in 20115-16. Headcount
has declined from the peak by 233 to a total of 697 in 2016-17. FTES have been
relatively consistent, with an average of 28.6 each year, with the exception of 2015-16
where FTES jumped up by 9.28 and then dropped back by 8.38 in 2016-17.
Education Data
2014-15 2015-16 2016-17
# of Sections 2 1 2
WSCH 8.0 12.0 12.0
FTES 27.86 37.10 28.72
Avg Class Size 2.00 6.0 3.0
FTEF 0.08 0.04 0.08
# of Sections# of Sections 2 1 2 2 1 2 2 1 2 2 1 2 2 1 2 2 1 2 2 1 2 2 1 2
FTESFTES 27.86 37.10 28.72 27.86 37.10 28.72 27.86 37.10 28.72 27.86 37.10 28.72 27.86 37.10 28.72 27.86 37.10 28.72 27.86 37.10 28.72 27.86 37.10 28.72
FTEFFTEF 0.08 0.04 0.08 0.08 0.04 0.08 0.08 0.04 0.08 0.08 0.04 0.08 0.08 0.04 0.08 0.08 0.04 0.08 0.08 0.04 0.08 0.08 0.04 0.08
Table 17: Education Data930
838753 766
697
28.8 28.07 27.86 37.1 28.720
200
400
600
800
1000
2012-132 013-14 2014-152 015-16 2016-17
Headcount & FTES - 2014-2017
Headcount FTES
Graph 33: Education Headcount & FTES
» 2012-13 2013-14 2014-15 2015-16 2016-17
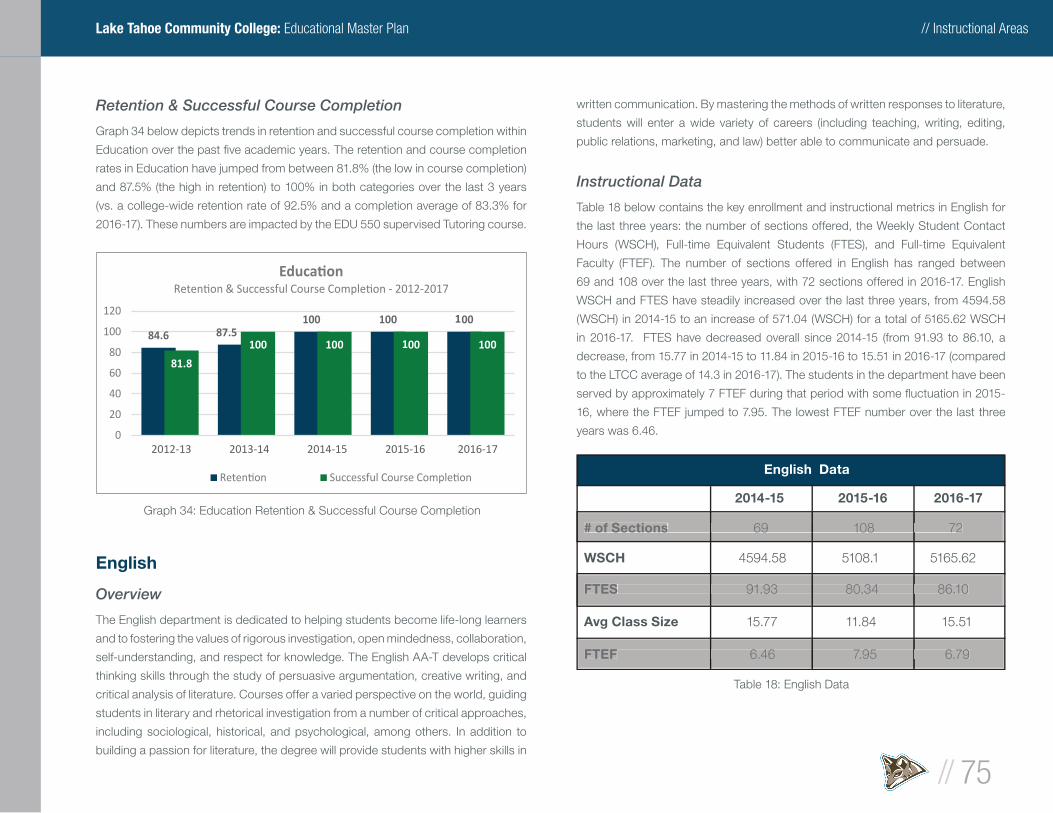
// Instructional Areas
// 75
Lake Tahoe Community College: Educational Master Plan
Retention & Successful Course Completion
Graph 34 below depicts trends in retention and successful course completion within
Education over the past fi ve academic years. The retention and course completion
rates in Education have jumped from between 81.8% (the low in course completion)
and 87.5% (the high in retention) to 100% in both categories over the last 3 years
(vs. a college-wide retention rate of 92.5% and a completion average of 83.3% for
2016-17). These numbers are impacted by the EDU 550 supervised Tutoring course.
English
Overview
The English department is dedicated to helping students become life-long learners
and to fostering the values of rigorous investigation, open mindedness, collaboration,
self-understanding, and respect for knowledge. The English AA-T develops critical
thinking skills through the study of persuasive argumentation, creative writing, and
critical analysis of literature. Courses offer a varied perspective on the world, guiding
students in literary and rhetorical investigation from a number of critical approaches,
including sociological, historical, and psychological, among others. In addition to
building a passion for literature, the degree will provide students with higher skills in
written communication. By mastering the methods of written responses to literature,
students will enter a wide variety of careers (including teaching, writing, editing,
public relations, marketing, and law) better able to communicate and persuade.
Instructional Data
Table 18 below contains the key enrollment and instructional metrics in English for
the last three years: the number of sections offered, the Weekly Student Contact
Hours (WSCH), Full-time Equivalent Students (FTES), and Full-time Equivalent
Faculty (FTEF). The number of sections offered in English has ranged between
69 and 108 over the last three years, with 72 sections offered in 2016-17. English
WSCH and FTES have steadily increased over the last three years, from 4594.58
(WSCH) in 2014-15 to an increase of 571.04 (WSCH) for a total of 5165.62 WSCH
in 2016-17. FTES have decreased overall since 2014-15 (from 91.93 to 86.10, a
decrease, from 15.77 in 2014-15 to 11.84 in 2015-16 to 15.51 in 2016-17 (compared
to the LTCC average of 14.3 in 2016-17). The students in the department have been
served by approximately 7 FTEF during that period with some fl uctuation in 2015-
16, where the FTEF jumped to 7.95. The lowest FTEF number over the last three
years was 6.46.
84.6 87.5100 1001 00
81.8
100 1001 00 100
0
20
40
60
80
100
120
2012-132 013-14 2014-152 015-16 2016-17
- 2012-2017
Graph 34: Education Retention & Successful Course Completion
English Data
2014-15 2015-16 2016-17
# of Sections 69 108 72
WSCH 4594.58 5108.1 5165.62
FTES 91.93 80.34 86.10
Avg Class Size 15.77 11.84 15.51
FTEF 6.46 7.95 6.79
# of Sections# of Sections 69 108 72 69 108 72 69 108 72 69 108 72 69 108 72 69 108 72 69 108 72 69 108 72
FTESFTES 91.93 80.34 86.10 91.93 80.34 86.10 91.93 80.34 86.10 91.93 80.34 86.10 91.93 80.34 86.10 91.93 80.34 86.10 91.93 80.34 86.10 91.93 80.34 86.10
FTEFFTEF 6.46 7.95 6.79 6.46 7.95 6.79 6.46 7.95 6.79 6.46 7.95 6.79 6.46 7.95 6.79 6.46 7.95 6.79 6.46 7.95 6.79 6.46 7.95 6.79
Table 18: English Data
» 2012-13 2013-14 2014-15 2015-16 2016-17
1
1
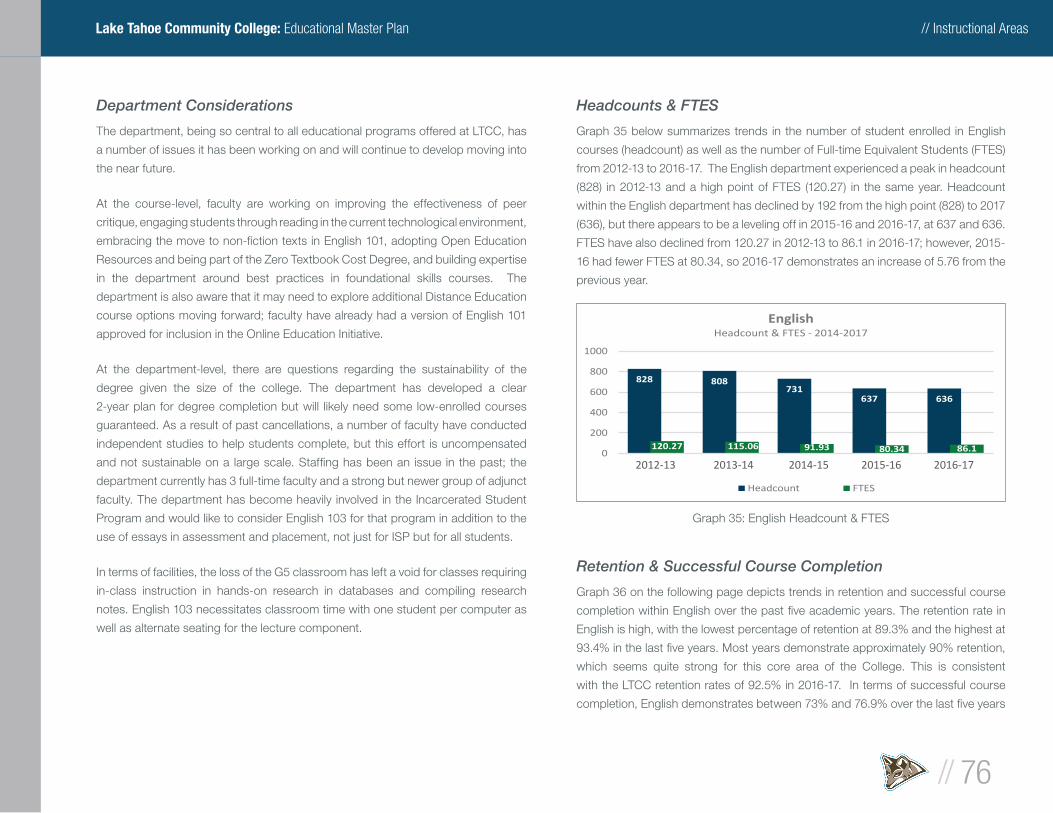
// Instructional Areas
// 76
Lake Tahoe Community College: Educational Master Plan
Department Considerations
The department, being so central to all educational programs offered at LTCC, has
a number of issues it has been working on and will continue to develop moving into
the near future.
At the course-level, faculty are working on improving the effectiveness of peer
critique, engaging students through reading in the current technological environment,
embracing the move to non-fi ction texts in English 101, adopting Open Education
Resources and being part of the Zero Textbook Cost Degree, and building expertise
in the department around best practices in foundational skills courses. The
department is also aware that it may need to explore additional Distance Education
course options moving forward; faculty have already had a version of English 101
approved for inclusion in the Online Education Initiative.
At the department-level, there are questions regarding the sustainability of the
degree given the size of the college. The department has developed a clear
2-year plan for degree completion but will likely need some low-enrolled courses
guaranteed. As a result of past cancellations, a number of faculty have conducted
independent studies to help students complete, but this effort is uncompensated
and not sustainable on a large scale. Staffi ng has been an issue in the past; the
department currently has 3 full-time faculty and a strong but newer group of adjunct
faculty. The department has become heavily involved in the Incarcerated Student
Program and would like to consider English 103 for that program in addition to the
use of essays in assessment and placement, not just for ISP but for all students.
In terms of facilities, the loss of the G5 classroom has left a void for classes requiring
in-class instruction in hands-on research in databases and compiling research
notes. English 103 necessitates classroom time with one student per computer as
well as alternate seating for the lecture component.
Headcounts & FTES
Graph 35 below summarizes trends in the number of student enrolled in English
courses (headcount) as well as the number of Full-time Equivalent Students (FTES)
from 2012-13 to 2016-17. The English department experienced a peak in headcount
(828) in 2012-13 and a high point of FTES (120.27) in the same year. Headcount
within the English department has declined by 192 from the high point (828) to 2017
(636), but there appears to be a leveling off in 2015-16 and 2016-17, at 637 and 636.
FTES have also declined from 120.27 in 2012-13 to 86.1 in 2016-17; however, 2015-
16 had fewer FTES at 80.34, so 2016-17 demonstrates an increase of 5.76 from the
previous year.
Retention & Successful Course Completion
Graph 36 on the following page depicts trends in retention and successful course
completion within English over the past fi ve academic years. The retention rate in
English is high, with the lowest percentage of retention at 89.3% and the highest at
93.4% in the last fi ve years. Most years demonstrate approximately 90% retention,
which seems quite strong for this core area of the College. This is consistent
with the LTCC retention rates of 92.5% in 2016-17. In terms of successful course
completion, English demonstrates between 73% and 76.9% over the last fi ve years
828 808731
637 636
120.27 115.06 91.93 80.34 86.10
200
400
600
800
1000
2012-132 013-14 2014-152 015-16 2016-17
EnglishHeadcount & FTES - 2014-2017
Headcount FTES
Graph 35: English Headcount & FTES
» 2012-13 2013-14 2014-15 2015-16 2016-17

// Instructional Areas
// 77
Lake Tahoe Community College: Educational Master Plan
(vs. a college-wide average of 83.3% in 2016-17). These success rates appear to be
appropriate for the subject area, and the department is conscious of the importance
of student preparedness in English for their success across disciplines.
English as a Second Language
Overview
The Non-Credit English as a Second Language (NCESL) program at Lake Tahoe
Community College strives to assist non-native English speaking students to
become profi cient in English in the minimum time possible. The program is designed
as a series of sequential courses, ranging from Low Beginning through Advanced
levels, providing instruction in listening, speaking, reading and writing, along with
U.S. Citizenship and High School Equivalency (HSE) preparation in both English and
Spanish.
Instructional Data
Table 19 contains the key enrollment and instructional metrics in English as a
Second Language (ESL) for the last three years: the number of sections offered, the
Weekly Student Contact Hours (WSCH), Full-time Equivalent Students (FTES), and
Full-time Equivalent Faculty (FTEF). The number of sections offered in ESL was 28
in 2014-15 and 25 in 2016-17. ESL WSCH and FTES have decreased dramatically
over the last three years, from 3505 WSCH in 2014-15 to 2157 WSCH in 2016-17.
FTES have also decreased precipitously since 2014-15 (32.34) to 16.77 in 2016-17.
Average class sizes have dropped as well, from 21.50 in 2014-15 to 15.10 in 2016-
17 (still comparing favorably to the LTCC average of 14.3 for 2016-17). The students
in the ESL department have been served by between 1.42 and 2.43 FTEF during
that period.
Department Considerations
The ESL department has experienced a signifi cant decline in enrollment and FTES
generated last year and in recent quarters. Staff believe that this to be the result of
several factors; the increase in jobs available in the basin due to the positive state
of the economy (typically the better the economy and more open jobs, the lower
numbers of students coming to study English), the political climate, and potentially
fewer Latinos moving into the area. The ESL department has partnered with the
ADVANCE network on campus to assist with funding non-credit coursework. In
addition, having HSE testing available in the South Shore has facilitated students
taking the test and passing, both in Spanish and in English. Recently the NCESL
93.4 90 90.7 89.3 90.5
74.1 74.7 73 76.9 74.8
0
20
40
60
80
100
2012-132 013-14 2014-152 015-16 2016-17
English- 2012-2017
Graph 36: English Retention & Success Course Completion
English as a Second Language Data
2014-15 2015-16 2016-17
# of Sections 28 26 25
WSCH 3505.0 2613.0 2157.0
FTES 32.34 23.81 16.71
Avg Class Size 21.50 17.5 15.10
FTEF 1.42 1.47 2.43
# of Sections# of Sections 28 26 25 28 26 25 28 26 25 28 26 25 28 26 25 28 26 25 28 26 25 28 26 25
FTESFTES 32.34 23.81 16.71 32.34 23.81 16.71 32.34 23.81 16.71 32.34 23.81 16.71 32.34 23.81 16.71 32.34 23.81 16.71 32.34 23.81 16.71 32.34 23.81 16.71
FTEFFTEF 1.42 1.47 2.43 1.42 1.47 2.43 1.42 1.47 2.43 1.42 1.47 2.43 1.42 1.47 2.43 1.42 1.47 2.43 1.42 1.47 2.43 1.42 1.47 2.43
Table 19: English as a Second Language Data
» 2012-13 2013-14 2014-15 2015-16 2016-17
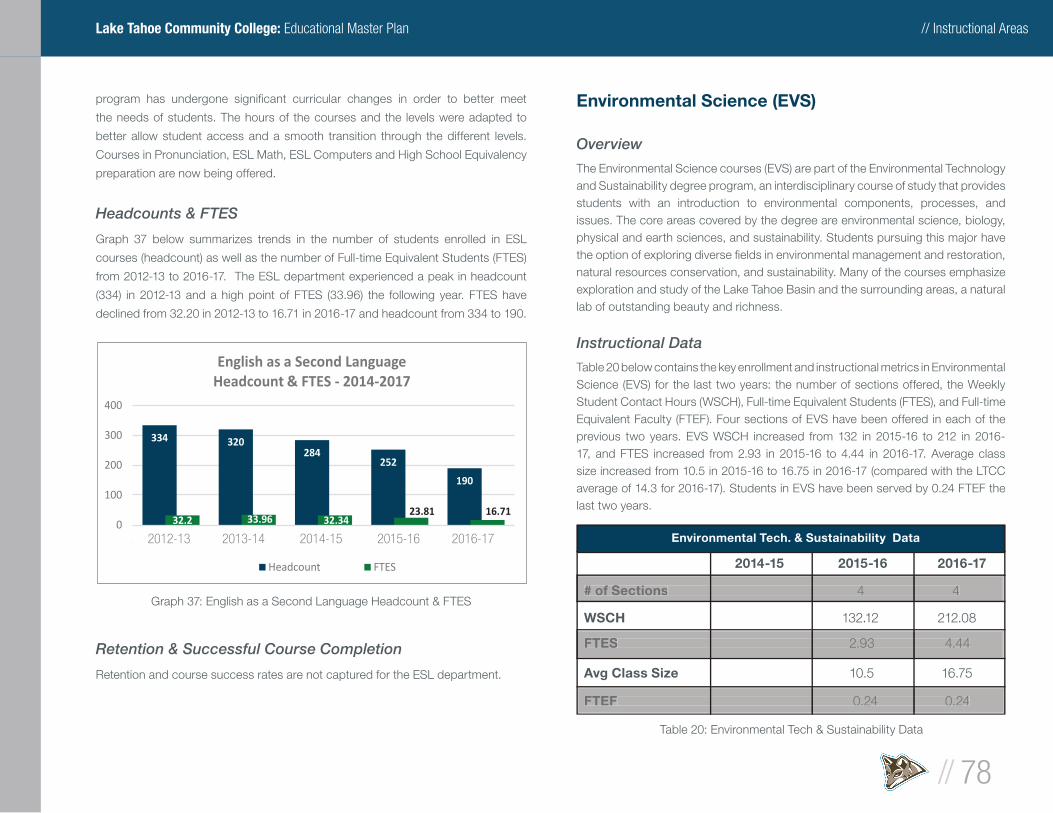
// Instructional Areas
// 78
Lake Tahoe Community College: Educational Master Plan
program has undergone signifi cant curricular changes in order to better meet
the needs of students. The hours of the courses and the levels were adapted to
better allow student access and a smooth transition through the different levels.
Courses in Pronunciation, ESL Math, ESL Computers and High School Equivalency
preparation are now being offered.
Headcounts & FTES
Graph 37 below summarizes trends in the number of students enrolled in ESL
courses (headcount) as well as the number of Full-time Equivalent Students (FTES)
from 2012-13 to 2016-17. The ESL department experienced a peak in headcount
(334) in 2012-13 and a high point of FTES (33.96) the following year. FTES have
declined from 32.20 in 2012-13 to 16.71 in 2016-17 and headcount from 334 to 190.
Retention & Successful Course Completion
Retention and course success rates are not captured for the ESL department.
Environmental Science (EVS)
Overview
The Environmental Science courses (EVS) are part of the Environmental Technology and Sustainability degree program, an interdisciplinary course of study that provides students with an introduction to environmental components, processes, and issues. The core areas covered by the degree are environmental science, biology, physical and earth sciences, and sustainability. Students pursuing this major have the option of exploring diverse fi elds in environmental management and restoration, natural resources conservation, and sustainability. Many of the courses emphasize exploration and study of the Lake Tahoe Basin and the surrounding areas, a natural lab of outstanding beauty and richness.
Instructional Data
Table 20 below contains the key enrollment and instructional metrics in Environmental Science (EVS) for the last two years: the number of sections offered, the Weekly Student Contact Hours (WSCH), Full-time Equivalent Students (FTES), and Full-time Equivalent Faculty (FTEF). Four sections of EVS have been offered in each of the previous two years. EVS WSCH increased from 132 in 2015-16 to 212 in 2016-17, and FTES increased from 2.93 in 2015-16 to 4.44 in 2016-17. Average class size increased from 10.5 in 2015-16 to 16.75 in 2016-17 (compared with the LTCC average of 14.3 for 2016-17). Students in EVS have been served by 0.24 FTEF the last two years.
334 320284
252
190
32.2 33.96 32.3423.81 16.71
0
100
200
300
400
2012-132 013-14 2014-152 015-16 2016-17
English as a Second LanguageHeadcount & FTES - 2014-2017
Headcount FTES
Graph 37: English as a Second Language Headcount & FTES
Environmental Tech. & Sustainability Data
2014-15 2015-16 2016-17
# of Sections 4 4
WSCH 132.12 212.08
FTES 2.93 4.44
Avg Class Size 10.5 16.75
FTEF 0.24 0.24
# of Sections# of Sections 4 4 4 4 4 4 4 4 4 4 4 4 4 4 4 4
FTESFTES 2.93 4.44 2.93 4.44 2.93 4.44 2.93 4.44 2.93 4.44 2.93 4.44 2.93 4.44 2.93 4.44
FTEFFTEF 0.24 0.24 0.24 0.24 0.24 0.24 0.24 0.24 0.24 0.24 0.24 0.24 0.24 0.24 0.24 0.24
Table 20: Environmental Tech & Sustainability Data
» 2012-13 2013-14 2014-15 2015-16 2016-17
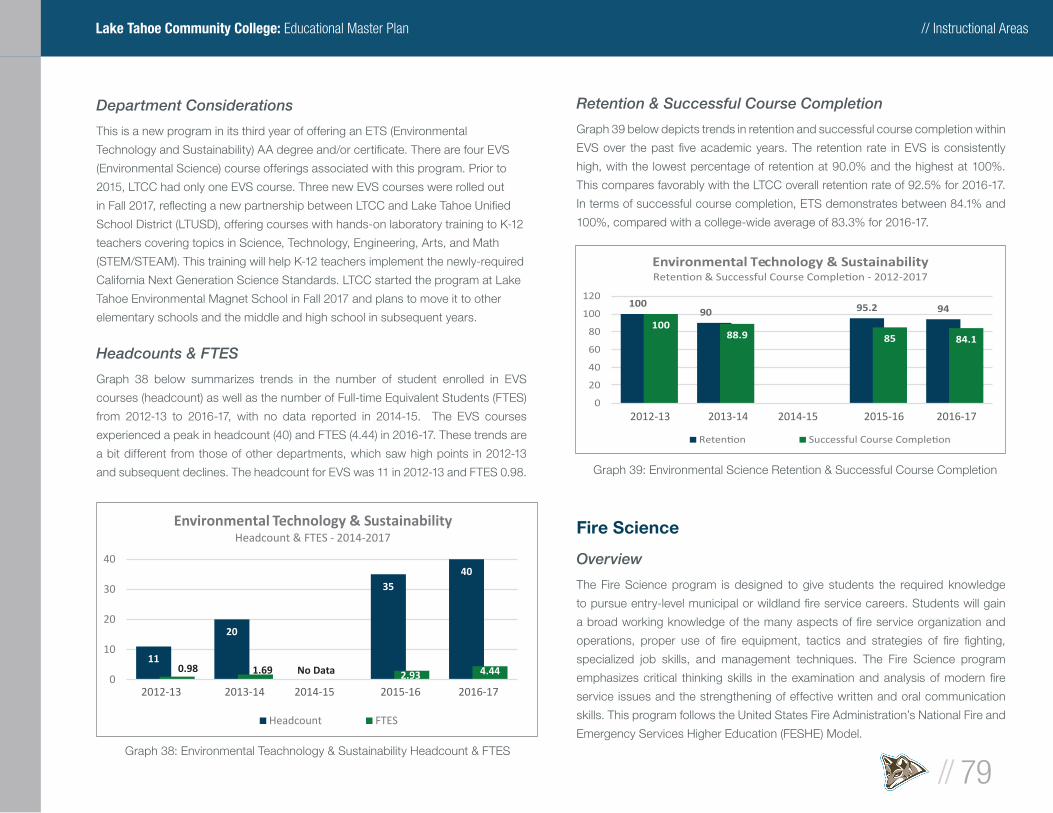
// Instructional Areas
// 79
Lake Tahoe Community College: Educational Master Plan
Department Considerations
This is a new program in its third year of offering an ETS (Environmental
Technology and Sustainability) AA degree and/or certifi cate. There are four EVS
(Environmental Science) course offerings associated with this program. Prior to
2015, LTCC had only one EVS course. Three new EVS courses were rolled out
in Fall 2017, refl ecting a new partnership between LTCC and Lake Tahoe Unifi ed
School District (LTUSD), offering courses with hands-on laboratory training to K-12
teachers covering topics in Science, Technology, Engineering, Arts, and Math
(STEM/STEAM). This training will help K-12 teachers implement the newly-required
California Next Generation Science Standards. LTCC started the program at Lake
Tahoe Environmental Magnet School in Fall 2017 and plans to move it to other
elementary schools and the middle and high school in subsequent years.
Headcounts & FTES
Graph 38 below summarizes trends in the number of student enrolled in EVS
courses (headcount) as well as the number of Full-time Equivalent Students (FTES)
from 2012-13 to 2016-17, with no data reported in 2014-15. The EVS courses
experienced a peak in headcount (40) and FTES (4.44) in 2016-17. These trends are
a bit different from those of other departments, which saw high points in 2012-13
and subsequent declines. The headcount for EVS was 11 in 2012-13 and FTES 0.98.
Retention & Successful Course Completion
Graph 39 below depicts trends in retention and successful course completion within
EVS over the past fi ve academic years. The retention rate in EVS is consistently
high, with the lowest percentage of retention at 90.0% and the highest at 100%.
This compares favorably with the LTCC overall retention rate of 92.5% for 2016-17.
In terms of successful course completion, ETS demonstrates between 84.1% and
100%, compared with a college-wide average of 83.3% for 2016-17.
Fire Science
Overview
The Fire Science program is designed to give students the required knowledge
to pursue entry-level municipal or wildland fi re service careers. Students will gain
a broad working knowledge of the many aspects of fi re service organization and
operations, proper use of fi re equipment, tactics and strategies of fi re fi ghting,
specialized job skills, and management techniques. The Fire Science program
emphasizes critical thinking skills in the examination and analysis of modern fi re
service issues and the strengthening of effective written and oral communication
skills. This program follows the United States Fire Administration’s National Fire and
Emergency Services Higher Education (FESHE) Model.
11
20
No Data
3540
0.98 1.690
2.93 4.440
10
20
30
40
2012-132 013-14 2014-152 015-16 2016-17
Environmental Technology & SustainabilityHeadcount & FTES - 2014-2017
Headcount FTES
Graph 38: Environmental Teachnology & Sustainability Headcount & FTES
10090 95.2 94
10088.9
0
85 84.1
0
20
40
60
80
100
120
2012-132 013-14 2014-152 015-16 2016-17
Environmental Technology & Sustainability- 2012-2017
Graph 39: Environmental Science Retention & Successful Course Completion
» 2012-13 2013-14 2014-15 2015-16 2016-17
» 2012-13 2013-14 2014-15 2015-16 2016-17
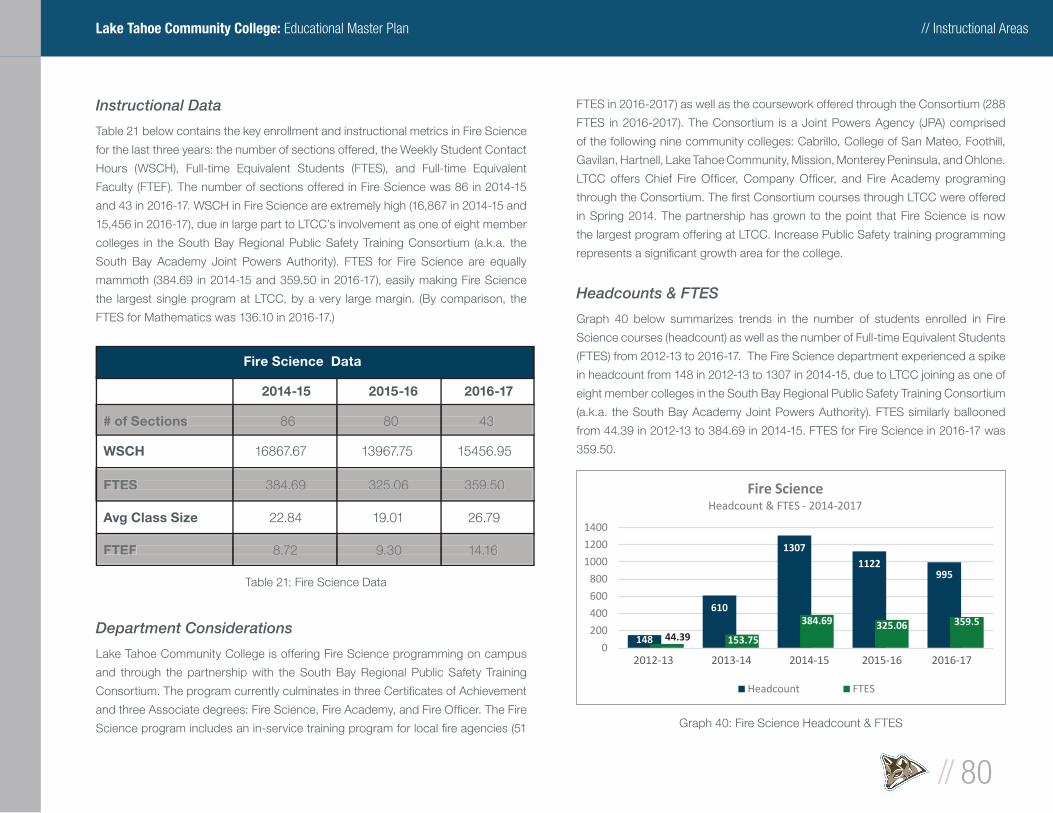
// Instructional Areas
// 80
Lake Tahoe Community College: Educational Master Plan
Instructional Data
Table 21 below contains the key enrollment and instructional metrics in Fire Science
for the last three years: the number of sections offered, the Weekly Student Contact
Hours (WSCH), Full-time Equivalent Students (FTES), and Full-time Equivalent
Faculty (FTEF). The number of sections offered in Fire Science was 86 in 2014-15
and 43 in 2016-17. WSCH in Fire Science are extremely high (16,867 in 2014-15 and
15,456 in 2016-17), due in large part to LTCC’s involvement as one of eight member
colleges in the South Bay Regional Public Safety Training Consortium (a.k.a. the
South Bay Academy Joint Powers Authority). FTES for Fire Science are equally
mammoth (384.69 in 2014-15 and 359.50 in 2016-17), easily making Fire Science
the largest single program at LTCC, by a very large margin. (By comparison, the
FTES for Mathematics was 136.10 in 2016-17.)
Department Considerations
Lake Tahoe Community College is offering Fire Science programming on campus
and through the partnership with the South Bay Regional Public Safety Training
Consortium. The program currently culminates in three Certifi cates of Achievement
and three Associate degrees: Fire Science, Fire Academy, and Fire Offi cer. The Fire
Science program includes an in-service training program for local fi re agencies (51
FTES in 2016-2017) as well as the coursework offered through the Consortium (288
FTES in 2016-2017). The Consortium is a Joint Powers Agency (JPA) comprised
of the following nine community colleges: Cabrillo, College of San Mateo, Foothill,
Gavilan, Hartnell, Lake Tahoe Community, Mission, Monterey Peninsula, and Ohlone.
LTCC offers Chief Fire Offi cer, Company Offi cer, and Fire Academy programing
through the Consortium. The fi rst Consortium courses through LTCC were offered
in Spring 2014. The partnership has grown to the point that Fire Science is now
the largest program offering at LTCC. Increase Public Safety training programming
represents a signifi cant growth area for the college.
Headcounts & FTES
Graph 40 below summarizes trends in the number of students enrolled in Fire
Science courses (headcount) as well as the number of Full-time Equivalent Students
(FTES) from 2012-13 to 2016-17. The Fire Science department experienced a spike
in headcount from 148 in 2012-13 to 1307 in 2014-15, due to LTCC joining as one of
eight member colleges in the South Bay Regional Public Safety Training Consortium
(a.k.a. the South Bay Academy Joint Powers Authority). FTES similarly ballooned
from 44.39 in 2012-13 to 384.69 in 2014-15. FTES for Fire Science in 2016-17 was
359.50.
Fire Science Data
2014-15 2015-16 2016-17
# of Sections 86 80 43
WSCH 16867.67 13967.75 15456.95
FTES 384.69 325.06 359.50
Avg Class Size 22.84 19.01 26.79
FTEF 8.72 9.30 14.16
# of Sections# of Sections 86 80 43 86 80 43 86 80 43 86 80 43 86 80 43 86 80 43 86 80 43 86 80 43
FTESFTES 384.69 325.06 359.50 384.69 325.06 359.50 384.69 325.06 359.50 384.69 325.06 359.50 384.69 325.06 359.50 384.69 325.06 359.50 384.69 325.06 359.50 384.69 325.06 359.50
FTEFFTEF 8.72 9.30 14.16 8.72 9.30 14.16 8.72 9.30 14.16 8.72 9.30 14.16 8.72 9.30 14.16 8.72 9.30 14.16 8.72 9.30 14.16 8.72 9.30 14.16
Table 21: Fire Science Data
148
610
13071122
995
44.39 153.75
384.69 325.06 359.5
0
200
400
600
800
1000
1200
1400
2012-132 013-14 2014-152 015-16 2016-17
Fire ScienceHeadcount & FTES - 2014-2017
Headcount FTES
Graph 40: Fire Science Headcount & FTES
» 2012-13 2013-14 2014-15 2015-16 2016-17
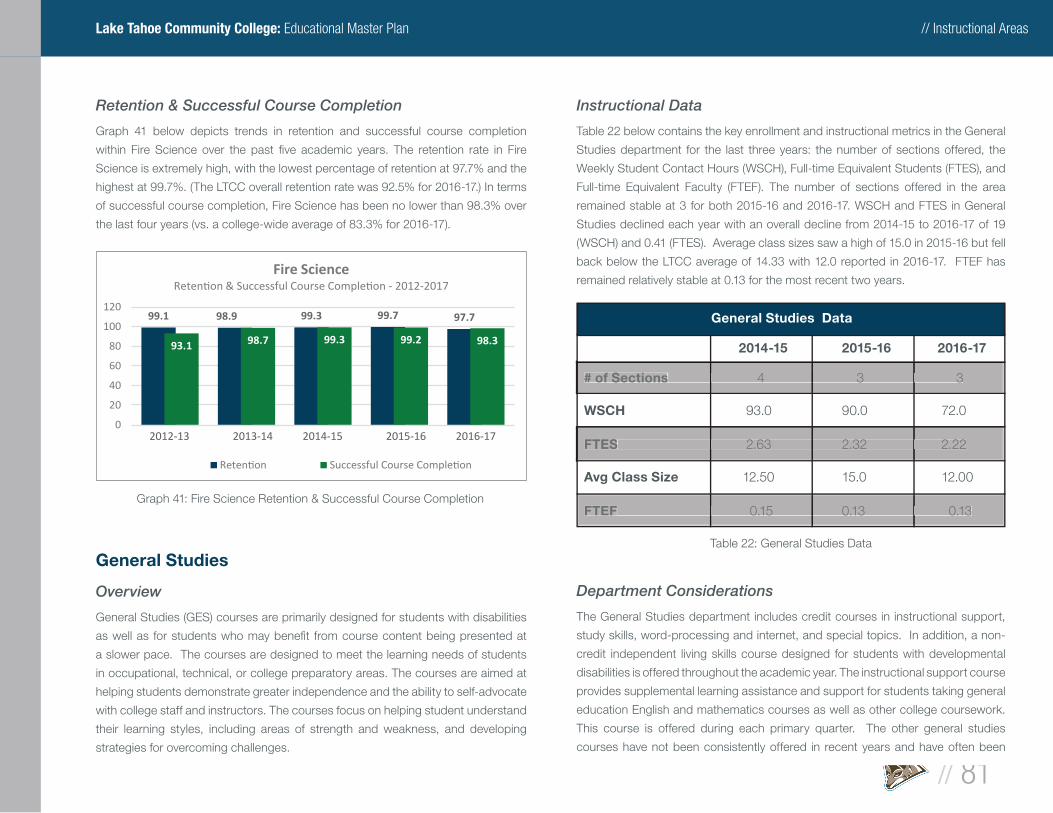
// Instructional Areas
// 81
Lake Tahoe Community College: Educational Master Plan
Retention & Successful Course Completion
Graph 41 below depicts trends in retention and successful course completion
within Fire Science over the past fi ve academic years. The retention rate in Fire
Science is extremely high, with the lowest percentage of retention at 97.7% and the
highest at 99.7%. (The LTCC overall retention rate was 92.5% for 2016-17.) In terms
of successful course completion, Fire Science has been no lower than 98.3% over
the last four years (vs. a college-wide average of 83.3% for 2016-17).
General Studies
Overview
General Studies (GES) courses are primarily designed for students with disabilities
as well as for students who may benefi t from course content being presented at
a slower pace. The courses are designed to meet the learning needs of students
in occupational, technical, or college preparatory areas. The courses are aimed at
helping students demonstrate greater independence and the ability to self-advocate
with college staff and instructors. The courses focus on helping student understand
their learning styles, including areas of strength and weakness, and developing
strategies for overcoming challenges.
Instructional Data
Table 22 below contains the key enrollment and instructional metrics in the General
Studies department for the last three years: the number of sections offered, the
Weekly Student Contact Hours (WSCH), Full-time Equivalent Students (FTES), and
Full-time Equivalent Faculty (FTEF). The number of sections offered in the area
remained stable at 3 for both 2015-16 and 2016-17. WSCH and FTES in General
Studies declined each year with an overall decline from 2014-15 to 2016-17 of 19
(WSCH) and 0.41 (FTES). Average class sizes saw a high of 15.0 in 2015-16 but fell
back below the LTCC average of 14.33 with 12.0 reported in 2016-17. FTEF has
remained relatively stable at 0.13 for the most recent two years.
Department Considerations
The General Studies department includes credit courses in instructional support,
study skills, word-processing and internet, and special topics. In addition, a non-
credit independent living skills course designed for students with developmental
disabilities is offered throughout the academic year. The instructional support course
provides supplemental learning assistance and support for students taking general
education English and mathematics courses as well as other college coursework.
This course is offered during each primary quarter. The other general studies
courses have not been consistently offered in recent years and have often been
99.1 98.9 99.3 99.7 97.7
93.1 98.7 99.3 99.2 98.3
0
20
40
60
80
100
120
2012-132 013-14 2014-152 015-16 2016-17
Fire Science- 2012-2017
Graph 41: Fire Science Retention & Successful Course Completion
General Studies Data
2014-15 2015-16 2016-17
# of Sections 4 3 3
WSCH 93.0 90.0 72.0
FTES 2.63 2.32 2.22
Avg Class Size 12.50 15.0 12.00
FTEF 0.15 0.13 0.13
# of Sections# of Sections 4 3 3 4 3 3 4 3 3 4 3 3 4 3 3 4 3 3 4 3 3 4 3 3
FTESFTES 2.63 2.32 2.22 2.63 2.32 2.22 2.63 2.32 2.22 2.63 2.32 2.22 2.63 2.32 2.22 2.63 2.32 2.22 2.63 2.32 2.22 2.63 2.32 2.22
FTEFFTEF 0.15 0.13 0.13 0.15 0.13 0.13 0.15 0.13 0.13 0.15 0.13 0.13 0.15 0.13 0.13 0.15 0.13 0.13 0.15 0.13 0.13 0.15 0.13 0.13
Table 22: General Studies Data
» 2012-13 2013-14 2014-15 2015-16 2016-17
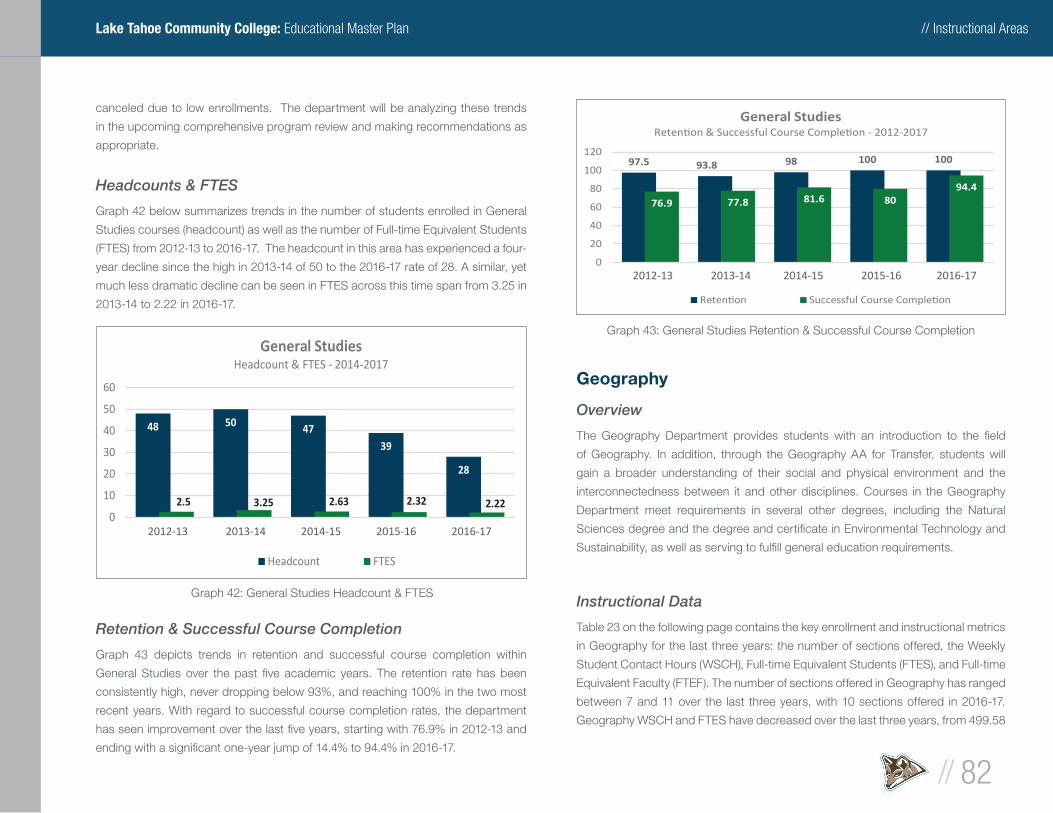
// Instructional Areas
// 82
Lake Tahoe Community College: Educational Master Plan
canceled due to low enrollments. The department will be analyzing these trends
in the upcoming comprehensive program review and making recommendations as
appropriate.
Headcounts & FTES
Graph 42 below summarizes trends in the number of students enrolled in General
Studies courses (headcount) as well as the number of Full-time Equivalent Students
(FTES) from 2012-13 to 2016-17. The headcount in this area has experienced a four-
year decline since the high in 2013-14 of 50 to the 2016-17 rate of 28. A similar, yet
much less dramatic decline can be seen in FTES across this time span from 3.25 in
2013-14 to 2.22 in 2016-17.
Retention & Successful Course Completion
Graph 43 depicts trends in retention and successful course completion within
General Studies over the past fi ve academic years. The retention rate has been
consistently high, never dropping below 93%, and reaching 100% in the two most
recent years. With regard to successful course completion rates, the department
has seen improvement over the last fi ve years, starting with 76.9% in 2012-13 and
ending with a signifi cant one-year jump of 14.4% to 94.4% in 2016-17.
Geography
Overview
The Geography Department provides students with an introduction to the fi eld
of Geography. In addition, through the Geography AA for Transfer, students will
gain a broader understanding of their social and physical environment and the
interconnectedness between it and other disciplines. Courses in the Geography
Department meet requirements in several other degrees, including the Natural
Sciences degree and the degree and certifi cate in Environmental Technology and
Sustainability, as well as serving to fulfi ll general education requirements.
Instructional Data
Table 23 on the following page contains the key enrollment and instructional metrics
in Geography for the last three years: the number of sections offered, the Weekly
Student Contact Hours (WSCH), Full-time Equivalent Students (FTES), and Full-time
Equivalent Faculty (FTEF). The number of sections offered in Geography has ranged
between 7 and 11 over the last three years, with 10 sections offered in 2016-17.
Geography WSCH and FTES have decreased over the last three years, from 499.58
48 50 47
39
28
2.5 3.25 2.63 2.32 2.220
10
20
30
40
50
60
2012-132 013-14 2014-152 015-16 2016-17
General StudiesHeadcount & FTES - 2014-2017
Headcount FTES
Graph 42: General Studies Headcount & FTES
97.5 93.8 98 1001 00
76.9 77.8 81.6 8094.4
0
20
40
60
80
100
120
2012-132 013-14 2014-152 015-16 2016-17
General Studies- 2012-2017
Graph 43: General Studies Retention & Successful Course Completion
» 2012-13 2013-14 2014-15 2015-16 2016-17
» 2012-13 2013-14 2014-15 2015-16 2016-17
1
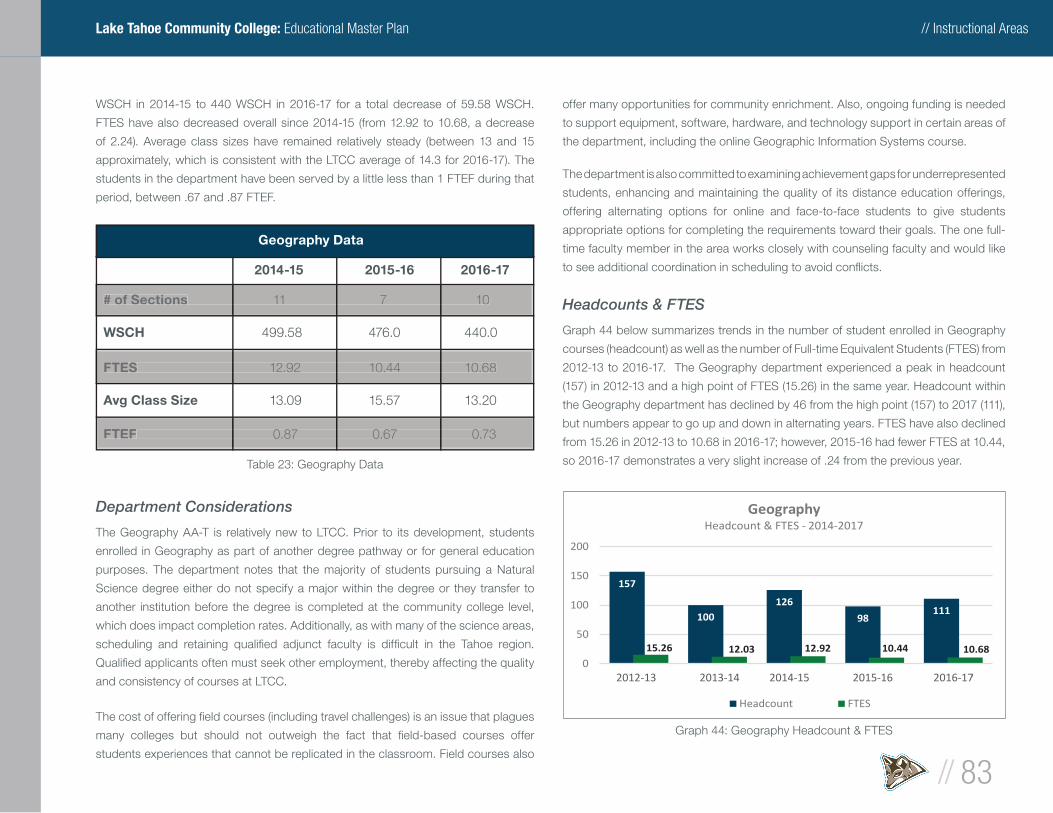
// Instructional Areas
// 83
Lake Tahoe Community College: Educational Master Plan
WSCH in 2014-15 to 440 WSCH in 2016-17 for a total decrease of 59.58 WSCH.
FTES have also decreased overall since 2014-15 (from 12.92 to 10.68, a decrease
of 2.24). Average class sizes have remained relatively steady (between 13 and 15
approximately, which is consistent with the LTCC average of 14.3 for 2016-17). The
students in the department have been served by a little less than 1 FTEF during that
period, between .67 and .87 FTEF.
Department Considerations
The Geography AA-T is relatively new to LTCC. Prior to its development, students
enrolled in Geography as part of another degree pathway or for general education
purposes. The department notes that the majority of students pursuing a Natural
Science degree either do not specify a major within the degree or they transfer to
another institution before the degree is completed at the community college level,
which does impact completion rates. Additionally, as with many of the science areas,
scheduling and retaining qualifi ed adjunct faculty is diffi cult in the Tahoe region.
Qualifi ed applicants often must seek other employment, thereby affecting the quality
and consistency of courses at LTCC.
The cost of offering fi eld courses (including travel challenges) is an issue that plagues
many colleges but should not outweigh the fact that fi eld-based courses offer
students experiences that cannot be replicated in the classroom. Field courses also
offer many opportunities for community enrichment. Also, ongoing funding is needed
to support equipment, software, hardware, and technology support in certain areas of
the department, including the online Geographic Information Systems course.
The department is also committed to examining achievement gaps for underrepresented
students, enhancing and maintaining the quality of its distance education offerings,
offering alternating options for online and face-to-face students to give students
appropriate options for completing the requirements toward their goals. The one full-
time faculty member in the area works closely with counseling faculty and would like
to see additional coordination in scheduling to avoid confl icts.
Headcounts & FTES
Graph 44 below summarizes trends in the number of student enrolled in Geography
courses (headcount) as well as the number of Full-time Equivalent Students (FTES) from
2012-13 to 2016-17. The Geography department experienced a peak in headcount
(157) in 2012-13 and a high point of FTES (15.26) in the same year. Headcount within
the Geography department has declined by 46 from the high point (157) to 2017 (111),
but numbers appear to go up and down in alternating years. FTES have also declined
from 15.26 in 2012-13 to 10.68 in 2016-17; however, 2015-16 had fewer FTES at 10.44,
so 2016-17 demonstrates a very slight increase of .24 from the previous year.
Geography Data
2014-15 2015-16 2016-17
# of Sections 11 7 10
WSCH 499.58 476.0 440.0
FTES 12.92 10.44 10.68
Avg Class Size 13.09 15.57 13.20
FTEF 0.87 0.67 0.73
# of Sections# of Sections 11 7 10 11 7 10 11 7 10 11 7 10 11 7 10 11 7 10 11 7 10 11 7 10
FTESFTES 12.92 10.44 10.68 12.92 10.44 10.68 12.92 10.44 10.68 12.92 10.44 10.68 12.92 10.44 10.68 12.92 10.44 10.68 12.92 10.44 10.68 12.92 10.44 10.68
FTEFFTEF 0.87 0.67 0.73 0.87 0.67 0.73 0.87 0.67 0.73 0.87 0.67 0.73 0.87 0.67 0.73 0.87 0.67 0.73 0.87 0.67 0.73 0.87 0.67 0.73
Table 23: Geography Data
157
100126
98111
15.26 12.03 12.92 10.44 10.680
50
100
150
200
2012-132 013-14 2014-152 015-16 2016-17
GeographyHeadcount & FTES - 2014-2017
Headcount FTES
Graph 44: Geography Headcount & FTES
» 2012-13 2013-14 2014-15 2015-16 2016-17
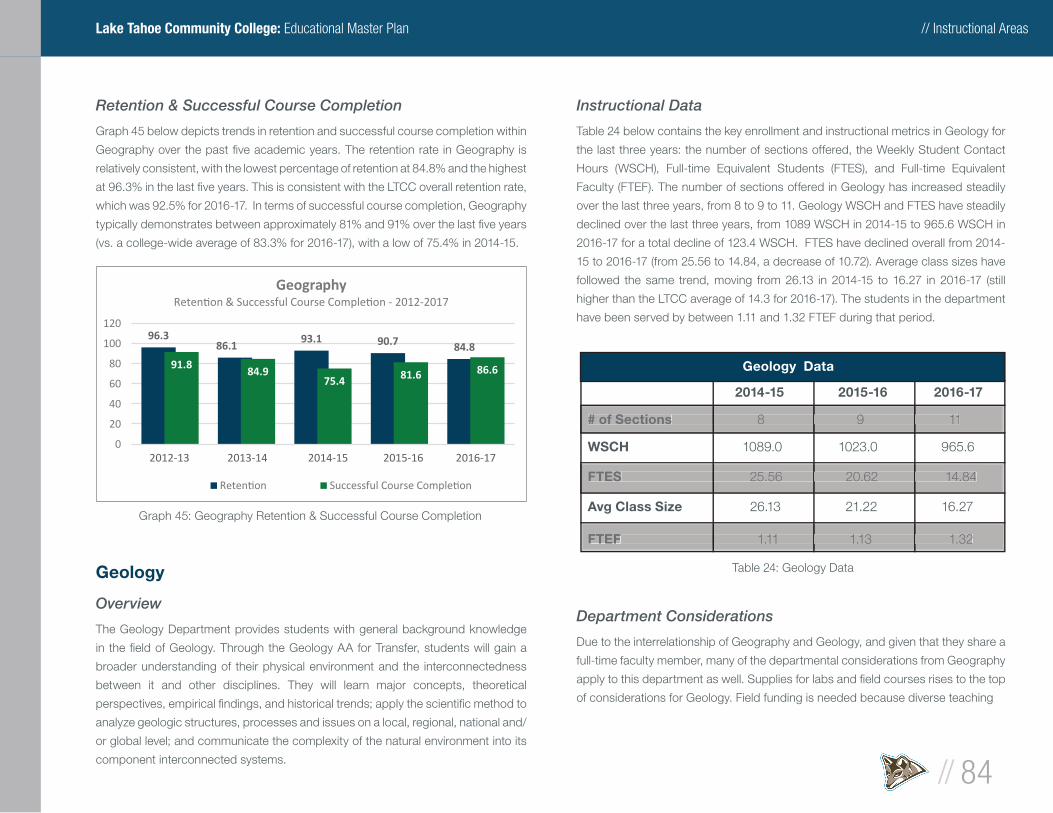
// Instructional Areas
// 84
Lake Tahoe Community College: Educational Master Plan
Retention & Successful Course Completion
Graph 45 below depicts trends in retention and successful course completion within
Geography over the past fi ve academic years. The retention rate in Geography is
relatively consistent, with the lowest percentage of retention at 84.8% and the highest
at 96.3% in the last fi ve years. This is consistent with the LTCC overall retention rate,
which was 92.5% for 2016-17. In terms of successful course completion, Geography
typically demonstrates between approximately 81% and 91% over the last fi ve years
(vs. a college-wide average of 83.3% for 2016-17), with a low of 75.4% in 2014-15.
Geology
Overview
The Geology Department provides students with general background knowledge
in the fi eld of Geology. Through the Geology AA for Transfer, students will gain a
broader understanding of their physical environment and the interconnectedness
between it and other disciplines. They will learn major concepts, theoretical
perspectives, empirical fi ndings, and historical trends; apply the scientifi c method to
analyze geologic structures, processes and issues on a local, regional, national and/
or global level; and communicate the complexity of the natural environment into its
component interconnected systems.
Instructional Data
Table 24 below contains the key enrollment and instructional metrics in Geology for
the last three years: the number of sections offered, the Weekly Student Contact
Hours (WSCH), Full-time Equivalent Students (FTES), and Full-time Equivalent
Faculty (FTEF). The number of sections offered in Geology has increased steadily
over the last three years, from 8 to 9 to 11. Geology WSCH and FTES have steadily
declined over the last three years, from 1089 WSCH in 2014-15 to 965.6 WSCH in
2016-17 for a total decline of 123.4 WSCH. FTES have declined overall from 2014-
15 to 2016-17 (from 25.56 to 14.84, a decrease of 10.72). Average class sizes have
followed the same trend, moving from 26.13 in 2014-15 to 16.27 in 2016-17 (still
higher than the LTCC average of 14.3 for 2016-17). The students in the department
have been served by between 1.11 and 1.32 FTEF during that period.
Department Considerations
Due to the interrelationship of Geography and Geology, and given that they share a
full-time faculty member, many of the departmental considerations from Geography
apply to this department as well. Supplies for labs and fi eld courses rises to the top
of considerations for Geology. Field funding is needed because diverse teaching
96.386.1
93.1 90.7 84.8
91.884.9
75.4 81.6 86.6
0
20
40
60
80
100
120
2012-132 013-14 2014-152 015-16 2016-17
Geography- 2012-2017
Graph 45: Geography Retention & Successful Course Completion
Geology Data
2014-15 2015-16 2016-17
# of Sections 8 9 11
WSCH 1089.0 1023.0 965.6
FTES 25.56 20.62 14.84
Avg Class Size 26.13 21.22 16.27
FTEF 1.11 1.13 1.32
# of Sections# of Sections 8 9 11 8 9 11 8 9 11 8 9 11 8 9 11 8 9 11 8 9 11 8 9 11
FTESFTES 25.56 20.62 14.84 25.56 20.62 14.84 25.56 20.62 14.84 25.56 20.62 14.84 25.56 20.62 14.84 25.56 20.62 14.84 25.56 20.62 14.84 25.56 20.62 14.84
FTEFFTEF 1.11 1.13 1.32 1.11 1.13 1.32 1.11 1.13 1.32 1.11 1.13 1.32 1.11 1.13 1.32 1.11 1.13 1.32 1.11 1.13 1.32 1.11 1.13 1.32
Table 24: Geology Data
» 2012-13 2013-14 2014-15 2015-16 2016-17
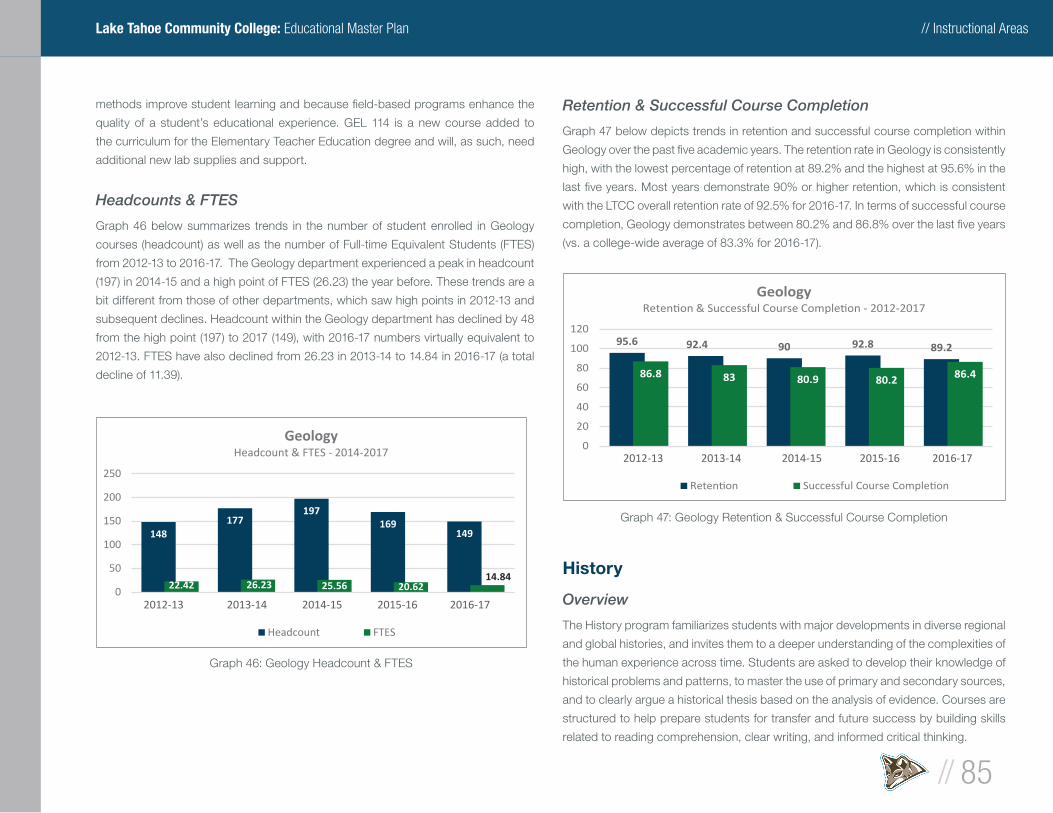
// Instructional Areas
// 85
Lake Tahoe Community College: Educational Master Plan
methods improve student learning and because fi eld-based programs enhance the
quality of a student’s educational experience. GEL 114 is a new course added to
the curriculum for the Elementary Teacher Education degree and will, as such, need
additional new lab supplies and support.
Headcounts & FTES
Graph 46 below summarizes trends in the number of student enrolled in Geology
courses (headcount) as well as the number of Full-time Equivalent Students (FTES)
from 2012-13 to 2016-17. The Geology department experienced a peak in headcount
(197) in 2014-15 and a high point of FTES (26.23) the year before. These trends are a
bit different from those of other departments, which saw high points in 2012-13 and
subsequent declines. Headcount within the Geology department has declined by 48
from the high point (197) to 2017 (149), with 2016-17 numbers virtually equivalent to
2012-13. FTES have also declined from 26.23 in 2013-14 to 14.84 in 2016-17 (a total
decline of 11.39).
Retention & Successful Course Completion
Graph 47 below depicts trends in retention and successful course completion within
Geology over the past fi ve academic years. The retention rate in Geology is consistently
high, with the lowest percentage of retention at 89.2% and the highest at 95.6% in the
last fi ve years. Most years demonstrate 90% or higher retention, which is consistent
with the LTCC overall retention rate of 92.5% for 2016-17. In terms of successful course
completion, Geology demonstrates between 80.2% and 86.8% over the last fi ve years
(vs. a college-wide average of 83.3% for 2016-17).
History
Overview
The History program familiarizes students with major developments in diverse regional
and global histories, and invites them to a deeper understanding of the complexities of
the human experience across time. Students are asked to develop their knowledge of
historical problems and patterns, to master the use of primary and secondary sources,
and to clearly argue a historical thesis based on the analysis of evidence. Courses are
structured to help prepare students for transfer and future success by building skills
related to reading comprehension, clear writing, and informed critical thinking.
148177
197169
149
22.42 26.23 25.56 20.6214.84
0
50
100
150
200
250
2012-132 013-14 2014-152 015-16 2016-17
GeologyHeadcount & FTES - 2014-2017
Headcount FTES
Graph 46: Geology Headcount & FTES
95.6 92.4 90 92.8 89.2
86.8 83 80.9 80.2 86.4
0
20
40
60
80
100
120
2012-132 013-14 2014-152 015-16 2016-17
Geology- 2012-2017
Graph 47: Geology Retention & Successful Course Completion
» 2012-13 2013-14 2014-15 2015-16 2016-17
» 2012-13 2013-14 2014-15 2015-16 2016-17
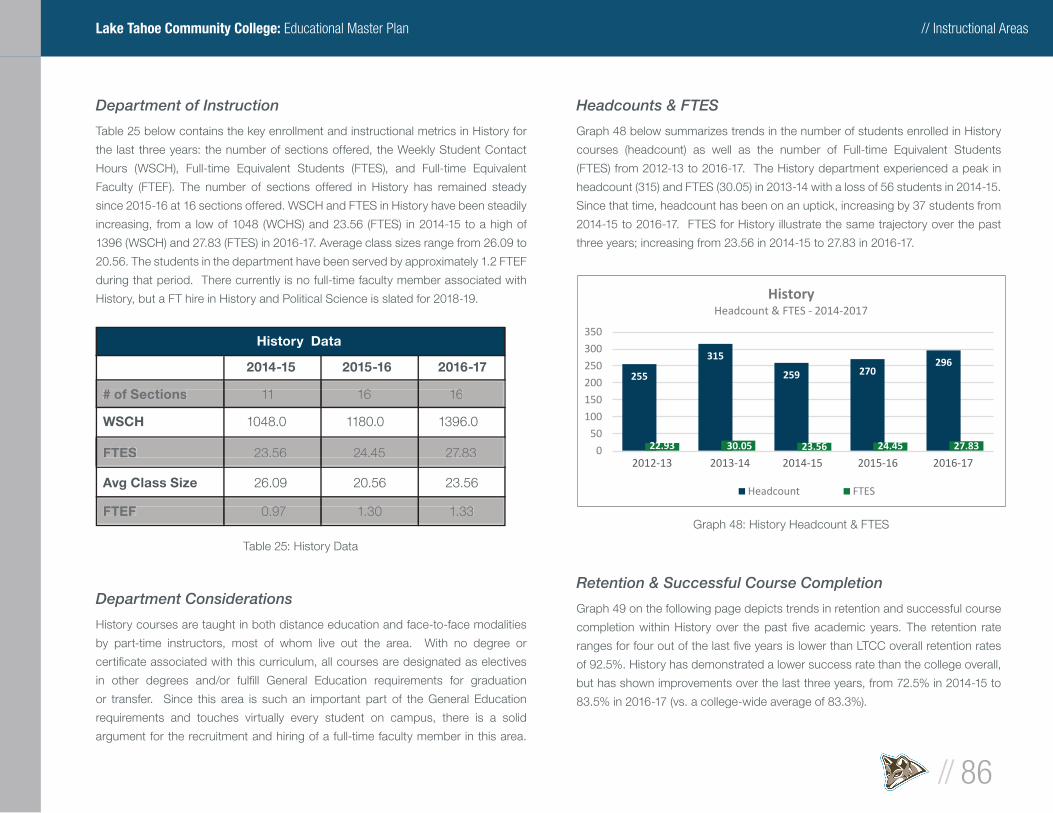
// Instructional Areas
// 86
Lake Tahoe Community College: Educational Master Plan
Department of Instruction
Table 25 below contains the key enrollment and instructional metrics in History for
the last three years: the number of sections offered, the Weekly Student Contact
Hours (WSCH), Full-time Equivalent Students (FTES), and Full-time Equivalent
Faculty (FTEF). The number of sections offered in History has remained steady
since 2015-16 at 16 sections offered. WSCH and FTES in History have been steadily
increasing, from a low of 1048 (WCHS) and 23.56 (FTES) in 2014-15 to a high of
1396 (WSCH) and 27.83 (FTES) in 2016-17. Average class sizes range from 26.09 to
20.56. The students in the department have been served by approximately 1.2 FTEF
during that period. There currently is no full-time faculty member associated with
History, but a FT hire in History and Political Science is slated for 2018-19.
Department Considerations
History courses are taught in both distance education and face-to-face modalities
by part-time instructors, most of whom live out the area. With no degree or
certifi cate associated with this curriculum, all courses are designated as electives
in other degrees and/or fulfi ll General Education requirements for graduation
or transfer. Since this area is such an important part of the General Education
requirements and touches virtually every student on campus, there is a solid
argument for the recruitment and hiring of a full-time faculty member in this area.
Headcounts & FTES
Graph 48 below summarizes trends in the number of students enrolled in History
courses (headcount) as well as the number of Full-time Equivalent Students
(FTES) from 2012-13 to 2016-17. The History department experienced a peak in
headcount (315) and FTES (30.05) in 2013-14 with a loss of 56 students in 2014-15.
Since that time, headcount has been on an uptick, increasing by 37 students from
2014-15 to 2016-17. FTES for History illustrate the same trajectory over the past
three years; increasing from 23.56 in 2014-15 to 27.83 in 2016-17.
Retention & Successful Course Completion
Graph 49 on the following page depicts trends in retention and successful course
completion within History over the past fi ve academic years. The retention rate
ranges for four out of the last fi ve years is lower than LTCC overall retention rates
of 92.5%. History has demonstrated a lower success rate than the college overall,
but has shown improvements over the last three years, from 72.5% in 2014-15 to
83.5% in 2016-17 (vs. a college-wide average of 83.3%).
History Data
2014-15 2015-16 2016-17
# of Sections 11 16 16
WSCH 1048.0 1180.0 1396.0
FTES 23.56 24.45 27.83
Avg Class Size 26.09 20.56 23.56
FTEF 0.97 1.30 1.33
# of Sections# of Sections 11 16 16 11 16 16 11 16 16 11 16 16 11 16 16 11 16 16 11 16 16 11 16 16
FTESFTES 23.56 24.45 27.83 23.56 24.45 27.83 23.56 24.45 27.83 23.56 24.45 27.83 23.56 24.45 27.83 23.56 24.45 27.83 23.56 24.45 27.83 23.56 24.45 27.83
FTEFFTEF 0.97 1.30 1.33 0.97 1.30 1.33 0.97 1.30 1.33 0.97 1.30 1.33 0.97 1.30 1.33 0.97 1.30 1.33 0.97 1.30 1.33 0.97 1.30 1.33
Table 25: History Data
255
315
259 270296
22.93 30.05 23.56 24.45 27.830
50
100
150
200
250
300
350
2012-132 013-14 2014-152 015-16 2016-17
HistoryHeadcount & FTES - 2014-2017
Headcount FTES
Graph 48: History Headcount & FTES
» 2012-13 2013-14 2014-15 2015-16 2016-17
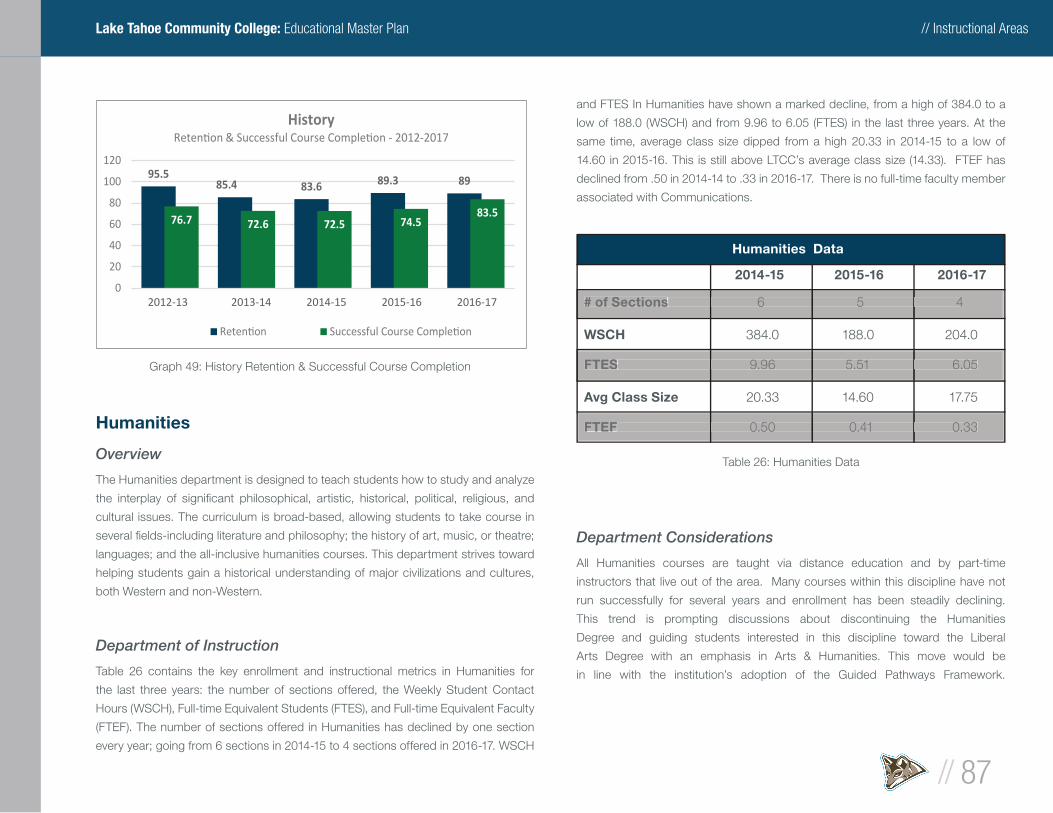
// Instructional Areas
// 87
Lake Tahoe Community College: Educational Master Plan
Humanities
Overview
The Humanities department is designed to teach students how to study and analyze
the interplay of signifi cant philosophical, artistic, historical, political, religious, and
cultural issues. The curriculum is broad-based, allowing students to take course in
several fi elds-including literature and philosophy; the history of art, music, or theatre;
languages; and the all-inclusive humanities courses. This department strives toward
helping students gain a historical understanding of major civilizations and cultures,
both Western and non-Western.
Department of Instruction
Table 26 contains the key enrollment and instructional metrics in Humanities for
the last three years: the number of sections offered, the Weekly Student Contact
Hours (WSCH), Full-time Equivalent Students (FTES), and Full-time Equivalent Faculty
(FTEF). The number of sections offered in Humanities has declined by one section
every year; going from 6 sections in 2014-15 to 4 sections offered in 2016-17. WSCH
and FTES In Humanities have shown a marked decline, from a high of 384.0 to a
low of 188.0 (WSCH) and from 9.96 to 6.05 (FTES) in the last three years. At the
same time, average class size dipped from a high 20.33 in 2014-15 to a low of
14.60 in 2015-16. This is still above LTCC’s average class size (14.33). FTEF has
declined from .50 in 2014-14 to .33 in 2016-17. There is no full-time faculty member
associated with Communications.
Department Considerations
All Humanities courses are taught via distance education and by part-time
instructors that live out of the area. Many courses within this discipline have not
run successfully for several years and enrollment has been steadily declining.
This trend is prompting discussions about discontinuing the Humanities
Degree and guiding students interested in this discipline toward the Liberal
Arts Degree with an emphasis in Arts & Humanities. This move would be
in line with the institution’s adoption of the Guided Pathways Framework.
95.585.4 83.6 89.3 89
76.7 72.6 72.5 74.583.5
0
20
40
60
80
100
120
2012-132 013-14 2014-152 015-16 2016-17
History- 2012-2017
Graph 49: History Retention & Successful Course Completion
Humanities Data
2014-15 2015-16 2016-17
# of Sections 6 5 4
WSCH 384.0 188.0 204.0
FTES 9.96 5.51 6.05
Avg Class Size 20.33 14.60 17.75
FTEF 0.50 0.41 0.33
# of Sections# of Sections 6 5 4 6 5 4 6 5 4 6 5 4 6 5 4 6 5 4 6 5 4 6 5 4
FTESFTES 9.96 5.51 6.05 9.96 5.51 6.05 9.96 5.51 6.05 9.96 5.51 6.05 9.96 5.51 6.05 9.96 5.51 6.05 9.96 5.51 6.05 9.96 5.51 6.05
FTEFFTEF 0.50 0.41 0.33 0.50 0.41 0.33 0.50 0.41 0.33 0.50 0.41 0.33 0.50 0.41 0.33 0.50 0.41 0.33 0.50 0.41 0.33 0.50 0.41 0.33
Table 26: Humanities Data
» 2012-13 2013-14 2014-15 2015-16 2016-17
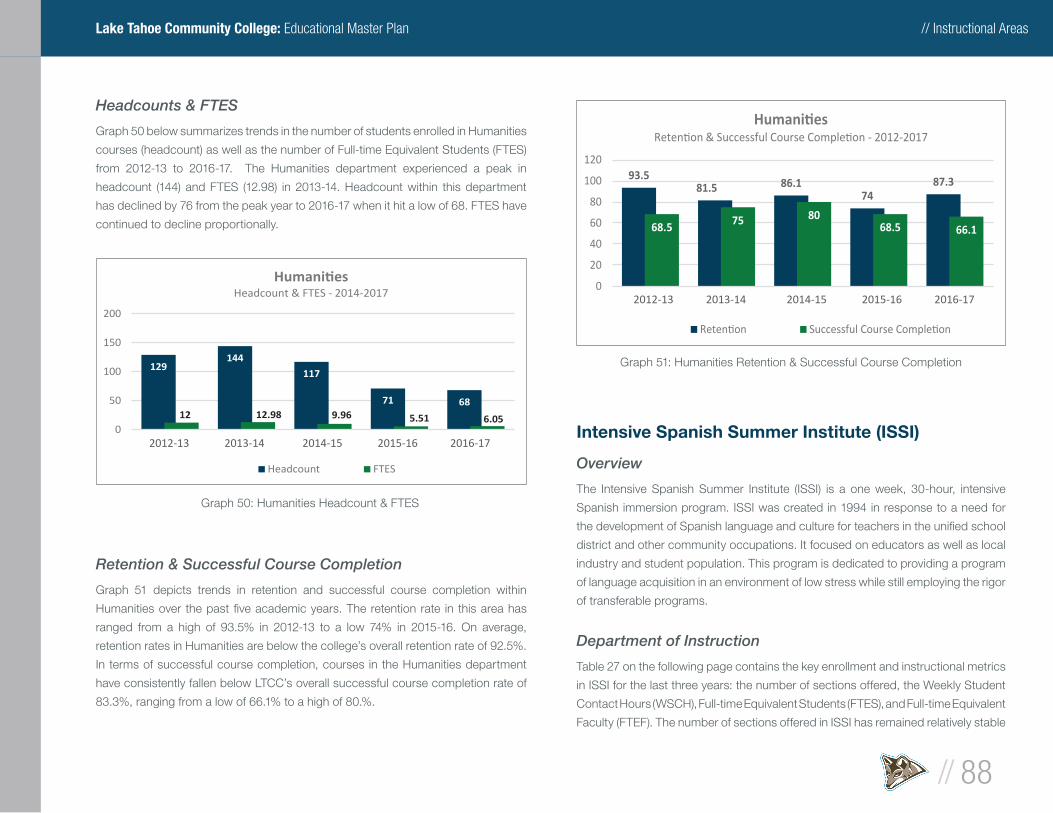
// Instructional Areas
// 88
Lake Tahoe Community College: Educational Master Plan
Headcounts & FTES
Graph 50 below summarizes trends in the number of students enrolled in Humanities
courses (headcount) as well as the number of Full-time Equivalent Students (FTES)
from 2012-13 to 2016-17. The Humanities department experienced a peak in
headcount (144) and FTES (12.98) in 2013-14. Headcount within this department
has declined by 76 from the peak year to 2016-17 when it hit a low of 68. FTES have
continued to decline proportionally.
Retention & Successful Course Completion
Graph 51 depicts trends in retention and successful course completion within
Humanities over the past fi ve academic years. The retention rate in this area has
ranged from a high of 93.5% in 2012-13 to a low 74% in 2015-16. On average,
retention rates in Humanities are below the college’s overall retention rate of 92.5%.
In terms of successful course completion, courses in the Humanities department
have consistently fallen below LTCC’s overall successful course completion rate of
83.3%, ranging from a low of 66.1% to a high of 80.%.
Intensive Spanish Summer Institute (ISSI)
Overview
The Intensive Spanish Summer Institute (ISSI) is a one week, 30-hour, intensive
Spanish immersion program. ISSI was created in 1994 in response to a need for
the development of Spanish language and culture for teachers in the unifi ed school
district and other community occupations. It focused on educators as well as local
industry and student population. This program is dedicated to providing a program
of language acquisition in an environment of low stress while still employing the rigor
of transferable programs.
Department of Instruction
Table 27 on the following page contains the key enrollment and instructional metrics
in ISSI for the last three years: the number of sections offered, the Weekly Student
Contact Hours (WSCH), Full-time Equivalent Students (FTES), and Full-time Equivalent
Faculty (FTEF). The number of sections offered in ISSI has remained relatively stable
129144
117
71 6812 12.98 9.96 5.51 6.05
0
50
100
150
200
2012-132 013-14 2014-152 015-16 2016-17
Headcount & FTES - 2014-2017
Headcount FTES
Graph 50: Humanities Headcount & FTES
93.581.5 86.1
7487.3
68.5 75 8068.5 66.1
0
20
40
60
80
100
120
2012-132 013-14 2014-152 015-16 2016-17
- 2012-2017
Graph 51: Humanities Retention & Successful Course Completion
» 2012-13 2013-14 2014-15 2015-16 2016-17
» 2012-13 2013-14 2014-15 2015-16 2016-17
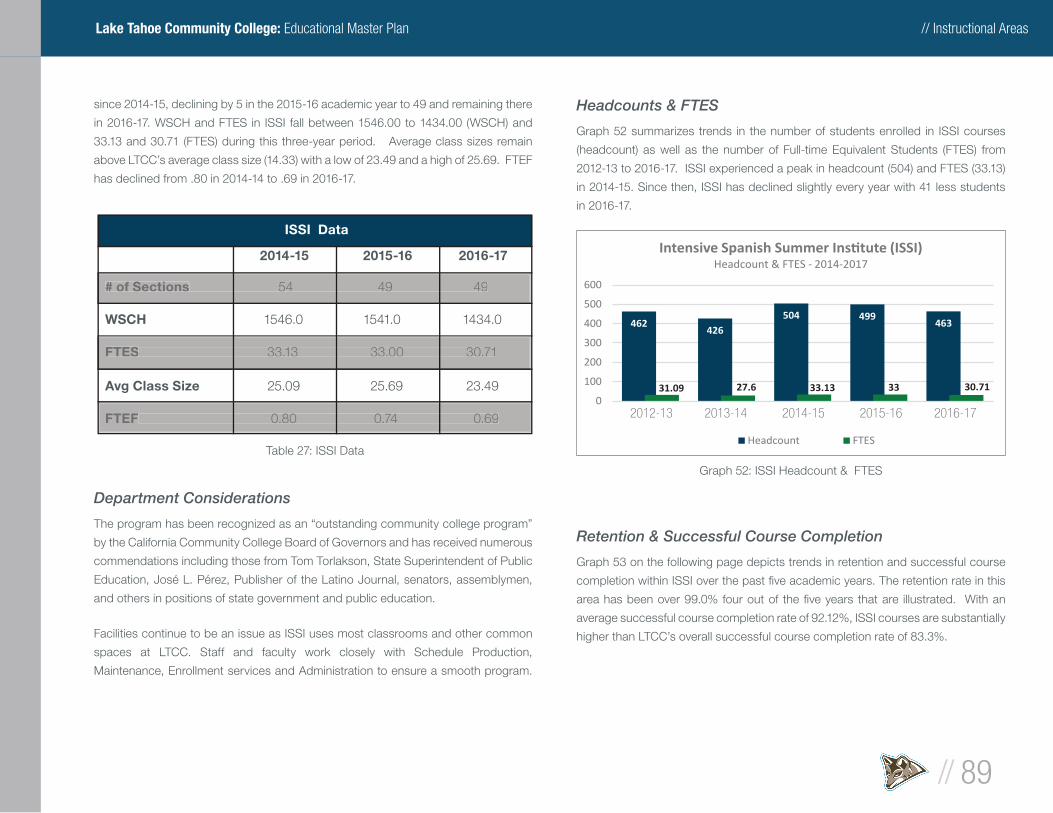
// Instructional Areas
// 89
Lake Tahoe Community College: Educational Master Plan
since 2014-15, declining by 5 in the 2015-16 academic year to 49 and remaining there
in 2016-17. WSCH and FTES in ISSI fall between 1546.00 to 1434.00 (WSCH) and
33.13 and 30.71 (FTES) during this three-year period. Average class sizes remain
above LTCC’s average class size (14.33) with a low of 23.49 and a high of 25.69. FTEF
has declined from .80 in 2014-14 to .69 in 2016-17.
Department Considerations
The program has been recognized as an “outstanding community college program”
by the California Community College Board of Governors and has received numerous
commendations including those from Tom Torlakson, State Superintendent of Public
Education, José L. Pérez, Publisher of the Latino Journal, senators, assemblymen,
and others in positions of state government and public education.
Facilities continue to be an issue as ISSI uses most classrooms and other common
spaces at LTCC. Staff and faculty work closely with Schedule Production,
Maintenance, Enrollment services and Administration to ensure a smooth program.
Headcounts & FTES
Graph 52 summarizes trends in the number of students enrolled in ISSI courses
(headcount) as well as the number of Full-time Equivalent Students (FTES) from
2012-13 to 2016-17. ISSI experienced a peak in headcount (504) and FTES (33.13)
in 2014-15. Since then, ISSI has declined slightly every year with 41 less students
in 2016-17.
Retention & Successful Course Completion
Graph 53 on the following page depicts trends in retention and successful course
completion within ISSI over the past fi ve academic years. The retention rate in this
area has been over 99.0% four out of the fi ve years that are illustrated. With an
average successful course completion rate of 92.12%, ISSI courses are substantially
higher than LTCC’s overall successful course completion rate of 83.3%.
ISSI Data
2014-15 2015-16 2016-17
# of Sections 54 49 49
WSCH 1546.0 1541.0 1434.0
FTES 33.13 33.00 30.71
Avg Class Size 25.09 25.69 23.49
FTEF 0.80 0.74 0.69
# of Sections# of Sections 54 49 49 54 49 49 54 49 49 54 49 49 54 49 49 54 49 49 54 49 49 54 49 49
FTESFTES 33.13 33.00 30.71 33.13 33.00 30.71 33.13 33.00 30.71 33.13 33.00 30.71 33.13 33.00 30.71 33.13 33.00 30.71 33.13 33.00 30.71 33.13 33.00 30.71
FTEFFTEF 0.80 0.74 0.69 0.80 0.74 0.69 0.80 0.74 0.69 0.80 0.74 0.69 0.80 0.74 0.69 0.80 0.74 0.69 0.80 0.74 0.69 0.80 0.74 0.69
Table 27: ISSI Data
462426
504 499463
31.09 27.6 33.13 33 30.710
100
200
300
400
500
600
2012-132 013-14 2014-152 015-16 2016-17
Headcount & FTES - 2014-2017
Headcount FTES
Graph 52: ISSI Headcount & FTES
» 2012-13 2013-14 2014-15 2015-16 2016-17
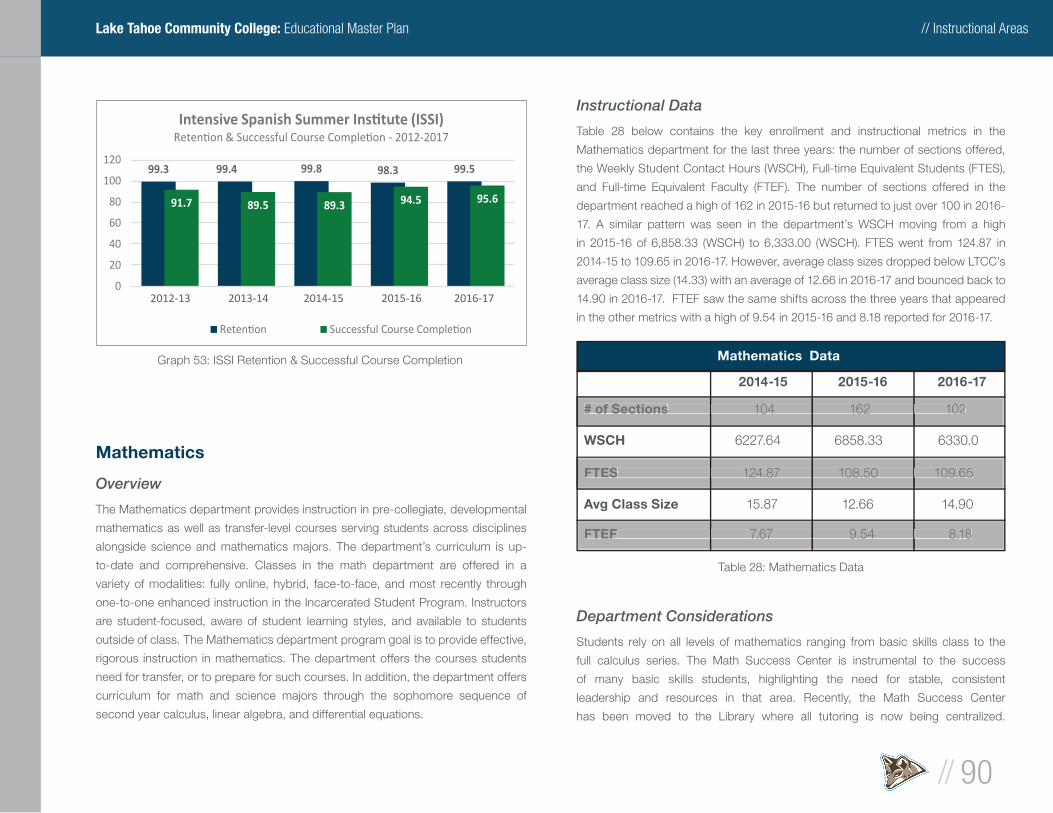
// Instructional Areas
// 90
Lake Tahoe Community College: Educational Master Plan
Mathematics
Overview
The Mathematics department provides instruction in pre-collegiate, developmental
mathematics as well as transfer-level courses serving students across disciplines
alongside science and mathematics majors. The department’s curriculum is up-
to-date and comprehensive. Classes in the math department are offered in a
variety of modalities: fully online, hybrid, face-to-face, and most recently through
one-to-one enhanced instruction in the Incarcerated Student Program. Instructors
are student-focused, aware of student learning styles, and available to students
outside of class. The Mathematics department program goal is to provide effective,
rigorous instruction in mathematics. The department offers the courses students
need for transfer, or to prepare for such courses. In addition, the department offers
curriculum for math and science majors through the sophomore sequence of
second year calculus, linear algebra, and differential equations.
Instructional Data
Table 28 below contains the key enrollment and instructional metrics in the
Mathematics department for the last three years: the number of sections offered,
the Weekly Student Contact Hours (WSCH), Full-time Equivalent Students (FTES),
and Full-time Equivalent Faculty (FTEF). The number of sections offered in the
department reached a high of 162 in 2015-16 but returned to just over 100 in 2016-
17. A similar pattern was seen in the department’s WSCH moving from a high
in 2015-16 of 6,858.33 (WSCH) to 6,333.00 (WSCH). FTES went from 124.87 in
2014-15 to 109.65 in 2016-17. However, average class sizes dropped below LTCC’s
average class size (14.33) with an average of 12.66 in 2016-17 and bounced back to
14.90 in 2016-17. FTEF saw the same shifts across the three years that appeared
in the other metrics with a high of 9.54 in 2015-16 and 8.18 reported for 2016-17.
Department Considerations
Students rely on all levels of mathematics ranging from basic skills class to the
full calculus series. The Math Success Center is instrumental to the success
of many basic skills students, highlighting the need for stable, consistent
leadership and resources in that area. Recently, the Math Success Center
has been moved to the Library where all tutoring is now being centralized.
99.3 99.4 99.8 98.3 99.5
91.7 89.5 89.3 94.5 95.6
0
20
40
60
80
100
120
2012-132 013-14 2014-152 015-16 2016-17
- 2012-2017
Graph 53: ISSI Retention & Successful Course Completion Mathematics Data
2014-15 2015-16 2016-17
# of Sections 104 162 102
WSCH 6227.64 6858.33 6330.0
FTES 124.87 108.50 109.65
Avg Class Size 15.87 12.66 14.90
FTEF 7.67 9.54 8.18
# of Sections# of Sections 104 162 102 104 162 102 104 162 102 104 162 102 104 162 102 104 162 102 104 162 102 104 162 102
FTESFTES 124.87 108.50 109.65 124.87 108.50 109.65 124.87 108.50 109.65 124.87 108.50 109.65 124.87 108.50 109.65 124.87 108.50 109.65 124.87 108.50 109.65 124.87 108.50 109.65
FTEFFTEF 7.67 9.54 8.18 7.67 9.54 8.18 7.67 9.54 8.18 7.67 9.54 8.18 7.67 9.54 8.18 7.67 9.54 8.18 7.67 9.54 8.18 7.67 9.54 8.18
Table 28: Mathematics Data
» 2012-13 2013-14 2014-15 2015-16 2016-17

// Instructional Areas
// 91
Lake Tahoe Community College: Educational Master Plan
A major consideration for the Math department involves acceleration and the
changing landscape of remedial and developmental coursework. The recent
passage of AB705 requires all community colleges to use high school grades
as important part of the placement decision thereby giving students much more
opportunity to skip remedial courses and go directly to college level math. LTCC has
a sequence of developmental mathematics courses that starts with basic arithmetic,
then goes on to pre-algebra, elementary algebra, and fi nally intermediate algebra,
all of which must be passed before a student can enroll in a transfer-level college
mathematics course. Because the way mathematics has traditionally been taught is
sequential, the time and completion implications for students who are placed in the
lower-level courses can be quite severe. A student placed in basic arithmetic may
face two full years of mathematics classes before he or she can take a college-level
course. The changes suggested by AB705 could present the math department with
unknown impact.
Headcounts & FTES
Graph 54 below summarizes trends in the number of students enrolled in Mathematics
courses (headcount) as well as the number of Full-time Equivalent Students (FTES)
from 2012-13 to 2016-17. The department has experienced a steady decline across
the fi ve years, with a headcount of 935 in 2012-13 and 756 in 2016-17. With regard
to FTES, the peak year was actually in 2013-14 with 138.06 followed by three-years
of decline to 108.5 in 2015-16 and a slight increase in 2016-17 to 109.65.
Retention & Successful Course Completion
Graph 55 below depicts trends in retention and successful course completion
within Mathematics over the past fi ve academic years. The retention rate has
remained above 89% each year with a rate of 90% in 2016-17. With regard to
successful course completion, Mathematics courses have a fi ve-year average of
71.2%. College averages in 2016-17 in these areas were 92.5% and 83.3% for
retention and success respectively.
Medical Offi ce Assistant
Overview
The Medical Offi ce Assistant: Administrative degree is designed to provide
students with essential knowledge and skills to assume responsible administrative
positions in medical offi ces. The core curriculum in the Medical Offi ce Assistant:
Administrative program focuses on the effective use of medical terminology and the
mechanics of medical coding and billing procedures. Additional courses emphasize
contemporary medical offi ce technology skills such as effective computer fi les
management, data entry, and word processing. Students will develop solid skills
in bookkeeping/accounting, math, and oral communication as well as an in depth
understanding and appreciation of ethical issues related to employment in a medical
offi ce.
935 914 882808 756
135.01 138.06 124.87 108.5 109.650
200
400
600
800
1000
2012-132 013-14 2014-152 015-16 2016-17
Headcount & FTES - 2014-2017
Headcount FTES
Graph 54: Mathematics Headcount & FTES
94.7 89.3 89.7 89.3 90
70.7 71.2 69.9 72.5 71.5
0
20
40
60
80
100
120
2012-132 013-14 2014-152 015-16 2016-17
- 2012-2017
Graph 55: Mathematics Retention & Successful Course Completion
» 2012-13 2013-14 2014-15 2015-16 2016-17
» 2012-13 2013-14 2014-15 2015-16 2016-17
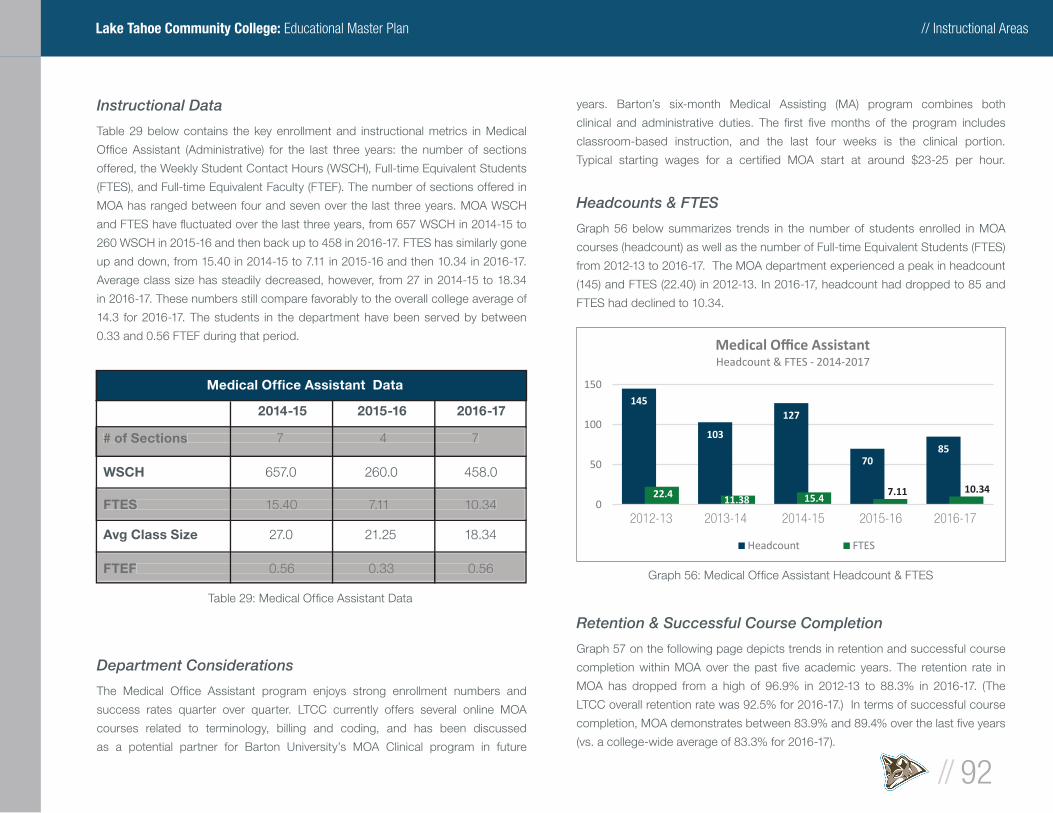
// Instructional Areas
// 92
Lake Tahoe Community College: Educational Master Plan
Instructional Data
Table 29 below contains the key enrollment and instructional metrics in Medical
Offi ce Assistant (Administrative) for the last three years: the number of sections
offered, the Weekly Student Contact Hours (WSCH), Full-time Equivalent Students
(FTES), and Full-time Equivalent Faculty (FTEF). The number of sections offered in
MOA has ranged between four and seven over the last three years. MOA WSCH
and FTES have fl uctuated over the last three years, from 657 WSCH in 2014-15 to
260 WSCH in 2015-16 and then back up to 458 in 2016-17. FTES has similarly gone
up and down, from 15.40 in 2014-15 to 7.11 in 2015-16 and then 10.34 in 2016-17.
Average class size has steadily decreased, however, from 27 in 2014-15 to 18.34
in 2016-17. These numbers still compare favorably to the overall college average of
14.3 for 2016-17. The students in the department have been served by between
0.33 and 0.56 FTEF during that period.
Department Considerations
The Medical Offi ce Assistant program enjoys strong enrollment numbers and
success rates quarter over quarter. LTCC currently offers several online MOA
courses related to terminology, billing and coding, and has been discussed
as a potential partner for Barton University’s MOA Clinical program in future
years. Barton’s six-month Medical Assisting (MA) program combines both
clinical and administrative duties. The fi rst fi ve months of the program includes
classroom-based instruction, and the last four weeks is the clinical portion.
Typical starting wages for a certifi ed MOA start at around $23-25 per hour.
Headcounts & FTES
Graph 56 below summarizes trends in the number of students enrolled in MOA
courses (headcount) as well as the number of Full-time Equivalent Students (FTES)
from 2012-13 to 2016-17. The MOA department experienced a peak in headcount
(145) and FTES (22.40) in 2012-13. In 2016-17, headcount had dropped to 85 and
FTES had declined to 10.34.
Retention & Successful Course Completion
Graph 57 on the following page depicts trends in retention and successful course
completion within MOA over the past fi ve academic years. The retention rate in
MOA has dropped from a high of 96.9% in 2012-13 to 88.3% in 2016-17. (The
LTCC overall retention rate was 92.5% for 2016-17.) In terms of successful course
completion, MOA demonstrates between 83.9% and 89.4% over the last fi ve years
(vs. a college-wide average of 83.3% for 2016-17).
Medical Offi ce Assistant Data
2014-15 2015-16 2016-17
# of Sections 7 4 7
WSCH 657.0 260.0 458.0
FTES 15.40 7.11 10.34
Avg Class Size 27.0 21.25 18.34
FTEF 0.56 0.33 0.56
# of Sections# of Sections 7 4 7 7 4 7 7 4 7 7 4 7 7 4 7 7 4 7 7 4 7 7 4 7
FTESFTES 15.40 7.11 10.34 15.40 7.11 10.34 15.40 7.11 10.34 15.40 7.11 10.34 15.40 7.11 10.34 15.40 7.11 10.34 15.40 7.11 10.34 15.40 7.11 10.34
FTEFFTEF 0.56 0.33 0.56 0.56 0.33 0.56 0.56 0.33 0.56 0.56 0.33 0.56 0.56 0.33 0.56 0.56 0.33 0.56 0.56 0.33 0.56 0.56 0.33 0.56
Table 29: Medical Offi ce Assistant Data
145
103
127
7085
22.4 11.38 15.47.11 10.34
0
50
100
150
2012-132 013-14 2014-152 015-16 2016-17
Headcount & FTES - 2014-2017
Headcount FTES
Graph 56: Medical Offi ce Assistant Headcount & FTES
» 2012-13 2013-14 2014-15 2015-16 2016-17
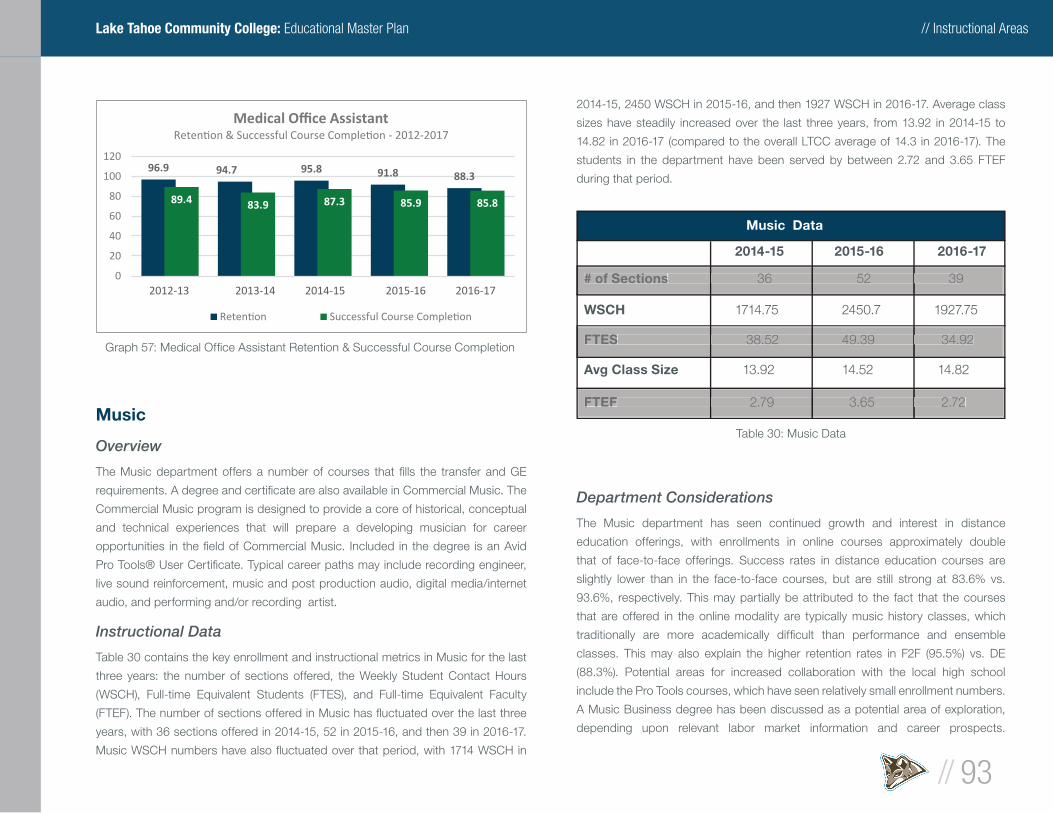
// Instructional Areas
// 93
Lake Tahoe Community College: Educational Master Plan
Music
Overview
The Music department offers a number of courses that fi lls the transfer and GE
requirements. A degree and certifi cate are also available in Commercial Music. The
Commercial Music program is designed to provide a core of historical, conceptual
and technical experiences that will prepare a developing musician for career
opportunities in the fi eld of Commercial Music. Included in the degree is an Avid
Pro Tools® User Certifi cate. Typical career paths may include recording engineer,
live sound reinforcement, music and post production audio, digital media/internet
audio, and performing and/or recording artist.
Instructional Data
Table 30 contains the key enrollment and instructional metrics in Music for the last
three years: the number of sections offered, the Weekly Student Contact Hours
(WSCH), Full-time Equivalent Students (FTES), and Full-time Equivalent Faculty
(FTEF). The number of sections offered in Music has fl uctuated over the last three
years, with 36 sections offered in 2014-15, 52 in 2015-16, and then 39 in 2016-17.
Music WSCH numbers have also fl uctuated over that period, with 1714 WSCH in
2014-15, 2450 WSCH in 2015-16, and then 1927 WSCH in 2016-17. Average class
sizes have steadily increased over the last three years, from 13.92 in 2014-15 to
14.82 in 2016-17 (compared to the overall LTCC average of 14.3 in 2016-17). The
students in the department have been served by between 2.72 and 3.65 FTEF
during that period.
Department Considerations
The Music department has seen continued growth and interest in distance
education offerings, with enrollments in online courses approximately double
that of face-to-face offerings. Success rates in distance education courses are
slightly lower than in the face-to-face courses, but are still strong at 83.6% vs.
93.6%, respectively. This may partially be attributed to the fact that the courses
that are offered in the online modality are typically music history classes, which
traditionally are more academically diffi cult than performance and ensemble
classes. This may also explain the higher retention rates in F2F (95.5%) vs. DE
(88.3%). Potential areas for increased collaboration with the local high school
include the Pro Tools courses, which have seen relatively small enrollment numbers.
A Music Business degree has been discussed as a potential area of exploration,
depending upon relevant labor market information and career prospects.
96.9 94.7 95.8 91.8 88.3
89.4 83.9 87.3 85.9 85.8
0
20
40
60
80
100
120
2012-132 013-14 2014-152 015-16 2016-17
- 2012-2017
Graph 57: Medical Offi ce Assistant Retention & Successful Course Completion
Music Data
2014-15 2015-16 2016-17
# of Sections 36 52 39
WSCH 1714.75 2450.7 1927.75
FTES 38.52 49.39 34.92
Avg Class Size 13.92 14.52 14.82
FTEF 2.79 3.65 2.72
# of Sections# of Sections 36 52 39 36 52 39 36 52 39 36 52 39 36 52 39 36 52 39 36 52 39 36 52 39
FTESFTES 38.52 49.39 34.92 38.52 49.39 34.92 38.52 49.39 34.92 38.52 49.39 34.92 38.52 49.39 34.92 38.52 49.39 34.92 38.52 49.39 34.92 38.52 49.39 34.92
FTEFFTEF 2.79 3.65 2.72 2.79 3.65 2.72 2.79 3.65 2.72 2.79 3.65 2.72 2.79 3.65 2.72 2.79 3.65 2.72 2.79 3.65 2.72 2.79 3.65 2.72
Table 30: Music Data
» 2012-13 2013-14 2014-15 2015-16 2016-17
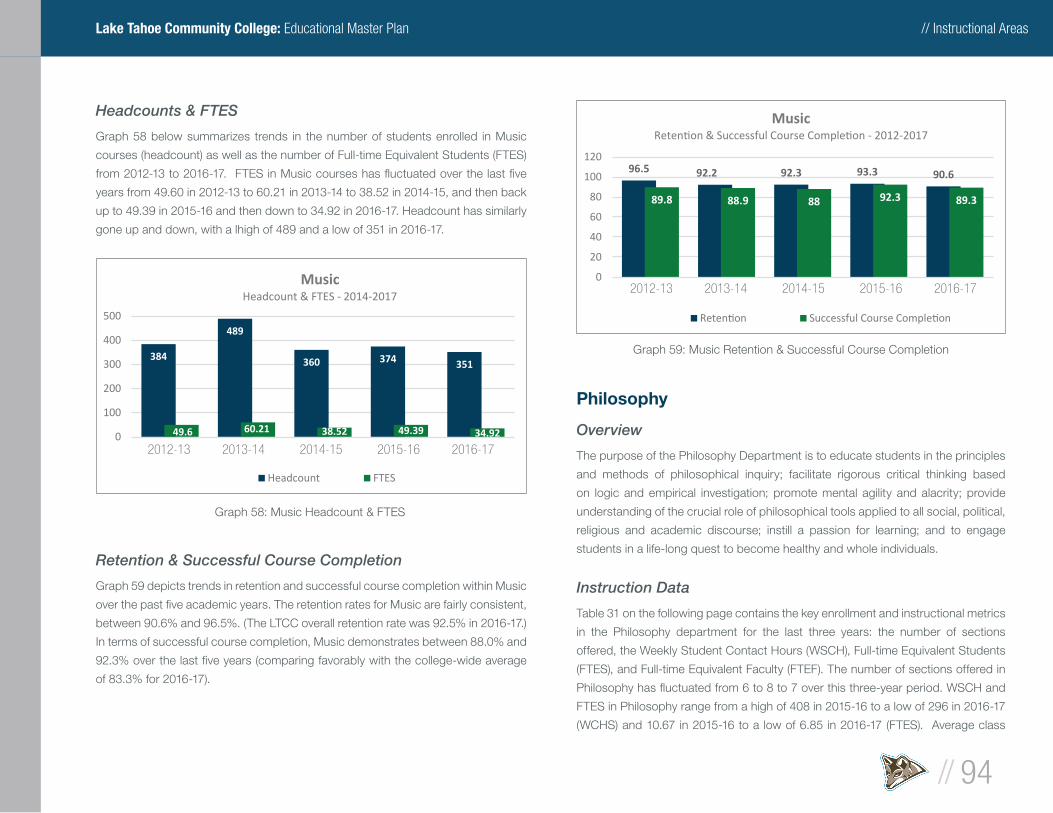
// Instructional Areas
// 94
Lake Tahoe Community College: Educational Master Plan
Headcounts & FTES
Graph 58 below summarizes trends in the number of students enrolled in Music
courses (headcount) as well as the number of Full-time Equivalent Students (FTES)
from 2012-13 to 2016-17. FTES in Music courses has fl uctuated over the last fi ve
years from 49.60 in 2012-13 to 60.21 in 2013-14 to 38.52 in 2014-15, and then back
up to 49.39 in 2015-16 and then down to 34.92 in 2016-17. Headcount has similarly
gone up and down, with a lhigh of 489 and a low of 351 in 2016-17.
Retention & Successful Course Completion
Graph 59 depicts trends in retention and successful course completion within Music
over the past fi ve academic years. The retention rates for Music are fairly consistent,
between 90.6% and 96.5%. (The LTCC overall retention rate was 92.5% in 2016-17.)
In terms of successful course completion, Music demonstrates between 88.0% and
92.3% over the last fi ve years (comparing favorably with the college-wide average
of 83.3% for 2016-17).
Philosophy
Overview
The purpose of the Philosophy Department is to educate students in the principles
and methods of philosophical inquiry; facilitate rigorous critical thinking based
on logic and empirical investigation; promote mental agility and alacrity; provide
understanding of the crucial role of philosophical tools applied to all social, political,
religious and academic discourse; instill a passion for learning; and to engage
students in a life-long quest to become healthy and whole individuals.
Instruction Data
Table 31 on the following page contains the key enrollment and instructional metrics
in the Philosophy department for the last three years: the number of sections
offered, the Weekly Student Contact Hours (WSCH), Full-time Equivalent Students
(FTES), and Full-time Equivalent Faculty (FTEF). The number of sections offered in
Philosophy has fl uctuated from 6 to 8 to 7 over this three-year period. WSCH and
FTES in Philosophy range from a high of 408 in 2015-16 to a low of 296 in 2016-17
(WCHS) and 10.67 in 2015-16 to a low of 6.85 in 2016-17 (FTES). Average class
384
489
360 374 351
49.6 60.21 38.52 49.39 34.920
100
200
300
400
500
2012-132 013-14 2014-152 015-16 2016-17
MusicHeadcount & FTES - 2014-2017
Headcount FTES
Graph 58: Music Headcount & FTES
96.5 92.2 92.3 93.3 90.6
89.8 88.9 88 92.3 89.3
0
20
40
60
80
100
120
2012-132 013-14 2014-152 015-16 2016-17
Music- 2012-2017
Graph 59: Music Retention & Successful Course Completion
» 2012-13 2013-14 2014-15 2015-16 2016-17
» 2012-13 2013-14 2014-15 2015-16 2016-17
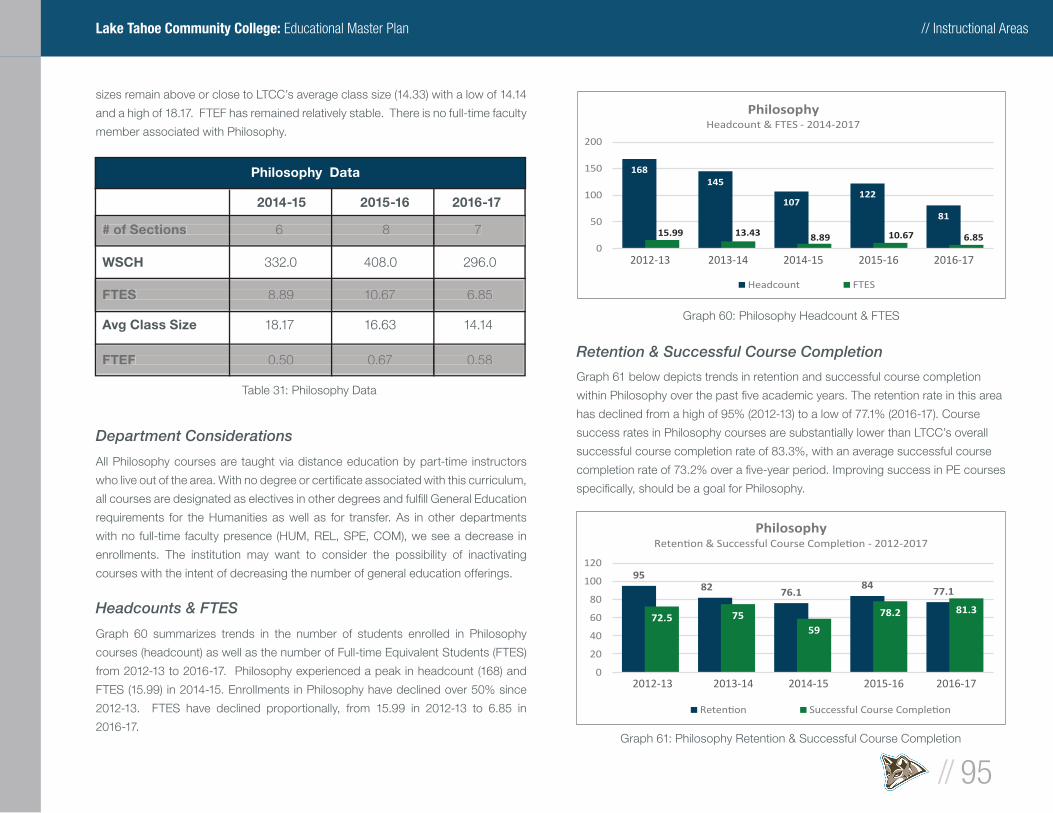
// Instructional Areas
// 95
Lake Tahoe Community College: Educational Master Plan
sizes remain above or close to LTCC’s average class size (14.33) with a low of 14.14
and a high of 18.17. FTEF has remained relatively stable. There is no full-time faculty
member associated with Philosophy.
Department Considerations
All Philosophy courses are taught via distance education by part-time instructors
who live out of the area. With no degree or certifi cate associated with this curriculum,
all courses are designated as electives in other degrees and fulfi ll General Education
requirements for the Humanities as well as for transfer. As in other departments
with no full-time faculty presence (HUM, REL, SPE, COM), we see a decrease in
enrollments. The institution may want to consider the possibility of inactivating
courses with the intent of decreasing the number of general education offerings.
Headcounts & FTES
Graph 60 summarizes trends in the number of students enrolled in Philosophy
courses (headcount) as well as the number of Full-time Equivalent Students (FTES)
from 2012-13 to 2016-17. Philosophy experienced a peak in headcount (168) and
FTES (15.99) in 2014-15. Enrollments in Philosophy have declined over 50% since
2012-13. FTES have declined proportionally, from 15.99 in 2012-13 to 6.85 in
2016-17.
Retention & Successful Course Completion
Graph 61 below depicts trends in retention and successful course completion
within Philosophy over the past fi ve academic years. The retention rate in this area
has declined from a high of 95% (2012-13) to a low of 77.1% (2016-17). Course
success rates in Philosophy courses are substantially lower than LTCC’s overall
successful course completion rate of 83.3%, with an average successful course
completion rate of 73.2% over a fi ve-year period. Improving success in PE courses
specifi cally, should be a goal for Philosophy.
Philosophy Data
2014-15 2015-16 2016-17
# of Sections 6 8 7
WSCH 332.0 408.0 296.0
FTES 8.89 10.67 6.85
Avg Class Size 18.17 16.63 14.14
FTEF 0.50 0.67 0.58
# of Sections# of Sections 6 8 7 6 8 7 6 8 7 6 8 7 6 8 7 6 8 7 6 8 7 6 8 7
FTESFTES 8.89 10.67 6.85 8.89 10.67 6.85 8.89 10.67 6.85 8.89 10.67 6.85 8.89 10.67 6.85 8.89 10.67 6.85 8.89 10.67 6.85 8.89 10.67 6.85
FTEFFTEF 0.50 0.67 0.58 0.50 0.67 0.58 0.50 0.67 0.58 0.50 0.67 0.58 0.50 0.67 0.58 0.50 0.67 0.58 0.50 0.67 0.58 0.50 0.67 0.58
Table 31: Philosophy Data
168145
107122
81
15.99 13.43 8.89 10.67 6.850
50
100
150
200
2012-132 013-14 2014-152 015-16 2016-17
PhilosophyHeadcount & FTES - 2014-2017
Headcount FTES
Graph 60: Philosophy Headcount & FTES
9582 76.1
8477.1
72.5 7559
78.2 81.3
0
20
40
60
80
100
120
2012-132 013-14 2014-152 015-16 2016-17
Philosophy- 2012-2017
Graph 61: Philosophy Retention & Successful Course Completion
» 2012-13 2013-14 2014-15 2015-16 2016-17
» 2012-13 2013-14 2014-15 2015-16 2016-17
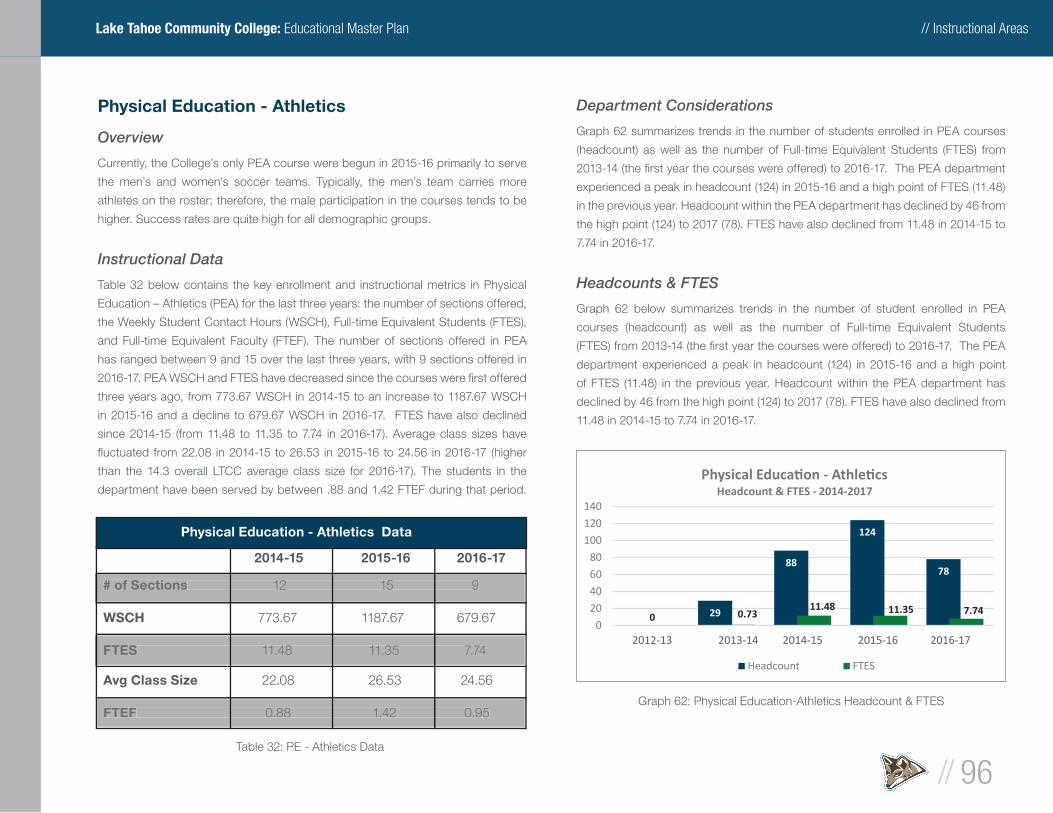
// Instructional Areas
// 96
Lake Tahoe Community College: Educational Master Plan
Physical Education - Athletics
Overview
Currently, the College’s only PEA course were begun in 2015-16 primarily to serve
the men’s and women’s soccer teams. Typically, the men’s team carries more
athletes on the roster; therefore, the male participation in the courses tends to be
higher. Success rates are quite high for all demographic groups.
Instructional Data
Table 32 below contains the key enrollment and instructional metrics in Physical
Education – Athletics (PEA) for the last three years: the number of sections offered,
the Weekly Student Contact Hours (WSCH), Full-time Equivalent Students (FTES),
and Full-time Equivalent Faculty (FTEF). The number of sections offered in PEA
has ranged between 9 and 15 over the last three years, with 9 sections offered in
2016-17. PEA WSCH and FTES have decreased since the courses were fi rst offered
three years ago, from 773.67 WSCH in 2014-15 to an increase to 1187.67 WSCH
in 2015-16 and a decline to 679.67 WSCH in 2016-17. FTES have also declined
since 2014-15 (from 11.48 to 11.35 to 7.74 in 2016-17). Average class sizes have
fl uctuated from 22.08 in 2014-15 to 26.53 in 2015-16 to 24.56 in 2016-17 (higher
than the 14.3 overall LTCC average class size for 2016-17). The students in the
department have been served by between .88 and 1.42 FTEF during that period.
Department Considerations
Graph 62 summarizes trends in the number of students enrolled in PEA courses
(headcount) as well as the number of Full-time Equivalent Students (FTES) from
2013-14 (the fi rst year the courses were offered) to 2016-17. The PEA department
experienced a peak in headcount (124) in 2015-16 and a high point of FTES (11.48)
in the previous year. Headcount within the PEA department has declined by 46 from
the high point (124) to 2017 (78). FTES have also declined from 11.48 in 2014-15 to
7.74 in 2016-17.
Headcounts & FTES
Graph 62 below summarizes trends in the number of student enrolled in PEA
courses (headcount) as well as the number of Full-time Equivalent Students
(FTES) from 2013-14 (the fi rst year the courses were offered) to 2016-17. The PEA
department experienced a peak in headcount (124) in 2015-16 and a high point
of FTES (11.48) in the previous year. Headcount within the PEA department has
declined by 46 from the high point (124) to 2017 (78). FTES have also declined from
11.48 in 2014-15 to 7.74 in 2016-17.
Physical Education - Athletics Data
2014-15 2015-16 2016-17
# of Sections 12 15 9
WSCH 773.67 1187.67 679.67
FTES 11.48 11.35 7.74
Avg Class Size 22.08 26.53 24.56
FTEF 0.88 1.42 0.95
# of Sections# of Sections 12 15 9 12 15 9 12 15 9 12 15 9 12 15 9 12 15 9 12 15 9 12 15 9
FTESFTES 11.48 11.35 7.74 11.48 11.35 7.74 11.48 11.35 7.74 11.48 11.35 7.74 11.48 11.35 7.74 11.48 11.35 7.74 11.48 11.35 7.74 11.48 11.35 7.74
FTEFFTEF 0.88 1.42 0.95 0.88 1.42 0.95 0.88 1.42 0.95 0.88 1.42 0.95 0.88 1.42 0.95 0.88 1.42 0.95 0.88 1.42 0.95 0.88 1.42 0.95
Table 32: PE - Athletics Data
0 29
88
124
78
0 0.7311.48 11.35 7.74
0
20
40
60
80
100
120
140
2012-132 013-14 2014-152 015-16 2016-17
-Headcount & FTES - 2014-2017
Headcount FTES
Graph 62: Physical Education-Athletics Headcount & FTES
» 2012-13 2013-14 2014-15 2015-16 2016-17
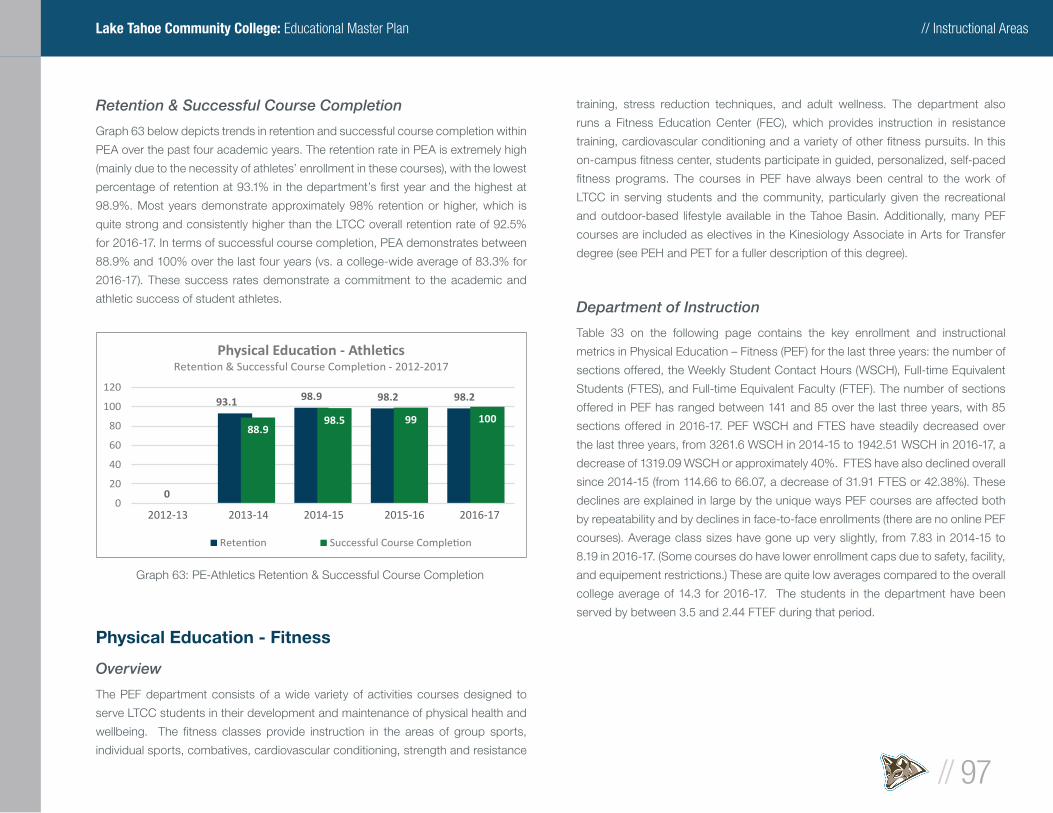
// Instructional Areas
// 97
Lake Tahoe Community College: Educational Master Plan
Retention & Successful Course Completion
Graph 63 below depicts trends in retention and successful course completion within
PEA over the past four academic years. The retention rate in PEA is extremely high
(mainly due to the necessity of athletes’ enrollment in these courses), with the lowest
percentage of retention at 93.1% in the department’s fi rst year and the highest at
98.9%. Most years demonstrate approximately 98% retention or higher, which is
quite strong and consistently higher than the LTCC overall retention rate of 92.5%
for 2016-17. In terms of successful course completion, PEA demonstrates between
88.9% and 100% over the last four years (vs. a college-wide average of 83.3% for
2016-17). These success rates demonstrate a commitment to the academic and
athletic success of student athletes.
Physical Education - Fitness
Overview
The PEF department consists of a wide variety of activities courses designed to
serve LTCC students in their development and maintenance of physical health and
wellbeing. The fi tness classes provide instruction in the areas of group sports,
individual sports, combatives, cardiovascular conditioning, strength and resistance
training, stress reduction techniques, and adult wellness. The department also
runs a Fitness Education Center (FEC), which provides instruction in resistance
training, cardiovascular conditioning and a variety of other fi tness pursuits. In this
on-campus fi tness center, students participate in guided, personalized, self-paced
fi tness programs. The courses in PEF have always been central to the work of
LTCC in serving students and the community, particularly given the recreational
and outdoor-based lifestyle available in the Tahoe Basin. Additionally, many PEF
courses are included as electives in the Kinesiology Associate in Arts for Transfer
degree (see PEH and PET for a fuller description of this degree).
Department of Instruction
Table 33 on the following page contains the key enrollment and instructional
metrics in Physical Education – Fitness (PEF) for the last three years: the number of
sections offered, the Weekly Student Contact Hours (WSCH), Full-time Equivalent
Students (FTES), and Full-time Equivalent Faculty (FTEF). The number of sections
offered in PEF has ranged between 141 and 85 over the last three years, with 85
sections offered in 2016-17. PEF WSCH and FTES have steadily decreased over
the last three years, from 3261.6 WSCH in 2014-15 to 1942.51 WSCH in 2016-17, a
decrease of 1319.09 WSCH or approximately 40%. FTES have also declined overall
since 2014-15 (from 114.66 to 66.07, a decrease of 31.91 FTES or 42.38%). These
declines are explained in large by the unique ways PEF courses are affected both
by repeatability and by declines in face-to-face enrollments (there are no online PEF
courses). Average class sizes have gone up very slightly, from 7.83 in 2014-15 to
8.19 in 2016-17. (Some courses do have lower enrollment caps due to safety, facility,
and equipement restrictions.) These are quite low averages compared to the overall
college average of 14.3 for 2016-17. The students in the department have been
served by between 3.5 and 2.44 FTEF during that period.
0
93.1 98.9 98.2 98.2
0
88.998.5 99 100
0
20
40
60
80
100
120
2012-132 013-14 2014-152 015-16 2016-17
-- 2012-2017
Graph 63: PE-Athletics Retention & Successful Course Completion
» 2012-13 2013-14 2014-15 2015-16 2016-17
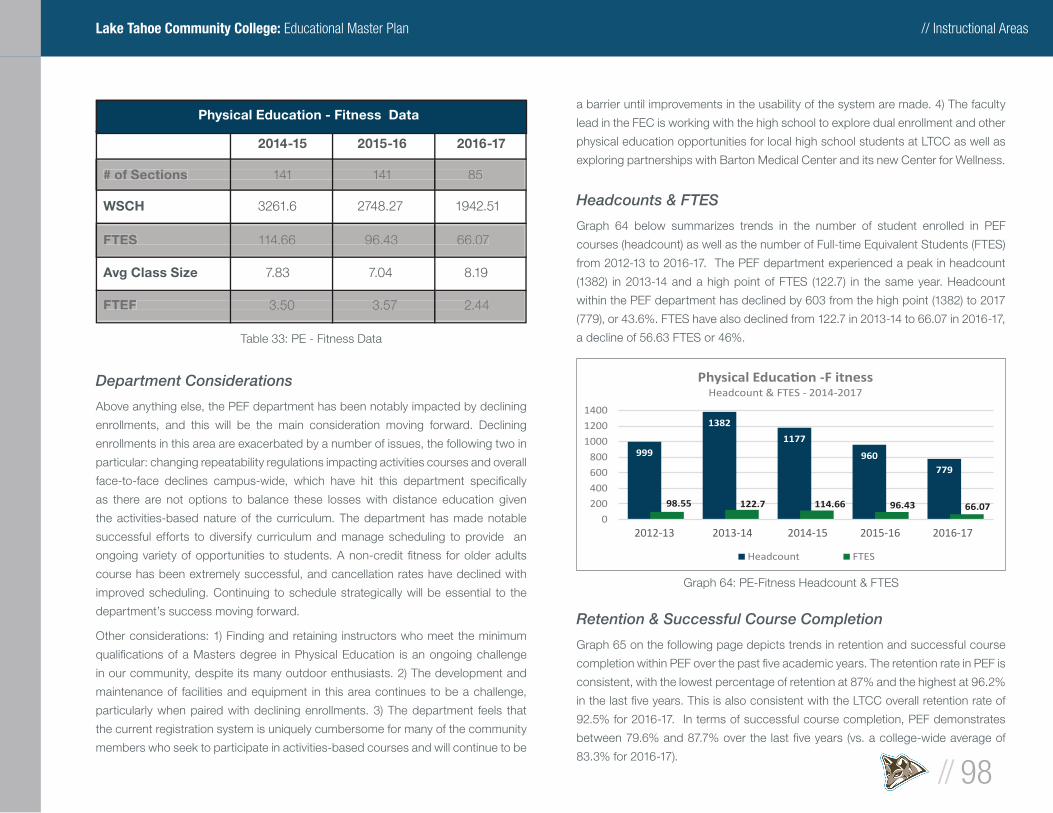
// Instructional Areas
// 98
Lake Tahoe Community College: Educational Master Plan
Department Considerations
Above anything else, the PEF department has been notably impacted by declining
enrollments, and this will be the main consideration moving forward. Declining
enrollments in this area are exacerbated by a number of issues, the following two in
particular: changing repeatability regulations impacting activities courses and overall
face-to-face declines campus-wide, which have hit this department specifi cally
as there are not options to balance these losses with distance education given
the activities-based nature of the curriculum. The department has made notable
successful efforts to diversify curriculum and manage scheduling to provide an
ongoing variety of opportunities to students. A non-credit fi tness for older adults
course has been extremely successful, and cancellation rates have declined with
improved scheduling. Continuing to schedule strategically will be essential to the
department’s success moving forward.
Other considerations: 1) Finding and retaining instructors who meet the minimum
qualifi cations of a Masters degree in Physical Education is an ongoing challenge
in our community, despite its many outdoor enthusiasts. 2) The development and
maintenance of facilities and equipment in this area continues to be a challenge,
particularly when paired with declining enrollments. 3) The department feels that
the current registration system is uniquely cumbersome for many of the community
members who seek to participate in activities-based courses and will continue to be
a barrier until improvements in the usability of the system are made. 4) The faculty
lead in the FEC is working with the high school to explore dual enrollment and other
physical education opportunities for local high school students at LTCC as well as
exploring partnerships with Barton Medical Center and its new Center for Wellness.
Headcounts & FTES
Graph 64 below summarizes trends in the number of student enrolled in PEF
courses (headcount) as well as the number of Full-time Equivalent Students (FTES)
from 2012-13 to 2016-17. The PEF department experienced a peak in headcount
(1382) in 2013-14 and a high point of FTES (122.7) in the same year. Headcount
within the PEF department has declined by 603 from the high point (1382) to 2017
(779), or 43.6%. FTES have also declined from 122.7 in 2013-14 to 66.07 in 2016-17,
a decline of 56.63 FTES or 46%.
Retention & Successful Course Completion
Graph 65 on the following page depicts trends in retention and successful course
completion within PEF over the past fi ve academic years. The retention rate in PEF is
consistent, with the lowest percentage of retention at 87% and the highest at 96.2%
in the last fi ve years. This is also consistent with the LTCC overall retention rate of
92.5% for 2016-17. In terms of successful course completion, PEF demonstrates
between 79.6% and 87.7% over the last fi ve years (vs. a college-wide average of
83.3% for 2016-17).
Physical Education - Fitness Data
2014-15 2015-16 2016-17
# of Sections 141 141 85
WSCH 3261.6 2748.27 1942.51
FTES 114.66 96.43 66.07
Avg Class Size 7.83 7.04 8.19
FTEF 3.50 3.57 2.44
# of Sections# of Sections 141 141 85 141 141 85 141 141 85 141 141 85 141 141 85 141 141 85 141 141 85 141 141 85
FTESFTES 114.66 96.43 66.07 114.66 96.43 66.07 114.66 96.43 66.07 114.66 96.43 66.07 114.66 96.43 66.07 114.66 96.43 66.07 114.66 96.43 66.07 114.66 96.43 66.07
FTEFFTEF 3.50 3.57 2.44 3.50 3.57 2.44 3.50 3.57 2.44 3.50 3.57 2.44 3.50 3.57 2.44 3.50 3.57 2.44 3.50 3.57 2.44 3.50 3.57 2.44
Table 33: PE - Fitness Data
999
1382
1177
960779
98.55 122.7 114.66 96.43 66.070
200
400
600
800
1000
1200
1400
2012-132 013-14 2014-152 015-16 2016-17
-F itnessHeadcount & FTES - 2014-2017
Headcount FTES
Graph 64: PE-Fitness Headcount & FTES
» 2012-13 2013-14 2014-15 2015-16 2016-17
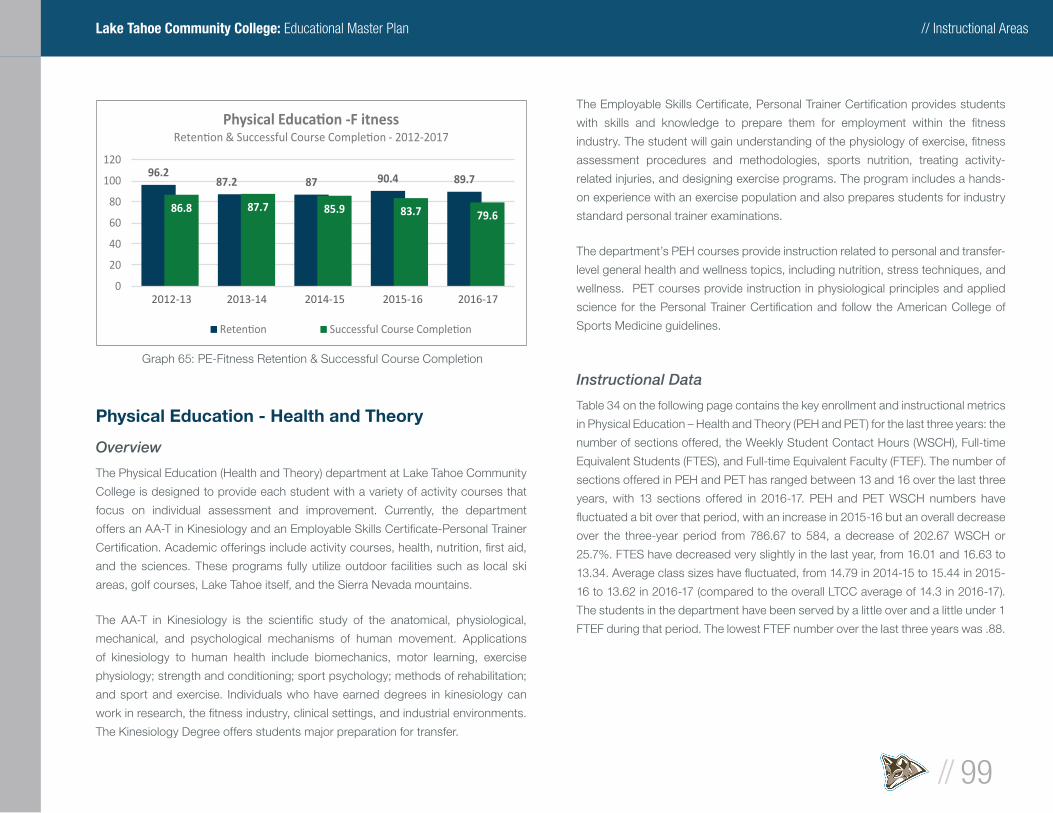
// Instructional Areas
// 99
Lake Tahoe Community College: Educational Master Plan
Physical Education - Health and Theory
Overview
The Physical Education (Health and Theory) department at Lake Tahoe Community
College is designed to provide each student with a variety of activity courses that
focus on individual assessment and improvement. Currently, the department
offers an AA-T in Kinesiology and an Employable Skills Certifi cate-Personal Trainer
Certifi cation. Academic offerings include activity courses, health, nutrition, fi rst aid,
and the sciences. These programs fully utilize outdoor facilities such as local ski
areas, golf courses, Lake Tahoe itself, and the Sierra Nevada mountains.
The AA-T in Kinesiology is the scientifi c study of the anatomical, physiological,
mechanical, and psychological mechanisms of human movement. Applications
of kinesiology to human health include biomechanics, motor learning, exercise
physiology; strength and conditioning; sport psychology; methods of rehabilitation;
and sport and exercise. Individuals who have earned degrees in kinesiology can
work in research, the fi tness industry, clinical settings, and industrial environments.
The Kinesiology Degree offers students major preparation for transfer.
The Employable Skills Certifi cate, Personal Trainer Certifi cation provides students
with skills and knowledge to prepare them for employment within the fi tness
industry. The student will gain understanding of the physiology of exercise, fi tness
assessment procedures and methodologies, sports nutrition, treating activity-
related injuries, and designing exercise programs. The program includes a hands-
on experience with an exercise population and also prepares students for industry
standard personal trainer examinations.
The department’s PEH courses provide instruction related to personal and transfer-
level general health and wellness topics, including nutrition, stress techniques, and
wellness. PET courses provide instruction in physiological principles and applied
science for the Personal Trainer Certifi cation and follow the American College of
Sports Medicine guidelines.
Instructional Data
Table 34 on the following page contains the key enrollment and instructional metrics
in Physical Education – Health and Theory (PEH and PET) for the last three years: the
number of sections offered, the Weekly Student Contact Hours (WSCH), Full-time
Equivalent Students (FTES), and Full-time Equivalent Faculty (FTEF). The number of
sections offered in PEH and PET has ranged between 13 and 16 over the last three
years, with 13 sections offered in 2016-17. PEH and PET WSCH numbers have
fl uctuated a bit over that period, with an increase in 2015-16 but an overall decrease
over the three-year period from 786.67 to 584, a decrease of 202.67 WSCH or
25.7%. FTES have decreased very slightly in the last year, from 16.01 and 16.63 to
13.34. Average class sizes have fl uctuated, from 14.79 in 2014-15 to 15.44 in 2015-
16 to 13.62 in 2016-17 (compared to the overall LTCC average of 14.3 in 2016-17).
The students in the department have been served by a little over and a little under 1
FTEF during that period. The lowest FTEF number over the last three years was .88.
96.287.2 87 90.4 89.7
86.8 87.7 85.9 83.7 79.6
0
20
40
60
80
100
120
2012-132 013-14 2014-152 015-16 2016-17
-F itness- 2012-2017
Graph 65: PE-Fitness Retention & Successful Course Completion
» 2012-13 2013-14 2014-15 2015-16 2016-17
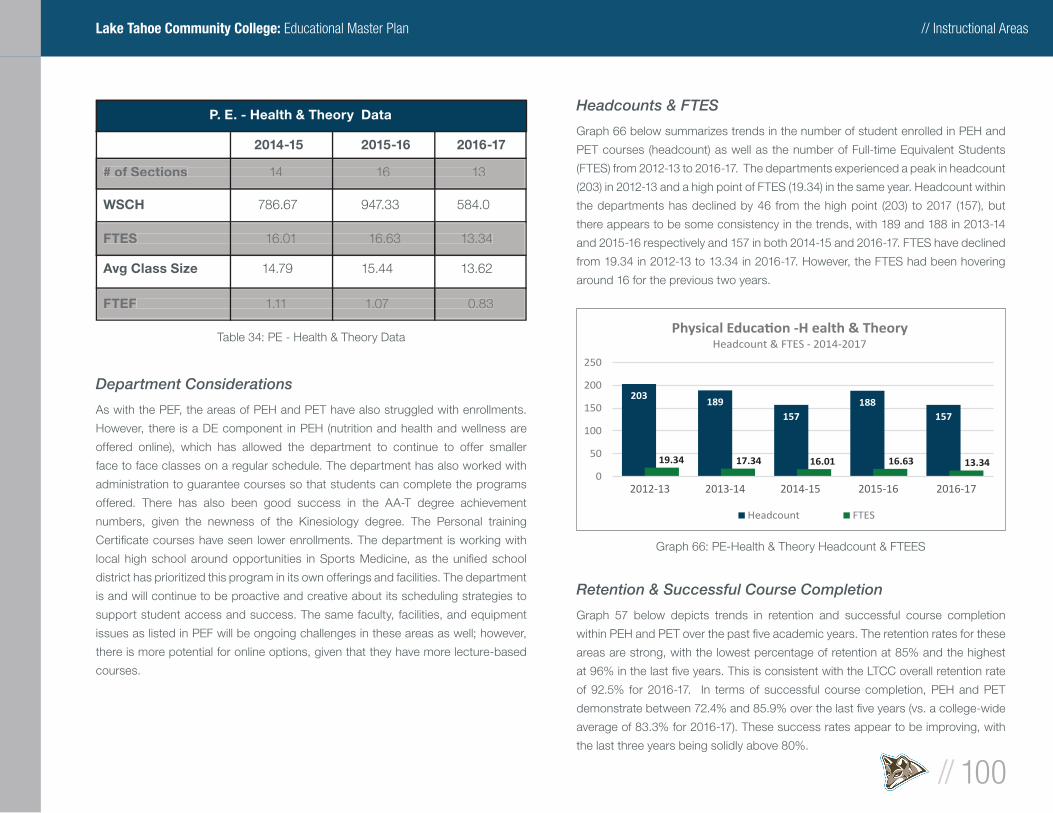
// Instructional Areas
// 100
Lake Tahoe Community College: Educational Master Plan
Department Considerations
As with the PEF, the areas of PEH and PET have also struggled with enrollments.
However, there is a DE component in PEH (nutrition and health and wellness are
offered online), which has allowed the department to continue to offer smaller
face to face classes on a regular schedule. The department has also worked with
administration to guarantee courses so that students can complete the programs
offered. There has also been good success in the AA-T degree achievement
numbers, given the newness of the Kinesiology degree. The Personal training
Certifi cate courses have seen lower enrollments. The department is working with
local high school around opportunities in Sports Medicine, as the unifi ed school
district has prioritized this program in its own offerings and facilities. The department
is and will continue to be proactive and creative about its scheduling strategies to
support student access and success. The same faculty, facilities, and equipment
issues as listed in PEF will be ongoing challenges in these areas as well; however,
there is more potential for online options, given that they have more lecture-based
courses.
Headcounts & FTES
Graph 66 below summarizes trends in the number of student enrolled in PEH and
PET courses (headcount) as well as the number of Full-time Equivalent Students
(FTES) from 2012-13 to 2016-17. The departments experienced a peak in headcount
(203) in 2012-13 and a high point of FTES (19.34) in the same year. Headcount within
the departments has declined by 46 from the high point (203) to 2017 (157), but
there appears to be some consistency in the trends, with 189 and 188 in 2013-14
and 2015-16 respectively and 157 in both 2014-15 and 2016-17. FTES have declined
from 19.34 in 2012-13 to 13.34 in 2016-17. However, the FTES had been hovering
around 16 for the previous two years.
Retention & Successful Course Completion
Graph 57 below depicts trends in retention and successful course completion
within PEH and PET over the past fi ve academic years. The retention rates for these
areas are strong, with the lowest percentage of retention at 85% and the highest
at 96% in the last fi ve years. This is consistent with the LTCC overall retention rate
of 92.5% for 2016-17. In terms of successful course completion, PEH and PET
demonstrate between 72.4% and 85.9% over the last fi ve years (vs. a college-wide
average of 83.3% for 2016-17). These success rates appear to be improving, with
the last three years being solidly above 80%.
P. E. - Health & Theory Data
2014-15 2015-16 2016-17
# of Sections 14 16 13
WSCH 786.67 947.33 584.0
FTES 16.01 16.63 13.34
Avg Class Size 14.79 15.44 13.62
FTEF 1.11 1.07 0.83
# of Sections# of Sections 14 16 13 14 16 13 14 16 13 14 16 13 14 16 13 14 16 13 14 16 13 14 16 13
FTESFTES 16.01 16.63 13.34 16.01 16.63 13.34 16.01 16.63 13.34 16.01 16.63 13.34 16.01 16.63 13.34 16.01 16.63 13.34 16.01 16.63 13.34 16.01 16.63 13.34
FTEFFTEF 1.11 1.07 0.83 1.11 1.07 0.83 1.11 1.07 0.83 1.11 1.07 0.83 1.11 1.07 0.83 1.11 1.07 0.83 1.11 1.07 0.83 1.11 1.07 0.83
Table 34: PE - Health & Theory Data
203189
157188
157
19.34 17.34 16.01 16.63 13.340
50
100
150
200
250
2012-132 013-14 2014-152 015-16 2016-17
-H ealth & TheoryHeadcount & FTES - 2014-2017
Headcount FTES
Graph 66: PE-Health & Theory Headcount & FTEES
» 2012-13 2013-14 2014-15 2015-16 2016-17
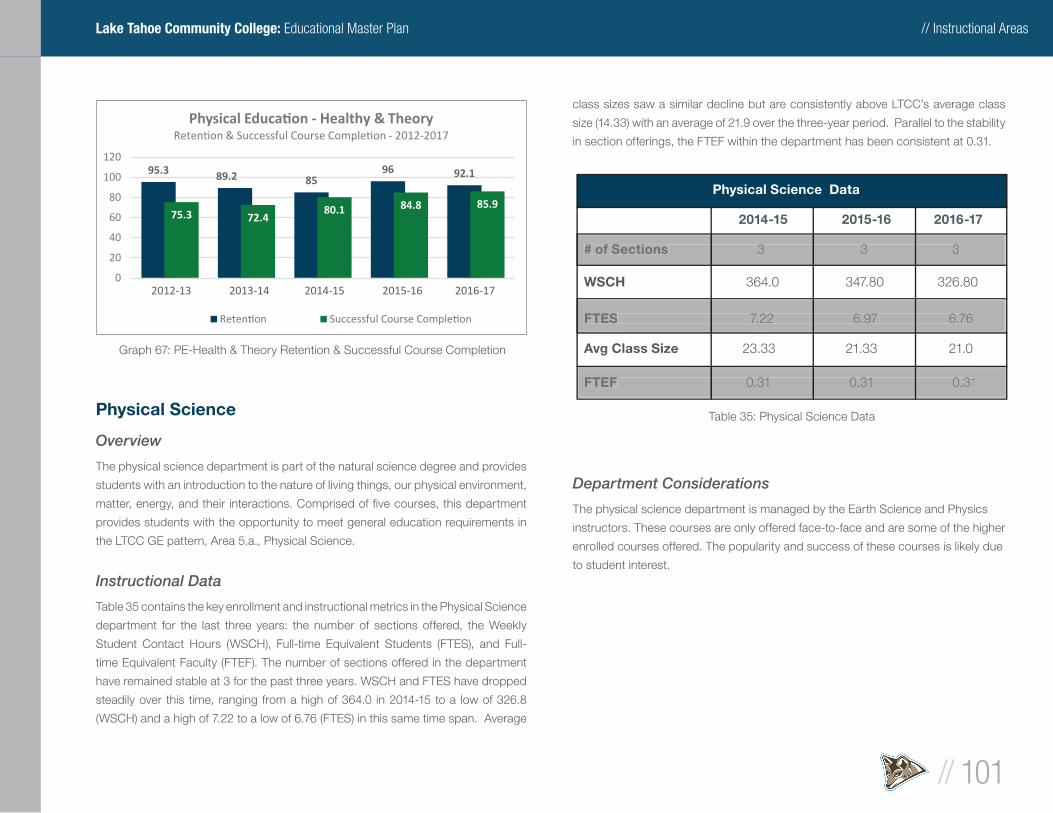
// Instructional Areas
// 101
Lake Tahoe Community College: Educational Master Plan
Physical Science
Overview
The physical science department is part of the natural science degree and provides
students with an introduction to the nature of living things, our physical environment,
matter, energy, and their interactions. Comprised of fi ve courses, this department
provides students with the opportunity to meet general education requirements in
the LTCC GE pattern, Area 5.a., Physical Science.
Instructional Data
Table 35 contains the key enrollment and instructional metrics in the Physical Science
department for the last three years: the number of sections offered, the Weekly
Student Contact Hours (WSCH), Full-time Equivalent Students (FTES), and Full-
time Equivalent Faculty (FTEF). The number of sections offered in the department
have remained stable at 3 for the past three years. WSCH and FTES have dropped
steadily over this time, ranging from a high of 364.0 in 2014-15 to a low of 326.8
(WSCH) and a high of 7.22 to a low of 6.76 (FTES) in this same time span. Average
class sizes saw a similar decline but are consistently above LTCC’s average class
size (14.33) with an average of 21.9 over the three-year period. Parallel to the stability
in section offerings, the FTEF within the department has been consistent at 0.31.
Department Considerations
The physical science department is managed by the Earth Science and Physics
instructors. These courses are only offered face-to-face and are some of the higher
enrolled courses offered. The popularity and success of these courses is likely due
to student interest.
Physical Science Data
2014-15 2015-16 2016-17
# of Sections 3 3 3
WSCH 364.0 347.80 326.80
FTES 7.22 6.97 6.76
Avg Class Size 23.33 21.33 21.0
FTEF 0.31 0.31 0.31
# of Sections# of Sections 3 3 3 3 3 3 3 3 3 3 3 3 3 3 3 3 3 3 3 3 3 3 3 3
FTESFTES 7.22 6.97 6.76 7.22 6.97 6.76 7.22 6.97 6.76 7.22 6.97 6.76 7.22 6.97 6.76 7.22 6.97 6.76 7.22 6.97 6.76 7.22 6.97 6.76
FTEFFTEF 0.31 0.31 0.31 0.31 0.31 0.31 0.31 0.31 0.31 0.31 0.31 0.31 0.31 0.31 0.31 0.31 0.31 0.31 0.31 0.31 0.31 0.31 0.31 0.31
Table 35: Physical Science Data
95.3 89.2 8596 92.1
75.3 72.480.1 84.8 85.9
0
20
40
60
80
100
120
2012-132 013-14 2014-152 015-16 2016-17
- Healthy & Theory- 2012-2017
Graph 67: PE-Health & Theory Retention & Successful Course Completion
» 2012-13 2013-14 2014-15 2015-16 2016-17
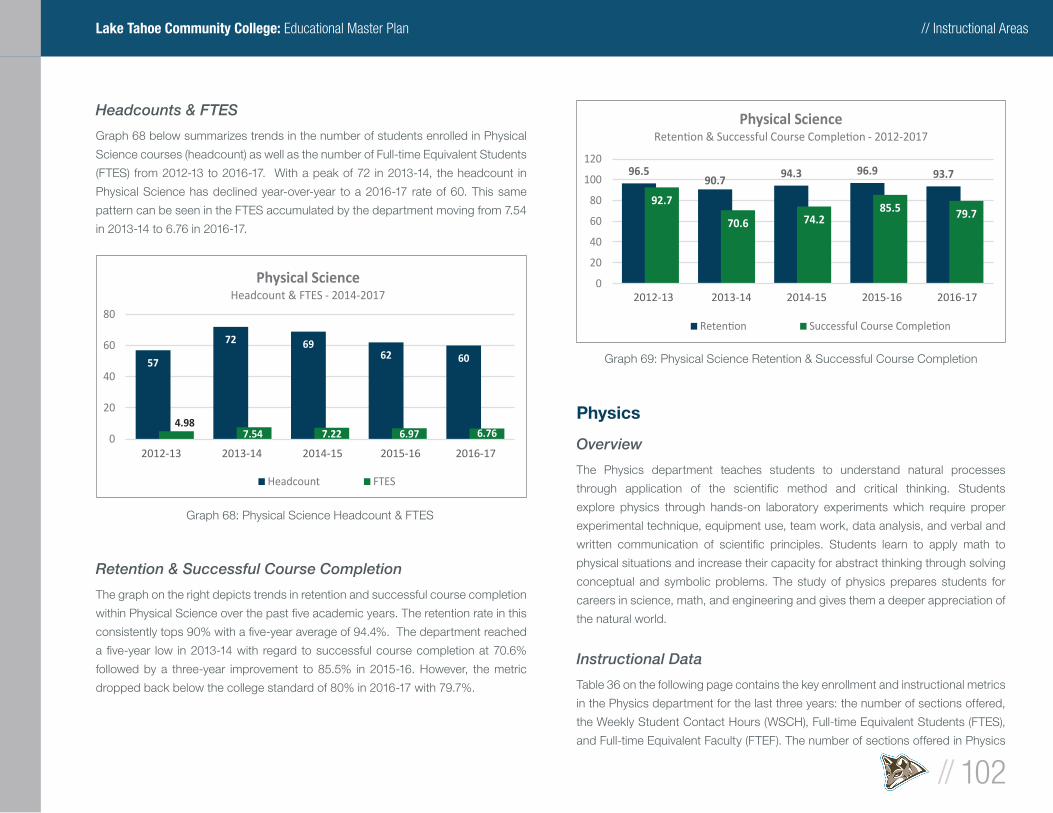
// Instructional Areas
// 102
Lake Tahoe Community College: Educational Master Plan
Headcounts & FTES
Graph 68 below summarizes trends in the number of students enrolled in Physical
Science courses (headcount) as well as the number of Full-time Equivalent Students
(FTES) from 2012-13 to 2016-17. With a peak of 72 in 2013-14, the headcount in
Physical Science has declined year-over-year to a 2016-17 rate of 60. This same
pattern can be seen in the FTES accumulated by the department moving from 7.54
in 2013-14 to 6.76 in 2016-17.
Retention & Successful Course Completion
The graph on the right depicts trends in retention and successful course completion
within Physical Science over the past fi ve academic years. The retention rate in this
consistently tops 90% with a fi ve-year average of 94.4%. The department reached
a fi ve-year low in 2013-14 with regard to successful course completion at 70.6%
followed by a three-year improvement to 85.5% in 2015-16. However, the metric
dropped back below the college standard of 80% in 2016-17 with 79.7%.
Physics
Overview
The Physics department teaches students to understand natural processes
through application of the scientifi c method and critical thinking. Students
explore physics through hands-on laboratory experiments which require proper
experimental technique, equipment use, team work, data analysis, and verbal and
written communication of scientifi c principles. Students learn to apply math to
physical situations and increase their capacity for abstract thinking through solving
conceptual and symbolic problems. The study of physics prepares students for
careers in science, math, and engineering and gives them a deeper appreciation of
the natural world.
Instructional Data
Table 36 on the following page contains the key enrollment and instructional metrics
in the Physics department for the last three years: the number of sections offered,
the Weekly Student Contact Hours (WSCH), Full-time Equivalent Students (FTES),
and Full-time Equivalent Faculty (FTEF). The number of sections offered in Physics
57
72 6962 60
4.987.54 7.22 6.97 6.760
20
40
60
80
2012-132 013-14 2014-152 015-16 2016-17
Physical ScienceHeadcount & FTES - 2014-2017
Headcount FTES
Graph 68: Physical Science Headcount & FTES
96.590.7
94.3 96.9 93.7
92.7
70.6 74.285.5 79.7
0
20
40
60
80
100
120
2012-132 013-14 2014-152 015-16 2016-17
Physical Science- 2012-2017
Graph 69: Physical Science Retention & Successful Course Completion
» 2012-13 2013-14 2014-15 2015-16 2016-17
» 2012-13 2013-14 2014-15 2015-16 2016-17
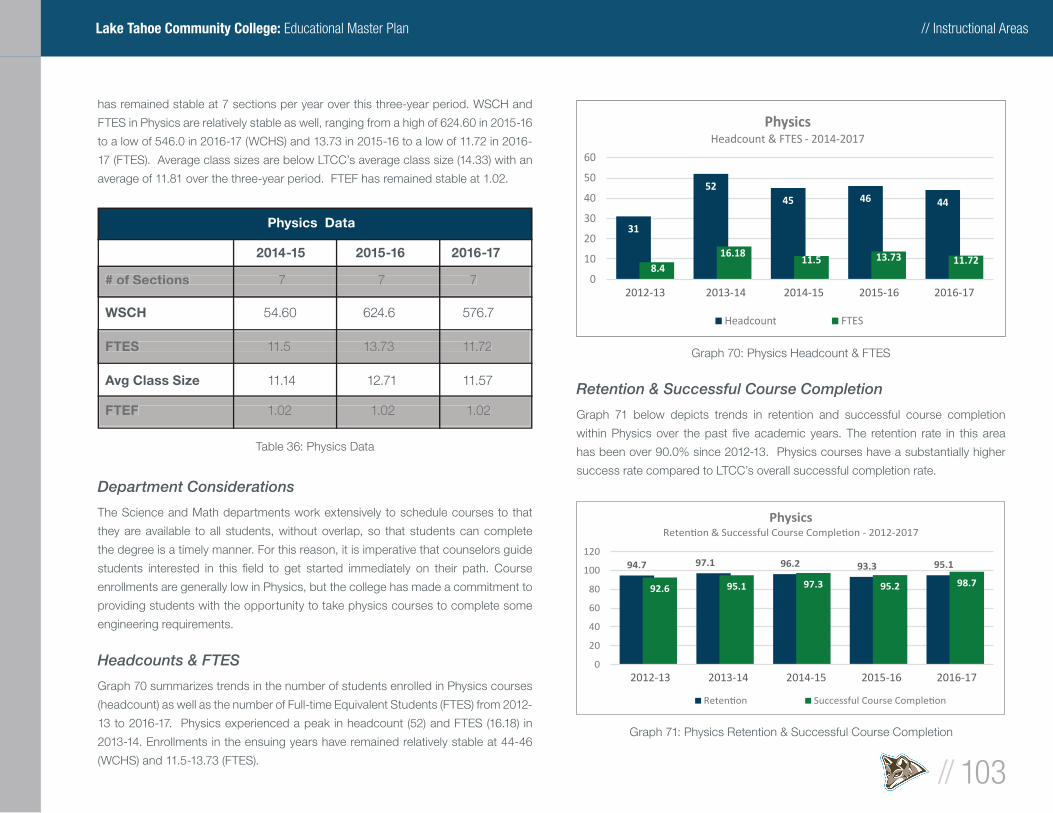
// Instructional Areas
// 103
Lake Tahoe Community College: Educational Master Plan
has remained stable at 7 sections per year over this three-year period. WSCH and
FTES in Physics are relatively stable as well, ranging from a high of 624.60 in 2015-16
to a low of 546.0 in 2016-17 (WCHS) and 13.73 in 2015-16 to a low of 11.72 in 2016-
17 (FTES). Average class sizes are below LTCC’s average class size (14.33) with an
average of 11.81 over the three-year period. FTEF has remained stable at 1.02.
Department Considerations
The Science and Math departments work extensively to schedule courses to that
they are available to all students, without overlap, so that students can complete
the degree is a timely manner. For this reason, it is imperative that counselors guide
students interested in this fi eld to get started immediately on their path. Course
enrollments are generally low in Physics, but the college has made a commitment to
providing students with the opportunity to take physics courses to complete some
engineering requirements.
Headcounts & FTES
Graph 70 summarizes trends in the number of students enrolled in Physics courses
(headcount) as well as the number of Full-time Equivalent Students (FTES) from 2012-
13 to 2016-17. Physics experienced a peak in headcount (52) and FTES (16.18) in
2013-14. Enrollments in the ensuing years have remained relatively stable at 44-46
(WCHS) and 11.5-13.73 (FTES).
Retention & Successful Course Completion
Graph 71 below depicts trends in retention and successful course completion
within Physics over the past fi ve academic years. The retention rate in this area
has been over 90.0% since 2012-13. Physics courses have a substantially higher
success rate compared to LTCC’s overall successful completion rate.
Physics Data
2014-15 2015-16 2016-17
# of Sections 7 7 7
WSCH 54.60 624.6 576.7
FTES 11.5 13.73 11.72
Avg Class Size 11.14 12.71 11.57
FTEF 1.02 1.02 1.02
# of Sections# of Sections 7 7 7 7 7 7 7 7 7 7 7 7 7 7 7 7 7 7 7 7 7 7 7 7
FTESFTES 11.5 13.73 11.72 11.5 13.73 11.72 11.5 13.73 11.72 11.5 13.73 11.72 11.5 13.73 11.72 11.5 13.73 11.72 11.5 13.73 11.72 11.5 13.73 11.72
FTEFFTEF 1.02 1.02 1.02 1.02 1.02 1.02 1.02 1.02 1.02 1.02 1.02 1.02 1.02 1.02 1.02 1.02 1.02 1.02 1.02 1.02 1.02 1.02 1.02 1.02
Table 36: Physics Data
31
5245 46 44
8.416.18
11.5 13.73 11.72
0
10
20
30
40
50
60
2012-132 013-14 2014-152 015-16 2016-17
PhysicsHeadcount & FTES - 2014-2017
Headcount FTES
Graph 70: Physics Headcount & FTES
94.7 97.1 96.2 93.3 95.1
92.6 95.1 97.3 95.2 98.7
0
20
40
60
80
100
120
2012-132 013-14 2014-152 015-16 2016-17
Physics- 2012-2017
Graph 71: Physics Retention & Successful Course Completion
» 2012-13 2013-14 2014-15 2015-16 2016-17
» 2012-13 2013-14 2014-15 2015-16 2016-17
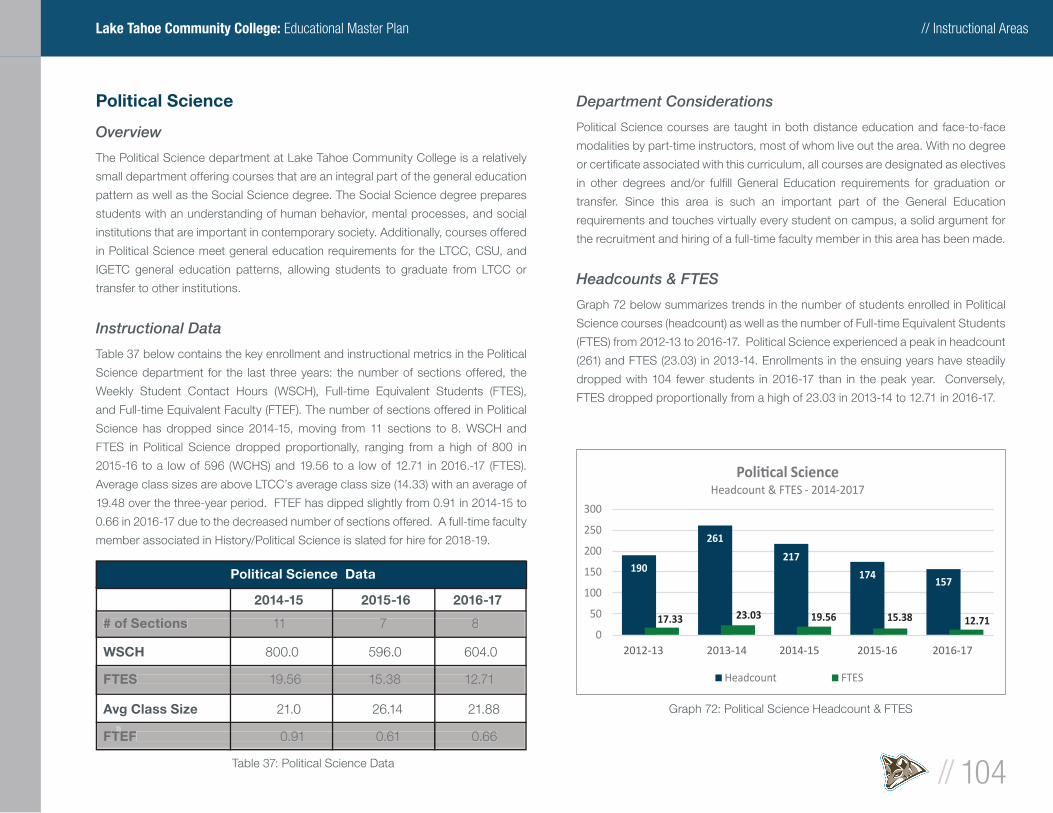
// Instructional Areas
// 104
Lake Tahoe Community College: Educational Master Plan
Political Science
Overview
The Political Science department at Lake Tahoe Community College is a relatively
small department offering courses that are an integral part of the general education
pattern as well as the Social Science degree. The Social Science degree prepares
students with an understanding of human behavior, mental processes, and social
institutions that are important in contemporary society. Additionally, courses offered
in Political Science meet general education requirements for the LTCC, CSU, and
IGETC general education patterns, allowing students to graduate from LTCC or
transfer to other institutions.
Instructional Data
Table 37 below contains the key enrollment and instructional metrics in the Political
Science department for the last three years: the number of sections offered, the
Weekly Student Contact Hours (WSCH), Full-time Equivalent Students (FTES),
and Full-time Equivalent Faculty (FTEF). The number of sections offered in Political
Science has dropped since 2014-15, moving from 11 sections to 8. WSCH and
FTES in Political Science dropped proportionally, ranging from a high of 800 in
2015-16 to a low of 596 (WCHS) and 19.56 to a low of 12.71 in 2016.-17 (FTES).
Average class sizes are above LTCC’s average class size (14.33) with an average of
19.48 over the three-year period. FTEF has dipped slightly from 0.91 in 2014-15 to
0.66 in 2016-17 due to the decreased number of sections offered. A full-time faculty
member associated in History/Political Science is slated for hire for 2018-19.
Department Considerations
Political Science courses are taught in both distance education and face-to-face
modalities by part-time instructors, most of whom live out the area. With no degree
or certifi cate associated with this curriculum, all courses are designated as electives
in other degrees and/or fulfi ll General Education requirements for graduation or
transfer. Since this area is such an important part of the General Education
requirements and touches virtually every student on campus, a solid argument for
the recruitment and hiring of a full-time faculty member in this area has been made.
Headcounts & FTES
Graph 72 below summarizes trends in the number of students enrolled in Political
Science courses (headcount) as well as the number of Full-time Equivalent Students
(FTES) from 2012-13 to 2016-17. Political Science experienced a peak in headcount
(261) and FTES (23.03) in 2013-14. Enrollments in the ensuing years have steadily
dropped with 104 fewer students in 2016-17 than in the peak year. Conversely,
FTES dropped proportionally from a high of 23.03 in 2013-14 to 12.71 in 2016-17.
Political Science Data
2014-15 2015-16 2016-17
# of Sections 11 7 8
WSCH 800.0 596.0 604.0
FTES 19.56 15.38 12.71
Avg Class Size 21.0 26.14 21.88
FTEF 0.91 0.61 0.66
# of Sections# of Sections 11 7 8 11 7 8 11 7 8 11 7 8 11 7 8 11 7 8 11 7 8 11 7 8
FTESFTES 19.56 15.38 12.71 19.56 15.38 12.71 19.56 15.38 12.71 19.56 15.38 12.71 19.56 15.38 12.71 19.56 15.38 12.71 19.56 15.38 12.71 19.56 15.38 12.71
FTEFFTEF 0.91 0.61 0.66 0.91 0.61 0.66 0.91 0.61 0.66 0.91 0.61 0.66 0.91 0.61 0.66 0.91 0.61 0.66 0.91 0.61 0.66 0.91 0.61 0.66»»
FTEFFTEF»
FTEFFTEFFTEF
Table 37: Political Science Data
190
261
217
174157
17.33 23.03 19.56 15.38 12.710
50
100
150
200
250
300
2012-132 013-14 2014-152 015-16 2016-17
Headcount & FTES - 2014-2017
Headcount FTES
Graph 72: Political Science Headcount & FTES
» 2012-13 2013-14 2014-15 2015-16 2016-17
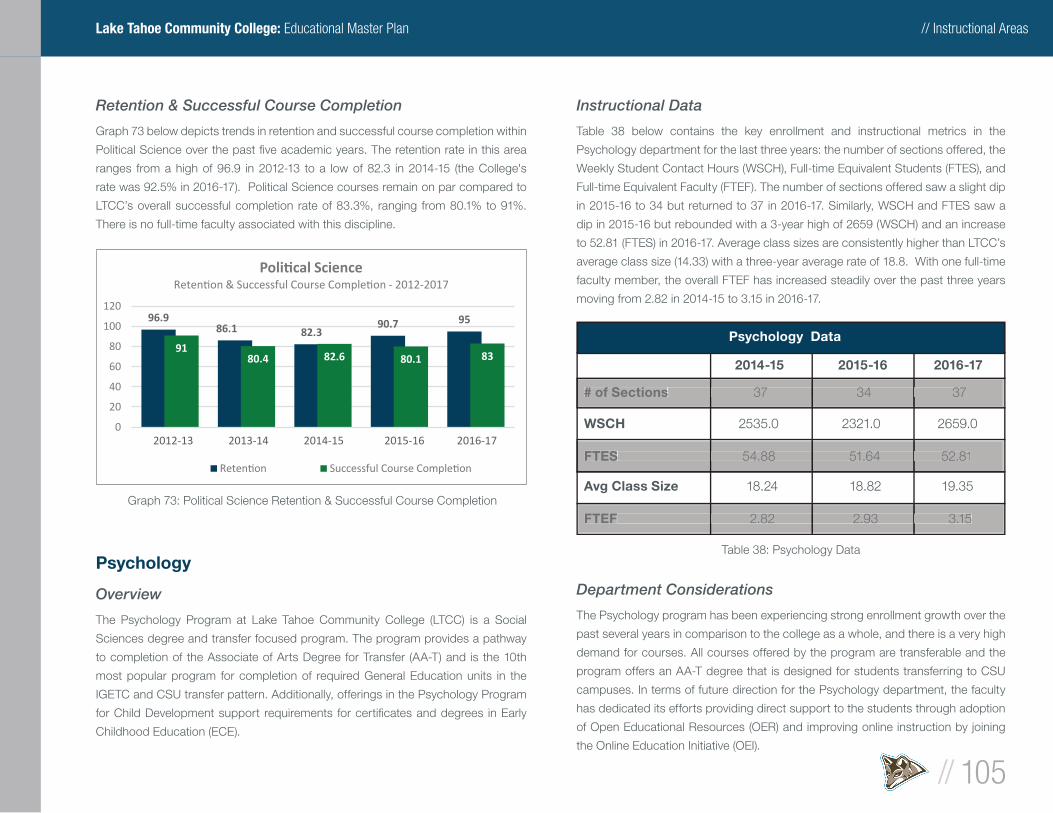
// Instructional Areas
// 105
Lake Tahoe Community College: Educational Master Plan
Retention & Successful Course Completion
Graph 73 below depicts trends in retention and successful course completion within
Political Science over the past fi ve academic years. The retention rate in this area
ranges from a high of 96.9 in 2012-13 to a low of 82.3 in 2014-15 (the College's
rate was 92.5% in 2016-17). Political Science courses remain on par compared to
LTCC’s overall successful completion rate of 83.3%, ranging from 80.1% to 91%.
There is no full-time faculty associated with this discipline.
Psychology
Overview
The Psychology Program at Lake Tahoe Community College (LTCC) is a Social
Sciences degree and transfer focused program. The program provides a pathway
to completion of the Associate of Arts Degree for Transfer (AA-T) and is the 10th
most popular program for completion of required General Education units in the
IGETC and CSU transfer pattern. Additionally, offerings in the Psychology Program
for Child Development support requirements for certifi cates and degrees in Early
Childhood Education (ECE).
Instructional Data
Table 38 below contains the key enrollment and instructional metrics in the
Psychology department for the last three years: the number of sections offered, the
Weekly Student Contact Hours (WSCH), Full-time Equivalent Students (FTES), and
Full-time Equivalent Faculty (FTEF). The number of sections offered saw a slight dip
in 2015-16 to 34 but returned to 37 in 2016-17. Similarly, WSCH and FTES saw a
dip in 2015-16 but rebounded with a 3-year high of 2659 (WSCH) and an increase
to 52.81 (FTES) in 2016-17. Average class sizes are consistently higher than LTCC’s
average class size (14.33) with a three-year average rate of 18.8. With one full-time
faculty member, the overall FTEF has increased steadily over the past three years
moving from 2.82 in 2014-15 to 3.15 in 2016-17.
Department Considerations
The Psychology program has been experiencing strong enrollment growth over the
past several years in comparison to the college as a whole, and there is a very high
demand for courses. All courses offered by the program are transferable and the
program offers an AA-T degree that is designed for students transferring to CSU
campuses. In terms of future direction for the Psychology department, the faculty
has dedicated its efforts providing direct support to the students through adoption
of Open Educational Resources (OER) and improving online instruction by joining
the Online Education Initiative (OEI).
96.986.1 82.3
90.7 95
9180.4 82.6 80.1 83
0
20
40
60
80
100
120
2012-132 013-14 2014-152 015-16 2016-17
- 2012-2017
Graph 73: Political Science Retention & Successful Course Completion
Psychology Data
2014-15 2015-16 2016-17
# of Sections 37 34 37
WSCH 2535.0 2321.0 2659.0
FTES 54.88 51.64 52.81
Avg Class Size 18.24 18.82 19.35
FTEF 2.82 2.93 3.15
# of Sections# of Sections 37 34 37 37 34 37 37 34 37 37 34 37 37 34 37 37 34 37 37 34 37 37 34 37
FTESFTES 54.88 51.64 52.81 54.88 51.64 52.81 54.88 51.64 52.81 54.88 51.64 52.81 54.88 51.64 52.81 54.88 51.64 52.81 54.88 51.64 52.81 54.88 51.64 52.81
FTEFFTEF 2.82 2.93 3.15 2.82 2.93 3.15 2.82 2.93 3.15 2.82 2.93 3.15 2.82 2.93 3.15 2.82 2.93 3.15 2.82 2.93 3.15 2.82 2.93 3.15
Table 38: Psychology Data
» 2012-13 2013-14 2014-15 2015-16 2016-17
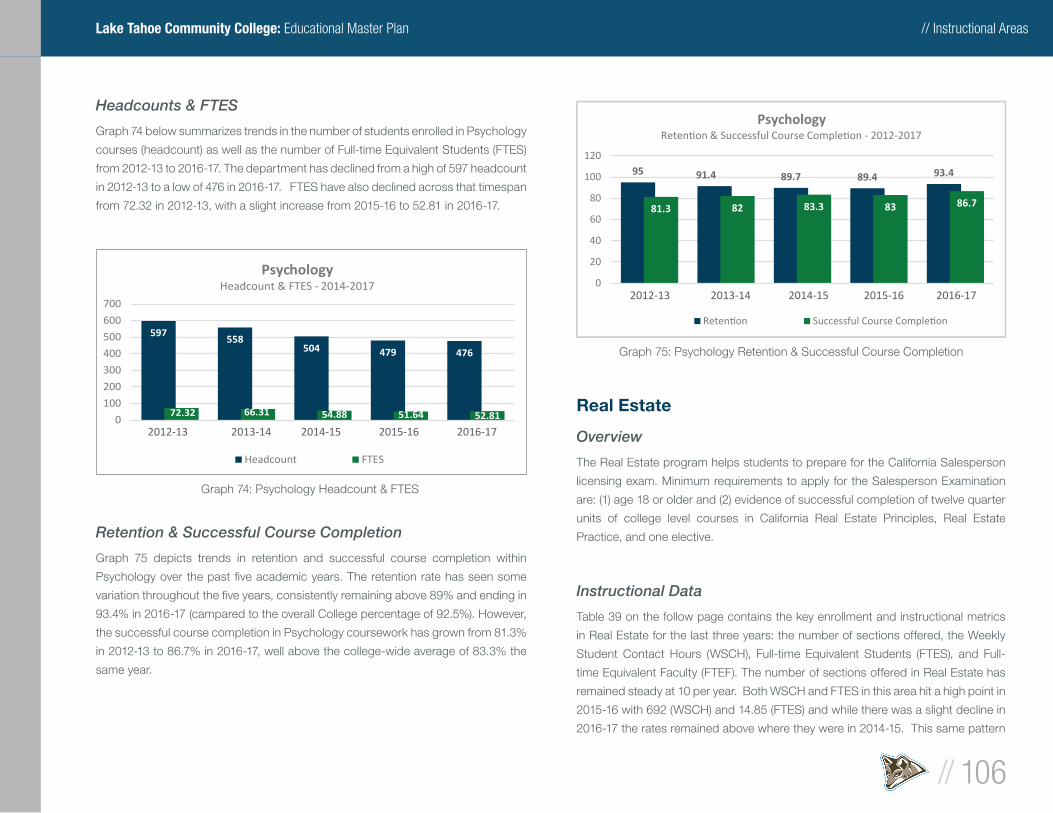
// Instructional Areas
// 106
Lake Tahoe Community College: Educational Master Plan
Headcounts & FTES
Graph 74 below summarizes trends in the number of students enrolled in Psychology
courses (headcount) as well as the number of Full-time Equivalent Students (FTES)
from 2012-13 to 2016-17. The department has declined from a high of 597 headcount
in 2012-13 to a low of 476 in 2016-17. FTES have also declined across that timespan
from 72.32 in 2012-13, with a slight increase from 2015-16 to 52.81 in 2016-17.
Retention & Successful Course Completion
Graph 75 depicts trends in retention and successful course completion within
Psychology over the past fi ve academic years. The retention rate has seen some
variation throughout the fi ve years, consistently remaining above 89% and ending in
93.4% in 2016-17 (campared to the overall College percentage of 92.5%). However,
the successful course completion in Psychology coursework has grown from 81.3%
in 2012-13 to 86.7% in 2016-17, well above the college-wide average of 83.3% the
same year.
Real Estate
Overview
The Real Estate program helps students to prepare for the California Salesperson
licensing exam. Minimum requirements to apply for the Salesperson Examination
are: (1) age 18 or older and (2) evidence of successful completion of twelve quarter
units of college level courses in California Real Estate Principles, Real Estate
Practice, and one elective.
Instructional Data
Table 39 on the follow page contains the key enrollment and instructional metrics
in Real Estate for the last three years: the number of sections offered, the Weekly
Student Contact Hours (WSCH), Full-time Equivalent Students (FTES), and Full-
time Equivalent Faculty (FTEF). The number of sections offered in Real Estate has
remained steady at 10 per year. Both WSCH and FTES in this area hit a high point in
2015-16 with 692 (WSCH) and 14.85 (FTES) and while there was a slight decline in
2016-17 the rates remained above where they were in 2014-15. This same pattern
597558
504 479 476
72.32 66.31 54.88 51.64 52.810
100
200
300
400
500
600
700
2012-132 013-14 2014-152 015-16 2016-17
PsychologyHeadcount & FTES - 2014-2017
Headcount FTES
Graph 74: Psychology Headcount & FTES
95 91.4 89.7 89.4 93.4
81.3 82 83.3 83 86.7
0
20
40
60
80
100
120
2012-132 013-14 2014-152 015-16 2016-17
Psychology- 2012-2017
Graph 75: Psychology Retention & Successful Course Completion
» 2012-13 2013-14 2014-15 2015-16 2016-17
» 2012-13 2013-14 2014-15 2015-16 2016-17
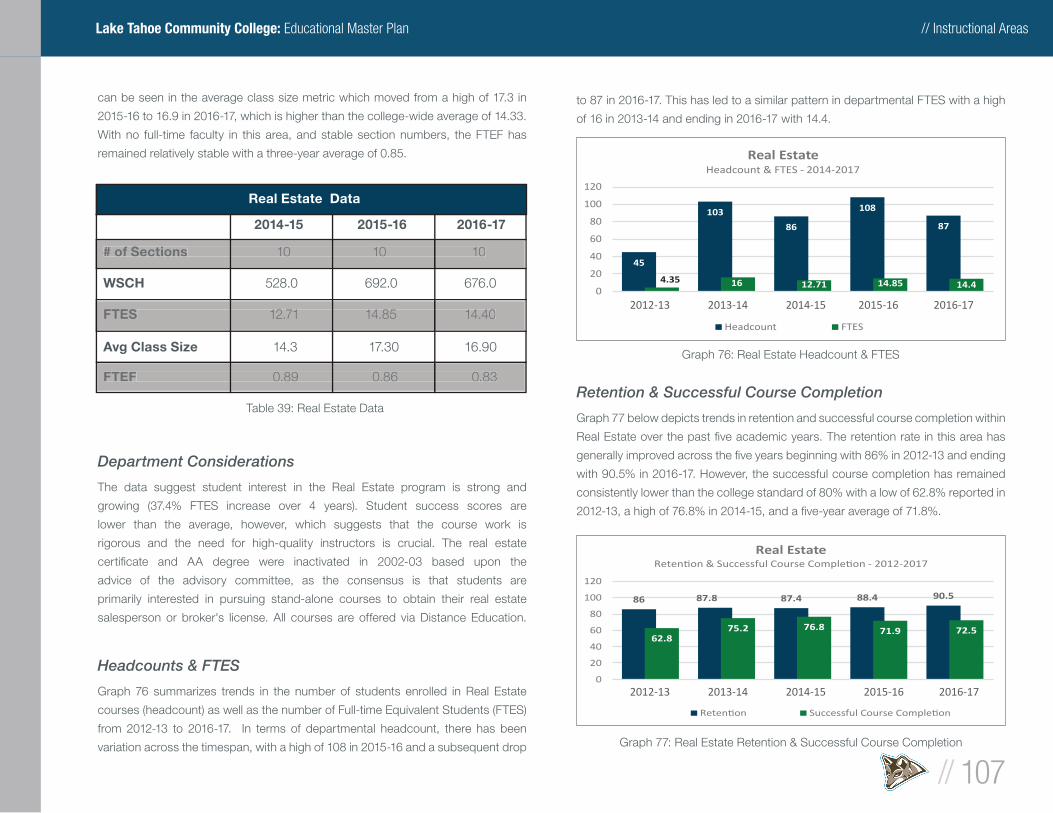
// Instructional Areas
// 107
Lake Tahoe Community College: Educational Master Plan
can be seen in the average class size metric which moved from a high of 17.3 in
2015-16 to 16.9 in 2016-17, which is higher than the college-wide average of 14.33.
With no full-time faculty in this area, and stable section numbers, the FTEF has
remained relatively stable with a three-year average of 0.85.
Department Considerations
The data suggest student interest in the Real Estate program is strong and
growing (37.4% FTES increase over 4 years). Student success scores are
lower than the average, however, which suggests that the course work is
rigorous and the need for high-quality instructors is crucial. The real estate
certifi cate and AA degree were inactivated in 2002-03 based upon the
advice of the advisory committee, as the consensus is that students are
primarily interested in pursuing stand-alone courses to obtain their real estate
salesperson or broker's license. All courses are offered via Distance Education.
Headcounts & FTES
Graph 76 summarizes trends in the number of students enrolled in Real Estate
courses (headcount) as well as the number of Full-time Equivalent Students (FTES)
from 2012-13 to 2016-17. In terms of departmental headcount, there has been
variation across the timespan, with a high of 108 in 2015-16 and a subsequent drop
to 87 in 2016-17. This has led to a similar pattern in departmental FTES with a high
of 16 in 2013-14 and ending in 2016-17 with 14.4.
Retention & Successful Course Completion
Graph 77 below depicts trends in retention and successful course completion within
Real Estate over the past fi ve academic years. The retention rate in this area has
generally improved across the fi ve years beginning with 86% in 2012-13 and ending
with 90.5% in 2016-17. However, the successful course completion has remained
consistently lower than the college standard of 80% with a low of 62.8% reported in
2012-13, a high of 76.8% in 2014-15, and a fi ve-year average of 71.8%.
Real Estate Data
2014-15 2015-16 2016-17
# of Sections 10 10 10
WSCH 528.0 692.0 676.0
FTES 12.71 14.85 14.40
Avg Class Size 14.3 17.30 16.90
FTEF 0.89 0.86 0.83
# of Sections# of Sections 10 10 10 10 10 10 10 10 10 10 10 10 10 10 10 10 10 10 10 10 10 10 10 10
FTESFTES 12.71 14.85 14.40 12.71 14.85 14.40 12.71 14.85 14.40 12.71 14.85 14.40 12.71 14.85 14.40 12.71 14.85 14.40 12.71 14.85 14.40 12.71 14.85 14.40
FTEFFTEF 0.89 0.86 0.83 0.89 0.86 0.83 0.89 0.86 0.83 0.89 0.86 0.83 0.89 0.86 0.83 0.89 0.86 0.83 0.89 0.86 0.83 0.89 0.86 0.83
Table 39: Real Estate Data
45
103
86
108
87
4.35 16 12.71 14.85 14.40
20
40
60
80
100
120
2012-132 013-14 2014-152 015-16 2016-17
Real EstateHeadcount & FTES - 2014-2017
Headcount FTES
86 87.8 87.4 88.4 90.5
62.875.2 76.8 71.9 72.5
0
20
40
60
80
100
120
2012-132 013-14 2014-152 015-16 2016-17
Real Estate- 2012-2017
Graph 76: Real Estate Headcount & FTES
Graph 77: Real Estate Retention & Successful Course Completion
» 2012-13 2013-14 2014-15 2015-16 2016-17
» 2012-13 2013-14 2014-15 2015-16 2016-17
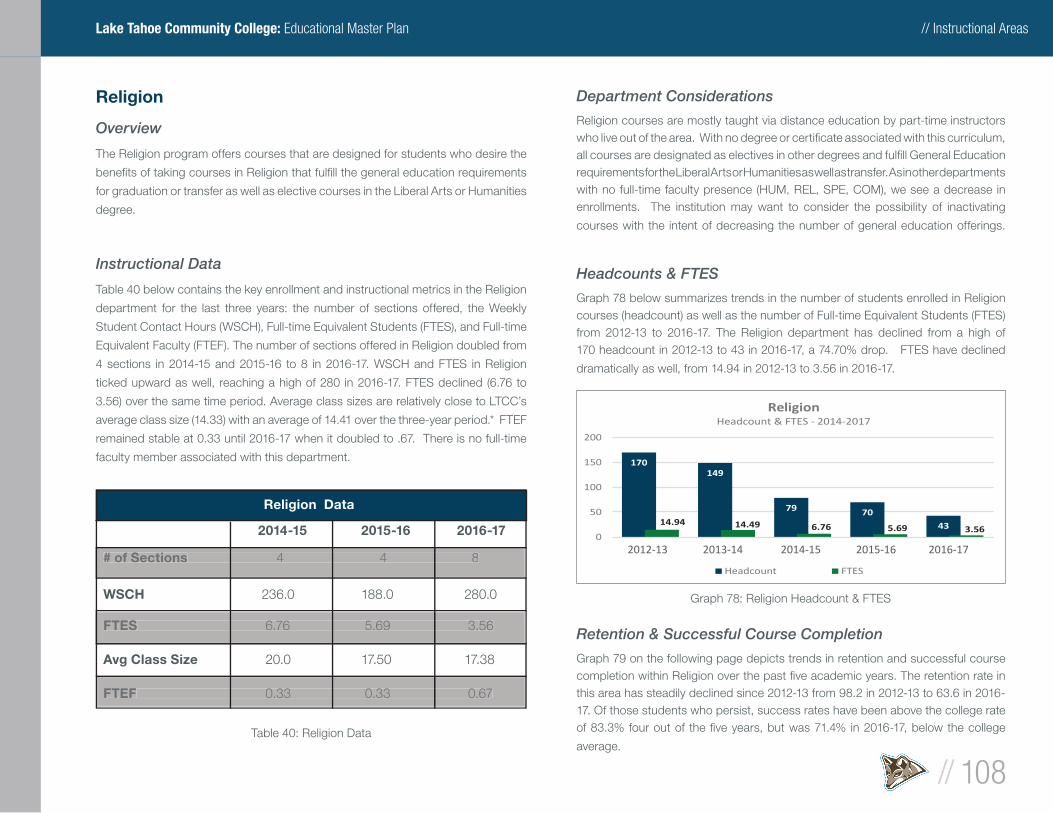
// Instructional Areas
// 108
Lake Tahoe Community College: Educational Master Plan
Religion
Overview
The Religion program offers courses that are designed for students who desire the
benefi ts of taking courses in Religion that fulfi ll the general education requirements
for graduation or transfer as well as elective courses in the Liberal Arts or Humanities
degree.
Instructional Data
Table 40 below contains the key enrollment and instructional metrics in the Religion
department for the last three years: the number of sections offered, the Weekly
Student Contact Hours (WSCH), Full-time Equivalent Students (FTES), and Full-time
Equivalent Faculty (FTEF). The number of sections offered in Religion doubled from
4 sections in 2014-15 and 2015-16 to 8 in 2016-17. WSCH and FTES in Religion
ticked upward as well, reaching a high of 280 in 2016-17. FTES declined (6.76 to
3.56) over the same time period. Average class sizes are relatively close to LTCC’s
average class size (14.33) with an average of 14.41 over the three-year period.* FTEF
remained stable at 0.33 until 2016-17 when it doubled to .67. There is no full-time
faculty member associated with this department.
Department Considerations
Religion courses are mostly taught via distance education by part-time instructors who live out of the area. With no degree or certifi cate associated with this curriculum, all courses are designated as electives in other degrees and fulfi ll General Education requirements for the Liberal Arts or Humanities as well as transfer. As in other departments with no full-time faculty presence (HUM, REL, SPE, COM), we see a decrease in enrollments. The institution may want to consider the possibility of inactivating
courses with the intent of decreasing the number of general education offerings.
Headcounts & FTES
Graph 78 below summarizes trends in the number of students enrolled in Religion courses (headcount) as well as the number of Full-time Equivalent Students (FTES) from 2012-13 to 2016-17. The Religion department has declined from a high of 170 headcount in 2012-13 to 43 in 2016-17, a 74.70% drop. FTES have declined
dramatically as well, from 14.94 in 2012-13 to 3.56 in 2016-17.
Retention & Successful Course Completion
Graph 79 on the following page depicts trends in retention and successful course completion within Religion over the past fi ve academic years. The retention rate in this area has steadily declined since 2012-13 from 98.2 in 2012-13 to 63.6 in 2016-17. Of those students who persist, success rates have been above the college rate of 83.3% four out of the fi ve years, but was 71.4% in 2016-17, below the college
average.
Religion Data
2014-15 2015-16 2016-17
# of Sections 4 4 8
WSCH 236.0 188.0 280.0
FTES 6.76 5.69 3.56
Avg Class Size 20.0 17.50 17.38
FTEF 0.33 0.33 0.67
# of Sections# of Sections 4 4 8 4 4 8 4 4 8 4 4 8 4 4 8 4 4 8 4 4 8 4 4 8
FTESFTES 6.76 5.69 3.56 6.76 5.69 3.56 6.76 5.69 3.56 6.76 5.69 3.56 6.76 5.69 3.56 6.76 5.69 3.56 6.76 5.69 3.56 6.76 5.69 3.56
FTEFFTEF 0.33 0.33 0.67 0.33 0.33 0.67 0.33 0.33 0.67 0.33 0.33 0.67 0.33 0.33 0.67 0.33 0.33 0.67 0.33 0.33 0.67 0.33 0.33 0.67
Table 40: Religion Data
170149
79 70
4314.94 14.49 6.76 5.69 3.560
50
100
150
200
2012-132 013-14 2014-152 015-16 2016-17
ReligionHeadcount & FTES - 2014-2017
Headcount FTES
Graph 78: Religion Headcount & FTES
2012-13 2013-14 2014-15 2015-16 2016-17
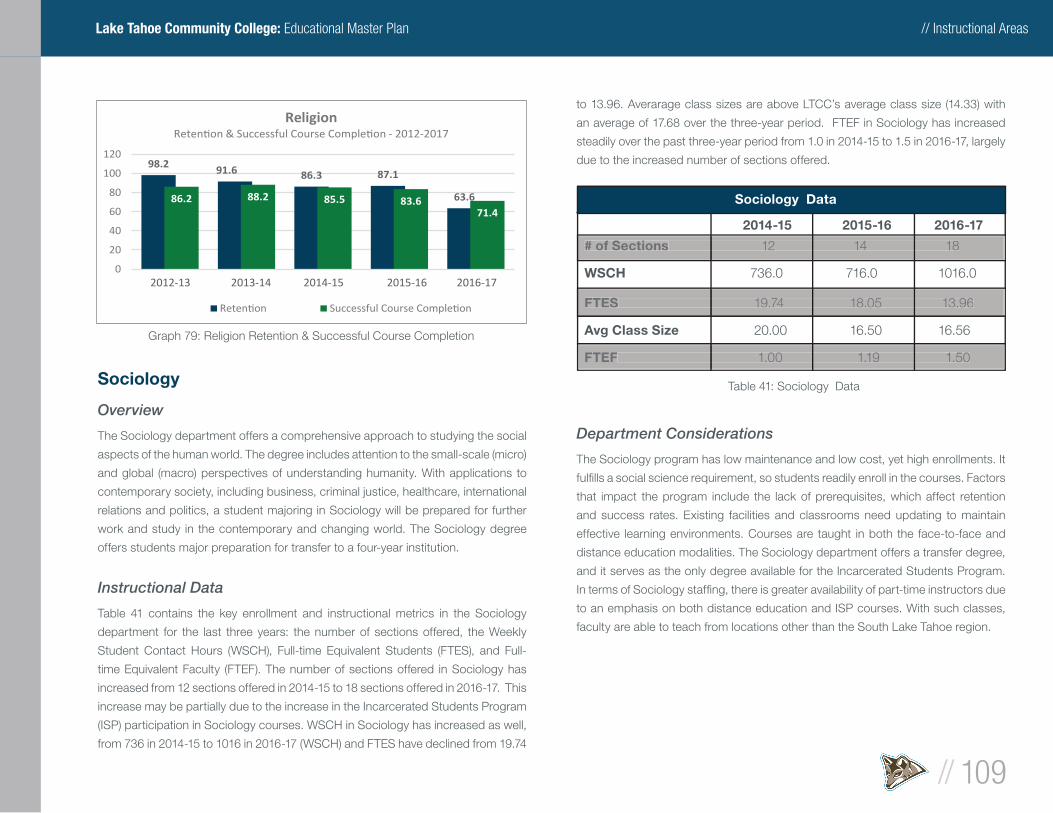
// Instructional Areas
// 109
Lake Tahoe Community College: Educational Master Plan
Sociology
Overview
The Sociology department offers a comprehensive approach to studying the social
aspects of the human world. The degree includes attention to the small-scale (micro)
and global (macro) perspectives of understanding humanity. With applications to
contemporary society, including business, criminal justice, healthcare, international
relations and politics, a student majoring in Sociology will be prepared for further
work and study in the contemporary and changing world. The Sociology degree
offers students major preparation for transfer to a four-year institution.
Instructional Data
Table 41 contains the key enrollment and instructional metrics in the Sociology
department for the last three years: the number of sections offered, the Weekly
Student Contact Hours (WSCH), Full-time Equivalent Students (FTES), and Full-
time Equivalent Faculty (FTEF). The number of sections offered in Sociology has
increased from 12 sections offered in 2014-15 to 18 sections offered in 2016-17. This
increase may be partially due to the increase in the Incarcerated Students Program
(ISP) participation in Sociology courses. WSCH in Sociology has increased as well,
from 736 in 2014-15 to 1016 in 2016-17 (WSCH) and FTES have declined from 19.74
to 13.96. Averarage class sizes are above LTCC’s average class size (14.33) with
an average of 17.68 over the three-year period. FTEF in Sociology has increased
steadily over the past three-year period from 1.0 in 2014-15 to 1.5 in 2016-17, largely
due to the increased number of sections offered.
Department Considerations
The Sociology program has low maintenance and low cost, yet high enrollments. It
fulfi lls a social science requirement, so students readily enroll in the courses. Factors
that impact the program include the lack of prerequisites, which affect retention
and success rates. Existing facilities and classrooms need updating to maintain
effective learning environments. Courses are taught in both the face-to-face and
distance education modalities. The Sociology department offers a transfer degree,
and it serves as the only degree available for the Incarcerated Students Program.
In terms of Sociology staffi ng, there is greater availability of part-time instructors due
to an emphasis on both distance education and ISP courses. With such classes,
faculty are able to teach from locations other than the South Lake Tahoe region.
Sociology Data
2014-15 2015-16 2016-17
# of Sections 12 14 18
WSCH 736.0 716.0 1016.0
FTES 19.74 18.05 13.96
Avg Class Size 20.00 16.50 16.56
FTEF 1.00 1.19 1.50
# of Sections# of Sections 12 14 18 12 14 18 12 14 18 12 14 18 12 14 18 12 14 18 12 14 18 12 14 18
FTESFTES 19.74 18.05 13.96 19.74 18.05 13.96 19.74 18.05 13.96 19.74 18.05 13.96 19.74 18.05 13.96 19.74 18.05 13.96 19.74 18.05 13.96 19.74 18.05 13.96
FTEFFTEF 1.00 1.19 1.50 1.00 1.19 1.50 1.00 1.19 1.50 1.00 1.19 1.50 1.00 1.19 1.50 1.00 1.19 1.50 1.00 1.19 1.50 1.00 1.19 1.50
Table 41: Sociology Data
98.2 91.6 86.3 87.1
63.686.2 88.2 85.5 83.671.4
0
20
40
60
80
100
120
2012-132 013-14 2014-152 015-16 2016-17
Religion- 2012-2017
Graph 79: Religion Retention & Successful Course Completion
» 2012-13 2013-14 2014-15 2015-16 2016-17
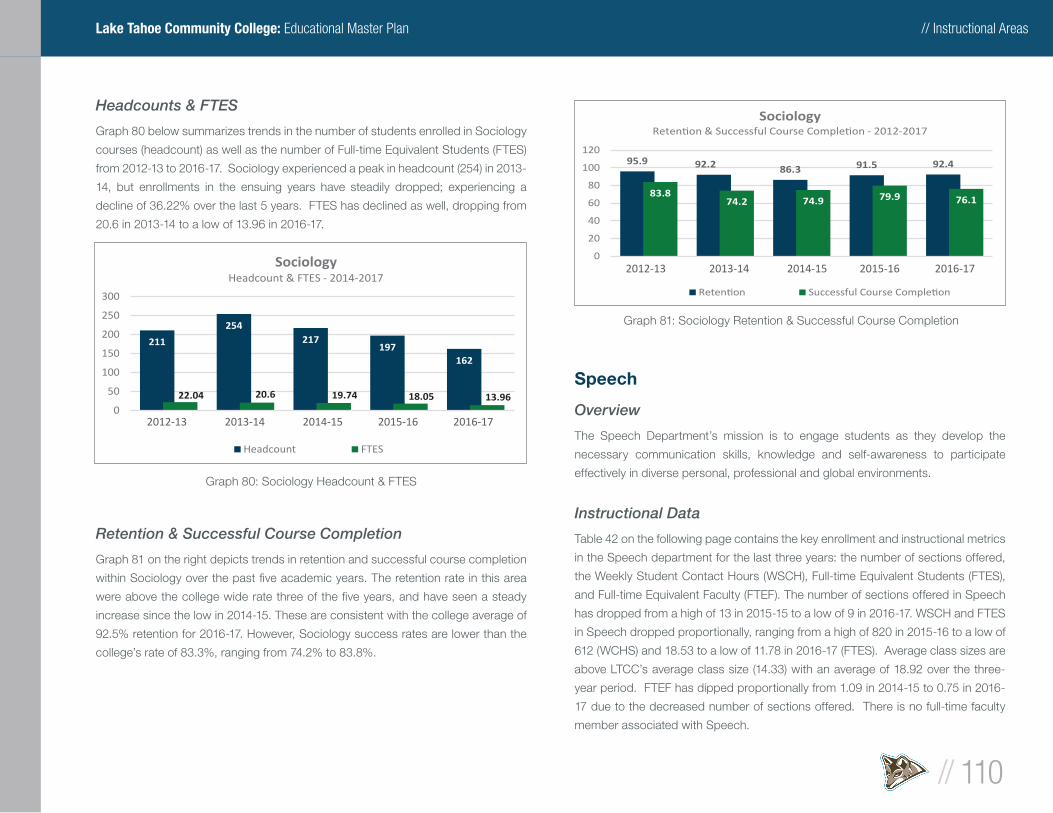
// Instructional Areas
// 110
Lake Tahoe Community College: Educational Master Plan
Headcounts & FTES
Graph 80 below summarizes trends in the number of students enrolled in Sociology
courses (headcount) as well as the number of Full-time Equivalent Students (FTES)
from 2012-13 to 2016-17. Sociology experienced a peak in headcount (254) in 2013-
14, but enrollments in the ensuing years have steadily dropped; experiencing a
decline of 36.22% over the last 5 years. FTES has declined as well, dropping from
20.6 in 2013-14 to a low of 13.96 in 2016-17.
Retention & Successful Course Completion
Graph 81 on the right depicts trends in retention and successful course completion
within Sociology over the past fi ve academic years. The retention rate in this area
were above the college wide rate three of the fi ve years, and have seen a steady
increase since the low in 2014-15. These are consistent with the college average of
92.5% retention for 2016-17. However, Sociology success rates are lower than the
college’s rate of 83.3%, ranging from 74.2% to 83.8%.
Speech
Overview
The Speech Department’s mission is to engage students as they develop the
necessary communication skills, knowledge and self-awareness to participate
effectively in diverse personal, professional and global environments.
Instructional Data
Table 42 on the following page contains the key enrollment and instructional metrics
in the Speech department for the last three years: the number of sections offered,
the Weekly Student Contact Hours (WSCH), Full-time Equivalent Students (FTES),
and Full-time Equivalent Faculty (FTEF). The number of sections offered in Speech
has dropped from a high of 13 in 2015-15 to a low of 9 in 2016-17. WSCH and FTES
in Speech dropped proportionally, ranging from a high of 820 in 2015-16 to a low of
612 (WCHS) and 18.53 to a low of 11.78 in 2016-17 (FTES). Average class sizes are
above LTCC’s average class size (14.33) with an average of 18.92 over the three-
year period. FTEF has dipped proportionally from 1.09 in 2014-15 to 0.75 in 2016-
17 due to the decreased number of sections offered. There is no full-time faculty
member associated with Speech.
95.9 92.2 86.3 91.5 92.4
83.874.2 74.9 79.9 76.1
0
20
40
60
80
100
120
2012-132 013-14 2014-152 015-16 2016-17
Sociology- 2012-2017
Graph 81: Sociology Retention & Successful Course Completion
211
254217
197162
22.04 20.6 19.74 18.05 13.960
50
100
150
200
250
300
2012-132 013-14 2014-152 015-16 2016-17
SociologyHeadcount & FTES - 2014-2017
Headcount FTES
Graph 80: Sociology Headcount & FTES
» 2012-13 2013-14 2014-15 2015-16 2016-17
» 2012-13 2013-14 2014-15 2015-16 2016-17
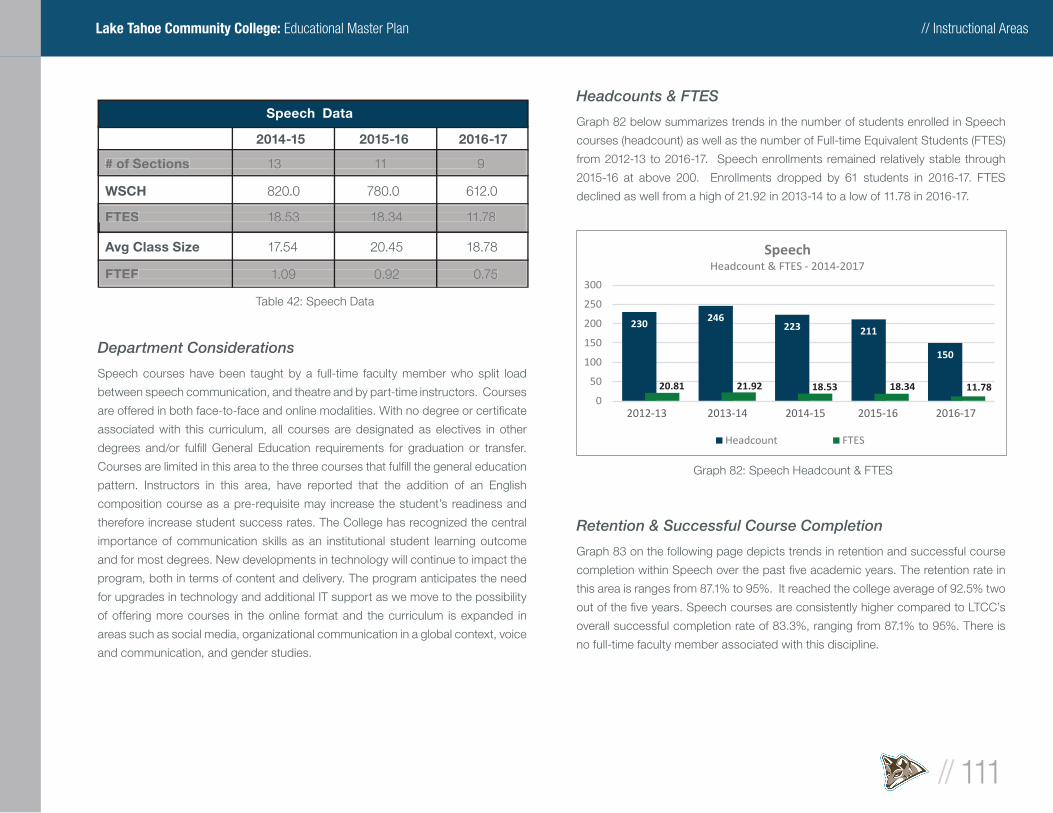
// Instructional Areas
// 111
Lake Tahoe Community College: Educational Master Plan
Department Considerations
Speech courses have been taught by a full-time faculty member who split load
between speech communication, and theatre and by part-time instructors. Courses
are offered in both face-to-face and online modalities. With no degree or certifi cate
associated with this curriculum, all courses are designated as electives in other
degrees and/or fulfi ll General Education requirements for graduation or transfer.
Courses are limited in this area to the three courses that fulfi ll the general education
pattern. Instructors in this area, have reported that the addition of an English
composition course as a pre-requisite may increase the student’s readiness and
therefore increase student success rates. The College has recognized the central
importance of communication skills as an institutional student learning outcome
and for most degrees. New developments in technology will continue to impact the
program, both in terms of content and delivery. The program anticipates the need
for upgrades in technology and additional IT support as we move to the possibility
of offering more courses in the online format and the curriculum is expanded in
areas such as social media, organizational communication in a global context, voice
and communication, and gender studies.
Headcounts & FTES
Graph 82 below summarizes trends in the number of students enrolled in Speech
courses (headcount) as well as the number of Full-time Equivalent Students (FTES)
from 2012-13 to 2016-17. Speech enrollments remained relatively stable through
2015-16 at above 200. Enrollments dropped by 61 students in 2016-17. FTES
declined as well from a high of 21.92 in 2013-14 to a low of 11.78 in 2016-17.
Retention & Successful Course Completion
Graph 83 on the following page depicts trends in retention and successful course
completion within Speech over the past fi ve academic years. The retention rate in
this area is ranges from 87.1% to 95%. It reached the college average of 92.5% two
out of the fi ve years. Speech courses are consistently higher compared to LTCC’s
overall successful completion rate of 83.3%, ranging from 87.1% to 95%. There is
no full-time faculty member associated with this discipline.
230246
223 211
150
20.81 21.92 18.53 18.34 11.780
50
100
150
200
250
300
2012-132 013-14 2014-152 015-16 2016-17
SpeechHeadcount & FTES - 2014-2017
Headcount FTES
Graph 82: Speech Headcount & FTES
Speech Data
2014-15 2015-16 2016-17
# of Sections 13 11 9
WSCH 820.0 780.0 612.0
FTES 18.53 18.34 11.78
Avg Class Size 17.54 20.45 18.78
FTEF 1.09 0.92 0.75
# of Sections# of Sections 13 11 9 13 11 9 13 11 9 13 11 9 13 11 9 13 11 9 13 11 9 13 11 9
FTESFTES 18.53 18.34 11.78 18.53 18.34 11.78 18.53 18.34 11.78 18.53 18.34 11.78 18.53 18.34 11.78 18.53 18.34 11.78 18.53 18.34 11.78 18.53 18.34 11.78
FTEFFTEF 1.09 0.92 0.75 1.09 0.92 0.75 1.09 0.92 0.75 1.09 0.92 0.75 1.09 0.92 0.75 1.09 0.92 0.75 1.09 0.92 0.75 1.09 0.92 0.75
Table 42: Speech Data
» 2012-13 2013-14 2014-15 2015-16 2016-17
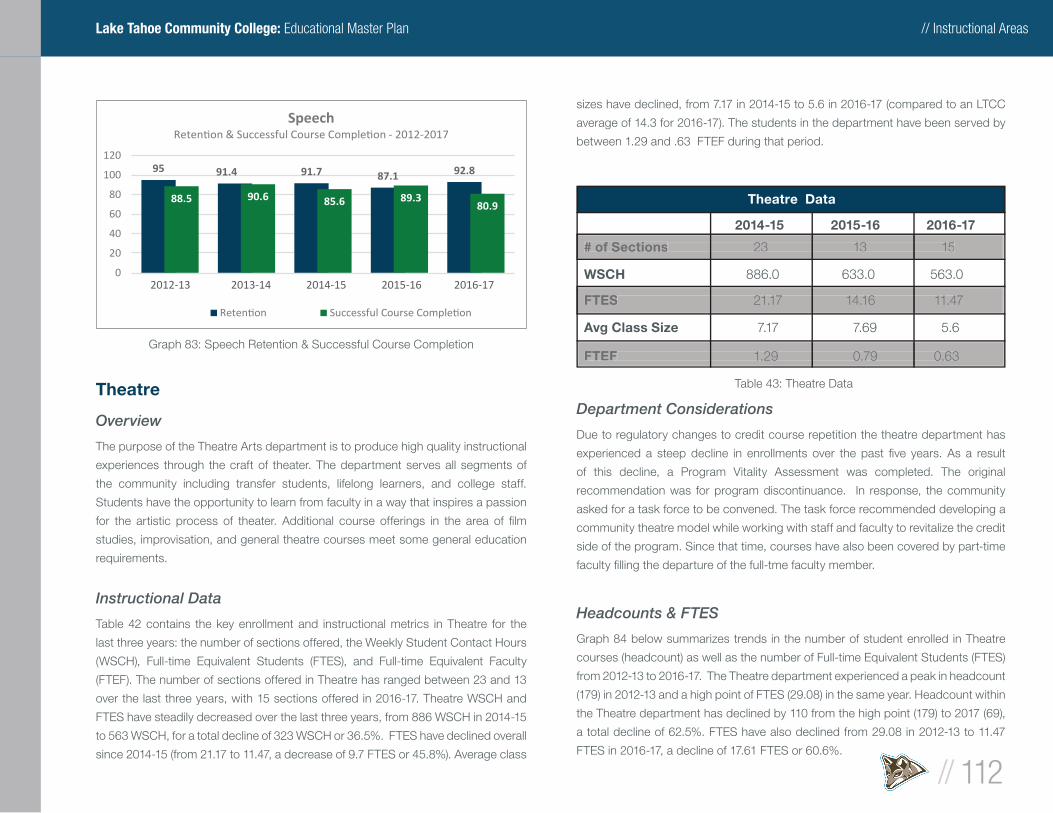
// Instructional Areas
// 112
Lake Tahoe Community College: Educational Master Plan
Theatre
Overview
The purpose of the Theatre Arts department is to produce high quality instructional
experiences through the craft of theater. The department serves all segments of
the community including transfer students, lifelong learners, and college staff.
Students have the opportunity to learn from faculty in a way that inspires a passion
for the artistic process of theater. Additional course offerings in the area of fi lm
studies, improvisation, and general theatre courses meet some general education
requirements.
Instructional Data
Table 42 contains the key enrollment and instructional metrics in Theatre for the
last three years: the number of sections offered, the Weekly Student Contact Hours
(WSCH), Full-time Equivalent Students (FTES), and Full-time Equivalent Faculty
(FTEF). The number of sections offered in Theatre has ranged between 23 and 13
over the last three years, with 15 sections offered in 2016-17. Theatre WSCH and
FTES have steadily decreased over the last three years, from 886 WSCH in 2014-15
to 563 WSCH, for a total decline of 323 WSCH or 36.5%. FTES have declined overall
since 2014-15 (from 21.17 to 11.47, a decrease of 9.7 FTES or 45.8%). Average class
sizes have declined, from 7.17 in 2014-15 to 5.6 in 2016-17 (compared to an LTCC
average of 14.3 for 2016-17). The students in the department have been served by
between 1.29 and .63 FTEF during that period.
Department Considerations
Due to regulatory changes to credit course repetition the theatre department has
experienced a steep decline in enrollments over the past fi ve years. As a result
of this decline, a Program Vitality Assessment was completed. The original
recommendation was for program discontinuance. In response, the community
asked for a task force to be convened. The task force recommended developing a
community theatre model while working with staff and faculty to revitalize the credit
side of the program. Since that time, courses have also been covered by part-time
faculty fi lling the departure of the full-tme faculty member.
Headcounts & FTES
Graph 84 below summarizes trends in the number of student enrolled in Theatre
courses (headcount) as well as the number of Full-time Equivalent Students (FTES)
from 2012-13 to 2016-17. The Theatre department experienced a peak in headcount
(179) in 2012-13 and a high point of FTES (29.08) in the same year. Headcount within
the Theatre department has declined by 110 from the high point (179) to 2017 (69),
a total decline of 62.5%. FTES have also declined from 29.08 in 2012-13 to 11.47
FTES in 2016-17, a decline of 17.61 FTES or 60.6%.
Theatre Data
2014-15 2015-16 2016-17
# of Sections 23 13 15
WSCH 886.0 633.0 563.0
FTES 21.17 14.16 11.47
Avg Class Size 7.17 7.69 5.6
FTEF 1.29 0.79 0.63
# of Sections# of Sections 23 13 15 23 13 15 23 13 15 23 13 15 23 13 15 23 13 15 23 13 15 23 13 15
FTESFTES 21.17 14.16 11.47 21.17 14.16 11.47 21.17 14.16 11.47 21.17 14.16 11.47 21.17 14.16 11.47 21.17 14.16 11.47 21.17 14.16 11.47 21.17 14.16 11.47
FTEFFTEF 1.29 0.79 0.63 1.29 0.79 0.63 1.29 0.79 0.63 1.29 0.79 0.63 1.29 0.79 0.63 1.29 0.79 0.63 1.29 0.79 0.63 1.29 0.79 0.63
Table 43: Theatre Data
95 91.4 91.7 87.1 92.8
88.5 90.6 85.6 89.380.9
0
20
40
60
80
100
120
2012-132 013-14 2014-152 015-16 2016-17
Speech- 2012-2017
Graph 83: Speech Retention & Successful Course Completion
» 2012-13 2013-14 2014-15 2015-16 2016-17
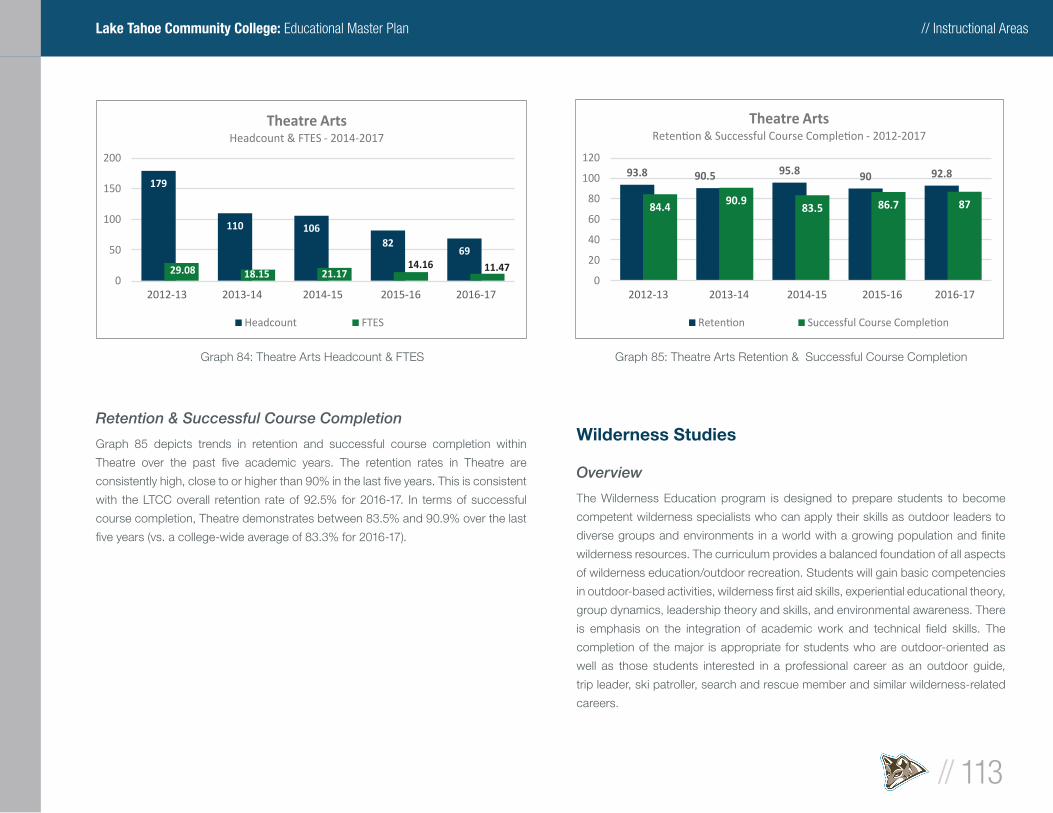
// Instructional Areas
// 113
Lake Tahoe Community College: Educational Master Plan
Retention & Successful Course Completion
Graph 85 depicts trends in retention and successful course completion within
Theatre over the past fi ve academic years. The retention rates in Theatre are
consistently high, close to or higher than 90% in the last fi ve years. This is consistent
with the LTCC overall retention rate of 92.5% for 2016-17. In terms of successful
course completion, Theatre demonstrates between 83.5% and 90.9% over the last
fi ve years (vs. a college-wide average of 83.3% for 2016-17).
Wilderness Studies
Overview
The Wilderness Education program is designed to prepare students to become
competent wilderness specialists who can apply their skills as outdoor leaders to
diverse groups and environments in a world with a growing population and fi nite
wilderness resources. The curriculum provides a balanced foundation of all aspects
of wilderness education/outdoor recreation. Students will gain basic competencies
in outdoor-based activities, wilderness fi rst aid skills, experiential educational theory,
group dynamics, leadership theory and skills, and environmental awareness. There
is emphasis on the integration of academic work and technical fi eld skills. The
completion of the major is appropriate for students who are outdoor-oriented as
well as those students interested in a professional career as an outdoor guide,
trip leader, ski patroller, search and rescue member and similar wilderness-related
careers.
179
110 10682
69
29.08 18.15 21.1714.16 11.47
0
50
100
150
200
2012-132 013-14 2014-152 015-16 2016-17
Theatre Arts Headcount & FTES - 2014-2017
Headcount FTES
Graph 84: Theatre Arts Headcount & FTES
93.8 90.5 95.8 90 92.8
84.4 90.983.5 86.7 87
0
20
40
60
80
100
120
2012-132 013-14 2014-152 015-16 2016-17
Theatre Arts- 2012-2017
Graph 85: Theatre Arts Retention & Successful Course Completion
» 2012-13 2013-14 2014-15 2015-16 2016-17 » 2012-13 2013-14 2014-15 2015-16 2016-17
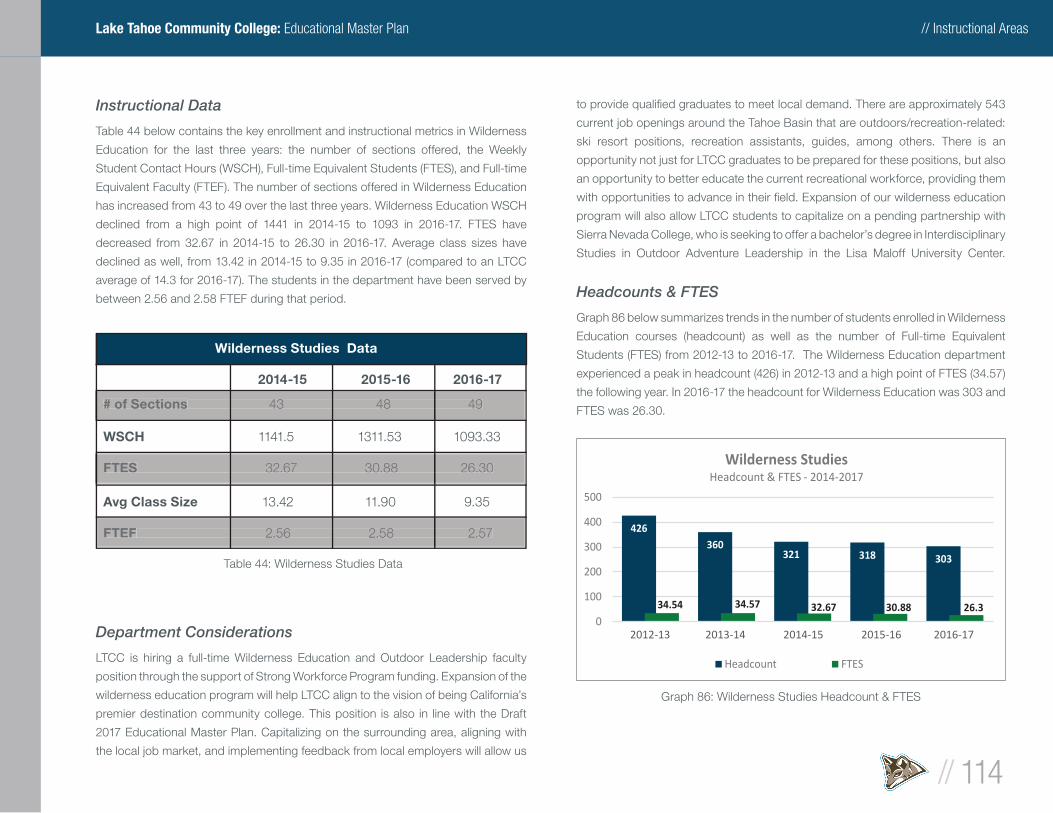
// Instructional Areas
// 114
Lake Tahoe Community College: Educational Master Plan
Instructional Data
Table 44 below contains the key enrollment and instructional metrics in Wilderness
Education for the last three years: the number of sections offered, the Weekly
Student Contact Hours (WSCH), Full-time Equivalent Students (FTES), and Full-time
Equivalent Faculty (FTEF). The number of sections offered in Wilderness Education
has increased from 43 to 49 over the last three years. Wilderness Education WSCH
declined from a high point of 1441 in 2014-15 to 1093 in 2016-17. FTES have
decreased from 32.67 in 2014-15 to 26.30 in 2016-17. Average class sizes have
declined as well, from 13.42 in 2014-15 to 9.35 in 2016-17 (compared to an LTCC
average of 14.3 for 2016-17). The students in the department have been served by
between 2.56 and 2.58 FTEF during that period.
Department Considerations
LTCC is hiring a full-time Wilderness Education and Outdoor Leadership faculty
position through the support of Strong Workforce Program funding. Expansion of the
wilderness education program will help LTCC align to the vision of being California’s
premier destination community college. This position is also in line with the Draft
2017 Educational Master Plan. Capitalizing on the surrounding area, aligning with
the local job market, and implementing feedback from local employers will allow us
to provide qualifi ed graduates to meet local demand. There are approximately 543
current job openings around the Tahoe Basin that are outdoors/recreation-related:
ski resort positions, recreation assistants, guides, among others. There is an
opportunity not just for LTCC graduates to be prepared for these positions, but also
an opportunity to better educate the current recreational workforce, providing them
with opportunities to advance in their fi eld. Expansion of our wilderness education
program will also allow LTCC students to capitalize on a pending partnership with
Sierra Nevada College, who is seeking to offer a bachelor’s degree in Interdisciplinary
Studies in Outdoor Adventure Leadership in the Lisa Maloff University Center.
Headcounts & FTES
Graph 86 below summarizes trends in the number of students enrolled in Wilderness
Education courses (headcount) as well as the number of Full-time Equivalent
Students (FTES) from 2012-13 to 2016-17. The Wilderness Education department
experienced a peak in headcount (426) in 2012-13 and a high point of FTES (34.57)
the following year. In 2016-17 the headcount for Wilderness Education was 303 and
FTES was 26.30.
Wilderness Studies Data
2014-15 2015-16 2016-17
# of Sections 43 48 49
WSCH 1141.5 1311.53 1093.33
FTES 32.67 30.88 26.30
Avg Class Size 13.42 11.90 9.35
FTEF 2.56 2.58 2.57
# of Sections# of Sections 43 48 49 43 48 49 43 48 49 43 48 49 43 48 49 43 48 49 43 48 49 43 48 49
FTESFTES 32.67 30.88 26.30 32.67 30.88 26.30 32.67 30.88 26.30 32.67 30.88 26.30 32.67 30.88 26.30 32.67 30.88 26.30 32.67 30.88 26.30 32.67 30.88 26.30
FTEFFTEF 2.56 2.58 2.57 2.56 2.58 2.57 2.56 2.58 2.57 2.56 2.58 2.57 2.56 2.58 2.57 2.56 2.58 2.57 2.56 2.58 2.57 2.56 2.58 2.57
Table 44: Wilderness Studies Data
426360
321 318 303
34.54 34.57 32.67 30.88 26.30
100
200
300
400
500
2012-132 013-14 2014-152 015-16 2016-17
Wilderness StudiesHeadcount & FTES - 2014-2017
Headcount FTES
Graph 86: Wilderness Studies Headcount & FTES
» 2012-13 2013-14 2014-15 2015-16 2016-17
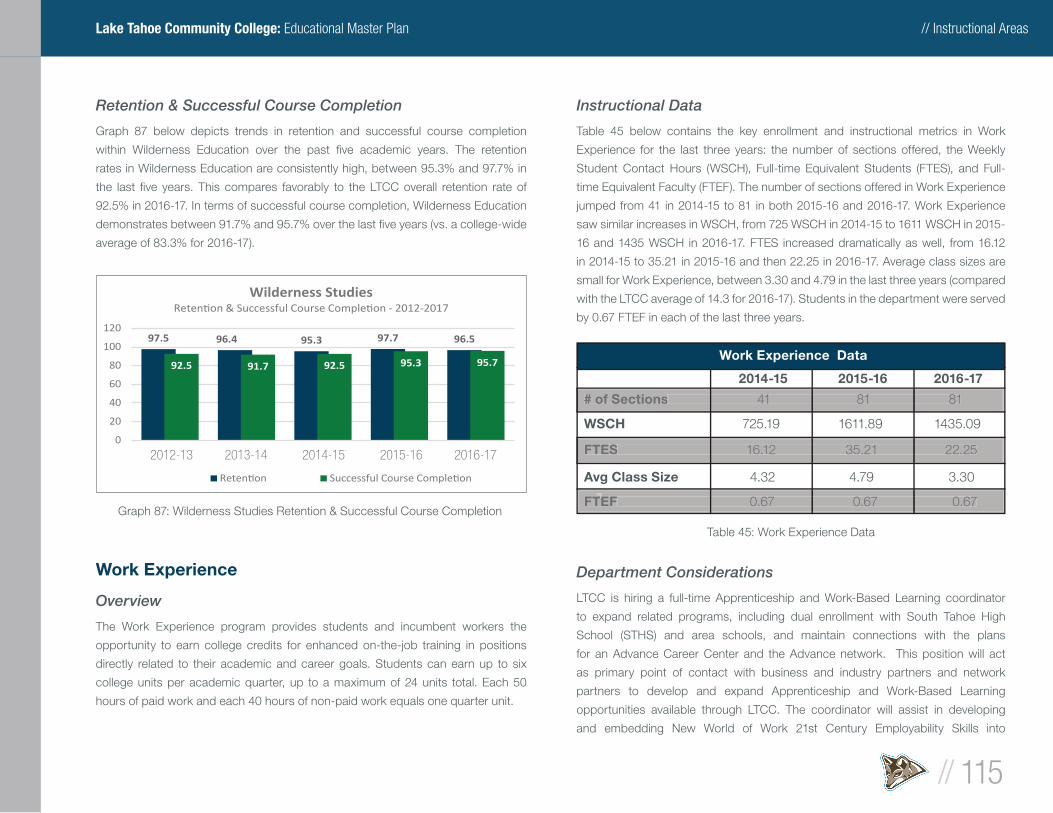
// Instructional Areas
// 115
Lake Tahoe Community College: Educational Master Plan
Retention & Successful Course Completion
Graph 87 below depicts trends in retention and successful course completion
within Wilderness Education over the past fi ve academic years. The retention
rates in Wilderness Education are consistently high, between 95.3% and 97.7% in
the last fi ve years. This compares favorably to the LTCC overall retention rate of
92.5% in 2016-17. In terms of successful course completion, Wilderness Education
demonstrates between 91.7% and 95.7% over the last fi ve years (vs. a college-wide
average of 83.3% for 2016-17).
Work Experience
Overview
The Work Experience program provides students and incumbent workers the
opportunity to earn college credits for enhanced on-the-job training in positions
directly related to their academic and career goals. Students can earn up to six
college units per academic quarter, up to a maximum of 24 units total. Each 50
hours of paid work and each 40 hours of non-paid work equals one quarter unit.
Instructional Data
Table 45 below contains the key enrollment and instructional metrics in Work
Experience for the last three years: the number of sections offered, the Weekly
Student Contact Hours (WSCH), Full-time Equivalent Students (FTES), and Full-
time Equivalent Faculty (FTEF). The number of sections offered in Work Experience
jumped from 41 in 2014-15 to 81 in both 2015-16 and 2016-17. Work Experience
saw similar increases in WSCH, from 725 WSCH in 2014-15 to 1611 WSCH in 2015-
16 and 1435 WSCH in 2016-17. FTES increased dramatically as well, from 16.12
in 2014-15 to 35.21 in 2015-16 and then 22.25 in 2016-17. Average class sizes are
small for Work Experience, between 3.30 and 4.79 in the last three years (compared
with the LTCC average of 14.3 for 2016-17). Students in the department were served
by 0.67 FTEF in each of the last three years.
Department Considerations
LTCC is hiring a full-time Apprenticeship and Work-Based Learning coordinator
to expand related programs, including dual enrollment with South Tahoe High
School (STHS) and area schools, and maintain connections with the plans
for an Advance Career Center and the Advance network. This position will act
as primary point of contact with business and industry partners and network
partners to develop and expand Apprenticeship and Work-Based Learning
opportunities available through LTCC. The coordinator will assist in developing
and embedding New World of Work 21st Century Employability Skills into
Work Experience Data
2014-15 2015-16 2016-17
# of Sections 41 81 81
WSCH 725.19 1611.89 1435.09
FTES 16.12 35.21 22.25
Avg Class Size 4.32 4.79 3.30
FTEF 0.67 0.67 0.67
# of Sections# of Sections 41 81 81 41 81 81 41 81 81 41 81 81 41 81 81 41 81 81 41 81 81 41 81 81
FTESFTES 16.12 35.21 22.25 16.12 35.21 22.25 16.12 35.21 22.25 16.12 35.21 22.25 16.12 35.21 22.25 16.12 35.21 22.25 16.12 35.21 22.25 16.12 35.21 22.25
FTEFFTEF 0.67 0.67 0.67 0.67 0.67 0.67 0.67 0.67 0.67 0.67 0.67 0.67 0.67 0.67 0.67 0.67 0.67 0.67 0.67 0.67 0.67 0.67 0.67 0.67»»FTEFFTEF»FTEFFTEFFTEF FTEFFTEF FTEFFTEF 0.67 0.67 0.67 0.67 0.67 0.67 0.67 0.67 0.67 0.67 0.67 0.67
Table 45: Work Experience Data
97.5 96.4 95.3 97.7 96.5
92.5 91.7 92.5 95.3 95.7
0
20
40
60
80
100
120
2012-132 013-14 2014-152 015-16 2016-17
Wilderness Studies- 2012-2017
Graph 87: Wilderness Studies Retention & Successful Course Completion
» 2012-13 2013-14 2014-15 2015-16 2016-17
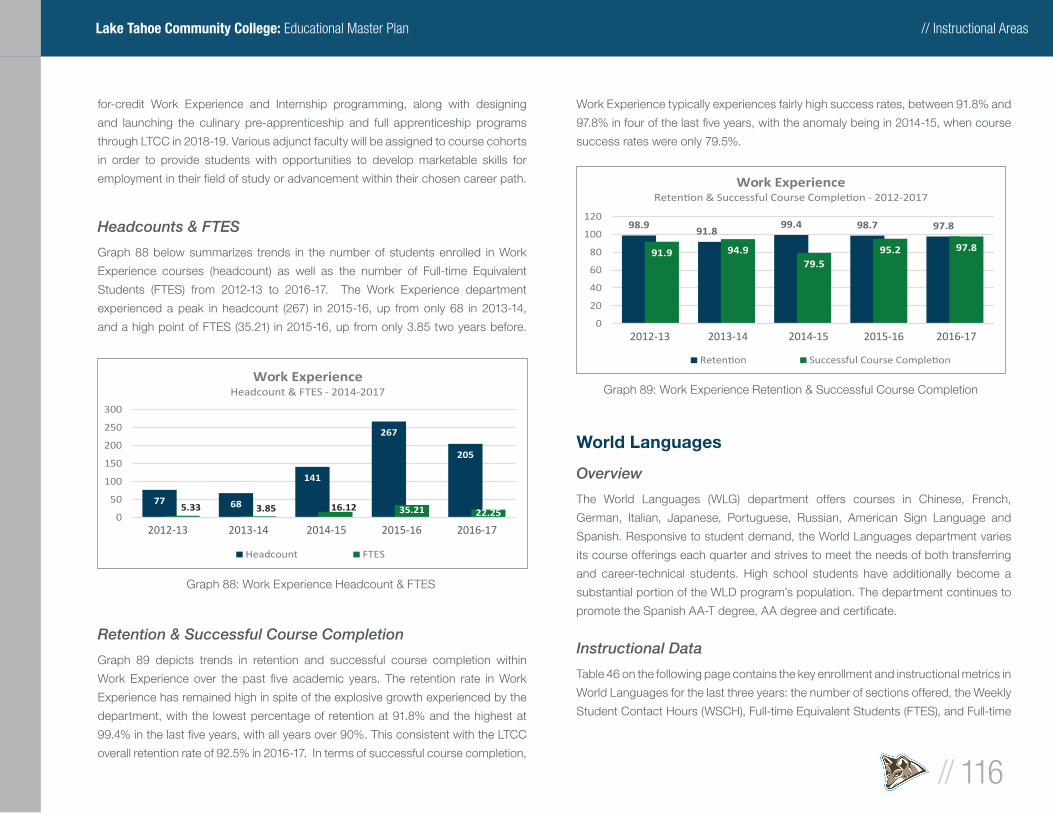
// Instructional Areas
// 116
Lake Tahoe Community College: Educational Master Plan
for-credit Work Experience and Internship programming, along with designing
and launching the culinary pre-apprenticeship and full apprenticeship programs
through LTCC in 2018-19. Various adjunct faculty will be assigned to course cohorts
in order to provide students with opportunities to develop marketable skills for
employment in their fi eld of study or advancement within their chosen career path.
Headcounts & FTES
Graph 88 below summarizes trends in the number of students enrolled in Work
Experience courses (headcount) as well as the number of Full-time Equivalent
Students (FTES) from 2012-13 to 2016-17. The Work Experience department
experienced a peak in headcount (267) in 2015-16, up from only 68 in 2013-14,
and a high point of FTES (35.21) in 2015-16, up from only 3.85 two years before.
Retention & Successful Course Completion
Graph 89 depicts trends in retention and successful course completion within
Work Experience over the past fi ve academic years. The retention rate in Work
Experience has remained high in spite of the explosive growth experienced by the
department, with the lowest percentage of retention at 91.8% and the highest at
99.4% in the last fi ve years, with all years over 90%. This consistent with the LTCC
overall retention rate of 92.5% in 2016-17. In terms of successful course completion,
Work Experience typically experiences fairly high success rates, between 91.8% and
97.8% in four of the last fi ve years, with the anomaly being in 2014-15, when course
success rates were only 79.5%.
World Languages
Overview
The World Languages (WLG) department offers courses in Chinese, French,
German, Italian, Japanese, Portuguese, Russian, American Sign Language and
Spanish. Responsive to student demand, the World Languages department varies
its course offerings each quarter and strives to meet the needs of both transferring
and career-technical students. High school students have additionally become a
substantial portion of the WLD program’s population. The department continues to
promote the Spanish AA-T degree, AA degree and certifi cate.
Instructional Data
Table 46 on the following page contains the key enrollment and instructional metrics in
World Languages for the last three years: the number of sections offered, the Weekly
Student Contact Hours (WSCH), Full-time Equivalent Students (FTES), and Full-time
77 68
141
267
205
5.33 3.85 16.12 35.21 22.250
50
100
150
200
250
300
2012-132 013-14 2014-152 015-16 2016-17
Work ExperienceHeadcount & FTES - 2014-2017
Headcount FTES
Graph 88: Work Experience Headcount & FTES
98.991.8
99.4 98.7 97.8
91.9 94.979.5
95.2 97.8
0
20
40
60
80
100
120
2012-132 013-14 2014-152 015-16 2016-17
Work Experience- 2012-2017
Graph 89: Work Experience Retention & Successful Course Completion
» 2012-13 2013-14 2014-15 2015-16 2016-17
» 2012-13 2013-14 2014-15 2015-16 2016-17
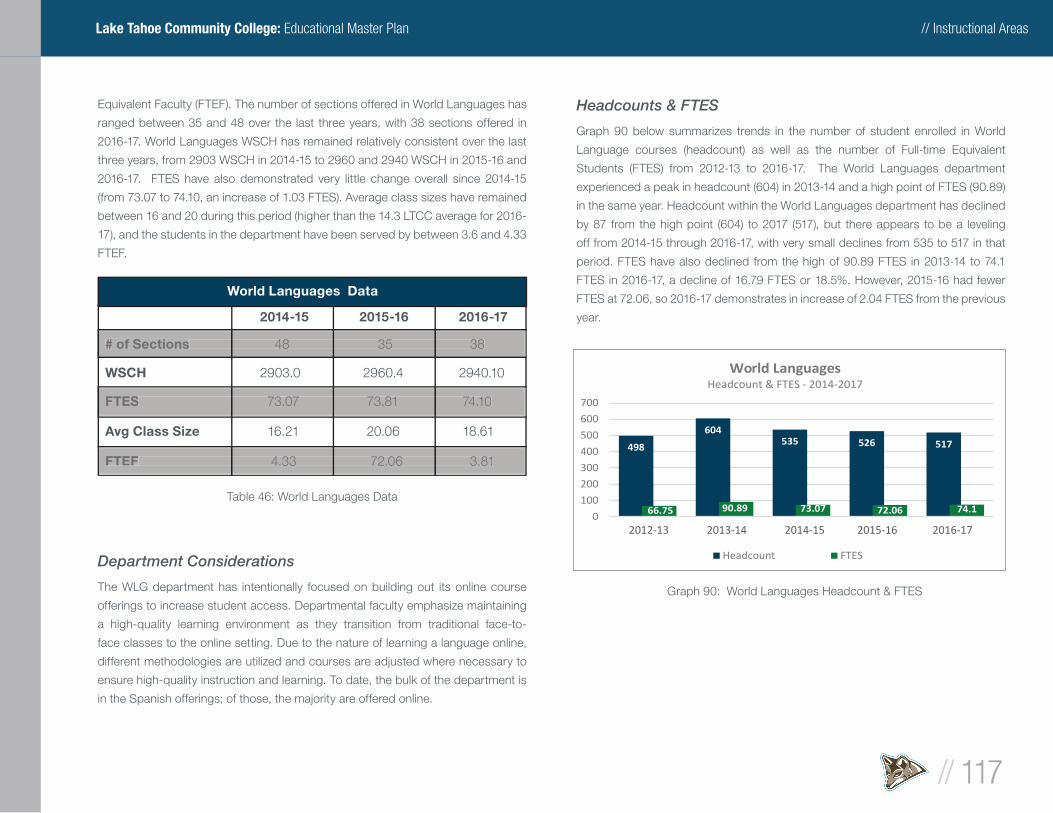
// Instructional Areas
// 117
Lake Tahoe Community College: Educational Master Plan
Headcounts & FTES
Graph 90 below summarizes trends in the number of student enrolled in World
Language courses (headcount) as well as the number of Full-time Equivalent
Students (FTES) from 2012-13 to 2016-17. The World Languages department
experienced a peak in headcount (604) in 2013-14 and a high point of FTES (90.89)
in the same year. Headcount within the World Languages department has declined
by 87 from the high point (604) to 2017 (517), but there appears to be a leveling
off from 2014-15 through 2016-17, with very small declines from 535 to 517 in that
period. FTES have also declined from the high of 90.89 FTES in 2013-14 to 74.1
FTES in 2016-17, a decline of 16.79 FTES or 18.5%. However, 2015-16 had fewer
FTES at 72.06, so 2016-17 demonstrates in increase of 2.04 FTES from the previous
year.
Equivalent Faculty (FTEF). The number of sections offered in World Languages has
ranged between 35 and 48 over the last three years, with 38 sections offered in
2016-17. World Languages WSCH has remained relatively consistent over the last
three years, from 2903 WSCH in 2014-15 to 2960 and 2940 WSCH in 2015-16 and
2016-17. FTES have also demonstrated very little change overall since 2014-15
(from 73.07 to 74.10, an increase of 1.03 FTES). Average class sizes have remained
between 16 and 20 during this period (higher than the 14.3 LTCC average for 2016-
17), and the students in the department have been served by between 3.6 and 4.33
FTEF.
Department Considerations
The WLG department has intentionally focused on building out its online course
offerings to increase student access. Departmental faculty emphasize maintaining
a high-quality learning environment as they transition from traditional face-to-
face classes to the online setting. Due to the nature of learning a language online,
different methodologies are utilized and courses are adjusted where necessary to
ensure high-quality instruction and learning. To date, the bulk of the department is
in the Spanish offerings; of those, the majority are offered online.
World Languages Data
2014-15 2015-16 2016-17
# of Sections 48 35 38
WSCH 2903.0 2960.4 2940.10
FTES 73.07 73.81 74.10
Avg Class Size 16.21 20.06 18.61
FTEF 4.33 72.06 3.81
# of Sections# of Sections 48 35 38 48 35 38 48 35 38 48 35 38 48 35 38 48 35 38 48 35 38 48 35 38
FTESFTES 73.07 73.81 74.10 73.07 73.81 74.10 73.07 73.81 74.10 73.07 73.81 74.10 73.07 73.81 74.10 73.07 73.81 74.10 73.07 73.81 74.10 73.07 73.81 74.10
FTEFFTEF 4.33 72.06 3.81 4.33 72.06 3.81 4.33 72.06 3.81 4.33 72.06 3.81 4.33 72.06 3.81 4.33 72.06 3.81 4.33 72.06 3.81 4.33 72.06 3.81
Table 46: World Languages Data
498
604535 526 517
66.75 90.89 73.07 72.06 74.10
100
200
300
400
500
600
700
2012-132 013-14 2014-152 015-16 2016-17
World LanguagesHeadcount & FTES - 2014-2017
Headcount FTES
Graph 90: World Languages Headcount & FTES
» 2012-13 2013-14 2014-15 2015-16 2016-17
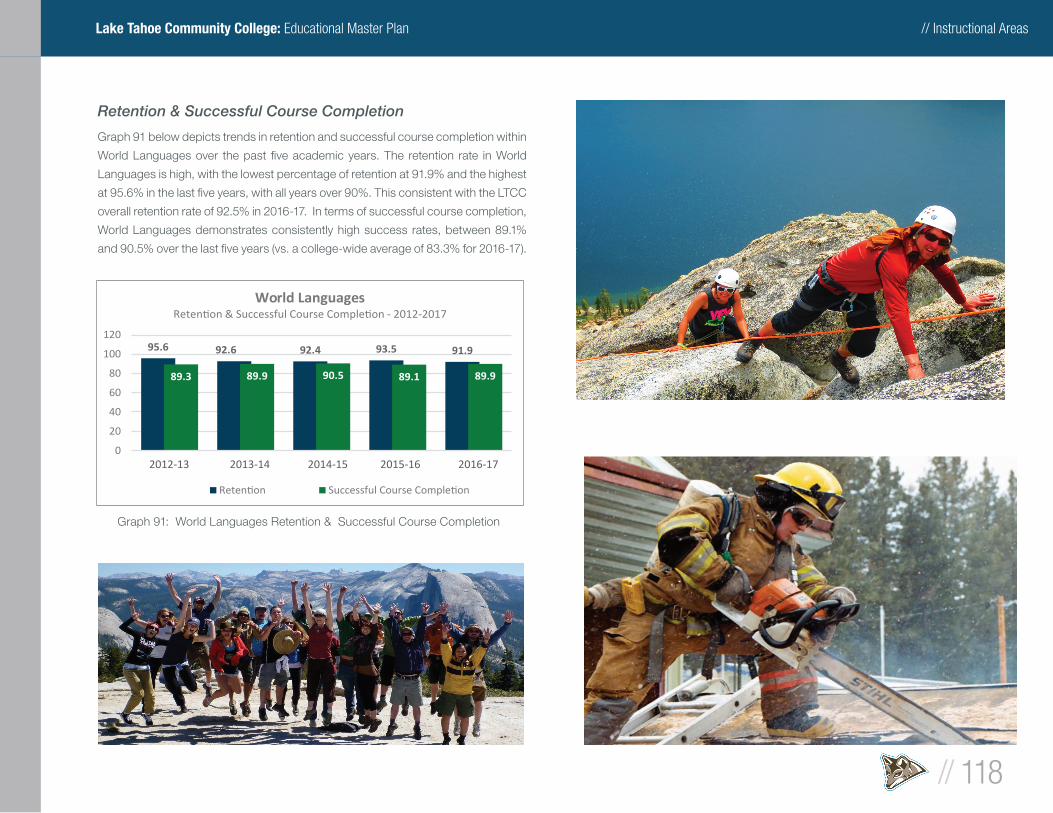
// Instructional Areas
// 118
Lake Tahoe Community College: Educational Master Plan
Retention & Successful Course Completion
Graph 91 below depicts trends in retention and successful course completion within
World Languages over the past fi ve academic years. The retention rate in World
Languages is high, with the lowest percentage of retention at 91.9% and the highest
at 95.6% in the last fi ve years, with all years over 90%. This consistent with the LTCC
overall retention rate of 92.5% in 2016-17. In terms of successful course completion,
World Languages demonstrates consistently high success rates, between 89.1%
and 90.5% over the last fi ve years (vs. a college-wide average of 83.3% for 2016-17).
95.6 92.6 92.4 93.5 91.9
89.3 89.9 90.5 89.1 89.9
0
20
40
60
80
100
120
2012-132 013-14 2014-152 015-16 2016-17
World Languages- 2012-2017
Graph 91: World Languages Retention & Successful Course Completion
» 2012-13 2013-14 2014-15 2015-16 2016-17
// Student Support Services
// 119
Lake Tahoe Community College: Educational Master Plan
OverviewThe following are the student support services offered at LTCC that are critical in
supporting the goals, mission and students at LTCC. The following services and
descriptions listed on the following pages have been provided by the College.
BookstoreThe College Bookstore, located on the fi rst fl oor of the main campus near the
front entrance, is provided as a service to the college community. In addition
to new and used textbooks, the Bookstore carries general reference materials;
hiking and fi eld guides; works by local/faculty authors; a variety of school, culinary
arts, and art supplies; electronic accessories; clothing; gifts; and greeting cards.
The Bookstore offers a book rental program for many courses and has eTexbook
options available for most titles. The bookstore can also special order textbooks
and general reading books upon request. Additionally, the LTCC Bookstore
carries a wide selection of snack and meal options and beverages.
CalWORKsStudents who are receiving CalWORKs benefi ts are eligible for support services
through the college, including child care vouchers, paid work-study positions,
and free employment preparedness workshops.
Career CenterStudents who are unclear about their career goal or major are encouraged to
take advantage of career exploration and planning services. These services are
designed to help students make career choices consistent with their interests,
abilities, personality traits, and values. Career planning increases the likelihood
of job satisfaction and success. Career counseling, workshops, classes,
assessments, and many other services are available through the center.
Child Development CenterThe Child Development Center (CDC) is a fully-licensed childcare facility located
on the Lake Tahoe Community College campus. Licensed for 46 children ages 6
weeks through pre-kindergarten, the CDC is a model facility for Early Childhood
Education students. Although the CDC operates at full capacity, students have
top priority and every attempt is made to accommodate their needs.
Clubs and OrganizationsLTCC offers over 16 clubs and organizations for students to enjoy. These include
social, athletic, and major-based clubs.
Counseling/AdvisingLTCC Counselors help students in developing educational goals and planning for
success. They also work with students in setting personal goals and managing
life issues.
Disability Resource Center (DRC)Lake Tahoe Community College is committed to accommodating students
with disabilities as defi ned in the Americans with Disabilities Act and Section
504 of the Rehabilitation Act of 1973. The Disability Resource Center facilitates
accommodations in regular college programs for learning, psychological,
hearing, visual, and communication disabilities as well as health disorders and
mobility limitations. Students with other verifi able and documented disabilities
may also be eligible for academic accommodations. The Disability Resource
Center (DRC) offers a formal assessment for students who suspect that they may
have a learning disability. A fully equipped High Tech Center (HTC) is available
to students who may benefi t from using adapted computer technology. Deaf or
Hard of Hearing students may access a Video Phone located in the DRC.
Student Support Services
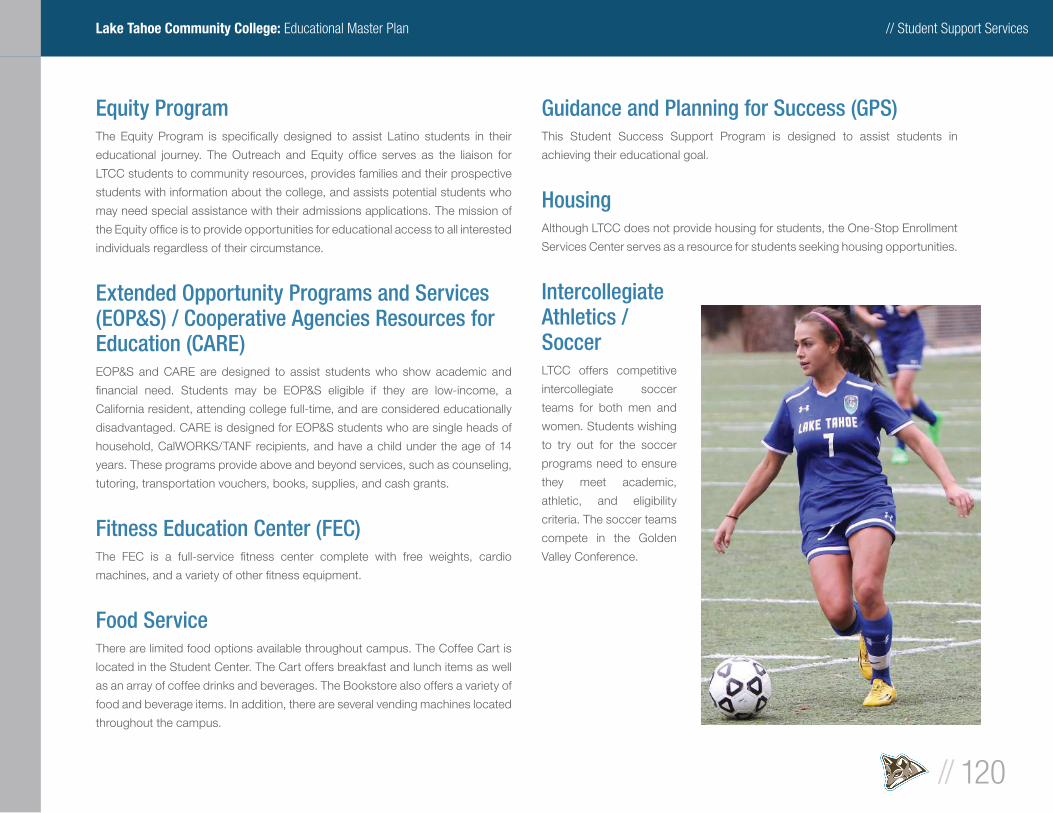
// Student Support Services
// 120
Lake Tahoe Community College: Educational Master Plan
Equity ProgramThe Equity Program is specifi cally designed to assist Latino students in their
educational journey. The Outreach and Equity offi ce serves as the liaison for
LTCC students to community resources, provides families and their prospective
students with information about the college, and assists potential students who
may need special assistance with their admissions applications. The mission of
the Equity offi ce is to provide opportunities for educational access to all interested
individuals regardless of their circumstance.
Extended Opportunity Programs and Services (EOP&S) / Cooperative Agencies Resources for Education (CARE)EOP&S and CARE are designed to assist students who show academic and
fi nancial need. Students may be EOP&S eligible if they are low-income, a
California resident, attending college full-time, and are considered educationally
disadvantaged. CARE is designed for EOP&S students who are single heads of
household, CalWORKS/TANF recipients, and have a child under the age of 14
years. These programs provide above and beyond services, such as counseling,
tutoring, transportation vouchers, books, supplies, and cash grants.
Fitness Education Center (FEC)The FEC is a full-service fi tness center complete with free weights, cardio
machines, and a variety of other fi tness equipment.
Food ServiceThere are limited food options available throughout campus. The Coffee Cart is
located in the Student Center. The Cart offers breakfast and lunch items as well
as an array of coffee drinks and beverages. The Bookstore also offers a variety of
food and beverage items. In addition, there are several vending machines located
throughout the campus.
Guidance and Planning for Success (GPS)This Student Success Support Program is designed to assist students in
achieving their educational goal.
HousingAlthough LTCC does not provide housing for students, the One-Stop Enrollment
Services Center serves as a resource for students seeking housing opportunities.
Intercollegiate Athletics / SoccerLTCC offers competitive
intercollegiate soccer
teams for both men and
women. Students wishing
to try out for the soccer
programs need to ensure
they meet academic,
athletic, and eligibility
criteria. The soccer teams
compete in the Golden
Valley Conference.
// Student Support Services
// 121
Lake Tahoe Community College: Educational Master Plan
International Student ProgramThe Offi ce of International Student Programs at LTCC provides services and
support for international students. We offer assistance with USCIS procedures,
particularly for visa status maintenance and employment options. Additionally,
ISP organizes orientation meeting for new students and study skills workshops
for continuing students. We also coordinate access for international students to
both college and external resources, for insurance, banking, social security, and
daily life needs. In addition, ISP moderates quarterly fun activities for international
students in Lake Tahoe.
Job Training Skills, Internships and Work ExperienceThe Lake Tahoe Community College Work Experience and Internship Program
is committed to providing students with opportunities for work based learning,
professional growth, and applying academic knowledge to the workplace. The
program is dedicated to advancing students’ professional competencies in the
workplace and promoting career awareness through linking education with
employment and careers.
Library and Learning ServicesLTCC’s ibrary is a beautiful facility that includes an art gallery, wireless technology,
twenty-fi ve computer Internet stations, a cozy fi reside reading area, several study
rooms for groups, the Math Success Center, a writing center, and test proctoring
services. The library’s collection has over 40,000 volumes as well as rich access
to e-books and subscriptions to 10,000 print and online journals and newspapers,
music on CD and LP records, plus a DVD/video collection which supports the
college curriculum. Additionally, the library features a Spanish language aisle,
an adaptive technology station for persons with disabilities, a children’s section,
plus popular movies for home checkout. The library offers a unique rare book
collection comprised of out-of-print books about Tahoe. Information services are
offered at the reference desk, or teaching station, where online research skills are
taught one-on-one. The library’s online resources, such as its catalog and online
databases, can be accessed 24 hours a day via its web site. Library services and
borrowing privileges are extended to all members of the Lake Tahoe community.
In 2017, the Tutoring and Learning Center services were combined with the
Library to consolidate, in terms of space and services, the tutoring and student
support efforts in both areas. The library space now houses individual and group
tutoring at no costs to students.
Media ServicesMedia services are provided to enhance the college’s instructional environment,
bringing a rich array of audiovisual technology into the classroom. Housed in
the library, an audiovisual viewing room with media equipment is available to
students and the public.
One-Stop Enrollment Services CenterThe One-Stop Enrollment Services Center is designed to assist students with all
of their registration and enrollment needs as well as with any student services
program information.

// Student Support Services
// 122
Lake Tahoe Community College: Educational Master Plan
Transfer CenterIf transferring to another institution is part of a student’s educational goal,
counselors can help students keep up to date with the complex array of transfer
requirements. To ensure transfer admission, particularly into competitive majors,
students should see a counselor to develop an educational plan that includes
transfer prerequisites. The Transfer Center also has several resources for
students to use, including a library of California and Nevada college catalogs,
books and brochures with general college information, access to over 18,000
college catalogs online, and articulation agreement information with California
universities and the University of Nevada, Reno. Counselors can also assist with
CSU, UC, and UNR applications.
Veterans ServicesVeterans and dependents of disabled veterans are encouraged to take advantage
of the educational opportunities and benefi ts available at Lake Tahoe Community
College. Eligibility information and applications for benefi ts are available at the
One-Stop Enrollment Services Center. The College has a designated Veterans
Resource Center with specialized support and resources provided to veteran
students.
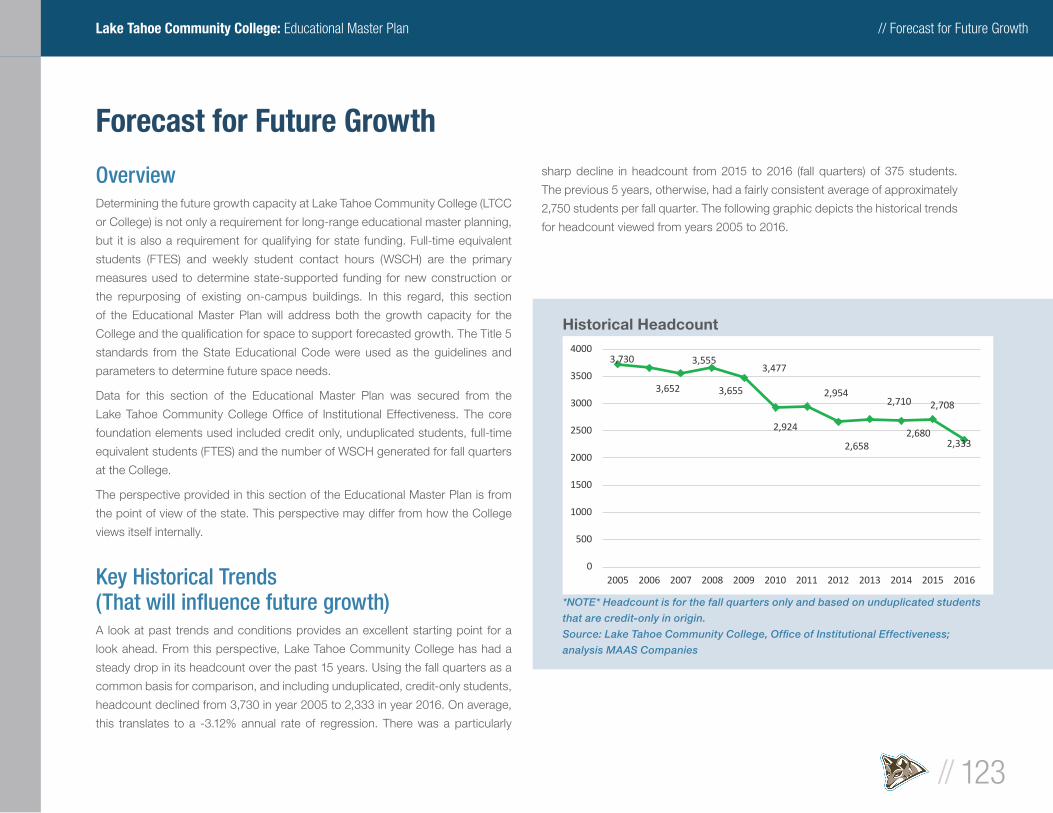
// Forecast for Future Growth
// 123
Lake Tahoe Community College: Educational Master Plan
OverviewDetermining the future growth capacity at Lake Tahoe Community College (LTCC
or College) is not only a requirement for long-range educational master planning,
but it is also a requirement for qualifying for state funding. Full-time equivalent
students (FTES) and weekly student contact hours (WSCH) are the primary
measures used to determine state-supported funding for new construction or
the repurposing of existing on-campus buildings. In this regard, this section
of the Educational Master Plan will address both the growth capacity for the
College and the qualifi cation for space to support forecasted growth. The Title 5
standards from the State Educational Code were used as the guidelines and
parameters to determine future space needs.
Data for this section of the Educational Master Plan was secured from the
Lake Tahoe Community College Offi ce of Institutional Effectiveness. The core
foundation elements used included credit only, unduplicated students, full-time
equivalent students (FTES) and the number of WSCH generated for fall quarters
at the College.
The perspective provided in this section of the Educational Master Plan is from
the point of view of the state. This perspective may differ from how the College
views itself internally.
Key Historical Trends(That will infl uence future growth)A look at past trends and conditions provides an excellent starting point for a
look ahead. From this perspective, Lake Tahoe Community College has had a
steady drop in its headcount over the past 15 years. Using the fall quarters as a
common basis for comparison, and including unduplicated, credit-only students,
headcount declined from 3,730 in year 2005 to 2,333 in year 2016. On average,
this translates to a -3.12% annual rate of regression. There was a particularly
sharp decline in headcount from 2015 to 2016 (fall quarters) of 375 students.
The previous 5 years, otherwise, had a fairly consistent average of approximately
2,750 students per fall quarter. The following graphic depicts the historical trends
for headcount viewed from years 2005 to 2016.
Forecast for Future Growth
3,730
3,652
3,555
3,655
3,477
2,924
2,954
2,658
2,710
2,680
2,708
2,333
0
500
1000
1500
2000
2500
3000
3500
4000
2005 2006 2007 2008 2009 2010 2011 2012 2013 2014 2015 2016
*NOTE* Headcount is for the fall quarters only and based on unduplicated students
that are credit-only in origin.
Source: Lake Tahoe Community College, Offi ce of Institutional Effectiveness;
analysis MAAS Companies
Historical Headcount
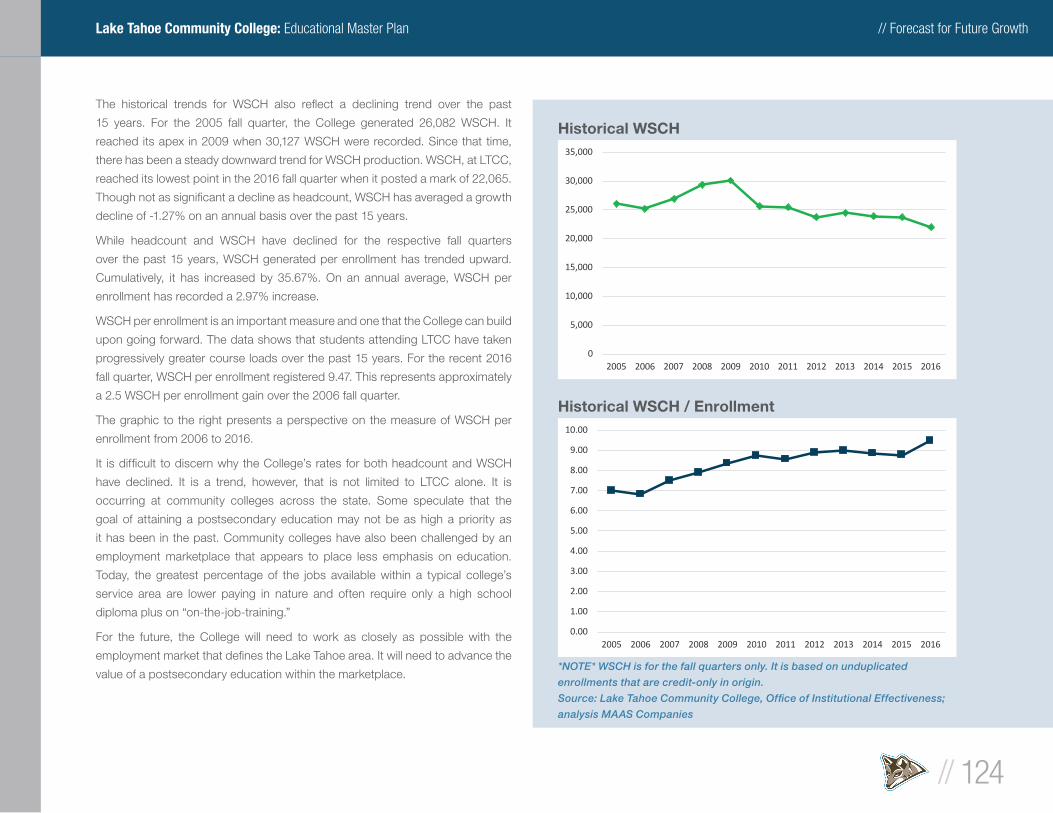
// Forecast for Future Growth
// 124
Lake Tahoe Community College: Educational Master Plan
The historical trends for WSCH also refl ect a declining trend over the past
15 years. For the 2005 fall quarter, the College generated 26,082 WSCH. It
reached its apex in 2009 when 30,127 WSCH were recorded. Since that time,
there has been a steady downward trend for WSCH production. WSCH, at LTCC,
reached its lowest point in the 2016 fall quarter when it posted a mark of 22,065.
Though not as signifi cant a decline as headcount, WSCH has averaged a growth
decline of -1.27% on an annual basis over the past 15 years.
While headcount and WSCH have declined for the respective fall quarters
over the past 15 years, WSCH generated per enrollment has trended upward.
Cumulatively, it has increased by 35.67%. On an annual average, WSCH per
enrollment has recorded a 2.97% increase.
WSCH per enrollment is an important measure and one that the College can build
upon going forward. The data shows that students attending LTCC have taken
progressively greater course loads over the past 15 years. For the recent 2016
fall quarter, WSCH per enrollment registered 9.47. This represents approximately
a 2.5 WSCH per enrollment gain over the 2006 fall quarter.
The graphic to the right presents a perspective on the measure of WSCH per
enrollment from 2006 to 2016.
It is diffi cult to discern why the College’s rates for both headcount and WSCH
have declined. It is a trend, however, that is not limited to LTCC alone. It is
occurring at community colleges across the state. Some speculate that the
goal of attaining a postsecondary education may not be as high a priority as
it has been in the past. Community colleges have also been challenged by an
employment marketplace that appears to place less emphasis on education.
Today, the greatest percentage of the jobs available within a typical college’s
service area are lower paying in nature and often require only a high school
diploma plus on “on-the-job-training.”
For the future, the College will need to work as closely as possible with the
employment market that defi nes the Lake Tahoe area. It will need to advance the
value of a postsecondary education within the marketplace.*NOTE* WSCH is for the fall quarters only. It is based on unduplicated
enrollments that are credit-only in origin.
Source: Lake Tahoe Community College, Offi ce of Institutional Effectiveness;
analysis MAAS Companies
Historical WSCH
Historical WSCH / Enrollment
0.00
1.00
2.00
3.00
4.00
5.00
6.00
7.00
8.00
9.00
10.00
2005 2006 2007 2008 2009 2010 2011 2012 2013 2014 2015 2016
0
5,000
10,000
15,000
20,000
25,000
30,000
35,000
2005 2006 2007 2008 2009 2010 2011 2012 2013 2014 2015 2016
// Forecast for Future Growth
// 125
Lake Tahoe Community College: Educational Master Plan
Current Status
The Existing Program of InstructionWhether it is for academic purposes, for accommodating support and
administrative services or for defi ning facilities, all needs on the campus relate
to and emanate from the program of instruction. In this regard, the program of
instruction provides an excellent, current-day perspective and starting point. It is
the most important element for forecasting the College’s future growth.
The current (2016 fall quarter) program of instruction is characterized as having
four primary components: Instruction delivered in the traditional manner, via on-
campus course offerings (hereafter, Face-to-Face instruction or F2F), instruction
delivered via a program of Distance Education (hereafter, DE instruction), instruction
provided to incarcerated students (hereafter, ISP) and instruction relating to the
public safety services provided via a Joint Powers Agreement (hereafter, JPA).*
The greatest generator of WSCH at LTCC is the Face-to-Face, on-campus
educational component. Of the total 22,065 WSCH tallied through this analysis
(fall quarter 2016), 13,713, almost two-thirds, is attributed to this source. Distance
Education is responsible for 4,760 of the LTCC WSCH. The ISP and JPA programs
currently generates WSCH of 1,649 and 1,944 respectively.
Overall, for the 2016 fall quarter, 308 class sections were offered to a credit-only,
unduplicated headcount of 2,333 students. The average class size was 16.37
students and WSCH produced per class section averaged 71.64. The College
generated 475.08 FTES for the 2016 fall quarter.
The delivery of the program of instruction favored a lecture-based modality.
Lecture hours outnumbered laboratory hours by a margin of 77% to 23%.
* Note: Some programs, such as DE and JPA, consistently see higher numbers
in the spring terms. This should be kept in mind when reviewing the data here,
which considers fall numbers.
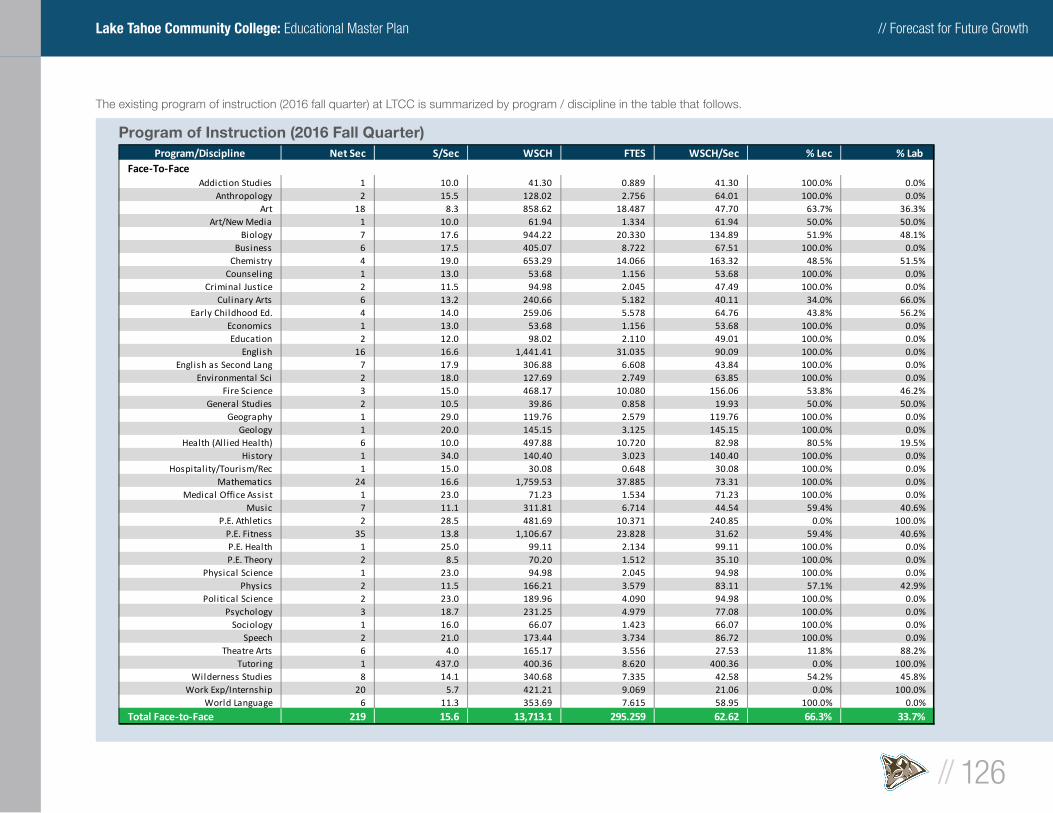
// Forecast for Future Growth
// 126
Lake Tahoe Community College: Educational Master Plan
The existing program of instruction (2016 fall quarter) at LTCC is summarized by program / discipline in the table that follows.
Program of Instruction (2016 Fall Quarter)
Program/Discipline Net Sec S/Sec WSCH FTES WSCH/Sec % Lec % Lab Fir - 170D 1 40.0 1,738.69 37.436 1,738.69 100.0% 0.0%Fir - 171B 1 4.0 14.15 0.305 14.15 100.0% 0.0%Fir - 171C 1 3.0 10.62 0.229 10.62 100.0% 0.0%Fir - 173A 1 5.0 17.69 0.381 17.69 100.0% 0.0%Fir - 174A 1 9.0 31.85 0.686 31.85 100.0% 0.0%HEA - 131PP 1 13.0 130.57 2.811 130.57 100.0% 0.0%
Total JPA 6 12.3 1,943.6 41.848 323.93 100.0% 0.0%
JPA (South Bay Regional PSTC)
Program/Discipline Net Sec S/Sec WSCH FTES WSCH/Sec % Lec % Lab Face-To-Face
Addiction Studies 1 10.0 41.30 0.889 41.30 100.0% 0.0%Anthropology 2 15.5 128.02 2.756 64.01 100.0% 0.0%
Art 18 8.3 858.62 18.487 47.70 63.7% 36.3%Art/New Media 1 10.0 61.94 1.334 61.94 50.0% 50.0%
Biology 7 17.6 944.22 20.330 134.89 51.9% 48.1%Business 6 17.5 405.07 8.722 67.51 100.0% 0.0%
Chemistry 4 19.0 653.29 14.066 163.32 48.5% 51.5%Counseling 1 13.0 53.68 1.156 53.68 100.0% 0.0%
Criminal Justice 2 11.5 94.98 2.045 47.49 100.0% 0.0%Culinary Arts 6 13.2 240.66 5.182 40.11 34.0% 66.0%
Early Childhood Ed. 4 14.0 259.06 5.578 64.76 43.8% 56.2%Economics 1 13.0 53.68 1.156 53.68 100.0% 0.0%Education 2 12.0 98.02 2.110 49.01 100.0% 0.0%
English 16 16.6 1,441.41 31.035 90.09 100.0% 0.0%English as Second Lang 7 17.9 306.88 6.608 43.84 100.0% 0.0%
Environmental Sci 2 18.0 127.69 2.749 63.85 100.0% 0.0%Fire Science 3 15.0 468.17 10.080 156.06 53.8% 46.2%
General Studies 2 10.5 39.86 0.858 19.93 50.0% 50.0%Geography 1 29.0 119.76 2.579 119.76 100.0% 0.0%
Geology 1 20.0 145.15 3.125 145.15 100.0% 0.0%Health (All ied Health) 6 10.0 497.88 10.720 82.98 80.5% 19.5%
History 1 34.0 140.40 3.023 140.40 100.0% 0.0%Hospitality/Tourism/Rec 1 15.0 30.08 0.648 30.08 100.0% 0.0%
Mathematics 24 16.6 1,759.53 37.885 73.31 100.0% 0.0%Medical Office Assist 1 23.0 71.23 1.534 71.23 100.0% 0.0%
Music 7 11.1 311.81 6.714 44.54 59.4% 40.6%P.E. Athletics 2 28.5 481.69 10.371 240.85 0.0% 100.0%
P.E. Fitness 35 13.8 1,106.67 23.828 31.62 59.4% 40.6%P.E. Health 1 25.0 99.11 2.134 99.11 100.0% 0.0%P.E. Theory 2 8.5 70.20 1.512 35.10 100.0% 0.0%
Physical Science 1 23.0 94.98 2.045 94.98 100.0% 0.0%Physics 2 11.5 166.21 3.579 83.11 57.1% 42.9%
Political Science 2 23.0 189.96 4.090 94.98 100.0% 0.0%Psychology 3 18.7 231.25 4.979 77.08 100.0% 0.0%
Sociology 1 16.0 66.07 1.423 66.07 100.0% 0.0%Speech 2 21.0 173.44 3.734 86.72 100.0% 0.0%
Theatre Arts 6 4.0 165.17 3.556 27.53 11.8% 88.2%Tutoring 1 437.0 400.36 8.620 400.36 0.0% 100.0%
Wilderness Studies 8 14.1 340.68 7.335 42.58 54.2% 45.8%Work Exp/Internship 20 5.7 421.21 9.069 21.06 0.0% 100.0%
World Language 6 11.3 353.69 7.615 58.95 100.0% 0.0%
Total Face-to-Face 219 15.6 13,713.1 295.259 62.62 66.3% 33.7%
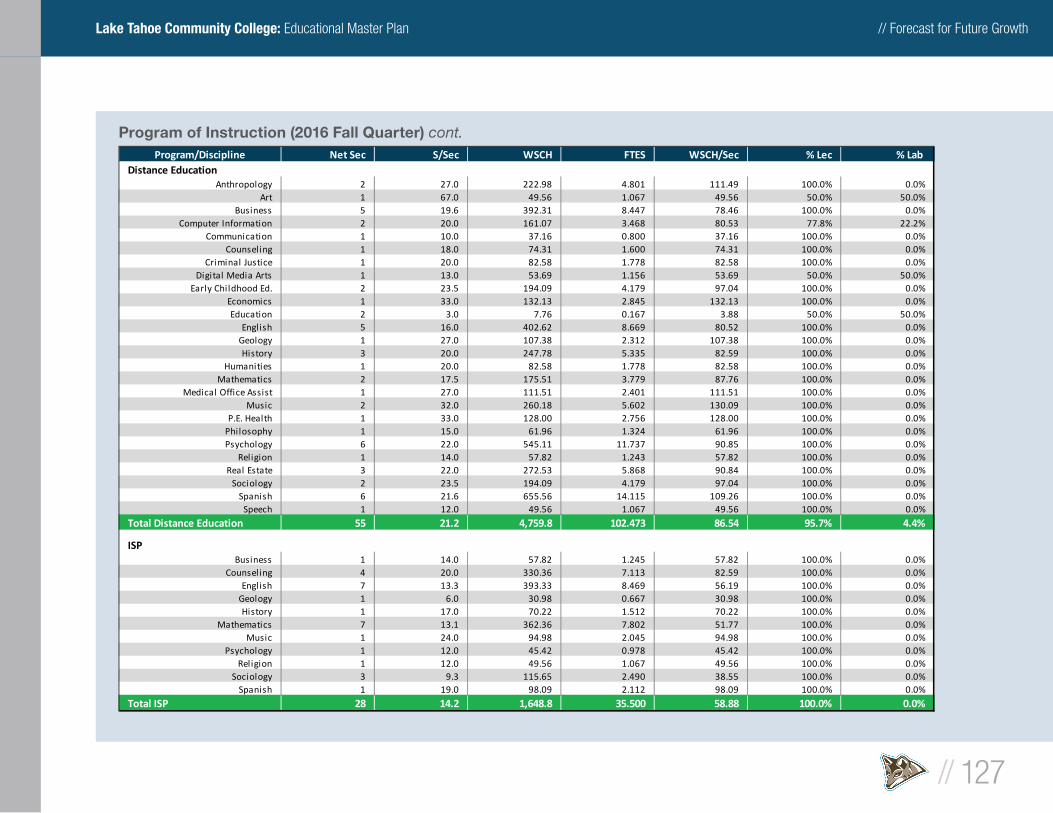
// Forecast for Future Growth
// 127
Lake Tahoe Community College: Educational Master Plan
Program of Instruction (2016 Fall Quarter) cont.Program/Discipline Net Sec S/Sec WSCH FTES WSCH/Sec % Lec % Lab
Distance EducationAnthropology 2 27.0 222.98 4.801 111.49 100.0% 0.0%
Art 1 67.0 49.56 1.067 49.56 50.0% 50.0%Business 5 19.6 392.31 8.447 78.46 100.0% 0.0%
Computer Information 2 20.0 161.07 3.468 80.53 77.8% 22.2%Communication 1 10.0 37.16 0.800 37.16 100.0% 0.0%
Counseling 1 18.0 74.31 1.600 74.31 100.0% 0.0%Criminal Justice 1 20.0 82.58 1.778 82.58 100.0% 0.0%
Digital Media Arts 1 13.0 53.69 1.156 53.69 50.0% 50.0%Early Childhood Ed. 2 23.5 194.09 4.179 97.04 100.0% 0.0%
Economics 1 33.0 132.13 2.845 132.13 100.0% 0.0%Education 2 3.0 7.76 0.167 3.88 50.0% 50.0%
English 5 16.0 402.62 8.669 80.52 100.0% 0.0%Geology 1 27.0 107.38 2.312 107.38 100.0% 0.0%History 3 20.0 247.78 5.335 82.59 100.0% 0.0%
Humanities 1 20.0 82.58 1.778 82.58 100.0% 0.0%Mathematics 2 17.5 175.51 3.779 87.76 100.0% 0.0%
Medical Office Assist 1 27.0 111.51 2.401 111.51 100.0% 0.0%Music 2 32.0 260.18 5.602 130.09 100.0% 0.0%
P.E. Health 1 33.0 128.00 2.756 128.00 100.0% 0.0%Philosophy 1 15.0 61.96 1.324 61.96 100.0% 0.0%Psychology 6 22.0 545.11 11.737 90.85 100.0% 0.0%
Religion 1 14.0 57.82 1.243 57.82 100.0% 0.0%Real Estate 3 22.0 272.53 5.868 90.84 100.0% 0.0%
Sociology 2 23.5 194.09 4.179 97.04 100.0% 0.0%Spanish 6 21.6 655.56 14.115 109.26 100.0% 0.0%
Speech 1 12.0 49.56 1.067 49.56 100.0% 0.0%
Total Distance Education 55 21.2 4,759.8 102.473 86.54 95.7% 4.4%
ISPBusiness 1 14.0 57.82 1.245 57.82 100.0% 0.0%
Counseling 4 20.0 330.36 7.113 82.59 100.0% 0.0%English 7 13.3 393.33 8.469 56.19 100.0% 0.0%
Geology 1 6.0 30.98 0.667 30.98 100.0% 0.0%History 1 17.0 70.22 1.512 70.22 100.0% 0.0%
Mathematics 7 13.1 362.36 7.802 51.77 100.0% 0.0%Music 1 24.0 94.98 2.045 94.98 100.0% 0.0%
Psychology 1 12.0 45.42 0.978 45.42 100.0% 0.0%Religion 1 12.0 49.56 1.067 49.56 100.0% 0.0%
Sociology 3 9.3 115.65 2.490 38.55 100.0% 0.0%Spanish 1 19.0 98.09 2.112 98.09 100.0% 0.0%
Total ISP 28 14.2 1,648.8 35.500 58.88 100.0% 0.0%
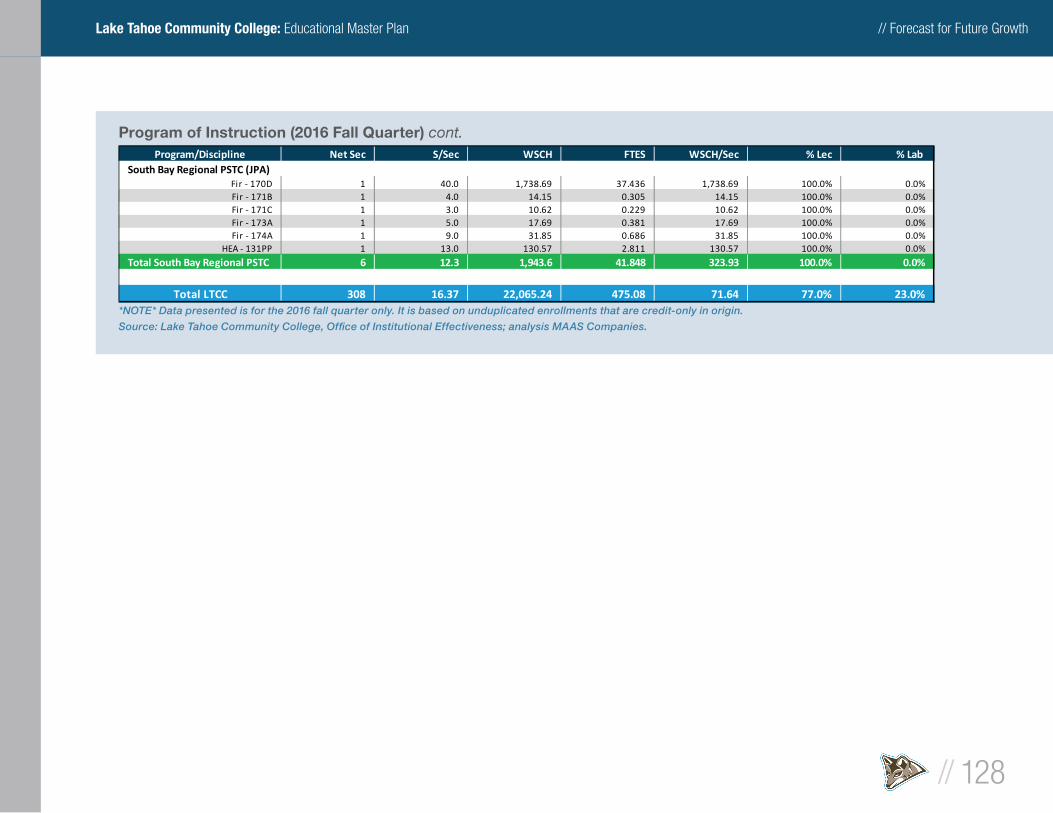
// Forecast for Future Growth
// 128
Lake Tahoe Community College: Educational Master Plan
*NOTE* Data presented is for the 2016 fall quarter only. It is based on unduplicated enrollments that are credit-only in origin.
Source: Lake Tahoe Community College, Offi ce of Institutional Effectiveness; analysis MAAS Companies.
Program of Instruction (2016 Fall Quarter) cont.Program/Discipline Net Sec S/Sec WSCH FTES WSCH/Sec % Lec % Lab
South Bay Regional PSTC (JPA)Fir - 170D 1 40.0 1,738.69 37.436 1,738.69 100.0% 0.0%Fir - 171B 1 4.0 14.15 0.305 14.15 100.0% 0.0%Fir - 171C 1 3.0 10.62 0.229 10.62 100.0% 0.0%Fir - 173A 1 5.0 17.69 0.381 17.69 100.0% 0.0%Fir - 174A 1 9.0 31.85 0.686 31.85 100.0% 0.0%
HEA - 131PP 1 13.0 130.57 2.811 130.57 100.0% 0.0%
Total South Bay Regional PSTC 6 12.3 1,943.6 41.848 323.93 100.0% 0.0%
Total LTCC 308 16.37 22,065.24 475.08 71.64 77.0% 23.0%
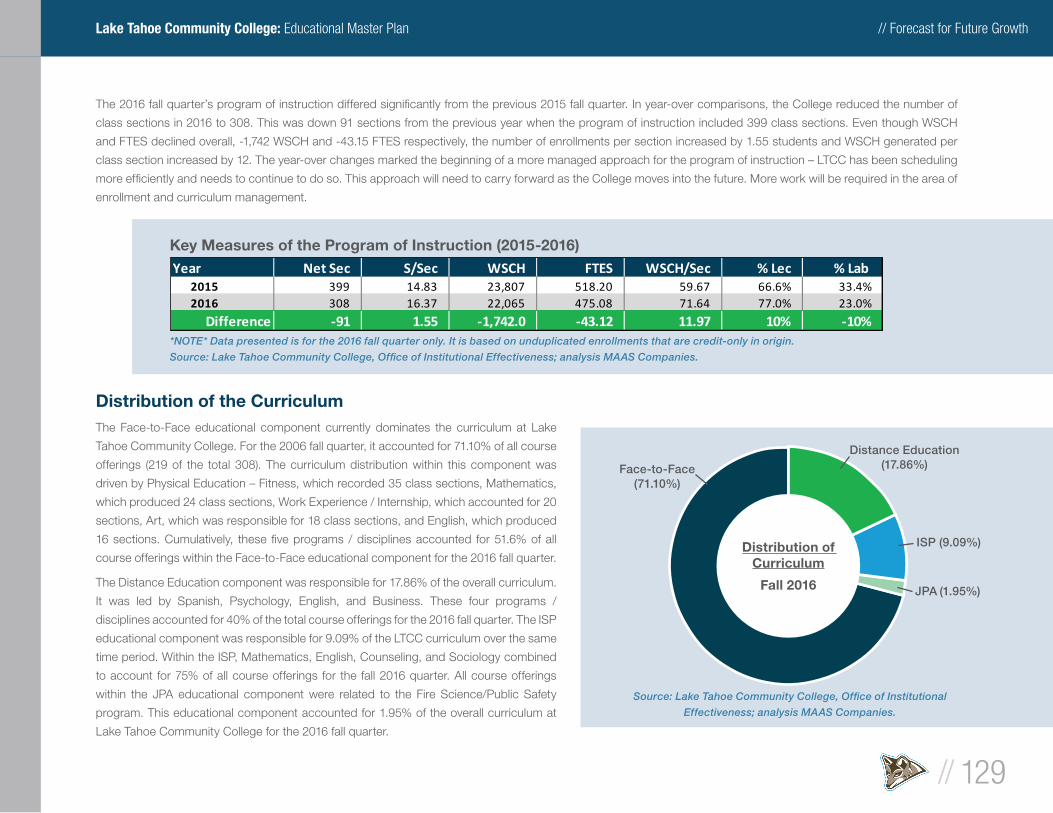
// Forecast for Future Growth
// 129
Lake Tahoe Community College: Educational Master Plan
The 2016 fall quarter’s program of instruction differed signifi cantly from the previous 2015 fall quarter. In year-over comparisons, the College reduced the number of
class sections in 2016 to 308. This was down 91 sections from the previous year when the program of instruction included 399 class sections. Even though WSCH
and FTES declined overall, -1,742 WSCH and -43.15 FTES respectively, the number of enrollments per section increased by 1.55 students and WSCH generated per
class section increased by 12. The year-over changes marked the beginning of a more managed approach for the program of instruction – LTCC has been scheduling
more effi ciently and needs to continue to do so. This approach will need to carry forward as the College moves into the future. More work will be required in the area of
enrollment and curriculum management.
Key Measures of the Program of Instruction (2015-2016)
*NOTE* Data presented is for the 2016 fall quarter only. It is based on unduplicated enrollments that are credit-only in origin.
Source: Lake Tahoe Community College, Offi ce of Institutional Effectiveness; analysis MAAS Companies.
Distribution of the CurriculumThe Face-to-Face educational component currently dominates the curriculum at Lake
Tahoe Community College. For the 2006 fall quarter, it accounted for 71.10% of all course
offerings (219 of the total 308). The curriculum distribution within this component was
driven by Physical Education – Fitness, which recorded 35 class sections, Mathematics,
which produced 24 class sections, Work Experience / Internship, which accounted for 20
sections, Art, which was responsible for 18 class sections, and English, which produced
16 sections. Cumulatively, these fi ve programs / disciplines accounted for 51.6% of all
course offerings within the Face-to-Face educational component for the 2016 fall quarter.
The Distance Education component was responsible for 17.86% of the overall curriculum.
It was led by Spanish, Psychology, English, and Business. These four programs /
disciplines accounted for 40% of the total course offerings for the 2016 fall quarter. The ISP
educational component was responsible for 9.09% of the LTCC curriculum over the same
time period. Within the ISP, Mathematics, English, Counseling, and Sociology combined
to account for 75% of all course offerings for the fall 2016 quarter. All course offerings
within the JPA educational component were related to the Fire Science/Public Safety
program. This educational component accounted for 1.95% of the overall curriculum at
Lake Tahoe Community College for the 2016 fall quarter.
Distribution of Curriculum
Fall 2016
Face-to-Face(71.10%)
ISP (9.09%)
Distance Education(17.86%)
JPA (1.95%)
Source: Lake Tahoe Community College, Offi ce of Institutional
Effectiveness; analysis MAAS Companies.
Year Net Sec S/Sec WSCH FTES WSCH/Sec % Lec % Lab 2015 399 14.83 23,807 518.20 59.67 66.6% 33.4%2016 308 16.37 22,065 475.08 71.64 77.0% 23.0%
Difference -91 1.55 -1,742.0 -43.12 11.97 10% -10%
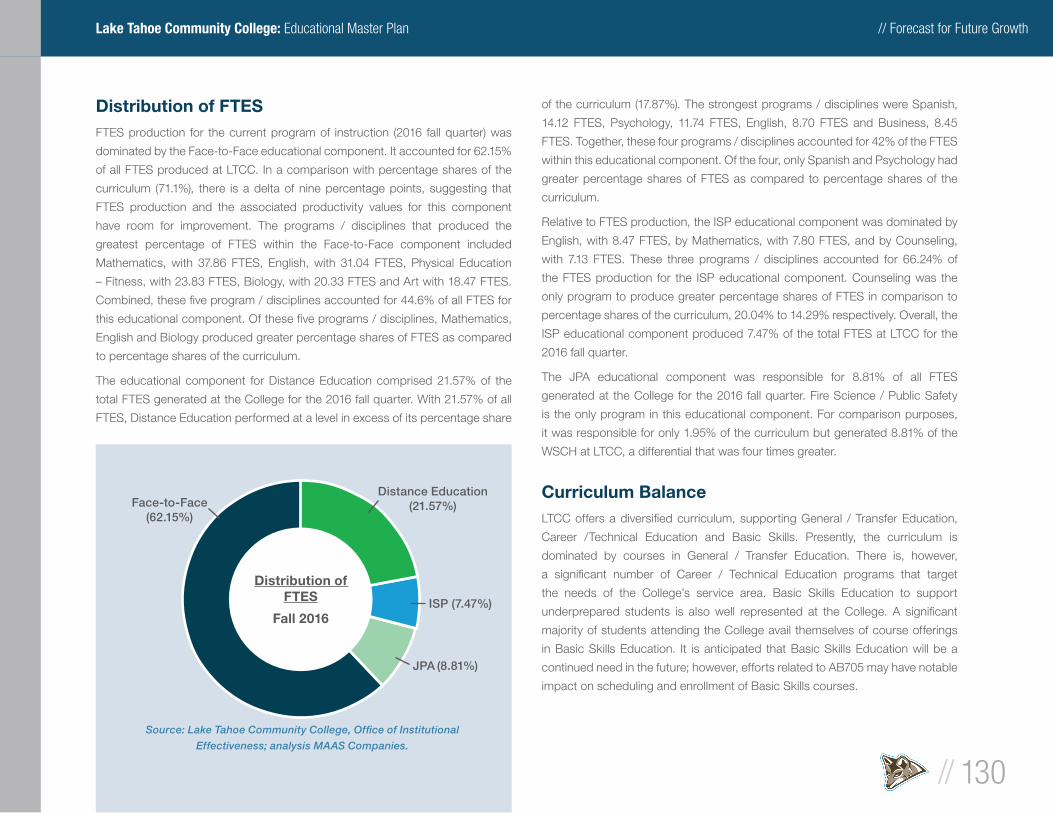
// Forecast for Future Growth
// 130
Lake Tahoe Community College: Educational Master Plan
Distribution of FTESFTES production for the current program of instruction (2016 fall quarter) was
dominated by the Face-to-Face educational component. It accounted for 62.15%
of all FTES produced at LTCC. In a comparison with percentage shares of the
curriculum (71.1%), there is a delta of nine percentage points, suggesting that
FTES production and the associated productivity values for this component
have room for improvement. The programs / disciplines that produced the
greatest percentage of FTES within the Face-to-Face component included
Mathematics, with 37.86 FTES, English, with 31.04 FTES, Physical Education
– Fitness, with 23.83 FTES, Biology, with 20.33 FTES and Art with 18.47 FTES.
Combined, these fi ve program / disciplines accounted for 44.6% of all FTES for
this educational component. Of these fi ve programs / disciplines, Mathematics,
English and Biology produced greater percentage shares of FTES as compared
to percentage shares of the curriculum.
The educational component for Distance Education comprised 21.57% of the
total FTES generated at the College for the 2016 fall quarter. With 21.57% of all
FTES, Distance Education performed at a level in excess of its percentage share
of the curriculum (17.87%). The strongest programs / disciplines were Spanish,
14.12 FTES, Psychology, 11.74 FTES, English, 8.70 FTES and Business, 8.45
FTES. Together, these four programs / disciplines accounted for 42% of the FTES
within this educational component. Of the four, only Spanish and Psychology had
greater percentage shares of FTES as compared to percentage shares of the
curriculum.
Relative to FTES production, the ISP educational component was dominated by
English, with 8.47 FTES, by Mathematics, with 7.80 FTES, and by Counseling,
with 7.13 FTES. These three programs / disciplines accounted for 66.24% of
the FTES production for the ISP educational component. Counseling was the
only program to produce greater percentage shares of FTES in comparison to
percentage shares of the curriculum, 20.04% to 14.29% respectively. Overall, the
ISP educational component produced 7.47% of the total FTES at LTCC for the
2016 fall quarter.
The JPA educational component was responsible for 8.81% of all FTES
generated at the College for the 2016 fall quarter. Fire Science / Public Safety
is the only program in this educational component. For comparison purposes,
it was responsible for only 1.95% of the curriculum but generated 8.81% of the
WSCH at LTCC, a differential that was four times greater.
Curriculum Balance LTCC offers a diversifi ed curriculum, supporting General / Transfer Education,
Career /Technical Education and Basic Skills. Presently, the curriculum is
dominated by courses in General / Transfer Education. There is, however,
a signifi cant number of Career / Technical Education programs that target
the needs of the College’s service area. Basic Skills Education to support
underprepared students is also well represented at the College. A signifi cant
majority of students attending the College avail themselves of course offerings
in Basic Skills Education. It is anticipated that Basic Skills Education will be a
continued need in the future; however, efforts related to AB705 may have notable
impact on scheduling and enrollment of Basic Skills courses.
Distribution of FTES
Fall 2016
Face-to-Face(62.15%)
ISP (7.47%)
Distance Education(21.57%)
JPA (8.81%)
Source: Lake Tahoe Community College, Offi ce of Institutional
Effectiveness; analysis MAAS Companies.
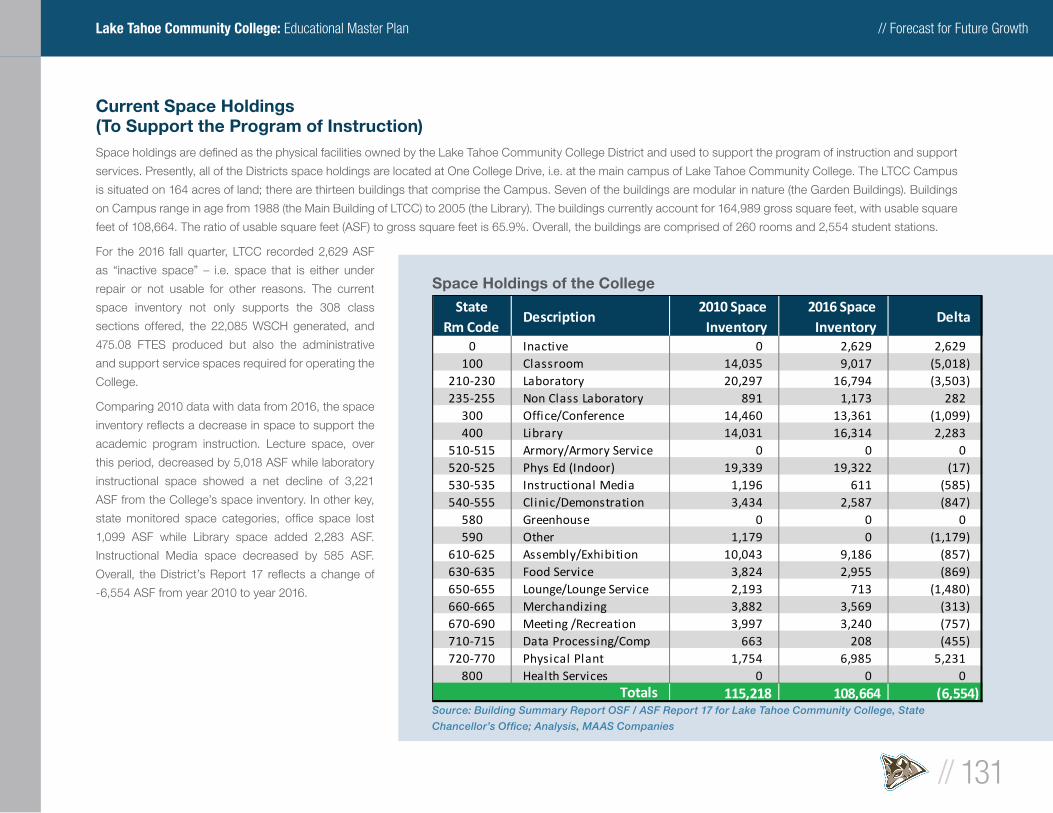
// Forecast for Future Growth
// 131
Lake Tahoe Community College: Educational Master Plan
Current Space Holdings(To Support the Program of Instruction)Space holdings are defi ned as the physical facilities owned by the Lake Tahoe Community College District and used to support the program of instruction and support
services. Presently, all of the Districts space holdings are located at One College Drive, i.e. at the main campus of Lake Tahoe Community College. The LTCC Campus
is situated on 164 acres of land; there are thirteen buildings that comprise the Campus. Seven of the buildings are modular in nature (the Garden Buildings). Buildings
on Campus range in age from 1988 (the Main Building of LTCC) to 2005 (the Library). The buildings currently account for 164,989 gross square feet, with usable square
feet of 108,664. The ratio of usable square feet (ASF) to gross square feet is 65.9%. Overall, the buildings are comprised of 260 rooms and 2,554 student stations.
For the 2016 fall quarter, LTCC recorded 2,629 ASF
as “inactive space” – i.e. space that is either under
repair or not usable for other reasons. The current
space inventory not only supports the 308 class
sections offered, the 22,085 WSCH generated, and
475.08 FTES produced but also the administrative
and support service spaces required for operating the
College.
Comparing 2010 data with data from 2016, the space
inventory refl ects a decrease in space to support the
academic program instruction. Lecture space, over
this period, decreased by 5,018 ASF while laboratory
instructional space showed a net decline of 3,221
ASF from the College’s space inventory. In other key,
state monitored space categories, offi ce space lost
1,099 ASF while Library space added 2,283 ASF.
Instructional Media space decreased by 585 ASF.
Overall, the District’s Report 17 refl ects a change of
-6,554 ASF from year 2010 to year 2016.
StateRm Code
Description2010 Space
Inventory2016 Space
InventoryDelta
0 Inactive 0 2,629 2,629100 Classroom 14,035 9,017 (5,018)
210-230 Laboratory 20,297 16,794 (3,503)235-255 Non Class Laboratory 891 1,173 282
300 Office/Conference 14,460 13,361 (1,099)400 Library 14,031 16,314 2,283
510-515 Armory/Armory Service 0 0 0520-525 Phys Ed (Indoor) 19,339 19,322 (17)530-535 Instructional Media 1,196 611 (585)540-555 Clinic/Demonstration 3,434 2,587 (847)
580 Greenhouse 0 0 0590 Other 1,179 0 (1,179)
610-625 Assembly/Exhibition 10,043 9,186 (857)630-635 Food Service 3,824 2,955 (869)650-655 Lounge/Lounge Service 2,193 713 (1,480)660-665 Merchandizing 3,882 3,569 (313)670-690 Meeting /Recreation 3,997 3,240 (757)710-715 Data Processing/Comp 663 208 (455)720-770 Physical Plant 1,754 6,985 5,231
800 Health Services 0 0 0115,218 108,664 (6,554)Totals
Source: Building Summary Report OSF / ASF Report 17 for Lake Tahoe Community College, State
Chancellor’s Offi ce; Analysis, MAAS Companies
Space Holdings of the College
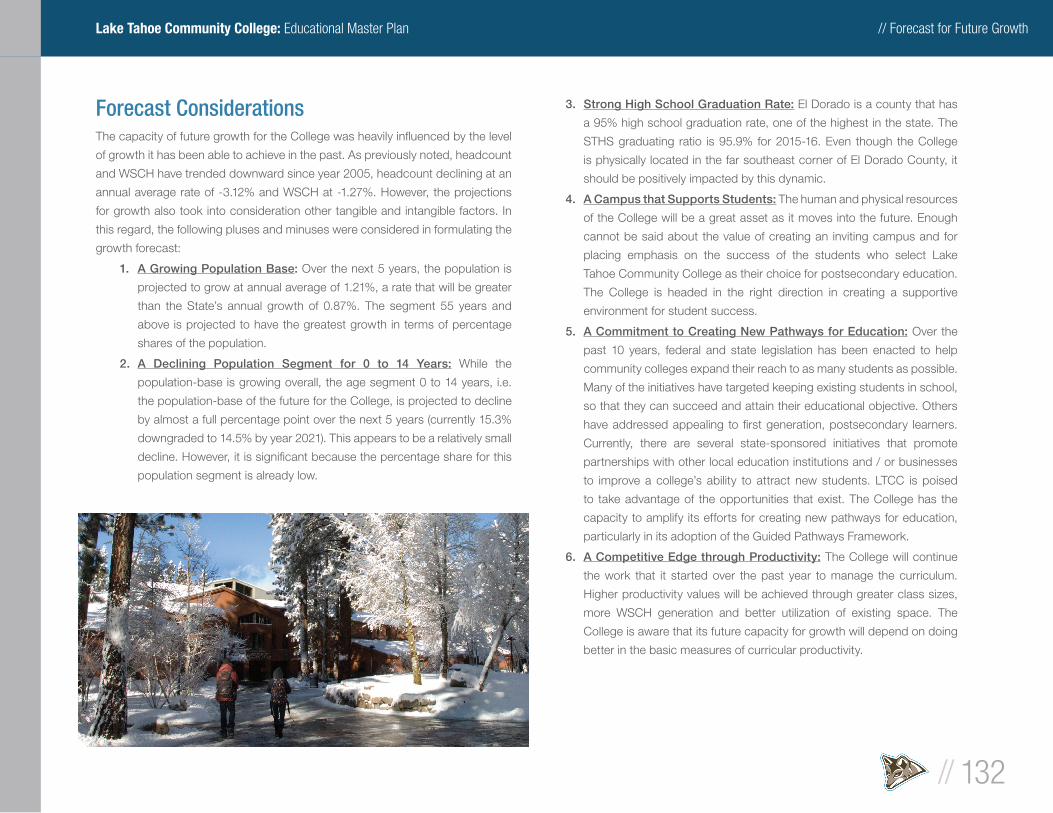
// Forecast for Future Growth
// 132
Lake Tahoe Community College: Educational Master Plan
Forecast ConsiderationsThe capacity of future growth for the College was heavily infl uenced by the level
of growth it has been able to achieve in the past. As previously noted, headcount
and WSCH have trended downward since year 2005, headcount declining at an
annual average rate of -3.12% and WSCH at -1.27%. However, the projections
for growth also took into consideration other tangible and intangible factors. In
this regard, the following pluses and minuses were considered in formulating the
growth forecast:
1. A Growing Population Base: Over the next 5 years, the population is
projected to grow at annual average of 1.21%, a rate that will be greater
than the State’s annual growth of 0.87%. The segment 55 years and
above is projected to have the greatest growth in terms of percentage
shares of the population.
2. A Declining Population Segment for 0 to 14 Years: While the
population-base is growing overall, the age segment 0 to 14 years, i.e.
the population-base of the future for the College, is projected to decline
by almost a full percentage point over the next 5 years (currently 15.3%
downgraded to 14.5% by year 2021). This appears to be a relatively small
decline. However, it is signifi cant because the percentage share for this
population segment is already low.
3. Strong High School Graduation Rate: El Dorado is a county that has
a 95% high school graduation rate, one of the highest in the state. The
STHS graduating ratio is 95.9% for 2015-16. Even though the College
is physically located in the far southeast corner of El Dorado County, it
should be positively impacted by this dynamic.
4. A Campus that Supports Students: The human and physical resources
of the College will be a great asset as it moves into the future. Enough
cannot be said about the value of creating an inviting campus and for
placing emphasis on the success of the students who select Lake
Tahoe Community College as their choice for postsecondary education.
The College is headed in the right direction in creating a supportive
environment for student success.
5. A Commitment to Creating New Pathways for Education: Over the
past 10 years, federal and state legislation has been enacted to help
community colleges expand their reach to as many students as possible.
Many of the initiatives have targeted keeping existing students in school,
so that they can succeed and attain their educational objective. Others
have addressed appealing to fi rst generation, postsecondary learners.
Currently, there are several state-sponsored initiatives that promote
partnerships with other local education institutions and / or businesses
to improve a college’s ability to attract new students. LTCC is poised
to take advantage of the opportunities that exist. The College has the
capacity to amplify its efforts for creating new pathways for education,
particularly in its adoption of the Guided Pathways Framework.
6. A Competitive Edge through Productivity: The College will continue
the work that it started over the past year to manage the curriculum.
Higher productivity values will be achieved through greater class sizes,
more WSCH generation and better utilization of existing space. The
College is aware that its future capacity for growth will depend on doing
better in the basic measures of curricular productivity.
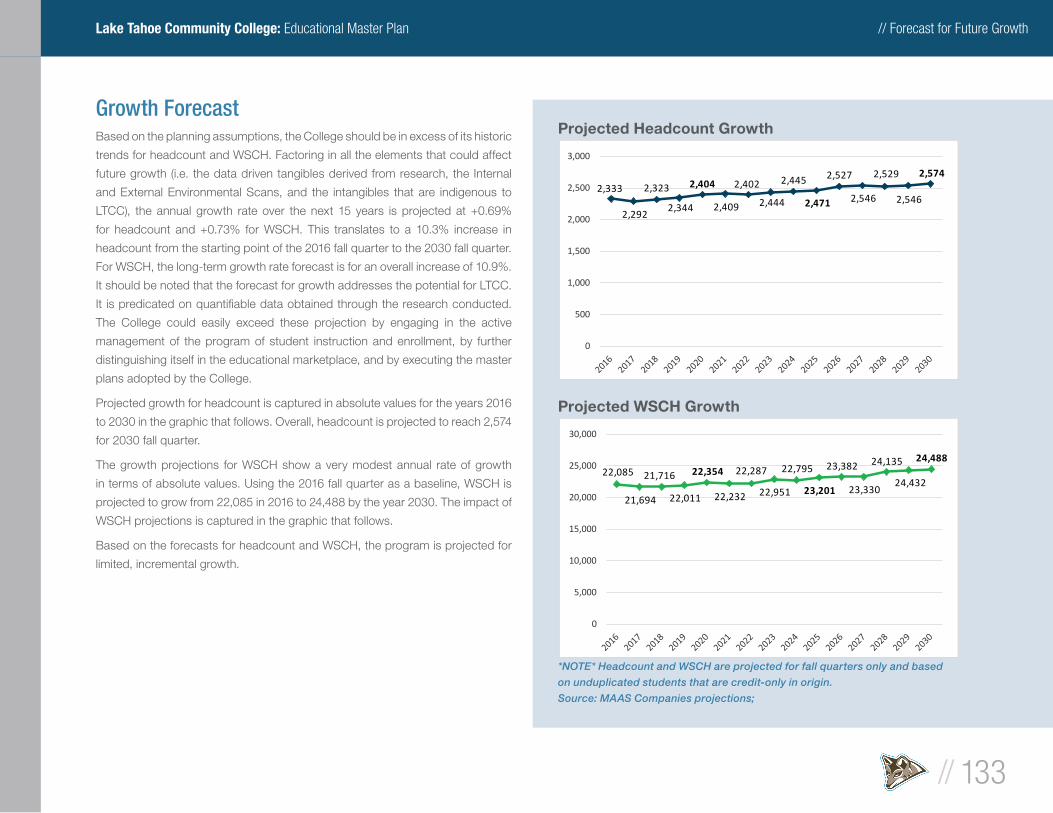
// Forecast for Future Growth
// 133
Lake Tahoe Community College: Educational Master Plan
Growth ForecastBased on the planning assumptions, the College should be in excess of its historic
trends for headcount and WSCH. Factoring in all the elements that could affect
future growth (i.e. the data driven tangibles derived from research, the Internal
and External Environmental Scans, and the intangibles that are indigenous to
LTCC), the annual growth rate over the next 15 years is projected at +0.69%
for headcount and +0.73% for WSCH. This translates to a 10.3% increase in
headcount from the starting point of the 2016 fall quarter to the 2030 fall quarter.
For WSCH, the long-term growth rate forecast is for an overall increase of 10.9%.
It should be noted that the forecast for growth addresses the potential for LTCC.
It is predicated on quantifi able data obtained through the research conducted.
The College could easily exceed these projection by engaging in the active
management of the program of student instruction and enrollment, by further
distinguishing itself in the educational marketplace, and by executing the master
plans adopted by the College.
Projected growth for headcount is captured in absolute values for the years 2016
to 2030 in the graphic that follows. Overall, headcount is projected to reach 2,574
for 2030 fall quarter.
The growth projections for WSCH show a very modest annual rate of growth
in terms of absolute values. Using the 2016 fall quarter as a baseline, WSCH is
projected to grow from 22,085 in 2016 to 24,488 by the year 2030. The impact of
WSCH projections is captured in the graphic that follows.
Based on the forecasts for headcount and WSCH, the program is projected for
limited, incremental growth.
*NOTE* Headcount and WSCH are projected for fall quarters only and based
on unduplicated students that are credit-only in origin.
Source: MAAS Companies projections;
Projected Headcount Growth
Projected WSCH Growth
2,333
2,292
2,323
2,344
2,404
2,409
2,402
2,444
2,445
2,471
2,527
2,546
2,529
2,546
2,574
0
500
1,000
1,500
2,000
2,500
3,000
22,085
21,694
21,716
22,011
22,354
22,232
22,287
22,951
22,795
23,201
23,382
23,330
24,135
24,432
24,488
0
5,000
10,000
15,000
20,000
25,000
30,000
// Forecast for Future Growth
// 134
Lake Tahoe Community College: Educational Master Plan
The Application of Forecasted GrowthForecasted growth was applied to the future program of instruction on an
individual program / discipline basis. It was not applied equally across the board
but on the basis of past curricular effi ciency and future potential. As a result,
some programs / disciplines experienced growth, some remained at status quo,
and some were reduced.
The forecasting process used the current program of instruction as a baseline.
While a generic, planned program of instruction could have been constructed
to create the forecasted number of class sections, the WSCH produced, the
FTES generated, the number of lecture and laboratory hours required and
the application of reasonable standards for effi ciency, the current program of
instruction served as a strong foundation from which to build. It was assumed
that adjustments would be made to curricular content and the methods of
instructional delivery but that the instructional program of the future would
remain similar to that which currently exists in terms of content. It is expected
that existing programs / disciplines in the four educational components will
increase or decrease proportionately with the needs of the College and refl ect
the environmental conditions and changes within the student body.
WSCH was used as the basis for forecasting the characteristics of the future
program of instruction. The College measures its progress and success in
terms of FTES. Alternately, the state measures growth and the qualifi cation for
future space in terms of WSCH. WSCH represents the average number of hours
of student instruction in a given week. A class of 35 students meeting three
hours per week produces 105 WSCH. The State uses this (WSCH) measure to
defi ne the need for space as well as the occupancy capacity of facilities. WSCH,
therefore, was used as the foundation element to project growth relative to the
future program of instruction.
Additionally, the following assumptions were considered in applying growth to
the future program of instruction:
§ The organizational structure at the College will be similar to that which
presently exist. The College may, however, consider organizing the program of
instruction into instructional divisions.
§ Greater demands will be placed on curricular direction and support services.
§ The College will continue to make strides in curricular effi ciency and, for the
future, trend higher in the key elements that measure overall productivity.
§ The College will use existing space to its intended capacity to meet the state
standards for facility utilization.
§ Based on the use of Title 5 standards, the College will strive to keep itself in a
funding-worthy position for available state funding opportunities.
Projections for the future program of instruction also referenced and incorporated
information from key documents. Those that carried the greatest weight included:
§ The 2017/2018 Lake Tahoe Community College District, Report 17 ASF/OGSF
Summary & Capacities Summary (State Chancellor’s Offi ce)
§ The 2017/2018 Lake Tahoe Community College District’s Five-Year
Construction Plan (State Chancellor’s Offi ce)
§ The 2017/2018 Long Range Enrollment and WSCH Forecast (State
Chancellor’s Offi ce)
§ Data reports and information provided via Lake Tahoe Community College,
Offi ce of Institutional Effectiveness from 2005 through 2016
§ Previous Master Plans of the College, including those for Education, Facilities,
Technology and Strategic Planning
§ The MAAS Companies database for over 60 community colleges in the state
Finally, the following parameters were selected to defi ne the future program of
instruction with the limits set for growth. These included the following:
Fall Quarters as a Point of Reference: The program of instruction of the future
refl ects growth in terms of comparable fall quarters. The State Chancellor’s
Offi ce uses fall quarters (or semesters) as the common measure for determining
space needs. Typically, fall quarters (or semesters) produce the highest number
of enrolled students within the academic year. This is true of enrollment at LTCC
with the exception of online distance education and JPA courses, which typically
experience their highest numbers in the spring quarter.
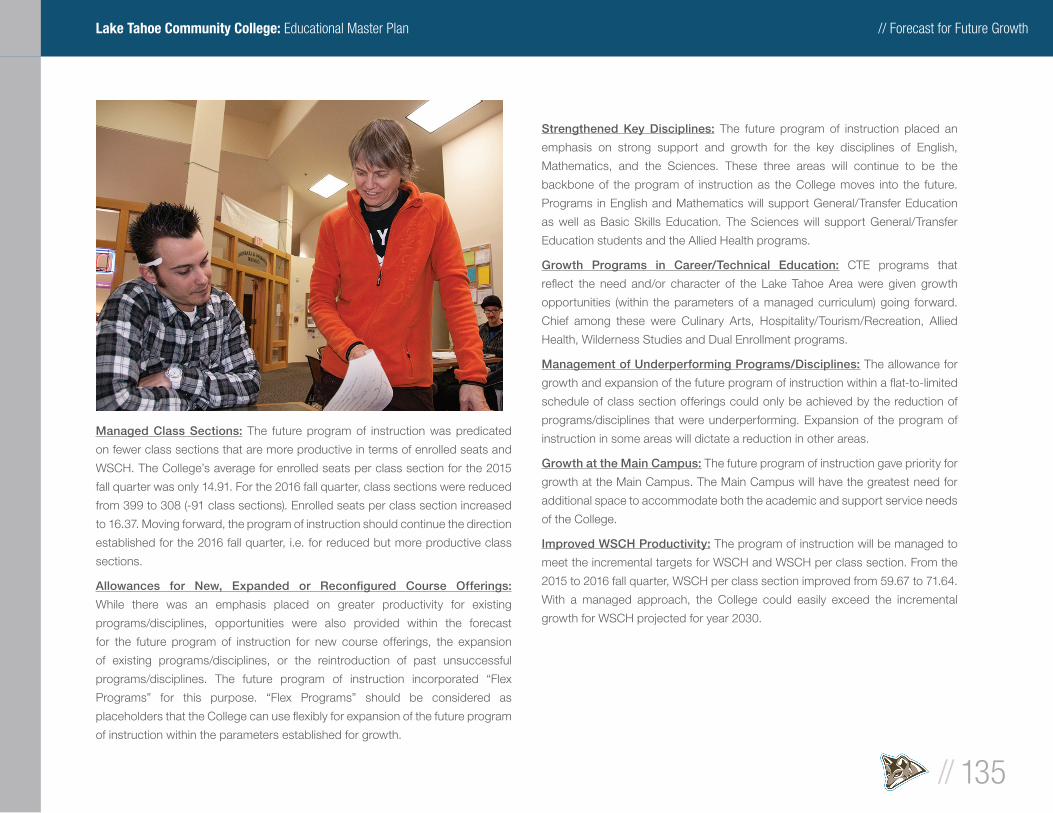
// Forecast for Future Growth
// 135
Lake Tahoe Community College: Educational Master Plan
Managed Class Sections: The future program of instruction was predicated
on fewer class sections that are more productive in terms of enrolled seats and
WSCH. The College’s average for enrolled seats per class section for the 2015
fall quarter was only 14.91. For the 2016 fall quarter, class sections were reduced
from 399 to 308 (-91 class sections). Enrolled seats per class section increased
to 16.37. Moving forward, the program of instruction should continue the direction
established for the 2016 fall quarter, i.e. for reduced but more productive class
sections.
Allowances for New, Expanded or Reconfi gured Course Offerings:
While there was an emphasis placed on greater productivity for existing
programs/disciplines, opportunities were also provided within the forecast
for the future program of instruction for new course offerings, the expansion
of existing programs/disciplines, or the reintroduction of past unsuccessful
programs/disciplines. The future program of instruction incorporated “Flex
Programs” for this purpose. “Flex Programs” should be considered as
placeholders that the College can use fl exibly for expansion of the future program
of instruction within the parameters established for growth.
Strengthened Key Disciplines: The future program of instruction placed an
emphasis on strong support and growth for the key disciplines of English,
Mathematics, and the Sciences. These three areas will continue to be the
backbone of the program of instruction as the College moves into the future.
Programs in English and Mathematics will support General/Transfer Education
as well as Basic Skills Education. The Sciences will support General/Transfer
Education students and the Allied Health programs.
Growth Programs in Career/Technical Education: CTE programs that
refl ect the need and/or character of the Lake Tahoe Area were given growth
opportunities (within the parameters of a managed curriculum) going forward.
Chief among these were Culinary Arts, Hospitality/Tourism/Recreation, Allied
Health, Wilderness Studies and Dual Enrollment programs.
Management of Underperforming Programs/Disciplines: The allowance for
growth and expansion of the future program of instruction within a fl at-to-limited
schedule of class section offerings could only be achieved by the reduction of
programs/disciplines that were underperforming. Expansion of the program of
instruction in some areas will dictate a reduction in other areas.
Growth at the Main Campus: The future program of instruction gave priority for
growth at the Main Campus. The Main Campus will have the greatest need for
additional space to accommodate both the academic and support service needs
of the College.
Improved WSCH Productivity: The program of instruction will be managed to
meet the incremental targets for WSCH and WSCH per class section. From the
2015 to 2016 fall quarter, WSCH per class section improved from 59.67 to 71.64.
With a managed approach, the College could easily exceed the incremental
growth for WSCH projected for year 2030.
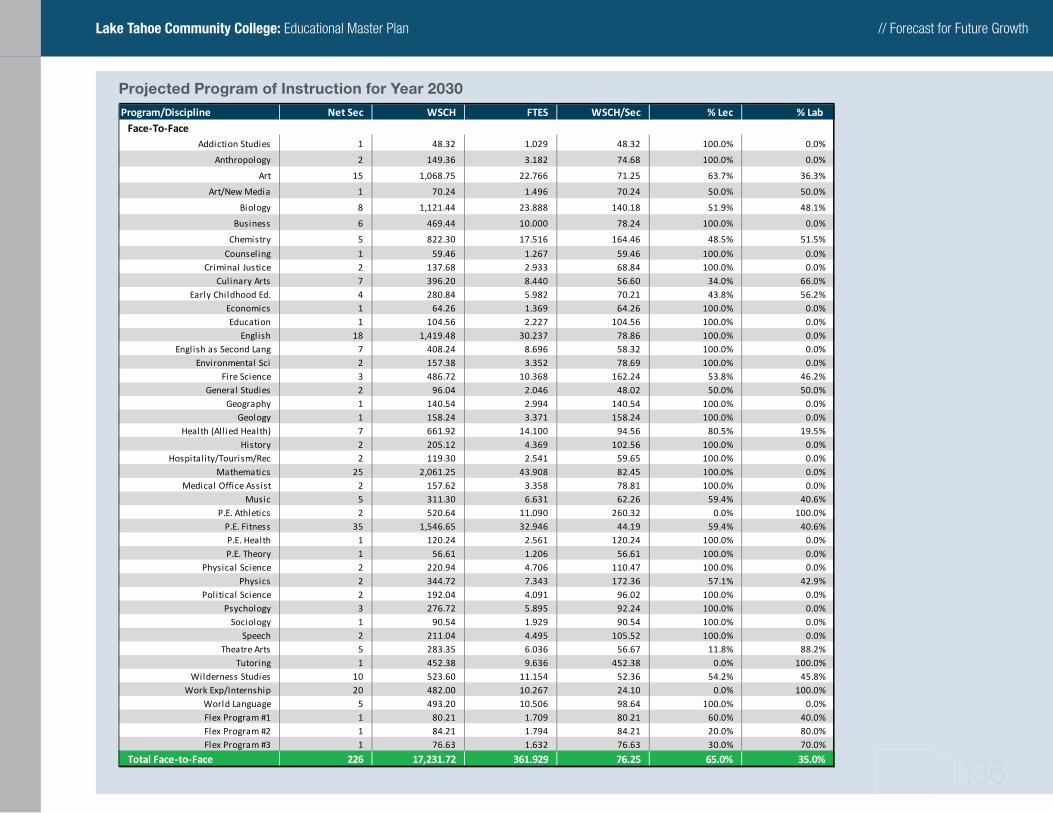
// Forecast for Future Growth
// 136
Lake Tahoe Community College: Educational Master Plan
// // 136136
Program/Discipline Net Sec WSCH FTES WSCH/Sec % Lec % Lab Face-To-Face
Addiction Studies 1 48.32 1.029 48.32 100.0% 0.0%
Anthropology 2 149.36 3.182 74.68 100.0% 0.0%
Art 15 1,068.75 22.766 71.25 63.7% 36.3%
Art/New Media 1 70.24 1.496 70.24 50.0% 50.0%
Biology 8 1,121.44 23.888 140.18 51.9% 48.1%
Business 6 469.44 10.000 78.24 100.0% 0.0%
Chemistry 5 822.30 17.516 164.46 48.5% 51.5%
Counseling 1 59.46 1.267 59.46 100.0% 0.0%Criminal Justice 2 137.68 2.933 68.84 100.0% 0.0%
Culinary Arts 7 396.20 8.440 56.60 34.0% 66.0%Early Childhood Ed. 4 280.84 5.982 70.21 43.8% 56.2%
Economics 1 64.26 1.369 64.26 100.0% 0.0%Education 1 104.56 2.227 104.56 100.0% 0.0%
English 18 1,419.48 30.237 78.86 100.0% 0.0%English as Second Lang 7 408.24 8.696 58.32 100.0% 0.0%
Environmental Sci 2 157.38 3.352 78.69 100.0% 0.0%Fire Science 3 486.72 10.368 162.24 53.8% 46.2%
General Studies 2 96.04 2.046 48.02 50.0% 50.0%Geography 1 140.54 2.994 140.54 100.0% 0.0%
Geology 1 158.24 3.371 158.24 100.0% 0.0%Health (All ied Health) 7 661.92 14.100 94.56 80.5% 19.5%
History 2 205.12 4.369 102.56 100.0% 0.0%Hospitality/Tourism/Rec 2 119.30 2.541 59.65 100.0% 0.0%
Mathematics 25 2,061.25 43.908 82.45 100.0% 0.0%Medical Office Assist 2 157.62 3.358 78.81 100.0% 0.0%
Music 5 311.30 6.631 62.26 59.4% 40.6%P.E. Athletics 2 520.64 11.090 260.32 0.0% 100.0%
P.E. Fitness 35 1,546.65 32.946 44.19 59.4% 40.6%P.E. Health 1 120.24 2.561 120.24 100.0% 0.0%P.E. Theory 1 56.61 1.206 56.61 100.0% 0.0%
Physical Science 2 220.94 4.706 110.47 100.0% 0.0%Physics 2 344.72 7.343 172.36 57.1% 42.9%
Political Science 2 192.04 4.091 96.02 100.0% 0.0%Psychology 3 276.72 5.895 92.24 100.0% 0.0%
Sociology 1 90.54 1.929 90.54 100.0% 0.0%Speech 2 211.04 4.495 105.52 100.0% 0.0%
Theatre Arts 5 283.35 6.036 56.67 11.8% 88.2%Tutoring 1 452.38 9.636 452.38 0.0% 100.0%
Wilderness Studies 10 523.60 11.154 52.36 54.2% 45.8%Work Exp/Internship 20 482.00 10.267 24.10 0.0% 100.0%
World Language 5 493.20 10.506 98.64 100.0% 0.0%Flex Program #1 1 80.21 1.709 80.21 60.0% 40.0%Flex Program #2 1 84.21 1.794 84.21 20.0% 80.0%Flex Program #3 1 76.63 1.632 76.63 30.0% 70.0%
Total Face-to-Face 226 17,231.72 361.929 76.25 65.0% 35.0%
Projected Program of Instruction for Year 2030
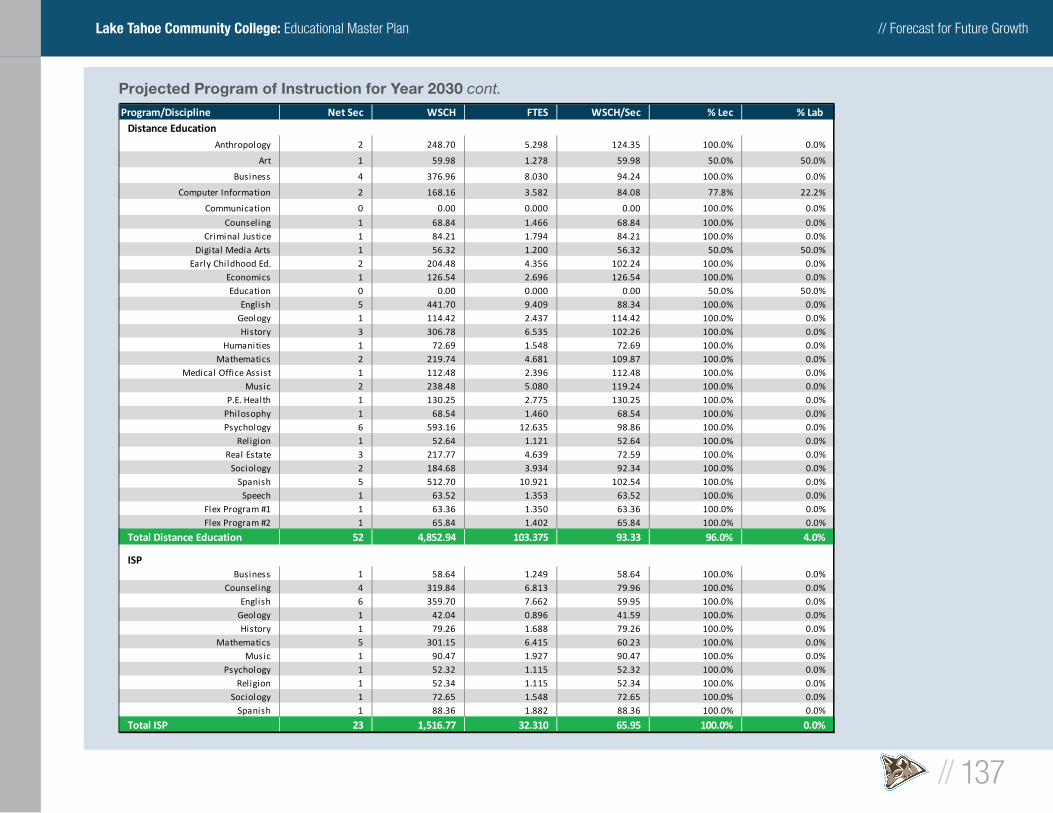
// Forecast for Future Growth
// 137
Lake Tahoe Community College: Educational Master Plan
Projected Program of Instruction for Year 2030 cont.Program/Discipline Net Sec WSCH FTES WSCH/Sec % Lec % Lab
Distance EducationAnthropology 2 248.70 5.298 124.35 100.0% 0.0%
Art 1 59.98 1.278 59.98 50.0% 50.0%
Business 4 376.96 8.030 94.24 100.0% 0.0%
Computer Information 2 168.16 3.582 84.08 77.8% 22.2%
Communication 0 0.00 0.000 0.00 100.0% 0.0%
Counseling 1 68.84 1.466 68.84 100.0% 0.0%Criminal Justice 1 84.21 1.794 84.21 100.0% 0.0%
Digital Media Arts 1 56.32 1.200 56.32 50.0% 50.0%Early Childhood Ed. 2 204.48 4.356 102.24 100.0% 0.0%
Economics 1 126.54 2.696 126.54 100.0% 0.0%Education 0 0.00 0.000 0.00 50.0% 50.0%
English 5 441.70 9.409 88.34 100.0% 0.0%Geology 1 114.42 2.437 114.42 100.0% 0.0%History 3 306.78 6.535 102.26 100.0% 0.0%
Humanities 1 72.69 1.548 72.69 100.0% 0.0%Mathematics 2 219.74 4.681 109.87 100.0% 0.0%
Medical Office Assist 1 112.48 2.396 112.48 100.0% 0.0%Music 2 238.48 5.080 119.24 100.0% 0.0%
P.E. Health 1 130.25 2.775 130.25 100.0% 0.0%Philosophy 1 68.54 1.460 68.54 100.0% 0.0%Psychology 6 593.16 12.635 98.86 100.0% 0.0%
Religion 1 52.64 1.121 52.64 100.0% 0.0%Real Estate 3 217.77 4.639 72.59 100.0% 0.0%
Sociology 2 184.68 3.934 92.34 100.0% 0.0%Spanish 5 512.70 10.921 102.54 100.0% 0.0%
Speech 1 63.52 1.353 63.52 100.0% 0.0%Flex Program #1 1 63.36 1.350 63.36 100.0% 0.0%Flex Program #2 1 65.84 1.402 65.84 100.0% 0.0%
Total Distance Education 52 4,852.94 103.375 93.33 96.0% 4.0%
ISPBusiness 1 58.64 1.249 58.64 100.0% 0.0%
Counseling 4 319.84 6.813 79.96 100.0% 0.0%English 6 359.70 7.662 59.95 100.0% 0.0%
Geology 1 42.04 0.896 41.59 100.0% 0.0%History 1 79.26 1.688 79.26 100.0% 0.0%
Mathematics 5 301.15 6.415 60.23 100.0% 0.0%Music 1 90.47 1.927 90.47 100.0% 0.0%
Psychology 1 52.32 1.115 52.32 100.0% 0.0%Religion 1 52.34 1.115 52.34 100.0% 0.0%
Sociology 1 72.65 1.548 72.65 100.0% 0.0%Spanish 1 88.36 1.882 88.36 100.0% 0.0%
Total ISP 23 1,516.77 32.310 65.95 100.0% 0.0%
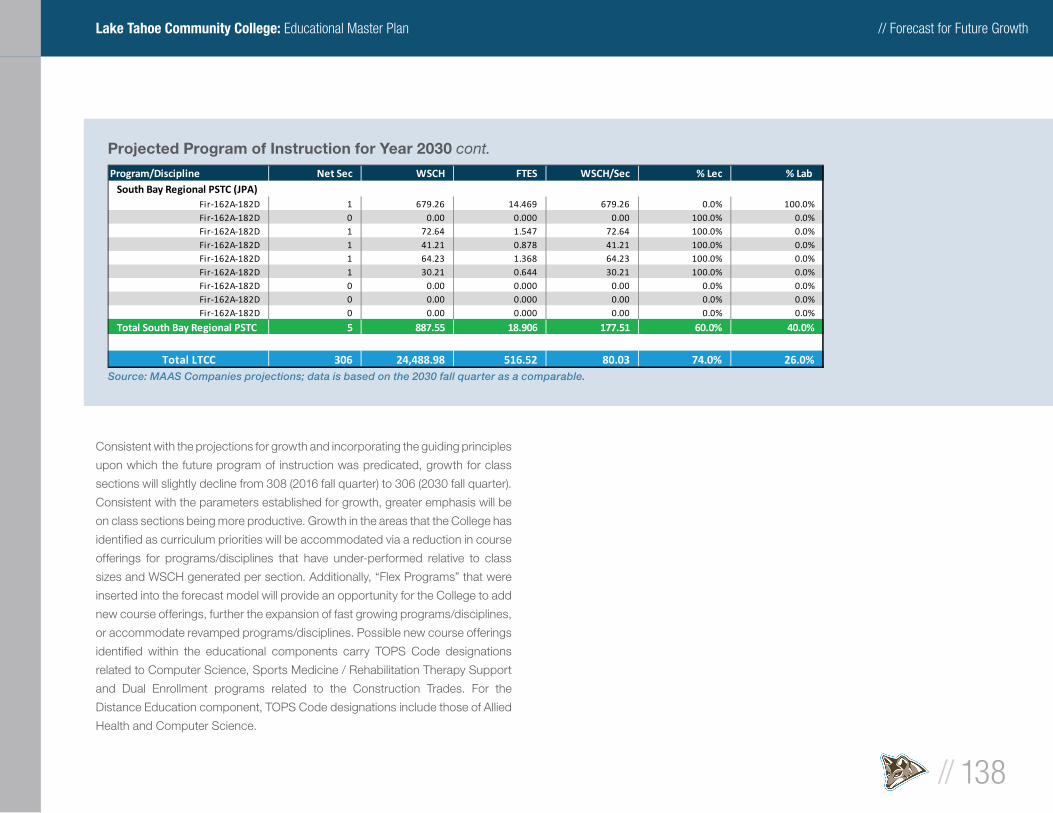
// Forecast for Future Growth
// 138
Lake Tahoe Community College: Educational Master Plan
Consistent with the projections for growth and incorporating the guiding principles
upon which the future program of instruction was predicated, growth for class
sections will slightly decline from 308 (2016 fall quarter) to 306 (2030 fall quarter).
Consistent with the parameters established for growth, greater emphasis will be
on class sections being more productive. Growth in the areas that the College has
identifi ed as curriculum priorities will be accommodated via a reduction in course
offerings for programs/disciplines that have under-performed relative to class
sizes and WSCH generated per section. Additionally, “Flex Programs” that were
inserted into the forecast model will provide an opportunity for the College to add
new course offerings, further the expansion of fast growing programs/disciplines,
or accommodate revamped programs/disciplines. Possible new course offerings
identifi ed within the educational components carry TOPS Code designations
related to Computer Science, Sports Medicine / Rehabilitation Therapy Support
and Dual Enrollment programs related to the Construction Trades. For the
Distance Education component, TOPS Code designations include those of Allied
Health and Computer Science.
Projected Program of Instruction for Year 2030 cont.
Source: MAAS Companies projections; data is based on the 2030 fall quarter as a comparable.
Program/Discipline Net Sec WSCH FTES WSCH/Sec % Lec % Lab South Bay Regional PSTC (JPA)
Fir-162A-182D 1 679.26 14.469 679.26 0.0% 100.0%Fir-162A-182D 0 0.00 0.000 0.00 100.0% 0.0%Fir-162A-182D 1 72.64 1.547 72.64 100.0% 0.0%Fir-162A-182D 1 41.21 0.878 41.21 100.0% 0.0%Fir-162A-182D 1 64.23 1.368 64.23 100.0% 0.0%Fir-162A-182D 1 30.21 0.644 30.21 100.0% 0.0%Fir-162A-182D 0 0.00 0.000 0.00 0.0% 0.0%Fir-162A-182D 0 0.00 0.000 0.00 0.0% 0.0%Fir-162A-182D 0 0.00 0.000 0.00 0.0% 0.0%
Total South Bay Regional PSTC 5 887.55 18.906 177.51 60.0% 40.0%
Total LTCC 306 24,488.98 516.52 80.03 74.0% 26.0%
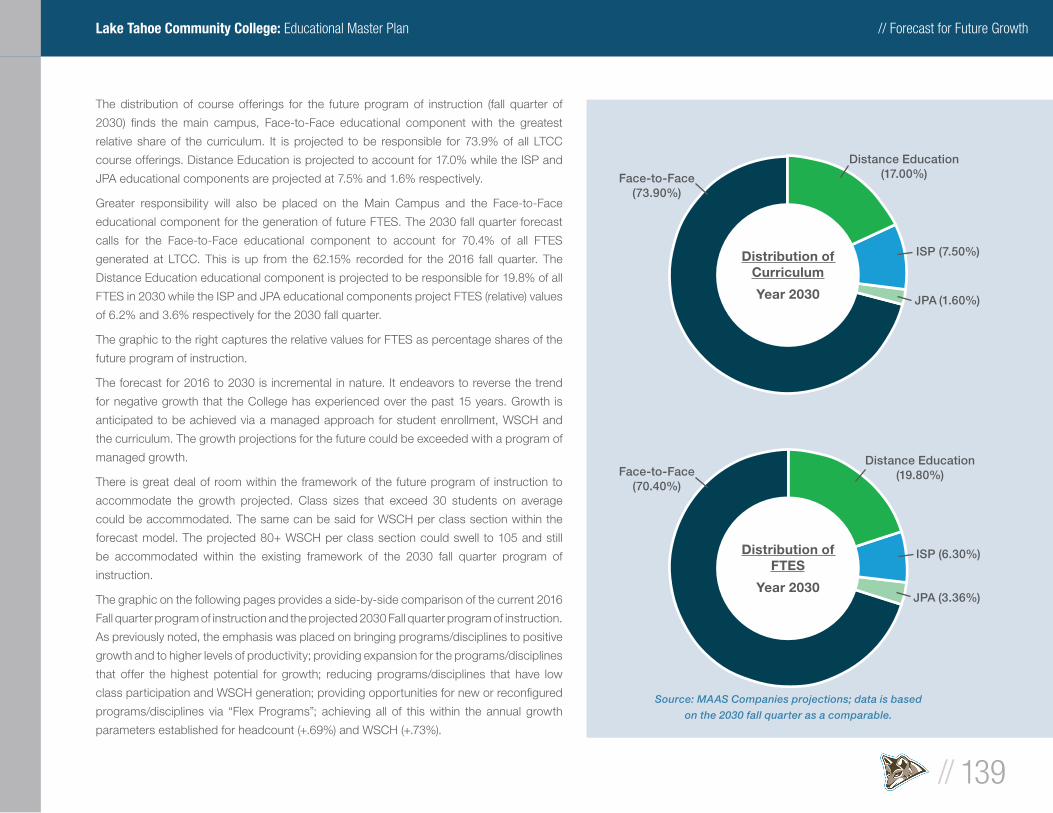
// Forecast for Future Growth
// 139
Lake Tahoe Community College: Educational Master Plan
The distribution of course offerings for the future program of instruction (fall quarter of
2030) fi nds the main campus, Face-to-Face educational component with the greatest
relative share of the curriculum. It is projected to be responsible for 73.9% of all LTCC
course offerings. Distance Education is projected to account for 17.0% while the ISP and
JPA educational components are projected at 7.5% and 1.6% respectively.
Greater responsibility will also be placed on the Main Campus and the Face-to-Face
educational component for the generation of future FTES. The 2030 fall quarter forecast
calls for the Face-to-Face educational component to account for 70.4% of all FTES
generated at LTCC. This is up from the 62.15% recorded for the 2016 fall quarter. The
Distance Education educational component is projected to be responsible for 19.8% of all
FTES in 2030 while the ISP and JPA educational components project FTES (relative) values
of 6.2% and 3.6% respectively for the 2030 fall quarter.
The graphic to the right captures the relative values for FTES as percentage shares of the
future program of instruction.
The forecast for 2016 to 2030 is incremental in nature. It endeavors to reverse the trend
for negative growth that the College has experienced over the past 15 years. Growth is
anticipated to be achieved via a managed approach for student enrollment, WSCH and
the curriculum. The growth projections for the future could be exceeded with a program of
managed growth.
There is great deal of room within the framework of the future program of instruction to
accommodate the growth projected. Class sizes that exceed 30 students on average
could be accommodated. The same can be said for WSCH per class section within the
forecast model. The projected 80+ WSCH per class section could swell to 105 and still
be accommodated within the existing framework of the 2030 fall quarter program of
instruction.
The graphic on the following pages provides a side-by-side comparison of the current 2016
Fall quarter program of instruction and the projected 2030 Fall quarter program of instruction.
As previously noted, the emphasis was placed on bringing programs/disciplines to positive
growth and to higher levels of productivity; providing expansion for the programs/disciplines
that offer the highest potential for growth; reducing programs/disciplines that have low
class participation and WSCH generation; providing opportunities for new or reconfi gured
programs/disciplines via “Flex Programs”; achieving all of this within the annual growth
parameters established for headcount (+.69%) and WSCH (+.73%).
Distribution of Curriculum
Year 2030
Face-to-Face(73.90%)
ISP (7.50%)
Distance Education(17.00%)
JPA (1.60%)
Distribution of FTES
Year 2030
Face-to-Face(70.40%)
ISP (6.30%)
Distance Education(19.80%)
JPA (3.36%)
Source: MAAS Companies projections; data is based
on the 2030 fall quarter as a comparable.
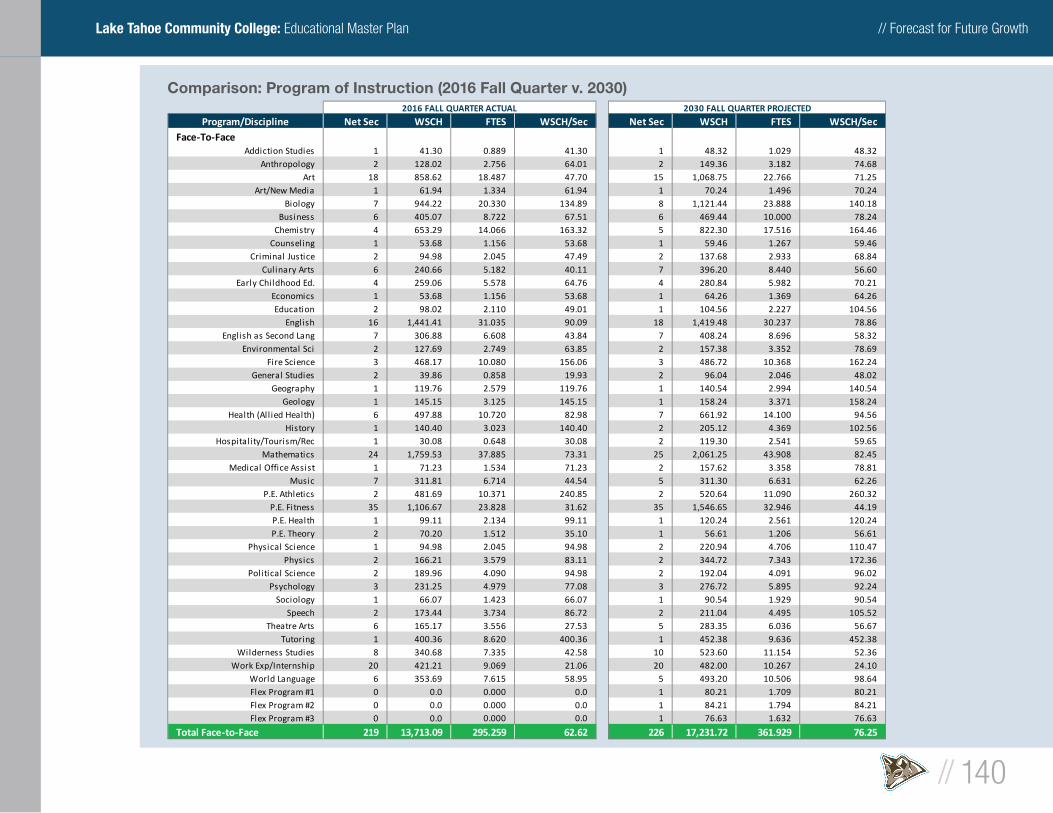
// Forecast for Future Growth
// 140
Lake Tahoe Community College: Educational Master Plan
Comparison: Program of Instruction (2016 Fall Quarter v. 2030)
Program/Discipline Net Sec WSCH FTES WSCH/Sec Net Sec WSCH FTES WSCH/SecFace-To-Face
Addiction Studies 1 41.30 0.889 41.30 1 48.32 1.029 48.32Anthropology 2 128.02 2.756 64.01 2 149.36 3.182 74.68
Art 18 858.62 18.487 47.70 15 1,068.75 22.766 71.25Art/New Media 1 61.94 1.334 61.94 1 70.24 1.496 70.24
Biology 7 944.22 20.330 134.89 8 1,121.44 23.888 140.18Business 6 405.07 8.722 67.51 6 469.44 10.000 78.24
Chemistry 4 653.29 14.066 163.32 5 822.30 17.516 164.46Counseling 1 53.68 1.156 53.68 1 59.46 1.267 59.46
Criminal Justice 2 94.98 2.045 47.49 2 137.68 2.933 68.84Culinary Arts 6 240.66 5.182 40.11 7 396.20 8.440 56.60
Early Childhood Ed. 4 259.06 5.578 64.76 4 280.84 5.982 70.21Economics 1 53.68 1.156 53.68 1 64.26 1.369 64.26Education 2 98.02 2.110 49.01 1 104.56 2.227 104.56
English 16 1,441.41 31.035 90.09 18 1,419.48 30.237 78.86English as Second Lang 7 306.88 6.608 43.84 7 408.24 8.696 58.32
Environmental Sci 2 127.69 2.749 63.85 2 157.38 3.352 78.69Fire Science 3 468.17 10.080 156.06 3 486.72 10.368 162.24
General Studies 2 39.86 0.858 19.93 2 96.04 2.046 48.02Geography 1 119.76 2.579 119.76 1 140.54 2.994 140.54
Geology 1 145.15 3.125 145.15 1 158.24 3.371 158.24Health (All ied Health) 6 497.88 10.720 82.98 7 661.92 14.100 94.56
History 1 140.40 3.023 140.40 2 205.12 4.369 102.56Hospitality/Tourism/Rec 1 30.08 0.648 30.08 2 119.30 2.541 59.65
Mathematics 24 1,759.53 37.885 73.31 25 2,061.25 43.908 82.45Medical Office Assist 1 71.23 1.534 71.23 2 157.62 3.358 78.81
Music 7 311.81 6.714 44.54 5 311.30 6.631 62.26P.E. Athletics 2 481.69 10.371 240.85 2 520.64 11.090 260.32
P.E. Fitness 35 1,106.67 23.828 31.62 35 1,546.65 32.946 44.19P.E. Health 1 99.11 2.134 99.11 1 120.24 2.561 120.24P.E. Theory 2 70.20 1.512 35.10 1 56.61 1.206 56.61
Physical Science 1 94.98 2.045 94.98 2 220.94 4.706 110.47Physics 2 166.21 3.579 83.11 2 344.72 7.343 172.36
Political Science 2 189.96 4.090 94.98 2 192.04 4.091 96.02Psychology 3 231.25 4.979 77.08 3 276.72 5.895 92.24
Sociology 1 66.07 1.423 66.07 1 90.54 1.929 90.54Speech 2 173.44 3.734 86.72 2 211.04 4.495 105.52
Theatre Arts 6 165.17 3.556 27.53 5 283.35 6.036 56.67Tutoring 1 400.36 8.620 400.36 1 452.38 9.636 452.38
Wilderness Studies 8 340.68 7.335 42.58 10 523.60 11.154 52.36Work Exp/Internship 20 421.21 9.069 21.06 20 482.00 10.267 24.10
World Language 6 353.69 7.615 58.95 5 493.20 10.506 98.64Flex Program #1 0 0.0 0.000 0.0 1 80.21 1.709 80.21Flex Program #2 0 0.0 0.000 0.0 1 84.21 1.794 84.21Flex Program #3 0 0.0 0.000 0.0 1 76.63 1.632 76.63
Total Face-to-Face 219 13,713.09 295.259 62.62 226 17,231.72 361.929 76.25
2016 FALL QUARTER ACTUAL 2030 FALL QUARTER PROJECTED
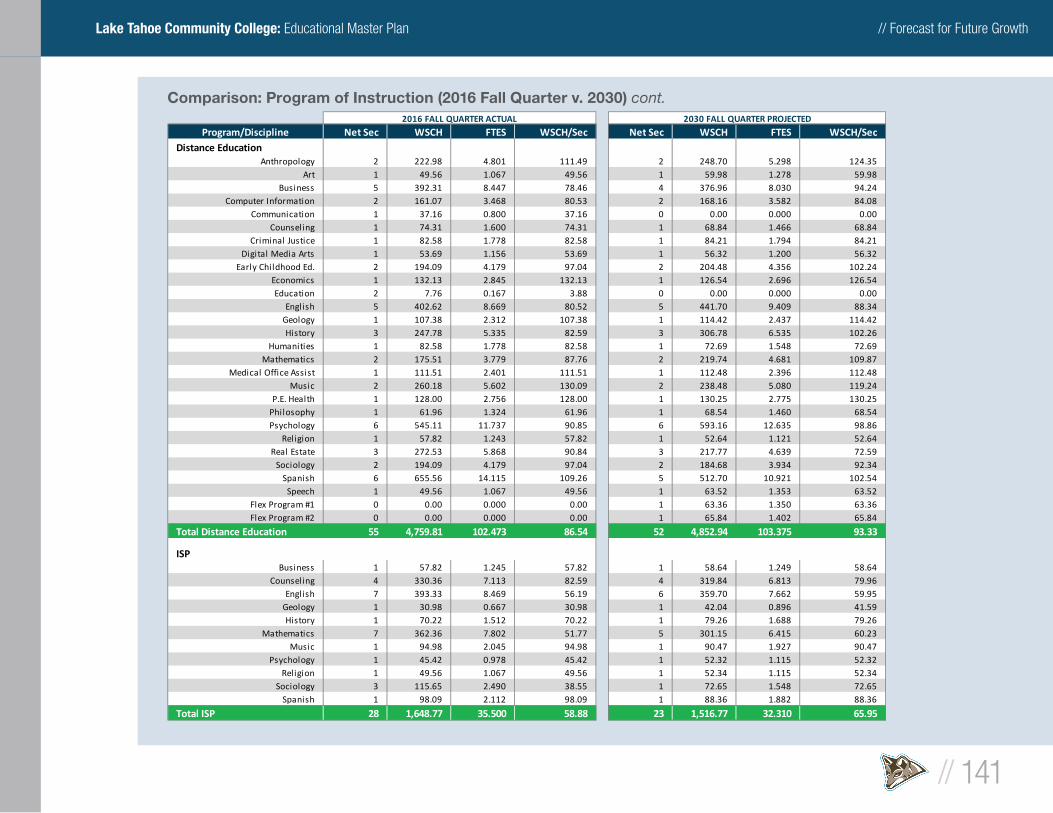
// Forecast for Future Growth
// 141
Lake Tahoe Community College: Educational Master Plan
Comparison: Program of Instruction (2016 Fall Quarter v. 2030) cont.
Program/Discipline Net Sec WSCH FTES WSCH/Sec Net Sec WSCH FTES WSCH/SecDistance Education
Anthropology 2 222.98 4.801 111.49 2 248.70 5.298 124.35Art 1 49.56 1.067 49.56 1 59.98 1.278 59.98
Business 5 392.31 8.447 78.46 4 376.96 8.030 94.24Computer Information 2 161.07 3.468 80.53 2 168.16 3.582 84.08
Communication 1 37.16 0.800 37.16 0 0.00 0.000 0.00Counseling 1 74.31 1.600 74.31 1 68.84 1.466 68.84
Criminal Justice 1 82.58 1.778 82.58 1 84.21 1.794 84.21Digital Media Arts 1 53.69 1.156 53.69 1 56.32 1.200 56.32
Early Childhood Ed. 2 194.09 4.179 97.04 2 204.48 4.356 102.24Economics 1 132.13 2.845 132.13 1 126.54 2.696 126.54Education 2 7.76 0.167 3.88 0 0.00 0.000 0.00
English 5 402.62 8.669 80.52 5 441.70 9.409 88.34Geology 1 107.38 2.312 107.38 1 114.42 2.437 114.42History 3 247.78 5.335 82.59 3 306.78 6.535 102.26
Humanities 1 82.58 1.778 82.58 1 72.69 1.548 72.69Mathematics 2 175.51 3.779 87.76 2 219.74 4.681 109.87
Medical Office Assist 1 111.51 2.401 111.51 1 112.48 2.396 112.48Music 2 260.18 5.602 130.09 2 238.48 5.080 119.24
P.E. Health 1 128.00 2.756 128.00 1 130.25 2.775 130.25Philosophy 1 61.96 1.324 61.96 1 68.54 1.460 68.54Psychology 6 545.11 11.737 90.85 6 593.16 12.635 98.86
Religion 1 57.82 1.243 57.82 1 52.64 1.121 52.64Real Estate 3 272.53 5.868 90.84 3 217.77 4.639 72.59
Sociology 2 194.09 4.179 97.04 2 184.68 3.934 92.34Spanish 6 655.56 14.115 109.26 5 512.70 10.921 102.54
Speech 1 49.56 1.067 49.56 1 63.52 1.353 63.52Flex Program #1 0 0.00 0.000 0.00 1 63.36 1.350 63.36Flex Program #2 0 0.00 0.000 0.00 1 65.84 1.402 65.84
Total Distance Education 55 4,759.81 102.473 86.54 52 4,852.94 103.375 93.33
ISPBusiness 1 57.82 1.245 57.82 1 58.64 1.249 58.64
Counseling 4 330.36 7.113 82.59 4 319.84 6.813 79.96English 7 393.33 8.469 56.19 6 359.70 7.662 59.95
Geology 1 30.98 0.667 30.98 1 42.04 0.896 41.59History 1 70.22 1.512 70.22 1 79.26 1.688 79.26
Mathematics 7 362.36 7.802 51.77 5 301.15 6.415 60.23Music 1 94.98 2.045 94.98 1 90.47 1.927 90.47
Psychology 1 45.42 0.978 45.42 1 52.32 1.115 52.32Religion 1 49.56 1.067 49.56 1 52.34 1.115 52.34
Sociology 3 115.65 2.490 38.55 1 72.65 1.548 72.65Spanish 1 98.09 2.112 98.09 1 88.36 1.882 88.36
Total ISP 28 1,648.77 35.500 58.88 23 1,516.77 32.310 65.95
2016 FALL QUARTER ACTUAL 2030 FALL QUARTER PROJECTED

// Forecast for Future Growth
// 142
Lake Tahoe Community College: Educational Master Plan
Comparison: Program of Instruction (2016 Fall Quarter v. 2030) cont.
Source: MAAS Companies projections; data is based on fall quarters from year 2016 to year 2030
Program/Discipline Net Sec WSCH FTES WSCH/Sec Net Sec WSCH FTES WSCH/SecSouth Bay Regional PSTC (JPA)
Fir-162A-182D 1 1,738.69 37.436 1,738.69 1 679.26 14.469 679.26
Fir-162A-182D 1 14.15 0.305 14.15 0 0.00 0.000 0.00
Fir-162A-182D 1 10.62 0.229 10.62 1 72.64 1.547 72.64
Fir-162A-182D 1 17.69 0.381 17.69 1 41.21 0.878 41.21
Fir-162A-182D 1 31.85 0.686 31.85 1 64.23 1.368 64.23
Fir-162A-182D 1 130.57 2.811 130.57 1 30.21 0.644 30.21
Fir-162A-182D 0 0.00 0.000 0.00 0 0.00 0.000 0.00
Fir-162A-182D 0 0.00 0.000 0.00 0 0.00 0.000 0.00
Fir-162A-182D 0 0.00 0.000 0.00 0 0.00 0.000 0.00
Total South Bay Regional PSTC 6 1,943.57 41.848 323.93 5 887.55 18.906 177.51
Total LTCC 308 22,065.24 475.08 71.64 306 24,488.98 516.52 80.03
2016 FALL QUARTER ACTUAL 2030 FALL QUARTER PROJECTED
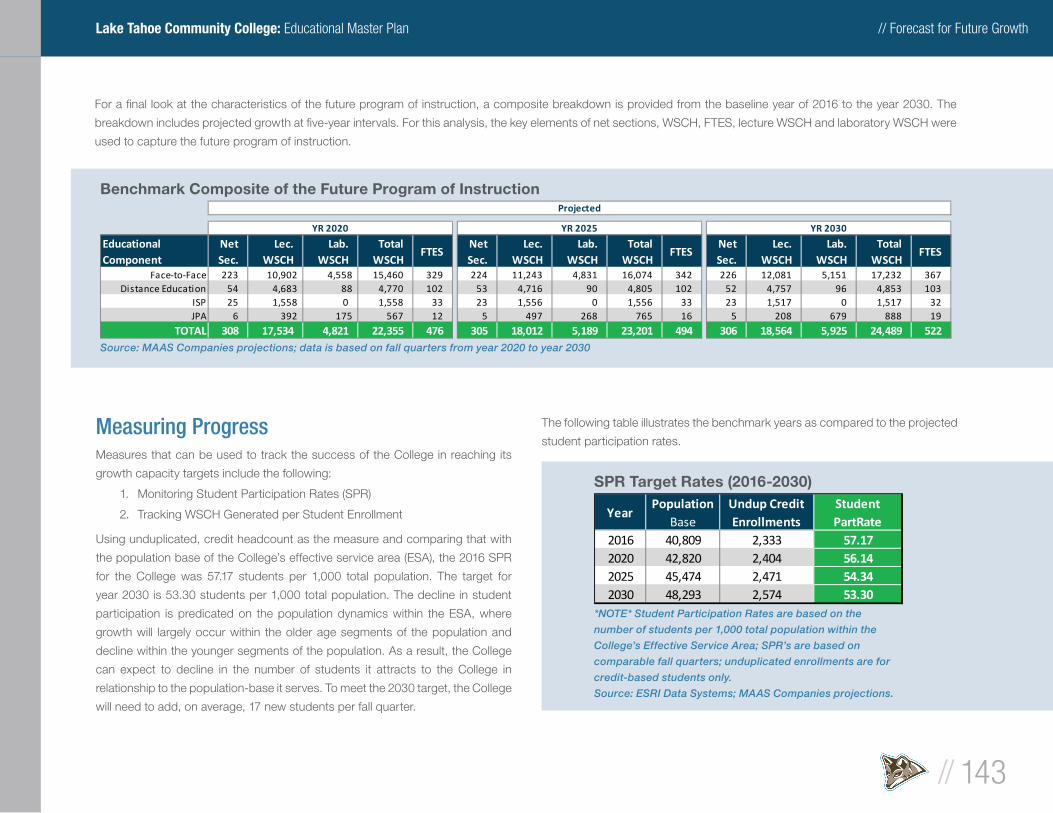
// Forecast for Future Growth
// 143
Lake Tahoe Community College: Educational Master Plan
For a fi nal look at the characteristics of the future program of instruction, a composite breakdown is provided from the baseline year of 2016 to the year 2030. The
breakdown includes projected growth at fi ve-year intervals. For this analysis, the key elements of net sections, WSCH, FTES, lecture WSCH and laboratory WSCH were
used to capture the future program of instruction.
Measuring ProgressMeasures that can be used to track the success of the College in reaching its
growth capacity targets include the following:
1. Monitoring Student Participation Rates (SPR)
2. Tracking WSCH Generated per Student Enrollment
Using unduplicated, credit headcount as the measure and comparing that with
the population base of the College’s effective service area (ESA), the 2016 SPR
for the College was 57.17 students per 1,000 total population. The target for
year 2030 is 53.30 students per 1,000 total population. The decline in student
participation is predicated on the population dynamics within the ESA, where
growth will largely occur within the older age segments of the population and
decline within the younger segments of the population. As a result, the College
can expect to decline in the number of students it attracts to the College in
relationship to the population-base it serves. To meet the 2030 target, the College
will need to add, on average, 17 new students per fall quarter.
The following table illustrates the benchmark years as compared to the projected
student participation rates.
SPR Target Rates (2016-2030)
*NOTE* Student Participation Rates are based on the
number of students per 1,000 total population within the
College’s Effective Service Area; SPR’s are based on
comparable fall quarters; unduplicated enrollments are for
credit-based students only.
Source: ESRI Data Systems; MAAS Companies projections.
YearPopulation
BaseUndup Credit Enrollments
Student PartRate
2016 40,809 2,333 57.172020 42,820 2,404 56.142025 45,474 2,471 54.342030 48,293 2,574 53.30
Benchmark Composite of the Future Program of Instruction
Source: MAAS Companies projections; data is based on fall quarters from year 2020 to year 2030
Educational Component
NetSec.
Lec.WSCH
Lab.WSCH
TotalWSCH
FTESNetSec.
Lec.WSCH
Lab.WSCH
TotalWSCH
FTESNetSec.
Lec.WSCH
Lab.WSCH
TotalWSCH
FTES
Face-to-Face 223 10,902 4,558 15,460 329 224 11,243 4,831 16,074 342 226 12,081 5,151 17,232 367Distance Education 54 4,683 88 4,770 102 53 4,716 90 4,805 102 52 4,757 96 4,853 103
ISP 25 1,558 0 1,558 33 23 1,556 0 1,556 33 23 1,517 0 1,517 32JPA 6 392 175 567 12 5 497 268 765 16 5 208 679 888 19
TOTAL 308 17,534 4,821 22,355 476 305 18,012 5,189 23,201 494 306 18,564 5,925 24,489 522
YR 2030YR 2025YR 2020
Projected
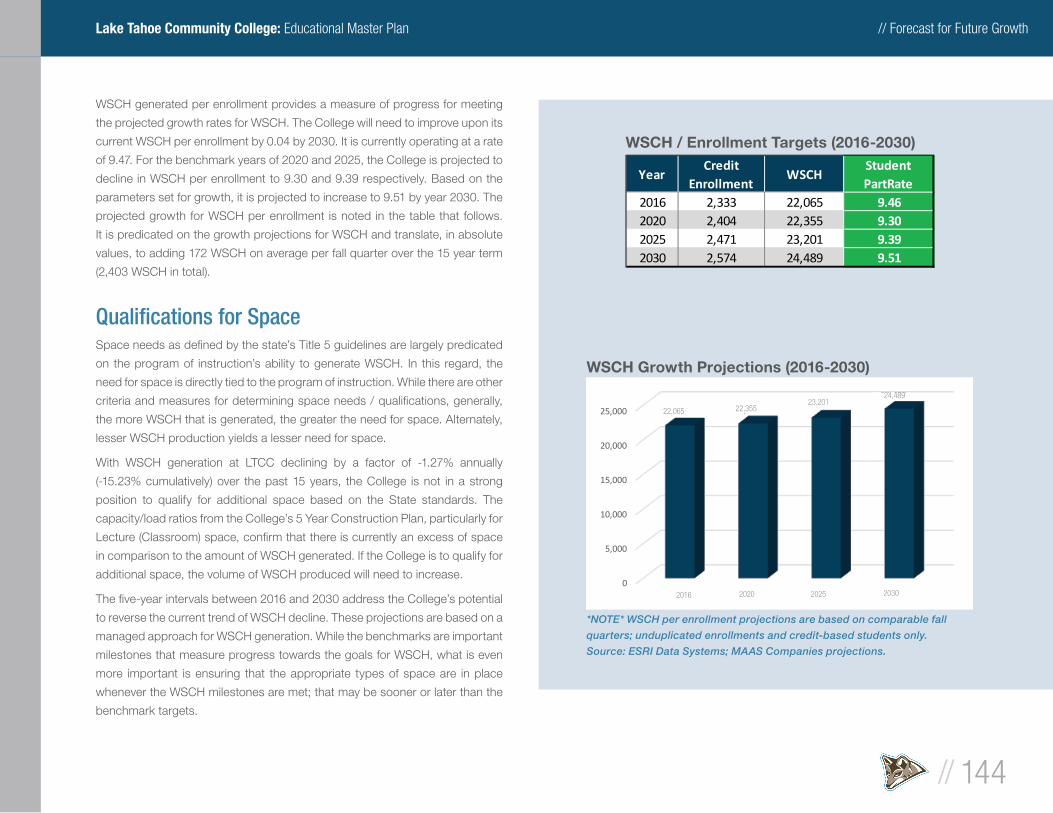
// Forecast for Future Growth
// 144
Lake Tahoe Community College: Educational Master Plan
YearCredit
EnrollmentWSCH
Student PartRate
2016 2,333 22,065 9.462020 2,404 22,355 9.302025 2,471 23,201 9.392030 2,574 24,489 9.51
WSCH Growth Projections (2016-2030)
0
5,000
10,000
15,000
20,000
25,000
2015 2020 2025 2030
22,085 22,35423,201
24,488
2016
24,489
22,35522,06523,201
2020 2025 2030
WSCH / Enrollment Targets (2016-2030)
*NOTE* WSCH per enrollment projections are based on comparable fall
quarters; unduplicated enrollments and credit-based students only.
Source: ESRI Data Systems; MAAS Companies projections.
WSCH generated per enrollment provides a measure of progress for meeting
the projected growth rates for WSCH. The College will need to improve upon its
current WSCH per enrollment by 0.04 by 2030. It is currently operating at a rate
of 9.47. For the benchmark years of 2020 and 2025, the College is projected to
decline in WSCH per enrollment to 9.30 and 9.39 respectively. Based on the
parameters set for growth, it is projected to increase to 9.51 by year 2030. The
projected growth for WSCH per enrollment is noted in the table that follows.
It is predicated on the growth projections for WSCH and translate, in absolute
values, to adding 172 WSCH on average per fall quarter over the 15 year term
(2,403 WSCH in total).
Qualifi cations for SpaceSpace needs as defi ned by the state’s Title 5 guidelines are largely predicated
on the program of instruction’s ability to generate WSCH. In this regard, the
need for space is directly tied to the program of instruction. While there are other
criteria and measures for determining space needs / qualifi cations, generally,
the more WSCH that is generated, the greater the need for space. Alternately,
lesser WSCH production yields a lesser need for space.
With WSCH generation at LTCC declining by a factor of -1.27% annually
(-15.23% cumulatively) over the past 15 years, the College is not in a strong
position to qualify for additional space based on the State standards. The
capacity/load ratios from the College’s 5 Year Construction Plan, particularly for
Lecture (Classroom) space, confi rm that there is currently an excess of space
in comparison to the amount of WSCH generated. If the College is to qualify for
additional space, the volume of WSCH produced will need to increase.
The fi ve-year intervals between 2016 and 2030 address the College’s potential
to reverse the current trend of WSCH decline. These projections are based on a
managed approach for WSCH generation. While the benchmarks are important
milestones that measure progress towards the goals for WSCH, what is even
more important is ensuring that the appropriate types of space are in place
whenever the WSCH milestones are met; that may be sooner or later than the
benchmark targets.
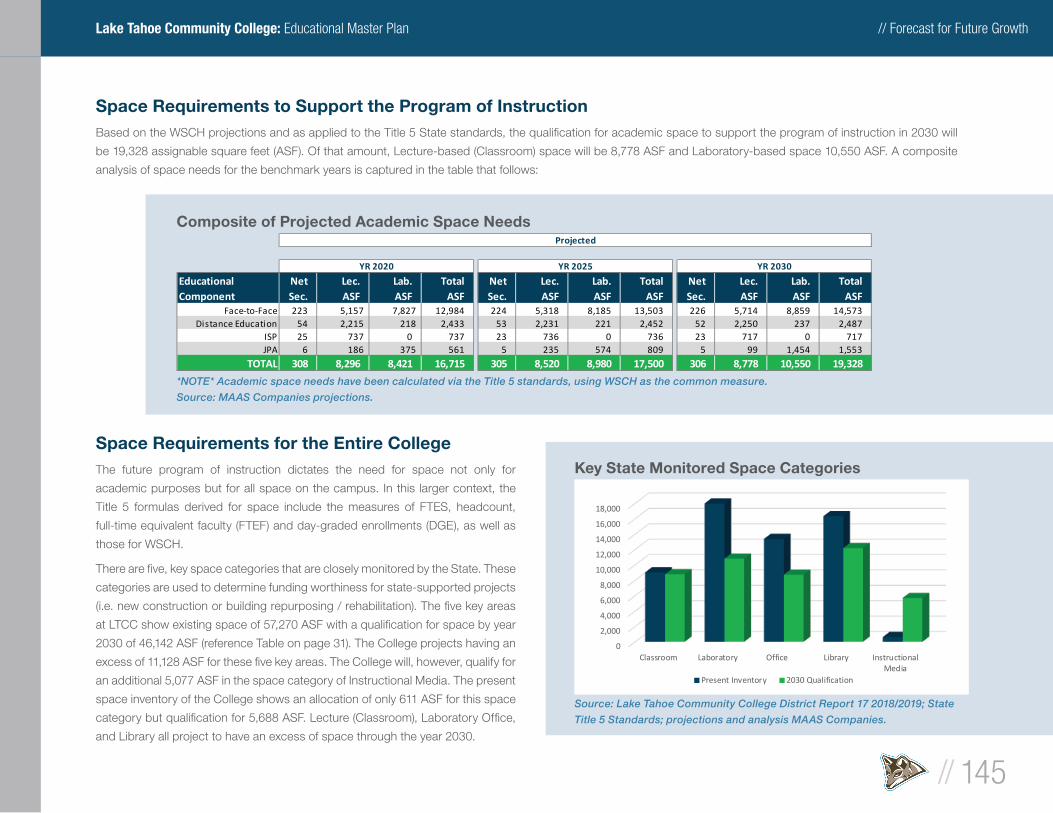
// Forecast for Future Growth
// 145
Lake Tahoe Community College: Educational Master Plan
Space Requirements to Support the Program of InstructionBased on the WSCH projections and as applied to the Title 5 State standards, the qualifi cation for academic space to support the program of instruction in 2030 will
be 19,328 assignable square feet (ASF). Of that amount, Lecture-based (Classroom) space will be 8,778 ASF and Laboratory-based space 10,550 ASF. A composite
analysis of space needs for the benchmark years is captured in the table that follows:
Composite of Projected Academic Space Needs
*NOTE* Academic space needs have been calculated via the Title 5 standards, using WSCH as the common measure.
Source: MAAS Companies projections.
Space Requirements for the Entire CollegeThe future program of instruction dictates the need for space not only for
academic purposes but for all space on the campus. In this larger context, the
Title 5 formulas derived for space include the measures of FTES, headcount,
full-time equivalent faculty (FTEF) and day-graded enrollments (DGE), as well as
those for WSCH.
There are fi ve, key space categories that are closely monitored by the State. These
categories are used to determine funding worthiness for state-supported projects
(i.e. new construction or building repurposing / rehabilitation). The fi ve key areas
at LTCC show existing space of 57,270 ASF with a qualifi cation for space by year
2030 of 46,142 ASF (reference Table on page 31). The College projects having an
excess of 11,128 ASF for these fi ve key areas. The College will, however, qualify for
an additional 5,077 ASF in the space category of Instructional Media. The present
space inventory of the College shows an allocation of only 611 ASF for this space
category but qualifi cation for 5,688 ASF. Lecture (Classroom), Laboratory Offi ce,
and Library all project to have an excess of space through the year 2030.
0
2,000
4,000
6,000
8,000
10,000
12,000
14,000
16,000
18,000
Classroom Laboratory Office Library InstructionalMedia
Present Inventory 2030 Qualification
Key State Monitored Space Categories
Source: Lake Tahoe Community College District Report 17 2018/2019; State
Title 5 Standards; projections and analysis MAAS Companies.
Educational Component
NetSec.
Lec.ASF
Lab.ASF
TotalASF
NetSec.
Lec.ASF
Lab.ASF
TotalASF
NetSec.
Lec.ASF
Lab.ASF
TotalASF
Face-to-Face 223 5,157 7,827 12,984 224 5,318 8,185 13,503 226 5,714 8,859 14,573Distance Education 54 2,215 218 2,433 53 2,231 221 2,452 52 2,250 237 2,487
ISP 25 737 0 737 23 736 0 736 23 717 0 717JPA 6 186 375 561 5 235 574 809 5 99 1,454 1,553
TOTAL 308 8,296 8,421 16,715 305 8,520 8,980 17,500 306 8,778 10,550 19,328
Projected
YR 2020 YR 2025 YR 2030

// Forecast for Future Growth
// 146
Lake Tahoe Community College: Educational Master Plan
Space, under the Title 5 guidelines also includes
fourteen non-state monitored spaces that are integral to
providing students with a “complete campus.” The table
that follows depicts the College’s qualifi cation for space
for 2030 via the State Title 5 standards for both the key
space categories monitored by the state and those that
are non-state monitored.
The non-state monitored space categories show a
current space inventory of 51,394 ASF with a “qualifying
allowance” of 35,515 ASF by 2030. This represents a
delta of plus 15,879 ASF of space excess (reference
Table on page 31). Within the individual space categories,
there will be allowances for Physical Education (678
ASF), Data Processing / Computer Services (642 ASF)
and Student Health Services (1,200 ASF). Combined,
the College will qualify for an additional 2,520 ASF of
non-state monitored space.
LTCC’s current space inventory of 108,664 ASF and the
space qualifi cations for 81,657 ASF suggest that the
College will have suffi cient space to meet the academic
and support services needs into the year 2030. As
previously noted, the projections for space are based
on the forecasted growth for headcount and WSCH and
program of instruction that supports that growth. The
qualifi cation for future space will be directly tied to the
College’s ability to meet or exceed these projections.
Total Space Needs via Title 5 Standards
*NOTE* All space needs have been calculated via the Title 5 standards, using WSCH, headcount, FTES,
Day graded Enrollments and FTEF as the common measures.
Source: Lake Tahoe Community College District Report 17 2018/2019; State Title 5 Standards; analysis,
MAAS Companies.
Category DescriptionCurrentSpace
2030 SpaceTitle V Allow
Difference Qualificationfor Space 2030
100 Classroom 9,017 8,778 (239) 0210-230 Laboratory 16,794 10,550 (6,244) 0235-255 Non Class Laboratory 1,173 245 (928) 0
300 Office/Conference 13,361 8,707 (4,654) 0400 Library 16,314 12,175 (4,139) 0
530-535 Instructional Media 611 5,688 5,077 5,07757,270 46,142 (11,128) 5,077
Category DescriptionCurrentSpace
2030 SpaceTitle V Allow
Difference Qualificationfor Space 2030
0 Inactive 2,629 0 (2,629) 0510-515 Armory/Armory Service - 0 0 0520-525 Phys Ed (Indoor) 19,322 20,000 678 678540-555 Clinic/Demonstration 2,587 1,030 (1,557) 0
580 Greenhouse - 0 0 0590 Other - 0 0 0
610-625 Assembly/Exhibition 9,186 2,574 (6,612) 0630-635 Food Service 2,955 1,544 (1,411) 0650-655 Lounge/Lounge Service 713 346 (367) 0660-665 Merchandizing 3,569 3,225 (344) 0670-690 Meeting /Recreation 3,240 857 (2,383) 0710-715 Data Processing/Comp 208 850 642 642720-770 Physical Plant 6,985 3,888 (3,097) 0
800 Health Services - 1,200 1,200 1,20051,394 35,515 (15,879) 2,520
67,708 47,689 (27,007) 7,597
Key Space Categories Monitored by the State
sub total
Non-State Monitored Space Categories
sub total
TOTAL
// Summary Observations
// 147
Lake Tahoe Community College: Educational Master Plan
Observations & SuggestionsThe following observations / suggestions are offered for this component of the
Educational Master Plan. These themes will help guide planning at LTCC moving
forward. These observations and suggestions have been organized in alignment
with the seven core commitments as outlined by the Chancellor’s Offi ce in the
document “A Vision for Success.”
“A Vision for Success” was created by Chancellor Eloy Ortiz Oakley in partnership
with the Foundation for California Community Colleges. Through virtual town hall
meetings, it was clear that community colleges are invaluable to the state and
higher education. The supporters of community colleges clearly communicated
the need to improve the opportunities for those who seek them. The California
Community College system, including LTCC, is educating our future workforce,
citizens, and leaders.
“A Vision for Success” set six ambitious goals for community colleges to achieve
over the next ten years. These goals have been much discussed and debated
and will certainly continue to evolve. While the specifi c target numbers might
require reassessment and the actions taken to achieve these goals are proving
controversial, the core values behind the goals appear legitimately in alignment
with the enrollment management and student success efforts at LTCC. The six
goals for the system currently are:
• Increase by at least 20 percent the number of CCC students annually who
acquire associates degrees, credentials, certifi cates, or specifi c skill sets
that prepare them for an in-demand job.
• Increase by 35 percent the number of CCC students transferring annually
to a UC or CSU.
• Decrease the average number of units accumulated by CCC students
earning associate’s degrees, from approximately 87 total units to 79 units.
• Increase the percent of exiting CTE students who report being employed in
their fi eld of study, from the most recent statewide average of 60 percent to
an improved rate of 69 percent.
• Reduce equity gaps across all the above measures through faster
improvements among traditionally underrepresented student groups, with
the goal of cutting achievement gaps by 40 percent within 5 years and fully
closing the achievement gaps within 10 years.
• Reduce regional achievement gaps across all the above measures through
faster improvements among colleges located in regions with the lowest
educational attainment of adults, with the goal of fully closing regional
achievement gaps within 10 years.
“A Vision for Success” goes on to outline seven (7) “core commitments” to which
LTCC has aligned the results of the research conducted for this EMP.
Focus Relentlessly on Students' End Goals:
Guided Pathways: Interated Student Support and Instruction to Provide Clear and Effi cient Pathways for Success and Completion:
Clearly articulating the requirements to earn a certifi cate, degree, or transfer-
related outcome and ensuring a viable schedule for on-time completion are
essential to improving student success. This will require curricular design and
revision and enhanced technology to support student planning and data-
informed scheduling. These pathways must meet the needs of LTCC students
including options for part-time, online, and evening enrollment. Clear and
dependable pathways that lead employment opportunities or further education
opportunities will help our current and future students meet their goals.
Summary Observations and Recommendations
// Summary Observations
// 148
Lake Tahoe Community College: Educational Master Plan
Actions to Consider:
§ Obtain the data necessary to implement guided pathways, including student
preferences and success data for disproportionately impacted student
groups.
§ Student success must be the focus when designing curriculum, scheduling
courses, and providing support services.
§ Successful implementation will help to more students achieving the goals and is
possible through the use of data and thoughtful action.
Embrace Innovation and Evidence-Based Strategies to Recruit and Support Students with a Focus on Achieving Their Goals:
The College has been successful in encouraging students to take greater class
loads, with steady improvement from 2005 to 2016. Greater class loads will
help students achieve their goals in a timelier manner. Along with the proper
planning and support, students will earn their degree or certifi cate in less time
allowing them to transfer to a four-year school or enter the workforce to begin or
continue their career. With a declining trend for growth of the younger population
segments in the ESA, the value of students taking greater class loads will carry
an even greater importance for the operation of the college.
Actions to Consider:
• As part of the assessment and counseling processes, help students establish
a comprehensive education plan to complete their educational goals within
a certain time. The comprehensive education plan is essential to ensure that
the courses students are taking count towards their degree or certifi cate, and
students are not accumulating credits that do not help them achieve their
goals.
• Ensure that proper support is available to those who need it to achieve
ambitious goals.
• Encourage students to take more than one class at a time by emphasizing the
value of attaining their educational goals sooner rather than later.
• The vision for Dual Enrollment with South Tahoe High School includes the
development of an “Early Launch” program leading to a 4+1 model, helping
high school students complete their AA in just one more year after high school.
• These goals also suggest the development of General Education Certifi cates
that will help students complete their transfer preparation with the goal of
achieving a certifi cate that will support them not only in transfer but in seeking
employment.
Creating Access to Education:
Over the past 10 years, federal and state legislation has been enacted to
help community colleges expand their reach to provide education to as many
students as possible. Initiatives to reduce gaps in access and achievement have
targeted many underrepresented populations, including fi rst generation, low-
income, racial and ethnic minorities, and foster youth among others. Many of the
initiatives are focused on existing students, so that they can succeed in attaining
their educational objectives. Currently, there are several state sponsored
opportunities (e.g. Dual Enrollment Program) to partner with local education
institutions or business and industry to improve the College’s capacity to attract
and retain new students.
Actions to Consider:
• State legislation (sponsored by the State Chancellor’s Offi ce) has opened-
up new possibilities for community colleges to provide increased support
to students. More support is now available to reduce equity and regional
achievement gaps by targeting fi rst-generation, postsecondary students
through state-approved programs and local partnerships (e.g. Dual
Enrollment Program, Open Education Resource and Zero Textbook Cost
Degree programs, etc.).
• The College should continue to stand ready to take advantage of these
opportunities to help more students earn certifi cates and degrees, transfer to
four-year colleges, and enter the workforce.
// Summary Observations
// 149
Lake Tahoe Community College: Educational Master Plan
Always Design and Decide with the Student in Mind:
Continue to Commit to a “Students First” Approach:
Decision making with students in mind is imperative at LTCC. The Vision, Mission,
and Beliefs describe California’s premiere destination community college, where
students come fi rst and educational goals are achieved through quality instruction
and student support. During the 2017-18 budget development process, for
example, it was noticed that students were not mentioned in the Resource Allocation
Guiding Principles. The document was updated to include “Consider impact to
students in all aspects of fi nancial planning and budgeting” as the fi rst of the principles.
Actions to Consider:
§ As the institutional planning processes and procedures are updated, include
consideration of students in all aspects of planning.
§ All actions should consider students and support their achieving their
educational goals.
§ Scheduling and enrollment management should be data-informed, including
information regarding students’ educational goals (student planning
possibilities) as well as degree audits of where students are in the process
and where and why they might be getting stuck.
Redesigning Assessment and Placement to meet the Requirements of AB 705:
Assessment and placement of new students into math and English courses will
change as AB 705 is implemented. AB 705 requires community college districts
to maximize the probability that a student will enter and complete transfer-
level coursework in math and English within a one-year timeframe by utilizing
assessment measures that include high school performance to achieve this goal.
The goal of AB 705 is to ensure that students are not placed into remedial courses
that may delay or deter their educational progress unless evidence suggests
they are highly unlikely to succeed in the college-level course. This will very likely
reduce the number of remedial math and English courses in the schedule but
require additional innovations in curriculum and student support services.
Actions to Consider:
• Re-design assessment practices to meet the requirements of AB 705 and
increase the number of student placed in and completing transfer-level
English and mathematics.
• Investigate best practices to provide support to students to ensure success
in these courses. Best practices may include a concurrent support course,
embedded tutoring, or noncredit support options, which overlaps with core
commitment #3.
Pair High Expectations with High Support:
Strengthen the Support Systems to Help Students Navigate the Application, Admission, and Initial Enrollment Process:
The Guidance and Planning for Success (GPS) process at the College provides
a comprehensive system to help admitted students through assessment,
orientation, and educational planning. Looking for ways to expand and
enhance these services to actively connect with potential students and
provide continued support into the initial term of enrollment and beyond
will facilitate better student engagement and success. This should include
work that is currently being done to strengthen the connection to the high
school and further growth of online alternatives to these onboarding activities.
Actions to Consider:
• Look for ways to improve current outreach efforts at South Tahoe High
School and provide similar activities at George Whittell High School in
Nevada.
• Additionally, consider the development of a summer bridge program to help
keep students active between the end of their senior year in high school and
the beginning of their enrollment at the college.
// Summary Observations
// 150
Lake Tahoe Community College: Educational Master Plan
• This could potentially include work that is already being done in the Basic
Skills Boot Camps, enrollment in College Success (COU 100), and activities
related to the Get Focused…Stay Focused!® program currently offered
through dual enrollment at the high school.
Empower Students to Progress Through Their Chosen Path and Proactively Encourage Their Successful Completion of Their Educational Goal(s):
One barrier that many students face is uncertainty regarding where they
are in their program of study and what it will take to fi nish. While counseling
appointments and educational plans are available, many students don't have
the time or don't know to ask. An online, self-service degree planning option can
allow students to make informed decisions about registration in the current term
as well as through the rest of their academic career at LTCC. This would also
allow for more proactive interventions from student services faculty and staff as
well as a course schedule that can be built to meet the needs of the students.
Actions to Consider:
• The ongoing work of implementing Degree Audit and Student Self-Service
should be a high priority for the college.
• Investing time, energy, and resources in this effort will have lasting benefi ts
for the college and more importantly for the students.
Foster the Use of Data, Inquiry, and Evidence:
Improve the Curricular Effi ciency of Distance Education:
Distance Education is presently responsible for producing almost 20% of all FTES
at LTCC. For the 2015 fall quarter, Distance Education courses recorded 19.7
enrolled seats per section. For the 2016 fall quarter, enrolled seats per section
improved to 21.2. For the future, on-line courses at the College should target 30 or
more students per class section. There are great possibilities for Distance Education
but also room for substantial growth within the present structure that exists.
Actions to Consider:
• A managed approach that focuses on the relationship between class
sections and enrolled seats per section is needed for the delivery of the
Distance Education component. Enrolled seat per class section should
have target minimums and correlate with the curricular offerings of the Main
Campus.
• To facilitate and promote greater use of the Distance Education component,
in-service training for faculty and staff should be provided regularly, both in
terms of onboarding new instructors and supporting current instructors with
professional development opportunities.
• Additionally, the College should consider carefully what kind of balance is
needed in online versus face-to-face offerings for sustainability and, above
all, to support students in the completion of their goals.
Develop Curricular Effi ciency for the ISP Educational Component:
The Incarcerated Student Program presently accounts for 7.47% of the FTES
produced at LTCC. For the future, it will need to continue to be monitored for
curricular effi ciency. Currently, the program average for enrolled seats per
class section is 14.2. Some of the programs / disciplines that have multiple
class sections offered are averaging fewer than 10 students per class section.
Actions to Consider:
• While this educational component is unique, and the challenges (i.e.
delivering a program of instruction to an incarcerated population) are many,
curricular standards and guidelines for its operation should be in alignment
with other educational components of the College.
• These should include weighing the cost-to-benefi t relationship for
instructional delivery and having target minimums for enrolled seats per
class section as well as WSCH generated per class section.
// Summary Observations
// 151
Lake Tahoe Community College: Educational Master Plan
Improve WSCH Generation / FTES Production:
Low values for WSCH and FTES have resulted in a limited ability for the
College to qualify for space and for state funding support. Space expansion/
improvement and state funding support would allow LTCC to provide
new or upgraded classrooms, additional services, and new technology
for students to use in their education. A proactive plan for addressing
this condition will be required as the College moves into the future.
Actions to Consider:
• Develop an implementable plan for WSCH and FTES generation that is
monitored, evaluated, and adjusted each quarter.
• Make WSCH / FTES production the core foundation of a College-wide
enrollment management plan.
Utilize Resources in an Effective and Sustainable Way:
While lecture and laboratory hours currently maintain a satisfactory balance,
lecture hours (as an instructional delivery choice) increased and laboratory hours
decreased from the 2015 fall quarter to 2016 fall quarter. The Title 5 standards for
space qualifi cation favors Laboratory space over Lecture space by a margin of at
least 3 to 1 (in some cases, 5 to 1 or greater). A continued trend for increases in
lecture hours and decreases in laboratory hours will have a negative impact on
the academic space allowances going forward.
Actions to Consider:
• Revisit the Departments of Allied Health, Business, Hospitality / Tourism /
Recreation, Mathematics, Medical Offi ce Assistance, English, and Physical
Science to see where there might be opportunities to apportion some of the
teaching hours from lecture to laboratory-based instruction.
“Space Qualifi cation” Versus “Space Adequacy”:
Because space needs are interpreted via the Title 5 State guidelines, there is
a tendency to use the guidelines as the bottom-line, absolute value relative to
the need for space. The “adequacy of the space” that supports the College,
however, is an equally important consideration. While the cumulative amount
of space may refl ect an appropriate “capacity” based on WSCH production,
its usefulness, or lack thereof, may fall short of the actual need for the
College. Accommodating growth for the future will involve “adequacy” as
much as it will involve “qualifi cation.” It may come in the way of replacement,
repurposing or reconfi guring existing buildings. The fi nal measure, however,
should be the “adequacy” of space to support the delivery of the program
of instruction and meet the needs of services that support students.
Actions to Consider:
• Assess and address the defi ciencies of facilities from a functional
perspective.
• In addition to the Title 5 qualifi cations for space, determine space
“adequacy” to meet the needs of the students served.
Capitalize on Space Allowance Opportunities:
Based on the information provided, the current allocations for academic space
will be adequate to support an unduplicated, credit-based student population of
2,574 that generates 24,488 WCSH for a given quarter. There will be, however,
space allowances of over 5,000 ASF in the Instructional Media space category.
Actions to Consider:
• Consistent with the observations previously provided regarding increasing
the use of Distance Education as an instructional modality, the College
should consider the creation of a Media and Learning / Training Center to
support faculty in the delivery of the curriculum.
• This action should also be supplemented with a strong program of
professional development for faculty members, particularly around
technology-enhanced instruction.
// Summary Observations
// 152
Lake Tahoe Community College: Educational Master Plan
Confi rmation of the Existing Space Inventory:
Data gathered from the College’s projected space allowances (i.e. Total space
needs for Lake Tahoe Community College via Title 5 Standards) indicates
signifi cant imbalances between the existing space inventory and the potential
for space allowances for the future. The space allowances projected for the
Educational Master Plan relied on the accuracy of the documents (Report 17)
fi led by the District with the State Chancellor’s Offi ce. Report 17 is a critical
document in determining space allowances and should be closely monitored
on an annual basis to ensure space is accurately coded and recorded.
Actions to Consider:
• Conduct a space inventory audit by an outside consulting fi rm to verify /
validate the accuracy of the current space inventory.
• Re-code rooms, where possible and, within the guidelines for Report 17,
refl ect the College in the best possible light for space allowances.
• Revisit the Educational Master Plan to amend any changes that may be
uncovered as a result of the verifi cation / validation process.
Take Ownership of Goals and Performances:
Promote Responsible and Forward-Thinking Program Enhancement and Expansion:
Continue the direction that characterized the 2016 fall quarter relative to
increased effi ciency of the program of instruction. Curricular effi ciency
should be an ongoing goal for the future.
Actions to Consider:
• Develop and implement a plan to closely monitor the number of class
sections offered, the amount of WSCH generated per section and the
enrolled seats per section.
• Expansion or contraction of a given program / discipline should occur only after the
effi ciency values have been reviewed and considered.
• Measures should be created based on established guidelines adopted by the College.
Implement Structures for Continuous Assessment of Student Learning at the Program and Institution Levels and Measure Student Success After Leaving the College:
Recent improvements in course-level student learning outcomes assessment (SLO)
practices and the pending implementation of eLumen provide a framework for indirect
assessment of broader educational effectiveness. However, LTCC will need to look for
ways to provide more direct assessment of student learning within academic programs
(PLOs), outside of the classroom (SAOs), and throughout their curricular and co-curricular
experiences at the college (ILOs). This should include improvements in the way that
post-matriculation outcomes (employment, promotion, transfer, etc.) are assessed to
demonstrate that students’ goals are being met.
Actions to Consider:
• Identify faculty willing to participate in pilot projects to directly assess PLOs, either
through a portfolio project or identifi cation of a capstone course/assignment. This
could also include a high-level general education course that might provide a direct
assessment of an ILO.
• Additionally, the Career Technical Education Outcomes Survey (CTEOS) provides good
data on alumni who enrolled in CTE related coursework, but a broader alumni survey
could potentially provide more information.
Outreach and Access to Grow the Student Population:
Because of its geographic location, the College will need to maximize its efforts to draw
students from its existing population base and, even more importantly, to retain the
students who attend LTCC. College goals that target reduction of regional and equity
achievement gaps require LTCC to provide access to all populations in the area. Providing
// Summary Observations
// 153
Lake Tahoe Community College: Educational Master Plan
quality instruction and support services will be essential to attracting new
students and retaining current students.
Actions to Consider:
• Conduct periodic reviews and closely monitor the demographics of the
effective service area of the College.
• Develop strategies to maximize the outreach and access to the College
service area and beyond.
Enable Action and Thoughtful Innovation:
More Full Time Students:
As part of its strategy for growth, the College might wish to accelerate the
idea of creating affordable student housing on campus. Students who avail
themselves of student housing should be required to carry and maintain a
12-credit load to be eligible. International students offer a similar possibility
for new growth.
Actions to Consider:
• Create a strategy to pursue students who are most likely to take full-time
course loads.
• These might include students who would live in on-campus housing,
student athletes, international students, and transfer education students.
The College can expect that there will be no one course of action to
take in meeting the projected growth for student enrollment, WSCH, the
future program of instruction and the corresponding needs for space.
The approach will be a multifaceted effort with many smaller components
contributing to a plan of action that leads to a successful outcome. It will
take a great deal of work by many to direct the College to a place of growth
and expansion. The College will need to set its sights on looking in a forward
direction.
Refl ect the Uniqueness of the College’s Environment through the Program of Instruction:
Encourage and support instructional programs that refl ect and support the uniqueness
of the Lake Tahoe Area. Capitalize on the uniqueness by taking a refreshed look at the
Career / Technical Educational programs offered at the College. The college should
maximize educational offerings that will lead to employment opportunities in the area.
Actions to Consider:
• The Wilderness Studies Program is an example of an instructional program that
capitalizes on the uniqueness of the College’s service area. It should be considered
for expansion.
• With an aging population projected for the LTCC service area (the greatest relative
growth for the Lake Tahoe Area will be in the age groups 55 years and older), the
College should endeavor to investigate programs associated with Allied Health /
Health Careers.
• Based on the College’s locale and the health care industries present in the Lake
Tahoe Area, programs in Sports Medicine and the Rehabilitation Therapies represent
opportunities for the College.
• Additionally, consideration should be given to the career opportunities that exist in
the Trade Industries, as identifi ed in the External Environmental Scan. Degrees or
certifi cates for the above-mentioned programs should be part of the conversation.
Encourage Growth of the Public Safety Educational Component:
LTCC is in an exceptional position to provide public safety training on a regional basis,
particularly if it can successfully build an on-campus, public safety facility (as noted
in the LTCC Facilities Master Plan). Public Safety has the potential to become and
even more high-profi le program on the campus (beyond, even the highly successful
signature Lake Tahoe Basin Fire Academy). Projecting the future program of instruction
is diffi cult, given the uncertainty of state funding for this facility. The College has
// Summary Observations
// 154
Lake Tahoe Community College: Educational Master Plan
created partnerships with the South Bay Regional Public Safety Consortium,
the California Department of Corrections and Rehabilitation, and a number of
other public safety groups, including a variety of fi re agencies and the Industrial
Emergency Council. These partnerships, both local and regional, offer unique
opportunities and possibilities, particularly in combination with an on-campus
public safety training center.
Actions to Consider:
• The opportunity to become a regional hub for public safety training should be
pursued as a high priority.
• The future program of instruction will be dictated by demand and available
facilities.
• The public safety educational component has the potential to generate a set
of signature programs for the College.
Lead the Work of Partnering Across Systems:
Partners in Education:
The College will need to maintain strong working relationships with local high
schools to ensure that graduating students are given the best opportunity to
avail themselves of the educational opportunities provided by the College.
Strong partnerships will provide local high school students pathways from dual
enrollment to higher education at LTCC and the opportunity to transfer to a four-
year college or to enter the work force with the skills to be successful.
Actions to Consider:
• Maintain communication with the area high schools that support the College,
primarily STHS but other schools in the basin where appropriate.
• Regular meetings with high school staff and faculty may offer the opportunity for
increased communication and collaboration regarding existing and future services
the college can provide to current high school students.
CTE Relevance:
Career and Technical Education should be reviewed for content and relevance. Some
programs will need to be revamped, repurposed, or released. There will also be
opportunities for new programs to emerge that may have more direct pathways to
employment. There is great need to provide students with “now” opportunities.
Actions to Consider:
• Work with area resources in Business and Industry (including through the
partnership with the Lake Tahoe Adult Education Consortium) to reassess the
current program for Career / Technical Education, including culinary and hospitality,
among others.
• Revise the curriculum to create a more direct connection for pathways to existing
employment opportunities.
• Capitalize on funding from the Chancellor’s offi ce and other sources to expand
opportunities and meet the needs of the students and local business and industry,
including pre-apprenticeship and apprenticeship opportunities.
// Summary Observations
// 155
Lake Tahoe Community College: Educational Master Plan
- Karen Borges - Kerry David - Michelle Sweeney
- Nancy Dalton - Jeff Cowen - Morgan Montoya (Student Trustee)
The consulting team would like to thank the all the individuals representing
the different segments of the college community at Lake Tahoe
Community College who assisted and contributed in the development
of the 2017 Educational Master Plan including the following:
Acknowledgments
- Jeff DeFranco
Superintendent/President
- Lisa Shafer
Exec. Asst. to the Supt./President
- Michelle Risdon
V.P. Academic Affairs
- Russi Egan
V.P. Administrative Services
- Tracy Thomas
Exec. Dean Student Success
- Michelle Sower
Dean of Instruction
- Brad Deeds
Dean Workforce Dev. & Instr.
- Shelley Hanson
Director Human Resources
- Jeremy Brown
Director Institutional Effectiveness
- Diane Lewis
Director Mktg. & Comm.
Administration
LTCC Board of Trustees
- Maxine Alper
- Bruce Armbrust
- Aaron Barnett
- Susan Boulanger
- Cathy Cox
- Behnaz Gangursky
- Larry Green
- Pat Leonard-Heffner
- Tim Johnson
- Jon Kingsbury
- Sue Kloss
- Scott Lukas
- Walter Morris
- Michael O’Laughlin
- Sara Pierce
- David Reichel
- Steve Richardson
- Sean Ryland
- Phyllis Shafer
- Helen Shen
- Kathy Strain
- Eric Sturgess
- Treva Thomas
- Christina Tomolillo
- Scott Valentine
- Wynn Walker
- Mark Williams
- Bryan Yerian
Faculty
MAAS Companies, Inc.
- Lori Maas-O’Keefe- Jeff Kellogg
- Lanae White-Cruz- Bo Ralston
Related Documents