Educationa l Institutio n

Welcome message from author
This document is posted to help you gain knowledge. Please leave a comment to let me know what you think about it! Share it to your friends and learn new things together.
Transcript

Educational
Institution
Company: FAR EASTERN UNIVERSITY
2.1. What financial statements are reported by the company?
The Company reports the following financial statements:
Statements of Financial Position Consolidated Statements of Comprehensive Income Consolidated Statements of Changes in Equity Consolidated Statements of Cash Flows Schedule of Operating/Educational Expenses Notes to Financial Statements
2.2. On the Statement of Financial Position:
2.2.1. The preparation and classification used in the presentation of the SFP;
The company uses the report form to present its statement of financial position. It presents its assetsin the order of liquidity. It presents the assets and
its liabilities using the current to non-current presentation and segregates current from non-current items.
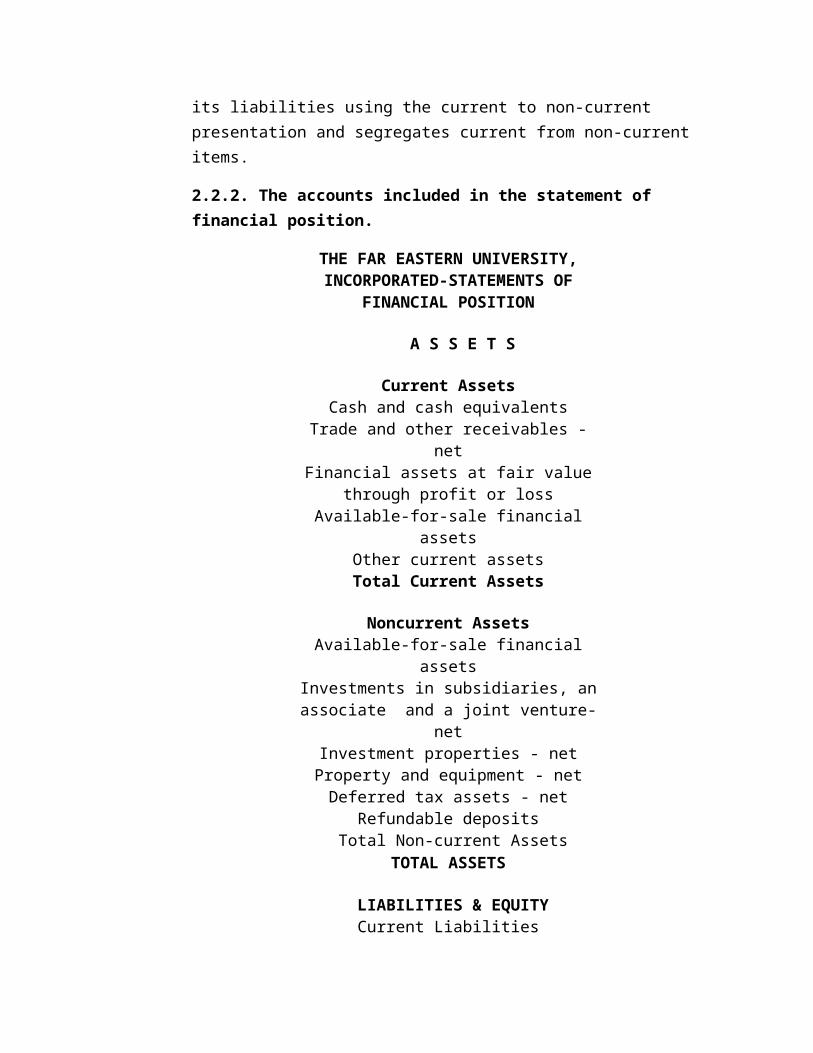
2.2.2. The accounts included in the statement of financial position.
THE FAR EASTERN UNIVERSITY,INCORPORATED-STATEMENTS OF
FINANCIAL POSITION
A S S E T S
Current AssetsCash and cash equivalents
Trade and other receivables -net
Financial assets at fair valuethrough profit or loss
Available-for-sale financialassets
Other current assetsTotal Current Assets
Noncurrent AssetsAvailable-for-sale financial
assetsInvestments in subsidiaries, anassociate and a joint venture-
netInvestment properties - netProperty and equipment - netDeferred tax assets - net
Refundable deposits Total Non-current Assets
TOTAL ASSETS
LIABILITIES & EQUITYCurrent Liabilities
Trade and other payablesTrust Funds
Unearned tuition feesIncome tax payable
Total Current LiabilitiesNon- Current LiabilitiesInterest bearing loan Total Liabilities
EquityCapital Stock
Treasury stock - at costRevaluation reservesRetained Earnings Appropriated Unappropriated Total Equity
TOTAL LIABILITIES AND EQUITY
2.3. On the Income Statement:
2.3.1. The form of the income statement used by the company
The company presents items in two statements: a statement displaying components of profit of loss and astatement of comprehensive income. It presents income and expenses using the function-of expense method.
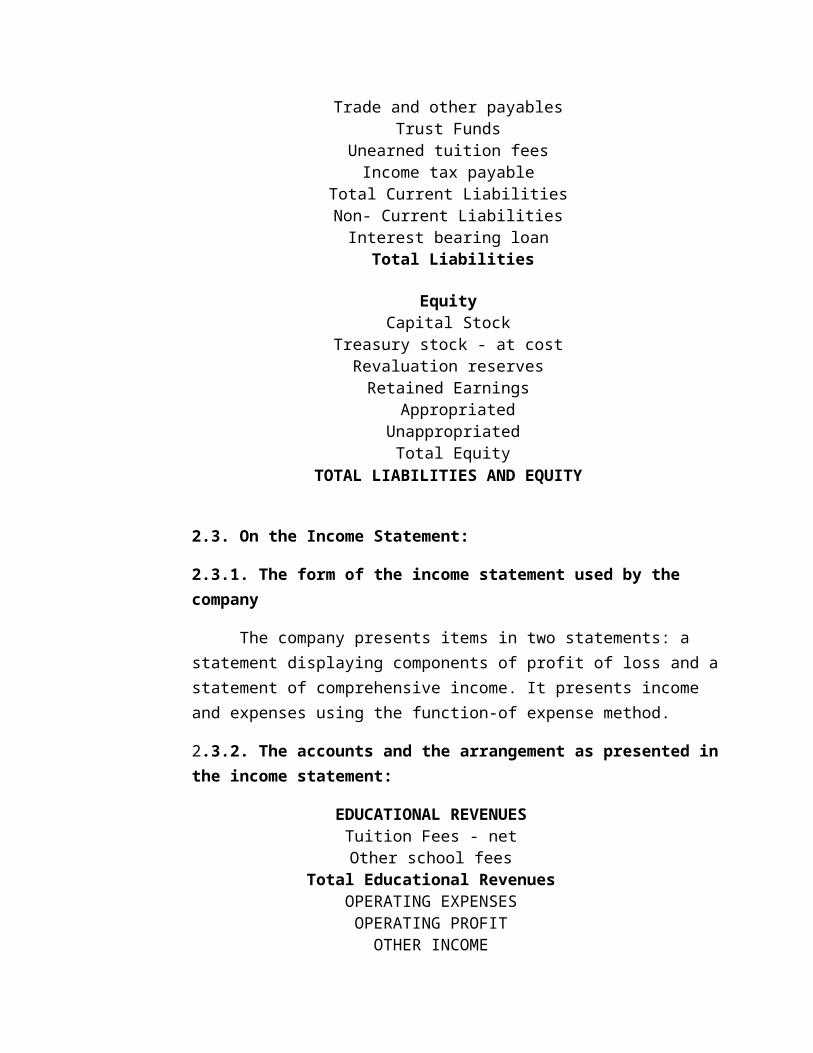
2.3.2. The accounts and the arrangement as presented inthe income statement:
EDUCATIONAL REVENUESTuition Fees - netOther school fees
Total Educational RevenuesOPERATING EXPENSESOPERATING PROFITOTHER INCOME
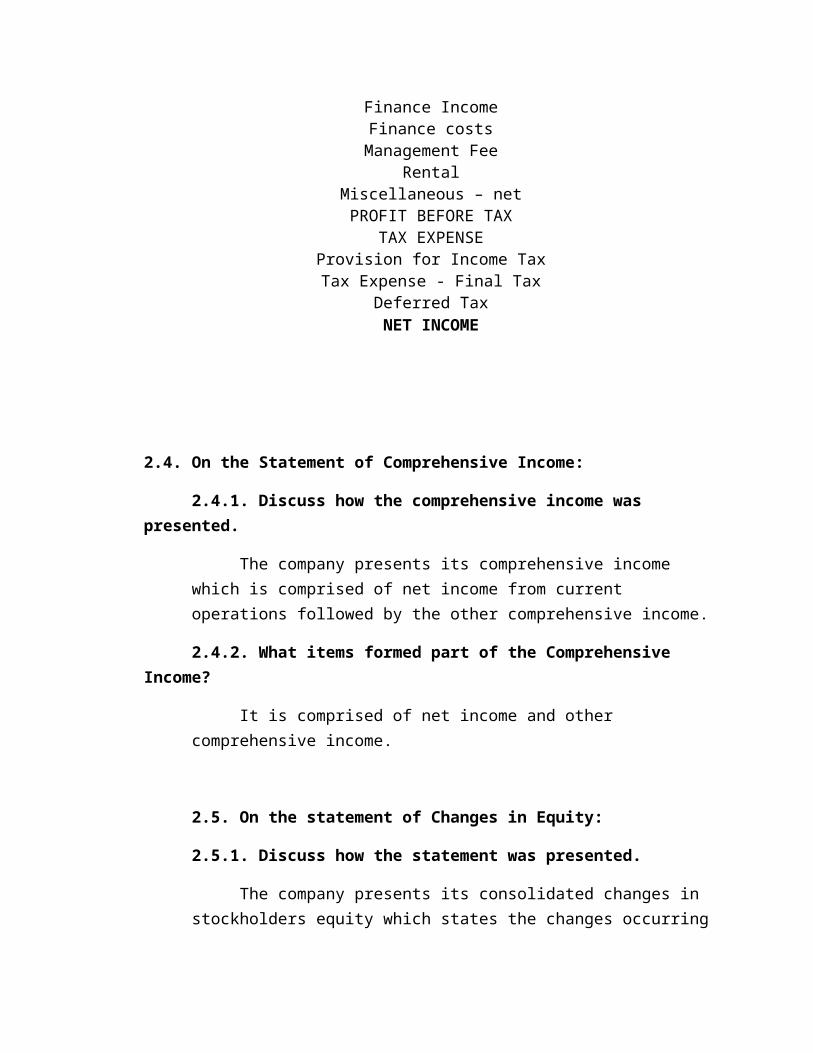
Finance IncomeFinance costsManagement Fee
RentalMiscellaneous – netPROFIT BEFORE TAX
TAX EXPENSEProvision for Income TaxTax Expense - Final Tax
Deferred TaxNET INCOME
2.4. On the Statement of Comprehensive Income:
2.4.1. Discuss how the comprehensive income was presented.
The company presents its comprehensive income which is comprised of net income from current operations followed by the other comprehensive income.
2.4.2. What items formed part of the Comprehensive Income?
It is comprised of net income and other comprehensive income.
2.5. On the statement of Changes in Equity:
2.5.1. Discuss how the statement was presented.
The company presents its consolidated changes in stockholders equity which states the changes occurring
on the following accounts: the capital stock, treasury stocks, revaluation reserves and the retained earnings.
2.5.2. What items worth nothing were included in the statement?
Since the company is in the educational institution, the emphasis should be on the amount of cash dividends and treasury shares the company has because it is comprised of control in the equity of thecompany.
2.6. On the Cash Flow Statement:
2.6.1. Discuss how the Cash Flow Statement was presented:
The company uses the indirect method of presentingits cash flows from operating companies and also consists of the cash flows from financing and investingactivities.
2.6.2. What items worth noting were included in the statement?
Since the entity has a service nature, the additions to plant, property and equipment should be noted because PPE is mainly used for the revenue-generating process of the entity.
2.7. On the Notes to Financial Statements:
2.7.1. Discuss the outline in the presentation of the notes to financial statements.
The notes to financial statement disclosed the compliance of the company to the PFRS and how the financial statements are prepared. The company’s notes to financial statements discuss corporate information
and its status of operations. The notes also disclose the basis of preparation of the financial position and the prospective changes in the accounting policies of the company.
2.7.2. What salient items are worth noting in the preparation of the financial statements?
The disclosure of the items comprising the investment of the school into buildings used for academic purposes and other investments of the organization for academic purposes should be considered.
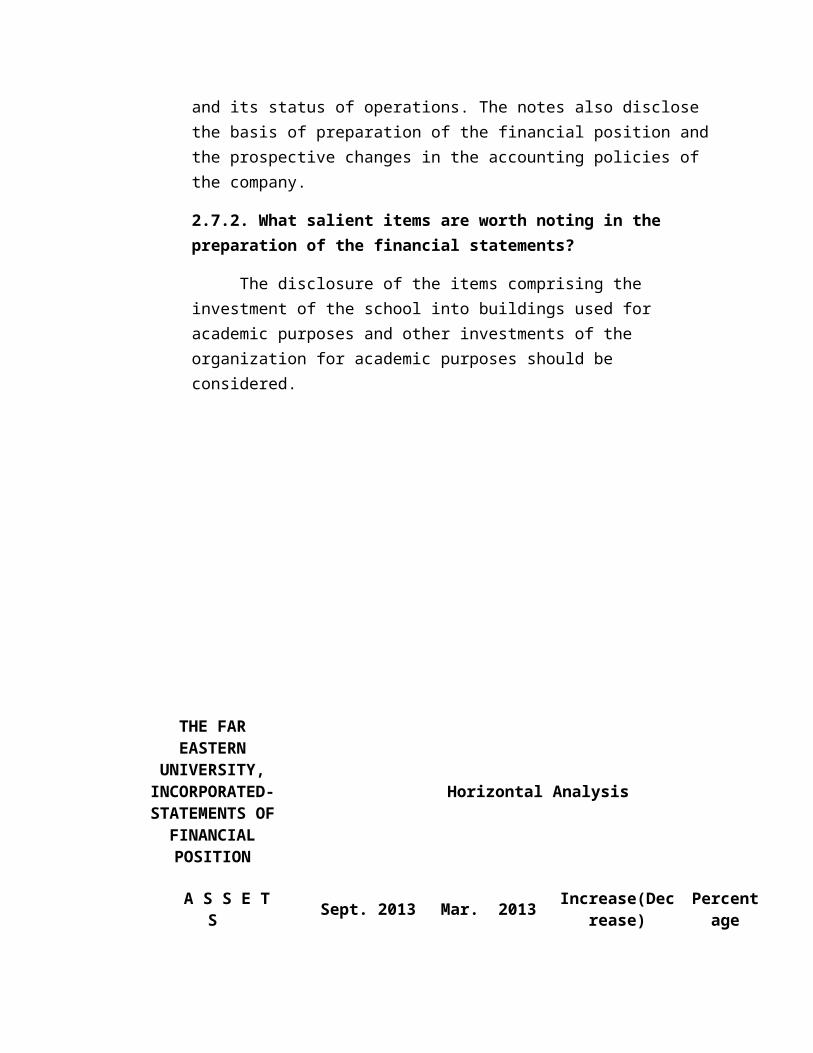
THE FAREASTERN
UNIVERSITY,INCORPORATED-STATEMENTS OF
FINANCIALPOSITION
Horizontal Analysis
A S S E TS Sept. 2013 Mar. 2013 Increase(Dec
rease)Percent
age

CurrentAssets
Cash and cashequivalents
248,306,39
4.46
195,608,838
.23
52,697,556.2
326.94%
Trade andother
receivables -net
379,978,58
3.97
327,223,561
.17
52,755,022.8
016.12%
Financialassets atfair valuethrough
profit orloss
18,629,900
.00
18,629,900.
00
- 0.00%
Available-for-salefinancialassets
1,868,906,0
50.84
1,997,186,487.
99
(128,280,437.15
)-6.42%
Other currentassets
9,278,331.
00
13,332,513.
85
(4,054,182.8
5)-30.41%
Total CurrentAssets
2,525,099,2
60.27
2,551,981,301.
24
(26,882,040.
97)-1.05%
NoncurrentAssets
Available-for-salefinancialassets
484,014,66
9.43
367,039,668
.00
116,975,001.
4331.87%
Investmentsin
subsidiaries,an associateand a jointventure- net
237,313,36
3.94
187,313,363
.94
50,000,000.0
026.69%
Investment 1 1,5 0.61%
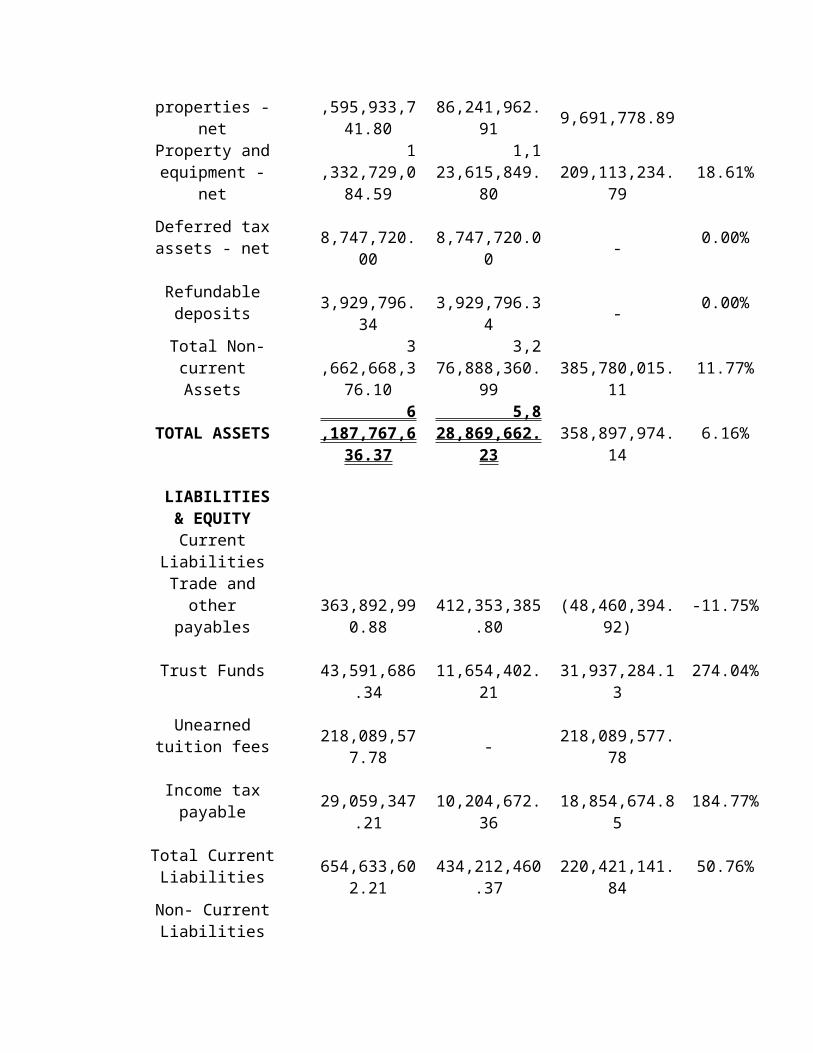
properties -net
,595,933,741.80
86,241,962.91 9,691,778.89
Property andequipment -
net
1,332,729,0
84.59
1,123,615,849.
80
209,113,234.
7918.61%
Deferred taxassets - net
8,747,720.
00
8,747,720.0
0
- 0.00%
Refundabledeposits
3,929,796.
34
3,929,796.3
4
- 0.00%
Total Non-currentAssets
3,662,668,3
76.10
3,276,888,360.
99
385,780,015.
1111.77%
TOTAL ASSETS 6,187,767,6
36.37
5,828,869,662.
23
358,897,974.
146.16%
LIABILITIES& EQUITYCurrent
LiabilitiesTrade and
otherpayables
363,892,99
0.88
412,353,385
.80
(48,460,394.
92)-11.75%
Trust Funds
43,591,686.34
11,654,402.
21
31,937,284.1
3274.04%
Unearnedtuition fees
218,089,57
7.78
-
218,089,577.
78
Income taxpayable
29,059,347
.21
10,204,672.
36
18,854,674.8
5184.77%
Total CurrentLiabilities
654,633,60
2.21
434,212,460
.37
220,421,141.
8450.76%
Non- CurrentLiabilities
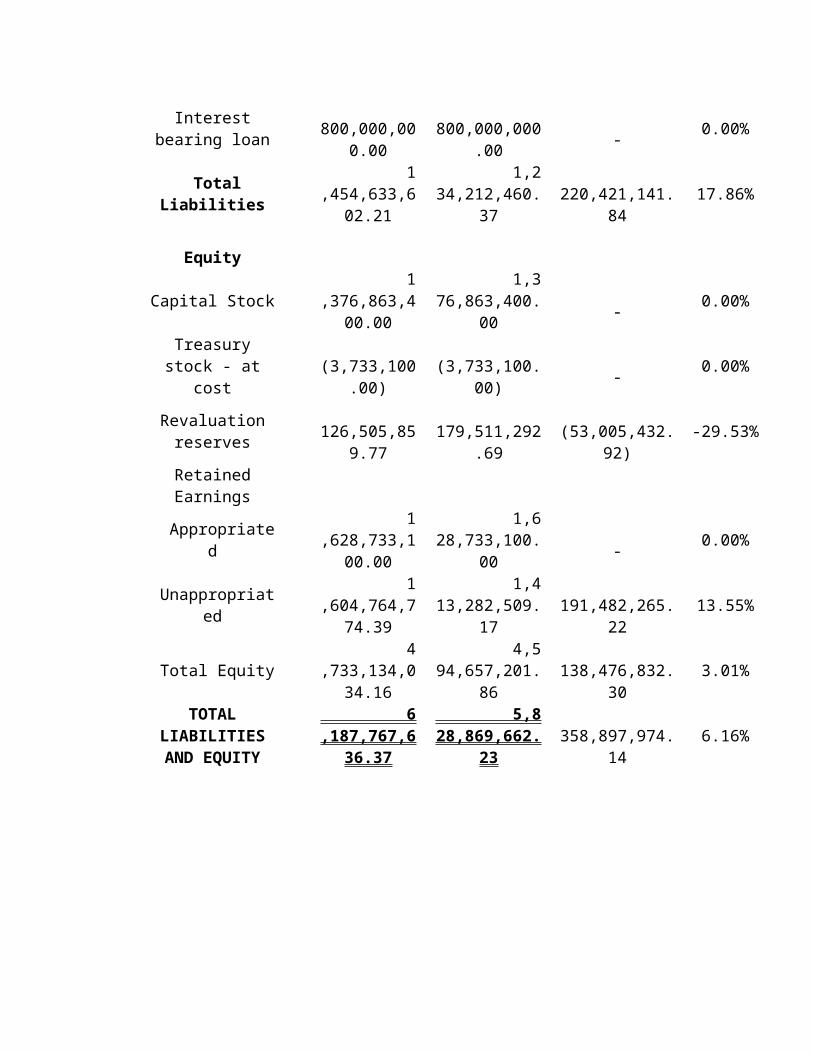
Interestbearing loan
800,000,00
0.00
800,000,000
.00
- 0.00%
TotalLiabilities
1,454,633,6
02.21
1,234,212,460.
37
220,421,141.
8417.86%
Equity
Capital Stock 1,376,863,4
00.00
1,376,863,400.
00
- 0.00%
Treasurystock - at
cost
(3,733,100
.00)
(3,733,100.
00)
- 0.00%
Revaluationreserves
126,505,85
9.77
179,511,292
.69
(53,005,432.
92)-29.53%
RetainedEarnings
Appropriated
1,628,733,1
00.00
1,628,733,100.
00
- 0.00%
Unappropriated
1,604,764,7
74.39
1,413,282,509.
17
191,482,265.
2213.55%
Total Equity 4,733,134,0
34.16
4,594,657,201.
86
138,476,832.
303.01%
TOTALLIABILITIESAND EQUITY
6,187,767,6
36.37
5,828,869,662.
23
358,897,974.
146.16%
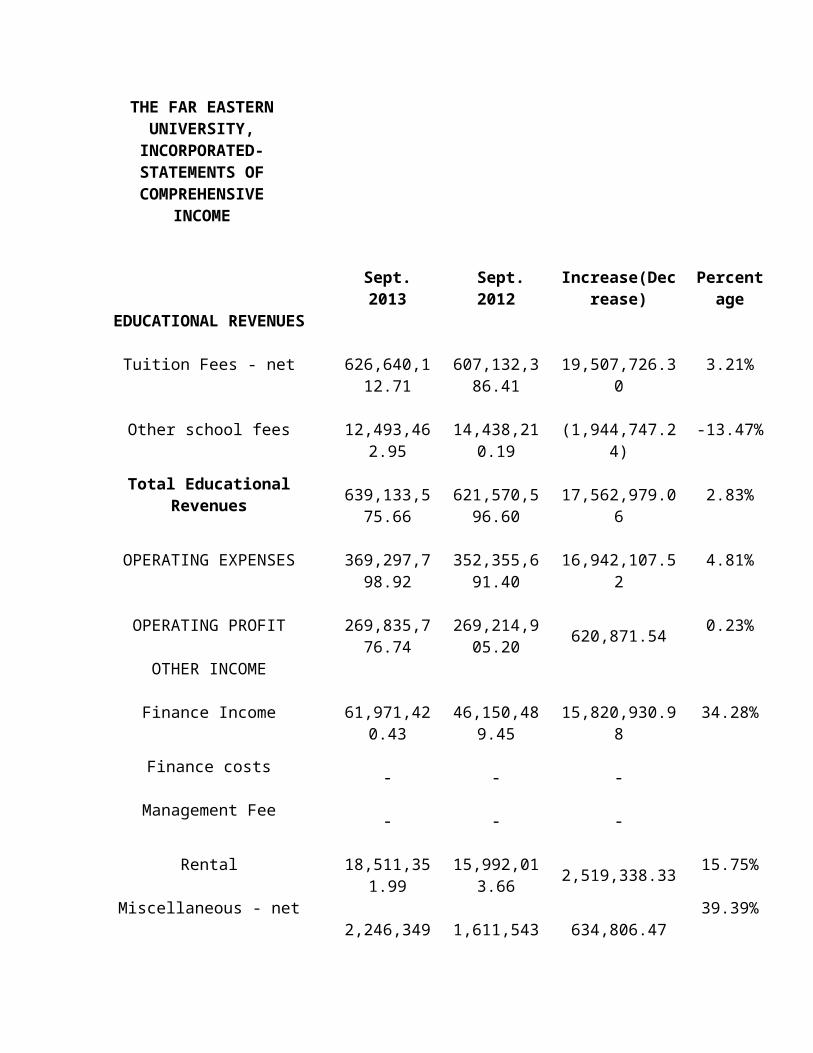
THE FAR EASTERNUNIVERSITY,INCORPORATED-STATEMENTS OFCOMPREHENSIVE
INCOME
Sept.2013
Sept.2012
Increase(Decrease)
Percentage
EDUCATIONAL REVENUES
Tuition Fees - net
626,640,112.71
607,132,386.41
19,507,726.3
03.21%
Other school fees
12,493,462.95
14,438,21
0.19
(1,944,747.2
4)-13.47%
Total EducationalRevenues
639,133,575.66
621,570,596.60
17,562,979.0
62.83%
OPERATING EXPENSES
369,297,798.92
352,355,691.40
16,942,107.5
24.81%
OPERATING PROFIT
269,835,776.74
269,214,905.20
620,871.54 0.23%
OTHER INCOME
Finance Income
61,971,420.43
46,150,48
9.45
15,820,930.9
834.28%
Finance costs -
-
-
Management Fee -
-
-
Rental
18,511,351.99
15,992,01
3.66
2,519,338.33 15.75%
Miscellaneous - net 2,246,349
1,611,543
634,806.47
39.39%
.76 .29
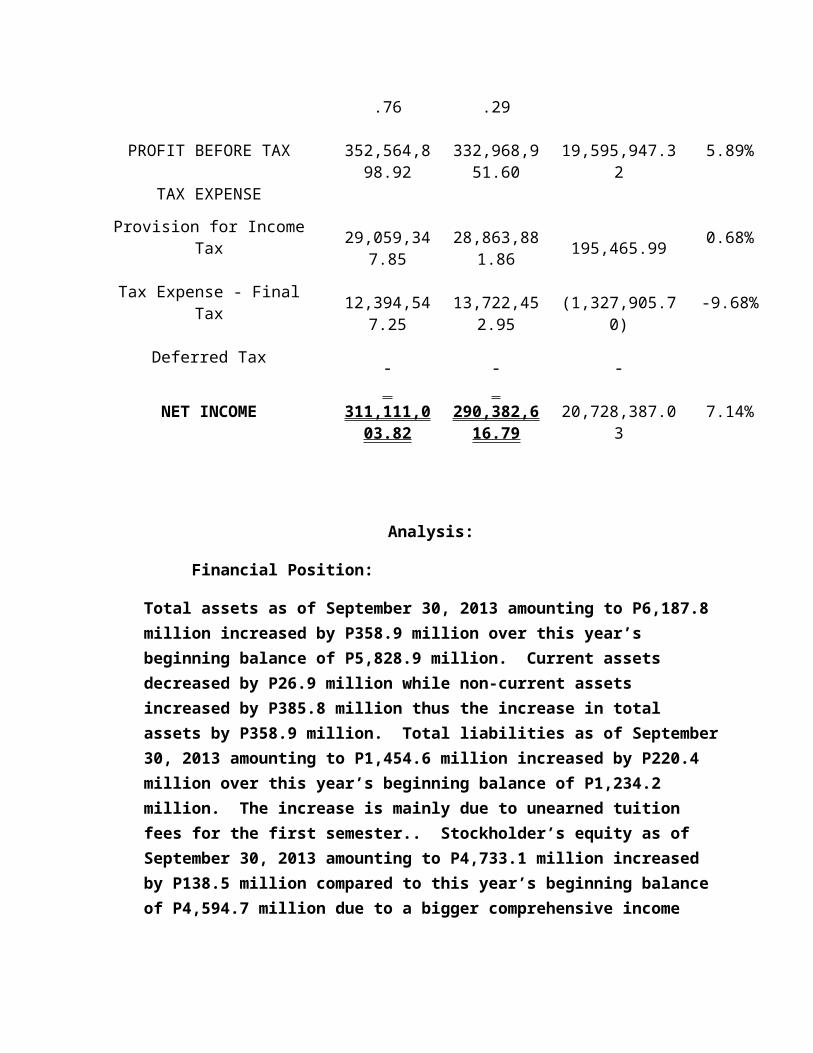
PROFIT BEFORE TAX
352,564,898.92
332,968,951.60
19,595,947.3
25.89%
TAX EXPENSE
Provision for IncomeTax
29,059,34
7.85
28,863,88
1.86
195,465.99 0.68%
Tax Expense - FinalTax
12,394,54
7.25
13,722,45
2.95
(1,327,905.7
0)-9.68%
Deferred Tax -
-
-
NET INCOME
311,111,003.82
290,382,616.79
20,728,387.0
37.14%
Analysis:
Financial Position:
Total assets as of September 30, 2013 amounting to P6,187.8 million increased by P358.9 million over this year’s beginning balance of P5,828.9 million. Current assets decreased by P26.9 million while non-current assets increased by P385.8 million thus the increase in total assets by P358.9 million. Total liabilities as of September30, 2013 amounting to P1,454.6 million increased by P220.4 million over this year’s beginning balance of P1,234.2 million. The increase is mainly due to unearned tuition fees for the first semester.. Stockholder’s equity as of September 30, 2013 amounting to P4,733.1 million increased by P138.5 million compared to this year’s beginning balance of P4,594.7 million due to a bigger comprehensive income
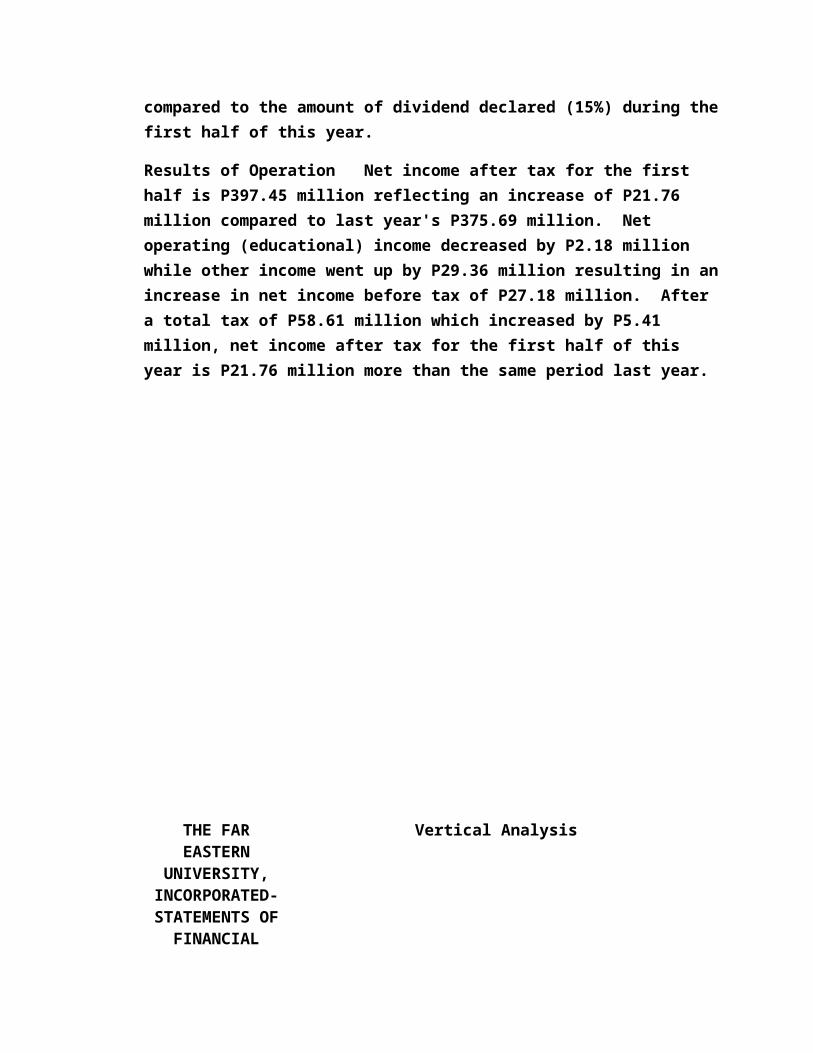
compared to the amount of dividend declared (15%) during thefirst half of this year.
Results of Operation Net income after tax for the first half is P397.45 million reflecting an increase of P21.76 million compared to last year's P375.69 million. Net operating (educational) income decreased by P2.18 million while other income went up by P29.36 million resulting in anincrease in net income before tax of P27.18 million. After a total tax of P58.61 million which increased by P5.41 million, net income after tax for the first half of this year is P21.76 million more than the same period last year.
THE FAREASTERN
UNIVERSITY,INCORPORATED-STATEMENTS OF
FINANCIAL
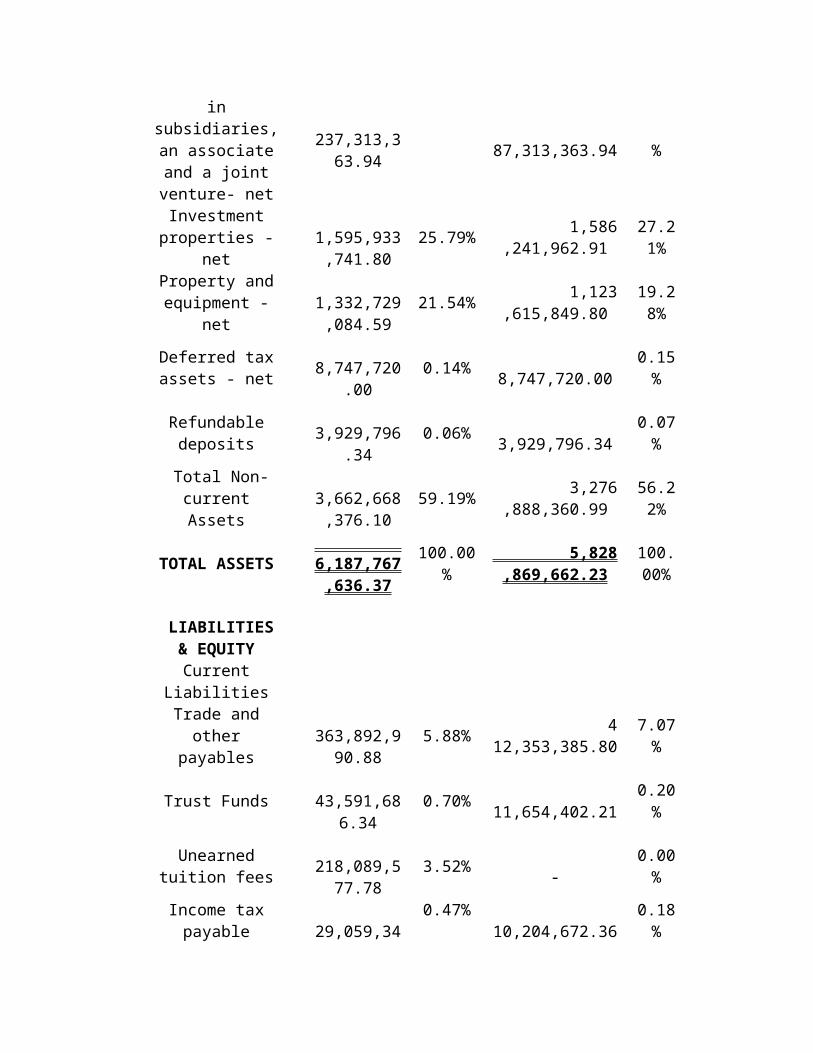
Vertical Analysis
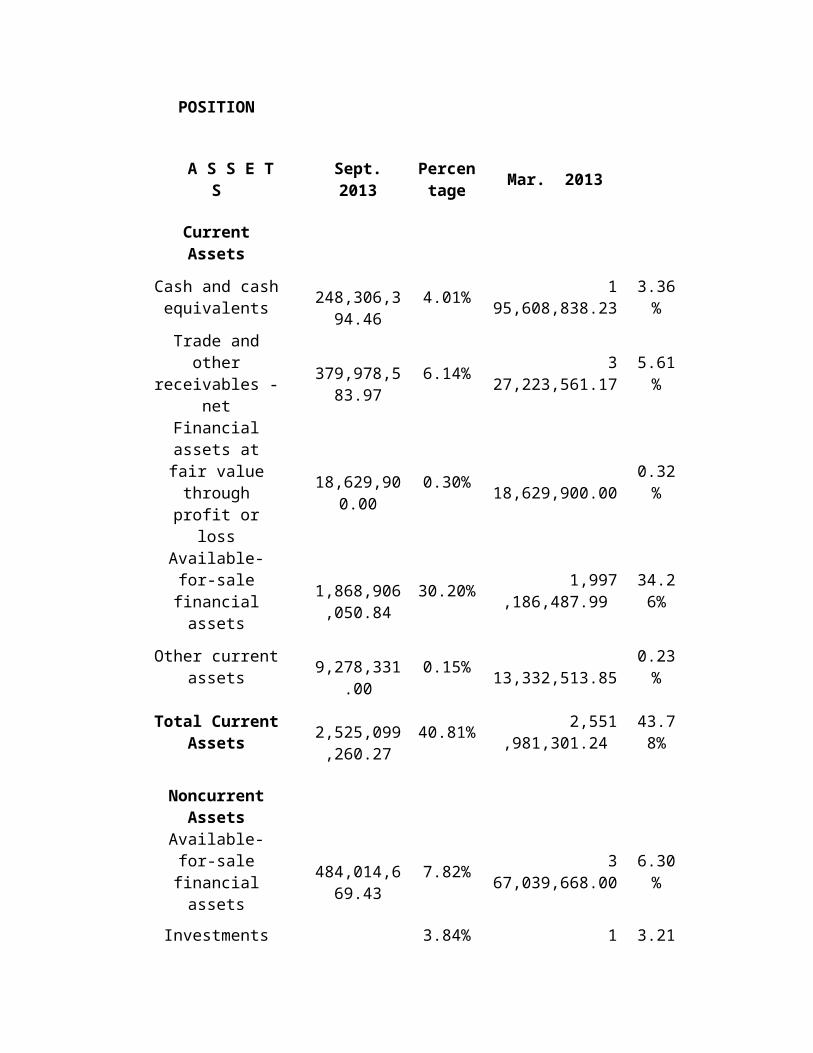
POSITION
A S S E TS
Sept.2013
Percentage Mar. 2013
CurrentAssets
Cash and cashequivalents
248,306,394.46
4.01% 195,608,838.23
3.36%
Trade andother
receivables -net
379,978,583.97
6.14% 327,223,561.17
5.61%
Financialassets atfair valuethroughprofit or
loss
18,629,90
0.000.30%
18,629,900.000.32%
Available-for-salefinancialassets
1,868,906,050.84
30.20% 1,997,186,487.99
34.26%
Other currentassets
9,278,331
.000.15%
13,332,513.850.23%
Total CurrentAssets
2,525,099,260.27
40.81% 2,551,981,301.24
43.78%
NoncurrentAssets
Available-for-salefinancialassets
484,014,669.43
7.82% 367,039,668.00
6.30%
Investments 3.84% 1 3.21
insubsidiaries,an associateand a jointventure- net
237,313,363.94 87,313,363.94 %
Investmentproperties -
net
1,595,933,741.80
25.79% 1,586,241,962.91
27.21%
Property andequipment -
net
1,332,729,084.59
21.54% 1,123,615,849.80
19.28%
Deferred taxassets - net
8,747,720
.000.14%
8,747,720.000.15%
Refundabledeposits
3,929,796
.340.06%
3,929,796.340.07%
Total Non-currentAssets
3,662,668,376.10
59.19% 3,276,888,360.99
56.22%
TOTAL ASSETS 6,187,767,636.37
100.00%
5,828,869,662.23
100.00%
LIABILITIES& EQUITYCurrent
LiabilitiesTrade andother
payables
363,892,990.88
5.88% 412,353,385.80
7.07%
Trust Funds
43,591,686.34
0.70% 11,654,402.21
0.20%
Unearnedtuition fees
218,089,577.78
3.52% -
0.00%
Income taxpayable
29,059,34
0.47% 10,204,672.36
0.18%

7.21
Total CurrentLiabilities
654,633,602.21
10.58% 434,212,460.37
7.45%
Non- CurrentLiabilities
Interestbearing loan
800,000,000.00
12.93% 800,000,000.00
13.72%
TotalLiabilities
1,454,633,602.21
23.51% 1,234,212,460.37
21.17%
Equity
Capital Stock 1,376,863,400.00
22.25% 1,376,863,400.00
23.62%
Treasurystock - at
cost
(3,733,100.00)
-0.06%
(3,733,100.00)
-0.06%
Revaluationreserves
126,505,859.77
2.04% 179,511,292.69
3.08%
RetainedEarnings
Appropriated
1,628,733,100.00
26.32% 1,628,733,100.00
27.94%
Unappropriated
1,604,764,774.39
25.93% 1,413,282,509.17
24.25%
Total Equity 4,733,134,034.16
76.49% 4,594,657,201.86
78.83%
TOTALLIABILITIESAND EQUITY
6,187,767,636.37
100.00%
5,828,869,662.23
100.00%
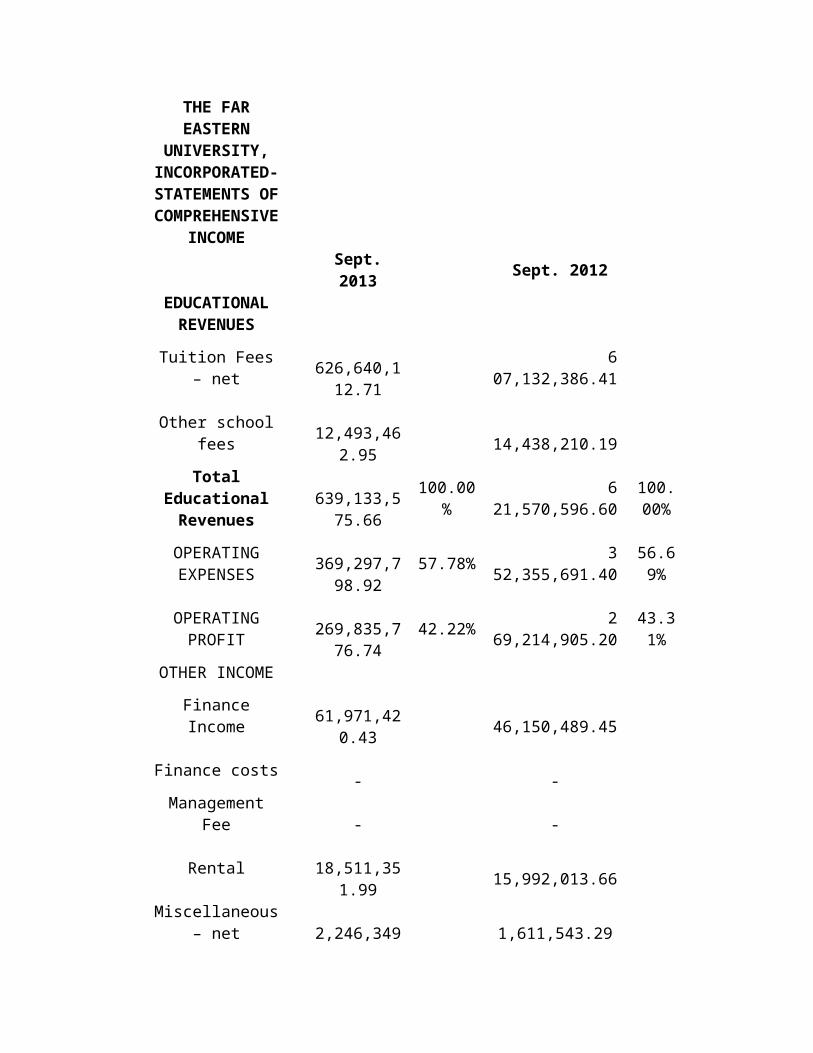
THE FAREASTERN
UNIVERSITY,INCORPORATED-STATEMENTS OFCOMPREHENSIVE
INCOMESept.2013 Sept. 2012
EDUCATIONALREVENUES
Tuition Fees– net
626,640,112.71
607,132,386.41
Other schoolfees
12,493,46
2.95
14,438,210.19
TotalEducationalRevenues
639,133,575.66
100.00%
621,570,596.60
100.00%
OPERATINGEXPENSES
369,297,798.92
57.78% 352,355,691.40
56.69%
OPERATINGPROFIT
269,835,776.74
42.22% 269,214,905.20
43.31%
OTHER INCOME
FinanceIncome
61,971,42
0.43
46,150,489.45
Finance costs -
-
ManagementFee
-
-
Rental
18,511,351.99
15,992,013.66
Miscellaneous– net
2,246,349
1,611,543.29
.76
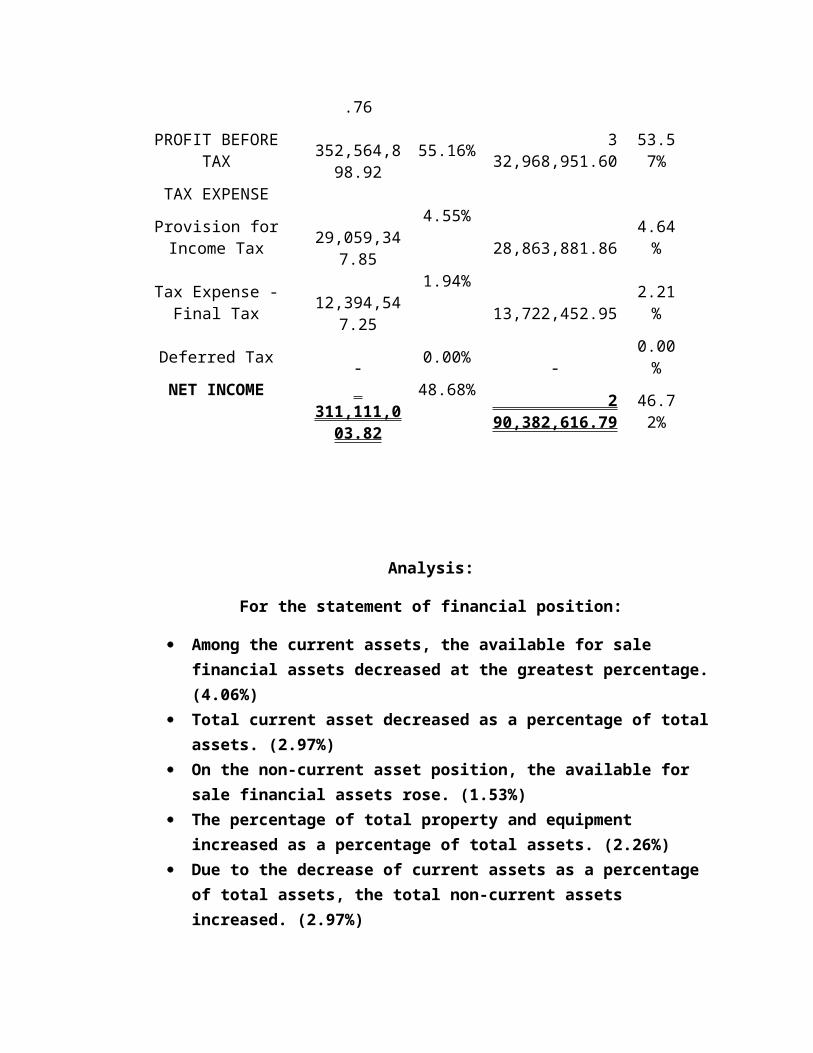
PROFIT BEFORETAX
352,564,898.92
55.16% 332,968,951.60
53.57%
TAX EXPENSE
Provision forIncome Tax
29,059,34
7.85
4.55% 28,863,881.86
4.64%
Tax Expense -Final Tax
12,394,54
7.25
1.94% 13,722,452.95
2.21%
Deferred Tax - 0.00%
-0.00%
NET INCOME 311,111,003.82
48.68% 290,382,616.79
46.72%
Analysis:
For the statement of financial position:
Among the current assets, the available for sale financial assets decreased at the greatest percentage. (4.06%)
Total current asset decreased as a percentage of total assets. (2.97%)
On the non-current asset position, the available for sale financial assets rose. (1.53%)
The percentage of total property and equipment increased as a percentage of total assets. (2.26%)
Due to the decrease of current assets as a percentage of total assets, the total non-current assets increased. (2.97%)
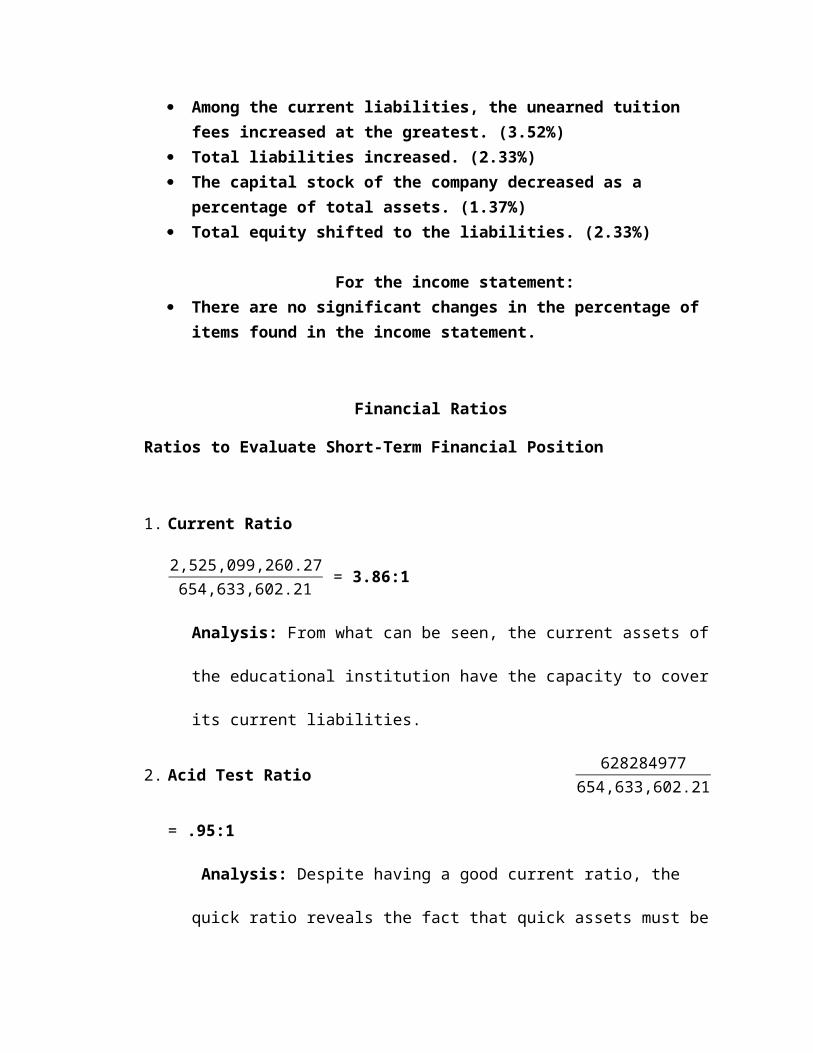
Among the current liabilities, the unearned tuition fees increased at the greatest. (3.52%)
Total liabilities increased. (2.33%) The capital stock of the company decreased as a
percentage of total assets. (1.37%) Total equity shifted to the liabilities. (2.33%)
For the income statement: There are no significant changes in the percentage of
items found in the income statement.
Financial Ratios
Ratios to Evaluate Short-Term Financial Position
1. Current Ratio
2,525,099,260.27654,633,602.21 = 3.86:1
Analysis: From what can be seen, the current assets of
the educational institution have the capacity to cover
its current liabilities.
2. Acid Test Ratio 628284977654,633,602.21
= .95:1
Analysis: Despite having a good current ratio, the
quick ratio reveals the fact that quick assets must be
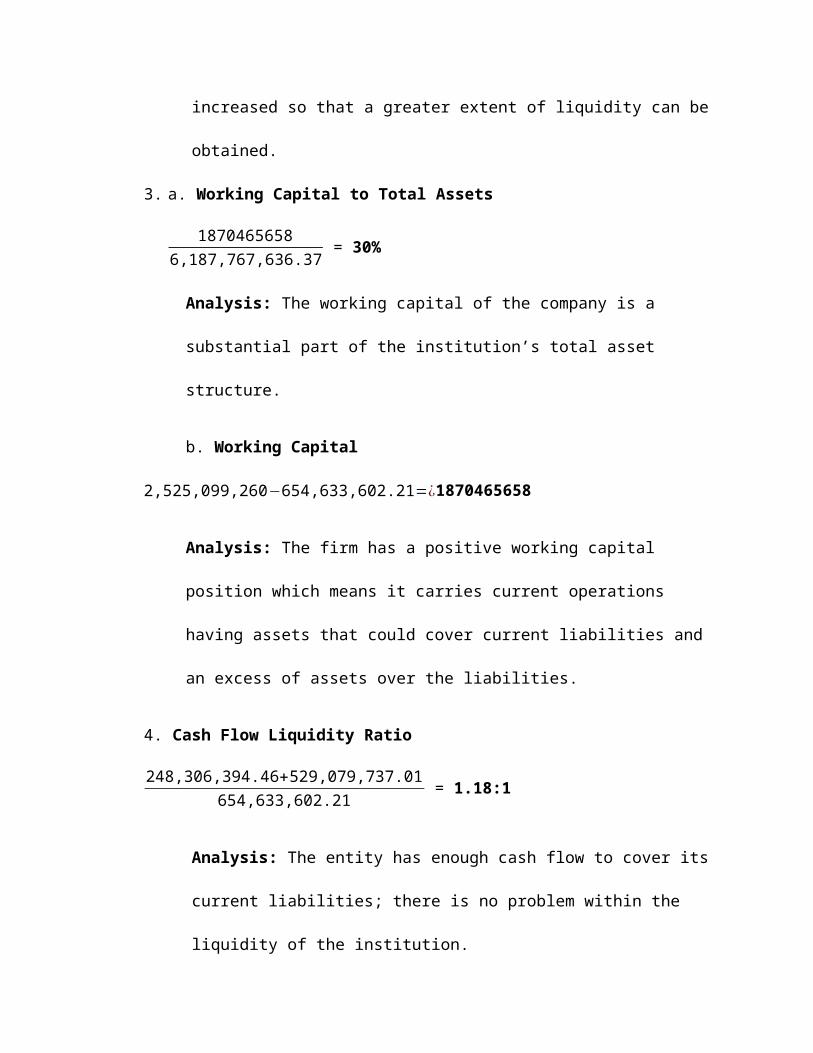
increased so that a greater extent of liquidity can be
obtained.
3. a. Working Capital to Total Assets
18704656586,187,767,636.37 = 30%
Analysis: The working capital of the company is a
substantial part of the institution’s total asset
structure.
b. Working Capital
2,525,099,260−654,633,602.21=¿1870465658
Analysis: The firm has a positive working capital
position which means it carries current operations
having assets that could cover current liabilities and
an excess of assets over the liabilities.
4. Cash Flow Liquidity Ratio
248,306,394.46+529,079,737.01654,633,602.21 = 1.18:1
Analysis: The entity has enough cash flow to cover its
current liabilities; there is no problem within the
liquidity of the institution.
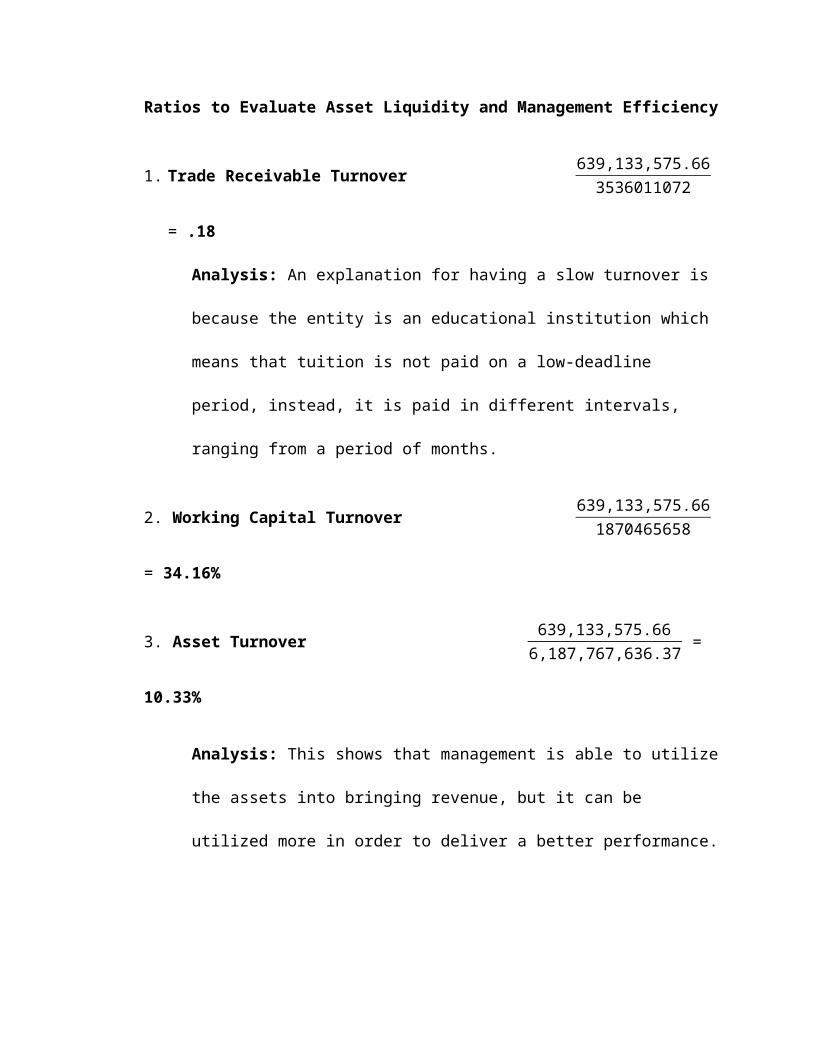
Ratios to Evaluate Asset Liquidity and Management Efficiency
1. Trade Receivable Turnover 639,133,575.663536011072
= .18
Analysis: An explanation for having a slow turnover is
because the entity is an educational institution which
means that tuition is not paid on a low-deadline
period, instead, it is paid in different intervals,
ranging from a period of months.
2. Working Capital Turnover 639,133,575.661870465658
= 34.16%
3. Asset Turnover 639,133,575.666,187,767,636.37 =
10.33%
Analysis: This shows that management is able to utilize
the assets into bringing revenue, but it can be
utilized more in order to deliver a better performance.
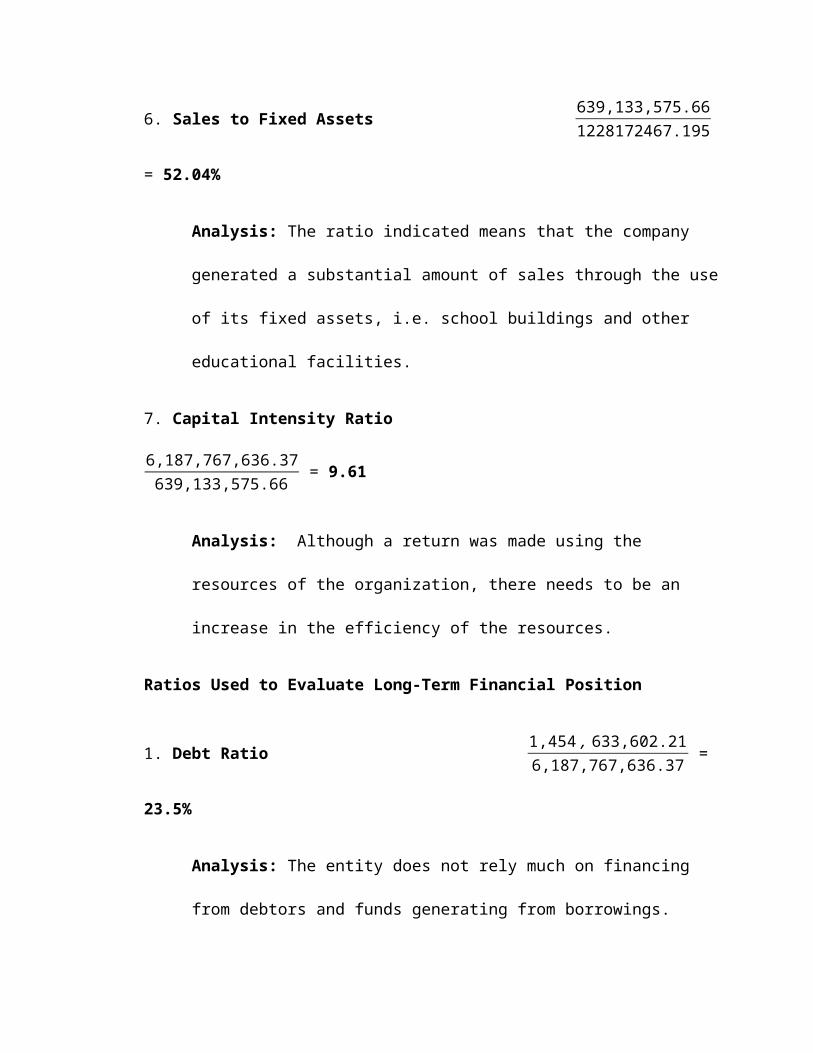
6. Sales to Fixed Assets 639,133,575.661228172467.195
= 52.04%
Analysis: The ratio indicated means that the company
generated a substantial amount of sales through the use
of its fixed assets, i.e. school buildings and other
educational facilities.
7. Capital Intensity Ratio
6,187,767,636.37639,133,575.66 = 9.61
Analysis: Although a return was made using the
resources of the organization, there needs to be an
increase in the efficiency of the resources.
Ratios Used to Evaluate Long-Term Financial Position
1. Debt Ratio 1,454, 633,602.216,187,767,636.37 =
23.5%
Analysis: The entity does not rely much on financing
from debtors and funds generating from borrowings.
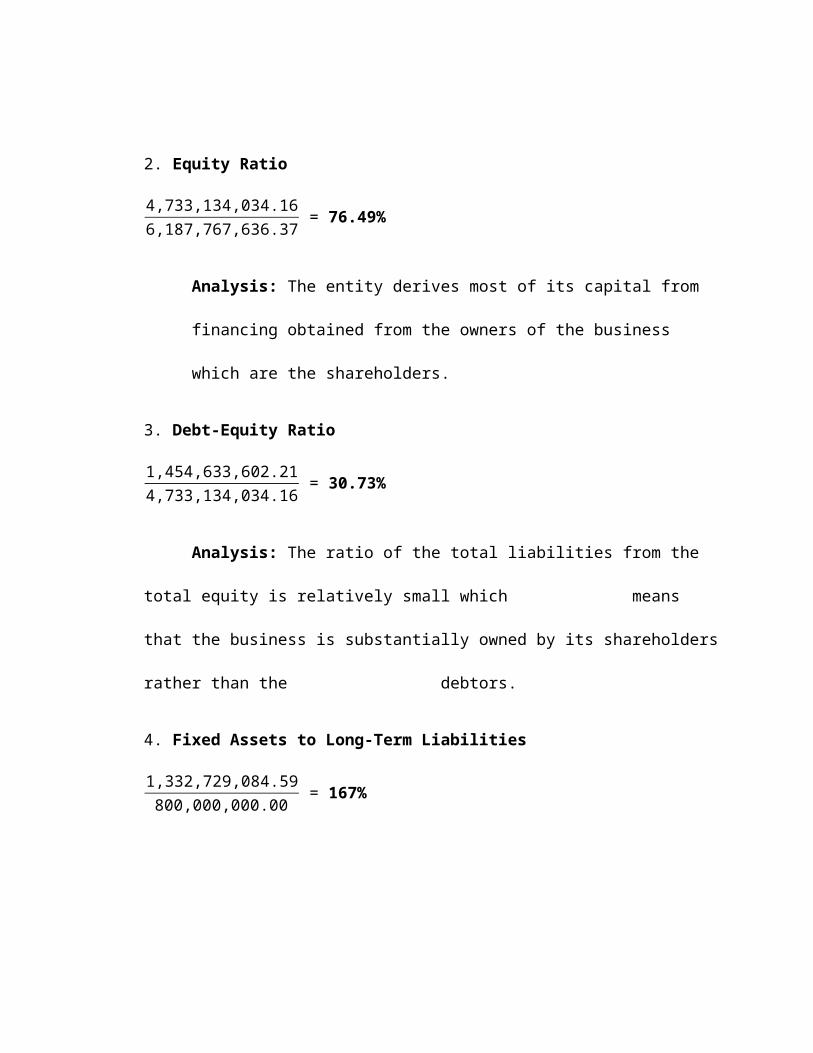
2. Equity Ratio
4,733,134,034.166,187,767,636.37 = 76.49%
Analysis: The entity derives most of its capital from
financing obtained from the owners of the business
which are the shareholders.
3. Debt-Equity Ratio
1,454,633,602.214,733,134,034.16 = 30.73%
Analysis: The ratio of the total liabilities from the
total equity is relatively small which means
that the business is substantially owned by its shareholders
rather than the debtors.
4. Fixed Assets to Long-Term Liabilities
1,332,729,084.59800,000,000.00 = 167%
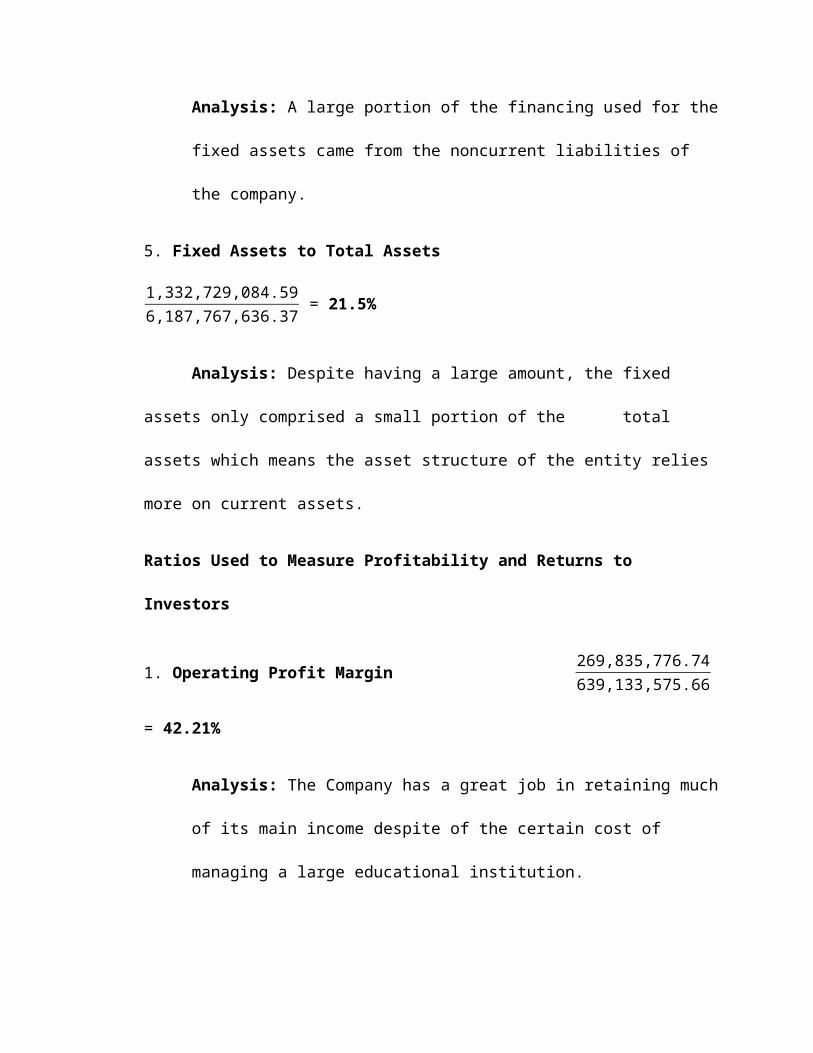
Analysis: A large portion of the financing used for the
fixed assets came from the noncurrent liabilities of
the company.
5. Fixed Assets to Total Assets
1,332,729,084.596,187,767,636.37 = 21.5%
Analysis: Despite having a large amount, the fixed
assets only comprised a small portion of the total
assets which means the asset structure of the entity relies
more on current assets.
Ratios Used to Measure Profitability and Returns to
Investors
1. Operating Profit Margin 269,835,776.74639,133,575.66
= 42.21%
Analysis: The Company has a great job in retaining much
of its main income despite of the certain cost of
managing a large educational institution.
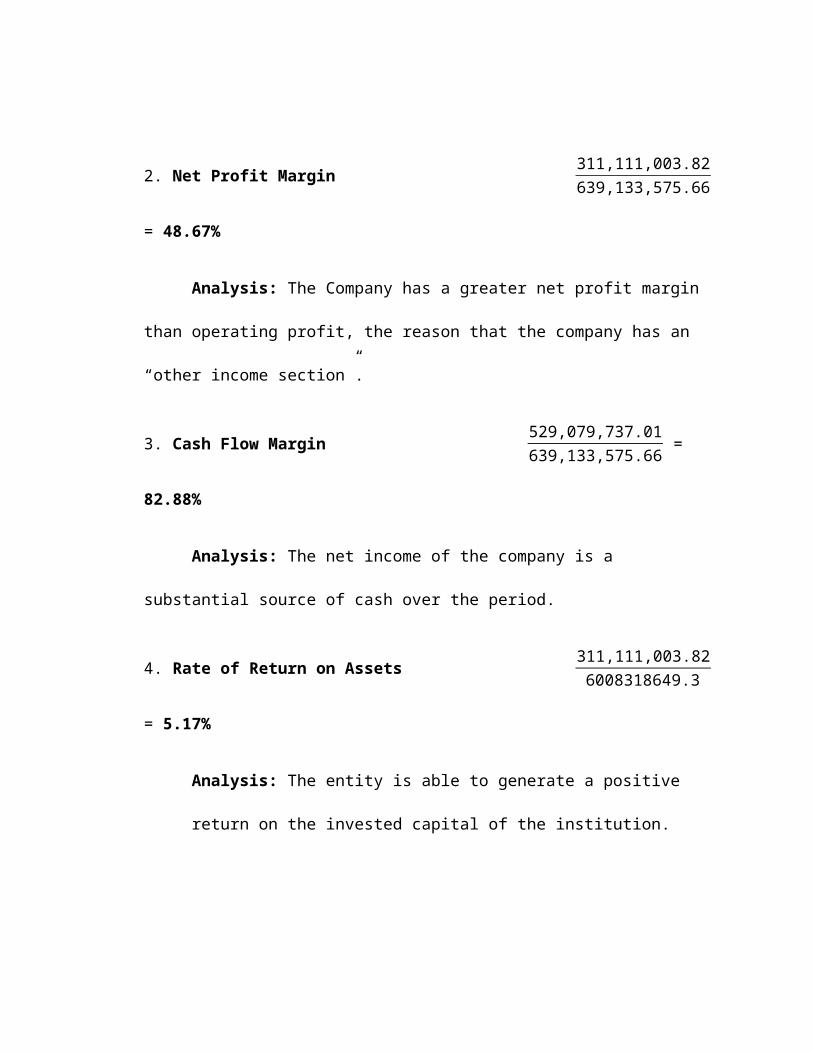
2. Net Profit Margin 311,111,003.82639,133,575.66
= 48.67%
Analysis: The Company has a greater net profit margin
than operating profit, the reason that the company has an
“other income section”.
3. Cash Flow Margin 529,079,737.01639,133,575.66 =
82.88%
Analysis: The net income of the company is a
substantial source of cash over the period.
4. Rate of Return on Assets 311,111,003.826008318649.3
= 5.17%
Analysis: The entity is able to generate a positive
return on the invested capital of the institution.
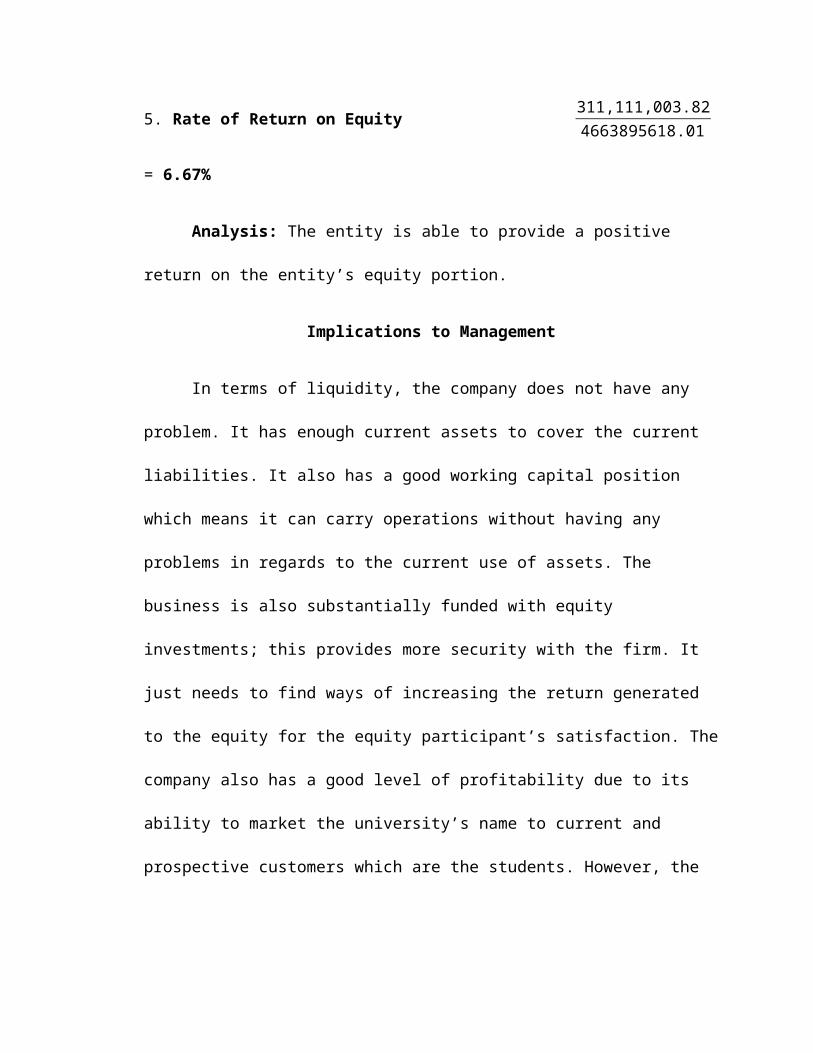
5. Rate of Return on Equity 311,111,003.824663895618.01
= 6.67%
Analysis: The entity is able to provide a positive
return on the entity’s equity portion.
Implications to Management
In terms of liquidity, the company does not have any
problem. It has enough current assets to cover the current
liabilities. It also has a good working capital position
which means it can carry operations without having any
problems in regards to the current use of assets. The
business is also substantially funded with equity
investments; this provides more security with the firm. It
just needs to find ways of increasing the return generated
to the equity for the equity participant’s satisfaction. The
company also has a good level of profitability due to its
ability to market the university’s name to current and
prospective customers which are the students. However, the

company must find ways to retain this position in the long-
run.
Related Documents


![Informal Application for Educational Institution [Documentation] 594](https://static.cupdf.com/doc/110x72/577ccfff1a28ab9e78911fce/informal-application-for-educational-institution-documentation-594.jpg)
