University of Central Florida University of Central Florida STARS STARS Electronic Theses and Dissertations, 2004-2019 2008 Educational Handheld Video: Examining Shot Composition, Educational Handheld Video: Examining Shot Composition, Graphic Design, And Their Impact On Learning Graphic Design, And Their Impact On Learning Jason Hutchens University of Central Florida Part of the Educational Leadership Commons Find similar works at: https://stars.library.ucf.edu/etd University of Central Florida Libraries http://library.ucf.edu This Doctoral Dissertation (Open Access) is brought to you for free and open access by STARS. It has been accepted for inclusion in Electronic Theses and Dissertations, 2004-2019 by an authorized administrator of STARS. For more information, please contact [email protected]. STARS Citation STARS Citation Hutchens, Jason, "Educational Handheld Video: Examining Shot Composition, Graphic Design, And Their Impact On Learning" (2008). Electronic Theses and Dissertations, 2004-2019. 3579. https://stars.library.ucf.edu/etd/3579

Welcome message from author
This document is posted to help you gain knowledge. Please leave a comment to let me know what you think about it! Share it to your friends and learn new things together.
Transcript
University of Central Florida University of Central Florida
STARS STARS
Electronic Theses and Dissertations, 2004-2019
2008
Educational Handheld Video: Examining Shot Composition, Educational Handheld Video: Examining Shot Composition,
Graphic Design, And Their Impact On Learning Graphic Design, And Their Impact On Learning
Jason Hutchens University of Central Florida
Part of the Educational Leadership Commons
Find similar works at: https://stars.library.ucf.edu/etd
University of Central Florida Libraries http://library.ucf.edu
This Doctoral Dissertation (Open Access) is brought to you for free and open access by STARS. It has been accepted
for inclusion in Electronic Theses and Dissertations, 2004-2019 by an authorized administrator of STARS. For more
information, please contact [email protected].
STARS Citation STARS Citation Hutchens, Jason, "Educational Handheld Video: Examining Shot Composition, Graphic Design, And Their Impact On Learning" (2008). Electronic Theses and Dissertations, 2004-2019. 3579. https://stars.library.ucf.edu/etd/3579
EDUCATIONAL HANDHELD VIDEO: EXAMINING SHOT COMPOSITION, GRAPHIC DESIGN, AND THEIR IMPACT ON LEARNING
by
JASON SCOTT HUTCHENS A.A.S. Virginia Western Community College, 1996
B.A. Virginia Tech, 1998 M.A.Ed. Virginia Tech, 2002
A dissertation submitted in partial fulfillment of the requirements for the degree of Doctor of Education
in the Department of Educational Research, Technology, and Leadership in the College of Education
at the University of Central Florida Orlando, Florida
Fall Term 2008
Major Professor: Rosemarye Taylor

ii
© 2008 Jason Scott Hutchens
iii
ABSTRACT
Formal features of video such as shot composition and graphic design can weigh
heavily on the success or failure of educational videos. Many studies have assessed the
proper use of these techniques given the psychological expectations that viewers have
for video programming (Hawkins et al., 2002; Kenny, 2002; Lang, Zhou, Schwardtz,
Bolls, & Potter, 2000; McCain, Chilberg, & Wakshlag, 1977; McCain & Repensky,
1972; Miller, 2005; Morris, 1984; Roe, 1998; Schmitt, Anderson, & Collins, 1999;
Sherman & Etling, 1991; Tannenbaum & Fosdick, 1960; Wagner, 1953). This study
examined formal features within the context of the newly emerging distribution method
of viewing video productions on mobile handheld devices. Shot composition and
graphic design were examined in the context of an educational video to measure whether
or not they had any influence on user perceptions of learning and learning outcomes.
The two formal features were modified for display on 24 inch screens and on 3.5 inch or
smaller screens. Participants were shown one of the four modified treatments, then
presented with a test to measure whether or not the modified formal features had any
impact or influence on learning outcomes from a sample of 132 undergraduate college
students. No significant differences were found to occur as a result of manipulation of
formal features between the treatment groups.

iv
This work is dedicated to my family – my father, brother, and late mother –
whose support and love helped guide me through those dark little tunnels that I
sometimes found myself stumbling through during the course of this journey.
v
ACKNOWLEDGMENTS
By its very nature, multimedia is a team-oriented field. As such, a project of this
magnitude could not have been completed without the help of those whom imparted a
variety of support and assistance.
Mike Gluckman, John Griffin, and Peder Trusiak offered their services,
expertise, and time to help produce the video used for this study. George Miliotes
provided valuable insight on the subject matter of the video, and graciously dedicated
his time, knowledge, and skill in front of the camera.
Karen Porter, Sherri Owens, and Steve and Deena Grabowski all provided
editorial assistance in smoothing out the rough edges of the language of this document.
Darlene Hadrika generously allowed me access to her students in the Visual
Language curriculum. Adam Lenz provided valuable assistance during the labs
conducted to collect data from students in the Digital Media curriculum.
Apple Inc. graciously loaned me 20 iPods to collect data for this study. Darden
Restaurants Inc. provided substantial assistance and access to their employees.
And last but certainly not least, I cannot express enough kind words for the
support and guidance of Rose Taylor, George Pawlas, Haiyan Bai, and Robert Kenny,
for helping me craft a study worthy of the degree for which it was meant to achieve.
Thank you all so very much. I could not have done this without your
contributions.
vi
TABLE OF CONTENTS
LIST OF FIGURES ........................................................................................................... x
LIST OF TABLES ........................................................................................................... xi
LIST OF ACRONYMS/ABBREVIATIONS ................................................................. xiii
CHAPTER ONE: INTRODUCTION ............................................................................... 1
Introduction ................................................................................................................... 1
Review of the Literature ................................................................................................ 7
Formal Features ......................................................................................................... 9
Shot Types ............................................................................................................. 9
Composition ........................................................................................................ 11
Graphic Design in Television .............................................................................. 13
From Print to Digital ........................................................................................... 16
Statement of the Problem ............................................................................................ 18
Research Questions ................................................................................................. 19
Definition of Terms ................................................................................................. 20
Methodology................................................................................................................ 21
Pilot Study ............................................................................................................... 21
Research Procedures ................................................................................................ 24
Significance of the Study............................................................................................. 25
Limitations ................................................................................................................... 26
Summary...................................................................................................................... 27
CHAPTER TWO: REVIEW OF THE LITERATURE ................................................... 29
vii
The Ease and Convenience of Handhelds ................................................................... 29
Video and Compression for Handhelds ....................................................................... 37
Interlaced Images, Progressive Images, and Frame Rates ...................................... 43
Learning with Video .................................................................................................... 45
Studies Relating to Shot Composition and Sequencing .............................................. 53
Graphic Design ............................................................................................................ 65
The Language of Type ............................................................................................. 68
Video: Text and Design Research ........................................................................... 70
Leadership Considerations .......................................................................................... 79
CHAPTER THREE: METHODOLOGY ........................................................................ 84
Introduction ................................................................................................................. 84
Problem Statement ....................................................................................................... 84
The Educational Video ................................................................................................ 85
The Test Instrument ..................................................................................................... 88
Research Questions ................................................................................................. 90
Data Analysis ........................................................................................................... 90
Sample ......................................................................................................................... 91
Limitations ................................................................................................................... 92
Summary...................................................................................................................... 94
CHAPTER FOUR: ANALYSIS OF DATA ................................................................... 95
Introduction ................................................................................................................. 95
Reliability .................................................................................................................... 97
viii
Research Question One ............................................................................................... 98
Hypothesis One ....................................................................................................... 99
Research Question Two ............................................................................................. 102
Hypothesis Two ..................................................................................................... 103
Hypothesis Three ................................................................................................... 104
Hypothesis Four..................................................................................................... 105
Research Question Three ........................................................................................... 106
Hypothesis Five ..................................................................................................... 106
Research Question Four ............................................................................................ 109
Hypothesis Six ....................................................................................................... 110
Sample Viewer Trends and Knowledge .................................................................... 110
Handheld Viewing Motivations ................................................................................ 113
Summary.................................................................................................................... 114
CHAPTER FIVE: DISCUSSION AND RECOMMENDATIONS .............................. 115
Purpose ...................................................................................................................... 115
The Instrument ........................................................................................................... 116
Research Question One ............................................................................................. 118
Research Question Two ............................................................................................. 122
Research Question Three ........................................................................................... 123
Research Question Four ............................................................................................ 127
Conclusions ............................................................................................................... 128
Implications ........................................................................................................... 128
ix
Recommendations for Future Research ................................................................. 130
Summary.................................................................................................................... 133
APPENDIX A: PILOT STUDY IRB APPROVAL ...................................................... 135
APPENDIX B: DISSERTATION IRB APPROVAL ................................................... 137
APPENDIX C: PERMISSION FOR USE OF COPYRIGHTED MATERIAL ........... 139
APPENDIX D: TEST INSTRUMENT ......................................................................... 141
APPENDIX E: VIDEO SCRIPT ................................................................................... 146
LIST OF REFERENCES .............................................................................................. 156
x
LIST OF FIGURES
Figure 1: Comparison among LS, MS, and CU Shot Compositions ............................... 10
Figure 2: The Rule of Thirds ........................................................................................... 12
Figure 3: Full Screen Graphic Compared with a Lower Third Graphic .......................... 15
Figure 4: The NTSC DV Image Size .............................................................................. 40
Figure 5: A Close Up Look at Interlaced Frames ............................................................ 44
Figure 6: Serif vs Sans Serif Font Styles ......................................................................... 68
Figure 7: Orthochromatic vs. Anti-aliased Type ............................................................. 70
Figure 8: Comparison of Lower 3rd Treatments .............................................................. 87
Figure 9: Comparison of Full Screen Treatments ........................................................... 87
Figure 10: Sample Ethnicity ............................................................................................ 97
Figure 11: Self-Perceptions of Learning Questions ........................................................ 99
Figure 12: Reported Frequency of Viewing Handheld Video ....................................... 112
xi
LIST OF TABLES
Table 1: Removed Questions ........................................................................................... 22
Table 2: Reliability after Removing Five Questions ....................................................... 23
Table 3: Four Treatments for Study ................................................................................ 25
Table 4: Data Rate Comparison Between Signals ........................................................... 41
Table 5: Bitrate Conversion ............................................................................................. 42
Table 6: Four Treatments ................................................................................................ 88
Table 7: Four Study Treatments ...................................................................................... 96
Table 8: Reliability of Learning Outcomes Measures ( n = 132) .................................... 98
Table 9: Levene’s Test for Hypothesis One ANOVA ................................................... 100
Table 10: ANOVA for Hypothesis One ........................................................................ 100
Table 11: Levene’s Test for Hypothesis Two ANOVA ................................................ 103
Table 12: Descriptives for Hypothesis Two ANOVA .................................................. 103
Table 13: ANOVA for Hypothesis Two ....................................................................... 104
Table 14: Independent T-test: Learning Outcomes Between Two Groups ................... 105
Table 15: Kruskall-Wallace Test for Hypothesis Four .................................................. 106
Table 16: Preferred Method of Learning Question ....................................................... 107
Table 17: Frequency of Handheld Viewing Question ................................................... 107
Table 18: χ2 Test of Independence for Hypothesis Five ................................................ 107
Table 19: Pearson Correlation for Hypothesis Six ........................................................ 110
Table 20: Mann-Whitney U Test: Viewing Frequency Between Gender ..................... 111
Table 21: Kruskall-Wallace Test for Viewing Between Race ...................................... 111

xii
Table 22: Prior Knowledge of Wine Question .............................................................. 113
xiii
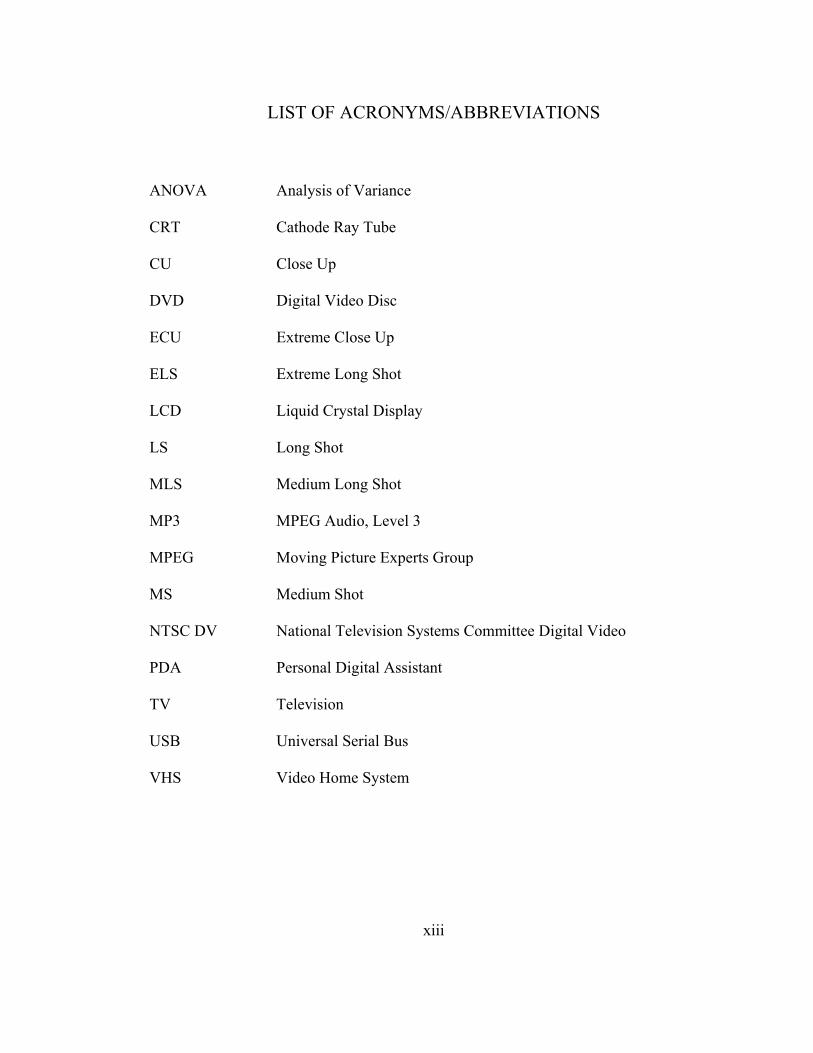
LIST OF ACRONYMS/ABBREVIATIONS
ANOVA Analysis of Variance
CRT Cathode Ray Tube
CU Close Up
DVD Digital Video Disc
ECU Extreme Close Up
ELS Extreme Long Shot
LCD Liquid Crystal Display
LS Long Shot
MLS Medium Long Shot
MP3 MPEG Audio, Level 3
MPEG Moving Picture Experts Group
MS Medium Shot
NTSC DV National Television Systems Committee Digital Video
PDA Personal Digital Assistant
TV Television
USB Universal Serial Bus
VHS Video Home System
1
CHAPTER ONE: INTRODUCTION
Introduction
Researchers have long studied the variety of influential effects that video and
motion pictures can have on both individuals and groups of people (Palmer, 1998; Roe,
1998). The emergence of the digital age has morphed the forms of traditional video and
motion pictures in ways too numerous for researchers to keep up with (Ward &
Greenfield, 1998). Videos can now exist as components of websites, software packages,
CD-Roms, and public kiosks. Further, many mobile devices such as personal digital
assistants (PDAs) and cellular phones are now capable of playing video programming
formatted for small screens. The emergence and increasing efficiency of wireless
networks capable of sending video content to these devices is resulting in a plethora of
consumer options for viewing video content (Wagner, 2005).
Developers are investing substantial sums of money to build the infrastructure
necessary to support mobile video. In 2004, telecommunications industry revenues
totaled $145 billion (Telecommunications Industry Association, 2007). Blum (2006)
predicted that the global telecommunications market will expand by nine percent in
2009 in the United States alone. Global increases are estimated even higher at 10%,
producing a staggering $3.6 trillion in predicted revenues. If met, these rates of growth
will surely fuel the availability of expanded wireless services.
Wireless handheld communications devices are evolving in tandem with the
growth of these networks. Cell phones, PDAs, and handheld multimedia tools are
2
converging in ways that are about to forever change the viewing of video content. PDAs
evolved from calculators in the mid 1970s (Koblentz, 2005). As computer chips and
circuitry became smaller and more powerful, successive generations of calculators were
able to offer more advanced tools and functions such as organizers and word processors.
Consumer demand for increasingly sophisticated, portable devices led to innovative
technologies such as pocket-sized digital cameras and cellular telephones, miniature
music players, and small, portable digital video players. More recently, these items have
begun to merge. Nearly all modern cell phones have cameras, video recorders, and some
form of software-supported organizational tools built into them. The quality and
resolution of these items increases with each generation. Many are also now
incorporating full MP3 audio players. The convergence of these media devices will
ultimately lead to the creation of new tools for viewing video content.
Mobile TV will increasingly be delivered by a device with multiple multimedia functions. Features such as radio, music player, camera and video recorder are already available on mobile devices. With these new multimedia functions mobile TV will offer a more active, interactive and personal viewing experience than that of traditional television. (Orgad, 2006, p. 2) “Everyone agrees that cell phone cameras will offer better quality and expanded
storage with time, making mobile video a force to contend with in the future”
(Grotticelli, 2006a, p. 36). Huge technological leaps toward this vision have been made
recently with the introduction of devices such as LG Electronics’ KE850 Prada phone
(available only in European countries) and Apple’s iPhone. Both products are fully
functioning phones with touch-screen control panels, internet access, video playback
capabilities, mp3 music players, and high resolution still cameras built into them. The
3
iPhone has a fully functional iPod portable music player built into it, up to eight
gigabytes of storage space, and sports a two megapixel camera. The touch-screen
interface allows easy use of multiple software tools such as word processors, personal
organizers, and internet mapping systems (Apple, 2007). The iPhone’s ability to play
video on its 3.5 inch screen makes it one of the most sophisticated mobile
communications devices currently on the market. Of course, other industries are already
following suit in mimicking the robust features of LG’s and Apple’s creations.
With an expanding infrastructure and more sophisticated devices, the industry
clearly believes that the proliferation of mobile video is on the horizon. “Robert Igler,
CEO of the Walt Disney Company, said his company sold 125,000 movie downloads
worth $1 million in revenue through Apple’s iTunes store during the first week
downloads were offered” (Grotticelli, 2006b, p. 34). Orgad (2006) stated that
“According to forecasts, by 2011 demand will explode with more than half a billion
customers subscribing to video services on their mobile phones” (p. 1). Feuiherade
(2006) projected more modest numbers, stating that, “According to analysts Informa
Telecoms and Media, more than 210 million people across the world will be watching
TV on mobile devices by 2011” (¶ 4).
Regardless of the forecast number, the direction of growth remains the same.
This leads educators to wonder how to leverage this technology as a tool for learning.
“As mobile connectedness continues to sweep across the landscape, the value of
deploying mobile technologies in the service of learning and teaching seems both self-
evident and unavoidable” (Wagner, 2005, p. 42).
4
If educators are seeking ways to utilize handheld video as a tool for learning,
then research into the aesthetic design factors appropriate for small screen viewing is
necessary in order to produce content which maximizes viewer learning potential. These
design factors are called ‘formal features’: the elements of video programming that
result from production techniques such as shot composition, editing pace, and graphic
design (Huston et al., 1983; Kozma, 1991; Roe, 1998). Anderson and Burns (1991)
stated that “There appears to be something special about within-program formal
features… that increase cognitive processing of content” (p. 13).
Producers use formal features for a number of reasons. They can influence the
mood, perception, and overall feel of a video. For instance, producers can utilize
different techniques of editing and pace to influence how a viewer interprets events
depicted on screen. One editing technique often used to convey a sense of urgency or
that a number of events have happened over a very short period of time is called a
montage. This is a series of edits of different scenes which occur very quickly to
increase the emotional intensity or anxiety of events within a story (Hickman, 1991;
Metallinos, 1996). Conversely, a producer may choose to convey a sense of boredom,
prolonging, or even isolation through the extended use of a static shot with no edits and
little or no motion happening within the frame.
Shot composition is another formal feature which can be used in a number of
different ways to convey information or affect viewers in psychological manners
(Kozma, 1986; McCain, Chilberg, & Wakshlag, 1977; McCain & Repensky, 1972; Zettl,
1998). Even similarly composed shots can have different psychological effects on
5
viewers based on the angle of the camera. Roe (1998) suggested that objects shot from
low camera angles appear stronger, more foreboding, and can even produce “increased
sensations of threatening force and/or increased speed” (p. 62) in viewers.
Television graphics are yet another formal feature warranting consideration
during program development. Graphic design can influence the mood of viewers and
their interpretation of messages being communicated (Las-Casas, 2006). This is another
reason why it is important to scrutinize suggestions which force designers into certain
choices for their designs. It is not new for graphic designers to have to work within
limitations of certain technologies (Las-Casas). However, the implications of suggested
graphic sizes, if taken at face value without any form of scientific inquiry, could impact
the message, emotion, or interpretation that the producer wishes to exert with a given
program. It is important to understand the limitations of a certain medium, and to work
within them in order to ensure that every element of a communicated message is being
received by the viewer (Hodges, 1996). If graphic elements are so small that they are
unreadable, then they will fail to convey information that a producer has deemed
necessary for full communication of the program’s message.
While the basic form of video content appears to remain relatively unchanged,
little research has been conducted on whether or not differences in the physical size of
the screen have any effect on how producers should design content for viewing on the
smallest of these aforementioned devices: PDAs and cell phones.
Many professionals in the industry have already formed opinions which
influence the methods that producers use to shape the messages they are tasked to
6
communicate via these small-screen devices. Some (Grotticelli, 2006b; Orgad, 2006;
Wang, Houqing, & Fan, 2006) feel that mobile video programs should minimize the use
of long shots (LS) and utilize mainly medium shots (MS) and close ups (CU) to convey
visual information on portable handheld video players. Others (Grotticelli, 2006b;
Plummer, 2007) have addressed the issue of graphic design for such programming,
stating that graphic elements should take up a significant portion of the screen to ensure
viewer legibility.
Video programming on personal mobile devices has the potential to positively
impact the usage and effectiveness of educational videos. Waggoner (n.d.) stated that
“mobile video probably has the most promise in training, where people learning how to
do a specific task can actually carry their training video in their pockets and refer to it
whenever needed” (¶ 7). Information seeking and retrieval is expected to be a main
usage of mobile video.
Consumers are likely to use their mobile televisions to seek time and place sensitive information, especially in situations when they are on the go, do not have internet access on a desktop PC, and need real time access to information. (Orgad, 2006, p. 6) Zettl (1998) established that formal features are the foundation for how
information is constructed by producers, and conversely, interpreted by viewers. He
even argued that proper usage of formal features could allow for accurate and reliable
predictions of viewer perceptions. If educational videos have a role to play within the
context of the coming mobile video revolution, then producers of educational video
content need to have sound scientific research to draw from in order to maximize the
potential of transferring knowledge to viewers.
7
Given the importance and impact of producer choices on the formal features of
any given educational video program, the researcher intended to expand on the robust
body of knowledge concerning formal features by looking at their impact on knowledge
retention in the context of viewing on small-screen mobile playback devices. The
researcher’s intent herein was to test the claims that others have made on proper formal
features to utilize for mobile video production and distribution. By scientifically
validating or disproving these claims, the hope was to shed some amount of light on
proper methodologies and paradigms for future video professionals who will create
content to be viewed within this new handheld theater.
Review of the Literature
A review of the literature reveals that many scientific studies on the cognitive
and psychological effects of formal features are conducted by isolating the components
in question and examining quantitatively measured differences. There are opposing
academic views on studies which utilize this methodology. Silbergleid (1992)
questioned the effectiveness of studies on individual formal features, stating that “it is
important to remember that a television program is more than just individual shots or
sounds working independently of one another” (p. 8). Tannenbaum and Fosdick (1960)
stated that “there is always a risk of generalizing from such experimental investigations”
(p. 261). These arguments arise from Gestalt psychology which asserts that the whole is
greater than the sum of its parts (Berryman, 1990; Koffka, 1999; Metzger, 2006).
Arguments that video programs should only be analyzed as whole parts are
problematic to the art of scientific inquiry. When comparing individual programs in their
8
entirety, an extreme number of variables is introduced that cannot be accounted for with
current methods of quantitative analysis. As such, the current scientific method is the
best measure that researchers have for a given set of variables – assuming, of course,
that all other components are equal. Goldner (as cited in Wagner, 1953) supported this
methodology, stating that “Only by dissection, analysis, and definition can we hope to
get closer to understanding and creating the special film that is to be the sharp and
dependable tool for training” (p. 28).
Research on formal features of film and video is not a new body of scientific
inquiry. Around the beginning of World War II “serious experimental research done
specifically relating to production techniques in educational films” (Wagner, 1953, p.
25) began to emerge. Since that time researchers have isolated and examined such
formal features as lighting angles (Tannenbaum & Fosdick, 1960), the use of fades and
transitions (Mercer, 1952), differences in camera angles (McCain, Chilberg, &
Wakshlag, 1977; McCain & Repensky, 1972), the use of animation and graphics (Miller,
2005; Morris, 1984), editing techniques and imagery (Sherman & Etling, 1991), editing
and pacing (Hawkins et al., 2002; Kenny, 2000; Lang, Zhou, Schwardtz, Bolls, & Potter,
2000; Schmitt, Anderson, & Collins, 1999) and many more.
Handheld video is still a very new technology; however, its roots derive from
traditional video. Orgad (2006) noted that mobile video technologies have not evolved in
a vacuum; rather, they have been built “upon existing platforms, primarily those of
television, mobile telephony, and the Internet” (p. 1). Inevitably, this change in
technology will bring with it modifications in the paradigms that drive the way that
9
videos are produced. For leaders in educational media development settings, this will
require new thinking in terms of the style and manner of educational media production,
as well as variations in distribution methodologies for produced content. As such, prior
research on the aesthetic factors of traditional video can properly guide investigations
into the development of educational video and multimedia content for a small screen
format. This study added to the body of research on the effects that formal features have
on viewers by isolating and comparing several specified features within an educational
video distributed and viewed on handheld devices as well as standard television sets.
Formal Features
Shot Types
Wagner (1953) stated that “good film form is basic to all the uses to which
motion pictures may be put” (p. 12). Thus, a study on design issues within educational
media must include a discussion on what makes ‘good form.’ One way that producers
shape the visual form of messages in video productions is by determining the type of
shot that conveys information during a particular point in time. In general, there are
three basic categories of shots (Burrows, Wood, & Gross, 1992; Hickman, 1991;
Millerson, 1990; Wagner, 1953). The long shot (LS) is far away enough from the main
subject or subjects that the viewer can obtain a sense of setting. Often times, this shot is
referred to as an establishing shot, as it establishes the orientation of the subjects within
a setting to one another. The close up (CU) is the exact opposite of the long shot.
Hickman (1991) stated “The close-up normally includes just the face or head of the
subject, from the top of the hair to the neckline” (p.139). Viewers will be more attuned
to the nuances of human expression if they view a close up shot of a person saddened or
enraged than viewing the same expressions in a long shot. Of course, close up shots –
like any shot – can consist of more than human subjects. One goal of close up shots is to
convey a sense of intimacy to the subject at hand. They can also serve to convey
information. For instance, a program about the craftsmanship of miniature ship modeling
will communicate the minutia of this art more effectively with close up shots than with
long shots.
The third type of shot is the medium shot (MS). These are shots which split the
difference in extremities between long and close up shots. Medium shots can be used to
convey a restrained sense of setting; allowing viewers to see events or objects within the
immediate vicinity of the subject. They can also be used to vary the pacing of
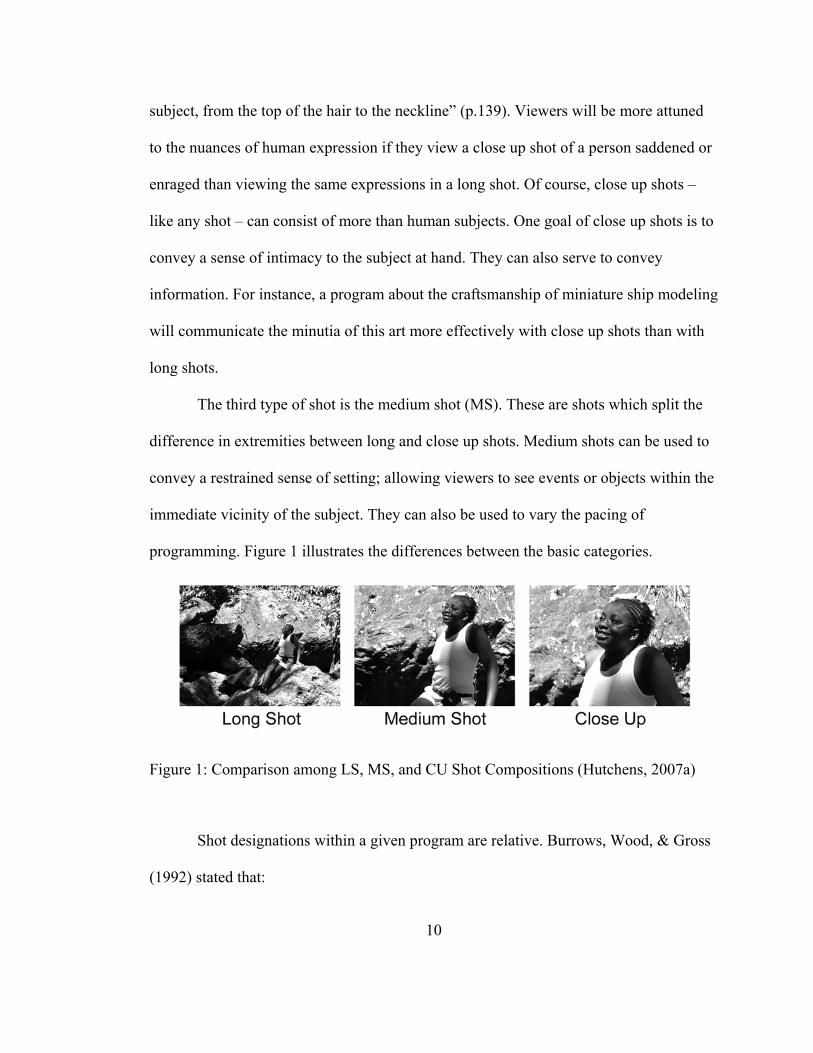
programming. Figure 1 illustrates the differences between the basic categories.
Figure 1: Comparison among LS, MS, and CU Shot Compositions (Hutchens, 2007a)
Shot designations within a given program are relative. Burrows, Wood, & Gross
(1992) stated that:
10
11
what is a long shot for one dramatic segment may be considered a medium shot in another situation. Generally, a medium shot of a person includes most of the body, perhaps cutting the talent off slightly above or below the waist. (p.151) There are, of course, variations on the degree to which shots differ from one
another. Designations such as extreme close ups (ECU), extreme long shots (ELS), and
medium long shots (MLS) are conventions used in television production, but the three
main shot styles discussed are the basis for all visual shot compositions in video
production.
Composition
An important aspect of professional video is the proper composition of imagery.
This refers to the alignment of objects within an image to produce an aesthetically
pleasing picture. Aiello (2000) stated that “Composition is at the heart of making
attractive video…” (p.16). One very useful guideline to use when one composes camera
shots is the ‘rule of thirds.’ This is a concept that most professional photographers and
videographers utilize.
It has been widely held among classical artists throughout history that painting objects on a rectangular canvas at certain predictable points causes the eye to flow more easily across the canvas, resulting in greater harmony among the painting’s visual elements. (Aiello, 2000, p.16) Aiello is referring to the ancient Greeks’ “Divine Proportion”, which is a
mathematical ratio that has been used through the ages to design famous sculptures,
buildings, and artwork (Metallinos, 1996). The rule of thirds is a simpler, modernized
version of this concept, and is widely applied by artists and photographers alike when
composing imagery. The presence or absence of this composition technique can often
differentiate professional work from that of amateurs. In fact, some companies
manufacture cameras that feature auto-focus points based on its intersecting lines
(Leong, 2004).
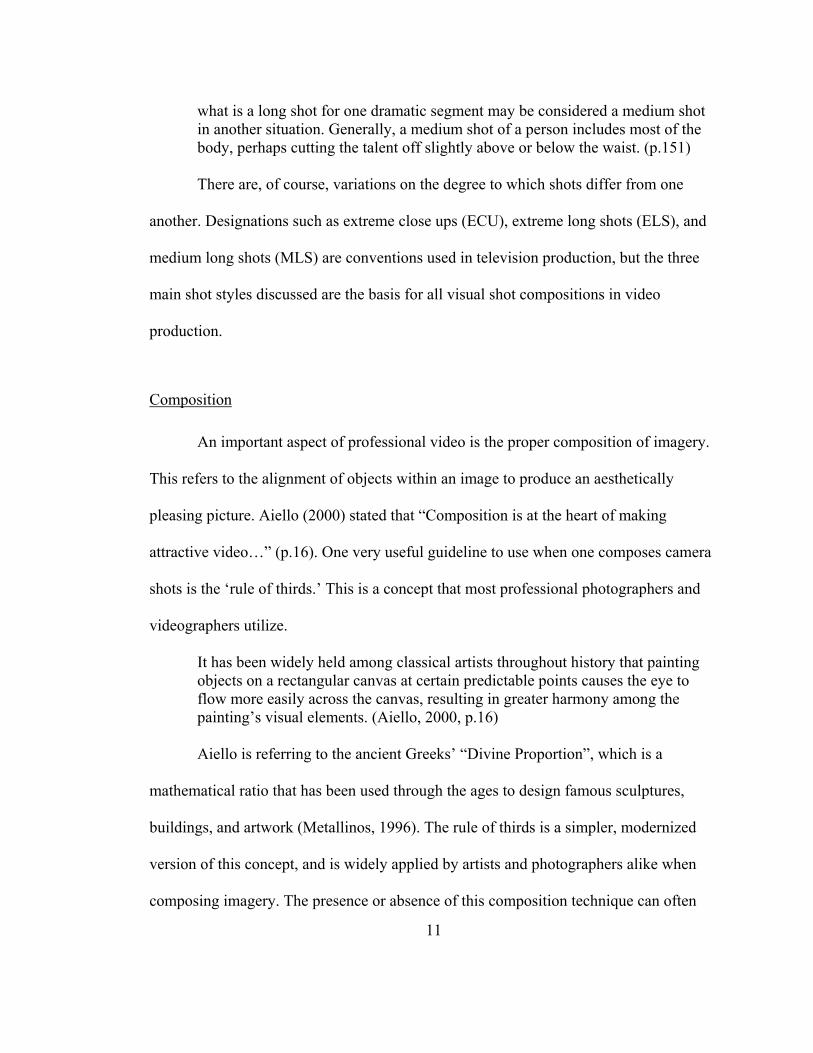
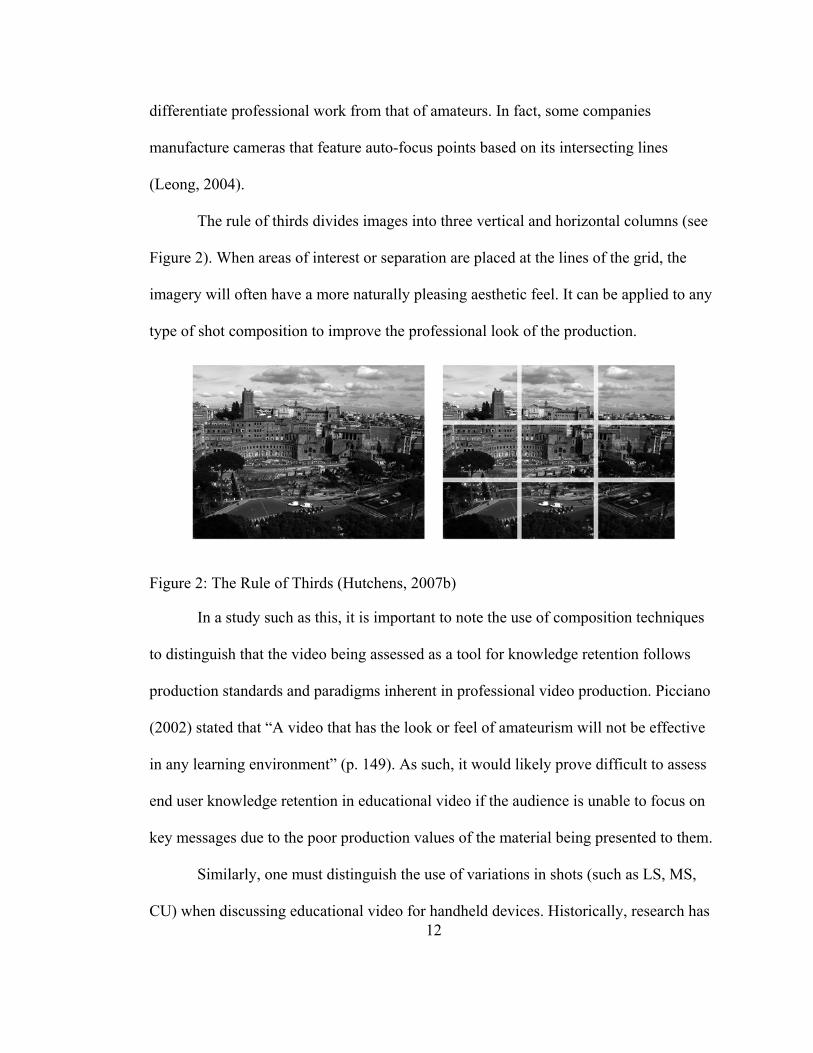
The rule of thirds divides images into three vertical and horizontal columns (see
Figure 2). When areas of interest or separation are placed at the lines of the grid, the
imagery will often have a more naturally pleasing aesthetic feel. It can be applied to any
type of shot composition to improve the professional look of the production.
Figure 2: The Rule of Thirds (Hutchens, 2007b)
In a study such as this, it is important to note the use of composition techniques
to distinguish that the video being assessed as a tool for knowledge retention follows
production standards and paradigms inherent in professional video production. Picciano
(2002) stated that “A video that has the look or feel of amateurism will not be effective
in any learning environment” (p. 149). As such, it would likely prove difficult to assess
end user knowledge retention in educational video if the audience is unable to focus on
key messages due to the poor production values of the material being presented to them.
12
Similarly, one must distinguish the use of variations in shots (such as LS, MS,
CU) when discussing educational video for handheld devices. Historically, research has
13
shown that variations in video image composition influence viewer interpretations of
meaning and attraction. McCain, Chilberg, and Wakshlag (1977) found “a near perfect
linear relationship between camera angle and perceived composure, sociability and
competence…. As the camera angle was raised, so too was a speaker’s perceived
credibility” (p. 39). McCain and Repensky (1972) found that the use of long, medium,
and close-up shots on comedians yielded significant differences in viewer attraction
depending on which type of shot was used on a given comedian.
Graphic Design in Television
“Captions and titles are a basic requirement of television” (Hurrell, 1973, p. 7).
In order to create effective graphics, “the designer needs to know in depth the perceptual
capabilities of his target audience” (Berryman, 1990, p.6). For handheld mobile video
devices, the most obvious perceptual consideration is that the viewing screen is in the
vicinity of three inches wide. This can have an impact on the legibility of graphic
communications content for video on handheld devices.
There is a large body of research on text, font-sizes, readability and legibility.
Historically, the classical era of this research applied to printed type in the 1920s to
1940s (Geske, 2000). The advent of television in the 1950s introduced a new medium in
which designers had to contend with displaying lettered content to viewers. The basis for
design theory from this era was drawn from previous studies in print until a body of
knowledge specific to the television medium existed which designers could draw from
14
(Hurrell, 1973). Later, in the 1980s, the personal computer emerged, adding yet another
genus of research on text and typographic displays as applied to computers.
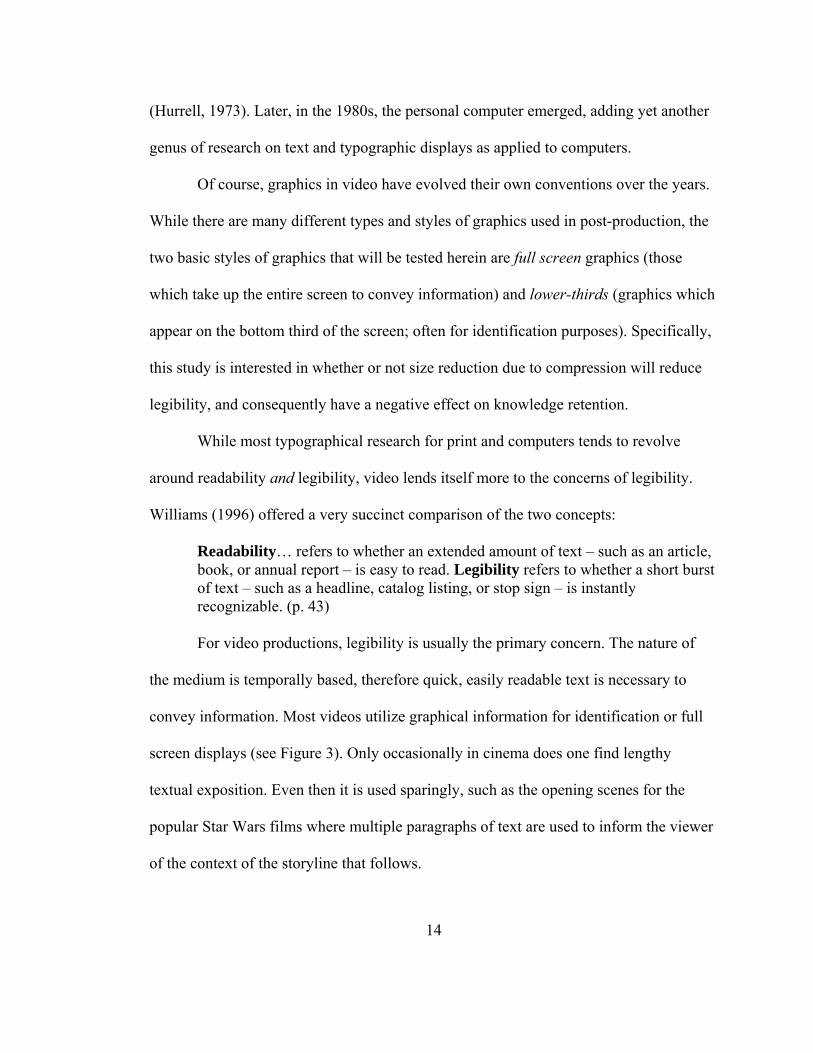
Of course, graphics in video have evolved their own conventions over the years.
While there are many different types and styles of graphics used in post-production, the
two basic styles of graphics that will be tested herein are full screen graphics (those
which take up the entire screen to convey information) and lower-thirds (graphics which
appear on the bottom third of the screen; often for identification purposes). Specifically,
this study is interested in whether or not size reduction due to compression will reduce
legibility, and consequently have a negative effect on knowledge retention.
While most typographical research for print and computers tends to revolve
around readability and legibility, video lends itself more to the concerns of legibility.
Williams (1996) offered a very succinct comparison of the two concepts:
Readability… refers to whether an extended amount of text – such as an article, book, or annual report – is easy to read. Legibility refers to whether a short burst of text – such as a headline, catalog listing, or stop sign – is instantly recognizable. (p. 43) For video productions, legibility is usually the primary concern. The nature of
the medium is temporally based, therefore quick, easily readable text is necessary to
convey information. Most videos utilize graphical information for identification or full
screen displays (see Figure 3). Only occasionally in cinema does one find lengthy
textual exposition. Even then it is used sparingly, such as the opening scenes for the
popular Star Wars films where multiple paragraphs of text are used to inform the viewer
of the context of the storyline that follows.
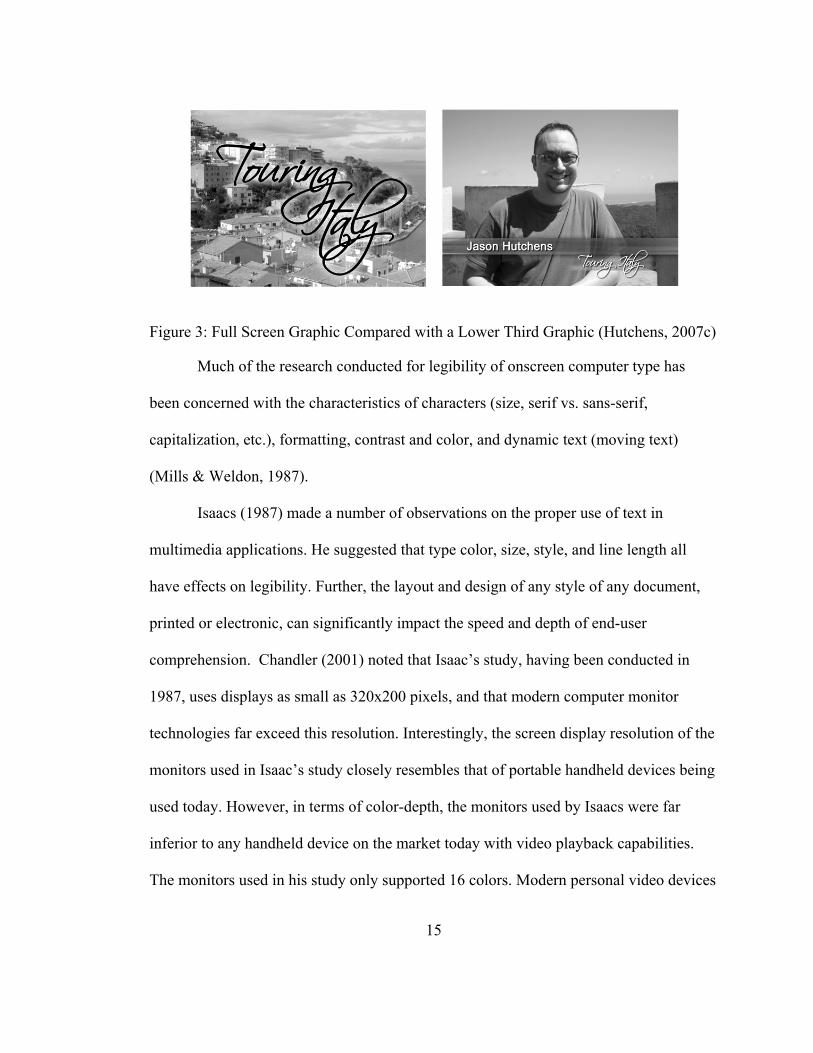
Figure 3: Full Screen Graphic Compared with a Lower Third Graphic (Hutchens, 2007c)
Much of the research conducted for legibility of onscreen computer type has
been concerned with the characteristics of characters (size, serif vs. sans-serif,
capitalization, etc.), formatting, contrast and color, and dynamic text (moving text)
(Mills & Weldon, 1987).
Isaacs (1987) made a number of observations on the proper use of text in
multimedia applications. He suggested that type color, size, style, and line length all
have effects on legibility. Further, the layout and design of any style of any document,
printed or electronic, can significantly impact the speed and depth of end-user
comprehension. Chandler (2001) noted that Isaac’s study, having been conducted in
1987, uses displays as small as 320x200 pixels, and that modern computer monitor
technologies far exceed this resolution. Interestingly, the screen display resolution of the
monitors used in Isaac’s study closely resembles that of portable handheld devices being
used today. However, in terms of color-depth, the monitors used by Isaacs were far
inferior to any handheld device on the market today with video playback capabilities.
The monitors used in his study only supported 16 colors. Modern personal video devices
15
16
are capable of producing images with millions of colors. Additionally, while the
physical size of the screen is not documented in his paper, it is likely that the screens
being utilized were much larger than a two or three inch monitor, which is common for
handheld monitors. So, while aspects of Isaacs’ research can be taken into consideration
when studying graphics in handheld video, advancements in the quality of displays must
also be taken into account.
From Print to Digital
Effective graphic design practices for television are derivative of traditions in
printed design. Hurrell (1973) stated that, “The standard demanded of a typographer in a
printing house is the basis of all lettering produced for television” (p. 8). That said,
Bringhurst (1996) stated:
The typographer’s one essential task is to interpret and communicate the text. Its tone, its tempo, its logical structure, its physical size, all determine the possibilities of its typographic form. The typographer is to the text as the theatrical director to the script, or the musician to the score. (p. 20) Hurrell’s (1973) deference to print design is interesting in that in many cases, it
appears that this sentiment has been lost over the years. For instance, Millerson (1990)
stated that, “Titling is there to inform your audience. They should be able to read it
quickly, easily, and unambiguously. If they cannot, it has failed in its purpose” (p. 348).
He made no mention or reference to utilizing a visual design to synch graphics with the
overall style of a production. Instead, he focused the remainder of the chapter to discuss
only the technical considerations for creating graphics for video. Burrows, Wood, and
Gross (1992) probed slightly deeper into topics such as kerning (the adjustment of space
17
between individual letters) to achieve a more visually appealing design. However,
neither text spent the amount of time and effort devoted to the subtle elements of design
as have many texts on typography. Some typographers approach a nearly spiritual
conviction when expounding on the fundamentals of the art:
Some of what a typographer must set, like some of what any musician must play, is simply passage work. Even an edition of Plato or Shakespeare will contain a certain amount of routine text: page numbers, scene numbers, textual notes, the copyright claim…. But just as a good musician can make a heart-wrenching ballad from a few banal words and a trivial tune, so the typographer can make poignant and lovely typography from bibliographical paraphernalia and textual chaff. The ability to do so rests on respect for the text as a whole, and on respect for the letters themselves. (Bringhurst, 1996, p. 24) Spacing (the act of organizing information within a fixed space), leading
(adjusting space between lines of text), kerning and alignment of elements are examples
of considerations which typographers concern themselves with that often fail to appear
in television production texts. This is unfortunate, as frequently on projects with smaller
budgets the post-production editor must also act as the graphic designer. Even
experienced editors tasked with designing graphics for their own project may undermine
the ability to communicate key concepts due to the fledgling, unprofessional look of the
graphic elements they are tasked to create. This is especially important given the cultural
expectations that viewers have for different modes of media (Lupton, 2004). When
editors do not have a functional grasp of effective typographic design, they risk
negatively impacting viewer impressions of their programmed content.
While often lacking in aesthetic principles of design, television production texts
usually offer some minimal guidelines for graphic design, mostly based on the
technological limitations of the medium itself. Burrows et al. (1992) suggested that font
18
sizes for on-screen type should not be smaller than one fifteenth of the size of the screen.
One reason for this general rule-of-thumb relates to the affect that thin lines (one pixel or
smaller) have on the NTSC signal. When elements of a font are reduced to one pixel or
smaller a visual flickering will occur that can be distracting to the viewer. This effect
occurs as a result of the structure of the NTSC signal, which will be explored in-depth in
Chapter Two. The important point herein is that the same phenomenon does not occur
with handheld video because the signal is fundamentally different than that of a standard
NTSC DV signal. In the end, small font sizes may still affect legibility on handheld
media viewing devices. Millerson (1990) suggested using fonts no smaller “than about
1/10 to 1/25 of the picture height” (p. 349). However, as with other older production
texts, these guidelines are based on viewing content on common television set displays,
not handheld screens.
Statement of the Problem
Though portable wireless handheld video is new, industry practitioners are
already forming opinions of the proper types of shots and graphics that should be used
for producing content for small screens. Wang, Houqiang, and Fan (2006) stated that
“users often feel that the display resolution greatly affects their perceptual experience
with the limited screen size” (p. 565). Orgad (2006) stated that “Because of the small
size of the screen mobile TV programmes are likely to lend themselves to focusing on
talking heads, where viewers will be able to watch close-ups and see the details, rather
than capture a wide scene” (p. 7). Grotticelli (2006b) stated that for handheld video,
lower-third graphics should “appear on the full lower half of the screen on a cell phone”
19
(p. 34). If these statements are true, then producers should follow these guidelines in
order to ensure that messages are being adequately communicated to viewers. If, on the
other hand, they are simply based on false speculation, then producers following these
guidelines are being limited in the types of formal features that can be used to convey
intended messages. This, in turn, may hamper their ability to communicate messages in
the most effective manner.
While these recommendations are being made by experts in the field, they have
not been tested via quantitative or qualitative measures. Despite the absence of formal
research on these ideas, their general acceptance is already changing how digital video is
produced and compressed for handheld distribution. Indeed, engineers are already
testing tools which would automatically reconfigure scenes from long shots to close ups
when converting video for playback on handheld devices (Wang, Houqiang, & Fan,
2006).
The problem to be addressed in this research was whether or not these prescribed
stylistic formulas were necessary. There was a need for formal research into these ideas
before widespread shifts within the industry locked producers into inefficient or
ineffective paradigms that would negatively affect the messages being communicated
via this new medium.
Research Questions
1) What differences, if any, exist between self-perceptions of learning with video training materials formatted for handheld devices compared to large screen delivery mediums?
20
2) Is there a difference in learning outcomes based on shot composition and graphic design formatting for educational videos being viewed on 3.5 inch screens (or smaller) compared to 24 inch monitors? (See Table 3 for grouping.)
3) Is there a relationship between user learning preferences for viewers watching
educational video content on handheld devices or televisions and viewer frequency of watching educational videos on handheld devices?
4) What are the relationships, if any, between the user frequency of viewing videos
on handheld devices and learning outcomes?
Definition of Terms
Close up (CU): a shot composed as a close view of the subject (Burrows et al., 1992) Full Screen: graphics which fill the television screen with information about content being presented (Hickman, 1991) Kerning: the act of vertically organizing text information within a fixed space (Williams, 1996) Legibility: the ease with which a short burst of text is recognizable (Williams, 1996) Lower Third: graphics which appear in the lower third portion of a screen; usually to identify content being presented (Burrows et al., 1992) Long Shot (LS): a shot composed as a far away view of the subject (Zettl, 1976) Master Sommelier: the highest level of certification achievable in the wine profession (Court of Master Sommeliers, 2007) MP3 (MPEG Audio, Level 3): a popular digital audio recording format (Wooton, 2005) Medium Shot (MS): a shot composed as a medium view of the subject (Burrows et al., 1992) NTSC DV: National Television Systems Committee Digital Video – the standard digital television signal used by the United States and Japan (Symes, 1998) Personal Digital Assistant (PDA): a handheld electronic organizer which often has multimedia capabilities such as cameras, video players, text editing software, etc. (Koblentz, 2005)
21
Readability: the ease with which an extended amount of text can be read (Williams, 1996) Spacing: the act of horizontally organizing text information within a fixed space (Williams, 1996) Full Screen Graphic: a graphic image which fills a television screen (Burrows et al., 1992)
Methodology
This study utilized a mixed method consisting of both quantitative and
qualitative feedback via a proprietary test instrument. Participants viewed a ten minute
video about the basics of professional wine tasting. The subject matter within the video
and test instrument was reviewed and confirmed accurate by a Master Sommelier. This
distinction is awarded by the Court of Master Sommeliers and is regarded as one of the
highest professional merits within the wine trade. Only 158 individuals worldwide hold
this title (Court of Master Sommeliers, 2007). The same sommelier also provided
instruction within the educational video as the on-camera talent.
Pilot Study
The test instrument was tested for reliability with a pilot study (n = 48). The goal
of the pilot study was to test the effectiveness the instrument. Participant ages ranged
from 21 to 67 years, and all had either normal vision or vision that was properly
corrected with either glasses or contacts during viewing of their respective treatments.
Participants viewed the ten minute instructional video then took an 18 question paper
test. Average scores for the test were 88.54. Data for the pilot study were analyzed with
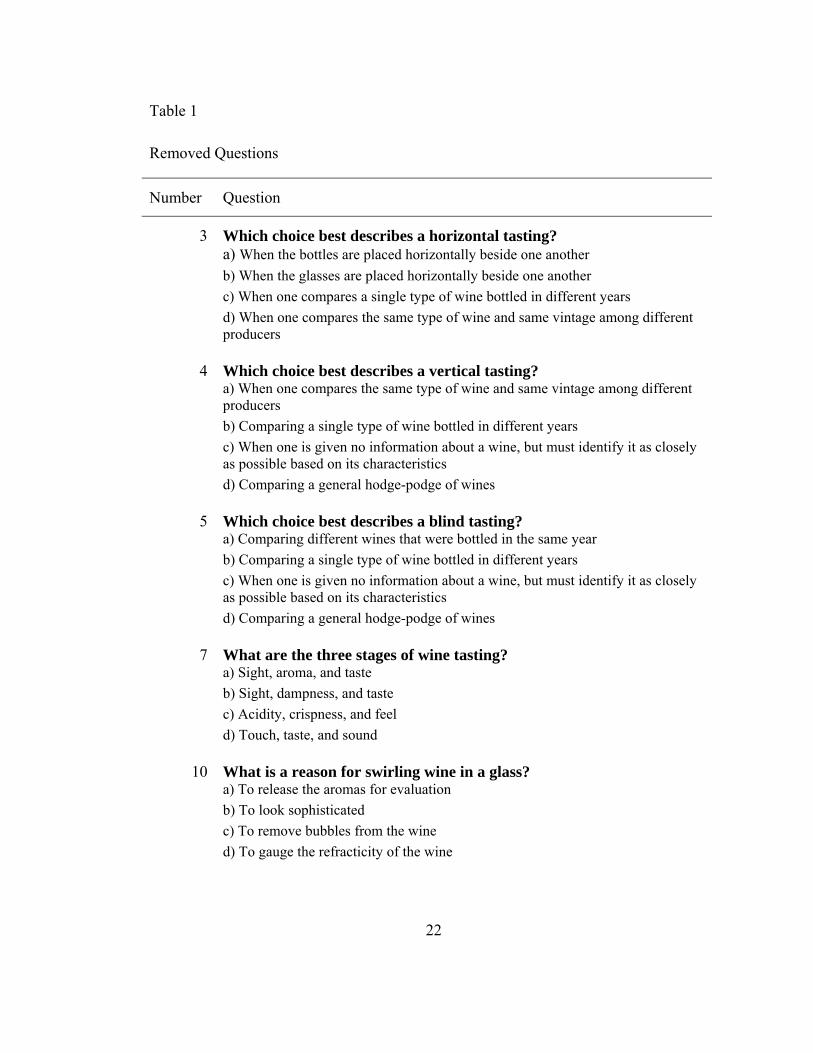
Chronbach’s Alpha. During this process, eight questions were removed (see Table 1).
22
Table 1
Removed Questions
Number Question
3 Which choice best describes a horizontal tasting? a) When the bottles are placed horizontally beside one another b) When the glasses are placed horizontally beside one another c) When one compares a single type of wine bottled in different years d) When one compares the same type of wine and same vintage among different producers
4 Which choice best describes a vertical tasting? a) When one compares the same type of wine and same vintage among different producers b) Comparing a single type of wine bottled in different years c) When one is given no information about a wine, but must identify it as closely as possible based on its characteristics d) Comparing a general hodge-podge of wines
5 Which choice best describes a blind tasting? a) Comparing different wines that were bottled in the same year b) Comparing a single type of wine bottled in different years c) When one is given no information about a wine, but must identify it as closely as possible based on its characteristics d) Comparing a general hodge-podge of wines
7 What are the three stages of wine tasting? a) Sight, aroma, and taste b) Sight, dampness, and taste c) Acidity, crispness, and feel d) Touch, taste, and sound
10 What is a reason for swirling wine in a glass? a) To release the aromas for evaluation b) To look sophisticated c) To remove bubbles from the wine d) To gauge the refracticity of the wine
23
Number Question
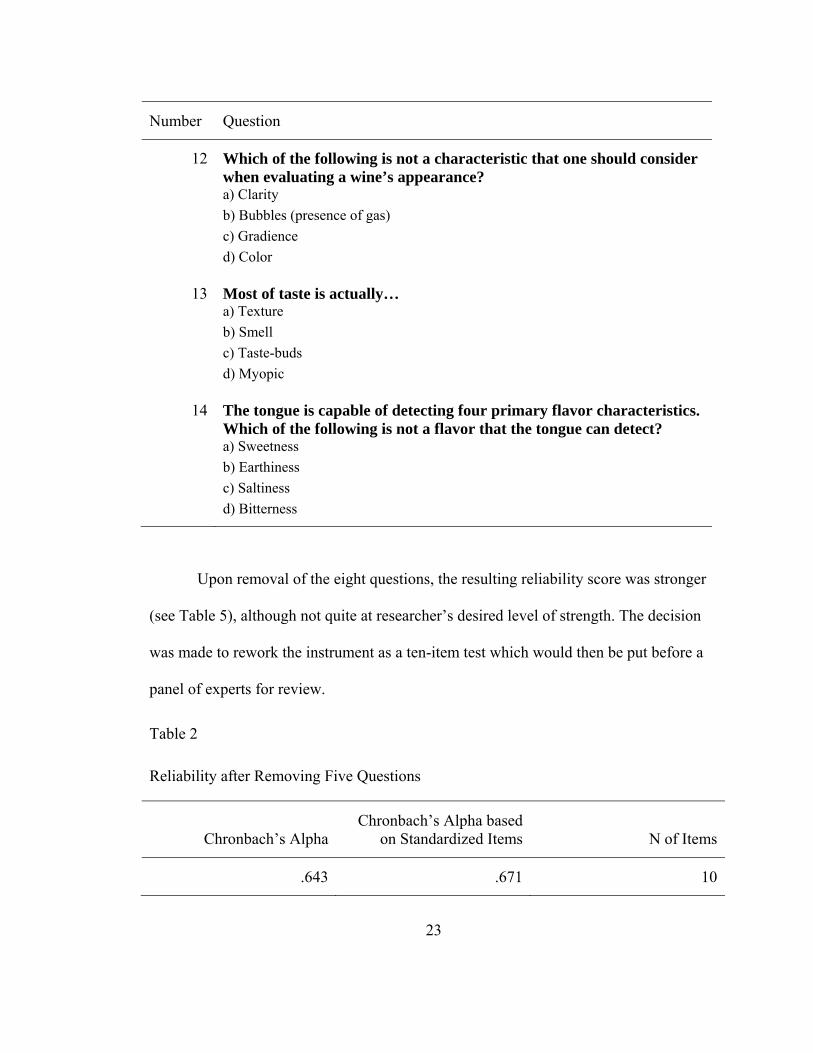
12 Which of the following is not a characteristic that one should consider when evaluating a wine’s appearance? a) Clarity b) Bubbles (presence of gas) c) Gradience d) Color
13 Most of taste is actually… a) Texture b) Smell c) Taste-buds d) Myopic
14 The tongue is capable of detecting four primary flavor characteristics. Which of the following is not a flavor that the tongue can detect? a) Sweetness b) Earthiness c) Saltiness d) Bitterness
Upon removal of the eight questions, the resulting reliability score was stronger
(see Table 5), although not quite at researcher’s desired level of strength. The decision
was made to rework the instrument as a ten-item test which would then be put before a
panel of experts for review.
Table 2
Reliability after Removing Five Questions
Chronbach’s AlphaChronbach’s Alpha based
on Standardized Items N of Items
.643 .671 10
24
Once the questions were removed and the posttest was reworked, it was
presented to a panel of eight experts in the field of educational research for review. A
number of modifications were made to both the quantitative section of the instrument, as
well as to the qualitative sections designed to collect demographic information and user
preferences and opinions of learning with various media formats. Upon receiving
feedback on ways to improve the instrument, the researcher implemented the
recommended changes to create the instrument used to collect data for the study. While
the Chronbach’s Alpha scores from the initial pilot study were not quite where the
researcher desired them to be, it was anticipated that the power of the test instrument
would increase given a larger sample size.
Research Procedures
The researcher looked at other similar research into formal features and their
cognitive effects to establish a similar sample size. Based on previous similar research
by Kenny (2002) and Roe (1998) the sample size consisted of approximately 150
individuals. Recruiting took place from the student body at the University of Central
Florida. Participants were scheduled in groups of approximately twenty individuals at a
time to view their assigned treatment in laboratory settings. Each group was randomly
assigned to one of the four treatments.
During the study, participants watching on handheld devices viewed their
segments on iPods loaned to the researcher by Apple Inc. specifically for use in this
study. Since all participants viewed their individual devices within the same room, each
was provided headphones so as not to distract the others around them.
25
After watching a randomly selected video treatment, participants took the test
instrument. Quantitative data collected via the instrument was analyzed to determine the
answers to the stated research questions. Qualitative feedback was solicited by means of
open-ended questions within the instrument which explored learning preferences and
reasons for viewing educational video content on handheld mobile devices. The
information collected was used for additional insight into participants’ overall
experiences with the material.
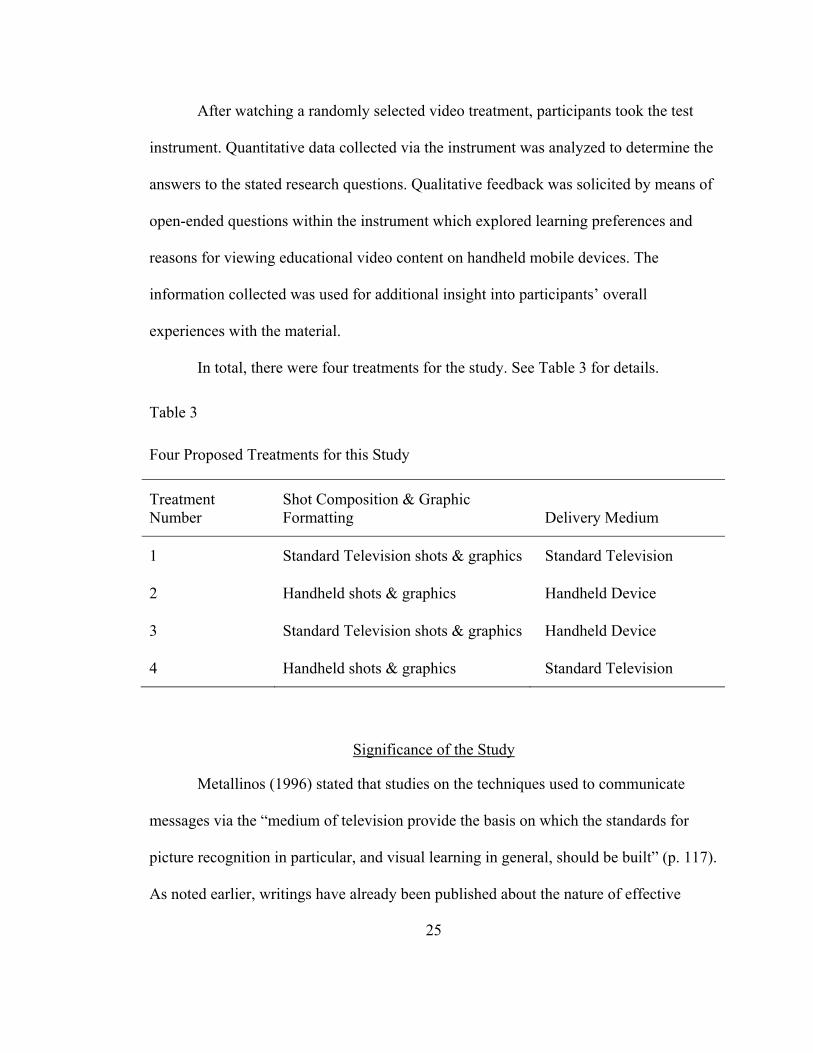
In total, there were four treatments for the study. See Table 3 for details.
Table 3
Four Proposed Treatments for this Study
Treatment Number
Shot Composition & Graphic Formatting Delivery Medium
1 Standard Television shots & graphics Standard Television
2 Handheld shots & graphics Handheld Device
3 Standard Television shots & graphics Handheld Device
4 Handheld shots & graphics Standard Television
Significance of the Study
Metallinos (1996) stated that studies on the techniques used to communicate
messages via the “medium of television provide the basis on which the standards for
picture recognition in particular, and visual learning in general, should be built” (p. 117).
As noted earlier, writings have already been published about the nature of effective
26
formal features within this medium: particularly with regard to the types of shot
compositions that should be used, as well as the design of informational graphics within
mobile video programming. However, not all of these claims have been made on the
basis of scientific inquiry. This study was designed as an empirical analysis to test these
assumptions; specifically for educational video products where knowledge retention is
the goal. The aim was to directly test these assumptions in the context of handheld video
as an educational tool. Shot compositions and graphics were manipulated to measure for
the presence of any possible relationships to knowledge retention in an educational
video. The outcome of these findings was intended to expand upon the body of research
on video formal features by exploring their impact within the context of mobile,
handheld viewing.
Limitations
This study was designed to expand upon prior research into the formal features
of video programming. As the medium of handheld video was new, no prior studies
examining formal features of programming on small screens existed to draw from.
Instead, methodologies used in older studies examining formal features in standard
television formats were studied and modified to develop a methodology for this
research. Additionally, a proprietary test instrument was developed for use in this study.
Efforts were made to maximize its reliability, as documented in the section on
methodology.
The study was conducted using a sample of college students studying
communications and digital media. The subject matter of the instructional video was
27
specifically chosen to, hopefully, capture a general level of interest across populations.
However, not everyone, even college students, was likely to have found interest in the
practice of wine tasting. This may have affected their level of involvement in the
training, and subsequently, their scores on the test instrument. Conversely, it was
assumed that some taking this module may already have an advanced knowledge of the
topic, which might also have influenced test instrument scores. It was assumed that
participants with either of these characteristics (non-interest in the topic or advanced
knowledge of the topic) were evenly distributed throughout the treatments through the
process of random sampling.
Since the participants took the test instrument immediately after viewing the
instructional video, this study did not take into account any potential long-term learning
retention. It represented a measurement of knowledge immediately retained by viewers
based on key points accentuated within the video through the methodical use of the
formal features described herein. Their affects on long-term learning and/or application
of the skills presented within the video were beyond the scope of this study.
Summary
The contents of this chapter have consisted of an introduction to topics and ideas
which are the crux of this proposed study. A review of literature was presented which
substantiates the relevance of this investigation: its goal being to further the robust body
of research on formal features of mobile, handheld video programming. Research
questions have been presented along with a proposed methodology for investigating
them.
28
The following chapter is a comprehensive review of the relevant literature
regarding this proposed study. It begins with a discussion of the vast monetary backing
and predictions of the eminent growth of the mobile video market. Differences in the
underlying technology between standard television and portable handheld video signals
are discussed during the section on compression. Formal features such as shot type,
composition, and graphic design will be further explored. Additionally, the technological
differences underlying NTSC DV and handheld mobile video signals are reviewed to
offer deeper insight into the paradigm and design differences between them. Finally,
leadership considerations for producers and leaders in video and multimedia production
environments are discussed.
The third chapter contains a thorough description of the methodology used to
develop the study and collect the appropriate data. Chapter Four features an analysis of
the collected data. Chapter Five consists of a discussion of interpretations of the
analyzed data, limitations of the study, and recommendations for further research.
29
CHAPTER TWO: REVIEW OF THE LITERATURE
The Ease and Convenience of Handhelds
Handheld computers allow access to immense amounts of information and
organizational tools literally in the palm of one’s hand. Reference materials such as
books, videos, audio, and software, as well as email, voice, and internet communications
are all accessible through the use of these devices. A myriad of professional disciplines
are finding success through educational programs which utilize the technology to teach
and train members of their profession. Colevins, Bond, and Clark (2006) demonstrated
how providing handheld personal digital assistants (PDAs) for nurses returning to the
field, who for various reasons had not been practicing for over five years, resulted in
successful reintegration back into their profession. Students with little experience using
handhelds were able to easily overcome learning gaps and dramatically improve comfort
levels with the technology over a relatively short period of time. “The percentage of
those who felt very comfortable with handheld rose from 22 percent to 66 percent”
(Colevins, Bond, & Clark, p. 46). Torre and Wright (2003) documented how students in
internal medicine residency programs found PDAs useful due to the ease of retrieval of
medical information and practical guidelines when diagnosing patients. Educators in the
same program reported that PDAs allowed them to evaluate their own performance in
training sessions and compare them to student evaluations. The insight which they
gained from these comparisons afforded them opportunities to modify their own
teaching practices as necessary to improve instruction.
30
Walthes (2005) discussed how one K – 12 school system found numerous
applications for improving education with the use of PDAs. For instance, science classes
used probes which attached directly to PDAs via Universal Serial Bus (USB) ports to
collect data on temperature, humidity, and motion. Students then exported the data to
spreadsheets for analysis. While collecting water samples from local streams, they also
used the wireless internet capabilities of the devices to research various bacterial strains
known to exist within regional tributaries.
Literature classes can also benefit from accessibility to PDAs. The advent of e-
books can allow students access to entire libraries of publications on their handheld
device. E-books, though broadly defined, are electronic books that can be downloaded
and reviewed on handheld devices in a multitude of formats (McGraw, Burdette, Seale,
& Ross, 2002). Walthes (2005) described how students can make notes and highlight
passages directly in an e-book. He also noted that students were able to use the search
functions within the software to instantly locate quotations or areas of text related to a
given topic.
Rivard (2005) documented how certain courses at the University of South
Dakota successfully implemented PDAs in disciplines such as law, medicine, and
computer science. Educators at the University had the ability to send quiz or test
materials to students remotely. Students were then able to take the examinations and
submit them back to instructors where the content could be instantly graded and logged
into a database for compiling student progress (Liebiger, 2002).
31
Thornton and Houser (2005) examined methods of using cell phones and PDAs
for Japanese college students studying English as a second language. First, they
compared email frequency between personal computer (PC) users and mobile device
users. Their findings are intriguing. Students in their study emailed their peers more
frequently about course issues with their phones or mobile devices than with personal
computers.
They also examined the use of ‘push-learning’ with mobile devices: sending
frequent text lessons to students as refresher lessons. They looked specifically at the
differences between push learning on PCs compared to mobile devices. Three times each
day during the duration of the study, students taking English courses were emailed mini-
lessons of 100 words of text or less that were formatted to be read on cell phone screens.
The lessons introduced up to five new vocabulary words per week in differing contexts,
and contained reviews of previously learned vocabulary words. The learning cycle lasted
for two weeks, and pre and post tests were used to measure gains in knowledge. They
found that not only did students prefer receiving these lessons on mobile devices, but
there was a significant difference in performance between the two groups. Those
receiving lessons on mobile devices outperformed those receiving lessons on PCs.
Industries are looking hard at the usage of PDAs to enhance their client
experiences. In particular, the restaurant industry is exploring the technology to improve
guest experiences (Manion & DeMicco, 2004). Scenarios have been painted where
customer preferences are collected and stored on customer appreciation cards. These
cards, containing Radio Frequency Identification Devices (RFIDs) can then translate
32
guest preferences to host and server handheld devices upon the customer’s return to the
restaurant. The type of information available to hosts and servers could allow them to
provide an ultra-personalized experience for guests, as well as increase the speed of
service. The positive effects of this have the potential to trickle through restaurant
operations. Orders taken via handhelds could be instantly transmitted to kitchen staff,
thereby eliminating the lag time required for a server to take an order then physically
move to a Point of Sale (POS) system to input orders so that they appear for kitchen staff
to begin preparing. The increased expediency could lead to higher guest satifaction as
well as increased table turnover. This would equate to more guests being served through
the duration of a day, thus more overall profits for a restaurant (Kimes, 2003; Kimes &
Thompson, 2004).
The usage of such systems is already seeing positive results through emerging
restaurant concepts such as Seasons 52 based out of Orlando, Florida. Panettieri (2003)
stated that Seasons 52’s handheld order-taking system is:
…functional and flexible. And for good reason: Seasons 52 is test-marketing a rotating weekly menu with seasonal food prepared a variety of ways. Waiters and waitresses who can’t keep track of the menu need merely reach for their Pocket PCs. (p. 54) Overall, more and more industries are using handheld devices in various ways to
improve efficiency within their respective trades. Trucking and shipping companies are
using PDAs to record and upload tire wear and damage to company databases for
analysis by mechanics. This allows them to determine if a vehicle requires maintenance
without the need to constantly bring trucks to repair shops for physical inspections
(Carretta, 2008). Military recruitment personnel are also finding uses for handheld
33
devices during ‘on-the-road’ recruiting shows to retrieve collected data from prospective
recruits and personalize pitches to encourage people to sign up for service (Voight,
2007). Continental Airlines has also been testing PDAs via a program where passengers
can board their planes without having to use a paper ticket. Instead, the airline sends a
barcode to an individual user’s cell phone or PDA, which can then be scanned from the
instrument’s screen (DeLollis, 2007). The use of handhelds in dietary monitoring and
recording has been explored for weight-loss programs (Yon, Johnson, Harvey-Berino,
Gold, & Howard, 2007). Law enforcement agencies dealing in information, security, and
fraud make extensive use of handheld devices to quickly analyze data while working in
the field (Ayers & Jansen, 2004).
Clearly industries are finding a number of fresh business uses for handheld
devices. Video content providers are responding to business and consumer demand by
pumping billions of dollars into an expanded infrastructure capable of supporting
hundreds of millions of subscribers by the end of the decade (Blum, 2006; Feuiherade,
2006; Orgad, 2006; Telecommunications Industry Association, 2007; Wagner, 2005).
Given the ever-expanding business, industrial, and consumer applications for
PDAs and handheld devices, it makes sense that educational video producers should
look to capitalize on the instant accessibility which these devices proffer. Other methods
of educational video delivery generally limit viewing options for end users. Viewers are
limited to static settings when accessing video players not designed for transit. Video
Home System (VHS) tapes offer the least mobility. The tapes are bulky, as are the
playback devices. While this technology is still moderately in use, it's market dominance
34
has almost completely succumbed to newer disk-based media. Digital Video Discs
(DVDs) offer some mobility. The disks themselves are smaller and more manageable for
transit. Small, portable DVD players exist for those willing to pay several hundred
dollars for them. While these portable players are designed for mobility, they are
generally only slightly smaller than a standard laptop computer, and therefore require a
relatively large amount of space for transport and usage. They are, by and large, best
suited for long-duration trips such as long-distance flights or train rides where the user
will be sitting stationary for long periods of time. Further, one has to physically load
media into either of the two devices in order to access a given program: a seemingly
small effort, but one which may contribute to a decision to not view any given program
due to general inconvenience for the end user.
Handheld devices with video playback capabilities, on the other hand, do not
offer the same constrictions. The devices themselves are small enough to fit in one’s
pocket. Therefore traveling with them does not require lofty amounts of space on one’s
person. Video content on these devices can be viewed virtually anywhere at any time.
There are no bulky disks or tapes required to load into them. Media can be downloaded
onto the devices wirelessly and played back at the user’s convenience. The combined
size and ease of accessibility make the devices ideal for viewing during both long-
distance travel, or short distance commutes. Consider a scenario of the daily commute of
a subway patron. The traveler must wait in a crowded tunnel for the arrival of their tram,
then board the tram with standing room only for a 20 minute ride to their exchange or
final destination. At no point during that scenario does it make sense for the traveler to
35
unpack a portable DVD player, select and load a disc of educational programming, and
attempt to watch the chosen video while standing among a crowd of people. However,
with a smartphone, PDA, or other mobile device, one merely has to reach into one’s
pocket and retrieve the device, then access the desired program that has already been
downloaded or stored on it. A small set of earbuds will solve any problems one has with
hearing the programming in a noisy situation. When the subway comes to a stop, the
user merely presses pause on the device, slips it back into a pocket, and easily moves
along with the crowd to the next phase of transit.
Cleary this example illustrates the advantages that such devices have in terms of
mobility and convenience. Educators looking to teach via the medium of video should
be weighing the implications of the ability to take advantage of the ease, convenience,
and increasing proliferation of this new technology. Of course, when dealing with new,
emerging technologies, fresh questions inevitably spring forth. Should producers looking
to make their educational programming available on handheld devices alter the stylistic
elements of a program to take advantage of the obvious differences in screen size? No
real scientific inquiries into this question currently exist. However, studies of similar
shifts in technological applications of educational materials can provide some insight to
these questions. In particular, this study will examine whether or not there are effects on
knowledge retention based on changes in graphic design (particularly type) and shot
composition when producing content specifically created for viewing on handheld
devices.
36
This will be of interest to video producers because many times alternate
distribution methods of video programming are an afterthought of the finished product.
This was often problematic when video was first made available for internet distribution.
Only a decade ago, in the 1990s, video began to become prevalent on the internet.
However, early compression technologies were not as effective at preparing video for
viewing across small bandwidths. Therefore, differing production techniques were often
recommended to ensure smoother playback for end users (Terran Interactive Inc., 1999).
For instance, lighting requirements were more stringent. It was difficult to achieve
viewable video on the web if there were low levels of lighting when capturing footage.
Compression technologies did not deal well with lots of movement within video frames,
so producers would often lock down shots on a tripod to minimize the amount of motion
in a given shot. The use of camera moves such as zooms, pans, or tilts was also
discouraged for the same reasons. Producers would try to keep details within shots to a
minimum. The simpler the shot, the easier it was for end users to make out what it was
that they were supposed to be viewing. In short, the process of preparing video for
distribution on a website was significantly different than preparing the same or similar
content for viewing on a standard television set. Even simple things could make a big
difference in how effective a program compressed for playback. For instance, Terran
Interactive cautioned producers when shooting subjects outdoors, stating that producers
should “Beware of trees moving in a breeze – the high detail and subtle changes between
frames make both temporal and spatial compression difficult” (p. 16).
37
The infancy of video distribution via the internet brought with it changes in the
paradigms that producers used to create products for that medium. Over time,
compression technologies improved and bandwidth used to move data from servers to
end users increased. As a result, recommendations such as the example from Terran
Interactive Inc. (1999) fell to the wayside, and producers were given more freedom in
how they created video content for the web. As the industry is currently breaking ground
in distributing videos via wireless handheld devices, the question becomes whether or
not new shifts in paradigms are necessary in order to create effective videos for this new
delivery method.
The bulk of concerns which lead to the initial shifts in production techniques
when creating video for web playback were a result of compression requirements. As
such, the next section focuses on what compression is, how it works, and why it is
important for distributing video content to handheld, wireless devices.
Video and Compression for Handhelds
There are fundamental differences in the types of signals used to view video on
standard televisions compared to the same video played back on wireless handhelds. In
an ideal world a study of this nature would be able to look beyond the technical
specifications of video signals and concentrate solely on the cognitive science
underlying the use of handheld video as an educational tool. To an end user, the only
difference in appearance is the physical size of the image. However, the sequences being
viewed, though similar in shape and form, are very different from one another beneath
the surface. Studies have shown that the characteristics of video compression have had
38
mixed effects on end user perceptions (Chen, Ghinea, & Macredie, 2006; Gulliver, Serif,
& Ghinea, 2004; Ong, et al., 2006; Rimmel, Keval, Mansfield, & Hands, 2005).
Understanding how these signals are manipulated for playback is a crucial part of the
production process. Therefore, it is necessary to detail the compression process and
specify the signals that will be compared within this study.
The most challenging problem in trying to articulate the differences in existing
video signals is that there are a lot of them. During the era of analog television the
Federal Communications Commission (FCC) specified the signal that was to be used for
transmitting video broadcasts. As such, all televisions and video recording devices were
designed with one signal in mind. There were differences in quality among differing
manufacturers, but the underlying signal that was output from cameras and then viewed
by end users was the same. Decades later when a digital version of this signal emerged,
companies such as Sony, Panasonic, JVC, and others began creating different
proprietary digital video specifications which were often incompatible with one another.
This time, the FCC refrained from forcing compliance with one specific signal, and
instead let developers choose from a variety of digital signal formats. Essentially, the
government let the battle for signal dominance be fought out within the marketplace.
The industry responded with a wide array of formats coming from a multitude of
manufacturers. Austerberry (2002) stated that “There have been about 100 formats
developed over the last 50 years, but less than 20 have been successful in the
marketplace” (p. 64). A discussion of these various types and kinds of video
specifications that exist and compete for market dominance is impractical due to the
39
extensive list of varying formats. Therefore, this section touches on the most common
U.S. signal and draws up comparisons to the most current handheld video specifications.
The two signals specifically discussed are the two used to compare the aesthetic design
factors in standard and handheld video within this study.
It is appropriate to begin by describing the one common factor between the two
specifications that were examined. It is the fundamental element of an electronic image:
the pixel. Digital video images derive their color by using an additive system of red,
green, and blue (RGB) values. Individual images (or frames - as will be discussed
shortly) are comprised of a grid of tiny electronic dots called pixels. All standard digital
video formats are comprised of 72 individual pixels per inch (PPI). This is referred to as
the resolution of the image. Each pixel within the image displays a single color that is
derived from combinations of red, green, and blue values. On computers, the saturation
of each color is represented numerically on a scale from zero to 255: zero being total
absence of the color and 255 being the most saturated presence of the color. For
example, a moderately dark orange color can be represented within an individual pixel
as a combined red value of 220, a green value of 156, and a blue value of 15. Each
individual pixel is an individual dot of color. Since the pixels are so small, when viewed
from a distance, the grid of individual colored dots (the pixels) blends to create the entire
image which end users view either on their handheld devices or on television sets in
their homes.
It should be noted that this is a very basic description of the structure of a digital
video image. The actual calculations of these individual pixels are usually derived via
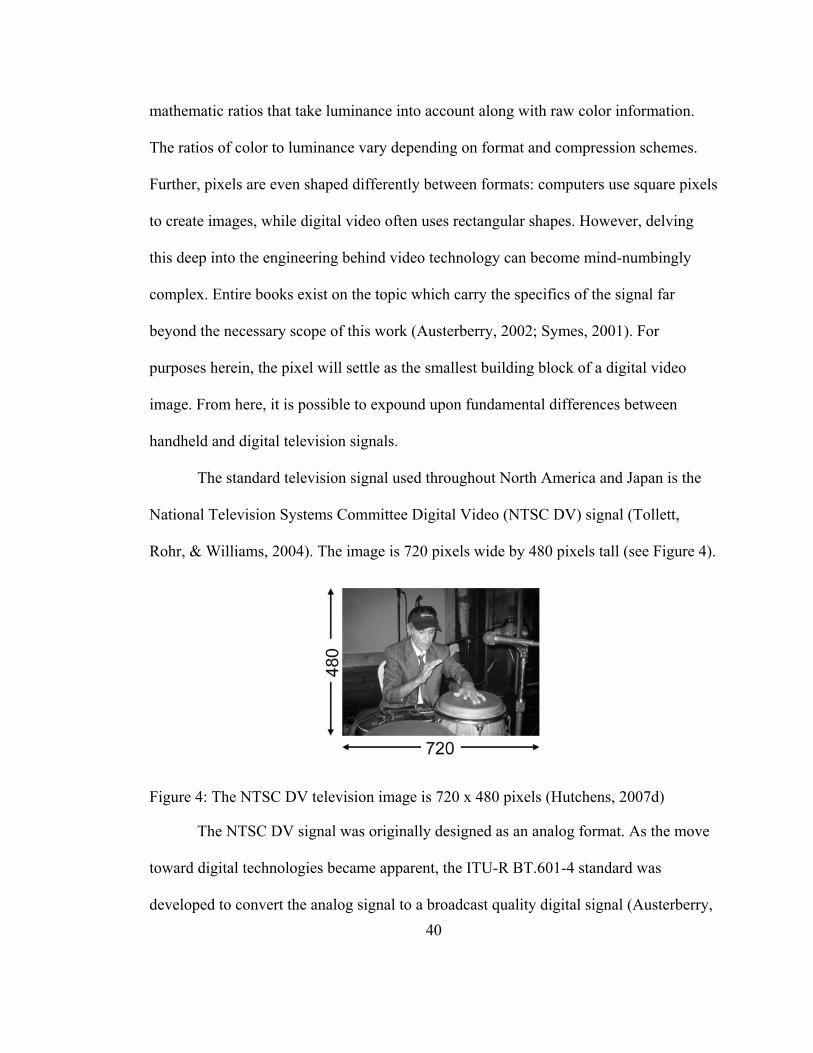
mathematic ratios that take luminance into account along with raw color information.
The ratios of color to luminance vary depending on format and compression schemes.
Further, pixels are even shaped differently between formats: computers use square pixels
to create images, while digital video often uses rectangular shapes. However, delving
this deep into the engineering behind video technology can become mind-numbingly
complex. Entire books exist on the topic which carry the specifics of the signal far
beyond the necessary scope of this work (Austerberry, 2002; Symes, 2001). For
purposes herein, the pixel will settle as the smallest building block of a digital video
image. From here, it is possible to expound upon fundamental differences between
handheld and digital television signals.
The standard television signal used throughout North America and Japan is the
National Television Systems Committee Digital Video (NTSC DV) signal (Tollett,
Rohr, & Williams, 2004). The image is 720 pixels wide by 480 pixels tall (see Figure 4).
Figure 4: The NTSC DV television image is 720 x 480 pixels (Hutchens, 2007d)
The NTSC DV signal was originally designed as an analog format. As the move
toward digital technologies became apparent, the ITU-R BT.601-4 standard was
developed to convert the analog signal to a broadcast quality digital signal (Austerberry, 40
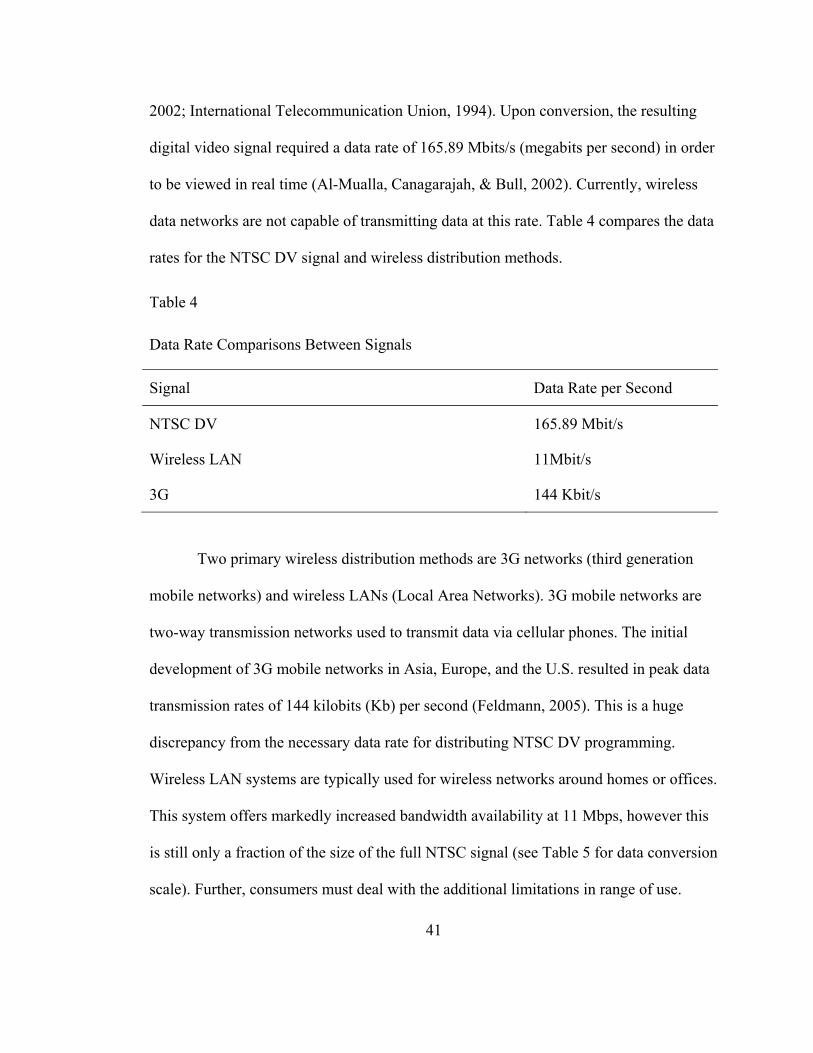
41
2002; International Telecommunication Union, 1994). Upon conversion, the resulting
digital video signal required a data rate of 165.89 Mbits/s (megabits per second) in order
to be viewed in real time (Al-Mualla, Canagarajah, & Bull, 2002). Currently, wireless
data networks are not capable of transmitting data at this rate. Table 4 compares the data
rates for the NTSC DV signal and wireless distribution methods.
Table 4
Data Rate Comparisons Between Signals
Signal Data Rate per Second
NTSC DV 165.89 Mbit/s
Wireless LAN 11Mbit/s
3G 144 Kbit/s
Two primary wireless distribution methods are 3G networks (third generation
mobile networks) and wireless LANs (Local Area Networks). 3G mobile networks are
two-way transmission networks used to transmit data via cellular phones. The initial
development of 3G mobile networks in Asia, Europe, and the U.S. resulted in peak data
transmission rates of 144 kilobits (Kb) per second (Feldmann, 2005). This is a huge
discrepancy from the necessary data rate for distributing NTSC DV programming.
Wireless LAN systems are typically used for wireless networks around homes or offices.
This system offers markedly increased bandwidth availability at 11 Mbps, however this
is still only a fraction of the size of the full NTSC signal (see Table 5 for data conversion
scale). Further, consumers must deal with the additional limitations in range of use.
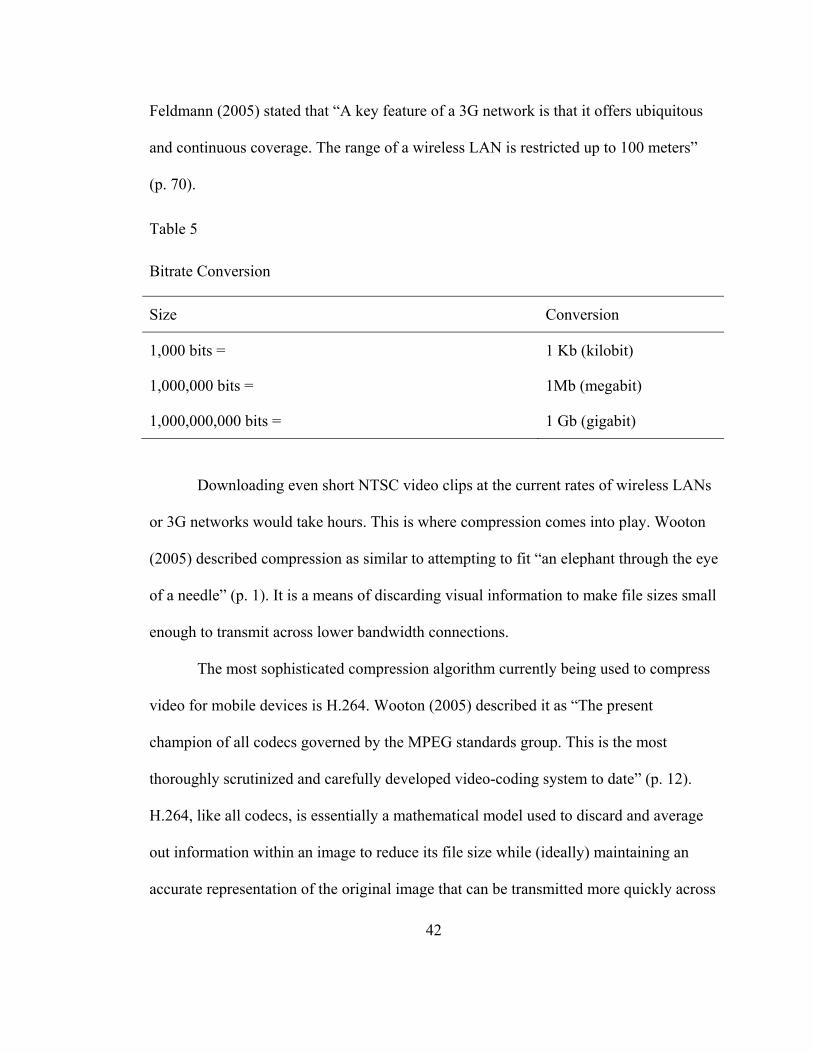
42
Feldmann (2005) stated that “A key feature of a 3G network is that it offers ubiquitous
and continuous coverage. The range of a wireless LAN is restricted up to 100 meters”
(p. 70).
Table 5
Bitrate Conversion
Size Conversion
1,000 bits = 1 Kb (kilobit)
1,000,000 bits = 1Mb (megabit)
1,000,000,000 bits = 1 Gb (gigabit)
Downloading even short NTSC video clips at the current rates of wireless LANs
or 3G networks would take hours. This is where compression comes into play. Wooton
(2005) described compression as similar to attempting to fit “an elephant through the eye
of a needle” (p. 1). It is a means of discarding visual information to make file sizes small
enough to transmit across lower bandwidth connections.
The most sophisticated compression algorithm currently being used to compress
video for mobile devices is H.264. Wooton (2005) described it as “The present
champion of all codecs governed by the MPEG standards group. This is the most
thoroughly scrutinized and carefully developed video-coding system to date” (p. 12).
H.264, like all codecs, is essentially a mathematical model used to discard and average
out information within an image to reduce its file size while (ideally) maintaining an
accurate representation of the original image that can be transmitted more quickly across
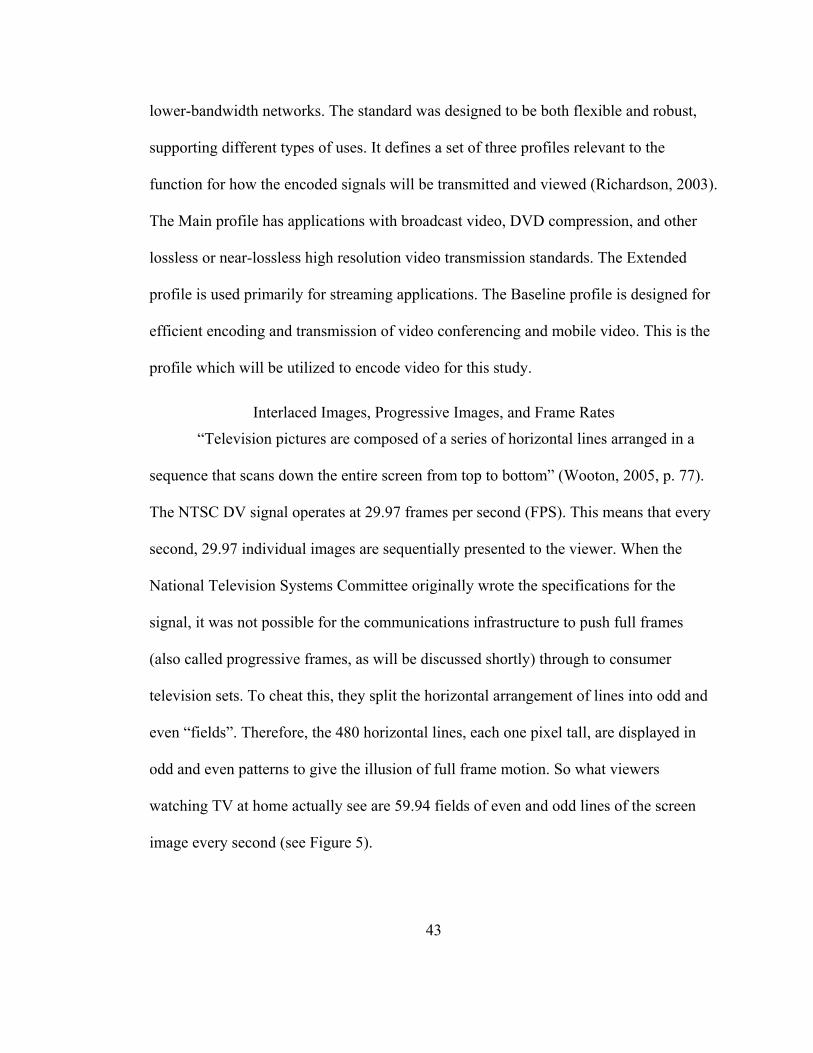
43
lower-bandwidth networks. The standard was designed to be both flexible and robust,
supporting different types of uses. It defines a set of three profiles relevant to the
function for how the encoded signals will be transmitted and viewed (Richardson, 2003).
The Main profile has applications with broadcast video, DVD compression, and other
lossless or near-lossless high resolution video transmission standards. The Extended
profile is used primarily for streaming applications. The Baseline profile is designed for
efficient encoding and transmission of video conferencing and mobile video. This is the
profile which will be utilized to encode video for this study.
Interlaced Images, Progressive Images, and Frame Rates
“Television pictures are composed of a series of horizontal lines arranged in a
sequence that scans down the entire screen from top to bottom” (Wooton, 2005, p. 77).
The NTSC DV signal operates at 29.97 frames per second (FPS). This means that every
second, 29.97 individual images are sequentially presented to the viewer. When the
National Television Systems Committee originally wrote the specifications for the
signal, it was not possible for the communications infrastructure to push full frames
(also called progressive frames, as will be discussed shortly) through to consumer
television sets. To cheat this, they split the horizontal arrangement of lines into odd and
even “fields”. Therefore, the 480 horizontal lines, each one pixel tall, are displayed in
odd and even patterns to give the illusion of full frame motion. So what viewers
watching TV at home actually see are 59.94 fields of even and odd lines of the screen
image every second (see Figure 5).
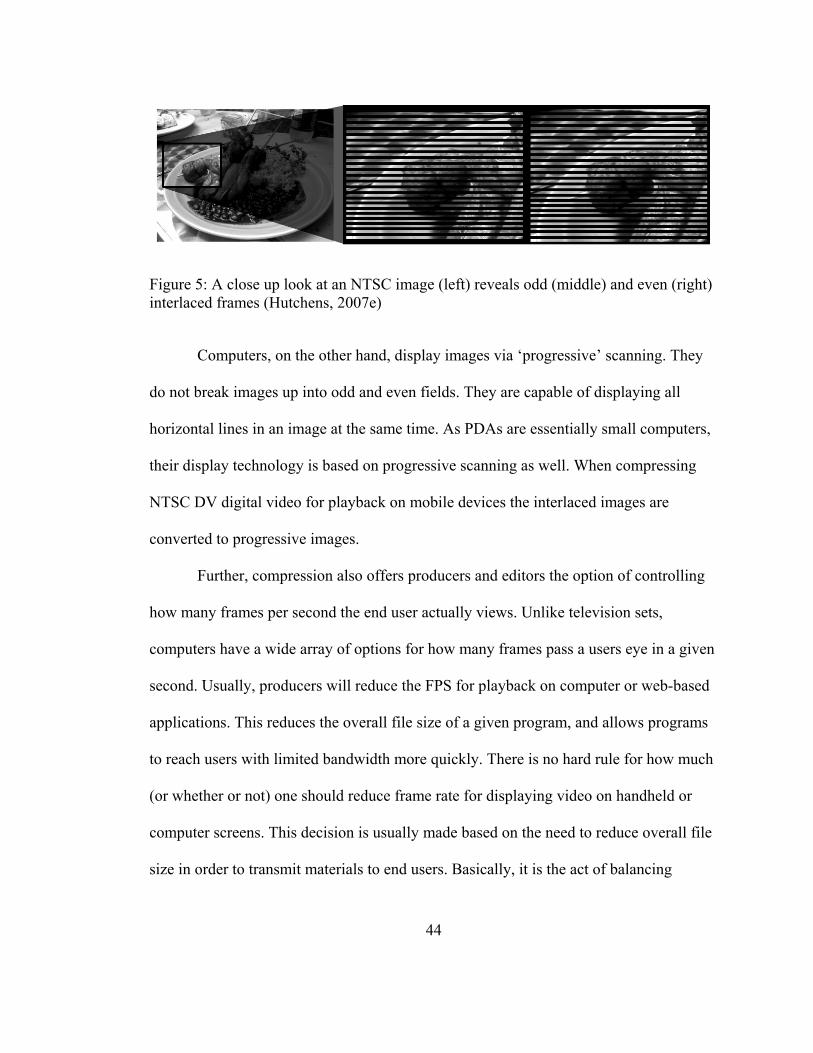
Figure 5: A close up look at an NTSC image (left) reveals odd (middle) and even (right) interlaced frames (Hutchens, 2007e)
Computers, on the other hand, display images via ‘progressive’ scanning. They
do not break images up into odd and even fields. They are capable of displaying all
horizontal lines in an image at the same time. As PDAs are essentially small computers,
their display technology is based on progressive scanning as well. When compressing
NTSC DV digital video for playback on mobile devices the interlaced images are
converted to progressive images.
Further, compression also offers producers and editors the option of controlling
how many frames per second the end user actually views. Unlike television sets,
computers have a wide array of options for how many frames pass a users eye in a given
second. Usually, producers will reduce the FPS for playback on computer or web-based
applications. This reduces the overall file size of a given program, and allows programs
to reach users with limited bandwidth more quickly. There is no hard rule for how much
(or whether or not) one should reduce frame rate for displaying video on handheld or
computer screens. This decision is usually made based on the need to reduce overall file
size in order to transmit materials to end users. Basically, it is the act of balancing
44
45
quality or speed of delivery: one can reduce quality and achieve faster delivery speeds,
or one can increase quality and, potentially, slow delivery speeds.
This offers a basic overview of the underlying differences between NTSC DV
television and handheld portable video files. While compression is not a factor in this
particular study, there has been some research exploring differences in compression
rates for web-based applications (Benierbah & Khamadja, 2005; Nyström & Holmqvist;
2007; Ong et. al; 2004). The documentation of the signals used in this study will be
provided for future research which may be interested in comparing compression rates for
optimal delivery of handheld video. More important for the present study, the type of
compression used to create video files which can be viewed on handheld devices can
have detrimental effects on the legibility of graphic designs and the general imagery
within a given video production. The section on graphic design within this chapter will
expound upon that. Having a general understanding of the process will help readers
understand the concepts being examined herein.
Learning with Video
“The theoretical foundation of instructional television is rooted in behaviorist
psychology” (Clark, 1998, p. 291). From the period of around 1920 until 1970, the
dominating theories underlying education in American classrooms were centered on
educational frameworks which held that learning occurred when learner behaviors were
successfully altered by some form of educational stimulus (Dellarosa, 1988; Hofstetter,
1997). As time went on and more and more research exploring behaviorist psychology
was conducted, it began to lose favor among many theorists in the field. While it did
46
fairly well in developing an understanding of how to predict animal behavior, it seemed
to have only limited applications for explaining how humans learn (Bruning, Schraw, &
Ronnig, 1999; Hofstetter). The human mind is capable of a number of mental processes
such as thinking, creating ideas, interpreting information, storing memory, solving
problems, and so on. Researchers attempting to explain these mental functions within
the behaviorists’ stimulus-response framework increasingly discovered that their
outcomes “seemed neither to satisfy nor to contribute greatly to our understanding of
human cognition” (Bruning et al., p. 5).
As behaviorism drew increasing scrutiny from experts, the idea of ‘cognitive
psychology’ began to emerge as a more comprehensive and robust theory which held
better explications for many of the shortcomings of its predecessor. The theory offered a
broader view of the learning experience by factoring the interaction between the
knowledge which learners possess, the information which they must process, and their
available processing capabilities at the moment that information is encountered.
Eventually, the cognitive model became the dominant theory for how people intake,
process, and store information: it essentially explains how we learn.
Cognitive psychology emphasizes that learning is a constructive process rather
than a receptive one. A large portion of the theory attempts to structurally explain how
people intake information, separate and store it, and consequently, derive new ideas and
meaning. It has had a profound influence on modern education; especially relating to
research on educational video and multimedia (Mayer, 2001; Mayer & Moreno, 1998;
Mayer & Sims, 1994; Metallinos, 1996; Roe, 1998). Mayer has used it throughout his
47
research to develop a theory for how people learn in multimedia-based environments.
His ultimate goal has been to establish practical models which help to define best
practices for achieving transfer of learning to end users of multimedia educational
products. Mayer’s Cognitive Theory of Multimedia Learning consists of three primary
assumptions for how humans process, interpret, and assimilate information into working
memory. The first assumption is that people process information through two primary
channels: visual and aural. These channels of information are constantly managing data
within working memory. The visual channel processes images, motion, animation, and
written text and symbols. The aural channel processes sounds, voices, and narratives.
These two conduits of incoming information are not mutually exclusive; there is a
relationship between the two. For instance, the aural channel can process and derive
meaning from a voice speaking the word “penguin,” even in the absence of a physical
image. Simultaneously, however, the mind conjures up an image of a black and white,
flightless, aquatic bird waddling around on a white horizon. Conversely, one might look
at a photo or video of a penguin being attacked by a polar bear. In order to describe this
event to another person, one must mentally convert the information from the visual
channel into words that can then be verbally transmitted.
The second assumption of the theory holds that each channel has a limited
capacity for receiving and storing information. A person looking through a magazine
with a large number of photographs, such as GQ or Cosmopolitan, for example, will not
be able to remember every picture that was viewed in the magazine once it has been set
aside. Similarly, most of the information presented on a video screen consisting of
48
images and multiple sets of text (such as a news ticker moving across the bottom of the
screen and stock prices being updated across the top) is likely to be lost because it will
simply be too much to for one’s working memory to hold and process (Mayer, Heiser, &
Lonn, 2001). Our aural channel suffers from a similar limited capacity as well. Narration
and long strands of verbal information cannot be held intact for long in working memory
(Mayer, 2001). People tend to discriminate and retain the important concepts within the
presented information to develop a general understanding of what was spoken. Consider,
for example, that most are not able to recite even the most recent conversation with a
peer or colleague verbatim: they are only able to convey the general ideas expressed
during the dialogue.
The third assumption in the cognitive theory of multimedia learning is that
people actively process the information they receive. That is, they attempt to apply
meaning to the information obtained from the outside world. An audio tape recorder or
VCR merely records information for retrieval at a further date. Humans record the
information they receive but assimilate new and old information to derive meaning and
knowledge. Further, people actively seek to construct knowledge structures to facilitate
coherent mental representations of new information (Cook & Mayer, 1998).
Accordingly, Mayer (2001) stated, “This assumption suggests two important
implications for multimedia design: (1) the presented material should have a coherent
structure and (2) the message should provide guidance to the learner for how to build the
structure” (p. 51). This is important to the idea that formal features are learned
representations for how people process information. Consider that using a clock-wipe or
49
a slow dissolve between two scenes is commonly used to represent elapsed time in a
video. Prior to the existence of film and video, there was no such representation for
people to create this association. It is a concept that viewers have learned to interpret and
understand automatically. Thus, it demonstrates how formal features can shape
instructional video content through applied cognitive models.
The rules of cognitive engagement differ between forms of educational media
(Kimber, Pillay, & Richards, 2007; Wise & Reeves, 2007; Yaros, 2006). This is due to
several factors. The first relates to the symbol systems which different forms of media
use. Symbol systems are the varying sets of elements which a given mode of media has
the ability to employ for any message (Goodman & Cundick, 1976). They are especially
important for the storage of mental representations of ideas. For instance, books can
employ words, pictures, graphs, and tables to represent known conventions that readers
can easily retain. Video, while possessing the ability to utilize the same symbol systems
as books, is generally regarded as employing representational symbol systems to convey
meaning (Kozma, 1991). That is, it utilizes combinations of motion pictures with aural
information to allow viewers to retrieve meaning from its content. However, in order to
achieve the cognition of a given idea or set of ideas, one must be able to process these
symbol systems. Kozma (1991) stated that “media can also be described and
distinguished by characteristic capabilities that can be used to process or operate on the
available symbol systems” (p.181). Consider that, while VHS and DVD technologies
both employ the same set of symbol systems, there is a distinct difference in their
process and retrieval abilities. VHS machines allow a user to fast-forward or rewind the
50
tape in order to access a certain piece of information. DVDs have the ability to set up
bookmarks or to use menu-driven designs for easier, faster information retrieval.
Conversely, traditional broadcast television utilizes the same symbol systems, but does
not offer any form of the retrieval of information. Of course, recording broadcast
programming onto the VHS medium, or utilizing newer services such as TiVo to record
and retrieve information introduces those capabilities, but in the absence of those
technologies viewers are not able to retrieve information for reexamination once it has
been processed. Therefore many scholars postulate that symbol systems and processes
capabilities both exert heavy influence on a technology’s ability to deliver meaningful
educational content (DeLoach, 2004; Garrod, Fay, Lee, Oberlander, & MacLeod, 2007;
Goodman & Cundick, 1976; Kozma,1991).
It is the symbol system component of this theory of media cognition that most
heavily relates to the study at hand. For it is within this realm that the relevance of
formal features comes into play. It is thought that certain formal features can be used
and manipulated to influence the amount of visual attention that viewers give to a
program (Huston et al., 1983). The frequency and duration of visual attention has been
the subject of much study by researchers investigating the effectiveness of educational
video (Anderson & Field, 1983; Anderson, Lorch, Field, Collins, & Nathan, 1986;
O’Bryan & Silverman, 1974). The amount of attention which viewers give to video
content is thought to influence the comprehension of the information being presented
(Calvert, Huston, Watkins, & Wright, 1982). Once attention is captured, viewers can
then process the contiguous information being presented for the duration of time that
51
their attention is maintained. If their attention is lost, the subsequent programming
information is less likely to be processed for comprehension. Bruning, Schraw, and
Ronnig (1999) stated that:
people cannot do more than one or two things at the same time; even the most able person can perform only a limited number of tasks simultaneously. This limitation makes what students attend to a significant part of instructional effectiveness. (p.30) Television viewing is often a supplemental activity (Anderson et al., 1986). That
is, people, especially children, are often doing other things while the television is on and
playing. Children might look at and away from a given television program several
hundred times within an hour, with glances from several seconds up to around a minute
if they are engaged in other simultaneous activities. It has been suggested that the
amount of attention given to a particular program has a direct affect on one’s ability to
learn from it (Kozma, 1991).
According to Kozma (1986) “attention is influenced by two factors: (a)
understandability of the content, and (b) the formal features of the production” (p. 15).
Huston et al. (1983) identified certain specific formal features which seemed to have a
greater ability to capture viewer attention: sound effects, music, animation, fast-paced
edits, camera motion and movement, and narration. However, they discovered that
viewer age had an effect on the impact certain formal features had in terms of capturing
attention. This is thought to be largely due to an individual’s level of cognitive
development as well as viewing habits. For instance, children seemed to at least lightly
monitor programming most of the time, even if there were other things happening
around them which commanded the majority of their attention. Their interests seemed to
52
be recaptured more frequently, though in limited duration, by formal features such as
visual movement, laughter, women’s, children’s, and cartoon-like voices, laughter, and
sound effects (Kozma, 1991). Other formal features such as special effects and high-
energy motion and physical activity were more likely to sustain attention for longer
periods of time. Consequently, the use of men’s voices in narration, long periods of
inactivity, and slow, elongated camera movements were more likely to result in losing
children’s visual attention.
Anderson et al. (1986) hypothesized that these reactions may, in fact, be learned
from the associations that children make as a result of repeated exposure to given formal
features. They suggest that programming which uses the types of formal features which
seem to more frequently lose children’s interest, such as slow camera movement or male
voices, are more frequently components of adult-oriented programming requiring higher
orders of comprehensive skills. Their frequent inability to understand the content being
presented to them may result in a more immediate ‘tuning out’ of similar types of formal
features, even when used in the context of lower-level comprehensive programming
such as children’s video shows.
Huston et al. (1983) proposed that attention is related to the comprehensibility of
programming. They suggested that the ease or complexity with which a program can be
comprehended has an inverted U relationship with attention. That is, extremely simple
content and extremely difficult content both achieve lower levels of attention with
children. Conversely, video content that falls more in a moderate range of
comprehensive complexity generally achieves higher levels of attention.
53
It should be noted that attention alone does not necessarily lead to
comprehension (Anderson, Lorch, & Field, 1981; Anderson et al., 1986). In cases where
viewers are not developmentally able to comprehend content, such as instances where
children are viewing adult-level material, low levels of comprehension have been shown
even when high levels of attention were achieved. Further, the younger the viewer, the
more difficulty the audience has in selecting and processing the central messages of an
educational program. Young viewers sometimes focus instead on subsidiary information
which may not be part of the instructional designer’s desired learning outcomes (Collins,
Wellman, & Keniston, 1978). However, Calvert et al. (1982) argue that this latter
problem, where viewers have difficulty determining the appropriate information to be
processed, can be overcome when producers strategize the use of formal features to grab
attention and subsequently focus them to underscore information relevant to the desired
instructional outcomes and goals.
So, to summarize thus far, the cognitive theory of multimedia learning provides a
theoretical basis for how people intake and process video information. This process of
mentally absorbing and organizing information leads to the creation of symbol systems
for how humans interpret the meanings behind the formal features used to construct
video programming. The next section will begin to summarize research in the first of
two formal features being researched within this study: shot composition.
Studies Relating to Shot Composition and Sequencing
The composition and subsequent sequencing of shots can have a critical impact
on how a story or concept is told by video producers and, conversely, interpreted by
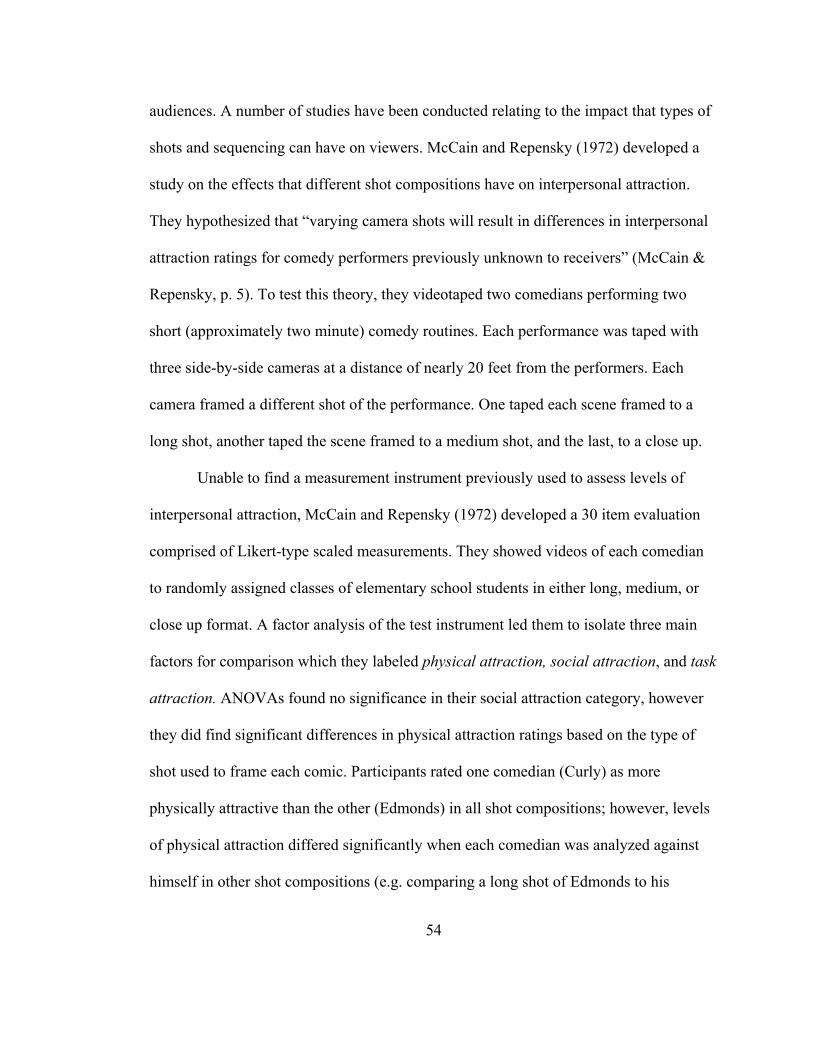
54
audiences. A number of studies have been conducted relating to the impact that types of
shots and sequencing can have on viewers. McCain and Repensky (1972) developed a
study on the effects that different shot compositions have on interpersonal attraction.
They hypothesized that “varying camera shots will result in differences in interpersonal
attraction ratings for comedy performers previously unknown to receivers” (McCain &
Repensky, p. 5). To test this theory, they videotaped two comedians performing two
short (approximately two minute) comedy routines. Each performance was taped with
three side-by-side cameras at a distance of nearly 20 feet from the performers. Each
camera framed a different shot of the performance. One taped each scene framed to a
long shot, another taped the scene framed to a medium shot, and the last, to a close up.
Unable to find a measurement instrument previously used to assess levels of
interpersonal attraction, McCain and Repensky (1972) developed a 30 item evaluation
comprised of Likert-type scaled measurements. They showed videos of each comedian
to randomly assigned classes of elementary school students in either long, medium, or
close up format. A factor analysis of the test instrument led them to isolate three main
factors for comparison which they labeled physical attraction, social attraction, and task
attraction. ANOVAs found no significance in their social attraction category, however
they did find significant differences in physical attraction ratings based on the type of
shot used to frame each comic. Participants rated one comedian (Curly) as more
physically attractive than the other (Edmonds) in all shot compositions; however, levels
of physical attraction differed significantly when each comedian was analyzed against
himself in other shot compositions (e.g. comparing a long shot of Edmonds to his
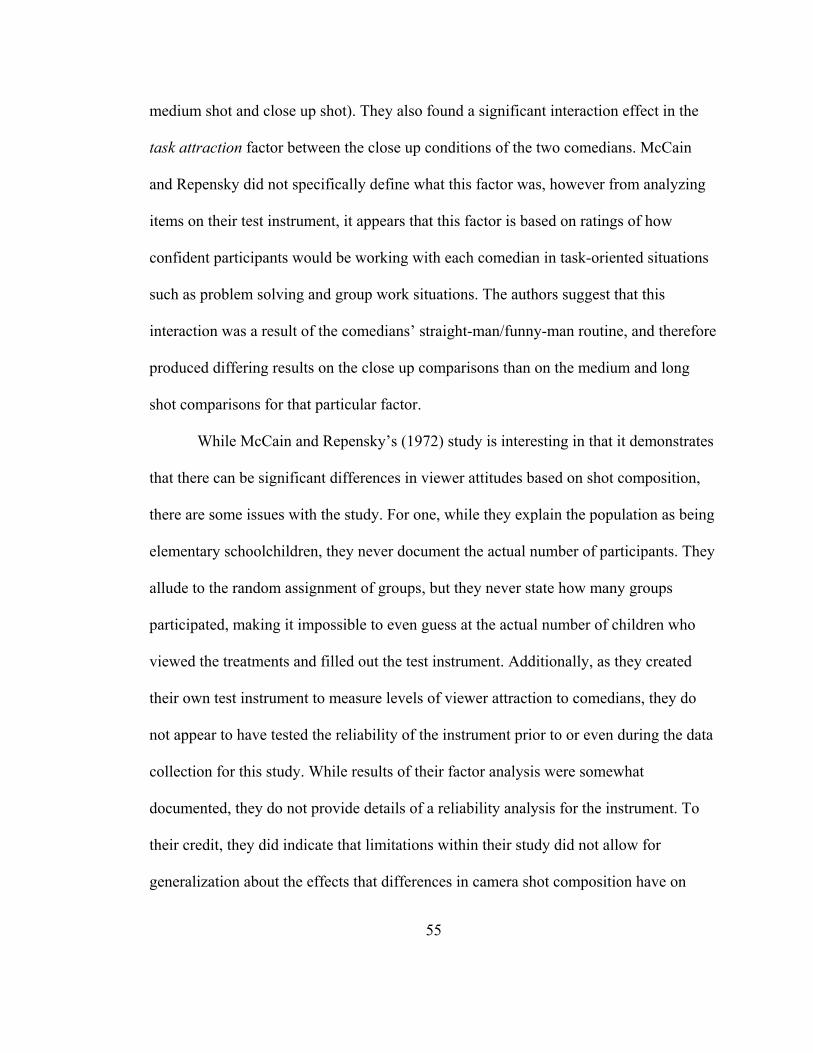
55
medium shot and close up shot). They also found a significant interaction effect in the
task attraction factor between the close up conditions of the two comedians. McCain
and Repensky did not specifically define what this factor was, however from analyzing
items on their test instrument, it appears that this factor is based on ratings of how
confident participants would be working with each comedian in task-oriented situations
such as problem solving and group work situations. The authors suggest that this
interaction was a result of the comedians’ straight-man/funny-man routine, and therefore
produced differing results on the close up comparisons than on the medium and long
shot comparisons for that particular factor.
While McCain and Repensky’s (1972) study is interesting in that it demonstrates
that there can be significant differences in viewer attitudes based on shot composition,
there are some issues with the study. For one, while they explain the population as being
elementary schoolchildren, they never document the actual number of participants. They
allude to the random assignment of groups, but they never state how many groups
participated, making it impossible to even guess at the actual number of children who
viewed the treatments and filled out the test instrument. Additionally, as they created
their own test instrument to measure levels of viewer attraction to comedians, they do
not appear to have tested the reliability of the instrument prior to or even during the data
collection for this study. While results of their factor analysis were somewhat
documented, they do not provide details of a reliability analysis for the instrument. To
their credit, they did indicate that limitations within their study did not allow for
generalization about the effects that differences in camera shot composition have on
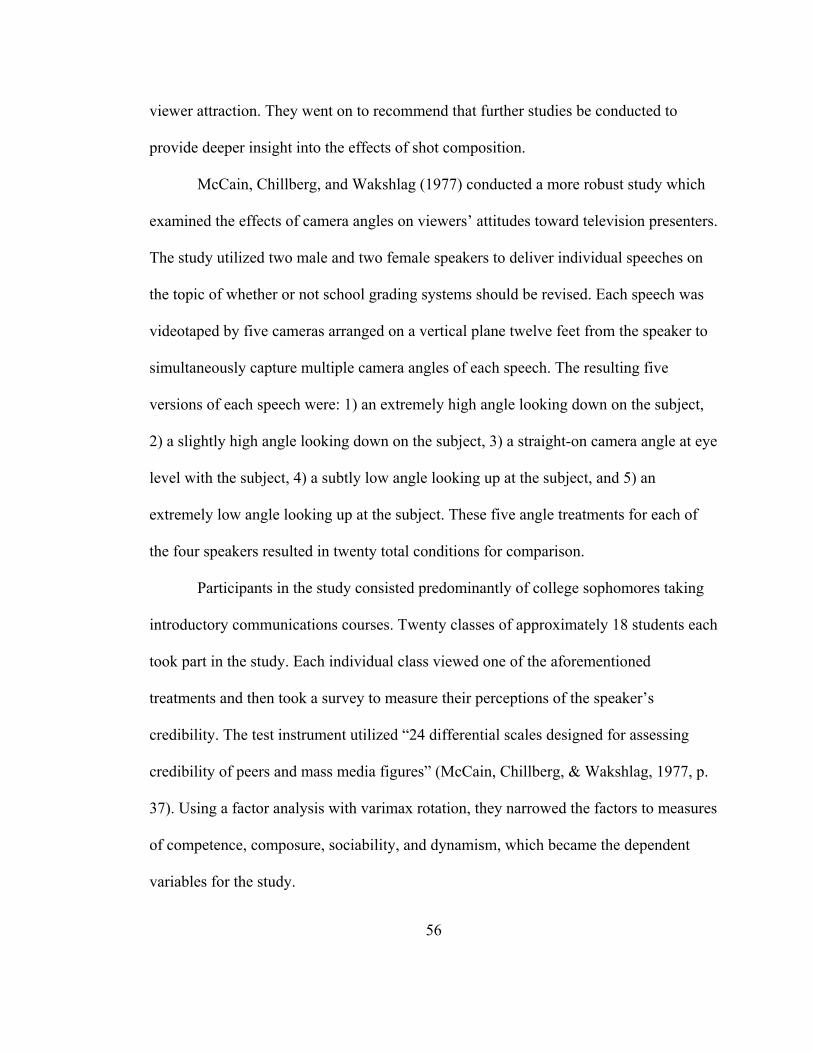
56
viewer attraction. They went on to recommend that further studies be conducted to
provide deeper insight into the effects of shot composition.
McCain, Chillberg, and Wakshlag (1977) conducted a more robust study which
examined the effects of camera angles on viewers’ attitudes toward television presenters.
The study utilized two male and two female speakers to deliver individual speeches on
the topic of whether or not school grading systems should be revised. Each speech was
videotaped by five cameras arranged on a vertical plane twelve feet from the speaker to
simultaneously capture multiple camera angles of each speech. The resulting five
versions of each speech were: 1) an extremely high angle looking down on the subject,
2) a slightly high angle looking down on the subject, 3) a straight-on camera angle at eye
level with the subject, 4) a subtly low angle looking up at the subject, and 5) an
extremely low angle looking up at the subject. These five angle treatments for each of
the four speakers resulted in twenty total conditions for comparison.
Participants in the study consisted predominantly of college sophomores taking
introductory communications courses. Twenty classes of approximately 18 students each
took part in the study. Each individual class viewed one of the aforementioned
treatments and then took a survey to measure their perceptions of the speaker’s
credibility. The test instrument utilized “24 differential scales designed for assessing
credibility of peers and mass media figures” (McCain, Chillberg, & Wakshlag, 1977, p.
37). Using a factor analysis with varimax rotation, they narrowed the factors to measures
of competence, composure, sociability, and dynamism, which became the dependent
variables for the study.
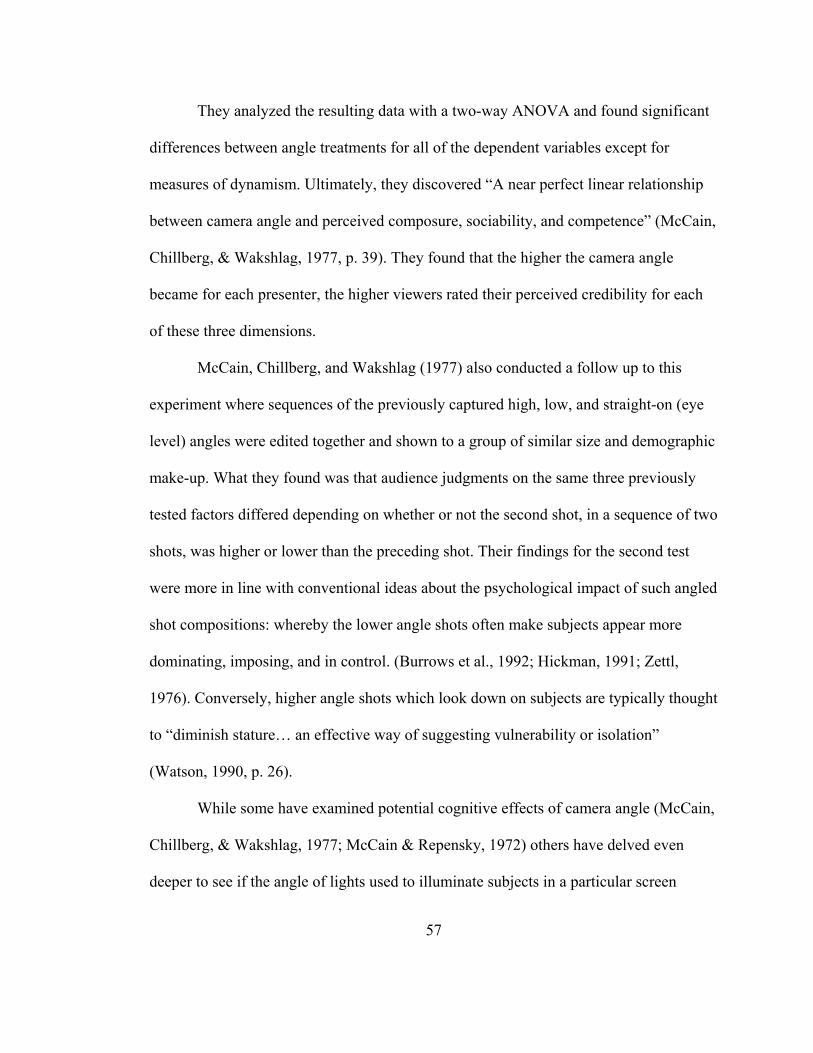
57
They analyzed the resulting data with a two-way ANOVA and found significant
differences between angle treatments for all of the dependent variables except for
measures of dynamism. Ultimately, they discovered “A near perfect linear relationship
between camera angle and perceived composure, sociability, and competence” (McCain,
Chillberg, & Wakshlag, 1977, p. 39). They found that the higher the camera angle
became for each presenter, the higher viewers rated their perceived credibility for each
of these three dimensions.
McCain, Chillberg, and Wakshlag (1977) also conducted a follow up to this
experiment where sequences of the previously captured high, low, and straight-on (eye
level) angles were edited together and shown to a group of similar size and demographic
make-up. What they found was that audience judgments on the same three previously
tested factors differed depending on whether or not the second shot, in a sequence of two
shots, was higher or lower than the preceding shot. Their findings for the second test
were more in line with conventional ideas about the psychological impact of such angled
shot compositions: whereby the lower angle shots often make subjects appear more
dominating, imposing, and in control. (Burrows et al., 1992; Hickman, 1991; Zettl,
1976). Conversely, higher angle shots which look down on subjects are typically thought
to “diminish stature… an effective way of suggesting vulnerability or isolation”
(Watson, 1990, p. 26).
While some have examined potential cognitive effects of camera angle (McCain,
Chillberg, & Wakshlag, 1977; McCain & Repensky, 1972) others have delved even
deeper to see if the angle of lights used to illuminate subjects in a particular screen
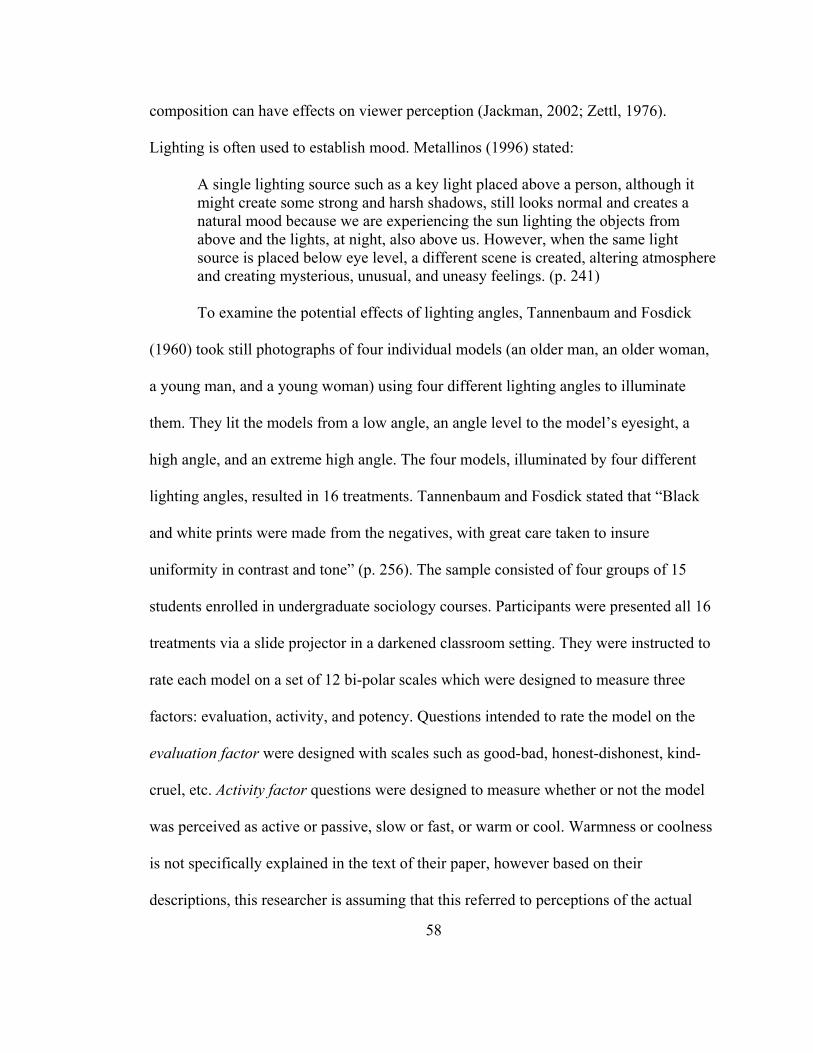
58
composition can have effects on viewer perception (Jackman, 2002; Zettl, 1976).
Lighting is often used to establish mood. Metallinos (1996) stated:
A single lighting source such as a key light placed above a person, although it might create some strong and harsh shadows, still looks normal and creates a natural mood because we are experiencing the sun lighting the objects from above and the lights, at night, also above us. However, when the same light source is placed below eye level, a different scene is created, altering atmosphere and creating mysterious, unusual, and uneasy feelings. (p. 241) To examine the potential effects of lighting angles, Tannenbaum and Fosdick
(1960) took still photographs of four individual models (an older man, an older woman,
a young man, and a young woman) using four different lighting angles to illuminate
them. They lit the models from a low angle, an angle level to the model’s eyesight, a
high angle, and an extreme high angle. The four models, illuminated by four different
lighting angles, resulted in 16 treatments. Tannenbaum and Fosdick stated that “Black
and white prints were made from the negatives, with great care taken to insure
uniformity in contrast and tone” (p. 256). The sample consisted of four groups of 15
students enrolled in undergraduate sociology courses. Participants were presented all 16
treatments via a slide projector in a darkened classroom setting. They were instructed to
rate each model on a set of 12 bi-polar scales which were designed to measure three
factors: evaluation, activity, and potency. Questions intended to rate the model on the
evaluation factor were designed with scales such as good-bad, honest-dishonest, kind-
cruel, etc. Activity factor questions were designed to measure whether or not the model
was perceived as active or passive, slow or fast, or warm or cool. Warmness or coolness
is not specifically explained in the text of their paper, however based on their
descriptions, this researcher is assuming that this referred to perceptions of the actual
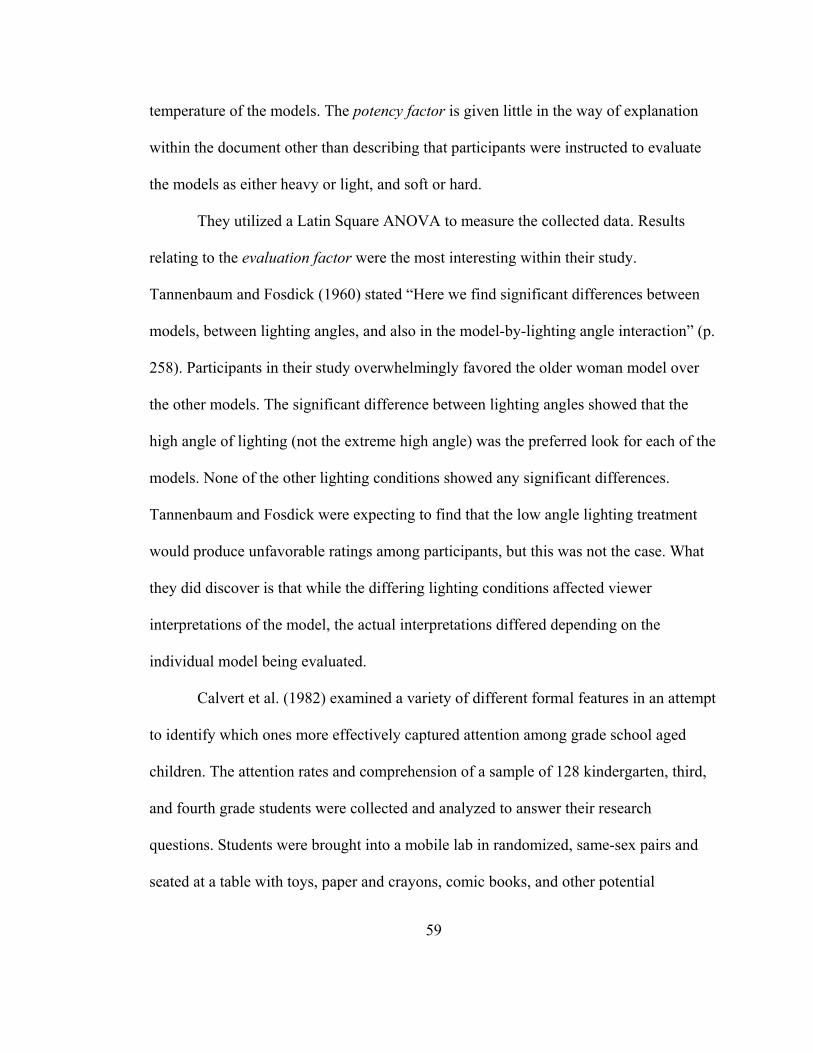
59
temperature of the models. The potency factor is given little in the way of explanation
within the document other than describing that participants were instructed to evaluate
the models as either heavy or light, and soft or hard.
They utilized a Latin Square ANOVA to measure the collected data. Results
relating to the evaluation factor were the most interesting within their study.
Tannenbaum and Fosdick (1960) stated “Here we find significant differences between
models, between lighting angles, and also in the model-by-lighting angle interaction” (p.
258). Participants in their study overwhelmingly favored the older woman model over
the other models. The significant difference between lighting angles showed that the
high angle of lighting (not the extreme high angle) was the preferred look for each of the
models. None of the other lighting conditions showed any significant differences.
Tannenbaum and Fosdick were expecting to find that the low angle lighting treatment
would produce unfavorable ratings among participants, but this was not the case. What
they did discover is that while the differing lighting conditions affected viewer
interpretations of the model, the actual interpretations differed depending on the
individual model being evaluated.
Calvert et al. (1982) examined a variety of different formal features in an attempt
to identify which ones more effectively captured attention among grade school aged
children. The attention rates and comprehension of a sample of 128 kindergarten, third,
and fourth grade students were collected and analyzed to answer their research
questions. Students were brought into a mobile lab in randomized, same-sex pairs and
seated at a table with toys, paper and crayons, comic books, and other potential
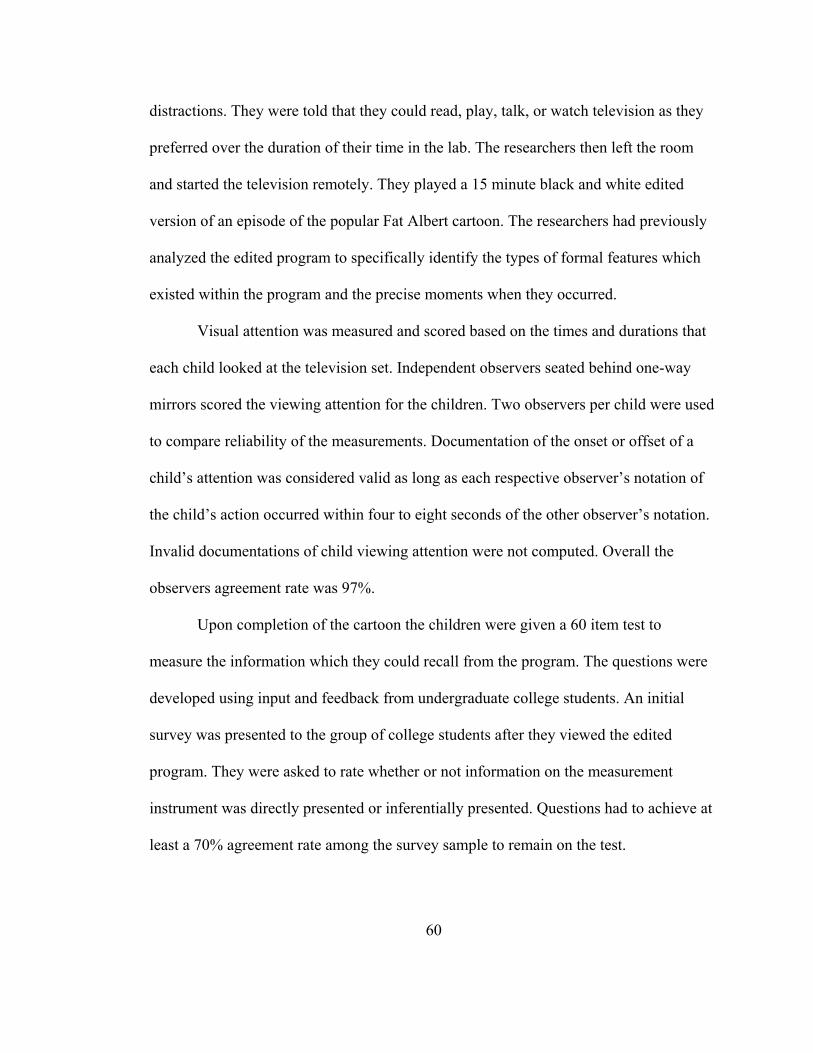
60
distractions. They were told that they could read, play, talk, or watch television as they
preferred over the duration of their time in the lab. The researchers then left the room
and started the television remotely. They played a 15 minute black and white edited
version of an episode of the popular Fat Albert cartoon. The researchers had previously
analyzed the edited program to specifically identify the types of formal features which
existed within the program and the precise moments when they occurred.
Visual attention was measured and scored based on the times and durations that
each child looked at the television set. Independent observers seated behind one-way
mirrors scored the viewing attention for the children. Two observers per child were used
to compare reliability of the measurements. Documentation of the onset or offset of a
child’s attention was considered valid as long as each respective observer’s notation of
the child’s action occurred within four to eight seconds of the other observer’s notation.
Invalid documentations of child viewing attention were not computed. Overall the
observers agreement rate was 97%.
Upon completion of the cartoon the children were given a 60 item test to
measure the information which they could recall from the program. The questions were
developed using input and feedback from undergraduate college students. An initial
survey was presented to the group of college students after they viewed the edited
program. They were asked to rate whether or not information on the measurement
instrument was directly presented or inferentially presented. Questions had to achieve at
least a 70% agreement rate among the survey sample to remain on the test.
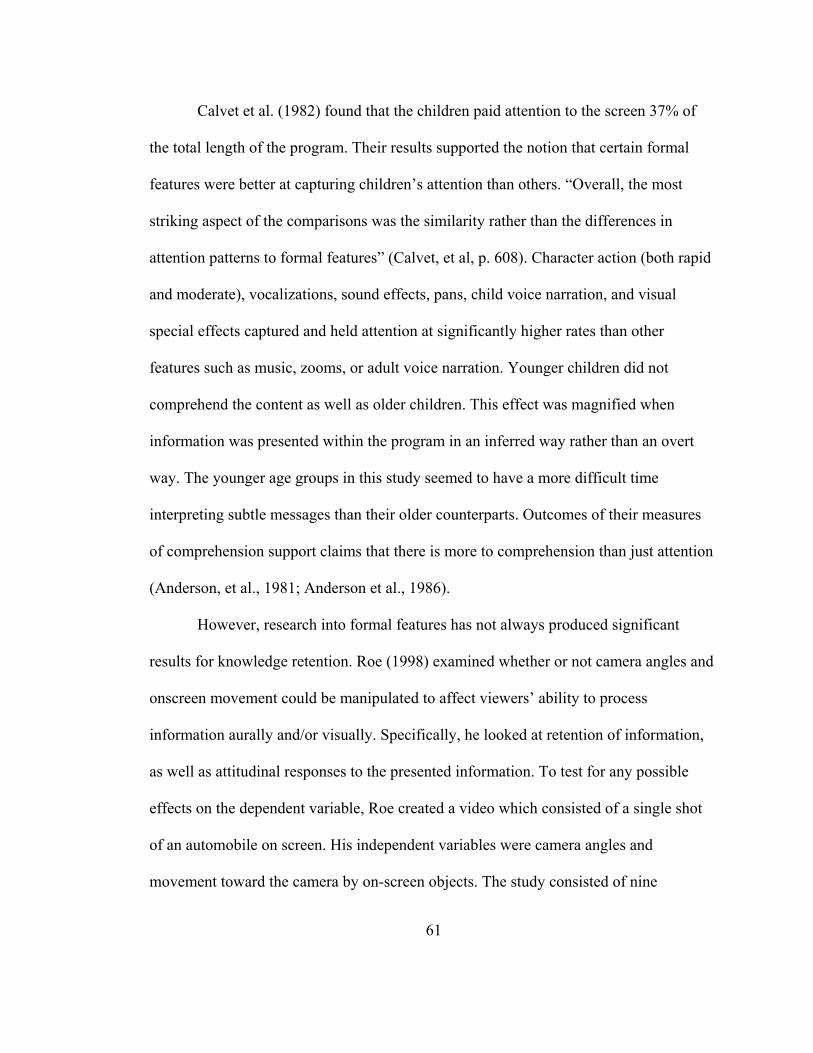
61
Calvet et al. (1982) found that the children paid attention to the screen 37% of
the total length of the program. Their results supported the notion that certain formal
features were better at capturing children’s attention than others. “Overall, the most
striking aspect of the comparisons was the similarity rather than the differences in
attention patterns to formal features” (Calvet, et al, p. 608). Character action (both rapid
and moderate), vocalizations, sound effects, pans, child voice narration, and visual
special effects captured and held attention at significantly higher rates than other
features such as music, zooms, or adult voice narration. Younger children did not
comprehend the content as well as older children. This effect was magnified when
information was presented within the program in an inferred way rather than an overt
way. The younger age groups in this study seemed to have a more difficult time
interpreting subtle messages than their older counterparts. Outcomes of their measures
of comprehension support claims that there is more to comprehension than just attention
(Anderson, et al., 1981; Anderson et al., 1986).
However, research into formal features has not always produced significant
results for knowledge retention. Roe (1998) examined whether or not camera angles and
onscreen movement could be manipulated to affect viewers’ ability to process
information aurally and/or visually. Specifically, he looked at retention of information,
as well as attitudinal responses to the presented information. To test for any possible
effects on the dependent variable, Roe created a video which consisted of a single shot
of an automobile on screen. His independent variables were camera angles and
movement toward the camera by on-screen objects. The study consisted of nine
62
treatment groups which ranged from standard to extremely low angle camera shots of a
vehicle. He also tested movement by having the car either remain static onscreen, or by
having it move toward the camera either moderately fast, or extremely fast. An identical
audio narration track describing ignition timing was used for each of the treatments. The
sample size for the experiment consisted of 198 college students equally divided into
groups of 22 students per one of the nine groups. A two-way ANOVA analysis found no
significant differences between any of the treatment groups.
Silbergleid (1992) investigated whether or not varying the levels of intensity or
frequency of certain formal features would increase viewer attention. To do this, he
created three different versions of an educational video about the workings of the Wall
Street Stock Exchange. The ‘basic’ version of the program consisted of cuts-only edits
and simple on-screen graphics to display the informational content. A more
sophisticated intermediate version of the same video used dissolves, fades, and more
sophisticated graphic designs to convey the visual information being presented. An
advanced version of the same video consisted of extensive use of transition effects and
motion graphics to create a visually richer adaptation of the financial educational video
product.
A total of 119 college level communications students participated in the study.
To test whether or not these variations produced increases in learning comprehension or
general likeability of the program, he broke the sample into four groups. One group
viewed the basic version of his video. Another viewed the intermediate version. A third
viewed the advanced version, and a fourth viewed a different video with similar formal
63
features as those used in the advanced version of the program. Almost no specifics are
offered about the video which the fourth group viewed in Silbergleid’s (1992)
documentation of the study: only that the last group was used as the control group.
To collect data, he used a posttest only methodology. A forty question, multiple
choice test was developed and pilot tested for use in the study. Likert-type questions
were used to measure the degree to which individuals liked the programming. Questions
were also included to determine if the amount of prior knowledge which students had
about the subject matter had any influence on their test performance. Sixteen of the forty
questions within the test were specifically pinpointed for separate analysis, as the
information which presented these concepts occurred within four seconds of a change in
formal features. The operating theory being tested was that if changes in certain formal
features contribute to increased attention, then content presented immediately after these
types of attention-grabbing changes should result in increases in comprehension of the
specified information.
Silbergleid (1992) found no significant differences of any kind among the
variations tested in his study.
The results of this study indicate that different levels of complexity of visual production techniques in ITV [instructional television] programs have no significant effect on the amount of learning comprehension of the viewer or on the degree of likeliness expressed by the viewer for the ITV program. These results do not support the theory that complex visual production techniques will lead to an increase in learning. (Silbergleid, p.20) While Silbergleid’s (1992) study found no evidence supporting current theories
for how viewer attention can affect cognitive engagement and thus result in learning,
there are some elements of his study which should be scrutinized. First, the introduction
64
of a control group which viewed an entirely different video than the three experimental
groups seems questionable. According to the documentation, all of the groups were
given the same test instrument, which covers the topic of monetary finances and the
workings of the stock market. Yet Silbergleid states that the control group’s video was
“of the same length and style but dealing with a different subject matter” (p.15). This
would seem to introduce an extreme number of variables, making it difficult to interpret
the results of any statistical analysis. This also leads one to question how reliable results
from a test instrument on money and finance can be if one of the groups taking the
instrument viewed a video of entirely different subject matter.
Lastly, Sieberglied specifically examined sixteen questions designed to test
retention of knowledge presented within four seconds of changes in unspecified formal
features. This portion of the analysis is examining a phenomenon known as attentional
inertia (Hawkins et al., 2002). This is the idea that sufficient levels of attention
conducive to cognitive processing may not occur until after around eight seconds of
active attention, “perhaps reflecting a point at which enough content has been processed
so that attention can be called “engaged” with the… message rather than merely
“oriented” or captured by some stimulus” (Hawkins et al., p. 25). So, while formal
features within Silbergleid’s videos may have captured attention, it does not necessarily
mean that cognition was occurring at the point that information expected to be recalled
on the test instrument was introduced. Similarly, other research suggests that certain
formal features are more conducive to capturing the attention of particular demographics
(Calvert et al., 1982; Schmitt, Anderson, & Collins, 1999; Singer, 1980). While
65
Silbergleid identifies general differences in the formal features compared in his
treatments, he does not offer great detail on what they specifically are or how they are
utilized within the context of the individual programs. Perhaps the formal features used
to assemble the treatment programs were not the most appropriate for the college-aged
students which participated in the study. As details on the use of formal features are not
offered within the documentation of the research, it is impossible to make educated
interpretations of the results of the study.
Of course, the relationship between formal features and ultimate cognition of
content on the part of the viewer is complex and remains a theoretical basis from which
to conduct research. Schmitt, Anderson, and Collins (1999) stated that, “attention to
television moves from predominant control by salient formal features to more complex
relationships with formal features and content” (p. 1166). While shot composition and
editing techniques comprise a portion of studies conducted on the effects of formal
features in educational television, there are certainly other formal features which have
enjoyed less presence in the limelight of research. In the following section, focus shall
shift to graphic design as a formal feature within video production. An overview of the
research on this topic demonstrates that there is reason to believe that graphic design
factors do have an influence on the cognitive effects of learning with video and
multimedia products.
Graphic Design
Cognitive models of learning are also applicable to graphic design within
educational video productions. Shedroff (2001) stated that “The most important aspect
66
of any design is how it is understood in the minds of the audience” (p. 60). In
conjunction with cognitive load theory, poor graphic and visual design can negatively
impact viewers’ ability to learn (Vekiri, 2002). While it is generally understood that
strong and suitable graphic design is necessary for transfer of learning to occur by means
of educational media, it has also been suggested that most of the literature offering
guidelines for design is based largely on opinion rather than empirical research: further,
that most of the empirical research that exists is older and may not be especially relevant
in today’s vastly complicated media environments (Williams & Stimatz, 2005). This
suggestion seems valid when digging for literature to support a study which examines
graphic design in the context of modern day video applications. There is a large body of
research concerning the legibility and readability of fonts within printed materials
(Goudy, 1946; Tinker, 1963; Williams & Stimatz). However research on textual type,
size, and/or legibility within video monitor environments has been far less robust
(Geske, 2000). In recent years the advent of multimedia-based instruction has led to
increased research in the uses of text and design features to support theories of cognitive
learning (Arditi & Cho, 2005; Arditi & Cho, 2007; Chen, Ghinea, & Macredie, 2006;
Mayer, 2001; Mayer, Heiser & Lonn, 2001; Mayer & Moreno, 1998; Mayer & Sims,
1994). While research of this nature is useful to achieving an overall understanding of
design techniques which support cognition, the inherent differences in screen technology
(Larson, 2007) force researchers to acknowledge multiple caveats in the application of
research findings across differing mediums. If one supports the idea that underlying
differences in how technology is used to construct visual information for end users can
67
affect learning outcomes, the problem then becomes compounded exponentially due to
the vast differences in video signals that exist. NTSC signals alone have considerable
differences when examining the traditional analog signal in comparison to the digital
version. However when one factors in the multitude of high definition (HD) formats that
are currently competing for market dominance, the task of deriving relative meaning
across formats becomes nearly insurmountable: likely a reason for why studies of this
nature are difficult to procure. Nonetheless, given the relatively small amount of
research on type and design within video contexts, one is forced to look beyond research
on conventional video and cross into the boundaries of research findings of text and
design within multimedia learning environments in order to hypothesize how these same
features within small format video will affect cognition and knowledge retention among
viewers.
While there is no clear answer to whether or not cross-referencing these formats
is a sound method for deriving valid research theories, some authors embrace this
methodology under the argument that the varying platforms of technology which exist
today are due to an ongoing convergence of media formats that has been playing out
since print typographic techniques were first used to display graphic information in the
early days of television (Cooke, 2005; Williams & Stimatz, 2005).
Though graphic design encompasses a large number of concepts (symbols, logos,
lettermarks, form, Gestalt psychology, layout, etc.) there are a few which are of primary
concern to the present study. They shall be encountered frequently in the remainder of
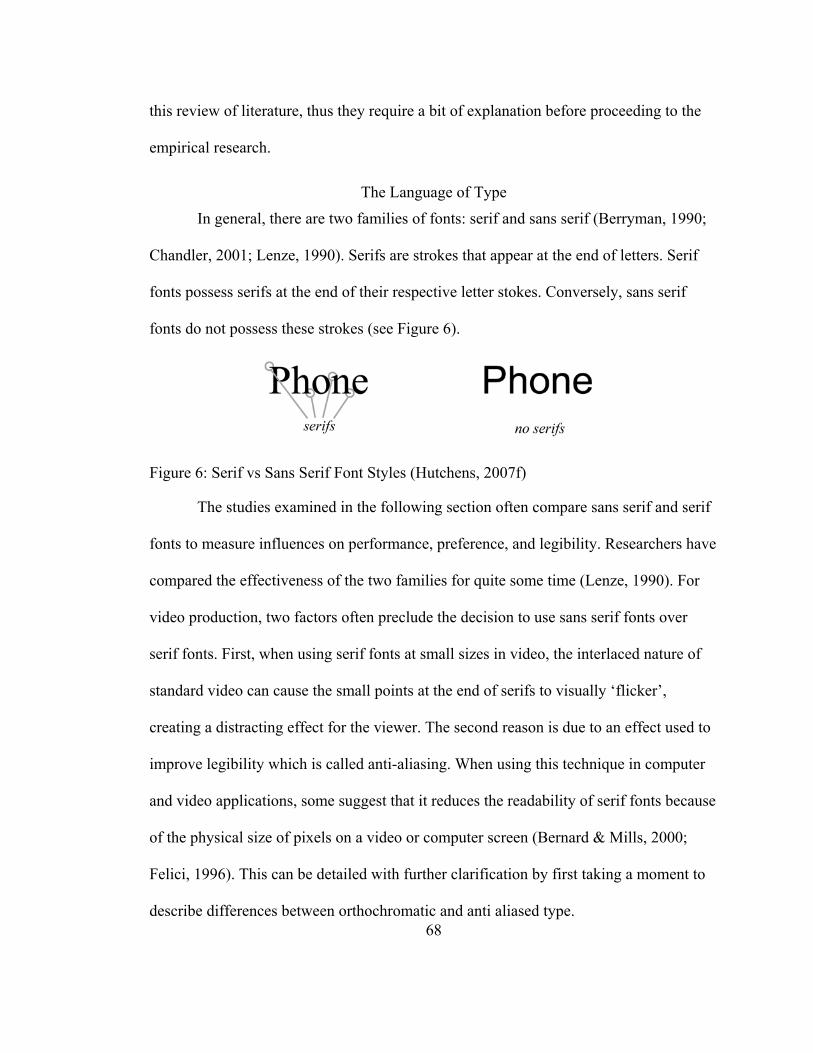
this review of literature, thus they require a bit of explanation before proceeding to the
empirical research.
The Language of Type
In general, there are two families of fonts: serif and sans serif (Berryman, 1990;
Chandler, 2001; Lenze, 1990). Serifs are strokes that appear at the end of letters. Serif
fonts possess serifs at the end of their respective letter stokes. Conversely, sans serif
fonts do not possess these strokes (see Figure 6).
Figure 6: Serif vs Sans Serif Font Styles (Hutchens, 2007f)
68
The studies examined in the following section often compare sans serif and serif
fonts to measure influences on performance, preference, and legibility. Researchers have
compared the effectiveness of the two families for quite some time (Lenze, 1990). For
video production, two factors often preclude the decision to use sans serif fonts over
serif fonts. First, when using serif fonts at small sizes in video, the interlaced nature of
standard video can cause the small points at the end of serifs to visually ‘flicker’,
creating a distracting effect for the viewer. The second reason is due to an effect used to
improve legibility which is called anti-aliasing. When using this technique in computer
and video applications, some suggest that it reduces the readability of serif fonts because
of the physical size of pixels on a video or computer screen (Bernard & Mills, 2000;
Felici, 1996). This can be detailed with further clarification by first taking a moment to
describe differences between orthochromatic and anti aliased type.
69
High resolution print materials use what is called an ‘orthochromatic’ process to
render type that is printed onto books, magazines, brochures, and so on. The printed area
where the font appears is made up of tiny little dots (the same as pixels, described earlier
in this chapter). The smaller the size of the dots which make up the image, the higher the
resolution is. In an orthochromatic process, each dot is assigned one of two values: solid
black or solid white. High resolution books and magazines can have resolutions up to
2,400 pixels per inch (PPI) or more (Chandler, 2001). This extremely high resolution
works well in creating high quality text. As such, small details (such as serifs on fonts)
are easily legible. Even lower-end printers used in office settings usually offer around
300ppi resolution, creating elegant, easy to read printed material.
For multimedia and video applications, screen resolutions are capped at a mere
72ppi . This resolution allows the transmission of nearly 30 images per second to reach
viewers without losing data or overloading the capacity to transmit the amount of visual
information to the viewer. Video can be created at higher resolutions than 72ppi,
however, it is virtually impossible to transmit such high resolution imagery based on the
transmission specifications of standard definition television. As such, when creating an
image using 72ppi rather than a higher resolution, such as 2,400ppi, the lower resolution
pixels are larger, as they still must occupy the same amount of physical space (an inch)
to create the overall image. These larger pixels do not create text as easily legible as
what can be produced in printed material. To compensate for the roughness of
orthochromatic rendering technologies on computer and video screens, a process called
‘anti-aliasing’ was created to smooth out letters displayed via these mediums (see Figure
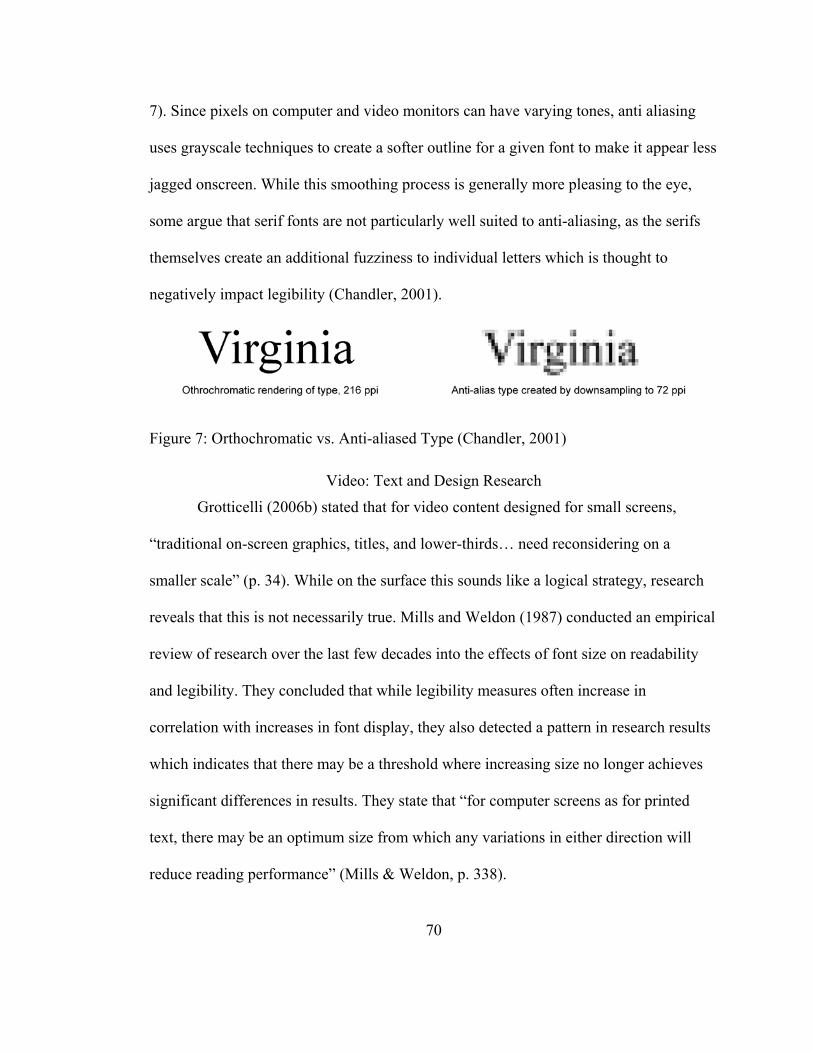
7). Since pixels on computer and video monitors can have varying tones, anti aliasing
uses grayscale techniques to create a softer outline for a given font to make it appear less
jagged onscreen. While this smoothing process is generally more pleasing to the eye,
some argue that serif fonts are not particularly well suited to anti-aliasing, as the serifs
themselves create an additional fuzziness to individual letters which is thought to
negatively impact legibility (Chandler, 2001).
Figure 7: Orthochromatic vs. Anti-aliased Type (Chandler, 2001)
Video: Text and Design Research
Grotticelli (2006b) stated that for video content designed for small screens,
“traditional on-screen graphics, titles, and lower-thirds… need reconsidering on a
smaller scale” (p. 34). While on the surface this sounds like a logical strategy, research
reveals that this is not necessarily true. Mills and Weldon (1987) conducted an empirical
review of research over the last few decades into the effects of font size on readability
and legibility. They concluded that while legibility measures often increase in
correlation with increases in font display, they also detected a pattern in research results
which indicates that there may be a threshold where increasing size no longer achieves
significant differences in results. They state that “for computer screens as for printed
text, there may be an optimum size from which any variations in either direction will
reduce reading performance” (Mills & Weldon, p. 338).
70
71
Rather than recommending specific font sizes, some suggest using ratios for
minimal letter height based on the distance of the viewer from the medium (Smith, 1979;
Tinker, 1963; Wogalter, 2006). Smith (1979) conducted a multi-year study to test
whether or not there was any scientific validity to the idea that ratio-based formulas
could serve as a reliable gauge for designers. Over the course of several years,
engineering college students in human factors courses were given research assignments
requiring them to collect legibility measurements with various subjects and compare
their findings with recommended standards. Students were free to choose the type of
text-based content for analysis. The procedure to carry out the testing was simple. They
were required to position viewers at a distance far enough away from a given text-based
display that they could not read it. Viewers were then asked to slowly move toward the
display until they could read the text. The distance from the display was measured and
recorded along with a description of the font size and type used. A multitude of
treatments were tested. “Some tested single letters or random mixtures of letters and
numerals. Most tested single words or running text” (Smith, 1979, p. 665). In total, 88
student researchers collected data from over 500 viewers resulting in a total of 2007
measures of legibility. Smith compared his overall data to the recommendations
specified in U.S. Military Standard 1472B which specifies a distance/font size ratio for
developing physical user equipment interfaces (Smith; Wogalter). From the total number
of measures taken, only eight instances of the individual measures fell within the ratio
specified in 1472B. The remaining 2001 measures all showed that visual acuity was
actually much greater than what the standard presumes. In other words, the
72
recommended standard appeared to be very conservative, as the data shows that humans
can legibly read text at much higher distance to letter size ratios than the standard allows
for. Smith’s study did support the idea, however, that the standard generally appears to
be safe in guaranteeing legibility.
One interesting angle to the idea of utilizing a ratio of font size to distance for
obtaining practical, ideal designs is the notion that users will always have a fixed
distance. While there are recommendations (Beldie, Pastoor, & Schwarz, 1983; Pastoor,
Schwarz, & Beldie, 1983) for optimum viewing distances from a standard television set,
it is unknown how close or far the average person sits away from their televisions when
viewing them. The same could be said for printed text, as it is merely the act of moving
one’s hand closer or further away to adjust the distance of a page of print. And, of
course, handheld video devices offer up the same variability in viewing. So, while the
notion of ideal ratios is interesting, its practicality in just about any design medium,
electronic, print or otherwise, is somewhat questionable.
One of the few studies looking at differences in text specifically on color
television sets was conducted by Pastoor, Schwarz, and Beldie (1983). Measuring font
sizes with the height by width ratio of a given font, they measured the legibility of four
different sized fonts. Since the fonts they measured were fixed-size dot-matrix fonts, all
characters in a given set, both upper and lower case, occupied the same number of
horizontal pixels on the screen. To test for legibility, they measured five performance
tasks and one rating task for each of twenty total participants in the study. The various
conditions and layouts of font information were displayed on a 51 cm color television
73
monitor. Curiously, and they do not specify why they chose to do this, they set up the
television so that there would be no interlacing interference – in other words, they used
progressive frames to display the images. This is somewhat puzzling, as this is one of
the fundamental differences between computer displays and television displays. In
altering the nature of the signal, it would seem that they would have been just as well
served to have shown the varying treatments on computer monitors rather than
televisions. Regardless, four different quantitative measures were used to test legibility.
Participants were asked to read the textual content aloud as quickly as possible. This task
was timed for comparison among subjects. They were each given a problem where they
were presented with a screen of lower case letters as well as a corresponding sheet of
paper with similar letters in a similar layout. They were each given two minutes to find
as many discrepancies between the paper and electronic screen as possible. A third
measure was taken for what the researchers dubbed an information service task. Subjects
were shown a screen of text listing products, prices, and names of stores where the items
could be purchased. They were repeatedly asked, in each different font treatment, to pick
the cheapest store which carried a given item. For the final quantitative measure,
participants were given a list of words which they were required to place in alphabetical
order. With the exception of the last mentioned task, where participants created lists of
on-screen words in alphabetical order, the researchers found that differences in font sizes
yielded significant differences in all of the task-based measures.
The four treatments across all of the participants’ tasks consisted of the following
four font sizes (in width by height-based pixel ratios): 5 x 7, 7 x 9, 9 x 13, and 11 x 15.
74
What Pastoor, Schwartz, and Beldie (1983) found was that increases from 5 x 7 to 7 x 9
sized fonts, and increases from 7 x 9 to 9 x 13 sized fonts yielded significant differences
in overall scores. While the increase from 9 x 13 sized fonts to 11 x 15 sized fonts did
yield a slightly higher mean score, it was not a significant mean difference when tested
at the p = .05 level. For two of the four described tasks, “the quantitatively best
performances were achieved not with the largest character size (11 x 15), but rather with
the 9 x 13 character size” (Pastoor, Schwartz, & Beldie, p. 271). This is consistent with
other research which has suggested that while increasing font sizes can improve task-
oriented viewing, there may be a threshold at which increasing size no longer achieves
much benefit (Beldie, Pastoor, & Schwarz, 1983: Sheedy, Subbaram, Zimmerman, &
Hayes, 2005).
Beldie, Pastoor, and Schwarz (1983) looked at the impact on task efficiency that
fixed matrix size fonts have, compared to variable matrix size fonts. They tested reading
speed, error identification, and word identification to see if either font style yielded
better results in these tasks. Viewing conditions were the same as those conducted by
Pastoor, Schwartz, and Beldie (1983) in that viewers sat six screen heights from the
monitor when viewing. Also like the prior study, the information was viewed in
progressive frames, rather than with interlaced frames. A total of nine subjects took
multiple task-oriented tests with both of the two font treatments. The arrangement of the
test sequences varied from subject to subject.
Repeated measures one-tailed T tests were calculated for each of the variables.
Their findings showed a significant difference in reading times between the two
75
treatments. Variable matrix fonts yielded faster reading times than type composed with
fixed matrix fonts. Only one of the error-identification based tasks showed a significant
difference: error identification appeared to be more accurate with variable matrix fonts
than with fixed matrix fonts. Their findings support the idea that variable matrix fonts
are more flexible for designers to work with than fixed matrix fonts. One suggested
reason for this is that, since variable matrix fonts are overwhelmingly used in print
materials, perhaps viewers are used to reading this style of layout and therefore are more
accustomed to perusing it for information.
Geske (2000) studied font size and type face effects on readability and user
preference. Seventy-eight participants viewed randomly assigned paragraphs of text on
web pages with treatments that varied the font style and size. Speed of reading was
measured to the nearest second for each treatment. A multiple choice test on the material
was presented upon completion of each treatment to measure for comprehension and
short-term recall. Participants were also asked questions relating to their preference
among the various treatments.
Geske’s (2000) conclusions generally support the idea that a threshold exists for
reading text on computer monitors. Among the range of ten to fourteen point sizes which
he tested, he found that twelve point fonts achieved the best results in terms of speed of
reading. Statistical significance for this finding was only found in serif type faces,
however. Interestingly, the largest size font in his study, fourteen point, was subjectively
the most preferred of the sizes, even though it did not achieve the best performance
among the varying treatments. This finding is consistent with other research that points
76
to the idea that viewers prefer larger sized font treatments, even though they may not
necessarily offer the strongest performance (Chen et al, 1996; Pancheo et al., 1999).
Geske did find statistically significant differences between font treatments in measures
of comprehension based on short term recall. Viewers reading twelve point fonts
achieved significantly higher comprehension scores than all the other font sizes, even
between serif and sans serif fonts. Geske stated that, “this research shows that some of
the common sense typographic “rules” and traditions are not supported by the evidence.
Larger type, while preferred by the reader, is not better for speed of reading or
comprehension” (¶ 60).
Of course, there are studies with opposing results that suggest that larger font
sizes correlate to improvements in reading and comprehension. Chandler (2001)
examined the effects of sans-serif vs. serif type, font sizes in eight, ten, and twelve point
type, and orthochromatic compared to anti-aliased type on reading speed and
comprehension in computer-mediated environments. While his analysis was not
concerned with television or handheld viewing all of his subjects viewed the various
treatments on computer monitors, so his results were of relevance to this study.
Chandler (2001) conducted a study with 110 college students from Virginia
Polytechnic Institute and State University. Small groups (approximately 5 students at a
time) were brought into a lab setting and instructed to read through multiple paragraphs
of text on a computer monitor. While the selected passages were the same, they either
read the passage in Helvetica (a sans-serif style font) or Palatino (a serif style).
Participants viewed randomized styles and sizes across all of the treatment groups.
77
Results from the study indicated that there was statistical significance in viewer
legibility based on font size. Ultimately, those reading from twelve point fonts scored
significantly higher at the p < .05 level than those reading from eight or ten point sizes
across all variables. Chandler (2001) also found that choices in anti-aliased and
orthochromatic type yielded statistically significant differences in legibility based on
whether or not a sans-serif or serif font was used. Sans-serif fonts achieved better
legibility results when rendered by orthochromatic means than with anti-aliasing
technology. Conversely, serif fonts achieved better legibility results with anti-aliased on-
screen rendering than when presented as orthochromatic.
While Chandler’s (2001) study yielded some significant differences and
interaction effects based on measures of legibility, it produced no significant differences
in terms of viewer comprehension of the presented materials. This is certainly worth
note, as the measure of legibility used was a speed-of-reading test. While often used as a
measure of the effectiveness of font variables in varying circumstances (Beldie, Pastoor,
& Schwarz, 1983; Pastoor, Schwarz, & Beldie, 1983), speed of reading is not terribly
relevant within video applications. For one, the temporality of the text that a viewer is
exposed to is controlled entirely by the producer. The decision is made by the producer
or editor to keep a certain body of text, be it a lower-third or full screen graphic, on
screen for a given amount of time. Viewers can usually choose to pause a screen if they
need more time to process the information, but this is rarely necessary. Seasoned
producers and editors will usually keep text on screen at minimal lengths, and will
account for the amount of time that one needs to read a given block of text. Therefore,
78
while Chandler denotes that larger font sizes yield increased legibility, his results on
comprehension, which showed no statistical significance, are probably more applicable
to the current study. These results support the ideas within this study, which counter
arguments made by Groticelli (2006a; 2006b) that a proper approach to graphic design
for small screen viewing is to simply increase the overall size of text and its framework
to encompass half or all of the total real-estate of the viewing screen.
Sheedy et al. (2005) measured the impact of font size on legibility among a
number of additional factors. For their study, they recruited 30 students from Ohio State
University. Their inclusion criteria required that all participants had at least 20/20 vision.
Four different font sizes (eight, ten, twelve, and fourteen) were tested across six different
fonts (Verdana, Georgia, Times New Roman, Arial, Franklin, and Plantin) to obtain
measures of legibility. They compared anti-aliasing styles, kerning adjustments, and
italic and bold font treatments across all of the test conditions. They also looked at the
effects of different display types: Liquid Crystal Display (LCD), Cathode Ray Tube
(CRT), and printed hard copies of text. Each of the participants viewed all of the three
display conditions from an even distance, and measures of acuity were collected for all
forms of treatments (font size, font style, anti-aliasing, etc.).
Their findings were consistent with the idea that there is a threshold on font sizes
in visual displays. “No further increase in legibility was obtained at pixel heights greater
than 9. The 9-pixel setting (10-point font) provided enough detail for optimal
recognition, and hence additional pixels did not significantly improve threshold
legibility” (Sheedy et al., 2005, p. 806). In general, sans-serif fonts performed better in
79
measurements of legibility than serif fonts. Of the six fonts that were compared, Veranda
and Arial showed significant differences in measures of legibility than the other fonts in
the study. While their research showed that certain sans-serif fonts outperformed other
serif fonts, they caution on generalizing too much from their results. Sheedy et al. stated
that “It is not possible to generalize that one category of fonts is more legible than the
other. It appears that the legibility of each font would need to be determined separately”
(p. 813).
The works of the various researchers and authors cited whom have contributed to
the present understanding of type and design offer an overview of the factors which
come into play given the recent convergence of print and electronic media which
continues to saturate the everyday experience. The application of these research findings
shall be detailed in the following chapter on the methodology of this study. The ultimate
goal is to implement these findings within the newer context of handheld video and,
hopefully, gain a better understanding of how (or even if) these principles apply to
creating educational video products for handheld video applications.
Leadership Considerations
As the study of leadership has evolved, so have the theories for leadership styles
and competencies. While it is generally held that certain aspects of leadership cross all
spectrums of management, some hold that leading highly skilled, technical professionals
– an adequate description for those involved in professional video production – requires
alternative, specified skills and talents outside of the scope of traditional management
(Glen, 2003; McCall, 1983; Rosenbaum, 1991). Knowledge workers have a nature and
80
style that differs from other workforce sectors. They are driven by the strong desire for
both personal and professional achievement. “As such, they are most productive when
they can achieve their professional goals in the process of pursuing organizational goals”
(Morse & Babcock, 2007, p. 164). They also require a great deal of independence.
Generally, the greater their ability to control the conditions and tempo of their tasks and
environment, the better their ability to function in a work setting.
To a large extent, this necessitates a degree of technical competence from the
leader or manager of a team of skilled professionals. On one hand, the leader of
knowledge workers needs to be able to act as a liaison between clients and technical
professionals. Communication structures of this nature can reduce the effects of sluggish
bureaucracy that can occur from clients who do not understand how the trade works, but
need to feel directly involved in a project due to their personal nature. In this role, the
leader must have enough competence of the product being created to intercept requests
from clients that may potentially bog down the process and disrupt the ability for team
members to stay focused and on track for a given project.
Beyond the ability of running interference, leadership competence is crucial to
managing knowledge workers due to the expectations that most knowledge workers
have for their leaders. Glen (2003) stated that technical professionals “… generally don’t
suffer fools gladly” (p. 36). Those with highly technical backgrounds are quick to judge
whether leadership is worthy of respect. If project managers demonstrate that they are
not competent in the tasks which they are supposed to be overseeing, workers in these
environments will quickly build barriers to communication and collaboration as a means
81
of protecting themselves from the influence of unwise managerial decisions which may
affect their work.
So why then do leaders in educational multimedia and video production care
about the minutia of whether or not long shots or close-ups are important when
transferring video to handheld specifications? How does a study of graphic legibility and
its effects on knowledge transfer in handheld mobile video contribute to the body of
research on educational leadership? Though small in scope compared with many ‘big
picture’ studies in the educational leadership arena, this study is of primary interest to
leaders overseeing knowledge workers in educational multimedia and video production
environments. Primarily, it offers a morsel of insight into production standards that will
help build competence for leadership in these settings. Studies of this nature will add to
the theoretical constructs that shape the educational communications of the future.
Leaders armed with the knowledge acquired from these experiments will have better
insight on how to strategize educational media production and distribution.
For any organization, leaders are faced with issues that affect the organization
both internally and externally (Bolman & Deal, 2003). Externally, leaders in educational
media must possess awareness of the trends in new media that surround them.
McLaughlin (2001) stated that “The information consumer has continually demanded
easier and better access to information” (p. 38). Commercial and private enterprises are
scrambling to meet the demands that consumers have for instant gratification of their
products. Leaders in educational media environments must also strategize in a similar
manner in order to ensure that their curricula are as prolific and accessible as possible to
82
learners. When budgets are tight, as they often are in educational environments, not
having the foresight to see mobile transmission as an option for a video and multimedia
production can easily translate to ineffective distribution of expensive and resource-
intensive content. Poor strategic modeling of production and distribution schemes can
have a dramatic impact on the effectiveness of educational media. Vekiri (2002) stated
that “learning difficulty may sometimes result from the design of instruction and not
from the nature of the material to be learned” (p.276). Short-sightedness on the part of
educational media leaders can easily lead to the dissemination of media which falls short
of end-user knowledge retention. When this occurs, the leader has failed to properly
perform his or her responsibilities.
These issues are important to the internal functions of multimedia and mobile
video production as well. Given the necessity of competence for leaders in these
environments, it is important for them to be able to design and articulate media strategies
to his or her team. These strategies must be formulated by experienced, knowledgeable
leaders. Not only is it important for gaining the trust and respect of technical
professionals, but sound decisions supported by theoretical constructs of research are
more likely to achieve the ‘buy-in’ which is necessary for employees to carry out their
tasks with the independence and motivation that they require for job satisfaction.
A review of the literature suggests that both of the formal features discussed
within this paper – composition and graphic design – can weigh heavily on the success
or failure of educational videos. The ultimate question being asked herein is; does the
delivery medium of video content (NTSC video or handheld video) alter the style in
83
which shot composition and graphic design should be utilized to achieve maximum
viewer retention of knowledge being presented? The following chapter contains a
summary of the methodology used to answer this question through this mixed-mode
analysis: the ultimate goal being to gain insight to the effects that these formal features
have on knowledge retention with end users of mobile educational video. It will contain
a summation of the development of a measurement instrument, as well as details on the
data collection process and analyses for this dissertation. Results of the study will be
detailed in Chapter Four, followed by discussion and implications of the findings in
Chapter Five.
84
CHAPTER THREE: METHODOLOGY
Introduction
This study was designed to ascertain a better understanding for production
methods which improve knowledge retention for learners using handheld educational
video. Two formal features were manipulated within the context of an educational video
on wine evaluation. The two variables specifically altered were shot composition and
graphic design styles. The goal of the study was to determine if manipulation of these
variables had any affect on a user’s knowledge retention. The study also examined user
preferences for viewing educational content on regular television sets compared to
handheld devices.
Problem Statement
Viewing video on handheld devices is a new phenomenon: the result of a
convergence of communications technologies which cater to our increasingly mobile
lifestyles (Koblentz, 2005; Orgad, 2006; Wagner 2005). Despite a deficiency of
scientific inquiry, industry practitioners are already publishing opinions about the proper
usage of shots and graphics when developing content for small screens. A school of
thought is developing which suggests that video content produced for mobile devices
should avoid the use of long shots and increase the overall size of graphics used in
mobile handheld video (Grotticelli, 2006a, 2006b; Orgad; Wang, Houqiang, & Fan,
2006). If these assumptions are true, then content creators for mobile devices should
follow these guidelines in order to ensure the adequate communication of messages to
85
viewing audiences. If, however, they are based on false conjecture, then producers are
more likely to place unnecessary limitations on the symbol systems available to convey
meaning and instruction via the medium of handheld video. This could ultimately result
in the creation and distribution of inferior message designs due to production practices
based on false assumptions.
This study was designed to test whether or not these prescribed stylistic formulas
are necessary. The remainder of this chapter will describe the overall methodology used
for this study, and detail the processes used to develop and refine the instrumentation
used to collect data.
The Educational Video
The test instrument used for this study was designed to measure viewers’
knowledge retention of content from a ten minute educational video on the subject of
wine evaluation. The video was produced specifically for this study. The subject of wine
evaluation was chosen in hopes of maximizing interest in a topic that is somewhat
elusive to the general public. Initial drafts of scripts for an educational topic concerned
video production and motion design tutorials, but they were abandoned for fear that
those types of topics would only be of interest to certain populations. Further, the
learning outcomes for educational products delving into those types of topics tend to be
skill-based. The researcher was looking for something which would hopefully be of
interest to a broader audience. Attention and attentional inertia are thought to contribute
heavily on learning outcomes from video programming (Anderson, Lorch, & Field,
1981; Anderson et al., 1986; Huston et al., 1983). Learning outcomes for this study were
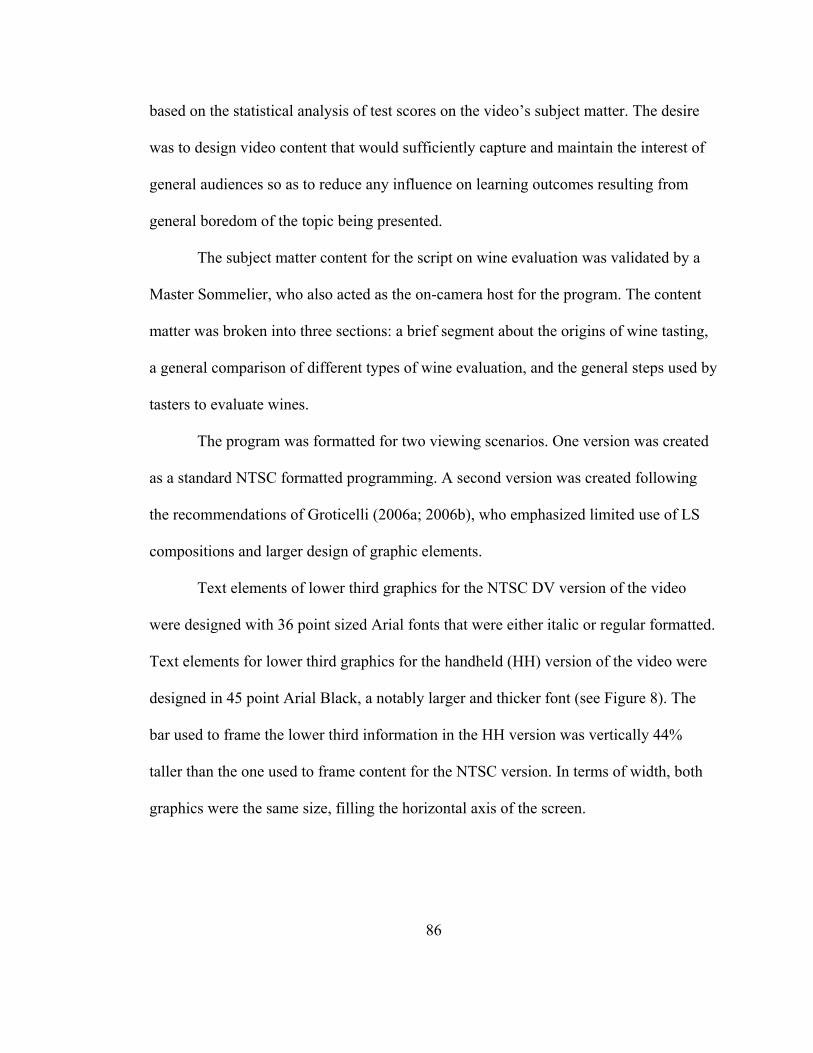
86
based on the statistical analysis of test scores on the video’s subject matter. The desire
was to design video content that would sufficiently capture and maintain the interest of
general audiences so as to reduce any influence on learning outcomes resulting from
general boredom of the topic being presented.
The subject matter content for the script on wine evaluation was validated by a
Master Sommelier, who also acted as the on-camera host for the program. The content
matter was broken into three sections: a brief segment about the origins of wine tasting,
a general comparison of different types of wine evaluation, and the general steps used by
tasters to evaluate wines.
The program was formatted for two viewing scenarios. One version was created
as a standard NTSC formatted programming. A second version was created following
the recommendations of Groticelli (2006a; 2006b), who emphasized limited use of LS
compositions and larger design of graphic elements.
Text elements of lower third graphics for the NTSC DV version of the video
were designed with 36 point sized Arial fonts that were either italic or regular formatted.
Text elements for lower third graphics for the handheld (HH) version of the video were
designed in 45 point Arial Black, a notably larger and thicker font (see Figure 8). The
bar used to frame the lower third information in the HH version was vertically 44%
taller than the one used to frame content for the NTSC version. In terms of width, both
graphics were the same size, filling the horizontal axis of the screen.
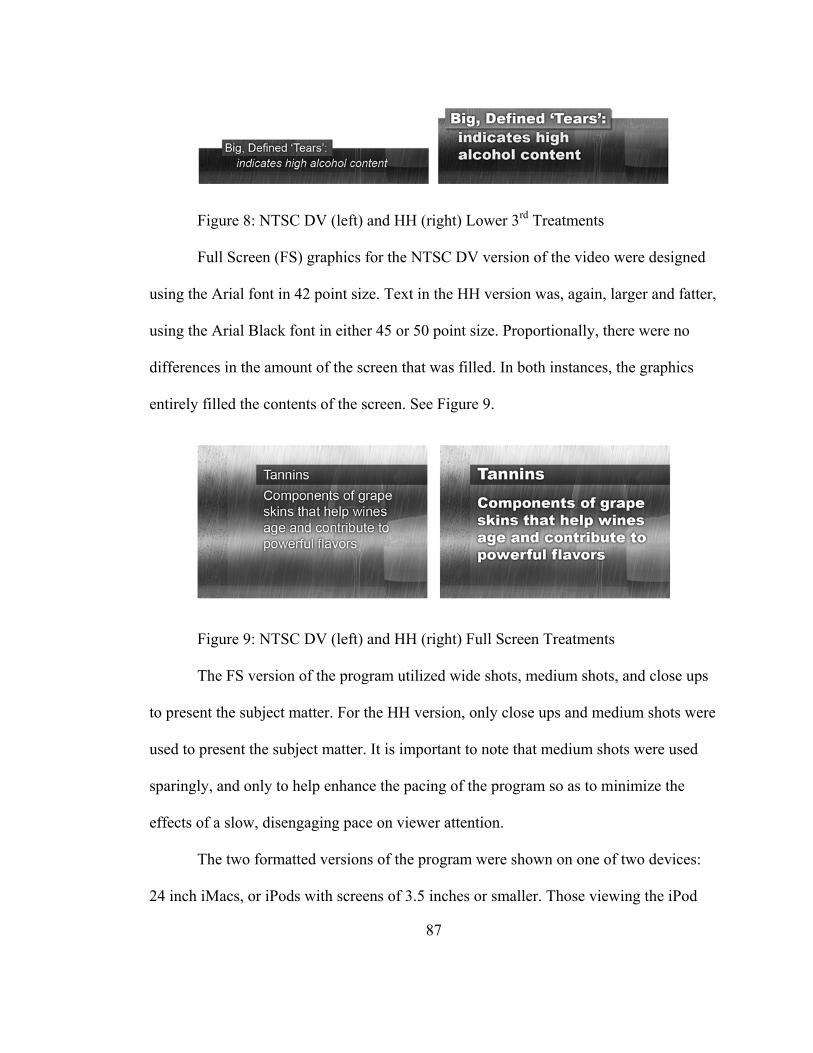
Figure 8: NTSC DV (left) and HH (right) Lower 3rd Treatments
Full Screen (FS) graphics for the NTSC DV version of the video were designed
using the Arial font in 42 point size. Text in the HH version was, again, larger and fatter,
using the Arial Black font in either 45 or 50 point size. Proportionally, there were no
differences in the amount of the screen that was filled. In both instances, the graphics
entirely filled the contents of the screen. See Figure 9.
Figure 9: NTSC DV (left) and HH (right) Full Screen Treatments
The FS version of the program utilized wide shots, medium shots, and close ups
to present the subject matter. For the HH version, only close ups and medium shots were
used to present the subject matter. It is important to note that medium shots were used
sparingly, and only to help enhance the pacing of the program so as to minimize the
effects of a slow, disengaging pace on viewer attention.
The two formatted versions of the program were shown on one of two devices:
24 inch iMacs, or iPods with screens of 3.5 inches or smaller. Those viewing the iPod
87
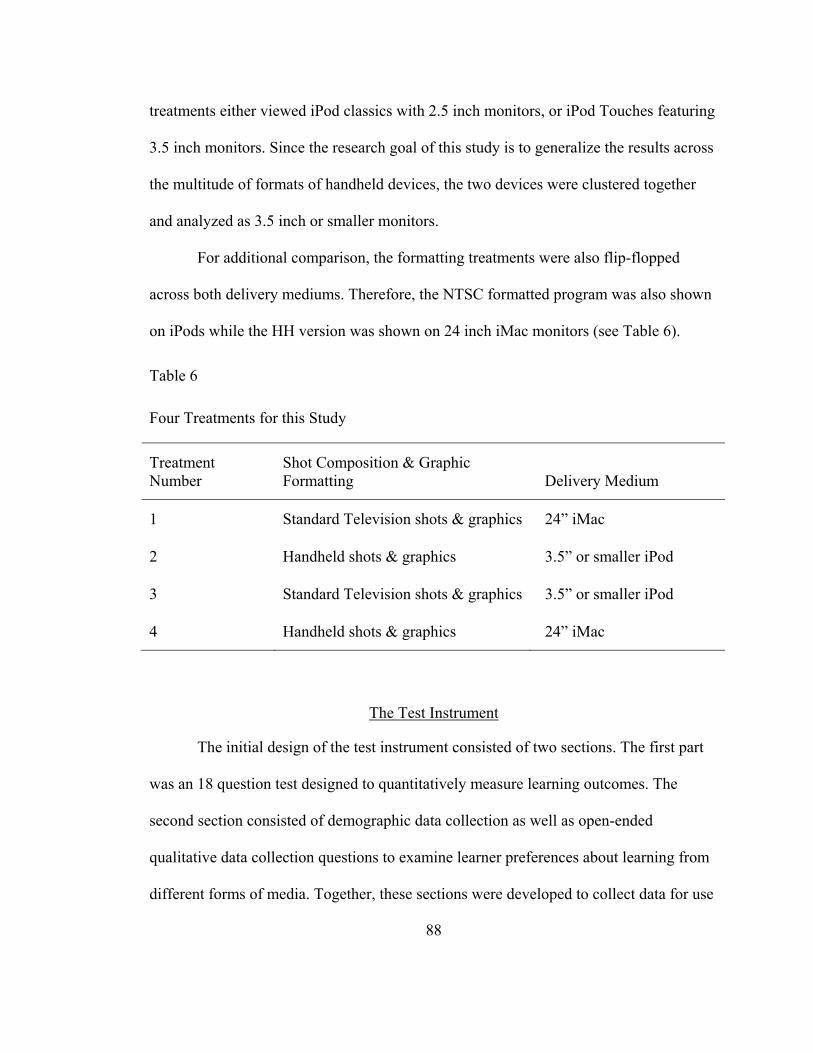
88
treatments either viewed iPod classics with 2.5 inch monitors, or iPod Touches featuring
3.5 inch monitors. Since the research goal of this study is to generalize the results across
the multitude of formats of handheld devices, the two devices were clustered together
and analyzed as 3.5 inch or smaller monitors.
For additional comparison, the formatting treatments were also flip-flopped
across both delivery mediums. Therefore, the NTSC formatted program was also shown
on iPods while the HH version was shown on 24 inch iMac monitors (see Table 6).
Table 6
Four Treatments for this Study
Treatment Number
Shot Composition & Graphic Formatting Delivery Medium
1 Standard Television shots & graphics 24” iMac
2 Handheld shots & graphics 3.5” or smaller iPod
3 Standard Television shots & graphics 3.5” or smaller iPod
4 Handheld shots & graphics 24” iMac
The Test Instrument
The initial design of the test instrument consisted of two sections. The first part
was an 18 question test designed to quantitatively measure learning outcomes. The
second section consisted of demographic data collection as well as open-ended
qualitative data collection questions to examine learner preferences about learning from
different forms of media. Together, these sections were developed to collect data for use
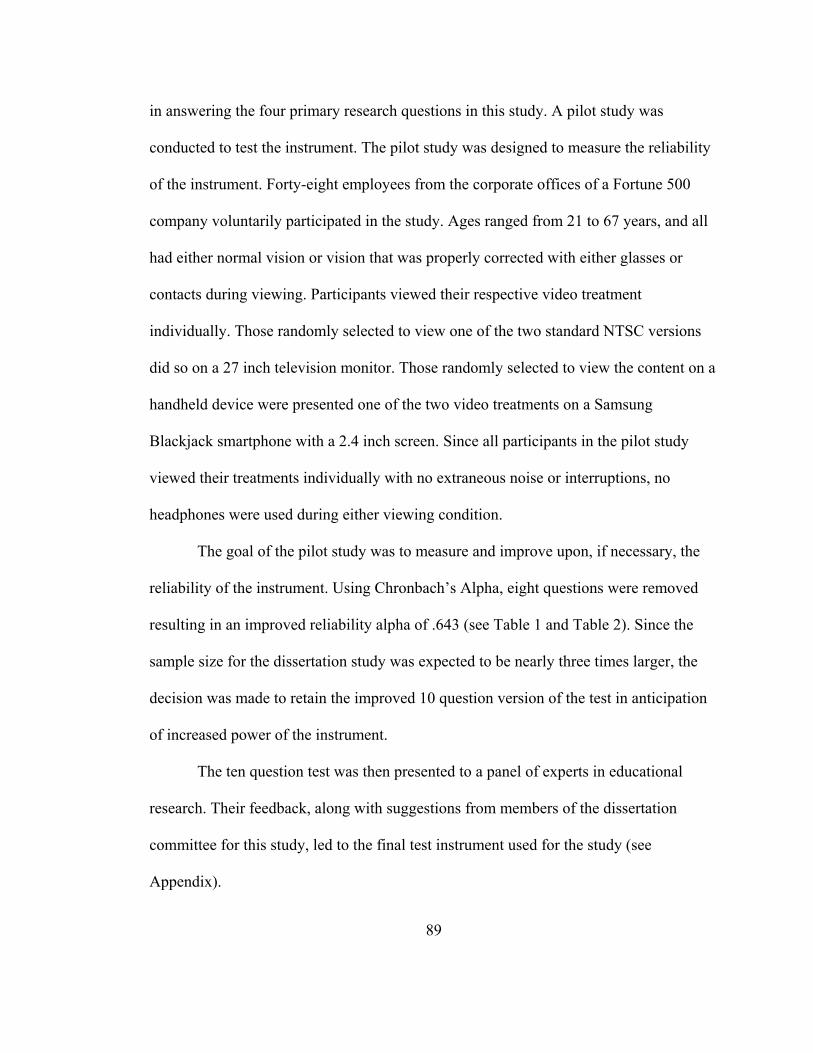
89
in answering the four primary research questions in this study. A pilot study was
conducted to test the instrument. The pilot study was designed to measure the reliability
of the instrument. Forty-eight employees from the corporate offices of a Fortune 500
company voluntarily participated in the study. Ages ranged from 21 to 67 years, and all
had either normal vision or vision that was properly corrected with either glasses or
contacts during viewing. Participants viewed their respective video treatment
individually. Those randomly selected to view one of the two standard NTSC versions
did so on a 27 inch television monitor. Those randomly selected to view the content on a
handheld device were presented one of the two video treatments on a Samsung
Blackjack smartphone with a 2.4 inch screen. Since all participants in the pilot study
viewed their treatments individually with no extraneous noise or interruptions, no
headphones were used during either viewing condition.
The goal of the pilot study was to measure and improve upon, if necessary, the
reliability of the instrument. Using Chronbach’s Alpha, eight questions were removed
resulting in an improved reliability alpha of .643 (see Table 1 and Table 2). Since the
sample size for the dissertation study was expected to be nearly three times larger, the
decision was made to retain the improved 10 question version of the test in anticipation
of increased power of the instrument.
The ten question test was then presented to a panel of experts in educational
research. Their feedback, along with suggestions from members of the dissertation
committee for this study, led to the final test instrument used for the study (see
Appendix).
90
Research Questions
1) What differences, if any, exist between self-perceptions of learning with video training materials formatted for handheld devices compared to large screen delivery mediums?
2) Is there a difference in learning outcomes based on shot composition and graphic
design formatting for educational videos being viewed on 3.5 inch screens (or smaller) compared to 24 inch monitors? (See Table 3 for grouping.)
3) Is there a relationship between user learning preferences for viewers watching
educational video content on handheld devices or televisions and viewer frequency of watching educational videos on handheld devices?
4) What are the relationships, if any, between the user frequency of viewing videos
on handheld devices and learning outcomes?
Thus, the following hypotheses are generated for examination in this study:
1) H0 = There is no difference in self perceptions of learning between the four treatment groups.
2) H0 = There is no difference in learning outcomes between the four treatment
groups. 3) H0 = There is no difference in learning outcomes between users viewing content
on iPods and those viewing content on 24 inch monitors.
4) H0 = There is no difference in ranked video quality between the four treatment groups.
5) H0 = There is no relationship between the preferred learning methods of users
and the frequency in which they report viewing handheld video content.
6) H0 = There is no relationship between reported frequency of viewing video on handheld devices and learning outcomes.
Data Analysis
Learning outcomes were measured based on an individual’s performance on the
ten item test. Self perceptions of learning were measured with four items on the test
91
which ask users the extent to which they agree or disagree with statements relating to
how easy they found the contents of the video. The variety of hypotheses presented
required several different approaches for testing. Hypothesis one was tested with an
Analysis of Variance. The second hypothesis was tested using an Independent T-test.
Hypothesis three used an ANOVA. The fourth hypothesis was tested using an
Independent T-test. Hypothesis five utilized a Kruskall-Wallace nonparametric test.
Hypothesis six was measured with Chi-square Test of Indpendence. The seventh
hypothesis was tested with a Pearson Correlation.
Several qualitative questions were also asked within the test instrument (see
Appendix) to gain deeper insight beyond the quantitative measures being conducted.
This data was analyzed by the researcher to expound upon the findings herein.
Sample
The sample for this study consisted of 132 undergraduate college students at the
University of Central Florida. Participants were enrolled in one of two curricula: Visual
Language or Digital Media. General ages ranged from 18 to 26 years of age. Six groups
of 20 to 30 students each were tested. The treatments for each group were randomly
assigned based on a generated set of numbers from Research Randomizer (Urbaniak &
Plous, 2008). Since the students were grouped together in clusters of 20 or 30 at a time,
all students were provided headphones so that they could view their respective treatment
without interruption or interference from others viewing the video on nearby devices.
Upon completion of viewing, each student was provided the paper test instrument for
completion.
92
Limitations
This study was intended to expand upon previous research into the cognitive
effects that formal features have on viewers. Specifically, the research goal was to
determine if alterations in shot composition and graphic design result in changes in
knowledge retention and viewer preference. This work expanded on previous
examinations on the effects of formal features by making comparisons within the newer
realm of viewing video in the context of small, handheld devices. As this medium is
relatively new, no prior studies or test instruments exist to directly measure the research
questions and hypotheses that were tested herein. To compensate for this, an extensive
review of literature was conducted to compile best practices used in the past to study
similar effects within similar mediums. These practices were borrowed from to devise
the current methodology discussed in this chapter.
A proprietary test instrument was developed to collect and measure data for use
within this study. A pilot study utilizing several statistical analyses as well as several
rounds of peer review was conducted to modify and improve the reliability of the
instrument.
Data were collected using a sample of undergraduate college students studying
visual language and digital media. The subject matter of the instructional material was
chosen to maximize interest levels across a broad spectrum of audiences. The desire was
to avoid polluting the collected data by introducing viewer disinterest or lack of attention
to the topic. Still, while it was believed that, in general, the subject matter would appeal
to a broad spectrum of viewers, it was understood that not everyone, including college
93
students, would find interest in the topic of wine evaluation. As such, disinterest in the
instructional materials could have led to a lack of attention, in turn corrupting the
collected data. There may also have also been members of the selected sample whom
already possessed a great deal of knowledge on the topic. To minimize their effects,
randomization was employed to increase the likelihood that these folks would be
randomly distributed across the sample.
Additionally, though most instructional designers make the best efforts to craft
engaging training materials, not all instruction has the levity to be generalized for mass
audiences. Some instructional needs may simply be about topics that are, in general, not
interesting. For instance, instructional videos on tax preparation, or even industrial
training such as proper sanitation of poultry processing equipment, while not compelling
content, may be necessary training for a given population. As such, results from this
study will not likely be able to be generalized to these types of applications.
Lastly, as this chapter has described, participants in this study took the test
immediately after viewing their respective video treatment. As such, this study was not
designed to measure any long-term gains or losses in knowledge retention. The data
collected represent a snapshot of knowledge immediately retained by viewers through
the methodical use of formal features to highlight and accentuate key instructional goals.
Long-term effects on learning and/or application of the skills presented within the video
were beyond the scope of this study.
94
Summary
The methodology used to develop instrumentation and collect and analyze data
for this study has been detailed within this chapter. Research questions were presented
as well as a set of hypotheses for examination. A set of 132 undergraduate college
students were sampled with the methodologies outlined herein. Chapter Four will
present the raw data collected and the results of the statistical analyses designed to
answer the research questions and address the hypotheses. Chapter Five will conclude
with a discussion of the results as well as implications and recommendations for further
research into this area of inquiry.
95
CHAPTER FOUR: ANALYSIS OF DATA
Introduction
This investigation was designed to offer insight on a topic that has recently
emerged within the video production profession: should videos produced for playback
on handheld devices be produced with more limited sets of formal features than videos
produced for playback on standard size monitors? The variety of formal features
available for manipulation for a study of this nature made it impossible to test all of
them. To keep the results manageable, two formal features were chosen as variables for
this study. The first was shot composition and the second was graphic design. Some
authors suggest that when producing videos for handheld devices, the use of long shots
should be minimized and avoided if possible (Orgad, 2006; Wang, Houqing, & Fan,
2006). Grotticelli (2006b) recommended that graphics such as lower third identifiers
should utilize up to half of the screen size in order to ensure legibility for viewers. These
assumptions were tested in a conjoined fashion: that is, shot composition and graphic
design were manipulated together across the four treatment groups. Participants
watching a video formatted according to the specifications for handheld video viewed
shot composition and graphic design treatments manipulated in accordance with the
aforementioned recommendations. Those watching video formatted for large screens
viewed a shot composition and graphic design treatment recommended for that specified
format. The treatments were then flip-flopped so that one group watched videos
formatted for handheld viewing specifications on large monitors and another group
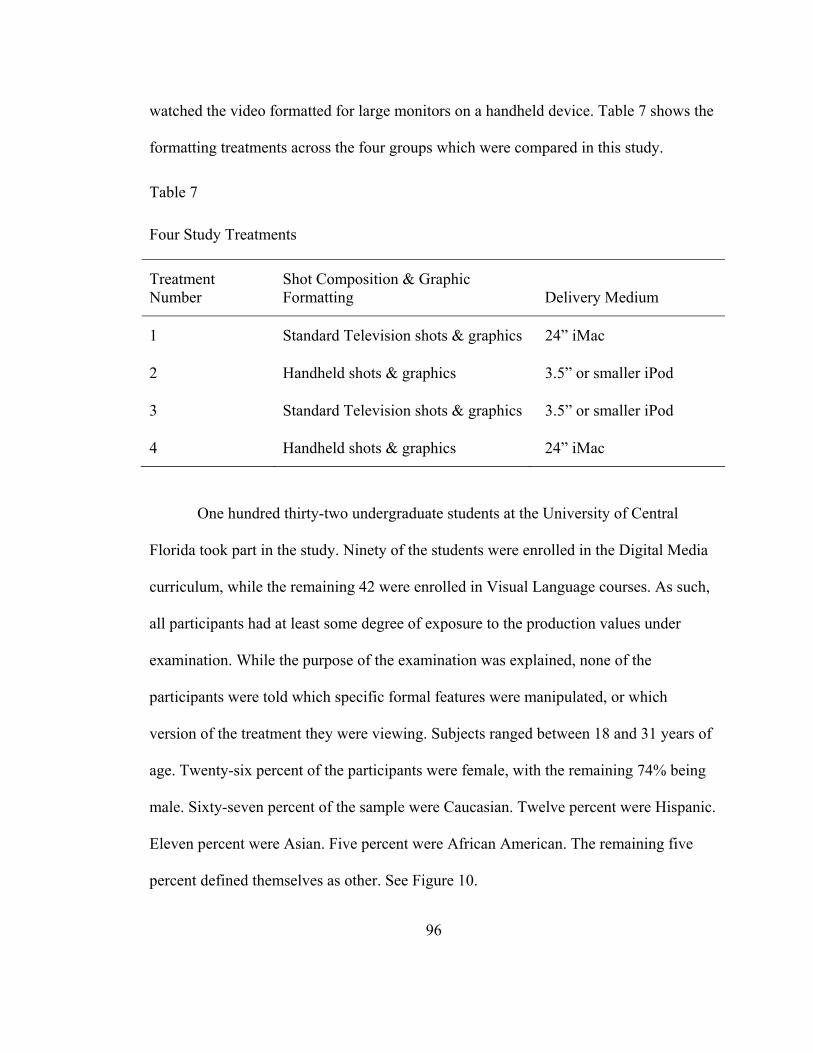
96
watched the video formatted for large monitors on a handheld device. Table 7 shows the
formatting treatments across the four groups which were compared in this study.
Table 7
Four Study Treatments
Treatment Number
Shot Composition & Graphic Formatting Delivery Medium
1 Standard Television shots & graphics 24” iMac
2 Handheld shots & graphics 3.5” or smaller iPod
3 Standard Television shots & graphics 3.5” or smaller iPod
4 Handheld shots & graphics 24” iMac
One hundred thirty-two undergraduate students at the University of Central
Florida took part in the study. Ninety of the students were enrolled in the Digital Media
curriculum, while the remaining 42 were enrolled in Visual Language courses. As such,
all participants had at least some degree of exposure to the production values under
examination. While the purpose of the examination was explained, none of the
participants were told which specific formal features were manipulated, or which
version of the treatment they were viewing. Subjects ranged between 18 and 31 years of
age. Twenty-six percent of the participants were female, with the remaining 74% being
male. Sixty-seven percent of the sample were Caucasian. Twelve percent were Hispanic.
Eleven percent were Asian. Five percent were African American. The remaining five
percent defined themselves as other. See Figure 10.
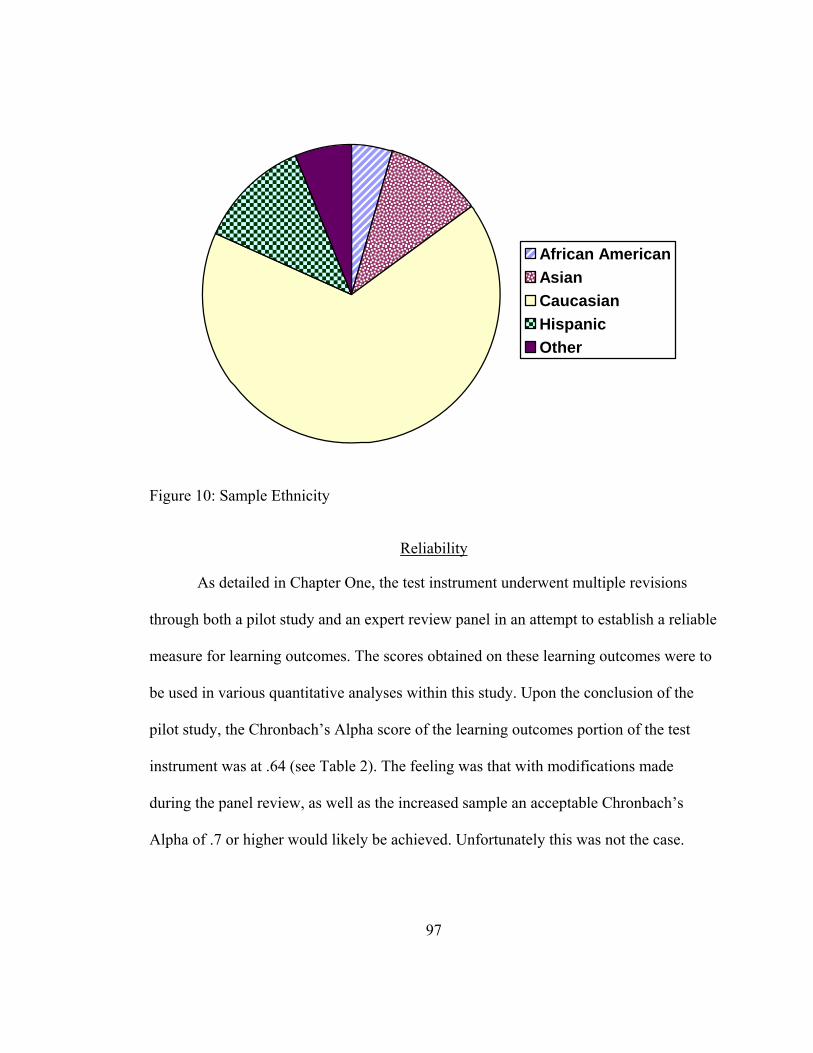
African AmericanAsianCaucasianHispanicOther
Figure 10: Sample Ethnicity
Reliability
As detailed in Chapter One, the test instrument underwent multiple revisions
through both a pilot study and an expert review panel in an attempt to establish a reliable
measure for learning outcomes. The scores obtained on these learning outcomes were to
be used in various quantitative analyses within this study. Upon the conclusion of the
pilot study, the Chronbach’s Alpha score of the learning outcomes portion of the test
instrument was at .64 (see Table 2). The feeling was that with modifications made
during the panel review, as well as the increased sample an acceptable Chronbach’s
Alpha of .7 or higher would likely be achieved. Unfortunately this was not the case.
97
98
When the Chronbach’s Alpha test was repeated with the sample of 132 students, the
outcome plummeted to .18 (see Table 8).
Table 8
Reliability of Learning Outcomes Measures (n = 132)
Chronbach’s Alpha N of Items
.177 10
This, of course, had an impact on the statistics used to measure differences
among learning outcomes based on media and modifications to the educational program.
For now the reliability of the test is simply detailed. The implications of this on the
overall findings within the study are detailed in Chapter Five.
Research Question One
The first research question asked was: what differences, if any, exist between
self-perceptions of learning with video training materials formatted for handheld devices
compared to large screen delivery mediums? The desired outcome was to gain insight as
to whether or not formatting or delivery methods could contribute to any significant
differences among the perceived ability to learn from a given medium. Participants were
asked the degree to which they agreed or disagreed with statements concerning their
ability to visually comprehend content as well as their increased understanding of the
materials presented within the video (see Figure 11).
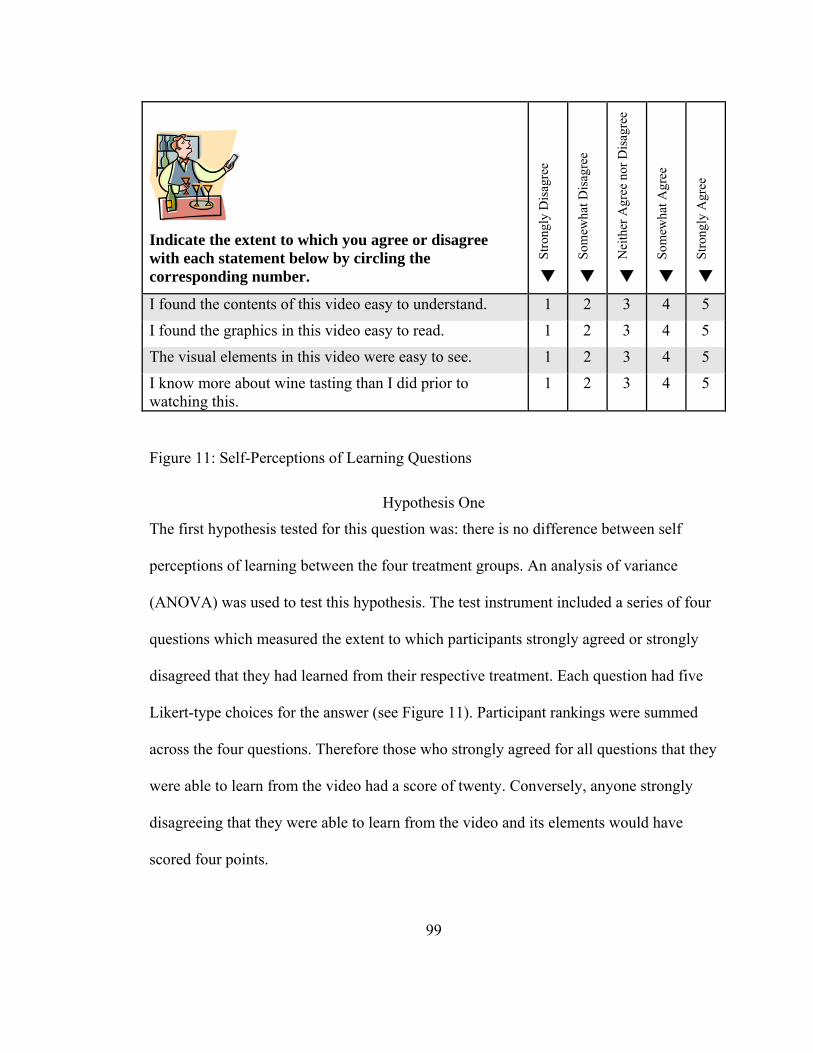
Indicate the extent to which you agree or disagree with each statement below by circling the corresponding number.
Stro
ngly
Dis
agre
e
Som
ewha
t Dis
agre
e
Nei
ther
Agr
ee n
or D
isag
ree
Som
ewha
t Agr
ee
Stro
ngly
Agr
ee
I found the contents of this video easy to understand. 1 2 3 4 5
I found the graphics in this video easy to read. 1 2 3 4 5
The visual elements in this video were easy to see. 1 2 3 4 5
I know more about wine tasting than I did prior to watching this.
1 2 3 4 5
Figure 11: Self-Perceptions of Learning Questions
Hypothesis One
The first hypothesis tested for this question was: there is no difference between self
perceptions of learning between the four treatment groups. An analysis of variance
(ANOVA) was used to test this hypothesis. The test instrument included a series of four
questions which measured the extent to which participants strongly agreed or strongly
disagreed that they had learned from their respective treatment. Each question had five
Likert-type choices for the answer (see Figure 11). Participant rankings were summed
across the four questions. Therefore those who strongly agreed for all questions that they
were able to learn from the video had a score of twenty. Conversely, anyone strongly
disagreeing that they were able to learn from the video and its elements would have
scored four points.
99
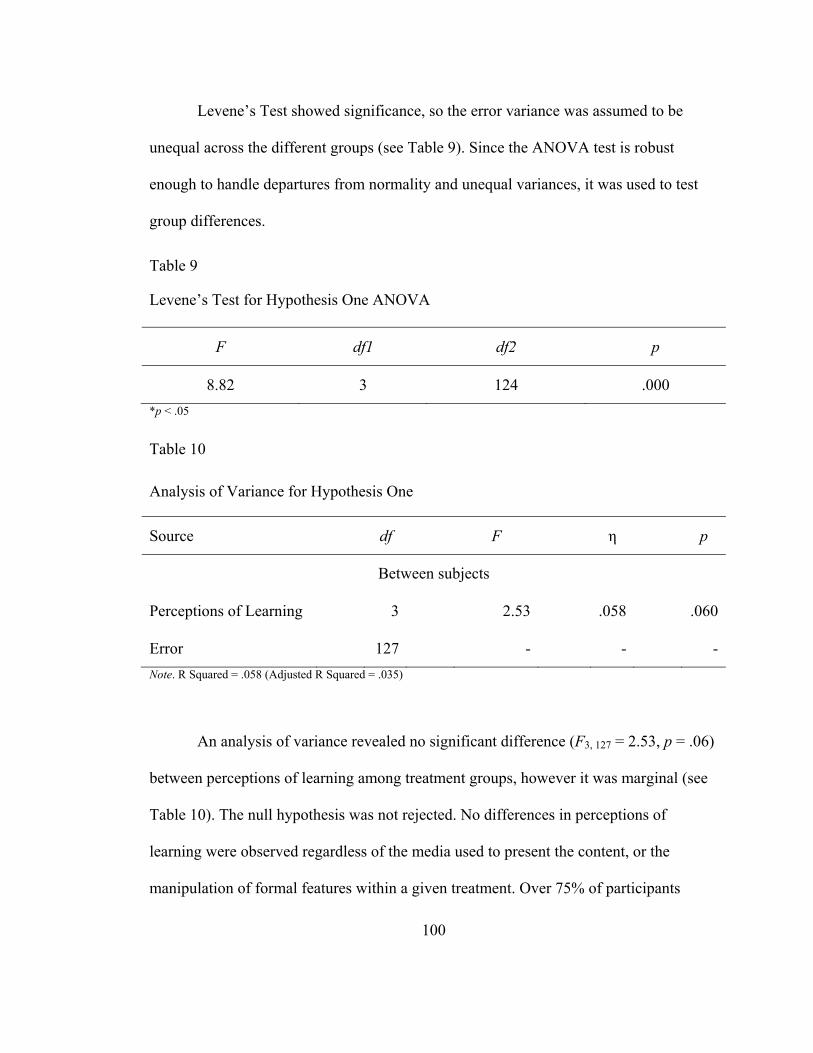
100
Levene’s Test showed significance, so the error variance was assumed to be
unequal across the different groups (see Table 9). Since the ANOVA test is robust
enough to handle departures from normality and unequal variances, it was used to test
group differences.
Table 9
Levene’s Test for Hypothesis One ANOVA
F df1 df2 p
8.82 3 124 .000 *p < .05
Table 10
Analysis of Variance for Hypothesis One
Source df F η p
Between subjects
Perceptions of Learning 3 2.53 .058 .060
Error 127 - - -Note. R Squared = .058 (Adjusted R Squared = .035)
An analysis of variance revealed no significant difference (F3, 127 = 2.53, p = .06)
between perceptions of learning among treatment groups, however it was marginal (see
Table 10). The null hypothesis was not rejected. No differences in perceptions of
learning were observed regardless of the media used to present the content, or the
manipulation of formal features within a given treatment. Over 75% of participants
101
scored 18 points or higher (from the 20 total possible) in the assessment of their ability
to learn from the video.
To gain a deeper insight into participants’ feelings toward viewing educational
content on handheld devices, the following open-ended question was asked on the
instrument: do you think that you can effectively learn from viewing educational videos
on handheld devices? Why or why not?
Nearly 86% of respondents responded yes to the question. A number of different
reasons were offered. Accessibility to educational materials appeared numerous times as
an advantage of the handheld devices. Participants pointed out that they were more
likely to have accessibility to their handheld device than a computer or television, and
therefore saw that as a benefit to having the materials available in this format. Many
who answered ‘yes’ to the question included the caveat that the content needed to be
produced well enough for viewers to see and comprehend the subject matter. One
participant stated “as long as I can see it, I can learn it, no matter what the source is.”
Some even felt that the small format screen had advantages over larger format screens.
The small screen on the iPod “forces you to focus on a small area of viewing, so your
attention is more focused.” Another participant highlighted the kinetic properties of
being able to hold the device while watching the educational content. “I like to hold and
touch things, so as a kinetic learner, it works.”
While some felt that the handheld devices aided their ability to focus, others
expressed concerns about potential distractions. One participant who liked the content
102
stated that “… it just takes more effort to pay attention.” “I think it’s the same as any
other display, although I could see it being easier to get distracted,” stated another.
Seventeen from the sample responded that they did not feel that effective
learning could take place with content delivered on handheld devices. The distraction
factor appeared multiple times within this group. One respondent stated, “I feel that you
can easily get distracted by learning something on such a small screen.” “It’s easy to be
distracted with such a small screen,” responded another. And another participant added
that, “it’s hard to stay focused on a handheld device.”
Among respondents who answered ‘no’ to the question, concerns about the
ability to easily see the content also appeared multiple times. One person stated, “I have
poor eyesight and glasses are not always readily accessible for me.” Another stated that,
“It’s too small to see. If there are notes, I can’t read them.”
Others who responded no to this question simply did not like the idea of learning
from video, regardless of the size of the screen. “I can only learn so much from watching
TV,” stated one participant. Another explained that they did not prefer any video
instruction because of the lack of opportunity for feedback or explanations if concepts
are being interpreted incorrectly by the learner.
Research Question Two
The second research question was; is there a difference in learning outcomes
based on shot composition and graphic design formatting for educational videos being
viewed on 3.5 inch screens (or smaller) compared to 24 inch monitors? This question
was meant to answer whether or not recommended formatting differences for video
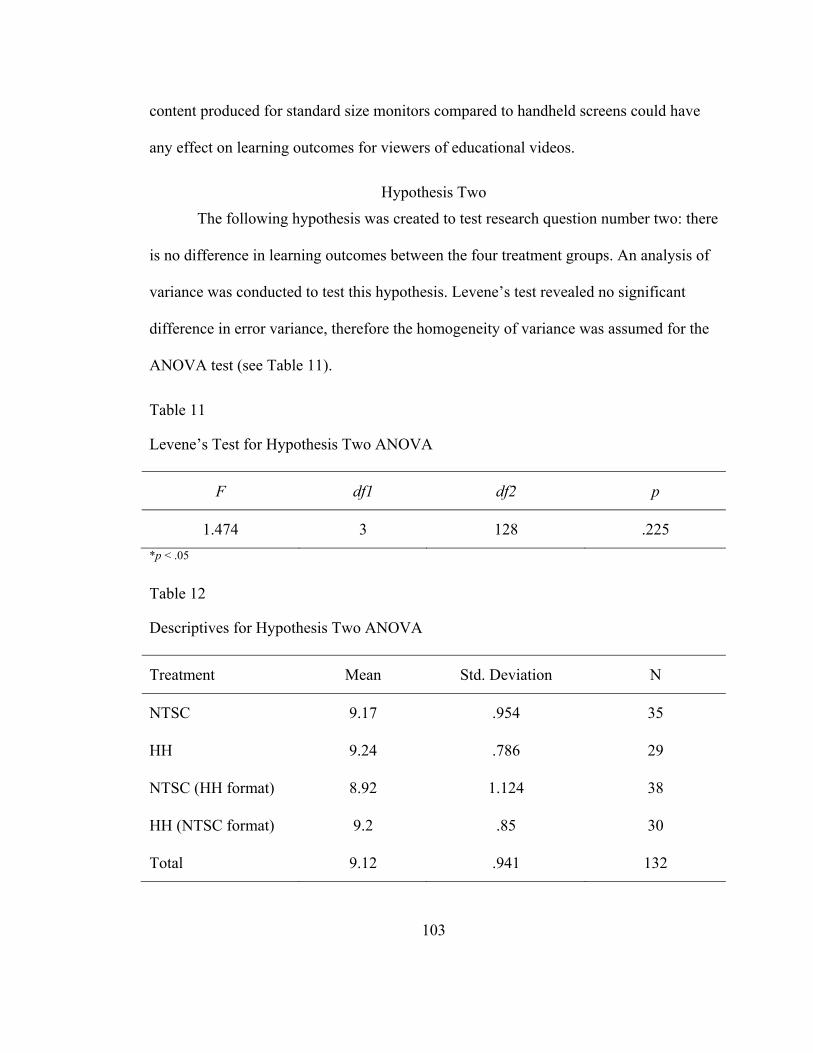
103
content produced for standard size monitors compared to handheld screens could have
any effect on learning outcomes for viewers of educational videos.
Hypothesis Two
The following hypothesis was created to test research question number two: there
is no difference in learning outcomes between the four treatment groups. An analysis of
variance was conducted to test this hypothesis. Levene’s test revealed no significant
difference in error variance, therefore the homogeneity of variance was assumed for the
ANOVA test (see Table 11).
Table 11
Levene’s Test for Hypothesis Two ANOVA
F df1 df2 p
1.474 3 128 .225 *p < .05
Table 12
Descriptives for Hypothesis Two ANOVA
Treatment Mean Std. Deviation N
NTSC 9.17 .954 35
HH 9.24 .786 29
NTSC (HH format) 8.92 1.124 38
HH (NTSC format) 9.2 .85 30
Total 9.12 .941 132
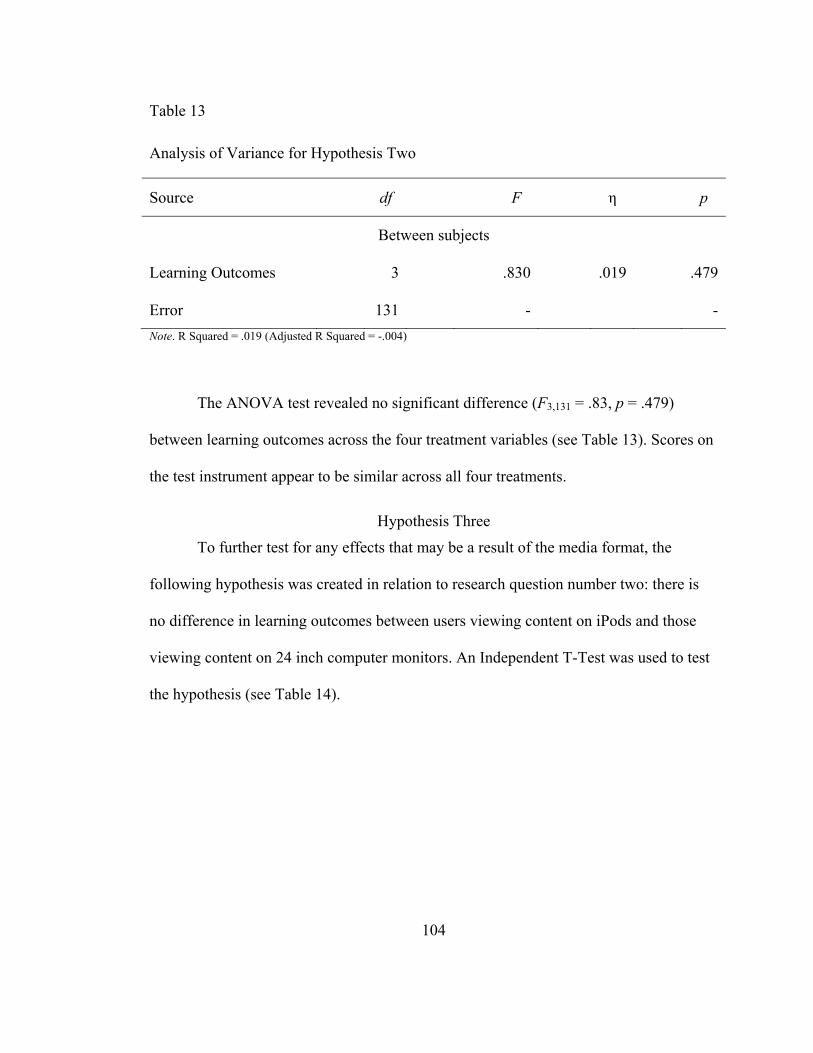
104
Table 13
Analysis of Variance for Hypothesis Two
Source df F η p
Between subjects
Learning Outcomes 3 .830 .019 .479
Error 131 - -Note. R Squared = .019 (Adjusted R Squared = -.004)
The ANOVA test revealed no significant difference (F3,131 = .83, p = .479)
between learning outcomes across the four treatment variables (see Table 13). Scores on
the test instrument appear to be similar across all four treatments.
Hypothesis Three
To further test for any effects that may be a result of the media format, the
following hypothesis was created in relation to research question number two: there is
no difference in learning outcomes between users viewing content on iPods and those
viewing content on 24 inch computer monitors. An Independent T-Test was used to test
the hypothesis (see Table 14).
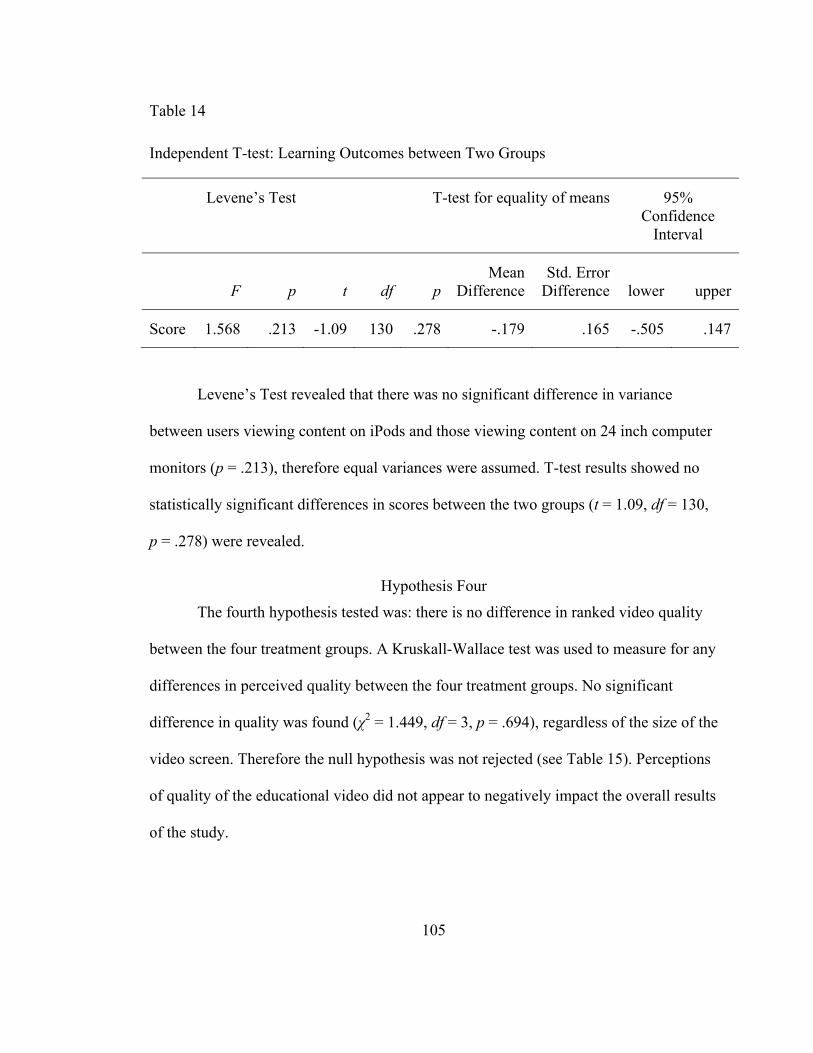
105
Table 14
Independent T-test: Learning Outcomes between Two Groups
Levene’s Test T-test for equality of means 95% Confidence
Interval
F p t df pMean
DifferenceStd. Error
Difference lower upper
Score 1.568 .213 -1.09 130 .278 -.179 .165 -.505 .147
Levene’s Test revealed that there was no significant difference in variance
between users viewing content on iPods and those viewing content on 24 inch computer
monitors (p = .213), therefore equal variances were assumed. T-test results showed no
statistically significant differences in scores between the two groups (t = 1.09, df = 130,
p = .278) were revealed.
Hypothesis Four
The fourth hypothesis tested was: there is no difference in ranked video quality
between the four treatment groups. A Kruskall-Wallace test was used to measure for any
differences in perceived quality between the four treatment groups. No significant
difference in quality was found (χ2 = 1.449, df = 3, p = .694), regardless of the size of the
video screen. Therefore the null hypothesis was not rejected (see Table 15). Perceptions
of quality of the educational video did not appear to negatively impact the overall results
of the study.
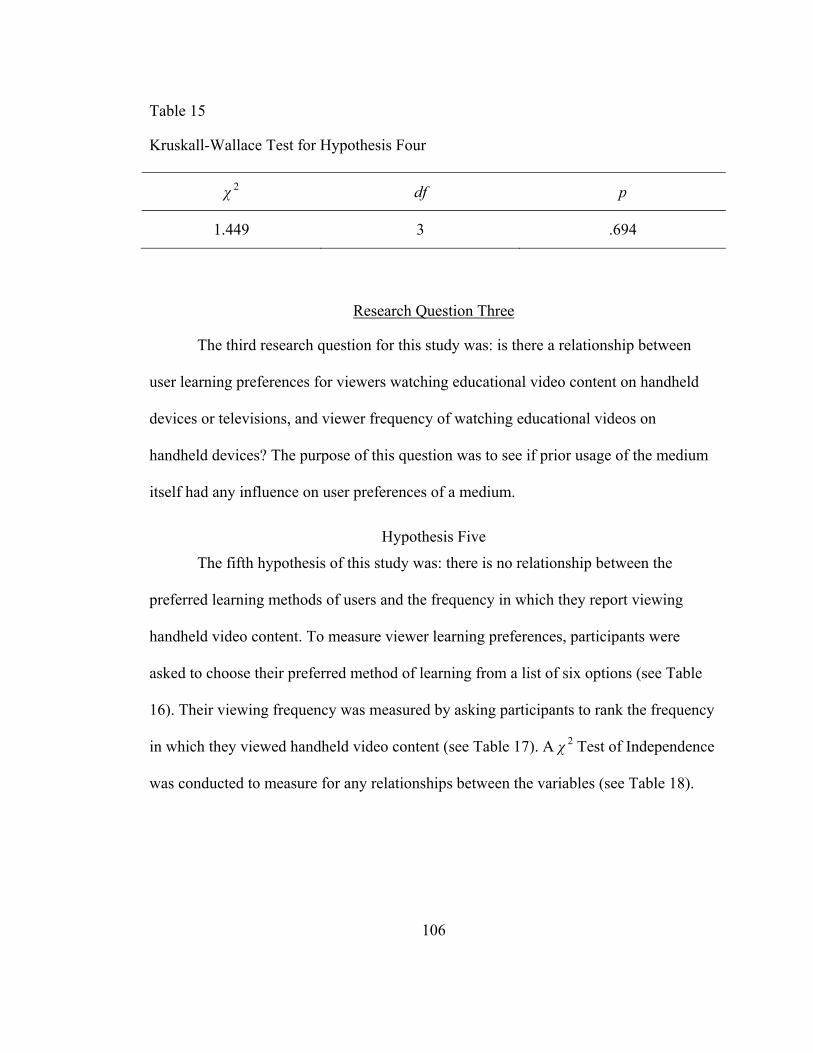
106
Table 15
Kruskall-Wallace Test for Hypothesis Four
χ 2 df p
1.449 3 .694
Research Question Three
The third research question for this study was: is there a relationship between
user learning preferences for viewers watching educational video content on handheld
devices or televisions, and viewer frequency of watching educational videos on
handheld devices? The purpose of this question was to see if prior usage of the medium
itself had any influence on user preferences of a medium.
Hypothesis Five
The fifth hypothesis of this study was: there is no relationship between the
preferred learning methods of users and the frequency in which they report viewing
handheld video content. To measure viewer learning preferences, participants were
asked to choose their preferred method of learning from a list of six options (see Table
16). Their viewing frequency was measured by asking participants to rank the frequency
in which they viewed handheld video content (see Table 17). A χ 2 Test of Independence
was conducted to measure for any relationships between the variables (see Table 18).
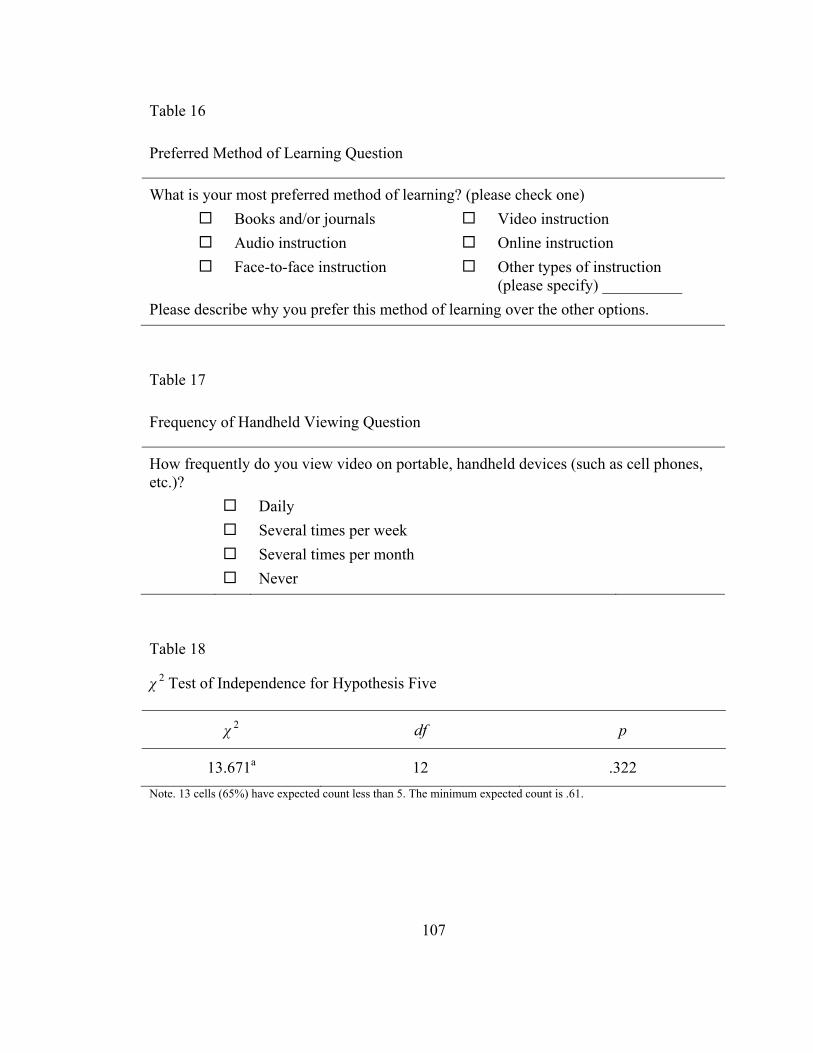
107
Table 16
Preferred Method of Learning Question
What is your most preferred method of learning? (please check one) Books and/or journals Video instruction Audio instruction Online instruction Face-to-face instruction Other types of instruction
(please specify) __________ Please describe why you prefer this method of learning over the other options.
Table 17
Frequency of Handheld Viewing Question
How frequently do you view video on portable, handheld devices (such as cell phones, etc.)? Daily Several times per week Several times per month Never
Table 18
χ 2 Test of Independence for Hypothesis Five
χ 2 df p
13.671a 12 .322 Note. 13 cells (65%) have expected count less than 5. The minimum expected count is .61.
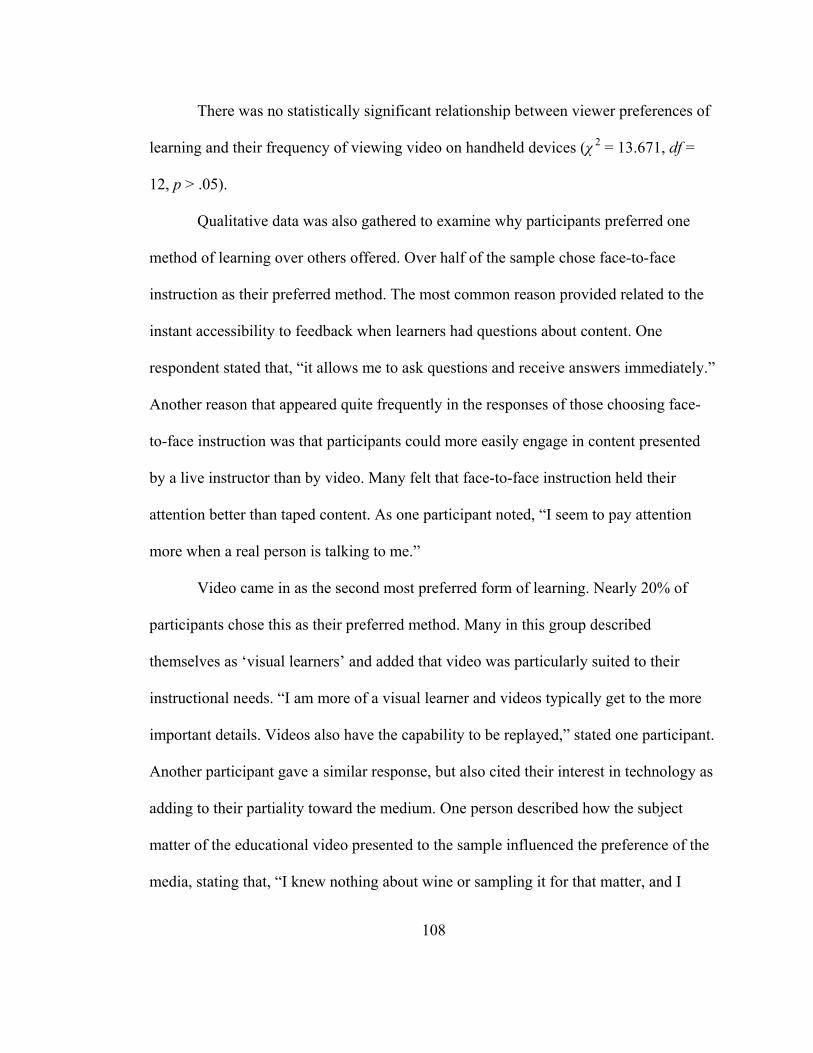
108
There was no statistically significant relationship between viewer preferences of
learning and their frequency of viewing video on handheld devices (χ 2 = 13.671, df =
12, p > .05).
Qualitative data was also gathered to examine why participants preferred one
method of learning over others offered. Over half of the sample chose face-to-face
instruction as their preferred method. The most common reason provided related to the
instant accessibility to feedback when learners had questions about content. One
respondent stated that, “it allows me to ask questions and receive answers immediately.”
Another reason that appeared quite frequently in the responses of those choosing face-
to-face instruction was that participants could more easily engage in content presented
by a live instructor than by video. Many felt that face-to-face instruction held their
attention better than taped content. As one participant noted, “I seem to pay attention
more when a real person is talking to me.”
Video came in as the second most preferred form of learning. Nearly 20% of
participants chose this as their preferred method. Many in this group described
themselves as ‘visual learners’ and added that video was particularly suited to their
instructional needs. “I am more of a visual learner and videos typically get to the more
important details. Videos also have the capability to be replayed,” stated one participant.
Another participant gave a similar response, but also cited their interest in technology as
adding to their partiality toward the medium. One person described how the subject
matter of the educational video presented to the sample influenced the preference of the
media, stating that, “I knew nothing about wine or sampling it for that matter, and I
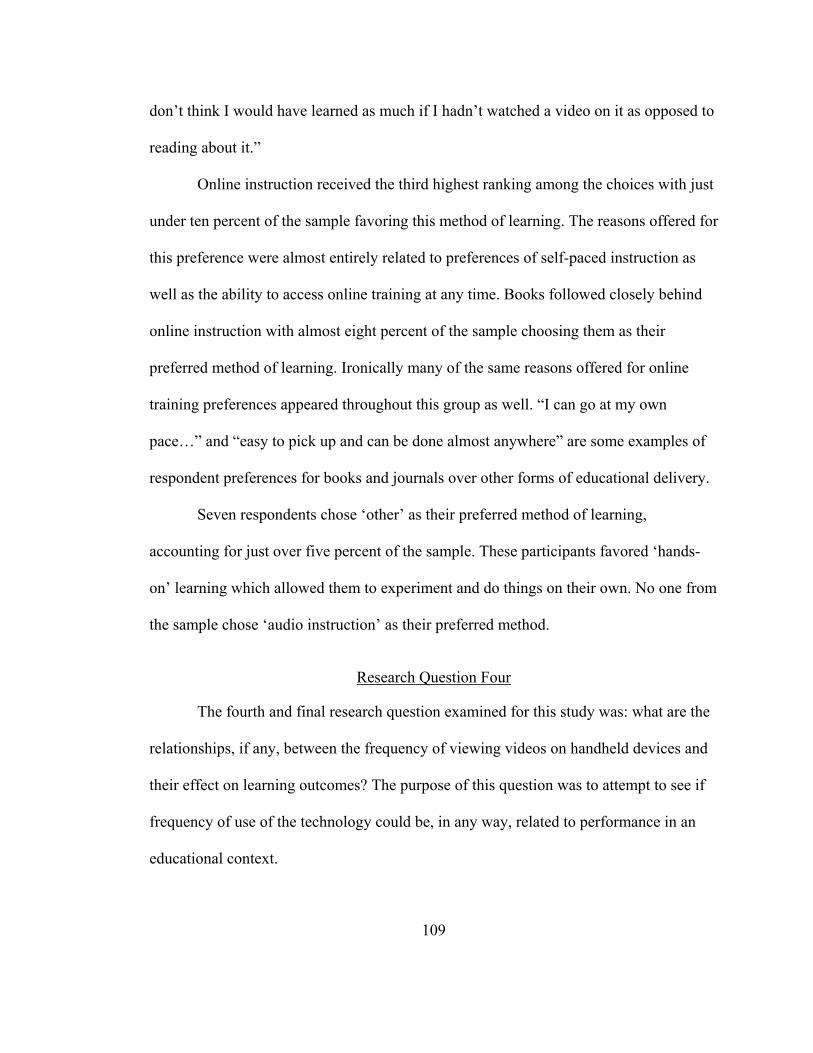
109
don’t think I would have learned as much if I hadn’t watched a video on it as opposed to
reading about it.”
Online instruction received the third highest ranking among the choices with just
under ten percent of the sample favoring this method of learning. The reasons offered for
this preference were almost entirely related to preferences of self-paced instruction as
well as the ability to access online training at any time. Books followed closely behind
online instruction with almost eight percent of the sample choosing them as their
preferred method of learning. Ironically many of the same reasons offered for online
training preferences appeared throughout this group as well. “I can go at my own
pace…” and “easy to pick up and can be done almost anywhere” are some examples of
respondent preferences for books and journals over other forms of educational delivery.
Seven respondents chose ‘other’ as their preferred method of learning,
accounting for just over five percent of the sample. These participants favored ‘hands-
on’ learning which allowed them to experiment and do things on their own. No one from
the sample chose ‘audio instruction’ as their preferred method.
Research Question Four
The fourth and final research question examined for this study was: what are the
relationships, if any, between the frequency of viewing videos on handheld devices and
their effect on learning outcomes? The purpose of this question was to attempt to see if
frequency of use of the technology could be, in any way, related to performance in an
educational context.
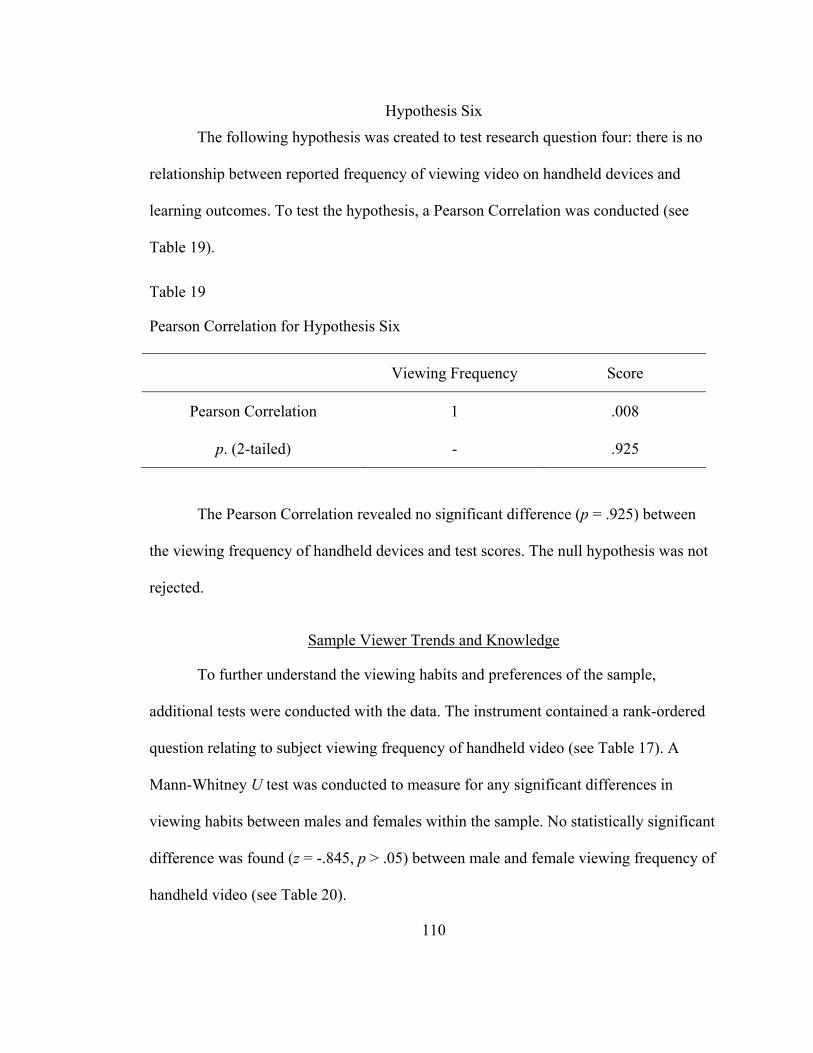
110
Hypothesis Six
The following hypothesis was created to test research question four: there is no
relationship between reported frequency of viewing video on handheld devices and
learning outcomes. To test the hypothesis, a Pearson Correlation was conducted (see
Table 19).
Table 19
Pearson Correlation for Hypothesis Six
Viewing Frequency Score
Pearson Correlation 1 .008
p. (2-tailed) - .925
The Pearson Correlation revealed no significant difference (p = .925) between
the viewing frequency of handheld devices and test scores. The null hypothesis was not
rejected.
Sample Viewer Trends and Knowledge
To further understand the viewing habits and preferences of the sample,
additional tests were conducted with the data. The instrument contained a rank-ordered
question relating to subject viewing frequency of handheld video (see Table 17). A
Mann-Whitney U test was conducted to measure for any significant differences in
viewing habits between males and females within the sample. No statistically significant
difference was found (z = -.845, p > .05) between male and female viewing frequency of
handheld video (see Table 20).
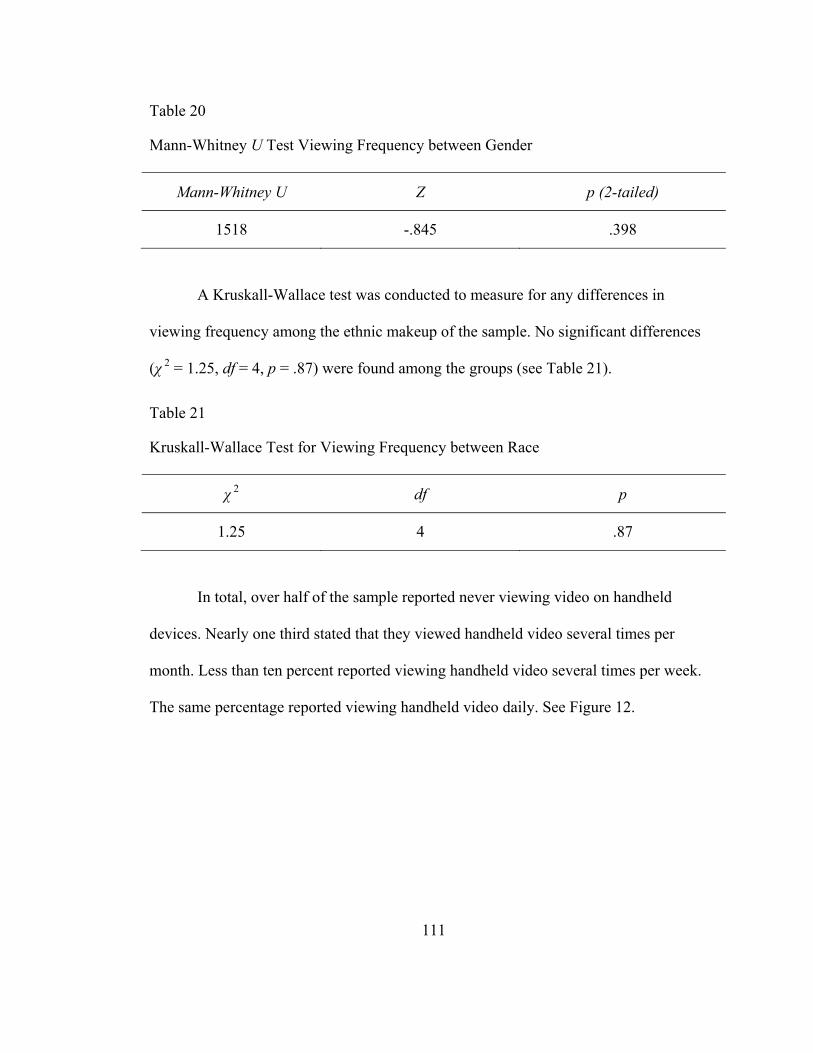
111
Table 20
Mann-Whitney U Test Viewing Frequency between Gender
Mann-Whitney U Z p (2-tailed)
1518 -.845 .398
A Kruskall-Wallace test was conducted to measure for any differences in
viewing frequency among the ethnic makeup of the sample. No significant differences
(χ 2 = 1.25, df = 4, p = .87) were found among the groups (see Table 21).
Table 21
Kruskall-Wallace Test for Viewing Frequency between Race
χ 2 df p
1.25 4 .87
In total, over half of the sample reported never viewing video on handheld
devices. Nearly one third stated that they viewed handheld video several times per
month. Less than ten percent reported viewing handheld video several times per week.
The same percentage reported viewing handheld video daily. See Figure 12.
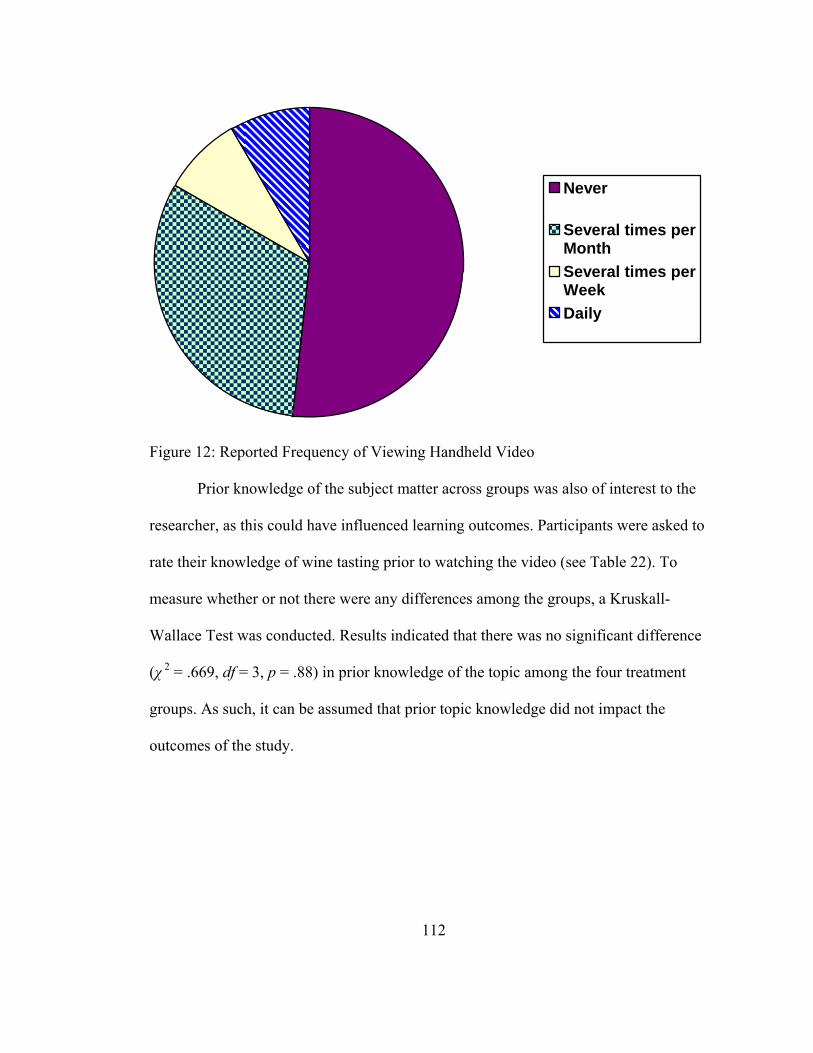
Never
Several times perMonthSeveral times perWeekDaily
Figure 12: Reported Frequency of Viewing Handheld Video
Prior knowledge of the subject matter across groups was also of interest to the
researcher, as this could have influenced learning outcomes. Participants were asked to
rate their knowledge of wine tasting prior to watching the video (see Table 22). To
measure whether or not there were any differences among the groups, a Kruskall-
Wallace Test was conducted. Results indicated that there was no significant difference
(χ 2 = .669, df = 3, p = .88) in prior knowledge of the topic among the four treatment
groups. As such, it can be assumed that prior topic knowledge did not impact the
outcomes of the study.
112
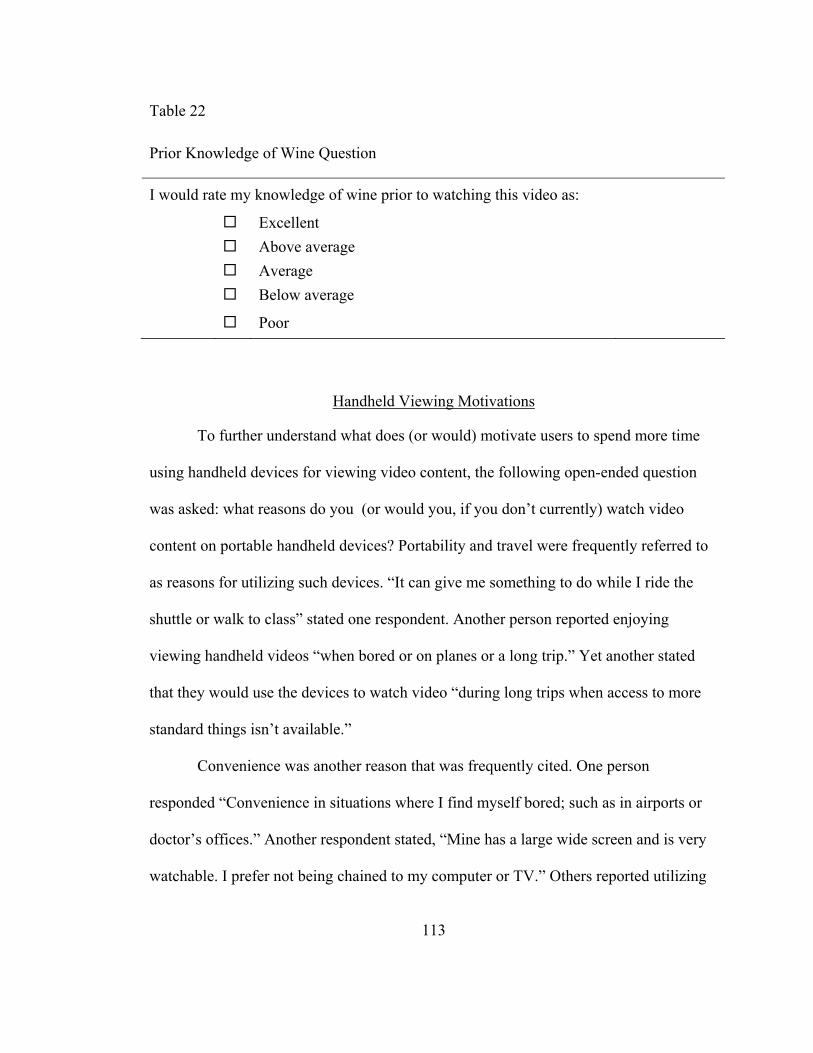
113
Table 22
Prior Knowledge of Wine Question
I would rate my knowledge of wine prior to watching this video as:
Excellent Above average Average Below average
Poor
Handheld Viewing Motivations
To further understand what does (or would) motivate users to spend more time
using handheld devices for viewing video content, the following open-ended question
was asked: what reasons do you (or would you, if you don’t currently) watch video
content on portable handheld devices? Portability and travel were frequently referred to
as reasons for utilizing such devices. “It can give me something to do while I ride the
shuttle or walk to class” stated one respondent. Another person reported enjoying
viewing handheld videos “when bored or on planes or a long trip.” Yet another stated
that they would use the devices to watch video “during long trips when access to more
standard things isn’t available.”
Convenience was another reason that was frequently cited. One person
responded “Convenience in situations where I find myself bored; such as in airports or
doctor’s offices.” Another respondent stated, “Mine has a large wide screen and is very
watchable. I prefer not being chained to my computer or TV.” Others reported utilizing
114
the convenience of the devices for more practical purposes: “I save some of my [video]
projects on my iPod so that I can show my friends and family.”
Ease of use also appeared multiple times as an important factor. Though no one
specifically wrote that they found the devices difficult to use, it appears that being able
to easily access the desired video programs is something that many in the sample believe
important to their utilizations of handheld video devices.
A portion of the sample indicated that they had no interest in viewing handheld
video. “I honestly would rather watch it on a computer if I had to watch it at all,” was
one such response. Some stated that they just did not like watching video on small
screens, and therefore were less likely to do so. Still a few others did not prefer viewing
handheld video because of the power consumption issues on their playback devices. “It
kills my battery!” wrote one participant.
Summary
The analyses of the data obtained for this study were presented in this chapter.
Chapter Five contains summaries, thoughts, and interpretations of these findings.
Conclusions and implications for future research in the area of formal features for
handheld video will also be discussed.
115
CHAPTER FIVE: DISCUSSION AND RECOMMENDATIONS
Purpose
This study was designed to test whether or not manipulation of formal features is
necessary when producing educational video content that will be viewed on handheld
devices. In many cases, video programming content is produced for standard sized
screens found in most households, then down-converted for distribution on handheld
devices. There is a school of thought, however, which suggests that additional measures
should be taken during the production phase of a video to ensure that video content is
clearly communicated. Some suggest that formal features such as shot composition and
graphic design styles should be manipulated to better utilize the small amount of screen
real estate available on handheld monitors (Grotticelli, 2006b; Orgad, 2006; Wang,
Houqing, & Fan, 2006). Taking this approach can be more costly and time consuming.
Certainly for this researcher, it extended the amount of time spent on the set while taping
the video produced for this study. To manipulate the shot compositions across
treatments, every long shot (LS) in the script had to be taped twice as both long and
medium shots (MS) in order to have all of the necessary footage to produce the final
product that would be shown across all treatments. The amount of graphics produced for
the final video was also doubled. Two sets of the same graphics had to be created with
differing specifications for each delivery medium. If the need for altering formal features
across the two delivery mediums turned out to be legitimate, then these same measures
would have to be taken for any video project being produced for handheld viewing
116
devices. The only alternative would be to produce strictly for handheld devices. This
would mean creating content within the constraints of the limited sets of formal features
proposed for that medium, then distributing the video across standard and handheld
video mediums. For most, this would not be an acceptable solution, as the constraints on
design styles and shot compositions would likely result in less than pleasing end
products for those viewing on standard devices: based on the sample taken herein, this
would be an overwhelming majority of the population. For organizations with deep
pockets, producing with dual shot and graphic design treatments may simply result in
minor inconveniences. However, for others with less than robust financial resources, the
amount of time and energy expended to undertake these recommendations can have far
larger consequences on the success or failure of an educational program. Thus, the
purpose of the study was to expand the current research on formal features by venturing
into the world of handheld video and providing insight as to whether or not these
assumptions actually yield improved viewing experiences.
As with any endeavor of this size and scope, many new things were learned:
some through the outcomes of successful research and others through failures which will
guide future investigators seeking to increase our understanding of the cognitive science
underlying video programming. The details of those successes and failures follow.
The Instrument
By far, the greatest disappointment in terms of developing this study was the low
reliability score that resulted on the learning outcomes portion of the test instrument
when applied to the sample. Despite pilot study results which looked as though validity
117
would be achieved when applied to a larger sample with less variables, the reliability
plummeted on the ten answer, multiple choice section of the instrument which was used
to measure learning outcomes for the study sample. While, in general, there were no
significant differences found on these portions of the study, it must be noted that the
reliability of the ten question test used to measure learning outcomes for content
presented in the video is questionable.
While reviewing the literature for this research, no record was found of any
general test instrument which could be used for a study of this nature. Most similar prior
research utilized proprietary instruments for their respective research questions. Seeing
no viable alternative, the decision was made to create a test instrument which mirrored
real-world applications of video education in industry and corporate training
environments.
When looking at the overall scores, it is likely that a portion of this failure was
due to the ease of the test instrument. The lowest score on the test was six (out of ten
possible correct) and only two out of 132 participants scored that low. The highest and
most frequently occurring score was a perfect ten. Nearly 42% of the sample achieved
this score.
It is possible that the high test scores may have been a result of the video
successfully teaching the content across all treatments. In hindsight, a pretest/posttest
methodology would likely have been a better indicator for differences in learning before
and after each subject viewed the video. However even with that alteration in
methodology, the validity of the test would likely still be called to question, so a better
118
quantitative data collection tool will be needed for future research. Recommendations
for this are summarized at the end of this chapter.
Having been forewarned by colleagues of the dangers in taking the path of
developing one’s own test instrument, the decision was made to also incorporate more
qualitative input for the study to offset any snags which may have resulted from a
proprietary instrument. So while the reliability tests of the learning outcomes portion
were poor, there is still much to be gained from the study as a whole.
Research Question One
What differences, if any, exist between self-perceptions of learning with video training materials formatted for handheld devices compared to large screen delivery mediums?
The hypothesis created to test this research question was: there is no difference in
self-perceptions of learning between the four treatment groups. No significant
differences were found. The sample indicated that their impressions of the ability to
learn from any of the treatments of the video were overwhelmingly positive.
Four Likert-type questions were asked which had users rank their perceptions of
quality and their ability to learn from their respective video treatment. The totals were
summed and analyzed across differing treatment groups to test the hypotheses generated
for this question. Possible score ranges would have been between four (for someone who
strongly disagreed with all four statements) and 20 (for those who strongly agreed with
all four statements). Results suggest that the sample felt that they understood the content
and could learn from the video, regardless of their treatment. No one in the entire sample
scored less than 12 total points, indicating that the lowest self-perceptions of the ability
119
to learn from a video treatment generally held no opinion on the topic. One person from
the entire sample scored a 12, and another scored 13. Nearly 75% of the sample scored
18 points or higher, indicating that they had a positive self-perception of their ability to
learn from the presented video content.
One of the four statements was: I know more about wine tasting than I did prior
to watching this. Nearly 95% of the sample either agreed or strongly agreed with this
statement. It appears that neither the delivery medium nor the manipulation of formal
features had any influence on viewer perceptions of whether or not they learned from the
video. Overall, viewers felt as though they had acquired new knowledge on the subject
matter, regardless of the treatment to which they were exposed.
Another statement within the self-perceptions category was: the visual elements
in this video were easy to see. Over 95% of the sample either agreed or strongly agreed
with this statement. Screen size and formal features did not contribute to viewers’ ability
to easily perceive the video images presented to them. No one in the sample strongly
disagreed with this statement.
Participants were asked the degree to which they agreed or disagreed with the
statement: I found the graphics in this video easy to read. Again, nearly 95% of the
sample either agreed or strongly agreed with the statement. This statement was
specifically pointed toward the differences in graphic design between the treatments. As
no observed differences were found from the statistical analysis, it can be assumed that
the two design treatments for this study were equally effective. This supports the idea
that creating differing design treatments for handheld and large screen viewing is
120
probably unnecessary unless there are obvious problems with legibility when down-
converting a video for viewing on a handheld device.
The final ranked statement used to measure self-perceptions of learning was: I
found the contents of this video easy to understand. Of the 132 total participants, 128
(97%) either agreed or strongly agreed with this statement. The remainder of the sample
chose neither agree nor disagree as their response to this. No one in the sample chose
disagree or strongly disagree as a response to this statement. Clearly, regardless of the
screen size or manipulation of formal features, the sample participants felt that they were
able to visually and aurally take-in and understand the content being communicated to
them.
An additional open-ended question was asked on the instrument to gain insight
into the findings from this research question. The question asked, do you think that you
can effectively learn from viewing educational videos on handheld devices? Why or why
not? Regardless of the delivery medium, respondents overwhelmingly indicated that
they felt they could effectively learn from educational videos presented on handheld
devices. Nearly 86% (113) responded yes to the question and offered a variety of
reasons for their opinion. Participants felt that easy access to content was a substantial
plus for using handhelds as learning tools. The ease and convenience of keeping these
devices on one’s person was mentioned multiple times as a benefit to storing educational
videos on them. The potential for having this content readily available appeared to fit
well into students’ ‘on-the-go’ lifestyles. Many indicated that they look for ways to
entertain themselves and pass time when undertaking such tasks as riding or a bus,
121
waiting in a doctor’s office, or simply walking across campus between classes. Some
reported already using similar devices to listen to music in similar circumstances, and
expressed interest in viewing video content in place of audio files if given the option.
Several participants felt that the size of the device might actually increase viewer
focus, since all of the content is presented within a small display area. However, the
topic of focus appeared more frequently as a concern among those who did not feel that
handheld devices were effective presentation tools for educational videos. Around 13%
(17 total participants) of the sample felt that educational videos on handheld devices
could not provide effective instruction. Seven respondents from this group felt that it
was too easy to be distracted. Small screens take up a very small portion of our total
vision. Over time, home theater screens as well as movie screens have grown to provide
viewers with more ‘immersive’ experiences. Certainly, viewing content on small
handheld devices is a step in the opposite direction from this trend. Perhaps exposure to
these larger, more immersive experiences has negative impacts for those asked to focus
on small handheld devices when viewing video content. It is impossible to tell causal
implications from the data collected herein, as the issue of viewer focus was not an
initial consideration for this study. However, it certainly raises an interesting topic for
further research.
Ultimately there were no differences in self-perceptions of learning between the
treatment groups. At least in this instance, viewers felt that they were able to
comprehend and learn from the content being presented to them. Learners were just as
comfortable watching and learning from educational video content that was simply
122
down-converted from the original ‘produced for large screen’ version as they were with
any of the other treatments. This lends credence to the idea that reproducing portions of
content for handheld distribution may not be necessary to still produce effective
educational videos.
Research Question Two
Is there a difference in learning outcomes based on shot composition and graphic design formatting for educational videos being viewed on 3.5 inch screens (or smaller) compared to 24 inch monitors?
Three null hypotheses were generated to test this research question
1) H0 = There is no difference in learning outcomes between the four treatment groups.
2) H0 = There is no difference in learning outcomes between users
viewing content on iPods and those viewing content on 24 inch monitors.
3) H0 = There is no difference in ranked video quality between the
four treatment groups.
The first two hypotheses for this research question were aimed at directly testing
the question between all four groups, as well as breaking the sample into two groups
(those viewing with iPods, and those viewing with 24 inch monitors). The third
hypothesis was intended to be supplemental, as it was meant to determine if the overall
quality of the video could have accounted for any influence between the two-group and
four-group testing scenarios. Since this research question and its corresponding
hypotheses were based on scores obtained from the learning outcomes measure on the
instrument, the findings here are questionable. An ANOVA was used to test the first
hypothesis, and a χ 2 Test of Independence was used to test the second. The findings
123
between the two tests are consistent with those found in the first research question: there
were no significant differences in learning outcomes between the two groups. The
average score across all four groups was nine correct out of a total ten questions. When
the groups were combined to look specifically at those who viewed either video format
on an iPod compared to those who viewed either video format on a 24 inch monitor, the
average score still came out to be nine out of ten correct.
When analyzed with a Kruskall-Wallace test, the four treatment groups showed
no significant differences in ranked quality of the educational video. Viewers had the
option to rank the video as poor, below average, average, above average, or excellent.
One third of the sample ranked the video as excellent. Nearly half of the sample ranked
the video as above average, and the remainder of the sample ranked the video as
average. No one in the sample ranked the video as poor or below average. Therefore,
negative perceptions of video quality do not appear to have been a factor of influence.
This ended up having little meaning for research question number two due to the
problems encountered with reliable learning outcomes. This does have important overall
implications for the study because it demonstrated that, in terms of viewer ranking, it is
possible to produce videos for handheld devices which are considered at least acceptable
without the need for manipulation of shot composition and graphic design.
Research Question Three
Is there a relationship between user learning preferences for viewers watching educational video content on handheld devices or televisions and frequency of watching educational videos on handheld devices?
124
The underlying purpose of this question was to examine whether or not prior
exposure and/or usage of the medium had any relationship with learning preferences.
The null hypothesis created to examine this research question was: there is no
relationship between the preferred learning methods of users and the frequency in which
they report viewing handheld video content.
A χ 2 Test of Independence revealed no relationships between frequency of
viewing and learning preferences. Over half of the entire sample (68) reported never
viewing handheld video content Just over 31% (42) reported viewing videos on
handheld devices up to several times per month. Around eight percent (11) reported
viewing several times per week. The remainder of the sample (11) reported viewing
videos on handheld devices daily. Around 80% (110) of the sample indicated that they
either never or rarely watched handheld videos. With such a small number of people
reporting regular exposure to the media, it is possible that there just wasn’t enough
saturation of usage within the sample to obtain a clear picture of whether or not
repetitive viewing can alter media preferences.
Upon choosing a preferred method of learning, participants were prompted to
explain their preference. Over half of the sample (72) chose face to face instruction as
their preferred method of learning. There were two primary reasons for this which
appeared numerous times in these responses. The first was the opportunity for instant
feedback and correction. Participants preferred having a live instructor present concepts
to them over other learning methods. In general, most felt that there was less opportunity
125
to interpret knowledge incorrectly if an expert was present to take questions and correct
any misinterpreted ideas on the spot.
The second common reason offered for this preference was that participants felt
that a live presenter was able to hold their attention better than any of the other forms of
media listed. While attentional inertia has been explored in other studies by varying
formal features such as editing, transition styles, and pace, this was not a focal point
examined within this study (Calvert et al., 1982; Schmitt, Anderson, & Collins, 1999;
Silbergleid, 1982; Singer, 1980). However, the need to use these formal features to
maintain attention was taken into consideration during the production of the educational
video used in this study. In fact, concerns about keeping audience attention were the
impetus for choosing the subject matter of the educational video. As discussed in
Chapter Three, the strategy was to use best practices to produce a dynamic video which
would hopefully maximize viewer attention. So given that there were no measures for
attention built into the study, even though participants gave the video high scores on
quality across all treatments, it is impossible to know if comments received concerning
difficulty maintaining attention were related to inappropriate usage of attention holding
formal features, individual disinterest in the subject matter, or ingrained cognitive
processes developed from a lifetime of exposure to video as a medium. Regardless of the
cause, the sample clearly felt that face-to-face instruction was better able to capture and
maintain learner focus than educational video products.
Video was the second most preferred method of learning among the sample.
However the gap between video and face-to-face instruction as a preference was wide.
126
Barely 20% of the sample (26) chose video, with over 50% choosing face-to-face. This
might also help to explain why only a small number of the sample reported frequently
using handheld video. With the vast majority of them not preferring it as a learning
method, it is possible that this may be the reason that they have not sought out the new
technology to take advantage of it. Of course, it could also be that with a technology so
new, there simply may not be enough offerings on the market yet for potential viewers
to take advantage of. The video category was not subdivided to separate standard video
from other forms such as handheld video or video used in the context of other
multimedia tools. However, given that such a low portion of the sample reported ever
using video on handheld devices, it is likely that alternate forms of video viewing would
have scored far lower on the scale if they had been subdivided.
Those who did chose video as their preferred method of learning often cited their
penchant toward ‘visual learning.’ They liked the instant accessibility of content as well
as the ability to skip around within a program to repeat important information. Others
were partial to video because of its ability to focus in on content and drill down learning
objectives with precision.
The remainder of options for learning preferences (book/journals, audio, online,
and other) combined to form a total of less than 20% of sample preferences. Nearly
equal numbers of the sample chose Books/journals and online learning as their preferred
method. Both groups seemed to value self-pacing and instant accessibility as advantages
for either method. No one among the sample chose audio as a preferred method of
learning.
127
Ultimately, these results suggest that the frequency of use of handheld video does
not sway user preferences in terms of methods of learning. However, since the portion of
the sample reporting frequent usage was very low, this question may need to be explored
again if usage increases in coming years with the intensity that Blum (2006) and the
Telecommunications Industry Association (2007) predict.
Research Question Four
What are the relationships, if any, between the user frequency of viewing videos on handheld devices and learning outcomes?
The following hypothesis was created to test this question: there is no
relationship between reported frequency of viewing video on handheld devices and
learning outcomes. No significant relationships were revealed in the Pearson Correlation
conducted to analyze the data.
There were several problems with this overall analysis. As mentioned with
reference to research question number three, the number of those reportedly viewing
videos on handheld devices on a frequent basis was small relative to those who either
rarely or never used the medium. Beyond that, this analysis utilized learning outcomes
as the basis for comparison among the treatment groups. So the failure of the reliability
test for that portion of the instrument also calls to question the results for this research
question.
128
Conclusions
Implications
While the findings herein were not without limitations, they still offer guidance
down the continued path of examination on the impact of formal features within video
production. As production budgets continue to be stretched in an ever darkening
economic setting, the ability to utilize video products across multiple delivery
applications will continue to be a burden for producers to bear. Having to alter shooting
and post production methodologies to placate the supposed needs for distributing video
via handheld devices can certainly impose time and budget constraints on a project.
The findings herein suggest that alterations in these formal features may not be
necessary. There were no significant differences in participant self-perceptions of
learning from any of the treatments. Users responded positively that they were able to
learn from the videos regardless of whether or not shot composition and graphic design
had been altered to ‘maximize’ their effectiveness for small screen playback. Further,
quality rankings from all of the participants were high. No one in the sample ranked any
of the treatments below an ‘average’ rating. The overwhelming majority felt that the
video, regardless of treatment, was either above average or excellent in terms of quality.
So, at least in this instance, perceptual quality was not affected by any need to
manipulate formal features to match a given treatment. It stands to reason that if this can
be done once, then it can be done again.
The information collected from open-ended questions within the instrument also
offers valuable insight into the factors which motivate viewers to embrace one form of
129
learning media over another. Despite the myriad technological methods for presenting
educational materials, learners in this sample still overwhelmingly prefer the
instantaneous interaction available with face-to-face instruction. The ability to ask
questions and receive feedback still makes instructor-led educational settings the
preferred method. Unless new technologies are developed which allow video
programming the ability to provide instantaneous feedback, other forms of instruction
will likely continue to act as supplements to the educational process. The closest leap
toward that type of interactive ability would be distance learning courses with live
lecturers streaming classroom presentations via handheld devices. It is possible to
envision such usage sometime in the not-so-distant future, however currently there is
little buzz within the industry concerning any such efforts.
Despite the technological lag which might prompt more users to embrace
handheld video as a primary source for education, participants did indicate a number of
reasons for which they would embrace the technology in its current form. Mobility and
travel seemed to be the most common themes for embracing the medium. Users could
easily envision using the technology when in transit or for passing time when away from
computers or televisions. As such, producers should continue to keep these user trends in
mind as they develop education and training content. Programs should continue to be
disseminated mostly in short-format. Of course, technical limitations will continue to
drive this trend also. Playing video on these devices is a processor-intensive function
and places substantial strain on batteries. However, even if battery life increases enough
130
to offer long-format programming, producers should rely more heavily on viewing
trends to make such decisions.
Recommendations for Future Research
The failure of the validity of the learning outcomes portion of the test instrument
was perhaps the most difficult among the problems encountered for this study. Looking
at past research, there appeared to be no standardized tool capable of measuring the
impact of formal features on such measures as learning outcomes. While setting to the
task of creating an instrument, the researcher tried to come up with a subject topic that
would, hopefully, maximize viewer interest. Thus a video which offered training and
instruction on the nuances of wine tasting was developed to supplement the test
instrument. However, after the datum was collected and the numbers were being
crunched, it occurred to the researcher that a different approach might yield better results
for inquiries such as this. There are programs that exist which offer training on strategies
used to raise scores on standardized tests such as the Graduate Record Exams (GREs),
Scholastic Achievement Tests (SATs), and so forth. If a short video could be created to
instruct subjects on strategies for improving scores on the mathematic portions of the
GRE, one should be able to manipulate formal features within the video to measure if
they have any effect on learning outcomes. By teaching strategies for overcoming
sections of standardized tests, one should be able to bypass the difficulties involved in
creating a valid test instrument capable of measuring learning outcomes. This approach
might also allow one to explore an even wider range of formal features, as it should free
the researcher from the task of trying to validate a proprietary instrument. Similar ideas
131
occurred to this researcher during the literature review process of this endeavor, however
during that phase the idea being explored was to take a subject, such as math, and
attempt to create a small modular instructional video which would literally teach a
mathematic concept: for instance, geometry. The problem became twofold: first, how
does one create a short instructional video which accurately covers such a broad,
complex topic? Second, and of more concern to the researcher was; how does one keep
that interesting so that the problem of attentional inertia does not creep in as a factor
which corrupts the data? However, if one took an approach of strategies for passing
these subjects, rather than trying to teach the subject from beginning to end, it could be
possible to keep the appropriate pacing for the medium. Beyond that, editing and pace
could also become one of the variables manipulated, possibly adding to the overall value
of the study. A tool of this nature would also require a dynamic on-camera talent to keep
viewers engaged. Looking at the problems encountered herein, it seems like this could
result in a viable product to provide deeper insight into the research questions posed for
this study. Showing viewers shortcuts which improve their success on an instrument of
this sort has more potential for engaging general populations than the rather dry nature
of direct instruction of high mathematical concepts. If a pretest and posttest were
employed, one should be able to measure differences between to two and determine if
differing video treatments or differences in the media demonstrate significant
differences in achievement.
One interesting finding in this study was the difference in opinion as to whether
or not small handheld devices offered more or less focus than viewing on large monitors.
132
Some participants suggested that they were easily distracted by things happening around
them as they viewed the video content on handheld devices. Others stated the exact
opposite, suggesting that having to focus their attention on such a small area actually
increased their focus. Is it possible to predict this? Could there be relationships between
types of learners and the degree of attention that one can maintain for handheld playback
devices? Such research may provide valuable insight for educators needing to produce
educational video content for audiences with pre-identified behavioral traits or learning
disabilities.
For this study, students were shown the video in classroom settings of 20 to 30
students at a time. Each student was provided headphones to view their respective
treatment. However, in real-world settings participants have indicated that they would be
more likely to view handheld educational videos in a variety of settings. It would be
interesting to determine the level of distractions which could lead to the success or
failure of knowledge transfer. Certainly if headphones were not provided the
participants’ experiences (and likely ratings and outcomes alike) when viewing the video
would have been markedly different. With 20 to 30 videos playing in a room all at the
same time, comments on the ability to focus would likely have been very different.
Future research investigating potential thresholds for acceptable interference levels when
viewing video on handhelds could provide educators with a better understanding of
proper uses and applications of the technology.
Another area which will be of concern to developers is whether or not repeated
exposure to viewing handheld video could increase its acceptance as a preferable
133
learning method. Measures for this were calculated within the sample. However, such a
small number of participants reported having exposure to viewing handheld video, that
there was likely not enough saturation to gain a clear understanding of any potential
impact. Certainly, the infrastructure is being built to make viewing videos on handheld
devices an everyday occurrence (Blum, 2006; Orgad, 2006). As usage of the medium
becomes more widespread, it will be interesting to see if trends differ, or if face-to-face
instruction will remain a preference for learners. Similarly, another worthwhile question
for future investigations would be whether or not repeated use of educational handheld
video has any impact on learning outcome performance.
This study in no way accounted for potential gains or losses in long-term
memory. Certainly, one advantage to the short-format types of educational videos being
studied herein is the ability to view it repeated times to refresh forgotten information.
However, one question that arises is whether or not presenting information in such short
‘bursts’ of content might have any impact on long term knowledge retention. Future
research should look to develop a repeated measures study to see if the knowledge
presented has any staying power with participants.
Summary
The purpose of this study was primarily to examine what appeared to be
anecdotal statements concerning the proper development of educational videos prepared
for distribution via handheld devices. By developing some formalized scientific inquiry,
it was hoped that the study would shed some light on whether or not these statements
held any truth, or if they were simply assumptions being stated as fact. Though further
134
research is needed for clarification, it appears that these recommendations may not be
necessary. If anything, these measures might only be detrimental to educational video
productions by placing unnecessary burdens budgets and resources. Ultimately, a
definitive answer to this topic will require more sound measures of learning outcomes,
however this study takes a step in the right direction.
Perhaps the more significant aspect of this study is the transition from looking at
formal features in the context of traditional video to examining it as a mobile, handheld
learning tool. Those filling leadership roles in educational video production
environments will certainly find value in continued studies of this nature. As digital
video will continue to offer new and expanded features, researchers must continue to
study how or if new delivery mediums will change the ways in which videos must be
produced in order to effectively communicate and transfer knowledge. The findings
herein will hopefully lay a brick in the path toward a complete understanding of best
practices for producing video content in this new, digital age of video. Katz (2007)
stated that, “Almost every household in American has a television set” (p. 49). The time
is fast approaching when every hand in America will have a television set. Only
continued research can prepare leaders and practitioners of educational video production
on how to ready themselves for the cultural changes which will result from this new,
evolving technology.

135
APPENDIX A: PILOT STUDY IRB APPROVAL
136

137
APPENDIX B: DISSERTATION IRB APPROVAL
138

139
APPENDIX C: PERMISSION FOR USE OF COPYRIGHTED MATERIAL
140

141
APPENDIX D: TEST INSTRUMENT
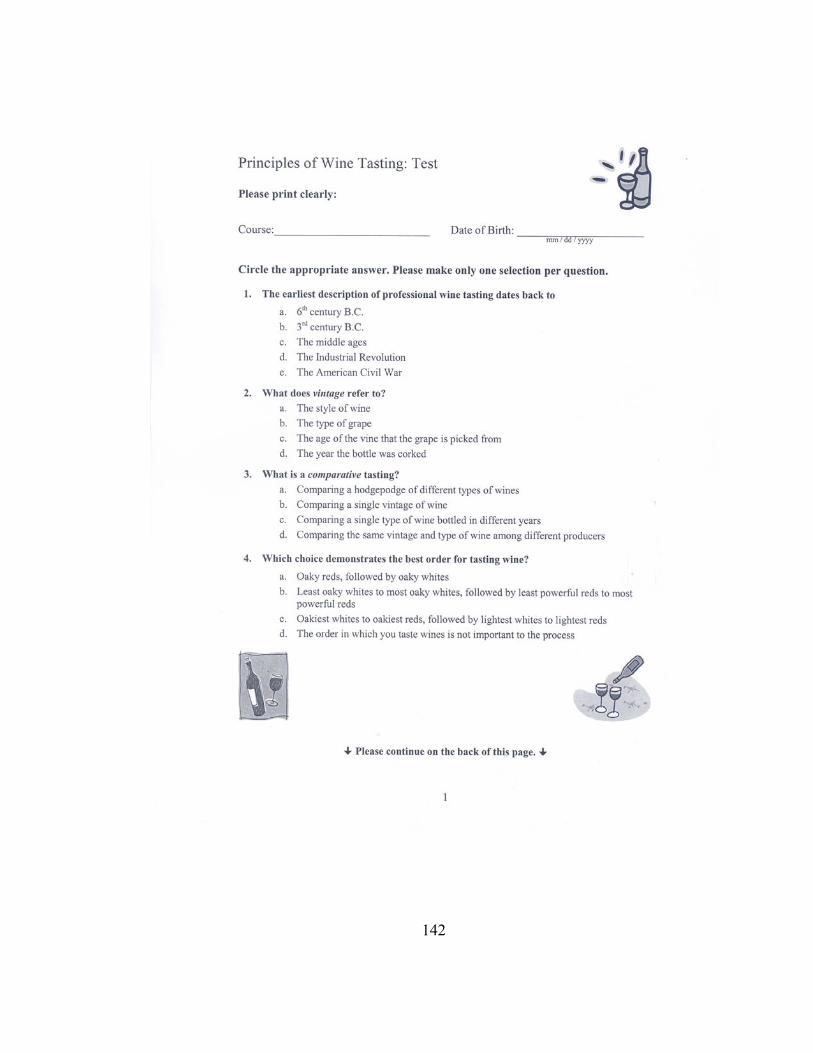
142
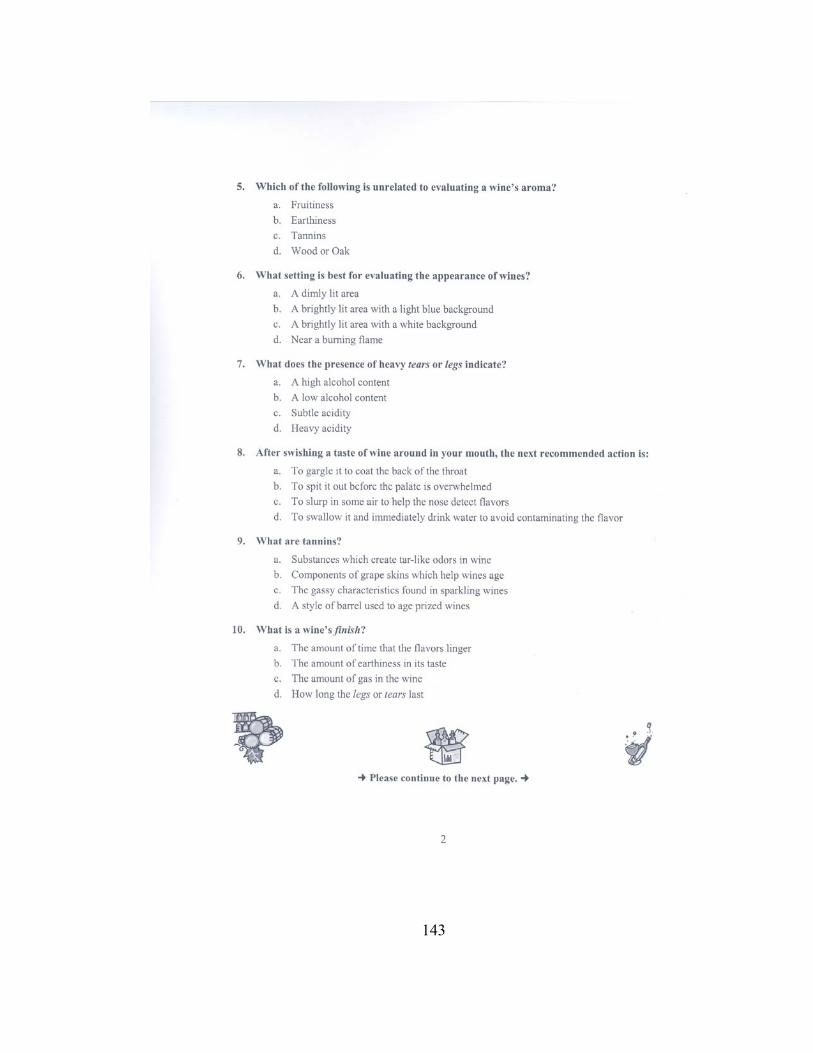
143

144

145

146
APPENDIX E: VIDEO SCRIPT
147
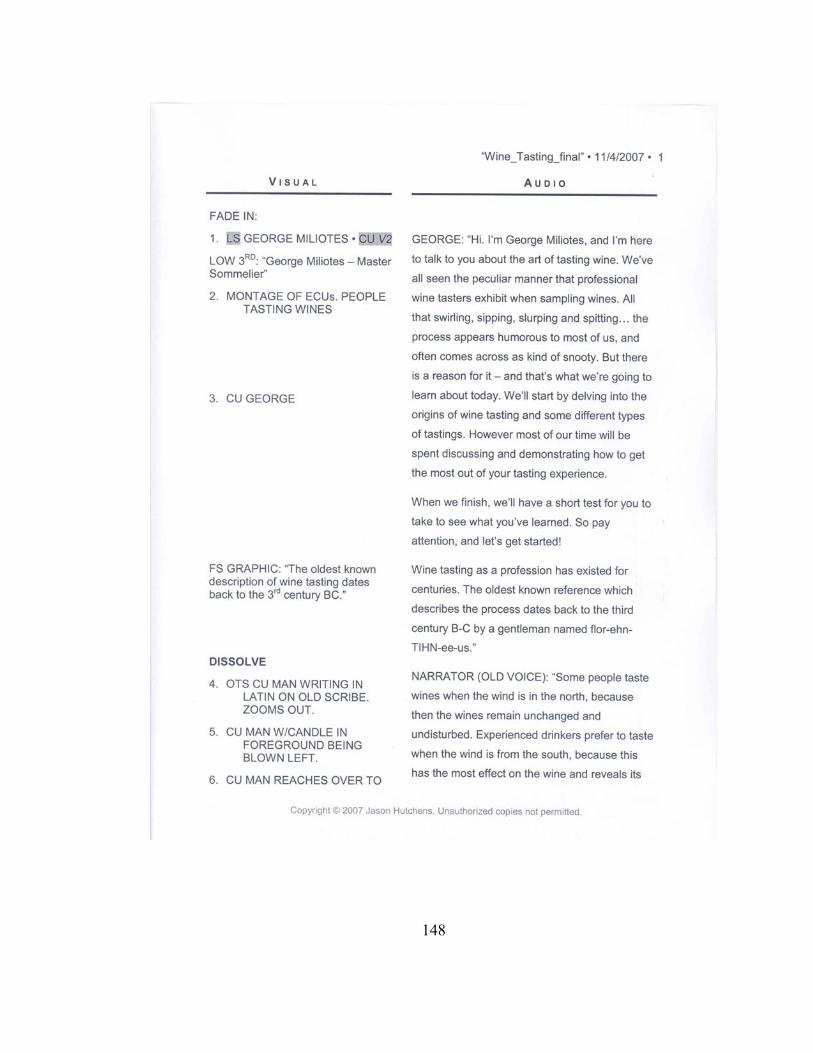
148
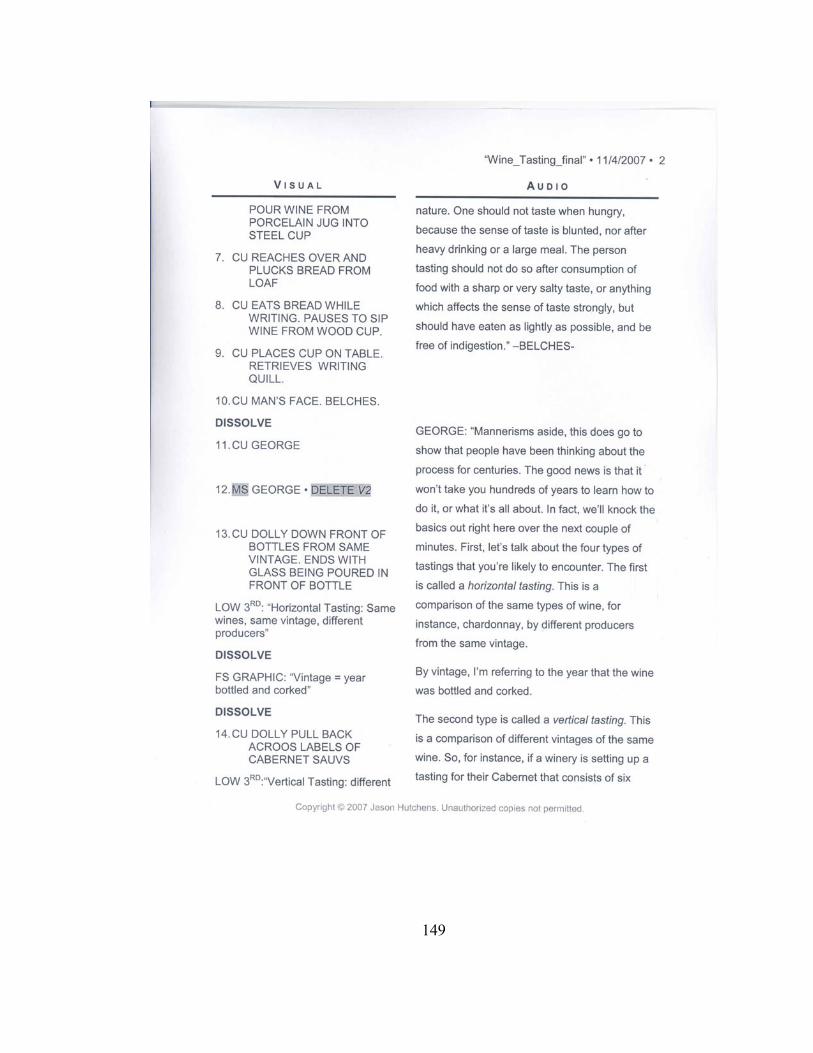
149
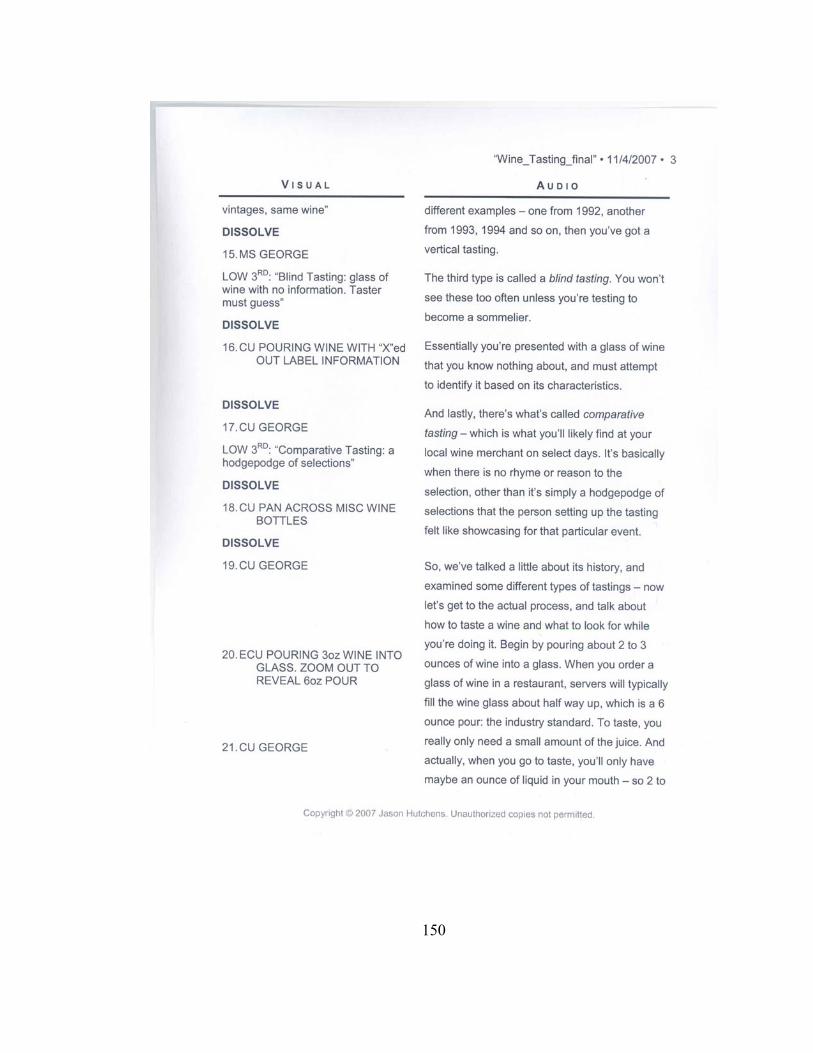
150
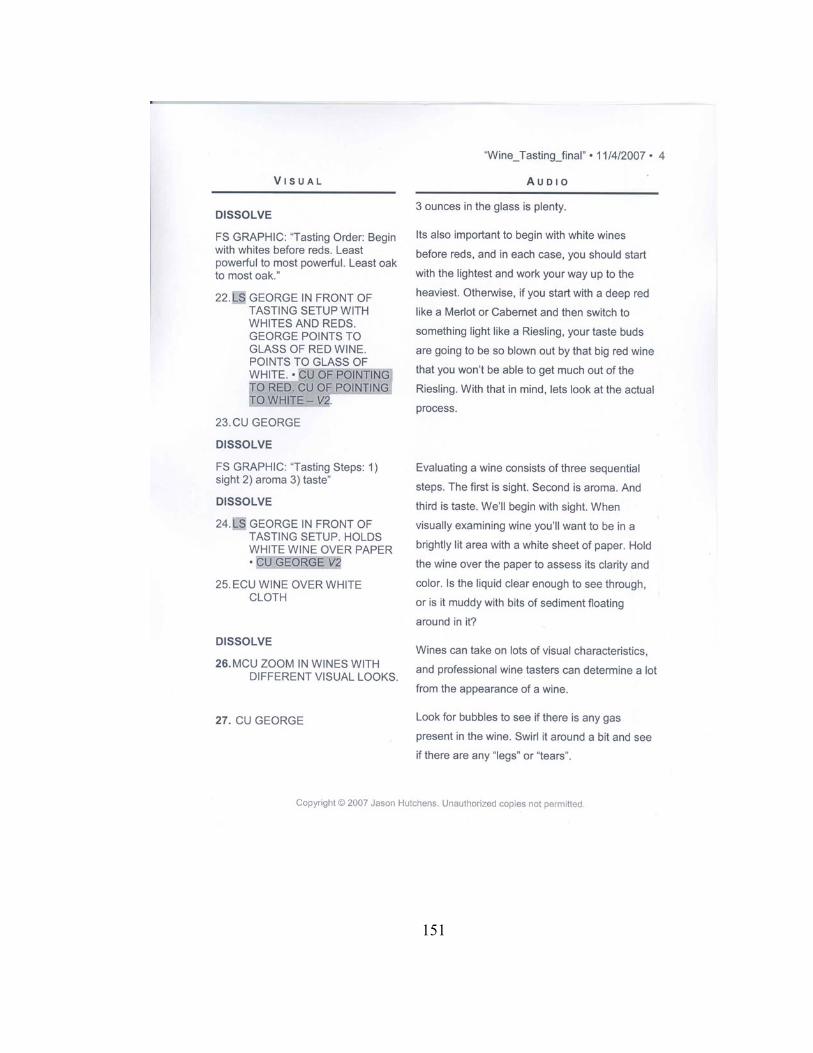
151
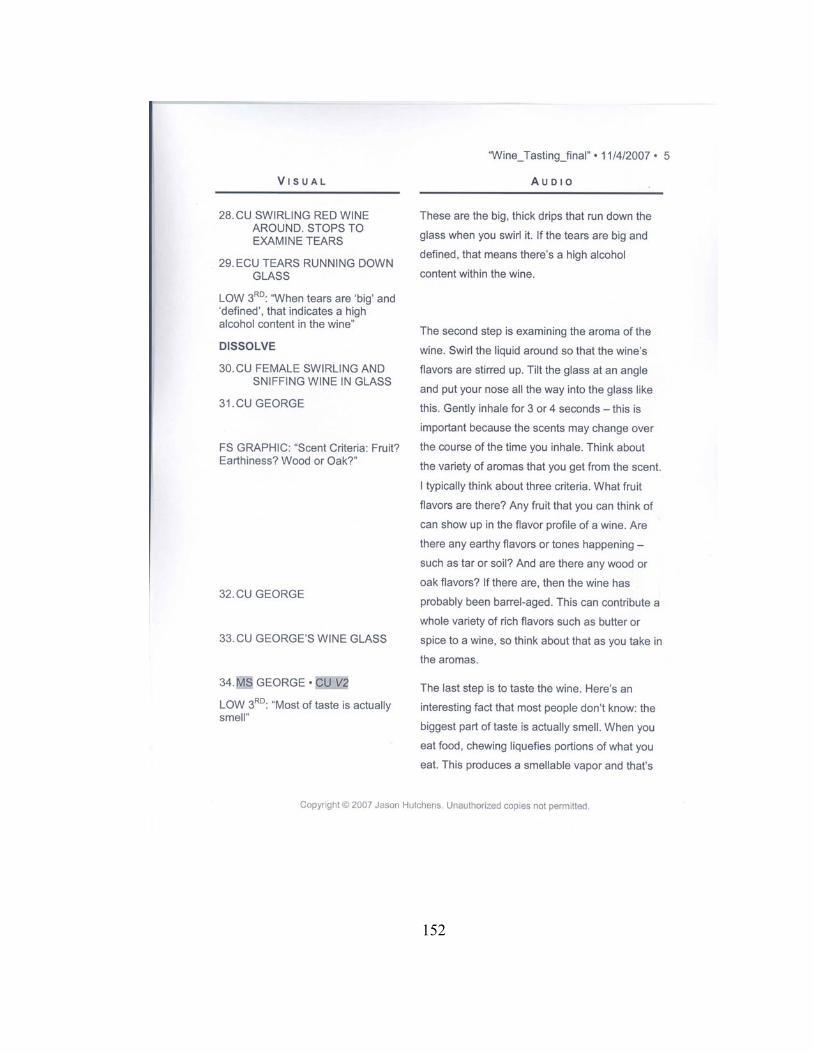
152
153
154

155
156
LIST OF REFERENCES
Aiello, A. (2000). Video Composition. Videomaker 14(12), 16-20. Al-Mualla, M. E., Canagarajah, C.N., & Bull, D.R. (2002). Video coding for mobile
communications: Efficiency, complexity, and resilience. San Diego, CA: Academic Press.
Anderson, D. R., & Burns, J. (1991). Paying attention to television. In Bryant, J., &
Zillman, D. (Eds.) Responding to the screen: Reception and reaction processes (pp. 3 – 25). Hillsdale, NJ: Lawrence Erlbaum Associates.
Anderson, D. R., Lorch, E. P., & Field, D. E. (1981). The effects of TV program
comprehensibility on preschool children’s visual attention to television. Child Development, 52(1), 151 – 157.
Anderson, D. R., Lorch, E. P., Field, D. E., Collins, P. A., & Nathan, J. G., (1986).
Television viewing at home: Age, trends in visual attention, and time with TV. Child Development, 57(4), 1024 – 1033.
Apple. (2007). iPhone. Retrieved February 3, 2007, from http://www.apple.com/iphone/ Arditi, A., & Cho, J. (2005). Serifs and font legibility. Vision Research, 45(23), 2926 –
2933. Arditi, A., & Cho, J. (2007). Letter case and text legibility in normal and low vision.
Vision Research, 47(19), 2499 – 2505. Austerberry, D. (2002). The technology of video and audio streaming. Woburn, MA:
Focal Press. Ayers, R., & Jansen, W. (2004). PDA forensic tools: An overview and analysis.
Gaithersburg, MD: U.S. Department of Commerce. Retrieved January 14, 2008 from http://csrc.nist.gov/publications/nistir/nistir-7100-PDAForensics.pdf
Beldie, I. P., Pastoor, S., & Schwarz, E. (1983). Fixed versus variable letter width for
televised text. Human Factors, 25(3), 273 – 277. Benierbah, S., & Khamadja, M. (2005). A new technique for quality scalable video
coding with H.264. IEEE Transactions on Circuits and Systems for Video Technology, 15(11), 1332 – 1340.
157
Bernard, M., & Mills, M. (2000). So, what size and type of font should I use on my
website? Usability News, 2(2). Retrieved March 16, 2008 from http://psychology.wichita.edu/surl/usabilitynews/2S/font.htm
Berryman, G. (1990). Notes on graphic design and visual communication. Menlo Park,
CA: Crisp Publications. Blum, C. (2006, December). Wireless trends: Technology & applications. Presentation
at the IT Trends Forecast 2007 conference, Chicago, IL. Retrieved January 20, 2007, from http://www.tiaonline.org/business/research/documents/Wireless_Trends_Technology_Applications.pdf.
Bolman, L. G, & Deal, T. E. (2003). Reframing organizations: Artistry, choice, and
leadership. San Francisco, CA: Jossey-Bass. Bringhurst, R. (1996). The elements of typographic style (2nd ed.). Point Roberts, WA:
Hartley & Marks. Bruning, R. H., Schraw, G. J., & Ronning, R. R. (1999). Cognitive psychology and
instruction (3rd ed.). Columbus, OH: Prentice-Hall Inc. Burrows, T. D., Wood, D. N., & Gross, L. S. (1992). Television production: Disciplines
and techniques (5th ed.). Dubuque, IA: Wm. C. Brown Publishers. Calvert, S. L., Huston, A. C., Watkins, B. A., & Wright, J. C. (1982). The relation
between selective attention to television forms and children’s comprehension of content. Child Development, 53(3), 601 – 610.
Carretta, J. (2008). Tire management simplified. Fleet Owner, 103(1), 60. Chandler, S. B. (2001). Comparing the legibility and comprehension of type size, font
selection, and rendering technology of onscreen type. (Doctoral dissertation, Virginia Polytechnic Institute and State University, 2001). Dissertation Abstracts International, 66 (12), 118A. (UMI No. 3203682)
Chen, M., Jackson, W. A., Parsons, C., Sindt, K. M., Summerville, J. B., Tharp, D. D., et
al. (1996). The effects of font size in a hypertext computer based instruction environment. Proceedings of Selected Research and Development Presentations at the 1996 national Convention of the Association for Educational Communications and Technology (pp. 137 – 144). Indianapolis, IN. (ERIC Document Reproduction Service No. ED397784)
158
Chen, S. Y., Ghinea, G., & Macredie, R. D. (2006). A cognitive approach to user perception of multimedia quality: An empirical investigation. International Journal of Human-Computer Studies, 64(12), 1200 – 1213.
Clark, K. A., (1998). Intersection of instructional television and computer-assisted
instruction: Implications for research paradigms. In Asamen, J. K., & Berry, G. L. (Eds.) Research paradigms, television, and social behavior (pp. 287 – 303). Thousand Oaks, CA: Sage Publications.
Colevins, H., Bond, D., & Clark, K. (2006). Nurse refresher students get a hand from
handhelds. Computers in Libraries, 26(4), 6 – 8, 46 – 48. Collins, W. A., Wellman, H. M., & Keniston, A. H., (1978). Age-related aspects of
comprehension and inference from a televised dramatic narrative. Child Development, 49(2), 389 – 399.
Cook, L. K., & Mayer, R. E. (1988). Teaching readers about the structure of scientific
text. Journal of Educational Psychology, 80(4), 448 – 456. Cooke, L. (2005). A visual convergence of print, television, and internet: Charting 40
years of design change in news presentation. New Media & Society, 7(1), 22 – 46.
Court of Master Sommeliers. (2007). Court of master sommeliers frequently asked
questions. Retrieved November 11, 2007, from http://www.mastersommeliers.org/faq
Dellarosa, D. (1998). A history of thinking. In Steinberg, R. J., & Smith, E. F. (Eds.),
The Psychology of Human Thought (pp. 1 – 18). New York: Cambridge University Press.
DeLoach, J. S. (2004). Becoming symbol-minded. Trends in Cognitive Sciences, 8(2),
66 – 70. DeLollis, B. (2007, December 5). Cellphone could be boarding pass too. USA Today, pp.
01b. Feldmann, V. (2005). Leveraging mobile media: Cross-media strategy and innovation
policy for mobile media communication. New York: Physica-Verlag. Felici, J. (1996). A bitmap a day keeps the eye doctor away. Retrieved March 15, 2008
from http://www.will-harris.com/typofeli.htm
159
Feuilherade, P. (2006). Mobile tv scores in Asia. BBC News. Retrieved January 19, 2007, from http://news.bbc.co.uk/go/pr/fr/-/2/hi/technology/5105400.stm
Garrod, S., Fay, N., Lee, J., Oberlander, J., & MacLeod, T. (2007). Foundations of
representation: Where might graphical symbol systems come from? Cognitive Sciences, 31(6), 961 – 978.
Geske, J. (2000). Readability of body text in computer mediated communications:
Effects of type family, size and face. Retrieved October 17, 2000, from http://www.public.iastate.edu/~geske/scholarship.html
Glen, P. (2003). Leading geeks. San Francisco, CA: Jossey-Bass. Goodman, M. D., & Cundick, B. P. (1976). Learning rates with black and colored
letters. Journal of Learning Disabilities, 9(9), 600 – 602. Goudy, F. W. (1946). A half-century of type design and typography, 1895 – 1947. New
York: Typophiles. Grotticelli, M. (2006a). Mobile video processing (and distribution) made easy. Studio
Monthly, 28(11), 36 – 39. Grotticelli, M. (2006b). Squeeze frame: Rethinking video production for the cell phone.
Studio Monthly, 28(11), 33 – 35. Gulliver, S. R., Serif, T., & Ghinea, G. (2004). Pervasive and standalone computing: The
perceptual effects of variable multimedia quality. International Journal of Human-Computer Studies, 60(5/6), 640 – 665.
Hawkins, R. P., Pingree, S., Hitchon, J. B., Gilligan, E., Kahlor, L., Gorham, B. W., et
al. (2002). What holds attention to television?: Strategic inertia of looks at content boundaries. Communications Research, 29(1), 3 – 30.
Hickman, H. R. (1991). Television directing. New York: McGraw-Hill Inc. Hodges, P. (1996). An introduction to video measurement. Boston: Focal Press. Hofstetter, F. T. (1997). Cognitive versus behavioral psychology. Retrieved February 2,
2008 from http://www.udel.edu/fth/pbs/webmodel.htm Hurrell, R. (1973). The Van Nostrand Reinhold manual of television graphics. New
York: Van Nostrand Reinhold Company.
160
Huston, A. C., Wright, J. C., Wartella, E., Rice, M. L., Watkins, B. A., Campbell, T., et al. (1983). Communicating more than content: Formal features of children’s television programs. In Wright, J., & Huston, A. (Eds.), Children and television (3rd ed.). Lexington, MA: Ginn Custom Publishing.
Hutchens, J. S. (2007a). [Comparison among LS, MS, and CU shot compositions].
Unpublished graphic. Hutchens, J. S. (2007b). [The rule of thirds]. Unpublished graphic. Hutchens, J. S. (2007c). [Title graphic compared with a lower third graphic].
Unpublished graphic. Hutchens, J. S. (2007d). [The NTSC DV television image]. Unpublished graphic. Hutchens, J. S. (2007e). [A close up look at an NTSC image]. Unpublished graphic. Hutchens, J. S. (2007f). [Serif vs. sans serif font styles]. Unpublished graphic. International Telecommunication Union. (1994). ITU-R .BT601-4. Section 11B: Digital
Video. Retrieved February 8, 2007 from University of California, Berkeley, Electrical Engineering and Computer Sciences Instructional and Electronics Support Web site: http://inst.eecs.berkeley.edu/~cs150/Documents/ITU601.PDF.
Isaacs, G. (1987). Text screen design for computer-assisted learning. British Journal of
Educational Technology, 81(1), 41 – 51. Jackman, J. (2002). Lighting for digital video and television. Lawrence, KS: CMP Books Katz, H. (2007). The media handbook: A complete guide to advertising media selection,
planning, research, and buying (3rd ed.). Mahwah, NJ: Lawrence Erlbaum Associates.
Kenny, R. F. (2002). The effects of cognitive style and gender on verbatim and gist
memory for rapidly-presented montage video. (Doctoral dissertation, University of Florida, 2002). Dissertation Abstracts International, 63 (6). (UMI No. 3056754)
Kimber, K., Pillay, H., & Richards, C. (2007). Technoliteracy and learning: An analysis
of the quality of knowledge in electronic representations of understanding. Computers & Education, 48(1), 59 – 79.
Kimes, S. E. (2003). Revenue management: A retrospective. Cornell Hotel and
Restaurant Administration Quarterly, 44(5/6), 371 – 392.
161
Kimes, S. E., & Thompson, G. M. (2004). Restaurant revenue management at Chevy’s: Determining the best table mix. Decision Sciences, 35(3), 371 – 392.
Koblentz, E. (2005). The evolution of the pda. Retrieved January 20, 2007, from
http://www.snarc.net/pda/pda-treatise.htm. Koffka, K. (1999). Principles of gestalt psychology. London: Routledge. Kozma, R. B. (1986). Implications of instructional psychology for the design of
educational television. Educational Communication and Technology Journal, 34(1), 11 – 19.
Kozma, R. B. (1991). Learning with media. Review of Educational Research, 61(2), 179
– 211. Lang, A., Zhou, S., Schwartz, N., Bolls, P. D., & Potter, R. F. (2000). The effects of
edits on arousal, attention and memory for television messages: When an edit is an edit can an edit be too much? Journal of Broadcasting & Electronic Media 44(1), 94 – 109.
Larson, K. (2007). The technology of text. IEEE Spectrum, 41(5), 26 – 31. Las-Casas, L. F. L. (2006). Cinedesign: Typography and graphic design in motion
pictures – the AMPAS awards. (Doctoral dissertation, New York University, 2006). Dissertation Abstracts International, 67 (5). (UMI No. 3215487).
Lenze, J. S. (1990). Serif vs. san serif type fonts: A comparison based on reader
comprehension. In D. G. Beauchamp (Ed.), Investigating Visual Literacy: Selected Readings from the Annual Conference of the International Visual Literacy Association (pp. 93 – 98). Bloomington/Normal: IL. (ERIC Document Reproduction Services No. ED352051)
Leong, E. (2004). Rule of thirds. In Camera hobby photography e-book (chap. 15).
Retrieved February 2, 2007, from http://www.camerahobby.com/Ebook-RuleThirds_Chapter15.htm
Liebiger, C. A. (2002). Beyond the organizer: A manual of educational uses for the
handheld computer. Vermillion, SD: University of South Dakota. (ERIC Document Reproduction Service No. ED471953)
Lupton, E. (2004). Thinking with type: A critical guide for designers, writers, editors,
and students. New York: Princeton Architectural Press.
162
Manion, C., & DeMicco, F. J. (2004). Handheld wireless point of sales systems in the restaurant industry. Journal of Foodservice Business Research, 7(2), 103 – 111.
Mayer, R. E. (2001). Multimedia learning. New York: Cambridge University Press. Mayer, R. E., Heiser, J., & Lonn, S. (2001). Cognitive constraints on multimedia
learning: When presenting more material results in less understanding. Journal of Educational Psychology, 93(1), 187 – 198.
Mayer, R. E., & Moreno, R. (1998). A split-attention effect in multimedia learning:
Evidence for dual processing systems in working memory. Journal of Educational Psychology, 90(2), 312 – 320.
Mayer, R. E., & Sims, V. K. (1994). For whom is a picture worth a thousand words?
Extensions of a dual-coding theory of multimedia learning. Journal of Educational Psychology, 86(3), 389 – 401.
McCain, T. A., Chilberg, J., & Wakshlag, J. (1977). The effect of camera angle on
source credibility and attraction. Journal of Broadcasting, 21(1), 35 – 46. McCain, T. A., & Repensky, G. R. (1972, December). The effect of camera shot on
interpersonal attraction for comedy performers. Paper presented at the 58th Annual Convention of the Speech Communication Association, Chicago, IL.
McGraw, T. M., Burdette, K., Seale, V. B., & Ross, J. D. (2002). Using imperceptible
digital watermarking technologies to transform educational media: A prototype. Charleston, WV: AEL Inc. (ERIC Document Reproduction Service No. ED477706)
McLaughlin, D. (2001). Information technology user devices in higher education. In
Maughan, G. R. (Ed.) Technology leadership: Communication and information systems in higher education (pp. 29 – 39). San Francisco: Jossey-Bass.
Mercer, J. (1952). Optical effects and film literacy. (Doctoral dissertation, University of
Nebraska, 1952). Dissertation Abstracts International, 66 (10). (UMI No. DP13858)
Metallinos, N. (1996). Television aesthetics: Perceptual, cognitive, and compositional
basics. Mahwah, NJ: Lawrence Erlbaum Associates, Inc. Metzger, W. (2006). Laws of seeing (Spillman, L., Lehar, S., Mimsey, S., & Werheimer,
M., Trans.). Cambridge, MA: The MIT Press. (Original work published 1936)
163
Miller, E. S. (2005). Multimedia learning of fine arts: The effects of animation, static graphics, and video. (Doctoral dissertation, Arizona State University, 2005). Dissertation Abstracts International, 66 (11).
Millerson, G. (1990). The technique of television production (12th ed.). Boston: Focal
Press. Mills, C. B., & Weldon, L. J. (1987). Reading text from computer screens. ACM
Computing Surveys, 19(4), 329 – 358. Morris, J. D. (1984). The Florida study: Improvement in student achievement and
attitudes through variations in instructional television production values. Journal of Educational Technology Systems, 12(4), 357 – 368.
Morse, L. C., & Babcock, D. L. (2007). Managing engineering and technology: An
introduction to management for engineers (4th ed.). Upper Saddle River, NJ: Pearson Prentice Hall.
Nystrom, M., & Holmqvist, K. (2007). Deriving and evaluating eye-tracking controlled
volumes of interest for variable-resolution video compression. Journal of Electronic Imaging, 16(1), 1 – 8.
O’Bryan, K. G., & Silverman, B. (1974). Experimental program eye movement study.
New York: U.S. Department of Health, Education, and Welfare. (ERIC Document Reproduction Service No. ED126870)
Ong, E. P., Yang, X., Lin, W., Lu, Z., Yao, S., Lin, X., et al. (2006). Perceptual quality
and objective quality measurements of compressed videos. Journal of Visual Communications & Image Representation, 17(4), 717 – 737.
Orgad, S. (2006, November). This box was made for walking…: How will mobile
television transform viewers’ experience and change advertising? (Available from Nokia Web site). Retrieved January 5, 2007, from http://www.nokia.com/NOKIA_COM_1/Press/Press_Events/mobile_tv_report,_november_10,_2006/Mobil_TV_Report.pdf
Palmer, E. L. (1998). Major paradigms and issues in television research: Field of
dreams, world of realities. In Asamen, J. K., & Berry, G. L. (Eds.), Research Paradigms, Television, and Social Behavior, 39 - 65. London: Sage Publications.
164
Pancheo, J., Day, B. T., Cribelli, S., Jordan, J. Murry, B., & Persichitte, K. A. (1999). Web-based menus: Font size and line spacing preferences. Proceedings of Selected Research and Development Papers Presented at the National Convention of the Assosication for Educational Communications and Technology (pp. 81 – 85). Houston, TX. (ERIC Document Reproduction Service No. ED436136)
Panettieri, J. C. (2003). May I take your order wirelessly? eWeek, 20(49), 54. Pastoor, S., Schwarz, E., & Beldie, I. P. (1983). The relative suitability of four dot-
matrix sizes for text presentation on color television screens. Human Factors, 25(3), 265 – 272.
Picciano, A. G. (2002). Educational leadership and planning for technology (3rd ed.).
Upper Saddle River, NJ: Merrill Prentice Hall. Plummer, M. (2007). Title design essentials for film and video. Berkeley, CA: Peachpit
Press. Richardson, I. E. G. (2003). H.264 and MPEG-4 video compression: Video coding for
next-generation multimedia. West Sussex, England: Wiley. Rimmell, A. N., Keval, H., Mansfield, N. J., & Hands, D. (2005). Quantification of error
perception for full-face digital video. Electronic Letters, 41(16), 1 – 2 Rivard, N. (2002). Handheld computers made easy. University Business, 5(1), 16. Roe, D. L. (1998). Visual intensity effects on verbal comprehension: The effects of
camera angle and subject movement on retention and attitudes. (Doctoral dissertation, University of Georgia, 1998). Dissertation Abstracts International, 60 (02). (UMI No. 9920086)
Sauer, J. (2004). Size matters! EMedia, 17(6), 48. Schmitt, K. L., Anderson, D. R., & Collins, P. A. (1999). Form and content: Looking at
visual features of television. Developmental Psychology, 35(4), 1156 – 1167. Shedroff, N. (2001). Experience design 1. Indianapolis, IN: New Riders. Sheedy, J. E., Subbaram, M. V., Zimmerman, A. B., & Hayes, J. R. (2005). Text
legibility and the letter superiority effect. Human Factors, 47(4), 797 – 815.
165
Sherman, B. L., & Etling, L. W. (1991). Perceiving and processing music television. In Bryant, J., & Zillman, D. (Eds.) Responding to the screen: Reception and reaction processes (pp. 373 – 388). Hillsdale, NJ: Lawrence Erlbaum Associates.
Silbergleid, M. I. (1992). Instructional television: Visual production techniques and
learning comprehension (Report No. IR 015 637). Washington, DC: Broadcast Education Association. (ERIC Document Reproduction Service No. ED349942)
Singer, J. (1980). The power and limitations of television: A cognitive-affective
analysis. In Tannenbaum, P. (Ed.), The entertainment functions of television (pp. 31 – 65). Hillsdale, NJ: Erlbaum.
Smith, S. L. (1979). Letter size and legibility. Human Factors, 21(6), 661 – 670. Symes, P. (2001). Video compression demystified. New York: McGraw-Hill. Tannenbaum, P. H., & Fosdick, J. A. (1960). The effect of lighting angle on the
judgment of photographed subjects. Audio Visual Communication Review, 8, 253 – 262.
Telecommunications Industry Association. (2007). Mobile and wireless communications
market analysis. Retrieved January 20, 2007, from http://www.tiaonline.org/business/research/mrf/chapters.cfm.
Terran Interactive Inc. (1999). How to produce high quality QuickTime. Retrieved
January 19, 2008, from http://talkbank.org/dv/guides/terran.pdf Thornton, P., & Houser, C. (2005). Using mobile phones in English education in Japan.
Journal of Computer Assisted Learning, 21(3), 217 – 228. Tinker, M. A. (1963). Legibility of print. Ames, IA: Iowa State University Press. Tollett, J., Rohr, D., & Williams, R. (2004). Robin Williams DVD design workshop.
Berkeley, CA: Peachpit Press. Torre, D. M., & Wright, S. M. (2003). Clinical and educational uses of handheld
computers. Southern Medical Journal, 26(10), 996 – 999. Urbaniak, G. C. & Plous, S. (2008). Research randomizer. Retrieved January 15, 2008,
from http://www.randomizer.org Vekiri, I. (2002). What is the value of graphical displays in learning? Educational
Psychology Review, 14(3), 261 – 312.
166
Voight, J. (2007, November 26). Army recruiters on a new mission. Adweek, 48(43), 12 – 13.
Waggoner, B. (n.d.) Making mobile video: What does it take to make video for PDAs
and cell phones? And is the effort worth it? Digital Video. Retrieved November 7, 2007 from http://www.dv.com/features/features_item.php?articleId=23902966
Wagner, E. D. (2005). Enabling mobile learning. Educause Review, 40(3), 40 – 52.
Retrieved January 5, 2007, from Academic Search Premier database. (17124648) Wagner, R. W. (1953). Design in the educational film: An analysis of production
elements in twenty-one widely used non-theatrical motion pictures. (Doctoral dissertation, Ohio State University, 1953). Dissertation Abstracts International, 20 (01), 294.
Wang, Y., Houqiang, L., & Fan, X. (2006). An attention based spatial adaptation scheme
for H.264 videos on mobiles. International Journal of Pattern Recognition, 20(4), 565 – 584.
Ward, L. M., & Greenfield, P. M. (1998). Designing experiments on television and
social behavior. In Asamen, J. K., & Berry, G. L. (Eds.), Research Paradigms, Television, and Social Behavior, 67 - 108. London: Sage Publications.
Watson, R. (1990). Film and television in education: An aesthetic approach to the
moving image. New York: The Falmer Press. Williams, B. O., & Stimatz, L. R. (2005). The origins of graphic screen design
principles: Theory or rhetoric? International Journal of Instructional Media, 32(2), 181 – 193.
Williams, R. (1996). Beyond the Mac is not a typewriter: More typographic insights and
secrets. Berkeley, CA: Peachpit Press. Wise, K., & Reeves, B. (2007). The effect of user control on the cognitive and emotional
processing of pictures. Media Psychology, 9(3), 549 – 566. Wogalter, M. S. (Ed.). (2006). Handbook of warnings. Malawah, NJ: Lawrence Erlbaum
Associates Inc. Wooton, C. (2005). A practical guide to video and audio compression: From sprockets
and rasters to macroblocks. Boston: Focal Press.
167
Yaros, R. A. (2006). Is it the medium or the message? Structuring complex news to enhance engagement and situational understanding by nonexperts. Communication Research, 33(4), 285 – 309.
Yon, B. A., Johnson, R. K., Harvey-Berino, J., Gold, B. C., & Howard, A. B. (2007).
Personal digital assistants are comparable to traditional diaries for self-monitoring during a weight-loss program. Journal of Behavioral Medicine, 30(2), 165 – 175.
Zettl, H. (1976). Television production handbook (3rd ed.). Belmont, CA: Wadsworth
Publishing Company, Inc. Zettl, H. (1998). Contextual media aesthetics as the basis for media literacy. Journal of
Communication, 48(1), 81 – 95.
Related Documents