_______________________________________________________ The Educational Backgrounds of Leading Scientists and Scholars September 2009 1

Educational Background of Scientists and Scholars
Mar 14, 2016
September 2009 _______________________________________________________ 1 Cambridge University particularly dominates the Royal Society – accounting for 34% of Fellows, compared to Oxford’s 13%. Over two thirds (68%) of British Academy Fellows educated in the UK went to Oxford or Cambridge universities compared with just under half (47%) of the UK educated Fellows at the Royal Society. Students in independent schools account for fewer than 15% of A level entries, but twice 2
Welcome message from author
This document is posted to help you gain knowledge. Please leave a comment to let me know what you think about it! Share it to your friends and learn new things together.
Transcript

_______________________________________________________
The EducationalBackgrounds of LeadingScientists and ScholarsSeptember 2009
1

Summary of Key Findings
Four in ten (42%) of the UK’s most prestigious scientists and scholars were educated atindependent schools.
40 schools, mostly independent, produced a quarter of today’s Fellows of the RoyalSociety and British Academy.
Over half (56%) of the Fellows of the Royal Society and British Academy studied atOxford or Cambridge.
Over two thirds (68%) of British Academy Fellows educated in the UK went to Oxford orCambridge universities compared with just under half (47%) of the UK educated Fellowsat the Royal Society.
Cambridge University particularly dominates the Royal Society – accounting for 34% ofFellows, compared to Oxford’s 13%.
The school backgrounds of today’s Fellows closely mirror the student intakes to Oxbridgeand other elite universities in the 1960s when many entered higher education.
Current independent school pupils are on average four times as likely to achieve an A* inacademic GCSEs than their state school counterparts, and constitute up to a half of thehighest achieving pupils in some core academic subjects at age 16.
Students in independent schools account for fewer than 15% of A level entries, but twicethe proportion of A grades. Independent school students account for one third or more oftop grades in key subjects like Physics, Chemistry, Economics and History.
Current trends in student intakes to leading research universities suggest thatindependent school pupils will continue to be over-represented among the nextgeneration of leading scientists and other scholars.
2

Introduction
The Sutton Trust has produced a series of studies reviewing the school and universitybackgrounds of leading people across a number of professions. This work has investigated fieldssuch as law, politics and the news media, and revealed a clear link between private educationand professional success. Independent schools make up 7% of the school population at age 11,yet constitute over half of leading news journalists, medics, chief executives, and 70% ofbarristers and judges1.
The surveys have highlighted that the majority of those holding the most powerful and influentialpositions in modern Britain come from a small social elite, and are not reflective of the widersociety which the professions are intended to serve.
The creation of these social elites is largely a result of educational inequalities exhibited in theschool and university system. Children at leading independent and state schools dominate entryto the country's most highly academically selective universities, which in turn produce the lion'sshare of graduates in the professions. The problem is that the vast majority of parents are unableto afford the fees charged by independent schools, and so are consequently unable to access theexpertise and facilities available at such schools.
Meanwhile, research has found that the careers and education advice and range of qualificationsoffered by many state schools is inadequate, which means pupils attending maintained schoolslack the credentials and pathways required to eventually progress into the professional elites2.There is a huge waste of academic talent in state schools in England, with 60,000 pupils at somestage between the ages 11 and 16 among the top fifth of academic performers yet notprogressing to higher education 3.
The studies have also shed some light on other barriers facing graduates from non-privilegedbackgrounds during the early career stages of many professions - factors that determine whichgraduates are able to gain access to (and prosper within) the professions. This includes access towork experience, internships and social networks, as well as the importance of fostering the ‘softskills’ valued by employers.
This latest survey in the series has a slightly different focus. It investigates the school anduniversity backgrounds of the country’s leading scientists and scholars – as defined bymembership of two of the country’s most prestigious academies: the Royal Society, and theBritish Academy4.
Being elected a Fellow of the Royal Society or the British Academy is one of the highestaccolades an academic can receive in the UK - showing he or she is at the top of their field asjudged by academic peers. Previous surveys by the Trust focus on the backgrounds of the top100 leaders in a given profession. This survey focuses on just under 2000 individual academics.But little up to now has been known about the social and educational backgrounds of theseleading scholars and scientists. One question we can pose (tentatively) with the data gatheredhere is whether the educational profile of Fellows simply reflects the make-up of past graduatesof elite universities - or whether there are differences in the likelihood of reaching the top inacademe once a university degree (and PhD) has been gained. Some have argued that theacademic world is more meritocratic than other areas of public life as there success in pureacademic terms is determined on one particular attribute: intellectual ability.
1 For a summary of these surveys see: http://www.suttontrust.com/reports/ST_MilburnSubmission.pdf2 See http://www.suttontrust.com/reports/NCEEOct2008.pdf3 http://www.suttontrust.com/reports/wastedTalent.pdf4 In an appendix to the report we also present less complete data gathered for fellows of the Academy ofMedical Sciences and the Academy for Social Sciences.
3

As discussed in later sections, another difference in this survey is that the majority of fellows areolder than leaders in other walks of life surveyed previously by the Trust. The majority were bornbefore World War 2, and a significant number in the 1940s. This means that many of today'sfellows are the products of an education system of a former era: the independent and stategrammar system of the post war years. They are the success stories that define the ‘goldengeneration’ of social mobility, which experienced an expansion of opportunities in the mid 20thcentury. The data gathered here allows us to explore to what extent today's leading scholars area direct reflection of this past era.
These historical trends however have clear resonances with contemporary debate over thecurrent school system, and its capacity to produce academically qualified students. Now, as inprevious decades, a major determinant of your academic prospects is what qualifications andadvice is on offer at the school you attend. We review some of the data on this issue for currentschools.
Clearly the characteristics of schools today will have major implications for the make-up of futureleading academics. These debates are perhaps even more crucial for the country now given theincreasingly skills-based global economy of the 21st century. The country's academic prospectsare the key to its economic future. The Trust believes that, as with other elites, the country’sacademic elite is something to be proud of; but it should be open to all academically able childrenirrespective of social background.
The figures gathered for this report suggest that much more needs to be done to improve theachievement in core academic subjects within state schools if future leaders in the sciences, artsand humanities are to come from a broader range of school and social backgrounds.
4

Methodology
The survey focused on the 2,200 leading scientists and scholars elected as Fellows of the twomost established academies, the Royal Society and British Academy. The latest lists of Fellowscan be found on the Societies’ respective websites5.
Each year the existing Fellows of the Royal Society, the UK’s national academy for the sciences,currently elect up to 44 scientists to its prestigious Fellowships. New Fellows must have made ‘asubstantial contribution to the improvement of natural knowledge, including mathematics,engineering science and medical science’. For scientists in the UK being awarded the Fellowshipis perhaps the highest accolade to have been given, short of a Nobel Prize. At the time of thesurvey, there were 1,328 Fellows.
‘Ordinary’ Fellows meanwhile are elected by the British Academy to scholars who have 'attaineddistinction in any of the branches of study which it is the object of the Academy to promote' – i.e.across the humanities and the social sciences. Election is a mark of distinction, as only a verysmall number of scholars in any field are elected. Up to 38 elections are made in each year toOrdinary Fellowship, and there are now some 890 Ordinary Fellows.
The school and university backgrounds of Fellows were obtained by using publicly availablesources, such as Who’s Who, and contacting academics directly. Schools were then categorisedaccording to their status at the point at which the Fellow would have entered the school - oftendifferent to the current status of schools. Schools were classified as non-selective state, stategrammar, direct grant or independent. Universities meanwhile were classified into a number ofwell-defined categories: Oxbridge; the Russell Group, the 1994 Group, and Post-92 universities.
We estimate that the figures collated for the schools attended by Fellows represent at least 80%of those educated in the UK. We believe this sample is broadly representative of the wholeFellowship. There were several reasons for not obtaining data for some individuals: informationon schools was not listed in the Who's Who entry; school information was available, but the statusof the school was difficult to ascertain; or Fellows did not respond to the email survey throughwhich we contacted those individuals for whom we could not find any publicly available data. It istherefore unlikely the minority of Fellows with missing school information will be sufficiently biasedtowards a particular school background to skew the findings significantly. The proportion of knownuniversity backgrounds among UK educated Fellows is 96%.
Response rates for parallel surveys of fellows of the Academy of Medical Sciences and theAcademy of Social Sciences were lower, and consequently it is uncertain how representative theyare. The results on these smaller samples are presented for interest in Appendix 6.
5 See: http://www.britac.ac.uk/fellowship/directory/ordinary.cfm?letter=A;http://royalsociety.org/page.asp?tip=1&id=2215;
5

Findings
Table 1: Fellows with known UK school backgrounds
Royal Society British Academy Combined totals School Number % Number % Number %
Independent 293 38 267 47 557 42
State 484 62 299 53 784 58
Direct Grant 88 11 76 14 164 12Grammar 364 47 214 38 578 43
Non-selective 32 4 9 2 41 2Total 777 100% 564 100% 1341 100%
The table above details the school backgrounds of Fellows for whom information was available.This excludes 197 UK-based Fellows of the Royal Society and 151 UK-based Fellows of theBritish Academy without school details. The remaining Fellows were educated outside the UK.
Detailed definitions of the different school types and discussion of the figures is provided in thefollowing section of the report. But there are a number of stand-out findings. Four in ten Fellowswere educated at independent schools, even though these schools made up just 7% of schoolpupils, and British Academy Fellows are significantly more likely to be privately educated thantheir Royal Society counterparts. Only one in 50 Fellows were educated in non-selective stateschools – with, as might be expected, the vast majority of state school educated Fellows fromselective grammar schools.
Elite schools
When the data are broken down for individual schools, it is striking how many Fellows of bothAcademies come from a tiny number of elite public schools (which made up significantpercentages of university entrants in the post war era). The figures for schools with at least fiveFellows among their former students are listed in Appendix 2. Perhaps unsurprisingly EtonCollege tops the list with 22 Etonians now leading scientists and scholars.
In fact, just ten schools - seven independent and three direct grant – educated over 10% oftoday's Fellows. Eton College, Winchester College and St Paul's School have at least 20 Fellowsto their name. Meanwhile 40 schools, mostly independent, produced between them a quarter ofthe leading scientists and scholars. None of these elite academic schools are in the state sector,although some direct grants are included. A number of state grammar schools produced threeFellows, but the most impressive state performer in this respect in fact comes from overseas:Sydney's High School for Boys produced at least 6 Fellows of the Royal Society.
In Appendix 4, the figures are broken down for age groups of Fellows, by decade of birth. Thisshows that slightly lower proportions of younger Fellows are independently educated than theirelder peers.
6

Table 2: Fellows’ university backgrounds
Royal Society British Academy Combined University Number % Number % Number %
Russell Group 846 83% 662 88% 1508 85%
- Oxford 129 13% 247 33% 376 21%
- Cambridge 348 34% 258 34% 606 34%
1994 Group 68 7% 34 5% 102 6%
Post 92 7 1% 0 0% 7 0%
Other 102 10% 56 7% 151 9%
Total 1016 100% 752 100% 1768 100%
The table above details the undergraduate university backgrounds of Fellows for whominformation was available. This excludes 70 UK-based Fellows of the Royal Society and theBritish Academy without university details. The remaining 350 Fellows graduated fromuniversities outside the UK. The current membership of the Russell and 1994 groups ofuniversities are available on their respective websites6.
Again, these findings are discussed in the following section of the report in the context of thenature of the university sector when the Fellows enrolled on degree courses in the 1960s. Thehigh proportion of Russell group graduates is to be expected given that these universitiescomprised much of the university sector at that time. Perhaps the most noticeable figures are thedifferent percentages of Oxbridge graduates among Fellows of the two academies. Two thirds ofBritish Academy Fellows educated in the UK went to Oxford or Cambridge, compared with justunder half of the UK-educated Fellows of the Royal Society. Graduates of Cambridge areparticularly well represented in the Royal Society, accounting for 34% of its Fellows, compared to13% for Oxford. This is perhaps a reflection of Cambridge’s historic dominance in the sciencesubjects.
As can be seen from the tables in Appendix 3, it is also the case that Fellows of the BritishAcademy generally come from a far narrower range of universities than Fellows of the RoyalSociety, perhaps reflecting differences in the provision of arts and science courses in theuniversity sector of the time.
6 See: http://www.russellgroup.ac.uk; http://www.1994group.ac.uk
7

Comparisons with other professions
In tables 3 and 4 below we compare the educational background of Fellows with other fieldssurveyed by the Trust. Here direct grant grammars are classified with state grammars in line withthe figures presented in previous reports, on the basis that more than half the places in thoseschools were open to non fee-payers.
Fellows are less likely to be privately educated than leaders in other areas of public life, such aslaw and journalism, but more likely than MPs. Interestingly, the fee paying school sector suppliestwo in five academics among the scholarly elite, but only one in five Vice Chancellors, those incharge of running universities. Scientists and other scholars (alongside journalists) are also morelikely to have attended Oxford or Cambridge Universities than those in any other field exceptJudges. In part, this may be because the age profile of both Judges and Scholars, on average,tends to be older than the other professions the Trust has reviewed.
Table 3: How the school backgrounds of scientists and scholars’ compare with leaders inother professions
Year %Independent %State %Grammar %CompScientists &scholars 2009 42 58 54 3VCs 2008 24 76 66 10Judges 2007 70 30 28 2MPs 2007 32 68 25 42Journalists 2006 54 46 32 14Medics 2007 51 49 32 17CEOs 2007 54 46 26 20
Table 4: How the Oxbridge backgrounds of scientists and scholars compare with leadersin other professions
Year %OxbridgeScientists &Scholars 2008 56VCs 2007 27Judges 2007 78MPs 2007 42Journalists 2006 56Medics 2007 15CEOs 2007 39
8

Discussion
The post war education landscape
The educational characteristics of today’s scientists and scholars needs to be put into the contextof the post-War education system – a system characterised by academically selective stateschools and a small number of elite universities. This is the world in which many of the Fellows,now in their late 60s, were educated – before the introduction of comprehensive state schools,the near abolition of grammar and direct grant schools, and the rapid expansion of the universitysector witnessed over more recent decades.
School characteristics
Official statistics on education are hard to come by for this period, but the overall make-up of theschool system can be gleaned from a number of official reviews undertaken at the time7. Duringthe 20 year period from 1950 until 1970 there were four main types of schools in England (otherparts of the UK had similar systems):
State grammar schools -- educating around 25% of all school pupils (both state andindependent) during the period.
Secondary modern schools -- accounting for approximately 65% of all school pupils.
Direct grant schools8 -- making up 3% of school pupils.
Independent schools -- making up around 6% of all school pupils (private school numbersactually witnessed a slight decline over the period, before rising again in the 1980s).
These figures highlight that independent school pupils are significantly over-represented amongtoday's Fellows. Independent schools educated just over 6% of young people in the post wareducation system, yet account for 42% of today’s leading scholars and scientists.
University characteristics
The university sector experienced by many of the Fellows was comprised of what, in modernparlance, is now termed the ‘old research universities’. This was essentially the majority ofmembers of the modern day Russell Group, although newer universities were starting to maketheir mark9. Overall, just over five percent of school leavers went on to study for a degree,compared to over one third today. Oxford and Cambridge graduates made up about a sixth of alluniversity students in the early Sixties; today they make up less than two percent of degreeentrants.
7 The statistics used here are taken from the Public Schools Commission report of 1968. We have alsoconsulted figures available in the Robbins Report tasked by the Government to look into the future ofhigher education in the early 1960s. For a helpful summary of some of these historical trends see:http://www.parliament.uk/commons/lib/research/briefings/snsg-00616.pdf8 These were 179 selective schools funded partly by the state and partly through private fees. 9 The Russell Group consists of: Birmingham, Bristol, Cambridge, Cardiff, Edinburgh, Glasgow, ImperialCollege, Kings College London, Leeds, Liverpool, London School of Economics, Manchester, Newcastle,Nottingham, Oxford, Queen’s University Belfast, Sheffield, Southampton, University College London, andWarwick
9

But the university system of the Fellows era was, as today, far from representative of the schoolsystem from which it drew its students. A useful snapshot of university admissions is provided byfigures collated for the Public Schools Commission in 1966. As the summary table below shows,42% of the intake of Oxbridge was drawn from independent schools, and a fifth of the studentpopulation as a whole came from private schools – far more than the proportion of pupilseducated by the sector.
Table 5: Intakes of universities in 1966 by school background
Schools Percentage of university student intake
OxbridgeOther
universitiesTotal
universitiesIndependent 42 16 19Direct Grant 19 13 13State 39 72 68 - State grammar 37 63 60
Backgrounds of Fellows compared with post war education system
As has been noted, it is hardly surprising that the vast majority of Fellows in our survey hadattended one of the Russell Group universities, as these accounted for most of the highereducation sector at the time. The high representation of Oxbridge graduates is also to beexpected – educating about a sixth of undergraduates at the time, but over half the Fellows – assuch academic powerhouses are bound to supply the lion’s share of leading scholars.
In terms of school background, if we take the above 1966 university admission figures as thebenchmark - most Fellows are aged in their 60s - the immediate observation is how similar theschool backgrounds of the Oxbridge intake is to the make-up of the Fellows in our sample. Justover four in ten of the student intakes at Oxford and Cambridge were privately educated in themid-1960s - the same proportion of privately educated Fellows at the Royal Society and BritishAcademy combined.
We do not have detailed figures on the admissions makeup of the other universities that Fellowsattended, but we know that, overall, universities outside of Oxbridge had a far lower proportion ofindependently educated students (less than one fifth in the mid Sixties). It seems likely, though,that the representation of privately schooled students was stronger in some of the mostprestigious and established universities of the time, and the school backgrounds of the Fellows inour sample reflect this.
Progression in academic careers
The close association between the proportion of independently educated students enrolled atelite universities in the 1950s and 1960s and the proportion of independently educated fellowssuggests broadly that school background might have little impact on the progress of individualsonce they are in academe. This contention is supported when the education backgrounds ofFellows from different age groups is considered: a slightly smaller proportion of younger Fellowswent to independent school and it is also the case that independent school pupils made up asmaller proportion of degree entrants in elite universities during later years. The figures for fellowswith known birth-dates, organized by different decades, are presented in Appendix 4.
However, given the paucity of data on the backgrounds of academics as a whole for variousstages of their careers, this remains, at best, a suggestion.
10

Postgraduate progression
The data available on the progression to postgraduate degrees, and PhDs in particular, for veryrecent cohorts of graduates suggests that school background has no impact on the likelihood oftaking up postgraduate study.
In 2005 the Higher Education Funding Council for England published a report that examinedpostgraduate participation rates and concluded that progression, once in possession of a firstdegree, is essentially invariant by background of the student10.
Another recent survey supports this conclusion and suggests that the chances of progressing to aPhD are the same for current university students from different types of schools - as long as theyhave performed well enough in their first degree to pursue research11.
Although this may not always have been the case. Forthcoming research by the London Schoolof Economics suggests that in previous decades independent school pupils were actually lesslikely than their state school counterparts to pursue postgraduate education after graduating. Onepossible reason for this is that the financial returns to postgraduate courses has radicallyimproved in more recent decades This finding applies to one year Masters degrees as well asresearch PhDs12.
Career progression
Much less is known about the backgrounds of young researchers during the early stages ofacademic careers. This is despite concerns about low pay and high insecurity for youngacademics in fixed term postdoctoral positions (before becoming full time lecturers)13, Therelatively low pay of academics compared with other high skill professions has led many tospeculate that it now attracts fewer individuals from prosperous backgrounds with expectations toearn high salaries. However, others suggest that it is precisely the low relative pay that means itis increasingly likely that young academics will come from privileged backgrounds, as poorearnings will impact on their lives far less.
What evidence is available for lecturers and professors indicates that academe attracts on thewhole individuals from increasingly average income homes – unlike those in other professions.
A research paper published by Bristol University for the recent Government-commissionedMilburn Review on fair access into the professions compared the income backgrounds of childrenborn in 1958 and 1970 who went on to pursue particular careers14. Children in the 1970 cohortwho grew up to become academics came from homes with incomes closer to the average for thecountry as a whole, than those academics born in the 1958 cohort. In other words, more recentgenerations of academics have come from less well off backgrounds than their predecessors.This is in stark contrast to professions such as journalism, law and medicine, which are in factbecoming more privileged. In these fields, individuals born in 1970 on average came from homeswith increasingly higher than average incomes compared with those born 12 years earlier in1958.
10 See http://www.hefce.ac.uk/pubs/hefce/2005/05_03/ pages 129-13111 For further details, see: http://www.york.ac.uk/depts/educ/people/WakelingP.htm12 Growth of Postgraduate Education and its Effect on Intergenerational Mobility, forthcoming13 See for example the 2002 Roberts report that sought to improve career progression for young scientists,http://www.hm-treasury.gov.uk/ent_res_roberts.htm14 See http://www.bristol.ac.uk/cmpo/publications/other/socialmobility.pdf
11

Election of Fellows
We received many comments from Fellows and reviewers on the peer selection processesdeployed by the Academies to appoint new Fellows. Concerns have been expressed about thelow representation of females, younger academics, and researchers from particular disciplines inthe Fellowship15.
Some academics even questioned the assumption that the Fellowship is a good proxy for leadingacademics - as so many highly rated researchers are not elected as fellows. As we have no dataon academics as a whole it is impossible to make any conclusive observations on these issues -only to re-iterate that any differences need to be considered in the context of the educationalachievements at school, university and during academic life, that are the major factors indetermining likely Fellows.
15 For a discussion of these issues see the 2002 House of Commons Science and Technology Committeereport, at http://www.publications.parliament.uk/pa/cm200102/cmselect/cmsctech/774/77403.htm
12

The academic divide in today’s schools: prospects for futureFellows
This report shows the high representation of the privately-schooled among leading researchers.Yet with an average age of 60 plus, the majority of the leading figures in the sciences andhumanities experienced the education system of the 1950s and 1960s – academically selective at11 and with much lower staying on rates to higher education than today. As discussed, theseeducational patterns persist for the youngest Fellows as well, but even these will have enteredschool in the early 70s at the very latest.
While there are lessons to learn from these historical trends, what can we say about theprospects for the future generation of leading scholars and scientists? What will the school anduniversity backgrounds of Fellows look like in 2050? Given the close association betweeneducational achievement and the make-up of current Fellows, we can consider the achievementin core academic subjects among today's school children – as well as intakes to research-leduniversities – to provide an indication of future trends in the educational backgrounds oftomorrow's leading scholars and scientists.
Attainment gaps
Analysis by the Trust of the 2008 results for GCSEs in England in a number of core academicsubjects reveals a stark state-independent school divide in the likelihood of achieving a top A*grade -- an indicator of high academic potential. The figures are presented in Table 6.
Independent school pupils entered for these disciplines are up to five times as likely to achieve anA* grade. As independent school pupils are also more likely to be entered for such subjects in thefirst place, this means that in many academic disciplines, they make up a substantial proportion ofA* pupils – despite representing only 7% of school pupils overall. In modern languages, forinstance, independent schools now make up nearly as many A* pupils as the entire state sector.So while independent school make up a fraction of school pupils at age 11, by age 16 theyconstitute up to a half of the highest achieving pupils in certain core academic subjects.
13

Table 6: Proportions and numbers of GCSE students achieving the top A* grade in 2008 inindependent and state schools in England
State Independent
% ofentriesA*
NumberA*
% ofentriesA*
NumberA*
BiologicalScience
15.4 9450 36.0 5718
Chemistry 19.1 10288 41.3 6203Physics 18.7 9993 40.7 5898CoreScience
2.2 11132 12.5 2723
AdditionalScience
5.1 17017 17.8 3314
Maths 4.5 31709 17.7 5537Geography 8.0 12452 30.3 6676History 8.1 14601 31.1 7376Art andDesign
5.2 8843 24.6 3905
English 3.2 19152 17.4 7627French 6.5 9833 30.3 8622German 6.7 4293 30.3 2286Spanish 10.4 4796 35.1 3992
This academic divide widens further at sixth form level. The chart below shows the extent towhich pupils in independent schools currently dominate entry to and high achievement in key Alevel subjects. Students in independent schools account for just under 15% of A level entries, buttwice the proportion of A grades. In many of the subjects core to the Royal Society's remit andthat of the British Academy, independent schools perform even better. The private sectorcontributes over one fifth of the entries in Physics, Maths and Chemistry, for instance, andproduces one third of the A grades.
Table 7: Independent school A level entries and A grades as percentage of total entriesand A grades
% of total entries (2008) % of total A grades (2008)Economics 33.1 48.4Physics 22.7 35.3Maths 21.3 31.4Chemistry 21.2 33.5Geography 19.5 32.5History 17.7 33.0Biology 17.2 30.5English 10.7 23.5All subjects 14.8 28.6Source: Independent Schools Council Bulletin 52
14

University entry
Attainment in core academic subjects is the key to gaining entry to elite research universities –the launch pad for the vast majority of future leading academics.
Recent work by Policy Exchange16 has shown that certain A level subject choices are much morelikely to lead to a place at such universities than others. The study found that traditional scienceand mathematics subjects, for example, account for a little under a quarter of the A levels studiedby young people, but one third of the A levels accepted by research-led universities. Similarly,‘soft’ arts and humanities subjects comprised just 5.2% of the A levels accepted by leadinguniversities, while ‘traditional’ arts and humanities subjects made up 16.6% of acceptedqualifications.
So the school supply chain is vital in predicting the composition of the next generation of topscholars. Research-led universities need to take on undergraduate students who have theattributes and knowledge to prosper in a highly academic environment.
University access
The data compiled for Fellows show that almost all had attended a Russell Group University fortheir undergraduate degree. While the broadening and expansion of the higher education sectormay change this situation a little for the leading scholarly elite of the future, it seems high likelythat – as in other elite walks of life – attendance at a relatively small number of prestigiousinstitutions will continue to be the dominant pathway to success. This is particularly so in a fieldwhere research and academic rigor is paramount. And, indeed, some core academic disciplinesare only offered by a select range of universities in the country.
Yet, when we look at access to a sample of these universities for today’s young people, thesituation is starkly unequal, despite some shifts in the last decade. The table below highlights thebackgrounds of students over the last ten years entering the thirteen universities ranked mosthighly by the newspaper league tables (the Sutton Trust 13).
Independent schools now educate seven percent of the school age population and 15 percent ofA level entrants; yet these schools account for one third of undergraduate students at top rankeduniversities. Similarly, around half the population are from the lower four social classes – but theymake up just 16% of entrants to leading universities, meaning that the richer half of the population
16 The hard truth about ‘soft’ subjects, Policy Exchange, Dec 2008, at www.policyexchange.org.uk
15

account for the remaining 84%. And the proportion of students from the poorest areas of thecountry is pitifully low, at just four percent.
If the leading scientists and scholars of 2050 more or less reflect the current student intakes atthese highly-ranked universities, then we will continue to see fewer state educated figures,particularly from our most deprived neighbourhoods and most challenging schools, than if wewere truly making the most of the talents of bright young people from all backgrounds. And itmay be that the intake figures for top universities overestimate the proportion of non-privilegedstudents who will go on to become future scholars, as the dominance of the independentlyschooled in the sciences, for example, may skew the figures further.
As discussed earlier, these university enrolment trends are driven by earlier achievement atschool. But this is not the whole story. Another reason driving inequalities in access to universityis that students in comprehensive schools – and especially those in schools with no track recordin admissions to elite higher education – are less likely to apply to prestigious institutions evenwhen armed with the appropriate A level grades, deterred by misconceptions and less confidentin their abilities. A recent report commissioned by the Sutton Trust and the Department forBusiness, Innovation and Skills, for example, showed that pupils in high performing independentschools made twice as many applications to elite institutions that their peers in similarly highperforming comprehensives17. There is also evidence of some teachers in state schools activelydiscouraging applications to, for instance, Oxbridge, even for their brightest pupils, as well aspoor careers and education advice holding back those from non-traditional homes18.
17 http://www.suttontrust.com/reports/BIS_ST_report.pdf18 See for example: http://www.suttontrust.com/reports/MORIJan2008.pdf
16

Appendix 1: Comments from Fellows
The email survey of Fellows prompted many unsolicited views on the education system of whichthey were the products. Here we provide a selected summary of some of the comments. Theseprovide a small insight into the experiences of the so called 'golden generation' of upward mobilityduring the immediate post war period – the grammar school boys and girls, and 'scholarship kids',and grant maintained university students. As these comments testify, the education systemenabled many to become the first in their family to go to university, transforming their lives.
As ever, views on grammar schools differ according to whether the individuals benefitted fromthem or not. In a small minority of cases, some scholars also spoke passionately about how theystruggled against the odds in a non-academic school, after failing to pass the eleven plus exam.While the grammar school debate is often seen as a particular historical feature of English schoolpolicy, many comments from Fellows educated overseas in fact revealed common experiences inAustralia, South Africa, and in Wales and Scotland.
Tom FoxonSchool of Physics and AstronomyUniversity of Nottingham
My own background, like many of my peers, was from a working class family and I was the first togo to university from the family. The secondary school, unusually for that time, had a scientist asheadmaster who worked with Appleton according to my recollection, so science was very muchencouraged. I took the then mandatory 11 plus, which enabled me to go to the Grammar school. Ido recall the most difficult thing financially for my parents was the cost of school uniform, butsomehow they managed.
At university I was completely self sufficient since the grant at that time was £300 per year andmy parents’ income was around £1000 per year. This made attending university much easier inreality than for today's students, but then of course the student population was much smaller as afraction of the total population.
Professor Lord May of Oxford Department of ZoologyUniversity of Oxford
My secondary school was Sydney Boys' High School. It was in fact the first secondary schoolestablished in Sydney, and was essentially a state grammar school. That is, it was a stateschool, but it selected from a wide region (the Eastern Suburbs of Sydney).
It had an absolutely superb set of teachers, including a remarkable chemistry teacher who taughtno fewer than eight Fellows of the Royal Society (including one Noble Laureate and one PRS).The same chemistry teacher coached the track team, which won the state school championship28 of the 33 years he coached the team.
As in the UK, a misguided Government disestablished most of the selective state schools in the1970s, with the result that the private schools were greatly academically strengthened -- just likethe UK.
17

David MillerSolid State and Photonics LaboratoryStanford University
I was educated at Perth Academy, Perth, Scotland. At that time (I left in 1972), it was a stateschool in Scotland, but had been operating as a selective high school, that is, pupils werestreamed on the basis of perceived academic ability on the basis of a test at the end of theirprimary school education, which was at about age 11. At the very end of my time at PerthAcademy, the school was just transitioning to being comprehensive, eliminating the aboveselection procedure.
I honestly think, incidentally, that I as an individual benefitted substantially from being in that moreselective school – I think I got a very good high school education. It is a fair question howeverwhether it was best overall for the larger body of students to do that streaming.
Tariq ModoodDepartment of SociologyUniversity of Bristol
My secondary school was Aylestone Secondary Modern School in Brent, London, which Iattended during 1964-71; I failed the 11+ and so was assigned this school, which became acomprehensive (though only in name) in the late 1960s. I went on to Durham University in 1971.In doing so I was the first person to go to university directly from Aylestone (in a 14 year history).Most of my teachers did not have a degree or know anything about universities and I had toresearch universities myself without any assistance.
Adrian SuttonDepartment of PhysicsImperial College
I went to a state school the Dartford Technical High School For Boys in Kent. I was there between1967 and 1973. At that time if one passed the 11 plus one had a choice between going to agrammar school or a technical high school. I was recommended to go to the technical highschool because I only just passed the 11 plus.
I subsequently got 5 A-levels and 2 S-levels at that school, and became the first pupil to apply toOxbridge, and the first member of my family to go to any University. My experience has alwaysconvinced me that the 11 plus is potentially a catastrophic examination for late developers likeme, and had I failed it I doubt very much that my career would have been as successful.
John MorrisDirector of Preclinical StudiesOxford University
I attended Colston’s School in Bristol – an independent school – on an academic scholarship. Mymother was a teacher in Bath where we lived, and the son of another teacher had a son who hadapplied for and gained the scholarship the previous year. It was suggested that I have a go withtwo others, all of whom were thought to have a better chance than I. However, for whateverreason I was given the fee-assisted place (there were 5 or 6 as I recall)
18
John BarrellCentre for Eighteenth Century StudiesUniversity of York
I went to Dulwich College (1954-61) and Trinity College Cambridge (1961-4). In those daysDulwich College, though now unambiguously an independent school, was not so when I wentthere. Although it was calling itself a public school and admitted fee-paying pupils like any otherpublic school, the great majority of the places were free, and paid for by local authorities. It wascalled the 'Dulwich experiment'. My place was free, and, like most other pupils, I went there aftertaking the 11-plus at a state primary school. We all became little gentlemen quite easily, or so Ithought until I went to Cambridge and met lots of real public schoolboys.
19
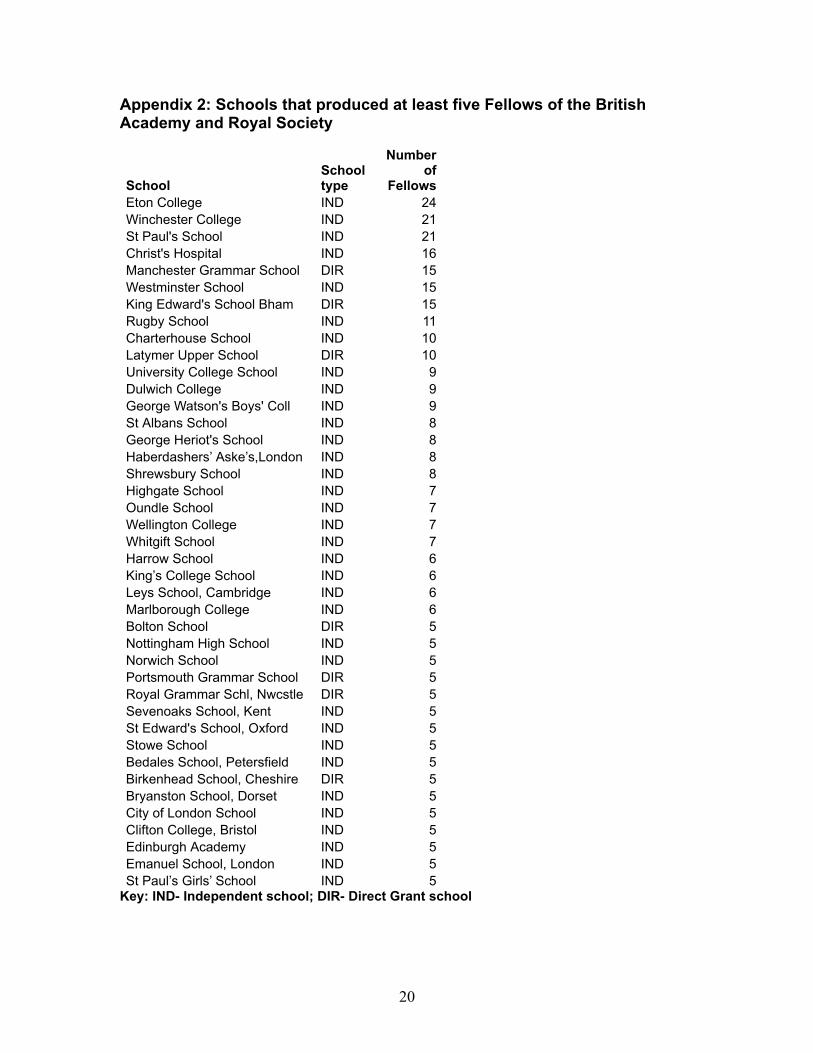
Appendix 2: Schools that produced at least five Fellows of the BritishAcademy and Royal Society
SchoolSchooltype
Numberof
FellowsEton College IND 24Winchester College IND 21St Paul's School IND 21Christ's Hospital IND 16Manchester Grammar School DIR 15Westminster School IND 15King Edward's School Bham DIR 15Rugby School IND 11Charterhouse School IND 10Latymer Upper School DIR 10University College School IND 9Dulwich College IND 9George Watson's Boys' Coll IND 9St Albans School IND 8George Heriot's School IND 8Haberdashers’ Aske’s,London IND 8Shrewsbury School IND 8Highgate School IND 7Oundle School IND 7Wellington College IND 7Whitgift School IND 7Harrow School IND 6King’s College School IND 6Leys School, Cambridge IND 6Marlborough College IND 6Bolton School DIR 5Nottingham High School IND 5Norwich School IND 5Portsmouth Grammar School DIR 5Royal Grammar Schl, Nwcstle DIR 5Sevenoaks School, Kent IND 5St Edward's School, Oxford IND 5Stowe School IND 5Bedales School, Petersfield IND 5Birkenhead School, Cheshire DIR 5Bryanston School, Dorset IND 5City of London School IND 5Clifton College, Bristol IND 5Edinburgh Academy IND 5Emanuel School, London IND 5St Paul’s Girls’ School IND 5
Key: IND- Independent school; DIR- Direct Grant school
20

Appendix 3: Universities that produced at least ten Fellows of the RoyalSociety / British Academy
Arts versus sciences
Further analysis of the data suggests that the higher representation of independent school alumniamong Fellows of the British Academy compared with Fellows of the Royal Society is due largelyto the social composition of the different universities attended by the Fellows as students.
The tables below show that only a relatively small number of universities have produced morethan 10 Fellows of the British Academy, compared with the number of universities producing atleast 10 Fellows of the Royal Society. Oxford in particular makes up a far larger proportion ofuniversity graduates among leading scholars of the British Academy – and historically Oxfordadmitted fewer state school pupils than Cambridge.
The slightly higher proportion of state school entrants at Cambridge and other universities suchas University College London and Manchester in past decades, meanwhile, is consistent with thesimilarly higher percentage of Royal Society Fellows from state education compared with theirBritish Academy counterparts. This wider group of universities produced a larger share of today'snationally recognised scientists.
UniversityNo. RSFellows University
No. BAFellows
Cambridge 348 Cambridge 258Oxford 129 Oxford 247UCL 58 UCL 34Manchester 41 LSE 25Bristol 40 Edinburgh 19Imperial 38 Glasgow 14Birmingham 28 Manchester 12Edinburgh 25London 24Glasgow 21Nottingham 21KCL 20Leeds 19Liverpool 16Durham 15Sheffield 14Queen’sBelfast 12St Andrews 12Queen Mary 10Reading 10Sussex 10
21

Appendix 4: Backgrounds by date of birth
The table below documents the school backgrounds of Fellows from the Royal Society and BritishAcademy by their decade of birth. These figures exclude those with unknown school backgroundsand those educated overseas.
The proportion of Fellows from private schools seems to have declined over time, but haspossibly stabilised more recently – with similar proportions of Fellows born in the 1940s and1950s educated in independent schools.
22
Independent State Direct Grant Grammar Non-selective
Decadeborn
Totalnumber number
% ofyear
group number
% ofyear
group number
% ofyear
group number
% ofyear
group number
% ofyear
group1920 -29 277 122 44% 148 53% 26 9% 115 42% 7 3%1930 -39 377 148 39% 221 59% 42 11% 173 46% 6 2%1940 -49 430 148 34% 268 62% 56 13% 198 46% 14 3%
1950 -59 179 62 35% 112 63% 17 10% 86 48% 9 5%

Appendix 5: School backgrounds of British Academy Fellows in differentdisciplines
Tables in Appendix 5 breakdown the school backgrounds of Fellows of the British Academy bydifferent disciplines. Numbers in each subject area are much smaller, but the figures suggestdifferences between different academic fields. Around 7 in 10 Fellows are privately educated inHistory of Art, Philosophy, or Classical Antiquity for example.
Number ofUK fellowswith knownschoolbackground %IND %State %unclassified
Classical Antiquity 45 67% 33% 0%Theology and Religious Studies 18 44% 50% 6%African and Oriental Studies 22 64% 36% 0%Linguistics and Philology 17 24% 71% 6%Early Modern Languages and Literatures 28 39% 54% 7%Modern Languages, Literatures and other Media 41 49% 39% 12%Archaeology 28 57% 43% 0%Medieval Studies 51 35% 55% 10%Early Modern History to 1800 39 46% 51% 3%Modern History from c.1800 45 58% 40% 2%History of Art and Music 23 78% 17% 4%Philosophy 27 67% 33% 0%Law 51 43% 53% 4%Economics and Economic History 39 28% 72% 0%Anthoropology and Geography 31 32% 65% 3%Sociology, Demography and Social Statistics 40 25% 73% 2%
Political Studies: Political Theory, Governmentand International Relations 24 50% 50% 0%Psychology 15 47% 47% 7%
Totals 584 273 289 22
23

Appendix 6: Educational backgrounds of Fellows of Academies of Medicaland Social Sciences
These tables summarise data from surveys of Fellows of the Academy of Social Sciences and theAcademy of Medical Sciences. Fellowship of the Academy of Medical Sciences is based ‘onexceptional contributions to the medical sciences either in the form of original discovery or ofsustained contributions to scholarship’. Fellows are drawn from clinical academic medicine,veterinary science, dentistry, laboratory science, medical and nursing care and other professionsallied to medical science. There are currently 912 Fellows19.
Members of the Academy of Social Sciences will have demonstrated ‘a significant contribution toScience and its promotion’ and include Learned Societies in the UK and individual socialscientists. The contributions made include research, teaching, professional practice, consultancyand the promotion of social science knowledge. There are currently 554 Fellows20.
We estimate that the figures collated for the schools attended by Fellows represent at least 53%of those educated in the UK for the AMS, and at least 62% of those educated in the UK for theASS. The proportion of known university backgrounds among UK educated Fellows meanwhile is71% and 62% respectively.
Fellows with known UK school backgrounds
Academy of Medical
SciencesAcademy of Social
Sciences
Number % Number %
Independent 203 44 61 24
State 234 50 196 76Grammar 204 44 160 62Non-selective 30 6 36 14Total 464 100 257 100
Fellows with known UK university backgrounds
Academy of MedicalSciences
Academy of SocialSciences
No % No %
RussellGroup
443 73 105 36
Oxbridge
220 36 74 25
94 Group 30 5 50 17Post 92 18 3 3 1Other 112 19 136 46Total 603 100 294 100
19 http://www.acmedsci.ac.uk/p59.html20 http://www.acss.org.uk/about3.htm
24
Related Documents


