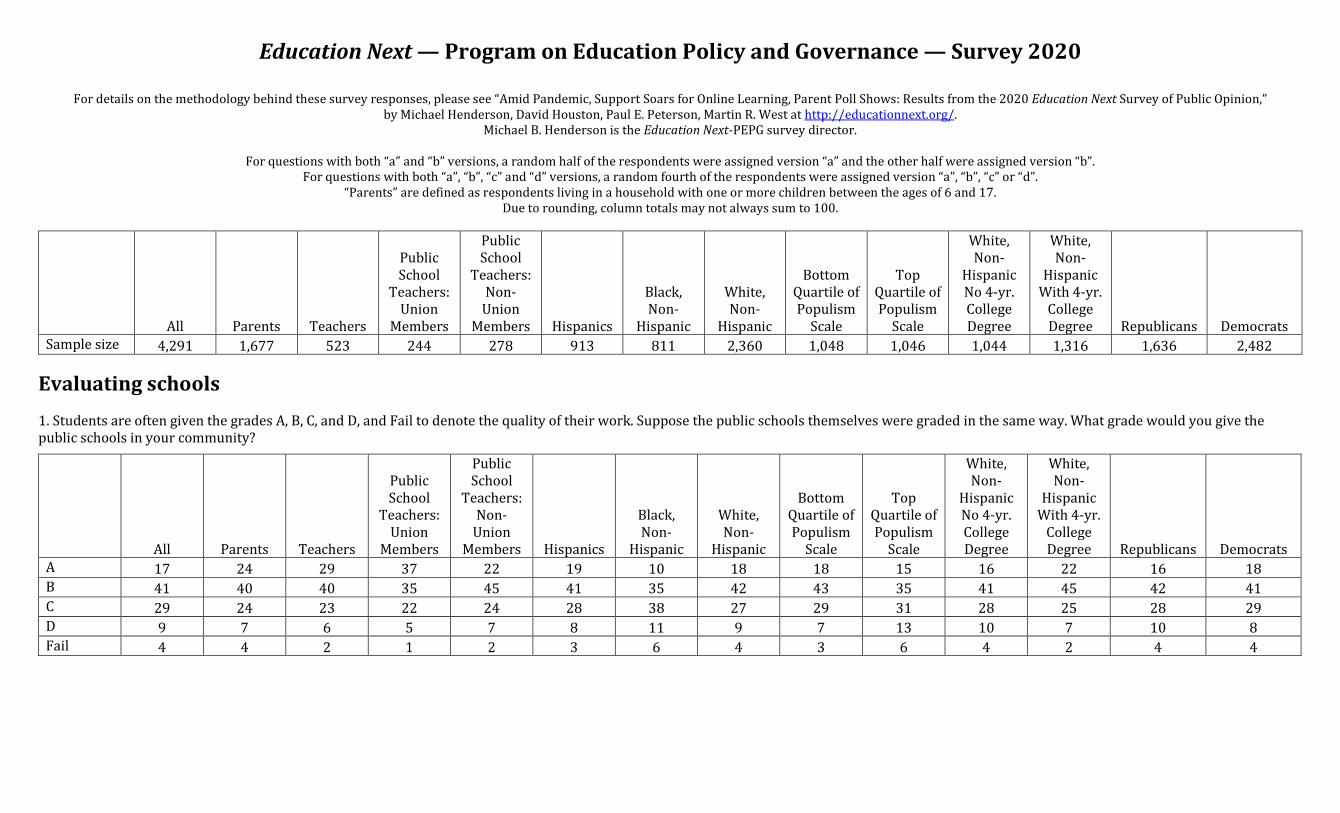
Education Next — Program on Education Policy and Governance — Survey 2020 For details on the methodology behind these survey responses, please see “Amid Pandemic, Support Soars for Online Learning, Parent Poll Shows: Results from the 2020 Education Next Survey of Public Opinion,” by Michael Henderson, David Houston, Paul E. Peterson, Martin R. West at http://educationnext.org/. Michael B. Henderson is the Education Next-PEPG survey director. For questions with both “a” and “b” versions, a random half of the respondents were assigned version “a” and the other half were assigned version “b”. For questions with both “a”, “b”, “c” and “d” versions, a random fourth of the respondents were assigned version “a”, “b”, “c” or “d”. “Parents” are defined as respondents living in a household with one or more children between the ages of 6 and 17. Due to rounding, column totals may not always sum to 100. All Parents Teachers Public School Teachers: Union Members Public School Teachers: Non- Union Members Hispanics Black, Non- Hispanic White, Non- Hispanic Bottom Quartile of Populism Scale Top Quartile of Populism Scale White, Non- Hispanic No 4-yr. College Degree White, Non- Hispanic With 4-yr. College Degree Republicans Democrats Sample size 4,291 1,677 523 244 278 913 811 2,360 1,048 1,046 1,044 1,316 1,636 2,482 Evaluating schools 1. Students are often given the grades A, B, C, and D, and Fail to denote the quality of their work. Suppose the public schools themselves were graded in the same way. What grade would you give the public schools in your community? All Parents Teachers Public School Teachers: Union Members Public School Teachers: Non- Union Members Hispanics Black, Non- Hispanic White, Non- Hispanic Bottom Quartile of Populism Scale Top Quartile of Populism Scale White, Non- Hispanic No 4-yr. College Degree White, Non- Hispanic With 4-yr. College Degree Republicans Democrats A 17 24 29 37 22 19 10 18 18 15 16 22 16 18 B 41 40 40 35 45 41 35 42 43 35 41 45 42 41 C 29 24 23 22 24 28 38 27 29 31 28 25 28 29 D 9 7 6 5 7 8 11 9 7 13 10 7 10 8 Fail 4 4 2 1 2 3 6 4 3 6 4 2 4 4

Welcome message from author
This document is posted to help you gain knowledge. Please leave a comment to let me know what you think about it! Share it to your friends and learn new things together.
Transcript
Education Next — Program on Education Policy and Governance — Survey 2020
For details on the methodology behind these survey responses, please see “Amid Pandemic, Support Soars for Online Learning, Parent Poll Shows: Results from the 2020 Education Next Survey of Public Opinion,” by Michael Henderson, David Houston, Paul E. Peterson, Martin R. West at http://educationnext.org/.
Michael B. Henderson is the Education Next-PEPG survey director.
For questions with both “a” and “b” versions, a random half of the respondents were assigned version “a” and the other half were assigned version “b”. For questions with both “a”, “b”, “c” and “d” versions, a random fourth of the respondents were assigned version “a”, “b”, “c” or “d”.
“Parents” are defined as respondents living in a household with one or more children between the ages of 6 and 17. Due to rounding, column totals may not always sum to 100.
All Parents Teachers
Public School
Teachers: Union
Members
Public School
Teachers: Non-
Union Members Hispanics
Black, Non-
Hispanic
White, Non-
Hispanic
Bottom Quartile of Populism
Scale
Top Quartile of Populism
Scale
White, Non-
Hispanic No 4-yr. College Degree
White, Non-
Hispanic With 4-yr.
College Degree Republicans Democrats
Sample size 4,291 1,677 523 244 278 913 811 2,360 1,048 1,046 1,044 1,316 1,636 2,482
Evaluating schools 1. Students are often given the grades A, B, C, and D, and Fail to denote the quality of their work. Suppose the public schools themselves were graded in the same way. What grade would you give the public schools in your community?
All Parents Teachers
Public School
Teachers: Union
Members
Public School
Teachers: Non-
Union Members Hispanics
Black, Non-
Hispanic
White, Non-
Hispanic
Bottom Quartile of Populism
Scale
Top Quartile of Populism
Scale
White, Non-
Hispanic No 4-yr. College Degree
White, Non-
Hispanic With 4-yr.
College Degree Republicans Democrats
A 17 24 29 37 22 19 10 18 18 15 16 22 16 18 B 41 40 40 35 45 41 35 42 43 35 41 45 42 41 C 29 24 23 22 24 28 38 27 29 31 28 25 28 29 D 9 7 6 5 7 8 11 9 7 13 10 7 10 8 Fail 4 4 2 1 2 3 6 4 3 6 4 2 4 4
Education Next—PEPG Survey 2020
2
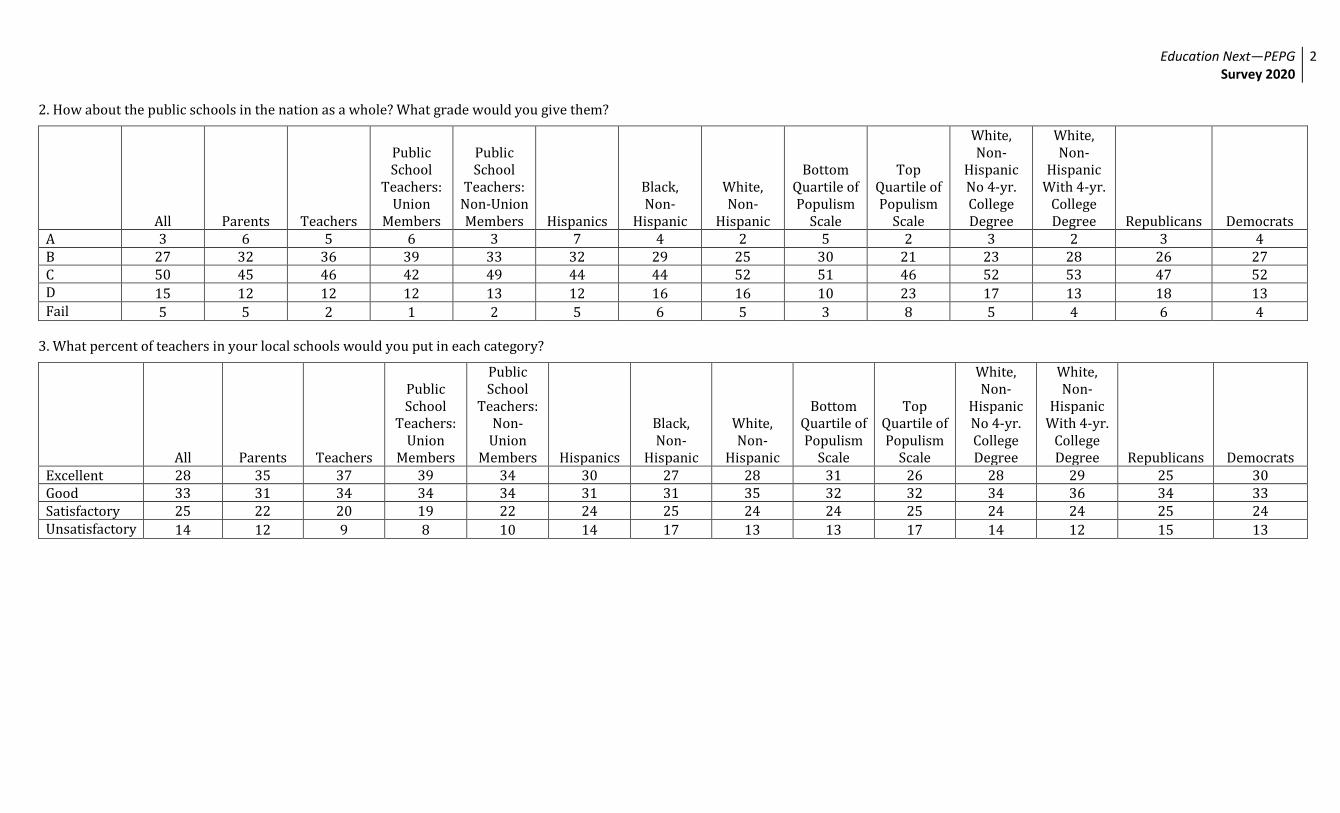
2. How about the public schools in the nation as a whole? What grade would you give them?
All Parents Teachers
Public School
Teachers: Union
Members
Public School
Teachers: Non-Union Members Hispanics
Black, Non-
Hispanic
White, Non-
Hispanic
Bottom Quartile of Populism
Scale
Top Quartile of Populism
Scale
White, Non-
Hispanic No 4-yr. College Degree
White, Non-
Hispanic With 4-yr.
College Degree Republicans Democrats
A 3 6 5 6 3 7 4 2 5 2 3 2 3 4 B 27 32 36 39 33 32 29 25 30 21 23 28 26 27 C 50 45 46 42 49 44 44 52 51 46 52 53 47 52 D 15 12 12 12 13 12 16 16 10 23 17 13 18 13 Fail 5 5 2 1 2 5 6 5 3 8 5 4 6 4
3. What percent of teachers in your local schools would you put in each category?
All Parents Teachers
Public School
Teachers: Union
Members
Public School
Teachers: Non-
Union Members Hispanics
Black, Non-
Hispanic
White, Non-
Hispanic
Bottom Quartile of Populism
Scale
Top Quartile of Populism
Scale
White, Non-
Hispanic No 4-yr. College Degree
White, Non-
Hispanic With 4-yr.
College Degree Republicans Democrats
Excellent 28 35 37 39 34 30 27 28 31 26 28 29 25 30 Good 33 31 34 34 34 31 31 35 32 32 34 36 34 33 Satisfactory 25 22 20 19 22 24 25 24 24 25 24 24 25 24 Unsatisfactory 14 12 9 8 10 14 17 13 13 17 14 12 15 13
Education Next—PEPG Survey 2020
3
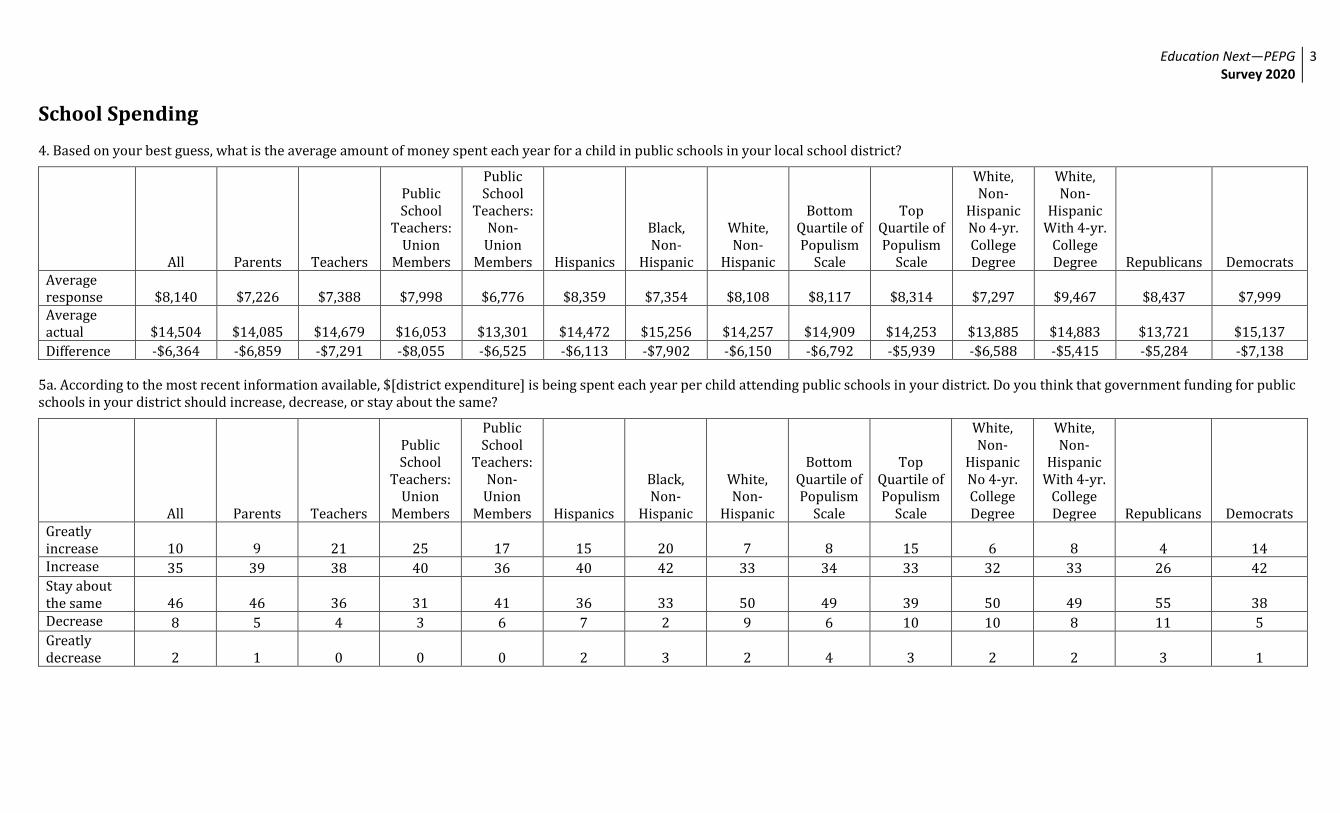
School Spending 4. Based on your best guess, what is the average amount of money spent each year for a child in public schools in your local school district?
All Parents Teachers
Public School
Teachers: Union
Members
Public School
Teachers: Non-
Union Members Hispanics
Black, Non-
Hispanic
White, Non-
Hispanic
Bottom Quartile of Populism
Scale
Top Quartile of Populism
Scale
White, Non-
Hispanic No 4-yr. College Degree
White, Non-
Hispanic With 4-yr.
College Degree Republicans Democrats
Average response $8,140 $7,226 $7,388 $7,998 $6,776 $8,359 $7,354 $8,108 $8,117 $8,314 $7,297 $9,467 $8,437 $7,999 Average actual $14,504 $14,085 $14,679 $16,053 $13,301 $14,472 $15,256 $14,257 $14,909 $14,253 $13,885 $14,883 $13,721 $15,137 Difference -$6,364 -$6,859 -$7,291 -$8,055 -$6,525 -$6,113 -$7,902 -$6,150 -$6,792 -$5,939 -$6,588 -$5,415 -$5,284 -$7,138
5a. According to the most recent information available, $[district expenditure] is being spent each year per child attending public schools in your district. Do you think that government funding for public schools in your district should increase, decrease, or stay about the same?
All Parents Teachers
Public School
Teachers: Union
Members
Public School
Teachers: Non-
Union Members Hispanics
Black, Non-
Hispanic
White, Non-
Hispanic
Bottom Quartile of Populism
Scale
Top Quartile of Populism
Scale
White, Non-
Hispanic No 4-yr. College Degree
White, Non-
Hispanic With 4-yr.
College Degree Republicans Democrats
Greatly increase 10 9 21 25 17 15 20 7 8 15 6 8 4 14 Increase 35 39 38 40 36 40 42 33 34 33 32 33 26 42 Stay about the same 46 46 36 31 41 36 33 50 49 39 50 49 55 38 Decrease 8 5 4 3 6 7 2 9 6 10 10 8 11 5 Greatly decrease 2 1 0 0 0 2 3 2 4 3 2 2 3 1
Education Next—PEPG Survey 2020
4
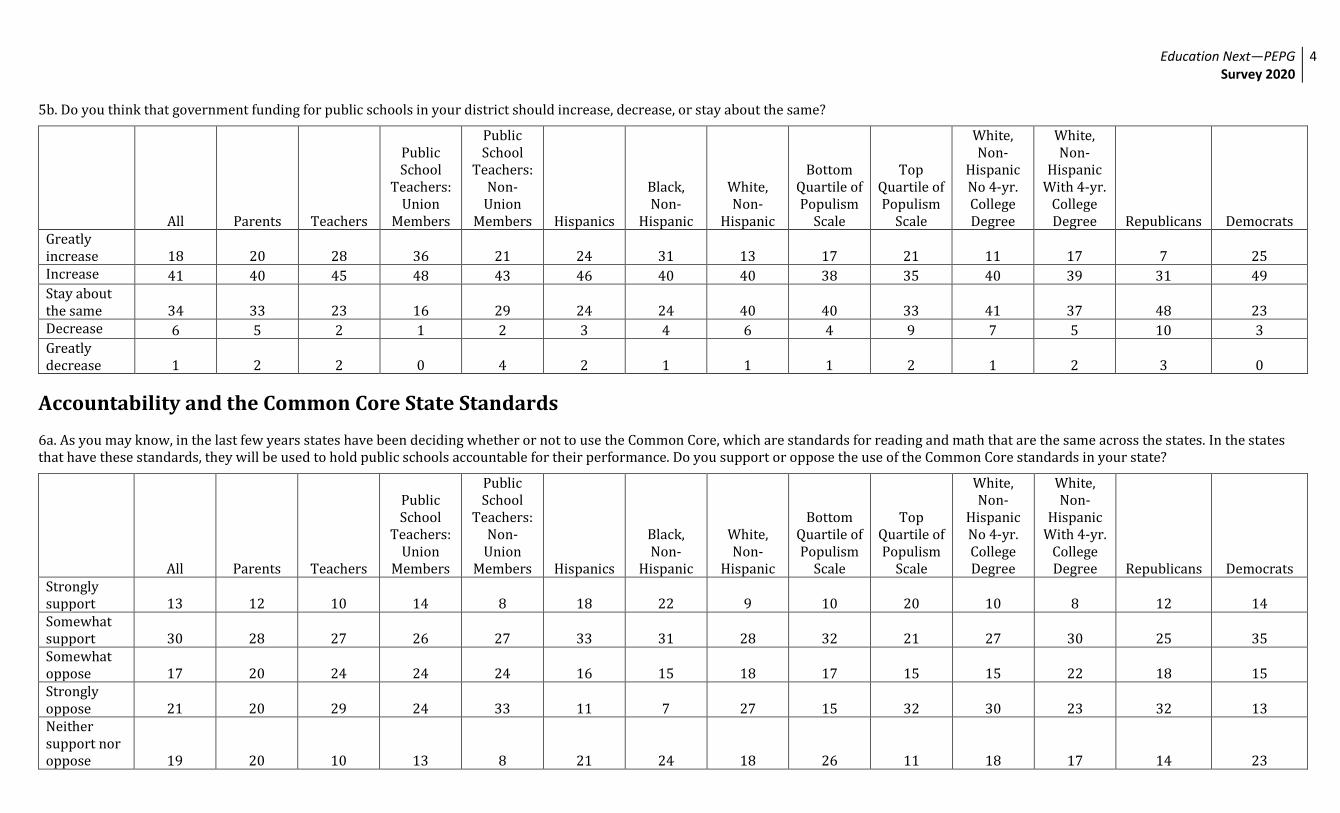
5b. Do you think that government funding for public schools in your district should increase, decrease, or stay about the same?
All Parents Teachers
Public School
Teachers: Union
Members
Public School
Teachers: Non-
Union Members Hispanics
Black, Non-
Hispanic
White, Non-
Hispanic
Bottom Quartile of Populism
Scale
Top Quartile of Populism
Scale
White, Non-
Hispanic No 4-yr. College Degree
White, Non-
Hispanic With 4-yr.
College Degree Republicans Democrats
Greatly increase 18 20 28 36 21 24 31 13 17 21 11 17 7 25 Increase 41 40 45 48 43 46 40 40 38 35 40 39 31 49 Stay about the same 34 33 23 16 29 24 24 40 40 33 41 37 48 23 Decrease 6 5 2 1 2 3 4 6 4 9 7 5 10 3 Greatly decrease 1 2 2 0 4 2 1 1 1 2 1 2 3 0
Accountability and the Common Core State Standards 6a. As you may know, in the last few years states have been deciding whether or not to use the Common Core, which are standards for reading and math that are the same across the states. In the states that have these standards, they will be used to hold public schools accountable for their performance. Do you support or oppose the use of the Common Core standards in your state?
All Parents Teachers
Public School
Teachers: Union
Members
Public School
Teachers: Non-
Union Members Hispanics
Black, Non-
Hispanic
White, Non-
Hispanic
Bottom Quartile of Populism
Scale
Top Quartile of Populism
Scale
White, Non-
Hispanic No 4-yr. College Degree
White, Non-
Hispanic With 4-yr.
College Degree Republicans Democrats
Strongly support 13 12 10 14 8 18 22 9 10 20 10 8 12 14 Somewhat support 30 28 27 26 27 33 31 28 32 21 27 30 25 35 Somewhat oppose 17 20 24 24 24 16 15 18 17 15 15 22 18 15 Strongly oppose 21 20 29 24 33 11 7 27 15 32 30 23 32 13 Neither support nor oppose 19 20 10 13 8 21 24 18 26 11 18 17 14 23
Education Next—PEPG Survey 2020
5
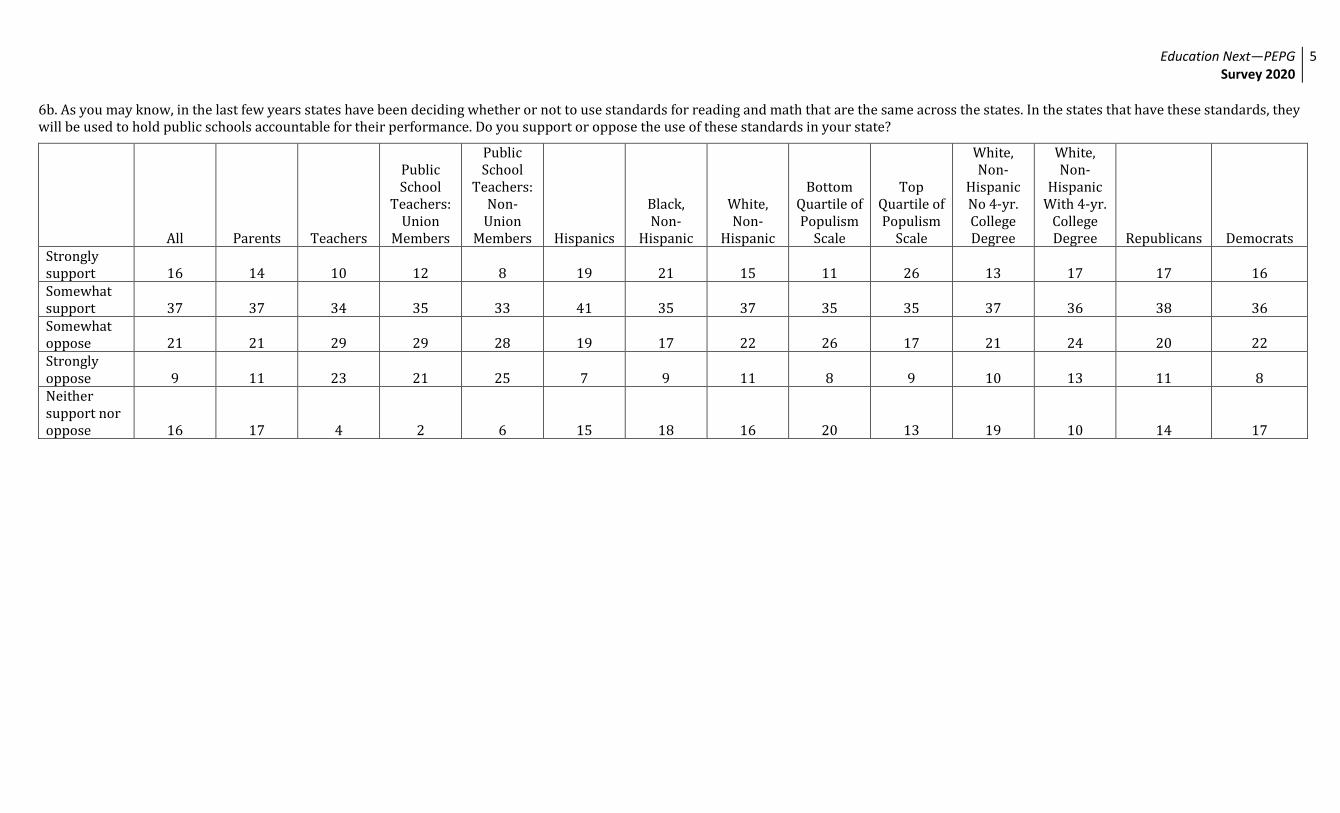
6b. As you may know, in the last few years states have been deciding whether or not to use standards for reading and math that are the same across the states. In the states that have these standards, they will be used to hold public schools accountable for their performance. Do you support or oppose the use of these standards in your state?
All Parents Teachers
Public School
Teachers: Union
Members
Public School
Teachers: Non-
Union Members Hispanics
Black, Non-
Hispanic
White, Non-
Hispanic
Bottom Quartile of Populism
Scale
Top Quartile of Populism
Scale
White, Non-
Hispanic No 4-yr. College Degree
White, Non-
Hispanic With 4-yr.
College Degree Republicans Democrats
Strongly support 16 14 10 12 8 19 21 15 11 26 13 17 17 16 Somewhat support 37 37 34 35 33 41 35 37 35 35 37 36 38 36 Somewhat oppose 21 21 29 29 28 19 17 22 26 17 21 24 20 22 Strongly oppose 9 11 23 21 25 7 9 11 8 9 10 13 11 8 Neither support nor oppose 16 17 4 2 6 15 18 16 20 13 19 10 14 17
Education Next—PEPG Survey 2020
6
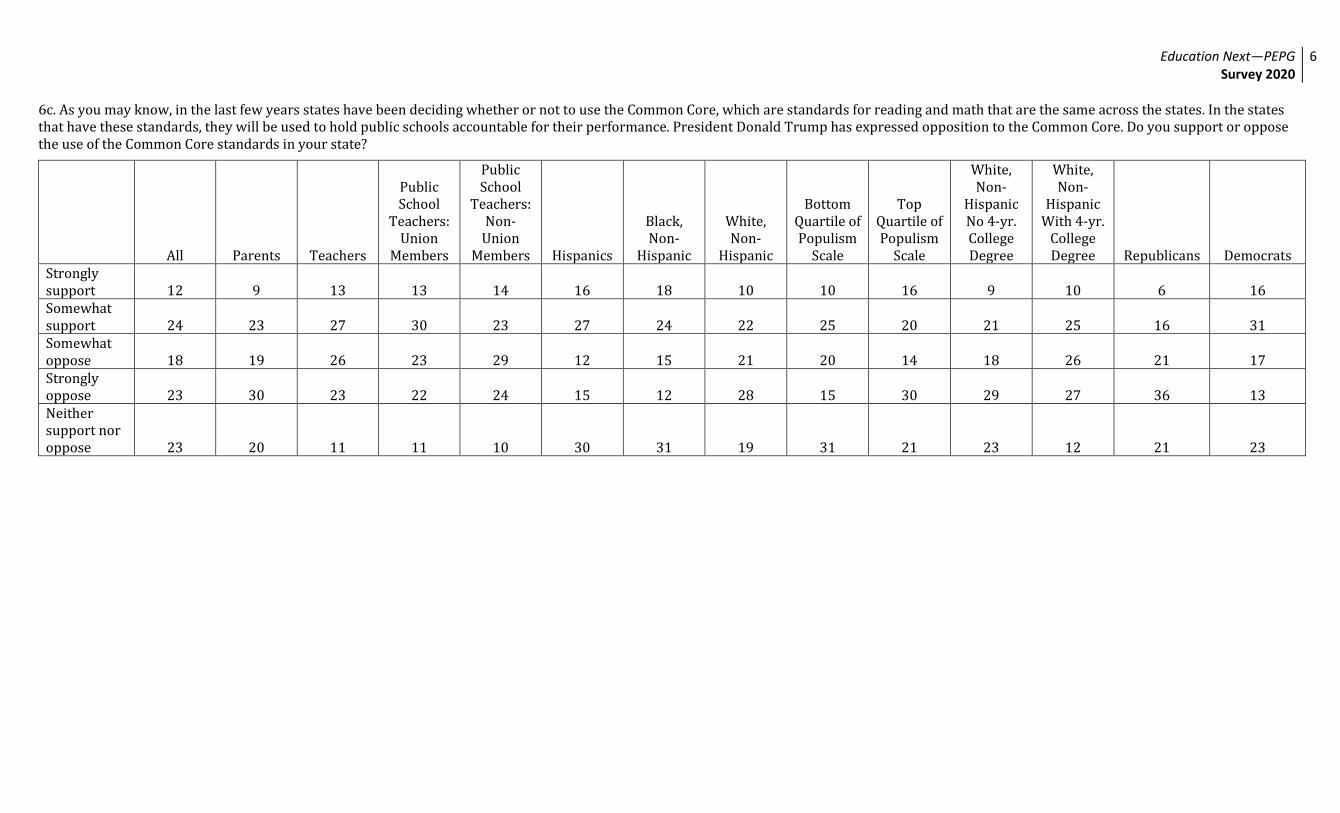
6c. As you may know, in the last few years states have been deciding whether or not to use the Common Core, which are standards for reading and math that are the same across the states. In the states that have these standards, they will be used to hold public schools accountable for their performance. President Donald Trump has expressed opposition to the Common Core. Do you support or oppose the use of the Common Core standards in your state?
All Parents Teachers
Public School
Teachers: Union
Members
Public School
Teachers: Non-
Union Members Hispanics
Black, Non-
Hispanic
White, Non-
Hispanic
Bottom Quartile of Populism
Scale
Top Quartile of Populism
Scale
White, Non-
Hispanic No 4-yr. College Degree
White, Non-
Hispanic With 4-yr.
College Degree Republicans Democrats
Strongly support 12 9 13 13 14 16 18 10 10 16 9 10 6 16 Somewhat support 24 23 27 30 23 27 24 22 25 20 21 25 16 31 Somewhat oppose 18 19 26 23 29 12 15 21 20 14 18 26 21 17 Strongly oppose 23 30 23 22 24 15 12 28 15 30 29 27 36 13 Neither support nor oppose 23 20 11 11 10 30 31 19 31 21 23 12 21 23
Education Next—PEPG Survey 2020
7
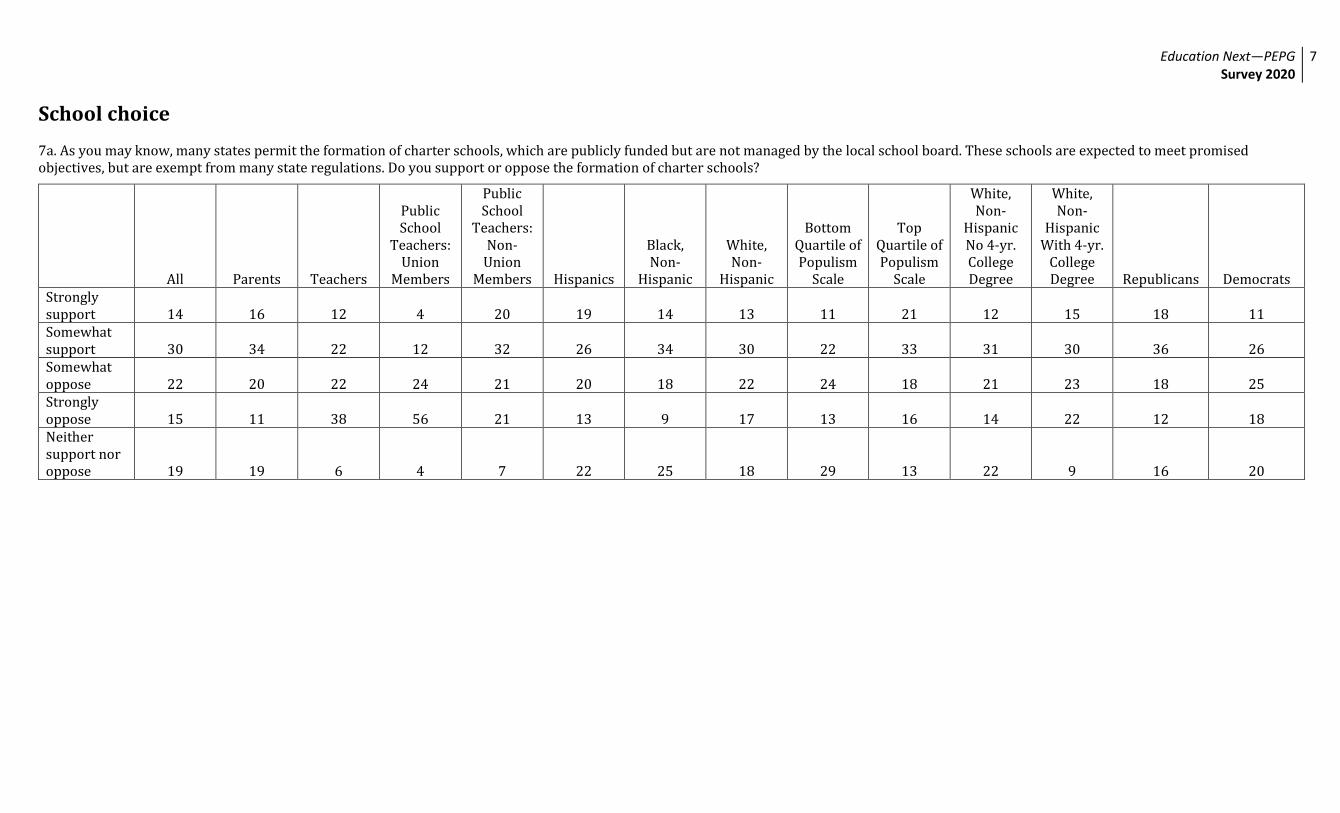
School choice 7a. As you may know, many states permit the formation of charter schools, which are publicly funded but are not managed by the local school board. These schools are expected to meet promised objectives, but are exempt from many state regulations. Do you support or oppose the formation of charter schools?
All Parents Teachers
Public School
Teachers: Union
Members
Public School
Teachers: Non-
Union Members Hispanics
Black, Non-
Hispanic
White, Non-
Hispanic
Bottom Quartile of Populism
Scale
Top Quartile of Populism
Scale
White, Non-
Hispanic No 4-yr. College Degree
White, Non-
Hispanic With 4-yr.
College Degree Republicans Democrats
Strongly support 14 16 12 4 20 19 14 13 11 21 12 15 18 11 Somewhat support 30 34 22 12 32 26 34 30 22 33 31 30 36 26 Somewhat oppose 22 20 22 24 21 20 18 22 24 18 21 23 18 25 Strongly oppose 15 11 38 56 21 13 9 17 13 16 14 22 12 18 Neither support nor oppose 19 19 6 4 7 22 25 18 29 13 22 9 16 20
Education Next—PEPG Survey 2020
8
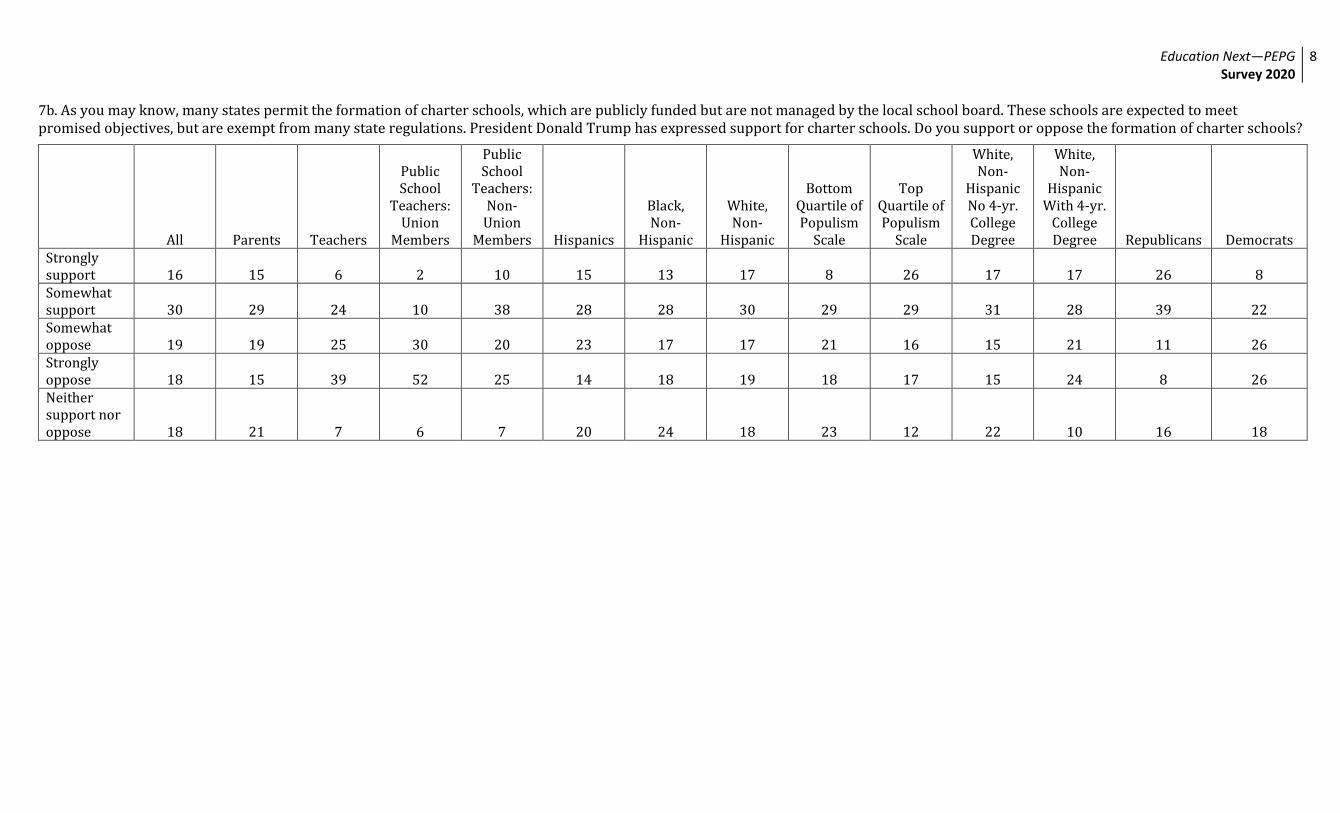
7b. As you may know, many states permit the formation of charter schools, which are publicly funded but are not managed by the local school board. These schools are expected to meet promised objectives, but are exempt from many state regulations. President Donald Trump has expressed support for charter schools. Do you support or oppose the formation of charter schools?
All Parents Teachers
Public School
Teachers: Union
Members
Public School
Teachers: Non-
Union Members Hispanics
Black, Non-
Hispanic
White, Non-
Hispanic
Bottom Quartile of Populism
Scale
Top Quartile of Populism
Scale
White, Non-
Hispanic No 4-yr. College Degree
White, Non-
Hispanic With 4-yr.
College Degree Republicans Democrats
Strongly support 16 15 6 2 10 15 13 17 8 26 17 17 26 8 Somewhat support 30 29 24 10 38 28 28 30 29 29 31 28 39 22 Somewhat oppose 19 19 25 30 20 23 17 17 21 16 15 21 11 26 Strongly oppose 18 15 39 52 25 14 18 19 18 17 15 24 8 26 Neither support nor oppose 18 21 7 6 7 20 24 18 23 12 22 10 16 18
Education Next—PEPG Survey 2020
9
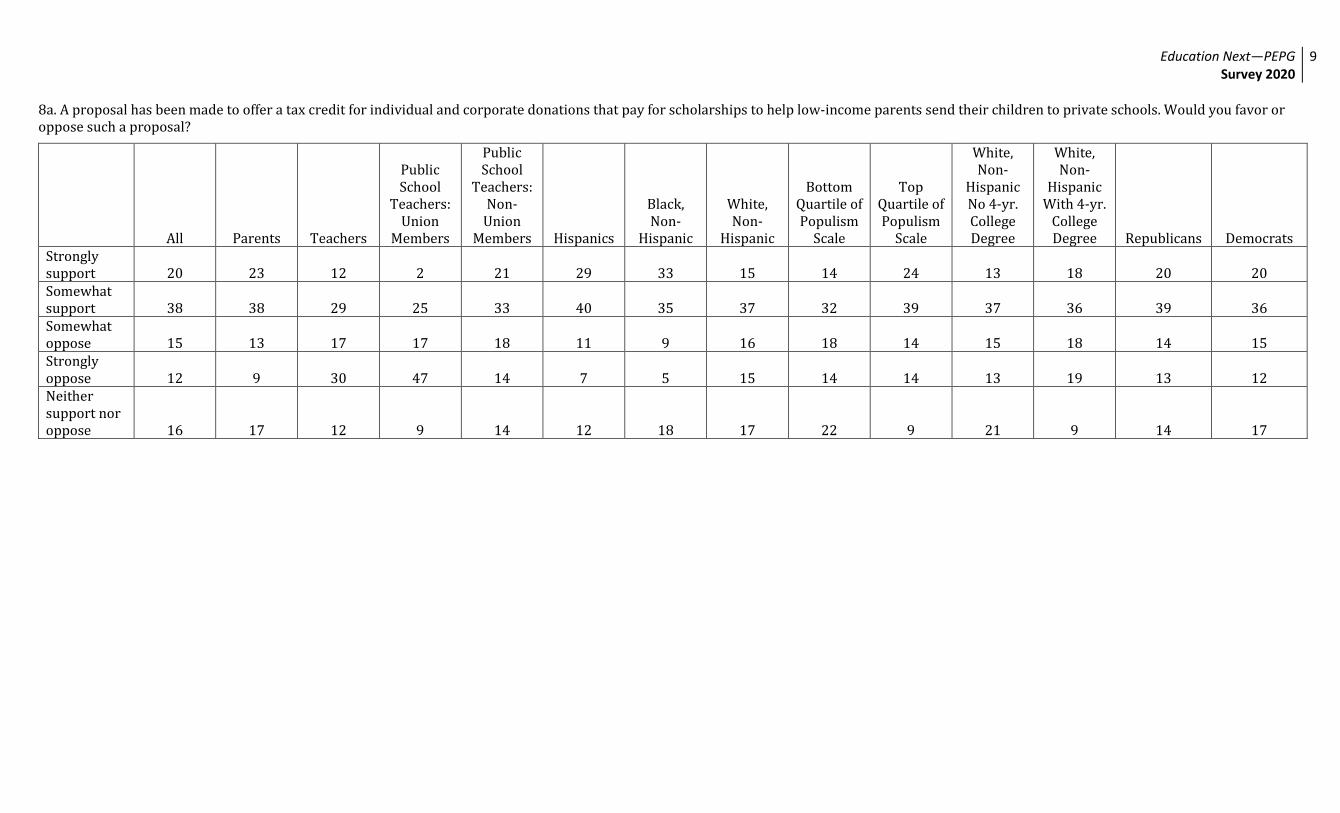
8a. A proposal has been made to offer a tax credit for individual and corporate donations that pay for scholarships to help low-income parents send their children to private schools. Would you favor or oppose such a proposal?
All Parents Teachers
Public School
Teachers: Union
Members
Public School
Teachers: Non-
Union Members Hispanics
Black, Non-
Hispanic
White, Non-
Hispanic
Bottom Quartile of Populism
Scale
Top Quartile of Populism
Scale
White, Non-
Hispanic No 4-yr. College Degree
White, Non-
Hispanic With 4-yr.
College Degree Republicans Democrats
Strongly support 20 23 12 2 21 29 33 15 14 24 13 18 20 20 Somewhat support 38 38 29 25 33 40 35 37 32 39 37 36 39 36 Somewhat oppose 15 13 17 17 18 11 9 16 18 14 15 18 14 15 Strongly oppose 12 9 30 47 14 7 5 15 14 14 13 19 13 12 Neither support nor oppose 16 17 12 9 14 12 18 17 22 9 21 9 14 17
Education Next—PEPG Survey 2020
10
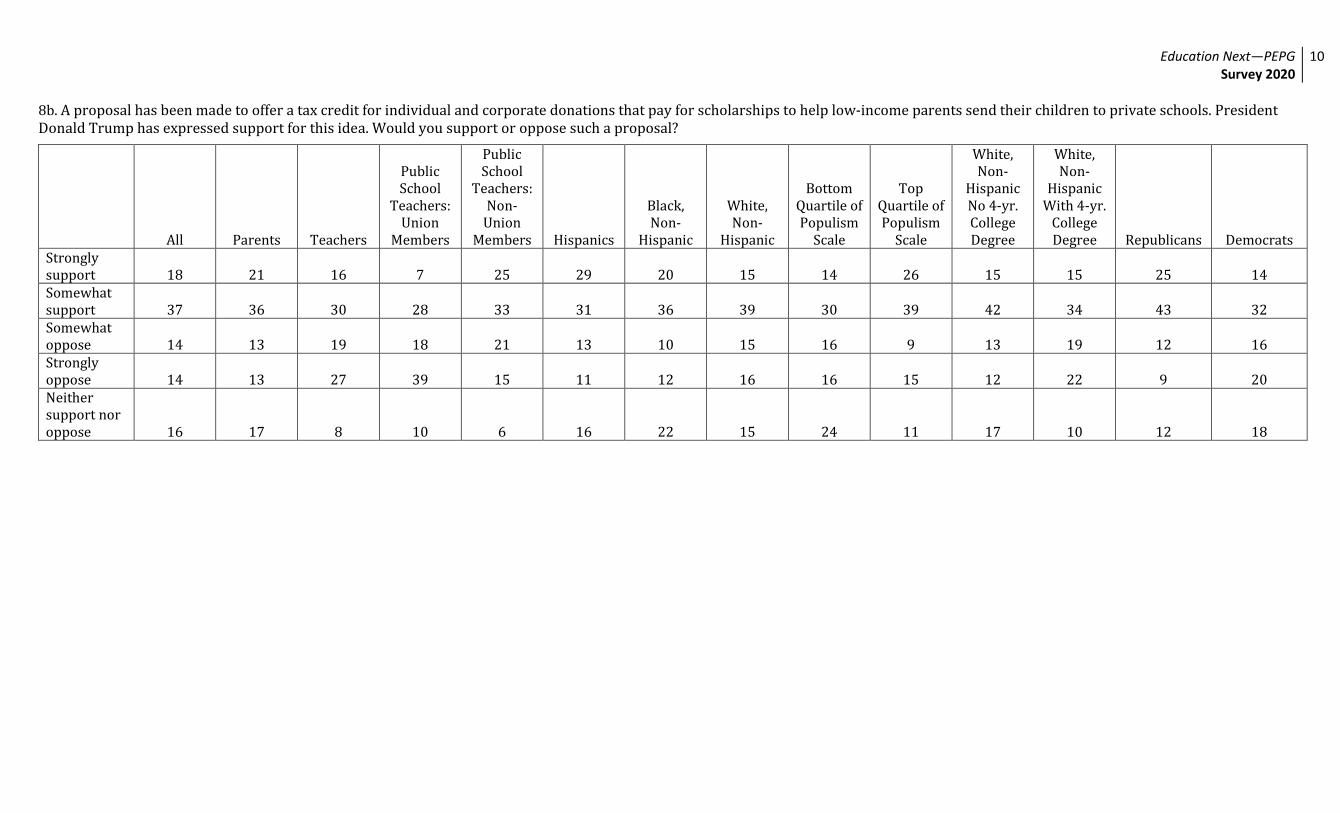
8b. A proposal has been made to offer a tax credit for individual and corporate donations that pay for scholarships to help low-income parents send their children to private schools. President Donald Trump has expressed support for this idea. Would you support or oppose such a proposal?
All Parents Teachers
Public School
Teachers: Union
Members
Public School
Teachers: Non-
Union Members Hispanics
Black, Non-
Hispanic
White, Non-
Hispanic
Bottom Quartile of Populism
Scale
Top Quartile of Populism
Scale
White, Non-
Hispanic No 4-yr. College Degree
White, Non-
Hispanic With 4-yr.
College Degree Republicans Democrats
Strongly support 18 21 16 7 25 29 20 15 14 26 15 15 25 14 Somewhat support 37 36 30 28 33 31 36 39 30 39 42 34 43 32 Somewhat oppose 14 13 19 18 21 13 10 15 16 9 13 19 12 16 Strongly oppose 14 13 27 39 15 11 12 16 16 15 12 22 9 20 Neither support nor oppose 16 17 8 10 6 16 22 15 24 11 17 10 12 18
Education Next—PEPG Survey 2020
11
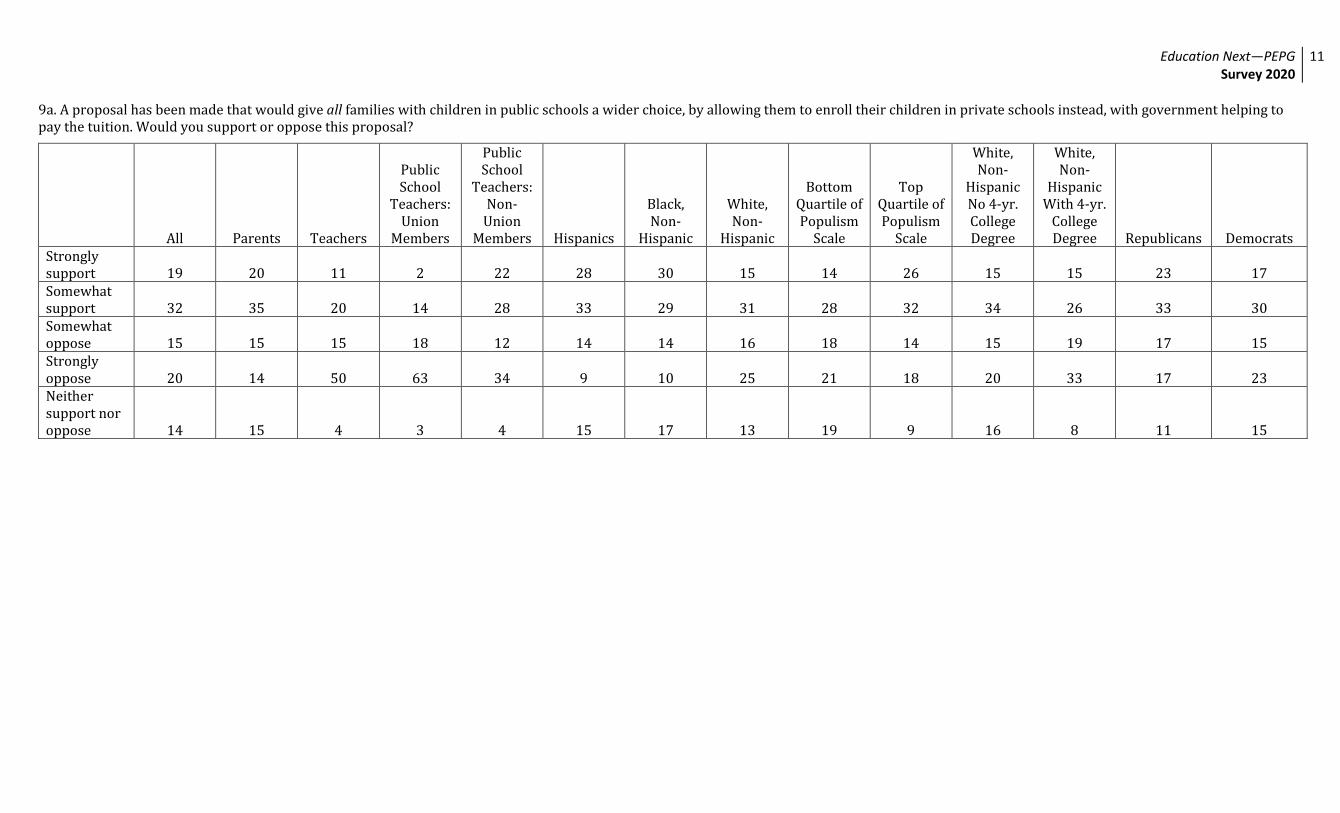
9a. A proposal has been made that would give all families with children in public schools a wider choice, by allowing them to enroll their children in private schools instead, with government helping to pay the tuition. Would you support or oppose this proposal?
All Parents Teachers
Public School
Teachers: Union
Members
Public School
Teachers: Non-
Union Members Hispanics
Black, Non-
Hispanic
White, Non-
Hispanic
Bottom Quartile of Populism
Scale
Top Quartile of Populism
Scale
White, Non-
Hispanic No 4-yr. College Degree
White, Non-
Hispanic With 4-yr.
College Degree Republicans Democrats
Strongly support 19 20 11 2 22 28 30 15 14 26 15 15 23 17 Somewhat support 32 35 20 14 28 33 29 31 28 32 34 26 33 30 Somewhat oppose 15 15 15 18 12 14 14 16 18 14 15 19 17 15 Strongly oppose 20 14 50 63 34 9 10 25 21 18 20 33 17 23 Neither support nor oppose 14 15 4 3 4 15 17 13 19 9 16 8 11 15
Education Next—PEPG Survey 2020
12
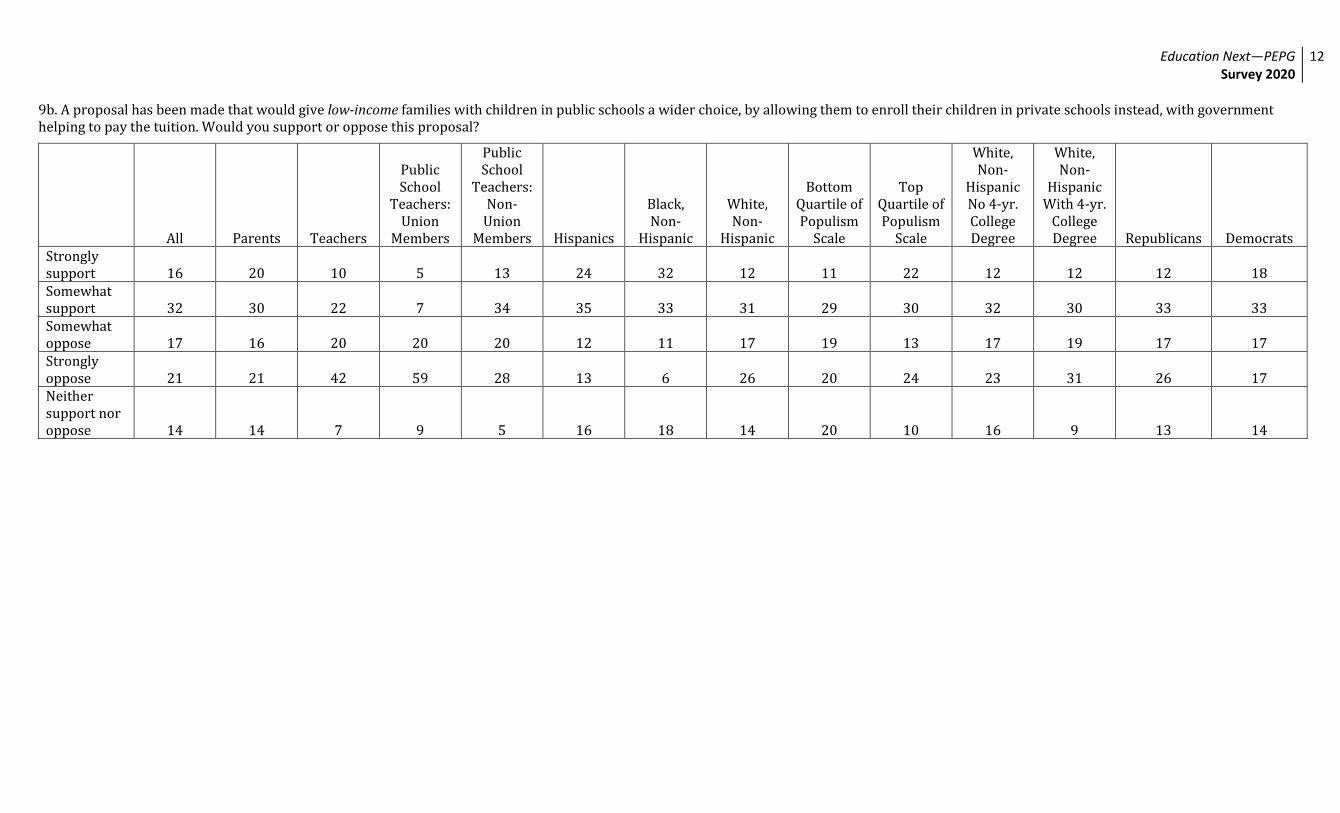
9b. A proposal has been made that would give low-income families with children in public schools a wider choice, by allowing them to enroll their children in private schools instead, with government helping to pay the tuition. Would you support or oppose this proposal?
All Parents Teachers
Public School
Teachers: Union
Members
Public School
Teachers: Non-
Union Members Hispanics
Black, Non-
Hispanic
White, Non-
Hispanic
Bottom Quartile of Populism
Scale
Top Quartile of Populism
Scale
White, Non-
Hispanic No 4-yr. College Degree
White, Non-
Hispanic With 4-yr.
College Degree Republicans Democrats
Strongly support 16 20 10 5 13 24 32 12 11 22 12 12 12 18 Somewhat support 32 30 22 7 34 35 33 31 29 30 32 30 33 33 Somewhat oppose 17 16 20 20 20 12 11 17 19 13 17 19 17 17 Strongly oppose 21 21 42 59 28 13 6 26 20 24 23 31 26 17 Neither support nor oppose 14 14 7 9 5 16 18 14 20 10 16 9 13 14
Education Next—PEPG Survey 2020
13
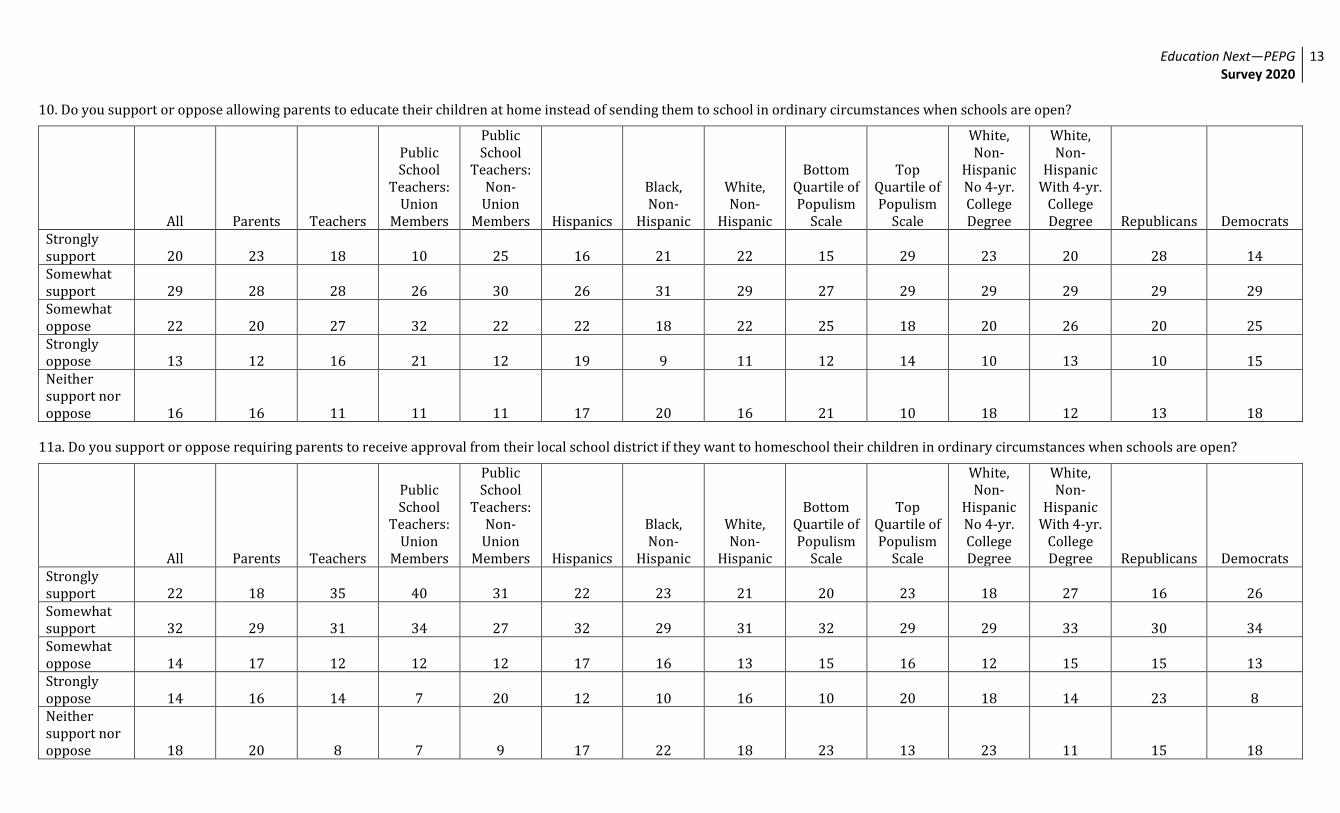
10. Do you support or oppose allowing parents to educate their children at home instead of sending them to school in ordinary circumstances when schools are open?
All Parents Teachers
Public School
Teachers: Union
Members
Public School
Teachers: Non-
Union Members Hispanics
Black, Non-
Hispanic
White, Non-
Hispanic
Bottom Quartile of Populism
Scale
Top Quartile of Populism
Scale
White, Non-
Hispanic No 4-yr. College Degree
White, Non-
Hispanic With 4-yr.
College Degree Republicans Democrats
Strongly support 20 23 18 10 25 16 21 22 15 29 23 20 28 14 Somewhat support 29 28 28 26 30 26 31 29 27 29 29 29 29 29 Somewhat oppose 22 20 27 32 22 22 18 22 25 18 20 26 20 25 Strongly oppose 13 12 16 21 12 19 9 11 12 14 10 13 10 15 Neither support nor oppose 16 16 11 11 11 17 20 16 21 10 18 12 13 18
11a. Do you support or oppose requiring parents to receive approval from their local school district if they want to homeschool their children in ordinary circumstances when schools are open?
All Parents Teachers
Public School
Teachers: Union
Members
Public School
Teachers: Non-
Union Members Hispanics
Black, Non-
Hispanic
White, Non-
Hispanic
Bottom Quartile of Populism
Scale
Top Quartile of Populism
Scale
White, Non-
Hispanic No 4-yr. College Degree
White, Non-
Hispanic With 4-yr.
College Degree Republicans Democrats
Strongly support 22 18 35 40 31 22 23 21 20 23 18 27 16 26 Somewhat support 32 29 31 34 27 32 29 31 32 29 29 33 30 34 Somewhat oppose 14 17 12 12 12 17 16 13 15 16 12 15 15 13 Strongly oppose 14 16 14 7 20 12 10 16 10 20 18 14 23 8 Neither support nor oppose 18 20 8 7 9 17 22 18 23 13 23 11 15 18
Education Next—PEPG Survey 2020
14
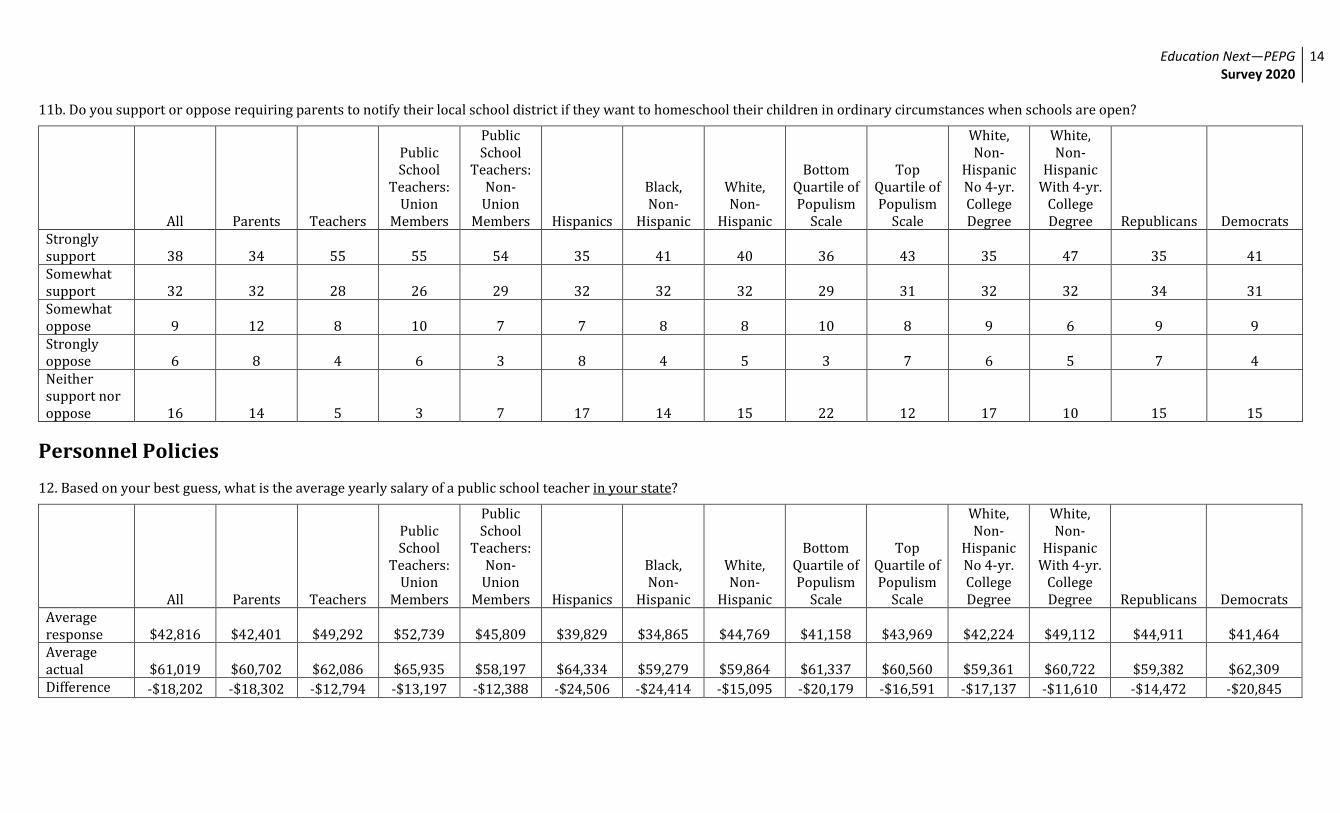
11b. Do you support or oppose requiring parents to notify their local school district if they want to homeschool their children in ordinary circumstances when schools are open?
All Parents Teachers
Public School
Teachers: Union
Members
Public School
Teachers: Non-
Union Members Hispanics
Black, Non-
Hispanic
White, Non-
Hispanic
Bottom Quartile of Populism
Scale
Top Quartile of Populism
Scale
White, Non-
Hispanic No 4-yr. College Degree
White, Non-
Hispanic With 4-yr.
College Degree Republicans Democrats
Strongly support 38 34 55 55 54 35 41 40 36 43 35 47 35 41 Somewhat support 32 32 28 26 29 32 32 32 29 31 32 32 34 31 Somewhat oppose 9 12 8 10 7 7 8 8 10 8 9 6 9 9 Strongly oppose 6 8 4 6 3 8 4 5 3 7 6 5 7 4 Neither support nor oppose 16 14 5 3 7 17 14 15 22 12 17 10 15 15
Personnel Policies 12. Based on your best guess, what is the average yearly salary of a public school teacher in your state?
All Parents Teachers
Public School
Teachers: Union
Members
Public School
Teachers: Non-
Union Members Hispanics
Black, Non-
Hispanic
White, Non-
Hispanic
Bottom Quartile of Populism
Scale
Top Quartile of Populism
Scale
White, Non-
Hispanic No 4-yr. College Degree
White, Non-
Hispanic With 4-yr.
College Degree Republicans Democrats
Average response $42,816 $42,401 $49,292 $52,739 $45,809 $39,829 $34,865 $44,769 $41,158 $43,969 $42,224 $49,112 $44,911 $41,464 Average actual $61,019 $60,702 $62,086 $65,935 $58,197 $64,334 $59,279 $59,864 $61,337 $60,560 $59,361 $60,722 $59,382 $62,309 Difference -$18,202 -$18,302 -$12,794 -$13,197 -$12,388 -$24,506 -$24,414 -$15,095 -$20,179 -$16,591 -$17,137 -$11,610 -$14,472 -$20,845
Education Next—PEPG Survey 2020
15
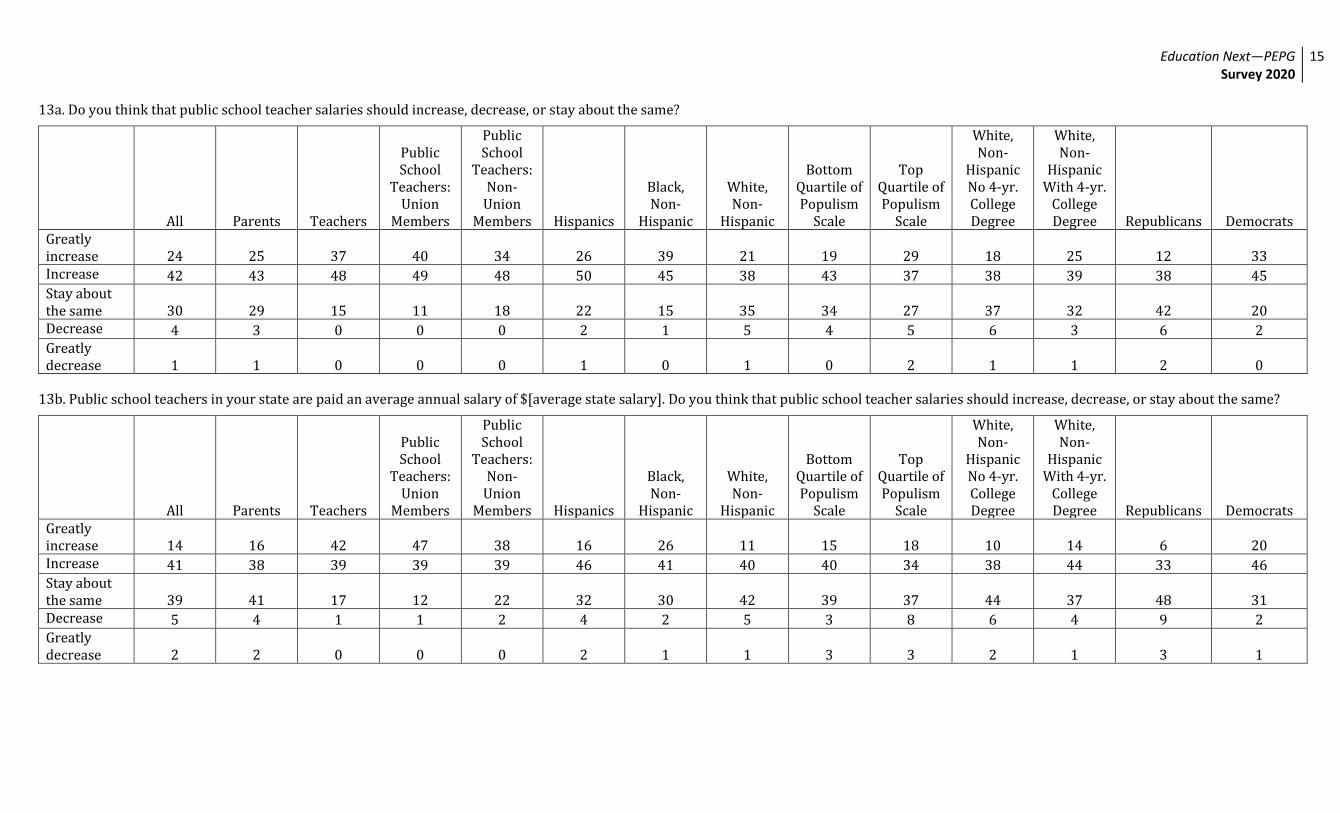
13a. Do you think that public school teacher salaries should increase, decrease, or stay about the same?
All Parents Teachers
Public School
Teachers: Union
Members
Public School
Teachers: Non-
Union Members Hispanics
Black, Non-
Hispanic
White, Non-
Hispanic
Bottom Quartile of Populism
Scale
Top Quartile of Populism
Scale
White, Non-
Hispanic No 4-yr. College Degree
White, Non-
Hispanic With 4-yr.
College Degree Republicans Democrats
Greatly increase 24 25 37 40 34 26 39 21 19 29 18 25 12 33 Increase 42 43 48 49 48 50 45 38 43 37 38 39 38 45 Stay about the same 30 29 15 11 18 22 15 35 34 27 37 32 42 20 Decrease 4 3 0 0 0 2 1 5 4 5 6 3 6 2 Greatly decrease 1 1 0 0 0 1 0 1 0 2 1 1 2 0
13b. Public school teachers in your state are paid an average annual salary of $[average state salary]. Do you think that public school teacher salaries should increase, decrease, or stay about the same?
All Parents Teachers
Public School
Teachers: Union
Members
Public School
Teachers: Non-
Union Members Hispanics
Black, Non-
Hispanic
White, Non-
Hispanic
Bottom Quartile of Populism
Scale
Top Quartile of Populism
Scale
White, Non-
Hispanic No 4-yr. College Degree
White, Non-
Hispanic With 4-yr.
College Degree Republicans Democrats
Greatly increase 14 16 42 47 38 16 26 11 15 18 10 14 6 20 Increase 41 38 39 39 39 46 41 40 40 34 38 44 33 46 Stay about the same 39 41 17 12 22 32 30 42 39 37 44 37 48 31 Decrease 5 4 1 1 2 4 2 5 3 8 6 4 9 2 Greatly decrease 2 2 0 0 0 2 1 1 3 3 2 1 3 1
Education Next—PEPG Survey 2020
16
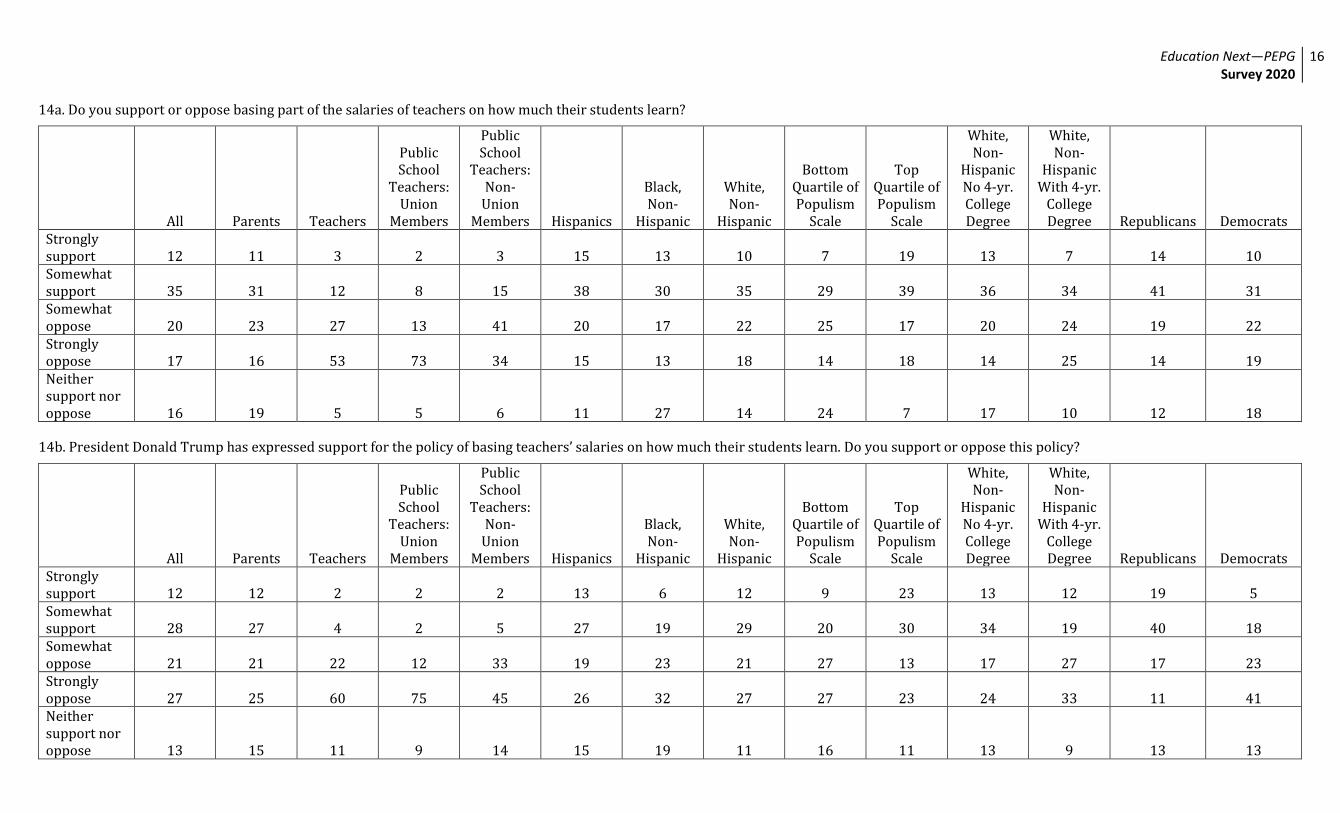
14a. Do you support or oppose basing part of the salaries of teachers on how much their students learn?
All Parents Teachers
Public School
Teachers: Union
Members
Public School
Teachers: Non-
Union Members Hispanics
Black, Non-
Hispanic
White, Non-
Hispanic
Bottom Quartile of Populism
Scale
Top Quartile of Populism
Scale
White, Non-
Hispanic No 4-yr. College Degree
White, Non-
Hispanic With 4-yr.
College Degree Republicans Democrats
Strongly support 12 11 3 2 3 15 13 10 7 19 13 7 14 10 Somewhat support 35 31 12 8 15 38 30 35 29 39 36 34 41 31 Somewhat oppose 20 23 27 13 41 20 17 22 25 17 20 24 19 22 Strongly oppose 17 16 53 73 34 15 13 18 14 18 14 25 14 19 Neither support nor oppose 16 19 5 5 6 11 27 14 24 7 17 10 12 18
14b. President Donald Trump has expressed support for the policy of basing teachers’ salaries on how much their students learn. Do you support or oppose this policy?
All Parents Teachers
Public School
Teachers: Union
Members
Public School
Teachers: Non-
Union Members Hispanics
Black, Non-
Hispanic
White, Non-
Hispanic
Bottom Quartile of Populism
Scale
Top Quartile of Populism
Scale
White, Non-
Hispanic No 4-yr. College Degree
White, Non-
Hispanic With 4-yr.
College Degree Republicans Democrats
Strongly support 12 12 2 2 2 13 6 12 9 23 13 12 19 5 Somewhat support 28 27 4 2 5 27 19 29 20 30 34 19 40 18 Somewhat oppose 21 21 22 12 33 19 23 21 27 13 17 27 17 23 Strongly oppose 27 25 60 75 45 26 32 27 27 23 24 33 11 41 Neither support nor oppose 13 15 11 9 14 15 19 11 16 11 13 9 13 13
Education Next—PEPG Survey 2020
17
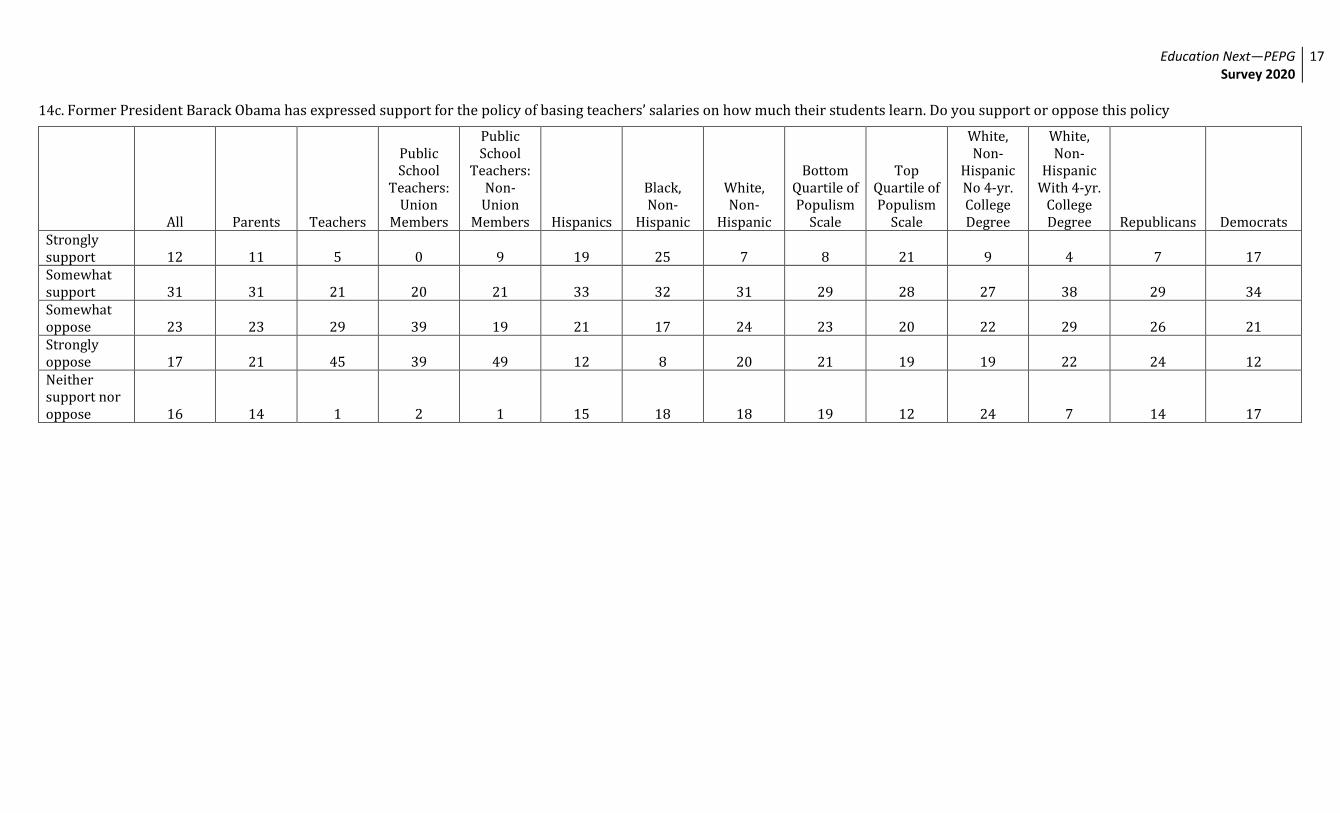
14c. Former President Barack Obama has expressed support for the policy of basing teachers’ salaries on how much their students learn. Do you support or oppose this policy
All Parents Teachers
Public School
Teachers: Union
Members
Public School
Teachers: Non-
Union Members Hispanics
Black, Non-
Hispanic
White, Non-
Hispanic
Bottom Quartile of Populism
Scale
Top Quartile of Populism
Scale
White, Non-
Hispanic No 4-yr. College Degree
White, Non-
Hispanic With 4-yr.
College Degree Republicans Democrats
Strongly support 12 11 5 0 9 19 25 7 8 21 9 4 7 17 Somewhat support 31 31 21 20 21 33 32 31 29 28 27 38 29 34 Somewhat oppose 23 23 29 39 19 21 17 24 23 20 22 29 26 21 Strongly oppose 17 21 45 39 49 12 8 20 21 19 19 22 24 12 Neither support nor oppose 16 14 1 2 1 15 18 18 19 12 24 7 14 17
Education Next—PEPG Survey 2020
18
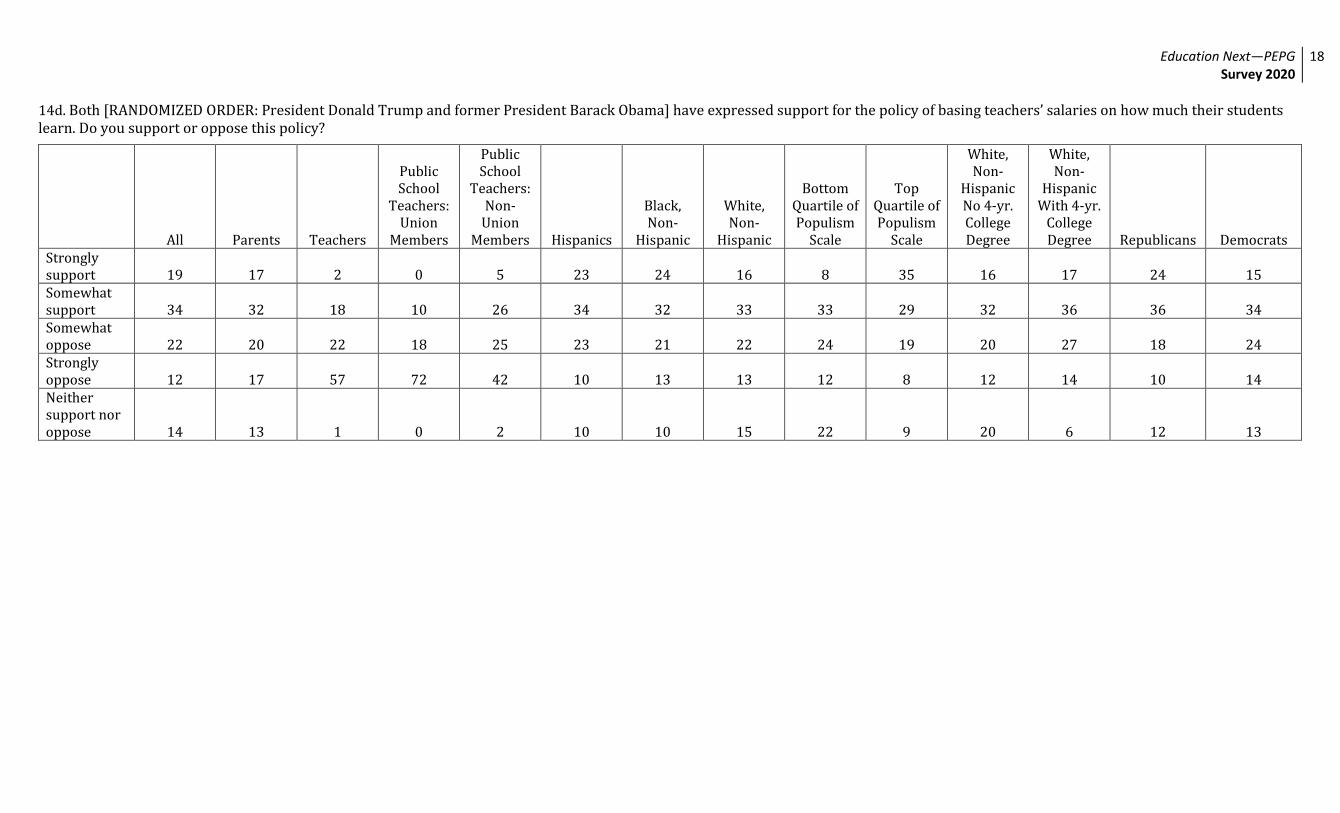
14d. Both [RANDOMIZED ORDER: President Donald Trump and former President Barack Obama] have expressed support for the policy of basing teachers’ salaries on how much their students learn. Do you support or oppose this policy?
All Parents Teachers
Public School
Teachers: Union
Members
Public School
Teachers: Non-
Union Members Hispanics
Black, Non-
Hispanic
White, Non-
Hispanic
Bottom Quartile of Populism
Scale
Top Quartile of Populism
Scale
White, Non-
Hispanic No 4-yr. College Degree
White, Non-
Hispanic With 4-yr.
College Degree Republicans Democrats
Strongly support 19 17 2 0 5 23 24 16 8 35 16 17 24 15 Somewhat support 34 32 18 10 26 34 32 33 33 29 32 36 36 34 Somewhat oppose 22 20 22 18 25 23 21 22 24 19 20 27 18 24 Strongly oppose 12 17 57 72 42 10 13 13 12 8 12 14 10 14 Neither support nor oppose 14 13 1 0 2 10 10 15 22 9 20 6 12 13
Education Next—PEPG Survey 2020
19
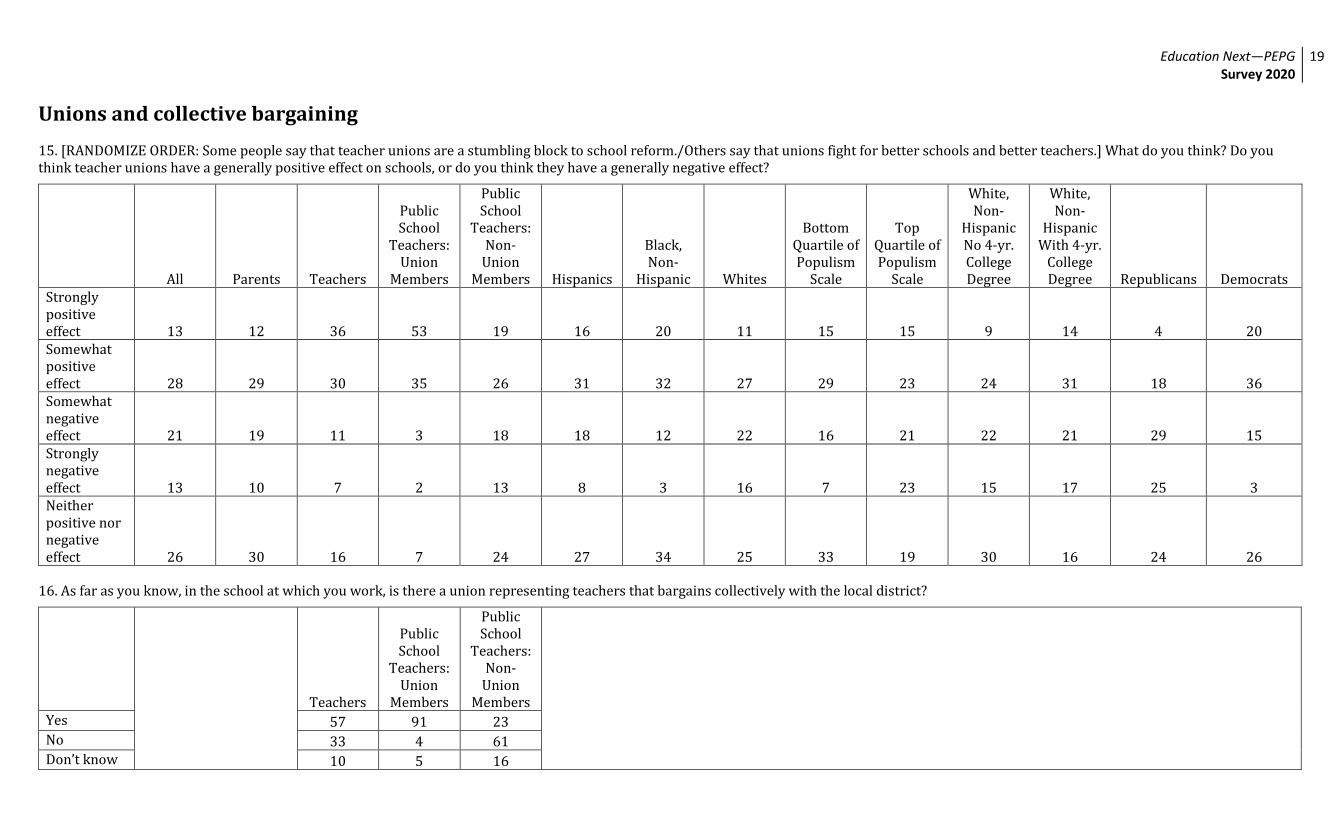
Unions and collective bargaining 15. [RANDOMIZE ORDER: Some people say that teacher unions are a stumbling block to school reform./Others say that unions fight for better schools and better teachers.] What do you think? Do you think teacher unions have a generally positive effect on schools, or do you think they have a generally negative effect?
All Parents Teachers
Public School
Teachers: Union
Members
Public School
Teachers: Non-
Union Members Hispanics
Black, Non-
Hispanic Whites
Bottom Quartile of Populism
Scale
Top Quartile of Populism
Scale
White, Non-
Hispanic No 4-yr. College Degree
White, Non-
Hispanic With 4-yr.
College Degree Republicans Democrats
Strongly positive effect 13 12 36 53 19 16 20 11 15 15 9 14 4 20 Somewhat positive effect 28 29 30 35 26 31 32 27 29 23 24 31 18 36 Somewhat negative effect 21 19 11 3 18 18 12 22 16 21 22 21 29 15 Strongly negative effect 13 10 7 2 13 8 3 16 7 23 15 17 25 3 Neither positive nor negative effect 26 30 16 7 24 27 34 25 33 19 30 16 24 26
16. As far as you know, in the school at which you work, is there a union representing teachers that bargains collectively with the local district?
Teachers
Public School
Teachers: Union
Members
Public School
Teachers: Non-
Union Members
Yes 57 91 23 No 33 4 61 Don’t know 10 5 16
Education Next—PEPG Survey 2020
20
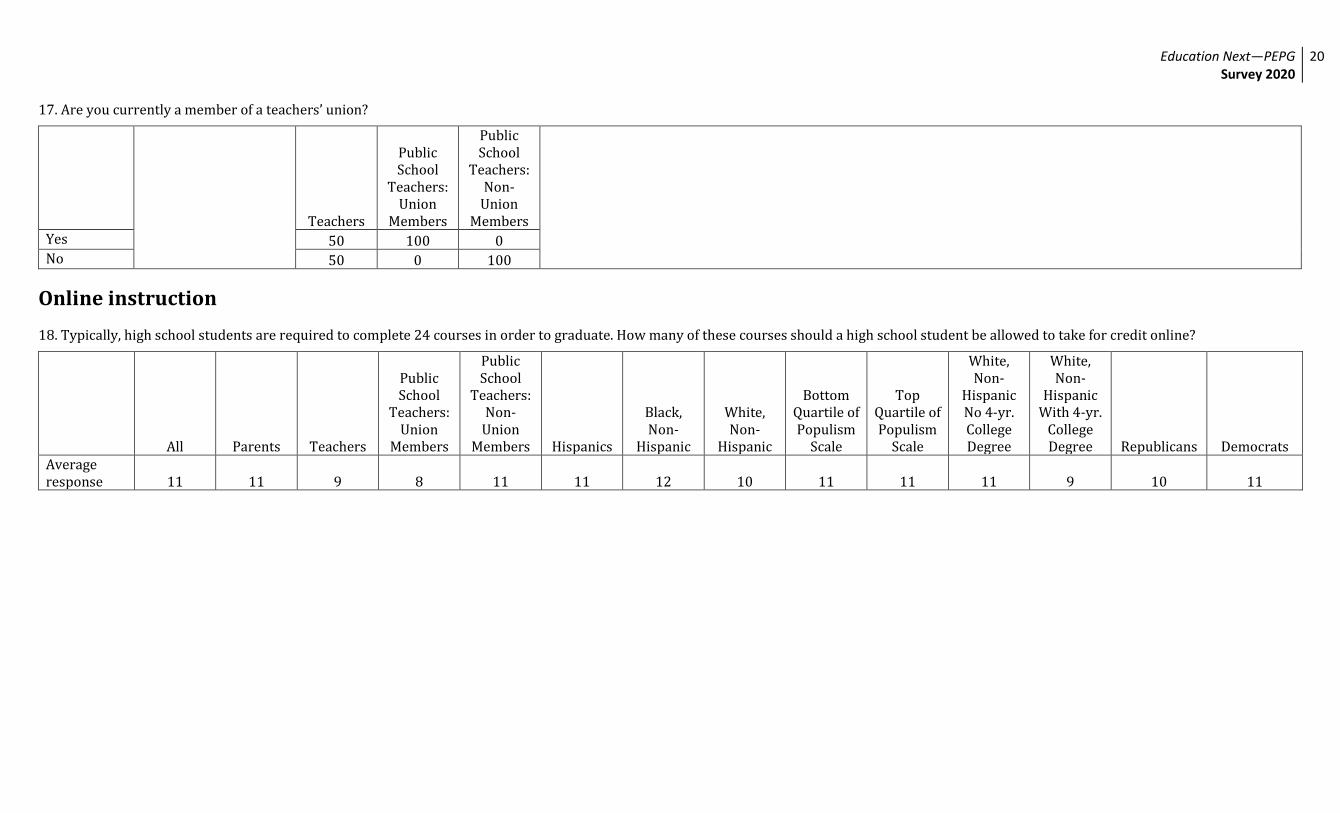
17. Are you currently a member of a teachers’ union?
Teachers
Public School
Teachers: Union
Members
Public School
Teachers: Non-
Union Members
Yes 50 100 0 No 50 0 100
Online instruction 18. Typically, high school students are required to complete 24 courses in order to graduate. How many of these courses should a high school student be allowed to take for credit online?
All Parents Teachers
Public School
Teachers: Union
Members
Public School
Teachers: Non-
Union Members Hispanics
Black, Non-
Hispanic
White, Non-
Hispanic
Bottom Quartile of Populism
Scale
Top Quartile of Populism
Scale
White, Non-
Hispanic No 4-yr. College Degree
White, Non-
Hispanic With 4-yr.
College Degree Republicans Democrats
Average response 11 11 9 8 11 11 12 10 11 11 11 9 10 11
Education Next—PEPG Survey 2020
21
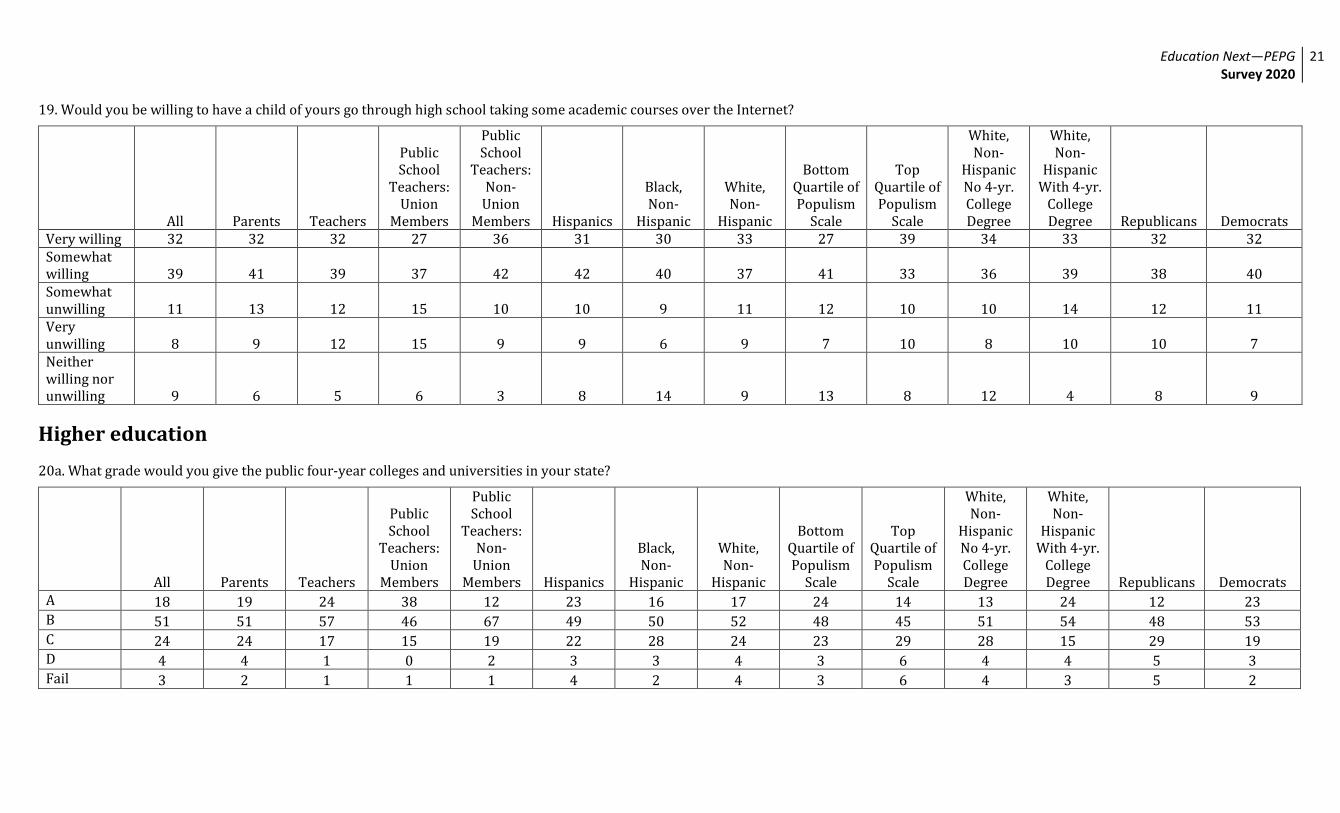
19. Would you be willing to have a child of yours go through high school taking some academic courses over the Internet?
All Parents Teachers
Public School
Teachers: Union
Members
Public School
Teachers: Non-
Union Members Hispanics
Black, Non-
Hispanic
White, Non-
Hispanic
Bottom Quartile of Populism
Scale
Top Quartile of Populism
Scale
White, Non-
Hispanic No 4-yr. College Degree
White, Non-
Hispanic With 4-yr.
College Degree Republicans Democrats
Very willing 32 32 32 27 36 31 30 33 27 39 34 33 32 32 Somewhat willing 39 41 39 37 42 42 40 37 41 33 36 39 38 40 Somewhat unwilling 11 13 12 15 10 10 9 11 12 10 10 14 12 11 Very unwilling 8 9 12 15 9 9 6 9 7 10 8 10 10 7 Neither willing nor unwilling 9 6 5 6 3 8 14 9 13 8 12 4 8 9
Higher education 20a. What grade would you give the public four-year colleges and universities in your state?
All Parents Teachers
Public School
Teachers: Union
Members
Public School
Teachers: Non-
Union Members Hispanics
Black, Non-
Hispanic
White, Non-
Hispanic
Bottom Quartile of Populism
Scale
Top Quartile of Populism
Scale
White, Non-
Hispanic No 4-yr. College Degree
White, Non-
Hispanic With 4-yr.
College Degree Republicans Democrats
A 18 19 24 38 12 23 16 17 24 14 13 24 12 23 B 51 51 57 46 67 49 50 52 48 45 51 54 48 53 C 24 24 17 15 19 22 28 24 23 29 28 15 29 19 D 4 4 1 0 2 3 3 4 3 6 4 4 5 3 Fail 3 2 1 1 1 4 2 4 3 6 4 3 5 2
Education Next—PEPG Survey 2020
22
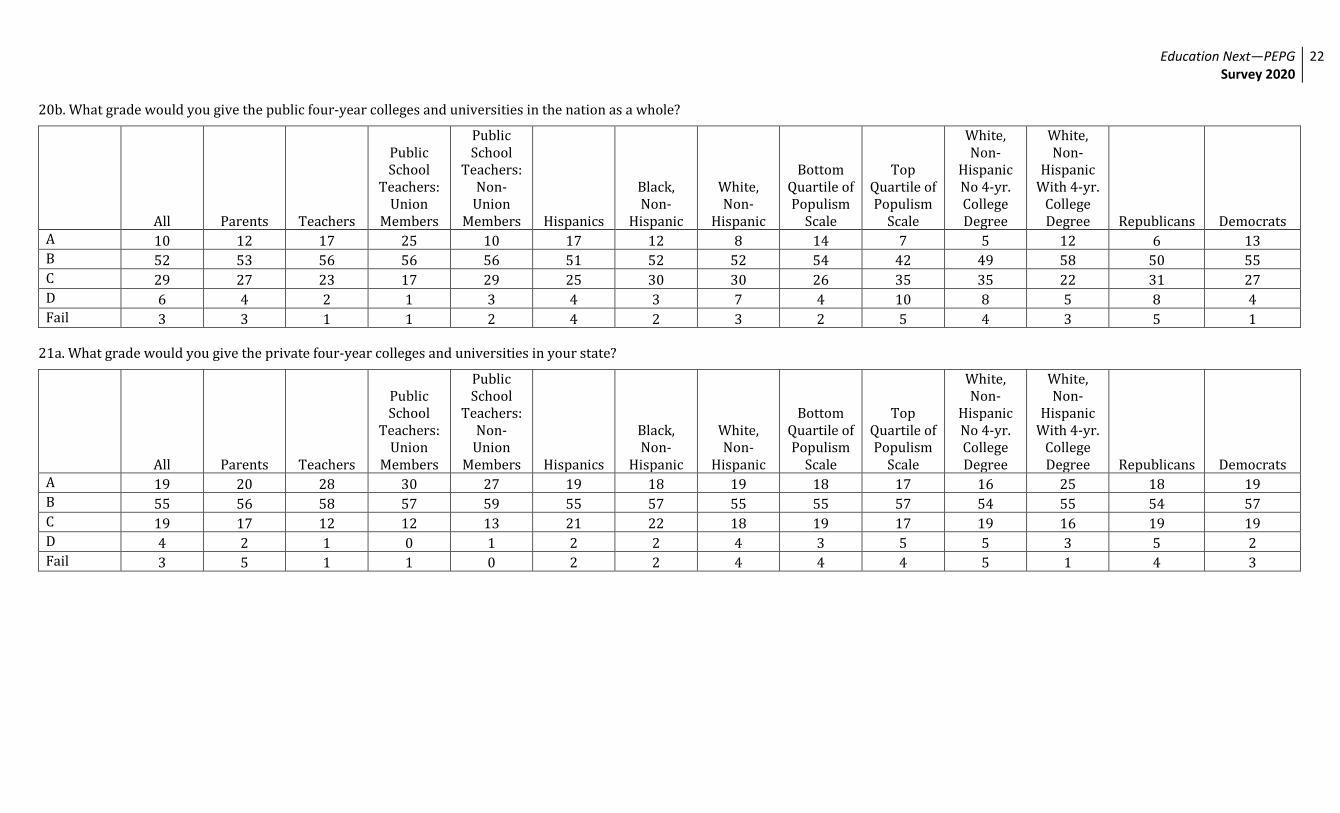
20b. What grade would you give the public four-year colleges and universities in the nation as a whole?
All Parents Teachers
Public School
Teachers: Union
Members
Public School
Teachers: Non-
Union Members Hispanics
Black, Non-
Hispanic
White, Non-
Hispanic
Bottom Quartile of Populism
Scale
Top Quartile of Populism
Scale
White, Non-
Hispanic No 4-yr. College Degree
White, Non-
Hispanic With 4-yr.
College Degree Republicans Democrats
A 10 12 17 25 10 17 12 8 14 7 5 12 6 13 B 52 53 56 56 56 51 52 52 54 42 49 58 50 55 C 29 27 23 17 29 25 30 30 26 35 35 22 31 27 D 6 4 2 1 3 4 3 7 4 10 8 5 8 4 Fail 3 3 1 1 2 4 2 3 2 5 4 3 5 1
21a. What grade would you give the private four-year colleges and universities in your state?
All Parents Teachers
Public School
Teachers: Union
Members
Public School
Teachers: Non-
Union Members Hispanics
Black, Non-
Hispanic
White, Non-
Hispanic
Bottom Quartile of Populism
Scale
Top Quartile of Populism
Scale
White, Non-
Hispanic No 4-yr. College Degree
White, Non-
Hispanic With 4-yr.
College Degree Republicans Democrats
A 19 20 28 30 27 19 18 19 18 17 16 25 18 19 B 55 56 58 57 59 55 57 55 55 57 54 55 54 57 C 19 17 12 12 13 21 22 18 19 17 19 16 19 19 D 4 2 1 0 1 2 2 4 3 5 5 3 5 2 Fail 3 5 1 1 0 2 2 4 4 4 5 1 4 3
Education Next—PEPG Survey 2020
23
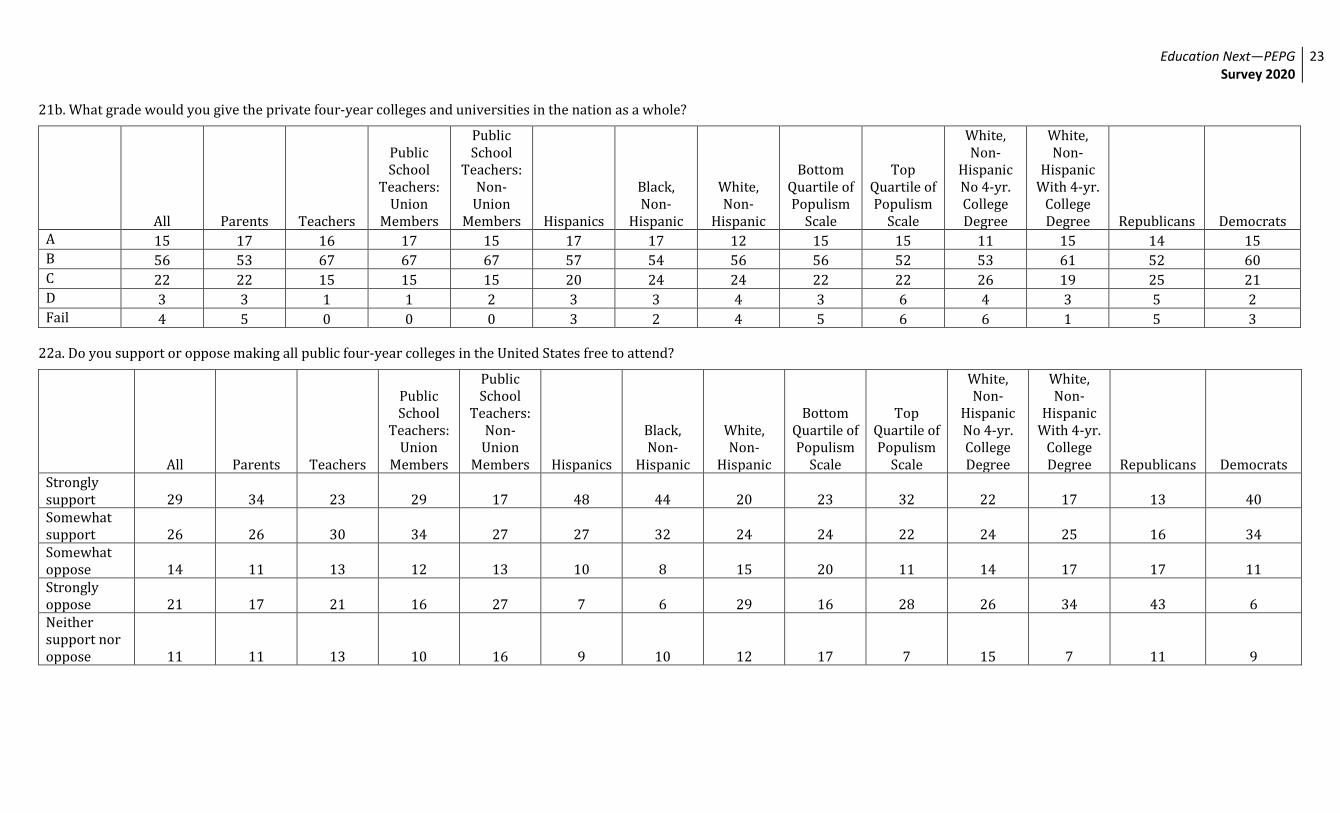
21b. What grade would you give the private four-year colleges and universities in the nation as a whole?
All Parents Teachers
Public School
Teachers: Union
Members
Public School
Teachers: Non-
Union Members Hispanics
Black, Non-
Hispanic
White, Non-
Hispanic
Bottom Quartile of Populism
Scale
Top Quartile of Populism
Scale
White, Non-
Hispanic No 4-yr. College Degree
White, Non-
Hispanic With 4-yr.
College Degree Republicans Democrats
A 15 17 16 17 15 17 17 12 15 15 11 15 14 15 B 56 53 67 67 67 57 54 56 56 52 53 61 52 60 C 22 22 15 15 15 20 24 24 22 22 26 19 25 21 D 3 3 1 1 2 3 3 4 3 6 4 3 5 2 Fail 4 5 0 0 0 3 2 4 5 6 6 1 5 3
22a. Do you support or oppose making all public four-year colleges in the United States free to attend?
All Parents Teachers
Public School
Teachers: Union
Members
Public School
Teachers: Non-
Union Members Hispanics
Black, Non-
Hispanic
White, Non-
Hispanic
Bottom Quartile of Populism
Scale
Top Quartile of Populism
Scale
White, Non-
Hispanic No 4-yr. College Degree
White, Non-
Hispanic With 4-yr.
College Degree Republicans Democrats
Strongly support 29 34 23 29 17 48 44 20 23 32 22 17 13 40 Somewhat support 26 26 30 34 27 27 32 24 24 22 24 25 16 34 Somewhat oppose 14 11 13 12 13 10 8 15 20 11 14 17 17 11 Strongly oppose 21 17 21 16 27 7 6 29 16 28 26 34 43 6 Neither support nor oppose 11 11 13 10 16 9 10 12 17 7 15 7 11 9

Education Next—PEPG Survey 2020
24
22b. According to the most recent information, about 50% of students attending public four-year colleges are from households with incomes above the national average. Do you support or oppose making all public four-year colleges in the United States free to attend?
All Parents Teachers
Public School
Teachers: Union
Members
Public School
Teachers: Non-
Union Members Hispanics
Black, Non-
Hispanic
White, Non-
Hispanic
Bottom Quartile of Populism
Scale
Top Quartile of Populism
Scale
White, Non-
Hispanic No 4-yr. College Degree
White, Non-
Hispanic With 4-yr.
College Degree Republicans Democrats
Strongly support 29 31 29 34 24 51 47 20 23 33 22 18 12 42 Somewhat support 28 28 32 35 30 29 23 28 32 18 26 30 21 32 Somewhat oppose 13 14 16 18 14 5 9 15 12 16 13 18 17 10 Strongly oppose 21 19 19 10 27 6 4 27 14 29 26 31 42 4 Neither support nor oppose 10 8 4 3 6 9 17 10 19 4 13 4 8 11
Education Next—PEPG Survey 2020
25
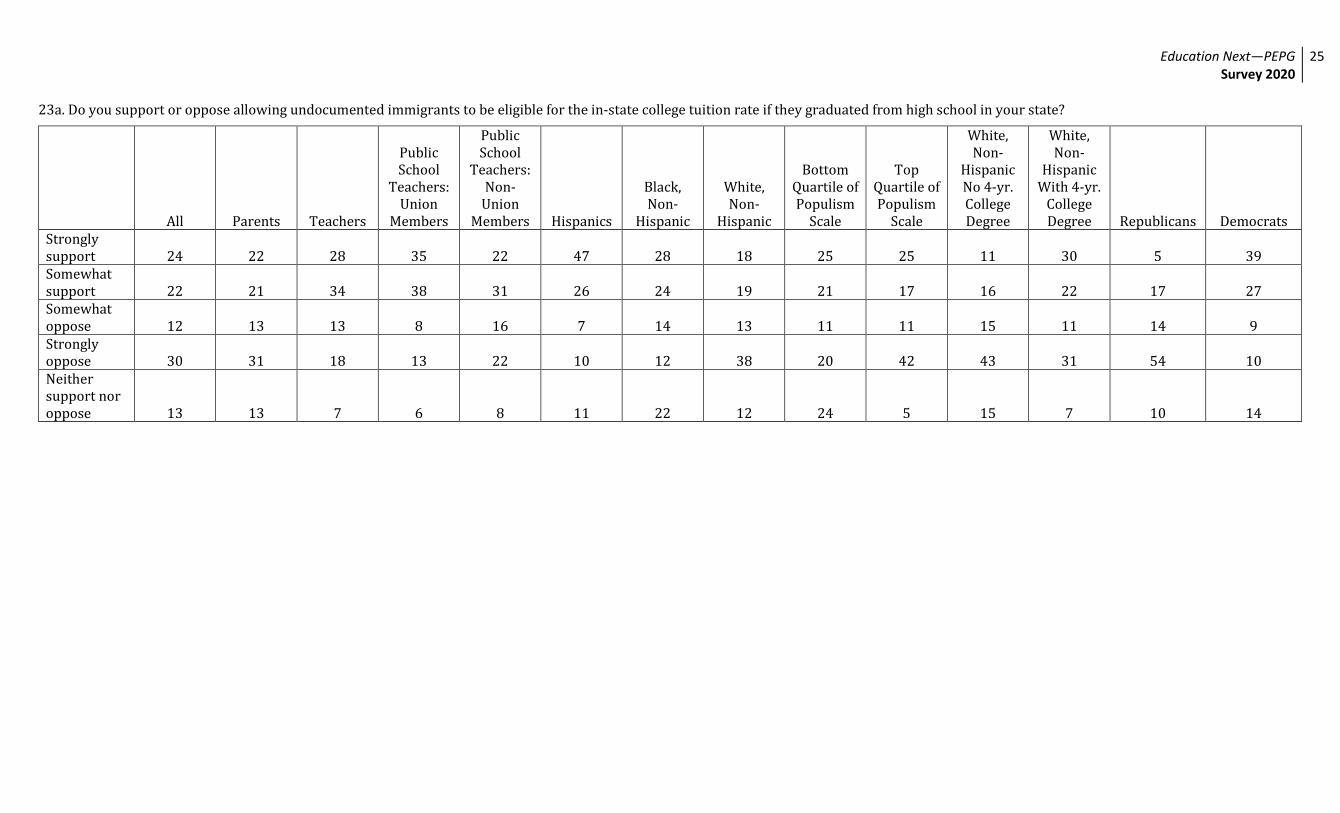
23a. Do you support or oppose allowing undocumented immigrants to be eligible for the in-state college tuition rate if they graduated from high school in your state?
All Parents Teachers
Public School
Teachers: Union
Members
Public School
Teachers: Non-
Union Members Hispanics
Black, Non-
Hispanic
White, Non-
Hispanic
Bottom Quartile of Populism
Scale
Top Quartile of Populism
Scale
White, Non-
Hispanic No 4-yr. College Degree
White, Non-
Hispanic With 4-yr.
College Degree Republicans Democrats
Strongly support 24 22 28 35 22 47 28 18 25 25 11 30 5 39 Somewhat support 22 21 34 38 31 26 24 19 21 17 16 22 17 27 Somewhat oppose 12 13 13 8 16 7 14 13 11 11 15 11 14 9 Strongly oppose 30 31 18 13 22 10 12 38 20 42 43 31 54 10 Neither support nor oppose 13 13 7 6 8 11 22 12 24 5 15 7 10 14
Education Next—PEPG Survey 2020
26
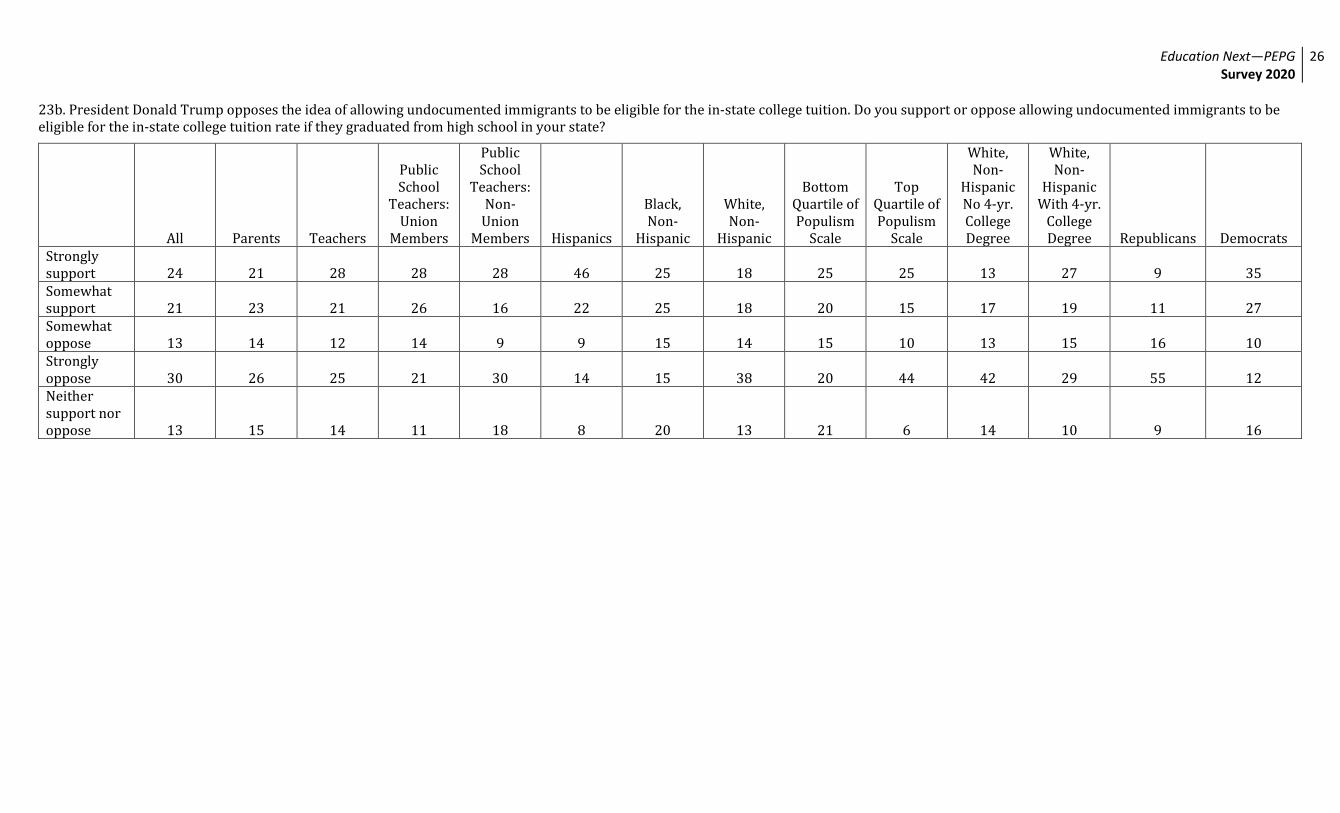
23b. President Donald Trump opposes the idea of allowing undocumented immigrants to be eligible for the in-state college tuition. Do you support or oppose allowing undocumented immigrants to be eligible for the in-state college tuition rate if they graduated from high school in your state?
All Parents Teachers
Public School
Teachers: Union
Members
Public School
Teachers: Non-
Union Members Hispanics
Black, Non-
Hispanic
White, Non-
Hispanic
Bottom Quartile of Populism
Scale
Top Quartile of Populism
Scale
White, Non-
Hispanic No 4-yr. College Degree
White, Non-
Hispanic With 4-yr.
College Degree Republicans Democrats
Strongly support 24 21 28 28 28 46 25 18 25 25 13 27 9 35 Somewhat support 21 23 21 26 16 22 25 18 20 15 17 19 11 27 Somewhat oppose 13 14 12 14 9 9 15 14 15 10 13 15 16 10 Strongly oppose 30 26 25 21 30 14 15 38 20 44 42 29 55 12 Neither support nor oppose 13 15 14 11 18 8 20 13 21 6 14 10 9 16
Education Next—PEPG Survey 2020
27
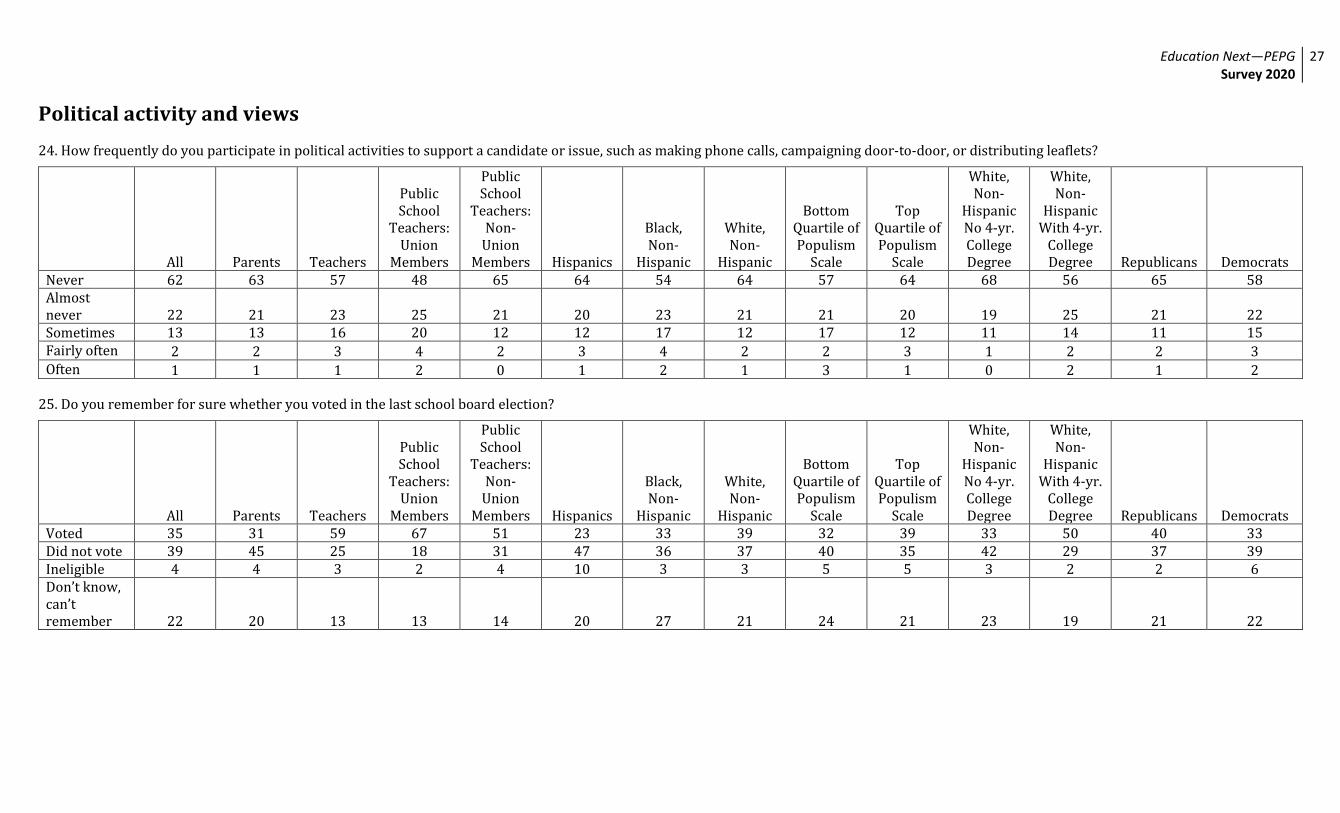
Political activity and views 24. How frequently do you participate in political activities to support a candidate or issue, such as making phone calls, campaigning door-to-door, or distributing leaflets?
All Parents Teachers
Public School
Teachers: Union
Members
Public School
Teachers: Non-
Union Members Hispanics
Black, Non-
Hispanic
White, Non-
Hispanic
Bottom Quartile of Populism
Scale
Top Quartile of Populism
Scale
White, Non-
Hispanic No 4-yr. College Degree
White, Non-
Hispanic With 4-yr.
College Degree Republicans Democrats
Never 62 63 57 48 65 64 54 64 57 64 68 56 65 58 Almost never 22 21 23 25 21 20 23 21 21 20 19 25 21 22 Sometimes 13 13 16 20 12 12 17 12 17 12 11 14 11 15 Fairly often 2 2 3 4 2 3 4 2 2 3 1 2 2 3 Often 1 1 1 2 0 1 2 1 3 1 0 2 1 2
25. Do you remember for sure whether you voted in the last school board election?
All Parents Teachers
Public School
Teachers: Union
Members
Public School
Teachers: Non-
Union Members Hispanics
Black, Non-
Hispanic
White, Non-
Hispanic
Bottom Quartile of Populism
Scale
Top Quartile of Populism
Scale
White, Non-
Hispanic No 4-yr. College Degree
White, Non-
Hispanic With 4-yr.
College Degree Republicans Democrats
Voted 35 31 59 67 51 23 33 39 32 39 33 50 40 33 Did not vote 39 45 25 18 31 47 36 37 40 35 42 29 37 39 Ineligible 4 4 3 2 4 10 3 3 5 5 3 2 2 6 Don’t know, can’t remember 22 20 13 13 14 20 27 21 24 21 23 19 21 22
Education Next—PEPG Survey 2020
28
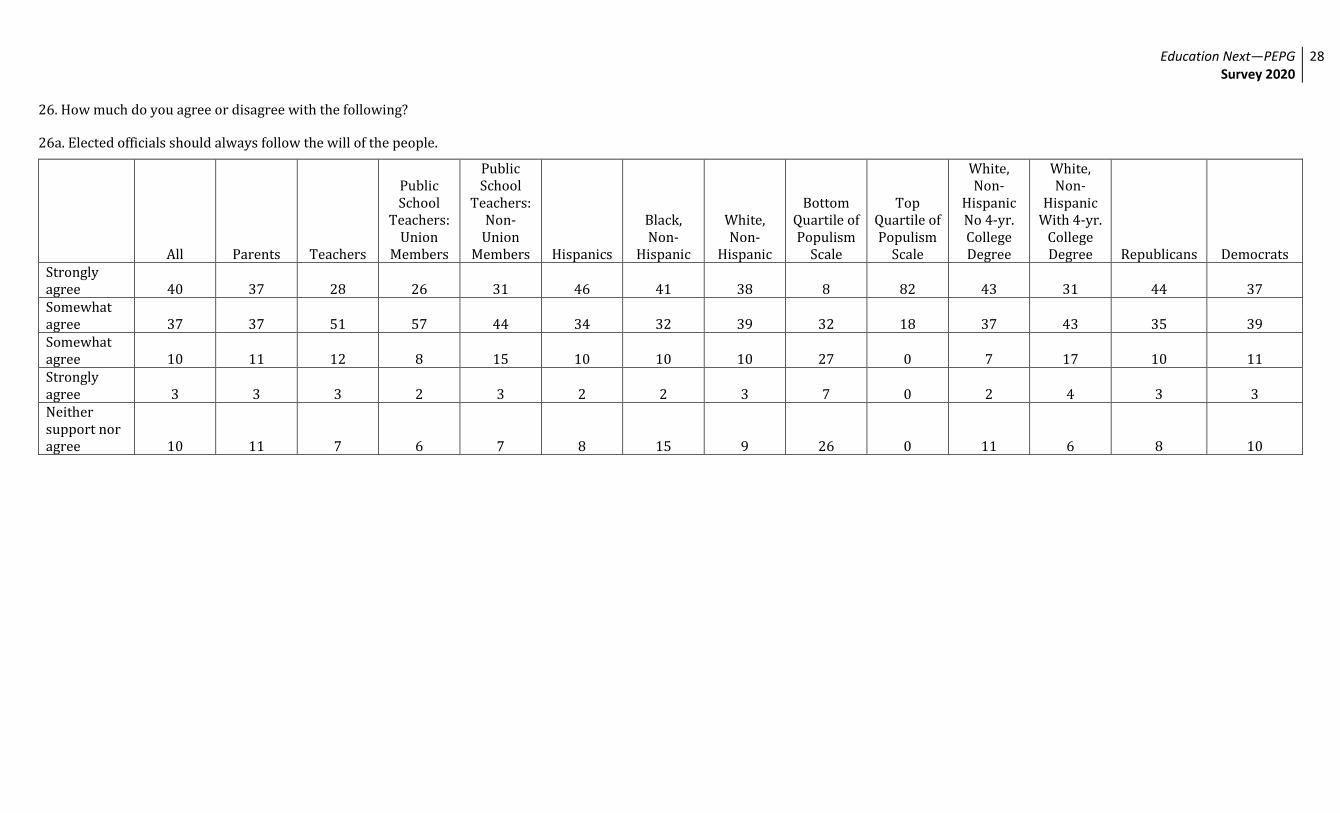
26. How much do you agree or disagree with the following?
26a. Elected officials should always follow the will of the people.
All Parents Teachers
Public School
Teachers: Union
Members
Public School
Teachers: Non-
Union Members Hispanics
Black, Non-
Hispanic
White, Non-
Hispanic
Bottom Quartile of Populism
Scale
Top Quartile of Populism
Scale
White, Non-
Hispanic No 4-yr. College Degree
White, Non-
Hispanic With 4-yr.
College Degree Republicans Democrats
Strongly agree 40 37 28 26 31 46 41 38 8 82 43 31 44 37 Somewhat agree 37 37 51 57 44 34 32 39 32 18 37 43 35 39 Somewhat agree 10 11 12 8 15 10 10 10 27 0 7 17 10 11 Strongly agree 3 3 3 2 3 2 2 3 7 0 2 4 3 3 Neither support nor agree 10 11 7 6 7 8 15 9 26 0 11 6 8 10
Education Next—PEPG Survey 2020
29
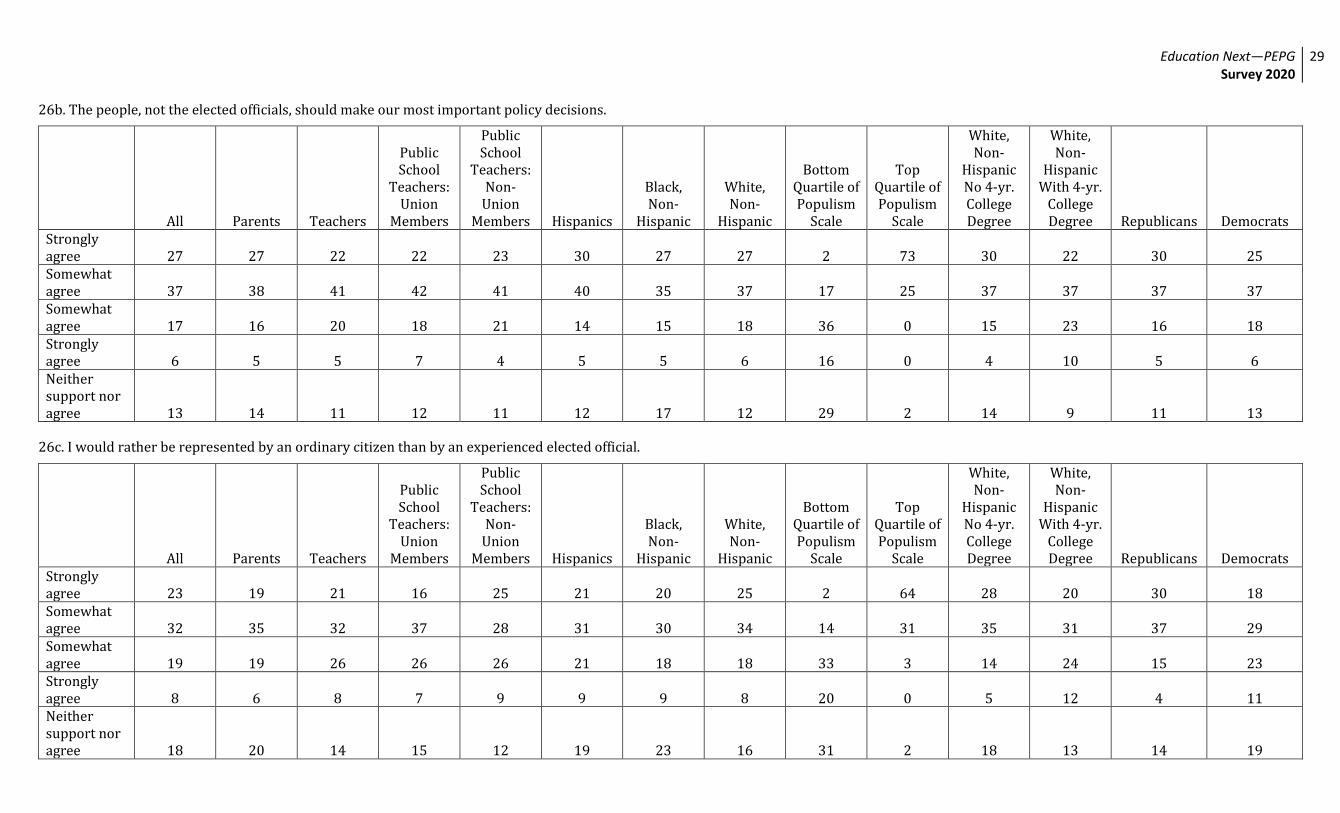
26b. The people, not the elected officials, should make our most important policy decisions.
All Parents Teachers
Public School
Teachers: Union
Members
Public School
Teachers: Non-
Union Members Hispanics
Black, Non-
Hispanic
White, Non-
Hispanic
Bottom Quartile of Populism
Scale
Top Quartile of Populism
Scale
White, Non-
Hispanic No 4-yr. College Degree
White, Non-
Hispanic With 4-yr.
College Degree Republicans Democrats
Strongly agree 27 27 22 22 23 30 27 27 2 73 30 22 30 25 Somewhat agree 37 38 41 42 41 40 35 37 17 25 37 37 37 37 Somewhat agree 17 16 20 18 21 14 15 18 36 0 15 23 16 18 Strongly agree 6 5 5 7 4 5 5 6 16 0 4 10 5 6 Neither support nor agree 13 14 11 12 11 12 17 12 29 2 14 9 11 13
26c. I would rather be represented by an ordinary citizen than by an experienced elected official.
All Parents Teachers
Public School
Teachers: Union
Members
Public School
Teachers: Non-
Union Members Hispanics
Black, Non-
Hispanic
White, Non-
Hispanic
Bottom Quartile of Populism
Scale
Top Quartile of Populism
Scale
White, Non-
Hispanic No 4-yr. College Degree
White, Non-
Hispanic With 4-yr.
College Degree Republicans Democrats
Strongly agree 23 19 21 16 25 21 20 25 2 64 28 20 30 18 Somewhat agree 32 35 32 37 28 31 30 34 14 31 35 31 37 29 Somewhat agree 19 19 26 26 26 21 18 18 33 3 14 24 15 23 Strongly agree 8 6 8 7 9 9 9 8 20 0 5 12 4 11 Neither support nor agree 18 20 14 15 12 19 23 16 31 2 18 13 14 19
Education Next—PEPG Survey 2020
30
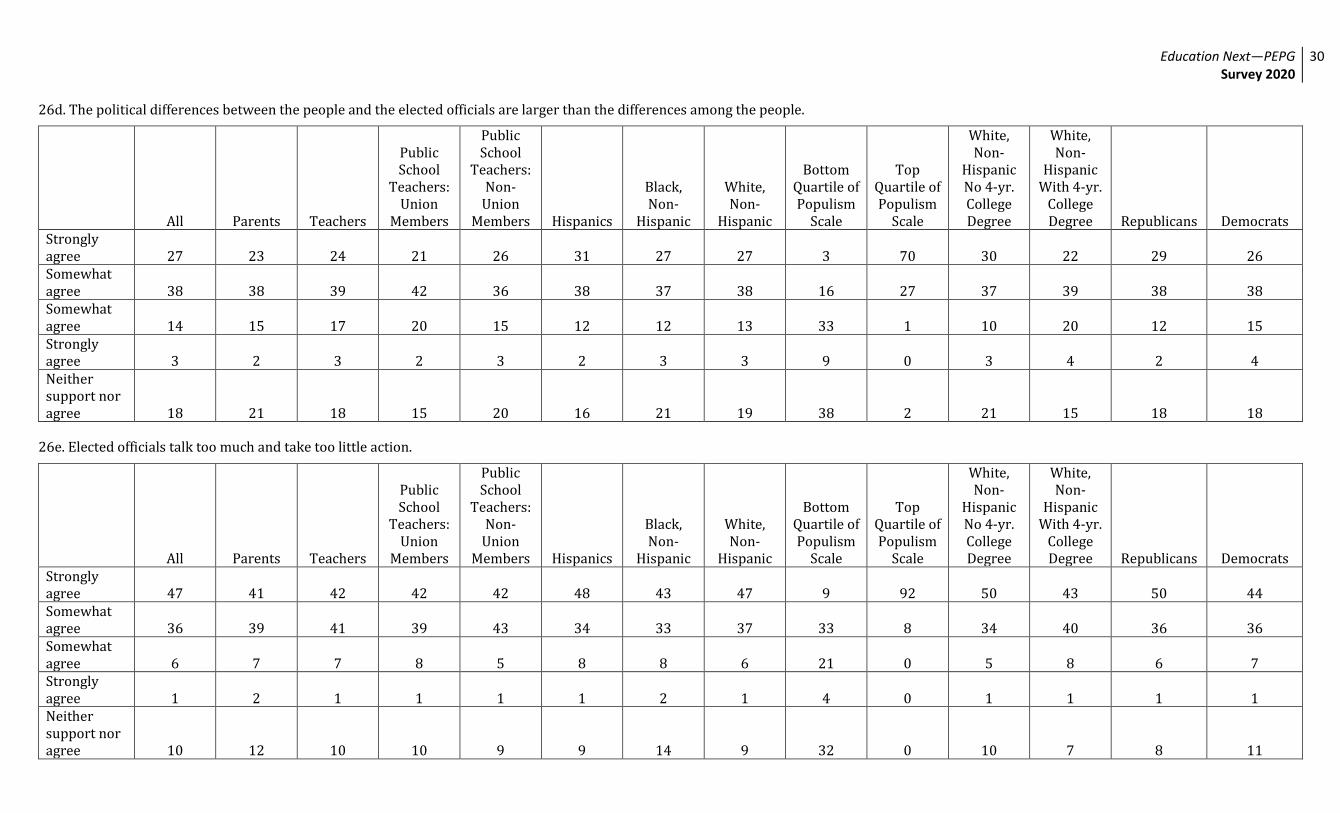
26d. The political differences between the people and the elected officials are larger than the differences among the people.
All Parents Teachers
Public School
Teachers: Union
Members
Public School
Teachers: Non-
Union Members Hispanics
Black, Non-
Hispanic
White, Non-
Hispanic
Bottom Quartile of Populism
Scale
Top Quartile of Populism
Scale
White, Non-
Hispanic No 4-yr. College Degree
White, Non-
Hispanic With 4-yr.
College Degree Republicans Democrats
Strongly agree 27 23 24 21 26 31 27 27 3 70 30 22 29 26 Somewhat agree 38 38 39 42 36 38 37 38 16 27 37 39 38 38 Somewhat agree 14 15 17 20 15 12 12 13 33 1 10 20 12 15 Strongly agree 3 2 3 2 3 2 3 3 9 0 3 4 2 4 Neither support nor agree 18 21 18 15 20 16 21 19 38 2 21 15 18 18
26e. Elected officials talk too much and take too little action.
All Parents Teachers
Public School
Teachers: Union
Members
Public School
Teachers: Non-
Union Members Hispanics
Black, Non-
Hispanic
White, Non-
Hispanic
Bottom Quartile of Populism
Scale
Top Quartile of Populism
Scale
White, Non-
Hispanic No 4-yr. College Degree
White, Non-
Hispanic With 4-yr.
College Degree Republicans Democrats
Strongly agree 47 41 42 42 42 48 43 47 9 92 50 43 50 44 Somewhat agree 36 39 41 39 43 34 33 37 33 8 34 40 36 36 Somewhat agree 6 7 7 8 5 8 8 6 21 0 5 8 6 7 Strongly agree 1 2 1 1 1 1 2 1 4 0 1 1 1 1 Neither support nor agree 10 12 10 10 9 9 14 9 32 0 10 7 8 11
Education Next—PEPG Survey 2020
31
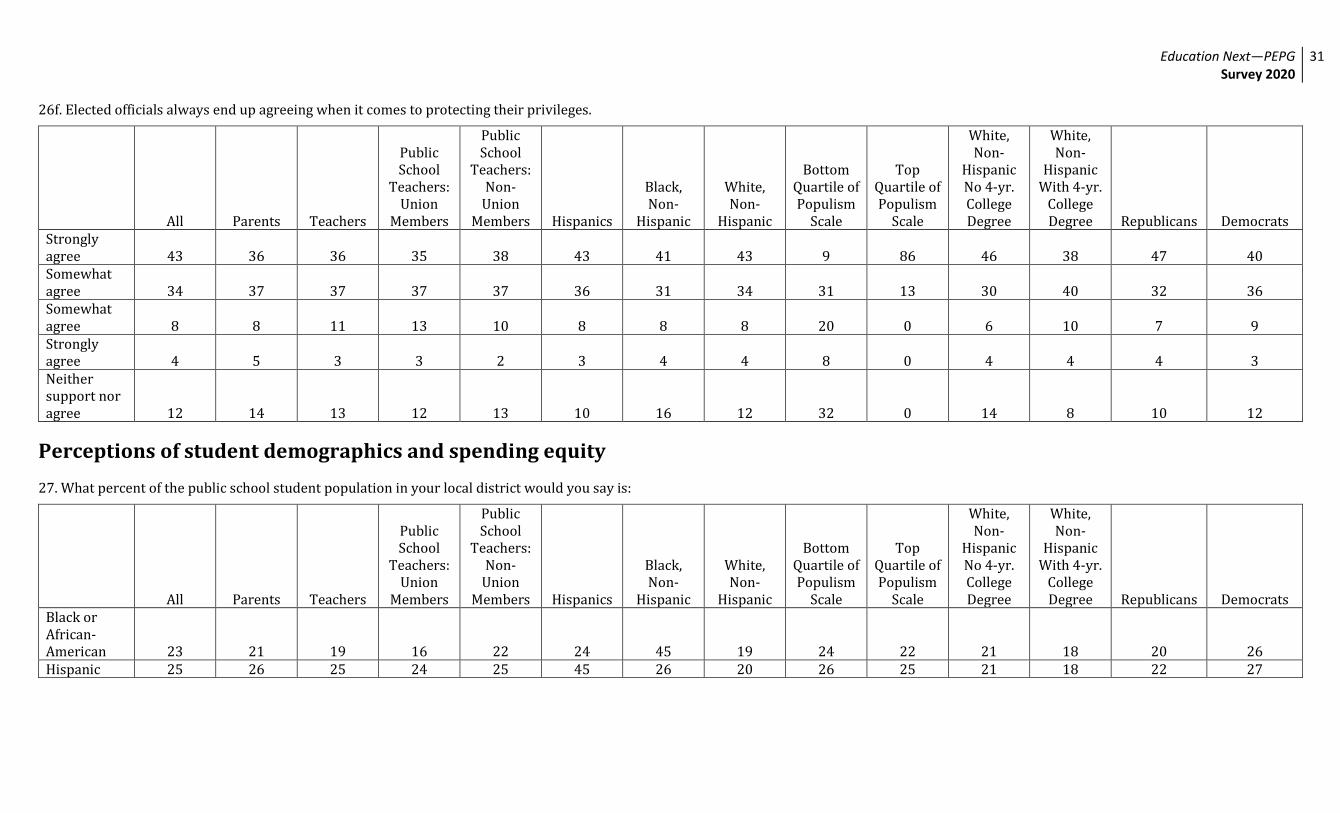
26f. Elected officials always end up agreeing when it comes to protecting their privileges.
All Parents Teachers
Public School
Teachers: Union
Members
Public School
Teachers: Non-
Union Members Hispanics
Black, Non-
Hispanic
White, Non-
Hispanic
Bottom Quartile of Populism
Scale
Top Quartile of Populism
Scale
White, Non-
Hispanic No 4-yr. College Degree
White, Non-
Hispanic With 4-yr.
College Degree Republicans Democrats
Strongly agree 43 36 36 35 38 43 41 43 9 86 46 38 47 40 Somewhat agree 34 37 37 37 37 36 31 34 31 13 30 40 32 36 Somewhat agree 8 8 11 13 10 8 8 8 20 0 6 10 7 9 Strongly agree 4 5 3 3 2 3 4 4 8 0 4 4 4 3 Neither support nor agree 12 14 13 12 13 10 16 12 32 0 14 8 10 12
Perceptions of student demographics and spending equity 27. What percent of the public school student population in your local district would you say is:
All Parents Teachers
Public School
Teachers: Union
Members
Public School
Teachers: Non-
Union Members Hispanics
Black, Non-
Hispanic
White, Non-
Hispanic
Bottom Quartile of Populism
Scale
Top Quartile of Populism
Scale
White, Non-
Hispanic No 4-yr. College Degree
White, Non-
Hispanic With 4-yr.
College Degree Republicans Democrats
Black or African-American 23 21 19 16 22 24 45 19 24 22 21 18 20 26 Hispanic 25 26 25 24 25 45 26 20 26 25 21 18 22 27
Education Next—PEPG Survey 2020
32
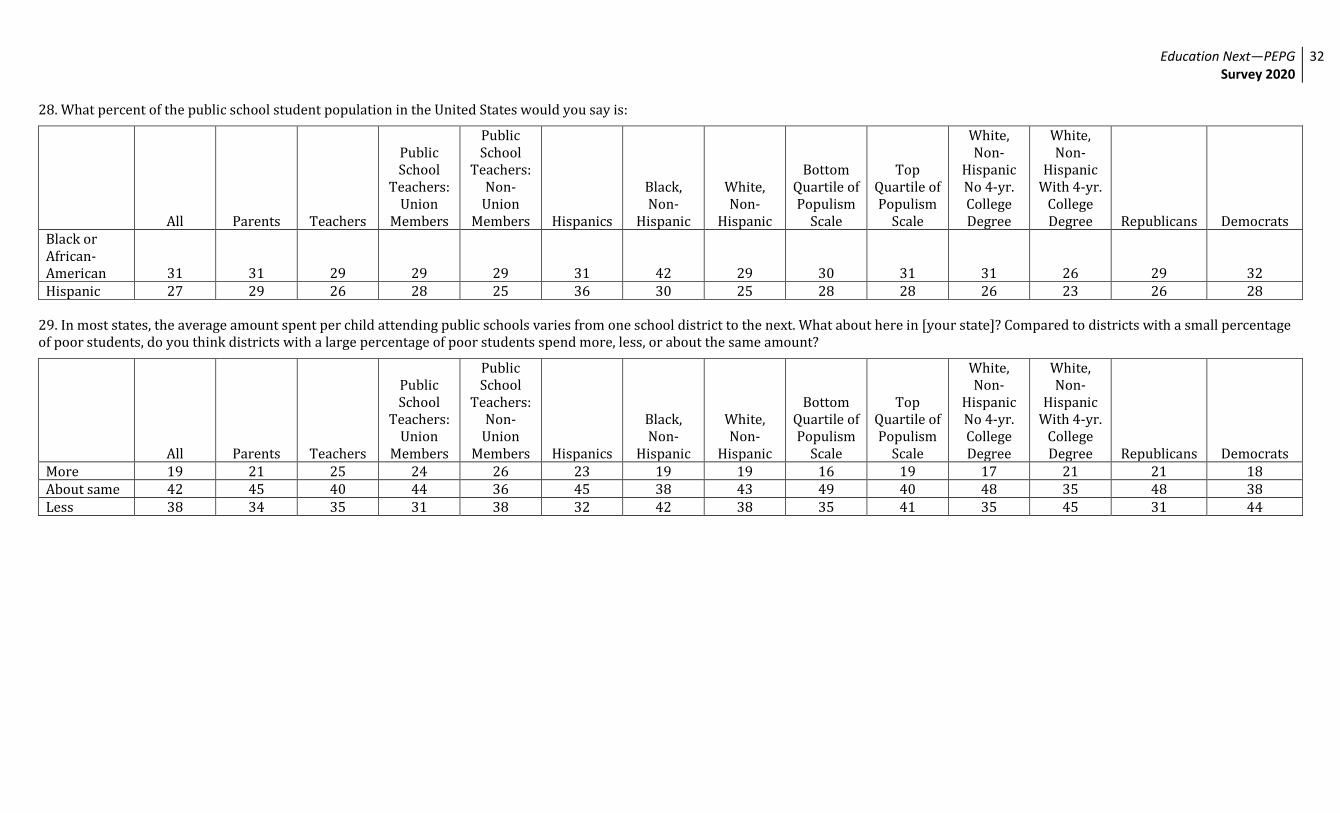
28. What percent of the public school student population in the United States would you say is:
All Parents Teachers
Public School
Teachers: Union
Members
Public School
Teachers: Non-
Union Members Hispanics
Black, Non-
Hispanic
White, Non-
Hispanic
Bottom Quartile of Populism
Scale
Top Quartile of Populism
Scale
White, Non-
Hispanic No 4-yr. College Degree
White, Non-
Hispanic With 4-yr.
College Degree Republicans Democrats
Black or African-American 31 31 29 29 29 31 42 29 30 31 31 26 29 32 Hispanic 27 29 26 28 25 36 30 25 28 28 26 23 26 28
29. In most states, the average amount spent per child attending public schools varies from one school district to the next. What about here in [your state]? Compared to districts with a small percentage of poor students, do you think districts with a large percentage of poor students spend more, less, or about the same amount?
All Parents Teachers
Public School
Teachers: Union
Members
Public School
Teachers: Non-
Union Members Hispanics
Black, Non-
Hispanic
White, Non-
Hispanic
Bottom Quartile of Populism
Scale
Top Quartile of Populism
Scale
White, Non-
Hispanic No 4-yr. College Degree
White, Non-
Hispanic With 4-yr.
College Degree Republicans Democrats
More 19 21 25 24 26 23 19 19 16 19 17 21 21 18 About same 42 45 40 44 36 45 38 43 49 40 48 35 48 38 Less 38 34 35 31 38 32 42 38 35 41 35 45 31 44
Education Next—PEPG Survey 2020
33
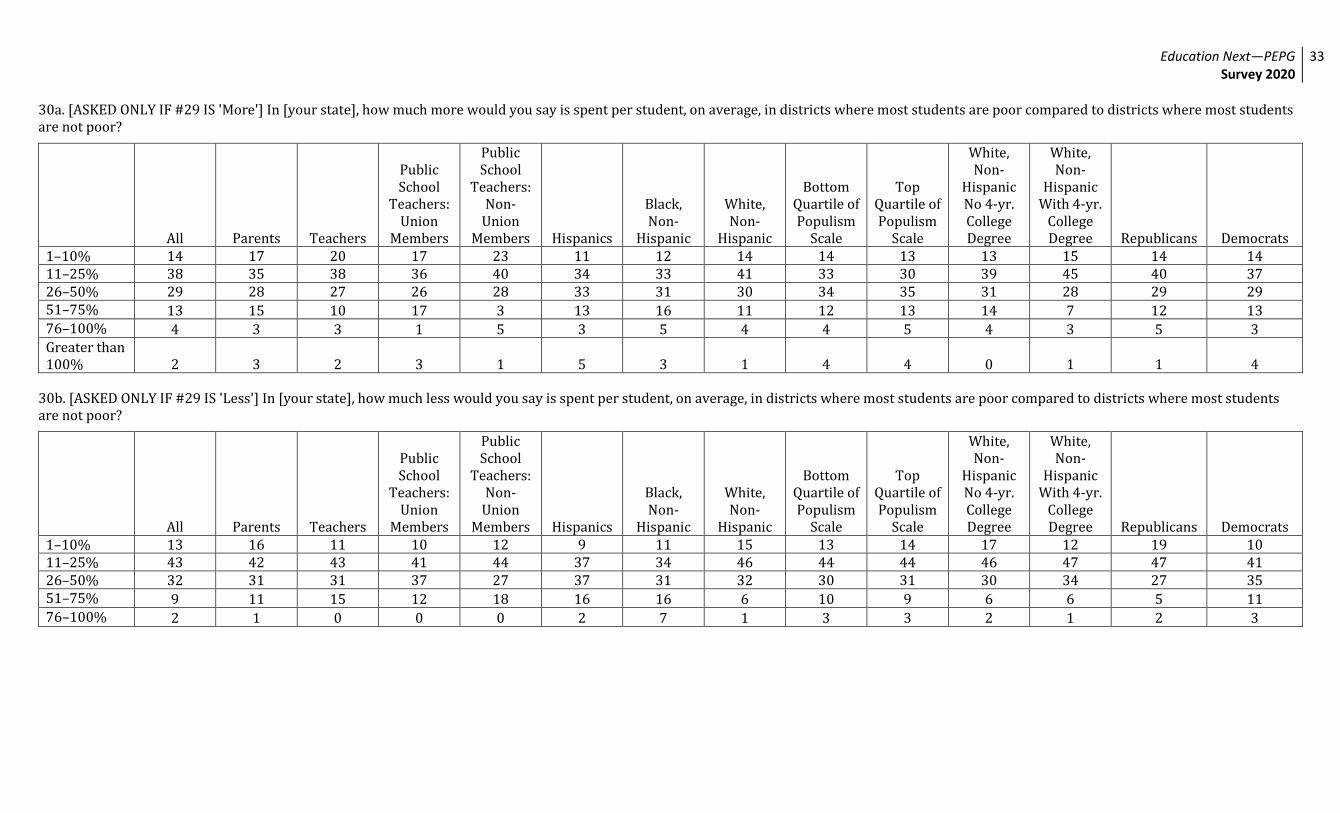
30a. [ASKED ONLY IF #29 IS 'More'] In [your state], how much more would you say is spent per student, on average, in districts where most students are poor compared to districts where most students are not poor?
All Parents Teachers
Public School
Teachers: Union
Members
Public School
Teachers: Non-
Union Members Hispanics
Black, Non-
Hispanic
White, Non-
Hispanic
Bottom Quartile of Populism
Scale
Top Quartile of Populism
Scale
White, Non-
Hispanic No 4-yr. College Degree
White, Non-
Hispanic With 4-yr.
College Degree Republicans Democrats
1–10% 14 17 20 17 23 11 12 14 14 13 13 15 14 14 11–25% 38 35 38 36 40 34 33 41 33 30 39 45 40 37 26–50% 29 28 27 26 28 33 31 30 34 35 31 28 29 29 51–75% 13 15 10 17 3 13 16 11 12 13 14 7 12 13 76–100% 4 3 3 1 5 3 5 4 4 5 4 3 5 3 Greater than 100% 2 3 2 3 1 5 3 1 4 4 0 1 1 4
30b. [ASKED ONLY IF #29 IS 'Less'] In [your state], how much less would you say is spent per student, on average, in districts where most students are poor compared to districts where most students are not poor?
All Parents Teachers
Public School
Teachers: Union
Members
Public School
Teachers: Non-
Union Members Hispanics
Black, Non-
Hispanic
White, Non-
Hispanic
Bottom Quartile of Populism
Scale
Top Quartile of Populism
Scale
White, Non-
Hispanic No 4-yr. College Degree
White, Non-
Hispanic With 4-yr.
College Degree Republicans Democrats
1–10% 13 16 11 10 12 9 11 15 13 14 17 12 19 10 11–25% 43 42 43 41 44 37 34 46 44 44 46 47 47 41 26–50% 32 31 31 37 27 37 31 32 30 31 30 34 27 35 51–75% 9 11 15 12 18 16 16 6 10 9 6 6 5 11 76–100% 2 1 0 0 0 2 7 1 3 3 2 1 2 3
Education Next—PEPG Survey 2020
34
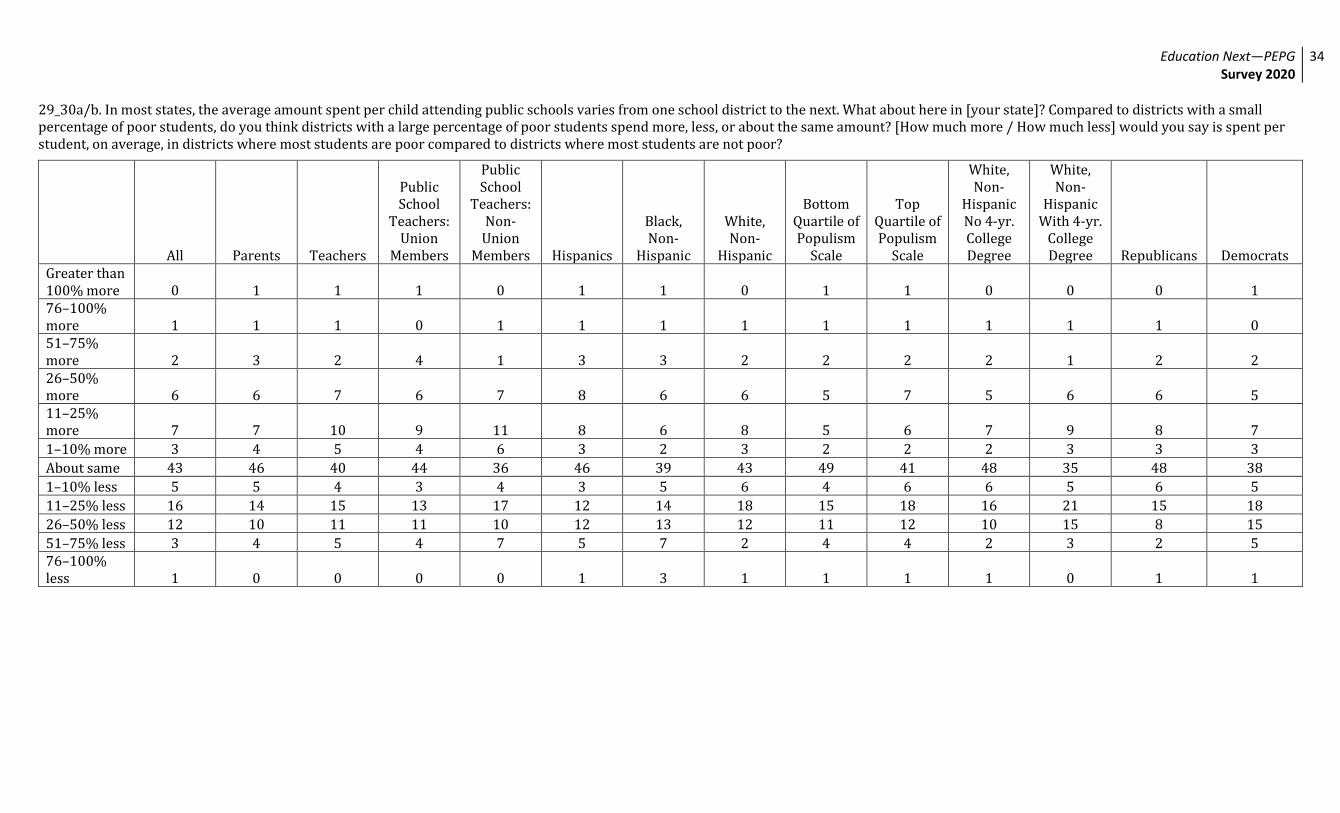
29_30a/b. In most states, the average amount spent per child attending public schools varies from one school district to the next. What about here in [your state]? Compared to districts with a small percentage of poor students, do you think districts with a large percentage of poor students spend more, less, or about the same amount? [How much more / How much less] would you say is spent per student, on average, in districts where most students are poor compared to districts where most students are not poor?
All Parents Teachers
Public School
Teachers: Union
Members
Public School
Teachers: Non-
Union Members Hispanics
Black, Non-
Hispanic
White, Non-
Hispanic
Bottom Quartile of Populism
Scale
Top Quartile of Populism
Scale
White, Non-
Hispanic No 4-yr. College Degree
White, Non-
Hispanic With 4-yr.
College Degree Republicans Democrats
Greater than 100% more 0 1 1 1 0 1 1 0 1 1 0 0 0 1 76–100% more 1 1 1 0 1 1 1 1 1 1 1 1 1 0 51–75% more 2 3 2 4 1 3 3 2 2 2 2 1 2 2 26–50% more 6 6 7 6 7 8 6 6 5 7 5 6 6 5 11–25% more 7 7 10 9 11 8 6 8 5 6 7 9 8 7 1–10% more 3 4 5 4 6 3 2 3 2 2 2 3 3 3 About same 43 46 40 44 36 46 39 43 49 41 48 35 48 38 1–10% less 5 5 4 3 4 3 5 6 4 6 6 5 6 5 11–25% less 16 14 15 13 17 12 14 18 15 18 16 21 15 18 26–50% less 12 10 11 11 10 12 13 12 11 12 10 15 8 15 51–75% less 3 4 5 4 7 5 7 2 4 4 2 3 2 5 76–100% less 1 0 0 0 0 1 3 1 1 1 1 0 1 1
Related Documents