ES/S5/18/22/A EDUCATION AND SKILLS COMMITTEE AGENDA 22nd Meeting, 2018 (Session 5) Wednesday 19 September 2018 The Committee will meet at 10.00 am in the Robert Burns Room (CR1). 1. Declaration of Interests: Clare Adamson, Alasdair Allan, Jenny Gilruth and Rona Mackay will be invited to declare any relevant interests. 2. Choice of Convener: The Committee will choose a Convener. 3. Decision on taking business in private: The Committee will decide whether to take agenda item 5 in private. The Committee will also decide whether to take the consideration of its work programme at its next meeting in private. 4. 2018 Exam Diet- curriculum and attainment trends: The Committee will take evidence from— Dr Alan Britton, Senior Lecturer in Education, University of Glasgow Professor Louise Hayward, Professor of Curriculum Assessment and Pedagogy, University of Glasgow; Professor Jim Scott, School of Education and Social Work, University of Dundee; Dr Marina Shapira, Lecturer in Quantitative Methods, University of Stirling; Dr Janet Brown, Chief Executive, and Alistair Wylie, Head of Technology, Engineering and Construction Qualifications, Scottish Qualifications Authority. 5. Review of evidence: The Committee will consider the evidence it heard earlier.

Welcome message from author
This document is posted to help you gain knowledge. Please leave a comment to let me know what you think about it! Share it to your friends and learn new things together.
Transcript

ES/S5/18/22/A
EDUCATION AND SKILLS COMMITTEE
AGENDA
22nd Meeting, 2018 (Session 5)
Wednesday 19 September 2018
The Committee will meet at 10.00 am in the Robert Burns Room (CR1).
1. Declaration of Interests: Clare Adamson, Alasdair Allan, Jenny Gilruth andRona Mackay will be invited to declare any relevant interests.
2. Choice of Convener: The Committee will choose a Convener.
3. Decision on taking business in private: The Committee will decide whetherto take agenda item 5 in private. The Committee will also decide whether totake the consideration of its work programme at its next meeting in private.
4. 2018 Exam Diet- curriculum and attainment trends: The Committee will takeevidence from—
Dr Alan Britton, Senior Lecturer in Education, University of Glasgow
Professor Louise Hayward, Professor of Curriculum Assessment and Pedagogy, University of Glasgow;
Professor Jim Scott, School of Education and Social Work, University of Dundee;
Dr Marina Shapira, Lecturer in Quantitative Methods, University of Stirling;
Dr Janet Brown, Chief Executive, and Alistair Wylie, Head of Technology, Engineering and Construction Qualifications, Scottish Qualifications Authority.
5. Review of evidence: The Committee will consider the evidence it heard earlier.
ES/S5/18/22/A
Roz Thomson Clerk to the Education and Skills Committee
Room T3.40 The Scottish Parliament
Edinburgh Tel: 85222
Email: [email protected]

ES/S5/18/22/A
ES/S5/18/22/1
The papers for this meeting are as follows—
Agenda Item 4
SPICe briefing paper
Submissions pack ES/S5/18/22/2
Agenda Item 1 ES/S5/18/22/1
1
Education and Skills Committee 2018 exam diet – curriculum and attainment trends
19 September 2018
INTRODUCTION
The Committee has invited a number of academics and the SQA to give evidence to the Committee.
The panel will comprise of—
• Professor Jim Scott;
• Professor Louise Hayward;
• Dr Alan Britton;
• Dr Marina Shapira;
• Dr Janet Brown, Chief Executive, and Mr Alistair Wylie, Head of Technology, Engineering and Construction Qualifications, SQA.
The paper has three sections—
• Curricular structures and subject choice;
• Levels of qualification; and
• Overall attainment.
Due to the tight timescales, it has not been possible for this paper to reflect all the submissions from the panellists.
About the panel
Dr Alan Britton
Dr Britton is a senior lecturer at the University of Glasgow teaching Initial Teacher Education courses. He has wide experience of education including English language teaching in France, outdoor instruction in the Highlands of Scotland, and secondary school teaching of languages and civics.
Dr Britton’s research interests are Education Policy, Citizenship, Political Literacy, and Sustainability. His doctoral thesis was on the development of CfE.
Professor Louise Hayward
Professor Hayward is Professor of Educational Assessment and Innovation at the University of Glasgow. She was a member of the internationally renowned Assessment Reform Group and is currently a member of the Curriculum, Assessment and Pedagogy

2
Educational Reform Group and the Scottish Government’s Curriculum and Assessment Board.
Professor Hayward has worked supporting education policy, including assessment and curricula development, internationally in Norway, Portugal, Wales and Malta. Professor Hayward has written extensively on assessment and learning and on national change processes.
Professor Jim Scott
Jim Scott is an Honorary Professor of Education in the School of Education and Social Work of the University of Dundee. Professor Scott served as a head teacher for a total of four secondary schools between September 1990 and January 2012 in Fife, Falkirk and Perth and Kinross.
He has published a number of papers focusing on curricular structures in Scottish Secondary schools and the impact on course entries. Professor Scott wrote a widely cited paper in March this year for the Royal Society of Edinburgh's Education Committee, which examined the S1-S4 curricular structures. Previous published papers have focused on the uptake of modern languages.
Dr Marina Shapira
Dr Shapira is a lecturer in quantitative methods at the University of Stirling’s Sociology, Social Policy & Criminology department. Her main research interests are listed as: educational inequalities, in particular inequalities in educational attainment and transitions from secondary education to work and further/higher education; role of school curriculum and curriculum choices on the attainment and transitions.
Along with Professor Mark Priestley, Dr Shapira has co-authored recent and ongoing research on the impact of the CfE on subject choice, attainment and transitions of young people in Scotland.
Dr Janet Brown
Dr Brown was appointed to the post of SQA Chief Executive in 2007. She has a background in the private sector, working in science and technology.
Committee work
The Senior Phase and subject choice in the Senior Phase is a topic that the Committee has discussed a number of times this Session during oral evidence on a range of topics. For example: 23 November 2016, 30 November 2016, 18 January 2017, 8 March 2017, 13 September 2017, and 6 June 2018 (part of the current inquiry into Young People’s Pathways).
The key issues that have been raised during Committee sessions have been subject choice and examinations or National 4 courses. With regard to subject choice, the debate has been the narrowing of choices of subjects at S4 from the norm being 8 prior to now 6 choices being more likely. However, the Senior Phase is designed as a three-year stage and others have argued that, taken as a whole, the Senior Phase provides the opportunity for greater depth and breadth. On National 4 qualifications, some have suggested that a lack of final an externally-marked exam lowers the qualification’s prestige, while others
3
have argued that the qualification is well-suited to the intended cohort and suits progression to National 5s and college courses. Both these issues are addressed in more detail later in this paper.
Committee Survey
In early 2017, the Committee undertook a survey of all secondary schools to establish further evidence of emerging Senior Phase patterns. The survey focused on:
• number of subjects taken in S4;
• ability to take 3 sciences;
• running Higher courses over two years; and
• taking Highers without first taking an N5.
An analysis of the survey is included in the Annexe to this paper.
CURRICULAR STRUCTURES AND SUBJECT CHOICE
The Senior Phase was the last element of the Curriculum for Excellence to be implemented. It was phased in from 2014 to 2016 and the previous national qualifications of Access, Standard, Intermediate, Higher and Advanced Higher were replaced by National courses (numbered 2-5) and new Higher and Advanced Higher qualifications. The previous system of secondary school tended to be structured in three two-year groupings S1-2, S3-4 (initial national qualifications over two years, e.g. Standard Grades or Access courses), S5-6 (further national qualifications, e.g. Intermediates, Highers and Advanced Highers). Curriculum for Excellence changed the structure of secondary school to two 3-year groupings S1-S3 (part of Broad General Education), S4-S6 (Senior Phase). Prof Jim Scott’s work is often cited as the leading researcher in changing curriculum models in Scotland and therefore this section includes a focus on his work. Prof Scott argued in a paper published in March1 that the change to the structure of secondary was implemented without adequate consultation. He also argued that while the 3-15 curriculum was subject of a great deal of work during the development of CfE, the Senior Phase was left to the SQA, “a qualifications body rather than a curricular agency”.(p4) Dr Britton’s submission to the Committee for this evidence session also identifies differences in approach to the development of BGE and the Senior Phase. He states—
“The post BGE phase did not receive the same pedagogical consideration as the earlier levels, and the strong messages about the need to revisit aspects of teaching and learning from the CfE review were not addressed to the same extent.”
Prof Scott has researched how schools have adapted their curricula design and timetabling to the new structure. Prof Scott’s research used data from a sample of 224 state-funded secondary schools (out of a total of 360) to analyse curriculum structures for the years S1 to S4. 127 (57%) of these schools provided for six qualification courses in S4, 72 (32%)
1 Scott J (2018) Curriculum for Excellence and the Early / Middle Secondary Curriculum in Scotland: Lessons Learned or Forgotten
4
provided for seven qualification courses, and 25 (11%) provided for 8 courses. There was a wide variety of curricular structures between S1 and S3 for each of these groups of schools. Prof Scott raised concerns both of there being, in some cases, too many subjects in S1-S3 and too few in S4. The SQA reported in September 2017, that its field research found that—
“Many learners expressed the view that they did not feel that S1–3 was a good preparation for the Senior Phase — both in the pace of work they had experienced and in the depth and breadth of the skills and knowledge they had developed to prepare them for the requirements of the Senior Phase.”
Prof Scott’s March 2018 paper questioned the role of education authorities in providing guidance for schools on their s1-s4 curriculum. The paper also questioned whether school leaders consistently have the requisite skills and knowledge to design and timetable appropriate curricular structures. In his submission to the OECD review of Curriculum for Excellence, Prof Scott stated that “a reduction to 6 S4 courses was never a planned aspect of Curriculum for Excellence but is an expedient measure resulting from some schools’/authorities’ interpretation of what is now possible within time constraints.” (p1) He also explained the impact of a reduced number of choices on the take up of certain subjects at S4—
“Parental/pupil S3-4 choices in schools with narrowed or very narrowed curricula still mostly resemble a part of those in the previous broader curriculum in that many parents and their children choose English, Mathematics (both generally compulsory) and either two Sciences and a Social Subject or two Social Subjects and a Science, effectively leaving all other subjects to compete for the remaining column choice.” (p4)
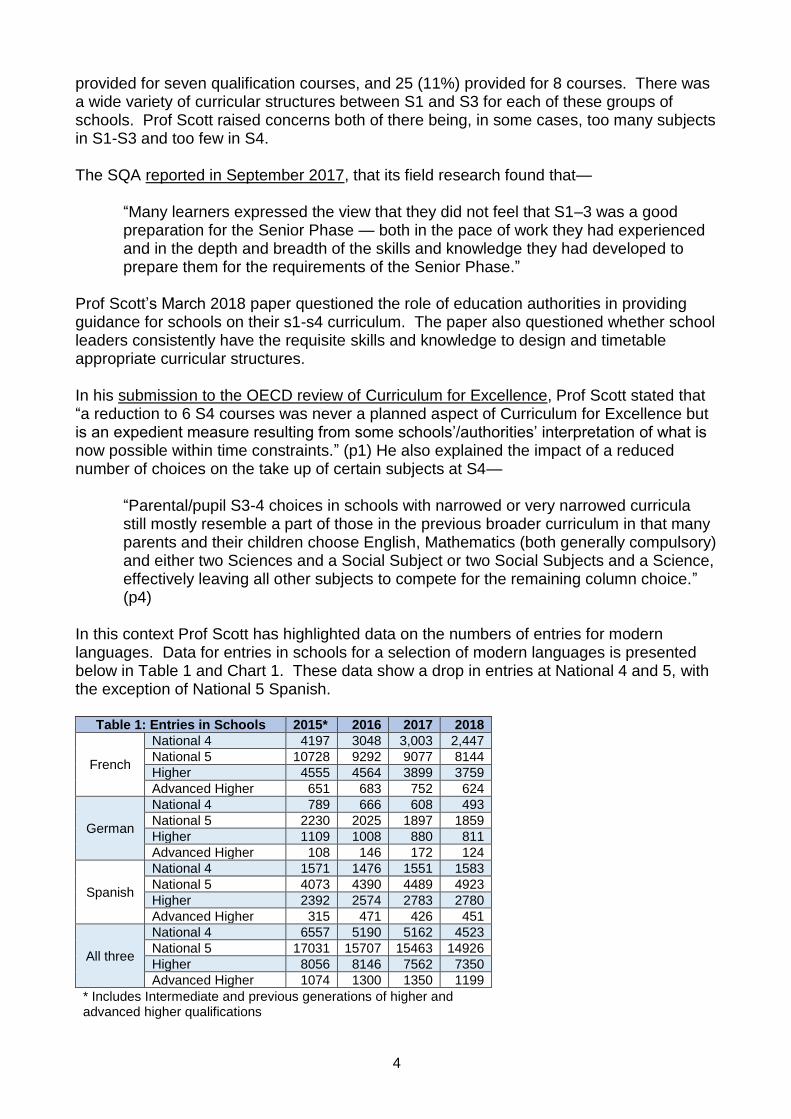
In this context Prof Scott has highlighted data on the numbers of entries for modern languages. Data for entries in schools for a selection of modern languages is presented below in Table 1 and Chart 1. These data show a drop in entries at National 4 and 5, with the exception of National 5 Spanish.
Table 1: Entries in Schools 2015* 2016 2017 2018
French
National 4 4197 3048 3,003 2,447
National 5 10728 9292 9077 8144
Higher 4555 4564 3899 3759
Advanced Higher 651 683 752 624
German
National 4 789 666 608 493
National 5 2230 2025 1897 1859
Higher 1109 1008 880 811
Advanced Higher 108 146 172 124
Spanish
National 4 1571 1476 1551 1583
National 5 4073 4390 4489 4923
Higher 2392 2574 2783 2780
Advanced Higher 315 471 426 451
All three
National 4 6557 5190 5162 4523
National 5 17031 15707 15463 14926
Higher 8056 8146 7562 7350
Advanced Higher 1074 1300 1350 1199
* Includes Intermediate and previous generations of higher and advanced higher qualifications

5
Source: SQA Attainment Statistics, Schools, 2016 & 2018 Members may be aware that take up of modern languages is also dropping at GCSE2 and A level across the other nations of the UK3. One of the factors that can affect the number of entries is the pupil roll. Table 2, below provides data on the number of pupils by stage in Scottish secondary schools. This data is collected in September: the S4, S5 and S6 cohorts marked 2017 in Table 2 will have taken exams in 2018. The 2017/18 S4 cohort is the smallest since before 2001 and is 5% smaller than the S4 cohort in 2014/15.
Table 2: Number of pupils 2011 2012 2013 2014 2015 2016 2017
S1 52,180 51,080 50,030 49,327 50,912 52,206 52,796
S2 54,187 52,254 51,240 50,248 49,612 51,133 52,437
S3 55,512 54,309 52,346 51,361 50,296 49,793 51,284
S4 55,243 54,895 53,895 52,206 51,175 50,244 49,705
S5 47,741 47,625 47,809 47,373 45,911 44,862 43,934
S6 32,246 33,399 33,844 34,247 34,033 32,745 31,837
Source: Scottish Government Pupil Census Analysis of the pupil census shows that staying on rates, the proportion of pupils staying in school in S5 and S6, have improved. Between 2002 and 2008, staying on rates for S4-S5 and S5-S6 were steady at around 77% and 58% respectively. Between 2008 and 2015, staying on rates in the Senior Phase increased to 88% (S4-S5) and 72% (S5-S6) and the 2017 figures are 87% and 71% respectively.
2 The Telegraph (24 August 2017) Number of language GCSEs plummets as academics warn students are relying on Google Translate 3 The Guardian (16 August 2018) A-level results: foreign languages suffer further slump
0
20
40
60
80
100
120
140
2015 2016 2017 2018
Chart 1: French, German and Spanish combined school entries, indexed
National 4
National 5
Higher
Advanced Higher
Index: 2015=100

6
The debate about subject choice is often framed around about the number of different subjects one can take in a single year (S4) and impact of this on the number of subjects one can take in Senior Phase overall. Other factors may also influence this; for example, the Committee’s 2017 survey found evidence that teacher shortages were impacting on the viability of courses in some areas. The breadth of the Senior Phase was discussed by the Committee at its meeting on 6 June 2018. Terry Lanagan of ADES told the Committee—
“The advantage of having [a Senior Phase with 6 choices in S4, S5 and S6 is] that schools can timetable S4 to S6 together. An increasing number of schools are doing that. It increases the available choice, because subjects can be timetabled across different year groups, and it makes some courses more viable, because the numbers are greater. The schools that are doing it report that the motivation and behaviour of S4 pupils has improved where they are in classes with fifth-year and sixth-year pupils.” Source: Education and Skills Committee OR 6 June 2018, Col 18
The previous Chief Executive of Education Scotland, Dr Bill Maxwell, told the Committee in 30 November 2016 (Col 40) that he did not accept there has been a narrowing of choice. Education Scotland wrote to the Committee in December 2016 explaining the CfE Senior Phase differs from previous arrangements:
“One key difference which has emerged nationally is that young people are taking exams in fewer subjects at the end of S4. Schools have made these changes to ensure greater depth in young people’s learning at this stage. As they move into S5 and S6, there is also the opportunity to study different or additional subjects from those studied in S4. Also, some schools have changed the timescales over which young people study for qualifications, for example, with some higher-attaining young people “by-passing” exams in S4, and instead following a two-year course to Higher in S5.”
An indication of whether a Senior Phase with a six-six-six structure offers a breadth of choice would be whether young people take courses in S5 or S6 that they would have taken at S4, given more choices at that stage. In 2017, there were 62,060 entries at Nat 5 in S5 and S6, 21% of the total Nat 5 entries for that year. For some subjects, the number of candidates taking Nat 5 in S5 represents a significant percentage of the cohort, e.g. in 2017: Maths (26%, incl. Lifeskills Maths) and English (18%). In other subjects, for example modern languages, the number is low. In the previous system, Intermediate 2 qualifications could have been used to obtain an SCQF level 5 qualification in S5 or S6. Those taking Nat 5s in S5 and S6 could be broadening their education by taking a new subject or deepening their education by progressing from a Nat 4 in the same subject. In 2017, 28,033 Nat 5 courses were completed by individuals who had completed a Nat 4 in the previous year in the same subject. It would therefore appear that progression accounts for a significant proportion of those taking Nat 5 in S5 and S6; a range of other factors (e.g. retakes) may also account for a number of these entries. The SQA does not publish data on candidates that took subjects in S4 and subsequently took entirely new subjects in S5 or S6. The report of the SQA’s Chief Examinations Officer, Dr Janet Brown, on the 2018 diet states—

7
“Schools and colleges have the flexibility to deliver curriculum models best suited to their local circumstances and the needs of individual candidates. These models provide the opportunity for learners to study a different mix of awards and courses at the most appropriate time for them during their Senior Phase.”
And—
“Performance in National Courses and Awards has, in the main, been fairly stable. There has been a small increase in the numbers undertaking the lower levels of qualifications, a small reduction at National 5 and Higher, and a small increase at Advanced Higher. There has also been a diversification of curriculum pathways, leading to a wider range of qualifications being used to meet learners’ needs.”
LEVELS OF QUALIFICATION
The Committee has explored issues with National 4 on a number occasions. One issue has been whether National 4 is valued and well-understood. The National Parent Forum of Scotland recently undertook a survey. A synopsis of the results of the survey were included in a paper to the Curriculum and Assessment Board in March 2018—
“There was a general consensus that the National 4 qualification was perceived as not being valued by employers due to no external assessment. The survey also highlighted concerns that National 4 did not adequately prepare learners for progression to National 5. It was highlighted that National 4 is equivalent to Standard Grade General, but unlike SG General, it does not specify a grade and there was a feeling that this is a negative aspect of National 4.”
The same paper set out the Scottish Government’s plan to “enhance the perceived credibility” of National 4s, it said—
“We will work with stakeholders to jointly design and deliver a communications exercise to promote the value of National 4 within the wider pathways available through the Senior Phase. This is likely to emphasise the value of internal assessment, given that the vast majority of vocational qualifications are internally assessed (drawing on the experiences of the HE and FE sectors); National 4 as a progression route from National 3; and raising awareness of National 4 as a dual purpose qualification - as a progression to the world of work and college, and progression route to National 5.”
The SQA sought views on whether National 4 should include an externally moderated exam paper in its fieldwork research published in September 2017. It identified mixed views on whether National 4 should do so with learners on the whole happy with National 4 to remain without a formal exam and teachers and school leaders preferring one to be included. Teachers were reported as focusing on exams providing parity of esteem with National 5, the potentially increased motivation of learners, and learner confidence. The SQA commented—
“These comments mainly seemed to stem from teachers’ previous experience of Standard Grade and its assessment approaches, rather than any acceptance that the National 4 assessment structure might be better suited to the cohort for which it was intended, and facilitate better potential progression routes to college for many of these learners.”

8
Another issue, leading on from a lack of credibility, has been a reduction in presentations in Nat 4s. The SQA found in its research published in September 2017, that—
“Nearly all teachers to a greater or lesser degree felt pressure to mis-present learners at National 5 despite pupil performance to the contrary. This pressure could come from parents and carers mainly, but also from SMT and occasionally the local authority. They felt this is mainly due to National 4 not being valued by parents and carers and employers. Teachers often felt such pressure was not in the long-term interest of the learner.”
The tables below show attainment at SCQF levels 3 and 4 and entries in national qualifications at these levels. Both tables are based on school data only (i.e. excluding colleges and other centres).
Table 3a: Attainment at SCQF Levels 3 & 4 Attainment (Schools)
SCQF Level Course 2015 2016 2017 2018
3
National 3 15,579 16,459 15,263 15,892
Access 3 3,103 - - -
Skills for Work 14 16 5 7
Awards 1,665 1,371 2,454 2,157
National Certificates 0 6 0 0
National Progression Awards 10 15 5 1
Total 20,371 17,867 17,727 18,057
4
National 4 121,505 113,874 106,537 95,619
Intermediate 1 (A-D) 1,028 - - -
Skills for Work 1,467 1,141 1,073 878
Awards 6,544 7,733 8,166 7,552
National Certificates 0 0 0 0
National Progression Awards 806 744 932 954
Total 131,350 123,492 116,708 105,003
Table 3b: Entries at National Courses at SCQF Levels 3 & 4
Entries (Schools)
SCQF Level Course 2015 2016 2017 2018
3
National 3 17,078 18,266 16,821 17,380
Access 3 3,252 - - -
Total 20,330 18,266 16,821 17,380
4
National 4 130,172 122,014 114,696 104,816
Intermediate 1 1,274 - - -
Total 131,446 122,014 114,696 104,816
Source: SQA Attainment Data (2018 and 2016)
Chart 2, below shows the decline in attainment at SCQF levels 3 and 4 since 2015 using the data in Table 3a (indexed, 2015=100). Between 2015 and 2018, the number of qualifications and awards achieved in schools has reduced by 11% at SCQF level 3 and 20% at SCQF level 4.

9
OVERALL ATTAINMENT
Overall attainment can be measured in a number of different ways. The Scottish Government’s National Performance Framework indicator for Education Attainment has a number of measures relating to the attainment of pupils leaving school. These are the proportion of school leavers attaining:
• 1 or more award at SCQF Level 4 or above;
• 1 or more award at SCQF Level 5 or above; and
• 1 or more award at SCQF Level 6 or above,
The most recent figures published on these measures are for the cohort in 2016/17 and show improvement since 2009/10.
Table 4: percentage of school leavers with at least 1 qualification
1 pass or more at:
SCQF Level 4 or better
SCQF Level 5 or better
SCQF Level 6 or better
2016/17 96.3 86.1 61.2
2015/16 96.3 85.6 61.7
2014/15 96.2 85.2 60.2
2013/14 96.3 84.3 58.1
2012/13 96.3 82.7 55.8
2011/12 95.8 81.6 55.8
2010/11 95.1 79.2 52.3
2009/10 94.4 77.1 50.4
Source: Scottish Government, Attainment and Leavers Destinations Data 2016/17
Another measure cited is the number of passes. Table 5 shows the number of passes (A-C) of National 4 to Advanced Higher over the past 4 years. Again this data relates to schools only.
0
20
40
60
80
100
2015 2016 2017 2018
Chart 2: Attainment SCQF Levels 3 & 4, indexed
SCQF 3 SCQF 4
2015=100

10
Table 5: Passes in schools (A-C, where applicable) 2015* 2016 2017 2018
National 4 122,462 113,874 106,537 95,619
National 5 234,572 231,704 230,273 215,534
Higher 149,791 147,299 144,341 142,456
Advanced Higher 18,693 19,204 19,106 19,397
Total 525,518 512,081 500,257 473,006
S4-S6 Cohort** 133,826 131,119 127,851 125,476 *Includes numbers for previous qualifications at the same SCQF level, i.e. Intermediates, previous higher/advanced higher **The pupil census counts the number of pupils in publicly funded schools in September, not the number of candidates.
Source: SQA Attainment Data (Schools), 2016 & 2018
With the exception of Advanced Higher, 2018 saw a drop in the number of passes for these national qualifications taken in schools. The cohort has also reduced, but the reduction of the cohort across all three years does not account for all of the fall in the number of passes in 2018.
Dr Janet Brown, said in her Chief Examining Officer's 2018 National Qualifications Results' Report—
“Attainment across National Courses and Awards was broadly in line with previous years, with a slight increase in attainment at Advanced Higher and a decrease in attainment at National 5. Some variation of attainment is to be expected between subjects and over time.”
Working on data up to to last year’s diet, Dr Shapira and Mark Priestley’s paper Narrowing the Curriculum? Contemporary trends in provision and attainment in the Scottish Curriculum. Found that while the curriculum had narrowed, there had not been an impact on attainment. Th paper concluded—
We did not find evidence of curriculum narrowing having a negative impact on the qualifications of school leavers. Our findings indicate that the relationship between the changes in curriculum and the attainment of school leavers in Scotland are complex. … Since Curriculum for Excellence and new qualifications were introduced, there is evidence in the reduction in the proportion of school leavers with SCQF level 4 and level 5 qualifications as their highest qualification level. Yet, there is also a significant increase in the proportion of those who leave school with one or more, four or more, and five or more qualifications at SCQF level 6, suggesting a significant improvement in the attainment levels of young Scots.
Ned Sharratt SPICe Research Date: 13 September 2018
Note: Committee briefing papers are provided by SPICe for the use of Scottish Parliament committees and clerking staff. They provide focused information or respond to specific questions or areas of interest to committees and are not intended to offer comprehensive coverage of a subject area.
The Scottish Parliament, Edinburgh, EH99 1SP www.parliament.scot

11
ANNEXE – COMMITTEE SURVEY ON THE SENIOR PHASE, 2017
Survey of secondary schools
Scottish Parliament Information C entre logo
Introduction In January the Committee decided to undertake a short survey of all secondary schools to establish further evidence of emerging Senior Phase patterns. The survey focused on:
• number of subjects taken in S4
• ability to take 3 sciences
• running Higher courses over two years
• taking Highers without first taking an N5 Schools were also asked about any plans for change they had for their Senior Phase curriculum structure. The survey was sent by e-mail to all publicly funded mainstream secondary schools and ran from 27th January to 13th February. The Committee received 87 completed responses. Further detail about the responses is provided at the end of this report. Response rate and demographics Completed responses were received from around a quarter of local authority mainstream secondary school (86 out of 359) local authority mainstream secondary schools. The grant-maintained school, Jordanhill, also submitted a response. Responses were received from all but two local authorities (West Lothian and East Renfrewshire). Chart 3 shows the % of secondary schools responding in each local authority. There were four areas where 50% or more of schools responded: Aberdeen, Aberdeenshire, Eilean Siar and West Dunbartonshire. Schools were also asked about their pupil roll and the proportion of pupils on free school meals. The general pattern of survey responses is reasonably similar to the range of size of school across Scotland, although the survey responses do show some over-representation from schools of a middling size (between 600 to 800 pupils). Chart 1: % responses by school size, comparing survey responses and all schools.
0%
5%
10%
15%
20%
25%
30%
0 to 99 100 - 199 200 - 299 300 - 399 400 - 499 500 - 599 600 - 799 800 - 9991,000 - 1,1991,200 +
survey
all secondaries

12
Responses were also checked against the general pattern of free school meal registration. Again, the responses do seem to loosely reflect the national pattern, although there is some over representation of schools with very low fsm registration and some under representation of those with middling fsm registration. Chart 2: % responses by free school meal registration, comparing survey responses and all schools
Chart 3: Proportion of responses by local authority
0.0%
5.0%
10.0%
15.0%
20.0%
25.0%
30.0%
0 to 4.9% 5% to 9.9% 10% to14.9%
15% to19.9%
20% to24.9%
25% to29.9%
30% to34.9%
35% to39.9%
40% to44.9%
survey
all secondaries
13
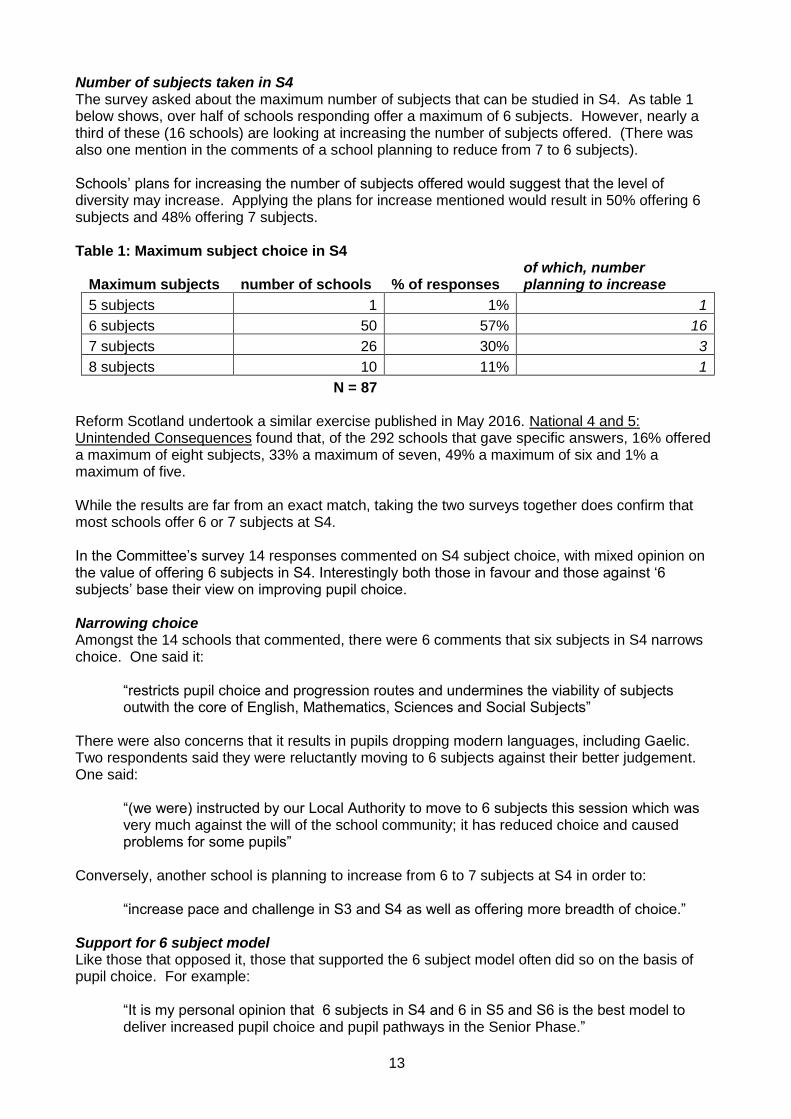
Number of subjects taken in S4 The survey asked about the maximum number of subjects that can be studied in S4. As table 1 below shows, over half of schools responding offer a maximum of 6 subjects. However, nearly a third of these (16 schools) are looking at increasing the number of subjects offered. (There was also one mention in the comments of a school planning to reduce from 7 to 6 subjects). Schools’ plans for increasing the number of subjects offered would suggest that the level of diversity may increase. Applying the plans for increase mentioned would result in 50% offering 6 subjects and 48% offering 7 subjects. Table 1: Maximum subject choice in S4
Maximum subjects number of schools % of responses of which, number planning to increase
5 subjects 1 1% 1
6 subjects 50 57% 16
7 subjects 26 30% 3
8 subjects 10 11% 1
N = 87 Reform Scotland undertook a similar exercise published in May 2016. National 4 and 5: Unintended Consequences found that, of the 292 schools that gave specific answers, 16% offered a maximum of eight subjects, 33% a maximum of seven, 49% a maximum of six and 1% a maximum of five. While the results are far from an exact match, taking the two surveys together does confirm that most schools offer 6 or 7 subjects at S4. In the Committee’s survey 14 responses commented on S4 subject choice, with mixed opinion on the value of offering 6 subjects in S4. Interestingly both those in favour and those against ‘6 subjects’ base their view on improving pupil choice. Narrowing choice Amongst the 14 schools that commented, there were 6 comments that six subjects in S4 narrows choice. One said it:
“restricts pupil choice and progression routes and undermines the viability of subjects outwith the core of English, Mathematics, Sciences and Social Subjects”
There were also concerns that it results in pupils dropping modern languages, including Gaelic. Two respondents said they were reluctantly moving to 6 subjects against their better judgement. One said:
“(we were) instructed by our Local Authority to move to 6 subjects this session which was very much against the will of the school community; it has reduced choice and caused problems for some pupils”
Conversely, another school is planning to increase from 6 to 7 subjects at S4 in order to:
“increase pace and challenge in S3 and S4 as well as offering more breadth of choice.”
Support for 6 subject model Like those that opposed it, those that supported the 6 subject model often did so on the basis of pupil choice. For example:
“It is my personal opinion that 6 subjects in S4 and 6 in S5 and S6 is the best model to deliver increased pupil choice and pupil pathways in the Senior Phase.”

14
another said:
“We are planning to move to a common choice form for S4-S6. This would reduce the number of courses from 7 to 6 at S4. It would also increase the availability of applied learning courses for S4 - S6 pupils and also increase the availability of N4/N5 courses to S5 and S6 pupil”
and another that:
“The move to a 6 subject model choice in S4 allows for greater depth and specialisation of study but we view the vast majority of our pupil coursing as a two or three year development as the vast majority of our pupils stay on until S5 and S6.”
National guidance The lack of clarity in the national policy was highlighted. One respondent commented:
“The diversity in opportunity across the country regarding how many courses a child can pursue in S4 is something which I believe must be reviewed at a national level. There is significant variation from authority to authority and this has the potential to become something of a post code lottery for young people.”
Another commented that:
“Over the last few years there has been a lack of clarity in advice for the Senior Phase -particularly over how more than 6 subjects can be taken in S4 and how that relates to the purpose and rationale for S3”
Another that:
“The continuing ambiguity at national level in this regard is unhelpful.”
Related to this is a comment from one respondent expressing frustration at criticism for following national guidance:
“Schools, like ourselves, who have followed guidance to the letter and embedded all aspects of CFE such as entitlement to work experience, foundation apprenticeships and wider achievement opportunities are correct. Yet we are the schools often criticised for only allowing 6 nationals as 'standard' in s4 with some degree of flexibility for a few. ALL SCHOOLS should be following the same model.”
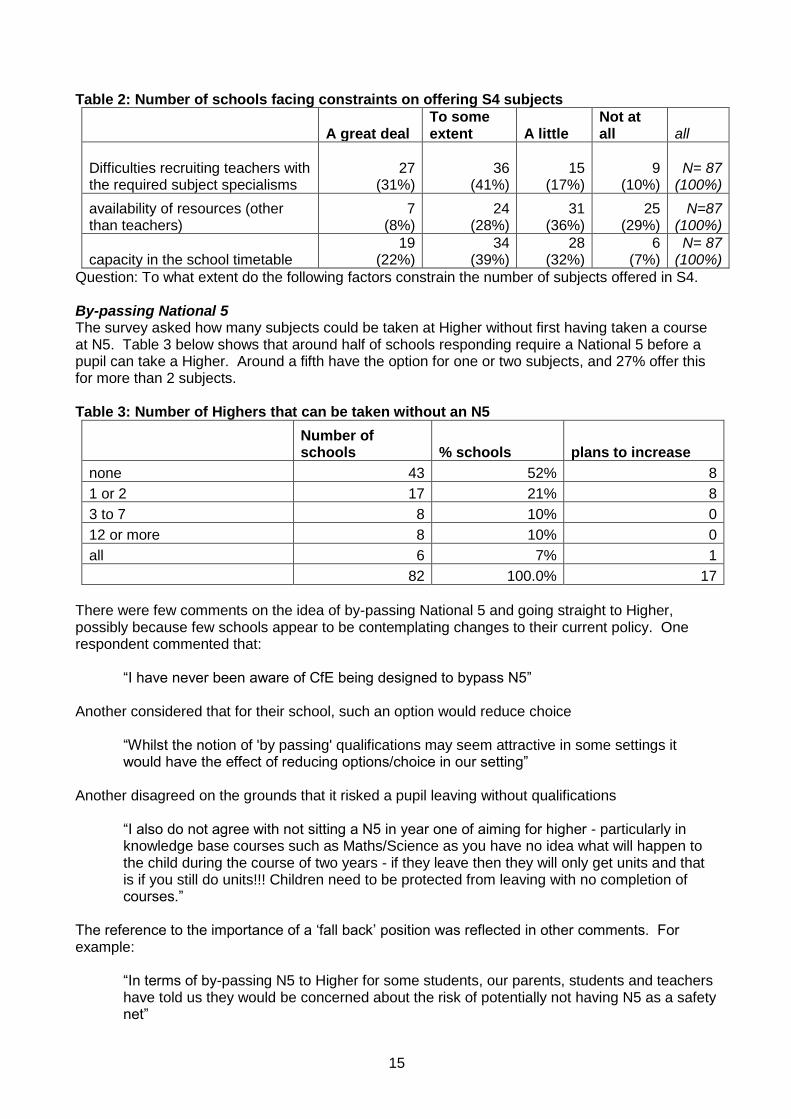
Constraints on the number of subjects offered The survey also asked whether certain factors - recruitment, resources and timetabling capacity – limited the number of subjects offered. Around three quarters of schools considered that difficulty recruiting teachers was constraining subject choice either a great deal or to some extent. Nine respondents made comments about staffing constraints. For example one said:
“increasingly choices in the Senior Phase are driven by what we can staff due to very challenging recruitment difficulties in the North East rather than the school’s rationale for our Senior Phase curriculum.”
Timetabling capacity also acted as a constraint, but to a lesser extent (61% said it impacted ‘to some extent’ or ‘a great deal’). Interestingly, for 29% of schools, resources (other than teachers) did not act as constraint at all. However it is possible that the term ‘resource’ might have been interpreted in different ways.
15
Table 2: Number of schools facing constraints on offering S4 subjects
A great deal To some extent A little
Not at all all
Difficulties recruiting teachers with the required subject specialisms
27 (31%)
36 (41%)
15 (17%)
9 (10%)
N= 87
(100%)
availability of resources (other than teachers)
7 (8%)
24 (28%)
31 (36%)
25 (29%)
N=87 (100%)
capacity in the school timetable 19
(22%) 34
(39%) 28
(32%) 6
(7%) N= 87
(100%)
Question: To what extent do the following factors constrain the number of subjects offered in S4. By-passing National 5 The survey asked how many subjects could be taken at Higher without first having taken a course at N5. Table 3 below shows that around half of schools responding require a National 5 before a pupil can take a Higher. Around a fifth have the option for one or two subjects, and 27% offer this for more than 2 subjects. Table 3: Number of Highers that can be taken without an N5
Number of schools % schools plans to increase
none 43 52% 8
1 or 2 17 21% 8
3 to 7 8 10% 0
12 or more 8 10% 0
all 6 7% 1
82 100.0% 17
There were few comments on the idea of by-passing National 5 and going straight to Higher, possibly because few schools appear to be contemplating changes to their current policy. One respondent commented that:
“I have never been aware of CfE being designed to bypass N5” Another considered that for their school, such an option would reduce choice
“Whilst the notion of 'by passing' qualifications may seem attractive in some settings it would have the effect of reducing options/choice in our setting”
Another disagreed on the grounds that it risked a pupil leaving without qualifications
“I also do not agree with not sitting a N5 in year one of aiming for higher - particularly in knowledge base courses such as Maths/Science as you have no idea what will happen to the child during the course of two years - if they leave then they will only get units and that is if you still do units!!! Children need to be protected from leaving with no completion of courses.”
The reference to the importance of a ‘fall back’ position was reflected in other comments. For example:
“In terms of by-passing N5 to Higher for some students, our parents, students and teachers have told us they would be concerned about the risk of potentially not having N5 as a safety net”

16
Similarly, another stated that the idea had not been supported by parents.
“The original consultation with parents (on Senior Phase) showed that they did not support the idea of going straight to Higher without the N5.”
Direct entry may be more common in some subjects rather than other. One commented:
“Direct entry is common in subjects such as Business Management, Physical Education, Modern Studies and to a lesser extent in Art, Graphic Communication, Design & Manufacture, Music and Drama.”
Two year highers Linked to the idea of bypassing N5 is the idea of studying Highers over two years – either in S4/S5 or S5/S6. In three quarters of schools responding (62 schools) it is not possible to take a Higher over two years. However 12 of these schools have plans to allow this in future. (See Table 4 below). Table 4: Ability to study Highers over two years
Number of subjects Number of schools % Schools planning to increase
none 62 75% 12
1 or 2 7 8% 1
2 to 24 6 7% 1
All 8 10% 1
N= 83 Eight respondents provided comment on the two year higher. Constraints discussed included the timetabling and staffing difficulties in offering this, particularly in small schools. One said:
“only a large school could manage the challenge of timetabling both one year and two year Higher course in the same session.”
It was also suggested that better articulation between N5 and Higher would mean students could be taught the same content, but be examined at different levels, and this would ease timetabling issues. There were several comments that a two year Higher is offered or planned over S5/S6 but not S4/S5. Taking three sciences In a letter to the Committee, Education Scotland stated that while schools enable 3 sciences where needed, very few pupils actually take this up.
“I can confirm that our inspectors are finding that secondary schools are generally still making arrangements for three sciences where needed. Indeed, the percentage of young people taking 3 science subjects to qualifications has remained around the same over the past few years with only slight fluctuations. It has ranged from 3.1% to 3.6% across the 2012 (3.1%) to 2016 (3.2%) period.” (Education Scotland letter dated 16th December 2016)
From the survey it appears that the vast majority of schools allow pupils to study three sciences in one year and almost all enable this over the Senior Phase as a whole. The Committee has also asked Scottish HEIs about their standard entry requirements for courses such as medicine and whether this requires 3 sciences at one sitting. Table 5: % schools that allow three sciences, in one year and across Senior Phase
% schools n=

17
At National 5 in S4 83% 87
At National 5 during Senior Phase 95% 86
At Higher in S5 83% 86
At Higher during Senior Phase 98% 86
There were few comments on this subject. However, one respondent mentioned that teacher recruitment difficulties led to pupils being taught by a non-specialist prior to S4 and that:
“this then impacts on attainment further up the school. Unless we recruit further in science for next session, we may have to limit the number of pupils taking sciences in the Senior Phase next year.”
One respondent referred to university entrance requirements:
“we have been assured by several Universities that they do not have a requirement for 3 Sciences at one sitting. In fact, they have said they are keen that young people show that they can pick up a 3rd science in S6 and show continuing commitment and the ability to learn new subjects.”
There was however one comment that pupils should not be sitting all three sciences:
“I am an ex PT Science. There is absolutely no need to take three sciences in the traditional sense and that includes for high tariff courses such as Medicine.”
Vocational subjects A number of respondents also referred to the importance of vocational pathways and collaboration with other schools and colleges. There were references to existing or planned collaboration although one respondent said that they were planning to increase their in-house provision due to the impact that travel time had on other subjects and the extra costs of provision in college. Camilla Kidner SPICe 16th February 2017
Agenda Item 2 ES/S5/18/22/2
1
EDUCATION AND SKILLS COMMITTEE
22nd Meeting, 2018 (Session 5), Wednesday, 19 September 2018
2018 Exam Diet- curriculum and attainment trends
Submissions Pack
This paper contains submissions received from four of the witnesses. Annexe A: Dr Alan Britton University of Glasgow Annexe B: Professor Jim Scott, University of Dundee Annexe C: Dr Marina Shapira, University of Stirling Annexe D: Scottish Qualifications Authority

Agenda Item 2 ES/S5/18/22/2
2
Annexe A
Dr Alan Britton Senior Lecturer in Education, University of Glasgow (writing in a personal capacity)
a) Relevant areas of specialism:
• Education policymaking and governance;
• The origins and evolution of A Curriculum for Excellence from National Debate
through to implementation;
• The distribution of roles among key stakeholder organisations in Scottish
education
b) Key themes/observations
The knowledge and expertise that I understand might be most relevant and useful to this
sitting of the Committee is mainly derived from empirical work I undertook a number of
years ago, into the origins and the development of A Curriculum for Excellence (CfE).
Having been a secondary school teacher, a civil servant, a Parliamentary official and an
education academic I came at this theme from a number of different analytical
perspectives. First and foremost, however, I sought to penetrate the often opaque forms
(at least as viewed by those on the ‘outside’) of policymaking and governance
undertaken in Scotland. This kind of disaggregated policymaking and governance is often
characterised by “pluralism, incoherence, [and] complexity” Cairney and McGarvey1,
2013: p142)
My research questions related to whether new forms of policymaking - consultative,
transparent, and participative – had emerged in the post-devolution era, drawing on
models such as the CSG Report (Scottish Office, 1998)2:
I undertook documentary analysis, and interviewed senior officials from across a range of
relevant stakeholder organisations (civil service, SQA, HMIE, Learning and Teaching
Scotland, as well as members of the original CfE Review Group) to evaluate the extent to
which the claims around new policymaking had translated into particular policymaking
practices, with specific reference to CfE. One key theme that emerged in my research
was the complex policy architecture in Scottish education, and the tendency of this
architecture to affect and sometimes distort, education policy development.
Looking back on this research, the issues that are now emerging in relation to curriculum
narrowing and changing patterns of presentation at SQA Examinations can be attributed
at least in part to decisions taken some time ago. The current issues of concern to the
Committee might best be characterised as unintended but inevitable
consequences of the courses of action decided in the implementation of CfE,
notably in the period around 2004-2008.
1 Cairney, P. & McGarvey, N. (2013) Scottish Politics, 2nd Edition. Basingstoke, Palgrave MacMillan 2 http://www.parliament.scot/PublicInformationdocuments/Report_of_the_Consultative_Steering_Group.pdf

Agenda Item 2 ES/S5/18/22/2
3
In Figure 1 below I set out the key stages in the implementation of CfE for ease of
reference.
Figure 1: The Genealogy of A Curriculum for Excellence (Britton, 2013)3
The CfE Review Group was convened as a direct response to the National Debate in
2002. According to the subsequent Review Group Report, “People argued for changes
which would:
• reduce an overcrowded curriculum
• better connect the different stages of the 3-18 curriculum
• achieve a better balance between ‘academic’ and ‘vocational’ subjects
• equip young people with new skills for tomorrow’s workforce
• make sure that assessment and certification support learning
• allow more choice to meet the needs of individual young people”
(Adapted from SEED, 2004: p7, emphasis added)
3 Britton, Alan D. (2013) The genealogy and governance of ‘A Curriculum for Excellence’. A case study in educational policymaking in post-devolution Scotland. Ed.D thesis, University of Glasgow. Available at: http://theses.gla.ac.uk/4054/

Agenda Item 2 ES/S5/18/22/2
4
I have highlighted some of the bullet points above as they seem pertinent to the current
concerns around the narrowing of curriculum choice in many schools and local
authorities, and the negative impact on particular areas of the curriculum, including
modern languages. How, despite these clear policy intentions stated above, did we arrive
at this situation?
Key points on the current situation and how we got here:
1. The implications of the underlying educational philosophy of CfE for the
qualifications and examinations regime in Scotland were seen as too sensitive and
challenging in 2004, and were consciously delayed, ‘kicked into the long grass’.
2. Despite the emphasis in CfE on a coherent curriculum from 3-18, the reality was
that the curriculum retained the traditional split in middle secondary, only this was
shifted from a transition at S2-S3 to one in S3-S4.
3. In the context of CfE, the developments after 2004 focused on the creation of a
‘curriculum’ from early years to the end of the Broad General Education (BGE),
but with a ‘syllabus’ thereafter.
4. The post BGE phase did not receive the same pedagogical consideration as the
earlier levels, and the strong messages about the need to revisit aspects of
teaching and learning from the CfE review were not addressed to the same extent.
5. While Learning and Teaching Scotland, with the support of HMIE and the subject
groups (which included large numbers of experienced practitioners) developed the
Es and Os, preparation of the revised Senior phase was to some extent
outsourced, and only belatedly in the process, to SQA.
6. The 3rd year was essentially removed from the middle/senior phase, leaving only
one year to cover the Nationals. In the past, S3 was a year in which schools could
prepare pupils for the certification phase, and you could prepare larger numbers of
pupils for presentation at the end of S4. This also limits the scope for extension,
e.g. Credit at start of 3rd year in the old arrangements.
7. Now, schools tend to ‘run out of road’ at the end of level 4 in CfE. The
underpinning philosophy of CfE comes up against logistical and practical
challenges in S4. For example, if a pupil is working at a level above level 4 in S3,
where do they go? And in S4, there are simply not enough actual or notional
learning hours to offer more than 6 qualifications, and sometimes as few as 5.
8. Curriculum narrowing, while not being actively pursued, seems to be inevitable in
this context. Under the old system 8 Standard Grades was the norm (in perhaps
90% of schools). The process of narrowing was conscious and phased in the old
system (5-14 breadth– 8 Standard Grades-4/5 Highers). Now pupils have to make
choices at the end of S3 [and sometimes earlier] from a narrower field. From 6
subjects in S4 to 5 in S5 seems to represent a very limited degree of choice.
Agenda Item 2 ES/S5/18/22/2
5
9. There are challenging implications for the current approach – in relation to limited
choice in STEM subjects, for example, and the gradual marginalisation of other
subject areas. Schools can’t always provide the choices the pupils make. This
directly contradicts the principles of curriculum design –including breadth, depth,
personalisation and choice. There was previously room in 4th year for arts, music,
‘minority’ subjects, and more than one language. A 1+ 2 approach to languages
earlier in the system fails to be matched by the landscape of choice available to
pupils subsequently.
10. A crucial technical point relates to timetabling and organisation – schools often try
to create an integrated senior phase timetable from S4-S6. This approach brings
lots of benefits, including economies of scale, and being able to include S4-S6
pupils in one class where necessary. S5 pupils have enough time under this
model, but S4s less time to undertake broader course choices. There are also
technical challenges around cross-matching column choices.
11. The fundamental architecture was not entirely thought through from the outset,
and now schools are having to retro-fit solutions due to organisational pressures in
light of the qualifications framework – elements of the pedagogy and original
purposes of CfE have been diminished, while there has also been a challenge to
the integrity of subject specialism.
12. The hugely varied practices across the country in relation to curriculum choice
demonstrate problems of governance. There is a need to address the tensions
between centralised oversight on the one hand; and assumptions of devolved
responsibility and subsidiarity.
13. From a wider systems perspective, we have reached a point where a number of
unintended consequences have taken root.
Agenda Item 2 ES/S5/18/22/2
6
Annexe B
Professor Jim Scott, School of Education and Social Work , University of Dundee
Unintended or Unexpected?: The Impact of Curriculum for Excellence on Secondary School Curriculum and Attainment
Summary
This paper analyses the changing shape of the Scottish secondary curriculum, resulting from national, local authority and school interpretation and implementation of the national Curriculum for Excellence (CfE) initiative of 2003 and its associated documentation. The paper also considers the impact of CfE and the associated ‘new’ National Qualifications (nNQs), introduced from 2013-2014, on attainment in Scottish secondary schools, seeking to answer the question:
“Have the introduction of the Curriculum for Excellence initiative from 2010 and the availability of linked “new” National Qualifications impacted on curricular structures, subject enrolments and/or attainment in Scottish secondary schools?”
The findings of the paper include evidence of extensive fragmentation of the S1-3 curriculum across a significant proportion of Scottish secondary schools, narrowing or severe narrowing of the S4 curriculum in a majority of Scottish secondary schools, a highly significant and continuing trend of decline in overall attainment at SCQF levels 3-5 since 2013, a smaller decline at SCQF level 6 (Higher), issues related to the ‘passability’ of SCQF level 5 courses, subject areas where the curricular presence has significantly to very significantly declined since 2013 and an apparent failure of the part of many Scottish schools to provide parents and pupils with the necessary information to allow them to decide which school would be most beneficial for enrolment by individual learners.
Introduction
CfE arose from the outcomes of the National Debate on Education instituted by the Labour-Liberal Scottish Executive in 2002. The original intent of this major curriculum initiative was both far-reaching and unprecedented, intending to take a unified approach to the entire curriculum experienced by Scottish children and young people in the 3-18 age range. As has often been the case with Scottish education, intention and implementation may, however, diverge. This may be seen in the non-implementation or changed forms of prior major Scottish initiatives such as 10-14, Modern Languages in the Primary School (versions 1 and 2), ‘Citizens of a Multilingual World’, the Brunton and Howie vocational initiatives, the Journey to Excellence, the Curriculum Flexibility initiative and, currently, the 1+2 initiative.
In the case of CfE, the 3-18 curriculum changed into a 3-15 curriculum developed by successive national working parties, supported by Learning and Teaching Scotland, and a 15-18 curriculum in which the Scottish Qualifications Authority played a more central role, despite stating repeatedly that it was not a curriculum agency. Given the subsequent (lack of) curricular support materials, the two-curriculum model appears to have eroded further, returning to a 3-12 model, followed by the secondary Broad General Education phase (BGE) in S1-3 and a secondary Senior Phase (S4-6), within which all qualifications-related activity occurs.
Agenda Item 2 ES/S5/18/22/2
7
This three-curriculum model is remarkably similar to the pre-CfE model, with the principal difference being that the boundary between non-certificable and certificable learning has been moved one year further back. Leaving philosophical considerations aside for a moment, this is a surprising outcome as one of the key issues from the National Debate was to reduce the examination pressure, commonly described at that time as the ‘two-term dash’, which was then evident in S5 and S6 certificate courses. It surely could not have been intended, therefore, that one outcome of the three-curriculum model was to replace two ‘two-term dashes’ with three?
However, philosophical and theoretical considerations also play a part in the difficulties in which CfE finds itself. Priestley and Humes (2010) analyse the internal contradictions within CfE, most notably the striking dichotomy between the ‘curriculum as process’ model inherent in the Four Capacities and the significantly more prescribed, content-driven model of the Experiences and Outcomes. From a reading of the successive CfE reports and papers, the differences of intent and approach of the National Debate report (Scottish Executive, 2002), A curriculum for excellence (Scottish Executive, 2004a), the Ministerial response (Scottish Executive, 2004b), Progress and Proposals (Scottish Executive, 2006) and Building the curriculum 3 (Scottish Government) are evident. These developments might be described as a tale of four committees and two governments, each apparently possessing – from the key statements in their publications –different intentions. Thus, CfE appears to conform to the previously stated Scottish pattern where intention and implementation diverge, although in this case it appears accurate to suggest that there have been repeated divergences.
The answer to the initial question of this paper therefore appears to be “yes”, with respect to the curriculum, and “possibly so” with respect to attainment. The remainder of the paper considers findings deriving from the available curricular and attainment evidence which might confirm or contradict such an analysis.
Section 1: The Secondary Curriculum
Part 1: The Broad General education (S1-3)
Concern about how to improve the early (S1-2) and middle (S3-4) years of Scottish secondary education is not new, or unique to CfE. This has been a recurring post-war theme in Scotland, providing much of the argument underpinning the Advisory Council on Education in Scotland’s (ACES) seminal report on secondary education (ACES, 1947), the Ruthven Report (CCC, 1967), the Munn Report (SED/CCC, 1977), the 10-14 report (CCC, 1986) and the 5-14 Report (SED, 1987), before reappearing in the last pre-CfE report on the early secondary curriculum, the 1997 report by Her Majesty’s Inspectorate of Education (HMI) Achieving Success in S1/S2: A report on the Provision in S1/S2 (HMI, 1997). This last report suggested that S1 and S2 pupils across Scotland were experiencing undue fragmentation of their curricular (and thus learning) experience due to a range of factors, particularly through encountering too many discrete subjects - and often too many teachers - in a week, thus significantly reducing the coherence and impact of their experience. HMI also suggested that single-period ‘taster courses’ contributed little of benefit to the students’ learning and secondary schools were therefore enjoined to reduce the numbers of teachers and subjects experienced by S1 pupils to approximately a dozen and to eliminate taster courses. Although 20 years old, there appears to be logic in this HMI view from a learner’s perspective. It bears careful comparison with the current picture, outlined in this section.
Interestingly, the precursor of CfE, the National Debate on Education (2002), did not seek to change the early secondary curriculum. The outcomes of the National Debate were analysed by a research team led by Professor Pamela Munn. Their findings (e.g. Munn et
Agenda Item 2 ES/S5/18/22/2
8
al., 2004), suggested that key priorities for the Scottish public included retaining the 5-14 curriculum for S1 and S2 pupils and the maintenance of a broad and balanced curriculum until age 14 (i.e. the end of S2), followed by a period of increased choice in S3 and S4, leading to national examinations at the end of S4. Two further priorities lay in reducing the time pressure on students engaged in study for national examinations and in reducing the ‘cluttering’ of the primary and, as per the 1997 HMI report, early secondary curricula.
The Curriculum for Excellence project was launched in 2003, through the establishment of a Curriculum Review Group (CRG), chaired by a senior civil servant and populated by several leading educational thinkers. The principal requirement upon them (SPICe, 2008, p.7) was to identify the purposes of education for the 3-18 age range and to determine principles to be applied in redesigning the curriculum. The group’s proposals were published as A curriculum for excellence (Scottish Executive, 2004a), closely followed by
the Scottish Executive’s response (Scottish Executive, 2004b).
The first of these two documents includes the following curricular proposals:
• a single curriculum from 3-18, supported by a “simple and effective” structure of
assessment and qualifications:
• greater choice and opportunity, earlier, for young people
• more space in the curriculum for work in depth
(Scottish Executive, 2004a, p.6)
Taking on the concerns of both HMI and the National Debate, the first document also suggests (ibid., p.10) that the curriculum should “not be too fragmented or over-crowded with content”, should include a “broad, suitably-weighted range of experiences” (ibid., p.14) and should “form a coherent experience” (ibid., p.15).
The Scottish Executive response (Scottish Executive, 2004b), after discussion of ‘decluttering’ the primary curriculum, moves to examine the S1-3 secondary curriculum. Previously, the Scottish secondary curriculum had been managed in two-year groupings, S1-2, S3-4 and S5-6, so this rearrangement of curricular structure - neither mentioned by the CRG nor evidenced by the Scottish Executive – came as a surprise to Scottish education as a whole. However, no detailed comments were provided to guide the reader with respect to what this apparent change might mean.
All but two (one a trades union representative) of the CRG members were removed from involvement in the project and a Curriculum Review Programme Board (CRPB) replaced the CRG committee. The CRPB’s final report, A curriculum for excellence: progress and proposals (Scottish Executive, 2006), made clear – without rationale or comment - that the unified 3-18 curriculum of the CRG report had become two discrete 3-15 and 15-18 curricula, thus replacing the 1980s 5-14 curriculum with a new 3-15 curriculum and truncating the 14-18 examination phase to 15-18, again without discussion or explanation of how this was to be achieved. The imbedded ministerial response to this report offered no further exemplification or explanation of the significant changes contained therein.
The CRPB report focused on the 3-15 phase, with curricular detail limited to an indication that there would be eight curricular areas (health and wellbeing, languages, mathematics, sciences, social studies, expressive arts, technologies and religious & moral education) structured through several hundred specific Experiences and Outcomes, a significant change from the open, process-driven approach of the CRG’s Four Capacities (which had won broad public approval). Discussion of the new S1-3 curriculum in the CRPB report was restricted to indicating that there would be: “greater scope for different approaches to curriculum design in S1 to S3 within clear parameters” (ibid., p. 20). Development of the

Agenda Item 2 ES/S5/18/22/2
9
15-18 phase was effectively transferred to the Scottish Qualifications Agency, a qualifications body rather than a curricular agency, as the qualifications developed by them inevitably impacted heavily on the enabling curriculum.
Details of the new S1-3 curriculum did not emerge until Building the Curriculum 3 (BtC3): a framework for learning and teaching (Scottish Government, 2008), which presented a learner’s entitlements, including:
• a coherent curriculum from 3 to 18
• a broad, general education [from age 3 to 15], including well planned experiences and outcomes across all the curriculum areas
• a senior phase [16-18] which provides opportunities for study for qualifications and other planned opportunities for developing the four capacities
• opportunities for developing skills for learning, skills for life and skills for work (ibid., p.13)
BtC3 is the principal (and almost the only) CfE document on the curriculum and its planning/development. However, discussion of the curriculum itself is limited to six pages (pp. 20-25) of the document, with perhaps the most significant statement being that, particularly in secondary schools, subjects would remain “an essential feature of the curriculum”, with “subjects increasingly being the principal means of structuring learning and delivering outcomes.” (ibid., p.20). Given the importance (and acceptance) of the Four Capacities within CfE and the Process Curriculum (Kelly, 2009, pp. 89-98) that they appeared to foreshadow, this reversion to a subject and content-based model is seen by Priestley & Humes (2010, p.6) to have allowed/encouraged “the continuation of subject fiefdoms … in which subject teachers saw their principal allegiance to their specialist discipline rather than to any broader conception of the learning process or the personal development of pupils”.
This section has recorded the stuttering and, at times, orthogonal progress of the national planning for CfE and also the lack of effective (and, for periods, any real) curricular exemplification for teachers. It is also important to note, from interviews conducted with governance actors at all layers of governance, that local authorities, headteachers and teachers appear to have themselves contributed – at times and in differing measure - to the issues evident in the implementation of CfE through failure to resolve uncertainties, a lack of coherent and organized vision and planning and, especially in the lower layers of governance, some covert resistance, as suggested by Priestley and Humes. Equally, some teachers, headteachers and local authorities have evidently made considerable efforts to make an underspecified system function well, for the benefit of their pupils.
Although much governmental paper was subsequently devoted to Experiences and Outcomes and to assessment, BtC3 remains the core, and much of the extent, of curricular advice to headteachers and their learning communities, other than some exemplification given in national seminars and by quasi-independent bodies such as the Building Our Curriculum Self-Help (BOCSH) group. Given that an S1-3 broad and general approach was a significant departure from the previous broad S1-2 and examination-focused S3-4, this lack of advice is at least surprising and appears to lead directly to the issues and challenges now evident in individual schools’ and authorities’ implementation of the BGE.
The provision of education in Scotland is the responsibility of local authorities (LAs) and - by extension - of their schools, with a statutory duty to ensure that there is adequate, efficient (and improving) provision of school education in their area (Education Scotland, undated). In order to ascertain the impact of the issues noted in this section on the S1-3 BGE curriculum, the curricular statements of the 32 local authorities and the curricula of
Agenda Item 2 ES/S5/18/22/2
10
the 359 state secondary schools were analysed (Scott, 2017).
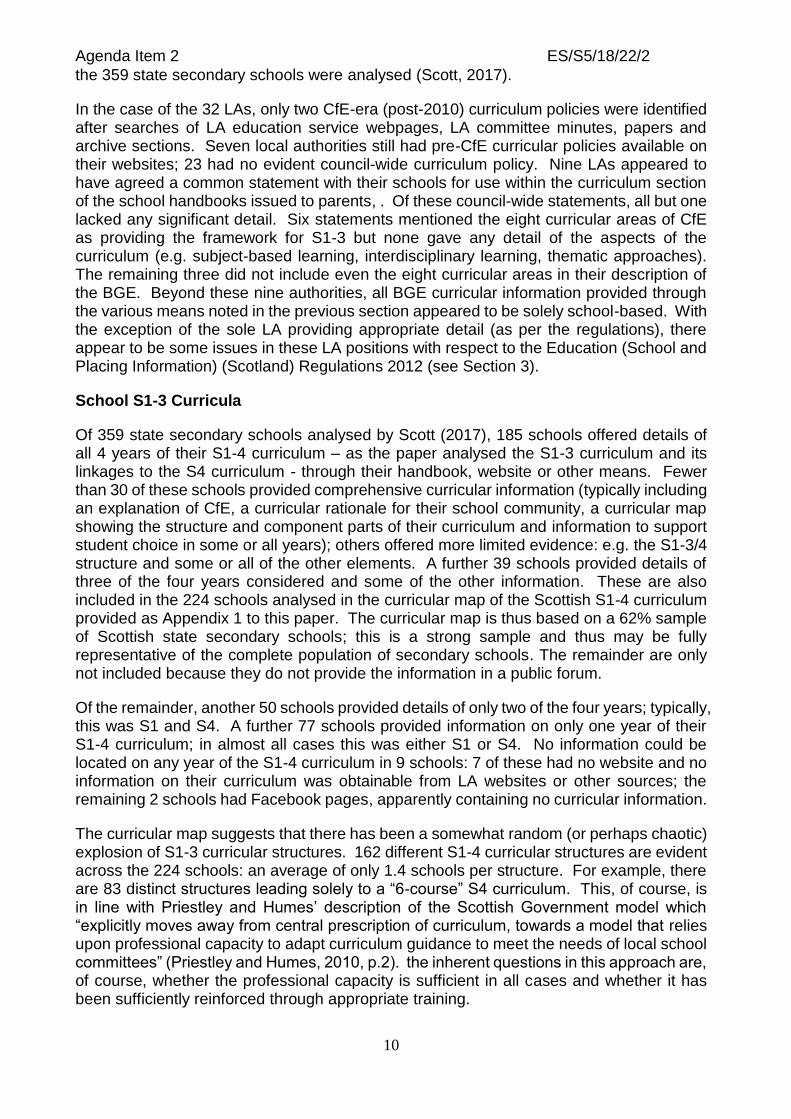
In the case of the 32 LAs, only two CfE-era (post-2010) curriculum policies were identified after searches of LA education service webpages, LA committee minutes, papers and archive sections. Seven local authorities still had pre-CfE curricular policies available on their websites; 23 had no evident council-wide curriculum policy. Nine LAs appeared to have agreed a common statement with their schools for use within the curriculum section of the school handbooks issued to parents, . Of these council-wide statements, all but one lacked any significant detail. Six statements mentioned the eight curricular areas of CfE as providing the framework for S1-3 but none gave any detail of the aspects of the curriculum (e.g. subject-based learning, interdisciplinary learning, thematic approaches). The remaining three did not include even the eight curricular areas in their description of the BGE. Beyond these nine authorities, all BGE curricular information provided through the various means noted in the previous section appeared to be solely school-based. With the exception of the sole LA providing appropriate detail (as per the regulations), there appear to be some issues in these LA positions with respect to the Education (School and Placing Information) (Scotland) Regulations 2012 (see Section 3).
School S1-3 Curricula
Of 359 state secondary schools analysed by Scott (2017), 185 schools offered details of all 4 years of their S1-4 curriculum – as the paper analysed the S1-3 curriculum and its linkages to the S4 curriculum - through their handbook, website or other means. Fewer than 30 of these schools provided comprehensive curricular information (typically including an explanation of CfE, a curricular rationale for their school community, a curricular map showing the structure and component parts of their curriculum and information to support student choice in some or all years); others offered more limited evidence: e.g. the S1-3/4 structure and some or all of the other elements. A further 39 schools provided details of three of the four years considered and some of the other information. These are also included in the 224 schools analysed in the curricular map of the Scottish S1-4 curriculum provided as Appendix 1 to this paper. The curricular map is thus based on a 62% sample of Scottish state secondary schools; this is a strong sample and thus may be fully representative of the complete population of secondary schools. The remainder are only not included because they do not provide the information in a public forum.
Of the remainder, another 50 schools provided details of only two of the four years; typically, this was S1 and S4. A further 77 schools provided information on only one year of their S1-4 curriculum; in almost all cases this was either S1 or S4. No information could be located on any year of the S1-4 curriculum in 9 schools: 7 of these had no website and no information on their curriculum was obtainable from LA websites or other sources; the remaining 2 schools had Facebook pages, apparently containing no curricular information.
The curricular map suggests that there has been a somewhat random (or perhaps chaotic) explosion of S1-3 curricular structures. 162 different S1-4 curricular structures are evident across the 224 schools: an average of only 1.4 schools per structure. For example, there are 83 distinct structures leading solely to a “6-course” S4 curriculum. This, of course, is in line with Priestley and Humes’ description of the Scottish Government model which “explicitly moves away from central prescription of curriculum, towards a model that relies upon professional capacity to adapt curriculum guidance to meet the needs of local school committees” (Priestley and Humes, 2010, p.2). the inherent questions in this approach are, of course, whether the professional capacity is sufficient in all cases and whether it has been sufficiently reinforced through appropriate training.

Agenda Item 2 ES/S5/18/22/2
11
The curricular map suggests that there are questions to be answered about the principles for curricular design of the BGE phase (not least because these have not been the subject of any national publication beyond the few words embedded in page 13 of BtC3 (Scottish Government, 2008). To begin to answer these questions, it is first helpful to try to rationalise the 162 different curricular structures evident in the curriculum map. Closer examination of the map reveals that some of the S1-3 structures leading to 6 qualifications are replicated in those leading to 7 and/or 8 qualifications. Analysing the ‘shape’ of the remaining structures, some common curricular shapes or patterns are evident. These have been collated to form Table 1:
Table 1 S1-3 and S1-4 Curriculum Patterns Evident in Scottish State Secondary Schools
Curriculum Pattern
No. Name Structure Frequency (f) Total f
1 2+1+1: S1-2; S3; S4 Quasi-Traditional (but with S3 increase)
2-1 2-1
3 16
19 (10%)
2 2+1+1: S1-2; S3; S4 Near-Traditional (with S3, S4 decrease)
2-1 2-1
64 25
89 (48%)
3 2+2 Quasi-traditional
S1-4: 1-1-2 S1-4: 2-2
15 7
22 (12%)
4 1+2: S1; S2-3 S1 Transition year + Larger S2-3 Structure
1-2 1-2
1 3
4 (2%)
5 1+2: S1; S2-3 Transition +Smaller S2-3 Structure
1-2 1-2
7 4
11 (6%)
6 “Steady State” (S1-3 all the same)
S1=2=3, then S4 (often S4=5=6 also)
12 12 (7%)
7 S1-3 Med.- Larger-Smaller
M-L-S: M-L-S:
11 7
18 (10%)
8 S1-3 Increasing Wedge (increasing: S1 2 3)
0 2
2 (1%)
9 S1-4 Declining Wedge (decreasing: S1 2 3)
Down Down
6 2
8 (4%)
SUB-TOTAL : 185 (100%)
10 2+1 / 1+2 / 3 Almost complete Data
39 39
11 Insufficient data (0,1 or 2 years of curricular structure)
0: 9 1: 77 (most S4) 2: 50
136
GRAND TOTAL: 360
Notes: 1. and indicate an increase or decrease in the number of subjects experienced,
moving from the earlier phase to the later

Agenda Item 2 ES/S5/18/22/2
12
2. and indicate a significant increase or decrease in the number of subjects experienced
3. M-L-S implies a medium number of subjects in S1 (13-15) followed by an increase in S2 followed by a decrease in S3.
4. ‘Wedge’ implies a curricular model where the number of subjects either declines steadily from S1-3 or rises steadily from S1-3.
Some broad issues emerge from the table. Categories 1-3 and 6 together demonstrate that 77% of secondary schools have a curricular structure where the S1 and S2 structures are either identical or very similar. This corresponds closely to the pre-CfE model derived from the former Scottish secondary curricular guidelines (SCCC, 1989). This approach may be based on authority/ headteacher/parental conservatism or on an intent not to change too many variables at one time. This pattern occurs, however, with anything from 9 subjects to over 20 subjects in S1/2; it would be difficult to perceive curricular structures near the ends of this spectrum as offering the same curricular experiences to students, not least with respect to the breadth and depth of learning. Further, not all these quasi-traditional structures are as close to the pre-CfE structures as might seem to be the case, as a relatively small minority include less-traditional subjects, e.g. work-related activities, additional health and wellbeing units, interdisciplinary learning (although this is visible in only a small minority of schools), Skills units and some topics particular to a single school or authority.
23% of schools in the sample have, however, opted for non-traditional patterns in S1/2 with 11% opting for an increase or significant increase in the number of subjects experienced from S1 to S2 and 12% opting for the opposite pattern. It is possible, although confirmed by only a minority of these schools, that they treat S1 as a year of transition from primary education. Thereafter, the S2-3 curricular structures of this 23% group diverge into 10 different pathways depending on the growth, fluctuation or decline in subjects experienced in S2-3 and the extent to which this occurs. As may be seen from the map, some curricular patterns (e.g. 14-18-19-6; 25-16-16-8) vary significantly from the traditional 14-14-8(+3)-8(+3).
The reason for including S4 in the map is that articulation between the BGE phase and the Senior Phase must be successfully handled if there is to be smooth progression into the first of what, for many pupils, is now a pattern of three ‘two-term dashes’. The S3 curriculum itself was likely to be the area where most structural change from the pre-CfE pattern might be perceived, given its CfE-based move from the middle (certificable) secondary curriculum to the 3-15 Broad General Education (BGE) phase of CfE. With the S3 curriculum leading to 5-, 6-, 7- and 8-course (plus core subjects) S4 structures, it might be expected that the S3 curriculum pattern would be tailored to ensure the smoothest possible approach to the ‘two-term dash’ towards initial qualifications in S4. The actual pattern of linkage, or otherwise, between S3 and S4 is shown in Table 2:
Agenda Item 2 ES/S5/18/22/2
13
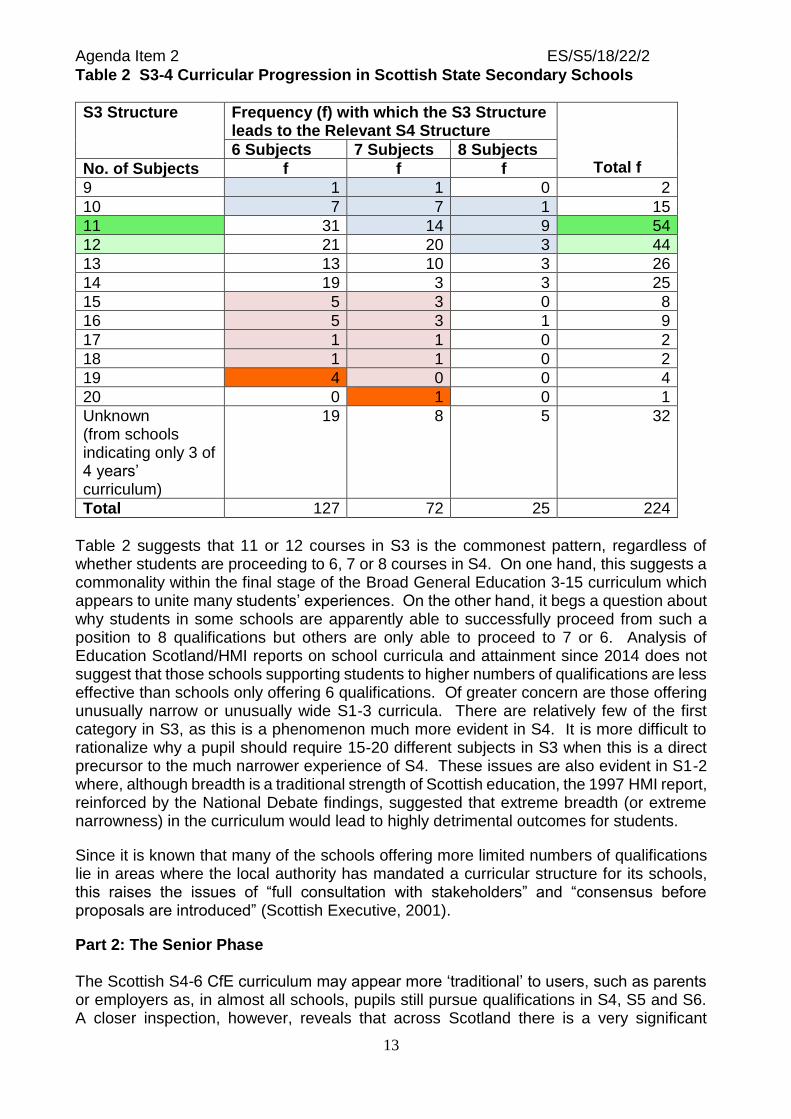
Table 2 S3-4 Curricular Progression in Scottish State Secondary Schools
S3 Structure Frequency (f) with which the S3 Structure leads to the Relevant S4 Structure
Total f 6 Subjects 7 Subjects 8 Subjects
No. of Subjects f f f
9 1 1 0 2
10 7 7 1 15
11 31 14 9 54
12 21 20 3 44
13 13 10 3 26
14 19 3 3 25
15 5 3 0 8
16 5 3 1 9
17 1 1 0 2
18 1 1 0 2
19 4 0 0 4
20 0 1 0 1
Unknown (from schools indicating only 3 of 4 years’ curriculum)
19 8 5 32
Total 127 72 25 224
Table 2 suggests that 11 or 12 courses in S3 is the commonest pattern, regardless of whether students are proceeding to 6, 7 or 8 courses in S4. On one hand, this suggests a commonality within the final stage of the Broad General Education 3-15 curriculum which appears to unite many students’ experiences. On the other hand, it begs a question about why students in some schools are apparently able to successfully proceed from such a position to 8 qualifications but others are only able to proceed to 7 or 6. Analysis of Education Scotland/HMI reports on school curricula and attainment since 2014 does not suggest that those schools supporting students to higher numbers of qualifications are less effective than schools only offering 6 qualifications. Of greater concern are those offering unusually narrow or unusually wide S1-3 curricula. There are relatively few of the first category in S3, as this is a phenomenon much more evident in S4. It is more difficult to rationalize why a pupil should require 15-20 different subjects in S3 when this is a direct precursor to the much narrower experience of S4. These issues are also evident in S1-2 where, although breadth is a traditional strength of Scottish education, the 1997 HMI report, reinforced by the National Debate findings, suggested that extreme breadth (or extreme narrowness) in the curriculum would lead to highly detrimental outcomes for students.
Since it is known that many of the schools offering more limited numbers of qualifications lie in areas where the local authority has mandated a curricular structure for its schools, this raises the issues of “full consultation with stakeholders” and “consensus before proposals are introduced” (Scottish Executive, 2001).
Part 2: The Senior Phase The Scottish S4-6 CfE curriculum may appear more ‘traditional’ to users, such as parents or employers as, in almost all schools, pupils still pursue qualifications in S4, S5 and S6. A closer inspection, however, reveals that across Scotland there is a very significant

Agenda Item 2 ES/S5/18/22/2
14
disparity of experience for learners. The phrase “postcode lottery” is inappropriate in an academic paper. However, in returning to the differing stances adopted by local authorities and schools with respect to their S4 curricular structures - ranging from a formal council requirement to follow one model (usually 6 subjects in S4) to allowing each school to select 5 to 8 courses to suit their ‘local needs’ - the use of the phrase is perhaps representative of the current reality of the Senior Phase in Scottish secondary schools. There is significantly greater variation in secondary curricular structures and examination presentation patterns in the CfE era than was previously the case with O Grades, Standard Grades or the subsequent Higher Still programme. In November 2012, the then Strategic Director (Curriculum) suggested to a regional conference held in Dundee that the S4 curricular balance in schools comprised: a “mixed economy” (5/6 to 8 subjects) in 11 local authorities, 8 subjects in 5 LAs, 7/8 subjects in 4 LAs, 7 subjects in 5 LAs, 6 subjects in 7 LAs and 5 subjects in only “1 or 2 schools”. Since then, neither the Scottish government nor the Convention of Scottish Local Authorities has published such data. Nowhere in the national CfE documentation does it suggest that S4 students should only attempt 6 courses. The Scottish Executive response (Scottish Executive, 2004) to the original CfE report of 2004 failed to mention any shortening of time allocation for the initial S4 national qualifications or to acknowledge that they should be reduced a one-year S4 process. This lack of clarity appears to have subsequently led directly to significant fragmentation and narrowing of the S4 curriculum across Scotland (Scott, 2015a) as local authorities and schools attempted to implement the developing national policy. Figure 1 shows the picture in 2015, demonstrating a significant change from the 2012 position with the overall picture being one of increasing diversity, both within and across local authorities.
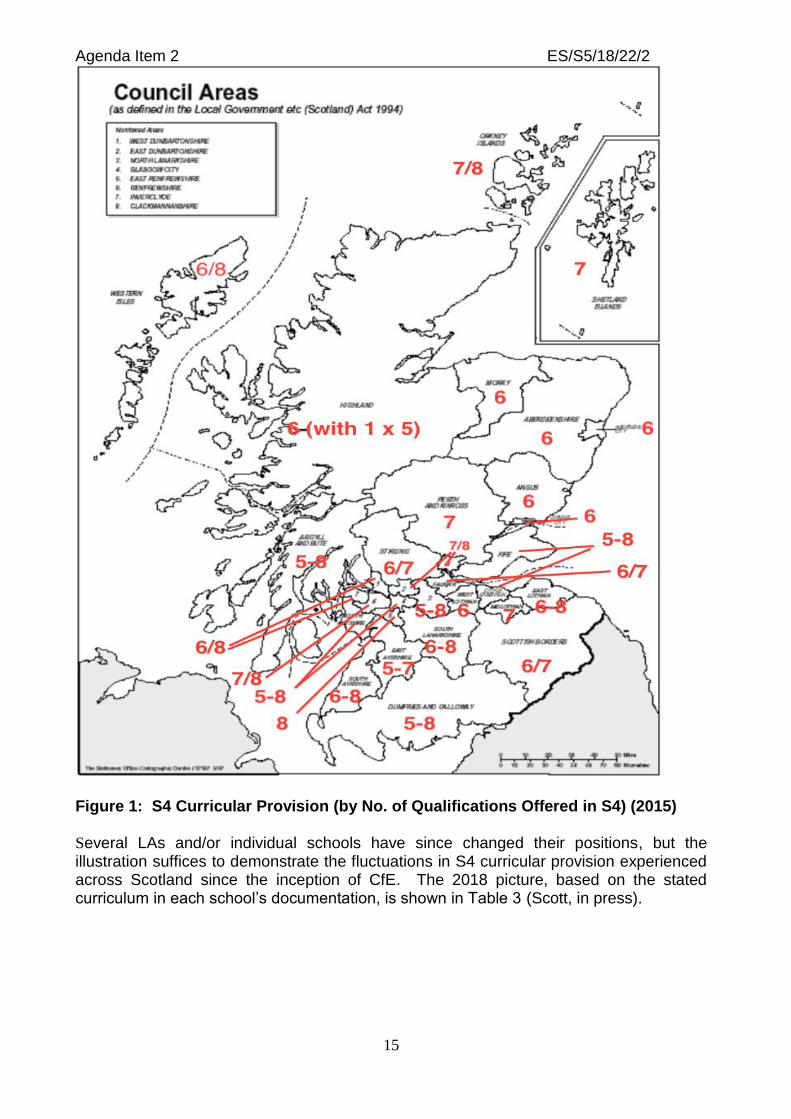
Agenda Item 2 ES/S5/18/22/2
15
Figure 1: S4 Curricular Provision (by No. of Qualifications Offered in S4) (2015)
Several LAs and/or individual schools have since changed their positions, but the illustration suffices to demonstrate the fluctuations in S4 curricular provision experienced across Scotland since the inception of CfE. The 2018 picture, based on the stated curriculum in each school’s documentation, is shown in Table 3 (Scott, in press).
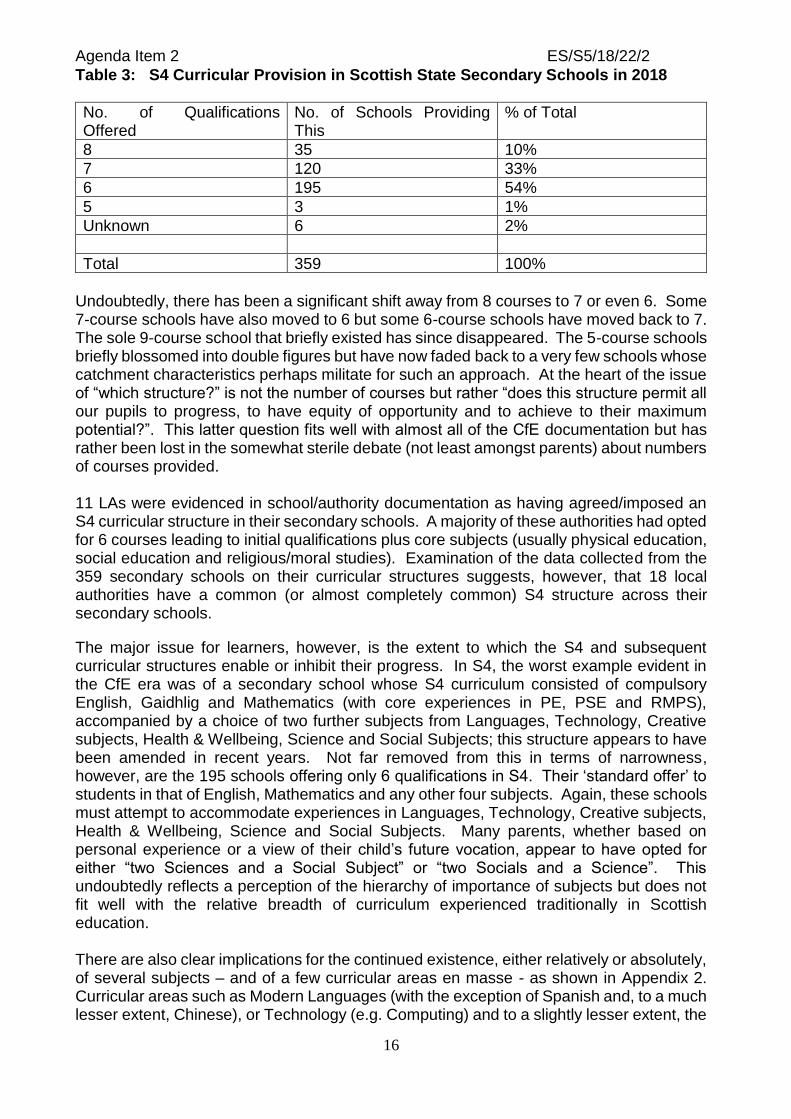
Agenda Item 2 ES/S5/18/22/2
16
Table 3: S4 Curricular Provision in Scottish State Secondary Schools in 2018
No. of Qualifications Offered
No. of Schools Providing This
% of Total
8 35 10%
7 120 33%
6 195 54%
5 3 1%
Unknown 6 2%
Total 359 100%
Undoubtedly, there has been a significant shift away from 8 courses to 7 or even 6. Some 7-course schools have also moved to 6 but some 6-course schools have moved back to 7. The sole 9-course school that briefly existed has since disappeared. The 5-course schools briefly blossomed into double figures but have now faded back to a very few schools whose catchment characteristics perhaps militate for such an approach. At the heart of the issue of “which structure?” is not the number of courses but rather “does this structure permit all our pupils to progress, to have equity of opportunity and to achieve to their maximum potential?”. This latter question fits well with almost all of the CfE documentation but has rather been lost in the somewhat sterile debate (not least amongst parents) about numbers of courses provided. 11 LAs were evidenced in school/authority documentation as having agreed/imposed an S4 curricular structure in their secondary schools. A majority of these authorities had opted for 6 courses leading to initial qualifications plus core subjects (usually physical education, social education and religious/moral studies). Examination of the data collected from the 359 secondary schools on their curricular structures suggests, however, that 18 local authorities have a common (or almost completely common) S4 structure across their secondary schools.
The major issue for learners, however, is the extent to which the S4 and subsequent curricular structures enable or inhibit their progress. In S4, the worst example evident in the CfE era was of a secondary school whose S4 curriculum consisted of compulsory English, Gaidhlig and Mathematics (with core experiences in PE, PSE and RMPS), accompanied by a choice of two further subjects from Languages, Technology, Creative subjects, Health & Wellbeing, Science and Social Subjects; this structure appears to have been amended in recent years. Not far removed from this in terms of narrowness, however, are the 195 schools offering only 6 qualifications in S4. Their ‘standard offer’ to students in that of English, Mathematics and any other four subjects. Again, these schools must attempt to accommodate experiences in Languages, Technology, Creative subjects, Health & Wellbeing, Science and Social Subjects. Many parents, whether based on personal experience or a view of their child’s future vocation, appear to have opted for either “two Sciences and a Social Subject” or “two Socials and a Science”. This undoubtedly reflects a perception of the hierarchy of importance of subjects but does not fit well with the relative breadth of curriculum experienced traditionally in Scottish education. There are also clear implications for the continued existence, either relatively or absolutely, of several subjects – and of a few curricular areas en masse - as shown in Appendix 2. Curricular areas such as Modern Languages (with the exception of Spanish and, to a much lesser extent, Chinese), or Technology (e.g. Computing) and to a slightly lesser extent, the
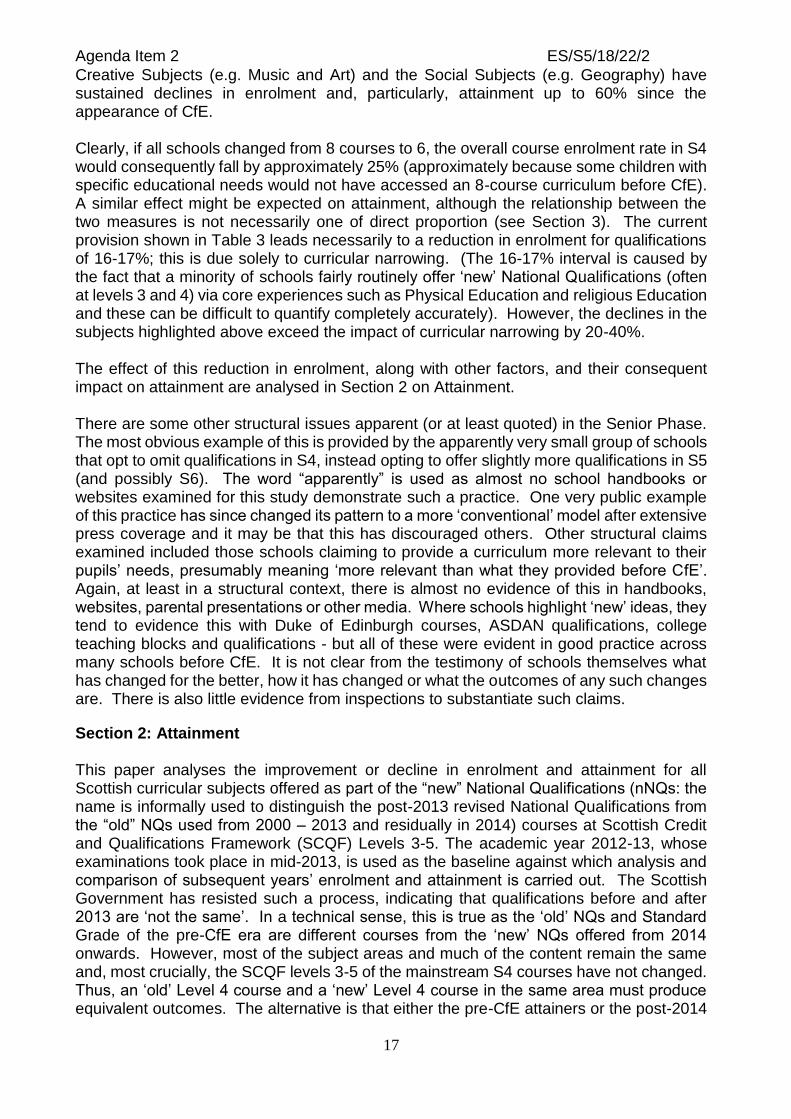
Agenda Item 2 ES/S5/18/22/2
17
Creative Subjects (e.g. Music and Art) and the Social Subjects (e.g. Geography) have sustained declines in enrolment and, particularly, attainment up to 60% since the appearance of CfE. Clearly, if all schools changed from 8 courses to 6, the overall course enrolment rate in S4 would consequently fall by approximately 25% (approximately because some children with specific educational needs would not have accessed an 8-course curriculum before CfE). A similar effect might be expected on attainment, although the relationship between the two measures is not necessarily one of direct proportion (see Section 3). The current provision shown in Table 3 leads necessarily to a reduction in enrolment for qualifications of 16-17%; this is due solely to curricular narrowing. (The 16-17% interval is caused by the fact that a minority of schools fairly routinely offer ‘new’ National Qualifications (often at levels 3 and 4) via core experiences such as Physical Education and religious Education and these can be difficult to quantify completely accurately). However, the declines in the subjects highlighted above exceed the impact of curricular narrowing by 20-40%. The effect of this reduction in enrolment, along with other factors, and their consequent impact on attainment are analysed in Section 2 on Attainment. There are some other structural issues apparent (or at least quoted) in the Senior Phase. The most obvious example of this is provided by the apparently very small group of schools that opt to omit qualifications in S4, instead opting to offer slightly more qualifications in S5 (and possibly S6). The word “apparently” is used as almost no school handbooks or websites examined for this study demonstrate such a practice. One very public example of this practice has since changed its pattern to a more ‘conventional’ model after extensive press coverage and it may be that this has discouraged others. Other structural claims examined included those schools claiming to provide a curriculum more relevant to their pupils’ needs, presumably meaning ‘more relevant than what they provided before CfE’. Again, at least in a structural context, there is almost no evidence of this in handbooks, websites, parental presentations or other media. Where schools highlight ‘new’ ideas, they tend to evidence this with Duke of Edinburgh courses, ASDAN qualifications, college teaching blocks and qualifications - but all of these were evident in good practice across many schools before CfE. It is not clear from the testimony of schools themselves what has changed for the better, how it has changed or what the outcomes of any such changes are. There is also little evidence from inspections to substantiate such claims.
Section 2: Attainment This paper analyses the improvement or decline in enrolment and attainment for all Scottish curricular subjects offered as part of the “new” National Qualifications (nNQs: the name is informally used to distinguish the post-2013 revised National Qualifications from the “old” NQs used from 2000 – 2013 and residually in 2014) courses at Scottish Credit and Qualifications Framework (SCQF) Levels 3-5. The academic year 2012-13, whose examinations took place in mid-2013, is used as the baseline against which analysis and comparison of subsequent years’ enrolment and attainment is carried out. The Scottish Government has resisted such a process, indicating that qualifications before and after 2013 are ‘not the same’. In a technical sense, this is true as the ‘old’ NQs and Standard Grade of the pre-CfE era are different courses from the ‘new’ NQs offered from 2014 onwards. However, most of the subject areas and much of the content remain the same and, most crucially, the SCQF levels 3-5 of the mainstream S4 courses have not changed. Thus, an ‘old’ Level 4 course and a ‘new’ Level 4 course in the same area must produce equivalent outcomes. The alternative is that either the pre-CfE attainers or the post-2014

Agenda Item 2 ES/S5/18/22/2
18
attainers would have the quality of their pass devalued and that appears to be an unlikely political action. Interestingly, the Scottish Government appears to have begun to quote pre-CfE levels against post-CfE levels in some of its parliamentary responses in recent months so there may be at least a tacit acceptance that this is an appropriate course of action. Regardless of any political input tof this issue, this paper employs 2013, the last year of pre-CfE results, as the baseline for analysis of subsequent performance in enrolment and attainment. It should be noted, however, that 2013 was not the strongest year of the 5 years preceding the introduction of “new” National Qualifications. Consequently, the comparison to 2013 rather than, say, 2011 slightly advantages the 2014-2018 results. The courses analysed in Appendix 2 are largely the nNQs provided by the Scottish Qualifications Authority (SQA) since session 2013-14 but the tables include a few relevant “old NQs” and the former Standard Grade Level 3-5 courses as these were all used in the baseline year, 2013, and, to a very limited extent, in 2014. Several significant issues are apparent: 1. the extent of decline in some subjects (e.g. French, German, Gaelic (Learners),
Computing, Geography) is highly significant with a significant minority of subjects demonstrating a decline in enrolments and attainment of 20-40% beyond the decline expected from S4 structural change.
2. This is particularly evident at SCQF level 3 where a notable minority of subjects have experienced overall declines pf 80-90%, including the 17% structural decline. Thiswould be good if the students concerned had risen up to the next SCQF level but there are also highly significant reductions at SCQF Level 4.
3. There is some evidence of improvement in some subjects at SCQF Level 5. This would be expected as, where able students study only 6 (or 7) subjects instead of the former 8, it woud be expected that the concentration of effort would drive up standards in the remaining subjects. This is not, however, a consistent pattern.
4. The core subjects of English and Mathematics would not be subject to the 17% structural reduction for almost all students, as their curriculum will be English (and/or Gaidhlig), Mathematics and 3/4/5/6 other subjects and thus the pattern should be much as before. There appears to be clear evidence of some improvement in the quality of pass post-CfE in these subjects but the decline in overall numbers is puzzling.
5. The population of learners fell slightly during the period analysed but this is not a significant factor when viewed against the overall declines evident in the table.
The table in Appendix 3 demonstrates the global declines in SCQF enrolment and attainment from 2013 to 2018 at SCQF Levels 3, 4 and 5. The overall totals are also given. As may be seen, the pattern in this table is also of decline. Overall attainment has declined from 2013 to 2018 by 33.8%, of which 16-17% may be attributed to curricular narrowing due to structural changes in S4. Again, the impact is apparently most heavily felt amongst learners operating at SCQF Level 3 and, to a lesser extent, Level 4. However, the relatively lesser decline at SCQF Level 5 does not disguise the highly significant overall decline. The author accessed the oldest of these records (those not displayed on the SQA website) with the cooperation of the SQA for an earlier piece of research and thus it is possible to indicate that, since ‘modern’ records began in 1965, there has been no such significant decline, particularly in such a short period. To this significant overall decline must be added the concern that the negative impact of CfE and ‘new’ national Qualifications appears to have fallen most heavily on the least able and parts of the group of average ability. This is clearly
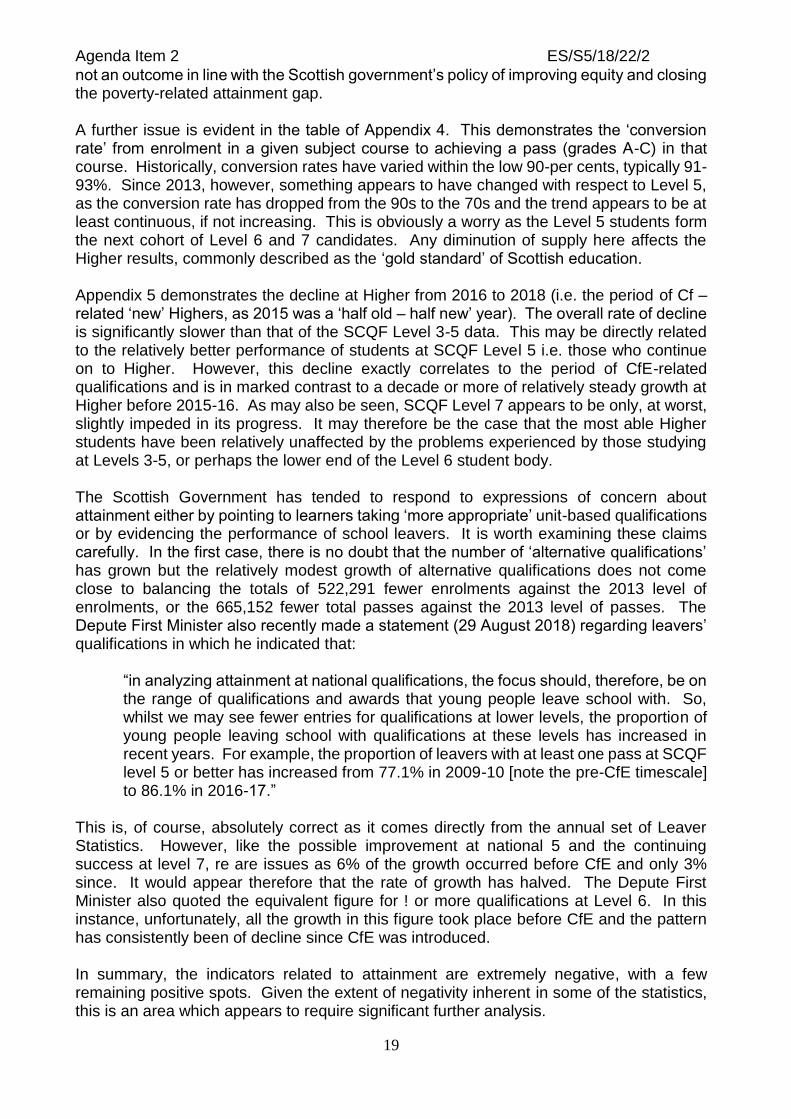
Agenda Item 2 ES/S5/18/22/2
19
not an outcome in line with the Scottish government’s policy of improving equity and closing the poverty-related attainment gap. A further issue is evident in the table of Appendix 4. This demonstrates the ‘conversion rate’ from enrolment in a given subject course to achieving a pass (grades A-C) in that course. Historically, conversion rates have varied within the low 90-per cents, typically 91-93%. Since 2013, however, something appears to have changed with respect to Level 5, as the conversion rate has dropped from the 90s to the 70s and the trend appears to be at least continuous, if not increasing. This is obviously a worry as the Level 5 students form the next cohort of Level 6 and 7 candidates. Any diminution of supply here affects the Higher results, commonly described as the ‘gold standard’ of Scottish education. Appendix 5 demonstrates the decline at Higher from 2016 to 2018 (i.e. the period of Cf –related ‘new’ Highers, as 2015 was a ‘half old – half new’ year). The overall rate of decline is significantly slower than that of the SCQF Level 3-5 data. This may be directly related to the relatively better performance of students at SCQF Level 5 i.e. those who continue on to Higher. However, this decline exactly correlates to the period of CfE-related qualifications and is in marked contrast to a decade or more of relatively steady growth at Higher before 2015-16. As may also be seen, SCQF Level 7 appears to be only, at worst, slightly impeded in its progress. It may therefore be the case that the most able Higher students have been relatively unaffected by the problems experienced by those studying at Levels 3-5, or perhaps the lower end of the Level 6 student body. The Scottish Government has tended to respond to expressions of concern about attainment either by pointing to learners taking ‘more appropriate’ unit-based qualifications or by evidencing the performance of school leavers. It is worth examining these claims carefully. In the first case, there is no doubt that the number of ‘alternative qualifications’ has grown but the relatively modest growth of alternative qualifications does not come close to balancing the totals of 522,291 fewer enrolments against the 2013 level of enrolments, or the 665,152 fewer total passes against the 2013 level of passes. The Depute First Minister also recently made a statement (29 August 2018) regarding leavers’ qualifications in which he indicated that:
“in analyzing attainment at national qualifications, the focus should, therefore, be on the range of qualifications and awards that young people leave school with. So, whilst we may see fewer entries for qualifications at lower levels, the proportion of young people leaving school with qualifications at these levels has increased in recent years. For example, the proportion of leavers with at least one pass at SCQF level 5 or better has increased from 77.1% in 2009-10 [note the pre-CfE timescale] to 86.1% in 2016-17.”
This is, of course, absolutely correct as it comes directly from the annual set of Leaver Statistics. However, like the possible improvement at national 5 and the continuing success at level 7, re are issues as 6% of the growth occurred before CfE and only 3% since. It would appear therefore that the rate of growth has halved. The Depute First Minister also quoted the equivalent figure for ! or more qualifications at Level 6. In this instance, unfortunately, all the growth in this figure took place before CfE and the pattern has consistently been of decline since CfE was introduced. In summary, the indicators related to attainment are extremely negative, with a few remaining positive spots. Given the extent of negativity inherent in some of the statistics, this is an area which appears to require significant further analysis.

Agenda Item 2 ES/S5/18/22/2
20
Section 3: Parental/Pupil Information and Involvement A final codicil to the curricular and attainment analysis carried out in this paper is provided by evaluating the extent to which parents and pupils are sufficiently well-informed to play their part in ensuring that each pupil maximizes their learning and achievement. This paper contains the results of a pilot study carried out as part of a forthcoming paper on Parental Information and Involvement in Scottish Education (Scott, unpublished). The information offered to parents on the curriculum and attainment patterns in Scottish secondary schools was analysed, again using school handbooks, websites, Twitter sites, Facebook sites, parental presentations and other school/authority-provided media. A significant majority of LAs provided web-based information related to their schools. Typically, this included contact details, geographical information, a copy of a (mostly recent) school handbook and, in almost all cases, a link to the schools’ own websites, with some also providing the most recent HMI inspection report. A further sizeable minority provided a school website link but no further information.
Of the 359 secondary schools, 26 (7.2%) fully met the requirements of the Education (School and Placing Information) (Scotland) Regulations 2012 with respect to the curricular and attainment sections of the regulations (clauses 6 and 11 respectively). A further 128 (35.6%) met the curricular requirements fully, but did not, to any extent, meet the attainment reporting requirements and 85 further schools (23.7%) partially met the curricular requirements whilst failing, to any extent, to meet the attainment reporting requirements. 24 schools (6.7%) met the attainment requirements fully, but did not, to any extent, meet the curricular reporting requirements and 9 further schools (2.5%) partially met the attainment requirements whilst failing, to any extent, to meet the curricular reporting requirements. A further 19 schools (5.3%) partially met both sets of requirements. Finally, 68 secondary schools (19.0%) neither met the curricular nor attainment requirements.
Of the 359 secondary schools, 130 schools provided no information on their examination presentation policy, either in their handbook, in their curricular choice information, in parental PowerPoint/Prezi presentations on course choice or on their websites (although not all of the requisite evidence was available in a minority of these schools). Significantly, however, a further 35 schools indicated that they only presented students for courses at SCQF levels 4-5, thus apparently providing no curricular/qualifications pathway for the least able. Seven of the 35 schools indicated that this was because all their students had already completed work at curricular level 3 of CfE in S2/3 and moved on to work at curricular level 4 in S4 and so, in their view, had no need of a qualification at SCQF Level 3. This appears to suggest that the author of the school documentation (and/or curriculum and presentation policies) did not understand the difference between CfE curricular levels and SCQF qualification levels. The remaining 28 schools gave no explanation for their lack of Level 3 qualifications, although examination of school catchment areas revealed that almost a half of these were sited in relatively prosperous suburban areas with smaller (but in most cases demonstrable) populations of students for whom Level 3 qualifications might be appropriate.
Conclusion
The findings of the paper - evidence of extensive fragmentation of the S1-3 curriculum across a significant proportion of Scottish secondary schools, narrowing or severe
Agenda Item 2 ES/S5/18/22/2
21
narrowing of the S4 curriculum in a majority of Scottish secondary schools, a highly significant and continuing trend of decline in overall attainment at SCQF levels 3-5 since 2013, a smaller decline at SCQF level 6 (Higher), issues related to the ‘passability’ of SCQF level 5 courses, subject areas where the curricular presence has significantly to very significantly declined since 2013 and an apparent failure on the part of many Scottish schools to provide parents and pupils with necessary information – are not, of themselves, an end point. Rather, they represent a stimulus to further research to identify the causal connections linking some/many of the issues raised. The author of this paper was part of the national ‘CfE sales force’ for some years and (still) personally believes that the original vision can be delivered. It would be wise, however, for anyone connected with CfE to accept that 5 cohorts of learners have received far less than the benefits envisaged by Scottish education through CfE. This cannot continue unchanged.
REFERENCES Advisory Council on Education in Scotland (1947) Secondary Education. Edinburgh: HMSO.
Angus Council Education Committee (1998) Report No. 867/98: “Achieving Success in S1/S2” – Proposals for Action. Forfar, Angus: Angus Council.
Consultative Committee on the Curriculum (CCC, later SCCC) (1967) Organisation of Courses leading to the Scottish Certificate of Education. Edinburgh: Her Majesty’s Stationery Office (HMSO). [The Ruthven Report]
CCC (1986) Education 10-14 in Scotland. Dundee: SCDS. Munn, P. Stead, J., McLeod, G., Brown, J. et al. (2004). Schools for the 21st century: the national debate on education in Scotland. Research Papers in Education, 19(4), pp.433-452. Available at: www.uws.ac.uk/workarea/downloadasset.aspx?id=2147498045 (Accessed: 15.01.18).
Priestley M. & Humes W. (2010) The development of Scotland’s Curriculum for Excellence: Amnesia and Déjà Vu, Oxford Review of Education, 36 (3), pp. 345-361.
Priestley, M. and Minty, S. (2013) ‘Curriculum for Excellence: ‘A brilliant idea, but...’ ’. Scottish Educational Review, 45 (1), pp.39-52.
Scott, J. (2015a) The Governance of Curriculum for Excellence in Scottish Secondary Schools: Structural Divergence, Curricular Distortion and Reduced Attainment. Evidence paper presented to the 2015 OECD Team investigating Scottish Education. Available at: http://www.academia.edu/20171586/OECD_Evidence_Paper_2015 (Accessed: 02.03.18).
Scott, J. (2015b) ‘Modern Languages in Scotland: Learner Uptake and Attainment 1996-2014’. Scottish Languages Review, 29, pp. 11-26.
Scott, J. (in press) Curriculum for Excellence and Attainment: Reinforcing Success for the Able and Failure for the Less Able? [To be available in mid/late 2018.]
Scottish Consultative Committee on the Curriculum (SCCC) (1989) Curriculum Design for the Secondary Stages: Guidelines for Headteachers. Edinburgh: HMSO.
Scottish Education Department (SED) / CCC (1977) The Structure of the Curriculum in the Third and Fourth Years of the Scottish Secondary School. Edinburgh: HMSO.
SED (1987). Curriculum and assessment in Scotland: A policy for the 90s. Edinburgh: HMSO.
[The 5-14 Report.]

Agenda Item 2 ES/S5/18/22/2
22
Scottish Executive (2004a) A curriculum for excellence. Edinburgh: Scottish Executive.
Scottish Executive (2004b) A curriculum for excellence: Ministerial response. Edinburgh: Scottish Executive
Scottish Executive (2006) A curriculum for excellence: progress and proposals. Edinburgh: Scottish Executive.
Scottish Government (2008) Building the curriculum 3: a framework for learning and teaching. Edinburgh: Scottish government.
Scottish Parliament Information Centre (SPICe) (2008) SPICe Briefing: The School Curriculum – Proposals for Change. Edinburgh: Scottish Parliament.

Agenda Item 2 ES/S5/18/22/2
23
APPENDIX 1: S1-4 Curricular Map
The map provided in this appendix illustrates the S1-4 curricula of all 224 (of the then 360) schools which provided sufficient curricular information to enable their curriculum to be mapped.
Part 1: S1-3 Curricular Structures Leading to 6 Qualifications in S4
Structure No.ofCoursesinS1 No.ofCoursesinS2 No.ofCoursesinS3 No.ofCoursesinS4
1 8(1) 10(1) 10(1)
2 10(1) 11(1)
3 11(1)
4 ?(1)
5
6
7 11(1)
8 12(1)
9
10
11 14(1)
12 18(1)
13 12(1)
14 14(1)
15 14(1) 14(1)
16 ?(1)
17 9(1)18
19
20
21
22
23
24
25 14(1)26
27
28 14(1) 11(1)
29 17(1) ?(1)
30 ?(1) 11(1)
31 13(1) ?(1)
32 ?(1)
33 10(1)34
35
36
37
38
39
40
41 14(1)
42 15(1)
43 16(1)
44
45
46
47 16(3) 11(1)
48 12(1)
49 13(1)
50 18(1) 19(1)
51 10(1) 10(1)
52 11(1) 11(1)
53
54
15(26)
13(2) 12(2)
6(127)
11(5)
14(20)
12(2)
11(3)
11(3)11(2)
12(11)
12(8)
13(2)
?(2)
13(2)
13(14)
13(12)
11(5)
12(2)
16(2)
14(11)
15(3)

Agenda Item 2 ES/S5/18/22/2
24
Structure No.ofCoursesinS1 No.ofCoursesinS2 No.ofCoursesinS3 No.ofCoursesinS4
55
56
57
58
59 10(1)60
61
62
63
64
65
66
67
68
69
70
71
72 15(1)
73 16(1)
74 19(1)
75 17(1)
76 ?(1)
77 ?(1) 13(1)
78 12(1) 12(1)
79 13(1) 13(1)
80
81
82
83 10(1)
84
85
86
87
88
89
90
91
92
93
94
95
96
97
98
99 19(1)
100 17(1) ?(1)
101 14(1) 14(1)
102 15(1) 13(1)
103 12(1)
104 14(1)
105 16(1)
106
107
108 10(2)
6(127)
15(26)
15(20)
14(3)
13(3)
12(2)
11(4)
?(4)
17(2)
?(2)
14(7)
13(2)
12(2)
11(4)
?(3)
17(15)
17(10)
16(3)
16(24)
16(20)
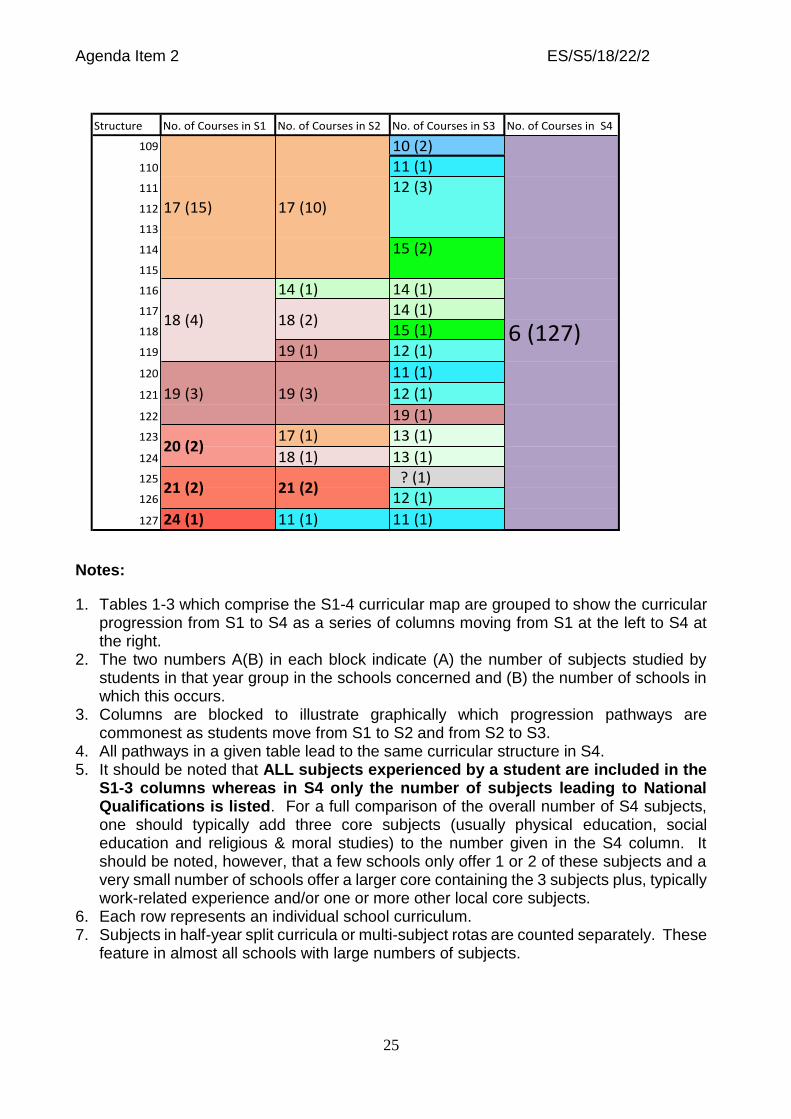
Agenda Item 2 ES/S5/18/22/2
25
Notes:
1. Tables 1-3 which comprise the S1-4 curricular map are grouped to show the curricular progression from S1 to S4 as a series of columns moving from S1 at the left to S4 at the right.
2. The two numbers A(B) in each block indicate (A) the number of subjects studied by students in that year group in the schools concerned and (B) the number of schools in which this occurs.
3. Columns are blocked to illustrate graphically which progression pathways are commonest as students move from S1 to S2 and from S2 to S3.
4. All pathways in a given table lead to the same curricular structure in S4. 5. It should be noted that ALL subjects experienced by a student are included in the
S1-3 columns whereas in S4 only the number of subjects leading to National Qualifications is listed. For a full comparison of the overall number of S4 subjects, one should typically add three core subjects (usually physical education, social education and religious & moral studies) to the number given in the S4 column. It should be noted, however, that a few schools only offer 1 or 2 of these subjects and a very small number of schools offer a larger core containing the 3 subjects plus, typically work-related experience and/or one or more other local core subjects.
6. Each row represents an individual school curriculum. 7. Subjects in half-year split curricula or multi-subject rotas are counted separately. These
feature in almost all schools with large numbers of subjects.
Structure No.ofCoursesinS1 No.ofCoursesinS2 No.ofCoursesinS3 No.ofCoursesinS4
109 10(2)
110 11(1)
111 12(3)
112
113
114 15(2)
115
116 14(1) 14(1)
117 14(1)
118 15(1)
119 19(1) 12(1)
120 11(1)
121 12(1)
122 19(1)
123 17(1) 13(1)
124 18(1) 13(1)
125 ?(1)
126 12(1)
127 24(1) 11(1) 11(1)
6(127)
17(10)
21(2)21(2)
20(2)
19(3) 19(3)
18(2)18(4)
17(15)

Agenda Item 2 ES/S5/18/22/2
26
Part 2: S1-3 Curricular Structures Leading to 7 Qualifications in S4
Structure No.ofCoursesinS1 No.ofCoursesinS2 No.ofCoursesinS3 No.ofCoursesinS4
1 10(1) 12(1)
2 17(1) 10(1)
3 11(1)
4 13(1)
5 15(1) 15(1)
6 17(1) 16(1)
7 11(1)
8 12(1)
9 16(1)
10 ?(1)
11 12(1)
12 12(1)
13
14
15 15(1)
16 18(1)
17
18
19
20
21
22
23
24 12(1)
25
26
27 ?(1)
28 11(1)
29 12(1)
30 13(1) 9(1)
31 11(1)
32 12(1)
33
34
35 10(1)36
37
38
39
40
41
42
43 15(1)
44 20(1)
45 16(1) 14(1)
46 12(1)
47 14(1)
48 19(1) 11(1)
49 ?(1)
50 11(1)
51
52
53 16(1)
54 17(1)
16(9)
7(72)
13(5) 13(5)
14(2)
14(13)
14(10)
15(3)
10(2)
11(4)
11(2)
12(5)
12(3)
14(2)
13(2)
12(2)
?(2)
10(2)
11(3)
13(2)
?(2)
11(2)
12(2)
13(3)
15(12)15(19)
17(2)
16(6)
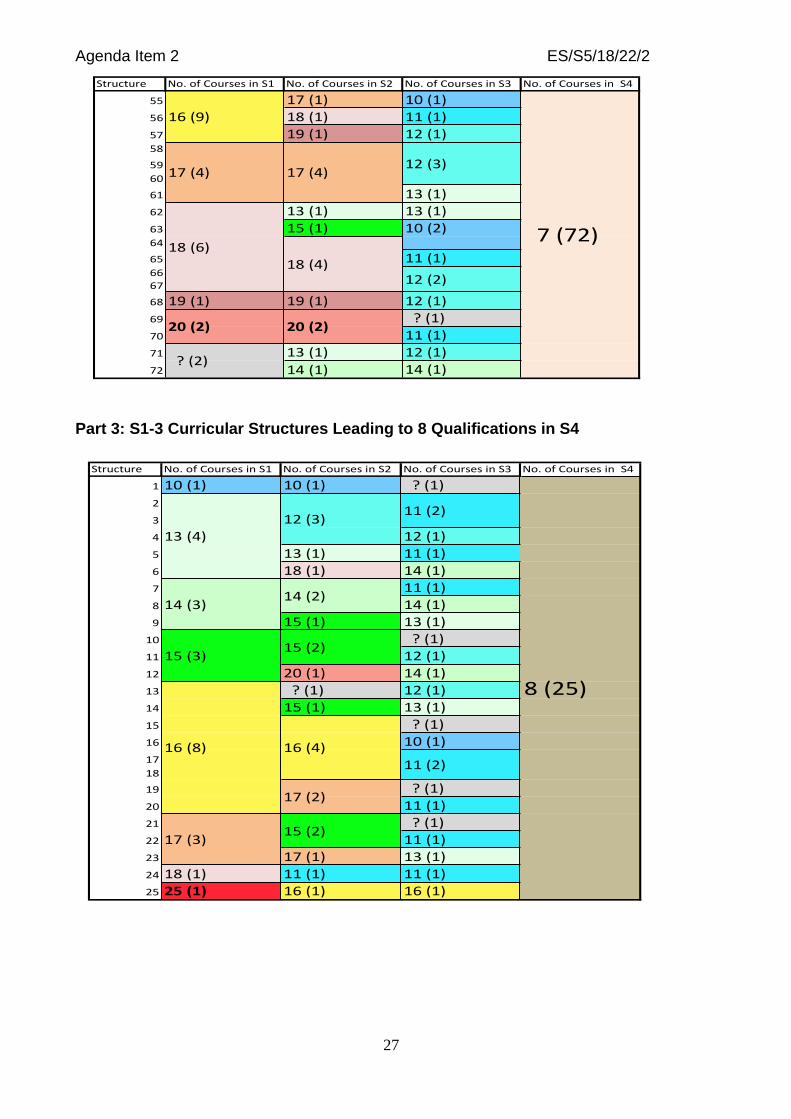
Agenda Item 2 ES/S5/18/22/2
27
Part 3: S1-3 Curricular Structures Leading to 8 Qualifications in S4
Structure No.ofCoursesinS1 No.ofCoursesinS2 No.ofCoursesinS3 No.ofCoursesinS4
55 17(1) 10(1)
56 18(1) 11(1)
57 19(1) 12(1)58
59
60
61 13(1)
62 13(1) 13(1)
63 15(1) 10(2)64
65 11(1)66
67
68 19(1) 19(1) 12(1)
69 ?(1)
70 11(1)
71 13(1) 12(1)
72 14(1) 14(1)
16(9)
7(72)
17(4) 17(4)
18(6)
20(2) 20(2)
?(2)
18(4)12(2)
12(3)
Structure No.ofCoursesinS1 No.ofCoursesinS2 No.ofCoursesinS3 No.ofCoursesinS4
1 10(1) 10(1) ?(1)
2
3
4 12(1)
5 13(1) 11(1)
6 18(1) 14(1)
7 11(1)
8 14(1)
9 15(1) 13(1)
10 ?(1)
11 12(1)
12 20(1) 14(1)
13 ?(1) 12(1)
14 15(1) 13(1)
15 ?(1)
16 10(1)
17
18
19 ?(1)
20 11(1)
21 ?(1)
22 11(1)
23 17(1) 13(1)
24 18(1) 11(1) 11(1)
25 25(1) 16(1) 16(1)
8(25)
16(4)
11(2)
17(2)
15(2)
14(2)
15(2)
12(3)11(2)
13(4)
16(8)
17(3)
15(3)
14(3)
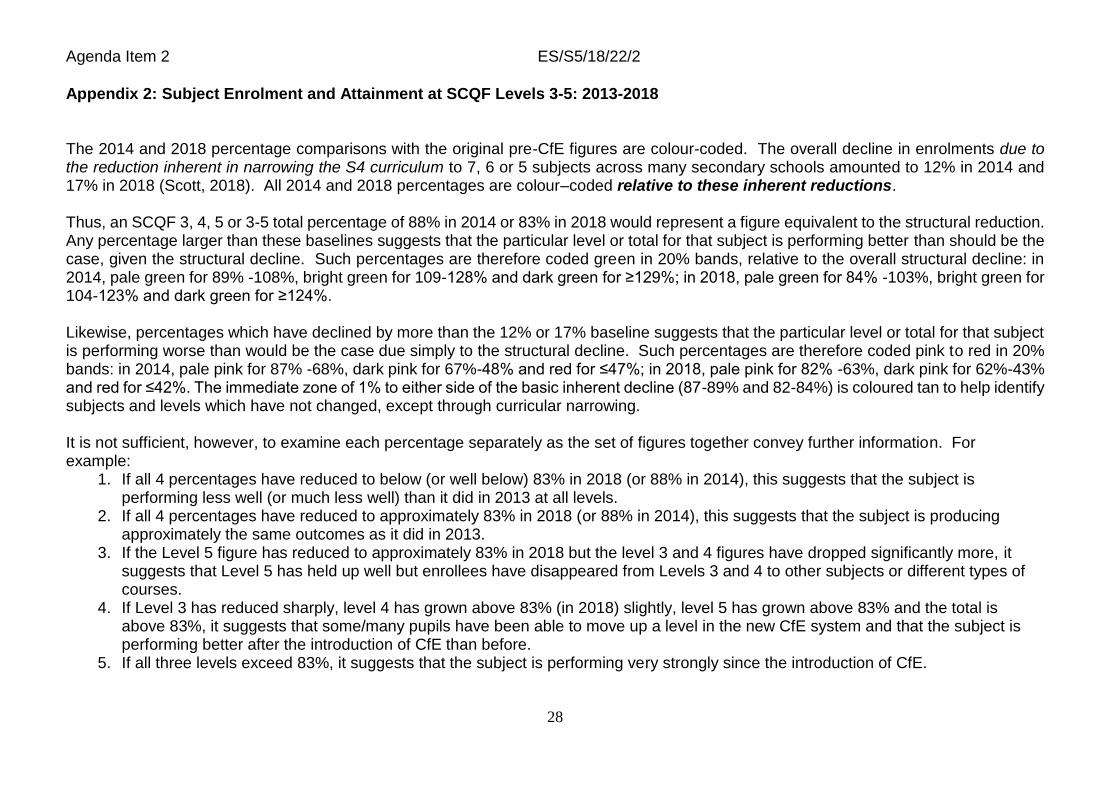
Agenda Item 2 ES/S5/18/22/2
28
Appendix 2: Subject Enrolment and Attainment at SCQF Levels 3-5: 2013-2018
The 2014 and 2018 percentage comparisons with the original pre-CfE figures are colour-coded. The overall decline in enrolments due to the reduction inherent in narrowing the S4 curriculum to 7, 6 or 5 subjects across many secondary schools amounted to 12% in 2014 and 17% in 2018 (Scott, 2018). All 2014 and 2018 percentages are colour–coded relative to these inherent reductions. Thus, an SCQF 3, 4, 5 or 3-5 total percentage of 88% in 2014 or 83% in 2018 would represent a figure equivalent to the structural reduction. Any percentage larger than these baselines suggests that the particular level or total for that subject is performing better than should be the case, given the structural decline. Such percentages are therefore coded green in 20% bands, relative to the overall structural decline: in 2014, pale green for 89% -108%, bright green for 109-128% and dark green for ≥129%; in 2018, pale green for 84% -103%, bright green for 104-123% and dark green for ≥124%. Likewise, percentages which have declined by more than the 12% or 17% baseline suggests that the particular level or total for that subject is performing worse than would be the case due simply to the structural decline. Such percentages are therefore coded pink to red in 20% bands: in 2014, pale pink for 87% -68%, dark pink for 67%-48% and red for ≤47%; in 2018, pale pink for 82% -63%, dark pink for 62%-43% and red for ≤42%. The immediate zone of 1% to either side of the basic inherent decline (87-89% and 82-84%) is coloured tan to help identify subjects and levels which have not changed, except through curricular narrowing. It is not sufficient, however, to examine each percentage separately as the set of figures together convey further information. For example:
1. If all 4 percentages have reduced to below (or well below) 83% in 2018 (or 88% in 2014), this suggests that the subject is performing less well (or much less well) than it did in 2013 at all levels.
2. If all 4 percentages have reduced to approximately 83% in 2018 (or 88% in 2014), this suggests that the subject is producing approximately the same outcomes as it did in 2013.
3. If the Level 5 figure has reduced to approximately 83% in 2018 but the level 3 and 4 figures have dropped significantly more, it suggests that Level 5 has held up well but enrollees have disappeared from Levels 3 and 4 to other subjects or different types of courses.
4. If Level 3 has reduced sharply, level 4 has grown above 83% (in 2018) slightly, level 5 has grown above 83% and the total is above 83%, it suggests that some/many pupils have been able to move up a level in the new CfE system and that the subject is performing better after the introduction of CfE than before.
5. If all three levels exceed 83%, it suggests that the subject is performing very strongly since the introduction of CfE.

Agenda Item 2 ES/S5/18/22/2
29
These are merely a few exemplars of possible patterns to allow the reader to analyses what they see in each subject.
Year 2013 2014 2018
Subjects
Candidates Candidates % of 2013 Candidates % of 2013
SC
QF
3
SC
QF
4
SC
QF
5
To
tal 3
-
5
SC
QF
3
SC
QF
4
SC
QF
5
To
tal 3
-
5
SC
QF
3
SC
QF
4
SC
QF
5
To
tal 3
-
5
SC
QF
3
SC
QF
4
SC
QF
5
To
tal 3
-
5
SC
QF
3
SC
QF
4
SC
QF
5
To
tal 3
-
5
Accounting
241 527 896 1664
8 968 976 1% 108%
59%
896 896 100%
53%
Administration
964 4060
5650
10674
487 3282
6306
10075
50%
81%
112%
94%
444
1973
4767
7184
46%
49%
84%
67%
Art & Design
1095
8673
12767
22535
782 6512
12007
19301
71%
75%
94%
87%
550
3417
9198
13165
50%
39%
72%
58%
Biology 5470
13182
18650
37212
1422
10670
23162
35254
26%
81%
125%
95%
629
7216
20928
28773
12%
55%
113%
77%
Business (/Bus Mant)
788 3097
7726
11611
258 3155
8295
11708
33%
102%
107%
101%
201
2603
7411
10215
26%
84%
96%
87%
Care 374 734 1108
3348
677 1025
93%
92%
93%
270 645 915 72%
88%
82%
Chemistry
2933
8757
16557
28247
1189
7524
17996
26709
41%
86%
109%
95%
369
4186
15930
20485
13%
48%
96%
72%
Chinese Langs.
93 68 84 245 60 43 53 156 65%
63%
63%
64%
20 56 186 262 22%
82%
221%
106%
Classical Studies
30 86 215 331 0 39 206 245 0% 45%
96%
74%
24 32 78 134 80%
37%
36%
40%

Agenda Item 2 ES/S5/18/22/2
30
Computing Science
2233
5567
8185
15985
873 4270
7945
13088
39%
77%
97%
82%
360
2820
6442
9622
16%
51%
79%
60%
(Craft) Design etc.
1069
4557
4657
10283
173 2445
4135
6753
16%
54%
89%
66%
127
1531
4599
6257
12%
34%
99%
60%
Dance 361 361 No course in 2013.
558 558 No course in 2013.
Drama 639 2343
5418
8400
272 1482
4961
6715
43%
63%
92%
80%
226
876 4507
5609
35%
37%
83%
66%
Economics
5 3 354 362 270 270 76%
75%
277 277 78%
76%
Engineering Skills/Sc.
340 189 529 397 1296
1693
117%
686%
320%
372 1808
2180
109%
956%
412%
English 4783
30485
44679
79947
3375
25059
48251
76685
71%
82%
108%
96%
1971
14451
44477
60899
41%
47%
100%
76%
ESOL 162 698 860 224 92 760 1076
138%
109%
125%
330
472 1035
1837
204%
148%
213%
Environmental Sc.
106 145 67 318 No equivalent course in 2013.
176
259 272 707 No equivalent course in 2013.
French 3293
11417
13836
28546
556 5719
11885
18160
17%
50%
86%
66%
427
2447
8145
11019
13%
21%
59%
38%
Gaelic (Learners)
45 118 208 371 19 90 185 294 42%
76%
89%
79%
6 46 107 159 13%
39%
51%
42%
Gaidhlig 9 58 170 237 3 30 189 222 33%
52%
111%
94%
1 12 183 196 11%
21%
108%
82%

Agenda Item 2 ES/S5/18/22/2
31
Geography
3601
5899
12014
21514
983 5178
12172
18333
27%
88%
101%
85%
563
3578
9795
13936
16%
61%
81%
64%
German 628 2314
2983
5925
104 1059
2581
3744
17%
46%
87%
62%
148
493 1859
2500
24%
21%
62%
42%
Graphic Commn.
590 3380
7169
11139
1829
7545
9374
54%
105%
94%
1211
5434
6645
36%
76%
59%
History 4239
7601
16017
27857
1130
7235
16939
25304
27%
95%
106%
91%
665
5739
14473
20877
16%
76%
90%
74%
Home Econs.: FTT
45 453 186 684 44 393 429 866 98%
87%
231%
127%
45 171 444 660 100%
38%
238%
96%
Home Econs.: HFT
175 393 316 884 139 1295
1948
3382
79%
329%
617%
383%
50 561 1474
2085
29%
143%
466%
235%
Hosp.: Pr. Cake Craft
652 562 No course in 2013.
1394
1394
No course in 2013.
Hosp.: Pr. Cookery
949 6621
5936
13506
500 4718
7282
12500
53%
71%
123%
93%
581
3597
5035
9213
61%
54%
85%
68%
Italian 57 91 297 445 3 146 347 496 5% 160%
117%
111%
23 143 286 452 40%
157%
96%
101%
Latin 1 30 482 513 1 13 452 466 100%
43%
94%
91%
1 2 390 393 100%
7% 81%
76%
Maths/Lifeskills Maths
19459
28353
38221
86033
10760
29615
41056
81431
55%
105%
107%
95%
6052
26377
44072
76501
31%
93%
115%
88%
Media/Media Studies
302 636 895 1833
175 629 866 1670
58%
99%
97%
91%
365
987 1007
2359
121%
155%
113%
128%
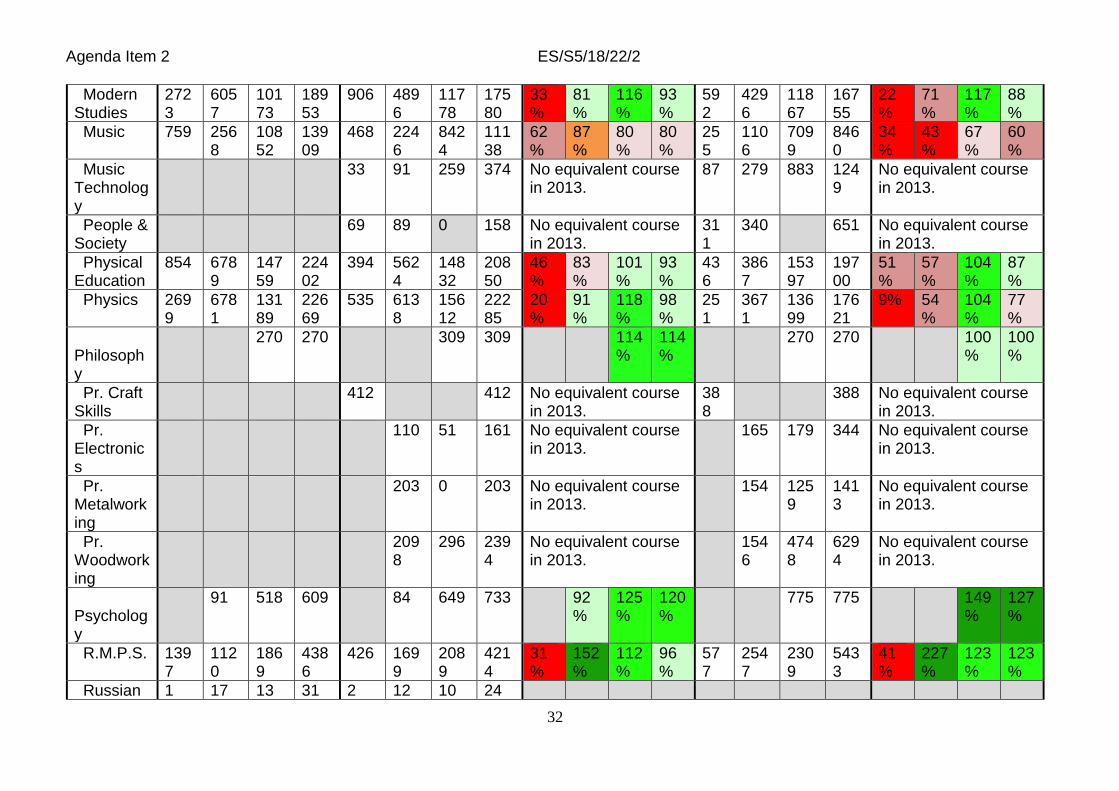
Agenda Item 2 ES/S5/18/22/2
32
Modern Studies
2723
6057
10173
18953
906 4896
11778
17580
33%
81%
116%
93%
592
4296
11867
16755
22%
71%
117%
88%
Music 759 2568
10852
13909
468 2246
8424
11138
62%
87%
80%
80%
255
1106
7099
8460
34%
43%
67%
60%
Music Technology
33 91 259 374 No equivalent course in 2013.
87 279 883 1249
No equivalent course in 2013.
People & Society
69 89 0 158 No equivalent course in 2013.
311
340 651 No equivalent course in 2013.
Physical Education
854 6789
14759
22402
394 5624
14832
20850
46%
83%
101%
93%
436
3867
15397
19700
51%
57%
104%
87%
Physics 2699
6781
13189
22669
535 6138
15612
22285
20%
91%
118%
98%
251
3671
13699
17621
9% 54%
104%
77%
Philosophy
270 270 309 309 114%
114%
270 270 100%
100%
Pr. Craft Skills
412 412 No equivalent course in 2013.
388
388 No equivalent course in 2013.
Pr. Electronics
110 51 161 No equivalent course in 2013.
165 179 344 No equivalent course in 2013.
Pr. Metalworking
203 0 203 No equivalent course in 2013.
154 1259
1413
No equivalent course in 2013.
Pr. Woodworking
2098
296 2394
No equivalent course in 2013.
1546
4748
6294
No equivalent course in 2013.
Psychology
91 518 609 84 649 733 92%
125%
120%
775 775 149%
127%
R.M.P.S. 1397
1120
1869
4386
426 1699
2089
4214
31%
152%
112%
96%
577
2547
2309
5433
41%
227%
123%
123%
Russian 1 17 13 31 2 12 10 24

Agenda Item 2 ES/S5/18/22/2
33
Science 419 1323
383 2125
169 521 690 40%
39%
33%
187
522 709 45%
40%
33%
Sociology
231 231 348 348 151%
151%
206 206 89%
89%
Spanish 1202
2674
3768
7644
371 1913
3894
6178
31%
71%
103%
81%
201
1618
4937
6756
17%
61%
131%
88%
Urdu 7 25 71 103 11 29 42 82 157%
116%
59%
80%
7 24 45 76 100%
96%
63%
73%
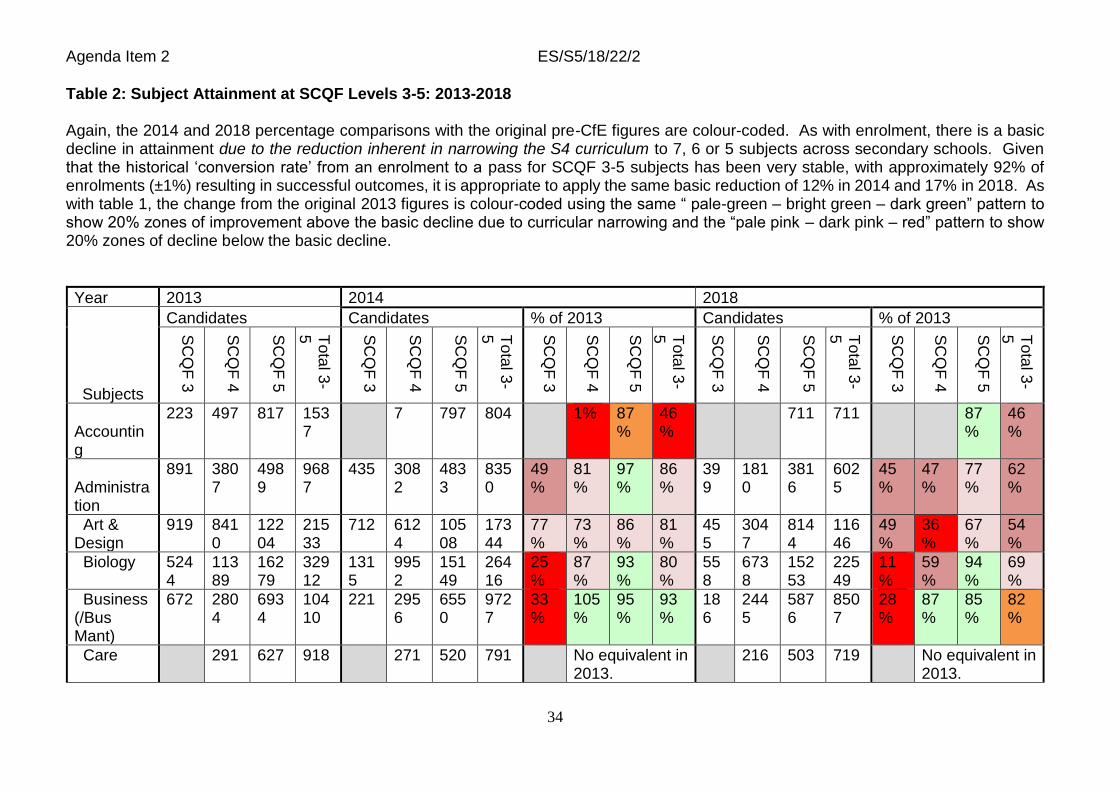
Agenda Item 2 ES/S5/18/22/2
34
Table 2: Subject Attainment at SCQF Levels 3-5: 2013-2018 Again, the 2014 and 2018 percentage comparisons with the original pre-CfE figures are colour-coded. As with enrolment, there is a basic decline in attainment due to the reduction inherent in narrowing the S4 curriculum to 7, 6 or 5 subjects across secondary schools. Given that the historical ‘conversion rate’ from an enrolment to a pass for SCQF 3-5 subjects has been very stable, with approximately 92% of enrolments (±1%) resulting in successful outcomes, it is appropriate to apply the same basic reduction of 12% in 2014 and 17% in 2018. As with table 1, the change from the original 2013 figures is colour-coded using the same “ pale-green – bright green – dark green” pattern to show 20% zones of improvement above the basic decline due to curricular narrowing and the “pale pink – dark pink – red” pattern to show 20% zones of decline below the basic decline.
Year 2013 2014 2018
Subjects
Candidates Candidates % of 2013 Candidates % of 2013
SC
QF
3
SC
QF
4
SC
QF
5
To
tal 3
-
5
SC
QF
3
SC
QF
4
SC
QF
5
To
tal 3
-
5
SC
QF
3
SC
QF
4
SC
QF
5
To
tal 3
-
5
SC
QF
3
SC
QF
4
SC
QF
5
To
tal 3
-5
SC
QF
3
SC
QF
4
SC
QF
5
To
tal 3
-
5
Accounting
223 497 817 1537
7 797 804 1% 87%
46%
711 711 87%
46%
Administration
891 3807
4989
9687
435 3082
4833
8350
49%
81%
97%
86%
399
1810
3816
6025
45%
47%
77%
62%
Art & Design
919 8410
12204
21533
712 6124
10508
17344
77%
73%
86%
81%
455
3047
8144
11646
49%
36%
67%
54%
Biology 5244
11389
16279
32912
1315
9952
15149
26416
25%
87%
93%
80%
558
6738
15253
22549
11%
59%
94%
69%
Business (/Bus Mant)
672 2804
6934
10410
221 2956
6550
9727
33%
105%
95%
93%
186
2445
5876
8507
28%
87%
85%
82%
Care 291 627 918 271 520 791 No equivalent in 2013.
216 503 719 No equivalent in 2013.

Agenda Item 2 ES/S5/18/22/2
35
Chemistry
2737
8066
15648
26451
1103
7116
13020
21239
40%
88%
83%
80%
337
3937
12296
16570
12%
49%
79%
63%
Chinese Langs.
93 61 79 233 42 42 52 136 45%
69%
66%
58%
18 42 165 225 19%
69%
209%
97%
Classical Studies
27 80 205 312 0 35 185 220 0% 44%
90%
71%
24 30 65 119 89%
37%
32%
38%
Computing Science
2079
5416
7573
15068
813 3980
6361
11154
39%
73%
84%
74%
323
2571
4814
7708
15%
48%
64%
51%
(Craft) Design etc.
851 4557
4657
10065
164 2142
3755
6061
19%
47%
81%
60%
113
1248
2603
3964
13%
27%
56%
39%
Dance 322 322 No course in 2013.
514 514 No course in 2013.
Drama 484 2314
5279
8077
223 1348
4635
6206
46%
58%
88%
77%
190
760 4167
5117
39%
33%
79%
63%
Economics
5 3 337 345 246 246 73%
71%
262 262 78%
76%
Engineering Skills/Science
340 189 529 331 1058
1389
97%
560%
263%
320 1407
1727
94%
744%
327%
English 4322
28967
41091
74380
3206
23163
41016
67385
74%
80%
100%
91%
1796
13415
37701
52912
42%
46%
92%
71%
ESOL 146 548 694 205 85 629 919 140%
N/A 115%
132%
306
365 832 1503
210%
N/A 152%
216%
Environmental Sc.
92 132 30 254 No equivalent course in 2013.
158
222 141 521 No equivalent course in 2013.
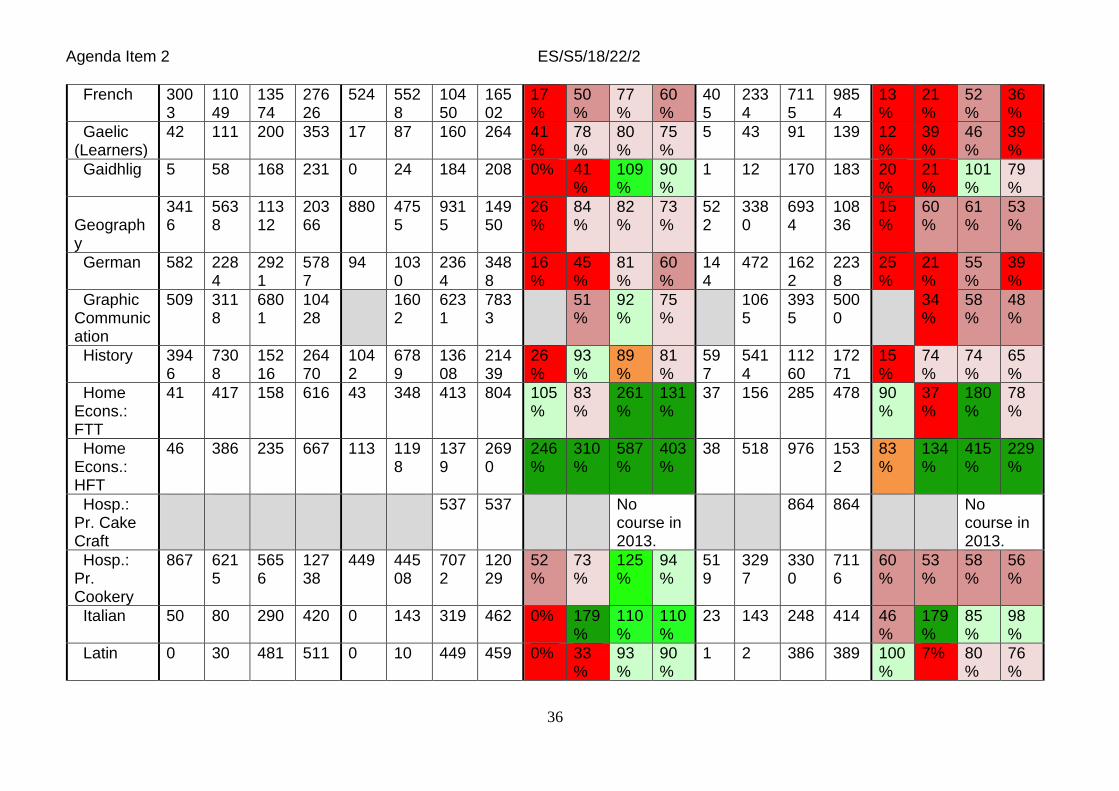
Agenda Item 2 ES/S5/18/22/2
36
French 3003
11049
13574
27626
524 5528
10450
16502
17%
50%
77%
60%
405
2334
7115
9854
13%
21%
52%
36%
Gaelic (Learners)
42 111 200 353 17 87 160 264 41%
78%
80%
75%
5 43 91 139 12%
39%
46%
39%
Gaidhlig 5 58 168 231 0 24 184 208 0% 41%
109%
90%
1 12 170 183 20%
21%
101%
79%
Geography
3416
5638
11312
20366
880 4755
9315
14950
26%
84%
82%
73%
522
3380
6934
10836
15%
60%
61%
53%
German 582 2284
2921
5787
94 1030
2364
3488
16%
45%
81%
60%
144
472 1622
2238
25%
21%
55%
39%
Graphic Communication
509 3118
6801
10428
1602
6231
7833
51%
92%
75%
1065
3935
5000
34%
58%
48%
History 3946
7308
15216
26470
1042
6789
13608
21439
26%
93%
89%
81%
597
5414
11260
17271
15%
74%
74%
65%
Home Econs.: FTT
41 417 158 616 43 348 413 804 105%
83%
261%
131%
37 156 285 478 90%
37%
180%
78%
Home Econs.: HFT
46 386 235 667 113 1198
1379
2690
246%
310%
587%
403%
38 518 976 1532
83%
134%
415%
229%
Hosp.: Pr. Cake Craft
537 537 No course in 2013.
864 864 No course in 2013.
Hosp.: Pr. Cookery
867 6215
5656
12738
449 44508
7072
12029
52%
73%
125%
94%
519
3297
3300
7116
60%
53%
58%
56%
Italian 50 80 290 420 0 143 319 462 0% 179%
110%
110%
23 143 248 414 46%
179%
85%
98%
Latin 0 30 481 511 0 10 449 459 0% 33%
93%
90%
1 2 386 389 100%
7% 80%
76%
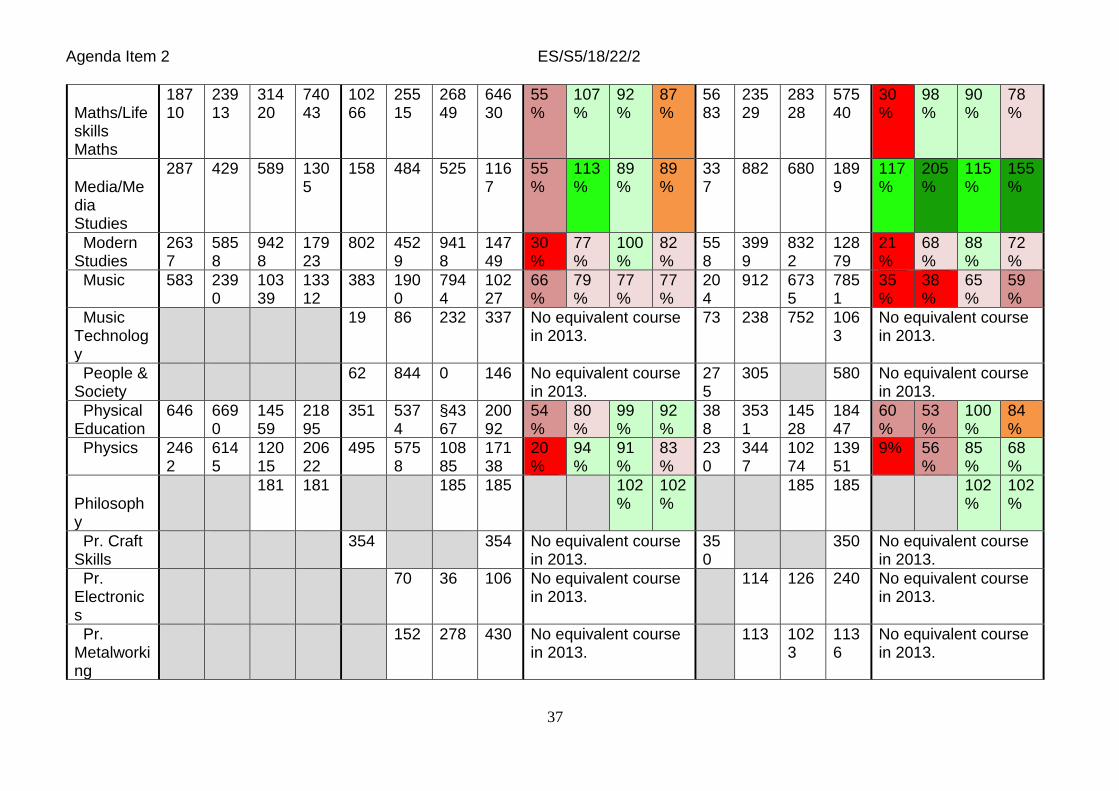
Agenda Item 2 ES/S5/18/22/2
37
Maths/Lifeskills Maths
18710
23913
31420
74043
10266
25515
26849
64630
55%
107%
92%
87%
5683
23529
28328
57540
30%
98%
90%
78%
Media/Media Studies
287 429 589 1305
158 484 525 1167
55%
113%
89%
89%
337
882 680 1899
117%
205%
115%
155%
Modern Studies
2637
5858
9428
17923
802 4529
9418
14749
30%
77%
100%
82%
558
3999
8322
12879
21%
68%
88%
72%
Music 583 2390
10339
13312
383 1900
7944
10227
66%
79%
77%
77%
204
912 6735
7851
35%
38%
65%
59%
Music Technology
19 86 232 337 No equivalent course in 2013.
73 238 752 1063
No equivalent course in 2013.
People & Society
62 844 0 146 No equivalent course in 2013.
275
305 580 No equivalent course in 2013.
Physical Education
646 6690
14559
21895
351 5374
§4367
20092
54%
80%
99%
92%
388
3531
14528
18447
60%
53%
100%
84%
Physics 2462
6145
12015
20622
495 5758
10885
17138
20%
94%
91%
83%
230
3447
10274
13951
9% 56%
85%
68%
Philosophy
181 181 185 185 102%
102%
185 185 102%
102%
Pr. Craft Skills
354 354 No equivalent course in 2013.
350
350 No equivalent course in 2013.
Pr. Electronics
70 36 106 No equivalent course in 2013.
114 126 240 No equivalent course in 2013.
Pr. Metalworking
152 278 430 No equivalent course in 2013.
113 1023
1136
No equivalent course in 2013.

Agenda Item 2 ES/S5/18/22/2
38
Pr. Woodworking
1765
2285
4050
No equivalent course in 2013.
1271
4057
5328
No equivalent course in 2013.
Psychology
72 386 458 52 468 520 72%
121%
113%
501 501 129%
109%
R.M.P.S. 1241
969 1482
3692
363 1478
1448
3289
29%
153%
98%
89%
540
2263
1612
4415
43%
233%
109%
120%
Russian 0 16 13 29 0 9 10 19 0% 56%
77%
65%
Science 376 1323
383 2082
148 483 0 631 39%
36%
0% 30%
165
500 665 44%
38%
32%
Sociology
197 197 255 255 129%
129%
136 136 69%
69%
Spanish 1138
2455
3608
7201
359 1849
3543
5751
31%
75%
98%
80%
173
1483
4442
6098
15%
60%
123%
85%
Urdu 7 25 71 103 10 29 42 81 143%
116%
59%
79%
7 24 44 75 100%
96%
62%
73%

Agenda Item 2 ES/S5/18/22/2
39
Appendix 3: Global Enrolment and Attainment at SCQF Levels 3-5: 2013-2018 The table demonstrates the decline in enrolment from 2013 to 2018 at SCQF Levels 3, 4 and 5. The overall totals are also given. As may be seen. Overall attainment has declined from 2013 to 2018 by 33.8%, of which 16-17% may be attributed to curricular narrowing due to structural changes in S4.
Table1:S4EnrolmentandAttainment:2012-13to2017-18ProducedbyProfessorJimScott,UniversityofDundee.
Number as%of2013 Number as%of2013 Number as%of2013 Attainment as%of2013 Number as%of2013 Attainment as%of2013 Number as%of2013 Attainment as%of2013 Number as%of2013 Attainment as%of2013 Number as%of2013 Attainment as%of2013
Enrolment Attainment Enrolment Attainment Enrolment Attainment Enrolment Attainment Enrolment Attainment Enrolment Attainment
SGrade5/6 32,216 29,185 0 0 0 0 0 0 0 0 0 0
Access3 32393 30908 10939 10391 3340 3184 3 3 0 0 0 0
National3 0 0 16587 14898 17268 15756 18478 16662 17114 15543 0 0
SCQF3total 64,609 11.9 60,093 12.0 27,526 5.1 25,289 5.1 20,608 3.8 18,940 3.8 18,481 3.4 16,665 3.3 17114 3.1 15543 3.1 17646 3.2 16138 3.2
Changefrom2013 -37083 -34804 -44001 -41153 -46128 -43428 -47,495 -44,550 -46,963 -43,955
SGrade3/4 120,401 120,241 0 0 0 0 0 0 0 0 0 0
Inter.1 63190 49220 18679 13666 1553 1170 0 0 0 0 0 0
National4 0 0 122716 114173 130876 122071 122961 114635 116032 107631 0 0
SCQF4total 183,591 33.7 169,461 33.9 141,395 26.0 127,839 25.6 132,429 24.3 123,241 24.7 122,961 22.6 114,635 22.9 116032 21.3 107631 21.5 106,033 19.5 96613 19.3
Changefrom2013 -42196 -55752 -51162 -46220 -60630 -54826 -67,559 -61,830 -77,558 -72,848
SGrade1/2 155,626 155,426 0 0 0 0 0 0 0 0 0 0
Inteer.2 140,577 114,934 97122 75689 10678 7828 0 0 0 0 0 0
National5 0 0 213595 173131 288016 229870 295083 234160 293220 233005 0 0
SCQF5total 296,203 54.4 270,360 54.1 310,717 57.1 248,820 49.8 298,694 54.9 237,698 47.5 295,083 54.2 234,160 46.8 293220 53.9 233005 46.6 281785 51.8 218,201 43.6
Changefrom2013 14514 -21540 2491 -32662 -1120 -36200 -2,983 -37,355 -14,418 -52,159
OverallTot. 544,403 100.0 499,914 100.0 479,638 88.1 401,948 80.4 451,731 83.0 379,879 76.0 436,525 80.2 365,460 73.1 426366 78.3 356179 71.2 405464 74.5 330952 66.2Changefrom2013 -64765 -97966 -92672 -120035 -107878 -134454 -118,037 -143,735 -138,939 -168,962
2013 2014 2015
Enrolment Attainment Enrolment Attainment Enrolment Attainment
2018
Enrolment Attainment
2017
Enrolment Attainment
2016
Enrolment Attainment
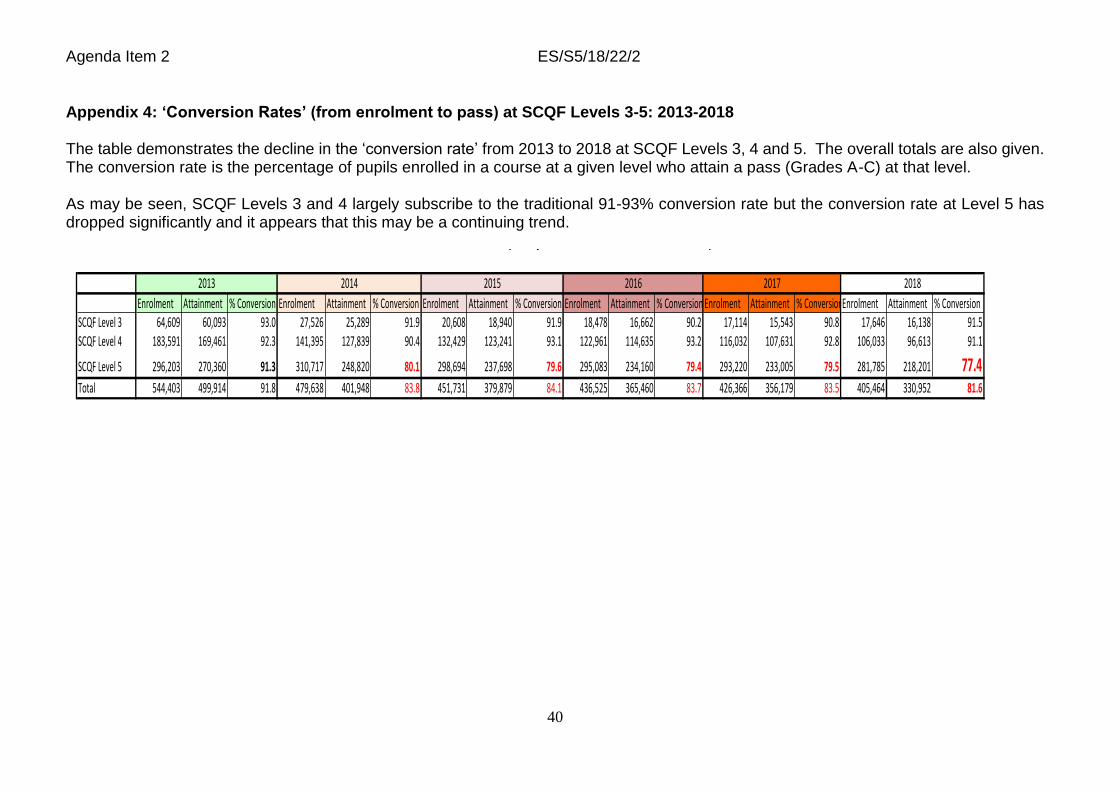
Agenda Item 2 ES/S5/18/22/2
40
Appendix 4: ‘Conversion Rates’ (from enrolment to pass) at SCQF Levels 3-5: 2013-2018 The table demonstrates the decline in the ‘conversion rate’ from 2013 to 2018 at SCQF Levels 3, 4 and 5. The overall totals are also given. The conversion rate is the percentage of pupils enrolled in a course at a given level who attain a pass (Grades A-C) at that level. As may be seen, SCQF Levels 3 and 4 largely subscribe to the traditional 91-93% conversion rate but the conversion rate at Level 5 has dropped significantly and it appears that this may be a continuing trend.
Table2:S4ConversionRatesFromEnrolmenttoAttainment:2012-13to2017-18(i.e."passrate"ofthosewhoenrolled)ProducedbyProfessorJimScott,UniversityofDundee
Enrolment Attainment %Conversion Enrolment Attainment %Conversion Enrolment Attainment %Conversion Enrolment Attainment %Conversion Enrolment Attainment %ConversionEnrolment Attainment %Conversion
SCQFLevel3 64,609 60,093 93.0 27,526 25,289 91.9 20,608 18,940 91.9 18,478 16,662 90.2 17,114 15,543 90.8 17,646 16,138 91.5
SCQFLevel4 183,591 169,461 92.3 141,395 127,839 90.4 132,429 123,241 93.1 122,961 114,635 93.2 116,032 107,631 92.8 106,033 96,613 91.1
SCQFLevel5 296,203 270,360 91.3 310,717 248,820 80.1 298,694 237,698 79.6 295,083 234,160 79.4 293,220 233,005 79.5 281,785 218,201 77.4Total 544,403 499,914 91.8 479,638 401,948 83.8 451,731 379,879 84.1 436,525 365,460 83.7 426,366 356,179 83.5 405,464 330,952 81.6
2013 2014 2015 20182016 2017

Agenda Item 2 ES/S5/18/22/2
41
Appendix 5: SCQF Level 6-7 (Higher and Advanced Higher) Enrolment and Attainment: 2011-2018 The table demonstrates the decline at Higher from 2016 to 2018 i.e. the period of CfE –related ‘new’ Highers. The overall rate of decline is significantly slower than that of the SCQF Level 3-5 data. This may be directly related to the relatively better performance of students at SCQF Level 5 i.e. those who continue on to Higher. However, this decline exactly correlates to the period of CfE-related qualifications and is in marked contrast to a decade or more of relatively steady growth at Higher before 2015-16. As may also be seen, SCQF Level 7 appears to be only, at worst, slightly impeded in its progress. It may therefore be the case that the most able Higher students have been relatively unaffected by the problems experienced by those studying at Levels 3-5, or perhaps the lower end of the Level 6 student body.
NumbersofCandidatesEnrollingandAttainingatLevels6-7
2018 2017 2016 2015 2014 2013 2012 2011
Enrol Attain Enrol Attain Enrol Attain Enrol Attain Enrol Attain Enrol Attain
OldH 92,555 70,981 191,850 147,899 182,601 141,257 180,912 139,125 178,203 133,960
NewH 191,951 147,419 194,813 150,010 197,750 153,391 107,295 85,019
TotalH 191,951 147,419 194,813 150,010 197,750 153,391 199,850 156,000 191,850 147,899 182,601 141,257 180,912 139,125 178,203 133,960
Totalas% 76.8 77.0 77.6 78.1 77.1 77.4 76.9 75.2
ofsameyear
enrolments
AdvH 24,331 19,585 24,112 19,283 23,794 19,007 23,348 18,899 22,430 18,171 22,120 18,162 21,587 17,299 21,414 16,976
Changefrom UP219 UP302 UP318 UP276 UP446 UP108 UP918 UP718 UP310 UP9 UP533 UP863 UP173 UP323
previousyear
Scot.Bacc. 70 50 71 67 140 103 122 98 176 144 191 164 182 144 174 140
(Lev.7)
Changefrom DOWN17 DOWN36 UP5 DOWN46 DOWN20 UP20 UP4
previousyear
Table3:S5/6HigherandAdvancedHigher:2010-11to2076-18ProducedbyProfessorJimScott,UniversityofDundee
Baseline
Baseline
Ref: ES/S5/18/ED/3
42
Annexe C
Education and Skills Committee
SUBMISSION FROM DR MARINA SHAPIRA, FACULTY OF SOCIAL SCIENCES, UNIVERSITY OF STIRLING
Narrowing the Curriculum: An exploration of trends in subject enrolment in National 5 level qualifications (SCQF level 5), in 2011-2017
This paper presents findings from an ongoing study (Shapira and Priestly 2018a, 2018b) that examines the impact of the Curriculum for Excellence on subject enrolment, attainment and transitions of young people in Scotland. In this submission we present our finding in relation to subject enrolment for SCQF National 5 level qualifications of 14-15 years old pupils in year 4 of secondary education (S4). The study used the administrative educational data on subject enrolment and attainment (based on the SQA enrolments and attainment statistics) that was provided by the Scottish Government. The data is aggregated on the level of schools and is linked with the Scottish Pupil Census data that provides information about pupils’ and schools’ characteristics.
We used descriptive methods of statistical data analysis and regression modelling in order to explore the variations between schools in the (a) number of subject choices and (b) configuration of subject enrolment and identify factors responsible for these variations.
Summary of findings
1. Our results show that the senior phase of secondary curriculum is becoming narrower. Fewer subjects are being taken in school year S4 for level 5 National Qualifications (Table 1). On average, the number of subject choices decreased from 7.3 in 2011-2013 to 5.3 in 2014-2017. The reduction took place mostly in 2013-2014 and then in 2014-2015 academic years. 2. The size of reduction in the number of subject choices (number of subject entries per pupil) varied
a) between Local authorities
b) between areas with different levels of deprivation (measured by the SIMD decile)
c) between schools of different characteristics.
Although schools in every SIMD decile experienced a reduction in the number of subject choices the reduction was larger for schools in areas of higher deprivation. As a result, in 2017 the number of subject entries per student become more differentiated by the area’s level of multiple deprivation than it was in 2011. The rate of reduction in the number of subject entries per students also varied across Local Authorities (Figure 1).

Ref: ES/S5/18/ED/3
43
Figure 1. Trends in number of subject choices per student in National 5 level qualifications (S4) by 1) the by level of school area’s deprivation (SIMD Decile); 2) by Local Authority
Table 1. Trends in subject entries, number of subject entries per student, size of school roll and S4 roll, and average number of subject for SCQF level 5 qualifications, in 2011-2018.
year
Total number of entries
Number of entries per students
S4 roll School Roll Average number of subjects in
school
2011 Mean 1138 7.26 156.16 838.13 20.12
Std. Dev.
546.1 1.30 68.23 358.28 2.57
2012 Mean 1127 7.33 153.44 828.71 19.96
Std. Dev.
554.3 1.37 67.85 355.57 2.93
2013 Mean 1139 7.34 152.91 823.12 20.02
Std. Dev.
559.9 1.36 68.26 355.61 2.85
2014 Mean 835 5.49 150.52 813.85 20.07
Std. Dev.
438.6 1.17 66.35 353.14 3.20
2015 Mean 753 5.11 145.40 800.35 20.50
Std. Dev.
397.9 1.06 66.00 353.93 3.45
2016 Mean 742 5.18 142.62 793.15 20.83
Std. Dev.
389.1 0.99 65.91 354.58 3.42
2017 Mean 737 5.22 140.32 793.20 21.09
Std. Dev.
388.2 0.95 65.37 356.66 3.64
1
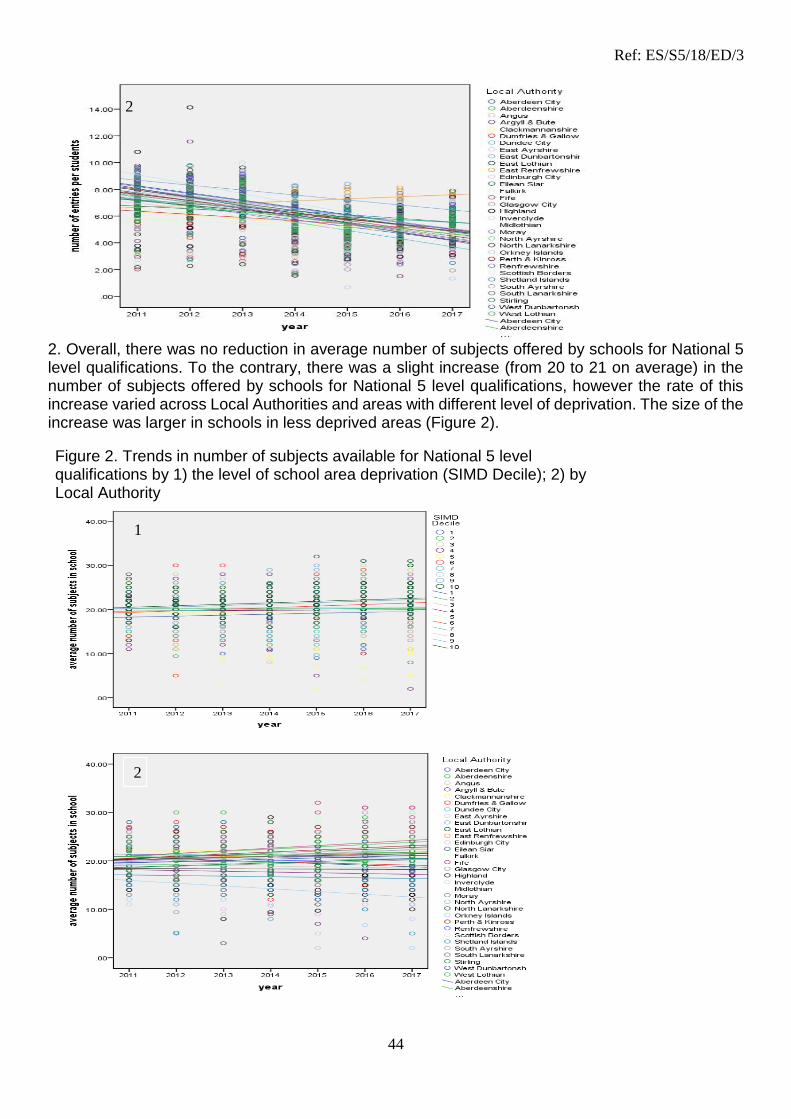
Ref: ES/S5/18/ED/3
44
2. Overall, there was no reduction in average number of subjects offered by schools for National 5 level qualifications. To the contrary, there was a slight increase (from 20 to 21 on average) in the number of subjects offered by schools for National 5 level qualifications, however the rate of this increase varied across Local Authorities and areas with different level of deprivation. The size of the increase was larger in schools in less deprived areas (Figure 2).
Figure 2. Trends in number of subjects available for National 5 level qualifications by 1) the level of school area deprivation (SIMD Decile); 2) by Local Authority
2
1
2

Ref: ES/S5/18/ED/3
45
3. The number of subject entries declined for all subject groups over the period 2011-2018.
• The main drop in the number of entries took place in 2013 and in 2014. A considerable part
of this decline can be attributed to changes in SCQF level 3-5 qualifications. Yet there was
an additional decline in the number of entries for all subject groups but Maths in 2014-2015
(Figure 3a). The size of the reduction in the numbers of entries varied between subject
groups and its relative size was smallest for Sciences and largest for Modern Languages.
• In 2015-2017 the numbers of entries remained relatively stable for Maths and English.
However, there was a further (albeit small) decline in entries in Sciences, Social Sciences,
Arts, but most notably in Modern Languages (Figure 3a).
4. Changes in the configuration of subject entries.
Since 2013 there has been a slight increase in the proportion of entries in English and Maths, more notable increase in the proportion of entries in Sciences, a small decreased in the proportion of Arts entries and the largest decrease in the proportion of entries in Modern Languages (Figure 3b).
5. Subject entries and school area’s level of deprivation (Figure 4).
• The change over time in the proportion of English, Math’s and Social Sciences entries was
loosely differentiated by the school area level of deprivation.
• The change over time in the proportion of entries in Sciences was highly differentiated by the
area’s level of deprivation – the smallest increase in the proportion of entries was for schools
in the SIMD deciles 1 and 2 (the most deprived areas) while the highest increase in the
0.00
50.00
100.00
150.00
200.00
250.00
English Maths Sciences SocialSciences
Arts ModernLanguages
Vocationalsubjects
Figure 3a. Trends in numbers of entries in National 5 level qualifications in 2011-2017, per subject group
2011 2012 2013 2014 2015 2016 2017
0.00
5.00
10.00
15.00
20.00
25.00
English Maths Sciences SocialSciences
Arts ModernLanguages
Figure 3b, Percentage of entries in National 5 level qualifications in 2011-2017, per subject group
2011 2012 2013 2014 2015 2016 2017

Ref: ES/S5/18/ED/3
46
proportion of entries in Sciences was for schools in the SIMD decile 10 (the least deprived
area).
• Young people who attended schools in the least deprived areas (SIMD decile 10) were 3
times more likely to choose Sciences for their National 5 qualifications than those attending
schools in the most deprived areas (SIMD decile 1).
• An increase in the proportion of entries in Vocational subjects was largest for schools in areas
with high level of deprivation
• Although schools in every deprivation decile saw a considerable reduction in the proportion
of entries in Modern languages, the rate of the reduction was larger for schools in areas with
higher level of deprivation

Ref: ES/S5/18/ED/3
47
6. School Characteristics:
We found that the composition of school’s intake and other characteristics of schools were linked to the subject entries (Table A1 in Appendix1).:
Figure 4. Trends in the percentages of entries in a) Sciences, b) Vocational subjects and c) Modern Languages, by school area’s level of deprivation (SIMD decile), in 2011-2018
a
b
c
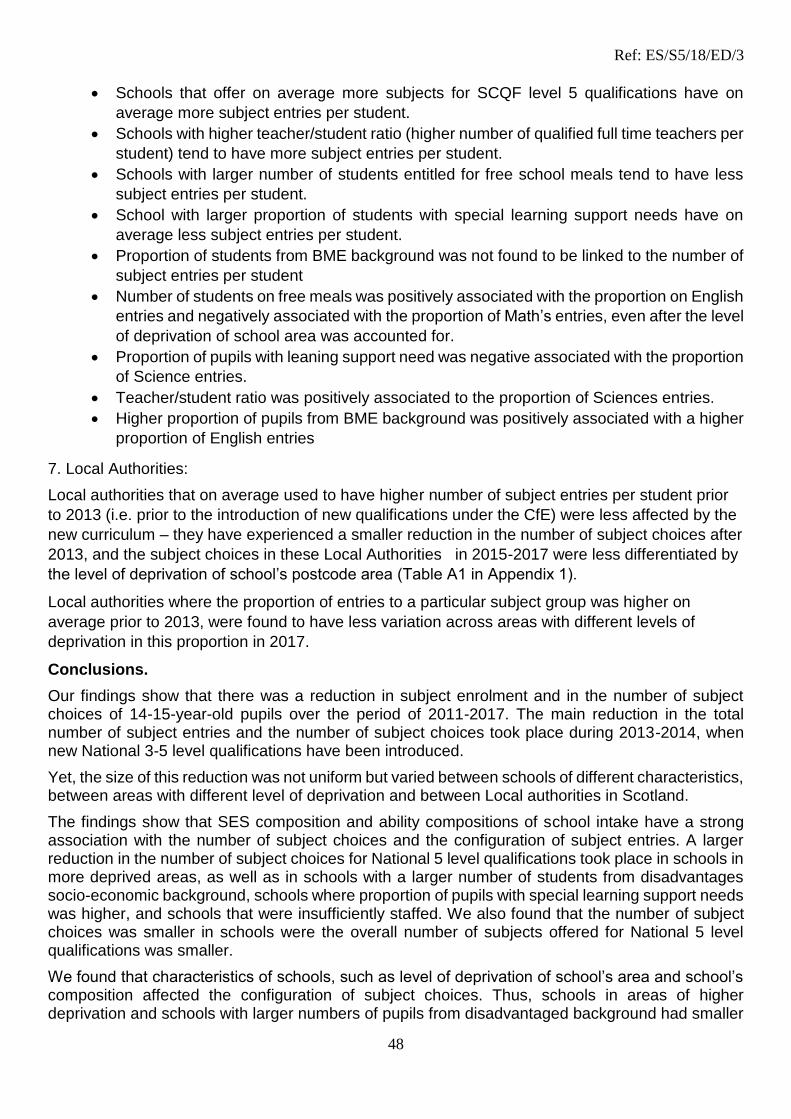
Ref: ES/S5/18/ED/3
48
• Schools that offer on average more subjects for SCQF level 5 qualifications have on
average more subject entries per student.
• Schools with higher teacher/student ratio (higher number of qualified full time teachers per
student) tend to have more subject entries per student.
• Schools with larger number of students entitled for free school meals tend to have less
subject entries per student.
• School with larger proportion of students with special learning support needs have on
average less subject entries per student.
• Proportion of students from BME background was not found to be linked to the number of
subject entries per student
• Number of students on free meals was positively associated with the proportion on English
entries and negatively associated with the proportion of Math’s entries, even after the level
of deprivation of school area was accounted for.
• Proportion of pupils with leaning support need was negative associated with the proportion
of Science entries.
• Teacher/student ratio was positively associated to the proportion of Sciences entries.
• Higher proportion of pupils from BME background was positively associated with a higher
proportion of English entries
7. Local Authorities:
Local authorities that on average used to have higher number of subject entries per student prior
to 2013 (i.e. prior to the introduction of new qualifications under the CfE) were less affected by the
new curriculum – they have experienced a smaller reduction in the number of subject choices after
2013, and the subject choices in these Local Authorities in 2015-2017 were less differentiated by
the level of deprivation of school’s postcode area (Table A1 in Appendix 1).
Local authorities where the proportion of entries to a particular subject group was higher on
average prior to 2013, were found to have less variation across areas with different levels of
deprivation in this proportion in 2017.
Conclusions.
Our findings show that there was a reduction in subject enrolment and in the number of subject choices of 14-15-year-old pupils over the period of 2011-2017. The main reduction in the total number of subject entries and the number of subject choices took place during 2013-2014, when new National 3-5 level qualifications have been introduced.
Yet, the size of this reduction was not uniform but varied between schools of different characteristics, between areas with different level of deprivation and between Local authorities in Scotland.
The findings show that SES composition and ability compositions of school intake have a strong association with the number of subject choices and the configuration of subject entries. A larger reduction in the number of subject choices for National 5 level qualifications took place in schools in more deprived areas, as well as in schools with a larger number of students from disadvantages socio-economic background, schools where proportion of pupils with special learning support needs was higher, and schools that were insufficiently staffed. We also found that the number of subject choices was smaller in schools were the overall number of subjects offered for National 5 level qualifications was smaller.
We found that characteristics of schools, such as level of deprivation of school’s area and school’s composition affected the configuration of subject choices. Thus, schools in areas of higher deprivation and schools with larger numbers of pupils from disadvantaged background had smaller

Ref: ES/S5/18/ED/3
49
proportion of young people enrolled in Sciences and Modern Languages, and larger proportion of pupils enrolled in Vocational subjects was larger.
Thus, one of main finding from our study is that after 2013 the configuration of subject entries and the number of subject choices become more differentiated by characteristics of school, that it was prior to the introduction of new qualifications under the CfE.
As our finding indicate, the phenomenon of the ‘curriculum narrowing’ and the reduction in subject’s choices might disproportionally affect students from disadvantaged socio-economic background. Existing research evidence shows that in Scottish education system subject choices made by young people in S4 are strongly related to subject choices made later, in S5 and S6, and to career opportunities of young people and their ability to make a transition to Higher Education (Iannelli, Smyth & Klein 2015). Therefore, the narrowing of the curriculum and the reduction of choice might have an adverse effect on social-economic mobility opportunities for young people from disadvantaged socio-economic background.
Existing research evidence shows a clear link between subject choices of young people at senior stages of secondary education and their family background, gender and prior attainment (ibid). Our findings confirm existing research evidence that school characteristics are important for individual subject choices (Anders et al 2017). Yet, the mechanism that links between school characteristics and individual subject choice is not entirely clear and more research in needed to understand how schools influence the subject choices of young people. It is especially important now, under the new CfE that has increased the autonomy of schools in curriculum provision, and hence increased the role that schools might play in subject choices of young people.
In order to gain better insights into how patterns of curriculum provision relate to visible phenomena such as curriculum narrowing and their subsequent impact on educational opportunities for young people from different socio-economic backgrounds it is necessary to generate missing data about patterns of provision, the role of schools and teachers in shaping provision and curriculum decision-making. This new data needs to be analysed in conjunction with the analysis of secondary data sources on subject choices, attainment and early destinations of young people in Scotland, with findings from such research informing current and future curriculum policies and practices.
References: Anders, J., Henderson, M., Moulton, V. and Sullivan, A. (2017) The role of schools in explaining individuals’ subject choices at age 14. Centre for Longitudinal Studies, Working Paper 2017/9 Iannelli, C., Smyth, E. & Klein, M. (2015). Curriculum differentiation and social inequality in higher education entry in Scotland and Ireland. British Educational Research Journal. Shapira, Marina and Priestley, Mark (2018) Narrowing the Curriculum? Contemporary trends in provision and attainment in the Scottish Curriculum. Scottish Educational Review, 50(1) Shapira, Marina and Priestley, Mark (2018) Do schools matter? An exploration of the determinants of lower secondary school subject choices under the Scottish Curriculum for Excellence. Paper presented at 2018 European Educational Research Conference, Bolzano, September 2018
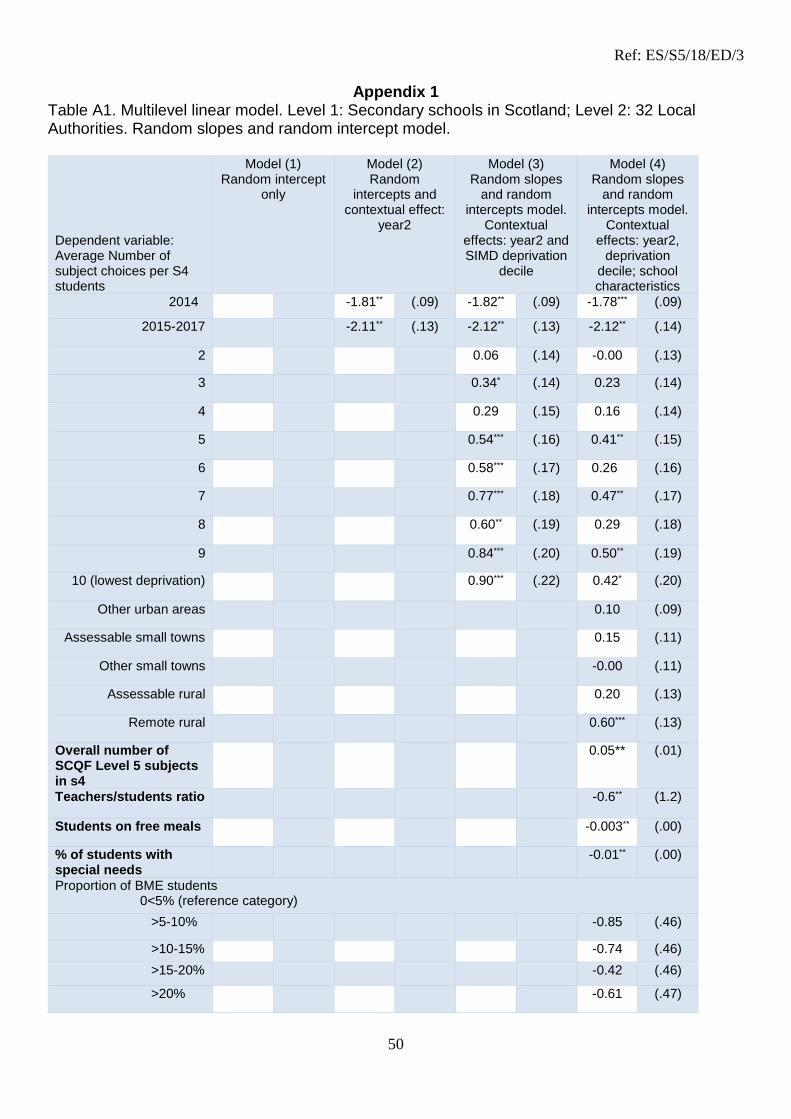
Ref: ES/S5/18/ED/3
50
Appendix 1 Table A1. Multilevel linear model. Level 1: Secondary schools in Scotland; Level 2: 32 Local Authorities. Random slopes and random intercept model. Dependent variable: Average Number of subject choices per S4 students
Model (1) Random intercept
only
Model (2) Random
intercepts and contextual effect:
year2
Model (3) Random slopes
and random intercepts model.
Contextual effects: year2 and SIMD deprivation
decile
Model (4) Random slopes
and random intercepts model.
Contextual effects: year2,
deprivation decile; school characteristics
2014 -1.81** (.09) -1.82** (.09) -1.78*** (.09)
2015-2017 -2.11** (.13) -2.12** (.13) -2.12** (.14)
2 0.06 (.14) -0.00 (.13)
3 0.34* (.14) 0.23 (.14)
4 0.29 (.15) 0.16 (.14)
5 0.54*** (.16) 0.41** (.15)
6 0.58*** (.17) 0.26 (.16)
7 0.77*** (.18) 0.47** (.17)
8 0.60** (.19) 0.29 (.18)
9 0.84*** (.20) 0.50** (.19)
10 (lowest deprivation) 0.90*** (.22) 0.42* (.20)
Other urban areas 0.10 (.09)
Assessable small towns 0.15 (.11)
Other small towns -0.00 (.11)
Assessable rural 0.20 (.13)
Remote rural 0.60*** (.13)
Overall number of SCQF Level 5 subjects in s4
0.05** (.01)
Teachers/students ratio -0.6** (1.2)
Students on free meals -0.003** (.00)
% of students with special needs
-0.01** (.00)
Proportion of BME students 0<5% (reference category)
>5-10% -0.85 (.46)
>10-15% -0.74 (.46)
>15-20% -0.42 (.46)
>20% -0.61 (.47)
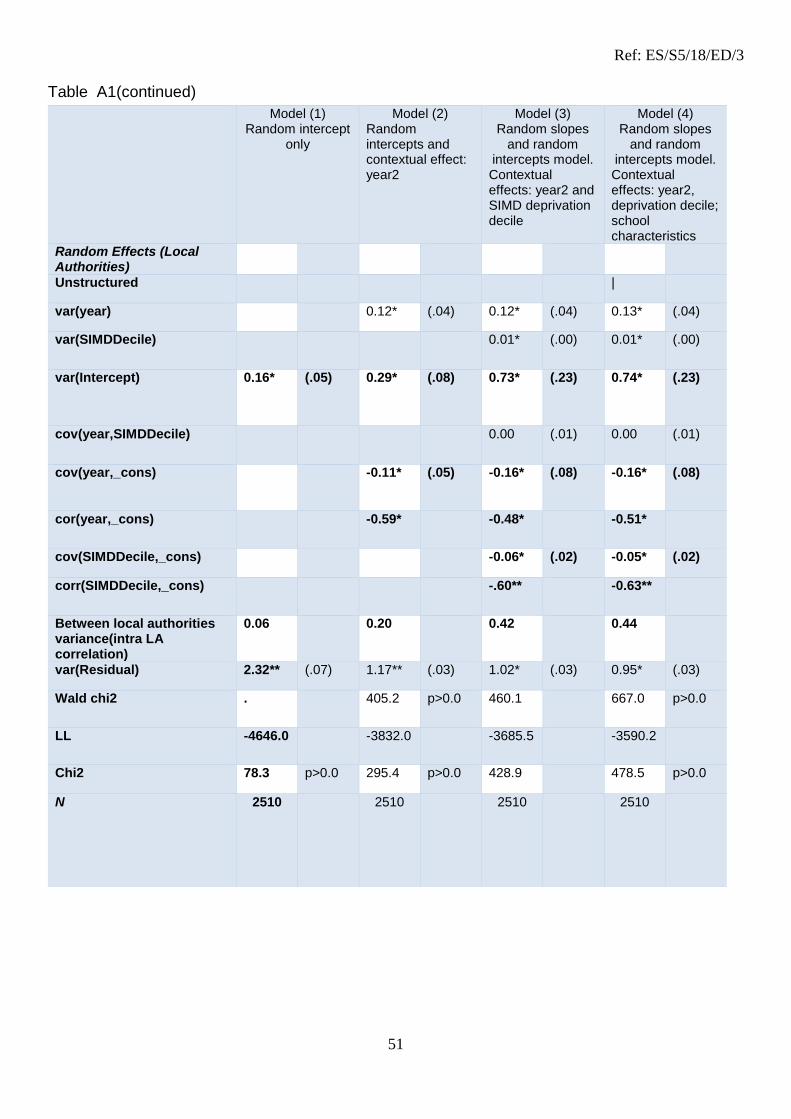
Ref: ES/S5/18/ED/3
51
Table A1(continued)
Model (1) Random intercept
only
Model (2) Random intercepts and contextual effect: year2
Model (3) Random slopes
and random intercepts model. Contextual effects: year2 and SIMD deprivation decile
Model (4) Random slopes
and random intercepts model. Contextual effects: year2, deprivation decile; school characteristics
Random Effects (Local Authorities)
Unstructured |
var(year) 0.12* (.04) 0.12* (.04) 0.13* (.04)
var(SIMDDecile) 0.01* (.00) 0.01* (.00)
var(Intercept) 0.16* (.05) 0.29* (.08) 0.73* (.23) 0.74* (.23)
cov(year,SIMDDecile) 0.00 (.01) 0.00 (.01)
cov(year,_cons) -0.11* (.05) -0.16* (.08) -0.16* (.08)
cor(year,_cons) -0.59* -0.48* -0.51*
cov(SIMDDecile,_cons) -0.06* (.02) -0.05* (.02)
corr(SIMDDecile,_cons) -.60** -0.63**
Between local authorities variance(intra LA correlation)
0.06 0.20 0.42 0.44
var(Residual) 2.32** (.07) 1.17** (.03) 1.02* (.03) 0.95* (.03)
Wald chi2 . 405.2 p>0.0 460.1 667.0 p>0.0
LL -4646.0 -3832.0 -3685.5 -3590.2
Chi2 78.3 p>0.0 295.4 p>0.0 428.9 478.5 p>0.0
N 2510 2510 2510 2510

Ref: ES/S5/18/ED/3
52
Annexe D Education and Skills Committee
SUBMISSION FROM SCOTTISH QUALIFICATIONS AUTHORITY
2017-18 NATIONAL QUALIFICATIONS RESULTS STATISTICS
1. Introduction
The Education and Skills Committee is seeking to look at the 2017-18 National Qualifications
results, together with previous years. They have indicated that this will include discussion around
subject choice, qualification uptake, attainment levels, and the numbers of people taking different
forms of qualification. SQA will provide evidence to the Committee on the national results data for
2017-18 and previous years. It will be for other national and local bodies to address why there may
have been changes to the nature of subject choice, presentation patterns, and uptake volumes.
As Scotland’s national awarding and accreditation body, SQA is proud to be at the heart of the
education and skills system in Scotland, and is committed to work with partners to help young
people realise their potential and achieve their ambitions.
SQA is the statutory awarding body for qualifications in Scotland. Its duties are to develop,
validate, quality assure and award a national framework of qualifications. In this capacity, SQA
publishes statistics on the attainment of qualifications in Scotland, including National
Qualifications, and a wide range of vocational courses and awards, which are certificated annually
in August.
SQA is keenly aware of its responsibility to maintain the credibility, quality and standards of
Scottish Qualifications over time. We continue to work closely with all our stakeholders to ensure
appropriate support is given and appropriate actions taken to maintain the robust standards of our
National Qualifications over time.
2. National Qualifications
a. Previous qualifications
Nationals replaced Access, Standard Grade and Intermediate qualifications as part of the
evolution of qualifications and represent a natural continuation in the way pupils have learned
under Curriculum for Excellence (CfE), as they have moved from their broad general education, in
S1 to S3, through to their senior phase, in S4 to S6.
Highers (SCQF level 6) and Advanced Highers (SCQF level 7) were also revised to support
Curriculum for Excellence.
Before the introduction of the new Nationals, learners in S4 would typically be entered for and
undertake assessments at two levels in Standard Grade qualifications – Credit/General
(SCQF levels 4 & 5) or General/Foundation (SCQF levels 3 & 4). Learners were awarded a
grade at an SCQF level based on their performance in the assessments. It should be noted
that learners could be awarded a Standard Grade at a level for which they were not

Ref: ES/S5/18/ED/3
53
presented. For example, a learner who performed poorly in both the General and Credit
assessment could end up with a Foundation level result. This means that it is not possible to
provide SCQF level entry versus attainment statistics for Standard Grade qualifications.
While there are no direct comparisons of qualification entries by individual SCQF level
between 2013 (which includes Standard Grade) and subsequent years, a comparison can be
made of attainment volumes (the numbers of learners attaining qualifications) at SCQF
levels 3-5 across the years.
Direct comparison of qualification entries and attainment by individual SCQF level can be
made from 2014 onwards.
b. New qualifications to support Curriculum for Excellence (CfE)
The introduction of CfE represented the most significant change in Scotland’s education and
qualifications systems in a generation. CfE covers a continuum of learning, assessment and
qualifications from 3 to18 years. It provides a broad general education (BGE) for learners from the
ages of 3 to 15 years, followed by a more subject-specific focus when they enter the senior phase
of secondary education, usually 15 to18 years.
Both the curriculum and qualifications aim to ensure that all children and young people in Scotland
develop the knowledge, skills and attributes they will need to flourish in life, learning and work,
now and in the future.
SQA’s role was to design and develop new National Qualifications and assessments that support
the principles and aims of CfE, building on the learning in BGE. These qualifications would be
undertaken by learners in the senior phase of their secondary school education (S4-S6). SQA has
a remit to set and mark assessments, quality assure that process, and then certificate the
qualifications.
The challenges of the world that young people are emerging into and how prepared they are for
their next steps in life were very much the focus. While knowledge is still important, there is a
greater emphasis on skills development inside breadth, depth and application of skills and
knowledge. There was a redressing of the balance between knowledge, understanding and skills,
with a greater focus on subject-specific skills and generic skills, like higher order thinking skills —
skills for learning, life and work.
The new qualifications (National 1 – National 5, Higher and Advanced Higher) allow learners to
demonstrate attainment against consistent and stringent standards that cover skills, knowledge,
problem solving and the application of skills.
In addition to the new National Qualifications, SQA has qualifications to meet a wider range of
learners’ needs, including a range of Awards, Skills for Work, National Progression Awards,
National Certificates, and Foundation Apprenticeships in areas such as leadership, employability,
modern languages for life and work, childcare, sound production, and personal finance.
Ref: ES/S5/18/ED/3
54
These are part of a broad offering of qualifications available to learners which support the
Developing the Young Workforce (DYW) programme.
This wide range of qualifications helps young people reach their full potential as they progress
from their broad general education through to college, university, apprenticeships, other learning,
training and employment.
The new qualifications were introduced in phases, with the first National 1 to National 5
qualifications being undertaken in academic session 2013–14. The new Higher was introduced in
2014-15 and the new Advanced Higher in 2015-16.
3. Trends in entries and attainment, 2011-2018
The period 2011-2018 spans the use of Access, Standard Grades, Intermediates and the new
qualifications introduced to support CfE.
The data in Table 1 originates from SQA statistical attainment data taken in August each
academic year. The shaded area in this and subsequent tables highlight those years where the
statistics include Standard Grade presentations.
The Scottish Baccalaureate is not included in total figures as it is composed of Highers and
Advanced Highers (counted elsewhere), and the Interdisciplinary Project (IP), which is formally a
unit.
The Scottish Credit and Qualifications Framework (SCQF) helps people to understand and
compare different qualifications in Scotland.

Ref: ES/S5/18/ED/3
55
Table 1: Entries for each National Qualification type, 2011 – 2018, with subtotals
Entries
2011 2012 2013 2014 2015 2016 2017 2018
SCQF level 2
Access 2 1,964 1,915 1,586 416 104 20 - -
National 2 - - - 1,217 1,865 2,449 1,896 2,077
Skills for Work and
Personal Development 174 204 246 117 -
- - -
Total 2,138 2,119 1,832 1,750 1,969 2,469 1,896 2,077
SCQF level 3
Access 3 32,503 35,350 32,963 10,939 3,340 3 - -
National 3 - - - 16,587 17,268 18,475 17,114 17,646
Skills for Work and
Personal Development 323 327 439 467 39 32 15 11
Total 32,826 35,677 33,402 27,993 20,647 18,510 17,129 17,657
SCQF level 4
Intermediate 1 65,425 67,721 63,190 18,679 1,553 - - -
National 4 - - - 122,716 130,876 122,961 116,032 106,033
Skills for Work and
Personal Development 6,749 6,706 6,428 5,667 5,361 4,218 3,767 3,601
Total 72,174 74,427 69,618 147,062 137,790 127,179 119,799 109,634
SCQF level 5
Intermediate 2 132,345 137,158 140,577 97,122 10,678 - - -
National 5 - - - 213,595 288,016 295,083 293,220 281,785
Skills for Work and
Personal Development 2,171 2,888 3,791 4,586 5,207 5,372 6,126 6,632
Total 134,516 140,046 144,368 315,303 303,901 300,455 299,346 288,417
SCQF level 3-5
Standard Grade 330,671 319,986 308,243 - - - - -
Total 330,671 319,986 308,243 - - - - -
SCQF level 6
Previous Higher 178,203 180,912 182,601 191,850 92,555 - - -
Higher - - - - 107,295 197,774 194,813 191,951
Skills for Work and
Personal Development 635 656 713 1,228 1,276 386 433 264
Total 178,838 181,568 183,314 193,078 201,126 198,160 195,246 192,215
SCQF level 7
Previous Advanced Higher 21,414 21,587 22,120 22,430 23,348 - - -
Advanced Higher - - - - - 23,795 24,112 24,331
Total 21,414 21,587 22,120 22,430 23,348 23,795 24,112 24,331
TOTAL 772,577 775,410 762,897 707,616 688,781 670,568 657,528 634,331
Scottish Baccalaureate
(SCQF level 7) 174 182 191 176 122 140 161 155

Ref: ES/S5/18/ED/3
56
Table 2: SCQF levels 3-5 entries, 2011-2018
Year 2011 2012 2013 2014 2015 2016 2017 2018
SCQF levels 3-5 entries 570,187 570,136 555,631 490,358 462,338 446,144 436,274 415,708
SCQF levels 3-5 are combined in table 2, as this facilitates comparisons across the period when
Standard Grade was available, and all Standard Grade entries were made within these levels.
There has been an overall decrease in the number of learners on the school roll at stages S3 and
S4 (the school stages most likely to be completing qualifications at SCQF levels 3-5) across the
indicated period, although there was an increase in 2017. Table 3 provides the school roll data
published by the Scottish Government in February 2018.
Table 3: School roll figures (Scottish Government, February 2018)
Number of Pupils
2011 2012 2013 2014 2015 2016 2017
S1 52,180 51,080 50,030 49,327 50,912 52,206 52,796
S2 54,187 52,254 51,240 50,248 49,612 51,133 52,437
S3 55,512 54,309 52,346 51,361 50,296 49,793 51,284
S4 55,243 54,895 53,895 52,206 51,175 50,244 49,705
S5 47,741 47,625 47,809 47,373 45,911 44,862 43,934
S6 32,246 33,399 33,844 34,247 34,033 32,745 31,837
There may be a number of factors contributing to the decrease in the volume of attainment, which
are out with the remit of SQA. These include the extension of the BGE from S1 to S3, the
reduction in the school roll in S3 and S4, and variations in the number of subjects offered in
individual schools and local authorities.
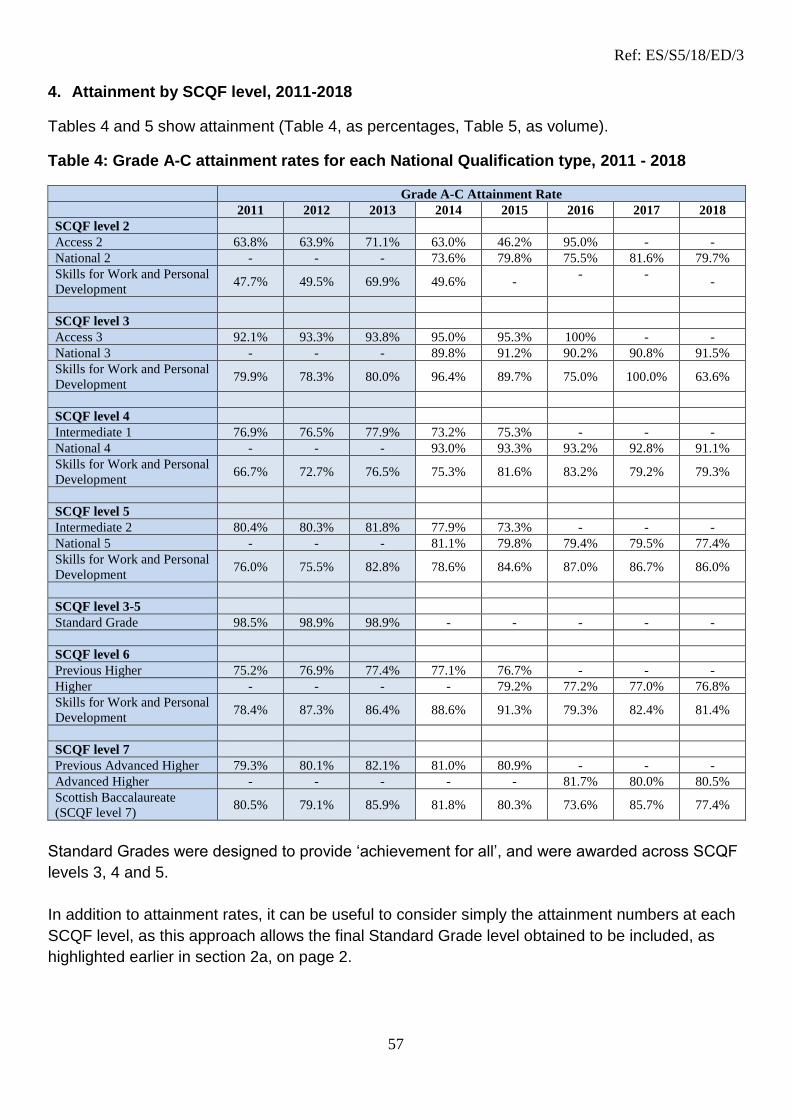
Ref: ES/S5/18/ED/3
57
4. Attainment by SCQF level, 2011-2018
Tables 4 and 5 show attainment (Table 4, as percentages, Table 5, as volume).
Table 4: Grade A-C attainment rates for each National Qualification type, 2011 - 2018
Grade A-C Attainment Rate
2011 2012 2013 2014 2015 2016 2017 2018
SCQF level 2
Access 2 63.8% 63.9% 71.1% 63.0% 46.2% 95.0% - -
National 2 - - - 73.6% 79.8% 75.5% 81.6% 79.7%
Skills for Work and Personal
Development 47.7% 49.5% 69.9% 49.6% -
- - -
SCQF level 3
Access 3 92.1% 93.3% 93.8% 95.0% 95.3% 100% - -
National 3 - - - 89.8% 91.2% 90.2% 90.8% 91.5%
Skills for Work and Personal
Development 79.9% 78.3% 80.0% 96.4% 89.7% 75.0% 100.0% 63.6%
SCQF level 4
Intermediate 1 76.9% 76.5% 77.9% 73.2% 75.3% - - -
National 4 - - - 93.0% 93.3% 93.2% 92.8% 91.1%
Skills for Work and Personal
Development 66.7% 72.7% 76.5% 75.3% 81.6% 83.2% 79.2% 79.3%
SCQF level 5
Intermediate 2 80.4% 80.3% 81.8% 77.9% 73.3% - - -
National 5 - - - 81.1% 79.8% 79.4% 79.5% 77.4%
Skills for Work and Personal
Development 76.0% 75.5% 82.8% 78.6% 84.6% 87.0% 86.7% 86.0%
SCQF level 3-5
Standard Grade 98.5% 98.9% 98.9% - - - - -
SCQF level 6
Previous Higher 75.2% 76.9% 77.4% 77.1% 76.7% - - -
Higher - - - - 79.2% 77.2% 77.0% 76.8%
Skills for Work and Personal
Development 78.4% 87.3% 86.4% 88.6% 91.3% 79.3% 82.4% 81.4%
SCQF level 7
Previous Advanced Higher 79.3% 80.1% 82.1% 81.0% 80.9% - - -
Advanced Higher - - - - - 81.7% 80.0% 80.5%
Scottish Baccalaureate
(SCQF level 7) 80.5% 79.1% 85.9% 81.8% 80.3% 73.6% 85.7% 77.4%
Standard Grades were designed to provide ‘achievement for all’, and were awarded across SCQF
levels 3, 4 and 5.
In addition to attainment rates, it can be useful to consider simply the attainment numbers at each
SCQF level, as this approach allows the final Standard Grade level obtained to be included, as
highlighted earlier in section 2a, on page 2.
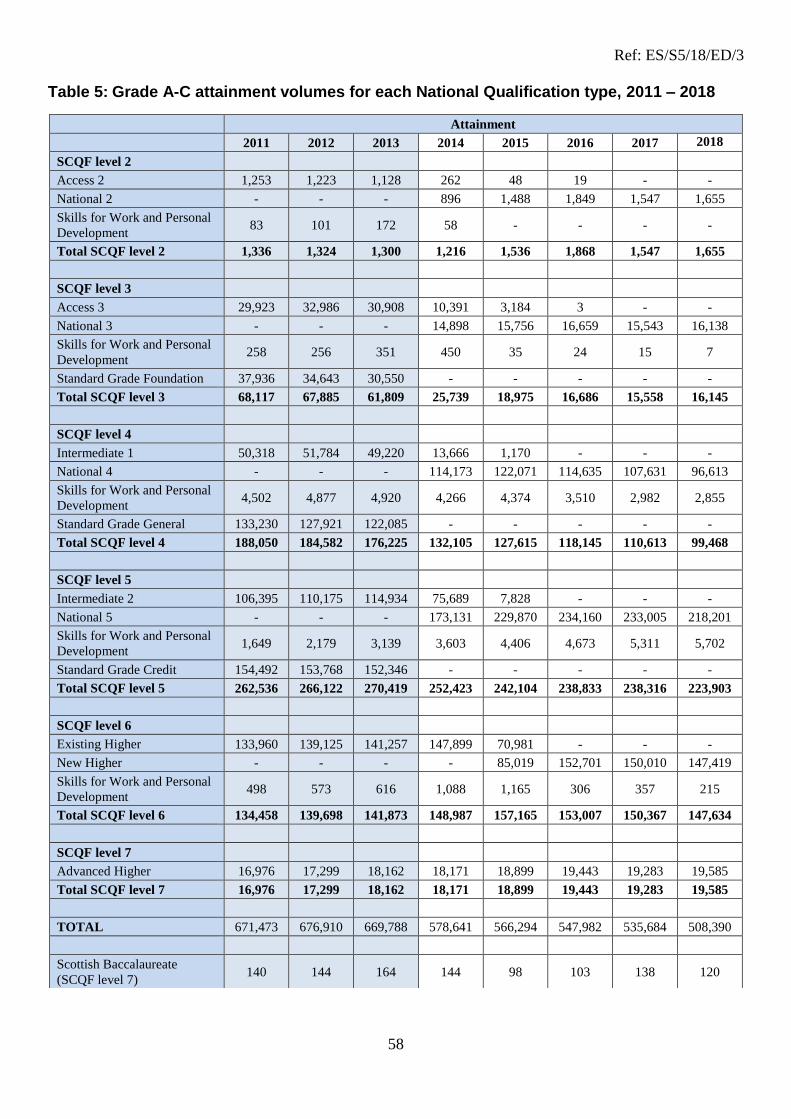
Ref: ES/S5/18/ED/3
58
Table 5: Grade A-C attainment volumes for each National Qualification type, 2011 – 2018
Attainment
2011 2012 2013 2014 2015 2016 2017 2018
SCQF level 2
Access 2 1,253 1,223 1,128 262 48 19 - -
National 2 - - - 896 1,488 1,849 1,547 1,655
Skills for Work and Personal
Development 83 101 172 58 - - - -
Total SCQF level 2 1,336 1,324 1,300 1,216 1,536 1,868 1,547 1,655
SCQF level 3
Access 3 29,923 32,986 30,908 10,391 3,184 3 - -
National 3 - - - 14,898 15,756 16,659 15,543 16,138
Skills for Work and Personal
Development 258 256 351 450 35 24 15 7
Standard Grade Foundation 37,936 34,643 30,550 - - - - -
Total SCQF level 3 68,117 67,885 61,809 25,739 18,975 16,686 15,558 16,145
SCQF level 4
Intermediate 1 50,318 51,784 49,220 13,666 1,170 - - -
National 4 - - - 114,173 122,071 114,635 107,631 96,613
Skills for Work and Personal
Development 4,502 4,877 4,920 4,266 4,374 3,510 2,982 2,855
Standard Grade General 133,230 127,921 122,085 - - - - -
Total SCQF level 4 188,050 184,582 176,225 132,105 127,615 118,145 110,613 99,468
SCQF level 5
Intermediate 2 106,395 110,175 114,934 75,689 7,828 - - -
National 5 - - - 173,131 229,870 234,160 233,005 218,201
Skills for Work and Personal
Development 1,649 2,179 3,139 3,603 4,406 4,673 5,311 5,702
Standard Grade Credit 154,492 153,768 152,346 - - - - -
Total SCQF level 5 262,536 266,122 270,419 252,423 242,104 238,833 238,316 223,903
SCQF level 6
Existing Higher 133,960 139,125 141,257 147,899 70,981 - - -
New Higher - - - - 85,019 152,701 150,010 147,419
Skills for Work and Personal
Development 498 573 616 1,088 1,165 306 357 215
Total SCQF level 6 134,458 139,698 141,873 148,987 157,165 153,007 150,367 147,634
SCQF level 7
Advanced Higher 16,976 17,299 18,162 18,171 18,899 19,443 19,283 19,585
Total SCQF level 7 16,976 17,299 18,162 18,171 18,899 19,443 19,283 19,585
TOTAL 671,473 676,910 669,788 578,641 566,294 547,982 535,684 508,390
Scottish Baccalaureate
(SCQF level 7) 140 144 164 144 98 103 138 120
Ref: ES/S5/18/ED/3
59
Since 2014, relatively few candidates have been obtaining qualifications at SCQF level 3.
Attainment at SCQF level 3 has decreased by 73.9% between 2013 (last year of Standard Grade),
and 2018. It is possible that candidates are being entered at a later stage, or at higher SCQF
levels than was the case previously, or for other reasons.
5. Attainment in the wider SQA provision of qualifications
SQA Awards are designed to develop and provide evidence of specific skills that will help learners
in the world of work and everyday life. Awards include Enterprise, Employability, Modern
Languages for Work and Life and a Scottish Studies Award.
National Progression Awards are designed to assess a defined set of skills and knowledge in
specialist vocational areas, such as Construction and Childcare. National Certificates are designed
to prepare people for employment, career development or progression to more advanced study in
areas such as Sound Production and Technical Theatre.
All of these qualifications, being delivered in schools in partnership with colleges and employers,
are part of a broadening of the curriculum and also support the implementation of Developing the
Young Workforce.
Attainment in this wider provision remains broadly similar, having been steadily increasing and
then peaking in 2016 at 43,055. In 2018, the total attainment in such qualifications remained
broadly similar to 2017 at 41,526, representing a 0.1% increase compared to 2017. There is a
6.4% decrease in National Certificates, a 12.6% increase in National Progression Awards, and a
3.9% decrease in Awards, so there has been some movement with regards to the qualification
types making up this wider attainment.
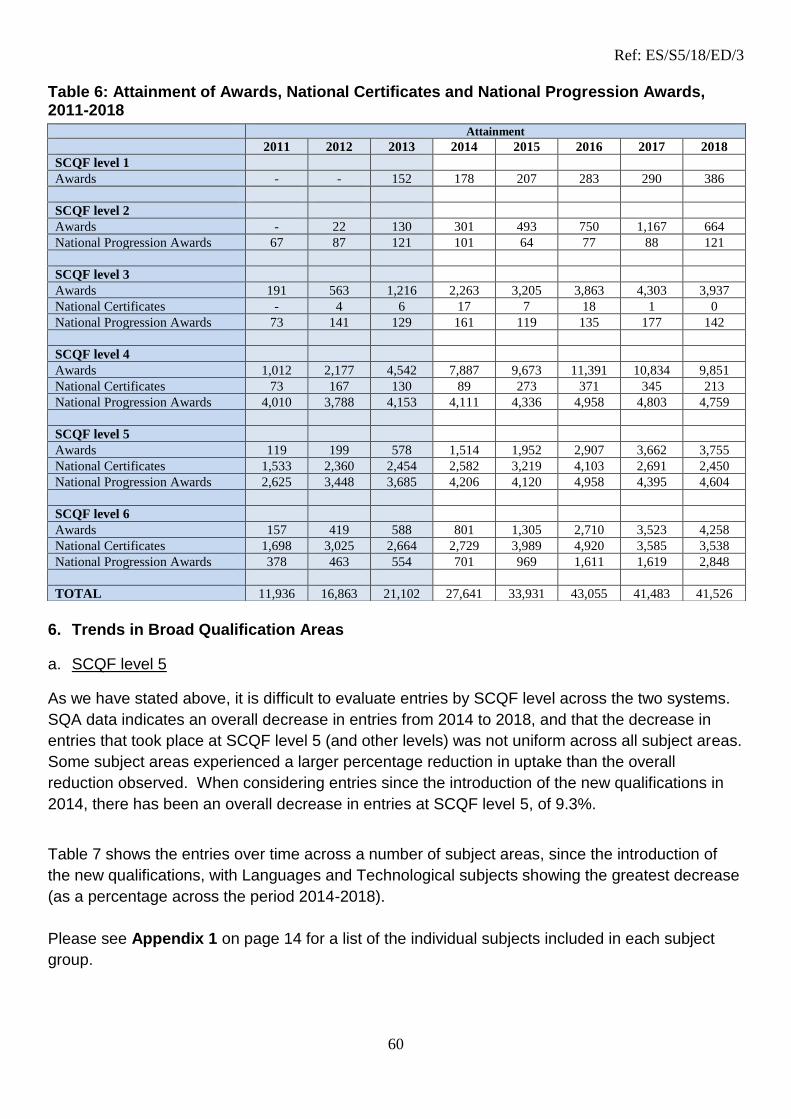
Ref: ES/S5/18/ED/3
60
Table 6: Attainment of Awards, National Certificates and National Progression Awards, 2011-2018
6. Trends in Broad Qualification Areas
a. SCQF level 5
As we have stated above, it is difficult to evaluate entries by SCQF level across the two systems.
SQA data indicates an overall decrease in entries from 2014 to 2018, and that the decrease in
entries that took place at SCQF level 5 (and other levels) was not uniform across all subject areas.
Some subject areas experienced a larger percentage reduction in uptake than the overall
reduction observed. When considering entries since the introduction of the new qualifications in
2014, there has been an overall decrease in entries at SCQF level 5, of 9.3%.
Table 7 shows the entries over time across a number of subject areas, since the introduction of
the new qualifications, with Languages and Technological subjects showing the greatest decrease
(as a percentage across the period 2014-2018).
Please see Appendix 1 on page 14 for a list of the individual subjects included in each subject
group.
Attainment
2011 2012 2013 2014 2015 2016 2017 2018
SCQF level 1
Awards - - 152 178 207 283 290 386
SCQF level 2
Awards - 22 130 301 493 750 1,167 664
National Progression Awards 67 87 121 101 64 77 88 121
SCQF level 3
Awards 191 563 1,216 2,263 3,205 3,863 4,303 3,937
National Certificates - 4 6 17 7 18 1 0
National Progression Awards 73 141 129 161 119 135 177 142
SCQF level 4
Awards 1,012 2,177 4,542 7,887 9,673 11,391 10,834 9,851
National Certificates 73 167 130 89 273 371 345 213
National Progression Awards 4,010 3,788 4,153 4,111 4,336 4,958 4,803 4,759
SCQF level 5
Awards 119 199 578 1,514 1,952 2,907 3,662 3,755
National Certificates 1,533 2,360 2,454 2,582 3,219 4,103 2,691 2,450
National Progression Awards 2,625 3,448 3,685 4,206 4,120 4,958 4,395 4,604
SCQF level 6
Awards 157 419 588 801 1,305 2,710 3,523 4,258
National Certificates 1,698 3,025 2,664 2,729 3,989 4,920 3,585 3,538
National Progression Awards 378 463 554 701 969 1,611 1,619 2,848
TOTAL 11,936 16,863 21,102 27,641 33,931 43,055 41,483 41,526
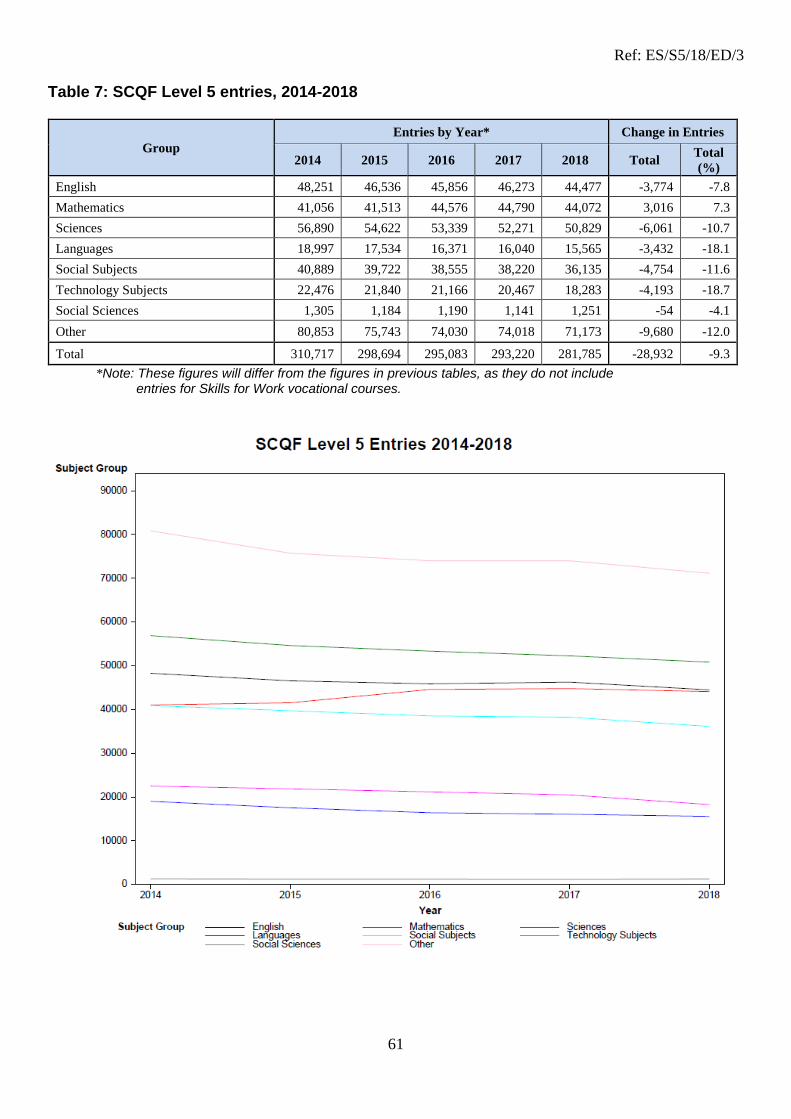
Ref: ES/S5/18/ED/3
61
Table 7: SCQF Level 5 entries, 2014-2018
Group
Entries by Year* Change in Entries
2014 2015 2016 2017 2018 Total Total
(%)
English 48,251 46,536 45,856 46,273 44,477 -3,774 -7.8
Mathematics 41,056 41,513 44,576 44,790 44,072 3,016 7.3
Sciences 56,890 54,622 53,339 52,271 50,829 -6,061 -10.7
Languages 18,997 17,534 16,371 16,040 15,565 -3,432 -18.1
Social Subjects 40,889 39,722 38,555 38,220 36,135 -4,754 -11.6
Technology Subjects 22,476 21,840 21,166 20,467 18,283 -4,193 -18.7
Social Sciences 1,305 1,184 1,190 1,141 1,251 -54 -4.1
Other 80,853 75,743 74,030 74,018 71,173 -9,680 -12.0
Total 310,717 298,694 295,083 293,220 281,785 -28,932 -9.3
*Note: These figures will differ from the figures in previous tables, as they do not include entries for Skills for Work vocational courses.

Ref: ES/S5/18/ED/3
62
Table 8 shows the changes across 2013-2014 (coinciding with the removal of Standard Grade),
and then a decrease across the period 2014-2018, representing the change as the new
qualifications were being introduced.
The figures indicate the number of candidates obtaining SQA qualifications in Language,
Technology and Social Subjects at SCQF level 5 has decreased over this period, both across the
Standard Grade to CfE transition year, and over the period 2014-2018, when the new
qualifications were in use.
Table 8: SCQF Level 5 attainment, 2013-2018
Group^ Attainment* by Year
Change in Attainment
2013-2014 2014-2018 2013-2018
2013 2014 2015 2016 2017 2018 Total Total
(%) Total
Total
(%) Total
Total
(%)
English 40,127 40,914 40,322 39,813 40,354 37,701 787 2 -3,213 -7.9 -2,426 -6.0
Mathematics 31,077 28,782 24,617 27,412 28,135 28,328 -2,295 -7.4 -454 -1.6 -2,749 -8.8
Sciences 44,081 39,058 39,472 39,623 38,332 37,964 -5,023 -11.4 -1,094 -2.8 -6,117 -13.9
Languages 20,428 16,885 15,699 14,289 14,324 13,727 -3,543 -17.3 -3,158 -18.7 -6,701 -32.8
Social
Subjects 34,596 32,219 30,832 29,809 28,924 26,516 -2,377 -6.9 -5,703 -17.7 -8,080 -23.4
Technology
Subjects 21,444 18,514 18,475 17,036 17,022 12,759 -2,930 -13.7 -5,755 -31.1 -8,685 -40.5
Other 75,527 72,448 68,281 66,178 65,914 61,206 -3,079 -4.1 -11,242 -15.5 -14,321 -19.0
Total 267,280 248,820 237,698 234,160 233,005 218,201 -18,460 -6.9 -30,619 -12.3 -49,079 -18.4
^ The social sciences subject group is not listed in this table as the subjects were not available at Standard Grade. From 2014,
attainment figures for social science subjects have been added to the ‘Other’ group
* Learners attaining a grade 1 or 2 at Standard Grade or an A-C grade at Intermediate 2 and National 5
We have detailed SCQF level 5 as it plays a significant role in the route learners most commonly
take as they progress to Higher level.
b. SCQF levels 6 and 7
Comparisons at SCQF levels 6 and 7 in terms of both entries and awards is relatively straightforward. Please see Appendix 2 on page 16 for tables on Higher and Advanced Higher qualification attainment, 2013-18. c. SCQF level 4
National 4 entries and awards contain awards made through the Recognising Positive
Achievement (RPA) process, where candidates are awarded a National 4 if obtaining a ‘No
Award’ result at National 5 but have completed the relevant units at National 4. This
arrangement makes evaluation of entries and awards for this qualification difficult, however
SQA does annually estimate the use of RPA and this is shown in Table 9.

Ref: ES/S5/18/ED/3
63
Table 9: RPA estimations since 2014
*Note: In 2018, Grade D at National 5 was extended to allow for greater recognition of attainment
at this SCQF level. As a result fewer candidates received a ‘No Award’ and were thus not
automatically awarded a National 4 if they had completed the relevant units.
^ The figures in this table have all been taken from Results Day, each August. However, the
numbers of candidates being awarded a National 4 through RPA have increased when centres
submit entries for the relevant units, after the results are published.
7. Summary
SQA is confident that the qualifications are appropriate and offer the necessary challenge for the
learners undertaking them. The qualifications and associated course assessments are currently
functioning well, and the national standard is being maintained over time.
SQA uses a range of mechanisms to ensure that it sets assessments at the correct standard.
Grade boundary setting is used to make small adjustments if an assessment was more or less
challenging than planned. A number of statistical measures are also used to ensure broad
comparability of challenge at each SCQF level.
SQA undertakes regular standards monitoring exercises to ensure that standards over time are
being maintained, and the findings are published.
Each autumn, SQA publishes course reports, which give information on the performance of
candidates in that year’s exams and coursework. They also provide advice for teachers and
lecturers on preparing candidates for future course assessments. SQA also offers seminars and
webinars as part of our Understanding Standards programme, and publishes more detailed
materials to help teachers and lecturers understand the standard, for example, by publishing
marked examples of candidates’ work.
The Curriculum and Assessment Board is currently reviewing the National 4 qualification, at SCQF
level 4, and SQA will continue to engage with the education community on all National and other
qualifications.
SQA welcomes the opportunity to discuss the national statistics further with the Committee. We
remain committed to providing qualifications and awards that enable the young people of Scotland
to develop the skills that they need to thrive in the future, whichever path they choose to take.
2014 2015 2016 2017 2018*
National 4 reported entries 122,716 130,876 122,961 116,032 106,033
National 4 reported awards (Total) 114,173 122,071 114,635 107,631 96,613
Estimate of those awarded through RPA^ 10,705 20,500 23,551 24,211 10,914
Estimated percentage of National 4 recorded
entries with an award arising through RPA 8.7% 15.7% 19.2% 20.9% 10.3%
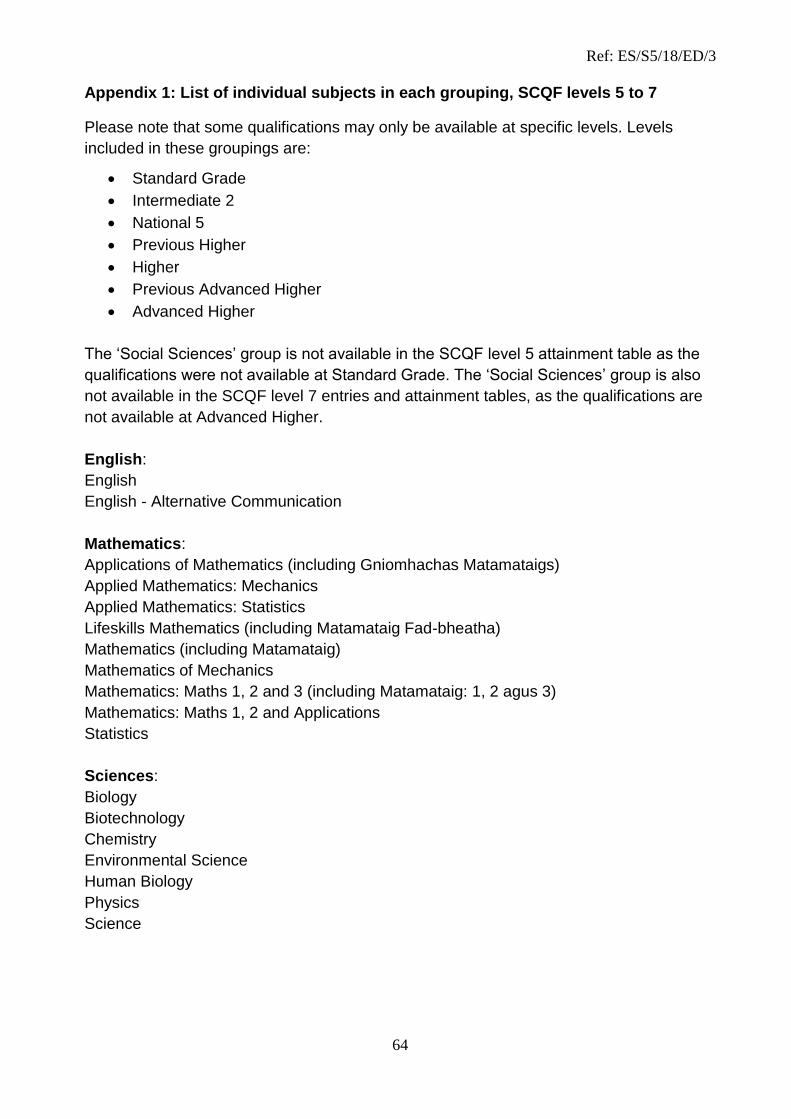
Ref: ES/S5/18/ED/3
64
Appendix 1: List of individual subjects in each grouping, SCQF levels 5 to 7
Please note that some qualifications may only be available at specific levels. Levels
included in these groupings are:
• Standard Grade
• Intermediate 2
• National 5
• Previous Higher
• Higher
• Previous Advanced Higher
• Advanced Higher
The ‘Social Sciences’ group is not available in the SCQF level 5 attainment table as the
qualifications were not available at Standard Grade. The ‘Social Sciences’ group is also
not available in the SCQF level 7 entries and attainment tables, as the qualifications are
not available at Advanced Higher.
English:
English
English - Alternative Communication
Mathematics:
Applications of Mathematics (including Gniomhachas Matamataigs)
Applied Mathematics: Mechanics
Applied Mathematics: Statistics
Lifeskills Mathematics (including Matamataig Fad-bheatha)
Mathematics (including Matamataig)
Mathematics of Mechanics
Mathematics: Maths 1, 2 and 3 (including Matamataig: 1, 2 agus 3)
Mathematics: Maths 1, 2 and Applications
Statistics
Sciences:
Biology
Biotechnology
Chemistry
Environmental Science
Human Biology
Physics
Science

Ref: ES/S5/18/ED/3
65
Languages:
Cantonese
French
Gaelic (Learners)
German
Italian
Mandarin (Simplified)
Mandarin (Traditional)
Russian
Spanish
Urdu
Social Subjects:
Geography (including Cruinn-eolas)
History (including Eachdraidh)
Modern Studies (including Nuadh-Eolas)
Technology Subjects:
Computing
Computing Science
Computing Studies
Craft & Design
Design and Manufacture
Engineering Science
Graphic Communication
Information Systems
Product Design
Technological Studies
Social Sciences:
Philosophy
Psychology
Sociology

Ref: ES/S5/18/ED/3
66
Appendix 2: Higher and Advanced Higher attainment, 2013-18
a. SCQF level 6 entries, 2013-18
Group (SCQF 6)
Entries by Year Change in Entries
(2013-2018)
2013 2014 2015 2016 2017 2018 Total Total
(%)
English 30,401 31,582 35,354 36,356 35,716 36,185 5,784 19.0
Mathematics 20,663 21,851 21,074 18,868 18,861 18,753 -1,910 -9.2
Sciences 34,703 36,135 35,401 33,084 33,044 31,935 -2,768 -8.0
Languages 7,499 7,574 8,625 8,707 8,183 7,974 475 6.3
Social Subjects 26,144 28,306 29,009 29,176 28,024 26,959 815 3.1
Technology
Subjects 12,392 12,818 13,223 13,172 12,974 12,067 -325 -2.6
Social Sciences 5,087 5,632 5,703 5,553 5,454 5,304 217 4.3
Other 45,712 47,952 51,461 52,858 52,557 52,774 7,062 15.4
Total 182,601 191,850 199,850 197,774 194,813 191,951 9,350 5.1
b. SCQF level 6 attainment, 2013-18
Group (SCQF 6)
Attainment* by Year
Change in
Attainment
(2013-2018)
2013 2014 2015 2016 2017 2018 Total Total
(%)
English 22,460 23,702 27,902 28,666 27,609 27,482 5,022 22.4
Mathematics 14,979 15,757 15,169 13,863 13,953 13,973 -1,006 -6.7
Sciences 25,737 26,487 25,786 23,945 24,391 23,709 -2,028 -7.9
Languages 6,186 6,441 7,419 7,776 7,217 6,881 695 11.2
Social Subjects 21,411 22,732 22,746 22,884 21,824 20,972 -439 -2.1
Technology
Subjects 9,201 9,315 9,630 9,055 9,066 8,369 -832 -9.0
Social Sciences 3,666 3,797 3,829 3,644 3,499 3,122 -544 -14.8
Other 37,617 39,668 43,519 42,868 42,451 42,911 5,294 14.1
Total 141,257 147,899 156,000 152,701 150,010 147,419 6,162 4.4
* Learners attaining an A-C grade at Higher
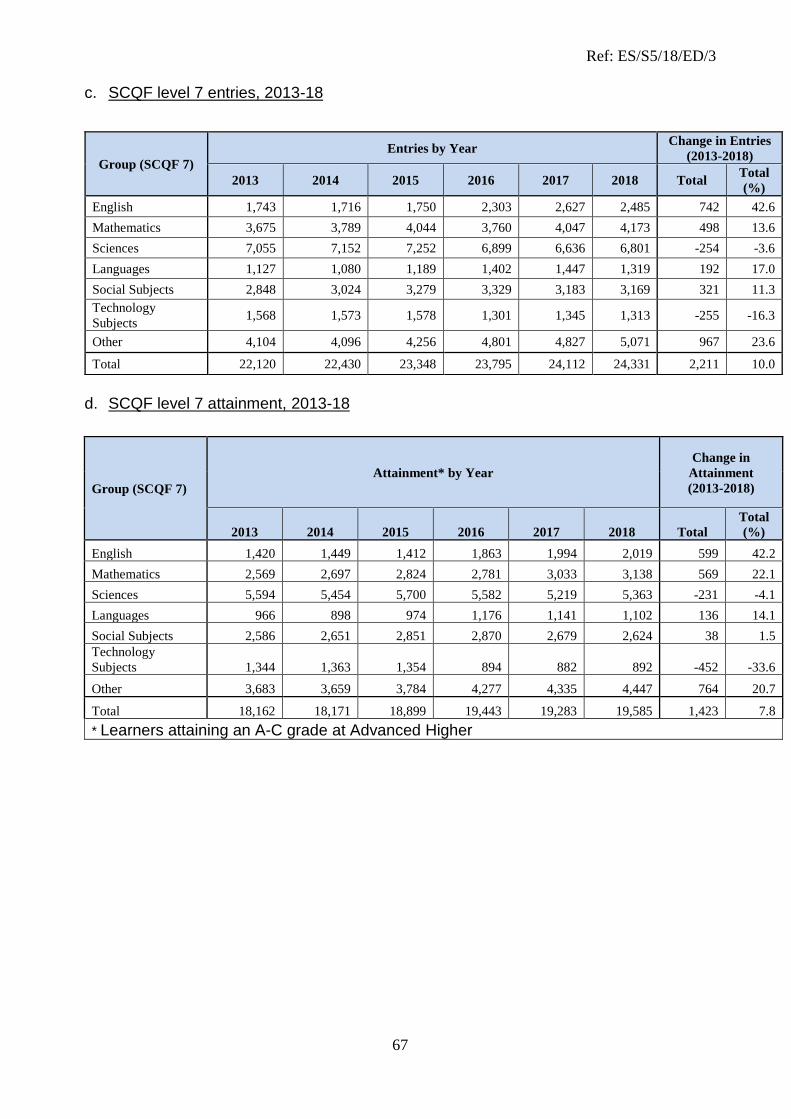
Ref: ES/S5/18/ED/3
67
c. SCQF level 7 entries, 2013-18
d. SCQF level 7 attainment, 2013-18
Group (SCQF 7)
Attainment* by Year
Change in
Attainment
(2013-2018)
2013 2014 2015 2016 2017 2018 Total
Total
(%)
English 1,420 1,449 1,412 1,863 1,994 2,019 599 42.2
Mathematics 2,569 2,697 2,824 2,781 3,033 3,138 569 22.1
Sciences 5,594 5,454 5,700 5,582 5,219 5,363 -231 -4.1
Languages 966 898 974 1,176 1,141 1,102 136 14.1
Social Subjects 2,586 2,651 2,851 2,870 2,679 2,624 38 1.5
Technology
Subjects 1,344 1,363 1,354 894 882 892 -452 -33.6
Other 3,683 3,659 3,784 4,277 4,335 4,447 764 20.7
Total 18,162 18,171 18,899 19,443 19,283 19,585 1,423 7.8
* Learners attaining an A-C grade at Advanced Higher
Group (SCQF 7)
Entries by Year Change in Entries
(2013-2018)
2013 2014 2015 2016 2017 2018 Total Total
(%)
English 1,743 1,716 1,750 2,303 2,627 2,485 742 42.6
Mathematics 3,675 3,789 4,044 3,760 4,047 4,173 498 13.6
Sciences 7,055 7,152 7,252 6,899 6,636 6,801 -254 -3.6
Languages 1,127 1,080 1,189 1,402 1,447 1,319 192 17.0
Social Subjects 2,848 3,024 3,279 3,329 3,183 3,169 321 11.3
Technology
Subjects 1,568 1,573 1,578 1,301 1,345 1,313 -255 -16.3
Other 4,104 4,096 4,256 4,801 4,827 5,071 967 23.6
Total 22,120 22,430 23,348 23,795 24,112 24,331 2,211 10.0
Ref: ES/S5/18/ED/3
68
Education and Skills Committee
BACKGROUND INFORMATION ABOUT SCOTTISH QUALIFICATIONS AUTHORITY
Introduction
The Scottish Qualifications Authority (SQA) is the national accreditation and awarding
body in Scotland. It is a Non-Departmental Public Body (NDPB) and the Education
(Scotland) Act 1996 sets out SQA’s functions and the governance arrangements to
oversee SQA’s distinct accreditation, regulatory and awarding responsibilities. SQA is
sponsored by the Scottish Government’s Learning Directorate.
SQA is supported mainly by the entry fees for its qualifications, supplemented by Scottish
Government grant funding. SQA is not a commercial enterprise aimed principally at
generating profit, though our work plays an important role in many sectors of the Scottish
economy, and we are always conscious of our duty to operate efficiently to optimise the
use of our resources. We also work on contract and international projects that support
the Scottish Government’s international agenda and generates additional income.
SQA plays a crucial role in ensuring that the skills, training, and education systems in
Scotland are effective, and we are acutely aware of our responsibility to uphold both the
accessibility and the credibility of Scotland’s qualifications system. The school curriculum,
presentation patterns and the availability of qualifications in schools are a matter for other
national and local organisations.
We are proud to be at the heart of the education and skills system in Scotland, and are
committed to work with partners to help people and businesses to realise their potential
and achieve their ambitions.
This work underpins key public policy areas, such as widening participation, narrowing
the attainment gap, and providing the people and businesses of Scotland with the skills
that they need for the future.
SQA Awarding
There are SQA qualifications for everyone:
• students in schools and colleges
• trainees and apprentices
• people who already have qualifications, and those who don’t
• people who are in employment, and those who aren’t
• those seeking academic or vocational qualifications
More than ever, qualifications are an essential part of learners’ successful journey from education and training into further study and employment, as well as success in life, benefitting the whole of Scottish society.

Ref: ES/S5/18/ED/3
69
SQA also plays an important role in supporting Foundation Apprenticeships and the wider Developing the Young Workforce policy, and our qualifications form part of the majority of Scotland’s Modern Apprenticeships. A more detailed overview of SQA’s range of qualifications can be found in our Guide to Scottish Qualifications. SQA very much values its partnerships with a broad spectrum of schools, colleges, training providers, and employers, as well as professional and national bodies. To maintain the quality, flexibility, and relevance of our qualifications, we are welcoming and responsive to feedback from all these sectors, and we research the impact and effectiveness of our qualifications. We also welcome initiatives from businesses, professional bodies, and economic sectors which wish to establish new qualifications to support their activities; for example, to certificate and extend the existing skills of their workforce and sector. SQA is committed to ensuring the highest level of customer service as demonstrated by our Customer Charter, and expanding the ways we use digital technologies to engage with people and enhance our products and services. SQA Accreditation
In its accreditation role, SQA accredits vocational qualifications that are offered across Scotland, including Scottish Vocational Qualifications, and approves awarding bodies that wish to award them.
The accreditation function is a discrete and autonomous part of SQA, and is accountable to the Accreditation Committee and then to Scottish Government. The Accreditation Committee is a statutory committee having been established by the Education (Scotland) 1996 Act. SQA Accreditation is funded separately by the Advanced Learning and Science Directorate of the Scottish Government.
Related Documents