EDUCATED GUESS Interpreting traffic forecasting during the pandemic canso.org

Welcome message from author
This document is posted to help you gain knowledge. Please leave a comment to let me know what you think about it! Share it to your friends and learn new things together.
Transcript
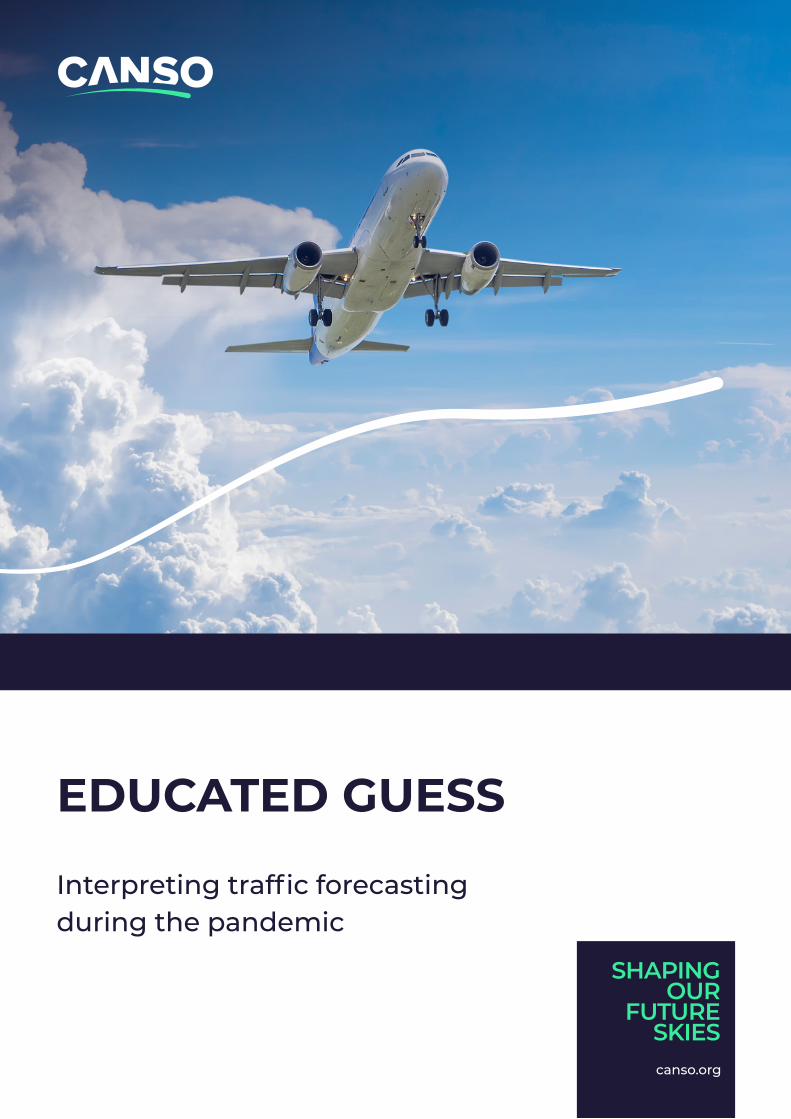
EDUCATED GUESS
Interpreting traffic forecasting during the pandemic
cansoorg
2
Educated Guess Interpreting traffic forecasting during the pandemic
Contents Synopsis 3
Acknowledgements 3
Introduction 4
Part A Traditional forecasts 5
Roles of forecasting 5
Available forecasts 6
Part B Forecasting during COVID-19 8
Who has been forecasting what when 8
How good were the forecasts 14
How can ANSPs use the available forecasts 15
How can ANSPs produce local forecasts during COVID-19 15
Part C Forecasting post-COVID-19 17
When will traditional models be valid 17
How much traffic has been lost 17
How will traditional models need to be recalibrated 18
Conclusions 19
Annex 1 Forecasting methodologies 20
Quantitative forecasting 20
Data availability 20
Forecasting errors 21
Qualitative forecasting 22
Delphi technique 22
Decision analysis 22
Probabilistic analysis 22
Air traffic distribution models 22
Medium-term forecast analysis components 23
Air traffic forecasting parameters 24
Annex 2 Analysis of 2020 forecasts 24
Forecasts analysis limitations 27
References 28
3
Educated Guess Interpreting traffic forecasting during the pandemic
SynopsisAs the saying by George EP Box goes ldquoall models are wrong but some are usefulrdquo The severe impact of COVID-19 on aviation has led to a situation where traditional traffic forecasts are no longer valid
In order to provide Air Navigation Service Providers (ANSPs) with a sense of what products are currently available how they might be used by ANSPs and when longer term forecasts may be available this paper provides a high-level overview of the current state of traffic forecasting
Part A Traditional forecasts Considers the range of products normally available to support short- medium- and long-term planning
Part B Forecasting during COVID-19 Provides an analysis of the products currently being made publicly available and how they can be used by ANSPs
Part C Forecasting post COVID-19 Looks at when ANSPs may be able to rely on a range of forecasting products once again and how forecasting techniques might need to evolve
It is clear that a lack of medium-term forecasts is a significant hindrance to the financial and capacity planning required to enable ANSPs to successfully navigate the current crisis It may be some time after the pandemic before medium term forecasting is reliable again
AcknowledgementsThis publication was produced by the Ad Hoc Group on Traffic Forecasting part of the CANSO Strategy and Integration Standing Committee
CANSO would especially like to thank THINK Research Ltd for its significant contribution to this paper
copy Copyright CANSO February 2021
All rights reserved No part of this publication may be reproduced or transmitted in any form without the prior permission of CANSO This paper is for information purposes only While every effort has been made to ensure the quality and accuracy of information in this publication it is made available without any warranty of any kind
4
Educated Guess Interpreting traffic forecasting during the pandemic
IntroductionUnderstanding demand is critical to the cost-efficient delivery of capacity ANSPs need accurate information on demand to plan staffing capacity enhancements and revenues They need information for the current day (sectorisation) for the next weeks (staff rostering) and months (staff levels) and years (calculation of revenues need for additional capacity) This information is drawn from filed flight plans airline schedules as well as short (1 year) medium (3 to 7 years) and long term (10+ years) traffic forecasts
The COVID-19 crisis has led to an unprecedented fall in demand The impact of COVID-19 is different to other crises that have affected aviation
bull Previous natural disasters such as the Eyjafjallajoumlkull volcano crisis of 2010 have caused severe short term largely regional reductions with quick rebounds Extant traffic forecasts remained valid after the event
bull Economic crises have caused moderate falls in traffic with a slow return to previous traffic levels For example following the 2008 financial crisis it took 10 years for traffic to recover Whilst forecast models required recalibration the forecasting methodologies remained largely valid and sufficiently accurate forecasts were always available
bull Terrorist attacks or war have sometimes resulted in severe drops in traffic for periods of time within specific regions with return of traffic once traffic restrictions were lifted and passenger confidence regarding safety returned
bull Previous pandemics have had severe but short impacts on traffic The SARS outbreak in 2003 was the most serious in terms of impact on traffic volumes prior to COVID-19 At the height of the outbreak (May 2003) monthly Revenue Passenger Kilometres (RPKs) flown by Asia-Pacific airlines were 35 lower than their pre-crisis levels Overall in 2003 the loss of confidence and fears of global spread impacted both business and leisure travel to from and within the region resulting in Asia-Pacific airlines losing 8 of annual RPKs and $6 billion of revenues
COVID-19 is different The impact of COVID-19 is more severe ndash both in the level and duration of the disruption It is a truly global and sustained event whose travel and economic impact will be felt for years Furthermore the pandemic has driven changes to consumer behaviour and business practices that fit no previous models suggesting that the long-term impact of COVID on society in general and aviation in particular is not clear As a result the practice of forecasting has been upended and the traditional traffic forecasts available to ANSPs for planning are no longer valid
In order to provide ANSPs with a sense of what products are currently available and when longer term forecasts may be available this paper provides a high-level overview of the current state of traffic forecasting
Part A Traditional forecasts Considers the range of products normally available to support short- medium- and long-term planning
Part B Forecasting during COVID-19 Provides an analysis of the products currently being made publicly available and how they can be used by ANSPs
Part C Forecasting post COVID-19 Looks at when ANSPs may be able to rely on a range of forecasting products once again and how forecasting techniques might need to evolve
5
Educated Guess Interpreting traffic forecasting during the pandemic
Part A Traditional forecasts
Roles of forecastingStates air navigation service providers airports airlines aircraft manufacturers suppliers and other relevant aviation organisations all rely on air traffic forecasts to support accurate planning and resource allocation For example accurate traffic forecasts
bull Assist states in facilitating the orderly development of Civil aviation
bull Assist in the process of planning for necessary airspace and airport infrastructure and staffing (air traffic control airport terminal facilities and operations access roads runways taxiways etc)
bull Assist airlines in the short medium and long-term planning of equipment crew and route structures
bull Assist aircraft manufacturers in understanding potential customer needs and planning for the introduction of new models
ANSPs in particular are dependent on accurate forecasts to support many critical decisions both on the day of operation and a decade into the future To support these decisions ANSPs relay on a variety of products ndash some developed in-house and others from public sources
Use Planning Horizon Data Sources
ATFM Solutions Planning eg sectorisation traffic orientation ATFM measures
1+ days Flights Plans
Operational capacity planning eg rostering 1+ weeks Schedules
Staff planning 3+ years Short Term Forecast
Financial planning 5+ years Medium Term Forecast
Capacity planning 10+ years Long term Forecast
Table 1 ndash ANSP planning dependencies
In Europe medium term forecasts have a particular importance as they are central part of the European Unionrsquos ldquoPerformance Scheme
1 httpswwwboeingcomcommercialmarketcommercial-market-outlook
6
Educated Guess Interpreting traffic forecasting during the pandemic
Available forecastsBased on the time horizon there are generally three types of forecasts1
Are used mostly in connection with strategic planning to determine the level and direction of capital expenditures and to decide on ways in which goals can be accomplished The trend element generally dominates long-term situations and must be considered in the determination of any longrun decisions It is also important that forecasts are calibrated and revised at periodic intervals
Long-term forecasts
Medium-term forecasts
Short-term forecastsAre generally prepared for planning scheduling budgeting and resource requirement purposes The trend factor as well as the cyclical component plays a key role in the medium term forecasts because the year-to-year variations in traffic growth are an important element in the planning process
Generally involves some form of scheduling which may include for example the seasons of the year for planning purposes However public holidays and specific events (ie Fifa World Cup) also play an important role that affects traffic volume and airspace capacity Such forecasts are prepared every six months or on a more frequent basis
Figure 1 ndash Types of forecasts
Each forecast is based on a specific forecasting method ndash which can be divided into three broad categories2
Quantitative Mathematical model heavily reliant on historical data and trends
Qualitative Judgmental reliant on the judgement of experts and may be used to predict a significant change in historical patterns
Decision analysis Combination of the first two methods
Table 2 ndash Forecasting methods
Depending on the scope and intended customer forecasters develop their own specific methodologies which combine traditional methods and techniques (details in Annex 1) with further intelligence gathered from relevant data sources These forecasting methodologies are constantly refined to improve accuracy
Forecasters decide on the methodology to be used based on required output Their consumers are interested in various information as they will use it for different reasons For example while airlines are mainly interested in the number of passengers airports look at number of ground movements too and ANSPs need to know the estimated number of flights they will have to control in order to ensure appropriate resource allocation
So each forecast provider uses a combination of methods and techniques depending on the scope period and data sources available to build their own specific and vigorous methodology To further improve accuracy all forecasts are based on a set of key assumptions which need to accompany the relevant forecast presentation
Several forecasts are developed on a systemic basis and made available to the aviation community either for free or by subscription Table 3 provides a summary of the key products In addition industry forecasts published by Boeing and Airbus provide insight in to the evolution of the commercial aircraft fleet
2 httpswwwairbuscomaircraftmarketglobal-market-forecasthtml
Educated Guess Interpreting traffic forecasting during the pandemic
7
Forecaster Forecast Type Period Updated Last Published Metric Scope Availability
ICAO
Mid-term 5 years Yearly December 2020bull PKP bull FTK
Global Regional States
Public [3]
Long-term 20 yearsBiennially or Triennially
April 2018bull RPK bull Growth
Global Regional States
Public [4]
IATA Long-term 20 years Biennially April 2020 bull Passenger numbersGlobal Regional States
Subscription
ACI Long-term gt20 years Yearly 2019bull Passenger numbers bull Aircraft movements
Global Regional States
Subscription
EUROCONTROL
Short-term 2 years Monthly Livebull Flight Movements bull Service Units bull Growth
EU FAB States Public [5]
Mid-term 7 years Twice Yearly October 2019bull Flights bull Service Units
EU FAB States Public [6]
Long-term 20 years 3 to 5 years September 2018bull Flights bull Service Units
EU FAB States Public [7]
FAA
Long-term 20 years Yearly July 2020bull Flights bull ASM RPM bull Passenger Enplanements
Regional States Public [8]
Terminal Area Forecast
5 years Yearly 2019bull Passenger Enplanements bull Total Operations
Regional States Public [9]
Table 3 ndash Traditional Forecasts
Note Depending on the provider the forecasted aircraft movementsRPK may not include overflights which may affect their utility for ANSPs who manage upper airspace ANSPs may use trend and growth from these
sources as guidelines and comparison to crosscheck if their own forecast is in line with the globalregional picture
8
Educated Guess Interpreting traffic forecasting during the pandemic
Part B Forecasting during COVID-19
Who has been forecasting what whenIn March 2020 it quickly became clear that existing traffic forecasts were no longer valid Traditional forecasters stopped providing regular updates and started to publish ldquorecovery scenariosrdquo This section looks at the available products and how well they are performing given the challenges in the current environment
Figure 2 illustrates the timeline of published forecasting information in 2020 showing that IATA led the way with their initial COVID-19 Impact assessment[9] quickly followed by the International Civil Aviation Organization (ICAO)[10] Meanwhile EUROCONTROL had a more conservative approach and only published their short-term traffic outlook one month later than the global forecast providers[11] It is also worth noting that both the FAA and EUROCONTROL present weekly figures on actual traffic3 which support an understanding of short-term trends
Figure 2 ndash Forecasting information timeline in beginning of the pandemic
The change in the frequency of updates highlights the high-level uncertainty within the forecasts [14 15 16 17 18 and 19] The key products are summarised on the following pages
3 For example httpswwweurocontrolintcovid19
9
Educated Guess Interpreting traffic forecasting during the pandemic
ICAO
httpswwwicaointsustainabilityDocumentsCovid-19ICAO_coronavirus_Econ_Impactpdf
Latest Publication 30 December 2020 Scope Global 2020 ndash June 2021
PublicationEffects of Novel Coronavirus (COVID-19) on Civil Aviation Economic Impact Analysis [20]
Value PSK
Scenarios
As overall severity and duration of the COVID-19 pandemic are still uncertain four (4) different recovery paths under two (2) indicative scenarios are developed
bull Baseline counterfactual scenario in which the COVID-19 pandemic does not occur that is originally planned or business as usual
bull Scenario 1 two (2) different paths (like Nike swoosh ndash and W-shaped)
bull Scenario 2 two (2) different paths (like U- and L-shaped)
bull Reference information only based on latest airline schedules (like V-shaped)
Underlying Assumptions
bull International and domestic passenger traffic has separate scenariospaths
bull Scenariospaths are differentiated in terms of supply and demand ie
ndash Scale of output or seat capacity change
ndash Degree of consumer confidence that can be translated into demand or load factor as a proxy
bull Supply and demand are influenced by
ndash Different timing and speed of recovery by region internationaldomestic and intra-inter-region
ndash Global economic contraction
bull No consideration is made to social distancing requirements on aircraft etc
10
Educated Guess Interpreting traffic forecasting during the pandemic
IATA
httpswwwiataorgeniata-repositorypublicationseconomic-reportsjune-data-and-revised-air-travel-outlook
Latest Publication 28th July 2020 Scope Global 2010-2025
Publication COVID-19 June data and revised air travel outlook [21]
Value RPK
Scenarios
The outlook for global GDP could take different paths and therefore IATA is exploring optimistic and pessimistic scenarios for the economy as below
Underlying Assumptions
bull Pandemic will gradually be contained and there will not be a second wave of COVID cases
bull Cautious behaviour of travellers will continue to affect travel demand at the start of 2021 and the recovery in business travel will come with a lag
bull The impact of COVID-19 on the global economy will be severe Global GDP growth is expected to contract by 50 in 2020
bull COVID-19 will have a significant impact on international trade (13 decline) which has been suffering from the US-China trade war
bull 2020 will be the worst year in history for airlines (net loss of $843bn) and losses will continue in 2021 albeit to a lesser extent
bull Airlines in all regions are expected to record negative operating income in 2020
bull Revenues are expected to fall by more than demand as airlines are significantly discounting ticket prices to help stimulate travel
11
Educated Guess Interpreting traffic forecasting during the pandemic
EUROCONTROL
httpswwweurocontrolintforecasting
Latest Publication November 2020 Scope Regional (EU) 2020 ndash 2024
Publication EUROCONTROL Five-Year Forecast 2020-2024 [27]
Value Number of flights ()
Scenarios
The 5 year forecast references 3 separate scenarios considering all possible risks and their relative impacts as follows
bull Scenario 1 ndash Vaccine Summer 2021 Vaccine widely made available for travellers (or end of pandemic) by Summer 2021 with traffic only returning to 2019 levels by 2024
bull Scenario 2 ndash Vaccine Summer 2022 Vaccine widely made available for travellers (or end of pandemic) by Summer 2022 with traffic only returning to 2019 levels by 2026
bull Scenario 3 ndash Vaccine not effective Lingering infection and low passenger confidence with traffic only returning to 2019 levels by 2029
Underlying Assumptions
bull Recovery is strongly dependent on how soon an effective vaccine is made widely available and by levels of public confidence
bull Uses 23 October 2020 Oxford Economics Economic Forecast Cumulative Change in GDP growth
bull Continued transport connectivity will be ensured post Brexit
12
Educated Guess Interpreting traffic forecasting during the pandemic
ACI
httpsaciaerowp-contentuploads202012Advisory_Bulletin_The_impact_of_COVID_19_on_the_airport_businesspdf
Latest Publication 8 December 2020 Scope Global 2020
Publication ACI Advisory Bulletin [23] Value Number of passengers
Scenarios
bull ACI World estimated the impact of the coronavirus outbreak 2019 (COVID-19) on the airport industry in terms of potential losses in traffic and revenues based primarily on two key data elements estimated traffic considering the latest COVID-19 statistics and unit revenues derived from the Airport Key Performance Indicators 2020 as total airport revenues are largely a function of traffic while unit revenues have remained stable in recent years
bull Traffic estimates for Q1 2020 were generated using data collected by ACI World from airports for that period
bull The impact has been measured as a difference between the ldquobusiness as usual scenariordquo (BAU) for Q1 2020 as well as year-end 2020 and the ldquoCOVID-19 scenariordquo with estimated traffic and revenues for Q1 2020 and year-end 2020 on a regional basis
bull The Q1 2020 traffic estimates and hence the revenue figures consider the seasonality patterns for the year 2019 calculated on a regional basis
bull The business-as-usual (BAU) forecast for 2020 represents the comparative baseline and is derived from the adjusted World Airport Traffic Forecasts (WATF) 2019ndash2040 considering latest insights provided by ACI Regional offices and other inputs The BAU baseline represents a 3 growth in passenger traffic
bull The impact of COVID-19 on passenger traffic for year-end 2020 was estimated under the assumption that most containment measures and flight restrictions will be lifted by the end of summer 2020 This implies a difficult second quarter for the aviation industry with a partial recovery in Q3 and Q4 However the impact on passenger traffic is assumed to be long lasting implying a slow and steady recovery possibly spanning far beyond the end of 2020
13
Educated Guess Interpreting traffic forecasting during the pandemic
Underlying Assumptions
Note ACI included a forecast out to 2040 predicting that global traffic may take up to two decades to return to previously projected levels and cautioning that a structural change (in which traffic will never return to pre-COVID-19 forecasted level) is still a possibility
14
Educated Guess Interpreting traffic forecasting during the pandemic
How good were the forecastsThe different forecasts use different parameters and underlying assumptions but tend to have similar looking predictions ndash suggesting a common bias based around airline expectations To compare the products a numerical comparison was undertaken The full results methodology and references can be found in Annex 2 Analysis of 2020 Forecasts
COVID-19 has disrupted many data sources that feed traffic forecasts ndash including industry schedules airline operations airline fleets aircraft seat capacity and industry traffic and fares This means that many of the assumptions used to create forecasts no longer hold
This is best illustrated by considering observed changes in airline behaviour during the pandemic
Pre-COVID-19
bull Airlines published their schedules 6-11 months in advance
bull Schedule changes inside 4 months of departure were minor
bull Once crew assignments were in place only day-of-departure operational issues would cause a flight cancellation
bull Airlines flew 98+ of their published schedule
Post-COVID-19
bull Airlines are waiting 4-8 weeks prior to departure
bull Changes are happening 1 to 2 weeks before departure some cases days out
bull Cancellations are now happening 1 to 2 days out for non-operational reasons
Table 4 Changes in airline behaviour during pandemic4
But the real issue affecting the accuracy of forecasts is the progress of the pandemic itself and States responses to growing numbers of cases and the emergency of new variants Aviation forecasts are able to track positive plans of airlines to grow demand but canrsquot predict when local flare ups in COVID-19 create tighter restrictions
4 Source Adapted from httpswwwciriumcomthoughtcloudaviation-data-quality-pandemic-forecasting
15
Educated Guess Interpreting traffic forecasting during the pandemic
How can ANSPs use the available forecasts Given the difficulty in developing accurate forecasts in the current climate ANSPs should consult these products with caution carefully assess underlying assumptions and use them as a trend guideline rather than a reliable data source To minimise the potential eronous or misleading information ANSPs should aim to identify more direct local data to support decision-making
Sensible caveats for use of the current forecast products incude
bull Current forecasts should serve as a cross-check and ANSPs should try to focus on the specific sections that may apply to them
bull Identify which of the curves (eg W U L etc) might apply to each ANSP based on alternative available information (local passenger surveys state masures COVID-19 rates etc)
bull Due to the rapid rate of change of external factors through 2020 ANSPs should recheck the available forecasts on a weekly basis to make sure no major
changes are introduced and ensure continuous alignment between different data streams
bull Planning ahead process should be adapted to account for spontaneous changes and forecasts should be trusted for short-term outlooks rather than drive medium-term strategic decisions
bull ANSPs should note that some of the metrics provided may not be available in terms of traffic movements and may not account for overflights
How can ANSPs produce local forecasts during COVID-19There are many factors out of industryrsquos control and making it necessary to identify new techniques and strategies to understand the limits and sensitivity of forecasts including the following techniques
bull ANSPs should think about providing separate forecasts for domestic and international flights (andor overflights) which may be effected by travel restrictions and national passenger behaviour
bull For international flights segregating city-pair traffic (routes or major flows) will allow ANSPs to forecast according to travel restrictions
bull ANSPs should liaise with key stakeholders that are leading the state vaccine deployment strategy in order to understand how to treat scenarios and refine them based on availability of vaccines This should then be factored into determining how much of the traffic would increasedecrease due to each scenario
bull Flight schedules (seasonal slot allocation and other sources such as OAG amp Innovata) can still be used for forecasting but realiability drops significantly To mitigate the variation due to last minute cancellations and change in flight scedules a regional intelligence driven approach should be considered For example EUROCONTROL managed to provide more reliable traffic forecasts than most regional forecaters by coordinating well with airlines directly and not relying on the traditional sources
Alternatively ANSPs may develop alternative approaches to forecasting during the pandemic A promising approach developed by METRON is described in the table below
16
Educated Guess Interpreting traffic forecasting during the pandemic
METRON Approach to forecasting impact of COVID-19
The METRON approach was developed to support regional State level forecasts based on examination of historical traffic and travel constraints imposed by States METRON has published regular updates for CANSO meetings and works with specific ANSPs
The main assumptions are
bull Use of a V-shaped recovery ndash specifically traffic demand will resume if and when State authorities allow it
bull Provision of upper and lower envelopes around itsforecast (best-case and worst-case scenarios)
bull Forecast the rate at which traffic will rebound and where it would be coming from but without placing time values on exactly when the rebound occurs except that
ndash Countriesterritories with more rapid COVID recovery will acceptsend traffic sooner which determines the ordering on the horizontal axis (see graph below)
bull Forecast suggests a steady traffic growth rather than a surge as countriesterritories resume traffic
bull Timing of how long this will take is difficult to determine and METRON continues to refine its approach
Rationale
bull Global forecasts may not reflect upcoming trends for a given ANSP ndash hence a need to decompose traffic forecasts and recent trends by specific country or region
bull In the long run traffic demand composition (ie contribution from other countries or regions) will be inclined to restore itself to pre-COVID conditions though it is a question of timing ndash which ones will restore first and by how much
bull Traffic demand is largely driven by the following factors
ndash Rate at which airlines can resume operations which is often faster and more ambitious than what States will allow
ndash OAG largely reflects airline intentions but must be tempered with recent airline tendencies to overunder schedule then adjust
ndash Number of new COVID cases in each country or region In turn this will dictate the rate at which each State authority will allow travel tofrom other countries or regions
17
Educated Guess Interpreting traffic forecasting during the pandemic
Part C Forecasting post-COVID-19The ongoing second wave in COVID-19 cases the emergence of new strains and subsequent reestablishment of flight restrictions highlights the lack of stability with the current forecasts It is clear that accurate medium-term forecasts will not be available in the short-term
So the critical question remains when will the industry enjoy the wealth of products previously available The answer has three elements
bull When will traditional models be valid
bull How much traffic will have been lost
bull How will traditional models need to be recalibrated
When will traditional models be validIt is clear that demand remains severely curtailed by the coronavirus and in particular travel restrictions imposed by states ldquoBusiness as usualrdquo is dependent on
Factor Risk Potential Impact
Availability and Effectiveness of Vaccine
The approval and availability of vaccines will dictate the pace of aviation recovery With vaccine deployment underway there is renewed hope that normal life will return in SpringSummer 2021 although there is some uncertainty about the effectiveness of vaccines against new variants
High
State Travel Restrictions
As vaccination rates climb States will lift travel restrictions as the local population gets covered If the vaccine is available only in a limited number of countries there is a possibility that quarantine or travel restrictions may remain for an extended period
Medium
COVID-19 Constraints limiting Airport Capacity
The aviation infrastructure is not designed for operating with social distancing ndash new capacity constraints (eg queueing capacity at airports) may become apparent as traffic returns to more normal level
Low
Table 5 ndash Novel factors
At the time of writing vaccine deployment is underway and spooling up in some countries Widespread innoculation however remains unlikely before 3rd quarter 2021 suggesting that traditional forecasting models will not be valid before 2022
How much traffic has been lostThe following table summarises the current predictions for traffic level at the end of 2020 compared to 2019 IATA has suggested that 2019 traffic may return between 2024 and 2029 depending on the success of vaccination programmes across the world
18
Educated Guess Interpreting traffic forecasting during the pandemic
Forecaster Full year 2020 Potential Impact
IATA (RPK) [20] -66 2024
ICAO (number of passengers) [21] -59 NA
ACI (number of passengers) [22] -642 2023
EUROCONTROL (Number of Flights) [28] -55 2024 2026 2029
Table 6 ndash Recovery forecasts
How will traditional models need to be recalibratedWe could assume that traditional forecasting models will be used to forecast traffic from 2022 onwards based on unconstrained use of the infrastructure (albeit with more permanent losses of capacity if airports are forced into bankruptcy and airlines are forced to reduce the number of pilots crews and aircraft to keep their companies afloat) But these forecasts will need a new set of assumptions to take account of the longer-term impacts of COVID-19 ndash ranging from the loss of GDP (a key factor in most forecast models) to growing awareness of environmental issues and change to public perception of travel ndash will we continue to use Zoom for our business meetings
This range of new assumptions required is going to lead to higher uncertainty in the forecasts ndash which of course leads to the issue of deciding how to cope with high and low scenarios
Factor Risk Potential Impact
Environmental Pressure
Linked to passenger behaviour environmental consciousness and flight shaming can be factors driving global lifestyle change This was mostly dormant before COVID-19 but has potentially been accelerated by the pandemic and environmental report showing the benefits of lockdown highlighting human impact on the environment Furthermore planes flying half empty may become unacceptable due to environmental impact
Medium
Economic ImpactGDP projections traditionally play an important role in medium to long term air traffic forecasting However the weight of the economic impact might be reduced for a significant period due to remaining concerns of public health safety
Medium
Business TravelThe need for business travel has been extremely reduced during the pandemic and there is high uncertainty associated to the extent this will be restored in the upcoming years
Medium
Public Confidence
Public confidence in traveling by air has been significantly impacted Surveys show that passengers consciousness regarding their intention to return to their usual travel plans has been continuously shifting As an example IATA found that a sizeable portion of the surveyed population would wait up to half a year or even a year to return to flying again But looking at Asia and their experience with domestic traffic recovery one may argue confidence in flying may not be a decisive factor and would rather be a cumulus of previously discussed factors that will consequently further affect traffic recovery
Low
But risk mitigations can drive opportunities Can the aviation industry accelerate the wide implementation of environmental measures and the advent of environmentally friendly technologies such as efficient aircraft or cleaner fuel Would the traffic downturn during COVID-19 help enable the implementation of some new concepts and technologies For example many ANSPs are using this low-traffic period to trial direct routing Free Route Airspace and CCOCDO which can all contribute to flying being more efficient and environmentally friendly
If there is enough advancement in sustainability by the aviation industry itself it could improve the publicrsquos perception and balance against the ldquoflight-shamingrdquo movement
19
Educated Guess Interpreting traffic forecasting during the pandemic
ConclusionsTraffic Forecasting is a significant undertaking It is performed globally regionally and nationally Traffic Forecasters use a range of techniques to provide the aviation community with a wealth of different products that really do drive critical decision-making in the industry They are so important that even in relatively stable times forecasting errors can cause significant disruption
ANSPs are currently relying on limited short-term forecasts or scenario products with no real view of the medium term At the same time decisions are required on how to effectively reduce costs without limiting medium term capacity or damaging long term reform
It is critical that medium term forecasts are available to prevent short-termism creating long-term structural issues
The forecasting models will necessarily evolve over time and will be self-correcting ndash as we move through pandemic recovery we will learn which modelling assumptions are valid and which are not Two other novel elements of forecasting that would need to be included are (1) forecasts of how COVID-19 will move through society as this will in turn dictate travel restrictions (or relaxation of) from State authorities and (2) addition of some more economic modelling based on past recovery trends for airline industry and overall economic recoveries
20
Educated Guess Interpreting traffic forecasting during the pandemic
Annex 1 Forecasting methodologies Depending on the scope and intended customer forecasters use methodologies which combine traditional methods and techniques (details below) with further intelligence gathered from relevant data sources These forecasting methodologies tend to evolve and be refined to continuously improve accuracy [2]
Image 1 ndash Alternative forecasting techniques
Quantitative forecastingQuantitative forecasting methodologies rely on historical data and trends The challenge with this type of forecasting becomes easily apparent as the first two quarters of 2020 have been a break in such trends with little to no previous supporting data The SARS event in 2003 was initially thought to be an indicator of the type of curve civil aviation might follow on its recovery path but new levels of complexity must be considered due to the global and fast spread of the virus in a very different socio-economic context
Data availabilityA key initial step in the model-building process is the measurement of the variables chosen for inclusion in the model As mentioned previously it may become evident at this stage that certain variables can be rejected due to lack of available data For some variables the data may not be directly available in an appropriate form but can be derived from several sources or by careful estimation
Data for the dependent variables such as passenger traffic in terms of passengers or RPKs and freight traffic in terms of freight tonnes or Freight Tonnes per Kilometre (FTKs) are normally available from the airline airport or the State that needs the forecast They are also normally available in the ICAO statistical databases This data may be supplemented as required using International Air Transport Association (IATA) Airports Council International (ACI) or other sources such
21
Educated Guess Interpreting traffic forecasting during the pandemic
as airline flight schedule data from OAG Data for the independent or explanatory variables related to airline operating economics are also available from the ICAO databases supplemented as required using other sources as mentioned earlier Data for socio-economic variables and demographics may be available from the publications of the International Monetary Fund (IMF) and the United Nations national accounts and other economic services
Accurate measurement of the price of air travel is complicated by the various fares that are available A single measure of price may be calculated as an average of the various fares weighted by the number of passengers using each fare In general passenger yield ie passenger revenue per passenger-kilometre can be used as a measure of price Ideally the average weighted fare for a particular route group or region concerned is more appropriate however the average yield can be considered as a suitable substitute or proxy variable to reflect the price of air travel
A special problem with economic and financial data is whether to use current or constant money values to measure monetary quantities The normal practice is to work with constant money values by adjusting the time series of financial data for simultaneous changes in the purchasing power of the currency
Consider as an example a model of the demand for passenger travel on a network of routes which includes a measure of income (for example GDP) of the country or region and the passenger yield as explanatory variables The data for the variables in current values can be divided by consumer price indices for each of the years concerned to obtain a constant (or ldquorealrdquo) price series The advantage of this approach is that it removes the effect of fluctuations in the inflation rate
Development of an econometric model Source ICAO Forecasting Manual
Forecasting errors
Traditionally there are four potential quantitative forecast errors
a a specification error which results when the incorrect functional form is chosen or a key explanatory variable is left out of the model or if the model structure varies over time
b a conditional error which occurs when predictions of the inputs to the model are not accurate
c a random error which is due to sampling and randomness associated with the data and
d an exogenous error which is unrelated to any of the inputs or specifications but is due to an external event of a unique character such as a war or terrorist attack
By looking at these four categories when considering 2020 forecasts it can be agreed their accuracy is highly affected by exogenous errors due to unpredictable coronavirus pandemic
22
Educated Guess Interpreting traffic forecasting during the pandemic
Qualitative forecastingQuantitative forecasting techniques discussed so far assume that a number of historical observations are available and they represent some underlying pattern Qualitative forecasting methods are used when such data is sparse or not available These methods can also be used in an assessment of how new technological or other developments would affect the forecast The state-of-the-art in qualitative forecasting methods is not nearly as well-defined as in quantitative analysis These methods are largely intuitive They rely heavily on the judgement of experts and may be used to predict a significant change in historical patterns or due to lack of sufficient historical data for a quantitative analysis
Therefore as judgement plays an important part in qualitative analysis providing reliable forecasts based on expert opinions can be problematic during the most dramatic economic impact on civil aviation However qualitative forecasts can assist support in providing a set of possible scenarios rather than a clear exact forecast (ICAO Scenarios)
Delphi techniqueFor example Delphi technique is a special procedure for forecasting by consolidation of opinions on the future It has two steps A selected group of qualified people are first presented with a questionnaire in which they are requested to indicate a most probable course of development in the activity being forecast The initial returns are then consolidated and the composite response returned to all contributors giving them the opportunity to revise their original assessments in light of prevailing opinions among other experts The Delphi technique is a practical means of bringing together information from many experts and moving towards a consensus among them
Decision analysisPotentially the most suitable analysis methodology for the current context is decision analysis which is essentially a combination of both quantitative and qualitative analysis methods In decision analysis the analystrsquos judgement is used in preparing forecasts for a particular area of expertise in combination with some statistical or mathematical techniques including subjective inputs of probabilities Decision analysis is helpful in the assessment of uncertainty and in risk analysis Examples of forecasting methods within this category are market research and industry surveys Bayesian analysis probabilistic analysis and system dynamics
Probabilistic analysisThe notion of forecasting the value of some variable in the future is based on the fact that there is some uncertainty associated with that variable In cases where the amount of uncertainty is large it would be desirable to have a range of values associated with that variable and to assign probabilities to the outcome of a variable or the forecast itself
Air traffic distribution modelsAir traffic distribution models are normally used to forecast traffic demand between designated airport pairs city pairs andor country pairs The socio-economic factors demographics and other relevant factors including the economic characteristics of the cities themselves for the market concerned should be taken into consideration Also supply-side factors such as the level of service available between origin and destination can also come into play
Normally demand between the two cities is directly proportional to the population of the two cities concerned and inversely proportional to the square of the distance between them Population is used here as a measure of attractiveness of the cities and the distance as a measure of impedance (resistance) This is a very simplistic approach and the gravity model in its simplest form implies that if there is a two-fold increase in population this will result in a four-fold increase in demand
But given the current context demand distribution changes rapidly and passenger behaviour has not yet reached a clear direction Uncertainty and continuous geo-political decisions regarding country-to-country border rules and air travel
23
Educated Guess Interpreting traffic forecasting during the pandemic
corridors affect consumer behaviour towards flight bookings People no longer plan or book holidays months in advance as they are conscious of the unpredictable pandemic resolution but they might be prepared to purchase holiday flight tickets on a short-term basis The affordability of booking ad-hoc holidays however is another factor to be considered when projecting further demand calculations
Medium-term forecast analysis componentsTo provide further context of how such methods and techniques are combined to create accurate methodologies for each forecaster ICAO has published a mid-term forecast analysis overview based on EUROCONTROLrsquos approach in 2006
Overview of medium-term forecast analysis components EUROCONTROL Source ICAO Forecasting Manual
24
Educated Guess Interpreting traffic forecasting during the pandemic
Air traffic forecasting parametersConsumers of Air Traffic Forecasts are interested in various information as they will use it for different reasons For example while airlines are mainly interested in the number of passengers airports look at the number of ground movements too and ANSPs need to know the estimated number of flights they will have to control in order to ensure appropriate resource allocation Similarly Air Traffic Forecast Providers aim to produce and support different end users of their product feeding the relevant information to fulfil their primary end usersrsquo needs
Therefore when looking at multiple forecasts global or regional we see they are measured and presented using different measurement units such as Revenue Passenger Kilometre (RPK) Available Seat Kilometre (ASK) Freight Tonne-Kilometres (FTK) Number of Flights Aircraft Movements Number of Passengers
While these parameters are self-explanatory two of the most commonly used ones are ASK and RPK ASK refers to available capacity deployed by scheduled carriers on all its routes whereas RPK performed refers to number of seats for which the carrier has earned revenue in relation to the distance travelled ASK is normally the supply side parameter used to assess the capacity growth in the market whereas RPK is the demand side parameter used to assess the revenue generated by airlines from passenger traffic
Annex 2 Analysis of 2020 forecastsThe below analysis aims to compare the main global and regional forecasts or scenarios available during the COVID-19 pandemic in order to get a better understanding of the information available and its accuracy
The key assumptions are
bull For this accuracy assessment we compared IATA and ICAO forecasts against actual global data
bull Similarly for the regional assessment we plotted EUROCONTROLrsquos and ICAOrsquos public predictions for 2020 to highlight the variation We also compared their forecasts against relevant regional actual data
bull ACIrsquos quarterly projection was included and compared with the other regional data for Europe published by EUROCONTROL and ICAO
bull All percentages are given with respect to 2019 ndash it was found more relevant to compare to data we already have from 2019 than to compare it with the 2020
scenario this way we shall obtain a more accurate picture of the situation
bull Different metrics used in forecasts will give roughly the same numbers ndash as forecasts use RPK ndash passenger revenue number of kilometres or number of flights or number of seats
bull Number of seats is proportional to passenger revenue in case of seats capacity being a relative percentage to 2019 it gives a similar value to RPK (in absolute value the two metrics might not be directly proportional but the decrease in number of flights gives roughly the same decrease in RPK)
These assumptions helped us overlap the forecasts in order to find the most similar models and the path that was mentioned before This way we were also able to take a range of possibilities
In order to compare the main global and regional forecasts or scenario available during COVID-19 pandemic (as of August 2020) we plotted them together as summarised in the table below
25
Educated Guess Interpreting traffic forecasting during the pandemic
Figure 3 ndash Current global forecasts scenarios
As the different paths can be visualised in Figure 3 ndash Current Global Forecasts Scenarios one can observe the variation of the different recovery paths forecasted by the key providers Therefore to get an indication on accuracy and relevance of the different forecasts we compared all scenarios with actual published data from April May June and mid-July in order to obtain an understanding of accuracy to date
To do so we took the average absolute difference in percentage points (ie for IATA the differences were 24 18 1 4 7 9 and 11 respectively resulting in the average error being 52) Figure 4 below is showing global forecastscenarios and associate errors in a graphical representation
Figure 4 ndash Global forecasting error
Similarly we looked at EUROCONTROL and ICAO and their regional forecasts as per Figure 5
26
Educated Guess Interpreting traffic forecasting during the pandemic
Figure 5 ndash European forecasts
Looking at ACIrsquos quarterly European forecast we also plotted the previous scenarios in order to visualise the variation between their models and they are shown in Figure 6 below
Figure 6 ndash European quarterly forecast
Figure 7 below shows the Error variation between EUROCONTROLrsquos forecast and the actual air traffic data recorded for the April ndash August time period
Figure 7 ndash European forecasting error
27
Educated Guess Interpreting traffic forecasting during the pandemic
The graphs clearly show that ECTL error was very small compared to all other forecasts and a key factor that contributed to EUROCONTROLrsquos accuracy is that they have ldquomemorisedrdquo the data based on actual airline bookings Furthermore providing a forecast for a region with geo-political similarities and limited traffic behaviour is very different to predicting the air traffic evolution world-wide Thus EUROCONTROLrsquos average forecast accuracy error is only 08
ECTL IATA ICAO UL have the highest accuracy over the past four months ICAO UL and IATA offer the best range of possibilities however starting from August ICAO U and ICAO L will follow different paths that will give a smaller range and a better prediction on what will come IF AND ONLY IF the assumptions remain valid throughout the entire recovery period
Taking a range of possibilities is a safer more pragmatic approach because it reduces the sensitivity to unexpected changes Providers can reduce the range of forecasted scenarios as more actual data becomes available
While there might exist more complex methods of comparing accuracies we used this method to get a better understanding of the air traffic forecasting products during the COVID-19 pandemic aiming to support Forecast-data users get an informed overview of the projected short-term air traffic picture
Forecasts analysis limitationsDuring this analysis a set of limitations was identified as follows
bull Some scenarios are dependent on others IATA and ICAO predictions take into consideration ECTLrsquos scenario while ECTLrsquos scenario considers the views of IATA and ICAO =gt meaning that if one is wrong the error will be distributed and incorporated in the others leading to the introduction of a bigger error than expected
bull The data available to produce current forecastsscenarios is not extensive enough to provide an accurate prediction therefore depend to some extent on the experience of the analysts
bull Human behaviour is unpredictable and can significantly affect these predictions
bull There is no previous experience with a similar global pandemic to support robust assumptions the current COVID-19 outbreak has a much bigger global impact on all industries including aviation than the SARS in 2002
bull They are sensitive to unexpected changes ndash example a new wave of COVID-19 is not taken into consideration
28
Educated Guess Interpreting traffic forecasting during the pandemic
References[1] ACI Airport Traffic Forecasting Manual A practical guide addressing best practices (June 2011)[2] ICAO Manual on Air Traffic Forecasting (Third edition 2006)[3] Effects of Novel Coronavirus (COVID-19) on Civil Aviation Economic Impact Analysis (9th September 2020)[4] ICAO Long-Term Traffic Forecasts (April 2018)[5] COVID-19 impact on the European air traffic network (httpswwweurocontrolintcovid19)[6] EUROCONTROL Seven-Year Forecast Autumn 2019 Update Flight Movements and Service Units 2019-2025[7] EUROPEAN AVIATION IN 2040 ndash CHALLENGES OF GROWTH ndash Annex1 Flight Forecast to 2040[8] FAA Aerospace Forecast ndash Fiscal Years 2020 ndash 2040[9] COVID-19 Initial impact assessment of the novel Coronavirus (20th February 2020)[10] Effects of Novel Coronavirus (COVID-19) on Civil Aviation Economic Impact Analysis (26th March 2020)[11] EUROCONTROL-aviation-recovery-factsheet-27042020 ndash 27th April 2020[12] IATA ndash Outlook for air travel in the next 5 years (13th May 2020)[13] IATA COVID-19 Air travel turns up but outlook uncertain-1st of July edition[14] IATA Air Passenger Market Analysis (April 2020)[15] IATA ndash June data and revised air travel outlook[16] ICAO COVID 2020 07 06 Economic Impact[17] ICAO Effects of Novel Coronavirus (COVID-19) on Civil Aviation Economic Impact Analysis (6th July 2020)[18] ICAO monthly monitor-gt March 2019 to May 2020 httpswwwicaointsustainabilityPagesAir-Traffic-Monitor
aspx[19] IATA Economics ndash Economic Performance of the Airline Industry (9th June 2020)[20] IATA Annual Review 2020 [21] Effects of Novel Coronavirus (COVID-19) on Civil Aviation Economic Impact Analysis ndash 30 December 2020[22] COVID-19 Impact on European Air Traffic ndash EUROCONTROL Comprehensive Assessment[23] ACI Advisory Bulletin ndash Economic impact assessment of COVID-19 on the airport business[24] EUROCONTROL Forecasting Dashboard httpswwweurocontrolintforecasting[25] IATA Market Analysis (Jan 2020 gt May 2020)[26] Global Busines Travel Association ndash 2020 Coronavirus Poll (Monthly Reports ndash April to July 2020)[27] EUROCONTROL Five-Year Forecast 2020-2024 4 November 2020
httpswwweurocontrolintlibraryf5B05D=product3A801ampf5B15D=product3A801ampf5B25D=product3A801
[28] What COVID-19 did to European Aviation in 2020 and Outlook 2021 1st January 2021 httpswwweurocontrolintsitesdefaultfiles2021-01eurocontrol-think-paper-8-impact-of-covid-19-on-european-aviation-in-2020-and-outlook-2021pdf
cansoorg
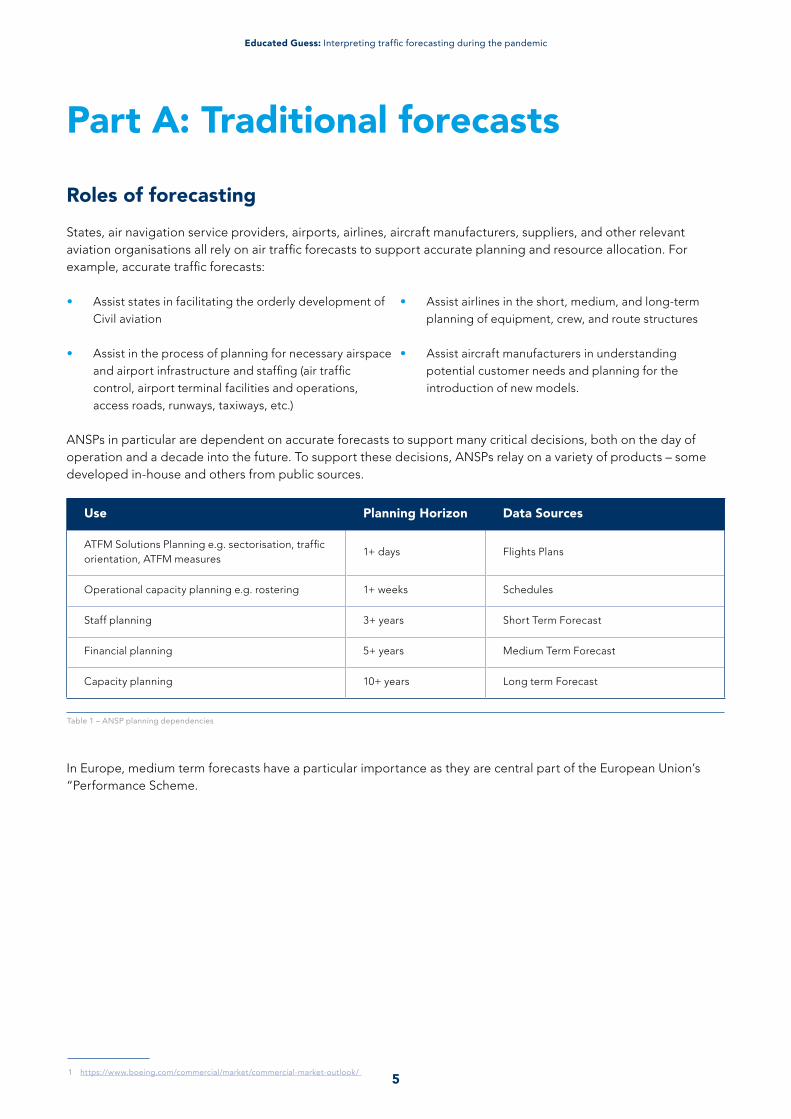
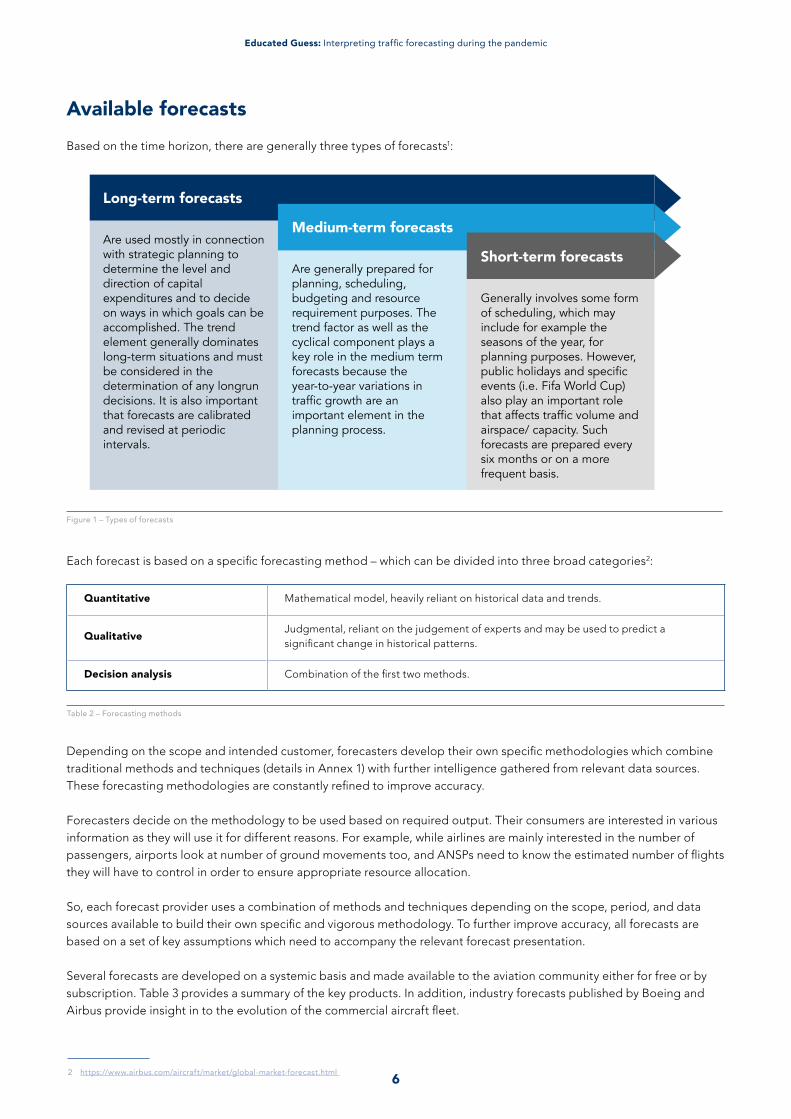
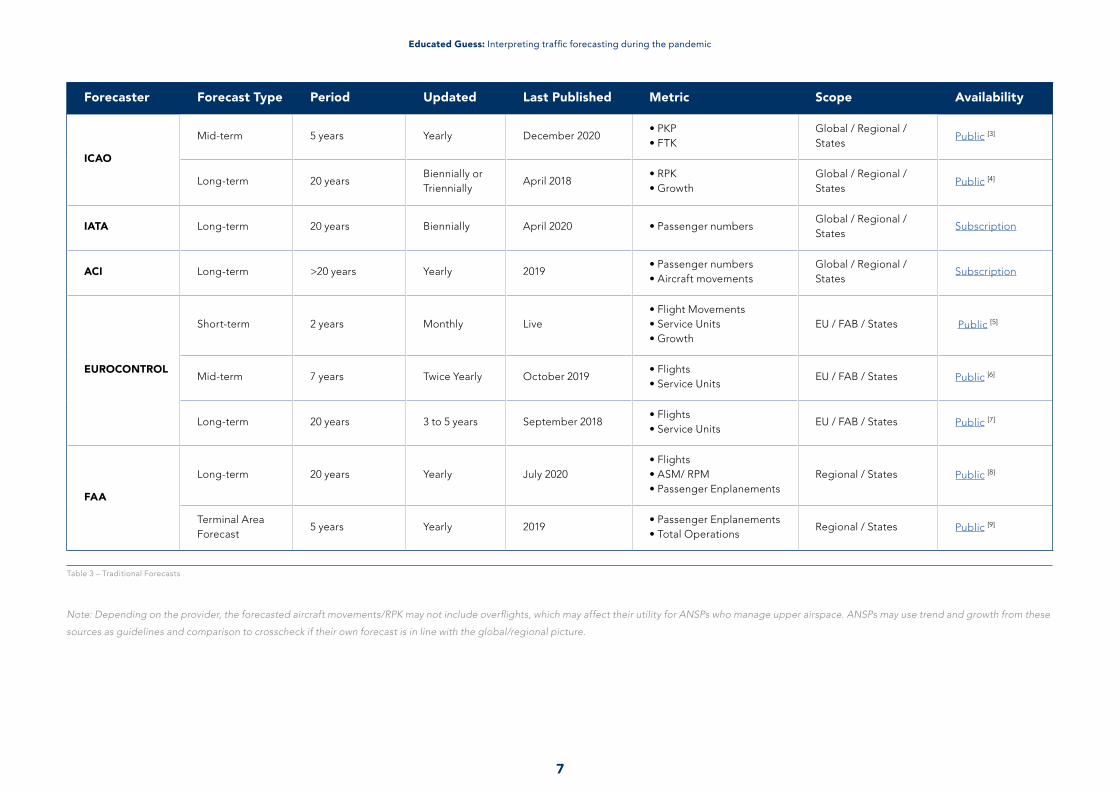
Educated Guess Interpreting traffic forecasting during the pandemic
7
Forecaster Forecast Type Period Updated Last Published Metric Scope Availability
ICAO
Mid-term 5 years Yearly December 2020bull PKP bull FTK
Global Regional States
Public [3]
Long-term 20 yearsBiennially or Triennially
April 2018bull RPK bull Growth
Global Regional States
Public [4]
IATA Long-term 20 years Biennially April 2020 bull Passenger numbersGlobal Regional States
Subscription
ACI Long-term gt20 years Yearly 2019bull Passenger numbers bull Aircraft movements
Global Regional States
Subscription
EUROCONTROL
Short-term 2 years Monthly Livebull Flight Movements bull Service Units bull Growth
EU FAB States Public [5]
Mid-term 7 years Twice Yearly October 2019bull Flights bull Service Units
EU FAB States Public [6]
Long-term 20 years 3 to 5 years September 2018bull Flights bull Service Units
EU FAB States Public [7]
FAA
Long-term 20 years Yearly July 2020bull Flights bull ASM RPM bull Passenger Enplanements
Regional States Public [8]
Terminal Area Forecast
5 years Yearly 2019bull Passenger Enplanements bull Total Operations
Regional States Public [9]
Table 3 ndash Traditional Forecasts
Note Depending on the provider the forecasted aircraft movementsRPK may not include overflights which may affect their utility for ANSPs who manage upper airspace ANSPs may use trend and growth from these
sources as guidelines and comparison to crosscheck if their own forecast is in line with the globalregional picture
8
Educated Guess Interpreting traffic forecasting during the pandemic
Part B Forecasting during COVID-19
Who has been forecasting what whenIn March 2020 it quickly became clear that existing traffic forecasts were no longer valid Traditional forecasters stopped providing regular updates and started to publish ldquorecovery scenariosrdquo This section looks at the available products and how well they are performing given the challenges in the current environment
Figure 2 illustrates the timeline of published forecasting information in 2020 showing that IATA led the way with their initial COVID-19 Impact assessment[9] quickly followed by the International Civil Aviation Organization (ICAO)[10] Meanwhile EUROCONTROL had a more conservative approach and only published their short-term traffic outlook one month later than the global forecast providers[11] It is also worth noting that both the FAA and EUROCONTROL present weekly figures on actual traffic3 which support an understanding of short-term trends
Figure 2 ndash Forecasting information timeline in beginning of the pandemic
The change in the frequency of updates highlights the high-level uncertainty within the forecasts [14 15 16 17 18 and 19] The key products are summarised on the following pages
3 For example httpswwweurocontrolintcovid19
9
Educated Guess Interpreting traffic forecasting during the pandemic
ICAO
httpswwwicaointsustainabilityDocumentsCovid-19ICAO_coronavirus_Econ_Impactpdf
Latest Publication 30 December 2020 Scope Global 2020 ndash June 2021
PublicationEffects of Novel Coronavirus (COVID-19) on Civil Aviation Economic Impact Analysis [20]
Value PSK
Scenarios
As overall severity and duration of the COVID-19 pandemic are still uncertain four (4) different recovery paths under two (2) indicative scenarios are developed
bull Baseline counterfactual scenario in which the COVID-19 pandemic does not occur that is originally planned or business as usual
bull Scenario 1 two (2) different paths (like Nike swoosh ndash and W-shaped)
bull Scenario 2 two (2) different paths (like U- and L-shaped)
bull Reference information only based on latest airline schedules (like V-shaped)
Underlying Assumptions
bull International and domestic passenger traffic has separate scenariospaths
bull Scenariospaths are differentiated in terms of supply and demand ie
ndash Scale of output or seat capacity change
ndash Degree of consumer confidence that can be translated into demand or load factor as a proxy
bull Supply and demand are influenced by
ndash Different timing and speed of recovery by region internationaldomestic and intra-inter-region
ndash Global economic contraction
bull No consideration is made to social distancing requirements on aircraft etc
10
Educated Guess Interpreting traffic forecasting during the pandemic
IATA
httpswwwiataorgeniata-repositorypublicationseconomic-reportsjune-data-and-revised-air-travel-outlook
Latest Publication 28th July 2020 Scope Global 2010-2025
Publication COVID-19 June data and revised air travel outlook [21]
Value RPK
Scenarios
The outlook for global GDP could take different paths and therefore IATA is exploring optimistic and pessimistic scenarios for the economy as below
Underlying Assumptions
bull Pandemic will gradually be contained and there will not be a second wave of COVID cases
bull Cautious behaviour of travellers will continue to affect travel demand at the start of 2021 and the recovery in business travel will come with a lag
bull The impact of COVID-19 on the global economy will be severe Global GDP growth is expected to contract by 50 in 2020
bull COVID-19 will have a significant impact on international trade (13 decline) which has been suffering from the US-China trade war
bull 2020 will be the worst year in history for airlines (net loss of $843bn) and losses will continue in 2021 albeit to a lesser extent
bull Airlines in all regions are expected to record negative operating income in 2020
bull Revenues are expected to fall by more than demand as airlines are significantly discounting ticket prices to help stimulate travel
11
Educated Guess Interpreting traffic forecasting during the pandemic
EUROCONTROL
httpswwweurocontrolintforecasting
Latest Publication November 2020 Scope Regional (EU) 2020 ndash 2024
Publication EUROCONTROL Five-Year Forecast 2020-2024 [27]
Value Number of flights ()
Scenarios
The 5 year forecast references 3 separate scenarios considering all possible risks and their relative impacts as follows
bull Scenario 1 ndash Vaccine Summer 2021 Vaccine widely made available for travellers (or end of pandemic) by Summer 2021 with traffic only returning to 2019 levels by 2024
bull Scenario 2 ndash Vaccine Summer 2022 Vaccine widely made available for travellers (or end of pandemic) by Summer 2022 with traffic only returning to 2019 levels by 2026
bull Scenario 3 ndash Vaccine not effective Lingering infection and low passenger confidence with traffic only returning to 2019 levels by 2029
Underlying Assumptions
bull Recovery is strongly dependent on how soon an effective vaccine is made widely available and by levels of public confidence
bull Uses 23 October 2020 Oxford Economics Economic Forecast Cumulative Change in GDP growth
bull Continued transport connectivity will be ensured post Brexit
12
Educated Guess Interpreting traffic forecasting during the pandemic
ACI
httpsaciaerowp-contentuploads202012Advisory_Bulletin_The_impact_of_COVID_19_on_the_airport_businesspdf
Latest Publication 8 December 2020 Scope Global 2020
Publication ACI Advisory Bulletin [23] Value Number of passengers
Scenarios
bull ACI World estimated the impact of the coronavirus outbreak 2019 (COVID-19) on the airport industry in terms of potential losses in traffic and revenues based primarily on two key data elements estimated traffic considering the latest COVID-19 statistics and unit revenues derived from the Airport Key Performance Indicators 2020 as total airport revenues are largely a function of traffic while unit revenues have remained stable in recent years
bull Traffic estimates for Q1 2020 were generated using data collected by ACI World from airports for that period
bull The impact has been measured as a difference between the ldquobusiness as usual scenariordquo (BAU) for Q1 2020 as well as year-end 2020 and the ldquoCOVID-19 scenariordquo with estimated traffic and revenues for Q1 2020 and year-end 2020 on a regional basis
bull The Q1 2020 traffic estimates and hence the revenue figures consider the seasonality patterns for the year 2019 calculated on a regional basis
bull The business-as-usual (BAU) forecast for 2020 represents the comparative baseline and is derived from the adjusted World Airport Traffic Forecasts (WATF) 2019ndash2040 considering latest insights provided by ACI Regional offices and other inputs The BAU baseline represents a 3 growth in passenger traffic
bull The impact of COVID-19 on passenger traffic for year-end 2020 was estimated under the assumption that most containment measures and flight restrictions will be lifted by the end of summer 2020 This implies a difficult second quarter for the aviation industry with a partial recovery in Q3 and Q4 However the impact on passenger traffic is assumed to be long lasting implying a slow and steady recovery possibly spanning far beyond the end of 2020
13
Educated Guess Interpreting traffic forecasting during the pandemic
Underlying Assumptions
Note ACI included a forecast out to 2040 predicting that global traffic may take up to two decades to return to previously projected levels and cautioning that a structural change (in which traffic will never return to pre-COVID-19 forecasted level) is still a possibility
14
Educated Guess Interpreting traffic forecasting during the pandemic
How good were the forecastsThe different forecasts use different parameters and underlying assumptions but tend to have similar looking predictions ndash suggesting a common bias based around airline expectations To compare the products a numerical comparison was undertaken The full results methodology and references can be found in Annex 2 Analysis of 2020 Forecasts
COVID-19 has disrupted many data sources that feed traffic forecasts ndash including industry schedules airline operations airline fleets aircraft seat capacity and industry traffic and fares This means that many of the assumptions used to create forecasts no longer hold
This is best illustrated by considering observed changes in airline behaviour during the pandemic
Pre-COVID-19
bull Airlines published their schedules 6-11 months in advance
bull Schedule changes inside 4 months of departure were minor
bull Once crew assignments were in place only day-of-departure operational issues would cause a flight cancellation
bull Airlines flew 98+ of their published schedule
Post-COVID-19
bull Airlines are waiting 4-8 weeks prior to departure
bull Changes are happening 1 to 2 weeks before departure some cases days out
bull Cancellations are now happening 1 to 2 days out for non-operational reasons
Table 4 Changes in airline behaviour during pandemic4
But the real issue affecting the accuracy of forecasts is the progress of the pandemic itself and States responses to growing numbers of cases and the emergency of new variants Aviation forecasts are able to track positive plans of airlines to grow demand but canrsquot predict when local flare ups in COVID-19 create tighter restrictions
4 Source Adapted from httpswwwciriumcomthoughtcloudaviation-data-quality-pandemic-forecasting
15
Educated Guess Interpreting traffic forecasting during the pandemic
How can ANSPs use the available forecasts Given the difficulty in developing accurate forecasts in the current climate ANSPs should consult these products with caution carefully assess underlying assumptions and use them as a trend guideline rather than a reliable data source To minimise the potential eronous or misleading information ANSPs should aim to identify more direct local data to support decision-making
Sensible caveats for use of the current forecast products incude
bull Current forecasts should serve as a cross-check and ANSPs should try to focus on the specific sections that may apply to them
bull Identify which of the curves (eg W U L etc) might apply to each ANSP based on alternative available information (local passenger surveys state masures COVID-19 rates etc)
bull Due to the rapid rate of change of external factors through 2020 ANSPs should recheck the available forecasts on a weekly basis to make sure no major
changes are introduced and ensure continuous alignment between different data streams
bull Planning ahead process should be adapted to account for spontaneous changes and forecasts should be trusted for short-term outlooks rather than drive medium-term strategic decisions
bull ANSPs should note that some of the metrics provided may not be available in terms of traffic movements and may not account for overflights
How can ANSPs produce local forecasts during COVID-19There are many factors out of industryrsquos control and making it necessary to identify new techniques and strategies to understand the limits and sensitivity of forecasts including the following techniques
bull ANSPs should think about providing separate forecasts for domestic and international flights (andor overflights) which may be effected by travel restrictions and national passenger behaviour
bull For international flights segregating city-pair traffic (routes or major flows) will allow ANSPs to forecast according to travel restrictions
bull ANSPs should liaise with key stakeholders that are leading the state vaccine deployment strategy in order to understand how to treat scenarios and refine them based on availability of vaccines This should then be factored into determining how much of the traffic would increasedecrease due to each scenario
bull Flight schedules (seasonal slot allocation and other sources such as OAG amp Innovata) can still be used for forecasting but realiability drops significantly To mitigate the variation due to last minute cancellations and change in flight scedules a regional intelligence driven approach should be considered For example EUROCONTROL managed to provide more reliable traffic forecasts than most regional forecaters by coordinating well with airlines directly and not relying on the traditional sources
Alternatively ANSPs may develop alternative approaches to forecasting during the pandemic A promising approach developed by METRON is described in the table below
16
Educated Guess Interpreting traffic forecasting during the pandemic
METRON Approach to forecasting impact of COVID-19
The METRON approach was developed to support regional State level forecasts based on examination of historical traffic and travel constraints imposed by States METRON has published regular updates for CANSO meetings and works with specific ANSPs
The main assumptions are
bull Use of a V-shaped recovery ndash specifically traffic demand will resume if and when State authorities allow it
bull Provision of upper and lower envelopes around itsforecast (best-case and worst-case scenarios)
bull Forecast the rate at which traffic will rebound and where it would be coming from but without placing time values on exactly when the rebound occurs except that
ndash Countriesterritories with more rapid COVID recovery will acceptsend traffic sooner which determines the ordering on the horizontal axis (see graph below)
bull Forecast suggests a steady traffic growth rather than a surge as countriesterritories resume traffic
bull Timing of how long this will take is difficult to determine and METRON continues to refine its approach
Rationale
bull Global forecasts may not reflect upcoming trends for a given ANSP ndash hence a need to decompose traffic forecasts and recent trends by specific country or region
bull In the long run traffic demand composition (ie contribution from other countries or regions) will be inclined to restore itself to pre-COVID conditions though it is a question of timing ndash which ones will restore first and by how much
bull Traffic demand is largely driven by the following factors
ndash Rate at which airlines can resume operations which is often faster and more ambitious than what States will allow
ndash OAG largely reflects airline intentions but must be tempered with recent airline tendencies to overunder schedule then adjust
ndash Number of new COVID cases in each country or region In turn this will dictate the rate at which each State authority will allow travel tofrom other countries or regions
17
Educated Guess Interpreting traffic forecasting during the pandemic
Part C Forecasting post-COVID-19The ongoing second wave in COVID-19 cases the emergence of new strains and subsequent reestablishment of flight restrictions highlights the lack of stability with the current forecasts It is clear that accurate medium-term forecasts will not be available in the short-term
So the critical question remains when will the industry enjoy the wealth of products previously available The answer has three elements
bull When will traditional models be valid
bull How much traffic will have been lost
bull How will traditional models need to be recalibrated
When will traditional models be validIt is clear that demand remains severely curtailed by the coronavirus and in particular travel restrictions imposed by states ldquoBusiness as usualrdquo is dependent on
Factor Risk Potential Impact
Availability and Effectiveness of Vaccine
The approval and availability of vaccines will dictate the pace of aviation recovery With vaccine deployment underway there is renewed hope that normal life will return in SpringSummer 2021 although there is some uncertainty about the effectiveness of vaccines against new variants
High
State Travel Restrictions
As vaccination rates climb States will lift travel restrictions as the local population gets covered If the vaccine is available only in a limited number of countries there is a possibility that quarantine or travel restrictions may remain for an extended period
Medium
COVID-19 Constraints limiting Airport Capacity
The aviation infrastructure is not designed for operating with social distancing ndash new capacity constraints (eg queueing capacity at airports) may become apparent as traffic returns to more normal level
Low
Table 5 ndash Novel factors
At the time of writing vaccine deployment is underway and spooling up in some countries Widespread innoculation however remains unlikely before 3rd quarter 2021 suggesting that traditional forecasting models will not be valid before 2022
How much traffic has been lostThe following table summarises the current predictions for traffic level at the end of 2020 compared to 2019 IATA has suggested that 2019 traffic may return between 2024 and 2029 depending on the success of vaccination programmes across the world
18
Educated Guess Interpreting traffic forecasting during the pandemic
Forecaster Full year 2020 Potential Impact
IATA (RPK) [20] -66 2024
ICAO (number of passengers) [21] -59 NA
ACI (number of passengers) [22] -642 2023
EUROCONTROL (Number of Flights) [28] -55 2024 2026 2029
Table 6 ndash Recovery forecasts
How will traditional models need to be recalibratedWe could assume that traditional forecasting models will be used to forecast traffic from 2022 onwards based on unconstrained use of the infrastructure (albeit with more permanent losses of capacity if airports are forced into bankruptcy and airlines are forced to reduce the number of pilots crews and aircraft to keep their companies afloat) But these forecasts will need a new set of assumptions to take account of the longer-term impacts of COVID-19 ndash ranging from the loss of GDP (a key factor in most forecast models) to growing awareness of environmental issues and change to public perception of travel ndash will we continue to use Zoom for our business meetings
This range of new assumptions required is going to lead to higher uncertainty in the forecasts ndash which of course leads to the issue of deciding how to cope with high and low scenarios
Factor Risk Potential Impact
Environmental Pressure
Linked to passenger behaviour environmental consciousness and flight shaming can be factors driving global lifestyle change This was mostly dormant before COVID-19 but has potentially been accelerated by the pandemic and environmental report showing the benefits of lockdown highlighting human impact on the environment Furthermore planes flying half empty may become unacceptable due to environmental impact
Medium
Economic ImpactGDP projections traditionally play an important role in medium to long term air traffic forecasting However the weight of the economic impact might be reduced for a significant period due to remaining concerns of public health safety
Medium
Business TravelThe need for business travel has been extremely reduced during the pandemic and there is high uncertainty associated to the extent this will be restored in the upcoming years
Medium
Public Confidence
Public confidence in traveling by air has been significantly impacted Surveys show that passengers consciousness regarding their intention to return to their usual travel plans has been continuously shifting As an example IATA found that a sizeable portion of the surveyed population would wait up to half a year or even a year to return to flying again But looking at Asia and their experience with domestic traffic recovery one may argue confidence in flying may not be a decisive factor and would rather be a cumulus of previously discussed factors that will consequently further affect traffic recovery
Low
But risk mitigations can drive opportunities Can the aviation industry accelerate the wide implementation of environmental measures and the advent of environmentally friendly technologies such as efficient aircraft or cleaner fuel Would the traffic downturn during COVID-19 help enable the implementation of some new concepts and technologies For example many ANSPs are using this low-traffic period to trial direct routing Free Route Airspace and CCOCDO which can all contribute to flying being more efficient and environmentally friendly
If there is enough advancement in sustainability by the aviation industry itself it could improve the publicrsquos perception and balance against the ldquoflight-shamingrdquo movement
19
Educated Guess Interpreting traffic forecasting during the pandemic
ConclusionsTraffic Forecasting is a significant undertaking It is performed globally regionally and nationally Traffic Forecasters use a range of techniques to provide the aviation community with a wealth of different products that really do drive critical decision-making in the industry They are so important that even in relatively stable times forecasting errors can cause significant disruption
ANSPs are currently relying on limited short-term forecasts or scenario products with no real view of the medium term At the same time decisions are required on how to effectively reduce costs without limiting medium term capacity or damaging long term reform
It is critical that medium term forecasts are available to prevent short-termism creating long-term structural issues
The forecasting models will necessarily evolve over time and will be self-correcting ndash as we move through pandemic recovery we will learn which modelling assumptions are valid and which are not Two other novel elements of forecasting that would need to be included are (1) forecasts of how COVID-19 will move through society as this will in turn dictate travel restrictions (or relaxation of) from State authorities and (2) addition of some more economic modelling based on past recovery trends for airline industry and overall economic recoveries
20
Educated Guess Interpreting traffic forecasting during the pandemic
Annex 1 Forecasting methodologies Depending on the scope and intended customer forecasters use methodologies which combine traditional methods and techniques (details below) with further intelligence gathered from relevant data sources These forecasting methodologies tend to evolve and be refined to continuously improve accuracy [2]
Image 1 ndash Alternative forecasting techniques
Quantitative forecastingQuantitative forecasting methodologies rely on historical data and trends The challenge with this type of forecasting becomes easily apparent as the first two quarters of 2020 have been a break in such trends with little to no previous supporting data The SARS event in 2003 was initially thought to be an indicator of the type of curve civil aviation might follow on its recovery path but new levels of complexity must be considered due to the global and fast spread of the virus in a very different socio-economic context
Data availabilityA key initial step in the model-building process is the measurement of the variables chosen for inclusion in the model As mentioned previously it may become evident at this stage that certain variables can be rejected due to lack of available data For some variables the data may not be directly available in an appropriate form but can be derived from several sources or by careful estimation
Data for the dependent variables such as passenger traffic in terms of passengers or RPKs and freight traffic in terms of freight tonnes or Freight Tonnes per Kilometre (FTKs) are normally available from the airline airport or the State that needs the forecast They are also normally available in the ICAO statistical databases This data may be supplemented as required using International Air Transport Association (IATA) Airports Council International (ACI) or other sources such
21
Educated Guess Interpreting traffic forecasting during the pandemic
as airline flight schedule data from OAG Data for the independent or explanatory variables related to airline operating economics are also available from the ICAO databases supplemented as required using other sources as mentioned earlier Data for socio-economic variables and demographics may be available from the publications of the International Monetary Fund (IMF) and the United Nations national accounts and other economic services
Accurate measurement of the price of air travel is complicated by the various fares that are available A single measure of price may be calculated as an average of the various fares weighted by the number of passengers using each fare In general passenger yield ie passenger revenue per passenger-kilometre can be used as a measure of price Ideally the average weighted fare for a particular route group or region concerned is more appropriate however the average yield can be considered as a suitable substitute or proxy variable to reflect the price of air travel
A special problem with economic and financial data is whether to use current or constant money values to measure monetary quantities The normal practice is to work with constant money values by adjusting the time series of financial data for simultaneous changes in the purchasing power of the currency
Consider as an example a model of the demand for passenger travel on a network of routes which includes a measure of income (for example GDP) of the country or region and the passenger yield as explanatory variables The data for the variables in current values can be divided by consumer price indices for each of the years concerned to obtain a constant (or ldquorealrdquo) price series The advantage of this approach is that it removes the effect of fluctuations in the inflation rate
Development of an econometric model Source ICAO Forecasting Manual
Forecasting errors
Traditionally there are four potential quantitative forecast errors
a a specification error which results when the incorrect functional form is chosen or a key explanatory variable is left out of the model or if the model structure varies over time
b a conditional error which occurs when predictions of the inputs to the model are not accurate
c a random error which is due to sampling and randomness associated with the data and
d an exogenous error which is unrelated to any of the inputs or specifications but is due to an external event of a unique character such as a war or terrorist attack
By looking at these four categories when considering 2020 forecasts it can be agreed their accuracy is highly affected by exogenous errors due to unpredictable coronavirus pandemic
22
Educated Guess Interpreting traffic forecasting during the pandemic
Qualitative forecastingQuantitative forecasting techniques discussed so far assume that a number of historical observations are available and they represent some underlying pattern Qualitative forecasting methods are used when such data is sparse or not available These methods can also be used in an assessment of how new technological or other developments would affect the forecast The state-of-the-art in qualitative forecasting methods is not nearly as well-defined as in quantitative analysis These methods are largely intuitive They rely heavily on the judgement of experts and may be used to predict a significant change in historical patterns or due to lack of sufficient historical data for a quantitative analysis
Therefore as judgement plays an important part in qualitative analysis providing reliable forecasts based on expert opinions can be problematic during the most dramatic economic impact on civil aviation However qualitative forecasts can assist support in providing a set of possible scenarios rather than a clear exact forecast (ICAO Scenarios)
Delphi techniqueFor example Delphi technique is a special procedure for forecasting by consolidation of opinions on the future It has two steps A selected group of qualified people are first presented with a questionnaire in which they are requested to indicate a most probable course of development in the activity being forecast The initial returns are then consolidated and the composite response returned to all contributors giving them the opportunity to revise their original assessments in light of prevailing opinions among other experts The Delphi technique is a practical means of bringing together information from many experts and moving towards a consensus among them
Decision analysisPotentially the most suitable analysis methodology for the current context is decision analysis which is essentially a combination of both quantitative and qualitative analysis methods In decision analysis the analystrsquos judgement is used in preparing forecasts for a particular area of expertise in combination with some statistical or mathematical techniques including subjective inputs of probabilities Decision analysis is helpful in the assessment of uncertainty and in risk analysis Examples of forecasting methods within this category are market research and industry surveys Bayesian analysis probabilistic analysis and system dynamics
Probabilistic analysisThe notion of forecasting the value of some variable in the future is based on the fact that there is some uncertainty associated with that variable In cases where the amount of uncertainty is large it would be desirable to have a range of values associated with that variable and to assign probabilities to the outcome of a variable or the forecast itself
Air traffic distribution modelsAir traffic distribution models are normally used to forecast traffic demand between designated airport pairs city pairs andor country pairs The socio-economic factors demographics and other relevant factors including the economic characteristics of the cities themselves for the market concerned should be taken into consideration Also supply-side factors such as the level of service available between origin and destination can also come into play
Normally demand between the two cities is directly proportional to the population of the two cities concerned and inversely proportional to the square of the distance between them Population is used here as a measure of attractiveness of the cities and the distance as a measure of impedance (resistance) This is a very simplistic approach and the gravity model in its simplest form implies that if there is a two-fold increase in population this will result in a four-fold increase in demand
But given the current context demand distribution changes rapidly and passenger behaviour has not yet reached a clear direction Uncertainty and continuous geo-political decisions regarding country-to-country border rules and air travel
23
Educated Guess Interpreting traffic forecasting during the pandemic
corridors affect consumer behaviour towards flight bookings People no longer plan or book holidays months in advance as they are conscious of the unpredictable pandemic resolution but they might be prepared to purchase holiday flight tickets on a short-term basis The affordability of booking ad-hoc holidays however is another factor to be considered when projecting further demand calculations
Medium-term forecast analysis componentsTo provide further context of how such methods and techniques are combined to create accurate methodologies for each forecaster ICAO has published a mid-term forecast analysis overview based on EUROCONTROLrsquos approach in 2006
Overview of medium-term forecast analysis components EUROCONTROL Source ICAO Forecasting Manual
24
Educated Guess Interpreting traffic forecasting during the pandemic
Air traffic forecasting parametersConsumers of Air Traffic Forecasts are interested in various information as they will use it for different reasons For example while airlines are mainly interested in the number of passengers airports look at the number of ground movements too and ANSPs need to know the estimated number of flights they will have to control in order to ensure appropriate resource allocation Similarly Air Traffic Forecast Providers aim to produce and support different end users of their product feeding the relevant information to fulfil their primary end usersrsquo needs
Therefore when looking at multiple forecasts global or regional we see they are measured and presented using different measurement units such as Revenue Passenger Kilometre (RPK) Available Seat Kilometre (ASK) Freight Tonne-Kilometres (FTK) Number of Flights Aircraft Movements Number of Passengers
While these parameters are self-explanatory two of the most commonly used ones are ASK and RPK ASK refers to available capacity deployed by scheduled carriers on all its routes whereas RPK performed refers to number of seats for which the carrier has earned revenue in relation to the distance travelled ASK is normally the supply side parameter used to assess the capacity growth in the market whereas RPK is the demand side parameter used to assess the revenue generated by airlines from passenger traffic
Annex 2 Analysis of 2020 forecastsThe below analysis aims to compare the main global and regional forecasts or scenarios available during the COVID-19 pandemic in order to get a better understanding of the information available and its accuracy
The key assumptions are
bull For this accuracy assessment we compared IATA and ICAO forecasts against actual global data
bull Similarly for the regional assessment we plotted EUROCONTROLrsquos and ICAOrsquos public predictions for 2020 to highlight the variation We also compared their forecasts against relevant regional actual data
bull ACIrsquos quarterly projection was included and compared with the other regional data for Europe published by EUROCONTROL and ICAO
bull All percentages are given with respect to 2019 ndash it was found more relevant to compare to data we already have from 2019 than to compare it with the 2020
scenario this way we shall obtain a more accurate picture of the situation
bull Different metrics used in forecasts will give roughly the same numbers ndash as forecasts use RPK ndash passenger revenue number of kilometres or number of flights or number of seats
bull Number of seats is proportional to passenger revenue in case of seats capacity being a relative percentage to 2019 it gives a similar value to RPK (in absolute value the two metrics might not be directly proportional but the decrease in number of flights gives roughly the same decrease in RPK)
These assumptions helped us overlap the forecasts in order to find the most similar models and the path that was mentioned before This way we were also able to take a range of possibilities
In order to compare the main global and regional forecasts or scenario available during COVID-19 pandemic (as of August 2020) we plotted them together as summarised in the table below
25
Educated Guess Interpreting traffic forecasting during the pandemic
Figure 3 ndash Current global forecasts scenarios
As the different paths can be visualised in Figure 3 ndash Current Global Forecasts Scenarios one can observe the variation of the different recovery paths forecasted by the key providers Therefore to get an indication on accuracy and relevance of the different forecasts we compared all scenarios with actual published data from April May June and mid-July in order to obtain an understanding of accuracy to date
To do so we took the average absolute difference in percentage points (ie for IATA the differences were 24 18 1 4 7 9 and 11 respectively resulting in the average error being 52) Figure 4 below is showing global forecastscenarios and associate errors in a graphical representation
Figure 4 ndash Global forecasting error
Similarly we looked at EUROCONTROL and ICAO and their regional forecasts as per Figure 5
26
Educated Guess Interpreting traffic forecasting during the pandemic
Figure 5 ndash European forecasts
Looking at ACIrsquos quarterly European forecast we also plotted the previous scenarios in order to visualise the variation between their models and they are shown in Figure 6 below
Figure 6 ndash European quarterly forecast
Figure 7 below shows the Error variation between EUROCONTROLrsquos forecast and the actual air traffic data recorded for the April ndash August time period
Figure 7 ndash European forecasting error
27
Educated Guess Interpreting traffic forecasting during the pandemic
The graphs clearly show that ECTL error was very small compared to all other forecasts and a key factor that contributed to EUROCONTROLrsquos accuracy is that they have ldquomemorisedrdquo the data based on actual airline bookings Furthermore providing a forecast for a region with geo-political similarities and limited traffic behaviour is very different to predicting the air traffic evolution world-wide Thus EUROCONTROLrsquos average forecast accuracy error is only 08
ECTL IATA ICAO UL have the highest accuracy over the past four months ICAO UL and IATA offer the best range of possibilities however starting from August ICAO U and ICAO L will follow different paths that will give a smaller range and a better prediction on what will come IF AND ONLY IF the assumptions remain valid throughout the entire recovery period
Taking a range of possibilities is a safer more pragmatic approach because it reduces the sensitivity to unexpected changes Providers can reduce the range of forecasted scenarios as more actual data becomes available
While there might exist more complex methods of comparing accuracies we used this method to get a better understanding of the air traffic forecasting products during the COVID-19 pandemic aiming to support Forecast-data users get an informed overview of the projected short-term air traffic picture
Forecasts analysis limitationsDuring this analysis a set of limitations was identified as follows
bull Some scenarios are dependent on others IATA and ICAO predictions take into consideration ECTLrsquos scenario while ECTLrsquos scenario considers the views of IATA and ICAO =gt meaning that if one is wrong the error will be distributed and incorporated in the others leading to the introduction of a bigger error than expected
bull The data available to produce current forecastsscenarios is not extensive enough to provide an accurate prediction therefore depend to some extent on the experience of the analysts
bull Human behaviour is unpredictable and can significantly affect these predictions
bull There is no previous experience with a similar global pandemic to support robust assumptions the current COVID-19 outbreak has a much bigger global impact on all industries including aviation than the SARS in 2002
bull They are sensitive to unexpected changes ndash example a new wave of COVID-19 is not taken into consideration
28
Educated Guess Interpreting traffic forecasting during the pandemic
References[1] ACI Airport Traffic Forecasting Manual A practical guide addressing best practices (June 2011)[2] ICAO Manual on Air Traffic Forecasting (Third edition 2006)[3] Effects of Novel Coronavirus (COVID-19) on Civil Aviation Economic Impact Analysis (9th September 2020)[4] ICAO Long-Term Traffic Forecasts (April 2018)[5] COVID-19 impact on the European air traffic network (httpswwweurocontrolintcovid19)[6] EUROCONTROL Seven-Year Forecast Autumn 2019 Update Flight Movements and Service Units 2019-2025[7] EUROPEAN AVIATION IN 2040 ndash CHALLENGES OF GROWTH ndash Annex1 Flight Forecast to 2040[8] FAA Aerospace Forecast ndash Fiscal Years 2020 ndash 2040[9] COVID-19 Initial impact assessment of the novel Coronavirus (20th February 2020)[10] Effects of Novel Coronavirus (COVID-19) on Civil Aviation Economic Impact Analysis (26th March 2020)[11] EUROCONTROL-aviation-recovery-factsheet-27042020 ndash 27th April 2020[12] IATA ndash Outlook for air travel in the next 5 years (13th May 2020)[13] IATA COVID-19 Air travel turns up but outlook uncertain-1st of July edition[14] IATA Air Passenger Market Analysis (April 2020)[15] IATA ndash June data and revised air travel outlook[16] ICAO COVID 2020 07 06 Economic Impact[17] ICAO Effects of Novel Coronavirus (COVID-19) on Civil Aviation Economic Impact Analysis (6th July 2020)[18] ICAO monthly monitor-gt March 2019 to May 2020 httpswwwicaointsustainabilityPagesAir-Traffic-Monitor
aspx[19] IATA Economics ndash Economic Performance of the Airline Industry (9th June 2020)[20] IATA Annual Review 2020 [21] Effects of Novel Coronavirus (COVID-19) on Civil Aviation Economic Impact Analysis ndash 30 December 2020[22] COVID-19 Impact on European Air Traffic ndash EUROCONTROL Comprehensive Assessment[23] ACI Advisory Bulletin ndash Economic impact assessment of COVID-19 on the airport business[24] EUROCONTROL Forecasting Dashboard httpswwweurocontrolintforecasting[25] IATA Market Analysis (Jan 2020 gt May 2020)[26] Global Busines Travel Association ndash 2020 Coronavirus Poll (Monthly Reports ndash April to July 2020)[27] EUROCONTROL Five-Year Forecast 2020-2024 4 November 2020
httpswwweurocontrolintlibraryf5B05D=product3A801ampf5B15D=product3A801ampf5B25D=product3A801
[28] What COVID-19 did to European Aviation in 2020 and Outlook 2021 1st January 2021 httpswwweurocontrolintsitesdefaultfiles2021-01eurocontrol-think-paper-8-impact-of-covid-19-on-european-aviation-in-2020-and-outlook-2021pdf
cansoorg
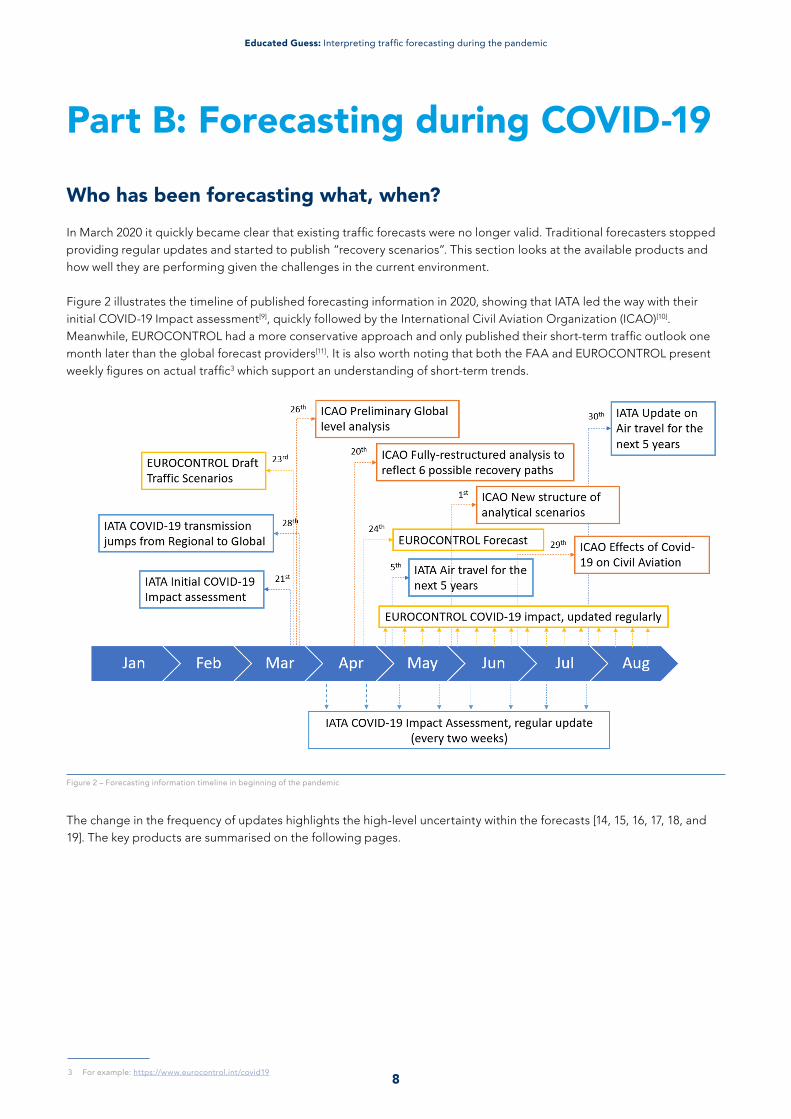
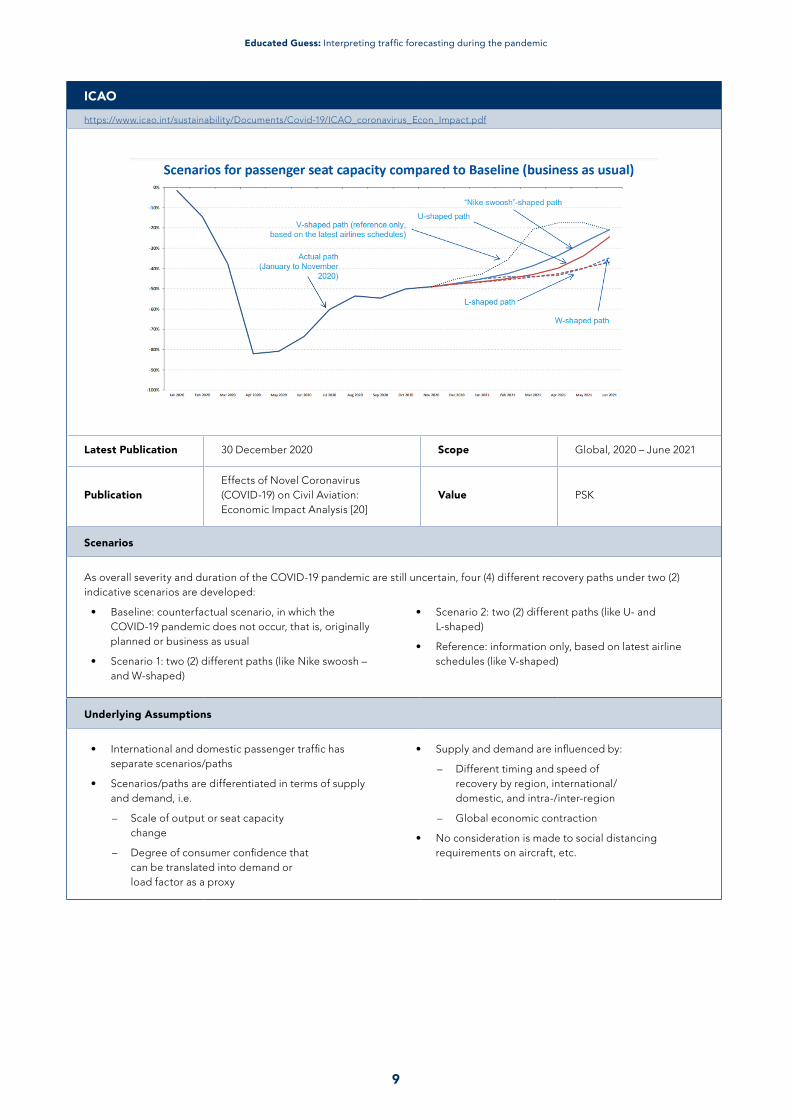
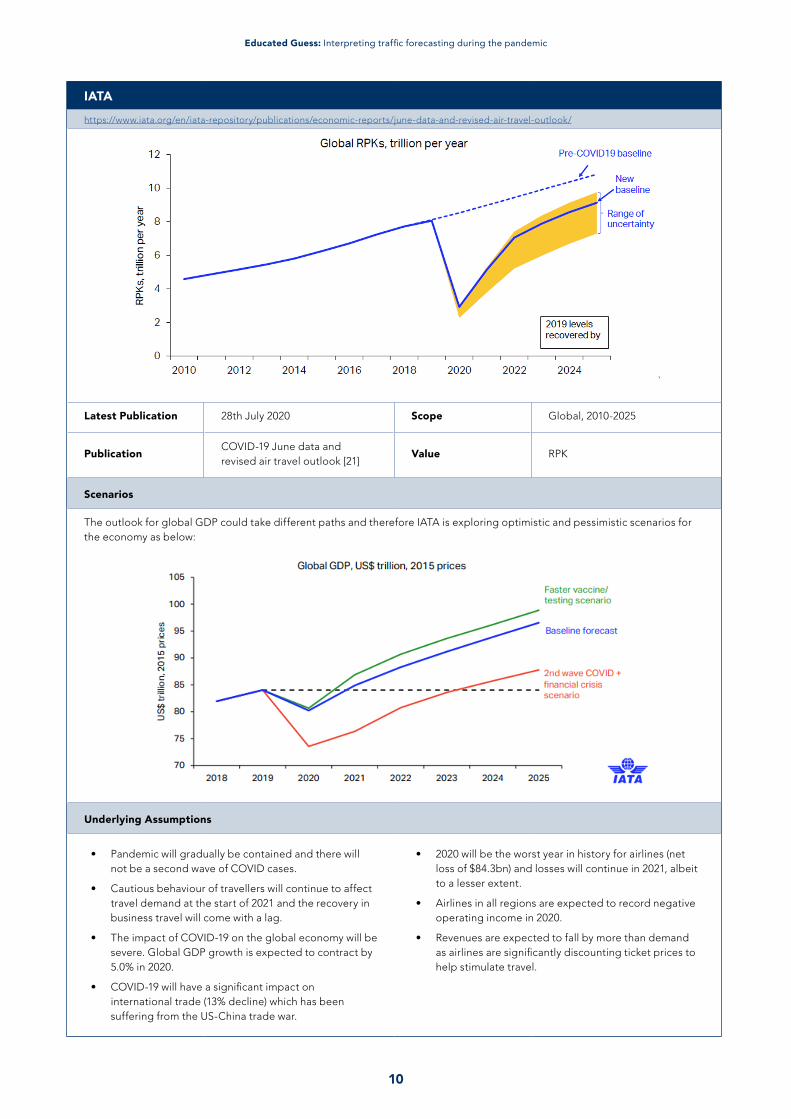
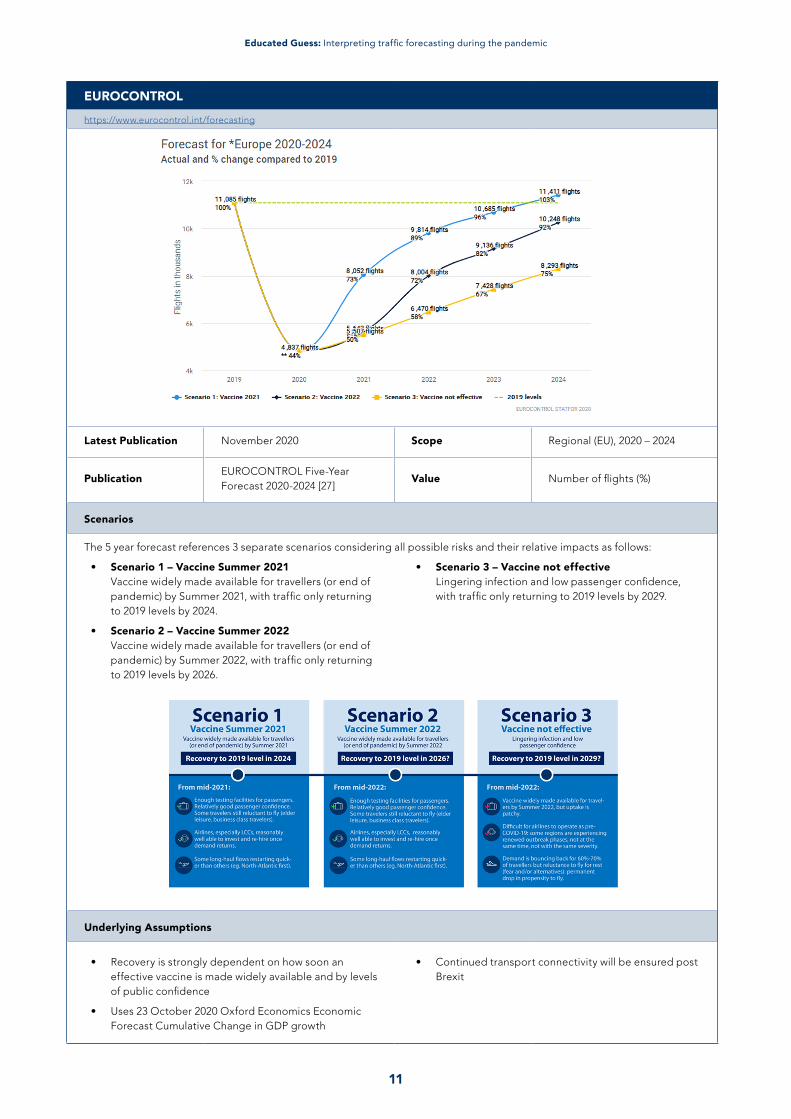
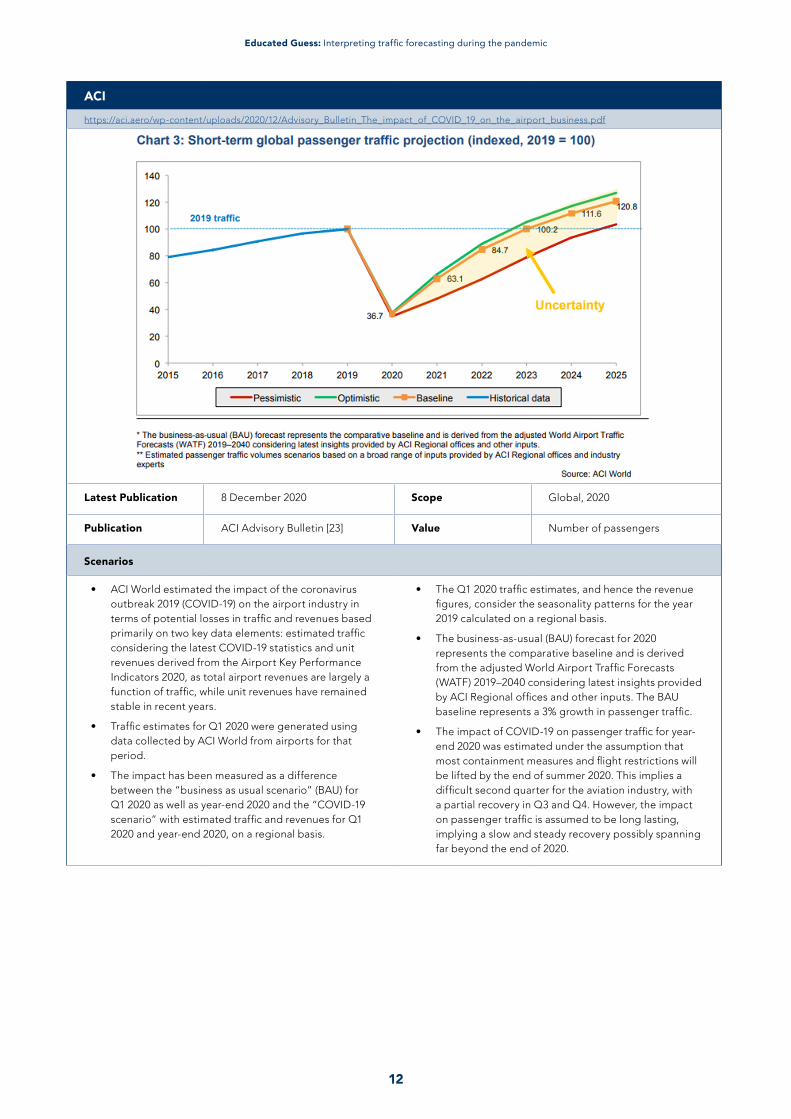
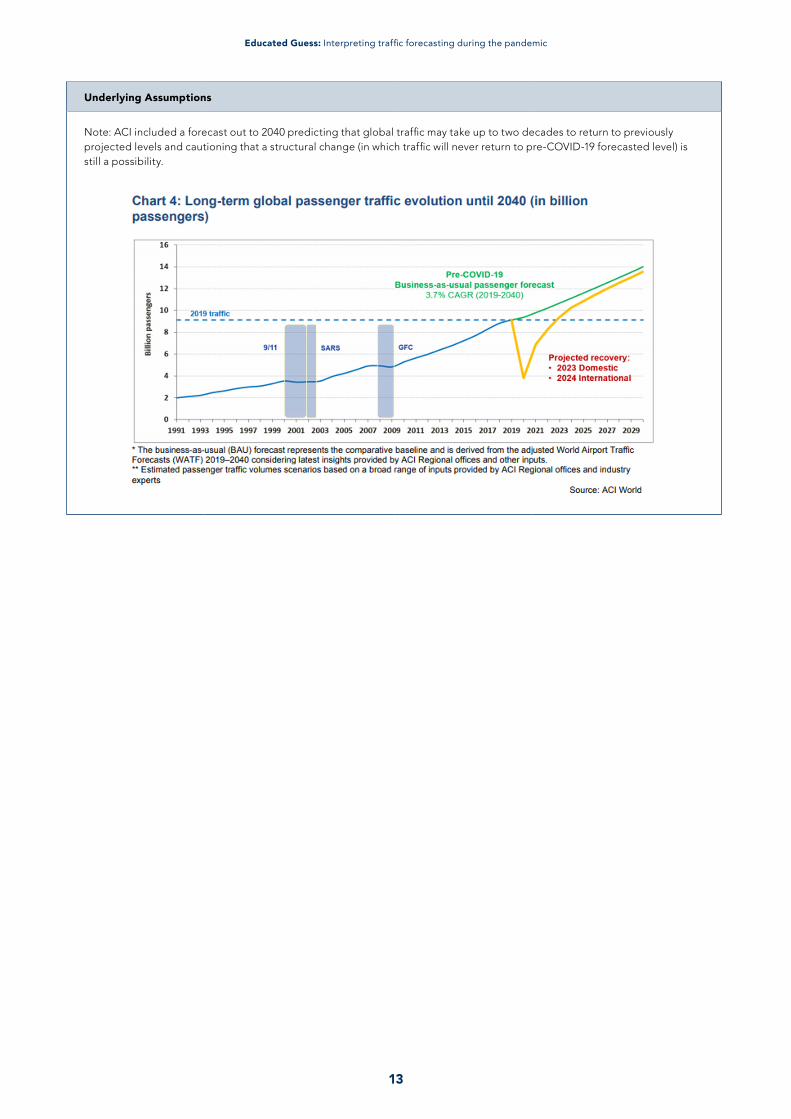
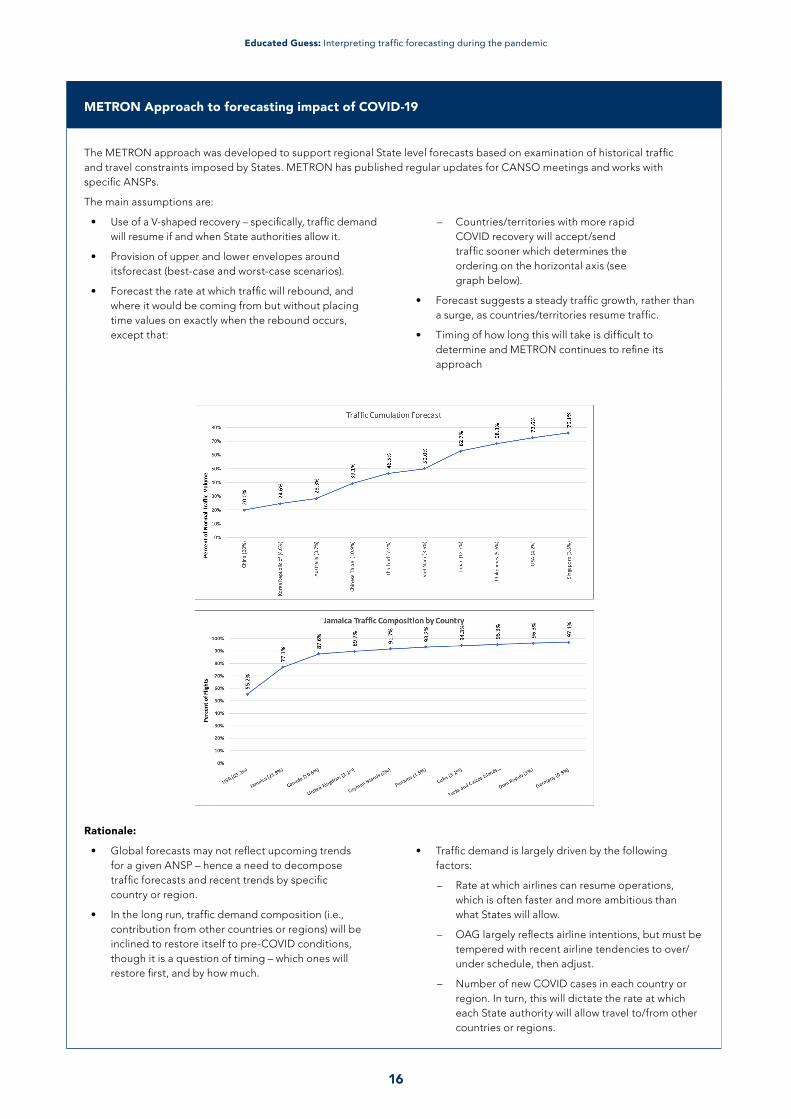
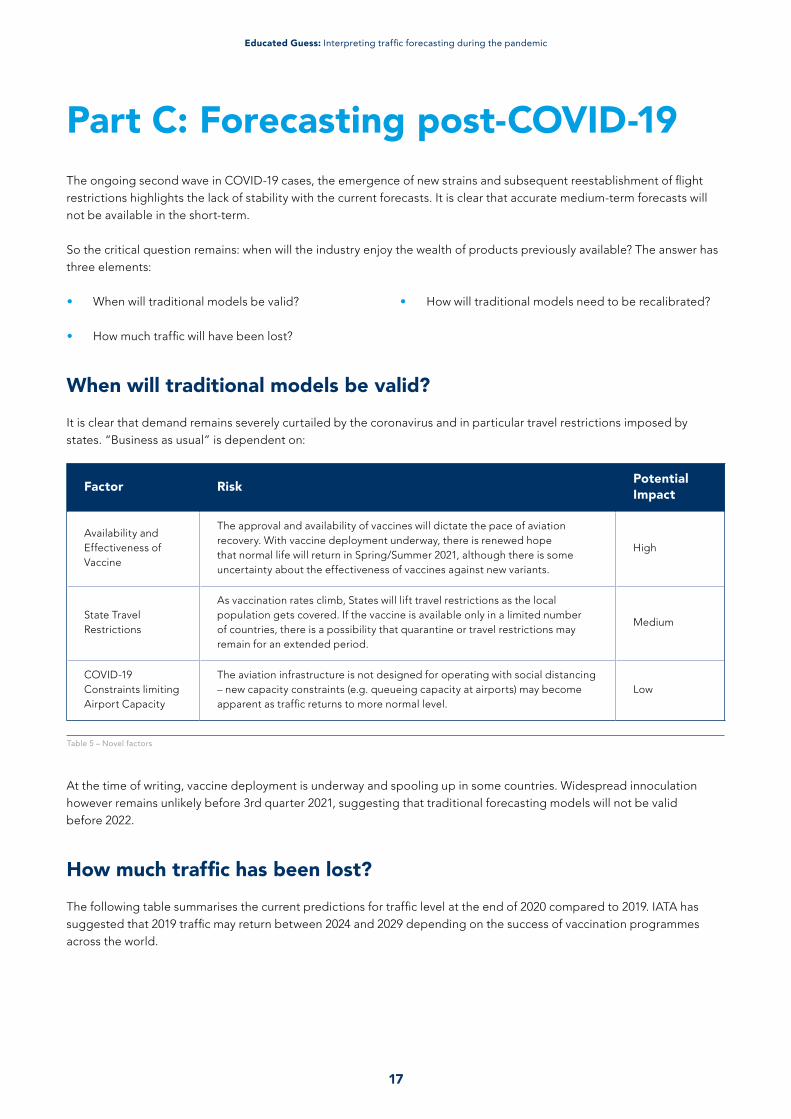
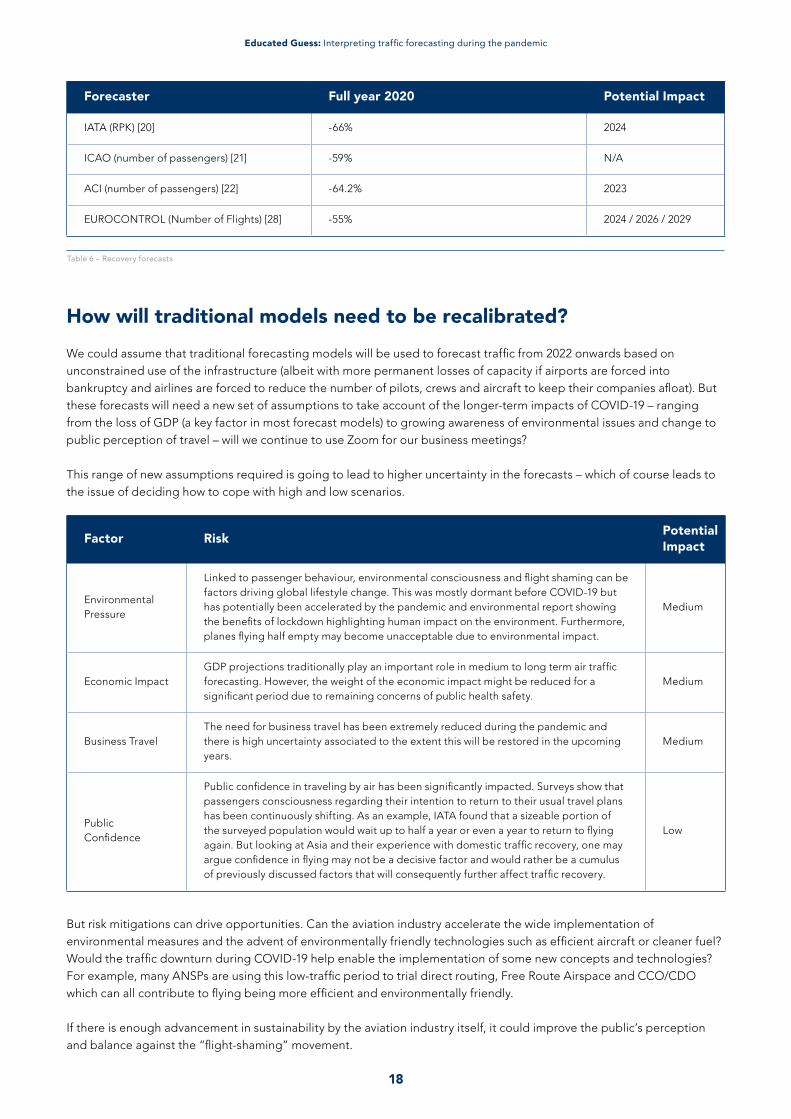
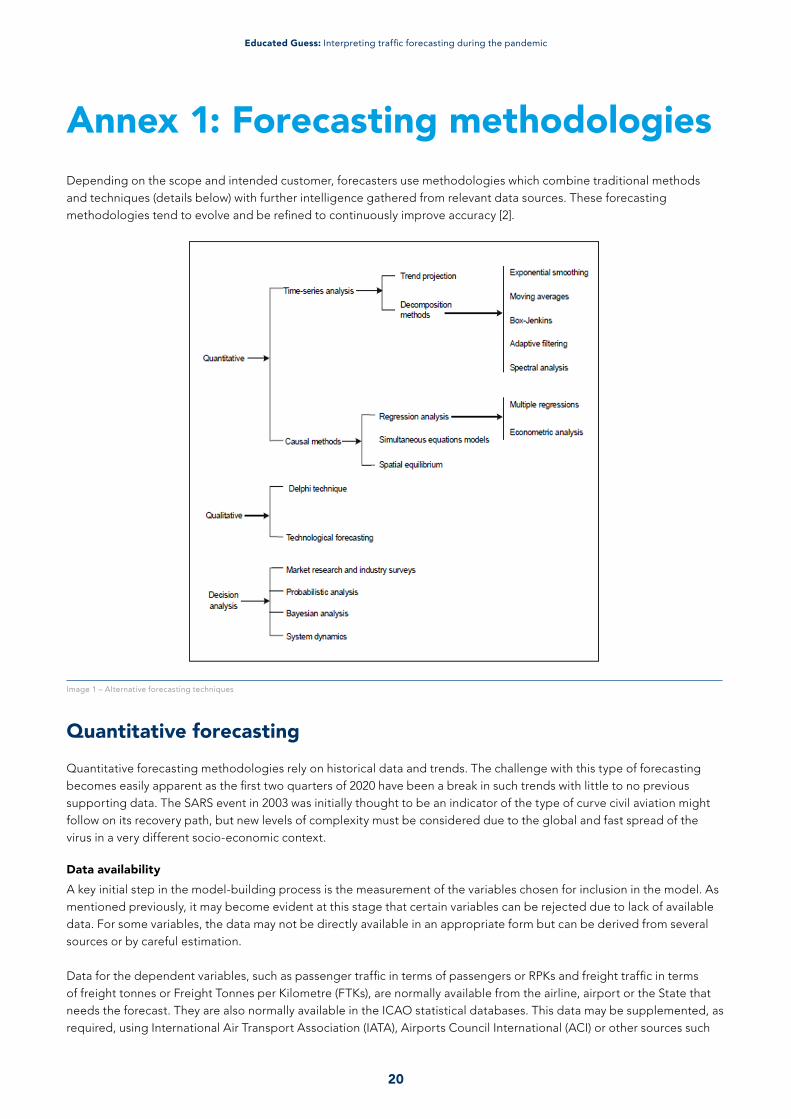
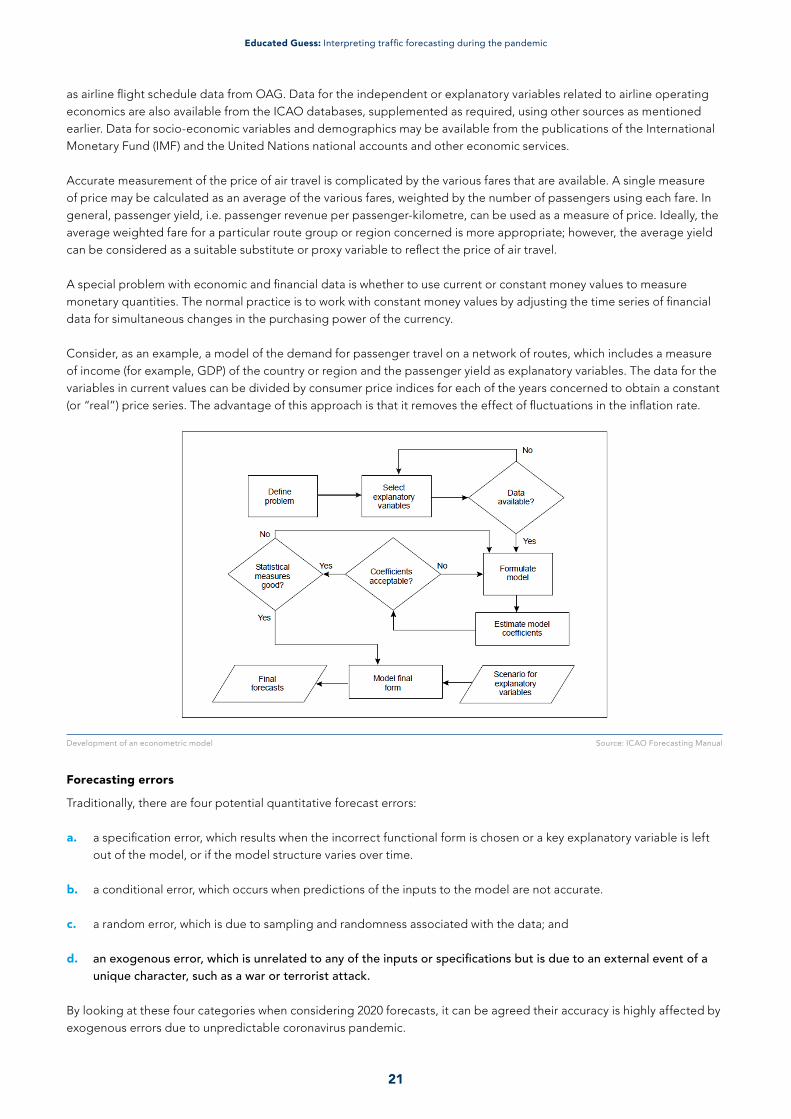
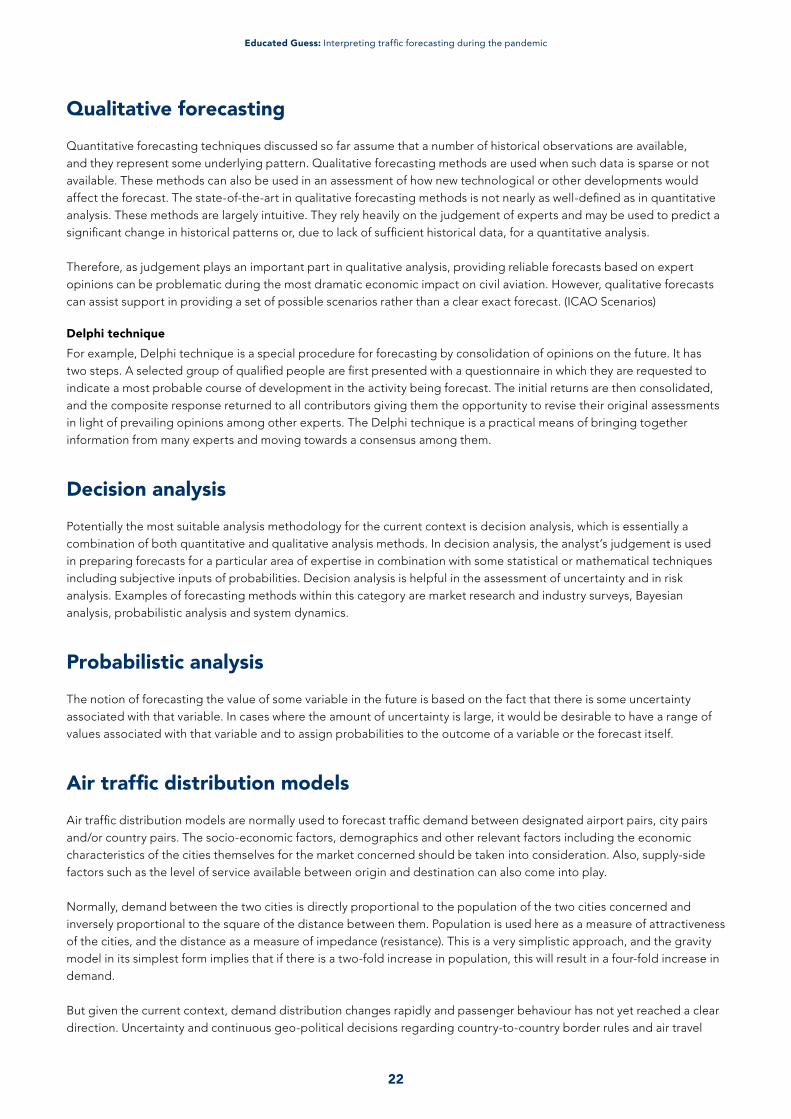
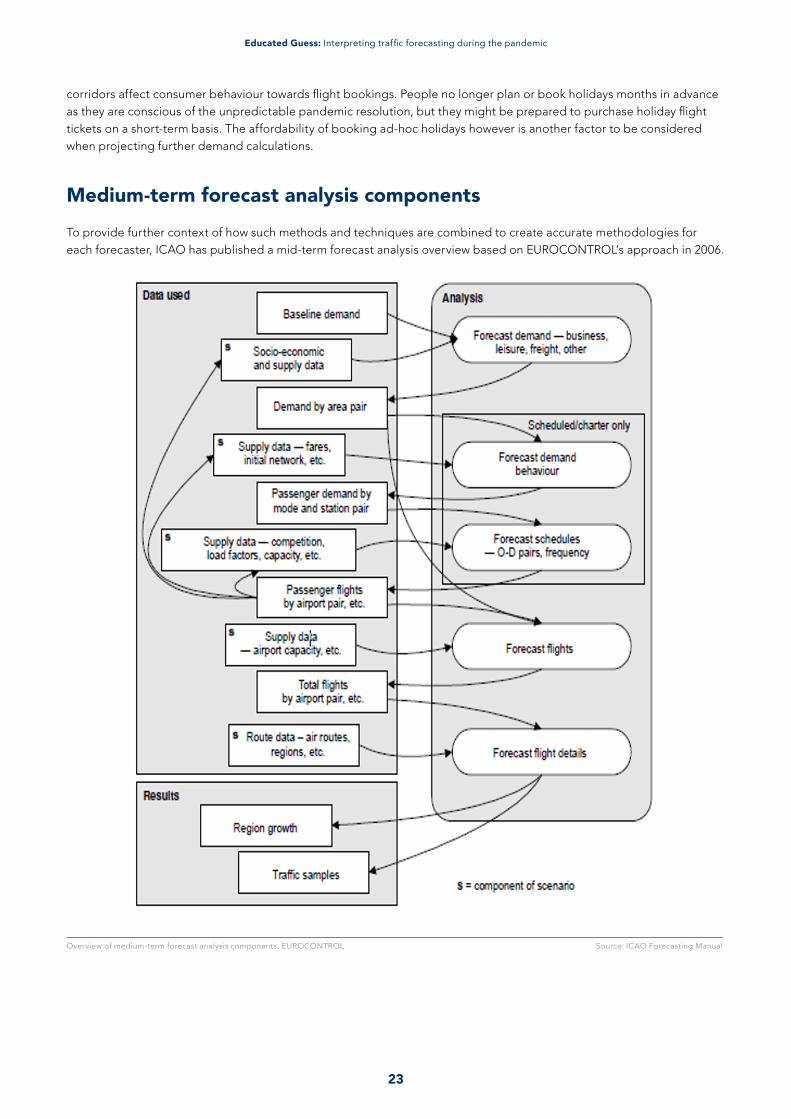
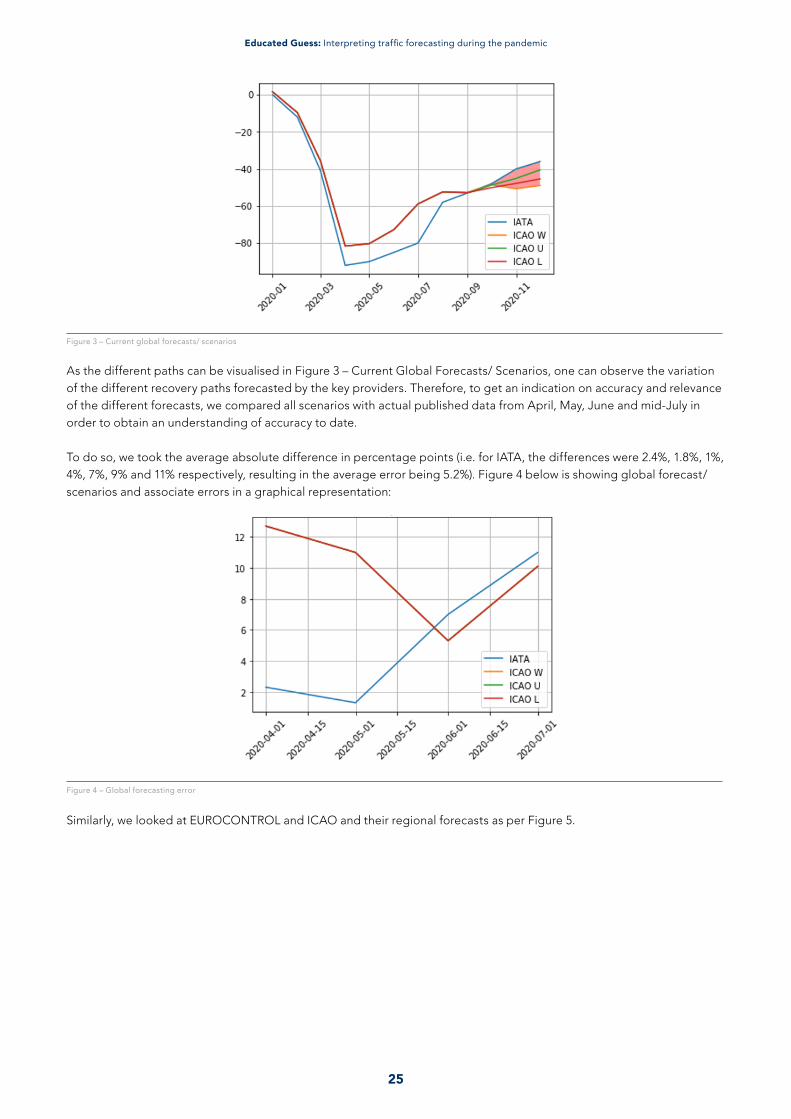
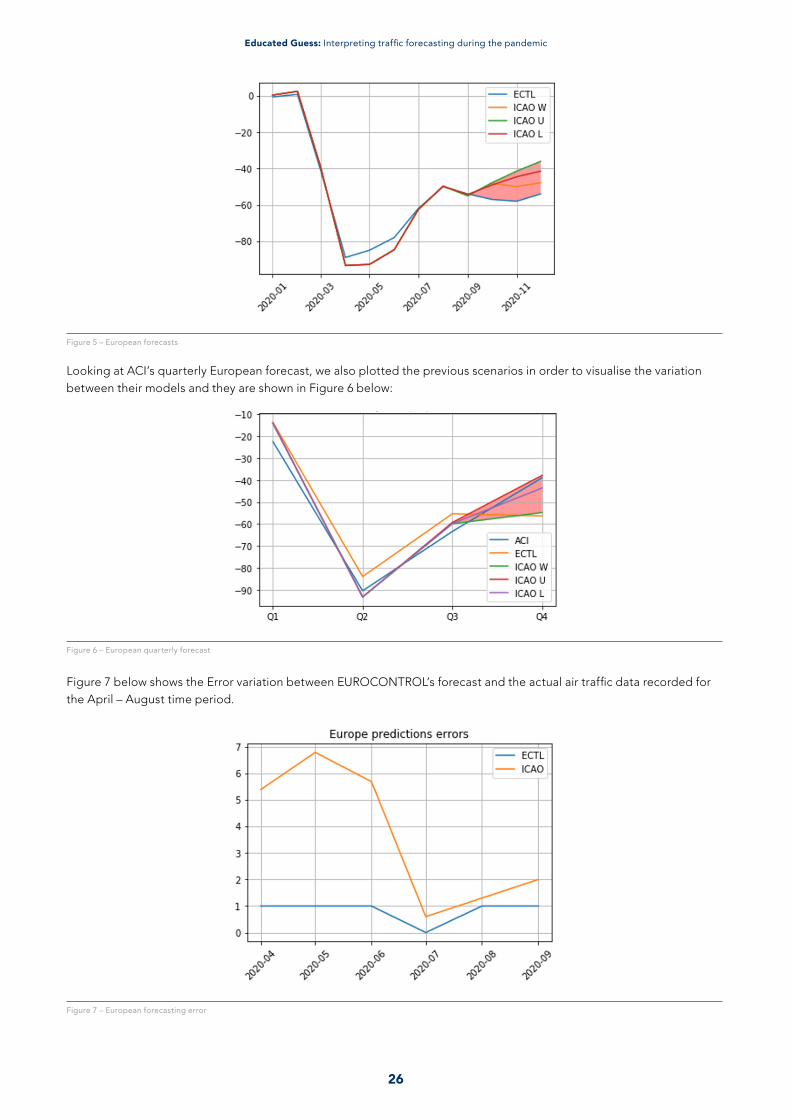
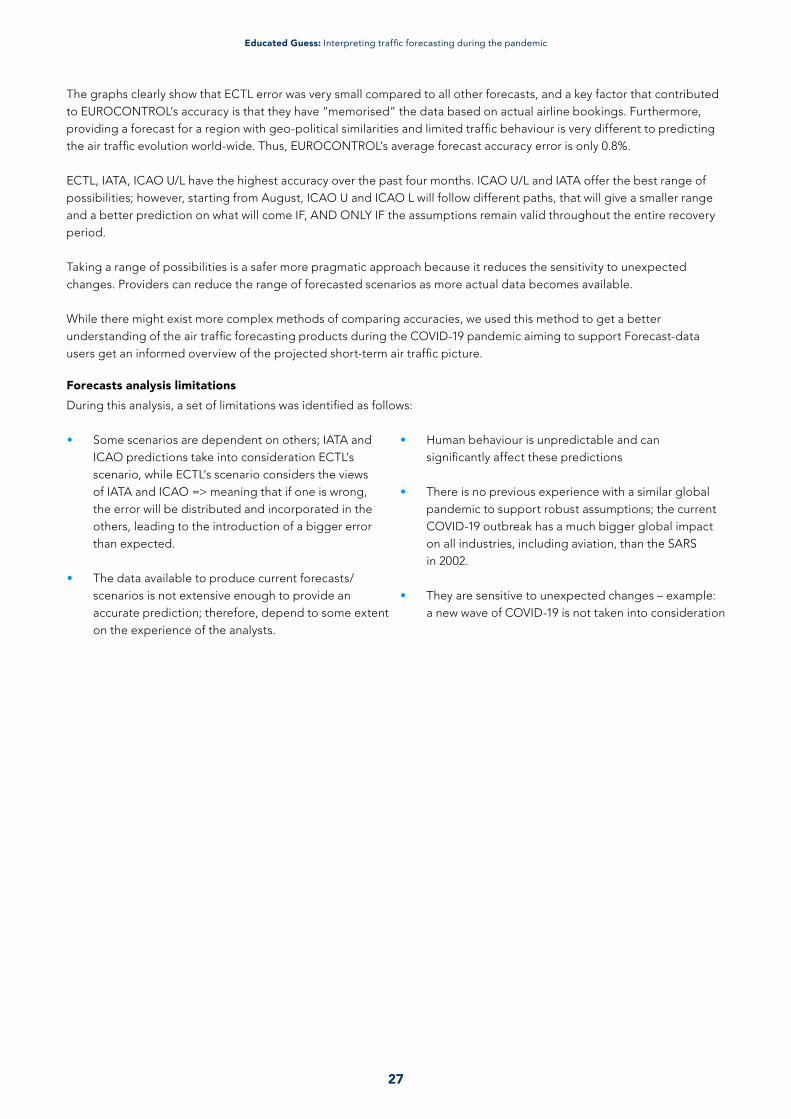
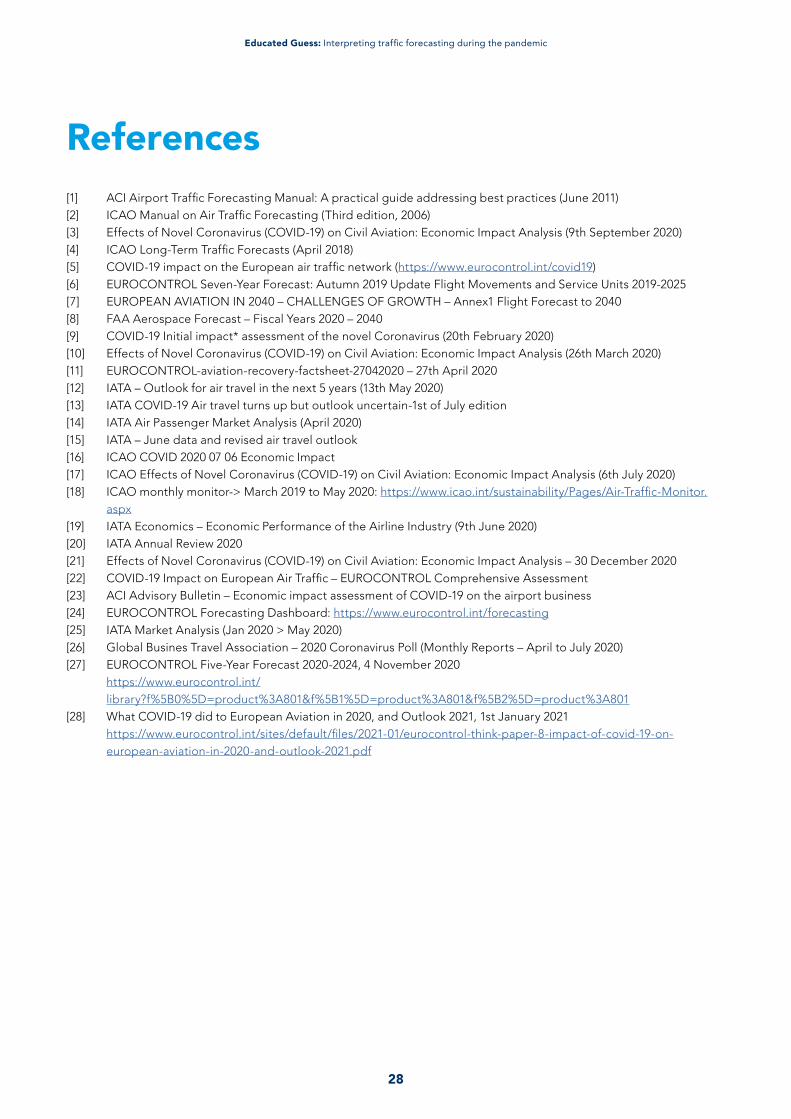

cansoorg
Related Documents