Ecology and Evolution. 2018;8:7763–7777. | 7763 www.ecolevol.org Received: 20 February 2018 | Revised: 20 April 2018 | Accepted: 23 April 2018 DOI: 10.1002/ece3.4213 ORIGINAL RESEARCH eDNA metabarcoding as a new surveillance approach for coastal Arctic biodiversity Anaïs Lacoursière-Roussel 1 | Kimberly Howland 2 | Eric Normandeau 3 | Erin K. Grey 4 | Philippe Archambault 5 | Kristy Deiner 6 | David M. Lodge 7 | Cecilia Hernandez 3 | Noémie Leduc 3 | Louis Bernatchez 3 This is an open access article under the terms of the Creative Commons Attribution License, which permits use, distribution and reproduction in any medium, provided the original work is properly cited. © 2018 The Authors. Ecology and Evolution published by John Wiley & Sons Ltd. 1 St. Andrews Biological Station (SABS), Fisheries and Oceans Canada, St. Andrews, NB, Canada 2 Central and Arctic Region, Fisheries and Oceans Canada, Freshwater Institute, Winnipeg, MB, Canada 3 Department of Biology, Institut de Biologie Intégrative et des Systèmes (IBIS), Université Laval, Québec, QC, Canada 4 Division of Science, Mathematics and Technology, Governors State University, University Park, IL, USA 5 Department of Biology, Université Laval, Québec, QC, Canada 6 Department of Evolutionary Biology and Environmental Studies, University of Zurich, Zürich, Switzerland 7 Department of Ecology and Evolutionary Biology, Cornell University, Ithaca, NY, USA Correspondence Anaïs Lacoursière-Roussel, St. Andrews Biological Station (SABS), Fisheries and Oceans Canada, St. Andrews, NB, Canada. Email: [email protected] Funding information ArcticNet; POLAR knowledge; Nunavut Wildlife Management Board; Fisheries and Oceans Canada Aquatic Invasive Species Monitoring Program Abstract Because significant global changes are currently underway in the Arctic, creating a large-scale standardized database for Arctic marine biodiversity is particularly press- ing. This study evaluates the potential of aquatic environmental DNA (eDNA) meta- barcoding to detect Arctic coastal biodiversity changes and characterizes the local spatio-temporal distribution of eDNA in two locations. We extracted and amplified eDNA using two COI primer pairs from ~80 water samples that were collected across two Canadian Arctic ports, Churchill and Iqaluit, based on optimized sampling and preservation methods for remote regions surveys. Results demonstrate that aquatic eDNA surveys have the potential to document large-scale Arctic biodiversity change by providing a rapid overview of coastal metazoan biodiversity, detecting nonindig- enous species, and allowing sampling in both open water and under the ice cover by local northern-based communities. We show that DNA sequences of ~50% of known Canadian Arctic species and potential invaders are currently present in public data- bases. A similar proportion of operational taxonomic units was identified at the spe- cies level with eDNA metabarcoding, for a total of 181 species identified at both sites. Despite the cold and well-mixed coastal environment, species composition was vertically heterogeneous, in part due to river inflow in the estuarine ecosystem, and differed between the water column and tide pools. Thus, COI-based eDNA metabar- coding may quickly improve large-scale Arctic biomonitoring using eDNA, but we caution that aquatic eDNA sampling needs to be standardized over space and time to accurately evaluate community structure changes. KEYWORDS Arctic, coastal biodiversity, eDNA metabarcoding, global changes, invasion, spatio-temporal distribution

Welcome message from author
This document is posted to help you gain knowledge. Please leave a comment to let me know what you think about it! Share it to your friends and learn new things together.
Transcript
Ecology and Evolution. 2018;8:7763–7777. | 7763www.ecolevol.org
Received:20February2018 | Revised:20April2018 | Accepted:23April2018DOI: 10.1002/ece3.4213
O R I G I N A L R E S E A R C H
eDNA metabarcoding as a new surveillance approach for coastal Arctic biodiversity
Anaïs Lacoursière-Roussel1 | Kimberly Howland2 | Eric Normandeau3 | Erin K. Grey4 | Philippe Archambault5 | Kristy Deiner6 | David M. Lodge7 | Cecilia Hernandez3 | Noémie Leduc3 | Louis Bernatchez3
ThisisanopenaccessarticleunderthetermsoftheCreativeCommonsAttributionLicense,whichpermitsuse,distributionandreproductioninanymedium,providedtheoriginalworkisproperlycited.©2018TheAuthors.Ecology and EvolutionpublishedbyJohnWiley&SonsLtd.
1St.AndrewsBiologicalStation(SABS),FisheriesandOceansCanada,St.Andrews,NB,Canada2CentralandArcticRegion,FisheriesandOceansCanada,FreshwaterInstitute,Winnipeg,MB,Canada3DepartmentofBiology,InstitutdeBiologieIntégrativeetdesSystèmes(IBIS),UniversitéLaval,Québec,QC,Canada4DivisionofScience,MathematicsandTechnology,GovernorsStateUniversity,UniversityPark,IL,USA5DepartmentofBiology,UniversitéLaval,Québec,QC,Canada6DepartmentofEvolutionaryBiologyandEnvironmentalStudies,UniversityofZurich,Zürich,Switzerland7DepartmentofEcologyandEvolutionaryBiology,CornellUniversity,Ithaca,NY,USA
CorrespondenceAnaïsLacoursière-Roussel,St.AndrewsBiologicalStation(SABS),FisheriesandOceansCanada,St.Andrews,NB,Canada.Email:[email protected]
Funding informationArcticNet;POLARknowledge;NunavutWildlifeManagementBoard;FisheriesandOceansCanadaAquaticInvasiveSpeciesMonitoringProgram
AbstractBecausesignificantglobalchangesarecurrentlyunderwayintheArctic,creatingalarge-scalestandardizeddatabaseforArcticmarinebiodiversityisparticularlypress-ing.ThisstudyevaluatesthepotentialofaquaticenvironmentalDNA(eDNA)meta-barcodingtodetectArcticcoastalbiodiversitychangesandcharacterizesthelocalspatio-temporaldistributionofeDNAintwolocations.WeextractedandamplifiedeDNAusingtwoCOIprimerpairsfrom~80watersamplesthatwerecollectedacrosstwoCanadianArcticports,ChurchillandIqaluit,basedonoptimizedsamplingandpreservationmethodsforremoteregionssurveys.ResultsdemonstratethataquaticeDNAsurveyshavethepotentialtodocumentlarge-scaleArcticbiodiversitychangebyprovidingarapidoverviewofcoastalmetazoanbiodiversity,detectingnonindig-enousspecies,andallowingsamplinginbothopenwaterandundertheicecoverbylocalnorthern-basedcommunities.WeshowthatDNAsequencesof~50%ofknownCanadianArcticspeciesandpotentialinvadersarecurrentlypresentinpublicdata-bases.Asimilarproportionofoperationaltaxonomicunitswasidentifiedatthespe-cies levelwitheDNAmetabarcoding, for a total of181 species identified atbothsites.Despitethecoldandwell-mixedcoastalenvironment,speciescompositionwasverticallyheterogeneous,inpartduetoriverinflowintheestuarineecosystem,anddifferedbetweenthewatercolumnandtidepools.Thus,COI-basedeDNAmetabar-codingmayquickly improve large-scaleArcticbiomonitoringusingeDNA,butwecautionthataquaticeDNAsamplingneedstobestandardizedoverspaceandtimetoaccuratelyevaluatecommunitystructurechanges.
K E Y W O R D S
Arctic,coastalbiodiversity,eDNAmetabarcoding,globalchanges,invasion,spatio-temporaldistribution
7764 | LACOURSIÈRE- ROUSSEL Et AL.
1 | INTRODUC TION
IntheArctic,climatechangeandmarineinvasionsareexpectedtoresultinover60%speciesturnoverfrompresentbiodiversitywithsubstantial impactsonmarineecosystems (Cheungetal., 2009).Climate change is opening newwaterways in the ArcticOcean,resulting in greater shipping traffic (ACIA 2004; Arctic Council2009;Guy&Lasserre,2016).Predictedincreasesinshippingfre-quencyandroutes(Eguíluz,Fernández-Gracia,Irigoien,&Duarte,2016;Miller&Ruiz,2014;Smith&Stephenson,2013), increasedinfrastructuredevelopmentinports(Gavrilchuk&Lesage,2014),andassociatedchemical/biologicalpollutionwillplaceothereco-system services at risk. Furthermore, the introductionof nonin-digenous species (NIS)maydisplacenative species, alterhabitatand community structure and increase aquaculture and fishinggearfoulinginestuariesandcoastalzones(Goldsmitetal.,2018;Grosholz, 2002; Parker etal., 1999). Currently, the continuousmonitoringneededtoevaluatelarge-scalechangesincoastalbio-diversityandfaunalassemblagesintheCanadianArcticislimited(Archambaultetal.,2010),hinderingriskmanagementandecosys-temsustainabilityplanning(Larigauderieetal.,2012).
Recentadvancesinthecollectionandanalysisofenvironmen-talDNA(eDNA)provideanewcomplementaryapproachthatcanhelptofillgapsinregionalspeciesdistributiondataleftbylogis-tically difficult traditional methods (e.g., bottom trawl, SCUBAdiving) (Deineretal.,2017),particularly inremoteandotherwisechallenginglocations.eDNAallowsforthedetectionoftracesofDNAinwaterfrommacro-organisms(Thomsen,Kielgast,Iversen,Wiuf, etal., 2012). Collecting water samples for eDNA surveyscould allow rapid sample collection, reduce the cost associatedwith data collection/shipping, and is less destructive because itdoesnotrequirethemanipulationoforganisms(Lodgeetal.,2012;Taberlet,Coissac,Hajibabaei,&Rieseberg,2012).eDNAmetabar-coding (i.e., high-throughput eDNA sequencing) can enable theidentification of millions of DNA fragments/sample, providing apowerfulapproachtosurveyaquaticbiodiversity.RepeatedeDNAsurveyscouldpotentiallybeusedtoevaluatelong-termbiodiver-sity changes such as detecting native species loss and declines,NISintroductionsandrangeexpansions,andcommunitystructurechanges. However, the detection of species using eDNA variesas a function of the population densities (Lacoursière-Roussel,Côté, Leclerc, &Bernatchez, 2016; Lacoursière-Roussel,Dubois,&Bernatchez,2016;Mahonetal.,2013), lifehistorytraits,shed-ding rates (Lacoursière-Roussel, Rosabal, & Bernatchez, 2016;Sassoubre,Yamahara,Gardner,Block,&Boehm,2016)localenvi-ronmentalconditionsandtechnicalapproachessuchassequencingeffortsandprimerbiases(Freeland,2017;Pawluczyketal.,2015).Moreover,majorconcernswitheDNAmetabarcoding,includingitsabilitytoaccuratelyidentifysequencestospecies(Chain,Brown,MacIsaac,&Cristescu,2016)andtheunknownecologicaldynam-ics of eDNA in coastal ecosystems, need to be studied beforemarinebiodiversitycanbecomparedacrossspatialandtemporalscalesusingthismethod.
Little iscurrentlyknownabouttheefficacyofeDNAmetabar-coding insurveying long-termvariation inmarinecoastalbiodiver-sity(Limetal.,2016;Portetal.,2016;Thomsen&Willerslev,2015).Relative to freshwaterecosystemswheremore studieshavebeenconducted, eDNA in coastal marine ecosystems is diluted into amuchlargervolumeofwaterandexposedtopronouncedhydrody-namics(e.g.,tides,currents)andvariationinabioticconditions(e.g.,salinity,temperature),whichislikelytoaffecteDNAtransportanddegradation(Footeetal.,2012;Thomsen,Kielgast,Iversen,Møller,etal., 2012). In spite of these challenges, a recent study of hori-zontal spatial eDNAdistribution in thePugetSound (Washington,USA;O’Donnelletal.,2017)wassuccessful in revealing finescaledistributionofspeciesinthesecommunities.InArcticecosystems,highereDNAtransportanddiffusionisexpectedduetoslowerDNAdegradationincold-watertemperatures,butnostudyhasyetchar-acterizedaquaticeDNAdistributioninthisenvironment.ImprovingourunderstandingoftheecologyofeDNA—themyriadof interac-tionsbetweenextraorganismalgeneticmaterialanditsenvironment(Barnes&Turner,2016)—invariousecosystemsisfundamentaltode-termininghoweDNAcanandcannotimprovebiodiversityresearch.
Our objective is to explore the potential of eDNA as a biodi-versitymonitoringapproach toassist in rapiddetectionofcoastalbiodiversityshiftsonlargespatialscaleintwoArcticcoastalareas:Churchill and Iqaluit. These two Arctic commercial ports are ex-pectedtobeparticularlypronetobiodiversitychangesbecausetheyareamongthetopthreeportsintheCanadianArcticwithrespecttovesselarrivalsandassociatedballastand/orhullfoulinginvasionsrisk (Chan,Bailey,Wiley,&MacIsaac,2013).Morespecifically,weestimatetheproportionoftheArcticbiodiversitythatcanbeiden-tifiedatthespecieslevelwitheDNA,andwethencharacterizethespatio-temporaldistributionofeDNAwithrespecttowatercolumndepths,tidepools,andseasons.
2 | MATERIAL S AND METHODS
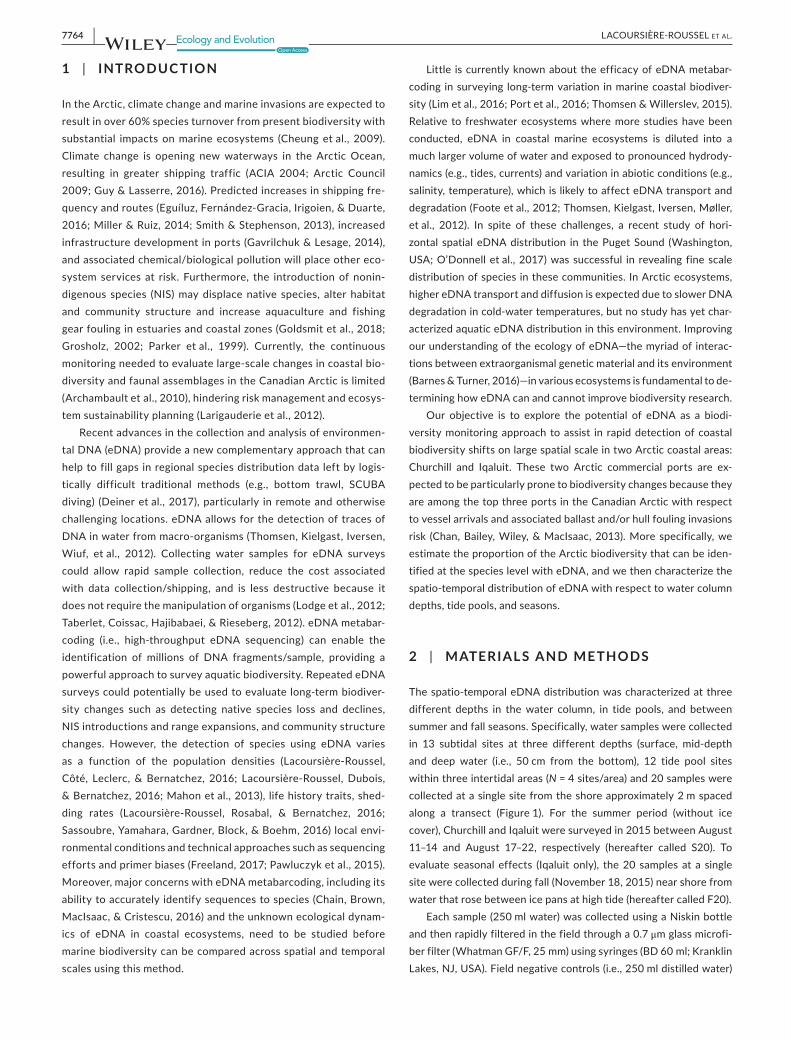
Thespatio-temporaleDNAdistributionwascharacterizedatthreedifferent depths in thewater column, in tide pools, and betweensummerandfallseasons.Specifically,watersampleswerecollectedin 13 subtidal sites at three different depths (surface, mid-depthand deep water (i.e., 50cm from the bottom), 12 tide pool siteswithinthreeintertidalareas(N=4sites/area)and20sampleswerecollectedatasinglesitefromtheshoreapproximately2mspacedalong a transect (Figure1). For the summer period (without icecover),ChurchillandIqaluitweresurveyedin2015betweenAugust11–14 and August 17–22, respectively (hereafter called S20). Toevaluate seasonal effects (Iqaluit only), the20 samples at a singlesitewerecollectedduringfall(November18,2015)nearshorefromwaterthatrosebetweenicepansathightide(hereaftercalledF20).
Eachsample(250mlwater)wascollectedusingaNiskinbottleandthenrapidlyfilteredinthefieldthrougha0.7μmglassmicrofi-berfilter(WhatmanGF/F,25mm)usingsyringes(BD60ml;KranklinLakes,NJ,USA).Fieldnegativecontrols(i.e.,250mldistilledwater)
| 7765LACOURSIÈRE- ROUSSEL Et AL.
were filtered for every10 samples. Filterswerepreserved at 4°Cin700μlofLongmire’slysis/preservationbufferwithina2mltubeforupto3weeks(Wegleitner,Jerde,Tucker,Chadderton,&Mahon,2015)andthenfrozenat−20°CuntilDNAextraction.Toreduceriskof cross-contaminationduring sampling and the filtrationprocess,individualsamplingkitswereusedforeachsample(bottlesandfil-terhousingsterilizedwitha10%bleachsolutionandnewsterilizedgloves, syringes, and tweezers).Eachsamplingkitwasexposed toUVfor30min.Toreducetheriskoflaboratorycross-contamination,procedures for eDNA extraction, PCR preparation, and post-PCRstepswereallperformedindifferentroomsandPCRmanipulationswereperformedinadecontaminatedUVhood.Samplesfromaspe-cificportwerealltreatedtogether,andthebenchspaceandlabo-ratorytoolswerebleachedandexposedtoUVfor30minpriortoprocessing the next port. Siteswithin a portwere processed in arandomizedorder.
2.1 | eDNA extraction, amplification and sequencing
DNA was extracted using a QIAshredder and phenol/chloroformprotocol (seeSupporting InformationAppendixS1).Negativecon-trol extractions (950μl distilled water) were performed for eachsamplebatch(i.e.,oneforeach23samples).TwopairsofuniversalmetazoanmitochondrialcytochromecoxidasesubunitI(COI)prim-ersthathavebeendevelopedandtestedonabroadarrayofmarinespecieswereused to amplify eDNA fromasmanymetazoan taxaaspossible:theforwardmlCOIintF(Lerayetal.,2013)andreversejgHCO2198(Geller,Meyer,Parker,&Hawk,2013)amplifying313bp(hereafter called COI1) and the forward LCO1490 (Folmer, Black,Hoeh,Lutz,&Vrijenhoek,1994)andreverseill_C_R(Shokrallaetal.,2015)amplifying325bp(COI2).
Theperformanceof the twoselectedprimerpairsused in thisstudywaspreviouslytestedon104zooplanktonspeciesandwasval-idatedonmockmetazoancommunitiescollectedinCanadianportsbyZhang (2017).Basedona totalof13COIprimerpairsselectedfromtheliteratureandtested,Zhang(2017)showedtheefficiencyofusingmultipleCOIprimerpairsinasingleIlluminaruntorecoverspe-ciesbymetabarcodinganddetected32%ofspeciesusingCOI1and49%ofspeciesusingCOI2.Here,theDNAamplificationprotocolsforbothprimerpairswereoptimizedinvitrousing12Arcticspeci-mensand12potentialinvaders(i.e.,annealingtemperaturegradientusingDNAextracted from tissue samples; Supporting InformationTableS1).Theprimersequencesandsequencedatabaseswerealsoevaluated in silico for their ability to detect native and potentialnonindigenous Arcticmetazoans. A list of recorded coastal Arcticmetazoans was obtained by pooling all Arctic species databasesthatwehadaccessto(Ntotal=897metazoanidentifiedatthespe-cieslevel;FisheriesandOceansCanadaArcticMarineInvertebrateDatabase (Supporting Information Appendix S2), Archambault un-publisheddata,Cusson,Archambault,andAitken(2007),Goldsmit,2016; Goldsmit, Howland, & Archambault, 2014; K. Howland, P.Archambault,N.SimardandRYoung,unpublisheddata,Piepenburgetal.,2011;Link,Piepenburg,&Archambault,2013;López,Olivier,Grant, & Archambault, 2016; Olivier, SanMartín, & Archambault,2013; Roy, Iken, & Archambault, 2015; Young, Abbott, Therriault,&Adamowicz,2016).PotentialNISinvaders(N=130species)weretargetedbasedon(1)screeninglevelriskassessmentsandpredictivespeciesdistributionmodelsindicatingtheywerehighrisk(Goldsmitetal.,2017), (2)theirpresenceinportsconnectedtotheCanadianArctic,and/or(3)theirpresenceinballastwatersandhullsofshipsbased onmonitoring at CanadianArctic ports (Chan,MacIsaac, &Bailey,2015;Chanetal.,2012).HistoricaldataincludemanyArctic
F IGURE 1 GeographicallocationsofthesamplingportintheCanadianArctic(mapa)andthesitedistributionwithinChurchill(mapb)andIqaluit(mapc).Subtidalareasareshowninwhiteandtheintertidalareasinlightgray.Circlesdepictthewatercolumnsites,trianglesarethetidepoolssitesandthesquaresaretheS20andF20shoresamplingsites
0 1 2 km
−120 −100 −80 −60 −40
4050
6070
80
−68.54 −68.50 −68.4663.7
063
.71
63.7
263
.73
63.7
4 0 1 2 km
−94.24 −94.20 −94.1658.7
758
.78
58.7
958
.80
58.8
1 0 1 2 km
Churchill
Iqaluit
USCa
(a)
(b) (c)
7766 | LACOURSIÈRE- ROUSSEL Et AL.
regions,surveyedmainlyduringtheopenwaterperiod,withfocaltaxavaryingamongsurveys.ComprehensiveportsurveysinChurchillandIqaluitwereonlyconductedonceeveryfewyears (Churchill2007,2011and2015;Iqaluit2012and2015–2016).Ascriptwasusedtodeterminewhethertheprimersequenceswerepresentforthetar-getedspecies(speciespreviouslyrecordedfromtheArticandpoten-tialNIS)availableintheNCBIandBOLDdatabases(September2016;http://www.barcodinglife.org).SearchesforArcticspeciesinthese-quencedatabaseswereperformedwithPythonandBashprograms(developedbyJérômeLarocheattheInstitutdeBiologieIntégrativeetdesSystèmes(IBIS),UniversitéLaval)andanalysesarefreelyavail-ableonBitbucket(https://bitbucket.org/jerlar73/env-dna).
Three PCR replicates were performed for each eDNA sampleandeachprimerset.DNAamplificationswereperformedinaone-stepdual-indexedPCRapproachdesignedforIlluminainstrumentsatIBIS.ThefinalreactionvolumeforeachPCRreplicatewas24μl; including12.5.μlQiagenMultiplexMastermix,6.5μldiH20,1μlofeachprimer(10μM),and3.0μlofDNA.Forallsamples,thePCRmix-turewasdenaturedat95°Cfor15min,followedby35cycles(94°Cfor30s,54°Cfor90s(exceptfortheCOI2primers,whichwereat52°Cfor90sand72°Cfor60s)andafinalelongationat72°Cfor10min.Productsofthethreealiquotswerepooledforeachsample.AnegativePCRcontrolwasperformedforeachsampleandprimerset.Allamplificationswerevisualizedona1.5%agarosegelelectro-phoresis.NopositiveamplificationofthePCRnegativecontrolwasobserved.Field andextractionnegative controlswere treatedex-actlythesameasregularsamplesandwerealsosequenced.PooledproductswerepurifiedusingAxygenPCRcleanupkitfollowingthemanufacturer’s recommended protocol. Libraries were quantifiedbyAccuClearUltraHighSensitivitydsDNAQuantificationKitusingtheTECANSpark10MReaderforeachsampleandwerepooledinequalmolarconcentrationstomaximizeequalsequencedepthpersamplelocation(150and37ngpersampleforCOI1andCOI2primersets, respectively, inChurchilland200and300ngpersample forCOI1andCOI2primersets,respectively,inIqaluit).WhenQuant-iTPicoGreen(LifeTechnologies)didnotdetectanyDNA,22.0μlPCRmixturesweremixednonetheless(seeSupportingInformationTableS2fortheconcentrationandvolumeforeachsampleseparately).
Sequencingwas carried out using an IlluminaMiSeq (Illumina,San Diego, CA, USA) using a paired-end MiSeq Reagent Kit V3(Illumina)andfollowingthemanufacturer’sinstructions(SupportingInformationAppendixS1).Eachportwasanalyzedonaseparateruntoensureindependency,butthesampleswithinaportwerepooledwithinasingleIlluminaMiSeqruntoensuretheequalityofsequenc-ingdepthamongsamples.RawsequencesreadsweredepositedinNCBI’sSequenceReadArchive(SRA,http://www.ncbi.nlm.nih.gov/sra)underBioprojectPRJNA388333.
2.2 | Taxonomic identification
Forward and reverse sequences for each sample were trimmedusing Trimmomatic 0.30 (Bolger, Lohse, & Usadel, 2014). FastQCversion v0.11.3 was used to confirm the quality of the trimmed
reads(Andrews,2010).TheFastqqualityscoreswereallwellabove20 for the trimmed reads. Readswere thenmerged using FLASHv1.2.11withaminimumoverlapof30bp(Magoč&Salzberg,2011).“Orphan”readswith<30bpofoverlapbetweenforwardandreversereadswerediscardedandonlymergedreadswereusedintheanaly-ses.COI1andCOI2ampliconsweresplitusingaPythonscriptwhichsearchesfordegenerateprimersatthebeginningandendofeachsequenceandonlykeepssequenceswherethereispositiveidenti-ficationforbothprimers≥270bp.Thesesequenceswerecomparedfor identitywith themetazoan sequences present in theBarcodeofLifeDatabase (BOLD) (Ratnasingham&Hebert,2007;availableontheBOLDSYSTEMS3website,http://www.boldsystems.org,onthe 22ndAugust 2016). Terrestrial species (insects, human, birds,andmammals)andsequencesthatdidnothaveataxonomicnameassigned at the species level were removed from the referencedatabase.
To examine biodiversity at the species level, direct taxonomicassignmentofeachmergedreadwith≥97%identitywasperformedusing theBarque pipeline version 0.9 (see Supporting InformationAppendix S3), an open source and freely availablemetabarcodinganalysis pipeline (www.github.com/enormandeau/barque). Readsmatchingwith equal quality scores tomore thanone species dueto low interspecific divergence were found using usearch. Only156 reads (i.e., 0.02% reads, 17 cases) in total were found withsuchmultiplehits.Foreachcase,thelistofspecieswasscrutinizedand species that were clearly not expected in the Arctic basedon Ocean Biogeographic Information system (OBIS), The WorldPoriferaDatabase,theWorldRegisterofMarineSpecies(WoRMS)database, invasion risk assessments (see references above andSupportingInformationAppendixS2),andexpertknowledgewereremoved fromthesequence referencedatabasementionedabove(seeSupportingInformationTableS3fordetailsaboutthemultiplehitsandactionsmadeforeachspecies).Thepipelinewasrunagaintofindthetophitsonly.Theproportionofmissingspeciesassign-mentsduetoBOLDincompletenesswasfurtherexploredforeachmetazoanphylausingOperationalTaxonomicUnits (OTU)cluster-ing according to 97% similaritywith swarm 2.2.0 (Mahé, Rognes,Quince, De Vargas, & Dunthorn, 2015; see bioinformatic detailsSupportingInformationAppendixS3).OTUsrepresentedbyasingleread(singletons)wereexcludedandtheidentitybetweentherepre-sentativesequencesandtheBOLDdatabasewasperformedusingvsearch (Rognes,Flouri,Nichols,Quince,&Mahé,2016).Foreachphylum,proportionofthebiodiversityassignedtothespecieslevelwasobtainedfromthenumberofOTUsbetween97–100%(similartothresholdusedtoassignspeciesforsequencesintheBOLDda-tabase)relativetothosebetween80–97%(i.e.,belowspecieslevel).
2.3 | Statistical analyses
SamplingeffortisanimportantfactortoconsiderinbothtraditionalandeDNAbiodiversitysurveys.Twolevelsofport-specificsamplingeffortwereexplored:numberofuniquespeciesperread(ameasureofsequencingeffort)andthenumberofuniquespeciespersample
| 7767LACOURSIÈRE- ROUSSEL Et AL.
(ameasureofeDNAcollectioneffort).Forwatercolumn (surface,mid-depthanddeep), tidepool and shore (S20andF20) samplinglocations,weplottedboth readand sample rarefiedaccumulationcurvestovisualizewhetherorwhenaplateauwasreached(whichwould indicate adequate sequencing and sampling effort tocharacterize all species). We also inspected the relative positionof the read curve compared to the sample curve, as read curveslyingabovesamplecurves typically indicatespatialaggregationofspecies (Gotelli&Colwell,2010),or in thiscaseeDNAsequences.ThesesamplingeffortanalyseswereperformedinR3.4.1usingthespecaccumfunctionintheveganpackage.
All further statistical analyses were performed using R 3.0.3.ThespatialdistributionofeDNAandtheseasonalvariabilityinthecommunity composition was represented using Principal compo-nent analysis (PCoA) and tested using PERMANOVA (Anderson,2001)afterHellingertransformation.Hellingertransformationwasappropriatetodealwiththelargeproportionofzerosandreducesthe importanceof large abundances (Legendre&Legendre, 1998)thatcouldbeduetotheeDNAorigin(e.g.,captureofcellormito-chondriavs.extracellularDNA)ortheamplificationprocess.Speciesthatmostlycontributed to thedissimilarity/similaritybetween thetreatments(depthsandtidepoolsvs.watercolumn)wereidentifiedusingSIMPERanalysisusingthesimper()functionoftheveganpack-age.Shannondiversity indiceswerecalculatedwiththeRpackagevegan.Analysesofvariance (ANOVAs)wereused to testwhetherspecies diversity, richness and log10(reads abundance) varied asa functionof sampling location (i.e.,water columnand tidepools;sitesincludedasarandomvariable)andwaterdepthsforeachport
separatelyusingthe lme()functionoftheNLMEpackage(Pinheiro,Bates,DebRoy,&Sarkar,2017)withsitesincludedasarandomvari-able(interactionsbetweensitesanddepthscouldnotbetestedduetouniquevaluesperdepth).Theseasonaleffectonreadabundance(i.e.,metazoanreads,seesectiontaxonomic identification),ShannondiversityandspeciesrichnesswasevaluatedusingaStudent’sttestcomparingtheS20andF20samplesinIqaluit.SørensenandJaccardnonparametricestimateswerecalculatedforlocationpairsusingtheSimilarityPairfunctionoftheSpadeRpackageinR(Chao,Ma,Hsieh,&Chiu,2016)totestforthelevelofsimilarityinspeciescompositionbetweensamplinglocationsandseasons.
3 | RESULTS
Afterbioinformaticsfiltering(SupportingInformationTableS2),weobtained 712,494 aquatic eukaryotic reads in Churchill (200,732reads forCOI1and511,762 reads forCOI2)and178,728 reads inIqaluit(100,139readsforCOI1and78,589readsforCOI2).Noam-plificationwasvisualizedonthegelelectrophoresisforthenegativePCRcontrolsandnosignificanteDNAreadsweresequencedinanyofthenegativeextractionscontrols(Churchill:1–12reads,averageof0.05%oftheeDNAsamplereads;Iqaluit:1–8reads,averageof0.17% of the eDNA samples reads) or the negative field controls(Churchill:2–73reads,0.30%inaverageoftheeDNAsamplereads;Iqaluit:0–54reads,0.75%inaverageoftheeDNAsamplereads).
Cytochrome c oxidase subunit I sequences of 46% and 44%of the known Canadian Arctic native taxa and 63% and 53% of
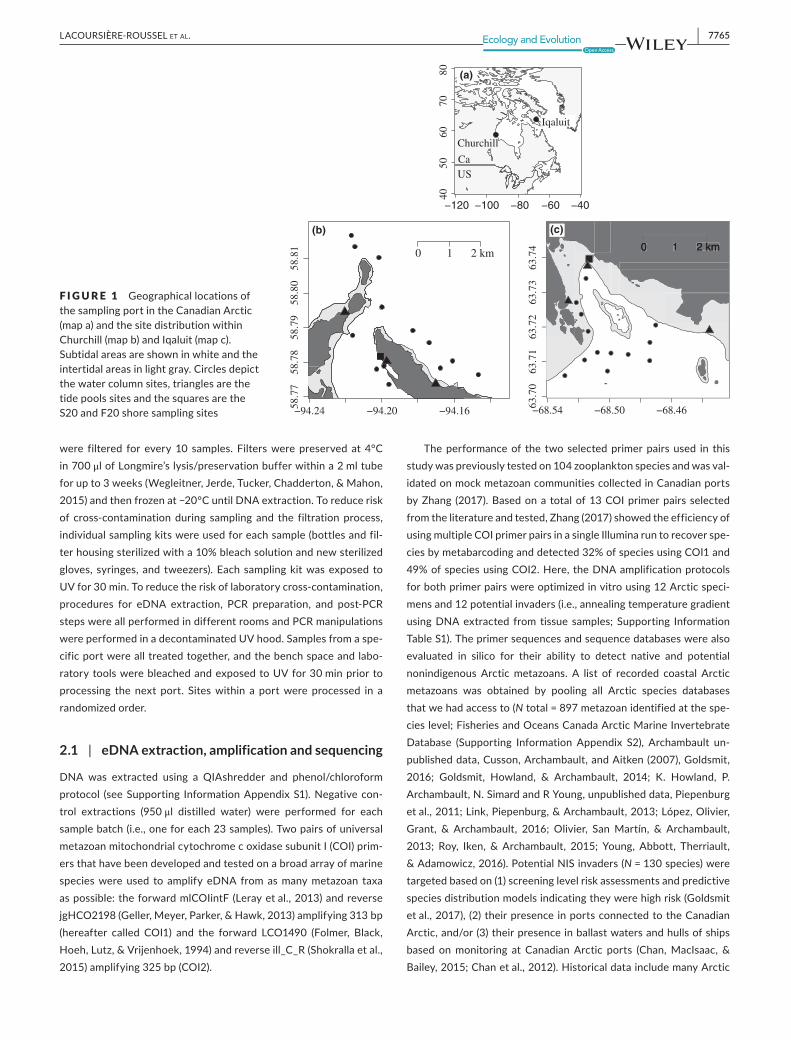
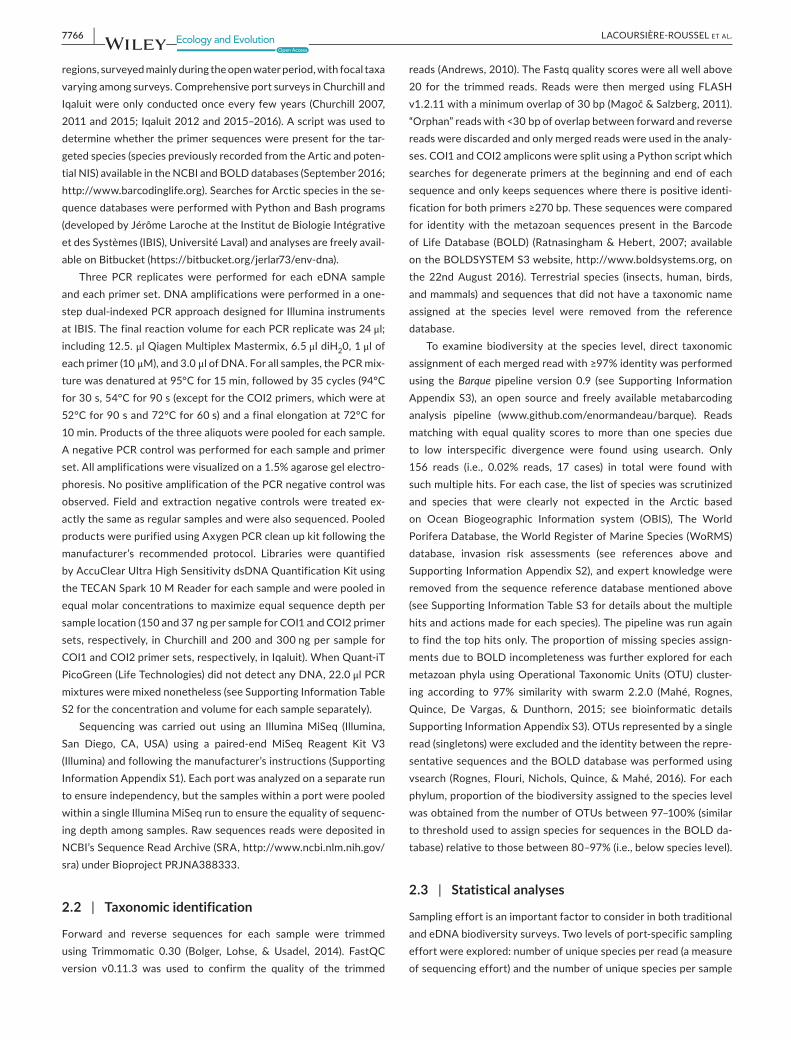
F IGURE 2 ThenumberofOperationaltaxonomicunits(OTU)identifiedatthespecieslevel(dark:≥97%identity)relativetothoseidentifiedbelowthespecieslevel(lighten:≥85%and<97%identity)foreachphylumandfromtheCOI1(mlCOIintF-jgHCO2198:blackandgray)andCOI2(LCO1490-ill_C_R:blue)primersetsseparatelyforbothArcticsamplingports(ChurchillandIqaluit)
0
100
200
300
400
Num
ber
of O
TU
s
0
100
200
300
Ann
elida
Anthrop
oda
Bryo
zoa
Chorda
ta
Cnidaria
Echino
derm
ata
Mollusca
Nem
atod
a
Nem
ertea
Plathe
lminthes
Porifera
Rotifera
Num
ber
of O
TU
s
(a) Churchill
(b) Iqaluit
7768 | LACOURSIÈRE- ROUSSEL Et AL.
potentialinvadersarecurrentlyinGenBankorBOLDdatabase,re-spectively.Inparallel,theproportionofOTUsmatchedtoaspeciesin the eDNA surveywas53% inChurchill and50% in Iqaluit (seetheproportionbyphyluminFigure2).Forbothports,thesamplingeffortcouldhavebeenincreasedtorevealadditionalspeciesasthesample and read accumulation curves did not plateau (SupportingInformationFigureS1).However,therewaslittleevidenceforspatialeDNAaggregationwithinalocationassample-basedcurvesfellonlyslightlybelowreadcurves,andwithin95%confidenceintervals,atalllocations.
3.1 | Taxonomic composition in Arctic coastal ports
Atotalof181speciesweredetectedintheeDNAsurvey;140spe-ciesinChurchilland87speciesinIqaluit(seeSupportingInformationFigure S2 for the species list for each primer set and their statusaccordingtopreviousCanadianArcticreports).Forty-eightspecieswereamplifiedwithbothCOIprimersets,116speciesrecordedbytheCOI1 primer set only and17 species by theCOI2 primer set.At thespecies level, theprimersetsdetecteda totalof tenphyla;includingninephylafor theCOI1primerset (44Annelidaspecies,31Arthropoda,35Chordata,17Cnidaria,17Echinodermata,eightMollusca, threeNemertea, fivePoriferaand fourRotifera) and10
fortheCOI2primerset(27Annelidaspecies,tenArthropoda,twoBryozoa, five Chordata, six Cnidaria, one Echinodermata, eightMollusca, twoNemertea, threePoriferaandoneRotifera). Incon-trasttomockmetazoancommunities(seemethodsection),alargernumber of species was identified using COI1 primers than COI2primers,butthelatterdetectedproportionatelymoreAnnelidaandPorifera.
Forbothports,74.0%ofthespeciesdetectedhavebeenpre-viously reported from the Arctic (Churchill: 70.0% and Iqaluit:87.4%;COI1:78.6%andCOI2:61.5%).Thenumberofspeciesde-tectedusingeDNAinChurchillandIqaluitrepresents10.9%and8.5%metazoanspeciesrecordedwithintheoverallArcticspeciesdatabases.Forty-sevenspeciesnotpreviouslyreportedwerede-tected,including15Annelida,fiveArthropoda,twoBryozoa,fourChordata,eightCnidaria,twoEchinodermata,fourMollusca,threeNemerteaandfourRotiferaspecies.Theonlypotential invadersdetected,theArthropodaAcartia tonsa,wasfoundwiththeCOI1primers inChurchill (64 readsaveraging99.4% identitywith thesequence references). This species was previously recorded inballastwater inportsconnectedtoChurchillandisconsideredapotential invader (Chanetal.,2012).However,COIsequences inBOLDassigned toA. tonsaarenotmonophyleticandseveralareindistinguishable from sequences assigned to the nativeA. hud-sonica,suggestingmisidentificationofsomeAcartiaspecimensinBOLD.
3.2 | Spatial eDNA distribution
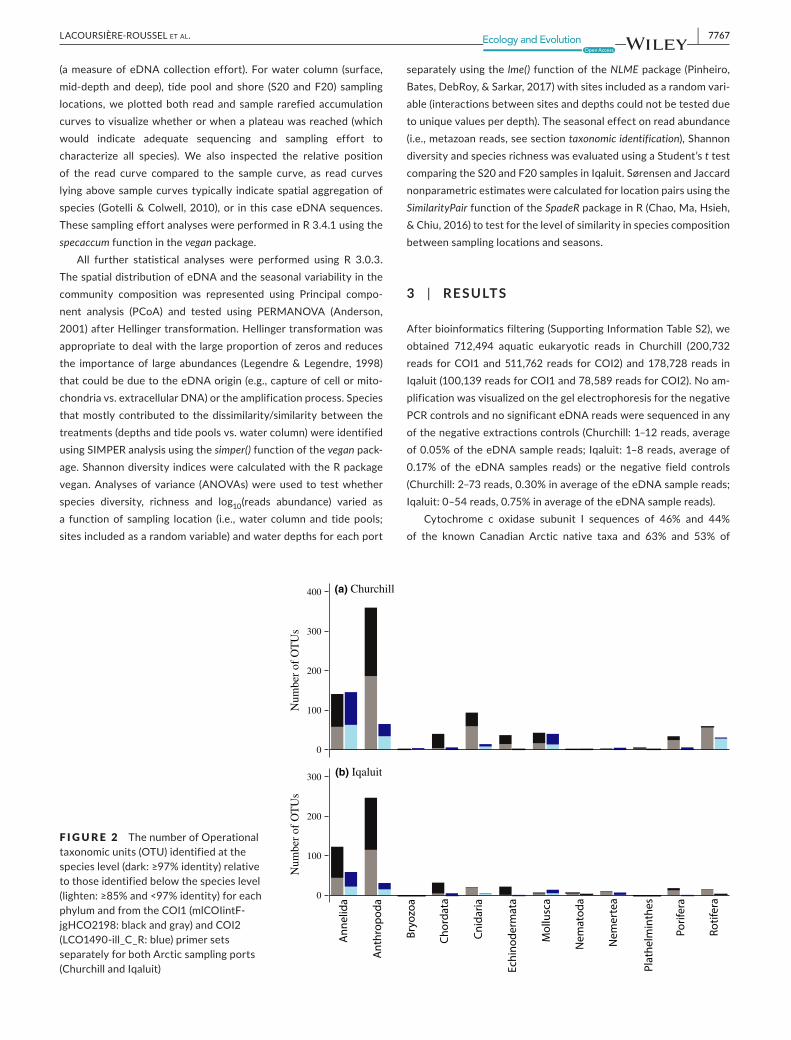
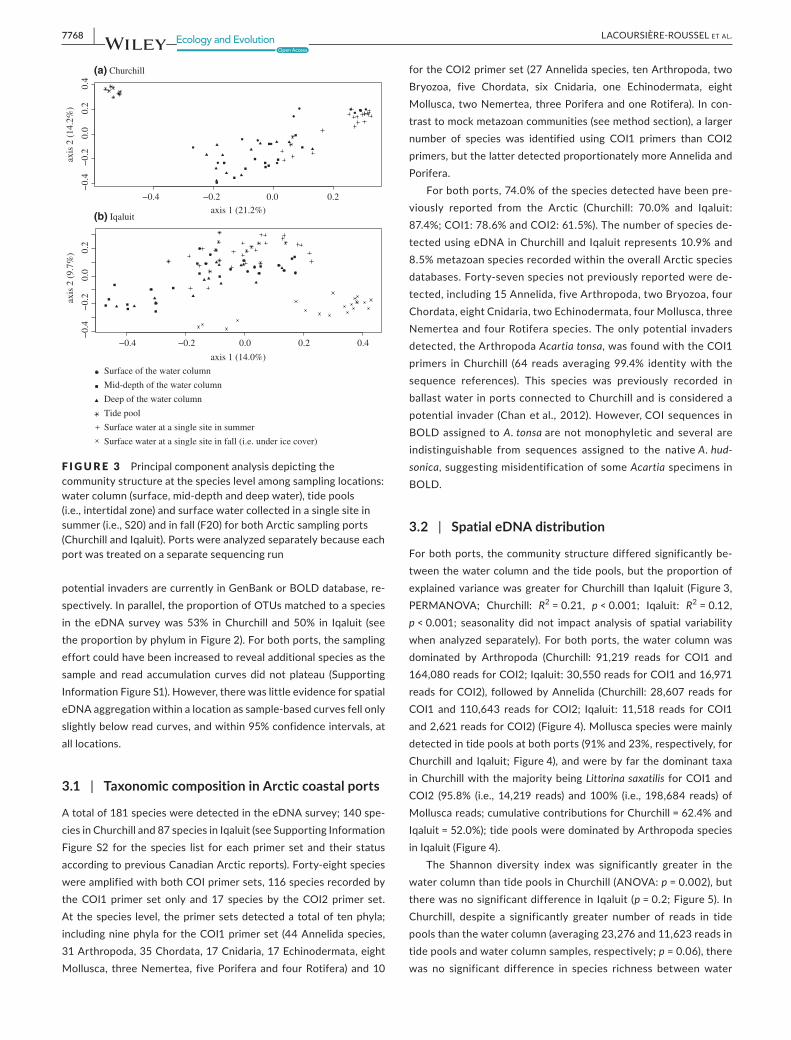
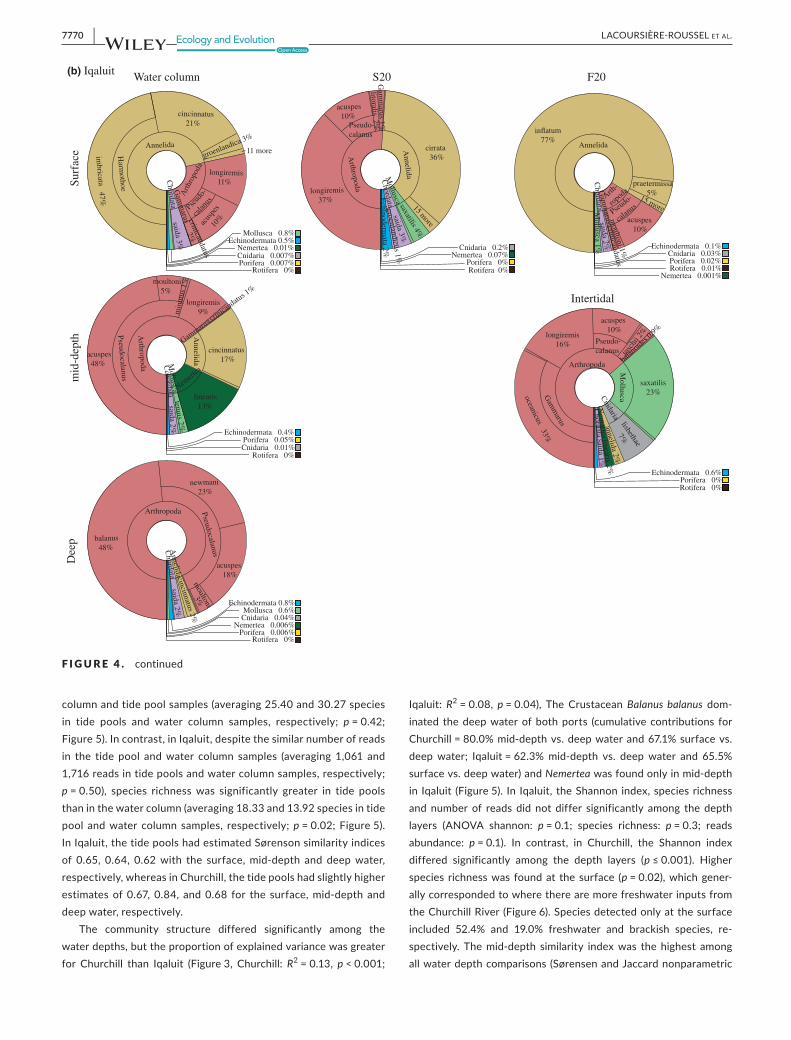
Forbothports, thecommunitystructuredifferedsignificantlybe-tweenthewatercolumnandthetidepools,buttheproportionofexplainedvariancewasgreater forChurchill than Iqaluit (Figure3,PERMANOVA; Churchill: R2=0.21, p < 0.001; Iqaluit: R2=0.12,p < 0.001; seasonality did not impact analysis of spatial variabilitywhenanalyzed separately). Forbothports, thewater columnwasdominated by Arthropoda (Churchill: 91,219 reads for COI1 and164,080readsforCOI2;Iqaluit:30,550readsforCOI1and16,971reads forCOI2), followedbyAnnelida (Churchill:28,607 reads forCOI1 and 110,643 reads forCOI2; Iqaluit: 11,518 reads forCOI1and2,621readsforCOI2)(Figure4).Molluscaspeciesweremainlydetectedintidepoolsatbothports(91%and23%,respectively,forChurchilland Iqaluit;Figure4),andwerebyfar thedominanttaxainChurchillwiththemajoritybeingLittorina saxatilis forCOI1andCOI2 (95.8% (i.e., 14,219 reads) and100% (i.e., 198,684 reads) ofMolluscareads;cumulativecontributionsforChurchill=62.4%andIqaluit=52.0%);tidepoolsweredominatedbyArthropodaspeciesinIqaluit(Figure4).
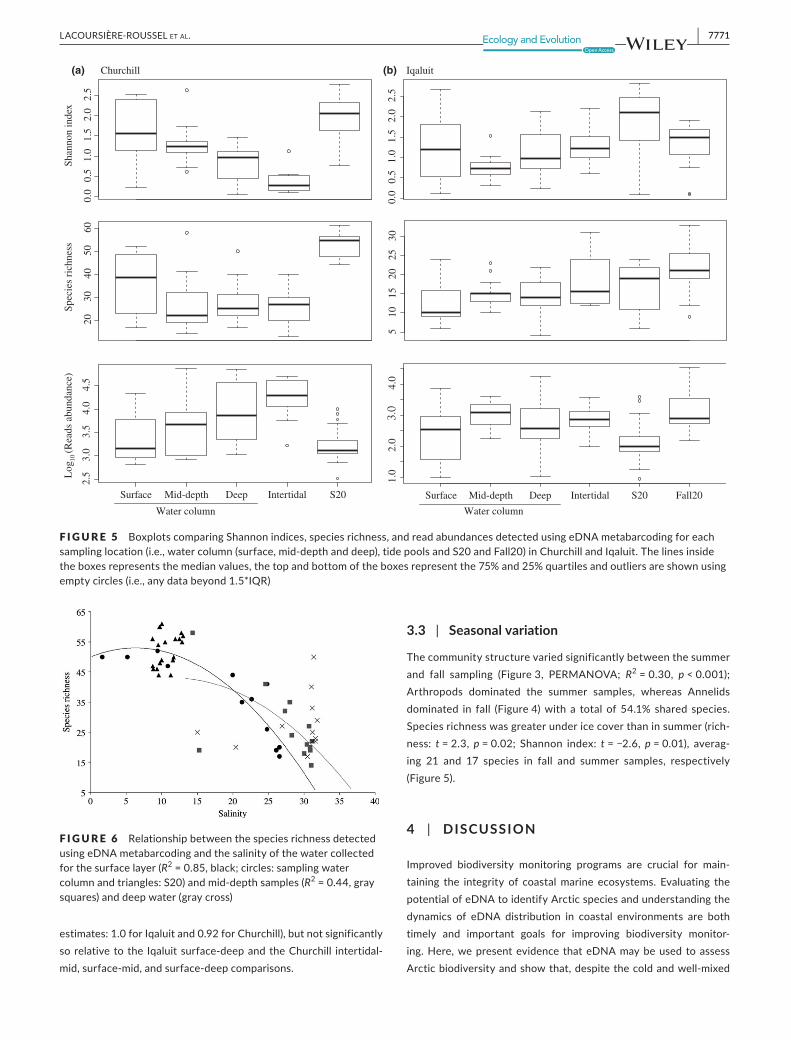
The Shannon diversity index was significantly greater in thewatercolumnthantidepoolsinChurchill(ANOVA:p = 0.002),buttherewasnosignificantdifferenceinIqaluit(p = 0.2;Figure5).InChurchill, despite a significantly greater number of reads in tidepoolsthanthewatercolumn(averaging23,276and11,623readsintidepoolsandwatercolumnsamples,respectively;p = 0.06),therewas no significant difference in species richness betweenwater
F IGURE 3 Principalcomponentanalysisdepictingthecommunitystructureatthespecieslevelamongsamplinglocations:watercolumn(surface,mid-depthanddeepwater),tidepools(i.e.,intertidalzone)andsurfacewatercollectedinasinglesiteinsummer(i.e.,S20)andinfall(F20)forbothArcticsamplingports(ChurchillandIqaluit).Portswereanalyzedseparatelybecauseeachportwastreatedonaseparatesequencingrun
−0.4 −0.2 0.0 0.2
−0.
4−
0.2
0.0
0.2
0.4
axis 1 (21.2%)
axis
2 (
14.2
%)
−0.4 −0.2 0.0 0.2 0.4
−0.
4−
0.2
0.0
0.2
axis 1 (14.0%)
axis
2 (
9.7%
)(a) Churchill
(b) Iqaluit
Surface of the water column
Mid-depth of the water column
Deep of the water column
Tide pool
Surface water at a single site in summer
Surface water at a single site in fall (i.e. under ice cover)
| 7769LACOURSIÈRE- ROUSSEL Et AL.
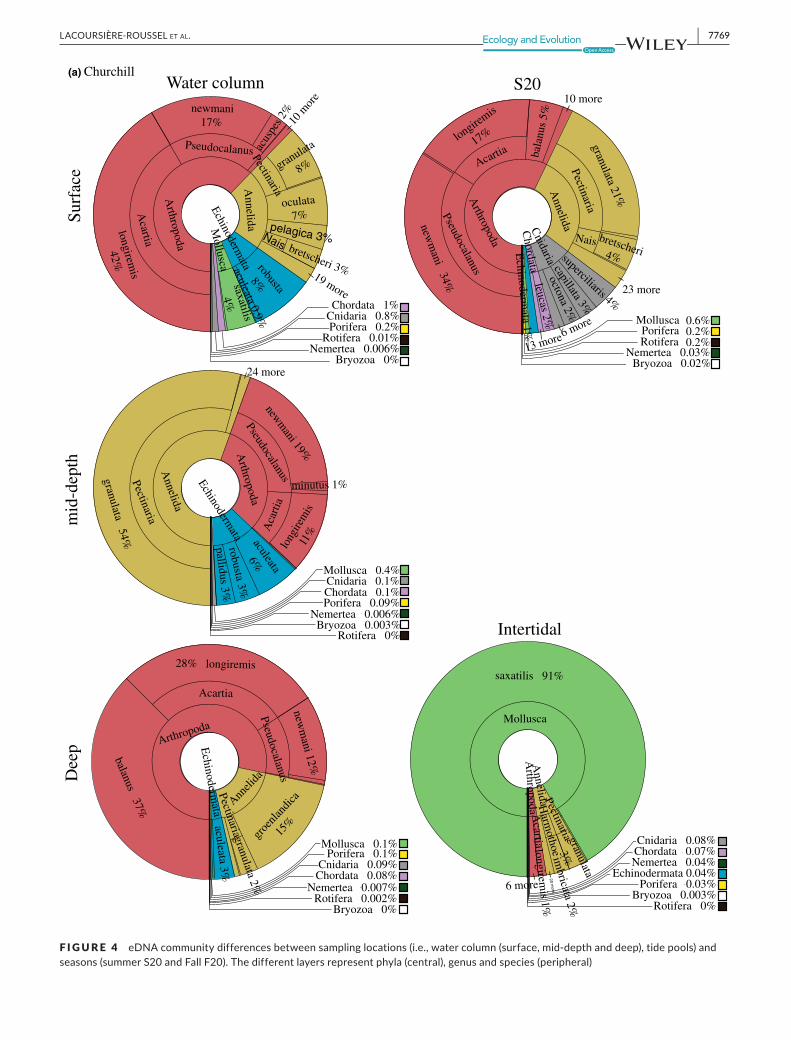
F IGURE 4 eDNAcommunitydifferencesbetweensamplinglocations(i.e.,watercolumn(surface,mid-depthanddeep),tidepools)andseasons(summerS20andFallF20).Thedifferentlayersrepresentphyla(central),genusandspecies(peripheral)
Arthropoda
Acartia
longiremis
42%
Pseudocalanus
newmani 17%
acus
pes 2
%
10 m
ore
Annelida
Pectinaria
granulata
8%
oculata
7% pelagica 3% Nais bretscheri 3% 19 more
Echinodermata robusta
8%
aculeata 0.9%
Mollusca
saxatilis
4%
Surf
ace
Chordata 1%Cnidaria 0.8%Porifera 0.2%
Rotifera 0.01%Nemertea 0.006%
Bryozoa 0%
Annelida
Pectinaria
granulata 54%
24 more
Arthropoda
Pseudocalanus
newm
ani 19%
minutus 1%
Aca
rtia
long
irem
is
1
1%
Echinodermata aculeata
6%
robusta 3%
pallidus 3%
mid
-dep
th
Arthropoda
balanus 37%
Acartia
28% longiremis
Pseudocalanusnew
mani 12%
Anneli
dagr
oenla
ndica
1
5%
Pectinariagranulata 2%
Echinoderm
ataaculeata 3%
Dee
p
Arthropoda
Pseudocalanus
newm
ani 34%
Acartialongire
mis
17%
bala
nus
5% 10 more
Annelida
Pectinariagranulata 21%
Nais bretscheri 4%
23 more
Cnidaria superciliaris 4%
capillata 3%
octona 2%
6 more
Chordata
leucas 2%
13 more
Echinoderm
ata 1% 0.2%
0.6% 0.2%
Water column S20
Mollusca
saxatilis 91%
Annelida Pectinaria granulata
3%
Harm
othoeim
bricata 2%
20 more
Arthropoda A
cartialongiremis 1%
6 more
Intertidal
(a) Churchill
Mollusca Porifera Rotifera
Nemertea 0.03%Bryozoa 0.02%
Mollusca 0.4%Cnidaria 0.1%Chordata 0.1%Porifera 0.09%
Nemertea 0.006%Bryozoa 0.003%
Rotifera 0%
Mollusca 0.1%Porifera 0.1%
Cnidaria 0.09%Chordata 0.08%
Nemertea 0.007%Rotifera 0.002%
Bryozoa 0%
Cnidaria 0.08%Chordata 0.07%Nemertea 0.04%
Echinodermata 0.04%Porifera 0.03%
Bryozoa 0.003%Rotifera 0%
7770 | LACOURSIÈRE- ROUSSEL Et AL.
columnandtidepoolsamples(averaging25.40and30.27speciesin tide pools and water column samples, respectively; p = 0.42; Figure5).Incontrast,inIqaluit,despitethesimilarnumberofreadsin the tide pool andwater column samples (averaging 1,061 and1,716readsintidepoolsandwatercolumnsamples,respectively;p = 0.50), species richnesswas significantly greater in tide poolsthaninthewatercolumn(averaging18.33and13.92speciesintidepool andwater column samples, respectively;p = 0.02;Figure5).InIqaluit,thetidepoolshadestimatedSørensonsimilarityindicesof 0.65, 0.64, 0.62with the surface,mid-depth and deepwater,respectively,whereasinChurchill,thetidepoolshadslightlyhigherestimatesof0.67, 0.84, and0.68 for the surface,mid-depth anddeepwater,respectively.
The community structure differed significantly among thewaterdepths,buttheproportionofexplainedvariancewasgreaterfor Churchill than Iqaluit (Figure3, Churchill: R2=0.13, p < 0.001;
Iqaluit:R2=0.08, p = 0.04), The CrustaceanBalanus balanus dom-inated thedeepwaterofbothports (cumulative contributions forChurchill=80.0%mid-depthvs.deepwaterand67.1%surfacevs.deepwater; Iqaluit=62.3%mid-depth vs. deepwater and 65.5%surfacevs.deepwater)andNemerteawasfoundonlyinmid-depthin Iqaluit (Figure5). In Iqaluit, theShannon index,species richnessand number of reads did not differ significantly among the depthlayers (ANOVA shannon: p = 0.1; species richness: p = 0.3; readsabundance: p = 0.1). In contrast, in Churchill, the Shannon indexdiffered significantly among the depth layers (p ≤ 0.001). Higherspecies richnesswas foundat the surface (p = 0.02),whichgener-allycorrespondedtowheretherearemorefreshwaterinputsfromtheChurchillRiver (Figure6).Speciesdetectedonlyatthesurfaceincluded 52.4% and 19.0% freshwater and brackish species, re-spectively. Themid-depth similarity indexwas the highest amongallwaterdepthcomparisons (SørensenandJaccardnonparametric
Annelida
Harm
othoe
imbricata 47%
cincinnatus 21%
groenlandica 3%
11 more
Arth
ropo
da longiremis 11%
Pseud
o-ca
lanus
acus
pes
10%
Gam
marus
Chordata
saida 3%
crinicaudatus
2%
Arthropoda
Pseudocalanus
acuspes 48%
moultoni 5%
min
utus
1%
longiremis 9%
Gammaru
s crinica
udatus 1
%
Annelida
cincinnatus 17%
Nemert
ea
linearis 13%
Mollusca
tenuis 2%
Cchordata
saida 2%
Arthropoda
balanus 48%
Pseudocalanus
newmani 23%
acuspes 18%
moultoni
Annelida cincinnatus 2%
Chordata
saida 2%
3%
Arthropodalongiremis
37%
Pseudo-calanus
acuspes 10%
litoralis 2%G
amm
arus 1%
Annelida
cirrata 36%
15 more
Mollusca saxatilis 4%
Chordata
saida 3%
groenlandicus 1%
Echinoderm
ata 2%
Annelida
inflatum 77%
praetermissa 5%
15 more
Arth-
ropod
a
Pseudo-
calan
us
acuspes 10%
moultoni 1%
Gam
marus
crinicaudatus
Chordata
saida 2%
Mollusca 1%
Arthropoda
Gam
marus
oceanicus 33%
longiremis 16% Pseudo-
calanus
acuspes 10%
rasc
hii 2
%
balan
oides
0.9%
Mollusca
saxatilis 23% C
nidarialisbethae
7%
annelida 2%
Nem
ertealinearis 2%
Chordata saida 1%
Surf
ace
mid
-dep
thD
eep
S20(b) Iqaluit Water column F20
Intertidal
Mollusca 0.8%Echinodermata 0.5%
Nemertea 0.01%
Porifera 0.007%Rotifera 0%
Cnidaria 0.007%Cnidaria 0.2%
Porifera 0%Rotifera 0%
Nemertea 0.07%Echinodermata 0.1%
Cnidaria 0.03%Porifera 0.02%Rotifera 0.01%
Nemertea 0.001%
Echinodermata 0.4%Porifera 0.05%Cnidaria 0.01%
Rotifera 0%
Echinodermata 0.8%Mollusca 0.6%Cnidaria 0.04%
Nemertea 0.006%Porifera 0.006%
Rotifera 0%
Echinodermata 0.6%Porifera 0%Rotifera 0%
F IGURE 4 . continued
| 7771LACOURSIÈRE- ROUSSEL Et AL.
estimates:1.0forIqaluitand0.92forChurchill),butnotsignificantlysorelativetothe Iqaluitsurface-deepandtheChurchill intertidal-mid,surface-mid,andsurface-deepcomparisons.
3.3 | Seasonal variation
Thecommunitystructurevariedsignificantlybetweenthesummerand fall sampling (Figure3, PERMANOVA; R2=0.30, p < 0.001);Arthropods dominated the summer samples, whereas Annelidsdominated in fall (Figure4)with a total of54.1% shared species.Speciesrichnesswasgreaterundericecoverthaninsummer(rich-ness: t = 2.3, p = 0.02; Shannon index: t=−2.6, p = 0.01), averag-ing 21 and 17 species in fall and summer samples, respectively(Figure5).
4 | DISCUSSION
Improved biodiversity monitoring programs are crucial for main-taining the integrity of coastalmarine ecosystems. Evaluating thepotentialofeDNAtoidentifyArcticspeciesandunderstandingthedynamics of eDNA distribution in coastal environments are bothtimely and important goals for improving biodiversity monitor-ing.Here,wepresentevidence thateDNAmaybeused toassessArcticbiodiversityandshowthat,despitethecoldandwell-mixed
F IGURE 6 RelationshipbetweenthespeciesrichnessdetectedusingeDNAmetabarcodingandthesalinityofthewatercollectedforthesurfacelayer(R2=0.85,black;circles:samplingwatercolumnandtriangles:S20)andmid-depthsamples(R2=0.44,graysquares)anddeepwater(graycross)
F IGURE 5 BoxplotscomparingShannonindices,speciesrichness,andreadabundancesdetectedusingeDNAmetabarcodingforeachsamplinglocation(i.e.,watercolumn(surface,mid-depthanddeep),tidepoolsandS20andFall20)inChurchillandIqaluit.Thelinesinsidetheboxesrepresentsthemedianvalues,thetopandbottomoftheboxesrepresentthe75%and25%quartilesandoutliersareshownusingemptycircles(i.e.,anydatabeyond1.5*IQR)
Surface Mid-depth Deep Intertidal
0.0
0.5
1.0
1.5
2.0
2.5
Shan
non
inde
x
2030
4050
60
Spec
ies
rich
ness
Fall20S20 Surface Mid-depth Deep Intertidal S20
Churchill Iqaluit
Water column Water column
Log
(R
eads
abu
ndan
ce)
0.0
0.5
1.0
1.5
2.0
2.5
510
1520
2530
1.0
2.0
3.0
4.0
2.5
3.0
3.5
4.0
4.5
10(a) (b)
7772 | LACOURSIÈRE- ROUSSEL Et AL.
environment,standardizedeDNAapproachestobiodiversitymoni-toringwillneedtoconsiderlocalspatio-temporalvariation.
4.1 | Taxonomic assignment challenges
ThehighcongruencebetweenhistoricalArcticdataandeDNAsamples(74.0%)supportstheefficacyofaquaticeDNAmetabar-coding forevaluatingArctic coastalbiodiversityat the specieslevel.ThespeciesdetectedwitheDNAthatwerenotpreviouslyknownfromtheCanadianArctic(42speciesinChurchilland11speciesinIqaluit)maybenewspeciesrecords,unexpectedNISorArctic species thatarenotyet represented in thesequencereference databases that instead matched a closely relatednon-Arcticspeciessequence.About3,894–4,674(4,284±390)macro- and megabenthic species are estimated to inhabit theArcticshelfregions(Piepenburgetal.,2011).However,Goldsmitetal.(2014)showedthatapproximately15%ofthetaxaidenti-fiedinArcticportswereconsiderednewrecordswithinthere-gionssurveyedandapproximately8%withinthemoreextensiveadjacentsurroundingregions.Piepenburgetal.(2011)suggestedthatfurthertraditionalsamplinginthecoastalArcticwouldin-creasethenumberofMollusca,ArthropodaandEchinodermataspeciesby26–52%,indicatingthatbetweenaboutafifthandathirdoftheexpectedMollusca-Arthropoda-Echinodermataspe-ciespool is still unknown.Given theseestimatedbiases in thehistoricaldata,itisthereforenotsurprisingthatthecongruencebetweenspeciesdetectedbymetabarcodingandhistoricaldataisnot100%.
A major shortcoming of metabarcoding is the incompletestate of reference sequence databases. Despite considerablebarcodingefforts,referencesequencesarestillverylimitedforcoastal benthic species, especially for remote regions such astheArctic.Resultsshowedthat~50%ofknownArcticspeciesare actually present in sequence databases and that a similarproportion of the eDNA sequenceswere assigned to species,indicatingthatreferencedatabaseomissionsarelimitingeDNAmetabarcodingsurveysatthistimeandthatCOIsequencingef-fortscanrapidlyimproveArcticbiomonitoring.AsshownbythelowproportionofOTUsidentifiedatthespecieslevel,PoriferaandRotiferawere less likely tobedetectedthanothergroupssuch as Annelida (Figure2). The use of eDNA metabarcodingmay thusbecomeapowerful approach to guide referenceda-tabase improvement (e.g.,97%RotiferaOTUswerenot identi-fiedatthespecieslevel).Moreover,groupssuchasBryozoans,NemerteansandRotiferaarecurrentlynot includedinthehis-torical Arctic Canada species records that we compiled, butthey are important to coastal ecosystems and could be goodindicators of biodiversity shifts caused by ice cover changes.TheeDNAmetabarcodingmethodmight thusbe a goodprac-ticalapproachtoevaluatethecommunitychangesofsuchspe-cies groups, evenwhen poorly identified at the species level.The better our knowledge of local species richness, potentialinvaders,andtheircorrespondinggeneticinformation,themore
accurate our eDNA biodiversity monitoring methods will be-come.However,evenwhennotassignedtospecies,theeDNAsequencesdetectedhereprovideasequencereferencebaselinethatcanbeusedtoevaluatefuturespeciesloss,newinvasions,orotherchangesincommunitystructure.
Oncea taxonhasbeen firmly identifiedby taxonomicexpertsanditsbarcodesequencehasbeendepositedinGenBankorBOLD,eDNAmighteventuallyreducetheneedfor largeteamsofexperttaxonomists to carry out routine biodiversitymonitoring. Yet, theroutineapplicationofmetabarcodingforArcticmonitoringrequiresovercoming various limitations. For example, here the eDNAme-tabarcoding identified Acartia tonsa, a potential invader that hasbeenpreviously recorded in theecoregionsofportsconnectedtoChurchill (Chan etal., 2012). However, the current available COIsequences forAcartia tonsa form several distinct clades, some ofwhichclusterwithAcartia hudsonica,raisingthepossibilitythattheeDNAsequencesassignedtoA. tonsaactuallybelongtothenativeA. hudsonica.Thus,taxonomicexpertiseremainscrucialforreducingbiasesofspeciesdistributionsrelatedtoincreasinguseoflarge-scaleeDNAmetabarcoding.
UsingtwoCOIprimerpairs,weincreasedthelevelofgeneticpolymorphism recorded at the species level, thereby increasingtheresolutionofthemethodforbiodiversitymonitoring(Deagle,Jarman, Coissac, Pompanon, & Taberlet, 2014). In addition toincreasing the number of species detected, combining multipleprimersmayalsoreducebiasofeDNAdominanceamongspeciesgroups(e.g.,dominanceshiftbetweenArthropodaandAnnelida;Figure2).DespitethefactthattheamplificationofCOI isoftendesirable to differentiate species using DNA barcoding proce-dures(Cheetal.,2012),thedegreeofuniversalityforCOIprimersis relatively low and so combiningmultiple COI primer pairs aswedidenabledmonitoringagreaterproportionofthediversity.Further studiesare,however,needed toevaluatehowthecom-binationoftheprimersetsmaydepictlocalspeciesdiversity.Ontheotherhand,targetinggeneswithlowertaxonomicspecificity(e.g., 18S) could improve the detection of biodiversity shifts athigher levels (e.g.,phyla level; seeBiketal.,2012;Deagleetal.,2014;Elbrecht&Leese,2015).
Characterization of biodiversity with metabarcoding is bi-ased at the amplification step (seeDeiner etal., 2017; Freeland,2017; Kelly etal., 2017 and Pawluczyk etal., 2015). Evaluatingthe primer bias of eDNA metabarcoding among primer pairs iscurrentlylimitedduetotheunknownnatureofeDNAandactualtechnologyusedtocharacterizeeDNA.Ourselectedprimerpairswerepreviouslytestedon104zooplanktonspeciesandvalidatedon mock metazoan communities collected in Canadian ports byZhang(2017).However,eventheseinsitumockcommunitiesarenotrepresentativeofthecomplexmixtureofeDNAinrealbiolog-ical samples, as theyconsistedofpurifiedDNAadded inequim-olar concentrations.Thus, future researchevaluating theeffectsofprimerbias isneeded.Nevertheless, the results fromourcur-rent comparisons show that there are important differences ineDNAcommunitycompositionacrossspaceand time insamples
| 7773LACOURSIÈRE- ROUSSEL Et AL.
collected using the same sampling and sequencingmethod. Thelargenumberofspeciesdetectedinthisstudydoesallowfores-tablishing a baseline for detecting species from their eDNA andmeasuringArcticcommunitystructurechanges.Thecurrent lackofknowledgeonprimerbiasdoeslimitcomparisonsofspecieslistsandcommunitystructurebetweenstudiesusingdifferentprimersetsandgeneticloci,however.
4.2 | Spatio- temporal eDNA variation
Our results clearly show that metazoan eDNA distribution inArcticcoastalenvironmentshassignificanttemporalandspatialvariation. The transport of eDNA may be substantially highercompared to southern regions due to the limited degradationfromcoldwaterandthelimitedUVexposureduringmuchoftheyear.AlthougheDNA isexpected tobehighlydispersed incoldenvironments, results here show clear horizontal and verticaleDNAheterogeneity in theArctic. Theobservedheterogeneityof eDNAwithin and between samples suggests that, based onthesummerandfallsamplerarefactioncurves,collectingatleast15samplesacrossasmanysitesaspossible isoptimal forcom-prehensive estimates of biodiversity variation (see SupportingInformationFigureS1);animportantmetricfordetectingeffectsofclimateandshippingtrafficchange.Abetterunderstandingofthespatio-temporalvariationineDNAduetolocalbioticandabi-oticconditionswillbeimportantinstandardizingcomparisonsofeDNAsamplesacrossspatialandtemporalgradientsintheArcticmarineenvironment.
Vertical eDNAdistribution in thewater columnmayvary as afunctionof the life cycleof species, transport and settling advec-tion(Turner,Uy,&Everhart,2015)andcomplexhydrodynamicpro-cesses.InadditiontowaveactiononeDNAmixing(O’Donnelletal.,2017;Portetal.,2016),ourdatasupporttheideathatinestuarineconditions, such as in Churchill, the freshwater flowing from theriveroverlongdistancesmaycontributetoincreasingthediversityinthesurfacewaterlayer(e.g.,Deiner&Altermatt,2014;Janeetal.,2015).CommunitychangesrelatedtoeDNAcompositionthusneedtointegrateinformationontemporalvariationinriverdischarge.ThevariabilityintheeDNAcapturezoneshouldthereforecombinecom-plex interactions between community changes and hydrodynamicmodels.
ThedominanceofMolluscareadsintidepoolsisconsistentwiththeobservedspeciescompositioninthesehabitats(e.g.,Goldsmit,2016).However,ourresultssupportthehypothesisthattidesmaymodifydifferencesineDNAcompositionbetweenthewatercolumnandtidepools.Atthelocalscale,theeDNAdistributionvariedbe-tweenhabitatsatbothports(i.e.,watercolumnandtidepools),butthis patternwasmoredistinct inChurchill. The large tidal area inIqaluit increases thewater admixturebetween tidepools and theopenocean(11.72mmaximumtideinIqaluitand4.93minChurchill(Tide-forecast2017)),whichmayexplaintherelatively lowercom-munitydifferentiationbetweentidepoolandwatercolumnsitesinIqaluitcomparedtoChurchill.
CoastalbiodiversitymonitoringintheArcticusingtraditionalsampling approaches is generally limited to summer. In contrasttotraditionalsurveys,thequalityofeDNAsurveysmightactuallyimproveundertheicecoverduetothelimitedUVexposureandcoldwatertemperature,hencepromotingeDNApreservationanddetection(Barnesetal.,2014).Ontheotherhand,coldtempera-tures areexpected to reduce themetabolismof species andas-sociated eDNA release/detection (Lacoursière-Roussel, Rosabal,etal.,2016).Here,eDNAmetabarcodingofwatercollectedunderice cover detected greater species richness than summer watercollections.ThisisparticularlyrelevantbecausetheuseofeDNAcould expand the timewindow to survey coastal biodiversity inthe Arctic. The observed species dominance changes betweenboth seasonsmayalso reflect lifehistory (e.g., lateAnnelida re-production; P. Archambault unpublished data). Here our surveyis limited to two sampling periods, and thus further studies areneededtodifferentiaterelativeeffectsofspeciesandeDNAecol-ogiesbetweenseasons(Hulbert,1984).
4.3 | Arctic conservation biology
As contributions of sequences from identified specimens in-creasetodatabasessuchasBOLD,sotoowilltheabilitytotrackbiodiversitychangesovertimeatthespecieslevelwithpowerfulmethods such as eDNAmetabarcoding (Gibson etal., 2014; Ji,Ashton,&Pedley,2013;Taylor&Harris,2012).IntheArctic,thedevelopment of cost-effectivemonitoringmethods is essentialforbetterprotectingtheintegrityofimportantnaturalenviron-mentsandendangeredspeciesandtoensuresustainablesubsist-enceharvestingbyaboriginalpeople,aswellasrecreationalandcommercial harvest by non-Aboriginals. Applying eDNA meta-barcodingtoassessbiodiversityinremotecoastalregionsoffersseveral advantages toward increasing the speed and accuracywithwhichwe can amass biodiversity data. As part of this re-searchproject, localcommunitymembersandpermanentlysta-tioned northern research staffwere trained in eDNA samplingtechniqueswith the goal of enabling a network of community-basedmonitoring.Inthiscontext,weoptimizedeDNAstrategiesforremoteregions.Wefirstusedasyringemethodforfilteringsamples(Deiner&Altermatt,2014),whichallowsforsamplingatmultiplesitessimultaneouslyandlimitscross-contaminationbe-tweensamplesaseachsamplecanbeprocessedwithindepend-entequipment.Moreover,thesimplicityofthisapproachallowsinexperienced collaborators to collectmore eDNA samples perunit of time relative to standard practices of using an electricpump.Second,asstoringandshippingfrozensamplesinremoteregions is risky and often not possible, we used methods thatallowed for DNA preservation at room temperature (Renshaw,Olds,Jerde,McVeigh,&Lodge,2014).Lastly,thecost-effectiveextractionmethodincreasestheabilitytoprocesslargenumberofsamples.
By overcoming methodological issues and improving knowl-edge about the ecology of eDNA in coastal area, this project
7774 | LACOURSIÈRE- ROUSSEL Et AL.
createstheopportunityforfuturemonitoringofmetazoancoastaldiversityinhighlyvulnerableecosystemssuchasArcticcommer-cialports.Thecombinedbenefitsofbeingable to identify largenumbersofspeciesincludinglocalspeciesandpotentialinvaders,assess a large number of phyla, the local habitat variability andtogetherwith the effectiveness of the eDNAmethod under icecover,are likely tomakeeDNAmetabarcodinganefficientcom-plementaryapproachtodetectlarge-scaleArcticcoastalbiodiver-sitychanges.AstheeDNAmethodprogresses,theuseofeDNAislikelytoexpandandbecomeacatalystforincreasedresearchoncoastalbiodiversity,ecosystemservices,andsustainability,partic-ularlyinremoteregionsoftheworldsuchastheCanadianArctic.However, spatio-temporal dimensions need to be considered instandardizingandoptimizing theassessmentofmarinebiodiver-sityusingeDNA.
ACKNOWLEDG MENTS
This project was funded by ArcticNet, POLAR knowledge,Nunavut Wildlife Management Board and the Fisheries andOceans Canada Aquatic Invasive SpeciesMonitoring Program.LogisticsupportwasprovidedbytheChurchillNorthernStudiesCenter and Fisheries and Oceans Canada Inuvik area office.WethankMelaniaCristescuandGuangZhangfortheirhelp inchoosingprimersandFredericChainandYiyuanLi forsugges-tions about the development of the Barque analysis pipelineanddata interpretation,CathrynAbbott forsharingspecimenstotest invitroprimers,RobYoungforsharingsequencesfromArcticspeciesandJérômeLarocheforhishelpwiththebioinfor-maticsanalyses.WearegratefultoBrianBoyle,MaëlleSevellec,CharlesBabin,EricParent,JésicaGoldsmit,RobYoung,NathalieSimard,FarrahChanandGuillaumeCôtéfortheirsupportinvar-iousareasofthiswork.Wealsothankthefollowingindividualsfor field assistance, participating in training and assistingwithcoordinationoffieldlogistics:ValérieCypihot,FrédéricHartog,Christopher W. Mckindsey, LeeAnn Fishback, Daniel Gibson,DickHunter, AustinMacPherson, Kimberly Thomson,HeatherClark,ColinGallagher,ZoyaMartin,ChrisLewis,JeremiahYoung,Richard Moore, Thomas Whittle, Rory McDonald, FredericLemire, Levi tikivik, Fred Lemire, ConnerMcCormack and stu-dentsfromtheNunavutArcticcollege.Wearealsograteful totheManagingEditorKarenChambers,theSubjectEditorAurélieBoninandthreeanonymousrefereesfortheirconstructivecom-mentsonapreviousversionofthemanuscript.
CONFLIC T OF INTERE S T
Nonedeclared.
AUTHOR CONTRIBUTIONS
Anaïs Lacoursière-Roussel is a conservationecologist evaluatinganthropogenicimpactsonthedynamicofaquaticcommunities.All
authorsofthismanuscriptareinteresteddevelopingandcalibrat-ingtheeDNAmethodintheapplicationofaquaticspeciesdistri-bution to improve the efficiency of conservation planning.ALR,LB,KH,PA,EG,andDLconceivedtheidea,ALR,LB,KH,KD,PA,andENstructuredandeditedthemanuscript,KHandALRdevel-opedthestudydesignandparticipatedinfieldcollections.KHandPAarespecializedintheArcticcoastalsurveillance,CH,ALR,KD,andNLdevelopedlaboratorymethodologyandENdevelopedtheanalysispipeline.
DATA ACCE SSIBILIT Y
Raw sequences reads were deposited in NCBI’s Sequence ReadArchive (SRA, http://www.ncbi.nlm.nih.gov/sra) under BioprojectPRJNA388333.
ORCID
Anaïs Lacoursière-Roussel http://orcid.org/0000-0002-9345-5682
R E FE R E N C E S
ACIA(2004).Impacts of a warming Arctic: Arctic climate impact assessment (146pp).Cambridge,UK:CambridgeUniversityPress.
Anderson,M.J.(2001).Anewmethodfornon-parametricmultivariateanalysisofvariance.Austral Ecology,26,32–46.
Andrews,S.(2010).FastQC: A quality control tool for high throughput se-quence data.BabrahamBioinformatics.Retrieved fromwww.bioin-formatics.babraham.ac.uk/projects/fastqc
Archambault, P., Snelgrove, P. V. R., Fisher, J. A. D., Gagnon, J.-M.,Garbary, D. J., Harvey, M., … Poulin, M. (2010). From sea to sea:Canada’sthreeoceansofbiodiversity.PLoS ONE,5,e12182.https://doi.org/10.1371/journal.pone.0012182
Arctic Council (2009). Arctic marine shipping assessment 2009 report Tromso.Akureykri:PAME,194pages
Barnes,M.A.,&Turner,C.R.(2016).TheecologyofenvironmentalDNAandimplicationsforconservationgenetics.Conservation Genetics,17,1–17.https://doi.org/10.1007/s10592-015-0775-4
Barnes, M. A., Turner, C. R., Jerde, C. L., Renshaw, M. A., LindsayChadderton,W.,&Lodge,D.M. (2014).Environmentalconditionsinfluence eDNA persistence in aquatic systems. Environmental Science and Technology, 48, 1819–1827. https://doi.org/10.1021/es404734p
Bik, H. M., Porazinska, D. L., Creer, S., Caporaso, J. G., Knight, R., &Thomas,W.K. (2012).Sequencingourwaytowardsunderstandingglobal eukaryotic biodiversity. Trends in Ecology and Evolution, 27,233–243.https://doi.org/10.1016/j.tree.2011.11.010
Bolger,A.M., Lohse,M.,&Usadel, B. (2014). Trimmomatic:A flexibletrimmerfor illuminasequencedata.Bioinformatics,30,2114–2120.https://doi.org/10.1093/bioinformatics/btu170
Chain,F. J. J.,Brown,E.A.,MacIsaac,H. J.,&Cristescu,M.E. (2016).Metabarcoding reveals strong spatial structure and temporalturnover of zooplankton communities among marine and fresh-water ports. Diversity and Distributions, 22, 493–504. https://doi.org/10.1111/ddi.12427
Chan,F.T.,Bailey,S.A.,Wiley,C.J.,&MacIsaac,H.J. (2013).Relativerisk assessment for ballast-mediated invasions at Canadian Arcticports. Biological Invasions, 15, 295–308. https://doi.org/10.1007/s10530-012-0284-z
| 7775LACOURSIÈRE- ROUSSEL Et AL.
Chan, F. T., Bronnenhuber, J. E., Bradie, J. N., Howland, K. L., Simard,N., Bailey, S. A., & Department of Fisheries and Oceans, Ottawa,ON(Canada); Canadian Science Advisory Secretariat, Ottawa, ON(Canada). (2012). Risk assessment for ship-mediated introductions of aquatic nonindigenous species to the canadian arctic. Canadian science advisory secretariat.ResearchDocument2011/105.Ottawa,ON:DFO.
Chan,F.T.,MacIsaac,H.J.,&Bailey,S.A.(2015).Relativeimportanceofvesselhullfoulingandballastwaterastransportvectorsofnonindig-enousspeciestotheCanadianArctic.Journal canadien des sciences halieutiques et aquatiques,72, 1230–1242.https://doi.org/10.1139/cjfas-2014-0473
Chao,A.,Ma,K.H.,Hsieh,T.C.,&Chiu,C.-H.(2016).SpadeR: Species-richness prediction and diversity estimation with R.Rpackageversion0.1.1. Retrieved from https://cran.r-project.org/web/packages/SpadeR
Che, J., Chen, H.-M., Yang, J.-X., Jin, J.-Q., Jiang, K., Yuan, Z.-Y., …Zhang, Y.-P. (2012). Universal COI primers forDNA barcoding am-phibians. Molecular Ecology Resources, 12, 247–258. https://doi.org/10.1111/j.1755-0998.2011.03090.x
Cheung,W.W.L.,Lam,V.W.Y.,Sarmiento,J.L.,Kearney,K.,Watson,R.,&Pauly,D.(2009).Projectingglobalmarinebiodiversityimpactsunder climate change scenarios. Fish and Fisheries, 10, 235–251.https://doi.org/10.1111/j.1467-2979.2008.00315.x
Cusson,M.,Archambault, P.,&Aitken,A. (2007).Biodiversity of ben-thicassemblagesontheArcticcontinentalshelf:HistoricaldatafromCanada.Marine Ecology Progress Series, 331, 291–304. https://doi.org/10.3354/meps331291
Deagle, B. E., Jarman, S. N., Coissac, E., Pompanon, F., & Taberlet, P.(2014).DNAmetabarcodingandthecytochromecoxidasesubunitImarker:Notaperfectmatch.Biology Letters,10,20140562.https://doi.org/10.1098/rsbl.2014.0562
Deiner,K.,&Altermatt,F.(2014).Transportdistanceofinvertebrateen-vironmentalDNAinanaturalriver.PLoS ONE,9,e88786.https://doi.org/10.1371/journal.pone.0088786
Deiner, K., Bik, H.,Mächler, E., Seymour,M., Lacoursière-Roussel, A.,Altermatt,F.,…Bernatchez,L.(2017).EnvironmentalDNAmetabar-coding: Transforming how we survey animal and plant communi-ties. Molecular Ecology, 26, 5872–5895. https://doi.org/10.1111/mec.14350
Eguíluz,V.M.,Fernández-Gracia,J.,Irigoien,X.,&Duarte,C.M.(2016).AquantitativeassessmentofArcticshippingin2010–2014.Scientific Reports,6,30682.https://doi.org/10.1038/srep30682
Elbrecht, V., & Leese, F. (2015). Can DNA-based ecosystem assess-ments quantify species abundance? Testing primer bias and bio-mass—sequence relationships with an innovative metabarcodingprotocol.PLoS ONE,10,e0130324.https://doi.org/10.1371/journal.pone.0130324
Folmer,O.,Black,M.,Hoeh,W.,Lutz,R.,&Vrijenhoek,R.(1994).DNAprimers for amplification of mitochondrial cytochrome C oxidasesubunit I from diverse metazoan invertebrates. Molecular Marine Biology and Biotechnology,3,294–299.
Foote,A.D., Thomsen, P. F., Sveegaard, S.,Wahlberg,M.,Kielgast, J.,Kyhn, L. A.,…Gilbert, T. P. (2012). Investigating the potential useof environmental DNA (eDNA) for genetic monitoring of marinemammals. PLoS ONE, 7, e41781. https://doi.org/10.1371/journal.pone.0041781
Freeland,J.R.(2017).Theimportanceofmolecularmarkersandprimerdesignwhen characterizingbiodiversity fromenvironmentalDNA.Genome,60,358–374.https://doi.org/10.1139/gen-2016-0100
Gavrilchuk, K., & Lesage, V. (2014). Large-scale marine developmentprojects(mineral,oilandgas,infrastructure)proposedforCanada’sNorth. Canadian Technical Report of Fisheries and Aquatic Sciences,3069,viii-84.
Geller,J.B.,Meyer,C.P.,Parker,M.,&Hawk,H.(2013).RedesignofPCRprimersformitochondrialCytochromecoxidasesubunitIformarine
invertebrates.Molecular Ecology Resources,13,851–861.https://doi.org/10.1111/1755-0998.12138
Gibson, J., Shokralla, S., Porter, T. M., King, I., van Konynenburg, S.,Janzen, D. H., … Hajibabaei, M. (2014). Simultaneous assessmentofthemacrobiomeandmicrobiomeinabulksampleoftropicalar-thropodsthroughDNAmetasystematics.Proceedings of the National Academy of Sciences, 111, 8007–8012. https://doi.org/10.1073/pnas.1406468111
Goldsmit,J.(2016).Benthic non-indigenous species in ports of the Canadian Arctic: identification, biodiversity and relationship with global warming and shipping activity.ISMER-UniversitéduQuébecàRimouski.
Goldsmit, J.,Archambault,P.,Chust,G.,Villarino,E., Liu,G., Lukovich,J.V.,…Howland,K.L.(2018).Projectingpresentandfuturehabitatsuitabilityofship-mediatedaquaticinvasivespeciesintheCanadianArctic.Biological Invasions,20(2),501–517.
Goldsmit, J., Howland, K. L., & Archambault, P. (2014). Establishinga baseline for early detection of non-indigenous species in portsof the Canadian Arctic. Aquatic Invasions, 9, 327–342. https://doi.org/10.3391/ai
Gotelli, N. J., & Colwell, R. K. (2010). Estimating species richness. InBiological diversity: Frontiers in measurement and assessment(p.345).Oxford,UK:OxfordUniversityPress.
Grosholz,E.(2002).Ecologicalandevolutionaryconsequencesofcoastalinvasions. Trends in Ecology and Evolution, 17, 22–27. https://doi.org/10.1016/S0169-5347(01)02358-8
Guy,E.,&Lasserre,F. (2016).Commercial shipping in theArctic:Newperpectives,challengesandregulations.Polar Record,52,294–304.https://doi.org/10.1017/S0032247415001011
Hulbert, R. C. (1984). Paleoecology and population dynamics of theearlyMiocene(Hemingfordian)horseParahippus leonensisfromtheThomasFarmsite,Florida.Journal of Vertebrate Paleontology,4,547–558.https://doi.org/10.1080/02724634.1984.10012030
Jane,S.F.,Wilcox,T.M.,McKelvey,K.S.,Young,M.K.,Schwartz,M.K.,Lowe,W.H.,…Whiteley,A.R.(2015).Distance,flow,andPCRinhi-bition:eDNAdynamicsintwoheadwaterstreams.Molecular Ecology Resources,15,216–227.https://doi.org/10.1111/1755-0998.12285
Ji,Y.,Ashton,L.,&Pedley,S.M.(2013).Reliable,verifiableandefficientmonitoring of biodiversity via metabarcoding. Ecology Letters, 16,1245–1257.https://doi.org/10.1111/ele.12162
Kelly,R.P.,Closek,C. J.,O’Donnell, J. L.,Kralj, J.E., Shelton,A.O.,&Samhourri,J.F.(2017).Geneticandmanualsurveymethodsyielddif-ferentandcomplementaryviewsofanecosystem.Frontiers in Marine Science,3,1–11.
Lacoursière-Roussel, A., Côté,G., Leclerc, V.,&Bernatchez, L. (2016).Quantifying relative fish abundancewith eDNA: A promising toolforfisheriesmanagement.Journal of Applied Ecology,53,1148–1157.https://doi.org/10.1111/1365-2664.12598
Lacoursière-Roussel,A.,Dubois,Y.,&Bernatchez,L. (2016). ImprovingherpetologicalsurveysineasternNorthAmericausingtheenviron-mentalDNAmethod.Genome Special Edition,59,991–1007.
Lacoursière-Roussel, A., Rosabal, M., & Bernatchez, L. (2016).Estimating fish abundance and biomass from eDNA concentra-tions: Variability among capturemethods and environmental con-ditions. Molecular Ecology Resources, 16, 1401–1414. https://doi.org/10.1111/1755-0998.12522
Larigauderie, A., Prieur- Richard, A.-H., Mace, G. M., Lonsdale, M.,Mooney,H.A.,Brussaard,L.,…S.,T. (2012).Biodiversityandeco-system services science for a sustainableplanet: TheDIVERSITASvisionfor2012–20.Current Opinion in Environnemtal Sustainability,4,101–105.https://doi.org/10.1016/j.cosust.2012.01.007
Legendre,P.,&Legendre,L.(1998).Numericalecology.InDevelopments in environmental modelling(2nded.,20,pp.xv+853),NewYork,NY:Elsevier.
Leray,M., Yang, J. Y.,Meyer,C. P.,Mills, S.C.,Agudelo,N., Ranwez,V., … S., R. J. (2013). A new versatile primer set targeting a
7776 | LACOURSIÈRE- ROUSSEL Et AL.
short fragment of the mitochondrial COI region for metabar-coding metazoan diversity: Application for characterizing coralreef fish gut contents. Frontiers in Zoology, 10, e34. https://doi.org/10.1186/1742-9994-10-34
Lim,N.K.M.,Tay,Y.C.,Srivathsan,A.,Tan,J.W.T.,Kwik,J.T.B.,Baloğlu,B.,…S.,D.C.J.(2016).Next-generationfreshwaterbioassessment:eDNA metabarcoding with a conserved metazoan primer revealsspecies-richandreservoir-specificcommunities.Royal Society Open Science,3,160635.https://doi.org/10.1098/rsos.160635
Link,H.,Piepenburg,D.,&Archambault,P.(2013).AreHotspotsAlwaysHotspots? The relationship between diversity, resource and eco-system functions in the Arctic. PLoS ONE, 8, e74077. https://doi.org/10.1371/journal.pone.0074077
Lodge, D. M., Turner, C. R., Jerde, C. L., Barnes, M. A., Chadderton,L., Egan, S. P., … Pfrender,M. E. (2012). Conservation in a cup ofwater:Estimatingbiodiversityandpopulationabundance fromen-vironmental DNA. Molecular Ecology, 21, 2555–2558. https://doi.org/10.1111/j.1365-294X.2012.05600.x
López,E.,Olivier,F.,Grant,C.,&Archambault,P.(2016).AnewspeciesandfournewrecordsofsedentarypolychaetesfromtheCanadianHighArctic.Journal of the Marine Biological Association of the United Kingdom,97,1685–1694.
Magoč, T.,& Salzberg, S. L. (2011). FLASH: Fast length adjustment ofshort reads to improve genome assemblies. Bioinformatics, 27,2957–2963.
Mahé,F.,Rognes,T.,Quince,C.,DeVargas,C.,&Dunthorn,M.(2015).Swarmv2:Highlyscalableandhigh-resolutionampliconclustering.PeerJ,3,e1420.https://doi.org/10.7717/peerj.1420
Mahon,A.R., Jerde,C. L.,Galaska,M.,Bergner, J. L.,Chadderton,W.L.,Lodge,D.M.,…S.,L.G.(2013).ValidationofeDNAsurveillancesensitivity for detection of Asian carps in controlled and field ex-periments. PLoS ONE, 8, e58316. https://doi.org/10.1371/journal.pone.0058316
Miller, A.W., & Ruiz, G.M. (2014). Arctic shipping andmarine invad-ers. Nature Climate Change, 4, 413–416. https://doi.org/10.1038/nclimate2244
O’Donnell,J.L.,Kelly,R.P.,Shelton,A.O.,Samhouri,J.F.,Lowell,N.C.,&Williams,G.D.(2017).SpatialdistributionofenvironmentalDNAinanearshoremarinehabitat.PeerJ,5,e3044.https://doi.org/10.7717/peerj.3044
Olivier, F., San Martín, G., & Archambault, P. (2013). Revision ofStreptospinigeraKudenov,1983(Polychaeta,Syllidae,Anoplosyllinae)and description of a new species from the Arctic and the west-ern northern Atlantic. Polar Biology, 36, 1499–1507. https://doi.org/10.1007/s00300-013-1369-6
Parker,I.M.,Simberloff,D.,Lonsdale,W.M.,Goodell,K.,Wonham,M.,Kareiva, P. M., … Goldwasser, L. (1999). Impact: Toward a frame-workforunderstandingtheecologicaleffectsofinvaders.Biological Invasions,1,3–19.https://doi.org/10.1023/A:1010034312781
Pawluczyk,M.,Weiss,J.,Links,M.G.,Aranguren,M.E.,Wilkinson,M. D., & Egea-Cortines,M. (2015). Quantitative evaluation ofbias in PCR amplification and next-generation sequencing de-rived frommetabarcoding samples.Analytical and Bioanalytical Chemistry, 407, 1841–1848. https://doi.org/10.1007/s00216-014-8435-y
Piepenburg,D.,Archambault,P.,Ambrose,W.G.,Blanchard,A.L.,Bluhm,B. A., Carroll,M. L., …Włodarska-Kowalczuk,M. (2011). Towardsa pan-Arctic inventory of the species diversity of themacro- andmegabenthic faunaof theArcticshelfseas.Marine Biodiversity,41,51–70.https://doi.org/10.1007/s12526-010-0059-7
Pinheiro,J.,Bates,D.,DebRoy,S.,Sarkar,D.&RCoreTeam(2017).nlme: Linear and nonlinear mixed effects models.Rpackageversion3.1-131,Retrievedfromhttps://CRAN.R-project.org/package=nlme
Port, J. A., O’Donnell, J. L., Romero-Maraccini, O. C., Leary, P. R.,Litvin,S.Y.,Nickols,K.J.,…Kelly,R.P.(2016).Assessingvertebrate
biodiversity in a kelp forest ecosystemusing environmentalDNA.Molecular Ecology,25,527–541.https://doi.org/10.1111/mec.13481
Ratnasingham,S.,&Hebert, P.D.N. (2007). bold:Thebarcodeof lifedatasystem(http://www.barcodinglife.org).Molecular Ecology Notes,7,355–364.https://doi.org/10.1111/j.1471-8286.2007.01678.x
Renshaw,M.A.,Olds,B.P.,Jerde,C.L.,McVeigh,M.M.,&Lodge,D.M.(2014).Theroomtemperaturepreservationoffilteredenvironmen-talDNAsamplesandassimilationintoaphenol–chloroform–isoamylalcoholDNAextraction.Molecular Ecology Resources,15,168–176.
Rognes,T.,Flouri,T.,Nichols,B.,Quince,C.,&Mahé,F.(2016).VSEARCH:A versatile open source tool for metagenomics. PeerJ, 4, e2584.https://doi.org/10.7717/peerj.2584
Roy,R.,Iken,K.,&Archambault,P.(2015).Regionalvariabilityofmega-benthiccommunitystructureacrosstheCanadianArctic.Arctic,68,180–192.https://doi.org/10.14430/arctic4486
Sassoubre,L.M.,Yamahara,K.M.,Gardner,L.D.,Block,B.A.,&Boehm,A.B.(2016).QuantificationofEnvironmentalDNA(eDNA)sheddinganddecayratesforthreemarinefishenviron.Environmental Science and Technology, 50, 10456–10464. https://doi.org/10.1021/acs.est.6b03114
Shokralla, S., Porter, T. M., Gibson, J. F., Dobosz, R., Janzen, D. H.,Hallwachs, W., … Hajibabaei, M. (2015). Massively parallel multi-plexDNAsequencingforspecimen identificationusingan IlluminaMiSeqplatform.Scientific Reports,5,9687.https://doi.org/10.1038/srep09687
Smith, L. R., & Stephenson, S. R. (2013). New Trans-Arctic shippingroutesnavigablebymidcentury.Proceedings of the National Academy of Sciences,11,4871–4872.
Taberlet, P., Coissac, E., Hajibabaei, M., & Rieseberg, L. H. (2012).EnvironmentalDNA.Molecular Ecology,21,1789–1793.https://doi.org/10.1111/j.1365-294X.2012.05542.x
Taylor, H. R., & Harris, W. E. (2012). An emergent science on thebrink of irrelevance: A review of the past 8 years of DNA bar-coding. Molecular Ecology Resources, 12, 377–388. https://doi.org/10.1111/j.1755-0998.2012.03119.x
Thomsen,P.F.,Kielgast,J.,Iversen,L.L.,Møller,P.R.,Rasmussen,M.,&Willerslev,E.(2012).DetectionofadiversemarinefishfaunausingenvironmentalDNA fromseawater samples.PLoS ONE,7, e41732.https://doi.org/10.1371/journal.pone.0041732
Thomsen, P., Kielgast, J. O. S., Iversen, L. L., Wiuf, C., Rasmussen,M., Gilbert, M. T. P., … Willerslev, E.. (2012). Monitoringendangered freshwater biodiversity using environmen-tal DNA. Molecular Ecology, 21, 2565–2573. https://doi.org/10.1111/j.1365-294X.2011.05418.x
Thomsen,P.F.,&Willerslev,E.(2015).EnvironmentalDNA–Anemerg-ing tool in conservation formonitoring past and present biodiver-sity. Biological Conservation, 183, 4–18. https://doi.org/10.1016/j.biocon.2014.11.019
Tide-forecast(2017).Tide time & Tide charts for the world.Retrievedfromhttps://www.tide-forecast.com/locations.
Turner, C. R., Uy, L. K., & Everhart, R. C. (2015). Fish environmentalDNAismoreconcentratedinaquaticsedimentsthansurfacewater.Biological Conservation, 183, 93–102. https://doi.org/10.1016/j.biocon.2014.11.017
Wegleitner,B.J.,Jerde,C.L.,Tucker,A.,Chadderton,W.L.,&Mahon,A.R.(2015).Longduration,roomtemperaturepreservationoffilteredeDNAsamples.Conservation Genetics Resources,7,789–791.https://doi.org/10.1007/s12686-015-0483-x
Young,R.G.,Abbott,C.L.,Therriault,T.W.,&Adamowicz,S.J.(2016).Barcode-basedspeciesdelimitationinthemarinerealm:AtestusingHexanauplia (Multicrustacea: ThecostracaandCopepoda).Genome,60,169–182.
Zhang, G. K. (2017). Calibration of the multi-gene metabarcod-ing approach as an efficient and accurate biomonitoring tool. Master Thesis. McGill University, Québec (Qc) Canada. 90

| 7777LACOURSIÈRE- ROUSSEL Et AL.
p. Retrieved from http://digitool.library.mcgill.ca/webclient/StreamGate?folder_id=0&dvs=1523467293609~14
SUPPORTING INFORMATION
Additional supporting information may be found online in theSupportingInformationsectionattheendofthearticle.
How to cite this article:Lacoursière-RousselA,HowlandK,NormandeauE,etal.eDNAmetabarcodingasanewsurveillanceapproachforcoastalArcticbiodiversity.Ecol Evol. 2018;8:7763–7777. https://doi.org/10.1002/ece3.4213
Related Documents