EDMS QUICK REFERENCE GUIDE 1 EDMS Version 7: Quick Reference Guide Updated 30-January-2014 This EDMS guide is under construction. Press [ctrl] + [f] in Adobe Reader to search keywords, or option numbers. Keep checking back in case sections have more detailed information or information about new features! Contents Install EDMS ...................................................................................................................................................................... 3 Have EDMS Installed but don’t have a shortcut to it on your desktop? .......................................................................... 3 Haven’t logged into EDMS before, don’t have a login, or forgot your password? ........................................................... 3 EDMS Terminology............................................................................................................................................................ 3 General tips and recommendations configuring your EDMS ........................................................................................... 3 General tips using EDMS ................................................................................................................................................... 4 Future improvements to EDMS ........................................................................................................................................ 5 EDMS MAIN MENU OPTIONS START HERE ....................................................................................................................... 5 Documents .................................................................................................................................................................... 5 1. Reporting................................................................................................................................................................... 5 2. Data Browsing Screen ............................................................................................................................................... 5 Compliance tab ......................................................................................................................................................... 6 Other Tab: Quick Search ........................................................................................................................................... 6 Other Tab: Ratio Calculation (of two Factors) .......................................................................................................... 6 Other Tab: Delta Graph ............................................................................................................................................. 6 3. User Defined Searches Screen .................................................................................................................................. 7 4. Wind Rose ................................................................................................................................................................. 8 5. WaTERS: upload discharge data ............................................................................................................................... 8 6. Samples Data Entry ....................................................................................................................................................... 9 6.1 Zip backup of EDMS data file (edmsdata.mdb) ...................................................................................................... 9 6.2 Recent Samples Screen ........................................................................................................................................... 9 6.3 Import MS Excel Spreadsheet Screen / Import Utility and General EDMS Import File Format ............................. 9 6.4 Manual Data Entry Screen and Field Sheets Screen ............................................................................................. 10 Manual Data Entry Screen ...................................................................................................................................... 10 Field Sheets (accessed via Field Sheets button at the bottom of Manual Data Entry Screen) .............................. 11 6.5 Import Data Logger Files ....................................................................................................................................... 12 6.6 Convert Data Logger Files to MS Excel Spreadsheet ............................................................................................ 12 7. Maps............................................................................................................................................................................ 12

Welcome message from author
This document is posted to help you gain knowledge. Please leave a comment to let me know what you think about it! Share it to your friends and learn new things together.
Transcript

EDMS QUICK REFERENCE GUIDE
1
EDMS Version 7: Quick Reference Guide
Updated 30-January-2014
This EDMS guide is under construction. Press [ctrl] + [f] in Adobe Reader to search keywords, or option numbers.
Keep checking back in case sections have more detailed information or information about new features!
Contents Install EDMS ...................................................................................................................................................................... 3
Have EDMS Installed but don’t have a shortcut to it on your desktop? .......................................................................... 3
Haven’t logged into EDMS before, don’t have a login, or forgot your password? ........................................................... 3
EDMS Terminology ............................................................................................................................................................ 3
General tips and recommendations configuring your EDMS ........................................................................................... 3
General tips using EDMS ................................................................................................................................................... 4
Future improvements to EDMS ........................................................................................................................................ 5
EDMS MAIN MENU OPTIONS START HERE ....................................................................................................................... 5
Documents .................................................................................................................................................................... 5
1. Reporting ................................................................................................................................................................... 5
2. Data Browsing Screen ............................................................................................................................................... 5
Compliance tab ......................................................................................................................................................... 6
Other Tab: Quick Search ........................................................................................................................................... 6
Other Tab: Ratio Calculation (of two Factors) .......................................................................................................... 6
Other Tab: Delta Graph ............................................................................................................................................. 6
3. User Defined Searches Screen .................................................................................................................................. 7
4. Wind Rose ................................................................................................................................................................. 8
5. WaTERS: upload discharge data ............................................................................................................................... 8
6. Samples Data Entry ....................................................................................................................................................... 9
6.1 Zip backup of EDMS data file (edmsdata.mdb) ...................................................................................................... 9
6.2 Recent Samples Screen ........................................................................................................................................... 9
6.3 Import MS Excel Spreadsheet Screen / Import Utility and General EDMS Import File Format ............................. 9
6.4 Manual Data Entry Screen and Field Sheets Screen ............................................................................................. 10
Manual Data Entry Screen ...................................................................................................................................... 10
Field Sheets (accessed via Field Sheets button at the bottom of Manual Data Entry Screen) .............................. 11
6.5 Import Data Logger Files ....................................................................................................................................... 12
6.6 Convert Data Logger Files to MS Excel Spreadsheet ............................................................................................ 12
7. Maps ............................................................................................................................................................................ 12

EDMS QUICK REFERENCE GUIDE
2
8. Configuration .............................................................................................................................................................. 12
8.1 EDMS Hierarchy Configuration ............................................................................................................................. 12
8.2 Sites Configuration ................................................................................................................................................ 13
8.3 Sub-Groups Configuration .................................................................................................................................... 13
8.4 Factors Configuration ............................................................................................................................................ 14
8.5 Sampling Schedule Configuration Screen (called Schedules) and Scheduler (Main Menu) ................................. 14
8.5.1 Sampling Schedule Configuration Screen ...................................................................................................... 14
8.5.2 Scheduler (on Main Menu) ............................................................................................................................ 15
8.6 Compliance Standards for Sample Readings ........................................................................................................ 17
8.7 Maps and Site Placement...................................................................................................................................... 17
8.8 Security ................................................................................................................................................................. 18
8.8.1 Users Configuration ....................................................................................................................................... 18
8.8.2 Change My Password ..................................................................................................................................... 18
8.9 Setup ..................................................................................................................................................................... 18
8.9.1 EDMS Shortcuts .............................................................................................................................................. 18
8.9.2 Attach to different EDMS Data File ................................................................................................................ 18
8.10 Unique Identifier options .................................................................................................................................... 18
8.11 Miscellaneous Configuration Settings................................................................................................................. 19
8.11.1 IMPORT LOGS DIRECTORY (MS Excel Imports) ............................................................................................ 19
8.11.2 MS EXCEL IMPORT AUTO SITES CREATION .................................................................................................. 19
8.11.3 IGNORE MANUAL DATA ENTRY LIMITS DETECTION .................................................................................... 19
8.11.4 DOCUMENTS DIRECTORY ............................................................................................................................. 19
8.11.5 GUEST DOCUMENTS DIRECTORY ................................................................................................................. 19
8.12 SWL Configuration and Help ............................................................................................................................... 19
10. Version History .......................................................................................................................................................... 20
11. EDMS Internet Upgrades .......................................................................................................................................... 20
12. Support ..................................................................................................................................................................... 20

EDMS QUICK REFERENCE GUIDE
3
Install EDMS If you don’t have EDMS installed on your computer, feel free and contact support. The way EDMS is installed
has changed as of January 2014. Support will get more instructions together on this soon.
Have EDMS Installed but don’t have a shortcut to it on your desktop? Having a program shortcut to EDMS on your desktop will help you get into EDMS faster.
Please refer 8.9.2.
Haven’t logged into EDMS before, don’t have a login, or forgot your password? Login as username administrator and password administrator, and create your own EDMS login or reset your
password, so any data you enter into EDMS is saved against your name. Refer 8.8.1.
EDMS Terminology Factors: general purpose name EDMS uses for analytes, or textual information like comments. Refer 8.4
(Factors Configuration Screen).
Sites: monitoring points. E.g. a data logger, a grab sample location, a bore hole, a human, or anything else
you can think of. Refer 8.2 (Sites Configuration Screen).
Activities / Areas: the two level hierarchy (each activity can have one or more areas) you may organise your
sites into, to make navigating your EDMS more user friendly. The combination of Activities, Areas, and sites
is also known as the EDMS Hierarchy. Refer 8.1 (EDMS Hierarchy Configuration Screen).
Sub-groups: although these may be utilised in EDMS, it is not recommended you use them, and may be
phased out in later versions of EDMS. E.g. Instead of implementing noise distances as subgroups of say 050m
(50 metres) and 100m (100 metres), it is suggested you create site with codes of <Site Code>_050m and
<Site Code>_100m, as this makes graphing and general usage more intuitive. Refer 8.3 (Sub Group
Configuration Screen).
Other Document Terminology:
RHS: right-hand-side
Lab: the laboratory you send your grab samples off to
General tips and recommendations configuring your EDMS If your EDMS is new, there is no need to create Activities and Areas yet. Just get all your data into EDMS,
then “move” data around later, via 6.4 (Data Entry tab step 3), and 8.1 (EDMS Hierarchy Configuration
Screen; choose site then MOVE option on RHS section of screen). You can also rename Sites, Activities, and
Areas, and Factors easily at a later stage.
Easiest way to get data into your EDMS is via 6.3 (Import Utility), before setting anything else up! Do not add
in new factors, new Sites etc. until you try out this screen.
When configuring Sites that have different depths or distances that measurements are taken at, create a
new site for each depth/distance. E.g. Create site names/codes as Noise001_000m, Noise001_050m,
Noise001_100m, do denote noise samples taken at 0, 50, and 100 metres distance.
A site may belong to more than one Activity and Area, but it is recommended you restrict a site to just one,
to make data entry easier, and 6.3 Import Utility should “guess” Activity and Area for you.
IMPORTANT: capture field and lab data as different factors. E.g. have separate factors for field pH (field),
and pH (lab).

EDMS QUICK REFERENCE GUIDE
4 Make sure that sample date/times for data from your lab and the field are the same so that data “matches
up” in EDMS; in essence combining lab and field data into one “sample”. E.g. if we take a grab sample on 7th
January 2014 at 9am, we should send date/time off with the sample to the lab. When we import results back
from lab, it should match up with any field data we have entered into EDMS, i.e. all lab and field data should
be against date/time of 7-Jan-2014 9:00am.
Want to check data has been entered each month, or need visual colour-coded reminders? Refer 8.5
Scheduler.
When using Scheduler, select factors like Work Order Number, pH (Lab), pH (Field) in 8.5.1, to ensure data
has been entered from the lab and field, if applicable.
Ways to coordinate entry of your lab and field data could be:
1. Key in lab data when you get back from the field via 6.4, importing lab results via 6.3 at a later date.
2. Key data into a spreadsheet (possibly out in the field) to import later via 6.3, and import lab results
via 6.3 before or after importing field data.
3. Import data from lab then manually key field data in via 8.5.2.
In any case, use Scheduler to ensure both lab and field data have been entered, at a glance.
To manage where you are up to importing you lab data, create a Lab folder with Inbox and Processed
folders inside, and up in the EDMS folder up on your network. Copy data files that come in from your Lab via
e-mail into the Inbox. After importing each file from the Inbox folder, move them into the “Processed” folder
to keep track of what has been imported. Refer 6.3 Import Utility.
If you have data from a weather station, contact support to setup data logger template(s) for you, via 6.5.
General tips using EDMS Once EDMS is initially configured for your operation, you will only need to use a small set of Main Menu options
most of the time:
• 2 and 3 for data analysis. 4 for Wind Rose.
• 5 for waste water discharges, if you are an Australian Queensland Coal Mine. Be warned, overlapping date
ranges will like cause issues on this screen.
• 6.3 for importing all data from your lab, and 6.4 for manually keying data. 6.4 option can be superseded if
you enter data into a Microsoft Excel spreadsheet instead then import using option 6.3; also refer this
section for General EDMS Import File Format.
Pivot tables and graphs produced from 2, 3, 4 are output to MS Excel and contain a sheet preceding the output
named <Date/Time>_RawData, which contains the source data used to produce it.
Press [Esc] key to undo changes to field(s) you have entered data into.
Press [Ctrl] + [f] on some screens to perform a find, or find and replace.
Be aware that you can usually resize screens to your taste by left-click dragging corners of the screen. This can
help to enlarge screens and display more information.
Many screens have hints, help and tips. Look in the top right corner of screens for a message (in green) to see if
may [F1] key for a pop-up hint, or click on the link to pop-up some help (this help will be updated at a later date).
You may also hold your mouse-pointer over buttons and other screen “features” to get handy pop-up tips.
You can double-click in date fields to bring up a calendar.
You can double-click in many text fields to bring up a zoom window that you can resize. These fields are usually
indicated with thick lines around them.

EDMS QUICK REFERENCE GUIDE
5
Future improvements to EDMS EDMS evolves with ideas. If you have any ideas of features that you and others may find useful, please drop us
an e-mail and we’ll add it to this list and endeavor to implement it sometime in the near future.
Features to implement (roughly in order):
• Ratio Graphs. Divide one factor into the other. Done. 2 (Data Browsing Screen): Other Tab.
• Difference of readings over time. Create an output that is the difference between factor readings between
dates (maybe monthly, or next closest date), so we can see the difference over time. E.g. useful for seeing
the difference between standing water levels over time. Done. 2 (Data Browsing Screen): Other Tab - Delta
Graph. (Colour coding not done)
• General improvements to maps. Selecting more than one site automatically selects them all in data browsing
screen. Other minor features to maps. Done.
• Allow attaching files and photos to sites. This could be useful to show where (physical location) the
monitoring is occurring. Could also be used to show photos of rehabilitated sites over time.
• Reports (option 1 on Main Menu). Automate generation of reports so anybody can quickly get reports in MS
Excel with useful graphs and information, in a couple button clicks. At this stage, reports will encompass
what can be produced on Data Browsing Screen and User Defines Searches screen.
• New EDMS website: this is under construction.
EDMS MAIN MENU OPTIONS START HERE What follows is the current structure of the EDMS Main Menu, with all options available, i.e. logged in with
administrator security permission.
Double-click on any option in the Main Menu to access the feature.
Documents
Display a folder structure through “Documents” section on EDMS Main Menu, from a folder/location on your
network. This folder structure should point to your EDMS related procedures and data. You can enter comments
through EDMS by clicking on related documents, to give other users more information. Turn this feature on, via
8.11 (Main Menu Documents Area). It is recommended the folder be located in the EDMS folder where your
data (edmsdata.mdb) is located.
1. Reporting
Yet to be implemented. List of graphs/data, setup by your site, to generate ad-hoc/monthly reports. This will be
a more automated way to produce reports, to produce the same reports as options 2, 3, and 4.
2. Data Browsing Screen
Generate ad-hoc Compliance, Graph, and data Views. Simply follow the 4 steps up top of the screen. Use
Filters tab to select a date range, or particular factors to output. Note all Compliance Standards on
Compliance tab (refer 8.6) are utilised for related factors in Compliance and Graph outputs.
This screen is accessible anytime, even when 3 (User Defined Searches) is open, via Data Browsing button in
top left of EDMS.
IMPORTANT: Select ‘date/time’ from Dates list to view every piece of sample data, otherwise data and
comments will be combined into daily or monthly maximums as default. Some users say that data is missing
from EDMS, but it’s because they are using the ‘daily’ or ‘monthly’ option, which combines data; not showing
every piece of data that has been entered.
Choose monthly do “condense” reports by only reporting, for example, the maximums for each month, on
your graphs and reports.

EDMS QUICK REFERENCE GUIDE
6 Compliance tab
When producing reports from the Compliance tab, you may notice a No Standards Apply in the Compliance
Standard column. Data for particular factors are displayed in these rows to warn you they are in the data-set
you have selected, but haven’t been checked against any compliance standards. This is because the factors
do not exist in any of the compliance standards you have selected. If this data doesn’t need to be reported,
just delete these rows out of the spreadsheet, or tick Exclude Factors without Standards before producing
the report so they are not output at all.
Tick All Standards (default), to compare your data with any compliance standard where the factor appears.
Tick <<None>> (do not use), if you want to produce a report in this format, but ignore any compliance
standards listed.
Other Tab: Quick Search
Quick Searches are created from 3 (User Defined Searches), but can be selected here to fill in Sites, Factors,
and/or date range on the Filter tab. Just select one from the list to make the selections on this screen; yours
are sorted to top of list.
Go into User Defined Searches screen and create Quick Searches for common data browsing requirements.
Other Tab: Ratio Calculation (of two Factors)
To calculate say Sulphate/Chloride ratio:
1) Select relevant Sites. Select these two factors and a date range (if applicable) from the Filter tab.
Alternatively, setup a Quick Search via 3 User Defined Searches, and select it from the Quick Search
list above.
2) Tick Calculate Ratio. Swap the calculation around by clicking the swap button.
Whilst the Calculate Ratio is ticked, you can now Graph and View this ratio and related factors. Also whilst
ticked, the ratio calculation is used as the basis for the Delta Graph below.
Other Tab: Delta Graph
Referred to as a Delta Graph in EDMS, this feature
creates a clustered bar chart of sites, allowing you
to compare changes to a factor, or a ratio of two
factors, over time. This metric could be used as a
risk or performance indicator.
Useful for factors like Standing Water Level (SWL),
EC, pH, Sulphate, or Sulphate/Chloride ratios. Or
anything else you can think of.
Currently, only monthly maximums are used in calculations. If you need other types, please contact
support.
To use this feature:
1) Select relevant Sites. Tick Calculate Ratio (refer above), otherwise select one factor from the Filter tab.
Alternatively, setup a Quick Search via 3 User Defined Searches, and select it from the Quick Search list
(refer above).
2) Use the Filter tab if you need a date filter. Enter a “from date” one month prior to the required results;
these readings are used to calculate the first real month of change, using the previous months
maximum. E.g. If you need to calculate say 2013, use 1-Dec-2012 to 31-Dec-2013. If you need to
calculate December 2013, select 1-Nov-2013 to 31-Dec-2013. Date from/to filter(s) are optional.
3) Click Delta Graph to graph results.

EDMS QUICK REFERENCE GUIDE
7 Calculated results will remain in Graph and Views features, and named <factor name> [EDMS Calc] until you
restart EDMS or click Clear Results, but only if the results are not a Ratio Calculation (above).
Note, if there are months of data missing for one or more sites, results can be skewed. E.g. if Standing Water
Levels haven’t been measured for a few months for some sites, we won’t know how realistically the water
levels have changed month to month, and compared to sites that have. This is where ticking View results
used to create graph can help you play detective and see where data is missing.
To also assist you in further determining how accurate your graph might be, the datasheet used to produce
it has a column named Number of Months of Sampling. This reflects how many months of data was used to
produce each sites bar. Generally, the higher this number the better. You could filter out sites that don’t
have much data by clicking in this column and filtering out data using standard MS Excel filtering as per
illustration below.
3. User Defined Searches Screen
Contains similar, but more features than 2 (Data Browsing Screen); except for the Other tab which now
contains a Ratio Calculation and Delta Graph feature not available on this screen.
Set up Quick Searches that allow you to save lists of Sites and Factors you commonly select to produce
common reports. Note these Quick Searches can be used in 2 (Data Browsing Screen).
To conduct a search, go to the Quick Searches tab if you have them, or just Select Sites (tab) you’re
interested in, then click big blue Search button. This will return a set of data to work with, and you will
presented with additional tabs to analyse it. Note, you can use the Select Sites, and Select Factors to narrow
down your data set further, e.g. limits outputs to more specific sites, or maybe just one or two factors. Click
New Search if you want to work with a different set of data.
When a search has completed (i.e. after clicking the Search button), clicking Save Over or Save as New from
the Quick Searches tab will save any selected Sites and/or Factors to that Quick Search, if any are selected.
This is so you can refine your quick search further. In previous versions of EDMS, only the set of the original
Sites of Factors there were selected before the Search button was clicked, were saved.

EDMS QUICK REFERENCE GUIDE
8 The top left of the corner of this screen will display in blue bolding, how many Sites and how many Factors
are currently selected for inclusion in any features you are about to undertake on this screen.
You can use this screen if working on larger sets of data is slow in 2 (Data Browsing screen).
Click in top right corner of screen to get more hints on selecting Sites etc.
Note: you can have open 2 (Data Browsing Screen) whilst this screen is open by clicking Data Browsing
button in top left corner of EDMS.
Refer 2 (Data Browsing Screen), as what is mentioned about the Compliance, Graph, and View tabs also
applies here.
4. Wind Rose
If you capture Wind Direction and Wind Speed, use this screen to output a chart in Microsoft Excel to
analyse impacts of dust, by following the steps on-screen. This graph shows how many readings where
recorded at each wind speed threshold, in each direction. Calm Threshold readings are ignored from results.
Wind Rose example in Excel 2013, with one click used to change the Design:
5. WaTERS: upload discharge data
This is required for all Australian Queensland (QLD) coal mining operations, unless you have been informed
otherwise.
This screen facilitates reporting data to QLD Government. It also keeps track of what has been sent and what
files have been uploaded (you will need to indicate this status) successfully via the internet. Once setup, it’s
easy to use.
Please refer this screen, and the Setup tab, for more information. Screen 8.6 is crucial in setting up this
feature in EDMS, by ticking the WaTERS Approved box for relevant Compliance Standards on this screen.
Before you can produce outputs, you will need to logon to the WaTERS website
https://waters.ehp.qld.gov.au and download a template for your operation, if you do not already have one.
You will know whether you have a template as this file will appear when you try to Generate an output. The
template is used as the basis for you to output data from your EDMS, so you can upload it back to WaTERS.
Please contact WaTERS for training.
WARNING: Do not overlap dates on this screen. This can result in “duplicate” data that may cause problems
later down the track. You may notice this when uploading data to WaTERS; you will be warned there are
duplicates and will not be able to upload the file to WaTERS.

EDMS QUICK REFERENCE GUIDE
9
6. Samples Data Entry
6.1 Zip backup of EDMS data file (edmsdata.mdb)
Double-click to zip up (compress) and save a copy of the current state of your entire EDMS (edmsdata.mdb)
to the Backups folder. This is useful when e-mailing your data to support, or to create a milestone when
entering data into EDMS.
You will notice the ‘Zip Backup’ created, will be named with the current date and in yyyy-mm-dd_24hour
time format, which facilitates sorting the latest backups to the bottom in Windows Explorer view. E.g.
You can revert to an earlier version of your EDMS by unzipping a file from the Backups folder, and
overwriting your existing edmsdata.mdb. Do this with caution! It is recommended you create a ‘Zip backup’
before doing so, to save the current state of your EDMS.
6.2 Recent Samples Screen
This screen serves as both a history of data entered into EDMS, and a means to Delete (or roll-back) data
that has been manually keyed in incorrectly, or imported incorrectly, e.g. data imported against incorrect
sites or factors, or new factors and sites added.
You can also view what new data was added during the import by clicking Samples, Sites, or Factors buttons.
Modify the date range up the top of the screen to filer the date range for when the data was created (via
manual data entry), or imported in EDMS. This date range should not to be confused with actual sample
dates.
Be careful when deleting data, as this is permanent, unless data is re-imported, or your edmsdata.mdb is
recovered from a network backup, or zip backup (refer 6.1.)
6.3 Import MS Excel Spreadsheet Screen / Import Utility and General EDMS Import File Format
Where possible, get data from lab in ALS (called DERM EDD), SGS (called EDMSv7 EDD), or MGT-LabMark
(called EDMSv7 EDD) formats. These have been developed specifically for EDMS. Please contact support if
you have any problems communicating EDD requirements to your Lab.
Otherwise import data from Microsoft Excel. Sheets must contain column names Site, Date (containing date
-- and time if captured), in row 1. Remaining columns should be the names of data that is captured, eg.
Electrical Conductivity @ 25°C µS/cm, Aluminium mg/kg, WorkOrder, Comment etc. Column names may
appear in any order, e.g. Date column may be entered in column A, or any other column. Actual data should
begin in row 2. Example of this General EDMS Import File Format:
EDMS QUICK REFERENCE GUIDE
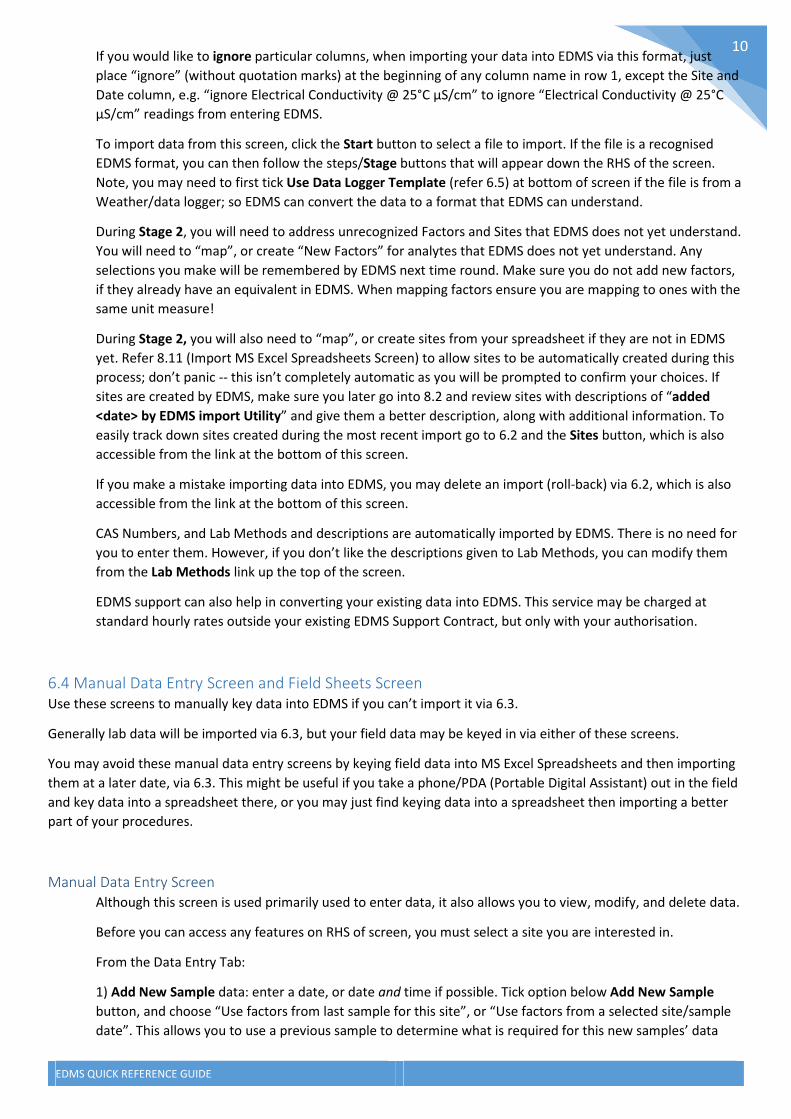
10 If you would like to ignore particular columns, when importing your data into EDMS via this format, just
place “ignore” (without quotation marks) at the beginning of any column name in row 1, except the Site and
Date column, e.g. “ignore Electrical Conductivity @ 25°C µS/cm” to ignore “Electrical Conductivity @ 25°C
µS/cm” readings from entering EDMS.
To import data from this screen, click the Start button to select a file to import. If the file is a recognised
EDMS format, you can then follow the steps/Stage buttons that will appear down the RHS of the screen.
Note, you may need to first tick Use Data Logger Template (refer 6.5) at bottom of screen if the file is from a
Weather/data logger; so EDMS can convert the data to a format that EDMS can understand.
During Stage 2, you will need to address unrecognized Factors and Sites that EDMS does not yet understand.
You will need to “map”, or create “New Factors” for analytes that EDMS does not yet understand. Any
selections you make will be remembered by EDMS next time round. Make sure you do not add new factors,
if they already have an equivalent in EDMS. When mapping factors ensure you are mapping to ones with the
same unit measure!
During Stage 2, you will also need to “map”, or create sites from your spreadsheet if they are not in EDMS
yet. Refer 8.11 (Import MS Excel Spreadsheets Screen) to allow sites to be automatically created during this
process; don’t panic -- this isn’t completely automatic as you will be prompted to confirm your choices. If
sites are created by EDMS, make sure you later go into 8.2 and review sites with descriptions of “added
<date> by EDMS import Utility” and give them a better description, along with additional information. To
easily track down sites created during the most recent import go to 6.2 and the Sites button, which is also
accessible from the link at the bottom of this screen.
If you make a mistake importing data into EDMS, you may delete an import (roll-back) via 6.2, which is also
accessible from the link at the bottom of this screen.
CAS Numbers, and Lab Methods and descriptions are automatically imported by EDMS. There is no need for
you to enter them. However, if you don’t like the descriptions given to Lab Methods, you can modify them
from the Lab Methods link up the top of the screen.
EDMS support can also help in converting your existing data into EDMS. This service may be charged at
standard hourly rates outside your existing EDMS Support Contract, but only with your authorisation.
6.4 Manual Data Entry Screen and Field Sheets Screen
Use these screens to manually key data into EDMS if you can’t import it via 6.3.
Generally lab data will be imported via 6.3, but your field data may be keyed in via either of these screens.
You may avoid these manual data entry screens by keying field data into MS Excel Spreadsheets and then importing
them at a later date, via 6.3. This might be useful if you take a phone/PDA (Portable Digital Assistant) out in the field
and key data into a spreadsheet there, or you may just find keying data into a spreadsheet then importing a better
part of your procedures.
Manual Data Entry Screen
Although this screen is used primarily used to enter data, it also allows you to view, modify, and delete data.
Before you can access any features on RHS of screen, you must select a site you are interested in.
From the Data Entry Tab:
1) Add New Sample data: enter a date, or date and time if possible. Tick option below Add New Sample
button, and choose “Use factors from last sample for this site”, or “Use factors from a selected site/sample
date”. This allows you to use a previous sample to determine what is required for this new samples’ data

EDMS QUICK REFERENCE GUIDE
11 entry. Alternatively, use the Factors tab to enter data entry requirements for any new samples for the
remainder of this EDMS session.
2) Add New Descriptive Data: not used by many operations, but this feature allows you to add static
information to a site that is not time series, such as borehole lithology or anything else you care to think of,
using text factors you create from 8.4 (Add New Factor). Alternatively, users place this kind of information in
the comments field of 8.2 (Site Configuration Screen).
3) Move this Site and data. You can change the way your EDMS is organised any time. Use this feature to
completely move a site and all its data to a new Activity, Area, and/or Site Code. E.g. you may have
accidently created two site codes that are the same physical location Site001 and Sites01, and want to
combine them into one site code. In this case, select site Site01 and Move it to Site001. Site01 will also
default to being removed permanently from EDMS after the process is completed. Be careful and do a 6.1
(Zip backup) before making major changes to how EDMS is organised, in case you makes mistakes and need
to revert to an earlier version of your EDMS.
In Edit Mode, double-click on list 1 (Descriptive Data), or list 2 (Time Series data) to open and view or modify
data for the site. Select Delete Mode, and an entry from list 1 or 2, to delete associated data.
“Show All data for this Site” is a performance optimisation, intended to speed up this screen if there are
masses of sample data. If you notice this screen is slow to navigate from site to site, tick off this option to
speed it up. If you do turn this feature off, lists 1 (Descriptive data) and 2 (Time Series data) will not be
populated.
Data Entry Screen. This screen will pop-up if you Add New Sample, or double-click on an existing entry in
lists 1 (Descriptive data) or 2 (Time Series data). On this screen you can change the Sample Date if it was
entered incorrectly. Type over existing readings, or into blank fields, then click Save to do so. Click Cancel to
undo any changes since this pop-up screen was opened. Click Show new data entry fields on this screen to
reveal fields that are missing and require data entry; these will appear in yellow.
Field Sheets (accessed via Field Sheets button at the bottom of Manual Data Entry Screen)
This screen is useful for a number of purposes but may be used primarily for entering Unique Identifiers
(8.10) and readings from the field.
One could enter data manually through the Manual Data Entry Screen, but using this screen bypasses the
need to enter factors into the EDMS Hierarchy (NOTE: This is no longer required as of EDMS Version 7). It
may also be quicker when entering multiple samples.
Upon entering this screen, there will be 5 rows at the top of the screen with the 'New' status. These rows
allow you to enter new samples against them. You should enter the UID you have on a sample bottle in the
Unique Identifier column, or double-click in the Unique Identifier box if you would like EDMS to assign one.
Up the top of the screen, you must select the factors you would like each column to represent in EDMS. In
the example above, comments may be entered in the "Comment Factor" column and would be saved into
the "Comments" factor. Sample readings for turbidity and acidity could be entered into the two columns
following that. You may change these columns whenever you like, i.e. turbidity could become pH. You can
enter a comment and up to eight sample readings for each sample row on this screen.
Once happy with the data you have entered against a row, click the 'Add / View' button to commit the values
of the new sample to EDMS. The status of the row should turn from 'New' to something like 'Added by John
Smith: date/time', if the data can be successfully committed to EDMS. Note: no data is committed to EDMS
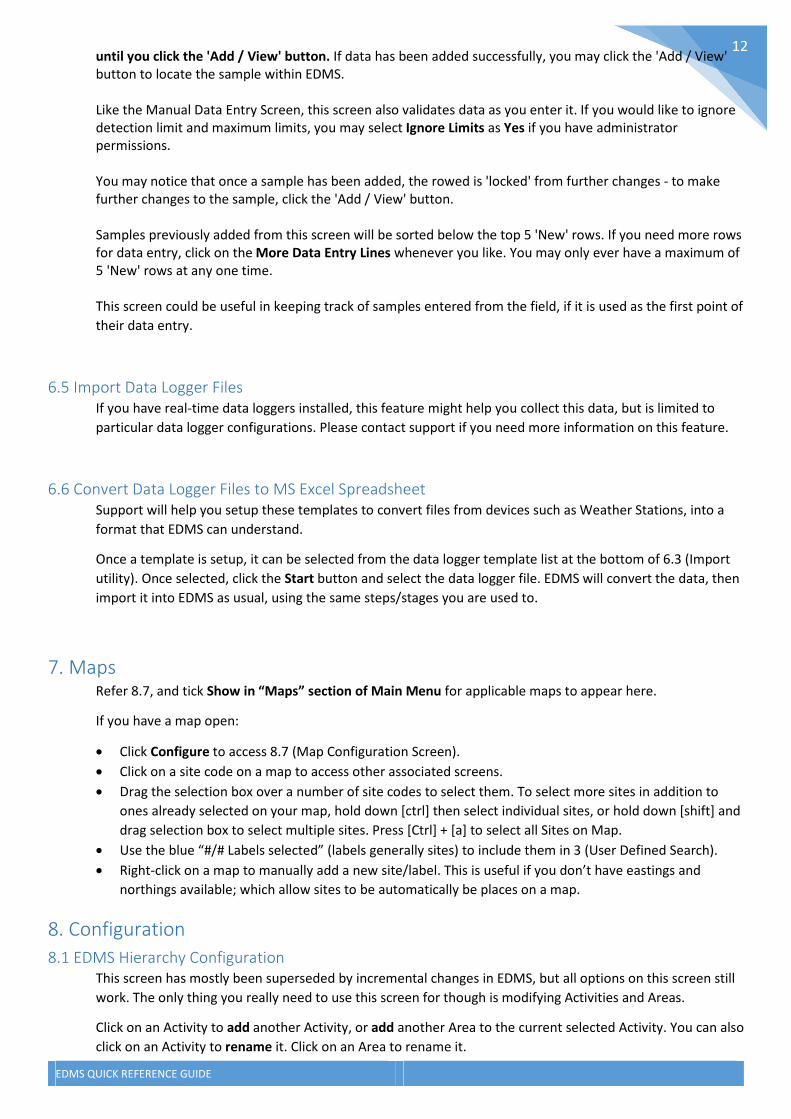
EDMS QUICK REFERENCE GUIDE
12 until you click the 'Add / View' button. If data has been added successfully, you may click the 'Add / View'
button to locate the sample within EDMS.
Like the Manual Data Entry Screen, this screen also validates data as you enter it. If you would like to ignore
detection limit and maximum limits, you may select Ignore Limits as Yes if you have administrator
permissions.
You may notice that once a sample has been added, the rowed is 'locked' from further changes - to make
further changes to the sample, click the 'Add / View' button.
Samples previously added from this screen will be sorted below the top 5 'New' rows. If you need more rows
for data entry, click on the More Data Entry Lines whenever you like. You may only ever have a maximum of
5 'New' rows at any one time.
This screen could be useful in keeping track of samples entered from the field, if it is used as the first point of
their data entry.
6.5 Import Data Logger Files
If you have real-time data loggers installed, this feature might help you collect this data, but is limited to
particular data logger configurations. Please contact support if you need more information on this feature.
6.6 Convert Data Logger Files to MS Excel Spreadsheet
Support will help you setup these templates to convert files from devices such as Weather Stations, into a
format that EDMS can understand.
Once a template is setup, it can be selected from the data logger template list at the bottom of 6.3 (Import
utility). Once selected, click the Start button and select the data logger file. EDMS will convert the data, then
import it into EDMS as usual, using the same steps/stages you are used to.
7. Maps Refer 8.7, and tick Show in “Maps” section of Main Menu for applicable maps to appear here.
If you have a map open:
• Click Configure to access 8.7 (Map Configuration Screen).
• Click on a site code on a map to access other associated screens.
• Drag the selection box over a number of site codes to select them. To select more sites in addition to
ones already selected on your map, hold down [ctrl] then select individual sites, or hold down [shift] and
drag selection box to select multiple sites. Press [Ctrl] + [a] to select all Sites on Map.
• Use the blue “#/# Labels selected” (labels generally sites) to include them in 3 (User Defined Search).
• Right-click on a map to manually add a new site/label. This is useful if you don’t have eastings and
northings available; which allow sites to be automatically be places on a map.
8. Configuration
8.1 EDMS Hierarchy Configuration
This screen has mostly been superseded by incremental changes in EDMS, but all options on this screen still
work. The only thing you really need to use this screen for though is modifying Activities and Areas.
Click on an Activity to add another Activity, or add another Area to the current selected Activity. You can also
click on an Activity to rename it. Click on an Area to rename it.
EDMS QUICK REFERENCE GUIDE
13 Although you only need one Activity and Area in EDMS, you can add more to organise your data into a more
user friendly EDMS Hierarchy, making it easier for you and others to understand and navigate. But this is
purely optional, and can be done later. You may just opt for user friendly sites codes to give better meaning
to your EDMS.
If you used to use this screen a lot, this is why you don’t need to any more:
• Sites are automatically added in to the EDMS Hierarchy if you do so from 8.2 (Sites Configuration
Screen), or from the 6.3 (Import Utility; refer 8.11 (Auto Sites Creation) to turn this feature on).
• You may Move existing Sites to other Activities and Areas or different Sites. This can be achieved by
clicking on the relevant site then click Options at this node over on the RHS of the screen. But this can
now be achieved, and is recommended via 6.4 (Manual Data Entry Screen; Data Entry tab step 3). This
way also gives you a good chance to look at data etc. you are moving.
• There is no need to add factors into this screen for manual data entry, as 6.4 Manual Data Entry Screen
offers new features to achieve this. E.g. use tick box and “Use factors from…” list (Data Entry tab,
section 1), which looks at what has previously been entered into EDMS to determine what factors
require data entry. Failing this, you can use the Factors tab (on 6.4) to add new or additional factors for
manual data entry.
If you to decide to make changes to the EDMS Hierarchy, refer 6.1 (Zip backup), so you may revert to an
earlier version if you make mistakes.
8.2 Sites Configuration
A Site is a monitoring point. E.g. a data logger, a grab sample location, a bore hole, a human, or anything else
you can think of.
You can have as many sites in EDMS as you want. A site code/name may be up to 30 characters in length.
Feel free and rename a site by typing over the top of the one you want to change.
Categories and Types are general purpose fields you may use to classify a Site. You can have as many as you
want, and name them as you like. They can help to easily find and filter group(s) of Sites from the User
Defined Searches. This is very handy if you have dozens or hundreds of Sites and need to select groups of
them at a time for analysis.
Ensure you enter a good Site Description so you can easily search for relevant sites on other screens.
Refer 8.12 regarding Borehole Casing and automatic calculation of Standing Water Levels.
To modify several Sites at a time, use [ctrl] + [f] to find and replace. Be warned, perform a Zip Backup (take
seconds) from Samples Data Entry Menu before making bulk changes in case you make a mistake that you
cannot undo.
Add New Site to add in a new monitoring point, or use 6.3 Import Utility to do this for you.
8.3 Sub-Groups Configuration
As mentioned in the EDMS Terminology section of this document, this feature may be superseded in a later
version of EDMS.
This is a further level than may be defined in the EDMS Hierarchy (refer 8.1), after sites. This would also
require a Sub-group column in the General EDMS Import File Format discussed in 6.3 (Import Utility).
EDMS QUICK REFERENCE GUIDE
14 8.4 Factors Configuration
Factors are a general purpose name EDMS uses for analytes, or textual information like comments, but can
be any number or piece of text (up to 255 characters) you can think of.
IMPORTANT: capture field and lab data as different factors. E.g. have separate factors for field pH (field),
and pH (lab).
It is recommended you allow EDMS to add factors into your EDMS via 6.3 (Import Utility) and data files from
your lab. This will save you a lot of work when you are setting up a new EDMS as it will save you having to
key all of them in!
You can have as many factors in EDMS as you want. A factor name may be up to 100 characters in length.
Feel free and rename a factor by typing over the top of the one you want to change.
You can add in a minimum and/or maximum if you want to prevent values outside particular from being
imported (6.3) or keyed in (6.4). You can enforce these limits via 8.11 (Ignore Manual Data Entry Limits
Detection Yes/No).
Copy and paste these special symbols into this screen if you would like to use them in unit measures: µ ° ² ³
8.5 Sampling Schedule Configuration Screen (called Schedules) and Scheduler (Main Menu)
8.5.1 Sampling Schedule Configuration Screen
NOTE: You may also access this screen in the blue section on the RHS of the EDMS Main Menu, by clicking on
“8.5 Scheduler”. Scheduler, refers to the calendar view the blue section on the Main Menu. More
information in this section below.
Apart from reminding you of what should be monitored for say ground water, “Schedules” can be used to
remind you of any other things you dare to think up, like a calibration schedule to remind you when site
equipment requires calibration.
E.g. create a factor called “Calibrated by”, entered into a schedule with relevant sites and dates they should
be calibrated. When calibration is completed for each site, enter a sample data into EDMS against this factor
and site, like ‘Calibrated by <Name> of <Company Name>’, otherwise it will be flagged in Scheduler as not
started.
Click New link up top of screen to create a new schedule… give it a try now – it’s easy. Delete schedules you
no longer want, or just click Inactive, to hide them.
Create as many Groups named whatever you like, by clicking on the Groups link. These are optional, but you
can assign one or more groups to one or more schedules, then select this group from the schedules list in 8.5
on Main Menu, to display results of any related schedules. Note, Groups appear on Main Menu in [square
brackets].
Use a period of daily, weekly, monthly or dates selection to determine how often each site, or site and
factor(s), should have data entered against it:
1. Daily are represented daily. Schedules of this period will be slower to calculate.
2. Weekly are represented on the first Sunday of each week.
3. Monthly are represented on the first day of each month.
4. Dates selection are specific locked in dates, represented on the dates selected, and in the Dates
section of this screen; where you can choose as many dates as you like. Click Select Dates to do so.
Use frequency to denote how many times each site, or site and factor, should have data entered against it,
for each period. E.g. if you decide something should be measured twice per month, enter 2 here. This
defaults to “1”; once each period.

EDMS QUICK REFERENCE GUIDE
15 Use a brief description if there are particulars days, etc. data entry should occur to guide other users, and
enter general Comments / Instructions to further guide them.
Sites selection is mandatory. Click Select Sites to do so.
Factors selection is optional. By not selecting any, you are in effect saying that so long as any, one or more
factors have readings against them, for the selected sites, the schedule is complete. Selecting one or more
factors makes them mandatory data entry for each site selected. Tick “Only sampled Factors”, before
clicking on the Select Factors button, if you only want to see factors that have actual sample data entered
against the selected sites.
“Date Applies from” and “Date Applies to” are optional. You can use none, either, or both dates to
determine what sample dates are affected by this schedule. You could use the “Date Applies from” as a sign-
off, in effect saying data up to this date is checked and approved so the schedule has no bearing on previous
dates. Only put in a Date Applies to if you want the schedule to finish on a particular date, but if the
schedule is on-going you should leave this blank.
: To copy Sites and/or Factors from another schedule to the currently selected
schedule, tick Sites and/or Factors then select a schedule from the list.
As an example schedule, you could create a new schedule named “My test” (or whatever you like). Choose a
period of monthly. Close schedules screen, then select Sites that you are interested in. Now select “My test”
under “8.5 Scheduler” on Main Menu. On the 1st of each month, EDMS will indicate what data entry has
occurred. Refer to section below for more information.
8.5.2 Scheduler (on Main Menu)
Scheduler shows months of colour-coded dates on the Main Menu, as per the legend at the bottom this
section. Colour-coded dates are calculated based upon what site and factors have data entered against
them, as defined by Schedules created in 8.5.1. Each date on the calendar can represent one or more of
these schedules depending on whether you have selected one, “All active Schedules”, or a Group of
schedules (appearing in [square brackets]), on the Main Menu.
1. Red indicates no data has been entered for any sites for any selected schedules.
2. Orange indicates some data has been entered against one or more selected schedules, for one or more
sites.
3. Green indicates all data has been entered against all selected schedules, for all sites.
4. Yellow indicates data entry is a future requirement, against one or more selected schedules.

EDMS QUICK REFERENCE GUIDE
16 To navigate through months of scheduler, you may click
on a year or month and select the one you want to go to.
Click the left or right arrow, on the first or last month, to
move to the previous or next month.
You can click on “8.5 Scheduler” to open 8.5.1 Sampling
Schedule Configuration Screen to view or make changes.
Click the Refresh button on the main menu to review any
changes you’ve made.
Size grid to fit (then hit Refresh button), for EDMS to
calculate how many months of results EDMS can display
on your Main Menu, depending upon your current
Windows screen resolution. Up to 10x10 (99) months can
be shown at once. Larger grids are slower to calculate.
Select a Group or any schedule in list under “8.5
Scheduler”, and tick Show on Startup, if you would like
to see these results each time you start EDMS
(recommended).
If you click on any date in the calendar above, a screen
will pop-up where you can add any general comments (refer screen below). These comments will enlarge the
date like 2nd of October above, when you hit refresh button. Hover your mouse pointer over these dates to view
comments people have added in, as illustrated.
In the example below, imagine clicking on the 1st October shows this:
This conveys that data has been collected for BWQ01/02/03/07 (indicated as ok), but is indicated as missing for
BWQ04/05/06 in the Factors unknown column; named “factors unknown” because we chose no factors in the
above example in 8.5.1. If we did include factors, they would be displayed in separate columns in above screen,
and you could tick Include actual sample data where possible to display the actual data captured.
Click on a row in the Schedule column to open the applicable schedule in the 8.5.1, so you can review
instructions etc.
Click in Site Name column to open 8.2 (Sites Configuration Screen).

EDMS QUICK REFERENCE GUIDE
17 Click Requirement column to open 6.4 (Manual Data Entry Screen) from where you can view, add, or modify
data. When opened, this screen will have a Show Scheduled data for this Site (Toggle) which defaults to on, and
display sampled dates in list 2 (Time series data) that are relevant to the selected site and schedule period.
Following on from point above, if you have decided what factors should be entered for this schedule (via factors
in 8.5.1), you could Add New Sample, or double-click on the relevant date in list 2 to pop open the Data Entry
Screen. From here, click Show new data entry fields button to complete data entry for any missing readings.
8.6 Compliance Standards for Sample Readings
Enter Compliance Standards to help pinpoint data that does/not comply with excepted guidelines or your
licencing conditions. Enter your own values, or contact your lab to obtain limits or “triggers”, and enter them
into this screen accordingly.
Under normal circumstances, an upper value (or “trigger” as referred to by labs), or an upper and lower
range in the white section, are mandatory and will make non-compliant values appear bold on compliance
reports. Values in the Colour Ranges section are optional; enter values here if you want values colour-coded
on compliance reports. Compliance Standards are utilised on 2. Data Browsing, 3. User Defines Searches,
and 5. WaTERS (if applicable) screens. You can also access this screen from these other screens.
Refer 5. WaTERS if you are an Australian Queensland (QLD) coal mining operation. Tick WaTERS Approved
on this screen and select relevant Sites and Factors that form your obligations/approvals to QLD
government. Sites and factors are mandatory. Also be sure and tick the Is Field Reading on Factors tab, if the
factor is one that is captured on-site.
8.7 Maps and Site Placement
This screen allows you to configure “maps” in EDMS.
Maps are usually jpeg images that overlay site codes (monitoring points) automatically, provided Easting and
Northing coordinates are supplied on 8.2 (Sites Configuration Screen), and provided easting and northings
are entered next to image on the Map Configuration tab.
You can have up to 30 maps in EDMS. If you need more, please contact support.
Tick Show in “Maps” section of Main Menu for each map you want to appear in the “7. Maps” section of the
Main Menu.
It is recommended map images are jpg (jpeg) format, approximately 200Kbytes or less in file size (or
2000x2000 pixels or less), otherwise they will be slow or unable to load into an EDMS map.
Maps currently work for Easting and Northings (refer 8.2 Sites). If you need maps to work for latitudes and
longitudes, please contact support -- there have been no requests for this feature yet. If you don’t want to
use either, you can right-click and place a site manually on map; or if you don’t know the easting and
northing.
Labels on Map tab allows you to remove sites that are manually placed on a map, by you or others, or revert
back to using a sites’ easting and northing (by ticking appropriate box in the Use Site Easting/Northing
column) if they have been manually moved.
Add New Sites tab, controls which site codes you want to place back on a map if they have been manually
removed. Select All Sites, or only the ones you want overlaid back on the map, then click Place select sites
on map now when you are ready to do so.
Don’t forget to right-click on site codes or actual map for more features. You can for example, drag and
select multiple site codes, then right-click > Style on a site code to change the look of all those selected.

EDMS QUICK REFERENCE GUIDE
18 Refer 7 (Maps) for more information.
8.8 Security
8.8.1 Users Configuration
If you login as user name administrator with password administrator, this option is also available in top left
of Main Menu by clicking on the link.
Click Add New Users to EDMS to open this screen, and use the default User Name provided if you want to
login into EDMS on your computer without a password. Enter a password, and password confirmation (8
alpha-numeric characters or more), choose a permission that is appropriate, and then click Add New User.
Enter your password, tick log me in automatically from now on, then click OK, if you want EDMS to login
without a password next time (this is secure) if this screen appears:
Reset your password by scrolling down to your Windows Login name and clicking the Reset Pwd (after
ticking the box to enable this feature). Quit out of EDMS. Next time you start EDMS on your computer, you
will asked to reset your password.
This screen also displays when a person last logged into EDMS.
8.8.2 Change My Password
Please follow instructions if you would like to change your password.
8.9 Setup
8.9.1 EDMS Shortcuts
If you want to create a shortcut on your desktop, click on Link to data and Create Shortcuts Icons button in
step 2.
8.9.2 Attach to different EDMS Data File
Warning, this feature is NOT recommended unless you have been instructed to use it.
If you need to connect to a different EDMS data file (edmsdata.mdb), select the relevant file via the Locate
button in step one, then click on Link to data and Create Shortcuts Icons button in step 2. EDMS will restart
and you will be connected to the file you have selected, and indicated in the bottom left of the EDMS Main
Menu.
8.10 Unique Identifier options
This features is purely optional, but used to uniquely identify each sample in EDMS, from 1 to n.
Click the Guidelines link in the top right of this screen for more information.

EDMS QUICK REFERENCE GUIDE
19 If this feature is on, but your operation doesn’t need this feature, you can rollback and turn this feature off
using the Rollback feature on this screen. Rollback with caution; it is suggested you do a zip backup (6.1)
before attempting to do so.
8.11 Miscellaneous Configuration Settings
8.11.1 IMPORT LOGS DIRECTORY (MS Excel Imports)
Each time you transfer data into EDMS using the Import MS Excel Spreadsheets screen, a separate text log
file is created, detailing each sample reading added or replaced in EDMS. If you do not want these files, clear
out the Import Logs Directory periodically.
8.11.2 MS EXCEL IMPORT AUTO SITES CREATION
Select yes if, when importing data from 6.3 (Import Utility), you would like EDMS to create new Site names
for Sites that are not recognised in the spreadsheet; rather than keying them manually through 8.2 (Sites
Configuration Screen).
Having this feature on can mean similar site codes are accidently generated for what should be the one site,
if users are not paying attention, e.g. DW01, and DW000001. Where this situation occurs, use the Move
feature via 6.4 (Manual Data Entry Screen). Having this feature off may eliminate an issue like this from
occurring, but may prove impractical if new sites are continually added into EDMS.
8.11.3 IGNORE MANUAL DATA ENTRY LIMITS DETECTION
Sample readings, entered via the 6.4 (Manual Data Entry Screen), will NOT be checked against detection limit
or maximum limit if "Yes" is selected. This means that keyed sample readings that fail limits detection are
permitted and saved in EDMS. Option "No" means that keyed sample readings failing limit tests will be
refused and NOT stored in EDMS.
These limits refer to the values entered on 8.4 (Factors).
8.11.4 DOCUMENTS DIRECTORY
Document directories are optional. Leave these boxes blank if you do not want to use them.
Entering a directory (folder) for this setting will show all documents and sub-folders contained within it, from
the "Documents" area of Main Menu. It is useful if environmentally related documentation needs to be
accessed from with EDMS, i.e. keep environmentally related data centralised.
Brief comments may be entered against each document and sub-folder by selecting each one from the
Document area of the Main Menu.
Double-clicking on a document will start up the associated application, i.e. if document is a ".doc" (Word
Document), Microsoft Word will open with the relevant document.
The Documents area is updated each time each time you login and start-up EDMS.
Note the Documents Directory is only visible only to High (Administrators) and Medium levels of security.
8.11.5 GUEST DOCUMENTS DIRECTORY
Same as DOCUMENT DIRECTORY, except it is only visible to users with Low level of security (guest users of
EDMS where data is read-only and limited options are available in Main Menu).
8.12 SWL Configuration and Help
EDMS can generate a Standing Water Level reading if you provide relevant information via 8.2 (Sites
Configuration screen), and have other relevant sample readings data stored in EDMS.

EDMS QUICK REFERENCE GUIDE
20 Click on Click here more info in top right corner of screen for more information.
10. Version History Displays a complete list of program enhancements or bug fixes.
Worth a look every now and then to see check whether new features have been implemented, or any out-
sanding issues have been addressed.
This screen will display automatically after an upgrade has been installed.
11. EDMS Internet Upgrades Double-click to turn on automatic program upgrades if this option is off (and coloured red). Turning this
feature on will ensure you have the latest EDMS program improvements and updates.
12. Support Double-click on this screen for support contact information.
We are happy to help!
If you need any assistance, please phone +61 7 3397 0707, or e-mail [email protected].
If you have any suggestions for improving EDMS, or have any errors, bugs, annoyances, sales or other
enquiries, please contact us without hesitation.
Related Documents