Welcome message from author
This document is posted to help you gain knowledge. Please leave a comment to let me know what you think about it! Share it to your friends and learn new things together.
Transcript


1
Editor’scomment
To say that 2016 was an eventful yearwould be a gross understatement. It wasalways inevitable that political shocks suchas the UK’s decision to leave the EU andthe election of erratic firebrand DonaldTrump in the US would affect FDI flows oneway or the other. We are only now startingto get a sense of what these impactsmight be, but greenfield investment is along-term game and the end results ofthese votes on either side of the Atlantic
will not be known for many years.What we can see already is that Brexit has done some short-
term damage to the UK’s once-enviable FDI position. Despiteadmirably solid economic growth – at least in Western terms –the UK experienced a 42% decline in greenfield capital investmentyear on year and a 9% decline in job creation via greenfield FDI.The number of projects declined 9%. Many investors have optedto postpone UK expansion or investment plans until there is moreclarity on what kind of agreement the UK is able to strike withBrussels. Despite these uncertainties, the UK has held on to its top-ranked position as an investment destination in Europe, showingthat its FDI appeal, while dented, does retain some of its strength.
Meanwhile, the UK’s closest ally is getting mixed messages
from investors, perhaps as a result of the confusing messagesit is sending to them. With the election not having taken placeuntil November 2016 – and most pundits widely predicting aHillary Clinton victory – 2016’s US figures cannot really tell usmuch about the ultimate impact of a Trump presidency on theUS’s FDI attractiveness. The initial investor reaction to Mr Trump’sinauguration was positive, with inward investment to the USjumping nearly 40% in January 2017 compared with the previousmonth and 35% on the samemonth the previous year. Manycompanies welcome Mr Trump’s proposed tax plans and anypolicies incentivising US companies to keep more investmentat homemight pay short-term dividends; but equally, corporateAmerica as well as foreign investors have sounded the alarm overthe administration’s immigration policies and the president’s useof Twitter as a bully pulpit.
The FDI figures for 2017 should tell us more on that score.Either way, this year looks set to be every bit as unpredictableas the previous.
Courtney Fingar is editor-in-chief of fDiMagazine and head ofcontent for fDi Intelligence, the Financial Times’ specialist unitdedicated to foreign direct investment
Greenfield investment is a long-term game and the end resultsof the votes on either side of theAtlantic will not be known formany years
THE fDi REPORT 2017 EDITOR’S COMMENT

2
Global FDI flows decline in 2016, while greenfieldFDI starts to recover
According to Unctad, official FDI flows declined by 13% in 2016 to$1670bn, with FDI into Europe experiencing the sharpest decline(26%) followed by developing countries (20%). fDiMarkets recordedjust over 6% growth in greenfield FDI in 2016, with $776.2bn ofannounced investment. This suggests the overall decline in FDIflows is mainly attributable to a decline in crossborder M&A in 2016.
Winners and losers of 2016
The global investment landscape changed considerably in2016 as FDI gravitated to locations experiencing the strongesteconomic growth, while locations in recession or facing high levelsof uncertainty saw major declines. Spain saw a very strong growth(28%) in inward FDI projects in 2016 as its economy started torecover strongly from recession, and India managed to keepthe crown as the world’s number one location for greenfieldcapital investment for the second year running – ahead ofChina and the US.
Brazil, on the other hand, saw a precipitous decline in FDI, with thenumber of inward FDI projects down 33% and capital investmentdown 28%. The UK, despite relatively strong economic growth,experienced a 42% decline in greenfield capital investment and a9% decline in job creation in 2016, with Brexit uncertainty leadinginvestors to postpone or relocate their UK FDI plans.
Executivesummary
THE fDi REPORT 2017 EXECUTIVE SUMMARY
Prospects for 2017We have identified six key influencers on the FDI markets in 2017:
1 World economic growth: FDI is very closely linked to GDPand GDP growth prospects. Global GDP growth was 3.1% in 2016and the IMF forecasts 3.4% growth in 2017 and 3.6% in 2018. Thisshould lead to an increase in FDI;
2 US politics:US president Donald Trump’s administration and itsimpact on trade agreements, US tax rates, immigration policy, FDIrestrictions and global security could have a considerable impacton global FDI and on the winners and losers in 2017;
3 USmonetary policy: The ‘normalisation’ of monetary policyin the US – after nearly a decade of historically low interest rates– could result in a significant shift in composition of capital flows tothe US, causing economic slowdown inmany, especially developing,countries. This would have a negative impact on global FDI;
4 Brexit impact on FDI: As the UKmoves toward Brexit, FDI intothe UK is expected to decline in 2017. Much of this FDI is likely to beredirected to EUmember states (leaving global FDI levels relativelyunchanged). However, if the Brexit negotiations lead to a breakdownin trade between the UK and the EU and to economic slowdown,then global FDI levels are likely to be negatively impacted;
5 Elections andpotential implications: Italy is regrouping andFrance andGermany are holding elections, all of which createsuncertainty and could lead to a negative impact on FDI; and
6 China’s FDI policy: Chinese signals on outbound investmentand outbound capital movement suggest that its policy maybecome increasingly restrictive (again), leading to a decline inChinese outward FDI which would bring down global FDI.
Overall, taking into account an increase in world economic growthand balancing positive growth forecasts with themore negativescenarios above, we expect overall FDI to increase in 2017 by 10%.
fDi Markets recorded just over 6%growth in greenfield FDI in 2016, with$776.2bn of announced investment. Thissuggests the overall decline in FDI flows ismainly attributable to a declinein crossborder M&A in 2016.
TheUK, despite relatively strongeconomic growth, experienceda 42% decline in greenfield capitalinvestment and a 9% decline in jobcreation in 2016, with Brexit uncertaintyleading investors to postpone or relocatetheir UK FDI plans.
FDI is very closely linked to GDP andGDP growth prospects. Global GDPgrowth was 3.1% in 2016 and the IMFforecasts 3.4% growth in 2017 and 3.6%in 2018. This should lead to an increasein FDI.
Overall, taking into account anincrease in world economic growthand balancing positive growth forecastswith themore negative scenarios listed(right), we expect overall FDI to increaseby 10% in 2017.
6%
42%
3.13.4
3.6
10%
The big numbers

The early signals fromDonaldTrump’s presidency are to discour-age US companies from investingoverseas and instead invest at
home, and to encourage companies to investin the US instead of in other countries,especially Mexico. Using the latest datafrom fDi Markets, we examined whether thispolicy rhetoric is yet to have any effect oncompanies’ FDI decisions.
First, looking at US FDI overseas, wecan see from Graph 1 that the number ofFDI projects being announced overseas byUS companies has declined sharply since MrTrump won the US presidential elections. InNovember 2016, US companies announced45% fewer FDI projects overseas than inOctober 2016, and in January 2017announced 35% fewer FDI projects overseaswhen compared with both January 2016 andJanuary 2015. Since Mr Trump won the presi-dential elections, FDI from US companieshas declined to the lowest levels since 2003,the year fDi Markets started tracking invest-ment data. It would certainly appear that thepolicy rhetoric is working and US companiesare significantly cutting back on their over-seas investments.
So is the policy rhetoric also working toattract companies to invest in the US? Graph 2
shows the same data for monthly inward FDIprojects into the US.
We can see that in the month Mr Trumptook office (January 2017) inward FDI proj-ects to the US jumped by nearly 40%compared with the previous month and wereup almost 35% compared with January 2016.Companies certainly did not respond nega-tively to Mr Trump being elected presidentand it is likely that key Trump policies on theagenda – in particular lowering corporatetax, making it more costly for companies tobring in foreign workers, and renegotiating
trade agreements – are all likely to stimulateFDI into the US.
Mexico is certainly seen byMr Trump to betaking jobs away from the US, and companieslooking to invest in Mexico have been in thefiring line. Looking at the latest FDI datashown in Graph 3, we can see that Mr Trumpwinning the presidential election has coin-cided with a very sharp decline in FDI projectsinto Mexico. In January 2017, FDI projects intoMexico were down nearly 40% compared withJanuary 2016 and declined by nearly 50%compared with January 2015.
It is very likely that FDI into the US willgrow considerably in 2017 as a direct impactof Mr Trump’s policies. The long-term impacton US outward FDI is likely to depend onactual policy change and the relative impactof each change.
A substantial decline in corporate tax inthe US is likely to encourage US companies toinvest in the US instead of overseas (as wellas attract other foreign investors from highertax jurisdictions), while amuch tighter immi-gration policymay lead US companies toinvest inmore immigration-friendly countries(such as neighbouring Canada), especially insectors such as IT, where talent availabilitydrives corporate location decisions and wheretrade agreements have less of an impact.
The impact of the Trumppresidency on FDIby Dr Henry Loewendahl, CEO, Wavteq
3THE fDi REPORT 2017 ANALYSIS
Graph1
MONTHLYUSOUTWARDFDITRENDS(NUMBEROFFDIPROJECTS)
Graph3
MONTHLYMEXICANINWARDFDITRENDS(NUMBEROFFDIPROJECTS)
Graph2
MONTHLYUS INWARDFDITRENDS(NUMBEROFFDIPROJECTS)
It would certainly appearthat Mr Trump’s policyrhetoric is workingand US companies aresignificantly cuttingback on their overseasinvestments
Jan2015
Mar2015
May2015
Jul2015
Sept2015
Nov2015
Jan2016
Mar2016
May2016
Jul2016
Sept2016
Nov2016
Jan2017
0
45
90
135
180
225
Jan2015
Mar2015
May2015
Jul2015
Sept2015
Nov2015
Jan2016
Mar2016
May2016
Jul2016
Sept2016
Nov2016
Jan2017
0
15
30
45
60
Jan2015
Mar2015
May2015
Jul2015
Sept2015
Nov2015
Jan2016
Mar2016
May2016
Jul2016
Sept2016
Nov2016
Jan2017
0
80
160
240
320
400

4THE fDi REPORT 2017 GLOBAL OVERVIEW
In 2016, greenfield FDI continued to rise, with capital investmentincreasing bymore than 6% to $776.2bn, its highest since 2011,alongside an increase in job creation by 5% to 2.02million. However,the number of FDI projects declined 3% to 12,644.
For the second year running, India was the highest rankedcountry by capital investment, with $62bn-worth of FDI projectsannounced in 2016. The US was the highest ranked country by FDIprojects, recording 1571.
Asia-Pacific remained the leading destination region for FDI in2016 with 3921 announced FDI projects bringing in an estimatedcapital investment of $348.5bn. Meanwhile, the region attracted45% of all capital investment globally. Western Europe was theleading source region for FDI in 2016, despite registering a 3%decline, with 5553 FDI projects recorded. This accounted for 44%of all FDI projects globally. Western Europe-based companiesaccounted for $219bn-worth of investments overseas.
Key trends in 2016 include:
• India retained its top spot for FDI by capital investment followingan increase in investment of 2% to $62.3bn.
• FDI rebounded in Spain, with the number of FDI projectsincreasing 28% to 324.
• China has overtaken the US to become the second biggestcountry for FDI by capital investment, recording $59bn ofannounced FDI, compared with $48bn-worth in the US.
• Capital investment in Mexico increased by 8% to $26.2bn, incontrast to a 23% decline in the US.
• FDI into theUK decreased across all indicators, with the number ofprojects, capital investment and jobs created falling 9%, 42% and9%, respectively.
• Brazilian FDI continued to collapse, with the number of FDIprojects declining 33% to 180, alongside a capital investmentdecline of 28% to $12.1bn.
Global overview
Source: fDiMarkets
* Includes estimates** by capital investment
Global overview2016 FDI snapshot
$776.2bn*Total capital investment ($bn)
Top source country
US**
2,018,291*Total jobs created
Top destination country
India**
Top sectorReal estate**
Total Projects
12,644

fDi Markets is the most comprehensive service tracking crossborder greenfield investment across all countries and sectors worldwide. This service can be used to:
• Identify target investors for your key markets• Profile companies within your target sectors• Receive early warning indicators that a company may be expanding internationally • Understand the key FDI trends in markets and sectors • Develop your investment promotion strategy using real time data
Make smart decisions on crossborder investment
For a free demonstration of our tools, contact us on +44 (0)20 7775 6667 or at
fDiIntelligence.com/marketsdemo
REQUEST A FREE DEMO

THE fDi REPORT 2017 ASIA-PACIFIC6
Asia-PacificKey trends in 2016 include:
• FDI into Asia-Pacific increased by 8% in 2016, with a total inwardcapital investment of $348.5bn. Project numbers increased by 1%and job creation grew by 6%.
• India retained its position as the leading recipient of capitalinvestment in Asia-Pacific, with a growth rate of 2% to $62.3bn.Project numbers also grew by 16% to 809.
• Vietnam and Malaysia, ranked a respective fifth and sixth for FDIby number of projects in Asia-Pacific, experienced an increase of18% and 13%. Capital investment in the countries also increased,with Vietnam attracting $36.6bn and Malaysia attracting $19.3bn.
• After an absence in 2015, Hong Kong re-entered the top 10for FDI by project numbers in 2016 with 165 recorded projects.
• China suffered a 10% decline in FDI projects. However, capitalinvestment into the country increased by 3% to $59.1bn.
• Japan achieved a 13% increase in the number of FDI projects intothe country.
• Kazakhstan was a new entry in the top 10 with a 591% increasein FDI by capital investment following a multibillion-dollarinvestment into a coal, oil and gas project.
• The top three countries for capital investment in the regionwere India, China and Kazakhstan, respectively, holding a 46%combined market share.
FDI INTOASIA-PACIFICBYPROJECTNUMBERS
Table 1
Country Projects 2016 %change
India 809 16%
China 710 -10%
Singapore 343 -3%
Australia 291 1%
Vietnam 265 18%
Malaysia 179 13%
Japan 174 13%
Hong Kong 165 11%
Philippines 157 -7%
Thailand 156 -2%
Other 672 -9%
Total 3921 1%Source: fDiMarkets
$348.5bnFDI into Asia-Pacific increased in 2016 by
8%, with a total inward capital investment of$348.5bn. Project numbers increased by 1%
and job creation grew by 6%
Graph1
Source: fDiMarketsNote: Includes estimates
Capital investment($bn) 2016
Asia-Pacificmarket share
18% India 62.3
17% China 59.1
12% Kazakhstan 40.1
11% Vietnam 36.6
6% Indonesia 22.1
6% Malaysia 19.3
5% Australia 18.8
3% Singapore 11.3
3% Philippines 10.5
3% Myanmar 10.4
17% Other 58.0
Capital investmentFDI INTOASIA-PACIFIC IN2016

THE fDi REPORT 2017 ASIA-PACIFIC7
FDIOUTOFASIA-PACIFICBYCAPITAL INVESTMENT($BN) IN2016
Table 2
Country Capital investment2016 ($bn)
China 109.7
Japan 46.9
South Korea 31.1
Singapore 25.9
Taiwan 20.8
Malaysia 20.1
India 17.8
Thailand 14.4
Hong Kong 12.1
Australia 10.5
Other 6.6
Total 315.9Source: fDiMarketsNote: Includes estimates
FDIOUTOFASIA-PACIFICBYPROJECTNUMBERSIN2016
Table 3
Country Projects 2016
Japan 884
China 585
India 272
Australia 214
South Korea 204
Singapore 180
Taiwan 122
Hong Kong 119
Thailand 103
Malaysia 70
Other 149
Total 2902Source: fDiMarkets
Recentmajor projects
Tengizchevroil, which operates aspart ofUS-basedChevron, plans toinvest $36.8bn to expand productionat the Tengiz field in Kazakhstan. Theinvestment will begin in 2017 andboost the field’s production capacityfrom500,000 barrels per day to about850,000 barrels per day by 2022.
Foxconn, an electronicsmanufacturer and a subsidiary ofTaiwan-basedHonHai PrecisionIndustry, is planning to establish anLCD TV panel factory in Guangzhou,China. It is expected to cost $8.8bnandwill begin production in 2019.
Malaysia-basedPavilionGroup, areal estate company, has enteredinto an investment co-operationagreement to develop the SaigonPeninsula project in HoChiMinh,Vietnam. The firmwill partner with theVan Thinh Phat Investment Group andGenting Group to invest about $6bn atthe 118-hectare site in District 7.
China-basedChina FortuneLandDevelopment has entered into amemorandumof understanding todevelop an industrial township inHaryana, India. It will encompass 600hectares across the Gurgaon district.
India retained its place as the leadingrecipient of capital investment in
Asia-Pacificwith a growth rate of 2%to $62.3bn. Project numbers also
grew by 16% to 809
Japan achieved a 13% increase inthe number of FDI projects into
the country
China suffered a 10%decline in FDIprojects. However, capital investment
into the country increased by3% to $59.1bn
$62.3%
10%
13%KEYTRENDSIN2016
Kazakhstan was a newentry in the top 10with a 591% increasein FDI by capitalinvestment followinga multibillion-dollarinvestment into a coal,oil and gas project

8
EuropeKey trends in 2016 include:
• FDI into Europe fell for the third year in a row in 2016, with a 9%decrease in project numbers to 4712. Capital investment declined12%. However, jobs created increased by 13%.
• FDI into ‘Emerging Europe’ increased across project numbers(13%) and capital investment (4%), while FDI into westernEurope declined across project numbers (16%) and capitalinvestment (18%).
• The UK witnessed a decrease in FDI, with project numbersdropping by 9% in 2016.
• The number of FDI projects into Spain increased by 28% to 324.
• Capital investment into France increased by 54% to $13bn in2016. The country ranked second in terms of inbound capitalinvestment, up from fourth place in 2015.
• While project numbers into Turkey fell by 5% in 2016, capitalinvestment increased by 55% to $8.8bn.
• In the Baltics, both Latvia and Estonia experienced an increasein FDI, with project numbers rising 44% and 60%, respectively.
• Capital investment into Switzerland increased by 46% to avalue of $3bn and the number of projects also increased by57% in 2016.
• Germany has overtaken the UK as the top outward investor in2016, accounting for more than 21% of projects from the region.
FDI INTOEUROPEBYPROJECTNUMBERS2016
Table 1
Country Projects 2016 %change
UK 1039 -9%
Germany 472 -55%
France 411 -15%
Spain 324 28%
Poland 272 36%
Russia 200 3%
Ireland 187 6%
Netherlands 176 -22%
Turkey 150 -5%
Belgium 139 -29%
Other 1342 21%
Total 4712 -9%Source: fDiMarkets
$13bnCapital investment into France increased by54% to $13bn in 2016. The country ranked
second in terms of inbound capital investment,up from fourth place in 2015
THE fDi REPORT 2017 EUROPE
Graph1
Capital investmentFDI INTOEUROPEIN2016
Source: fDiMarkets
UK
France
Russia
Germany
Poland
Turkey
Spain
Ireland
Netherlands
Hungary
Other
34.8
13.0
12.9
10.3
9.9
8.8
8.5
5.8
4.8
4.6
43.2
Capital investment($bn) 2016
Europemarket share
22%
8%
8%
7%
6%
6%
5%
4%
3%
3%
28%

9
FDI OUT OF EUROPE BY CAPITAL INVESTMENT ($BN) IN 2016
Table 2
Country Capital investment 2016 ($bn)
Germany 46.4
UK 38.0
France 31.6
Spain 19.8
Italy 15.1
Switzerland 12.4
Netherlands 9.3
Russia 8.5
Denmark 7.4
Belgium 7.3
Other 41.2
Total 236.9Source: fDi Markets Note: Includes estimates
FDI OUT OF EUROPE BY PROJECT NUMBERS IN 2016
Table 3
Country Projects 2016
Germany 1239
UK 1078
France 740
Switzerland 417
Spain 336
Netherlands 295
Italy 233
Sweden 205
Ireland 179
Luxembourg 151
Other 1000
Total 5873Source: fDi Markets
Germany has overtaken the UK as the top outward investor in 2016, accounting for more than 21% of projects from the region
THE fDi REPORT 2017 EUROPE
FDI into ‘Emerging Europe’ increased across project numbers (13%) and capital investment (4%), while FDI
into western Europe declined across project numbers (16%) and capital
investment (18%)
While project numbers into Turkey fell by 5% in 2016,
capital investment increased by 55% to $8.8bn
FDI into Europe fell for the third year in a row in 2016, with a 9%
decrease in project numbers to 4712. Capital investment declined 12%. However, jobs increased by 13%13%
12%
55%
KEY TRENDS IN 2016
Recent major projects
China-based Dalian Wanda Group has entered into an agreement with Auchan Group to co-invest $3bn in an integrated cultural, tourism and commercial project in Paris, France. It will encompass 80 hectares.
China-based Sunshine Kaidi New Energy Group, a renewable energy company, plans to invest €1bn to build a new wood-based biodiesel plant in Ajos, Finland, in collaboration with Finland-based Spinverse. It is scheduled to launch operations by the end of 2019 and will create about 150 jobs.
Automotive component manufacturer Magna Steyr, a subsidiary of Canada-based Magna International, plans to invest about $500m to expand its operations in Graz, Austria. The company expects to produce 200,000 units per year by 2018. The project will lead to the creation of approximately 3000 new jobs.
Mercedes-Benz, a subsidiary of Germany-based automotive company Daimler, plans to invest €1bn in a manufacturing plant in Kecskemet, Hungary. The facility will create 2500 jobs and will have a capacity of 150,000 vehicles a year.
Editor’s note: Our German data sources have not released all 2016 data yet so 2016 data for Germany in this report is underestimated.

10
North AmericaKey trends in 2016 include:
• FDI into North America decreased by 19% in 2016, with totalcapital investment of $56.5bn, resulting in an 11% decline in jobcreation. Despite this, projects numbers increased by 4% to 1813FDI projects.
• Capital investment into the US in 2016 dropped by 22%, andjobs created decreased by 15%. However, the number of projectssaw a 3% rise.
• The US remained the top destination country in the region,attracting 87% of the region’s FDI projects and 85% of capitalinvested, though this is a decrease on 2015’s market share of 89%.
• FDI into Canada by number of projects increased from 217 in2015 to 242 in 2016. Total capital investment into the countryalso increased by 4%, while jobs created enjoyed growth of 22%.
• Ontario attracted 128 FDI projects in 2016, an increase of 17%on 2015. It remained the top Canadian province for FDI in 2016,with a 7%market share of North American FDI projects.
• California and New York were the top two destination statesin 2016 for both FDI project numbers and capital investment.California’s inward capital investment increased by 50% to $5.8bn,while its FDI project numbers also grew by 7% to 246.
• Michigan attracted $2bn-worth of FDI in 2016, an increase of22% on its 2015 figures. This brought Michigan into the top 10destination states. Project numbers increased from 41 to 76 inthe same time period.
Table 1Graph1
Capital investment
FDI INTONORTHAMERICAIN2016
State/Province Projects 2016 %change
California 246 7%
New York 185 -4%
Texas 136 -8%
Ontario 128 17%
Florida 82 4%
Massachusetts 77 51%
Michigan 76 85%
Georgia 63 11%
North Carolina 53 -4%
South Carolina 51 16%
Other 716 -2%
Total 1813 4%Source: fDiMarkets
FDI INTONORTHAMERICABYPROJECTNUMBERSIN2016
THE fDi REPORT 2017 NORTH AMERICA
$1.45bnCapital investment intoMississippi
increased from$346.9m in 2015 to $1.6bnin 2016. This can be attributed, in part, tothe announcement of Germany-based
Continental’s $1.45bn tyre plant in ClintonSource: fDiMarketsNote: Includes estimates
New York
California
Ontario
Texas
Illinois
Quebec
Michigan
Florida
Pennsylvania
Mississippi
Other
5.8
5.8
4.5
4.4
2.2
2.1
2.0
1.7
1.7
1.6
24.7
Capital investment($bn) 2016
North Americamarket share
10%
10%
8%
8%
4%
4%
4%
3%
3%
3%
44%

11
FDIOUTOFNORTHAMERICABYCAPITAL INVESTMENT($BN) IN2016
Table 2
State/Province Capital investment2016 ($bn)
California 58.7
New York 16.5
Ontario 9.9
Colorado 8.9
Texas 6.7
Connecticut 5.9
Michigan 5.6
Florida 5.1
Washington 4.4
Pennsylvania 3.7
Other 38.8
Total 164.3Source: fDiMarketsNote: Includes estimates
Table 3
FDIOUTOFNORTHAMERICABYPROJECTNUMBERSIN2016State/Province Projects 2016
California 658
New York 431
Ontario 163
Massachusetts 159
Washington 136
Texas 124
Illinois 120
Connecticut 107
New Jersey 98
Florida 92
Other 1041
Total 3129Source: fDiMarkets
THE fDi REPORT 2017 NORTH AMERICA
FDI project numbers into Canadaincreased from217 in 2015 to 242in 2016. Total capital investmentinto the country also increased
by 4%, while jobs created enjoyedgrowth of 22%
TheUS remained the topdestination country in the region,attracting 87%of the region’s FDI
projects and 85%of capital invested,though this is a decrease on 2015’s
market share of 89%
Capital investment into theUS in 2016dropped by 22%, and jobs createddecreased by 15%. However, thenumber of projects saw a 3% rise
4%
22%
87%KEYTRENDSIN2016
Recentmajor projects
SMIUSA, a subsidiaryofChina-basedShanghaiMunicipalInvestment, a provider ofurbaninfrastructure services, is toconstruct a $3bn residential andcommercial complex inNewYork.The building, Central Park Tower, isa joint venturewith Extell Development.
Germany-basedContinental, anautomotive company, is to constructa new$1.45bn tyre plant in Clinton,Mississippi. The 464,515-square-metrefacility will be the company’s largestNorth American tyre factory. Theproject will create 2500 new jobs.
LotteChemical, a chemicalsproducer and a subsidiary ofSouthKorea-basedLotteGroup,is to construct amonoethylene glycolplant in Lake Charles, Louisiana. The$1.1bn facility will produce 700,000tonnes ofmonoethylene glycol peryear, mainly for export.
SamsungAustin Semiconductor,a subsidiary of SouthKorea-basedSamsung, plans to expand its plantin Austin, Texas. The firmwill invest$1bn to enhance current SystemLSIproduction tomeet increased demandfor advanced system-on-chip products.
Michigan attracted$2bn-worth of FDIin 2016, an increaseof 22% on its 2015figures

fDi Benchmark is the only online tool to benchmark the competitiveness of countries and cities worldwide in more than 70 sector profiles. You can use our fDi Benchmark tool to:
• Analyse over 1,000 quality and cost data points to develop customised reports• Approach potential investors with a solid, data driven business proposition on your location• Prepare sector specific investment propositions to get your location on the shortlist• Customise your benchmarking studies to suit the needs of the investor
Powerful location benchmarking for your organisation
For a free demonstration of our tools, contact us on +44 (0)20 7775 6667 or visit
fDiIntelligence.com/bmdemo
REQUEST A FREE DEMO
13
Table 1
Country 2012 2013 2014 2015 2016
US 56.07 63.72 50.39 62.09 48.13
Mexico 17.62 35.38 34.58 24.37 26.18
Canada 10.63 16.15 12.28 8.04 8.39
Total 84.32 115.25 97.24 94.50 82.70
FDIINTONAFTACOUNTRIESBYCAPITALINVESTMENT($BN),2012-16
Table 2
Country 2012 2013 2014 2015 2016
US 1521 1730 1638 1523 1571
Mexico 309 474 385 356 427
Canada 287 282 276 217 242
Total 2117 2486 2299 2096 2240
FDIINTONAFTACOUNTRIESBYPROJECTNUMBERS,2012-16
Table 3
Country 2012 2013 2014 2015 2016
US 148 143 128 98 124
Mexico 74 86 78 102 92
Canada 8 7 13 19 8
Total 230 236 219 219 224
AUTOMOTIVEFDIINTONAFTACOUNTRIESBYPROJECTNUMBERS,2012-16
Table 4
Country 2012 2013 2014 2015 2016
US 8.47 6.39 6.82 7.52 5.54
Mexico 5.60 7.33 12.81 8.58 4.88
Canada 0.21 0.97 3.46 1.25 0.14
Total 14.28 14.70 23.08 17.34 10.57Source: fDiMarketsNote: All tables include estimates
AUTOMOTIVEFDIINTONAFTACOUNTRIESBYCAPITALINVESTMENT($BN),2012-16
THE fDi REPORT 2017 IN FOCUS: NAFTA
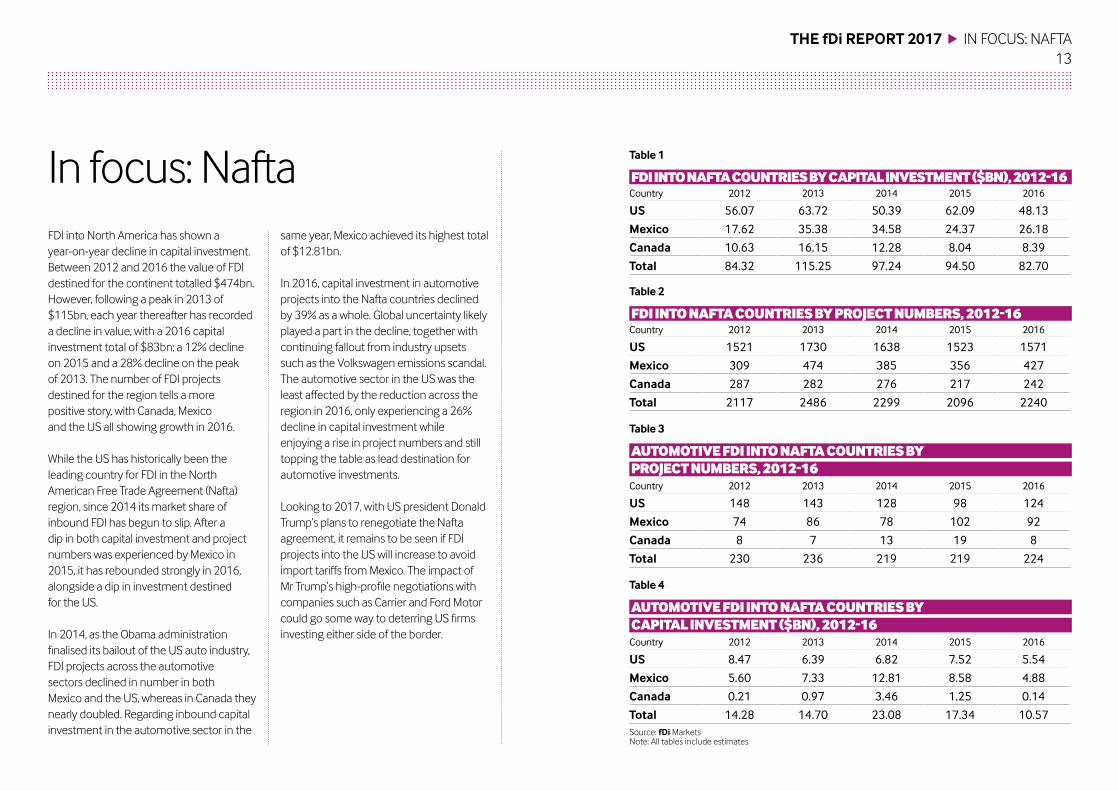
FDI into North America has shown ayear-on-year decline in capital investment.Between 2012 and 2016 the value of FDIdestined for the continent totalled $474bn.However, following a peak in 2013 of$115bn, each year thereafter has recordeda decline in value, with a 2016 capitalinvestment total of $83bn; a 12% declineon 2015 and a 28% decline on the peakof 2013. The number of FDI projectsdestined for the region tells a morepositive story, with Canada, Mexicoand the US all showing growth in 2016.
While the US has historically been theleading country for FDI in the NorthAmerican Free Trade Agreement (Nafta)region, since 2014 its market share ofinbound FDI has begun to slip. After adip in both capital investment and projectnumbers was experienced by Mexico in2015, it has rebounded strongly in 2016,alongside a dip in investment destinedfor the US.
In 2014, as the Obama administrationfinalised its bailout of the US auto industry,FDI projects across the automotivesectors declined in number in bothMexico and the US, whereas in Canada theynearly doubled. Regarding inbound capitalinvestment in the automotive sector in the
same year, Mexico achieved its highest totalof $12.81bn.
In 2016, capital investment in automotiveprojects into the Nafta countries declinedby 39% as a whole. Global uncertainty likelyplayed a part in the decline, together withcontinuing fallout from industry upsetssuch as the Volkswagen emissions scandal.The automotive sector in the US was theleast affected by the reduction across theregion in 2016, only experiencing a 26%decline in capital investment whileenjoying a rise in project numbers and stilltopping the table as lead destination forautomotive investments.
Looking to 2017, with US president DonaldTrump’s plans to renegotiate the Naftaagreement, it remains to be seen if FDIprojects into the US will increase to avoidimport tariffs fromMexico. The impact ofMr Trump’s high-profile negotiations withcompanies such as Carrier and Ford Motorcould go someway to deterring US firmsinvesting either side of the border.
In focus: Nafta

14
Latin Americaand theCaribbeanKey trends in 2016 include:
• FDI into Latin America and the Caribbean by capital investmentincreased by 2% in 2016, to a total of $71.8bn. There was a 5%increase in the number of FDI projects, while the number of jobscreated by FDI projects also increased by 4%.
• The top three destination countries for FDI by capital investmentin Latin America and the Caribbean were Mexico, Brazil andArgentina, which attracted $26.2bn, $12.1bn and $12bn,respectively. Combined, the three countries accounted forsome 70% of FDI into the region.
• In 2016, Brazil experienced a decline in FDI across projectnumbers (33%), capital investment (28%) and jobs (15%). Brazil’smarket share of FDI into Latin America dropped from 24% in 2015to 17% in 2016.
• The value of FDI destined for Argentina increased by 279% to$12bn in 2016 with project numbers increasing by 123%.
• Capital investment into Chile in 2016 decreased by 37% to $6bn,while project numbers also decreased by 20% to 53.
• In 2016, Peru experienced an increase across all three indicators,with project numbers increasing 76%, capital investmentincreasing 85% and the number of jobs created nearly doubling.
Table 1Graph1
Capital investment
FDI INTOLATINAMERICAANDTHECARIBBEANIN2016
Country Projects 2016 %change
Mexico 427 20%
Brazil 180 -33%
Argentina 105 123%
Colombia 74 -4%
Chile 53 -20%
Costa Rica 51 59%
Peru 44 76%
Panama 17 -26%
Dominican Republic 14 27%
Cuba 13 8%
Other 89 -9%
Total 1067 5%Source: fDiMarkets
FDI INTOLATINAMERICAANDTHECARIBBEANBYPROJECTNUMBERSIN2016
THE fDi REPORT 2017 LATIN AMERICA AND THE CARIBBEAN
$380mFDI into Costa Rica increasedby 59% to 51 projects in
2016, resulting in $380mofcapital investment
Source: fDiMarketsNote: Includes estimates
Mexico
Brazil
Argentina
Chile
Peru
Colombia
Venezuela
DominicanRepublic
Ecuador
Bolivia
Other
26.2
12.1
12.0
6.0
2.6
2.5
1.8
1.3
1.2
1.1
5.0
Capital investment($bn) 2016
Latin Americamarket share
36%
17%
17%
8%
4%
3%
3%
2%
2%
1%
7%

15
FDIOUTOFLATINAMERICAANDTHECARIBBEANBYCAPITALINVESTMENT($BN) IN2016
Table 2
Country Capital investment2016 ($bn)
Mexico 2.7
Brazil 2.0
Bermuda 1.8
Chile 0.7
Venezuela 0.7
Jamaica 0.5
Cayman Islands 0.3
Argentina 0.1
Peru 0.1
Colombia 0.1
Other 0.1
Total 9.2Source: fDiMarketsNote: Includes estimates
Table 3
FDIOUTOFLATINAMERICAANDTHECARIBBEANBYPROJECTNUMBERSIN2016Country Projects 2016
Brazil 48
Mexico 42
Bermuda 19
Argentina 17
Cayman Islands 11
Chile 10
Colombia 10
Peru 6
Uruguay 6
Costa Rica 5
Other 17
Total 191Source: fDiMarkets
THE fDi REPORT 2017 LATIN AMERICA AND THE CARIBBEAN
The top three destination countriesfor FDI by capital investment in LatinAmerica and the CaribbeanwereMexico, Brazil and Argentina, whichattracted $26.2bn, $12.1bn and
$12bn, respectively
The value of FDI destined forArgentina increased by 279%to $12bn in 2016with projectnumbers increasing by 123%
In 2016, Brazil experienced a declinein FDI across project numbers (33%),capital investment (28%) and jobs
(15%). Brazil’smarket share of FDI intoLatin America dropped from24% in
2015 to 17% in 2016
$50.3bn
17%279%
KEYTRENDSIN2016
Recentmajor projects
Ireland-based globalwind and solardeveloperMainstreamRenewablePower is to invest $1.65bn to develop986megawatts of wind energyprojects across seven plants in Chile.The projects are scheduled to beginsupplying clean energy into the gridfrom January 2021.
SouthKorea-basedKoreaGasCorporation, a liquefiednatural gas(LNG) importer andprovider, is toinvest $1.5bn to open a new LNGplantin Yucatan, Mexico by 2019. It will supply8.5million cubicmetres of gas per day.
US-basedConstellationBrands, aprovider of beer, wine and spirits,plans to invest $1.5bn to establish anewbrewery inMexicali, Mexico. Initially,the brewerywill be built to provide 10million hectolitres of production.
Oil andgas companyPetroquiriquire, a subsidiary ofSpain-basedRepsol, is to invest$1.2bn to increase its oil productionin Venezuela. The companywill reach60,000 barrels per day by 2019.
FDI into LatinAmerica and theCaribbean bycapital investmentincreased by 2% in2016, to a total of$71.8bn

16
Middle EastandAfricaKey trends in 2016 include:
• FDI into the Middle East and Africa by project numbersdecreased by 11% in 2016 to 1131. Capital investment increased60% to $142.8bn. However, jobs created declined by 3%.
• The United Arab Emirates retained its position as the top FDIdestination and source by project numbers, accounting for 22%of inward projects and 32% of outward projects.
• FDI by project numbers decreased by 55% in Kenya, from 85 in2015 to 38 in 2016.
• Iran was a new entry to the top 10 for FDI by project numbersafter an increase of 556% to 59 projects. The country also rankedsecond for FDI by capital investment in 2016, following theannouncement of two $1bn projects.
• Egypt retained its position as the top FDI destination by capitalinvestment, with $40bn of announced FDI recorded in 2016. Thisincluded a $20bn investment announced by China Fortune LandDevelopment.
• Algeria entered the top 10 for FDI by capital investment for thefirst time since 2014, following a $1bn investment by a China-based investor.
• Africa witnessed more FDI by capital investment than the MiddleEast, scooping 64% of the market share in 2016.
Table 1Graph1
Capital investment
FDI INTOTHEMIDDLEEASTANDAFRICAIN2016
Country Projects 2016 %change
UAE 245 -18%
South Africa 105 -19%
Morocco 80 13%
Egypt 69 15%
Saudi Arabia 69 -12%
Iran 59 556%
Nigeria 49 -4%
Kenya 38 -55%
Côte d’Ivoire 33 27%
Israel 32 7%
Other 352 -18%
Total 1131 -11%Source: fDiMarkets
FDI INTOTHEMIDDLEEASTANDAFRICABYPROJECTNUMBERSIN2016
THE fDi REPORT 2017 MIDDLE EAST AND AFRICA
$20bnEgypt retained its position as the top FDI
destination by capital investment, with $40bnof announced FDI recorded in 2016. This
included a $20bn investment announced byChina Fortune LandDevelopmentSource: fDiMarkets
Note: Includes estimates
Egypt
Iran
Saudi Arabia
UAE
Algeria
South Africa
Ethiopia
Morocco
Mozambique
Nigeria
Other
40.0
12.2
11.6
9.1
7.4
7.0
6.8
6.6
6.3
6.2
29.6
Capital investment($bn) 2016
MEAmarket share
28%
9%
8%
6%
5%
5%
5%
5%
4%
4%
21%

17
FDIOUTOFTHEMIDDLEEASTANDAFRICABYCAPITALINVESTMENT($BN) IN2016
Table 2
Country Capital investment2016
UAE 23.1
Saudi Arabia 6.1
Morocco 5.0
Oman 3.3
South Africa 2.9
Israel 2.1
Iran 1.7
Egypt 1.7
Kuwait 1.4
Qatar 0.7
Other 2.0
Total 49.9Source: fDiMarketsNote: Includes estimates
Table 3
FDIOUTOFTHEMIDDLEEASTANDAFRICABYPROJECTNUMBERSIN2016Country Projects 2016
UAE 177
Israel 104
South Africa 72
Saudi Arabia 27
Morocco 22
Kuwait 19
Nigeria 17
Qatar 15
Kenya 14
Iran 12
Other 70
Total 549Source: fDiMarkets
THE fDi REPORT 2017 MIDDLE EAST AND AFRICA
TheUnited Arab Emirates retainedits position as the top FDI destinationand source by project numbers,
accounting for 22%of inward projectsand 32%of outward projects
Iranwas a new entry to thetop 10 for FDI by projectnumbers after an increaseof 556% to 59 projects
FDI into theMiddle East and Africa byproject numbers decreased by 11%in 2016 to 1131. Capital investmentincreased 60% to $142.8bn. However,
jobs created declined 3%22%
11%556%
KEYTRENDSIN2016
Recentmajor projects
China-basedChina FortuneLandDevelopment has signed anagreement to invest $20bn in thedevelopment of a new city east ofCairo, Egypt. The firmwill develop andmanage about 5700 hectares of land,including homes, offices and relevantinfrastructure, as part of the secondphase of the new capital project.
UnitedArabEmirates-basedAlHabtoorGroup, a constructionconglomerate, plans to establish alarge-scalemixed-use project in Egypt.The $8.5bn developmentwill comprisea hotel located on 300 hectares and274 apartments and villas.
Belgium-basedUnit International,an owner anddeveloper of powergeneration assets, has reacheda $4.2bn deal with Iran’s Ministry ofEnergy to construct seven natural gasplants in the country. Operationswerescheduled to have commenced in thefirst quarter of 2017.
ChinaPetroleumPipelineBureau,a subsidiary of China-basedChinaNational Petroleum, plansto establish a newnatural gas pipelineinMozambique and South Africa’sGauteng province.
Africa witnessedmore FDI by capitalinvestment thanthe Middle East,scooping 64% of themarket share in 2016

18
FDIBYSECTOR(NUMBEROFPROJECTS),2016FDIBYSECTOR 2016
Table 1Graph1
Country Projects 2016 change
Software and IT services 2012 -3%
Business services 1435 -9%
Industrial machinery,equipment and tools
818 -13%
Financial services 782 -16%
Communications 759 10%
Transportation 624 2%
Automotive components 540 2%
Real estate 531 10%
Food and tobacco 512 10%
Chemicals 445 5%
Other 4186 -5%
Total 12644 -3%Source: fDiMarkets
Capital investment
Key trends in 2016 include:
• Real estate has claimed the top spot for capital investment,with $157.5bn of announced FDI recorded in 2016, following anincrease of 58%.
• The top three sectors by project numbers in 2016 were softwareand IT services, business services and industrial machinery,equipment and tools. Combined, these sectors account for34% of all FDI globally.
• Software and IT services maintained its place as the top sector byproject numbers, with 1984 in 2016. This was despite the numberof projects declining 3%.
• Of the top five sectors by project numbers, communications,which ranked fifth, was the only sector to achieve growth in 2016,with the number of projects increasing 10% to 759.
• Industrial machinery, equipment and tools replaced financialservices as the third most prominent sector in 2016 despite a 13%decline in project numbers to 818.
• Coal, oil and natural gas, the top sector for FDI projects by capitalinvestment in 2015, has dropped to second place with a value of$121bn despite a 10% increase in the value of FDI projects.
• The renewable energy sector saw a 7% increase in projectnumbers, but capital investment dropped by 9% to $77.1bn.
• The number of projects in the financial services sector declinedin 2016 with its market share of global FDI dropping.
Sector analysis
THE fDi REPORT 2017 SECTOR ANALYSIS
$157.5bnReal estate has claimed the top spotfor capital investment, with $157.5bnof announced FDI recorded in 2016,
following an increase of 58%
Real estate
Coal, oil andnatural gas
Alternative/renewable energy
Communications
Transportation
Chemicals
Electroniccomponents
Software andIT services
Automotive OEM
Financial services
Other
157.5
121.0
77.1
42.0
30.2
29.7
28.7
27.2
24.5
24.3
213.8
Capital investment($bn) 2016
FDI by sectormarket share
20%
16%
10%
5%
4%
4%
4%
4%
3%
3%
28%
Source: fDiMarketsNote: Includes estimates

About usfDi Intelligence is a specialist division of The Financial Times Ltdestablished to provide industry leading insight into globalisationwith a portfolio of world-class products, services and business toolsthat allow organisations such as investment promotion agencies,companies, services providers and academic institutions tomakeinformed decisions regarding FDI and associated activities.
Products and services include:fDiMarkets– the only online database tracking crossbordergreenfield investment covering all sectors and countries. It providesreal-timemonitoring of investment projects, capital investment and jobcreationwith tools to track andprofile companies investing overseas.
fDi Benchmark – the only online tool to benchmark thecompetitiveness of countries and cities in more than 70 sectors.Its comprehensive location data series covers themain cost andquality competitiveness indicators for more than 600 locations.
fDi Reports – provides sector, country, company and bespoke FDIreports which deliver business intelligence to corporations, IPAs,development organisations, consulting firms and research institutions.
fDi Magazine – firmly established as the world’s premierpublication for the business of globalisation. Published on a bi-monthly basis with an ABC-certified, highly targeted circulation ofmore than 15,000, fDi provides corporate decision-makers with anup-to-date image of the ever-changing global investmentmap.
GIS Planning – an online service which provides thecomprehensive demographic and industry data businesses needtomake successful location decisions in your community. VisitGISPlanning.com for more information.
About fDi Intelligence
The report is based on the fDiMarkets database of The FinancialTimes Ltd, which tracks greenfield investment projects. It does notincludemergers and acquisitions or other equity-based or non-equityinvestments. Only new investment projects and significant expansionsof existing projects are included. fDiMarkets is themost authoritativesource of intelligence on real investment in the global economy, andthe only source of greenfield investment data that covers all countriesand industries worldwide. Retail projects have been excluded from thisanalysis but are tracked by fDiMarkets.
The data presented includes FDI projects that have either beenannounced or opened by a company. The data on capital investmentand job creation is based on the investment the company ismaking atthe time of the project announcement or opening. As companies canraise capital locally, phase their investment over a period of time, and canchannel their investment through different countries for tax efficiency,the data used in this report is different to the official data on FDI flows. Thedata from fDiMarkets ismore accurate and a real-time indicator of thereal investment companies aremaking in their overseas subsidiaries.
The data shown includes estimates for capital investment and jobcreation derived from algorithms (patent pending) when a companydoes not release the information.
Note that the investment projects tracked by fDiMarkets are beingconstantly updated and revised based on new intelligence being receivedand the underlying algorithms are constantly improving their accuracyover time. The data presented in this reportmay therefore differ slightlyfrom the real-time data available atwww.fDimarkets.com.
The World Bank, Unctad, the Economist Intelligence Unit andmorethan 100 governments around the world as well as major corporationsuse the data as the primary source of intelligence on greenfieldinvestment trends.
About thedata
Published by TheFinancial Times LtdNumber OneSouthwark BridgeLondon SE1 9HL
© The FinancialTimes Ltd 2017
For further information,please contact;
[email protected]+44 (0) 20 7775 6365
[email protected]+ 44 (0)207 775 6667
EditorCourtney Fingar
Contributing editorDr Henry Loewendahl
ContributorsGeraldine Ewing, Christine McMillan,Julie Reynolds, Edna Rodriguez, JuliaKlotzer, Naomi Davies, Katie Morrison,James Whitten
Contributors
fDiIntelligence.com
Related Documents