Welcome message from author
This document is posted to help you gain knowledge. Please leave a comment to let me know what you think about it! Share it to your friends and learn new things together.
Transcript

denniswu
Typewriter
denniswu
Typewriter

THAILAND EQUITY RESEARCH
Page | 1 | PHILLIP SECURITIES (THAILAND)
MCI (P) 019/11/2014 Ref. No.: TH2015_0392
Samart Telcoms
2HFY15 earnings seen robust growth
THAILAND | SET | ICT | INITIATION OF COVERAGE BLOOMBERG SAMTE TB l REUTERS SAMTEL.BK
Thailand leading satellite communication operator SAMTEL provides range of satellite communication services with five business groups: 1) network services, 2) system integration, 3) innovation business application solutions, 4) ICT outsourcing services and services, and 5) IP business. 2HFY15 earnings look bright in “Digital APCO” In the first half of 2015, revenue from sales and services fell 21% y-y to Bt2,836 mn, blaming a delay in bidding projects from the public parties. Yet SAMTEL’s profitability remained intact. Some of its backlog projects yielded high margin that pushed total gross margin up to 22.43% from 18.72% a year earlier. In the face of the drastic drop in revenue amid wider margin, net profit fell 37% y-y to Bt250mn, which accounted for 38% of our full-year forecast. We however believe the second-half earnings will pick up after the newly won Bt3.3bn Digital APCO pushed total backlog up to Bt1.2bn, of which 40% will be recognized over course of the year. For the whole-year 2015, we expect revenue from sales and services to grow 7.4% to Bt7,089mn on the back of the potentially ample revenue recognition, and more new projects as bid for the public projects has loomed. Gross margin would stay flat at 20.20% as SAMTEL has still shouldered burden of high expenses for some projects. As such, net profit would decline 7% to Bt659mn. FY16 net profit seen up 30% In 2016, SAMTEL is expected to recognize the remaining 60% of its current revenue backlog, and we are positive the company will add more projects to its portfolio as the public parties are expected to set up more bids for satellite communication projects in the period. Based on the assumptions and SAMTEL’s previously high winning rate, we expect revenue from sales and services to grow 22% to Bt8,623mn but gross margin would stay flat at 20.06% as the large-scale projects literally face fiercer competitions. ‘BUY’ rating with FY16 target price of Bt24.70/share We have a ‘BUY’ call for SAMTEL with a FY16 price target of Bt24.70/share as the company is expected to win a greater number of projects, particularly from the public parties that should be an upside to earnings growth.
Closing Price(Bt) 22.10
Target Price(Bt) 24.70 (+11.76%)
COMPANY DATA
O/S Shares (mn) : 618
Market Cap. (Btmn) :
Market Cap. (USDmn) :
52-WK Hi/Lo (Bt) : 29.25/16.6
3M Average Daily T/O (mn) : 1.02
Par Value (Bt) : 1.00
MAJOR SHAREHOLDERS (%)
1. SAMART 70.1
2. BBL 4.9
3. NVDR 2.4
PRICE PERFORMANCE (%)
1MTH 3MTH 1YR
ABS 15% 4% 4%
REL TO SET INDEX 11% 8% 13%
PRICE VS SET INDEX
Source: Bloomberg, PSR
KEY FINANCIALS
FYE Dec FY13 FY14 FY15E FY16E
Sales(Btmn) 9,251 6,598 7,089 8,623
Net Profit(Btmn) 857 705 659 855
EPS (Bt) 1.39 1.14 1.07 1.38
P/E (X) 15.9 19.4 20.7 16.0
BVPS (Bt) 5.15 5.63 6.04 6.65
P/B (X) 4.3 3.9 3.7 3.3
DPS (Bt) 0.75 0.65 0.65 0.78
Dividend Yield (%) 3.4 2.9 2.9 3.5
ROE (%) 29.16 21.19 18.28 21.79
Debt/Equity (X) 2.93 1.57 1.64 1.54
Source: Company, PSR Est.
**Multiples and yields are based on latest closing price
VALUATION METHOD
PE'16 (17x)
Rutsada Tweesaengsakulthai
Securities Investment Analyst#17972
Tel: 66 2 635 1700 # 482
Hathaichanoke Moonwong
Assistant Analyst
13,658
387
27 August 2015
Buy
16 October 2015
0
10
20
30
Oct-12 Oct-13 Oct-14 Oct-15
SAMTEL TB EQUITY SETI (rebased)
Page | 2 | PHILLIP SECURITIES (THAILAND)
SAMTEL INITIATION OF COVERAGE
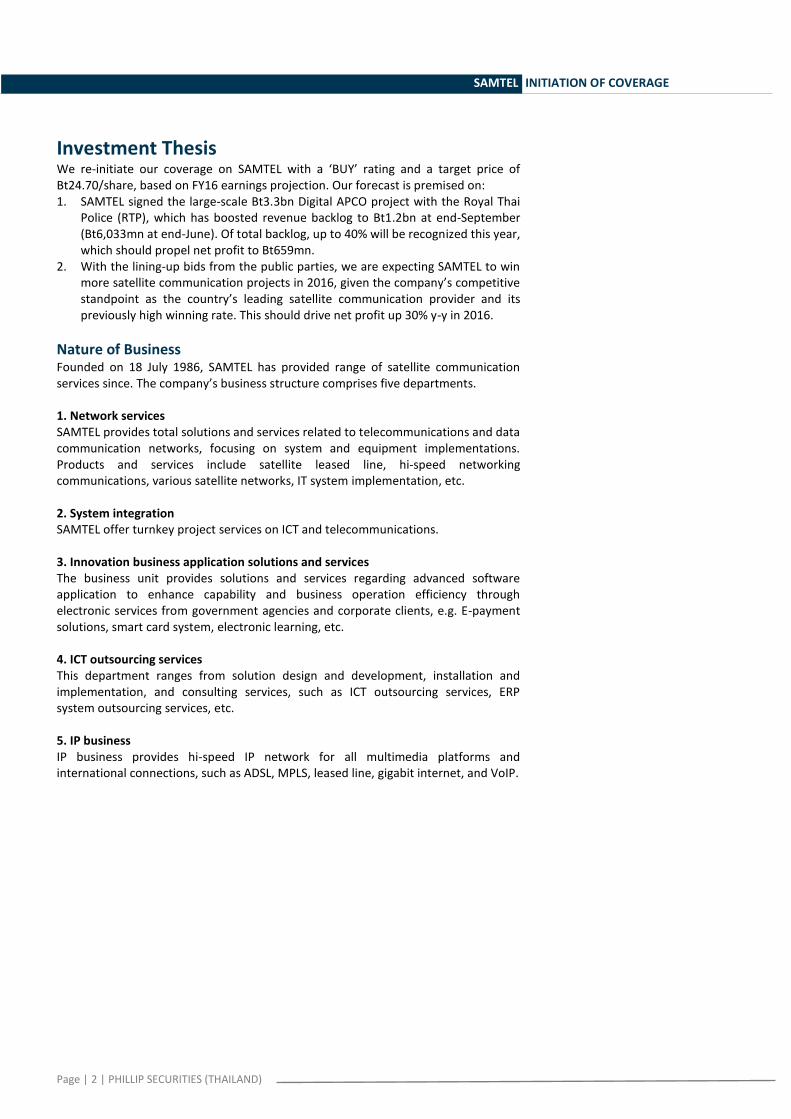
Investment Thesis We re-initiate our coverage on SAMTEL with a ‘BUY’ rating and a target price of Bt24.70/share, based on FY16 earnings projection. Our forecast is premised on: 1. SAMTEL signed the large-scale Bt3.3bn Digital APCO project with the Royal Thai
Police (RTP), which has boosted revenue backlog to Bt1.2bn at end-September (Bt6,033mn at end-June). Of total backlog, up to 40% will be recognized this year, which should propel net profit to Bt659mn.
2. With the lining-up bids from the public parties, we are expecting SAMTEL to win more satellite communication projects in 2016, given the company’s competitive standpoint as the country’s leading satellite communication provider and its previously high winning rate. This should drive net profit up 30% y-y in 2016.
Nature of Business Founded on 18 July 1986, SAMTEL has provided range of satellite communication services since. The company’s business structure comprises five departments. 1. Network services SAMTEL provides total solutions and services related to telecommunications and data communication networks, focusing on system and equipment implementations. Products and services include satellite leased line, hi-speed networking communications, various satellite networks, IT system implementation, etc. 2. System integration SAMTEL offer turnkey project services on ICT and telecommunications. 3. Innovation business application solutions and services The business unit provides solutions and services regarding advanced software application to enhance capability and business operation efficiency through electronic services from government agencies and corporate clients, e.g. E-payment solutions, smart card system, electronic learning, etc. 4. ICT outsourcing services This department ranges from solution design and development, installation and implementation, and consulting services, such as ICT outsourcing services, ERP system outsourcing services, etc. 5. IP business IP business provides hi-speed IP network for all multimedia platforms and international connections, such as ADSL, MPLS, leased line, gigabit internet, and VoIP.
Page | 3 | PHILLIP SECURITIES (THAILAND)
SAMTEL INITIATION OF COVERAGE
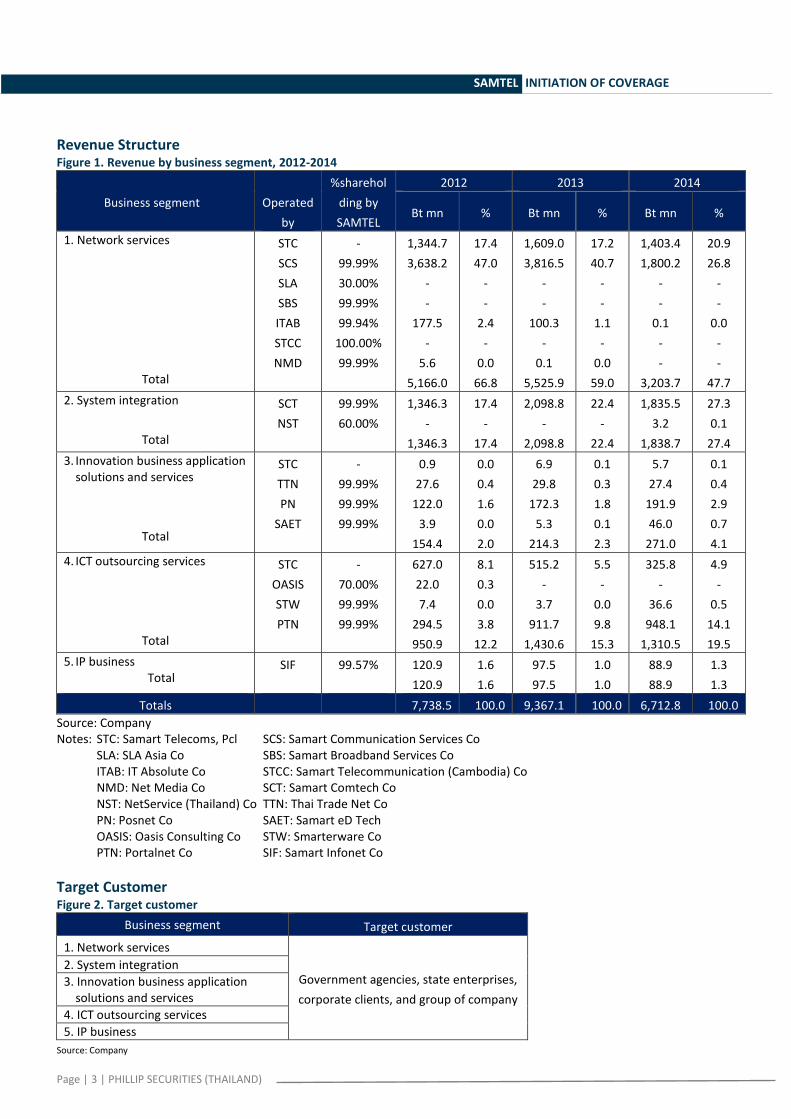
Revenue Structure Figure 1. Revenue by business segment, 2012-2014
Business segment
Operated
by
%sharehol
ding by
SAMTEL
2012 2013 2014
Bt mn % Bt mn % Bt mn %
1. Network services
Total
STC
SCS
SLA
SBS
ITAB
STCC
NMD
-
99.99%
30.00%
99.99%
99.94%
100.00%
99.99%
1,344.7
3,638.2
-
-
177.5
-
5.6
5,166.0
17.4
47.0
-
-
2.4
-
0.0
66.8
1,609.0
3,816.5
-
-
100.3
-
0.1
5,525.9
17.2
40.7
-
-
1.1
-
0.0
59.0
1,403.4
1,800.2
-
-
0.1
-
-
3,203.7
20.9
26.8
-
-
0.0
-
-
47.7
2. System integration
Total
SCT
NST
99.99%
60.00%
1,346.3
-
1,346.3
17.4
-
17.4
2,098.8
-
2,098.8
22.4
-
22.4
1,835.5
3.2
1,838.7
27.3
0.1
27.4
3. Innovation business application solutions and services
Total
STC
TTN
PN
SAET
-
99.99%
99.99%
99.99%
0.9
27.6
122.0
3.9
154.4
0.0
0.4
1.6
0.0
2.0
6.9
29.8
172.3
5.3
214.3
0.1
0.3
1.8
0.1
2.3
5.7
27.4
191.9
46.0
271.0
0.1
0.4
2.9
0.7
4.1
4. ICT outsourcing services
Total
STC
OASIS
STW
PTN
-
70.00%
99.99%
99.99%
627.0
22.0
7.4
294.5
950.9
8.1
0.3
0.0
3.8
12.2
515.2
-
3.7
911.7
1,430.6
5.5
-
0.0
9.8
15.3
325.8
-
36.6
948.1
1,310.5
4.9
-
0.5
14.1
19.5
5. IP business Total
SIF
99.57% 120.9
120.9
1.6
1.6
97.5
97.5
1.0
1.0
88.9
88.9
1.3
1.3
Totals 7,738.5 100.0 9,367.1 100.0 6,712.8 100.0
Source: Company Notes: STC: Samart Telecoms, Pcl SCS: Samart Communication Services Co SLA: SLA Asia Co SBS: Samart Broadband Services Co ITAB: IT Absolute Co STCC: Samart Telecommunication (Cambodia) Co NMD: Net Media Co SCT: Samart Comtech Co NST: NetService (Thailand) Co TTN: Thai Trade Net Co PN: Posnet Co SAET: Samart eD Tech OASIS: Oasis Consulting Co STW: Smarterware Co PTN: Portalnet Co SIF: Samart Infonet Co
Target Customer Figure 2. Target customer
Business segment Target customer
1. Network services
Government agencies, state enterprises,
corporate clients, and group of company
2. System integration
3. Innovation business application solutions and services
4. ICT outsourcing services
5. IP business
Source: Company
Page | 4 | PHILLIP SECURITIES (THAILAND)
SAMTEL INITIATION OF COVERAGE
Industry Trend and Forces Thailand information and communication technologies have been growing rapidly with investment budgets on this segment in both public and private parties rising over years. Regarding the public party, a change into new government proved no adverse impact on ICT budgets and the country’s policy has paid attention on ICT infrastructure development, such as digital economy. SAMTEL is the country’s leading satellite communication provider offering total solutions in telecommunication and networking infrastructure, applied technologies, ICT, internet access, etc. Bidding projects, particularly from the government agencies, are the major stream of revenue and the company appears to have a relatively stronger competitive edge given its long-run experiences and expertise in satellite communications, which allow the company to manage cost more efficiently than counterparts. More importantly, with high profile with the public sector, SAMTEL have been gaining an upper hand in winning project bidding. Risk factor 1. More intense competition would affect negatively investing and telecoms and
ICT expenses. 2. About 75% of total revenue comes from the public sector and state enterprises,
a decrease in telecoms and ICT budget may have a significantly adverse impact on the company’s earnings and financial position.
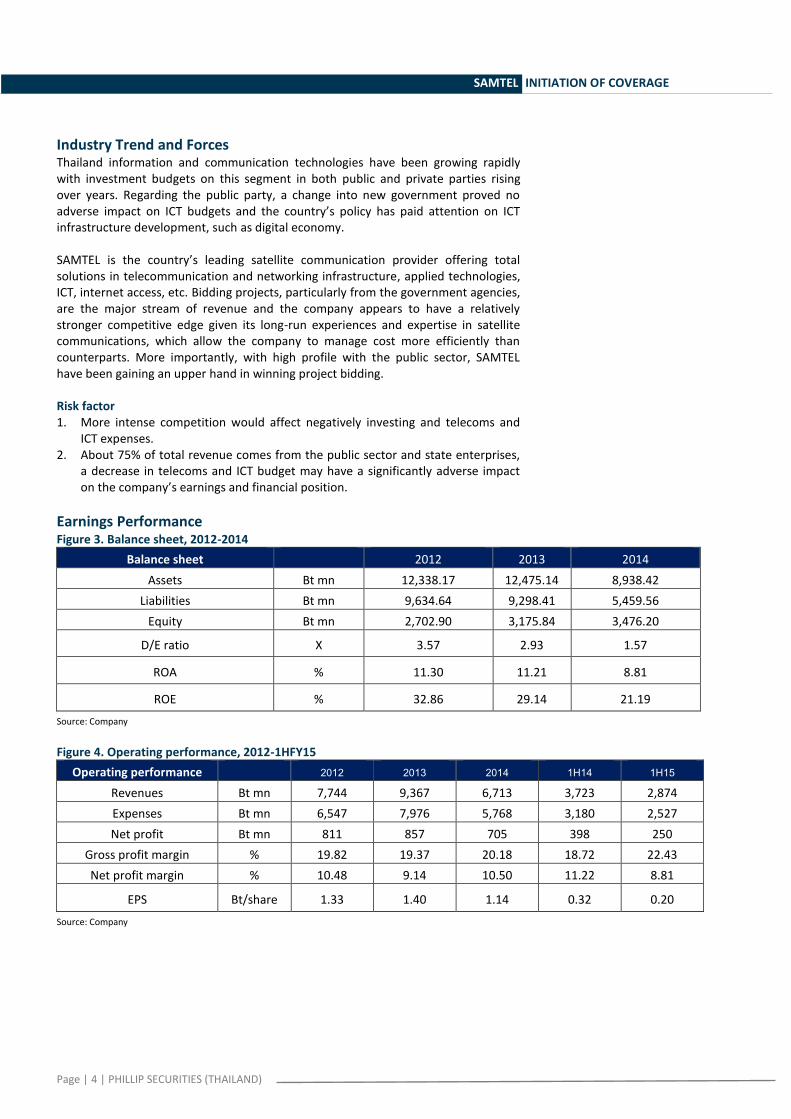
Earnings Performance Figure 3. Balance sheet, 2012-2014
Balance sheet 2012 2013 2014
Assets Bt mn 12,338.17 12,475.14 8,938.42
Liabilities Bt mn 9,634.64 9,298.41 5,459.56
Equity Bt mn 2,702.90 3,175.84 3,476.20
D/E ratio X 3.57 2.93 1.57
ROA % 11.30 11.21 8.81
ROE % 32.86 29.14 21.19
Source: Company
Figure 4. Operating performance, 2012-1HFY15
Operating performance 2012 2013 2014 1H14 1H15 Revenues Bt mn 7,744 9,367 6,713 3,723 2,874
Expenses Bt mn 6,547 7,976 5,768 3,180 2,527
Net profit Bt mn 811 857 705 398 250
Gross profit margin % 19.82 19.37 20.18 18.72 22.43
Net profit margin % 10.48 9.14 10.50 11.22 8.81
EPS Bt/share 1.33 1.40 1.14 0.32 0.20
Source: Company

Page | 5 | PHILLIP SECURITIES (THAILAND)
SAMTEL INITIATION OF COVERAGE
2HFY15 earnings likely to recover on newly awarded Digital APCO project SAMTEL registered the first-half revenue from sales and services of Bt2,836mn, which dropped 21% y-y, due to a delay of project bidding in the public sector. The company’s profitability however remained intact as some of project yielded decent margin, which pushed total gross margin up to 22.43% from a year-earlier 18.72%. As such, net profit plunged 37% y-y to Bt250mn, accounting for 38% of our FY15 forecast. We are growing optimistic about 2HFY15 earnings as SAMTEL added one more project into its portfolio. In Jul-Aug, the company signed three projects worth a combined Bt4,197mn, comprising AOT’s Bt3,250mn APPS project on 21 Jul, PEA’s Bt228mn AMR phase 2 on 10 Aug, and Department of Land’s Bt719mn phase 2 project on 31 Aug. Recently, the company won the Bt3.3bn Digital APCO phase 1 project—we expect the Cabinet to endorse the project within this week. With a greater number of project signings, the company’s backlog increased to Bt12bn and about 40% of which will be recognized as revenue in 2015. Based on the assumptions, we expect revenue from sales and services to grow 7.4% to Bt7,089mn in 2015 but gross margin would remain flat at 20.20% as SAMTEL continues to shoulder burden of high expense for some projects. Hence, net profit would fall 7% to Bt659mn this year. FY16 net profit seen up 30% y-y SAMTEL is likely to enjoy a busy time in 2016 with multiple lining bids of satellite communications from the government agencies, and its potential singing of more than Bt1,276mn new projects in 4QFY15, such as PEA’s Bt320mn AMR phase 1 maintenance project, a Bt200mn video conference, and other projects worth cBt756mn. With the said projects in picture, we believe SAMTEL to see a remarkable recovery in 2016. Revenue from sales and services would grow 22% to Bt8,623mn, largely on the back of its backlog—the remaining 60% of Bt12bn total backlog will be recognized. Gross margin would remain roughly flat at 20.06% as bids of large-scale projects that attract several bidders make the project become more cost-competitive. For this reason, net profit would increase 30% to Bt855mn in 2016. ‘BUY’ rating with FY16 target price of Bt24.70/share We have a ‘BUY’ call for SAMTEL with FY16 target price of Bt24.70/share as a number of signed projects, particularly from the public sector, looks likely to increase notably, which should be upside potential to future growth.

Page | 6 | PHILLIP SECURITIES (THAILAND)
SAMTEL INITIATION OF COVERAGE
Financials
Income Statement Cash Flow
FYE Dec, Btmn FY13 FY14 FY15E FY16E FYE Dec, Btmn FY13 FY14 FY15E FY16E
Revenue 9,251 6,598 7,089 8,623 CFO
EBITDA 2,308 1,989 2,014 2,317 PBT 1,022 729 701 901
Depreciation & Amortisation 917 1,044 1,104 1,197 Adjustments 1,185 1,215 1,313 1,416
EBIT 1,391 945 910 1,120 WC changes 305 1,939 195 (380)
Net Finance (Expense)/Inc (368) (215) (207) (220) Cash generated from ops 2,513 3,883 2,208 1,937
Other i tems 116 115 118 120 Others (610) (391) (250) (265)
Associates & JVs 0 (2) (2) 0 Cashflow from ops 1,903 3,492 1,958 1,671
Exceptional i tems 0 0 0 0 CFI
Profit Before Tax 1,022 729 701 901 CAPEX, net (643) (831) (1,000) (1,000)
Taxation (165) (30) (43) (46) Others 9 (60) 0 0
Profit After Tax 857 699 658 855 Cashflow from investments (634) (892) (1,000) (1,000)
Non-control l ing Interest 0 (6) (1) 0 CFF
Net Income, reported 857 705 659 855 Share i ssuance 0 0 0 0
Net Income, adj. 857 705 659 855 Loans , net of repayments (671) (2,073) 0 0
Dividends (460) (432) (402) (480)
Per share data Others 0 0 0 0
FYE Dec, Bt FY13 FY14 FY15E FY16E Cashflow from financing (1,131) (2,505) (402) (480)
EPS, reported 1.39 1.14 1.07 1.38 Net change in cash 5 61 181 (89)
EPS, adj. 1.39 1.14 1.07 1.38 Effects of exchange rates (0) (0) 0 0
DPS 0.75 0.65 0.65 0.78 CCE, end 563 657 1,213 1,405
BVPS 5.15 5.63 6.04 6.65
Valuation Ratios
Balance Sheet FYE Dec FY13 FY14 FY15E FY16E
FYE Dec, Btmn FY13 FY14 FY15E FY16E P/E (X), adj.** 15.7 19.1 20.4 15.8
Cash 562 657 1,213 1,405 P/B (X), adj.** 4.2 3.9 3.6 3.3
Investments 220 177 177 177 Dividend Yield (%) 3.4 3.0 3.0 3.6
Accounts Receivables 3,565 1,772 2,244 2,789
Inventories 341 353 338 397 Growth
Others 4,528 2,688 2,688 2,689 FYE Dec, % FY13 FY14 FY15E FY16E
Total current assets 9,217 5,647 6,661 7,457 Revenue 22.85 -28.67 7.44 21.64
PPE 2,849 2,746 2,675 2,511 EBITDA 22.34 -13.80 1.24 15.06
Intangibles 156 127 94 62 EBIT 16.18 -32.04 -3.74 23.14
Associates & JVs 0 7 5 7 Net Income, adj. 5.62 -17.75 -6.48 29.69
Investments 5 0 0 0
Others 246 411 411 411 Margins
Total non-current assets 3,257 3,291 3,186 2,991 FYE Dec, % FY13 FY14 FY15E FY16E
Total Assets 12,473 8,938 9,847 10,448 EBITDA margin 24.94 30.15 28.41 26.87
Short term loans 5,271 3,719 3,719 3,719 EBIT margin 15.04 14.32 12.83 12.99
Accounts Payables 2,414 837 1,489 1,713 Net Profi t Margin 9.26 10.68 9.30 9.91
Others 957 778 778 778
Total current liabilities 8,642 5,333 5,985 6,210 Key Ratios
Long term loans 591 61 61 61 FYE Dec FY13 FY14 FY15E FY16E
Others 65 65 65 65 ROE (%) 29.16 21.19 18.28 21.79
Total liabilities 656 126 126 126 ROA (%) 6.91 6.58 7.02 8.42
Non-control l ing interests 0 0 0 0 Net Debt/(Cash) (Btmn) 5,301 3,123 2,567 2,376
Shareholder Equities 3,175 3,479 3,735 4,111 Net Gearing (X) 0.70 0.54 0.50 0.47
Latest clos ing price
Source: Company Data, PSR est
**Based on latest closing price

Page | 7 | PHILLIP SECURITIES (THAILAND)
SAMTEL INITIATION OF COVERAGE

Page | 8 | PHILLIP SECURITIES (THAILAND)
SAMTEL INITIATION OF COVERAGE
Industry Group Name Sector Name Sector Index
Agro & Food Industry[AGRO] Agribusiness AGRI
Food & Beverage FOOD
Consumer Products[CONSUMP] Fashion FASHION
Home & Office Products HOME
Personal Products & Pharmaceuticals PERSON
Financials [FINCIAL] Banking BANK
Finance & Securities FIN
Insurance INSUR
Industrials [INDUS] Automotive AUTO
Industrial Materials & Machinery IMM
Packaging PKG
Paper & Printing Materials PAPER
Petrochemicals & Chemicals PETRO
Steel STEEL
Property & Construction[PROPCON] Construction Materials CONMAT
Construction Services CONS
Property Development PROP
Property Fund & REITs PF&REIT
Resources [RESOURC] Energy & Utilities ENERG
Mining MINE
Services [SERVICE] Commerce COMM
Media & Publishing MEDIA
Health Care Services HELTH
Tourism & Leisure TOURISM
Professional Services PROF
Transportation & Logistics TRANS
Technology [TECH] Electronic Components ETRON
Information & Communication Technology ICT
PSR Rating SystemCapital Gain Recommendation
> +10% Buy
0% to + 10% Neutral
< 0% Sell
Remarks
We do not base our recommendations entirely on the above quantitative return bands. We consider qualitative factors like (but not limited to) a
stock's risk reward profile, market sentiment, recent rate of share price appreciation, presence or absence of stock price catalysts, and speculative
undertones surrounding the stock, before making our final recommendation

5641029Hong Kong Representatives Contact Information
Research
Louis Wong Director (852) 22776892 [email protected]
Kay Ng Research Analyst Software (852) 22776751 [email protected]
Zhang Jing Research Analyst Transportation and Automobiles (86) 21 51699400-103 [email protected]
Chen Xingyu Director, Research Department, Shanghai Mainland Financial (86) 21 51699400-105 [email protected]
Fan Guohe Research Analyst TMT (86) 21 51699400-110 [email protected]
Chen Geng Research Analyst Mainland Property (86) 21 51699400-107 [email protected]
Sales
Aric Au Manager, Corporate & Institutional Sales (852) 22776783 [email protected]
Matthew Wong Manager, International Sales (852) 22776678 [email protected]
Yoshikazu Shikita Manager, International Sales (Japan Team) (852) 22776624 [email protected]

PHILLIP RESEARCH STOCK SELECTION SYSTEMS
We do not base our recommendations entirely on the above quantitative return bands. We consider qualitative factors like (but not limited to) a stock's risk reward profile, market sentiment, recent rate of share price appreciation, presence or absence of stock price catalysts, and speculative undertones surrounding the stock, before making our final recommendation
GENERAL DISCLAIMER
This publication is distributed in Hong Kong by Phillip Securities (Hong Kong) Limited (“PSHK”), which is licensed in Hong Kong by the Securities and Futures Commission for regulated activities, including Type 4 regulated activity (advising on securities). This publication was originally prepared by analysts from our overseas affiliates. The information contained herein is based on sources that PSHK and its affiliates believe to be accurate and any analysis, forecasts, projections, expectations and opinions contained in this publication are based on such information and are expressions of belief only. This material is prepared for general circulation to clients and is not intended to provide tailored investment advice and does not take into account the individual financial situation and objectives of any specific person who may receive this report. Investors should seek financial advice regarding the appropriateness of any investments or securities discussed or recommended in this report. This report is not (and should not be construed as) a solicitation to act as securities broker or dealer in any jurisdiction by any person or company that is not legally permitted to carry on such business in that jurisdiction. This research report may not be redistributed, retransmitted or disclosed, in whole or in part or and any form or manner, without the express written consent of PSHK. Please direct any enquiries to [email protected]. Investment involves risks. For details of product risks, please view the Risk Disclosures Statement on http://www.phillip.com.hk.”
Total Return Recommendation Rating Remarks
>+20% Buy 1 >20% upside from the current price
+5% to +20% Accumulate 2 +5% to +20%upside from the current price
-5% to +5% Neutral 3 Trade within ± 5% from the current price
-5% to -20% Reduce 4 -5% to -20% downside from the current price
<-20% Sell 5 >20%downside from the current price

Phillip Group Global Presence
SINGAPORE
Phillip Securities Pte Ltd
HONG KONG Phillip Securities (HK) Ltd
INDONESIA PT Phillip Securities Indonesia
THAILAND Phillip Securities (Thailand) Public Co. Ltd
UNITED KINGDOM King & Shaxson Capital Limited
AUSTRALIA PhillipCapital Australia
MALAYSIA Phillip Capital Management Sdn Bhd
JAPAN PhillipCapital Japan K.K.
CHINA Phillip Financial Advisory (Shanghai) Co. Ltd
FRANCE King & Shaxson Capital Limited
UNITED STATES Phillip Futures Inc
Related Documents