EDGEWOOD CHEMICAL BIOLOGICAL CENTER u.s. ARMY RESEARCH, DEVELOPMENT AND ENGINEERING COMMAND ECBC-TR-316 WORKPLACE BREATHING RATES: DEFINING ANTICIPATED VALUES AND RANGES FOR RESPIRATOR CER,.IFICATION TESTING David M. Caretti Paul D. Gardner RESEARCH AND TECHNOLOGY DIRECTORATE Karan M. Coyne OAK RIDGE INSTITUTE FOR SCIENCE AND EDUCATION Oak Ridge, TN 37831 September 2004 Approved for public release; distribution is unlimited. ABERDEEN PROVING GROUND, MD 21010·5424

Welcome message from author
This document is posted to help you gain knowledge. Please leave a comment to let me know what you think about it! Share it to your friends and learn new things together.
Transcript

EDGEWOOD CHEMICAL BIOLOGICAL CENTER
u.s. ARMY RESEARCH, DEVELOPMENT AND ENGINEERING COMMAND
ECBC-TR-316
WORKPLACE BREATHING RATES: DEFINING ANTICIPATED VALUES AND RANGES
FOR RESPIRATOR CER,.IFICATION TESTING
David M. Caretti Paul D. Gardner
RESEARCH AND TECHNOLOGY DIRECTORATE
Karan M. Coyne
OAK RIDGE INSTITUTE FOR SCIENCE AND EDUCATION Oak Ridge, TN 37831
September 2004
Approved for public release; distribution is unlimited.
ABERDEEN PROVING GROUND, MD 21010·5424

Form Approved REPORT DOCUMENTATION PAGE I OMB No. 0704-0188
Public reporting burdenfor this collection of information is estimatedto everege 1 hour per response, including the time for reviewing instructions,searching existing date sources,gathering end maintainingthe data needed, end completing end reviewing this collection of information. Send comments nsgardingthis burden estimate or eny other aspect 01 this collection of information, includingsuggestions for reducing this burden to Department of Defense,washington HeadquartersServices, Directorate for Information Operations and Reports (0704-01BB), 1215 Jefferson Devis Highway,Sune 1204,Arlington, VA 222024302. Respondents should be aware that notwithstanding any other provision of law, no person shall be subject to eny panelly for failing to comply with e collection of information ~ n does not display a currently valid OMB control number. PLEASE DO NOT RETURN YOUR FORM TO THE ABOVE ADDRESS.
1. REPORT DATE (DD-MM-YYYY) I2. REPORT TYPE
XX-09-2004 Final 4. TITLE AND SUBTITLE
Workplace Breathing Rates: Defining Anticipated Values and Ranges for Respirator Certification Testing
3. DATES COVERED (From To)
Sen 2003 - Am 2004 Sa. CONTRACT NUMBER
5b. GRANT NUMBER
5c. PROGRAM ELEMENT NUMBER
6. AUTHOR(S)
Caretti, David M.; Gardner, Paul D. (ECBC); and Coyne, Karen M. (Oak Ridge Institute for Science and Education)
5d. PROJECT NUMBER
62262255200 5e. TASK NUMBER
Sf. WORK UNIT NUMBER
7. PERFORMING ORGANIZATION NAME(S) AND ADDRESS(ES) AND ADDRESS(ES)
DIR, ECBC, ATTN: AMSRD-ECB-RT-PR, APG, MD 21010-5424 Oak Ridge Institute for Science and Education, Oak Ridge, TN 37831
8. PERFORMING ORGANIZATION REPORT NUMBER
ECBC-TR-3l6
9. SPONSORING I MONITORING AGENCY NAME(S) AND ADDRESS(ES)
Office of Law Enforcement Standards/NIST, Gaithersburg, MD 20899-8102 National Personal Protective Technology/NIOSH, Pittsburgh, PA 15236
10. SPONSORIMONITOR'S ACRONYM(S)
11. SPONSORIMONITOR'S REPORT NUMBER(S)
12. DISTRIBUTION I AVAILABILITY STATEMENT
Approved for public release; distribution is unlimited.
13. SUPPLEMENTARY NOTES
14. ABSTRACT
Test methods currently used by the National Institute for Occupational Safety and Health (NlOSH) are designed to assure that respirators meet a minimum level of efficacy when tested under standard laboratory protocols. For air-purifying respirators (APRs), the primary performance tests most affected by airflow rate are filter gas-life capacity, particulate filter efficiency, and respirator breathing resistances. Presently, NIOSH measures all three parameters using constant-rate airflow conditions. An analysis of the measured and estimated minute volumes contained in the literature indicated a range from about 8 to 162 L'min" for unencumbered ventilation and work activities that spanned from mild to exhaustive. The mean minute volume ofthe distribution was 38.5 ± 16.6 L'min-t, and the median was 33.6 L'min". Based on an empirical relationship between minute volume and peak inspiratory flow (PIF), peak flows between 72 L'min-1 and 183 L'min' would be expected for the mean minute volume for 38.5 L'min". The anticipated range ofPIF rates for the 95 th percentile minute volume is between 182 L'min" and 295 Lrnin", The results of this literature review suggest an increase in cyclic flow rates used for respirator certification testing should be considered to better represent ventilation rates found in the workplace. 15. SUBJECT TERMS
Breathing Minute volume Peak flow rate Respirators Workplace 16. SECURITY CLASSIFICATION OF: 17. LIMITATION OF
ABSTRACT
a. REPORT b.ABSTRACT c. THIS PAGE
U U U UL
18. NUMBER OF 19a. NAME OF RESPONSIBLE PERSON PAGES Sandra J. Johnson
19b. TELEPHONE NUMBER (include areacode)
69 (410) 436-2914 Standard Form 298 (Rev. 8-98) Prescribed by ANSI Sid. Z38.18

EXECUTIVE SUMMARY
Test methods currently used by the National Institute for Occupational Safety and Health (NIOSH) are designed to assure that all respirators of a given type will meet a minimum level of efficacy when tested under standard laboratory protocols. The relevance and adequacy of airflow rates used in respirator certification testing has been a longstanding debate. The concern is that the current test flow rates substantially underestimate real world values, implying that filters certified under existing standards may not provide adequate protection. For qualifying airpurifying respirators (APRs), the primary performance tests most affected by airflow rate are filter gas-life capacity, particulate filter efficiency, and respirator breathing resistances. Presently, NIOSH measures all three parameters using steady, constant-rate airflow conditions. This report reviews concepts ofhuman respiration pertinent to respirator certification, describes ventilation rates reported for occupational work activities, and reviews the impacts of respirator wear on ventilation.
The standard measure of respiration used to quantify respirator performance is minute volume, which represents the volume of air exhaled in one minute. Other ventilatory parameters of interest are peak inspiratory flow rate (PIF) and mean inspiratory flow rate. The instruments required to accurately quantify these ventilatory parameters are cumbersome and, thus, are impractical to use during most occupational activities. As a result, few data are available that quantify workplace activities. The data from many work rate studies present values for metabolic workload measured as oxygen consumption rate or heart rate. Empirical relationships
I~ developed by Hagan and Smith (51) and Baba et al. (10) were used to estimate minute volumes from the oxygen consumption rates. This allowed the inclusion of a greater number of studies and permitted analysis over a wider range of occupational activities.
An analysis ofthe measured and estimated minute volumes indicated a range from about 8 to 162 L'min- l for unencumbered ventilation and work activities that spanned from mild to exhaustive. The mean minute volume of the distribution was 38.5 ± 16.6 L'min- l and the median was 33.6 L·min- l
. The mean is similar to the 40 L'min- l cyclic flow rate currently employed in system-level chemical agent testing required by the NIOSH for certification of Self-Contained Breathing Apparatus (SCBA) and APRs to chemical, biological, radiological, and nuclear (CBRN) standards. However, a higher cyclic flow rate may be necessary to account for a greater percentage ofventilation rates that occur in the workplace as the 95th percentile for minute volume was 73.3 L·min-1. If the desire is to encompass a higher percentage ofpossible ventilation rates independent of the workplace, the recommendation would be to use the maximum minute volume of 114 ± 23 L'min-l measured by Blackie et al. (15) for 20 to 29 year old males during maximal exercise.
The literature review indicated that PIF rates generally increase exponentially with increasing work rate. Based on an empirical relationship between minute volume and PIF, peak flows between 72 L'min- l and 183 L'min' would be expected for the mean minute volume of 38.5 Lrnin". The anticipated range of PIF rates for the 95th percentile minute volume is between 182 L'min" and 295 L·min- l
. Thus, a PIF of approximately 300 L'min- l would adequately represent 95% of the peaks occurring during occupational task performance. However, PIF rates in excess of 300 L'min- l have been measured during high intensity work. Estimates of PIF rates
3
based on the minute volumes measured by Blackie et al. (15) indicate that the upper limit of PIF rate is between 430 and 500 L'min". However, application of a constant airflow rate of equal to the PIF upper limit would not be representative of real use conditions for most, if not all, respirator types. Therefore, it is recommended to test PIF impacts under cyclic flow conditions representative of human ventilation to gain an understanding of respirator or filter performance under extreme flow conditions.
According to the literature, respirator wear has little impact on the minute volumes measured during resting and low intensity work conditions. However, maximum values for minute volume and PIF will generally be lower than those achieved for unmasked test activities, particularly during heavy work with APR and SCBA respirators. Supplied air systems appear to have less of an impact on ventilation by comparison. Despite the apparent dampening impacts of APR and SCBA systems on maximum ventilation values, the current recommendation is to utilize data for the unencumbered state for test flow rates and not to establish multiple flow rate criteria based on respirator types.
This review reemphasized the gap in data pertaining to human breathing responses to real-world daily activities. Despite the potential shortcomings of the empirical relationships used for estimating minute volumes and PIF rates, this review serves as a first step towards defming ventilation responses in the workplace. These findings suggest that an increase in cyclic flow rates used for CBRN certification testing should be considered to better represent ventilation rates found in the workplace.
/"""'" \
4

PREFACE
The work described in this report was authorized under Project No. 62262255200, Research, Development, Testing and Evaluation. This work was started in September 2003 and completed in April 2004.
The use of either trade or manufacturers' names in this report does not constitute an official endorsement of any commercial products. This report may not be cited for purposes of advertisement.
This report has been approved for public release. Registered users should request additional copies from the Defense Technical Information Center; unregistered users should direct such requests to the National Technical Information Service.
Acknowledgments
This project was supported in part by an appointment to the Research Participation Program for the u.S. Army Edgewood Chemical Biological Center (ECBC) and administered by the Oak Ridge Institute for Science and Education through an agreement between the U.S. Department ofEnergy and ECBC. The authors would like to thank the Office ofLaw Enforcement Standards, National Institute of Standards and Technology and the National Personal Protective Technology Laboratory, National Institute for Occupational Safety and Health for funding this project.
5
CONTENTS
EXECUTIVE SUMMARY 3
1. INTRODUCTION 9
2. BACKGROUND 10 2.1 Measuring Ventilation 11 2.2 Measuring Energy Expenditure Rates 13 2.3 Classification of Work Based on Oxygen Consumption 14 2.4 Estimation ofVentilation Using Oxygen Consumption 15
3. LTNENCUMBERED VENTILATION 19 3.1 Minute Ventilation During Maximal Exercise 19 3.2 Peak Inspiratory Flow Rates During Exercise 21 3.3 Speech Ventilation and PIF 24
4. VENTILATION FOR SPECIFIC PHYSICAL ACTIVITIES 25 4.1 Ventilation Rates Recorded at Worksites or During Simulated Workplace
Activities 25 4.2 Estimates ofVentilation From Energy Expenditure Studies 28 4.3 Summary ofMeasured and Estimated Ventilation Rates for Occupational Tasks .35
f' ~..
5. VENTILATION WITH IMPOSED BREATHING RESISTANCE .36 5.1 Non-Respirator Applied Resistive Breathing Loads .37 5.2 Respirator Resistive Loads 39 5.3 Air-purifying Respirators 39 5.4 Positive-Pressure Respirators 40 5.5 Self-Contained Breathing Apparatus .41 5.6 Workplace Studies with Respirators .42 5.7 Air-purifying Respirators in the Workplace .42 5.8 Positive-Pressure Respirators During Work Activities .43 5.9 SCBA Wear During Work Performance .45
6. CONCLUSIONS AND RECOMMENDATIONS .46
7. FUTURE CONSIDERATIONS 47
LITERATURE CITED 49
APPENDIX - ESTIMATES OF VENTILATION BASED ON OCCUPATIONAL METABOLIC RATES FROM ISO 8996 AND THE COMPENDIUM OF PHYSICAL ACTIVITIES 61
r>. r \
7

FIGURES
1. Plot of 17E and 1702 Data Obtained From Selected Literature Compared to the Exponential Functions Described by Hagan and Smith and Baba et al 19
2. Relationship of 17E and PIF Determined From Data Reported by Silverman et al. and Coyne 23
3. Distribution of Ventilation Rates Measured or Estimated From Occupational Activity Literature Fitted with a Normal Distribution .36
TABLES
1. Classification ofPhysical Work Based on Metabolic and Ventilatory Parameters 16
2. Mean Values for Ventilation at the End ofMaximum Exercise 20
3. Mean Values for Ventilation (17E ) by Group Measured During Activities Assessed by Adams 27
4. Estimated Minute Volumes Based on Oxygen Consumption Data Obtained From Select Energy Expenditure Publications .30
..'\
8

WORKPLACE BREATHING RATES: DEFINING ANTICIPATED VALUES AND RANGES
FOR RESPIRATOR CERTIFICATION TESTING
1. INTRODUCTION
Test methods currently used by approval agencies are designed to assure that all respirators of a given type will meet a minimum level of efficacy when tested under standard laboratory protocols. The primary performance parameters most affected by airflow rate that are used to qualify air-purifying respirators (APRs) are filter gas-life capacity, particulate filter efficiency, and respirator breathing resistances. Presently, the National Institute for Occupational Safety and Health (NIOSH) measures all three parameters using steady, constant-rate airflow conditions. NIOSH-approved non-powered APR chemical cartridges and canisters (filter systems) are tested at a constant flow rate of 64 liters per minute (L·min-1). Powered air-purifying respirator chemical filters are tested at 115 or 170 L'min-1constant flow. All NIOSH-approved particulate filters are tested using an 85 Lrnin" flow rate. For all filter testing, the airflow is divided equally between the number of filters used in the filter system (usually one to three depending on the type and design of the respirator). The breathing resistance for all non-powered APRs is measured in the breathing zone of the respirator, mounted on a test fixture, using a constant flow rate of85 Lrnin". This flow rate is based on the assumption that 85 Lrnin" represents the maximum average flow rate into or out of the lungs during 30 minutes
/"> of sustained work.
The relevance and adequacy of airflow rates used in respirator certification testing has been a longstanding debate. The concern is that the current test flow rates substantially underestimate real world values, implying that filters certified under existing standards may not provide adequate protection. In general, the gas life provided by a respirator filter will decrease with increased airflow velocity since the time the contaminant stays in contact with the sorbent material (residence time) is significantly reducedY8, 109, 122) Thus, high peak flow rates during inhalation can result in shorter filter breakthrough times.(88) Filter gas-life performance against chemi-adsorbed contaminants, as opposed to those removed by physical adsorption, is particularly impacted since the residence time can be too short to allow sufficient reaction with the impregnates. The contaminant will thus penetrate the sorbent bed much quicker than if the filter was challenged under more moderate airflow conditions.
The collection efficiency of both mechanical and electret particulate filters will also decrease with increasing airflow velocity due to a shift towards the lower end of the size range of the most penetrating particle size (MPPS).(83, 85) For respirator filters the MPPS ranges from approximately 0.1 to 0.3 urn count median diameter.P'" 123) In general, electret filters are more prone to penetration ofparticles under high flow conditions. This is true because high flow rates reduce the residence time that is needed for particles to be effectively captured by the two most prevalent electrostatic capture mechanisms (electrophoretic and dielectrophoretic capture).(37, 123)
In addition to concerns about filter performance, some have questioned the ability of supplied air pressure-demand systems to maintain positive pressure within a respirator so that no
9
inward leakage ofa toxin would occur in the absence of an ideal seal of the respirator to the face under heavy work conditions that produce inhalation airflows that exceed current certification flow rates yo, 119) Others have recently debated this same concern in reference to powered air-purifying respirators.V"
This report attempts to review the concepts ofhuman respiration pertinent to respirator certification, to describe ventilation rates reported for occupational work activities, and to review the impacts of respirator wear on ventilation. Since ventilation rates are not available and are not likely ever to be available for all physical activities, this review includes a wide range ofphysical activity studies that were utilized to provide estimates ofventilation rates for multiple occupational tasks. The adequacy ofcurrent respirator certification flow rates will be discussed based on the findings ofthis review.
2. BACKGROUND
A standard measure of respiration used to quantify respirator performance is minute volume (PE ), which is simply the volume of air that is exhaled in one minute. Minute volume (or minute ventilation) is equal to the product of the volume of air respired in each breath, or the tidal volume (VT), and the number ofbreaths in a minute (/). Minute volumes during the
inhalation cycle of breathing ( PI ) can also be determined if tidal volumes are measured during inhalation. However, the volumes of inhaled and exhaled air are usually slightly different ( PI ~ PE ) because the conducting airways of the respiratory system condition inhaled air by warming it to body temperature and saturating it with water vapor before it is exhaled. Nevertheless, for the purpose of this review, data for PI and PE will be considered equal unless otherwise stated.
At rest, minute volumes of respiration typically range between 5 and 8 L·min-I.(48) From
rest, minute ventilation increases semilinearly with increasing rates of exercise up to maximal levels. Ventilation rates as high as 200 L'min- I have been reported in extreme cases.o27
, 151)
Other ventilatory parameters of interest used to relate respirator performance to human respiration include peak inspiratory flow rate (PIF) and.mean inspiratory flow rate, or the ratio of tidal volume to inspiratory time (VTffI) . Peak inspiratory flow rate describes the maximum rate of airflow attained during inhalation. As previously mentioned, high peak flow rates can result in shorter contaminant breakthrough times of filtering elements. In addition, PIF rates have a direct impact on the ability of supplied-air, demand systems to maintain positive pressure within the breathing zone of a respirator. In order to maintain positive pressure during inhalation, any pressure-demand respirator's airflow capability must exceed PIF. Mean inspiratory flow rate (VTffI ) is an index of inspiratory motor input or drive that generally increases linearly with PE .(24, 105) In reference to respirator usage, VTffI serves as an indicator of the mean rate of airflow during inhalation and provides information concerning the duration of flow.
10
/">
r>.
2.1 Measuring Ventilation.
Several methods of measuring ventilatory volumes and flow rates can be used, either directly as part of a breathing circuit or indirectly to measure volumes from a collection container. While ventilatory flow is usually measured, many other parameters of the respiratory system can be derived from measured quantities ofvolume or flow. In general, ventilation and flow have been measured using gas meters, spirometers, pneumotachographs, turbine flow meters, rotameters, hot-wire anemometers, ultrasonic flowmeters and, to a lesser extent, plethysmographic techniques. For a detailed discussion of some of these methods, as well as the advantages and disadvantages of each, refer to Wasserman et al.(146) A brief discussion ofeach method follows.
A gas meter acts as a volumetric turnstile, sequentially filling compartments of known volume and recording the number of times each has been filled. It is classified as dry or wet, depending on the seal that is used in the mechanism. A dry gas meter is used to measure volumes of respired air collected in Douglas bags or meteorological balloons, or used directly in either the inspired or expired side ofa breathing valve circuit. A dry gas meter is better suited for a manually operated data collection set up with an intermittent collection of respired air.
Perhaps the oldest device to measure ventilatory volumes is the spirometer, which can be used to measure collected volumes, calibrate other volume and flow devices, or measure volumes directly in a manually operated system. A spirometer by itself only measures volumes. To measure flow (volume per unit time), a means of recording changes in volume with time must be devised. Spirometers can also be connected to a computer to obtain volumes and flow rates.
Turbine flow transducers use a lightweight impeller to directly measure airflow volumes. Rotation of the impeller can be related to airflow and respired air volumes using optical, electrical, or mechanical detection systems. Such devices have gained wide acceptance, particularly for breath-by-breath ventilatory measurements. However, the speed of the impeller is sensitive to water or saliva deposition.
Rotameters are widely used in gas delivery systems for continuous flow measurements. Most designs utilize a vertical tapered tube containing a bobbin or ball that is supported by the airflow as it passes upwards through the tube. Rotameter calibration is gas-specific so, for accuracy, its use must be restricted to the same gas or it must be re-calibrated if a new gas is used. Inaccuracy results from anything that causes the bobbin to stick in the tube. Backpressure caused by downstream airflow resistance also leads to inaccurately low readings.
In a hot-wire anemometer, an electrically heated wire is placed in the airflow pathway and is cooled by the flow. The degree ofcooling depends upon the flow rate, which can thus be derived. This cooling effect occurs with flow in either direction, so the hot-wire anemometer can be modified to determine both inspiratory and expiratory flows when placed on only one side of the breathing circuit. Hot-wire anemometry is generally extremely accurate.
Ultrasonic flowmeters work on the principle that when an ultrasound signal is being transmitted within a flowing gas, its velocity changes in proportion to that ofthe gas flow. When the gas flow and ultrasound signal are in the same direction, an increase in signal velocity occurs.
11
I

Conversely, when the signal is against the direction of gas flow, its velocity decreases. The usual .~.
design incorporates a pair of ultrasound beams aimed in opposite directions, each with a sensor. When no flow is present, the velocity of the two beams is equal, and pulses of ultrasound arrive at the sensors simultaneously. When flow occurs, there is a time difference between signal detection at the sensors from which gas velocity and flow rate can be calculated.
The pneumotachograph is the most common device used for flow measurements in respiratory mechanics. In a pneumotachograph (both Fleisch and screen pneumotachographs), a resistance is put in the gas flow pathway and the resulting pressure drop is measured rapidly and accurately using a differential pressure transducer, from which flow rate and volume are calculated. Pneumotachographs generate differential pressures proportional to the volume flow and viscosity of gas, but independent ofgas pressure.(l41) Flow-to-differential pressure calibration of a pneumotachograph depends on gas viscosity, temperature, and humidity, as well as the up- and downstream geometry of the tube.(141-143) A heating element is sometimes incorporated to prevent the build-up of condensation that could compromise accuracy. Thus, pneumotachographs require routine calibration under conditions as close as possible to those under which measurements are performed. Even so, the pneumotachograph has the advantages ofcompactness, low flow resistance, and suitability for accurate measurements ofairflow. Measurements can be made at various points in the breathing circuit, and a pair of sensors is often used so that inspired and expired volumes can be measured independently. The Fleisch pneumotachograph is available in six different sizes, with larger sizes intended for measuring higher flow rates. Flow rates developed by exercising adults generally indicate that a No.3 Fleisch pneumotachograph is appropriate, providing a balance between linearity in flow rates up ~
to 10 L·s-1and adequate sensitivity at low flowsy46)
Despite the utility of dry gas meters, spirometers, pneumotachographs, and turbine flow meters, all are somewhat invasive in that they require a direct connection to the breathing circuit and can cause minor alterations in an individual's natural pattern of'breathing.P': 71,110) Respiratory inductive plethysmography is the most widely accepted method for quantitative non-invasive respiratory measurements. Respiratory inductive plethysmography (RIP) employs sensors to measure changes in a cross-sectional area of the rib cage and abdominal compartments during a respiratory cycle. The sensors consist ofarrays of sinusoidally arranged copper wires woven into elastic bands that are excited by a low-current, high-frequency (300 kHz) electrical oscillator circuit. Movement of the rib cage or abdominal compartments causes the sensors to generate magnetic fields, which are measured as voltage changes over time (i.e., waveforms). In order to correlate a cross sectional area of the rib cage and abdominal compartments with respired volume, the device must be calibrated for each individual user using a spirometer. When properly calibrated, the RIP will provide reasonable estimates of volume and timing components of the breathing cycle. However, due to difficulties in maintaining positioning ofthe ribcage and abdominal sensor bands once calibration has been completed, acceptance ofRIP for measuring ventilation is limited to non-exercise studies ofventilation such as speech ventilation and clinical monitoring. Researchers that have attempted to use RIP for measuring ventilation during physical activities that exceed restin~ workloads have reported varying degrees ofprecision when compared to other standards.(20,22, 12 )
12

2.2 Measuring Energy Expenditure Rates.
Two general methods exist for measuring an individual's rate of energy expenditure: direct and indirect calorimetry. Direct calorimetry is based on the principle that the amount of heat output from the body provides a direct measure of metabolic rate. However, since techniques for collecting such data are unsuitable for field conditions, indirect measures of metabolism are commonly employed. Indirect calorimetry is based on knowledge of the oxidation rate of food energy, which is, in tum, dependent upon oxygen utilization by the metabolizing tissue.
For the purpose ofmost energy-expenditure studies, indirect calorimetry consists of measuring the volume of expired air per unit of time and determining the percentage of oxygen expired.(148) By calculating the difference between the percentage of oxygen in inspired and expired air, the percentage utilized is determined. This value is then multiplied by the volume of expired air and corrected to standard temperature and atmospheric pressure conditions (STPD) to determine the amount of oxygen consumed. Commonly referenced equipment and techniques available to measure the volume of expired air from a subject and to collect a sample of expired air for gas analysis include the Douglas bag method, commercially available and customized exercise test systems or metabolic carts for computer-controlled indirect calorimetry, and various ambulatory gas analysis systems such as the Max Planck or Kofranyi-Michaelis (K-M) respirometer, the Oxylog, the Cosmed K2 and K4, and the TEEM 100. All require use of a flow-measuring device within the breathing circuit for sample collections. Summary descriptions of this equipment can be found in Durnin and Passmore.P" Bassey and Fentem,(ll) Wasserman et
r>. a/.,(146) and Patton.(lll) A brief overview of select indirect calorimetry techniques is provided below.
The Douglas bag method is both simple and reliable for collecting expired air samples over periods of 5 to 15 minutes.(27) The limitations of this method result from interference with locomotive activity caused by the need to carry a cumbersome 100-200 L bag, and the limited duration of the collection or sampling period because of bag capacity. Once an expired air sample is collected, its percentage of oxygen is analyzed and the volume is then recorded using a dry gas meter.
The K-M respirometer, carried in knapsack fashion, is much smaller and lighter (3 kg) than the Douglas bag so that interference with normal activities is far less severe. The system uses a dry gas meter for measuring total expired air volume and temperature. An aliquoting device continuously extracts a small amount of each breath into a sampling bladder for subsequent analysis ofoxygen and carbon dioxide content in a laboratory. Thus, it can measure consumption over extended periods at low metabolic rates, although the sampling bladder generally fills after only 10 minutes during moderate work. The major limitation of the K-M respirometer is that its design causes the equipment to begin to resist airflow at high ventilation rates. Consequently, oxygen consumption levels tend to be under-recorded when VE exceeds approximately 60 L·min- I
. Nevertheless, this method has proved highly reliable for normal work activities. A comglete description of this apparatus and the sources of inaccuracy are provided in Consolazio et at. 27) and Consolazio.(26)
13
The Oxylog is a lightweight, battery-driven instrument for measuring oxygen consumption and ventilation. The instrument is equipped with a half-mask that has a turbine flow meter attached to the inspiratory port for measuring VI. The accuracy of the Oxylog has been validated in both laboratory and field tests that indicate the system is sufficiently accurate for field measurements of VE .(56,91) Likewise, the system appears to be well suited for studies in which duration and intensity ofactivities need to be well defined.(11)
The Cosmed K2 and newer K4 systems also measure breath-by-breath gas exchange and ventilation using a facemask connected to a portable unit. The system has been validated for both maximal and submaximal work intensities (57, 100) and shows a strong correlation to values obtained with a metabolic cart.(114)
Finally, the TEEM 100 (Total Energy Expenditure Measurement system) uses an open-circuit continuous sampling system for the measurement of oxygen uptake and a pneumotachograph is positioned in a facemask for measuring VE. The validity of the TEEM 100 has been demonstrated for submaximal exercise testing, but data recorded during maximum exercise testing indicates that VE data obtained with the TEEM 100 is significantly lower compared to a metabolic cart system.(lll)
An alternative to indirect calorimetry is monitoring activity heart rates. This technique is based on an association between heart rate and oxygen consumption or energy expenditure. This relationship, however, does not hold for either sedentary activities or very high levels ofexertion. Moreover, although the relationship ofheart rate to energy expenditure may be highly significant /"\ in a single subject at anyone time, it can vary considerably between individuals and within one individual under different conditions. In order to deal with these problems and increase the precision ofthe method, it is first necessary to establish heart rates and associated oxygen consumption rates for each subject for various levels ofphysical exertion. One must then develop a regression equation for each subject in order to estimate energy expenditure for monitored activities.
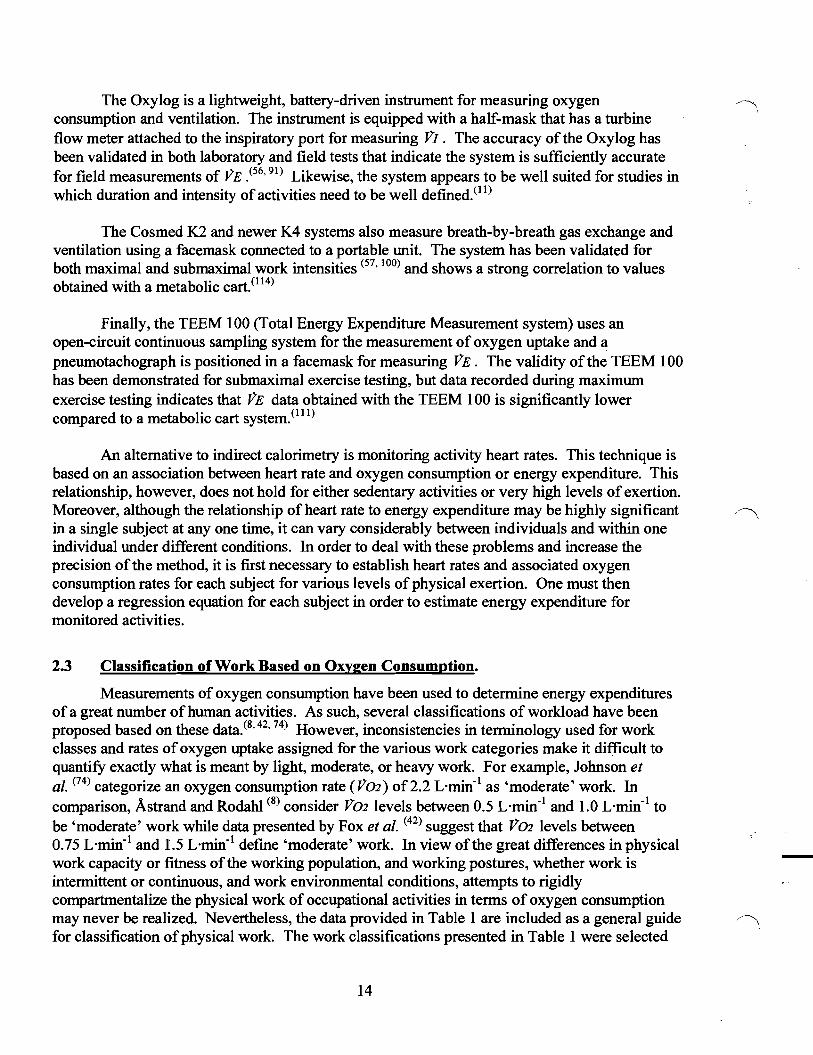
2.3 Classification ofWork Based on Oxygen Consumption.
Measurements of oxygen consumption have been used to determine energy expenditures ofa great number ofhuman activities. As such, several classifications of workload have been proposed based on these data.(8,42, 74) However, inconsistencies in terminology used for work classes and rates ofoxygen uptake assigned for the various work categories make it difficult to quantify exactly what is meant by light, moderate, or heavy work. For example, Johnson et al. (74) categorize an oxygen consumption rate (V02) of2.2 L'min- l as 'moderate' work. In comparison, Astrand and Rodahl (8) consider V02 levels between 0.5 L'min-l and 1.0 L·min- l to be 'moderate' work while data presented by Fox et al. (42) suggest that V02 levels between 0.75 L'min" and 1.5 Lrnin" defme 'moderate' work. In view ofthe great differences in physical work capacity or fitness ofthe working population, and working postures, whether work is intermittent or continuous, and work environmental conditions, attempts to rigidly compartmentalize the physical work of occupational activities in terms of oxygen consumption may never be realized. Nevertheless, the data provided in Table 1 are included as a general guide '\ for classification ofphysical work. The work classifications presented in Table 1 were selected
14

because they included estimates of both minute ventilation and breathing rates and because of their relative agreement with V02 levels and work categories published by Astrand and Rodahl. (8)
Another way to understand the relative intensities associated with various levels of work, whether they are based on V02, heart rates, or even VE, is to be cognizant of how they compare to common values at rest. In general, V02 at rest is between 0.25 and 0.3 L'min". Also, about six to eight liters of air are being ventilated per minute. With this knowledge, it is easy to understand that an activity that requires an oxygen consumption of3.0 Lrnin" is ten times more intense than rest. Likewise, an individual breathing at a rate of 80 Lrnin" is moving about ten times more air through the lungs than that needed for a resting metabolism. Knowing such relationships will assist in understanding the intensity of work.
2.4 Estimation of Ventilation Using Oxygen Consumption.
Accurate measurement of breathing rates and patterns normally requires that the subject breathe through a mouthpiece and one-way valve, and that the individual be instrumented with a flow-measuring device, data gathering hardware, and recording equipment. This is impractical during most everyday activities. As a result, few data are available that quantify workplace breathing parameters. However, some of the occupational task performance literature that was reviewed for this effort did include measurements of minute volumes, but the majority of the papers did not report these data. The data from many work rate studies present values for metabolic workload measured as V02, which, again, is the amount ofoxygen utilized by the body's metabolic processes in a given time. However, the majority of energy expenditure literature measured activity heart rates and used predetermined relationships between heart rate and V02 of individual test participants to estimate V02. Since V02 data for various physical activities have been widely reported, it was believed that such data could be used to estimate VE based on an understanding of the relationship between the volume of air respired per liter of oxygen consumed, or the ventilatory equivalent for oxygen.
The ventilatory equivalent for oxygen is defined as the ratio ofminute volume to oxygen consumption (VE/V02). The value of this ratio varies from person to person based upon an individual's oxygen uptake efficiency, lung physiology, and metabolic state. In general, the ventilatory equivalent for oxygen ranges from approximately 20 to 25 (unitless measure) from rest to moderate levels of physical activity (V02.::S 2 L·min-1
) .(8) Some researchers have reported that VE/V02 equals about 30 for oxygen uptake levels above 2.5 L·min-1.(101, 147) Layton (84)
compiled a dataset of 159 measurements of VE and V02 reported in the open literature to evaluate the ratio of VE to V02. This analysis showed a linear relationship between the two variables and indicated that most of the values of VE/V02 fall within the 68% confidence interval of a lognormal distribution. The VE/V02 values corresponding to this distribution were between 23 and 32.
15
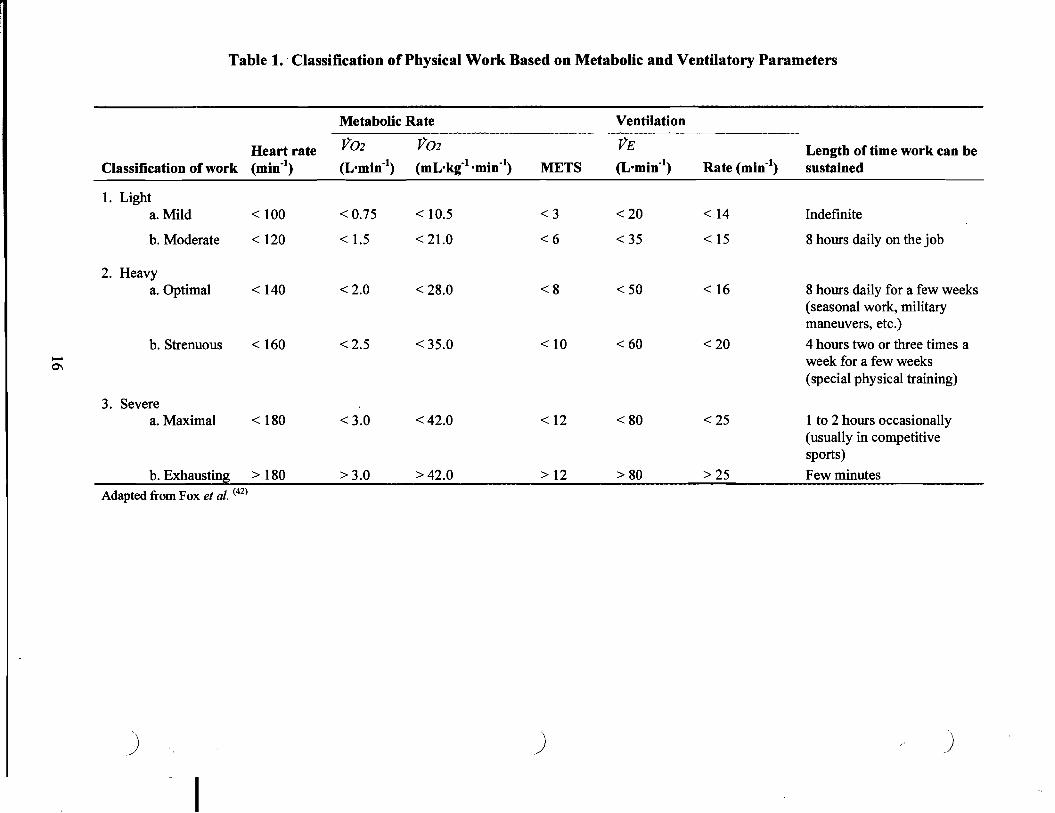
Table 1.' Classification ofPhysical Work Based on Metabolic and Ventilatory Parameters
Metabolic Rate Ventilation -
Classification of work Heart rate (min-I)
V02
(L·min-l) V02
(mL-kg-l·min-l) METS
VE
(L-min-l) Rate (min-I) Length of time work can be sustained
1. Light a. Mild < 100 <0.75 < 10.5 <3 <20 < 14 Indefinite
b. Moderate < 120 < 1.5 < 21.0 <6 < 35 < 15 8 hours daily on the job
2. Heavy a. Optimal < 140 <2.0 < 28.0 <8 < 50 < 16 8 hours daily for a few weeks
(seasonal work, military maneuvers, etc.)
-0'\
b. Strenuous < 160 <2.5 < 35.0 < 10 <60 <20 4 hours two or three times a week for a few weeks (special physical training)
3. Severe a. Maximal < 180 <3.0 <42.0 < 12 < 80 <25 1 to 2 hours occasionally
(usually in competitive sports)
b. Exhausting > 180 Adapted fromFox et al. (42)
> 3.0 >42.0 > 12 > 80 > 25 Few minutes
) ) )

r> In contrast to the findings ofLayton.P" some reports suggest that PE increases in a curvilinear fashion while P02 increases linearly, particularly at high work ratesY o,39, 51) Hagan and Smith (51) examined this apparent curvilinear relationship between exercise PE and P02 during exhaustive incremental treadmill exercise in 45 male volunteers (mean age 32 years) who were actively engaged in daily running programs. These investigators reported that during incremental load work PE increased exponentially with an increase in P02 even at low workloads. The correlation coefficient of the regression model was high (r = 0.94, p < 0.0001). The exponential regression equation that related PE to P02 for the range of oxygen consumption rates that were recorded (0.9 L'minl to 4 L'min") was
PE (L'min- l ) = 16.27 iO.515.V02) (1)
with P02 in L·min-l. This equation provides a possible means for estimating PE from P02 data
reported for occupational energy expenditure literature, at least for P02 values between 0.9 L'min" and 4 L·min-l
. However, the findings ofHagan and Smith (51) may be limited to healthy, physically active, male subjects. Considering that the demographic make-up of the worker population includes individuals with a wide range of physical fitness levels as well as varying degrees of cardiovascular and pulmonary health, estimation of PE based solely on this exponential function may not present a true representation of ventilation rates anticipated for the general working population.
f' Baba et al. (10) also reported an exponential relationship between PE and P02, but for a more diverse subject population that included 12 patients with chronic heart failure as well as eight female participants (total n = 38). The exponential regression equation that related PE to P02 for this study was
(2)
when P02 is expressed in mlzkgl-min", or
(3)
with both PE and P02 in L·min-l. The correlation coefficient ofthis regression model was also
high (r = 0.94). The range of oxygen consumption rates that were observed in this study was not explicitly reported, however interpolation of data presented in one of the report figures indicates that the range of P02 was between approximately 5 and 28 mlzkgl-min". This range would permit calculation of reasonable estimates of ventilation for workloads lower than those tested by Hagan and Smith (51) (P02 range of approximately 11.3 mlzkgi-min" to 50 mlzkgl-min' based on an average population weight of 80 kg).
It is important to note that both Baba et al. (10) and Hagan and Smith (51) found the relationship between PE and P02 to be reliably expressed as an exponential function
17
(4)
where the a parameter is the y-intercept ofthe regression equation and the b parameter is the slope. The differences between equations (1) and (3) in the magnitudes of these parameters can be explained based on the different test subject populations. Baba et al. (10) found that parameter a was significantly positively correlated with individual peak P02 (i.e., a was higher for individuals with higher peak P02). Since high values ofpeak (or maximum) P02 are an indication of a greater level of cardiorespiratory fitness, this would indicate that parameter a would be greater for individuals with better fitness levels. Baba et al. (10) also found that parameter b was significantly negatively correlated with individual peak P02 (i.e., b was smaller for individuals with higher peak P02), indicating that a lower value of b would be expected for those who have better cardiorespiratory fitness. Thus, the higher value for parameter a and the lower value for parameterb in equation (1) reflect the healthier, better fit subject population utilized by Hagan and Smith (51) for their study.
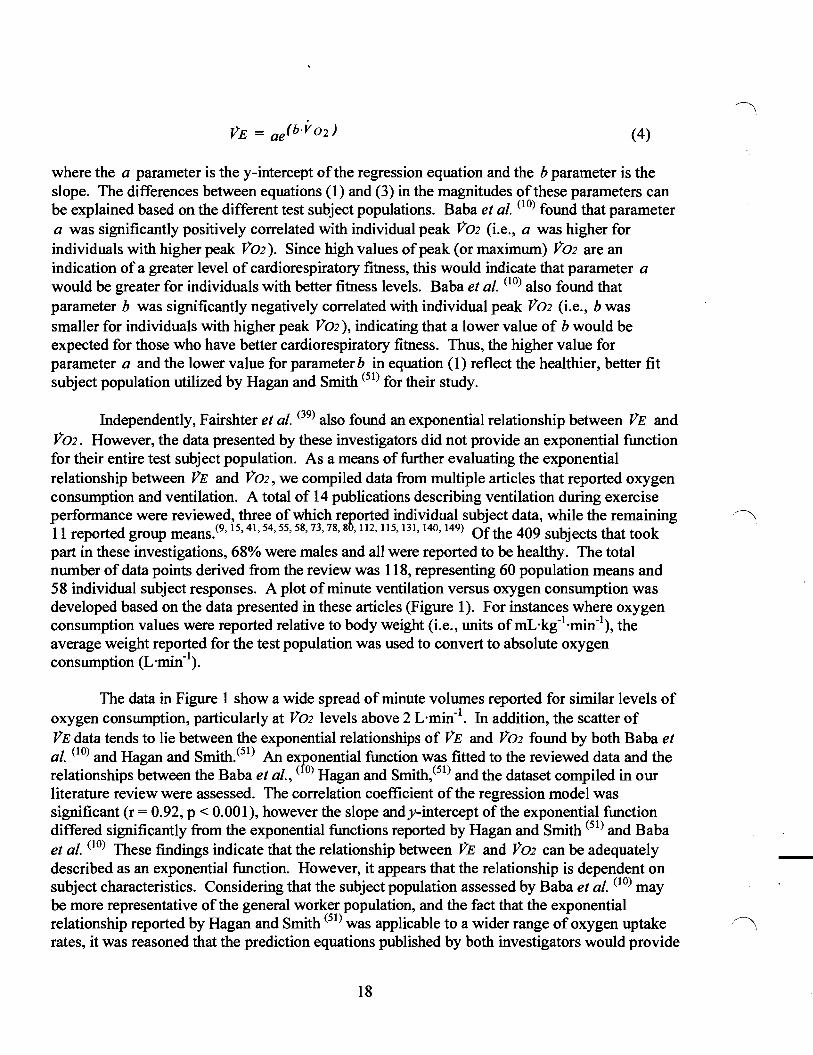
Independently, Fairshter et al. (39) also found an exponential relationship between PE and P02. However, the data presented by these investigators did not provide an exponential function for their entire test subject population. As a means of further evaluating the exponential relationship between PE and P02, we compiled data from multiple articles that reported oxygen consumption and ventilation. A total of 14 publications describing ventilation during exercise performance were reviewed, three of which reported individual subject data, while the remaining /~ 11 reported group means.i" 15,41,54,55,58,73,78, 8t>, 112, 115, 131,140,149) Of the 409 subjects that took
part in these investigations, 68% were males and all were reported to be healthy. The total number of data points derived from the review was 118, representing 60 population means and 58 individual subject responses. A plot ofminute ventilation versus oxygen consumption was developed based on the data presented in these articles (Figure 1). For instances where oxygen consumption values were reported relative to body weight (i.e., units ofml-kgl-min"), the average weight reported for the test population was used to convert to absolute oxygen consumption (L·min- l
) .
The data in Figure 1 show a wide spread ofminute volumes reported for similar levels of oxygen consumption, particularly at P02 levels above 2 L·min-l
. In addition, the scatter of PEdata tends to lie between the exponential relationships of PE and P02 found by both Baba et al. (10) and Hagan and Smith.(51) An eXPo0nential function was fitted to the reviewed data and the relationships between the Baba et al., ( 0) Hagan and Smith,(51) and the dataset compiled in our literature review were assessed. The correlation coefficient of the regression model was significant (r = 0.92, p < 0.001), however the slope andy-intercept of the exponential function differed significantly from the exponential functions reported by Hagan and Smith (51) and Baba et al. (10) These fmdings indicate that the relationship between PE and P02 can be adequately described as an exponential function. However, it appears that the relationship is dependent on subject characteristics. Considering that the subject population assessed by Baba et al. (10) may be more representative of the general worker population, and the fact that the exponential relationship reported by Hagan and Smith (51) was applicable to a wider range of oxygen uptake '\ rates, it was reasoned that the prediction equations published by both investigators would provide
18

I~
reasonable estimates of minute volumes from oxygen consumption rates. However, in adopting this approach, estimates of VE determined from the exponential relationships of both studies were only applied for the ranges of VOJ for which each were established. In other words, the Hagan and Smith (51) equation was not used for VOJ values below 0.9 L'min-1and the Baba et al. (10) relationship was not applied for VOJ above 2.2 L'min- 1(based on an assumed population weight of 80 kg; the average weight of the subjects was not published by Baba et al. (10»).
225
-200
175 , c: 'E 150
~-Q) 125 E ::::l
~ 100
Q)-::::l 75 c: ~
50
25
0
- - - Saba et. al. (2002) -- Hagan & Smith (1984)
A Published data A .. A
A A ~ AA
t .\ A A A A
,.AA AAt+ A
A
A .. A
0 1 2 3 4 5 6
Oxygen Consumption (L' min")
Figure 1. Plot of VE and V02 Data Obtained From Selected Literature (Scatter) Compared to the Exponential Functions Described by Hagan and Smith (51) and Baba et ale (10)
3. UNENCUMBERED VENTILATION
3.1 Minute Ventilation Durine: Maximal Exercise.
Maximal exercise testing permits a rapid yet thorough assessment of an individual's cardiorespiratory responses to exercise including the level of the subject's exercise limitation. Typically, such testing spans a tolerable work rate range from low to high levels during which large amounts of respiratory and cardiovascular data are collected up to and including the voluntary endpoint of testing. Many published reports have documented breathing patterns adopted by healthy humans during incremental exercise.(15,44, 108,139, 146) In general, it has been demonstrated in subjects with various fitness levels that increasing minute volumes are due to
19
increases in both tidal volume and breathing frequency at low exercise intensities. At high exercise intensities increases in minute volume are accomplished mainly by increasing breathing frequency, with tidal volume showing a plateau.(44)
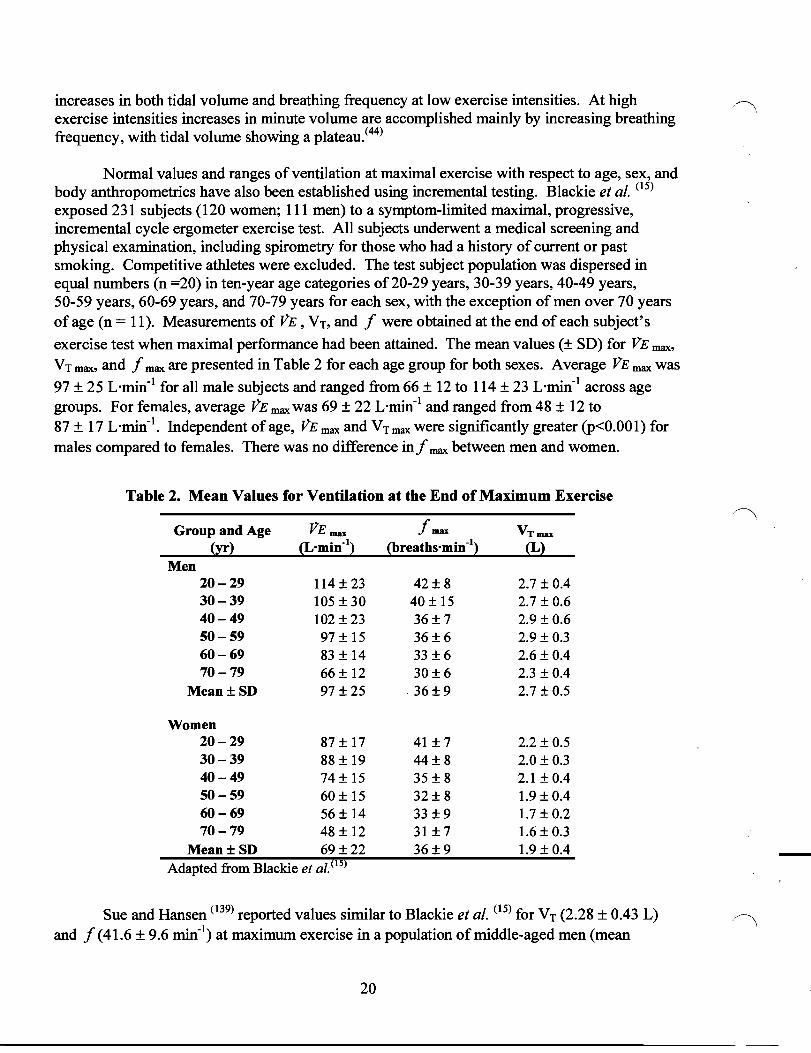
Normal values and ranges of ventilation at maximal exercise with respect to age, sex, and body anthropometries have also been established using incremental testing. Blackie et al. (15)
exposed 231 subjects (120 women; 111 men) to a symptom-limited maximal, progressive, incremental cycle ergometer exercise test. All subjects underwent a medical screening and physical examination, including spirometry for those who had a history of current or past smoking. Competitive athletes were excluded. The test subject population was dispersed in equal numbers (n =20) in ten-year age categories of 20-29 years, 30-39 years, 40-49 years, 50-59 years, 60-69 years, and 70-79 years for each sex, with the exception of men over 70 years of age (n = 11). Measurements of VE , VT,and f were obtained at the end of each subject's
exercise test when maximal performance had been attained. The mean values (± SD) for VE max,
VT max, and f max are presented in Table 2 for each age group for both sexes. Average VE max was
97 ± 25 L·min-I for all male subjects and ranged from 66 ± 12 to 114 ± 23 L·min-I across age groups. For females, average VE max was 69 ± 22 L·min-I and ranged from 48 ± 12 to 87 ± 17 L'min'. Independent of age, VE max and VT max were significantly greater (p<0.001) for males compared to females. There was no difference inf max between men and women.
Table 20 Mean Values for Ventilation at the End of Maximum Exercise
Group and Age VE max fmax VTmax (yr) (Lemin') (breaths-min-I) (L)
Men 20-29 114 ± 23 42±8 2.7 ± 0.4 30-39 105 ± 30 40 ± 15 2.7 ± 0.6 40-49 102 ± 23 36± 7 2.9 ± 0.6 50-59 97 ± 15 36±6 2.9 ± 0.3 60-69 83 ± 14 33 ±6 2.6 ± 0.4 70-79 66± 12 30±6 2.3 ± 0.4
Mean±SD 97 ±25 ·36±9 2.7 ± 0.5
Women 20-29 87 ± 17 41 ± 7 2.2 ± 0.5 30-39 88 ± 19 44±8 2.0 ± 0.3 40-49 74 ± 15 35 ± 8 2.1 ± 0.4 SO-59 60 ± 15 32± 8 1.9±0.4 60-69 56± 14 33 ±9 1.7 ± 0.2 70-79 48 ± 12 31 ± 7 1.6 ± 0.3
Mean±SD 69±22 36±9 1.9±OA Adapted from Blackie et al.(is)
Sue and Hansen (139) reported values similar to Blackie et al. (15) for VT (2.28 ± 0.43 L) and f (41.6 ± 9.6 min-I) at maximum exercise in a population of middle-aged men (mean
20

age = 54 years, range 34 to 74 years). Comparable values of VE have also been reported for specific age and gender groups and individual subjects at maximum efforts of incremental cycling exercise. Wasserman et al. (146) observed VE max values of 107 L'min- I for a 55 year old male executive, 89 L'min" for a 59 year old retired male shipyard worker, 70 L'rnin" for a 45 year old female homemaker, and 90 L'min- I for a 37 year old male shipyard machinist, values that all fall within age-specific data reported by Blackie et al. (IS)
In a study of similar design to that of Blackie et al., (IS) Neder et al. (108) assessed breathing patterns during incremental exercise of 120 normal, healthy, sedentary individuals (60 males, 60 females) evenly distributed in age groups of20-39 years, 40-59 years, and 60-80 years. Although these investigators were primarily interested in developing normative ventilatory data at selected submaximal ventilatory stresses, maximal VE data were reported for each age group by sex. For females, Neder et al. (l08) recorded average VE max values of approximately 76 ± 14,67 ± 11, and 50 ± 10 L·min- I for the age groups of 20-39 years, 40-59 years, and 60-80 years. Maximal VE averaged 120 ± 28, 99 ± 22, and 77 ± 12 L'min- I for the three ascending male age groups. Again, these values reflect the data reported by Blackie et al. (IS) for a similar subject population. Therefore, the data presented in Table 2 serve as a reasonable representation of normal maximal ventilatory responses to exhaustive incremental exercise for a wide range of ages in both males and females.
Ventilation rates that exceed the values presented in Table 2 have been reported, with minute volumes in excess of200 L·min-I found in some cases. Astrand and Saltin (9) measured a
r> maximal VE value of 183.4 L'min'I in one test subject during constant rate exhaustive cycling. In fact, these researchers reported peak minute volumes that ranged from approximately 116 to 157 L'min" dependent upon the type ofmaximal work that was performed. It should be noted, however, that these data were obtained on relatively well-trained males with relatively high aerobic capacities (V02 max > 4 L·min- I
) . Maximal VE of 180 to 190 L'min- I have also been reported in previous research using elite cyclists and oarsmen.v" 55, 96, 97) This evidence indicates that very high rates ofventilation are possible, but suggest that only relatively well-conditioned athletes can achieve such high values.
3.2 Peak Inspiratory Flow Rates During Exercise.
Reports that document peak inspiratory flow (PIF) rate data are not common for normal, healthy individuals performing various levels of work. It is important to understand that PIF rates do not quantify sustained rates of inhaled airflow, but represent peak velocities ofair movement during the inhalation phase of respiration. For example, a PIF rate of200 L'min- I
does not mean that an individual ventilated a total of 200 L of air in a minute but that the peak rate of air movement during inhalation was 200 Lrnin". To put it another way, a PIF of 200 L'min- I is not equal to a minute volume (VE ) of 200 L·min- I
.
Silverman et al. (131) investigated flow rates obtained from healthy males aged 16 to 44 while they were at rest and exercising at 0, 34, 68, 102, 136, 181,226, and 271 watts (W) on a cycle ergometer. Each work rate was performed with just the air flow-measuring apparatus (inspiratory and expiratory resistances of 0.4 and 0.2 CmH20 . L-I
. s) and with imposed
21
inspiratory and expiratory resistances (to be addressed later). Peak inspiratory flow rates for the~,
unencumbered condition were 40 ± 8, 49 ± 8,63 ± 8, 84 ± 10, 100 ± 14, 149 ± 29, 194 ± 32, 254, and 286 L'min- I for the eight work rates from rest to maximum. The authors concluded that peak inspiratory flow rates increased exponentially with increasing work rate. The authors also compared the peak flow rates of20 athletes exercising at 181 W with minimal resistance to data on non-athletes in the same age group and to all non-athletes in their study. Peak inspiratory flow rates for athletes, age-matched non-athletes, and all non-athletes averaged 180 ± 30, 196 ± 29, and 205 L 'min-I, respectively. The peak flows were 10% lower for athletes compared to age-matched non-athletes.
Lafortuna et al. (82) investigated PIF rates for six males (mean age 27.5 ± 13.2 years) during rest and during incremental cycle ergometer exercise at 40,80, 120, 160, and 200 W. Flow rates were measured with a No.3 Fleisch pneumotachograph. Peak inspiratory flow rates were 36.6, 79.3, 104.8, 134.9, 184.5, and 238.7 L'min- I from rest to maximal exercise. Harber et al. (54) also investigated PIF rates during rest and exercise for six female and five male subjects between the ages of22 and 39 years. This study involved a minimum of six minutes of steady state treadmill work, which continued until respiratory rate and heart rate stabilized for at least 60 seconds before measurements of flow were obtained with a pneumotachograph. The exercise levels were rest, low (0.89 mph, 0% grade), moderate (1.34 mph, 0% grade), high (1.34 mph, 10% grade), and maximal (1.7 mph, varied grade). The grade for maximal exercise was set to a level that the researchers estimated would exhaust the subject within several minutes. Each work rate was performed with and without a resistive load. Peak inspiratory flow rates for the no load condition from rest to maximum exercise were 40.8 ± 19.2,68.4 ± 14.4,88.8 ± 16.8, 135 ± 43.2, and 165 ± 46.8 L'min", respectively.
Collectively, these observations show that PIF rates increase as exercise intensity increases and suggest that PIF rates on the order of 300 L·min- I are possible under heavy work conditions. Since PIF data is not commonly addressed in energy expenditure literature, PIF are often estimated by multiplying PE by the constant 7t (3.14). This relationship assumes a sinusoidal breathing waveform, which is not a natural waveshape for inhalation when workloads exceed light intensities.(72) Sharkey and Gaskill (128) suggest that PIF can be adequately estimated by multiplying PE by a factor of four based on data presented by Silverman et al. (130) However, this relationship was determined from only one ofthe workloads utilized by Silverman et al. (130)
and may cause significant overestimation ofPIF at higher workloads when the ratio ofPIF to PE decreases.(132) In addition, during unencumbered breathing, ratios ofPIF to PE between five and six have been observed (K.M. Coyne, personal communication, February 27, 2004).
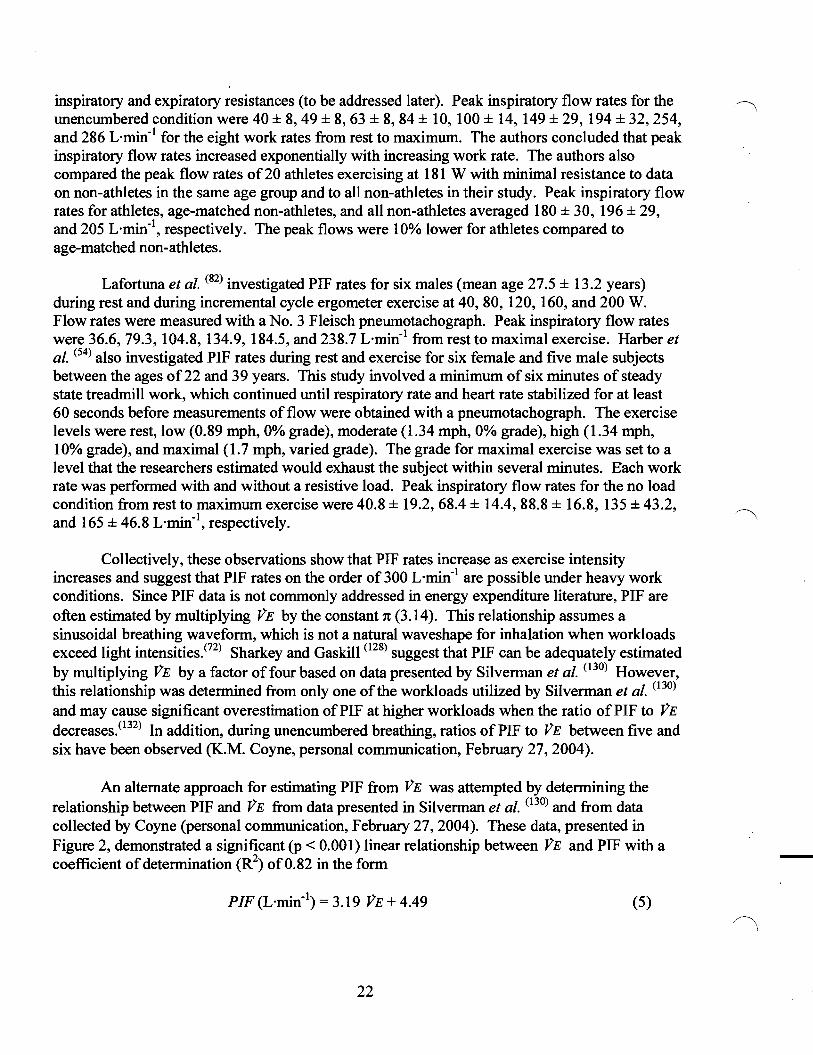
An alternate approach for estimating PIF from PE was attempted by determining the relationship between PIF and PE from data presented in Silverman et al. (130) and from data collected by Coyne (personal communication, February 27, 2004). These data, presented in Figure 2, demonstrated a significant (p < 0.001) linear relationship between PE and PIF with a coefficient ofdetermination (R2
) of0.82 in the form
PIF (L'min- l) = 3.19 PE + 4.49 (5)
22
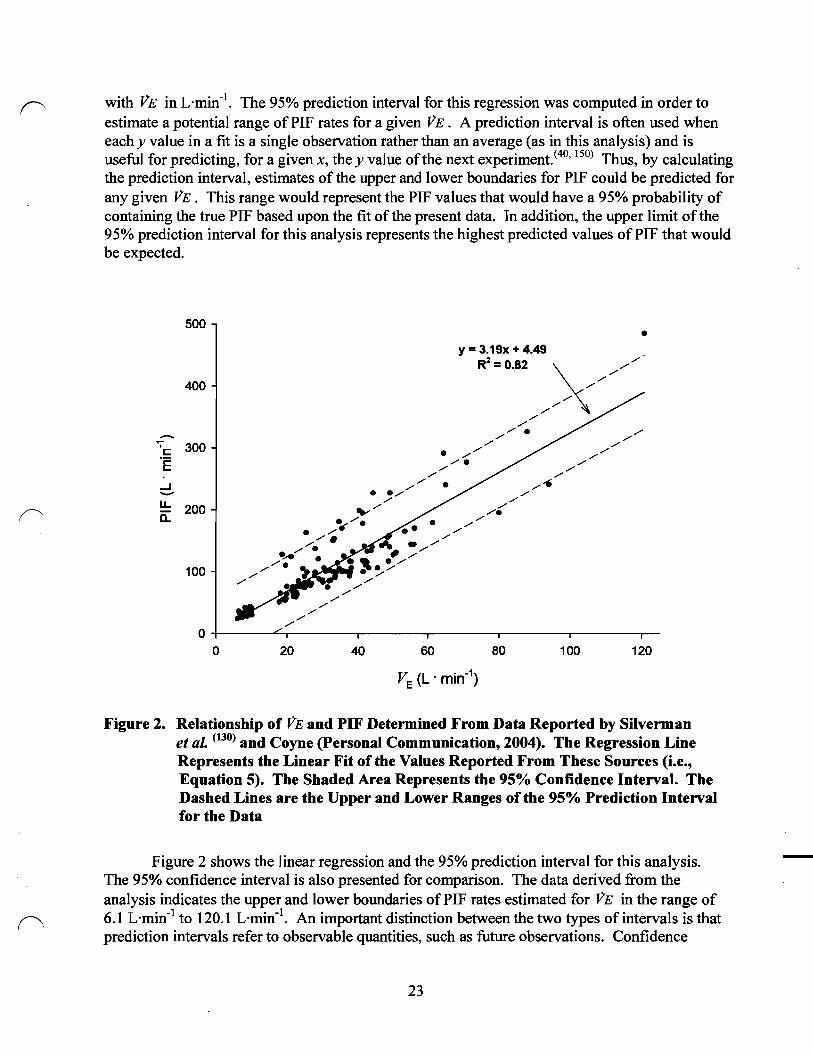
with VE in L·min-1. The 95% prediction interval for this regression was computed in order to
estimate a potential range of PIP rates for a given VE. A prediction interval is often used when eachy value in a fit is a single observation rather than an average (as in this analysis) and is useful for predicting, for a given x, the y value ofthe next experiment.v'?: 150) Thus, by calculating the prediction interval, estimates of the upper and lower boundaries for PIF could be predicted for any given VE. This range would represent the PIP values that would have a 95% probability of containing the true PIF based upon the fit of the present data. In addition, the upper limit of the 95% prediction interval for this analysis represents the highest predicted values ofPIF that would be expected.
500 •
400
-~,c::: 'E
300
..J-r>
u.. a.. 200
100
0+-------""''-,------,------,-----,-------.------, o 20 40 80 100 120
Figure 2. Relationship of VE and PIF Determined From Data Reported by Silverman et aL (130) and Coyne (personal Communication, 2004). The Regression Line Represents the Linear Fit of the Values Reported From These Sources (i.e., Equation 5). The Shaded Area Represents the 95% Confidence Interval. The Dashed Lines are the Upper and Lower Ranges of the 95% Prediction Interval for the Data
Figure 2 shows the linear regression and the 95% prediction interval for this analysis. The 95% confidence interval is also presented for comparison. The data derived from the analysis indicates the upper and lower boundaries ofPIP rates estimated for VE in the range of 6.1 Lrnin" to 120.1 L·min-1
• An important distinction between the two types of intervals is that prediction intervals refer to observable quantities, such as future observations. Confidence
23

intervals refer to parameters, such as probability, that cannot be observed, but still describe a ~~
process. Thus, ifthe goal were to describe the mean of a distribution, a confidence interval would be used. Ifthe intent were to put a bound on the next observation from the distribution, a prediction interval would be described. It has been argued that prediction intervals tend to be too narrow because out-of-sample forecast accuracy is often poorer than would be expected from within-sample fit, particularly for prediction intervals calculated conditionally on a model fitted to past data.(23) However, the boundaries described by the prediction interval provide a broader range for estimates of PIF compared to the confidence interval.
In order to determine the validity of estimating PIF from VE based on the prediction interval for equation (5), we derived a range ofPIF from the VE data reported by Silverman et al.,(131) Lafortuna et al., (82) and Harber et al. (54) The derived values for PIF were then compared
to average PIF data reported in conjunction with VE. The results of this analysis showed that measured PIF values fell within the 95% prediction intervals derived from corresponding VE data 90% of the time. Measured PIF values that did not fit within the prediction interval were lower than the estimated range. For comparison, estimating PIF by multiplying reported VE data by a factor of four overestimated PIF values 86% ofthe time by an average of 59 L'min-1 (range from 8 to 169 L·min- I
) . These fmdings suggest that estimating ranges ofPIF values from VE based on the prediction interval derived from the linear regression ofequation (5) will produce adequate estimates ofPIF rates. As demonstrated, values that fall outside of the prediction intervals are likely since the intervals are calculated on a model fitted to past data.
3.3 Speech Ventilation and PIF.
The main function of speech respiration is to provide the driving forces necessary to generate sounds. During speech breathing in healthy subjects the time spent on inspiration is minimized, the proportion of time spent on inspiration is reduced, and inspiratory flow rates are increased. Exhalation flow rates are either reduced or unchanged during speech production at rest. (125) In general, f is reduced and VT is increased to accommodate the need for sustained
speech-related exhalations with minimal disturbances in fluency. The flow dynamics of speech also vary based on the type of speech that is utilized (e.g., single words or connected utterances as in conversational speech, normal versus loud speech, etc.) and the physical activity level of the speaking individual.V" 62, 63, 90, 117, 125, 153) A brief review of the ventilatory values anticipated during speech in healthy individuals is provided below. Unless otherwise noted, the data reported herein were gathered using RIP techniques, which appear to have wide acceptance for determination of speech ventilatory parameters.
Horii and Cooke (63) recorded PIF rates with a pneumotachograph in the range of 72 to 144 Lrnin" during about 2.5 minutes of continuous reading in a normal voice. Mean inspiratory flow rate (VTITI ) was approximately 66 L'min-1and roughly only 13% of the speaking time was used for inspiration. Comparable VTITI values have been reported for oral monologue speech as well as for continuous conversational speech.(90) Horii and Cooke (63) also found that large inspiratory volumes were usually associated with inter-sentence inspirations, while smaller volumes were typically related to intra-sentence inspirations. On this point, there is general agreement that breaths are largely taken at places in text that are logical in terms of either punctuation or linguistic factors such as grammatical structure,053)
24
Loudon et al. (90) reported an average Vrffr of76.9 ± 30.7 L'min-I during oral counting while maintaining a speech intensity of 50 to 65 dB and an average Vr/Tr of 108.8 ± 45.9 L'min- I
while maintaining a speech intensity of 80 to 95 dB. Using the linear relationship
P/F (L'min- I) = 1.41 Vrffr (L'min- I
) - 5.67 (6)
observed between PIF and Vr/Tr from speech airflow data recorded in our laboratory (R2 = 0.92, p < 0.001), corresponding PIF rates would be approximately 103 ± 38 L'min- I and 148 ± 60 L'min" for the respective speech intensities. These fmdings show that utterances of single words and vocal intensity produce higher Vrffr and PIF rates compared to those recorded during conversational speech in a normal voice. Minute volumes reported during speech at rest also appear to be impacted by vocal intensity, with higher rates found with greater output volumes.(125)
In general, speech during exercise has been associated with decreased VE while Vrffr is held relatively constant.(113) With increasing levels of exercise, speech becomes more difficult, louder, and sometimes tremulous. The increased work intensities require significant increases in ventilation that cannot be maintained if interrupted or slowed by speech.(125) Doust and Patrick (33) tested the effect of five minutes of connected speech on ventilation during steady-state treadmill exercise at five different workloads. At each exercise level, VE was reduced during speech to about 55% of the non-speech VE. Respiratory frequency was reduced but Vr was relatively unchanged. Meckel et al. (102) also reported a significant reduction in VE, as well as V02, during speech while exercising at three different work intensities. Reductions in VE ranged from 24% to 10.5% during the lowest and highest work rates, respectively. Thus, speech during exercise appears to reduce ventilation so as to meet the phonatory requirements of low expiratory flow. Limited data for inspiratory flow ~atterns during speech and exercise were reported. Estimates ofVrffr from Meckel et al. (I 2) suggest that mean inspiratory flows between 128 and 208 L·min- I (with estimated PIF between 171 and 288 L'min") are likely when speech is produced during work intensities between 2.1 and 3.3 L'min- I ofoxygen consumption. However, the influences of speech characteristics such as intensity and content on these values are unknown under exercising conditions.
4. VENTILATION FOR SPECIFIC PHYSICAL ACTIVITIES
4.1 Ventilation Rates Recorded at Worksites or During Simulated Workplace Activities.
As mentioned previously, there is a shortage of data available for breathing flow rates and breathing patterns in actual occupational settings. However, some reports contain minute volume data collected durinff work or simulated task performance at worksites or in controlled settings. Smolander et al. (133 measured minute volumes ofnine male city caretakers (mean age of 43 ± 10 years) during manual snow clearing, a task that all were accustomed to performing during their daily work. Minute ventilation was measured with a K-M respirometer during the
25
last 10 minutes of two separate IS-minute self-paced snow clearing tasks (one with a shovel and one with a snow pusher) and averaged for each activity period. Smolander et al. (133) observed an average fiE of 60.7 ± 11.3 L'min- 1 during snow shoveling and an average fiE of 65.8 ± 11.3 L'min" during snow pushing. Using on-line indirect calorimetry, Bridger et al. (17)
found similar ventilation rates in a controlled laboratory study for individuals (10 males, 25 ± four years of age) shoveling sand with either a conventional shovel (fiE = 64.1 ± 16.1 L'min") or a two-handled shovel (fiE = 63.5 ± 13.6 L'min-1
) at a controlled pace for approximately 12 minutes. The oxygen consumption data from both Smolander et al. (133) and Bridger et al. (17) were also similar, indicating that the work intensities were the same between the simulated workplace shoveling tasks and the controlled laboratory tasks. Both investigations show that shoveling is strenuous physical work that elicits a relatively high level ofventilation. Since digging and shoveling are common tasks in a range of industries as well as in leisure activities such as gardening, fiE levels on the order ofmagnitude found by Smolander et al. (133)
and Bridger et al. (17) should be considered to be normal occurrences in similar manual labor activities.
Gallagher and Hamrick (46) recorded minute ventilation data on 12 male subjects (approximately 42 years old) during a series of lifting studies designed to simulate lifting tasks and postures commonly performed in underground coal mines. All subjects were current or former coal miners experienced with handling materials in underground mines. The range of average minute volumes measured with a metabolic cart was approximately 21 to 27 L'min" for the various container types and lifting postures tested and the weights of the lifted loads (20 - 24 kg). The physiological workloads (fl02) ranged between 0.82 L·min-1 to 1.04 L·min-1
7\. (9.8 to 12.7 ml-kgl-min") for all tasks, which can be categorized as moderate work (Table 1). Although these data were collected in a simulated environment, the lifting weights assessed were self-selected by the subjects according to their own estimate ofan acceptable lifting capacity and workload for each 15 minute treatment session. In addition, vertical space constraints for stooped lifting postures were controlled with a device that was adjusted to mimic underground mine ceiling heights. Since underground lifting tasks are often less than 10 minutes in duration, with ample breaks in between,<45) the data reported by Gallagher and Hamrick (46) provide reasonable estimates of fiE that would be found during short duration, sporadic lifting tasks common in underground mining occupations.
Linn et al. (89) estimated ventilation rates of 19 construction workers throughout a day on the job including some time before work and breaks. These investigators calibrated each individual by recording heart rate and vs at rest and at different levels of exercise. Least squares regression analysis was used to derive an equation predicting vs at a given heart rate for each subject. The subjects' heart rates were subsequently recorded beginning early in the morning at home and ending in the afternoon when the subjects stopped working. A diary of the subjects' activities was also kept, with each subject recording from waking to getting to work and a trained investigator entering information as communicated by the subject via a hands-free transmitter during work. Each individual's fiE prediction equation was used to calculate vs from the recorded HR data. For the 19 subjects, a total of 182 hours ofheart rate data was recorded, of which 144 hours represented actual work time. The construction workers estimated vs ranged from about 20 L·min-1 to 44 L·min-1 and averaged 30 Lrnin". These findings indicate that the job-site construction work assessed involved moderate to strenuous amounts ofwork (Table 1).
26
However, it is possible that this data may have underestimated VE during construction work activities. First, the ventilation data in the Linn et al. (89) study included time off work that could not be adequately accounted for when estimating VE during actual working periods. In addition, others have shown that predicting VE from heart rate data in uncontrolled settings generally leads to lower estimates of VE .0' 12, 104) Therefore, the precision of the VE data reported by Linn et al. (89) is somewhat limited and may not be the best representation for ventilation rates common to construction work. In this regard, the data from Linn et al. (89) are presented herein as a representation ofworksite recordings of VE and for later comparison with like activities.
The California Air Resources Board (CARB) sponsored a study in 1993 of measured ventilation rates in people performing various laboratory and field protocols.(1) Subjects completed resting and exercise protocols in the laboratory, and usually one or more field activities. Data collected in the field included VE , heart rate, and f during housework, yard
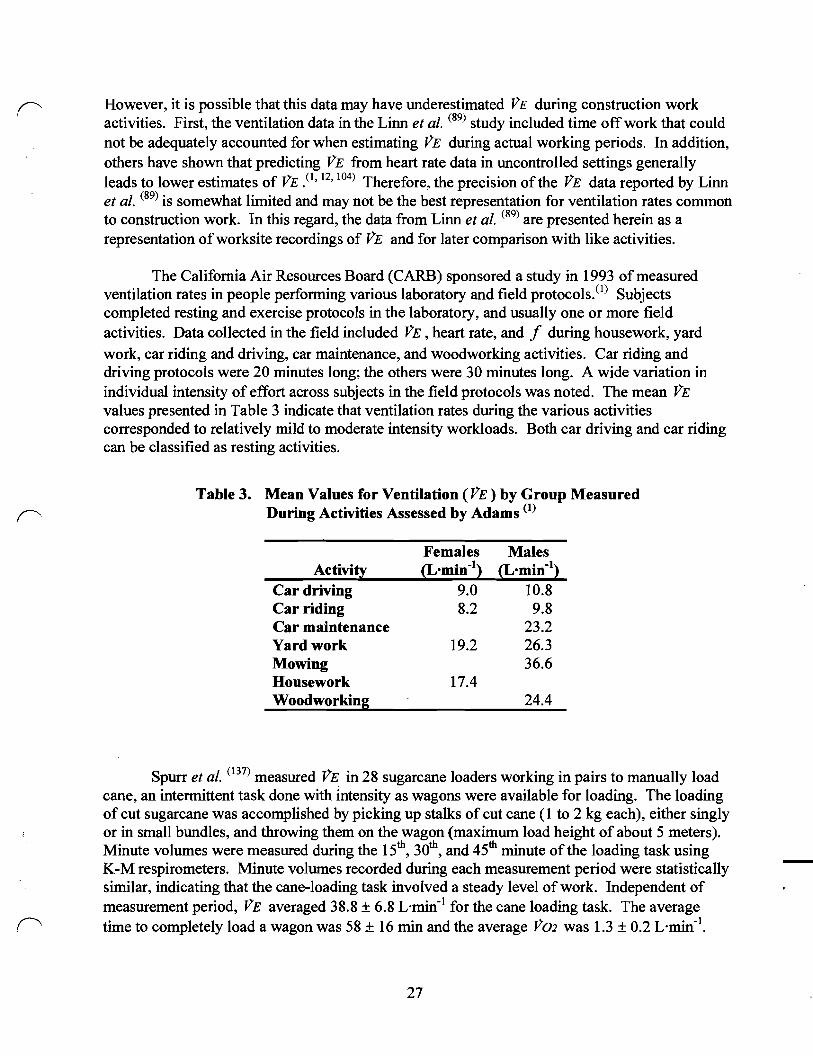
work, car riding and driving, car maintenance, and woodworking activities. Car riding and driving protocols were 20 minutes long; the others were 30 minutes long. A wide variation in individual intensity of effort across subjects in the field protocols was noted. The mean VE values presented in Table 3 indicate that ventilation rates during the various activities corresponded to relatively mild to moderate intensity workloads. Both car driving and car riding can be classified as resting activities.
Table 30 Mean Values for Ventilation (VE) by Group Measured During Activities Assessed by Adams (1)
Females Males Activity (Izmln") (Lomin-l )
Car driving 9.0 10.8 Car riding 8.2 9.8 Car maintenance 23.2 Yard work 19.2 26.3 Mowing 36.6 Housework 17.4 Woodworking 24.4
Spurr et al. (137) measured VE in 28 sugarcane loaders working in pairs to manually load cane, an intermittent task done with intensity as wagons were available for loading. The loading of cut sugarcane was accomplished by picking up stalks of cut cane (I to 2 kg each), either singly or in small bundles, and throwing them on the wagon (maximum load height of about 5 meters). Minute volumes were measured during the 15th
, 30th, and 45th minute of the loading task using
K-M respirometers. Minute volumes recorded during each measurement period were statistically similar, indicating that the cane-loading task involved a steady level of work. Independent of measurement period, VE averaged 38.8 ± 6.8 L'min-1 for the cane loading task. The average
(' time to completely load a wagon was 58 ± 16 min and the average V02 was 1.3 ± 0.2 L·min-1•
27

These results provide reference values of VE for a moderate effort (Table 1), intermittent lifting r-'-\
task.
In contrast to the material handling studies already discussed.v'" 137) Mackey et al. (99)
quantified breathing patterns of 10 females (31.8 ± 6.2 years old) during a simulated upper body work task designed to mimic small materials handling and inspection work. Minute volumes were measured with a pneumotachograph while subjects performed the simulated work task when seated, once with the arms in a supported position (both elbows resting on a work bench) and once with the arms unsupported during the inspection phase of the task. The simulated task required subjects to repeatedly pick up a 2 kg object, inspect and hold it for 15 seconds, and place it in a box for five minutes. Minute volumes averaged 14.8 L·min-1 during unsupported arm work and 13.4 L'min-1 when the arms were supported. The difference between VE for the unsupported and supported arm conditions was statistically significant (p < 0.01). These fmdings provide values of VE representative of occupational tasks that require repetitive material handling accomplished primarily with the arms.
Data collected during emergency egress simulations provide insight into ventilation rates that can occur during physically demanding emergency situations. Kamon et al. (76) measured V02 and VE during a simulated escape from an underground mine that was completed by six miners (mean age 45.2 ± 13.6 years) asked to perform the escape maneuver "as rapidly as they possibly could." The escape route included sections of different terrain and roof heights, which required periods of upright and head-bent walking, duck walking, running, and crawling. Minute ventilation, measured with an Oxylog, averaged 49 ± 13 L'min-1 throughout the escape route for all subjects. The average ofpeak VE recorded at any time for all subjects was 56 ± 13 L·min-1
•
The mean travel time for the six miners was 58 minutes. In a much shorter exercise (5.4 to 6.7 minutes), Ross et al. (124) recorded average minute volumes of 46.3 ± 15.8 Lrnin" in 26 offshore oil industry workers (mean age of36.7 years) during a simulated escape from an offshore oil installation. Peak VE values ranged from approximately 31 to 87 L'min-1 over the duration of the exercise. The data gathered in these two investigations are comparable and indicate that high ventilation rates are likely during life-threatening emergency escape situations.
4.2 Estimates ofVentilation From Energy Expenditure Studies.
The vast majority ofworkplace and simulated workplace studies designed to quantify energy expenditures ofvarious tasks focus more on measurements of energy expenditure and work rates as opposed to ventilation. Therefore, much of the data reported in these investigations is void of minute volume data, even when minute volumes were collected during testing. In such cases, where measurements of oxygen consumption were presented, the equations provided by both Baba et al. (10) and Hagan and Smith (51) were utilized when applicable to estimate minute volumes for occupational task performance when ventilation data were not reported.
In a study analogous to that of Smolander et al.,(133) Franklin et al. (43) measured cardiorespiratory responses to self-paced snow removal in 10 apparently healthy, untrained men (mean age 32.4 ± 2.1 years). Test participants cleared heavy, wet snow with either a shovel or an electric snow thrower in random order, with 10- to IS-minute rest periods between each 10-minute work period. Oxygen consumption, measured during the last four minutes of each
28

work task with a portable TEEM 100 Metabolic Analysis System and expressed as metabolic equivalents (METs; 1 MET = 3.5 ml-kgl-min') averaged 5.7 ± 0.8 ·METs for shoveling and 2.4 ± 0.7 METs with the automated snow thrower. Using the average subject population weight of 85.7 kg, estimated V02 in L·min-l would be about 1.71 L'min" for shoveling and 0.72 L·min- l
for automated snow removal based on the equation
(7)
where: EE= energy expenditure (METs)
BW = body weight (kg)
For these levels of V02, estimates of VE during manual shoveling are 39.2 L·min- l and 61.1 L'min- l using the Hagan and Smith (51) and Baba et al. (10) equations, respectively (Table 4). The estimate of VE based on the exponential function of Baba et al. (10) is comparable to the measured minute volumes during snow shoveling reported by Smolander et al.(133) The estimate of VE during automated snow removal is 26.6 Lrnin" based solely on the Baba et al. (10)
relationship; the Hagan and Smith (51) equation was not applicable to this activity because the estimated V02 was less than 0.9 L·min- l
.
Hagen et al. (52) recorded V02 data from 31 woodcutters performing on the job motormanual wood cutting tasks (i.e., using a chainsaw) for an average work period of
r> 111 ± 21 minutes. Oxygen consumption was measured during the last 30 minutes of each working shift with an Oxylog system. The work periods included felling, limbing, manual hauling ofwood, walking, and chainsaw maintenance, as well as intermittent delays. The mean V02 during work for the younger subject group (28.5 ± 3.9 years, n = 15) was 1.8 ± 0.2 L·min- l
.
Minute volume estimates for this level of V02 fall between 41.1 L'min- l and 65.9 L·min- l. Based
on an average V02 of 1.5 ± 0.2 L'min- l, anticipated minute volumes for the older subject
population (58.5 ± 5.1 years, n = 16) would be from 35.2 L'min- l to 51.2 L'min- l (Table 4). The mean V02 during work for all working phases for both age groups was 1.7 ± 0.3 Lrnin", which equates to estimated minute volumes of 39.0 L·min- l to 60.6 L·min-.l.
In a similar assessment of the physical demands of forestry operations performed by six male forestry workers (51 ± 6 years ofage), Kurumatani et al. (81) estimated energy expenditures for multiple tasks from the average heart rate during the activity of interest and apredicted maximal oxygen consumption of the subject obtained from a submaximal cycle ergometer test. Metabolic rates expressed in METs were converted to V02 values (L'min- l
) using the mean body weight of the test subject population and equation (7) so that estimates of VE could be calculated. The estimated minute volumes for four of the tasks assessed by Kurumatani et al. (81) are presented in Table 4. Despite the similarities in the tasks assessed by Kurumatani et al. (81) and Hagen et al.,(52) the estimates of VE were lower for the subject population assessed by Kurumatani et al. (81) when compared with the older, age-matched subject group in the work of Hagen et al.(52) Given that VE is positively correlated with body weight,(7, 12) the lower minute volumes found by Kurumatani et al. (81) were likely due to the lower weight of their subject population compared to Hagen et al. (52) Nevertheless, these findings demonstrate the variety in
29

energy expenditure rates and, thus VE, that can be found for similar activities due to individual variability of the worker population.
Table 40 Estimated Minute Volumes Based on Oxygen Consumption Data Obtained From Select Energy Expenditure Publications
Reference Job Task(s) Mean VOl (Lomin-1)
Estimated VE (L'min") Hagan
& Smith
Estimated VE (L'mln") Baba
et alo Franklin et al. (1995) Manual snow shoveling 1.71 39.2 61.1
Automated snow removal 0.72 26.6 Hagen et al. (1993)
Kurumatani et al. (1992)
Aminoff et al. (1999) Wakui et al. (2002)
Wood-cutting (young group) Wood-cutting (older group) Felling trees Limbing & bucking Dragging logs w/peavey Walking Kitchen work Nursing home care (day shift) Nursing home care (night shift)
1.8
1.5
1.09 0.99 1.05 1.03 0.65 0.52
0.55
41.1
35.2
28.5 27.0 27.9 27.6
65.9
51.2
36.2 33.2 35.0 34.4 22.7 21.3
21.6 ~,
Ahonen et al. (1990) Giving fresh hay Milking Removing manure Cleaning floor
1.36 0.84 1.26 1.09
(1.28t (0.86) (1.09) (0.91)
32.8
31.2 28.5
(31.4)
(28.5) (26.0)
45.6 29.5 41.9 36.2
(42.5) (29.9) (36.2) (31.2)
Gunn et al. (2002) Walking Sweeping Window cleaning Vacuuming Mowing
1.05 0.90 1.00 0.79 1.39
27.9 25.9 27.3
33.4
35.1 30.9 33.7 28.1 46.9
Ilmarinen (1984) Carrying/stacking steel rods Working with a wheelbarrow
2.00
1.50
45.6
35.2
78.1
51.2 Lemon and Hermiston
(1977) Ladder climbing Victim rescuing Hose dragging Ladder raising
2.19 2.53 2.55 2.30
50.3 59.9 60.5 53.2
91.6
Sothmann et al. (1992) Emergency firefighting 2.28 52.6 a Data in parentheses is for female test participants
Aminoff et al. (5) recorded performance data from nine hospital kitchen workers (six females and three males) while working 30 minute shifts at a conveyer belt collecting and sorting dishes for cleaning. The work movements involved twisting from right to left as subjects
30

collected the plates and glassware, emptied leftovers from them, and put them in washing baskets. Physiological responses were measured continuously for each subject with a portable system (Cosmed K4). No differences in V02 were observed between the male and female subjects. The mean V02 for all subjects during work was 0.65 L·min-1
• Despite the fact that the Cosmed K4 system measures and records VE, these data were not reported. The anticipated ventilation rate associated with this level of work intensity using the Baba et al. (10) equation is 22.7 L·min-1 (Table 4). It should be noted that the VEIV02 for this estimated minute volume is approximately 35, which is considered to be rather high for a task that would be classified as light work. However, the work tasks of this study involved primarily upper body activities, which utilized a relatively small active muscle mass for completion. It has been documented that ventilation at a given level of oxygen consumption is greater when activities involve primarily small muscle groups (e.g., the arms) than it is when larger muscle groups (e.g., leg muscles) are utilized.(8) Likewise, Mackey et al. (99) demonstrated that VE is significantly lower during supported arm work (e.g., with elbows resting on a surface) than during unsupported arm work like that involved in the kitchen work described by Aminoff et al.(5)
Another investigation that assessed job-related work intensities was reported by Wakui et al. (145) who examined energy expenditure and work rates of female nursing home care providers by monitoring heart rates over time. The types ofwork activities that were assessed included assisting nursing home residents with feeding, bathing, using the rest room, movement, and dressing, as well as administrative duties. Data were collected for subjects during day shift work (approximately nine hours) and night shift work (approximately 16 hours). Break times were not included in the data analysis. Oxygen uptake during care work was calculated for each subject based on the heart rate-oxygen uptake regression equation developed for each individual and energy expenditures were determined by multiplying V02 (Lrnin") by 5 kcal. Thus, the energy expenditures reported by Wakui et al. (145) were reconverted to rates of oxygen consumption so that estimates of VE could be calculated. The estimated VE for nursing care providers ranged from approximately 21 L·min-1 to 23 L'min" for both day and night shift workers. Since V02
levels were well below 0.9 L'min", estimates of VE are based solely on the exponential function of Baba et al.(IO) It is likely that instances of higher and lower breathing rates occurred during the working hours assessed in this study, but the researchers reported only average energy expenditure data for each working shift.
Estimates ofventilation for tasks performed in an agricultural setting were derived from data reported by Ahonen et al. (2) who measured V02 of both male and female dairy farmers during various short-term work tasks. Oxygen consumption data were obtained using an Oxylog. The estimated VE values for some of the common tasks in dairy farming reported by Ahonen et al. (2) are presented in Table 4. For the male farmers, the estimated VE data were recorded over task durations that averaged between five and 12 minutes, whereas the same tasks were about three to 16 minutes in duration for the females. The handling of feed was the heaviest work task assessed, which produced average V02 values of 1.36 L·min-1 for males and 1.28 L'min" for females, indicating that the task was moderate intensity work (Table 1). Corresponding VE estimates for these workloads are 32.8 L·min-1 to 45.6 L·min-l for males and 31.4 L'min" to 42.5 L'min" for females.
31
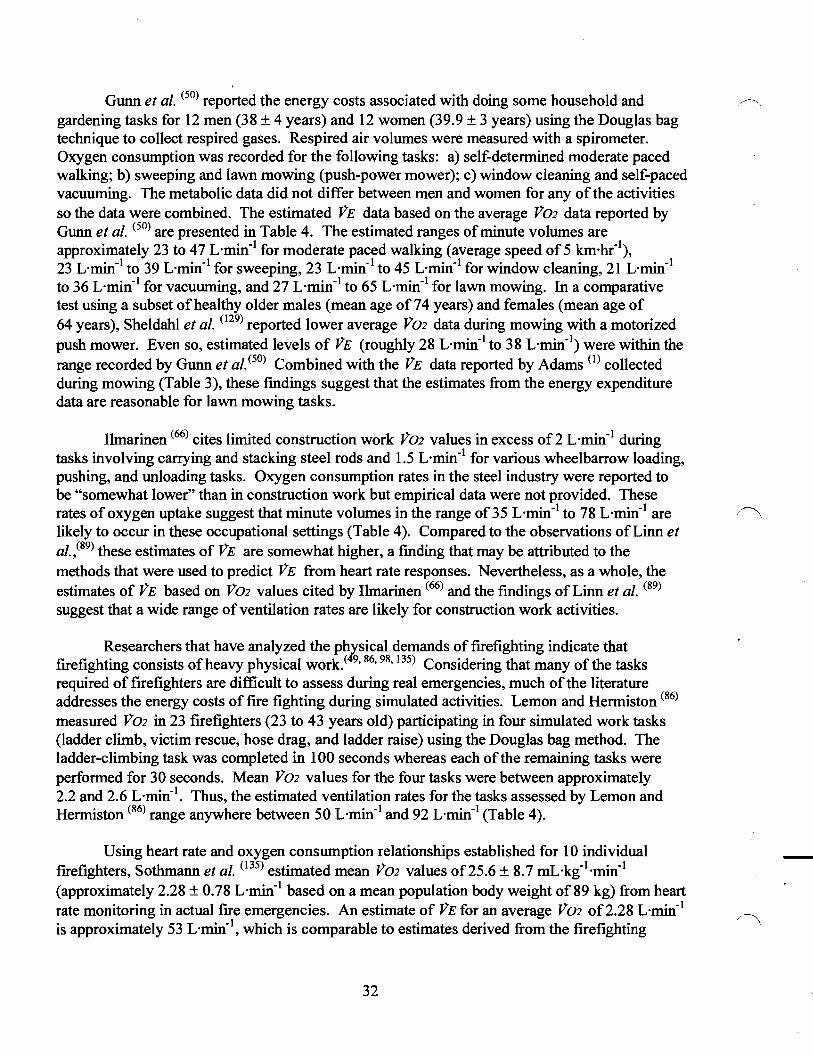
Gunn et al. (50) reported the energy costs associated with doing some household and gardening tasks for 12 men (38 ± 4 years) and 12 women (39.9 ± 3 years) using the Douglas bag technique to collect respired gases. Respired air volumes were measured with a spirometer. Oxygen consumption was recorded for the following tasks: a) self-determined moderate paced walking; b) sweeping and lawn mowing (push-power mower); c) window cleaning and self-paced vacuuming. The metabolic data did not differ between men and women for any of the activities so the data were combined. The estimated PE data based on the average P02 data reported by Gunn et a1. (50) are presented in Table 4. The estimated ranges ofminute volumes are approximately 23 to 47 L·min-l for moderate paced walking (average speed of 5 km-hr"), 23 L·min-l to 39 L'min- l for sweeping, 23 L·min-l to 45 L·min- l for window cleaning, 21 L'min-l
to 36 L'min-l for vacuuming, and 27 L'min" to 65 L·min- l for lawn mowing. In a comparative test using a subset ofhealthy older males (mean age of74 years) and females (mean age of 64 years), Sheldahl et al. (129) reported lower average P02 data during mowing with a motorized push mower. Even so, estimated levels of PE (roughly 28 L'min-l to 38 L·min-l) were within the range recorded by Gunn et al.(50) Combined with the PE data reported by Adams (1) collected during mowing (Table 3), these fmdings suggest that the estimates from the energy expenditure data are reasonable for lawn mowing tasks.
Ilmarinen (66) cites limited construction work P02 values in excess of2 L·min-l during tasks involving carrying and stacking steel rods and 1.5 L'rnin" for various wheelbarrow loading, pushing, and unloading tasks. Oxygen consumption rates in the steel industry were reported to be "somewhat lower" than in construction work but empirical data were not provided. These rates of oxygen uptake suggest that minute volumes in the range of 35 L'min" to 78 L·min-l are "\ likely to occur in these occupational settings (Table 4). Compared to the observations ofLinn et al.,(89) these estimates of PE are somewhat higher, a fmding that may be attributed to the methods that were used to predict PE from heart rate responses. Nevertheless, as a whole, the estimates of PE based on P02 values cited by Ilmarinen (66) and the fmdings of Linn et al. (89) suggest that a wide range ofventilation rates are likely for construction work activities.
Researchers that have analyzed the physical demands of frrefighting indicate that frrefighting consists of heavy physical work.(49, 86, 98,135) Considering that many of the tasks required of firefighters are difficult to assess during real emergencies, much of the literature addresses the energy costs of fire fighting during simulated activities. Lemon and Hermiston (86) measured P02 in 23 firefighters (23 to 43 years old) participating in four simulated work tasks (ladder climb, victim rescue, hose drag, and ladder raise) using the Douglas bag method. The ladder-climbing task was completed in 100 seconds whereas each of the remaining tasks were performed for 30 seconds. Mean P02 values for the four tasks were between approximately 2.2 and 2.6 L'min". Thus, the estimated ventilation rates for the tasks assessed by Lemon and Hermiston (86) range anywhere between 50 L·min- l and 92 L'min-l (Table 4).
Using heart rate and oxygen consumption relationships established for 10 individual firefighters, Sothmann et al. (135) estimated mean P02 values of25.6 ± 8.7 mL·kg-l·min-1
(approximately 2.28 ± 0.78 L·min-l based on a mean population body weight of 89 kg) from heart rate monitoring in actual fire emergencies. An estimate of PE for an average P02 of2.28 L·min- l
is approximately 53 L'min-l, which is comparable to estimates derived from the firefighting
32

simulations assessed by Lemon and Hermiston. (86) Furthermore, the estimates of VE provided for firefighting are comparable to the VE data gathered during simulated escape exercises reported by Kamon et al. (76) and Ross et al.,(124) which are comparable emergency activities requiring heavy physical work. Therefore, it is apparent that firefighting is strenuous work that necessitates high levels of ventilation to meet metabolic demands.
Physical activity data from two additional documents were utilized to estimate ventilation rates from metabolic rates representative ofoccupational activities. The International Organization for Standardization (ISO) Standard 8996 titled "Ergonomics - Determination of metabolic heat production" contains metabolic rates for various work and leisure activities that were derived using oxygen consumption and heart rate data from multiple sources.(68) The ISO 8996 standard presents metabolic rates in units ofW·m-2
• Using information published in the standard, ISO metabolic rates were converted into units of V02 (L'min") with the assumption that the energy equivalent ofoxygen was 5 kcal per liter of oxygen consumed using the equation
M· Anu V0 2 =
60· (5.815) (8)
M· Anu = 348.9
!" where: V02 = oxygen consumption (L'min") M ISO metabolic rate (W·m-2
)
ADu Dubois body surface area (m2)
60 = conversion factor 5.815 energy equivalent of oxygen (W-hr· L-1 02)
Assuming a body surface area of 1.8 m2 for males, the conversion equation is simplified to
v. _ M (9)02 - 193.8
and for females with a body surface area of 1.6 m2 the equation is
v. _ M (10)02 - 218.1
After conversion ofmetabolic rates for occupational activities listed in ISO 8996 were accomplished by applying equations (9) and (10), estimates ofventilation for the occupational activities were again derived based on the exponential relationships of VE and V02 as presented earlier. The results of this analysis are presented in the Appendix. Estimates of VE for females were included in the analysis to demonstrate the differences in ventilation between males and
33

females. Gender differences in flow rates have been previously documented and indicate that females typically have lower VE at rest and during exercise, particularly with maximal efforts.(4,15,79)
The data in Tables A.I and A.2 show mean values of metabolic rates for the duration ofa working period for certain occupations without considering rest periods. Thus, significant variation in work rates and VE should be expected due to differences in a worker's cardiovascular health as well as differences in technology, work tasks, work organization, etc. The estimates of VE presented in Tables A.I and A.2 were derived solely from the exponential VE to V02 relationship of Baba et al. (10) because all V02 values were below the minimum range (0.9 Lrnin") of the Hagan and Smith (51) equation. This analysis indicates that mean ventilation rates for the occupations listed generally fall between 20 L'min" and 40 L·min- l
.
Table A.3 presents metabolic rates measured during specific occupational activities selected from ISO Standard 8996 and our estimates of VE for the various tasks based on work rates using both the Hagan and Smith (51) and Baba et al. (10) functions where applicable. The data presented in Table A.3 permits cursory comparisons with both measured and estimated VE for certain work activities. For example, as previously detailed, we estimated VE values in the range of roughly 29 L·min- l to 66 L·min- l for chainsaw wood-cutting activities based on the reports of Hagen et al. (52) and Kurumatani et al.(81) According to the metabolic rates listed for like activities in Table A.3 (i.e., "felling with power saw" and "cutting across the grain"), estimates of VE fall between 27 L·min- l and 40 L·min- l (males) and are in general agreement with our estimates from Hagan et al. (51) and Kurumatani et al.(81) Likewise, Table A.3 VE estimates for "digging with spade" (45 L·min- l to 76 L·min- l (males)) are comparable to VE estimates for snow shoveling based on the energy expenditure data from Franklin et al. (43) as well as from the measured VE data reported by Smolander et al. (133) and Bridger et al. (17) for shovel work. These fmdings indicate that the estimates of VE derived from the metabolic data presented in Table A.3 are adequate representations of the listed occupational activities. However, it is important to remember that individual differences in metabolic rates for the same activity can be large and the true energy cost for an individual mayor may not be close to the metabolic rates presented in Table A.3. In this same context, variations in VE should also be expected.
The Compendium of Physical Activities (3) provides an additional listing ofphysical activities performed in various settings with their respective metabolic equivalent (MET) intensity levels. As already mentioned, I MET is equivalent to 3.5 mL 02 kg-l·min-l and is considered to be a resting metabolic rate obtained during quiet sitting. Activities are presented in the Compendium as multiples of the resting MET level. The Compendium has received widespread acceptance among physical activity specialists and has been cited as a reference that clinicians and practitioners can use to identify examples of moderate physical activities for exercise prescription. The Compendium was not developed to determine precise energy costs of physical activity within individuals, but instead to provide an activity classification system that standardizes the MET intensities ofphysical activities used in survey research.Y' However, since the MET levels listed for various activities in the Compendium are based on reported energy costs ofpublished research (obtained both with and without indirect calorimetry), the data were
34

considered to be useful for the purposes of this investigation, particularly since energy costs of multiple occupational activities are provided.
Table Ao4 lists the physical activity codes and MET intensities for all of the activities classified under occupational activities. In order to estimate ventilation rates for the multiple tasks, MET levels were converted into oxygen consumption rates (L'min- l
) using equation (7) and assumed body weights of75 kg and 60 kg for males and females, respectively. Again, as was evident with the VE data presented in Table A.3, the VE estimates derived from MET values from the Compendium of Physical Activities provided ventilation rates comparable to those previously presented for like activities. As one example, estimates of VE for "farming, milking by hand, moderate effort" (Code 11210) listed in Table Ao4 are 28.1 L·min- l for males and 24.6 L'rnin" for females, numbers that match previous estimates of25.1 L·min- l and 2504 L'min" for males and females based on metabolic data reported by Ahonen et al. (2) for the same activity. As was found for data from ISO Standard 8996, Table Ao4 VE estimates for "shoveling, digging ditches" and "shoveling, heavy" (Codes 11540 and 11550; 51.3 L·min- l and 54.9 L'min- l for males) are comparable to VE estimates for snow shoveling based on the energy expenditure data from Franklin et al. (43) as well as from the measured VE data reported for shovel work (17,133). Therefore, it again appears that the estimates of VE derived from the metabolic data provided by the Compendium ofPhysical Activities (Table AA) are adequate representations of the occupational activities that are listed, keeping in mind that individual differences in metabolic rates for the same activity are likely and that variations in VE are probable.
4.3 Summary of Measured and Estimated Ventilation Rates for Occupational Tasks.
The range and distribution of VE measured or estimated from our review of the literature is presented in Figure 3. These data include reported mean VE values for workplace and simulated workplace activities, VE values estimated from reported mean energy expenditure rates from like studies using both the Hagan and Smith (51) and Baba et al. (10) relationships of VE and V02, and VE estimates based on energy expenditure rates listed in Tables A.3 and Ao4 from both ISO Standard 8996 (68) and the Compendium ofPhysical Activities.(3) The data for both male and female subjects were combined for this analysis.
Analysis of the data showed a positively skewed distribution for the VE data, primarily due to the single outlying value of 162 L·min-l
. The mean VE ofthe distribution was 38.5 ± 16.6 L'min- l (the peak of the normal distribution curve in Figure 3) and the median was 33.6 L·min- l
. The 95th percentile for VE was 73.3 L·min- l indicating that only 5% of the measured or estimated minute volumes were above 73.3 L'min". Based on the earlier discussion concerning prediction ofPIF rate ranges, peak flows between 72 L·min- l and 183 L·min- l would be expected for the mean VE of38.5 L·min-l
. The anticipated range ofPIF rates for the 95th
percentile VE is between 182 L'min" and 295 L'min", whereas peak flows between 457 L·min- l
and 586 L·min- l are anticipated for the extreme VE estimate of 162 L·min- l. However, there are
two factors that minimize the reliability ofthe PIF data estimated for the 162 L·min-l VE. First, the VE value does not fit within the range of VE data used to determine the 95% prediction
(\ interval (i.e., 6.1 L·min- l to 120.1 L'min"). Second, considering that VE values of this extreme occur infrequently and appear to be attainable only for extremely well conditioned individuals
35
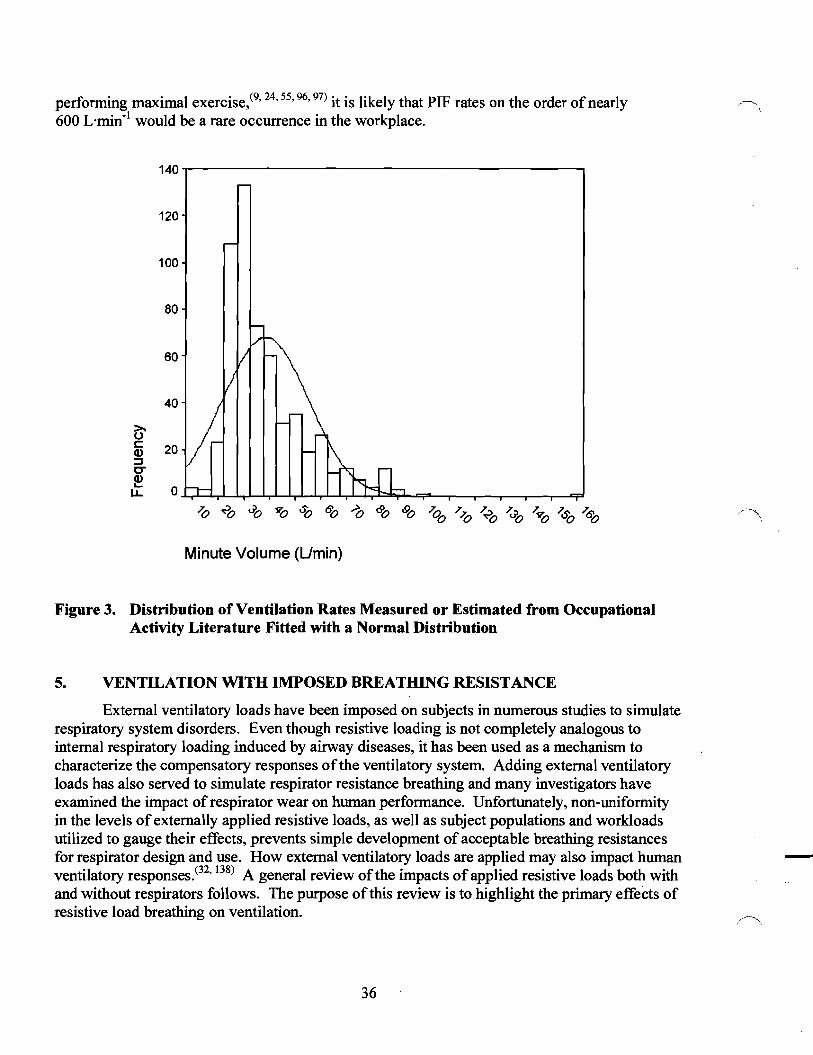
performing maximal exercise.i'" 24, 55, 96, 97) it is likely that PIF rates on the order of nearly /~ \
600 L'min-1 would be a rare occurrence in the workplace.
140..,---------------------------,
120
100
80
60
40
Minute Volume (Umin)
Figure 3. Distribution of Ventilation Rates Measured or Estimated from Occupational Activity Literature Fitted with a Normal Distribution
5. VENTILATION WITH IMPOSED BREATHING RESISTANCE
External ventilatory loads have been imposed on subjects in numerous studies to simulate respiratory system disorders. Even though resistive loading is not completely analogous to internal respiratory loading induced by airway diseases, it has been used as a mechanism to characterize the compensatory responses of the ventilatory system. Adding external ventilatory loads has also served to simulate respirator resistance breathing and many investigators have examined the impact of respirator wear on human performance. Unfortunately, non-uniformity in the levels ofexternally applied resistive loads, as well as subject populations and workloads utilized to gauge their effects, prevents simple development of acceptable breathing resistances for respirator design and use. How external ventilatory loads are applied may also impact human ventilatory responses.T: 138) A general review ofthe impacts ofapplied resistive loads both with and without respirators follows. The purpose ofthis review is to highlight the primary effects of resistive load breathing on ventilation.
36

5.1 Non-Respirator Applied Resistive Breathing Loads.
In response to external resistive loading, the pattern of breathing changes rather consistently for both inspiratory resistive loads (IRL) and expiratory resistive loads (ERL) with inter-individual differences in the amount of these changes. Under resting conditions, there is general agreement in the literature that Vr/Tr is decreased and f is decreased with IRL. (16,67,154)
However, since V T appears to be relatively unchanged or insignificantly increased with IRL, changes in ventilation at rest are also variable. 1m Hof et al. (67) reported an average decrease in ventilation ( Jll ) of approximately 10% with an applied IRL but Brack et al. (16) did not fmd any significant changes in Jll due to IRL of similar magnitude. Expiratory resistive loading consistently induces a pro1on§ation of expiratory time and an increase in V TffI at rest, just the opposite ofIRL. Hill et al. (6 ) reported substantial increases in VT (24%) with E:RL during quiet breathing and both Hill et al. (60) and Poon et al. (116) found significant decreases in f under such
conditions. Expiratory resistive loading appears to reduce ventilation at rest. However, compared to the unloaded condition, reductions are relatively sma11.(116)
Peak inspiratory (PIF) flow rates under sedentary conditions are significantly reduced with IRL. Decrements in PIF from 10% to as great as 60% have been reported with applied inspiratory resistances.l'F" 132, 155) As the level of resistance is increased, the PIF is decreased, the greatest change being produced with relatively small inspiratory loads.(132, 155) Silverman et al. (32) reported that the ratio ofpeak flow to minute volume is highest for individuals during rest with no added inspiratory resistance and lowest for subjects under working conditions with high
1·s).r inspiratory resistance (14.3 cmH20·L-
Flook and Kelman (41) exercised eleven male volunteers at 35%,50%, and 70% of estimated JI02 max , with and without each of three inspiratory resistances (approximately 12.5,27.5, and 92.5 CmH20'L-1. sat 1.42 L· S-I) to assess steady-state responses to IRL. There was a progressive decrease in JlE at each workload with increasing resistance. Average JlE decreased 12% from control with the highest IRL (from roughly 37.3 L'min" to 29 L'min-1)
during light work and 38% from control with the 92.5 cmH20' L-1. s load (from roughly 55.3 L· min-I to 34.4 L'min-1)under moderate steady-state work. During exercise at 70% of estimated Jl02max, average JlE decreased 27% from control with the 27.5 CmH20' L-1·s
resistance (from roughly 75.1 L'min-1to 54.8 Vmin-1) . Data were not reported for the highest
IRL under the heaviest work condition because only one volunteer was able to complete the test. Similar decrements in JlE at steady-state work rates requiring 80% to 85% of Jl02max have also been reported using much smaller inspiratory resistive loads (below 8 cmH20'L-1. s).(19,47,73,87) Applied ERL under steady-state exercise conditions tend to also reduce JlE but again, the magnitude of these reductions is much less than those found for IRL.(21, 60,118,136)
The changes in JlE during non-steady-state maximal efforts mimic those reported during steady-state work for individually applied inspiratory (36, 103, 107) and expiratory resistances.F" Specifically, there appears to be little difference in JlE between unloaded and resistive load conditions under low to moderate rate exercise intensities. However, Jl"E is significantly reduced with resistive loading when maximum performance has been attained.
37

Breathing against IRL under steady-state working conditions impacts PIF much the same ,--..\ as vs. Under steady-state exercise of 120 W, Yasukouchi (154) reported a 10% decrement in PIF with inspiratory loads of2.55 cmH20' L-1·s and 3.06 cmH20' L-1·s compared to the unloaded condition. When applying IRL near an individual's perceptual threshold of the load, Yasukouchi and Serita (155) also found a 10% decrease in PIF after the load was applied during 100 W of external work. Under similar steady-state conditions, Silverman et al. (132) reported roughly the same degree of decline in PIF for comparable IRL. However, as the resistive loads increased above a resistive load of 5.35 cmH20' L-1·s, these investigators found that PIF decreased 24% to 38% on average compared to the no load condition. Likewise, the maximum PIF value observed at 102 W of external work dropped from 170 Lrmin" in the unloaded state to 85 L'min-1 with the highest resistive load.
Considering the fact that respirators offer various degrees of resistance to both inhalation and exhalation dependent upon the respirator type and design, a clearer understanding of the impacts of respirator resistance breathing may only be possible by evaluating studies that have used respirators during testing or applied resistances to both inspiration and expiration. With regard to the latter, an argument could be made that all of the IRL and ERL studies discussed to this point applied both inspiratory and expiratory loads because the breathing apparatuses used to collect, direct, and measure ventilation impose some degree of resistance to airflow. In general, such resistances tend to be very low « 1 cmH20'L-1·s) and may have negligible impacts on ventilation in and of themselves. Thus, for the purposes of this paper, applied IRL and ERL studies will refer only to those investigations that explicitly detail added loads above those inherent to the measuring apparatus. /~
The work of Silverman et al. (131) represents some of the earliest work of applied inspiratory and expiratory breathing resistances. These researchers reported about a 20% decrement in fiE at the two highest work rates (226 W and 271 W) assessed with a combined breathing resistance of 4.51 cmH20'L-1
•s during inhalation and 2.89 cmH20' L-1• son
exhalation comrared to the unloaded condition (0.42 cmH20·L-1·s inhalation and
0.21 CmH20' L- -s exhalation resistance) during steady-state cycling exercise. The peak inspiratory and expiratory flows were also reduced by about 15% at the highest work rate and approximately 20% at the 226 W work rate. On average, the highest values of fiE and PIF reported by Silverman et al. (131) during IRL and ERL were 90.3 L·min-1 and 240 L'rnin".
Deno et al. (31) assessed the impacts of equalleve1s of inspiratory and expiratory resistance on ventilation during progressive exercise to exhaustion as well as during steady-state exercise that was maintained for 60 minutes for each of five resistance conditions. The lowest resistance utilized by these investigators was comparable to the IRL utilized by Silverman et al. (131), but roughly double the ERL. Peak vt: attained at the end ofprogressive exercise to exhaustion decreased with each increase in breathing resistance. At the lowest resistance level, TIE was reduced roughly 26% compared to the unloaded condition. The greatest IRL and ERL condition (roughly 40 cmH20' L-1·s) resulted in a 65% decrease in fiE. During prolonged steady-state exercise, absolute values of TIE were consistently lower than values measured during short-term testing at the same resistance levels. Average fiE was reduced roughly 21% compared to the unloaded condition for the lowest resistive load condition, and about 62% for the highest resistance under prolonged exercise designed to exhaust subjects in one hour.
38

The relative reduction in VE under both exercise scenarios for the resistive load comparable to Silverman et al. (131) parallels that reported by these same investigators, indicating that a 20% reduction in VE with resistive loads ofapproximately 4.5 to 6 CmH20'L-1·s is likely.
In summary, information presented for applied resistive loading shows that resistive loading has little impact on VE under resting and low intensity work conditions, but causes significant reductions in VE with increasing work rates above moderate levels. Furthermore, an inverse relationship between breathing resistance and VE is apparent. Resistive load breathing significantly reduces PIF even under resting conditions. Collectively, these fmdings suggest that peak VE and PIF values reported for unencumbered ventilation are unlikely to be found during resistive load breathing.
5.2 Respirator Resistive Loads.
Many studies have described the ventilatory effects of respirators and the topic has been reviewed elsewherey06, 120) The changes in ventilation associated with particular respirator types are presented here for laboratory-controlled testing and for the limited data available for both simulated and actual workplace studies. In order to facilitate this review, respirator studies were categorized as tests of air-purifying respirators (non-powered), positive pressure devices, including supplied air and powered air-purifying respirators, or self-contained breathing apparatus respirators.
5.3 Air-purifying Respirators.
The use of half-mask air-purifying respirators (APRs) and full-facepiece APRs has been found to result in both higher and lower VE during work of submaximal intensity. During short-duration work (five minutes), Louhevaara et al. (92,94) reported slightly higher VE during the use of a half-mask filtering device compared to unmasked conditions at work rates up to about 60% of V02max. However, the increased VE was not significant in either case. Harber et al. (53) reported non-significant increases in VE with a full-facepiece APR during 6 to 8 minutes of submaximal walking whereas both Jette et al. (69) and Hermansen et al. (59) found slight, but insignificant, decreases in VE with full-facepiece APRs used during submaximal exercise. Under conditions of longer duration steady-state exercise, White et al. (149) reported a significantly higher VE with an APR compared to an unmasked condition after 20 minutes of treadmill walking. However, since this investigation involved full-body encapsulation during heat exposure, the true impact of the APR may be masked by the physiological challenges associated with working in the heat.(69) As for VE, APR induced changes in f and VI were also variable.(53,59,75, 149) Louhevaara et al. (94) reported a slight decrease in the ventilatory equivalent for oxygen (VE/V02) with a half-mask APR during low intensity exercise, a finding supported by observations from Hermansen et al.(59) However, the decrease was not significant in either case. Together, these findings indicate that under submaximal work conditions alterations in ventilation are minimal due to APR wear.
Several authors have reported the effects of APRs for moderate to maximal levels ofr-. exercise. During both progressive and high-intensity constant load work, ventilation seems to
39

decrease substantially during APR wear compared to unmasked conditions. Jette et al. (70) found ,,\. significant reductions in VE at work intensities above approximately 80% V02 max and reported VE max values that were 24% lower than unmasked values during incremental exhaustive load work with a full-facepiece APR. Others found reductions in VE values on the order ofabout 15% to 43% under high-intensity constant load work conditions with similar respirator conditions.(59, 73) Due to these large decrements in VE but relatively unchanged or slightly reduced rates ofoxygen consumption, both Hermansen et al. (59) and Jette et al. (70) found that APR wear reduced VElV02 compared to the unmasked conditions at high work rates. Jette et al. (70) reported a 9% reduction in VEIV02 with an APR compared to the unmasked condition at maximal work. These fmding suggest that APR wear at near maximal and maximal exercise levels cause reduced levels of ventilation compared to unmasked conditions.
5.4 Positive-Pressure Respirators.
Literature for respirators included within this category include demand and pressuredemand supplied air respirators (SAR), and powered air-purifying respirators (PAPR), all of which are generally classified as positive-pressure devices. Positive-pressure respirators are intended to maintain pressures within the system's breathing zone slightly above atmospheric pressures during both inhalation and exhalation. Based on the findings from various studies with positive pressure respirators, it appears that the impacts on ventilation with such devices are minimal.
Laboratory experiments performed with demand or pressure-demand supplied air apparatus (full-facepiece) during short-duration submaximal exercise (% V02 max < 80%) did not show any significant differences in VE responses between masked and unmasked conditions.(94, 119, 121) Harber et al. (53) reported similar fmdings for a powered air-purifying respirator.
During prolonged submaximal, constant load work White et al. (149) found no differences in VE between unmasked and pressure-demand apparatus conditions. In contrast, a significantly greater level ofventilation was reported by Wilson et al. (152) during the first 60 minutes of constant load walking to exhaustion with a full-facepiece pressure-demand apparatus and at the point oftest termination (approximately 56 min). The 'substantially greater work intensity utilized by these investigators (70% V02 max) compared to White et al. (149) (about 24% V02 max)
may explain the contrasting results. However, using progressive load maximal efforts to exhaustion, neither Arborelius et al. (6) or Dahlback and Balldin (29) found significant impacts of positive pressure-demand masks on VE.
Data concerning the parameters ofPIF and VEIV02 as they relate to supplied air respirators are limited. Louhevaara et al. (94) reported a decrease in VElV02 with a pressure-demand apparatus during submaximal work, particularly at the highest workload that was tested (60% V02 max). However, the decrements in VElV02 were relatively small when compared to data collected without the respirator. Dahlback and Balldin (29) found no significant differences in VElV02 between positive pressure-demand masks and unmasked conditions during ~,
maximal exertion. Wilson et al. (152) reported an increased VEIV02 with a pressure-demand
40

~ apparatus at the end of endurance exercise of 70% V02 max but the difference did not appear to be significant.
Raven et al. (121) found that PIF with a pressure-demand type respirator was lower compared to an unmasked condition during exercise, but not at rest. Furthermore, the degree of reduction in PIF was greater at higher work rates. In a similar investigation with a positive pressure-demand type respirator, these same researchers found no differences in PIF between control and mask wear conditions.i'F" Peak inspiratory flows ranged from resting values of 36 L'min-1to 228 L'min-1at about 78% V02 max in this specific study. Under very hard work conditions (300 W) Dahlback and Novak (30) reported PIF rates of approximately 450 L'rnin" for one subject while wearing a pressure-demand respirator. Peak inspiratory flow rates of this magnitude are among the highest observed values even for non-respirator conditions. It should be noted that Dahlback and Novak (30) explicitly stated that their test subjects were two "well-trained" men, which may account for the high PIF rates according to the previous discussions that indicate that extreme values for both VE and PIF tend to be found with highly fit individuals.
Once again, data provided by Wilson et al. (152) showed the opposite effect ofa pressure-demand apparatus on PIF at the same relative work intensity, albeit for a longer duration. During the first 60 minutes of exercise, average PIF were found to be substantially higher with the SAR apparatus compared to the unmasked condition. Average fmal PIF were also significantly greater while wearing the respirator (211.4 ± 7.5 L'min-1) than without
~ (190.9 ± 7.8 L'rnin"). Differences in PIF data between Raven et al. (119) and Wilson et al. (152)
may be due to the substantially lower inhalation resistance of the supplied-air apparatus utilized by the latter researchers, which may have permitted greater PIF due to the initially lower efforts required to compensate for the respirator applied resistance. Regardless, it is important to note that the average values for PIF from both studies are comparable.
5.5 Self-Contained Breathing Apparatus.
A number of researchers have investigated the ventilatofl rewonses ofwearing self-contained breathing apparatus (SCBA) during exercise.Y'' 3 ,93, ,144,149) During submaximal exercise (:s 60% V02 max), it appears that with an SCBA, oxygen uptake is greater compared to unmasked conditions, indicating that wearing the air-container of an SCBA (~ 15 kg) carried as a shoulder harness increases the metabolic burden on the user.(93, 94,149) Louhevaara et al. (94) stated that the load of the SCBA air-container accounted for approximately two-thirds of the increments observed for V02 at the submaximal workloads in their study. Reported changes in VE due to SCBA wear during short-duration exercise of equivalent intensities include slight reductions at work below about 50% V02 max and significant increases at work loads of approximately 60% V02 max compared to unmasked conditions. (93,94) The peak levels of VE reported by Louhevaara et al. (93) averaged 76.7 ± 19.4 L·min-1at the highest workload. Under constant load submaximal work (24% V02 max) of longer duration (2:: 20 min), White et al. (149) reported an increase in VE due to SCBA wear when compared to control conditions.
41
In contrast to findings reported for heavy exercise, Verstappen et al. (144) reported that no significant differences in V02 and VE existed between SCBA wear and control conditions during maximal exercise. A possible explanation for these contrasting results may be that Verstappen et al. (144) did not have subjects wearing an SCBA air tank. A remotely placed cylinder with more than the usual volume of air of an SCBA air container provided the air supply to ensure that experimental tests were not terminated due to depletion oftank air. Even though subjects wore a 15 kg lead vest to simulate SCBA air tank weight, other dynamics that could have influenced metabolic responses such as restrictions ofa tank harness and postural adjustments used to accomplish tank carrying may not have been adequately simulated by Verstappen et al. (144).
Nevertheless, the VE data reported for SCBA wear at maximal exertion were slightly lower for SCBA conditions compared to control. Without an SCBA, VE max averaged 140 ± 15 L'min- l
during cycling and 140 ± 22 L'rnin" during treadmill exercise. With a positive pressure-demand SCBA, VE max averaged 134 ± 22 L'min- l during cycling and 129 ± 14 L'min" during treadmill exercise. These represent the highest VE values reported in the literature for SCBAs.
\
Changes in VEIV02 reported during SCBA wear include both an increase in values (93,94)
and no differences compared to control conditions.(144) Decrements as high as 20% were reported by Louhevaara et al. under heavy work. (93)
In general, the impacts of SCBA usage on ventilation suggest that VE are reduced compared to the unencumbered state. This, despite the fact that the added weight associated with carrying the air supply tank of an SCBA increases the metabolic load of the user, a factor that independently increases VE. Reductions in the VElV02 found with SCBA wear suggest that hypoventilation is likely with such respirator devices, particularly under heavy work conditions.
/-""\
5.6 Workplace Studies with Respirators.
The three main problems associated with measuring the ventilatory effects of respirator usage in the workplace are the technical challenge in measuring ventilation without altering the function of the respirator itself, collecting data without disrupting the user's normal work activities, and the inability to control factors that may impact the physiological parameters of interest,(61) With this in mind, it is not surprising that so few studies of respirator effects in the workplace are found in the open literature.
5.7 Air-purifying Respirators in the Workplace.
Louhevaara et al. (95) measured heart rate and, when technically possible, V02 and VI
using an Oxylog, during workshifts injobs that were completed with filtering devices. During building demolition work with a half-mask APR with dust filters, mean work intensity ranged from 36% to 62% of V02max with VI values of24 L'rnin" to 48 L·min- l for the test population. In cast cleaning, welding, and spray painting jobs with both half-mask and full facepiece APRs with combination dust and gas filters, average work intensities were between 12% and 32% of V02 max with VI values of 16 L'min-l to 33 L'rnin",
42

Using respiratory inductive plethysmography, Hodous et al. (61) measured ventilation with and without APR wear on workers performing various job tasks (e.g., working with molten ore, spray painting, sanding and cleaning activities, and sidewalk maintenance). Protective clothing was also worn when required and ambient conditions at all worksites were relatively warm (25°C to 30°C). Respirator wear periods lasted approximately 30 minutes for molten ore work and between five minutes and 40 minutes for spray painting. Based on heart rate data, job-task workloads were considered to be moderate. For all job tasks with an APR, PE averaged 21.5 ± 7.3 L'rnin".
Kaufman and Hastings (77) recently reported ventilation data recorded on 48 male (mean age 22 ± 2.1 years) members ofthe U.S. Marine Corps while performing simulated tasks relevant to their mission responsibilities. These included simulated decontamination procedures that involved lifting and moving litters and washing down individuals (DECON), a reconnoitering task of walking through various obstacles (RECON), and simulated frrefighting tasks. Volunteers wore a full-facepiece APR with a particulate and gas combination filter element for all trials, along with chemical protective clothing. Inspired minute volumes were obtained using a turbine flow meter mounted to the respirator filter element for all trials. Both the DECON and RECON tasks involved relatively low to moderate work over a 60 minutes duration, whereas the simulated frrefighting task involved heavy and near maximal exertion during roughly 20 minutes of work. Average ventilation rates for the simulated DECON and RECON tasks were below 40 L·min-1
• Data analyzed during what the authors identified as a region ofpeak respiration, which generally corresponded to the heaviest work period during the simulated frrefighting task,
r> showed an average PI of 96.4 ± 18.9 L·min- 1• The authors also reported that PI within each
subject's region ofpeak respiration exceeded 100 L'rnin" in 42% of the test participants. The single highest recorded PI during the frrefighting simulation was 132 L'rnin",
Data concerning PIF with APRs were also reported by Kaufman and Hastings (77), who found average PIF below approximately 120 Lrnin' during simulated DECON and RECON operations, with average maximal PIF of220 L'min-1 or less. For the simulated firefighting task, PIF averaged 239 ± 34 L'rnin" and maximum PIF averaged 294 ± 39 L·min- 1
• The authors observed a single maximum PIF of 356 L·min- 1 during frrefighting simulation. We have found similar PIF values during testing under heavy exercise conditions with an APR similar to that used by Kaufman and Hastings,(77) albeit with different inhalation resistances.(28)
5.8 Positive-Pressure Respirators During Work Activities.
In addition to testing with APRs, Hodous et al. (61) measured ventilation with and without SAR wear on workers performing sandblasting and spray painting in an equipment repair facility. The workers performing sandblasting wore a hooded air-line respirator with protective clothing and spray painters wore air-line respirators. Mean heart rates during work with both respirators averaged 114.3 beats'min-1 for both job tasks. Louhevaara et al. (95) observed comparable heart rates under similar work tasks and respirator conditions and classified such work with supplied-air respirators as light to moderate. According to Hodous et al. (61), average ventilation rates under such conditions were 17.7 ± 5.6 L·min-1
• Ventilation data were not reported by Louhevaara et al.(95)
43

Utilizing the same firefighting simulation task as Kaufman and Hastings,(77) Berndtsson
and Howie (14) recorded ventilation using a fan-supplied positive pressure breath responsive respirator. In general, the apparatus is a PAPR designed to maintain positive pressure in a full-facepiece respirator with a blower that adjusts the rate of supplied air according to breathing demands of the user. The system is packaged with pressure transducers that monitor pressure changes near the filtering elements and within the oral-nasal cavity ofthe respirator facepiece. Changes in pressure are used to adjust blower fan speed. The system also permits measurement oftotal airflow through the respirator's filtering elements and provides a nominal measure of user ventilation. However, there are some unresolved questions that need to be addressed concerning the methods used to determine the pressure-flow curves for measuring ventilation with the system.
In a recent paper, Berndtsson and Ekman (13) describe a technique for measuring ventilation with an APR that appears to be a variant of the principles utilized by a pneumotachograph in that pressure changes across a fixed resistance are related to volumetric flow. There are two potential problems with this method. First, the device, as described by Berndtsson and Ekman,(13) does not use a stable fixed resistance comparable to that ofa pneumotachograph, but it uses a P100 particulate filter that would likely have a variable resistance over time due to filter loading. Second, the device does not use a differential pressure transducer that measures pressure on both sides of the resistance element, but rather uses a gage pressure transducer that measures the difference between the applied pressure and atmospheric pressure. Ifthe gage pressure readings are not referenced to absolute pressure, then the pressure readings will be dependent on ambient pressure conditions, which fluctuate due to weather conditions. Thus, a pressure-flow calibration curve developed in a controlled lab may not be applicable when the respirator is worn in another location or at another time with changing weather conditions. It is unclear whether or not Berndtsson and Howie (14) used a similar method for measuring flow rates with the PAPR. Either way, more information on the method used to determine flow rates based on pressure changes within the PAPR system is needed. One fmal concern is the apparent method used to separate fan-supplied air volumes from ventilation volumes. The method requires the investigator or test administrator to visually inspect the flow tracings and then select the volume of airflow due to the fan from the flow curve that represents the total flow of air through the filters. This purely subjective determination is used in the flow analysis of all subsequent breaths in a given period. No effort is made to validate the selected fan-supplied air volume using an objective method. Thus, interpretation of the flow data reported for the flow measuring system utilized in the fan-supplied positive pressure breath responsive respirator warrants some caution until a better understanding of the device can be obtained. Despite potential shortcomings of their flow-measuring device, the data reported by Berndtsson and Howie (14) are reported here because they are pertinent to the discussion ofPAPR use in a simulated work setting.
For the firefighting simulation, Berndtsson and Howie (14) observed an average VI of approximately 106 L'min-1
, with a single maximal VI of roughly 175 L'min-1 when they assumed about a 17% overflow of fan-supplied air to maintain positive pressure in the respirator facepiece. Mean PIF with the breathe-assist PAPR was reported to be 290 ± 85 L'min-1 with maximal values as high as 582 L·min-1
• However, the authors appear to have failed to account for overflow of the fan-supplied air in the presentation of the PIF rate data. Assuming the same
44
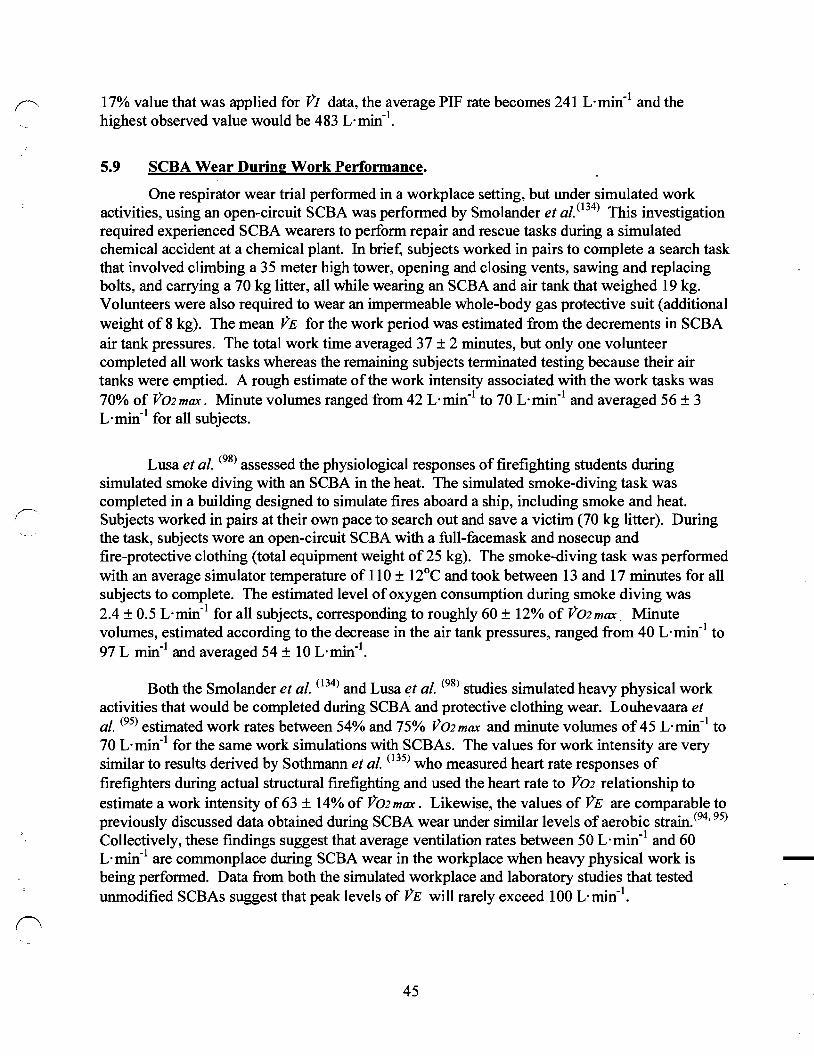
17% value that was applied for VI data, the average PIF rate becomes 241 L'min- l and the highest observed value would be 483 L·min- l
.
5.9 SeRA Wear During Work Performance.
One respirator wear trial performed in a workplace setting, but under simulated work activities, using an open-circuit SCBA was performed by Smolander et al.(134) This investigation required experienced SCBA wearers to perform repair and rescue tasks during a simulated chemical accident at a chemical plant. In brief, subjects worked in pairs to complete a search task that involved climbing a 35 meter high tower, opening and closing vents, sawing and replacing bolts, and carrying a 70 kg litter, all while wearing an SCBA and air tank that weighed 19 kg. Volunteers were also required to wear an impermeable whole-body gas protective suit (additional weight of 8 kg). The mean VE for the work period was estimated from the decrements in SCBA air tank pressures. The total work time averaged 37 ± 2 minutes, but only one volunteer completed all work tasks whereas the remaining subjects terminated testing because their air tanks were emptied. A rough estimate of the work intensity associated with the work tasks was 70% of Valmax . Minute volumes ranged from 42 Limin" to 70 L'min- l and averaged 56 ± 3 L'min- l for all subjects.
Lusa et al. (98) assessed the physiological responses offirefighting students during simulated smoke diving with an SCBA in the heat. The simulated smoke-diving task was completed in a building designed to simulate fires aboard a ship, including smoke and heat. Subjects worked in pairs at their own pace to search out and save a victim (70 kg litter). During the task, subjects wore an open-circuit SCBA with a full-facemask and nosecup and fire-protective clothing (total equipment weight of 25 kg). The smoke-diving task was performed with an average simulator temperature of 110 ± 12°C and took between 13 and 17 minutes for all subjects to complete. The estimated level ofoxygen consumption during smoke diving was 2.4 ± 0.5 L'min- l for all subjects, corresponding to roughly 60 ± 12% of Valmax. Minute volumes, estimated according to the decrease in the air tank pressures, ranged from 40 Lrrnin" to 97 L min-I and averaged 54 ± 10 L'rnin".
Both the Smolander et al. (134) and Lusa et al. (98) studies simulated heavy physical work activities that would be completed during SCBA and protective clothing wear. Louhevaara et al. (95) estimated work rates between 54% and 75% Valmax and minute volumes of 45 L'min- l to 70 L'min-l for the same work simulations with SCBAs. The values for work intensity are very similar to results derived by Sothmann et al. (135) who measured heart rate responses of firefighters during actual structural frrefighting and used the heart rate to Val relationship to estimate a work intensity of 63 ± 14% of Val max. Likewise, the values of VE are comparable to previously discussed data obtained during SCBA wear under similar levels of aerobic strain.(94,95)
Collectively, these fmdings suggest that average ventilation rates between 50 L'min- l and 60 L'min-l are commonplace during SCBA wear in the workplace when heavy physical work is being performed. Data from both the simulated workplace and laboratory studies that tested unmodified SCBAs suggest that peak levels of VE will rarely exceed 100 L·min- l
.
45

6. CONCLUSIONS AND RECOMMENDATIONS
It is apparent from the review of the literature presented herein that specific values for human ventilation during occupational tasks in work environments are limited. Since measurements ofventilation rates are available for a minimal number ofphysical activities, this review included estimates of vs based on energy expenditure rates reported for a wide range of occupational activities. In most instances, estimates of vt: were calculated based on the exponential relationships between vs and vos reported by Hagan and Smith (51) and Baba et a/.,o°) thus providing a range ofpredicted rtE values for a given energy expenditure. Since human ventilatory responses can vary dramatically based on cardiovascular fitness, body dimensions, gender, and age, not to mention the work environment (e.g., temperature and humidity) and the intensity and biomechanical dynamics of activity, it was reasoned that a range of rtE values would better defme anticipated occupational ventilation rates.
A summary analysis of both measured and estimated vs indicated a range of vs from about 8 L·min- l to 162 L·min- l for work activities that spanned mild to exhaustive workloads. The mean vs for all data was 38.5 ± 16.6 L'min" and the 95th percentile for vs was 73.3 L'min". Interestingly, the mean vs of 38.5 ± 16.6 L'min" is very similar to the 40 L'min- l
cyclic flow rate currently employed in chemical agent respirator system testing required by NIOSH for certification of SCBA and APR respirators to CBRN standards. However, based on the 95th percentile for vt: observed in this review, it appears that higher cyclic flow rates may be needed to account for a greater percentage ofventilation rates that are likely to occur in the workplace. When compared to minute volumes observed during incremental exercise testing to ~
exhaustion, testing that is designed to determine maximum physiological responses, the distribution of estimated vt: values for occupational work tasks indicated that minute volumes rarely reach rtE max values such as those reported by Blackie et a/.(15) Therefore, it appears that a minute volume of about 73 L·min- l sufficiently represents the upper end of workplace ventilation rates. Higher vs values are likely to be found in the workplace, however all indications are that these occurrences will not be the norm. An increase in cyclic flow rates used in CBRN certification testing should be considered to better represent ventilation rates found in the workplace. Ifthe desire is to encompass a higher percentage ofpossible human ventilation rates independent of the workplace, then the recommendation would be to utilize a vs of 114 L'min- l
,
the average vs max values reported by Blackie et a/. (15) for 20 to 29 year old males.
The data in the foregoing review that reported PIF rates for unencumbered ventilation from work intensities ranging from rest to exhaustive exercise, as well as during speech, showed that PIF rates generally increase exponentially with increasing work rate. High estimates of PIF based on the mean and 95th percentile vs values found in the analysis of workplace ventilation rates were 183 L'min- l and 295 Lrnin", respectively. These PIF rates correspond with average PIF data found in the literature and suggest that a PIF of approximately 300 L·min-l would adequately represent 95% of the peaks occurring during occupational task performance. However, since PIF in excess of 300 L'min- l has been measured during high intensity work (326 L·min- l and 485 L·min- l (Coyne, personal communication, February 27, 2004)), an argument for setting PIF rate test standards above 300 L'min" is difficult to dismiss. The question becomes what is a reasonable limit for PIF? One plausible solution is to estimate the ~ upper limit of a PIF rate range based on maximal vs data measured, not estimated, during
46

maximal load work. Again, we refer to the average VE max of 114 ± 23 L'min- I reported by Blackie et al.(15) The PIF rate prediction interval derived from this VE is about 329 Lrnin" to 428 L·min- I
. Ifone standard deviation is added to the average VE max as a safety factor or to account for potential shortfalls with prediction intervals, VE increases to 137 Lrnin" and the PIF prediction interval changes to 380 L'min- I to 503 Lrnin". These findings indicate that the upper limits ofPIF rate are likely to fall somewhere between roughly 430 and 500 L'min" and suggest that PIF rates of this magnitude should adequately represent peak values for most physical activities. Bearing in mind that peak inspiratory flows of 500 L'min" are likely to be found only during very short-duration, exhaustive work loads, the occurrence of such extreme flows should be considered extremely rare during normal workplace activities. In addition, since a PIF of 430 L'min- I is 1.4 times greater than the highest PIF estimates based on the 95th
percentile workplace ventilation rate (i.e., about 300 L'min- I) , it is recommended that utilizing a
PIF rate of this magnitude would be adequate for filter and respirator testing. Finally, since peak inspiratory flows are representative of the single highest rate of flow during a given inhalation phase, caution must be exercised in how the impacts of PIF on respirator or filter performance should be assessed. Ideally, testing should mimic real world use as much as possible. Our recommendation would be to test PIF impacts under cyclic flow conditions as would be observed during human breathing to gain a truer understanding of respirator or filter performance under extreme flow conditions. Application of a constant rate airflow that equals a chosen PIF upper limit would not be representative of real use conditions for most, if not all, respirator types.
According to the literature concerning ventilatory responses to work during respirator /"> wear reviewed herein, it appears that high VE and PIF rates are attainable while wearing most
respirator types during heavy work. However, peak values of VE and PIF will generally be lower than those achieved for unmasked test activities, particularly during heavy work with APR and SCBA respirators. Supplied-air systems appear to have less of an impact on ventilation by comparison. Despite the apparent damping impacts of APR and SCBA systems on peak ventilation values, the current recommendation is to utilize data for the unencumbered state for test flow rates and not to attempt to establish multiple flow rate criterion based on respirator types.
Finally, this review reemphasized the gap in data pertaining to human breathing responses to real-world daily activities. Despite the potential shortcomings of the methods adopted herein for estimating VE and PIF rates, we believe that this review serves as a first step toward defining ventilatory responses in the workplace. Until further research that utilizes a reliable, repeatable, and virtually unnoticeable method for measuring human ventilation can be implemented, a truer understanding cannot be achieved.
7. FUTURE CONSIDERATIONS
As an adjunct effort to this literature review, work has been initiated to gather, compile, and analyze human ventilation data from various sources. The objective ofthis work is to obtain raw data from willing investigators who have recently measured and recorded breathing volumes and other respiratory data during respirator wear test trials. Once gathered, the data will be
(' categorized according to parameters such as respirator type and external workload conditions and reanalyzed. The purpose of the analysis is to validate the current knowledge base on ventilatory
47
responses to respirator wear. In addition, the data will be scrutinized to identify knowledge gaps, which may be useful for setting future investigations of respirator wear. Ventilation data provided to date is under review and an initial database of independent and dependent variables has been designed and partially populated. Data analysis will be initiated once the database has been fmalized.
Other work items that should be considered as paramount to developing a comprehensive understanding of workplace breathing rates for respirator users include the following:
1. Determination of the relationship between VE and V02 for a representative population of respirator users. The exponential functions reported by Hagan and Smith (51) and Baba et al. (10) utilized to derive VE from V02 in this literature review have provided useful estimates ofventilation for various work tasks. However, additional research that establishes a relationship between VE and V02 based on actual respirator users should be considered so that estimates of VE based on energy expenditure better reflect this worker demographic.
2. Development of a flow-measuring device for quantifying breathing patterns of respirator users at work. As evident from the literature review, data that quantify ventilation rates of workers performing everyday tasks is sparse. Measuring the ventilatory effects of respirator usage in the workplace involves the technical challenges of measuring ventilation without altering the function of the respirator and collecting data without disrupting the user's normal work activities. In order to gain a better understanding of worker breathing parameters, an effort that develops a flow measuring device capable of measuring breathing patterns without increasing respirator encumbrance or interfering with protective capabilities during respirator wear is warranted. Without such a device, respirator test standards for airflows that are supposed to reflect actual user ventilation will continue to be based on airflow parameters measured in laboratory settings or estimated from physical activity workloads.
48
LITERATURE CITED
1. Adams W (1993). Measurement of breathing rate and volume in routinely performed daily activities. Sacramento, CA: California Air Resources Board Research Division.
2. Ahonen E, Venalainen 1M, Kononen U, and Klen T (1990). The physical strain of dairy farming. Ergonomics 33: 1549-1555.
3. Ainsworth BE, Haskell WL, Whitt MC, Irwin ML, Swartz AM, Strath SJ, O'Brien WL, Bassett Jr. DR, Schmitz KH, Emplaincourt PO, Jacobs DR, and Leon AS (2000). Compendium ofphysical activities: an update of activity codes and MET intensities. Med. Sci. Sports Exerc. 32: S498-S516.
4. Aitken ML, Franklin JL, Pierson DJ, and Schoene RB (1986). Influence of body size and gender on control ofventilation. J. Appl. Physiol. 60: 1894-1899.
5. AminoffT, Smolander J, Korhonen 0, and Louhevaara V (1999). Physiological strain during kitchen work in relation to maximal and task-specific peak values. Ergonomics 42: 584-592.
6. Arborelius M, Dahlback GO, and Data P-G (1983). Cardiac output and gas exchange during heavy exercise with a positive pressure respiratory protective apparatus. Scan. J. Work Environ. Health 9: 471-477.
7. Armstrong N, Kirby BJ, McManus AM, and WeIsman JR (1997). Prepubescents' ventilatory responses to exercise with reference to sex and body size. Chest 112: 15541560.
8. Astrand P-O and Rodahl K (1986). Textbook of work physiology. 3rd Edition. New York, NY: McGraw-Hill.
9. Astrand P-O and Saltin B (1961). Maximal oxygen uptake and heart rate in various types of muscular activity. J. Appl. Physiol. 16: 977-981.
10. Baba R, Mori E, Tauchi N, and Nagashima M (2002). Simple exponential regression model to describe the relation between minute ventilation and oxygen uptake during incremental exercise. Nagoya J. Med. Sci. 65: 95-102.
11. Bassey EJ and Fentem PH (1981). Sport and physical health. J. Biosoc. Sci. Suppl. 7: 71-82.
12. Beals JAJ, Funk LM, Fountain R, and Sedman R (1996). Quantifying the distribution of inhalation exposure in human populations: distribution of minute volumes in adults and children. Environ Health Perspect 104: 974-979.
13. Berndtsson G and Ekman L (2003). A new simplified technique for measuring inspiratory flow characteristics. J. Int. Soc. Respir. Prot. 20: 91-101.
49
14. Berndtsson G and Howie R (2003). Peak inhalation air flow during an agility test performed by the US Marine Corps. Sydney, Australia: The SEA Group.
15. Blackie SP, Fairbarn MS, McElvaney NG, Wilcox PG, Morrison NJ, and Pardy RL (1991). Normal values and ranges for ventilation and breathing pattern at maximal exercise. Chest 100: 136-142.
16. Brack T, Jubran A, and Tobin MJ (1998). Effect of resistive loading on variational activity of breathing. Am. J. Respir. Crit. Care Med. 17: 1756-1763.
17. Bridger RS, Cabion N, Goedecke J, Rickard S, Schabort E, Westgarth-Taylor C, and Lambert MI (1997). Physiological and subjective measures of workload when shoveling with a conventional and two-handled ('levered') shovel. Ergonomics 40: 1212-1219.
18. Busmundrud 0 (1993). Vapour breakthrough in activated carbon beds. Carbon 31: 286-297.
19. Caretti DM and Whitley JA (1998). Exercise performance during inspiratory resistance breathing under exhaustive constant load work. Ergonomics 41: 501-511.
20. Caretti DM, Pullen P, Premo LA, and Kuhlmann WD (1994). Reliability of respiratory inductive plethysmography for measuring tidal volume during exercise. Am. Ind. Hyg. Assoc. J. 55: 918-923.
21. Caretti DM, Scott WH, Johnson AT, Coyne KM, and Koh F (2001). Work performance when breathing through different respirator exhalation resistances. Am. Ind. Hyg. Assoc. J. 62: 411-415.
22. Carry P-Y, Baconnier P, Eberhard A, Cotte P, and Benchetrit G (1997). Evaluation of respiratory inductive plethysmography: accuracy for analysis of respiratory waveforms. Chest 111: 910-915.
23. Chatfield C (1998). Prediction Intervals. Bath, UK: Department ofMathematical Sciences, University ofBath.
24. Clark lM, Hagerman FC, and Gelfand R (1983). Breathing patterns during submaximal and maximal exercise in elite oarsmen. J. Appl. Physiol. 55: 440-446.
25. Conrad Band Schonle P (1979). Speech and Respiration. Arch. Psychiat. Nervenkr. 226: 251-268.
26. Consolazio CF (1971). Energy expenditure studies in military populations using the Kofranyi-Michaelis respirometers. Am. J. Clin. Nutr. 24: 1431-1437.
27. Consolazio CF, Johnson RE, and Pecora E (1963). Physiological methods ofmetabolic functions in man. 313-317. New York, NY: McGraw-Hill.
50
28. Coyne KM (2001). Modeling the Pulmonary Effects of Respiratory Protective Masks During Physical Activity. Department ofBiological Resources Engineering, University ofMaryland College Park.
29. Dahlback GO and Balldin U (1984). Physiological effects ofpressure demand masks during heavy exercise. Am. Ind. Hyg. Assoc. J 45: 177-181.
30. Dahlback GO and Novak L (1983). Do pressure demand systems safeguard against inward leakage? Am. Ind. Hyg. Assoc. J 44: 336-340.
31. Deno NS, Kamon E, and Kiser DM (1981). Physiological responses to resistance breathing during short and prolonged exercise. Am. Ind. Hyg. Assoc. J 42: 616-621.
32. Dooly CR, Johnson AT, Dotson CO, Vaccaro P, and Soong P (1996). Peak oxygen consumption and lactate threshold in full mask versus mouth mask conditions during incremental exercise. Eur. J Appl. Physiol. Occup. Physiol. 73: 311-316.
33. Doust JH and Patrick JM (1981). The limitation of exercise ventilation during speech. Respir. Physiol. 46: 137-147.
34. Duncan H, Gardner G, and Barnard R (1979). Physiological responses ofmen working in fire-fighting equipment. Ergonomics 22: 521-527.
35. Durnin JVDA and Passmore R (1967). Energy, work and leisure. London: William Heinemann, Ltd.
36. D'Urzo AD, Chapan KR, and Rebuck AS (1987). Effect of inspiratory resistive loading on control of ventilation during progressive exercise. J Appl. Physiol. 62: 134-140.
37. Emi H, Kanaoka C, Otani Y, and Ishiguro T (1987). Collection mechanisms of electret filter. Particulate Sci. Technol. 5: 161-171.
38. Faff J and Tutak T (1989). Physiological responses to working with fire-fighting equipment in the heat in relation to subjective fatigue. Ergonomics 32: 629-638.
39. Fairshter RD, Salness K, Walters J, Minh YD, and Wilson A (1987). Relationships between minute ventilation, oxygen uptake, and timing during incremental exercise. Respiration 51: 223-231.
40. Fisher A and Hom PS (1994). Robust prediction intervals in a regression setting. Comput. Statist. Data Anal. 17: 129-140.
41. Flook V and Kelman GR (1973). Submaximal exercise with increased inspiratory resistance to breathing. J Appl. Physiol. 35: 379-384.
42. Fox EL, Bowers RW, and Foss ML (1989). The physiological basis of physical education and athletics. 4th Edition. Dubuque, IA: Wm. C. Brown.
51
43. Franklin BA, Hogan MA, Bonzheim K, Bakalyar D, Terrien E, Gordoh S, and Timmins GC (1995). Cardiac demands ofheavy snow shoveling. JAMA 273: 880-882.
44. Gallagher CG, Brown E, and Younes M (1987). Breathing pattern during maximal exercise and during submaximal exercise whith hypercapnia. J. Appl. Physiol. 63: 238244.
45. Gallagher S (1991). Acceptable weights and physiological costs ofperforming combined manual handling tasks in restricted postures. Ergonomics 34: 939-952.
46. Gallagher S and Hamrick CA(1992). Acceptable workloads for three common mining materials. Ergonomics 35: 1013-1031.
47. Gee JBL, Burton C, Vassablo C, and Gregg J (1968). Effects of external airway obstruction on work capacity and pulmonary gas exchange. Am. Rev. Respir. Dis. 98: 1003-1012.
48. Gilbert R, Auchincloss JH, Brodsky J and Boden W (1972). Changes in tidal volume, frequency, and ventilation induced by their measurement. J. Appl. Physiol. 33: 252254.
49. Gledhill N and Jamnik VK (1992). Characterization ofthe physical demands of firefighting. Can. J. Sport Sci. 17: 207-213.
50. Gunn SM, Brooks AG, Withers RT, Gore CJ, Owen N, Booth ML, and Bauman AE (2002). Determining energy expenditure during some household gardening tasks. Med. Sci. Sports Exerc. 34: 895-902.
51. Hagan RD and Smith MG (1984). Pulmonary ventilation in relation to oxygen uptake and carbon dioxide production during incremental load work. Int. J. Sports Med. 5: 193-197.
52. Hagen KB, Vik T, Myhr NE, Opsahl PA, and Harms-Ringdahl K (1993). Physical workload, perceived exertion, and output of cut wood as related to age in motormanual cutting. Ergonomics 36: 479-488. .
53. Harber P, Beck J, Brown C, and Luo J (1991). Physiologic and subjective effects of respirator mask type. Am. Ind. Hyg. Assoc. J. 52: 357-362.
54. Harber P, SooHoo K, and Lew M (1988). Effects of industrial respirators on respiratory timing and psychophysiologic load sensitivity. J. Occup. Med. 30: 256-262.
55. Hanns C, Wetter TJ, St. Croix CM, Pegelow DF, and Dempsey JA (2000). Effects of respiratory muscle work on exercise performance. J. Appl. Physiol. 89: 131-138.
56. Harrison MH, Brown GA, and Belyavin AJ (1982). The "Oxylog"; an evaluation. Ergonomics 25: 809-820.
52
57. Hausswirth C, Bigard AX, and Le Chevalier 1M (1997). The Cosmed K4 telemetry system as an accurate device for oxygen uptake measurements during exercise. Int. J. Sports Med. 18: 449-453.
58. Hermansen Land Saltin BS (1969). Oxygen uptake during maximal treadmill and bicycle exercise. J. Appl. Physiol. 26: 31-37.
59. Hermansen L, Vokac Z, and Lereim P (1972). Respiratory and circulatory response to added air flow resistance during exercise. Ergonomics 15: 15-24.
60. Hill AR, Kaiser DL, Lu J-Y, and Rochester DF (1985). Steady-state response of conscious man to small expiratory resistive loads. Respir. Physiol. 61: 369-381.
61. Hodous TK, Hankinson JL, and Stark GP (1989). Workplace measurement of respirator effects using respiratory inductive plethysmography. Am. Ind. Hyg. Assoc. J. 50: 372-378.
62. Hoit JD and Lohmeier HL (2000). Influence of continuous speaking on ventilation. J. Speech Lang. Hear. Res. 43: 1240-1251.
63. Horii Y and Cooke PA (1978). Some airflow, volume, and duration characteristics of oral reading. J. Speech Hear. Res. 21: 470-481.
64. Huang C, Willeke K, Qian Y, Grinshpun S, and Ulevicius V (1998). Method for measuring the spatial variability of aerosol penetration through respirator filters. Am. Ind. Hyg. Assoc. J. 59:461-465.
65. landelli I, Aliverti A, Kayser B, Dellaca R, Cala SJ, Duranti R, Kelly S, Scano G, Sliwinski P, Van S, Macklem P, and Pedotti A (2002). Determinants of exercise performance in normal men with externally imposed expiratory flow limitation. J. Appl. Physiol. 92: 1943-1952.
66. Ilmarinen J (1984). Physical load on the cardiovascular system in different work tasks. Scand. J. Work Environ. Health 10: 403-408.
67. 1m HofV, West P, and Younes M (1986). Steady-state response ofnormal subjects to inspiratory resistive load. J. Appl. Physiol. 60: 1471-1481.
68. Isorrc159/SC5 (1990). Ergonomics - Determination ofmetabolic heat production. International Organization for Standardization.
69. Jette M, Quenneville J, Thoden J, and Livingstone S (1992). Effect of inspiratory resistance to prolonged exercise in a hot environment wearing protective clothing. Int. J. Biometeorol. 36: 130-135.
70. Jette M, Thoden J, and Livingstone S (1990). Physiological effects of inspiratory resistance on progressive aerobic work. Eur. J. Appl. Physiol. 60: 65-70.
53
71. Johns DP, Ingram CM, Khov S, Rochford PD, and Walters EH (1998). Effect of breathing circuit resistance on the measurement of ventilatory function. Thorax 53: 944-948.
72. Johnson AT (1993). How much work is expended for respiration? Frontiers Med. Bioi. Engng. 5: 265-287.
73. Johnson AT, Scott WH, Lausted CG, Benjamin MB, Coyne KM, Sahota MS, and Johnson MM (1999). Effect of respirator inspiratory resistance level on constant load treadmill work performance. Am. Ind. Hyg. Assoc. J. 60: 474-479.
74. Johnson AT, Weiss R, and Grove C (1992). Respirator performance rating table for mask design. Am. Ind. Hyg. Assoc. J. 53: 193-202.
75. Jones JG (1991). The physiological cost ofwearing a disposable respirator. Am. Ind. Hyg. Assoc. J. 52: 219-225.
76. Kamon E, Doyle D, and Kovac J (1983). The oxygen cost of an escape from an underground coal mine. Am. Ind. Hyg. Assoc. J. 44: 552-555.
77. Kaufman JW and Hastings S (2003). Respiratory demand in individuals performing rigorous physical tasks in chemical protective ensembles. NAWCADPAXffR2003/29. Patuxent River, MD: Naval Air Warfare Center Aircraft Division.
78. Kearon MC, Summers E, Jones NL, Campbell EJM, and Killian KJ (1991). Breathing during prolonged exercise in humans. J. Physiol. 442: 477-487.
79. Kilbride E, McLoughlin P, Gallagher CG, and Harty HR (2003). Do gender differences exist in the ventilatory response to progressive exercise in males and females of average fitness? Eur. J. Appl. Physiol. 89: 595-602.
80. Knight DR, Poole DC, Schaffartzik W, Guy HJ, Prediletto R, Hogan MC, and Wagner PD (1992). Relationship between body and leg V02 during maximal cycle ergometry. J. Appl. Physiol. 73: 1114-1121.
81. Kurumatani N, Yamaguchi B, Dejima M, Enomoto Y, and Moriyama T (1992). Aerobic capacity of forestry workers and physical demands of forestry operations. Eur. J. Appl. Physiol. 64: 546-551.
82. Lafortuna C, Minetti AE, and Mognoni P (1984). Inspiratory flow pattern in humans. J. Appl. Physiol. 57: 1111-1119.
83. Lathrache R and Fissan H (1986). Fractional penetrations for electrostatically charged fibrous filters in the subrnicron particle size range. Part. Charact. 3:74-80.
84. Layton D (1993). Metabolically consistent breathing rates for use in dose assessments. Health Phys. 64: 23-36. /"'\
54
85. Lee KW and Liu BYH (1982). Experimental study of aerosol filtration by fibrous filters. Aerosol Sci. Technol. 1:35-46.
86. Lemon PWR and Hermiston R (1977). The human energy cost of fire fighting. J Occup. Med. 19: 558-562.
87. Lerman Y, Shefer A, Epstein Y, and Keren G (1983). External inspiratory resistance of protective respiratory devices: effects on physical performance and respiratory function. Am. J Ind. Med. 4: 733-740.
88. Linders MJG, Mallens EPJ, van Bokhoven JJGM, Kapteijn F, and Moulijn JA (2003). Breakthrough of shallow activated carbon beds under constant and pulsating flow. Am. Ind. Hyg. Assoc. J, 64:173-180.
89. Linn WS, Spier CE, and Hackney JD (1993). Activity patterns in ozone-exposed workers. J Occup. Med. Toxicol. 2: 1-14.
90. Loudon RG, Lee L, and Holcomb BJ (1988). Volumes and breathing patterns during speech in healthy and asthmatic subjects. J Speech Hear. Res. 31: 219-227.
91. Louhevaara V and Ilmarinen J (1985). Comparison of three field methods for measuring oxygen consumption. Ergonomics 28: 463-470.
92. Louhevaara V, Smolander J, Korhonen 0, and Tuomi T (1986). Effects of industrial respirators on breathing pattern at different work levels. Eur. J Appl. Physiol. 55: 142146.
93. Louhevaara V, Smolander J, Tuomi T, Korhonen 0, and Jaakkola J (1985a). Effects of an SCBA on breathing pattern, gas exchange, and heart rate during exercise. J Occup. Med. 27: 213-216.
94. Louhevaara V, Tuomi T, Korhonen 0, and Jaakkola J (1984). Cardiorespiratory effects of respiratory protective devices during exercise in well-trained men. Eur. J Appl. Physiol. 52: 340-345.
95. Louhevaara V, Tuomi T, Smolander J, Korhonen 0, Tossavainen A, and Jaakkola J (1985b). Cardiorespiratory strain in jobs that require respiratory protection. Int. Arch. Occup. Environ. Health 55: 195-206.
96. Lucia A, Carvajal A, Calderon FJ, Alsonso A, and Chicharro JL (1999). Breathing pattern in highly competitive cyclists during incremental exercise. Eur. J Appl. Physiol.512-521.
97. Lucia A, Pardo J, Durantez A, Hoyos J, and Chicharro JL (1998). Physiological differences between professional and elite road cyclists. Int. J Sports Med. 19: 342348.
55

98. Lusa S, Louhevaara V, Smolander J, Kivimaki M, and Korhonen 0 (1993). ~
Physiological responses of firefighting students during simulated smoke-diving in the heat. Am. Ind. Hyg. Assoc. J. 54: 228-231.
99. Mackey M, Ellis E, and Nicholls M (1998). Breathing patterns and heart rate during simulated occupational upper limb tasks in normal humans. Physiother Res Int 3: 8399.
100. Maiolo C, Melchiorri G, lacopino L, Masala S, and DeLorenzo A (2003). Physical activity energy expenditure measured using a portable telemetric device in comparison with a mass spectrometer. Br. J. Sports Med. 37: 445-447.
101. McArdle WD, Magel JR, Lesmes GR, and Pechar GS (1976). Metabolic and cardiovascular adjustment to work in air and water at 18,25, and 35 C. J. Appl. Physiol. 40: 85-90.
102. Meckel Y, Rotstein A, and Inbar 0 (2002). The effects of speech production on physiologic responses during submaximal exercise. Med. Sci. Sports Exerc. 34: 13371343.
103. Melissant CF, Lammers J, and Demedts M (1998). Relationship between external resistances, lung function changes and maximal exercise capacity. Eur. Respir. J. 11: 1369-1375.
104. Mermier CM, Samet lM, Lambert WE, and Chick TW (1993). Evaluation of the relationship between heart rate and ventilation for epidemiological studies. Arch. Environ. Health 48: 263-269.
105. Milic-Emili G and Gruenstien M. (1976). Drive and timing components ofventilation. Chest 70: 131-133.
106. Muza S (1986). A review of biomedical aspects of CB masks and their relationship to military performance. USARIEM TI-87. Natick, MA: U.S. Army Research Institute of Environmental Medicine.
107. Muza SR, Levine L, Latzka WA, and Sawka MN (1996). Inspiratory resistance effects on exercise breathing pattern relationships to chemoresponsiveness. Int. J. Sports Med. 17: 344-350.
108. Neder J, Nery LE, Peres C, and Whipp BJ (2001). Reference values for dynamic responses to incremental cycle ergometry in males and females aged 20 to 80. Am. J. Respir. Crit. Care Med. 164: 1481-1486.
109. Osmond NM and Phillips PL (2001). Pressure drop and service life predictions for respirator canisters. Am. Ind. Hyg. Assoc. J. 62:288-294.
56

110. Paek D and McCool FD (1992). Breathing patterns during varied activities. J. Appl. Physiol. 73: 887-893.
111. Patton JF (1997). Measurement of oxygen uptake with portable equipment. Paper Presented at Emerging Technologies for Nutrition Research, Washington, DC.
112. Pellegrino R, Villosio C, Milanese U, Garelli G, Rodarte JR, and Brusasco V (1999). Breathing during exercise in subjects with mild-to-moderate airflow obstruction: effects ofphysical training. J. Appl. Physiol. 87: 1697-1704.
113. Phillipson EA, McClean P, Sullivan CA, and Zame1N (1978). Interaction of the metabolic and behavioral respiratory control during hypercapnea and speech. Am. Rev. Respir. Dis. 117: 903-909.
114. Pinnington HC, Wong P, Tay J, GreenD, and Dawson B (2001). The level of accuracy and agreement in measures ofFE02, FEC02, and VE between the Cosmed K2b2 portable, respiratory gas analysis system and a metabolic cart. J. Sci. Med. Sport 4: 324-335.
115. Pokan R, Schwaberger G, Hofmann P, Eber B, Top1akH, Gasser R, Fruhwa1d FM, Pessenhofer H, and Klein W (1995). Effects of treadmill exercise protocol with constant and ascending grade on leveling-off 02 uptake and V02max. Int. J. Sports Med. 16: 238-242.
116. Poon C-S, Younes M, and Gallagher CG (1987). Effects of expiratory resistive load on respiratory motor output in conscious humans. J. Appl. Physiol. 63: 1837-1845.
117. Prathanee B, Watthanathon J, and Ruangjirachuporn P (1994). Phonation time, phonation volume and air flow rate in normal adults. J. Med. Assoc. Thai. 77: 639-645.
118. Ramonatxo M, Mercier J, Cohendy R, and Prefaut C (1991). Effect of resistive loads on pattern of respiratory muscle recruitment during exercise. J. Appl. Physiol. 71: 1941-1948.
119. RavenPB, Bradley 0, Rohm-Young b, McClure FL, and Skaggs B (1982). Physiological response to "pressure-demand" respirator wear. Am. Ind. Hyg. Assoc. J. 43: 773-781.
120. Raven PB, Dotson AT, and Davis TO (1979). The physiological consequences of wearing industrial respirators: a review. Am. Ind. Hyg. Assoc. J. 40: 517-534.
121. Raven PB, Jackson AW, Page K, Moss RF, Bradley 0, and Skaggs B (1981). The physiological responses ofmild pulmonary impaired subjects while using a "demand" respirator during rest and work. Am. Ind. Hyg. Assoc. J. 42: 247-257.
122. Rehrmann JA and Jonas LA (1978). Dependence of gas adsorption rates on carbon granule size and linear flow velocity. Carbon 16: 47-51.
57
123. Romay FJ, Liu BYH, and Chae S-J (1998). Experimental study of electrostatic capture ,,\ mechanisms in commercial electret filters. Aerosol Sci. Technol. 28: 124-145.
124. Ross JAS, Henderson GD, and Howie RM (1997). Oxygen consumption and ventilation during simulated escape from an offshore oil platform. Ergonomics 40: 281292.
125. Russell BA, Cerny FJ, and Stathopoulos ET (1998). Effects ofvaried vocal intensity on ventilation and energy expenditure in women and men. J. Speech Lang. Hear. Res. 41: 239-248.
126. Sackner JD, Nixon AJ, Davis B, Atkins N, and Sackner MA (1980). Non-invasive measurement of ventilation during exercise using a respiratory inductive plethysmograph. Am. Rev. Respir. Dis. 122: 867-871.
127. Saltin B and Astrand P-O (1967). Maximal oxygen uptake in athletes. J. Appl. Physiol. 23: 353-358.
128. Sharkey B and Gaskill S (2001). Respiration, respirators and work capacity. 3M JobHealth Highlights 19(2): 1-7.
129. Sheldahl LM, Wilke NA, Hanna RD, Dougherty SM, and Tristani FE (1996). Responses of people with coronary artery disease to common lawn-care tasks. Eur. J. Appl. Physiol. 72: 357-364. ,~
130. Silverman L, Lee B, Plotkin T, Amory L, and Tancey AR (1945). Inspiratory and expiratory air flow measurements on human subjects with and without resistance at several work rates. OSRD No. 5732. Office of Scientific Research and Development.
131. Silverman L, Lee G, Plotkin T, Sawyers LA, and Yancey AR(1951). Air flow measurements on human subjects with and without respiratory resistance at several work rates. Ind. Hyg. Occup. Med. 3: 461-478.
132. Silverman L, Lee RC, Lee G, Drinker KR, and Carpenter TM (1943). Fundamental factors in the design of protective respiratory equipment. OSRD No. 1222. Office of Scientific Research and Development
133. Smolander J, Louhevaara V, Ahonen E, Polari J, and Klen T (1995). Energy expenditure and clearing snow: a comparison of shovel and snow pusher. Ergonomics 38: 749-753.
134. Smolander J, Louhevaara V, and Korhonen 0 (1985). Physiological strain in work with gas protective clothing at low ambient temperature. Am. Ind. Hyg. Assoc. J. 46: 720723.
58

135. Sothmann MS, Saupe K, JasenofD, and Blaney J (1992). Heart rate response of firefighters to actual emergencies: implications for cardiorespiratory fitness. J. Occup. Med 34: 797-800.
136. Spahija JA and Grassino A (1996). Effects ofpursed-lips breathing and expiratory resistive loading in healthy subjects. J. Appl. Physiol. 80: 1772-1784.
137. Spurr GB, Maksud M, and Barac-Nieto M (1977). Energy expenditure, productivity, and physical work capacity of sugarcane loaders. Am. J. Clin. Nutr. 30: 1740-1746.
138. Stemler FW and Craig FN (1977). Effects of respiratory equipment on endurance in hard work. J. Appl. Physiol. 42: 28-32.
139. Sue DY and Hansen JE (1984). Normal Values in adults during exercise testing. Clin. Chest Med. 5: 89-98.
140. Takahaski M, Mano Y, Shibayama M, and Yamani N (1998). Effects of breathing resistance while inhaling 3% carbon dioxide during steady-state exercise. J. Occup. Health 40: 213-217.
141. Tang Y, Turner MJ, Yem JS, and Baker AB (2003). Calibration ofpneumotachographs using a calibrated syringe. J. Appl. Physiol. 95: 571-576.
142. Turner MJ, MacLeod 1M, and Rothberg AD (1989). Effects of temperature and composition on the viscosity of respiratory gases. J. Appl. Physiol. 67: 472-477.
143. Turney S and Blumenfeld W (1973). Heated Fleisch pneumotachometer: a calibration procedure. J. Appl. Physiol. 34: 117-121.
144. Verstappen F, Bloemen L, VanPutten M, and Reuvers J (1986). Self-contained respirators: effects of negative and positive pressure-demand types on physical exercise. Am. Ind. Hyg. Assoc. J. 47: 635-640.
145. Wakui T, Shirono S, Takahashi S, Fujimura T, and Harada N (2002). Physical Activity, Energy Expenditure and Work Intensity of Care-Workers on Shift Work in a Special Nursing Home for the Elderly. J. Occup. Health 44: 8-14.
146. Wasserman K, Hansen JE, Sue DY, and Whipp BJ (1987). Principals of exercise testing and interpretation. Philadelphia: Lea & Febiger
147. Wasserman K, van Kessel AL, and Burton GG (1969). Interaction of physiological mechanisms during exercise. J. Appl. Physiol. 22: 71-85.
148. Weir JB (1949). New method for calculating metabolic rate with special reference to protein metabolism. J Physiol. 109: 1-9.
59
149. White MK, Hodous T, and Hudnall JB (1989). Physiological and subjective responses to working in disposable protective coveralls and respirators commonly used by the asbestos abatement industry. Am. Ind. Hyg. Assoc. J. 50: 313-319.
150. Whitmore GA (1986). Prediction limits for a univariate normal observation. Amer. Statist. 40: 141-143.
151. Wilmore JH and Haskell W (1972). Body composition and endurance capacity of professional football players. J. Appl. Physiol. 33: 564-567.
152. Wilson JR, Raven PB, ZinkgrafSA, Morgan WP, and Jackson AW (1989). Alterations in physiological and perceptual variables during exhaustive endurance work while wearing a pressure-demand respirator. Am. Ind. Hyg. Assoc. J. 50: 139-146.
153. Winkworth AL, Davis PJ, Ellis E, and Adams RD 1994. Variability and consistency in speech breathing during reading: lung volumes, speech intensity, and linguistic factors. J. Speech Hear. Res. 37: 535-556.
154. Yasukouchi A (1992). Breathing pattern and subjective responses to small inspiratory resistances during submaximal exercise. Ann. Physiol. Anthrop. 11: 191-291.
155. Yasukouchi A and Serita F (1990). Changes in breathing pattern at loads near perceptual threshold at different work levels. Eur. J. Appl. Physiol. 60: 337-345.
60

APPENDIX
ESTIMATES OF VENTILATION BASED ON OCCUPATIONAL METABOLIC RATES FROM ISO 8996 AND THE COMPENDIUM OF PHYSICAL ACTIVITIES
Table A.I. Estimates ofMinute Ventilation for Males ofVarious Occupations
Occupation Metabolic rate
rwom-:J) "02 (Lrmin") Estimated VE (Lomino1j*
Craftsmen Bricklayer 110 to 160 0.57 to 0.83 23.4 to 29.0 Carpenter 110 to 175 0.57 to 0.90 23.4 to 31.0 Glazier 90 to 125 0.46 to 0.64 21.4 to 24.9 Painter 100 to 130 0.52 to 0.67 22.4 to 25.5 Baker 110 to 140 0.57 to 0.72 23.4 to 26.6 Butcher 105 to 140 0.54 to 0.72 22.9 to 26.6 Clock/watch repairer 55 to 70 0.28 to 0.36 18.4 to 19.6 Mining Industry Haulage operator 70 to 85 0.36 to 0.44 19.6 to 21.0 Coal hewer 140 to 240 0.72 to 1.24 26.6 to 41.1 Coke oven man 115 to 175 0.59 to 0.90 23.9 to 31.0 Iron & Steel Industry Blast Furnace Man 170 to 220 0.88 to 1.14 30.3 to 37.7 Electric Furnace Man 125 to 145 0.64 to 0.75 24.9 to 27.2 Hand moulder 140 to 240 0.72 to 1.24 26.6 to 41.1 Machine moulder 105 to 165 0.54 to 0.85 22.9 to 29.7 Foundryman 140 to 240 0.72 to 1.24 26.6 to 41.1 IronlMetal working Smith 90 to 200 0.46 to 1.03 21.4 to 34.5 Welder 75 to 125 0.39 to 0.64 20.1 to 24.9 Turner 75 to 125 0.39 to 0.64 20.1 to 24.9 Drilling machine operator 80 to 140 0.41 to 0.72 20.5 to 26.6 Precision mechanic 70 to 110 0.36 to 0.57 19.6 to 23.4 Graphic Profession Hand compositor 70 to 95 0.36 to 0.49 19.6 to 21.9 Book binder 75 to 100 0.39 to 0.52 20.1 to 22.4 Agriculture Gardener 115 to 190 0.59 to 0.98 23.9 to 33.1 Tractor Driver 85 to 110 0.44 to 0.57 21.0 to 23.4 Traffic Cab driver 70 to 90 0.36 to 0.46 19.6 to 21.4 Bus driver 75 to 125 0.39 to 0.64 20.1 to 24.9 Tramway driver 80 to 115 0.41 to 0.59 20.5 to 23.9 Electric trolley driver 80 to 125 0.41 to 0.64 20.5 to 24.9 Crane driver 65 to 145 0.34 to 0.75 19.2 to 27.2 Various Professions Laboratory assistant 85 to 100 0.44 to 0.52 21.0 to 22.4 Teacher 85 to 100 0.44 to 0.52 21.0 to 22.4 Shop girl 100 to 120 0.52 to 0.62 22.4 to 24.4 Secretary 70 to 85 0.36 to 0.44 19.6 to 21.0
• Based on the exponential function of Baba et al.(10) only.
61
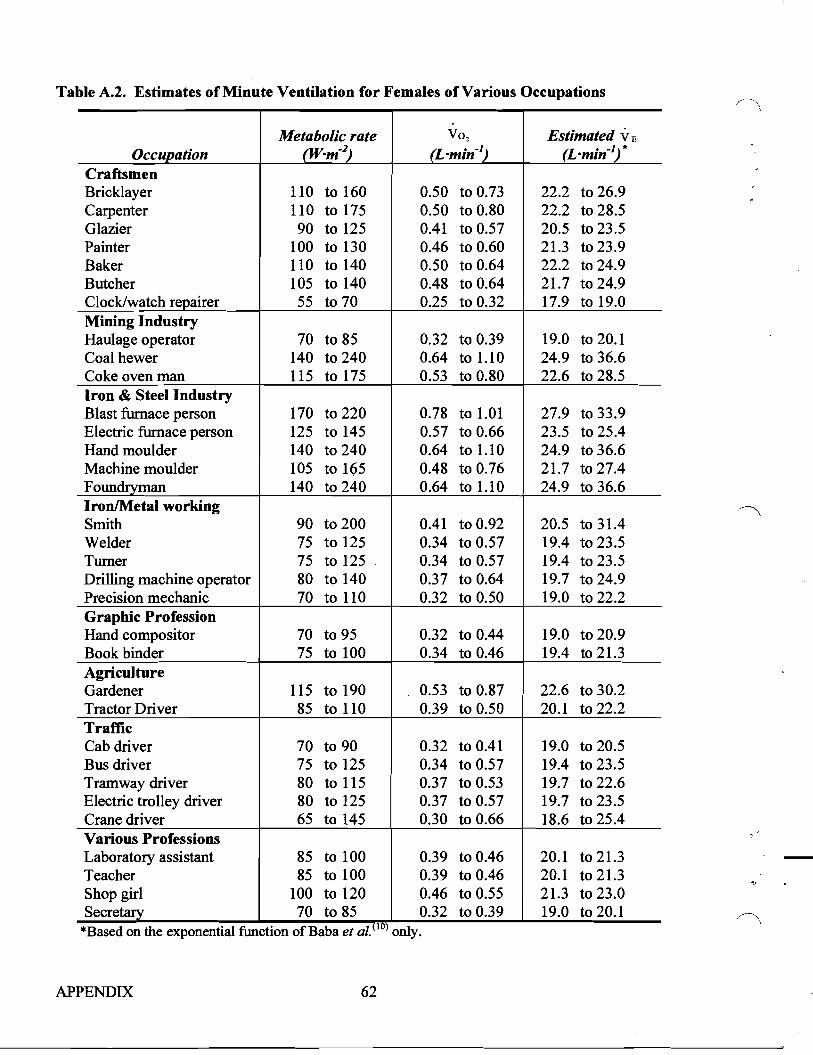
Table Ao2o Estimates ofMinute Ventilation for Females ofVarious Occupations
Occupation Metabolic rate
(Wom-2)
V0 2
(Lomin-1)
Estimated vE
(Irmin")" Craftsmen Bricklayer Carpenter Glazier Painter Baker Butcher Clock/watch repairer
110 to 160 110 to 175 90 to 125
100 to 130 110 to 140 105 to 140 55 to 70
0.50 to 0.73 0.50 to 0.80 0.41 to 0.57 0.46 to 0.60 0.50 to 0.64 0.48 to 0.64 0.25 to 0.32
22.2 to 26.9 22.2 to 28.5 20.5 to 23.5 21.3 to 23.9 22.2 to 24.9 21.7 to 24.9 17.9 to 19.0
Mining Industry Haulage operator 70 to 85 0.32 to 0.39 19.0 to 20.1 Coal hewer 140 to 240 0.64 to 1.10 24.9 to 36.6 Coke oven man 115 to 175 0.53 to 0.80 22.6 to 28.5 Iron & Steel Industry Blast furnace person 170 to 220 0.78 to 1.01 27.9 to 33.9 Electric furnace person 125 to 145 0.57 to 0.66 23.5 to 25.4 Hand moulder 140 to 240 0.64 to 1.10 24.9 to 36.6 Machine moulder 105 to 1()5 0.48 to 0.76 21.7 to 27.4 Foundryman 140 to 240 0.64 to 1.10 24.9 to 36.6 Iron/Metal working Smith 90 to 200 0.41 to 0.92 20.5 to 31.4 Welder 75 to 125 0.34 to 0.57 19.4 to 23.5 Turner 75 to 125 0.34 to 0.57 19.4 to 23.5 Drilling machine operator 80 to 140 0.37 to 0.64 19.7 to 24.9 Precision mechanic 70 to 110
70 to 95 75 to 100
115 to 190 85 to 110
0.32 to 0.50
0.32 to 0.44 0.34 to 0.46
0.53 to 0.87 0.39 to 0.50
19.0 to 22.2
19.0 to 20.9 19.4 to 21.3
22.6 to 30.2 20.1 to 22.2
Graphic Profession Hand compositor Book binder Agriculture Gardener Tractor Driver Traffic Cab driver 70 to 90 0.32 to 0.41 19.0 to 20.5 Bus driver 75 to 125 0.34 to 0.57 19.4 to 23.5 Tramway driver 80 to 115 0.37 to 0.53 19.7 to 22.6 Electric trolley driver 80 to 125 0.37 to 0.57 19.7 to 23.5 Crane driver 65 to 145 0.30 to 0.66 18.6 to 25.4 Various Professions Laboratory assistant 85 to 100 0.39 to 0.46 20.1 to 21.3 Teacher 85 to 100 0.39 to 0.46 20.1 to 21.3 Shop girl 100 to 120 0.46 to 0.55 21.3 to 23.0 Secretary 70 to 85 0.32 to 0.39 19.0 to 20.1
' ~lU)*Based on the exponential function of Baba et al. only.
APPENDIX 62
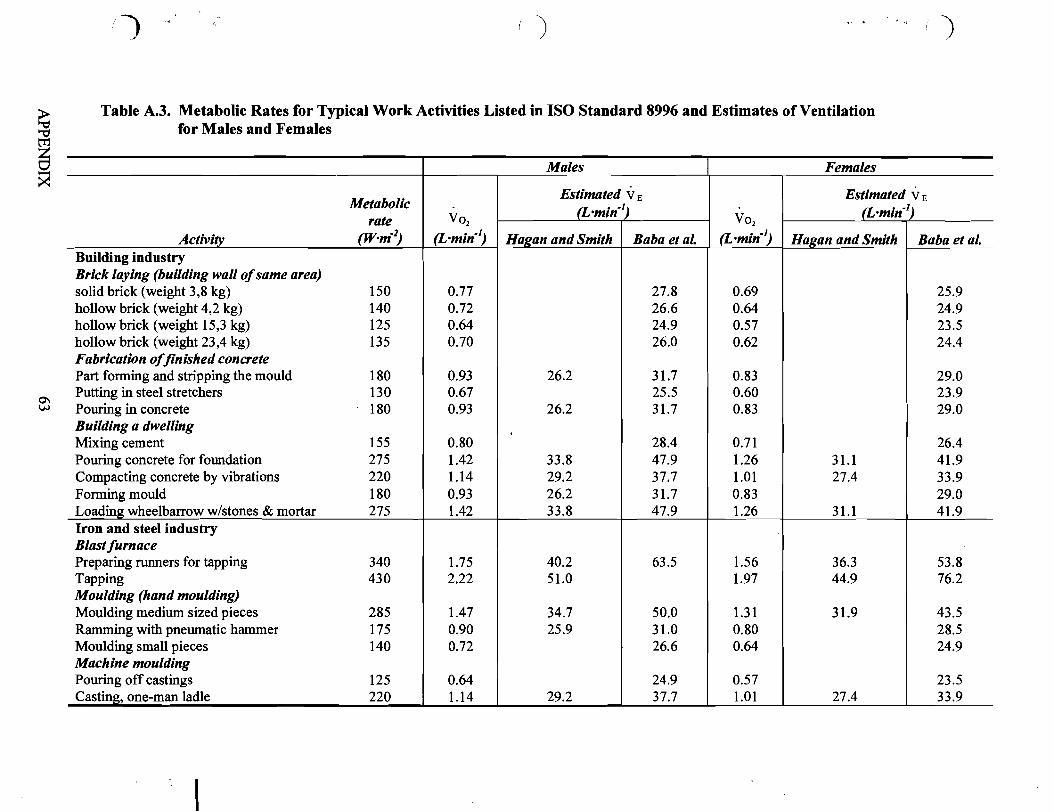
i) ) i)
Table A.3. Metabolic Rates for Typical Work Activities Listed in ISO Standard 8996 and Estimates of Ventilation?d for Males and Females
~
0\ w
Males Females
Metabolic rate V0 2
Estimated VE
(L'min- l ) V0 2
Estimated VE
(L'min- l )
Activity (W'm-1) (L'min- l
) Hagan and Smith Baba et al: (L'min- l ) Hagan and Smith Baba et al.
Building industry Brick laying (building wall ofsame area) solid brick (weight 3,8 kg) 150 0.77 27.8 0.69 25.9 hollow brick (weight 4,2 kg) 140 0.72 26.6 0.64 24.9 hollow brick (weight 15,3 kg) 125 0.64 24.9 0.57 23.5 hollow brick (weight 23,4 kg) 135 Fabrication offinished concrete
0.70 26.0 0.62 24.4
Part fanning and stripping the mould 180 0.93 26.2 31.7 0.83 29.0 Putting in steel stretchers 130 0.67 25.5 0.60 23.9 Pouring in concrete 180 Building a dwelling
0.93 26.2 31.7 0.83 29.0
Mixing cement 155 0.80 28.4 0.71 26.4 Pouring concrete for foundation 275 1.42 33.8 47.9 1.26 31.1 41.9 Compacting concrete by vibrations 220 1.14 29.2 37.7 1.01 27.4 33.9 Forming mould 180 0.93 26.2 31.7 0.83 29.0 Loading wheelbarrow w/stones & mortar 275 1.42 33.8 47.9 1.26 31.1 41.9 Iron and steel industry Blastfurnace Preparing runners for tapping 340 1.75 40.2 63.5 1.56 36.3 53.8 Tapping 430 Moulding (hand moulding)
2.22 51.0 1.97 44.9 76.2
Moulding medium sized pieces 285 1.47 34.7 50.0 1.31 31.9 43.5 Ramming with pneumatic hammer 175 0.90 25.9 31.0 0.80 28.5 Moulding small pieces 140 Machine moulding
0.72 26.6 0.64 24.9
Pouring off castings 125 0.64 24.9 0.57 23.5 Casting, one-man ladle 220 1.14 29.2 37.7 1.01 27.4 33.9
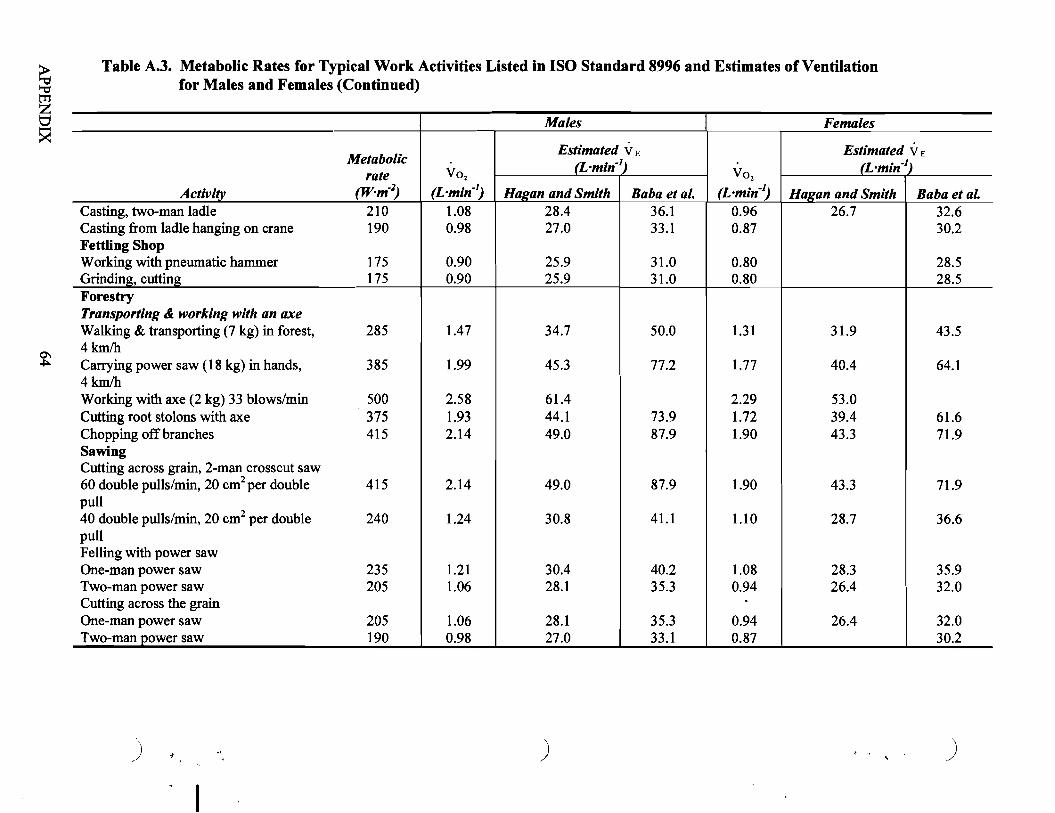
I Table A.3. Metabolic Rates for Typical Work Activities Listed in ISO Standard 8996 and Estimates of Ventilation
for Males and Females (Continued)
0'\ ~
Males Females
Metabolic rate V0 2
Estimated VE
(L·min-1) V0 2
Estimated VE
(Lomin-1)
Activity (Wom-1) (Irmin"} Hagan and Smith Baba et al: (Lomin-1) Hagan and Smith Baba et al.
Casting, two-man ladle 210 1.08 28.4 36.1 0.96 26.7 32.6 Casting from ladle hanging on crane 190 Fettling Shop
0.98 27.0 33.1 0.87 30.2
Working with pneumatic hammer 175 0.90 25.9 31.0 0.80 28.5 Grinding, cutting 175 0.90 25.9 31.0 0.80 28.5 Forestry Transporting & working with an axe Walking & transporting (7 kg) in forest, 285 4km/h
1.47 34.7 50.0 1.31 31.9 43.5
Carrying power saw (18 kg) in hands, 385 4km/h
1.99 45.3 77.2 1.77 40.4 64.1
Working with axe (2 kg) 33 blows/min 500 2.58 61.4 2.29 53.0 Cutting root stolons with axe 375 1.93 44.1 73.9 1.72 39.4 61.6 Chopping off branches 415 2.14 49.0 87.9 1.90 43.3 71.9 Sawing Cutting across grain, 2-man crosscut saw 60 double pulls/min, 20 cm2 per double 415 pull
2.14 4900 87.9 1.90 43.3 71.9
40 double pulls/min, 20 cm2 per double 240 1.24 30.8 41.1 1.10 28.7 36.6 pull Felling with power saw One-man power saw 235 1.21 30.4 40.2 1.08 28.3 35.9 Two-man power saw 205 Cutting across the grain
1.06 28.1 35.3 0.94 . 26.4 32.0
One-man power saw 205 1.06 28.1 35.3 0.94 26.4 32.0 Two-man power saw 190 0.98 27.0 33.1 0.87 30.2
) ) ).J "'
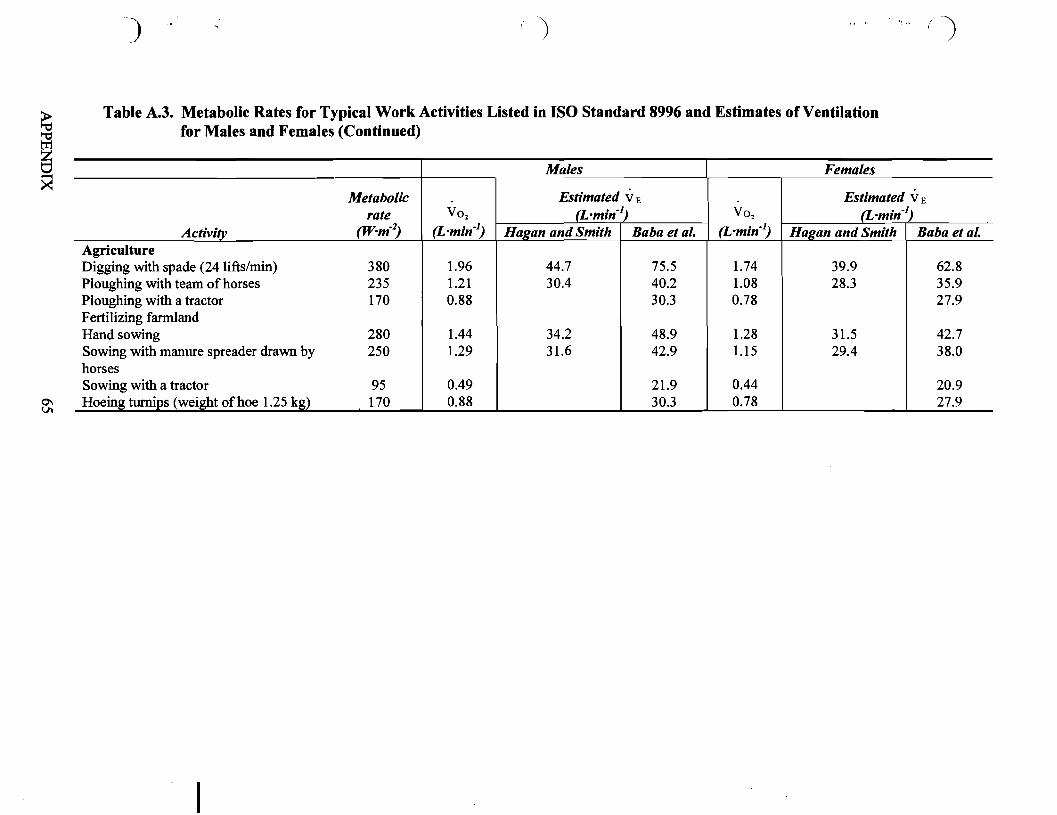
~.~ .. ()) )
Table Ao3o Metabolic Rates for Typical Work Activities Listed in ISO Standard 8996 and Estimates of Ventilation ~ for Males and Females (Continued)
~
0\ VI
Males Females
Metabolic Estimated VE Estimated VE
rate V0 2 (Irmin"} V02 (Irmin") Activity (Wom-1) (L·min- 1
) Hagan and Smith Baba et al. (Lrmin"} Hagan and Smith Baba et al. Agriculture Digging with spade (24 lifts/min) 380 1.96 44.7 75.5 1.74 39.9 62.8 Ploughing with team of horses 235 1.21 30.4 40.2 1.08 28.3 35.9 Ploughing with a tractor 170 Fertilizing farmland
0.88 30.3 0.78 27.9
Hand sowing 280 1.44 34.2 48.9 1.28 31.5 42.7 Sowing with manure spreader drawn by 250 horses
1.29 31.6 42.9 1.15 29.4 38.0
Sowing with a tractor 95 0.49 21.9 0.44 20.9 Hoeing turnips (weight of hoe 1.25 kg) 170 0.88 30.3 0.78 27.9
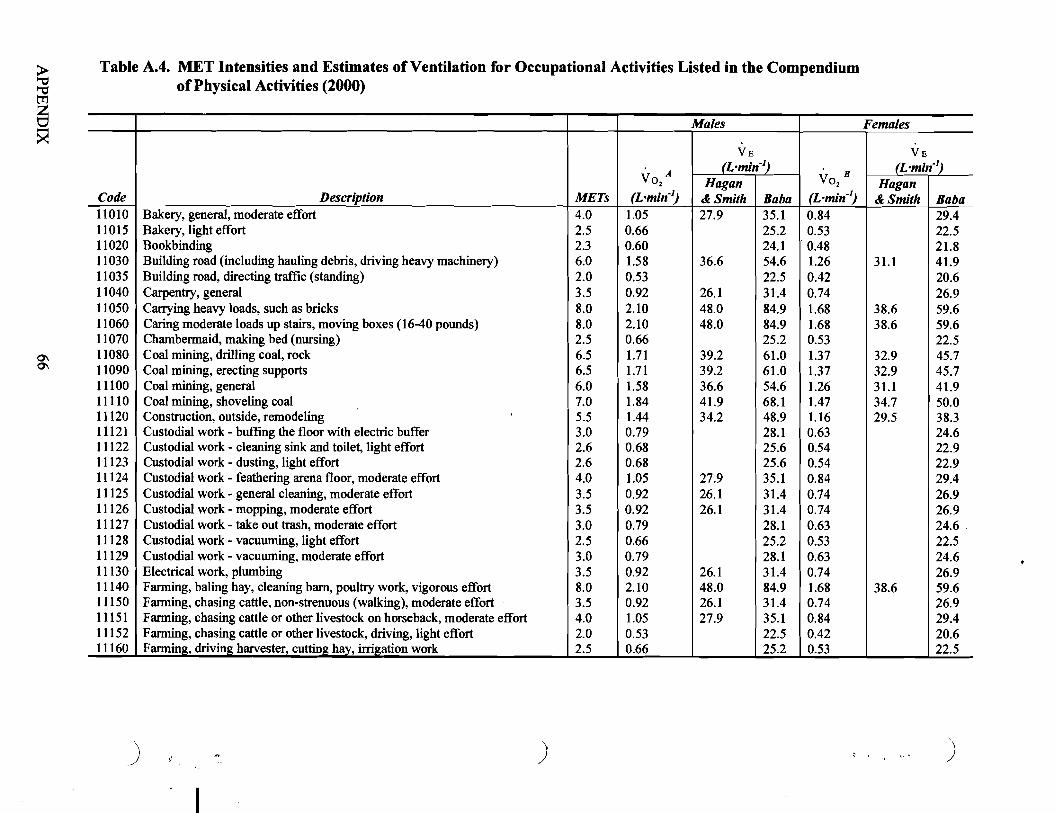
Table A.4. MET Intensities and Estimates ofVentilation for Occupational Activities Listed in the Compendium ~ ofPhysical Activities (2000)
~
0\ 0\
Males Females
Code Description METs
AV02
{Irmin"]
VE (Lrmin"}
BV02
(Lrmin:')
VE (L-min-1)
Hagan & Smith Baba
Hagan & Smith Baba
11010 Bakery, general, moderate effort 4.0 1.05 27.9 35.1 0.84 29.4 11015 Bakery, light effort 2.5 0.66 25.2 0.53 22.5 11020 Bookbinding 2.3 0.60 24.1 0.48 21.8 11030 Building road (including hauling debris, driving heavy machinery) 6.0 1.58 36.6 54.6 1.26 31.1 41.9 11035 Building road, directing traffic (standing) 2.0 0.53 22.5 0.42 20.6 11040 Carpentry, general 3.5 0.92 26.1 31.4 0.74 26.9 11050 Carrying heavy loads, such as bricks 8.0 2.10 48.0 84.9 1.68 38.6 59.6 11060 Caring moderate loads up stairs, moving boxes (16-40 pounds) 8.0 2.10 48.0 84.9 1.68 38.6 59.6 11070 Chambermaid, making bed (nursing) 2.5 0.66 25.2 0.53 22.5 11080 Coal mining, drilling coal, rock 6.5 1.71 39.2 61.0 1.37 32.9 45.7 11090 Coal mining, erecting supports 6.5 1.71 39.2 61.0 1.37 32.9 45.7 11100 Coalmining,general 6.0 1.58 36.6 54.6 1.26 31.1 41.9 11110 Coal mining, shoveling coal 7.0 1.84 41.9 68.1 1.47 34.7 50.0 11120 Construction, outside, remodeling 5.5 1.44 34.2 48.9 1.16 29.5 38.3 11121 Custodial work - buffing the floor with electric buffer 3.0 0.79 28.1 0.63 24.6 11122 Custodial work - cleaning sink and toilet, light effort 2.6 0.68 25.6 0.54 22.9 11123 Custodial work - dusting, light effort 2.6 0.68 25.6 0.54 22.9 11124 Custodial work - feathering arena floor, moderate effort 4.0 1.05 27.9 35.1 0.84 29.4 11125 Custodial work - general cleaning, moderate effort 3.5 0.92 26.1 31.4 0.74 26.9 11126 Custodial work - mopping, moderate effort 3.5 0.92 26.1 31.4 0.74 26.9 11127 Custodial work - take out trash, moderate effort 3.0 0.79 28.1 0.63 24.6 . 11128 Custodial work - vacuuming, light effort 2.5 0.66 25.2 0.53 22.5 11129 Custodial work - vacuuming, moderate effort 3.0 0.79 28.1 0.63 24.6 11130 Electrical work, plumbing 3.5 0.92 26.1 31.4 0.74 26.9 11140 Farming, baling hay, cleaning barn, poultry work, vigorous effort 8.0 2.10 48.0 84.9 1.68 38.6 59.6 11150 Farming, chasing cattle, non-strenuous (walking), moderate effort 3.5 0.92 26.1 31.4 0.74 26.9 11151 Farming, chasing cattle or other livestock on horseback, moderate effort 4.0 1.05 27.9 35.1 0.84 29.4 11152 Farming, chasing cattle or other livestock, driving, light effort 2.0 0.53 22.5 0.42 20.6 11160 Farming, driving harvester, cutting hay, irrigation work 2.5 0.66 25.2 0.53 22.5
) ) )
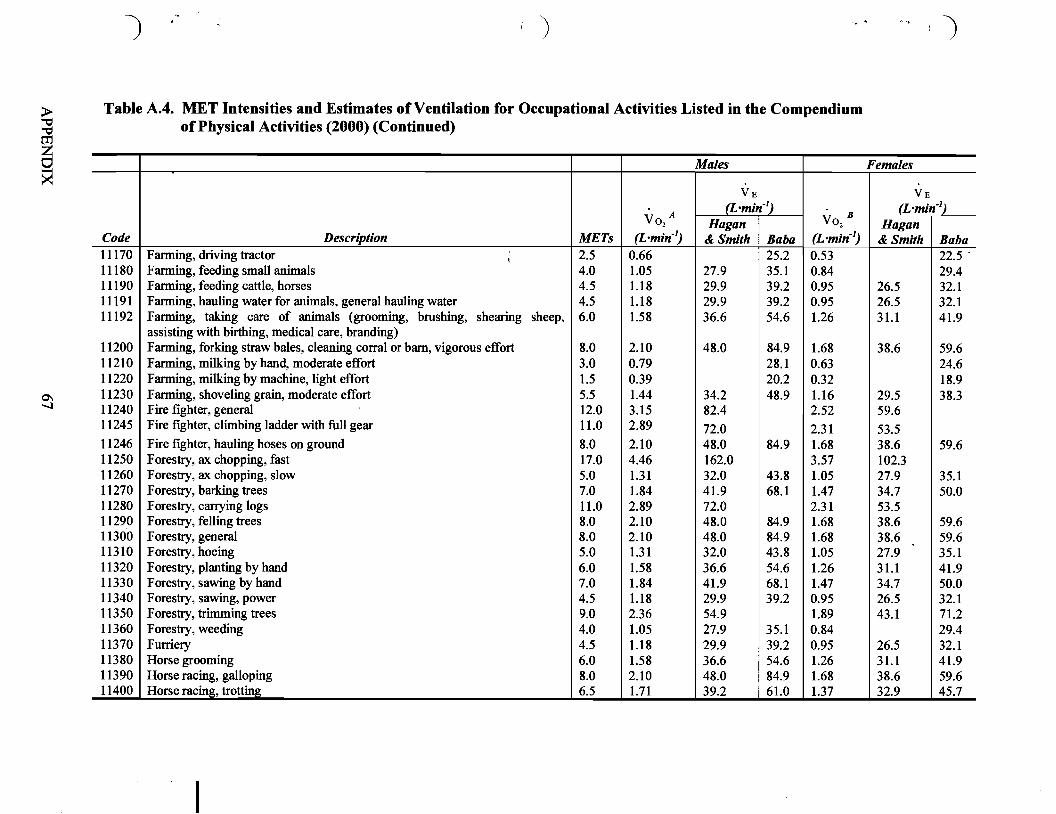
I, ••) ) :)
Table A.4. MET Intensities and Estimates of Ventilation for Occupational Activities Listed in the Compendium ~ of Physical Activities (2000) (Continued)
~ ~
0'1 -.....J
Males Females
Code Description METs
AV02
(Lrmin"]
VE (L'min- l
) BV02
(L'min- l)
VE (Lrmin"]
Hagan & Smith Baba
Hagan & Smith Baba
11170 Fanning, driving tractor , 2.5 0.66 25.2 0.53 22.5 -11180 Fanning, feeding small animals 4.0 1.05 27.9 35.1 0.84 29.4 11190 Fanning, feeding cattle, horses 4.5 1.18 29.9 39.2 0.95 26.5 32.1 11191 Fanning, hauling water for animals, general hauling water 4.5 1.18 29.9 39.2 0.95 26.5 32.1 11192 Farming, taking care of animals (grooming, brushing, shearing sheep,
assisting with birthing, medical care, branding) 6.0 1.58 36.6 54.6 1.26 31.1 41.9
11200 Farming, forking straw bales, cleaning corral or barn, vigorous effort 8.0 2.10 48.0 84.9 1.68 38.6 59.6 11210 Farming, milking by hand, moderate effort 3.0 0.79 28.1 0.63 24.6 11220 Farming, milking by machine, light effort 1.5 0.39 20.2 0.32 18.9 11230 Farming, shoveling grain, moderate effort 5.5 1.44 34.2 48.9 1.16 29.5 38.3 11240 Fire fighter, general 12.0 3.15 82.4 2.52 59.6 11245 Fire fighter, climbing ladder with full gear 11.0 2.89 72.0 2.31 53.5 11246 Fire fighter, hauling hoses on ground 8.0 2.10 48.0 84.9 1.68 38.6 59.6 11250 Forestry, ax chopping, fast 17.0 4.46 162.0 3.57 102.3 11260 Forestry, ax chopping, slow 5.0 1.31 32.0 43.8 1.05 27.9 35.1 11270 Forestry, barking trees 7.0 1.84 41.9 68.1 1.47 34.7 50.0 11280 Forestry, carrying logs 11.0 2.89 72.0 2.31 53.5 11290 Forestry, felling trees 8.0 2.10 48.0 84.9 1.68 38.6 59.6 11300 Forestry, general 8.0 2.10 48.0 84.9 1.68 38.6 59.6 11310 Forestry, hoeing 5.0 1.31 32.0 43.8 1.05 27.9 35.1 11320 Forestry, planting by hand 6.0 1.58 36.6 54.6 1.26 31.1 41.9 11330 Forestry, sawing by hand 7.0 1.84 41.9 68.1 1.47 34.7 50.0 11340 Forestry, sawing, power 4.5 1.18 29.9 39.2 0.95 26.5 32.1 11350 Forestry, trimming trees 9.0 2.36 54.9 1.89 43.1 71.2 11360 Forestry, weeding 4.0 1.05 27.9 35.1 0.84 29.4 11370 Furriery 4.5 1.18 29.9 39.2 0.95 26.5 32.1 11380 Horse grooming 6.0 1.58 36.6 54.6 1.26 31.1 41.9 11390 Horse racing, galloping 8.0 2.10 48.0 84.9 1.68 38.6 59.6 11400 Horse racing, trotting 6.5 1.71 39.2 61.0 1.37 32.9 45.7
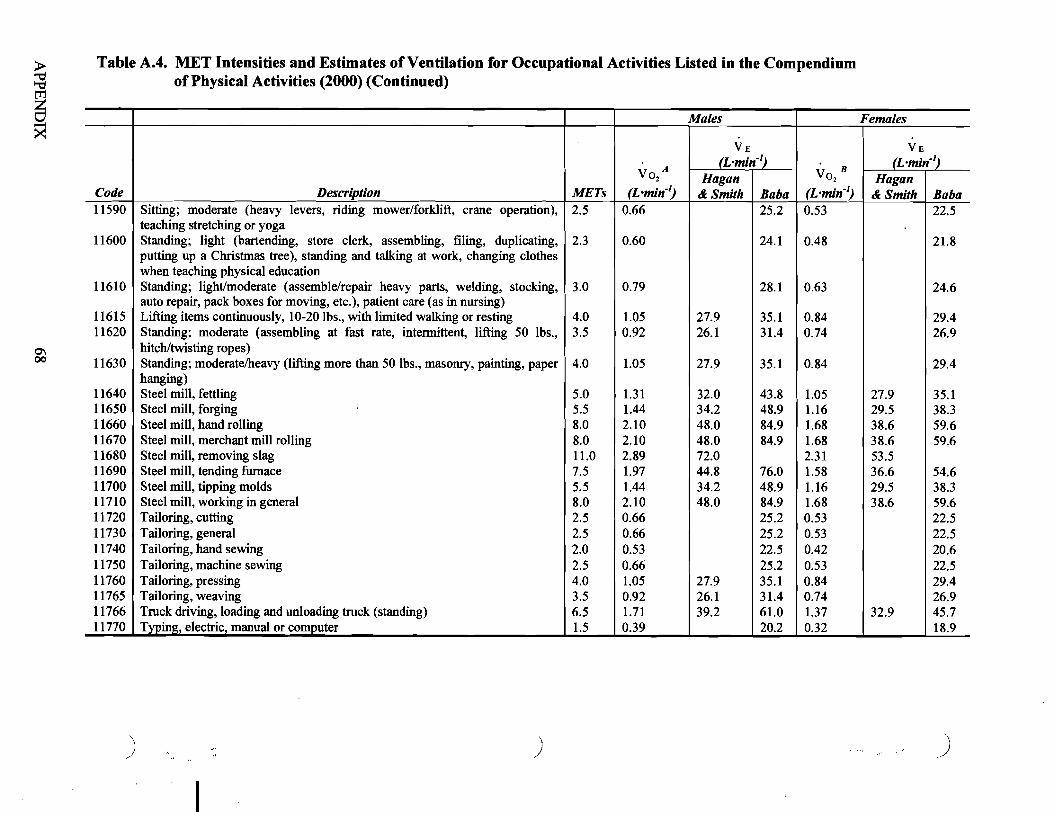
Table A.4. MET Intensities and Estimates of Ventilation for Occupational Activities Listed in the Compendium
I of Physical Activities (2000) (Continued)
0'\ 00
Males Females
Code Description METs
AVOz (L·min1
)
VE (L'min1
)BVOz
(Lrmin"]
VE (Lrmin"}
Hagan & Smith Baba
Hagan & Smith Baba
22.511590 Sitting; moderate (heavy levers, riding mower/forklift, crane operation), teaching stretching or yoga
2.5 0.66 25.2 0.53
11600 Standing; light (bartending, store clerk, assembling, filing, duplicating, 2.3 0.60 24.1 0.48 21.8 putting up a Christmas tree), standing and talking at work, changing clothes when teaching physical education
11610 Standing; light/moderate (assemble/repair heavy parts, welding, stocking, auto repair, pack boxes for moving, etc.), patient care (as in nursing)
3.0 0.79 28.1 0.63 24.6
11615 Lifting items continuously, 10-20 lbs., with limited walking or resting 4.0 1.05 27.9 35.1 0.84 29.4 11620 Standing; moderate (assembling at fast rate, intermittent, lifting 50 lbs.,
hitch/twisting ropes) 3.5 0.92 26.1 31.4 0.74 26.9
11630 Standing; moderate/heavy (lifting more than 50 lbs., masonry, painting, paper hanging)
4.0 1.05 27.9 35.1 0.84 29.4
11640 Steel mill, fettling 5.0 1.31 32.0 43.8 1.05 27.9 35.1 11650 Steel mill, forging 5.5 1.44 34.2 48.9 1.16 29.5 38.3 11660 Steel mill, hand rolling 8.0 2.10 48.0 84.9 1.68 38.6 59.6 11670 Steel mill, merchant mill rolling 8.0 2.10 48.0 84.9 1.68 38.6 59.6 11680 Steel mill, removing slag 11.0 2.89 72.0 2.31 53.5 11690 Steel mill, tending furnace 7.5 1.97 44.8 76.0 1.58 36.6 54.6 11700 Steel mill, tipping molds 5.5 1.44 34.2 48.9 1.16 29.5 38.3 11710 Steel mill, working in general 8.0 2.10 48.0 84.9 1.68 38.6 59.6 11720 Tailoring, cutting 2.5 0.66 25.2 0.53 22.5 11730 Tailoring, general 2.5 0.66 25.2 0.53 22.5 11740 Tailoring, hand sewing 2.0 0.53 22.5 0.42 20.6 11750 Tailoring, machine sewing 2.5 0.66 25.2 0.53 22.5 11760 Tailoring, pressing 4.0 1.05 27.9 35.1 0.84 29.4 11765 Tailoring, weaving 3.5 0.92 26.1 31.4 0.74 26.9 11766 Truck driving, loading and unloading truck (standing) 6.5 1.71 39.2 61.0 1.37 32.9 45.7 11770 Typing, electric, manual or computer 1.5 0.39 20.2 0.32 18.9
J'J ) )"
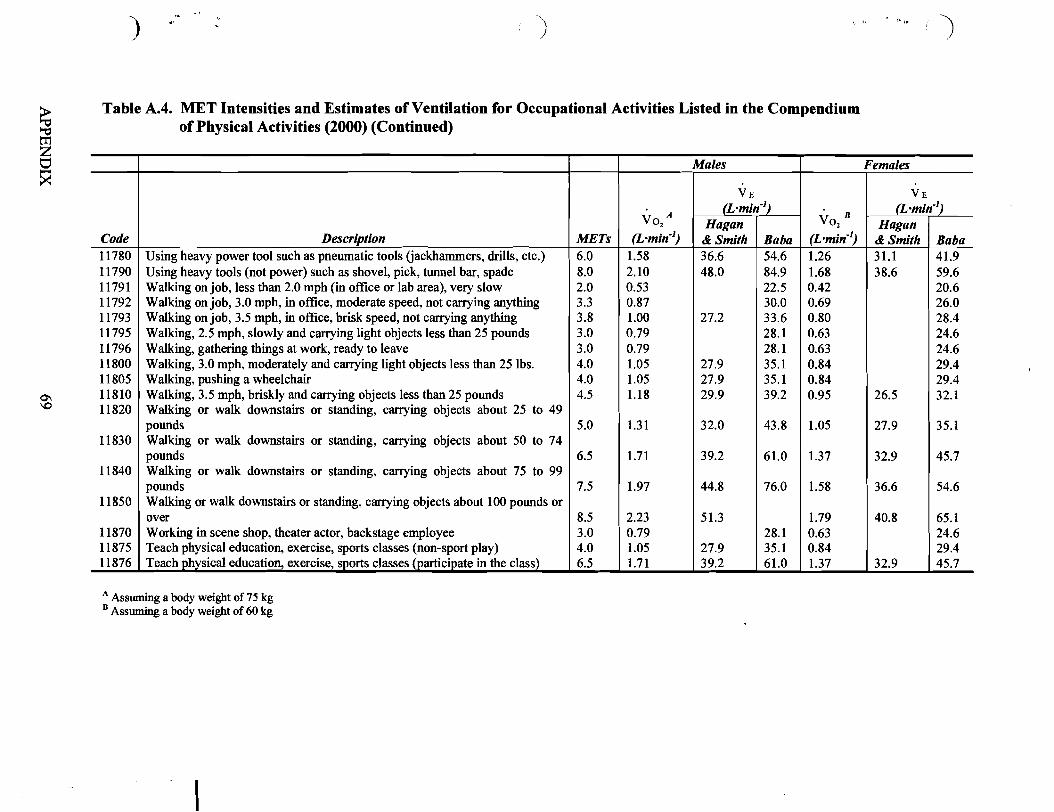
~j. u" I,) ) )
Table A.4. MET Intensities and Estimates of Ventilation for Occupational Activities Listed in the Compendium of Physical Activities (2000) (Continued)
~ ~
0'1 \0
Males Females
Code Description METs
AV02
(Irmin")
VE {Lrmin"]
BV02
(Lrmin"]
VE (Lrmin"]
Hagan & Smith Baba
Hagan & Smith Baba
11780 Using heavy power tool such as pneumatic tools (jackhammers, drills, etc.) 6.0 1.58 36.6 54.6 1.26 31.1 41.9 11790 Using heavy tools (not power) such as shovel, pick, tunnel bar, spade 8.0 2.10 48.0 84.9 1.68 38.6 59.6 11791 Walking on job, less than 2.0 mph (in office or lab area), very slow 2.0 0.53 22.5 0.42 20.6 11792 Walking on job, 3.0 mph, in office, moderate speed, not carrying anything 3.3 0.87 30.0 0.69 26.0 11793 Walking on job, 3.5 mph, in office, brisk speed, not carrying anything 3.8 1.00 27.2 33.6 0.80 28.4 11795 Walking, 2.5 mph, slowly and carrying light objects less than 25 pounds 3.0 0.79 28.1 0.63 24.6 11796 Walking, gathering things at work, ready to leave 3.0 0.79 28.1 0.63 24.6 11800 Walking, 3.0 mph, moderately and carrying light objects less than 25 lbs, 4.0 1.05 27.9 35.1 0.84 29.4 11805 Walking, pushing a wheelchair 4.0 1.05 27.9 35.1 0.84 29.4 11810 Walking, 3.5 mph, briskly and carrying objects less than 25 pounds 4.5 1.18 29.9 39.2 0.95 26.5 32.1 11820 Walking or walk downstairs or standing, carrying objects about 25 to 49
pounds 5.0 1.31 32.0 43.8 1.05 27.9 35.1 11830 Walking or walk downstairs or standing, carrying objects about 50 to 74
pounds 6.5 1.71 39.2 61.0 1.37 32.9 45.7 11840 Walking or walk downstairs or standing, carrying objects about 75 to 99
pounds 7.5 1.97 44.8 76.0 1.58 36.6 54.6 11850 Walking or walk downstairs or standing, carrying objects about 100 pounds or
over 8.5 2.23 51.3 1.79 40.8 65.1 11870 Working in scene shop, theater actor, backstage employee 3.0 0.79 28.1 0.63 24.6 11875 Teach physical education, exercise, sports classes (non-sport play) 4.0 1.05 27.9 35.1 0.84 29.4 11876 Teach physical education, exercise, sports classes (participate in the class) 6.5 1.71 39.2 61.0 1.37 32.9 45.7
A Assuming a body weight of 7S kg B Assuming a body weight of 60 kg
Related Documents