GRAPHIC MATERIALS

Welcome message from author
This document is posted to help you gain knowledge. Please leave a comment to let me know what you think about it! Share it to your friends and learn new things together.
Transcript
GRAPHIC MATERIALS

WHAT IS GRAPHICS?

The term graphics comes from the Greek word graphein which means “to write”, “to draw” or “to present by lines”. Graphics are
instructional materials which present summarized information and ideas through
drawings, words, pictures, and symbols. Graphics are generally abstract.

Drawings and IllustrationsDrawings and illustrations are non
photographic reconstructions or representations of reality, etched or drawn by an illustrator. Illustrations serve a variety of
functions such as:
- giving faces to characters in a story;- Displaying a numbers of examples of an item described in a textbook;- Visualizing stepwise sets o instructions in a technical manual;- Communicating subtle thematic tone in a narrative; and- Making a reader laugh or smile.

EXAMPLES:

Kinds of Graphic Materials
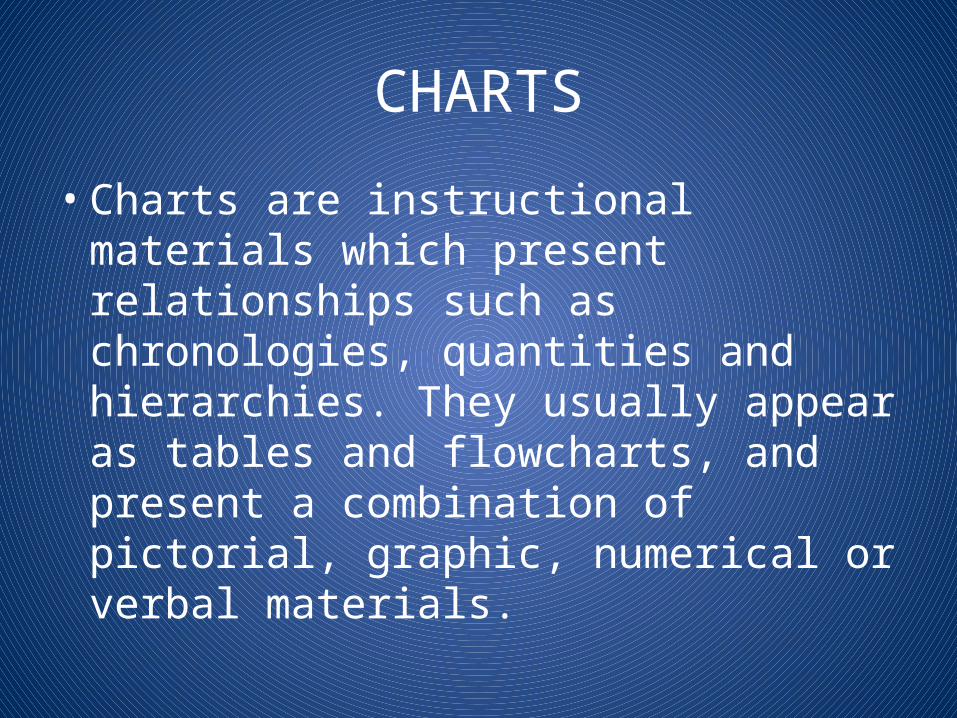
CHARTS
• Charts are instructional materials which present relationships such as chronologies, quantities and hierarchies. They usually appear as tables and flowcharts, and present a combination of pictorial, graphic, numerical or verbal materials.

Different Types of ChartsFlowcharts
Classification charts
Tabular charts
Organizational charts
Stream or tree charts
Timeline charts
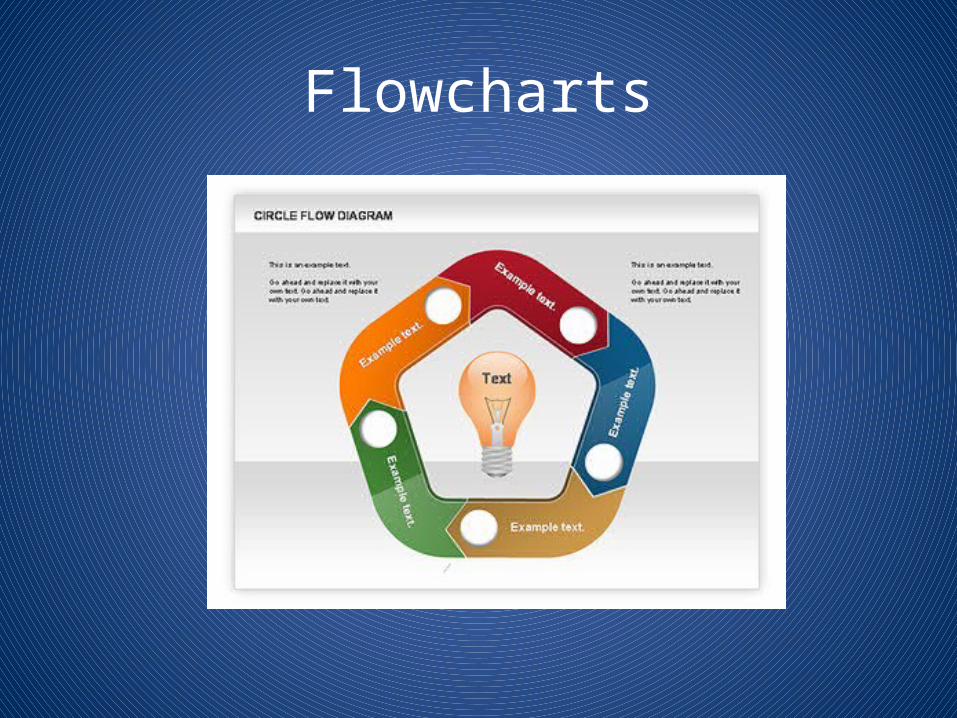
Flowcharts

Classification Charts

Tabular Charts

Organizational Charts

Stream or Tree Charts

DIAGRAMS
• Although considered as charts, these consist of lines and symbols that show the relationships or key features of a process, an object or an area. Diagrams could be very abstract such as construction blueprints or very simple such as diagrams showing relationships of verbs, subject or other parts of speech in English grammar classes

Different Types of Diagrams• Venn Diagram
• Cycle Diagram
• Radial Diagram
• Pyramid Diagram
• Target Diagram
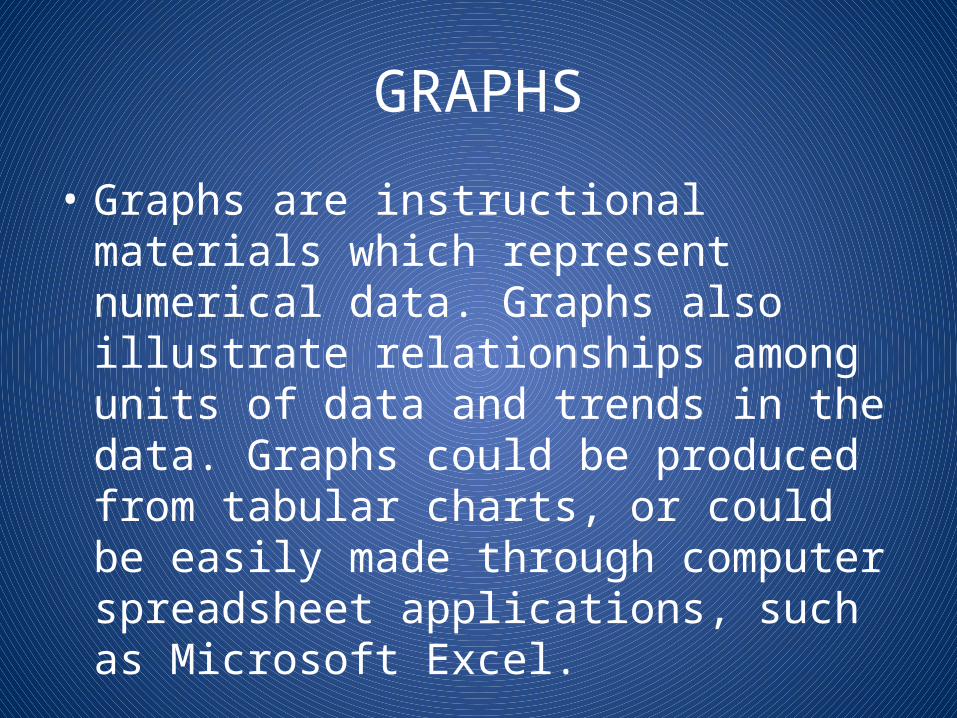
GRAPHS
• Graphs are instructional materials which represent numerical data. Graphs also illustrate relationships among units of data and trends in the data. Graphs could be produced from tabular charts, or could be easily made through computer spreadsheet applications, such as Microsoft Excel.

Different Types of Graphs

Line Graphs

Bar Graphs

Circle or Pie Graphs

Picture Graphs or Pictographs

POSTERS
• Posters are materials which combine images, lines, colors, and words. These materials intend to present a brief, persuasive message. Posters may be obtained from a variety of sources. These can also be prepared by teachers and students.
• A good poster is simple and should be able to convey a message quickly.

CARTOONS AND STRIP DRAWINGS• Cartoons are colorful line drawings with
exaggerated features or symbols that provide humor or satire. They usually appear in newspaper, periodicals, and textbooks. Cartoons also include comic strips or strip drawings, which is a sequence of closely related drawings intended to make important social and political comments.

MAPS AND GLOBES• Maps are instructional materials which
represent the Earth’s or portion of the Earth’s surface. Globes, on the other hand, are spherical models of the Earth. However, even though a globe is three-dimensional, it can be classified as a “graphic” because of the use of symbols, words, and drawings.

Classification of Maps
• Physical maps – emphasize terrain and topographical concepts
• Political maps – emphasize man-made phenomena such as state, city or provincial boundaries or location of highways or railroads or government buildings
• Special purpose maps – these are the maps used for perculiar purposes like those presenting amount of rainfall, population distribution, and travel routes.

Classification of Globes• Political globes – show location and
boundaries of cities, provinces and other man-made structures.
• Physical-political globes – show some political features but emphasize land elevations and ocean depths.
• Special purpose globe – these are globes constructed for specific purposes such as satellite globes, celestial globes, and physical relief globes.
Related Documents


