H Did E i M k How Did Emerging Markets Cope in the Crisis? Ferhan Salman Cope in the Crisis? Ferhan Salman Strategy, Policy, and Review Dept. Koc University – TUSIAD Economic Research Forum Istanbul, January 21, 2011

Welcome message from author
This document is posted to help you gain knowledge. Please leave a comment to let me know what you think about it! Share it to your friends and learn new things together.
Transcript
H Did E i M k How Did Emerging Markets Cope in the Crisis?
Ferhan Salman
Cope in the Crisis?
Ferhan SalmanStrategy, Policy, and Review Dept.
K o c U n i v e r s i t y – T U S I A D E c o n o m i c R e s e a r c h F o r u mIstanbul , January 21 , 2011
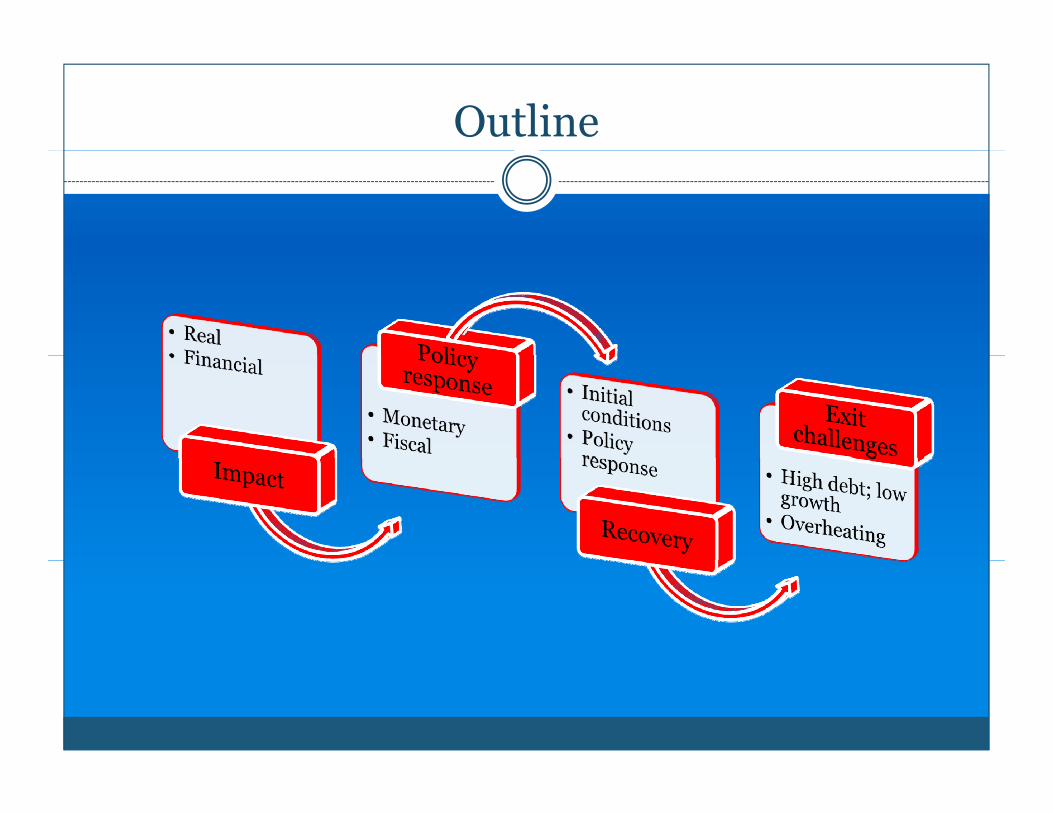
Outline

Vulnerability Index Methodology3
O llOverall Vulnerability
Index
External sector index
Public sector index
Corporate sector index
Financial sector indexindex
(weight=0.45)index
(weight = 0.25)index
(weight = 0.15)index
(weight = 0.15)
Reserves in percent of ST
debt + CA deficit (weight = 0.24)
CA in % of GDP (weight = 0.25)
External debt in % of GDP
(weight = 0.11)
External debt in % of exports
(weight = 0.20)
REER misalignment
(weight = 0.20) (weight 0.24)

Re-decoupling
120
Median Stock Market Indices
100
120Lehman Brothers G20 Summit -
London
Fedrateat zero
IMFReform Lending Facilities
60
80
St t f i i
40
EM Low & Medium VulnerabilityAM
Start of crisis,August 9, 2007
0
20
Jan-07 Apr-07 Jul-07 Oct-07 Jan-08 Apr-08 Jul-08 Oct-08 Jan-09 Apr-09 Jul-09 Oct-09 Jan-10 Apr-10 Jul-10
AMEM High Vulnerability
Source: “How Did Emerging Markets Cope in the Crisis?” IMF (2010), www.imf.org.
Jan-07 Apr-07 Jul-07 Oct-07 Jan-08 Apr-08 Jul-08 Oct-08 Jan-09 Apr-09 Jul-09 Oct-09 Jan-10 Apr-10 Jul-10
Impact Policy response Recovery Exit challenges

Stronger fundamentals – hit later
Proportion of Countries with Negative Quarterly Growth by L l f E t l V l bilit
80
90
100
gory
Level of External Vulnerability
50
60
70
nt o
f VE
cate
20
30
40
Perc
en
0
10
2007Q4 2008Q1 2008Q2 2008Q3 2008Q4 2009Q1
High vulnerability Medium vulnerability Low vulnerability
Source: “How Did Emerging Markets Cope in the Crisis?” IMF (2010), www.imf.org.
High vulnerability Medium vulnerability Low vulnerability
Impact Policy response Recovery Exit challenges
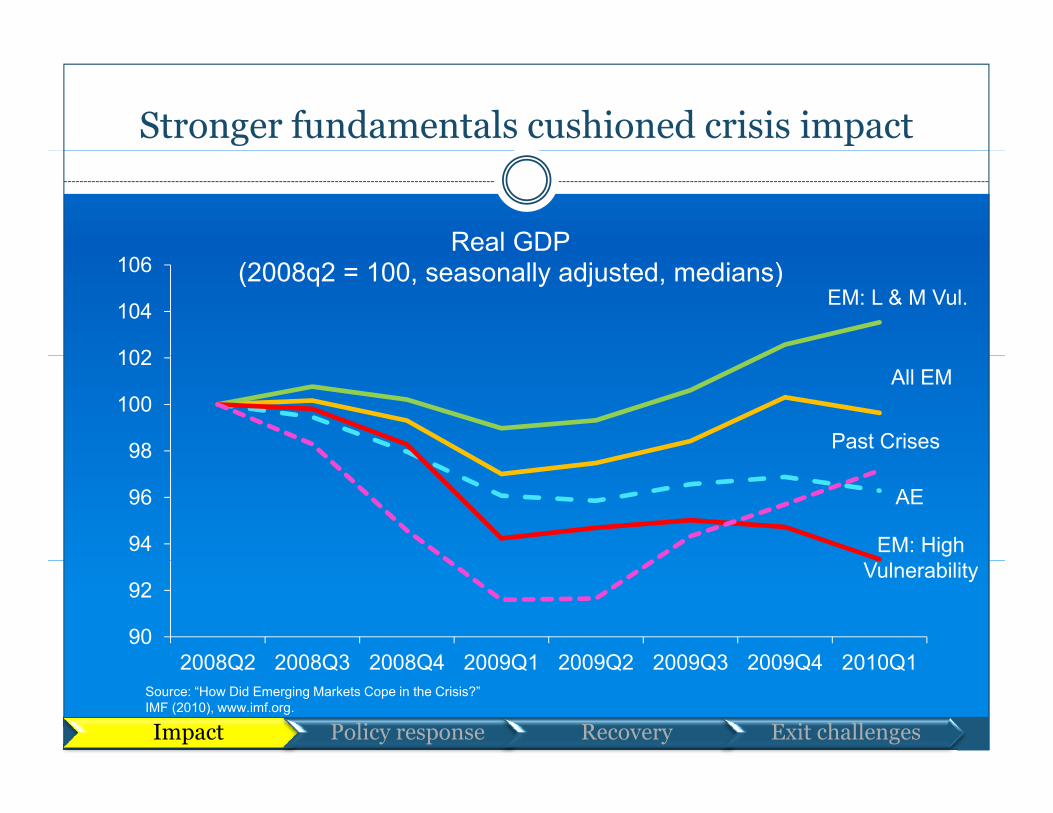
Stronger fundamentals cushioned crisis impact
Real GDP
EM: L & M Vul.
102
104
106 (2008q2 = 100, seasonally adjusted, medians)
All EM
98
100
102
Past Crises
AE
EM: High 94
96
98
Vulnerability
90
92
2008Q2 2008Q3 2008Q4 2009Q1 2009Q2 2009Q3 2009Q4 2010Q1
Impact Policy response Recovery Exit challenges
Source: “How Did Emerging Markets Cope in the Crisis?” IMF (2010), www.imf.org.
2008Q2 2008Q3 2008Q4 2009Q1 2009Q2 2009Q3 2009Q4 2010Q1

Explaining impact: Linkages and fundamentals mattered
0 Percent Change in Output (peak to trough)
-2
0
Top quartile average Determinants
Financial -6
-4
rcen
t
Bigger
External Vulnerabilities(Lower reserve coverage)
Linkages (Higher foreign bank claims)-8
6
Per contraction
Trade Linkages (Advanced partner country
-12
-10Bottom quartile average
(Advanced partner country growth)
Impact Policy response Recovery Exit challenges
Source: “How Did Emerging Markets Cope in the Crisis?” IMF (2010), www.imf.org.
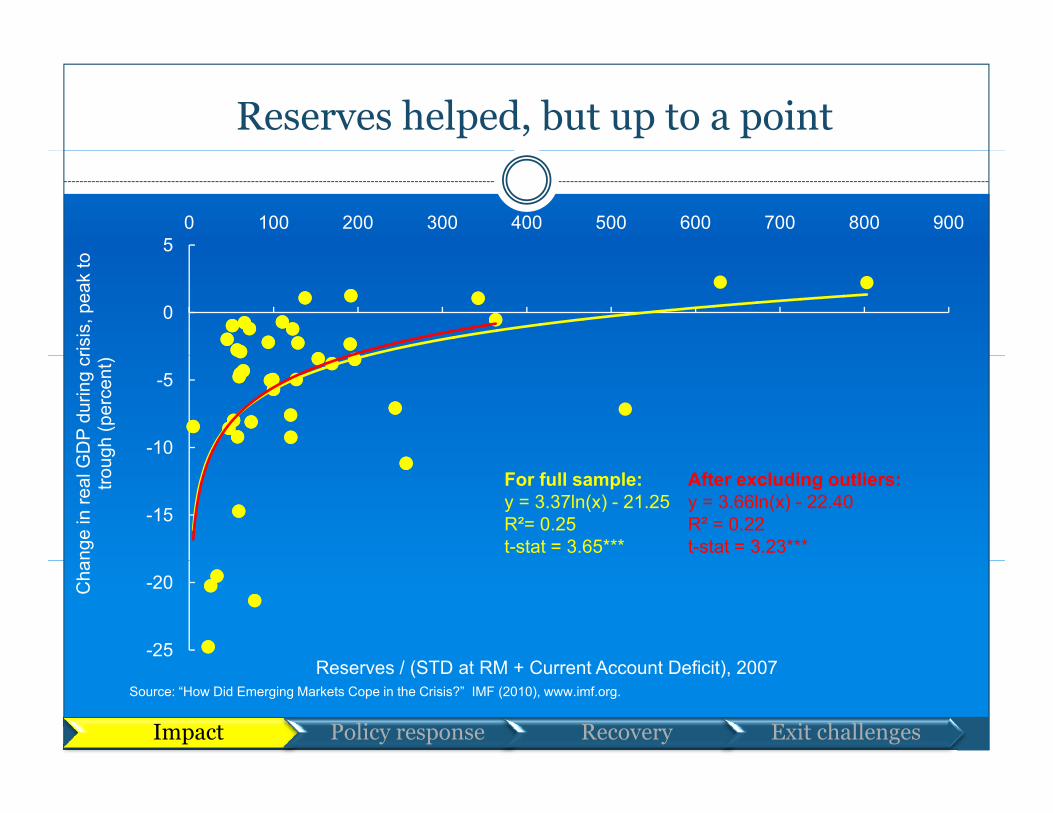
Reserves helped, but up to a point
50 100 200 300 400 500 600 700 800 900
0
risis
, pea
k to
-10
-5
GD
P du
ring
crgh
(per
cent
)
-15
nge
in re
al G
trou
After excluding outliers: y = 3.66ln(x) - 22.40R² = 0.22t-stat = 3.23***
For full sample:y = 3.37ln(x) - 21.25R²= 0.25 t-stat = 3.65***
-25
-20Cha
R / (STD t RM + C t A t D fi it) 2007
Impact Policy response Recovery Exit challenges
Reserves / (STD at RM + Current Account Deficit), 2007Source: “How Did Emerging Markets Cope in the Crisis?” IMF (2010), www.imf.org.

Reserves helped, but up to a point
Low-reserve coverage(reserves/STD at RM < 100)
High-reserve coverage(reserves/STD at RM >= 100)
15/ /
10
15
, pea
k to
al
s
y = 13.676x + 0.0741R² = 0.3378t stat = 2 47**
4
6
k to
trou
gh,
5
DP
chan
ge,
gh, r
esid
ua
t-stat = 2.47**
0
2
chan
ge, p
eak
resi
dual
s
-5
0
Per
cent
GD
troug
-4
-2
erce
nt G
DP
c
-10-0.6 -0.4 -0.2 0.0 0.2 0.4
Log(Reserves/GDP) residuals
-8
-6
-1.5 -1.0 -0.5 0.0 0.5 1.0 1.5
Pe
Log(Reserves/GDP) residuals
y = 0.1632x - 0.0036R² = 0.0009t-stat = 0.15
Log(Reserves/GDP), residuals Log(Reserves/GDP), residualsSource: “How Did Emerging Markets Cope in the Crisis?” IMF (2010), www.imf.org.
Source: “How Did Emerging Markets Cope in the Crisis?” IMF (2010), www.imf.org.
Impact Policy response Recovery Exit challenges

Deleveraging
30
40 Real Credit Growth, Peak to Trough, Median
cent
)
Figure 11. Deleveraging
Exposure of BIS banks (Percent of recipient country GDP, Peak =100)
0
10
20
30
Peak
dit G
row
th (
in p
erc
60
80
100
120Asia (t=Sep 1997) E Europe (t=Mar
2009)
Latin America(t=Dec 1983)
-30
-20
-10
Past crises High V l bilit
Low/Medium V l bilit
AMs
Trough
YoY
Rea
l Cre
d
0
20
40
60
Vulnerability Vulnerability
Source: VEE Spring 2007; IFS; BIS.
0t-20 t-14 t-8 t-2 t+4 t+10 t+16 t+22 t+28 t+34
Impact Policy response Recovery Exit challenges

Credit collapse explained by pre-crisis vulnerabilities
00 100 200 300 400 500
rcen
t Credit busts follow credit booms…400ra
tio ...generally foreign financed
-40
-20
0
troug
h, in
per
300
350
cent
of 2
003
r
-80
-60
wth
, pea
k to
t
150
200
250
ratio
in p
cerc
-140
-120
-100
al c
redi
t gro
w
50
100
150
edit
to G
DP
r
-160
140
Y-o-
y re
a
2007 Credit to GDP ratio in percent of 2003 Credit to GDP ratio
00 100 200 300 400
2007
cre
2007 BIS foreign claims to GDP ratio in percent of 2003 ratio
Source: “How Did Emerging Markets Cope in the Crisis?” IMF (2010), www.imf.org.
Source: “How Did Emerging Markets Cope in the Crisis?” IMF (2010), www.imf.org.
Impact Policy response Recovery Exit challenges

Impact on Spreads
The rise in Spreads is explained by1 – Monetary Policy Regime 1 Monetary Policy Regime Inflation Targeters observed lower spreads2 – Reserve coverage Higher reserves, lower spreads3 – Pre-crisis inflation rate Hi h i fl ti t hi h d Higher inflation rate higher spreads4 – Information (e.g. Indonesia)

POLICY RESPONSE
Substantial stimulus across EMs
Countries with stronger fundamentals were able to
accommodate more

Substantial fiscal reaction in EMs and AEs…
Fiscal accommodation in EMs and AEs (2009)( )
.2
s
Emerging Markets
.2s
Advanced Economies
.15
n of
cou
ntrie
s
.1.1
5n
of c
ount
ries
.05
.1P
ropo
rtion
.05
Pro
porti
on
0
-5 0 5 10Change in primary deficit
0
-5 0 5 10Change in primary deficit
Impact Policy response Recovery Exit challenges
Source: “How Did Emerging Markets Cope in the Crisis?” IMF (2010), www.imf.org.

Stronger fundamentals, more accommodationmore accommodation
5
Lower growth4
DP
Top quartile average
Lower public debt3
poin
ts o
f GD
omm
odat
ion
Better primary balance
2
Perc
enta
ge p
Mor
e ac
co
balance1
P
Bottom quartile average
0
Impact Policy response Recovery Exit challenges

Substantial monetary policy reaction…
Monetary accommodation in EMs and AEs (Aug. 2008 – Oct. 2009)
.2rie
s
Emerging Markets
.3rie
s
Advanced economies
.1.1
5tio
nof
cou
ntr
.2tio
nof
cou
ntr
.05Pro
por t
.1P
ropo
rt
0
0 2 4 6 8 10Reduction in policy rate
0
0 2 4 6Reduction in policy rate
S “H Did E i M k t C i th C i i ?”Source: “How Did Emerging Markets Cope in the Crisis?” IMF (2010), www.imf.org.
Impact Policy response Recovery Exit challenges

Lower spreads, more stimulusp ,
Floating regimes had higher adjustment in interest rates1. Countries with a larger output gaps2. Lower inflation rates3 EMBI spread also important (assessment 3. EMBI spread also important (assessment
of country fundamentals)
Impact Policy response Recovery Exit challenges
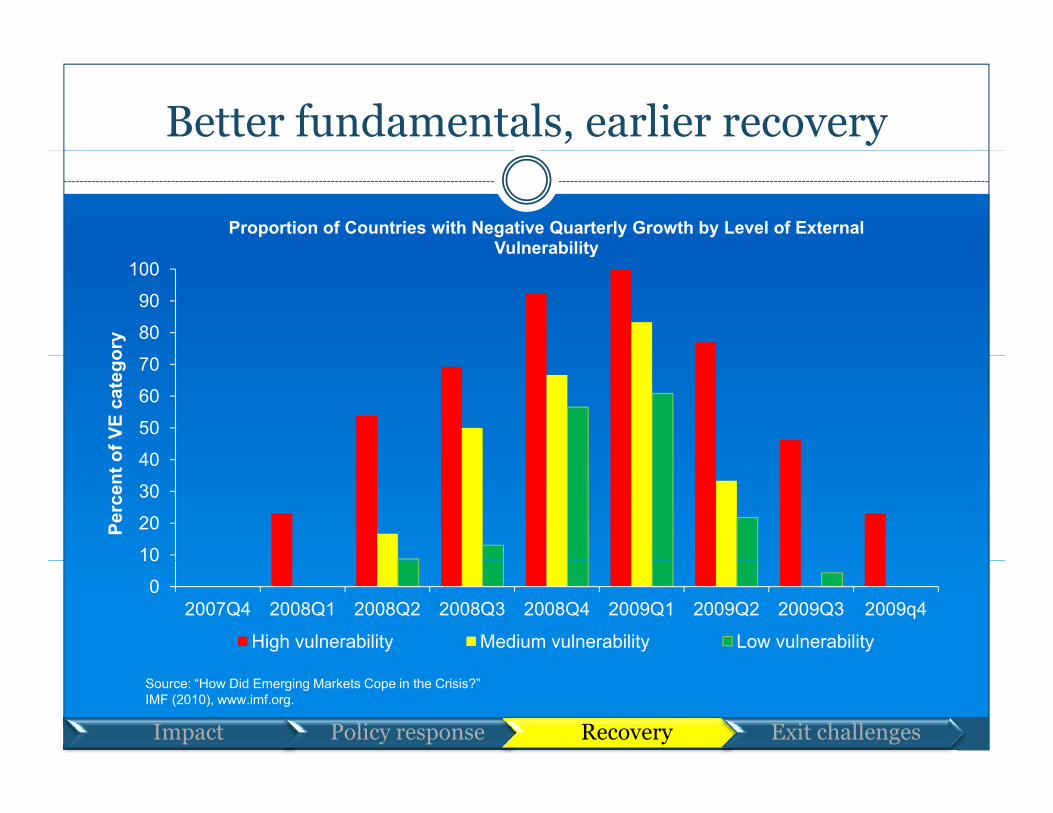
Better fundamentals, earlier recovery
Proportion of Countries with Negative Quarterly Growth by Level of External Vulnerability
80
90
100
ory
Vulnerability
40
50
60
70
of V
E ca
tego
10
20
30
40
Perc
ent o
0
10
2007Q4 2008Q1 2008Q2 2008Q3 2008Q4 2009Q1 2009Q2 2009Q3 2009q4
High vulnerability Medium vulnerability Low vulnerability
Source: “How Did Emerging Markets Cope in the Crisis?” IMF (2010), www.imf.org.
Impact Policy response Recovery Exit challenges

Recovery: fundamentals and stimulus
1. Initial contraction in output 2. Reserve cover of ST liabilities T
3. Domestic demand revival in trading partners
4 Fiscal expansion TPU
4. Fiscal expansion5. Monetary policy (pegs are not
recovering) OU
T
recovering)
Source: “How Did Emerging Markets Cope in the Crisis?” IMF (2010), www.imf.org.
Impact Policy response Recovery Exit challenges
Exit Issues and Lessons
Low vulnerability EMsLow vulnerability EMs
High vulnerability EMs
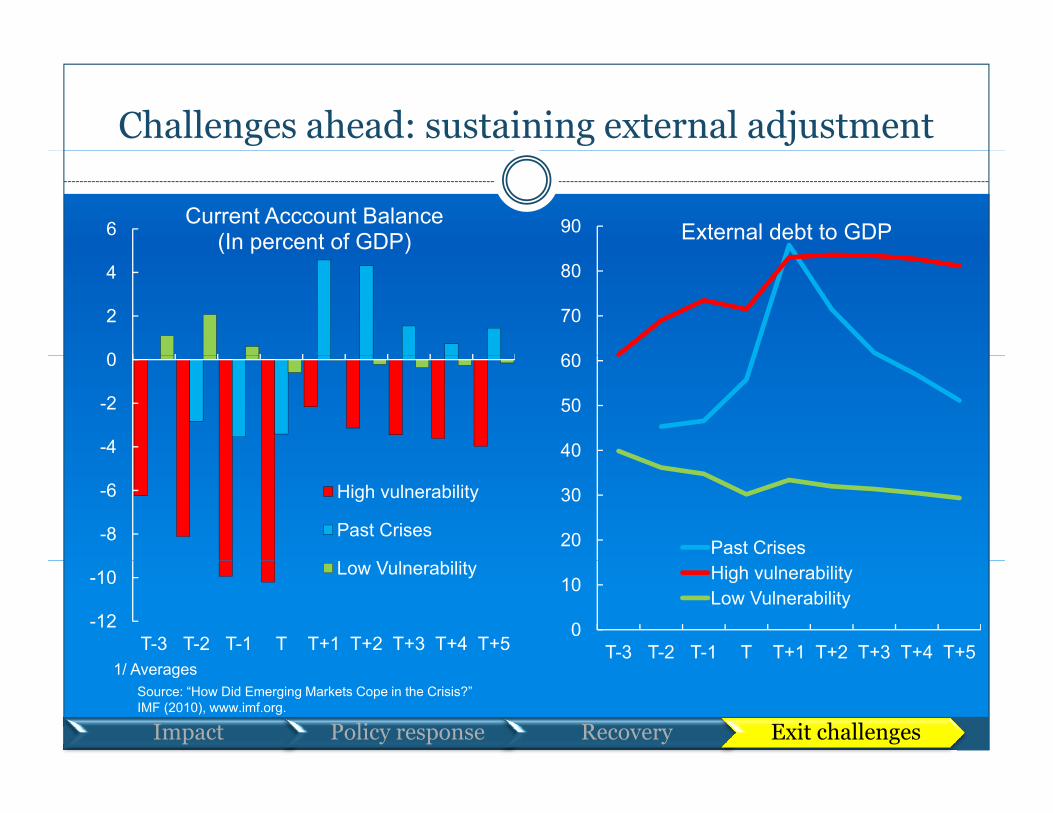
Challenges ahead: sustaining external adjustment
6 Current Acccount Balance(In percent of GDP)
90 External debt to GDP
0
2
4( p )
60
70
80
-4
-2
0
40
50
60
-8
-6 High vulnerability
Past Crises 20
30
Past Crises
/
-12
-10
T-3 T-2 T-1 T T+1 T+2 T+3 T+4 T+5
Low Vulnerability
0
10
T-3 T-2 T-1 T T+1 T+2 T+3 T+4 T+5
High vulnerabilityLow Vulnerability
1/ Averages
Impact Policy response Recovery Exit challenges
Source: “How Did Emerging Markets Cope in the Crisis?” IMF (2010), www.imf.org.
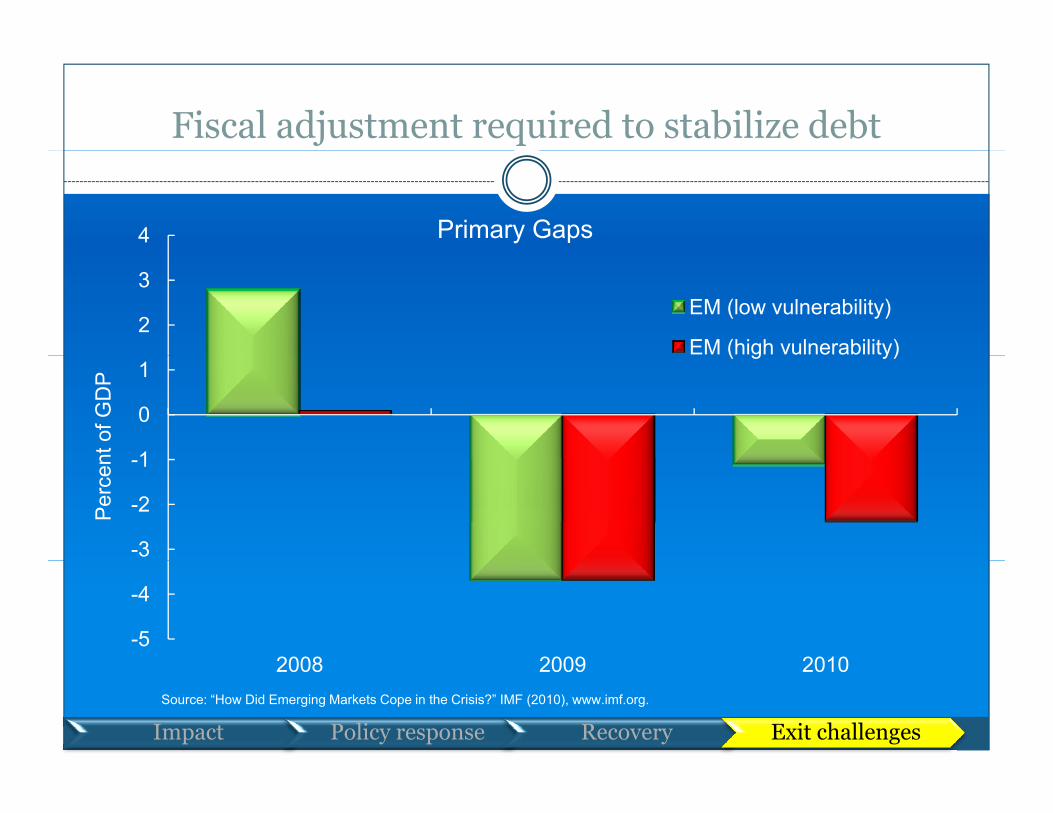
Fiscal adjustment required to stabilize debt
4 Primary Gaps
2
3EM (low vulnerability)
EM (high vulnerability)
1
0
1
nt o
f GD
P
( g y)
-3
-2
-1
Per
cen
-5
-4
2008 2009 20102008 2009 2010Source: “How Did Emerging Markets Cope in the Crisis?” IMF (2010), www.imf.org.
Impact Policy response Recovery Exit challenges

Overheating risks in some emerging markets…
6 Output Gaps in Emerging Markets (Medians)
4
5
1
2
3
High Medium & Low
-1
0
1
-3
-2
2007 2008 2009 2010 2011
Source: “How Did Emerging Markets Cope in the Crisis?” IMF (2010), www.imf.org.
Impact Policy response Recovery Exit challenges

Renewed capital flows pose policy dilemmas
2,500US$ b US$ bn
350
450
1 500
2,000
US$ bn US$ bn
150
250
1,000
1,500
-50
50
0
500
-150-500Mar-03 Mar-04 Mar-05 Mar-06 Mar-07 Mar-08 Mar-09 Mar-10
Annual change in global liquidity Gross Inflows into EMs (right axis)
Source: IFS and staff estimates.
Impact Policy response Recovery Exit challenges
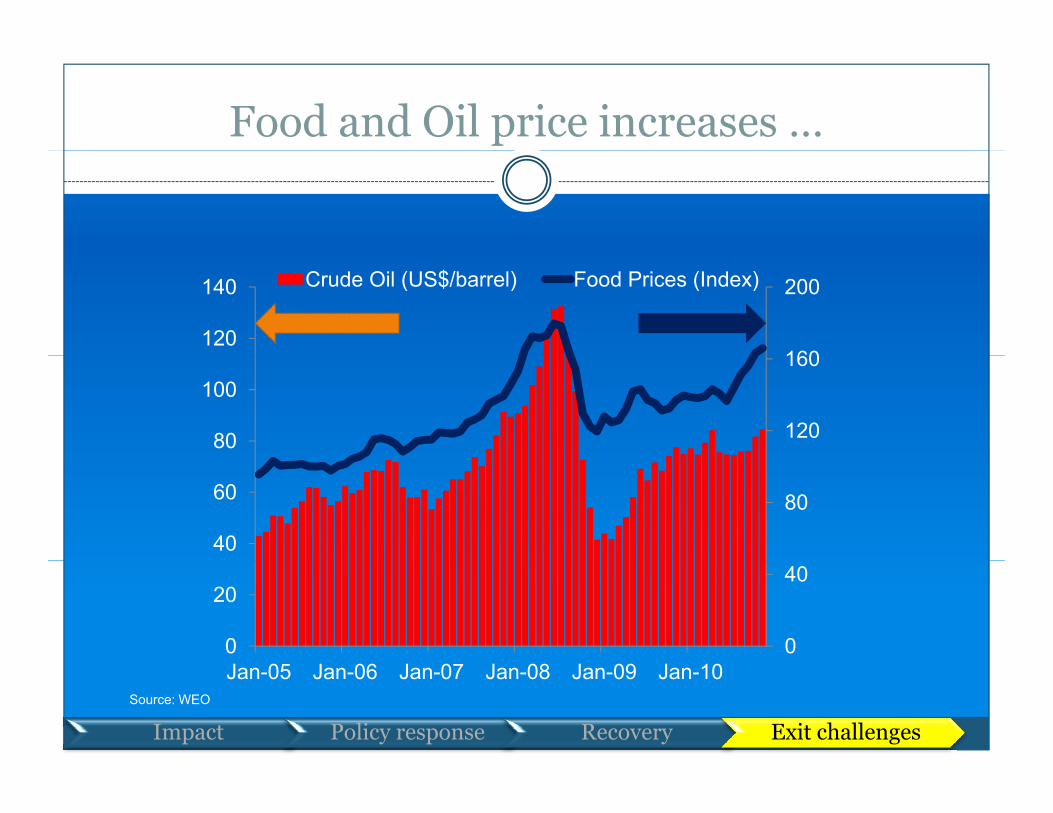
Food and Oil price increases …
160
200
120
140 Crude Oil (US$/barrel) Food Prices (Index)
120
160
80
100
80
40
60
0
40
0
20
Source: WEO
Impact Policy response Recovery Exit challenges
Jan-05 Jan-06 Jan-07 Jan-08 Jan-09 Jan-10

THANK YOU
Related Documents