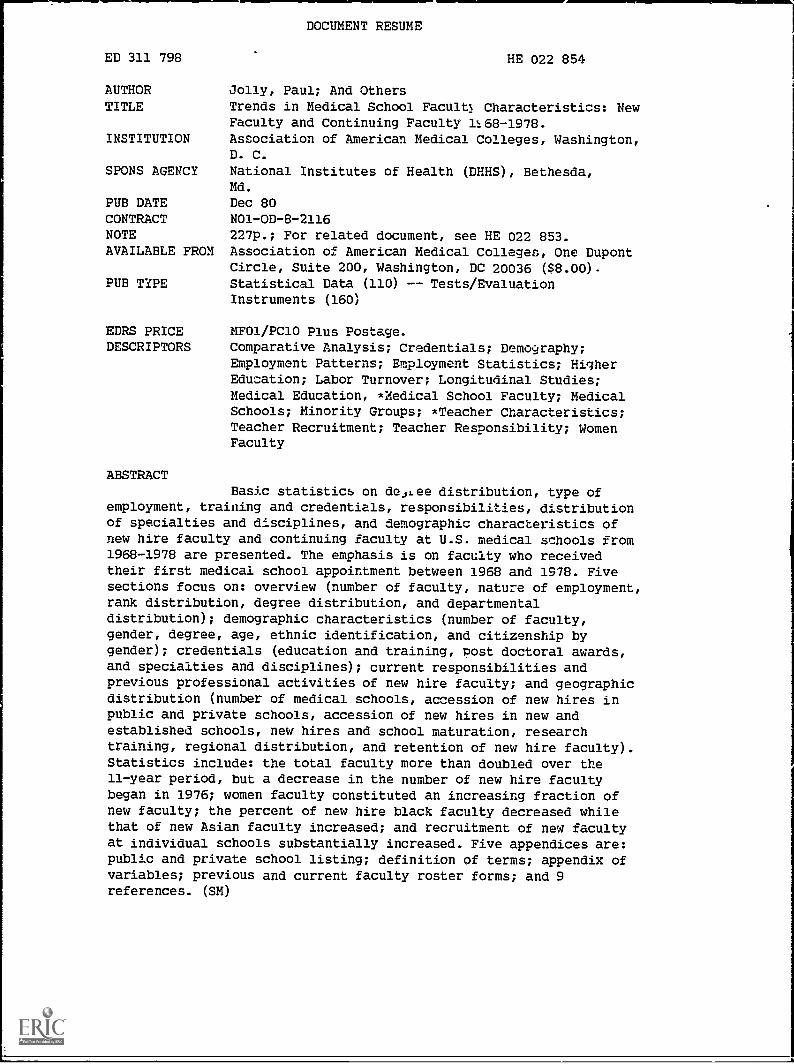
ED 311 798 AUTHOR TITLE INSTITUTION SPONS AGENCY PUB DATE CONTRACT NOTE AVAILABLE FROM PUB TYPE EDRS PRICE DESCRIPTORS ABSTRACT DOCUMENT RESUME HE 022 854 Jolly, Paul; And Others Trends in Medical School Faculty Characteristics: New Faculty and Continuing Faculty 168-1978. Association of American Medical Colleges, Washington, D. C. National Institutes of Health (DHHS), Bethesda, Md. Dec 80 NO1-0D-8-2116 227p.; For related document, see HE 022 853. Association of American Medical Colleges, One Dupont Circle, Suite 200, Washington, DC 20036 ($8.00). Statistical Data (110) -- Tests/Evaluation Instruments (160) MF01/PC10 Plus Postage. Comparative Analysis; Credentials; Demography; Employment Patterns; Employment Statistics; Higher Education; Labor Turnover; Longitudinal Studies; Medical Education, *Medical School Faculty; Medical Schools; Minority Groups; *Teacher Characteristics; Teacher Recruitment; Teacher Responsibility; Women Faculty Basic statistics on de,Lee distribution, type of employment, training and credentials, responsibilities, distribution of specialties and disciplines, and demographic characteristics of new hire faculty and continuing faculty at U.S. medical schools from 1968-1978 are presented. The emphasis is on faculty who received their first medical school appointment between 1968 and 1978. Five sections focus on: overview (number of faculty, nature of employment, rank distribution, degree distribution, and departmental distribution); demographic characteristics (number of faculty, gender, degree, age, ethnic identification, and citizenship by gender); credentials (education and training, post doctoral awards, and specialties and disciplines); current responsibilities and previous professional activities of new hire faculty; and geographic distribution (number of medical schools, accession of new hires in public and private schools, accession of new hires in new and established schools, new hires and school maturation, research training, regional distribution, and retention of new hire faculty). Statistics include: the total faculty more than doubled over the 11-year period, but a decrease in the number of new hire faculty began in 1976; women faculty constituted an increasing fraction of new faculty; the percent of new hire black faculty decreased while that of new Asian faculty increased; and recruitment of new faculty at individual schools substantially increased. Five appendices are: public and private school listing; definition of terms; appendix of variables; previous and current faculty roster forms; and 9 references. (SM)

Welcome message from author
This document is posted to help you gain knowledge. Please leave a comment to let me know what you think about it! Share it to your friends and learn new things together.
Transcript
ED 311 798
AUTHORTITLE
INSTITUTION
SPONS AGENCY
PUB DATECONTRACTNOTEAVAILABLE FROM
PUB TYPE
EDRS PRICEDESCRIPTORS
ABSTRACT
DOCUMENT RESUME
HE 022 854
Jolly, Paul; And OthersTrends in Medical School Faculty Characteristics: NewFaculty and Continuing Faculty 168-1978.Association of American Medical Colleges, Washington,D. C.
National Institutes of Health (DHHS), Bethesda,Md.
Dec 80NO1-0D-8-2116227p.; For related document, see HE 022 853.Association of American Medical Colleges, One DupontCircle, Suite 200, Washington, DC 20036 ($8.00).Statistical Data (110) -- Tests/EvaluationInstruments (160)
MF01/PC10 Plus Postage.Comparative Analysis; Credentials; Demography;Employment Patterns; Employment Statistics; HigherEducation; Labor Turnover; Longitudinal Studies;Medical Education, *Medical School Faculty; MedicalSchools; Minority Groups; *Teacher Characteristics;Teacher Recruitment; Teacher Responsibility; WomenFaculty
Basic statistics on de,Lee distribution, type ofemployment, training and credentials, responsibilities, distributionof specialties and disciplines, and demographic characteristics ofnew hire faculty and continuing faculty at U.S. medical schools from1968-1978 are presented. The emphasis is on faculty who receivedtheir first medical school appointment between 1968 and 1978. Fivesections focus on: overview (number of faculty, nature of employment,rank distribution, degree distribution, and departmentaldistribution); demographic characteristics (number of faculty,gender, degree, age, ethnic identification, and citizenship bygender); credentials (education and training, post doctoral awards,and specialties and disciplines); current responsibilities andprevious professional activities of new hire faculty; and geographicdistribution (number of medical schools, accession of new hires inpublic and private schools, accession of new hires in new andestablished schools, new hires and school maturation, researchtraining, regional distribution, and retention of new hire faculty).Statistics include: the total faculty more than doubled over the11-year period, but a decrease in the number of new hire facultybegan in 1976; women faculty constituted an increasing fraction ofnew faculty; the percent of new hire black faculty decreased whilethat of new Asian faculty increased; and recruitment of new facultyat individual schools substantially increased. Five appendices are:public and private school listing; definition of terms; appendix ofvariables; previous and current faculty roster forms; and 9references. (SM)
TRENDS IN MEDICAL SCHOOL FACULTY CHARACTERISTICS
NEW FACULTY AND CONTINUING FACULTY
1968 1978
0:PARTMENT OF EDUCATIONOffice of Edir:a. ',nal Research and Improvement
E CATIONAL RESOurICES INFORMATIONCENTER tERICI
Tres document nos been reproduced asreceived from the person or 'X011131.011Ong.nat.fig
l %nor changes nave been made to improvereproduchor duality
Points of view or opntonS st amain trnsclocameet do not necersonly represent othc,atOERI posaan or v
ASSOCIATION OF AMERICAN MEDICAL COLLEGESOne Dupont Circle, N.W.Washington, D.C. 20036
U.S. Department of Health and Human ServicesPublic Health Service
National Institutes of Health
N01-00-8-2116
BEST COPY AVAILABLE
"PERMISSION TO REPRODUCE THISMATERIAL HAS BEEN GRANTED BY
Association of American
Medical Colleges
TO THE EDUCATIONAL RESOURCESINFORMATION CENTER (ERIC)."
Additional copies of this report are availablefrom AAMC. Orders should be addressed to:
Association of American Medical CollegesOne Dupont Circle, Suite 200Washington, D. C. 20036
$8.00 per copy
Remittance or institutional purchase ordermust accompany order.
CO Association of American Medical Colleges, 1980.
The work upon which this publi:?ation is based
was supported in part by the Yational Institutesof Health, Department of Health and Human Servicespursuant to contract number NOZ-0-8-2116.However, any conclusions and/or recommendationsexpressed herein do not necessarily representthe views of the supporting agency.
The government retains the right to us',duplicate or disclose the contents of thisreport and to have or permit others to do so.
4
TRENDS IN MEDICAL SCHOOL FACULTY CHARACTERISTICS
NEW FACULTY AND CONTINUING FACULTY
1968-1978
Paul Jolly, Ph.D.
Elizabeth J. Higgins
Maryn P. Goodson
Division of Operational Studies
Department of Planning and Policy Development
Decembe 1980
TABLE OF CONTENTS
Page
List of Tables ii
List of Figures
Executive Summary vii
Introduction 1
Methodology 3
I. Overview 9
Number of Faculty, Nature of Employ-ment, Rank Distribution, DegreeDistribution and DepartmentalDistribution
II. Demographic Characteristics 27
Number of Faculty; Gender; Degree,Age, Ethnic Identification andCitizenship by Gender
III. Credentials 43
A. Education and Training 43
Location of Degree; Length c,f TimeBetween M.D. Degree and FirstAppointment; Residencies
Page
B. Post Doctoral Awards 51
Post M.D. Fellowships; Post Ph.D.Fellowships; Source of Awards toM.D. and Ph.D. New Hires
C. Specialties and Disciplines
N.D. Specialties; Board Certification;Ph.D. Disciplines; Non-doctoraldisciplines
IV. Current Responsibilities and PreviousProfessional Activities of NewHire Faculty
V. Geographic Distribution
Number of Medical Schools; Accession ofNew Hires in Public and Private Schools;Accession of New Hires in New andEstablished Schools; New Hires andSchool Maturation; Research Training,Regional Distribution and Retention ofNew hire Faculty
Appendices
61
73
77
97
A. Public and Private School Listing 99B. Definition of Terms 102C. Appendix of Variables 103D. Previous and Current Faculty
Roster Forms 118C. References 123
LIST OF TABLES
Page
Overview
Table 1 Number and Employment Statusof Total Medical School Faculty1968-1978 13
Table 2 Number and Rercent of TotalNew Hires and Base Faculty byNature of Employment 1968-1978.... 16
Table 3 Number and Percent of Full-timeNew Hire Faculty by Nature ofEmployment 1968-1978
Table 4 Number and Percent Distributionof New Hire, Base and TotalFull-time Faculty by Rank1977-1978
Table 5 Number and Percent of Full-timeNew Hire and Base Faculty byDegree 1968-1978
Table 6 Number and Percent Distributionof Total New Hire and BaseFaculty in Basic and ClinicalDepartments 1968-1978
Demographic Characteristics
Table 7 Number and Percent of Full-timeNew Hire and Base Faculty byGender 1968-1978
C.)
Page
Table 8 Number and Percent of Full-timeNew Hire Faculty by Degree andGender 1968-1978 35
Table 9 Mean/Median Age of Full-time NewHires and Base Faculty byGender 1968-1978 36
Table 10 Number and Percent of Full-timeNew Hire Faculty by Ethnic Originand Gender 1968-1978 37
18 Table 11 Number and Gender of Full-timeU.S. Citizen New Hire Facultyby Ethnic Group 1968-1978 39
Table 12 Number and Percent of Full-time
20 New Hire Faculty by Citizenship1968-1978 40
22 Credentials
Education and Training
Table 13 Distribution of New Hire and
24 Base Full-time Faculty byLocation of Degree - U.S.or Foreign 1968-1978 45
Table 14 Number and Percent Distributionof Full-time M.D. and M.D./Ph.D.New Hire Faculty by the Number
32 of Years Between Receiving M.D.Degree and a First Appointment 47
9
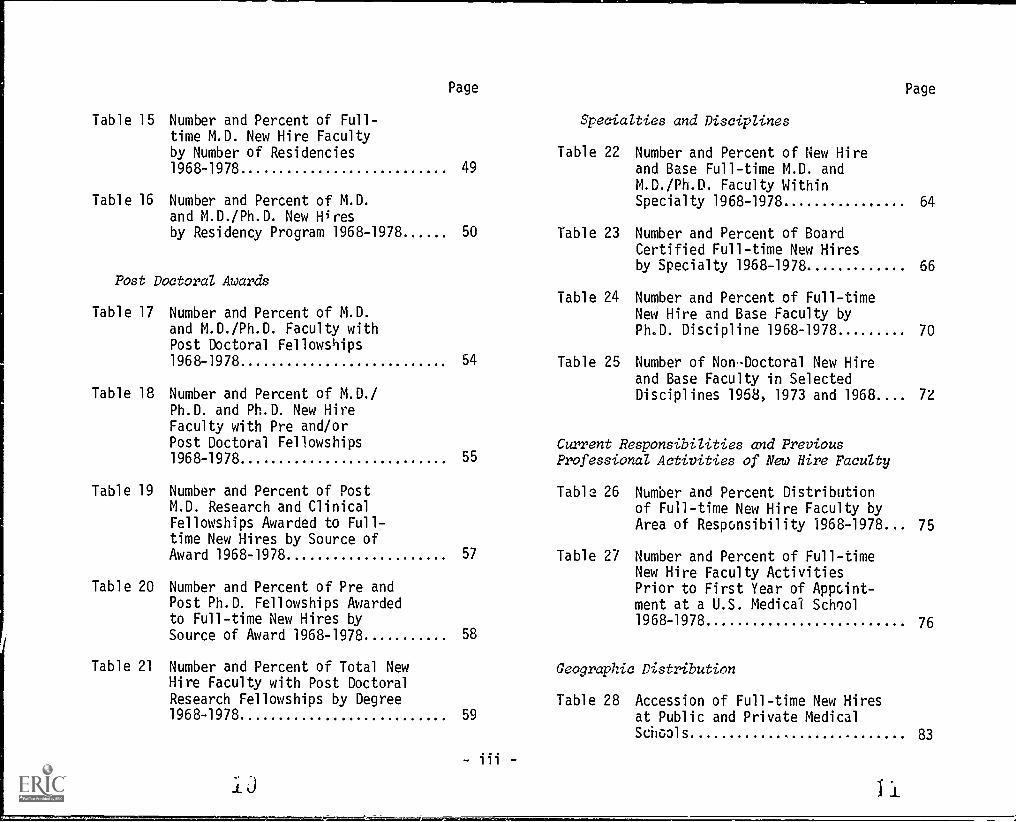
Table 15 Number and Percent of Full-time M.D. New Hire Facultyby Number of Residencies1968-1978
Table 16 Number and Percent of M.D.and M.D./Ph.D. New Hiresby Residency Program 1968-1978
Post Doctoral Awards
Table 17 Number and Percent of M.D.and M.D./Ph.D. Faculty withPost Doctoral Fellowships1968-1978
Page
Specialties and Disciplines
Page
Table 22 Number and Percent of New Hire49 and Base Full-time M.D. and
M.D./Ph.D. Faculty WithinSpecialty 1968-1978 64
50 Table 23 Number and Percent of BoardCertified Full-time New Hiresby Specialty 1968-1978 66
Table 24 Number and Percent of Full-timeNew Hire and Base Faculty byPh.D. Discipline 1968-1978 70
54 Table 25 Number of Non-Doctoral New Hireand Base Faculty in SelectedDisciplines 1958, 1973 and 1968 7ZTable 18 Number and Percent of M.D./
Ph.D. and Ph.D. New HireFaculty with Pre and/orPost Doctoral Fellowships1968-1978 55
Table 19 Number and Percent of PostM.D. Research and ClinicalFellowships Awarded to Full-time New Hires by Source ofAward 1968-1978 57
Table 20 Number and Percent of Pre andPost Ph.D. Fellowships Awardedto Full-time New Hires bySource of Award 1968-1978 58
Table 21 Number and Percent of Total NewHire Faculty with Post DoctoralResearch Fellowships by Degree1968-1978
IJ
Current Responsibilities and PreviousProfessional Activities of New Hire Faculty
Table 26 Number and Percent Distributionof Full-time New Hire Faculty byArea of Responsibility 1968-1978. . 75
Table 27 Number and Percent of Full-timeNew Hire Faculty ActivitiesPrior to First Year of Appoint-ment at a U.S. Medical School1968-1978 76
Geographic Distribution
Table 28 Accession of Full-time New Hires59 at Public and Private Medical
SchGals 83
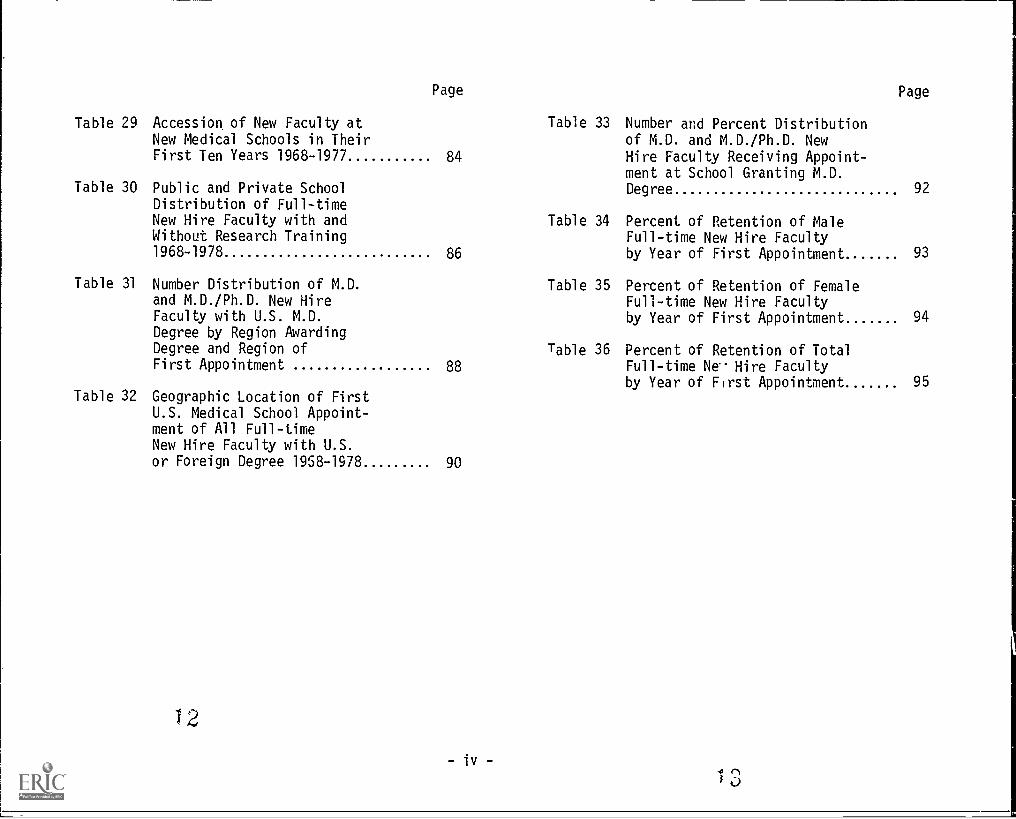
Table 29 Accession of New Faculty atNew Medical Schools in Their
Page
Table 33 Number and Percent Distributionof M.D. and M.D./Ph.D. New
Page
First Ten Years 1968-1977 84 Hire Faculty Receiving Appoint-ment at School Granting M.D.
Table 30 Public and Private School Degree 92
Distribution of Full-timeNew Hire Faculty with and Table 34 Percent of Retention of MaleWithout Research Training Full-time New Hire Faculty1968-1978 86 by Year of First Appointment 93
Table 31 Number Distribution of M.D.and M.D./Ph.D. New Hire
Table 35 Percent of Retention of FemaleFull-time New Hire Faculty
Faculty with U.S. M.D. by Year of First Appointment 94Degree by Region AwardingDegree and Region of Table 36 Percent of Retention of TotalFirst Appointment 88 Full-time Ne Hire Faculty
by Year of First Appointment 95Table 32 Geographic Location of First
U.S. Medical School Appoint-ment of All Full-timeNew Hire Faculty with U.S.or Foreign Degree 1958-1978 90
LIST OF FIGURES
Page Page
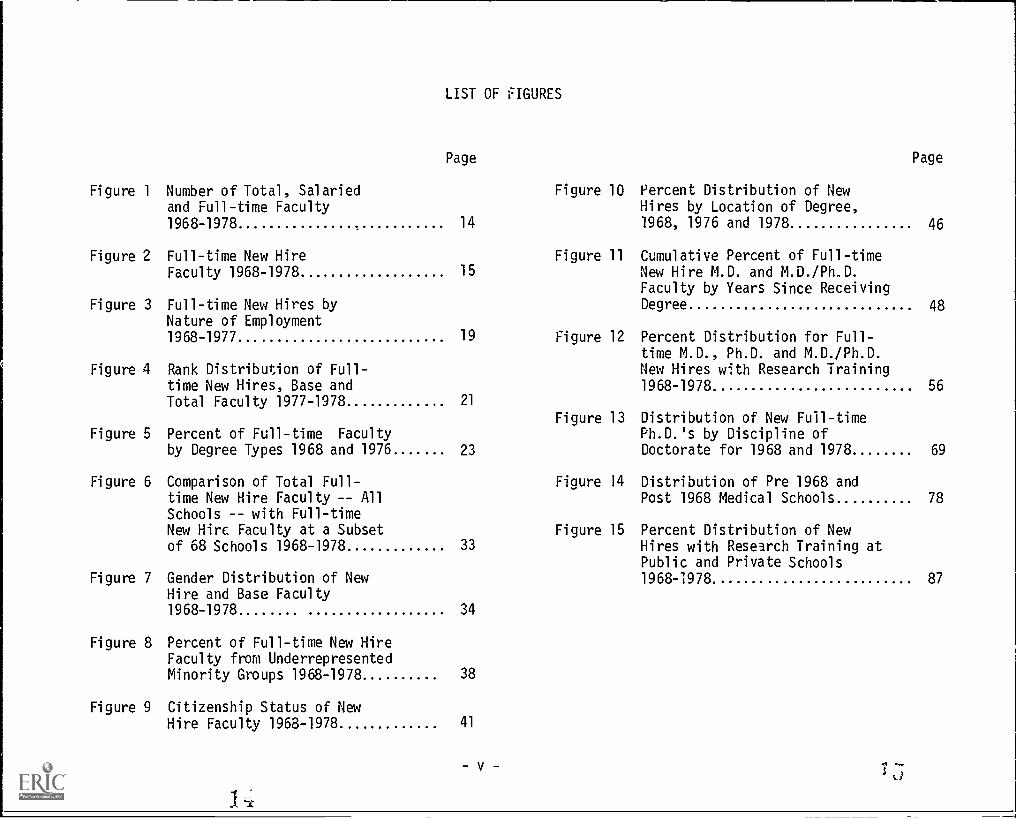
Figure 1 Number of Total, Salariedand Full-time Faculty1968-1978 14
Figure 10 Percent Distribution of NewHires by Location of Degree,1968, 1976 and 1978 46
Figure 2 Full-time New Hire Figure 11 Cumulative Percent of Full-time
Faculty 1968-1978 15 New Hire M.D. and M.D./Ph.D.Faculty by Years Since Receiving
Figure 3 Full-time New Hires by Degree 48Nature of Employment1968-1977 19 Figure 12 Percent Distribution for Full-
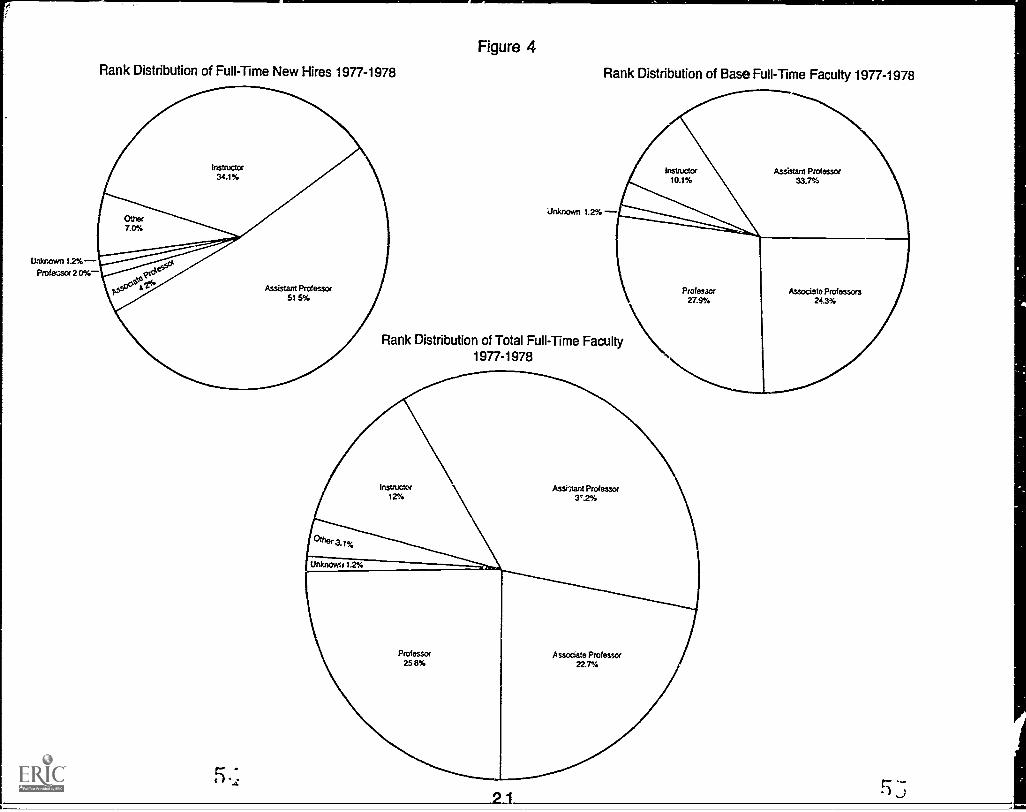
time M.D., Ph.D. and M.D./Ph.D.Figure 4 Rank Distribution of Full- New Hires with Research Training
time New Hires, Base and 1968-1978 56
Total Faculty 1977-1978 21
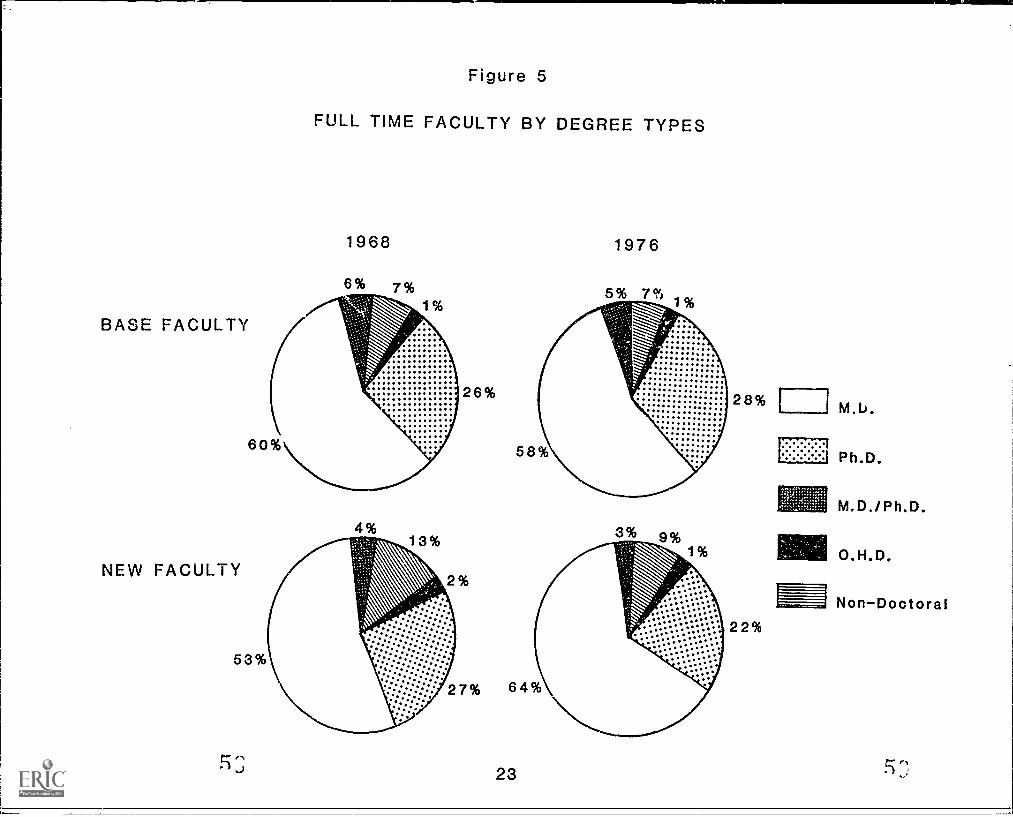
Figure 13 Distribution of New Full-timeFigure 5 Percent of Full-time Faculty Ph.D.'s by Discipline of
by Degree Types 1968 and 1976 23 Doctorate for 1968 and 1978 69
Figure 6 Comparison of Total Full- Figure 14 Distribution of Pre 1968 andtime New Hire Faculty -- All Post 1968 Medical Schools 78Schools -- with Full-timeNew Hire Faculty at a Subset Figure 15 Percent Distribution of Newof 68 Schools 1968-1978 33 Hires with Research Training at
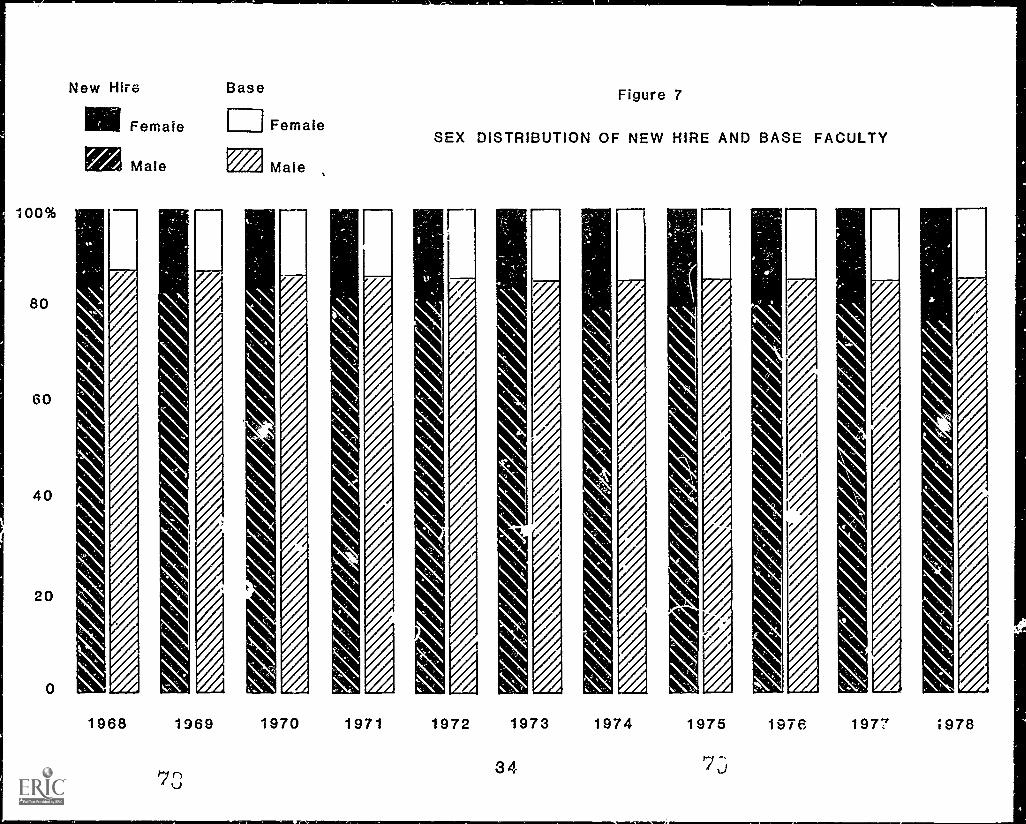
Public and Private SchoolsFigure 7 Gender Distribution of New 1968-1978 87
Hire and Base Faculty1968-1978 34
Figure 8 Percent of Full-time New HireFaculty from UnderrepresentedMinority Groups 1968-1978 38
Figure 9 Citizenship Status of NewHire Faculty 1968-1978 41
- v - 1 "-U
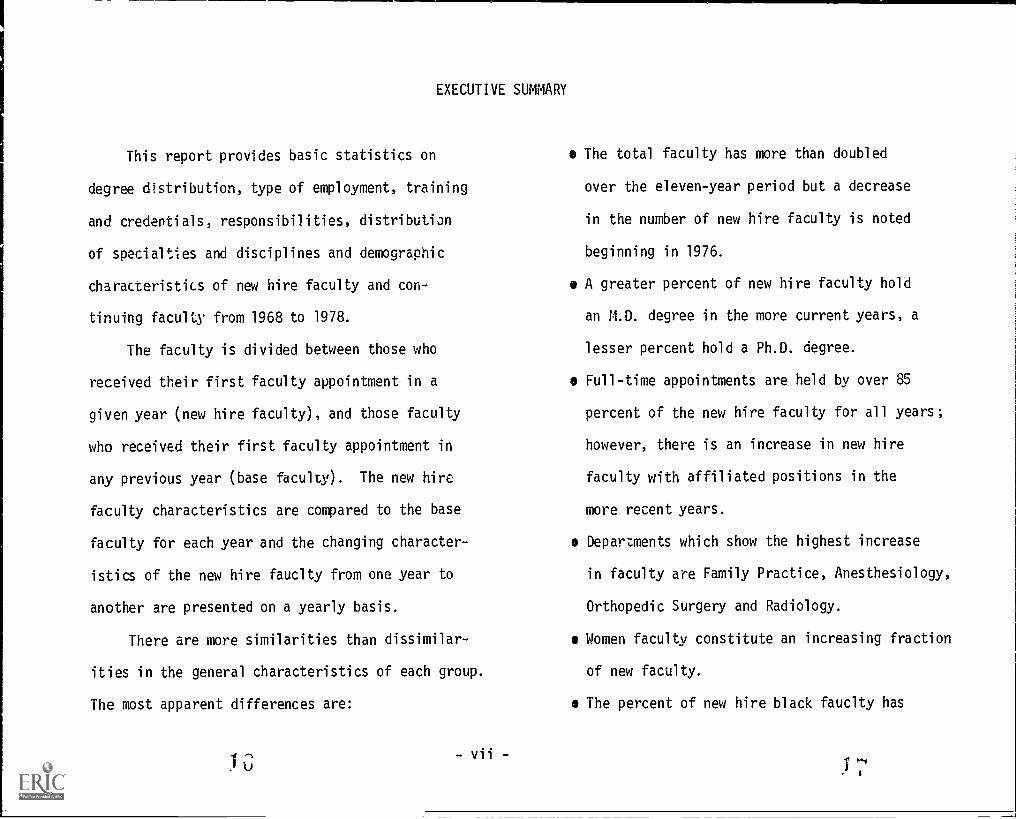
EXECUTIVE SUMMARY
This report provides basic statistics on
degree distribution, type of employment, training
and credentials, responsibilities, distribution
of specialties and disciplines and demographic
characteristics of new hire faculty and con-
tinuing faculty from 1968 to 1978.
The faculty is divided between those who
received their first faculty appointment in a
given year (new hire faculty), and those faculty
who received their first faculty appointment in
any previous year (base faculty). The new hire
faculty characteristics are compared to the base
faculty for each year and the changing character-
istics of the new hire fauclty from one year to
another are presented on a yearly basis.
There are more similarities than dissimilar-
ities in the general characteristics of each group.
The most apparent differences are:
The total faculty has more than doubled
over the eleven-year period but a decrease
in the number of new hire faculty is noted
beginning in 1976.
A greater percent of new hire faculty hold
an M.D. degree in the more current years, a
lesser percent hold a Ph.D. degree.
Full-time appointments are held by over 85
percent of the new hire faculty for all years;
however, there is an increase in new hire
faculty with affiliated positions in the
more recent years.
Departments which show the highest increase
in faculty are Family Practice, Anesthesiology,
Orthopedic Surgery and Radiology.
Women faculty constitute an increasing fraction
of new faculty.
The percent of new hire black fauclty has
decreased while the percent of new Asian
faculty has increased. Less than one percent
increases have occurred in the other minority
groups.
o Foreign new hires have increased and in 1976
comprised 20 percent of the new hire faculty.
o Research fellowships to M.D. new hire faculty
have decreased and research fellowships to
Ph.D. faculty have increased.
o Recruitment of new faculty at individual
schools has also substantially increased,
from an average of 20 new faculty per school
in 1968 to 30 new faculty per school in 1976.
o The retention rate of new hire faculty is
decreasing with over 30 percent departing
after 3 - 4 years.
INTRODUCTION
Activities have diversified over the past
thirty years at U.S. medical schools to meet the
additional responsibilities of the overall health
needs of the nation. The medical schools have
progressed from institutions 0 education to large,
complex medical centers. Not only have the schools
enlarged in scope but also in number. In 1968,
there were 99 accredited and provisionally accre-
dited medical schools and in 1978, this number
had increased to 125. During this same period of
time, undergraduate student enrollment increased
by 75% and salaried medical school faculty in-
creased from 27,996 in 1968 to 51,075 in 1978.
Since 1978 an additional medical school has en-
rolled its charter class,bringing the total num-
ber of medical schools in 1980 to 126.
The AAMC has prepared a series of descriptive
studies of the characteristics of medical school
1 a 1
faculty on an almost annual basis since 1975.
The most recent study, "Comparison of Character-
istics of U.S. Medical School Salaried Faculty
in the Past Decade, 1968-1978," was published
in 1979. The focus of the report was to com-
pare characteristics of the full-time faculty
over two points in time, 1968 and 1978.
The emphasis of the current report is fac-
ulty who have received their first medical school
appointment (New Hires) in the past eleven years
1968 through 1978. The objective is to com-
pare, with selected variables, the new faculty
to the base faculty for a given year. It is our
intention to note the similarities and dissimi-
larities among the new hires in each of the years
and for selected variables to contrast them with
the existing (Base) faculty.
For the total full-time salaried faculty,
A,
new hire and base, the report presents statistics
on demographic characteristics, educational
training and professional employment. For the
new hires, the report also contains data on the
retention rate and the employment distribution
by region and by public and private school.
The variables were selected to focus on the
similar and dissimilar characteristics of the
newly hired faculty versus the base faculty over
the past decade. They include the age of new
hire and base faculty; the gender of new hire and
base faculty; the percent of new hire and base
faculty by degree; by basic and clinical depart-
ment; location of degree, U.S. or foreign; by
teaching and research responsibility; the distri-
bution of the full-time M.D. new hire faculty by
length of time between receiving an M.D. degree
and a first appointment; length.of time new hire
members are remaining on the faculty at any
2
medical school; and the employment pattern of new
hire taculty, by region and by public and private
institution.
Medical school full-time faculty character-
istics have traditionally remained quite steady,
however, in this trend analysis, slight varia-
tions, which may or may not be significant for
the future, are noted. The Executive Summary
of this report highlights the most obvious indi-
cations of change.
It should be noted that data throughout the
study show an increase in new hires in 1973 that
is due to Mayo Medical School's change in status
that year. All of their faculty, regardless of
experience, received a first appointment' year of
1973.
22
All data reported in the study have been de-
rived from the AAMC Faculty Roster System. This
computer-based system, designed to collect data
on all salaried faculty at U.S. medical schools,
is the unique source of data on that population.
In addition to targeted studies such as this
report, the data base is used to generate:
reports to the medical schools on select-
ed data items, prepared annually or upon
request;
selected data for the Institutional Pro-
file System of AAMC;
responses to specific requests for infor-
mation from other offices of the Associa-
tion, as well as from outside agencies;
and
data for other national surveys.
METHODOLOGY
3
Data Collection Procedures
The Faculty Roster data base is a dynamic
system, continually updated to reflect the most
cum.._ status of medical school faculty. The
data base is maintained through voluntary parti-
cipation of the medical schools. Each school
appoints a faculty roster representative from
its staff. This representative reports informa-
tion on all salaried faculty at that school to
the Roster. (Volunteer faculty are reported at
the School's option.) The information reported
is acquired by administering special question-
naires on forms designed and provided by the
AAMC when a faculty member receives an initial
appointment, experiences a change in status with
respect to the data items collected for the
Roster, or becomes inactive. The forms are then
forwarded to the Faculty Roster staff at AAMC for
processing.
Upon receipt of the forms, the Faculty Roster
staff edits and codes the data and interactively
enters it onto the data base, thus initiating a
Faculty Roster record for each new faculty member
or updating a record for an existing faculty mem-
ber. Finally, the staff produces a form which dis-
plays the faculty member's record as it appears on
the data base and returns this form to the report-
ing school for its use in maintaining accurate
faculty records.
History of the Data Base
Faculty Roster data have been collected
since 1966. From 1966-1972, with the exception
of 1969-1970 when there was no collection, all
data were collected annually. Beginning in 1973,
the data collection process became a continuous
process, as described above.
254
The format of the questionnaire has also
changed since 1966. The first change occurred
in 1972 and the most recent in 1978. Copies of
both forms are in Appendix (D) of this report.
As a result of the 1978 format changes, a conver-
sion was performed on the data base in order that
all records would be in the new format. During
that process, some 5,000 pre-1972 records which
lacked initial appointment or termination dates
were purged from the system. These records had
been entered into the system prior to the exten-
sive editing process instigated in 1972 and did
not provide sufficient data for inclusion in
statistical analysis.
Validity of the Data Base
Although the Faculty Roster System is
designed to contain current data on all salaried
U.S. medical school faculty and all schools are
encouraged to report regularly, the currency and
completeness of the data from the schools vary.
Many schools do report all data regularly; others
report all data at irregular intervals; other
schools report only selected items or on select
faculty.
These reporting inconsistencies at any given
point in time result in varying degrees of accu-
racy and completeness in the master file. A study
conducted by the AAMC in 1977 to determine the
level of inconsistency in the Faculty Roster Sys-
tem found that:
As of 1977...the FRS contained informa-
tion for approximately 85 percent of the
population of salaried medical school fa-
culty in the United States. It has better
coverage for full-time faculty than for
part-time faculty....Finally, the infor-
mation carried by the FRS is approximately
95 percent accurate, with the highest
5
accuracy in demographic data and the
lowest accuracy in current activity
data items.*
Limitation of the Study
As this report is primarily concerned with
newly hired faculty for each of the eleven years,
the more current the year the less complete is
the data. In particular, twenty-three schools
have not reported their new faculty to the Roster
for 1978. For 1977 six schools did not report
any new faculty. Throughout the text, indica-
tions of this limitation are noted. Insofar as
can be determined, data is complete through 1976.
This limitation does not necessarily preclude
drawing inferences of trends in faculty charac-
teristics, since for most variables the distribu-
tions are not biased. It does serve to alert
*
"Estimates for Accuracy and Completeness ofAAMC Faculty Roster System Data," December 1977.
the reader, however, against the use of the report-
ed numbers as precise counts.
Data Selection and Processing
This study of the characteristics of newly
hired faculty was accomplished in multiple steps.
1) The data base, which is continually
changing through additions, updates, and deacti-
vations, was "rolled-back" to January 1 of the
years 1968 to 1978. This roll-back procedure,
developed for research purposes, was used to
build a roll-back file for each year of the study.
This procedure examined every faculty member on
the current data base, whether presently active
or inactive. If the individual was active on
January 1 of the year under study, that record
was included on that year's roll-back file and
examined more closely. If the individual had
transferred, changed departmental assignment,
received research training, etc. since the roll-
back date, the record was modified to appear on
the roll-back file as it actually had appeared
on January 1 of the target year.
2) After being identified and counted, all
volunteer faculty, faculty with invalid or incon-
sistent appointment da' , and all part-time sala-
ried faculty were excluded from further study
along with faculty whose part-time/full-time
status was unknown.
3) The remaining full-time salaried faculty
were divided into two groups: a) Base Faculty -
defined as those with a year of first appoint-
ment prior to the roll-back year and b) New Hires
- defined as those with a year of first appoint-
ment equal to the roll-back year.
4) Two corresponding sets of data items to
be studied were developed. The first was used in
studying the characteristics of New Hires com-
pared to Base Faculty for each roll-back year.
The second was used to study only the New Hires
for all of the roll-back years.
5) Study files were built containing only
these data items for the appropriate groups.
These files were then processed, using standard
statistical procedures.*
6) All tables and graphs were studied for
inferences which could be interpreted incorrectly
due to an artifact of the data collection proce-
dure and were formatted for consistency to pro-
vide the reader with ease of comparison.
7) The tables and graphs have been studied
to identify significant trends; the results of
this study provide the basis of the text for the
report.
*
Appendix C contains a chart showing thevariables which appear on each table and theaccession questionnaire item number from whichthe data were derived, and any conversions per-formed on the data.
7
I. OVERVIEW
Number and Employment Status of Total Faculty
The focus of this report are the individuals
who first joined a U.S. medical school faculty on
a full-time basis in the years 1968-69 through 1978-
79. In order to place this group of faculty in
context, data are also reported for faculty who
continued as full-time faculty in these same
years. Table 1 provides the total number of
active faculty, volunteer faculty, and salaried
full- and part-time faculty, for each of the years.
The number of active faculty in the 1968
academic year was 27,996. By 1978, this number
had grown to 51 075, an increase of 52.4 percent.
Although volunteer faculty may be a prominent
component source of the faculty at a number of
medical schools, they are not, in the majority of
cases, reported to the Faculty Roster. Therefore,
the small numbers shown on Table 1 are not repre-
9
3 2
sentative of the actual number of volunteer
faculty at medical schools. These volunteer
faculty and the faculty for whom data were in-
valid or inconsistent are excluded hereafter
from this report.
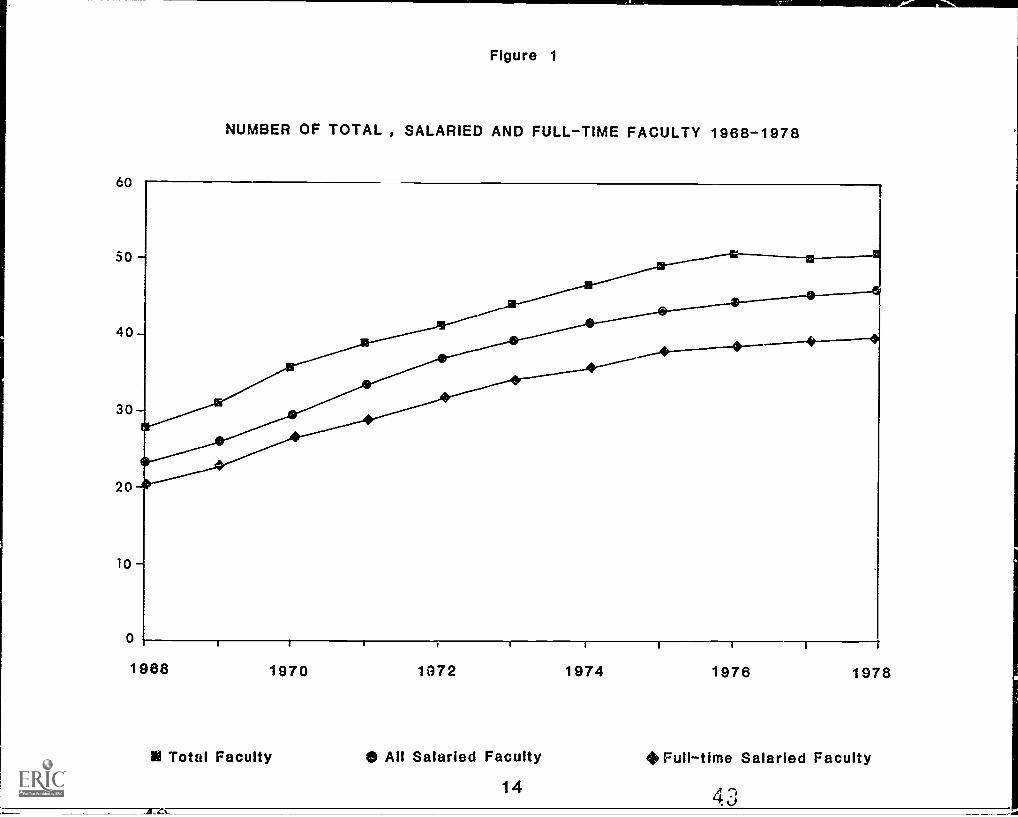
Figure 1 shows the leveling off of total
full-time salaried faculty and Figure 2 shows an
apparent decline in the percent of new hire faculty
being appointed at medical schools since 1975.*
Part-time new hire faculty at the medical
schools comprised 11.2 percent of the total salaried
new hire faculty in 1968 and increased to 14.6 per-
cent of the total new hire faculty in 1975. (Table
2) The years 1976, 1977 and 1978 show a decline,
however this may be a 1,2sult of the lack of reporting
*Data from the medical schools reportingnewly hired faculty is not as complete for 1977or 1978 as it is for previous years, and thetrends may be exaggerated by this artifact.
by the schools. The increase in the number of
part-time faculty from 1968 to 1978 is 2,362.
Volunteer faculty are only reported to the
Roster for a dozen schools, therefore no analysis
of that group is feasible. However, even within
this small group of reporting schools, the increase
is easily noted from approximately 400 volunteer
faculty in 1968 to over 2,000 in 1978. (Table 1)
Table 1 provides the number of part-time
faculty by year and Table 2 provides the number
and percent of the part-time faculty by the nature
of their employment -- salaried by the medical
school or an affiliated institution.
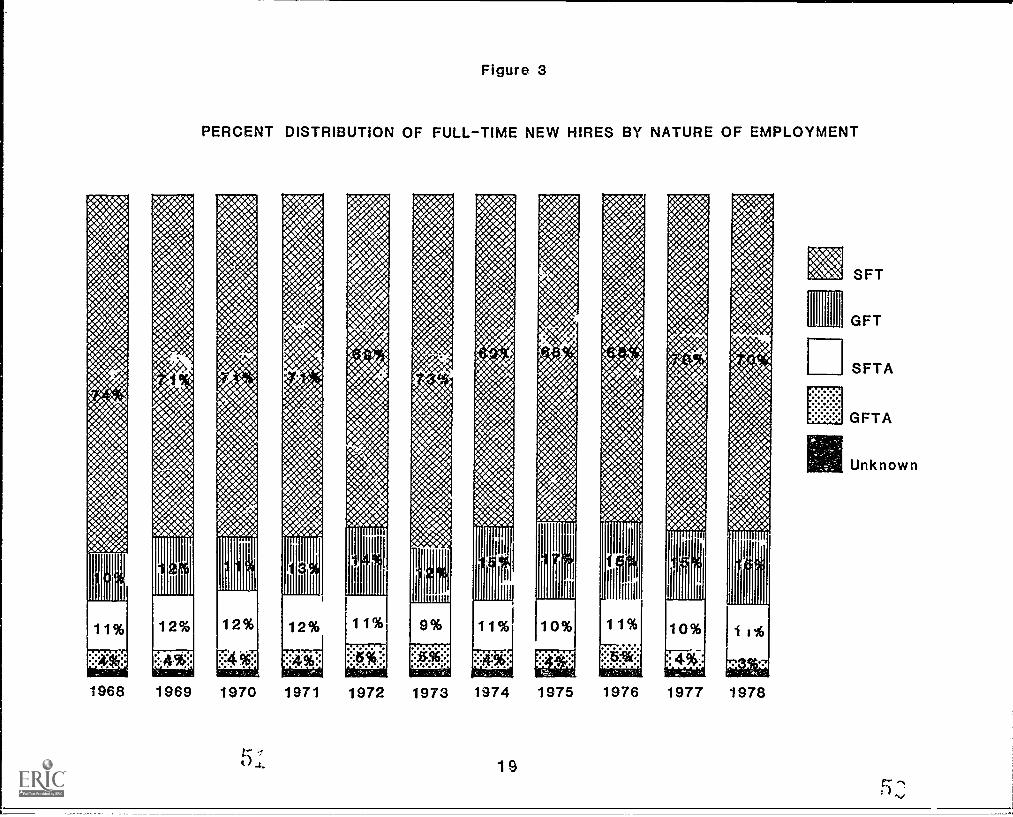
Nature of Employment of New Hire Faculty
Table 3 shows the distribution of the full-
time new hire faculty by their nature of employ-
ment at the medical school. There has been very
little change in the distribution of faculty
appointments in strict full-time or geographic
full-time categories, but more of the strict full-
- 10 -
time faculty have been appointed at affiliated in-
stitutions in recent years. These strict 'fall-
time affiliated" faculty appointments were only
10.3 percent of new appointments in 1968, but 15.0
percent in 1978. (Figure 3)
Rank Distribution of New Hire, Base and Total Faculty
Because historical data on rank have not been
maintained in the data base until recently, it is
impossible to review trends in faculty rank, thus,
there is only one table (Table 4) and one figure
(Figure 4) in this report that provide rank infor-
mation. The rank distribution of the total faculty,
base faculty and that of the newly hired faculty is
shown for 1977-78.
Degree Distribution of New Hire and Base Faculty
The distribution of full-time new hire and
base faculty by their highest degree is displayed
in Table 5. The M.D./Ph.D. group of faculty has
increased from 3.6 percent of the new hire faculty
in 1968 to 4.6 percent in 19i8, while the M.D./Ph.D.
R U
base faculty has slowly decreased. M.D. faculty
were 52.9 percent of new hires in 1968, 64.2 per-
cent in 1976 and 62.3 percent in 1977. However,
M.D. base faculty were 59.8 percent of existing
faculty in 1968 and in 1977 they were 58.8 per-
cent with little variation in the intervening years.
Therefore, it would appear that new hire M.D.
faculty are replacing departing M.D. faculty, as
opposed to increasing the percent of faculty who
are M.D.'s. (As mentioned in the Note to the
Reader, 1973 shows, throughout this study, a rise
in M.D. statistics due to the entrance of Mayo
Medical School in that year.)
Ph.D. faculty have made up approximately one-
fourth of new faculty over the entire time period,
however, the fraction of new hires with a Ph.D.
has declined slightly over the period from 1968
to 1978. The fraction of base faculty with a
Ph.D. has increased slowly over the same period.
The new hire Ph.D.'s are increasing the total
number of Ph.D. faculty and not just replacing
Ph.D. faculty who have terminated. (Figure 5)
There has been a relative decline in non-
doctoral full-time new hire faculty from a high
of 13.3 percent in 1968 to 9.9 percent in 1978.
Departmental Distribution of New Hire and
Base Faculty
The departmental distribution of full-time
new hire and base faculty is shown on Table 6.
The percent of new hire and ,rase faculty for all
basic departments has shown a consistent decline
over the eleven-year period.
In the clinical departments Family Practice
shows a substantial increase in the percentage of
new hires and base faculty as increased emphasis
was place on it after it became a certifiable
specialty in 1970.
To examine overall departmental growth, the
following table provides the difference in the
number of faculty within a department in 1968
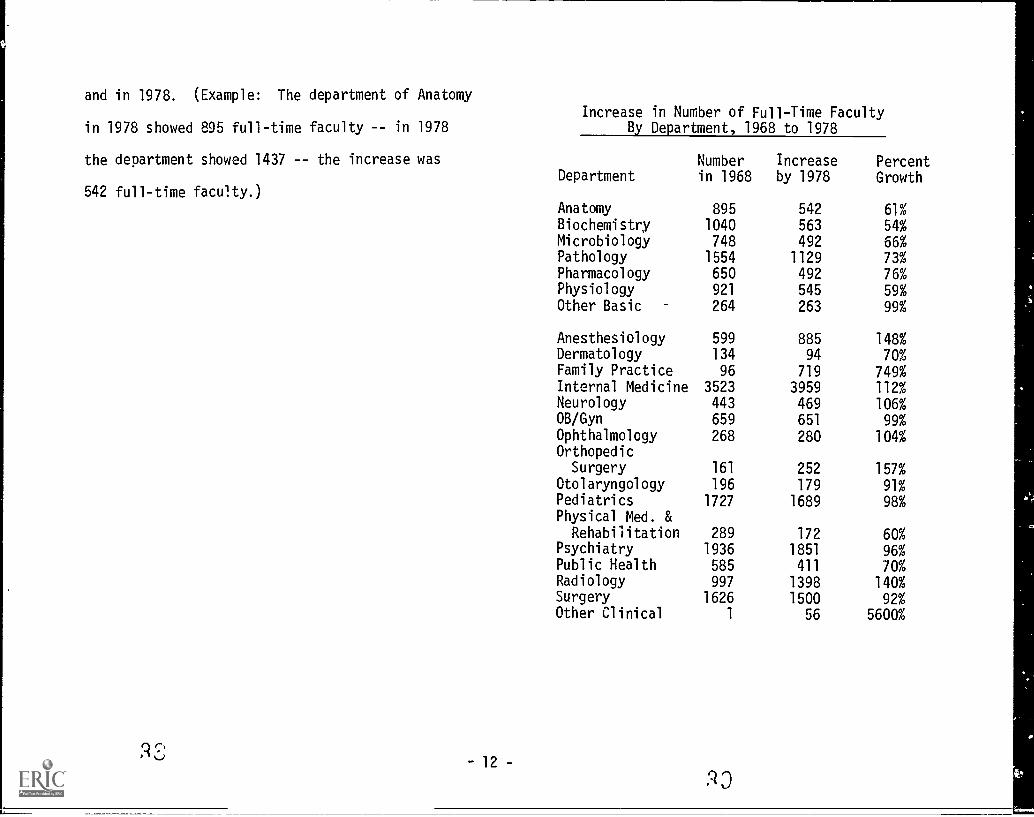
and in 1978. (Example: The department of Anatomy
in 1978 showed 895 full-time faculty -- in 1978
the department showed 1437 -- the increase was
542 full-time faculty.)
12 -
Increase in Number of Full-Time FacultyBy Department, 1968 to 1978
DepartmentNumber Increase Percentin 1968 by 1978 Growth
Anatomy 895Biochemistry 1040Microbiology 748Pathology 1554Pharmacology 650Physiology 921
Other Basic 264
Anesthesiology 599Dermatology 134Family Practice 96
Internal Medicine 3523Neurology 443OB/Gyn 659Ophthalmology 268OrthopedicSurgery 161
Otolaryngology 196Pediatrics 1727Physical Med. &Rehabilitation 289
Psychiatry 1936Public Health 585Radiology 997Surgery 1626Other Clinical 1
`,0
542 61%563 54%492 66%
1129 73%492 76%545 59%
263 99%
885 148%
94 70%719 749%
3959 112%469 106%
651 99%
280 104%
252 157%
179 91%1689 98%
172 60%1851 96%411 70%
1398 140%1500 92%
56 5600%
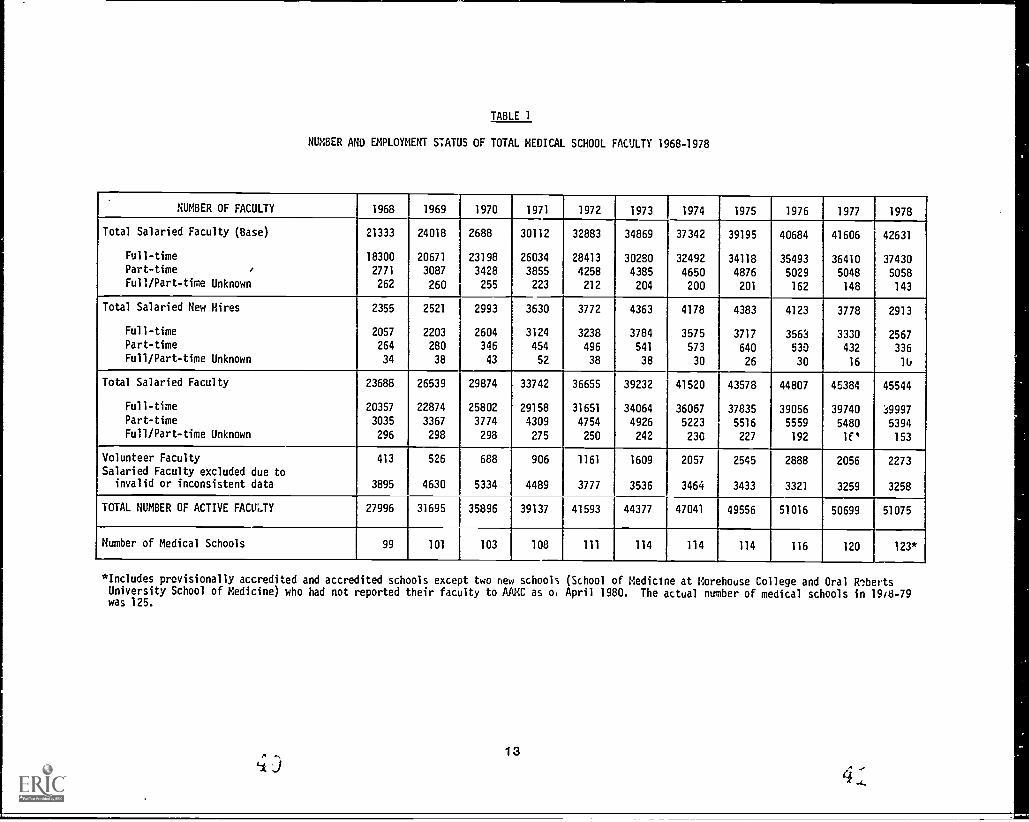
TABLE 1
NUMBER AND EMPLOYMENT STATUS OF TOTAL MEDICAL SCHOOL FACULTY 1968-1978
NUMBER OF FACULTY 1968 1969 1970 1971 1972 1973 1974 1975 1976 1977 1978
Total Salaried Faculty (Base) 21333 24018 2688 30112 32883 34869 37342 39195 40684 41606 42631
Full-time 18300 20671 23198 26034 28413 30280 32492 34118 35493 36410 37430Part-time / 2771 3087 3428 3855 4258 4385 4650 4876 5029 5048 5058Full/Part-time Unknown 262 260 255 223 212 204 200 201 162 148 143
Total Salaried New Hires 2355 2521 2993 3630 3772 4363 4178 4383 4123 3778 2913
Full-time 2057 2203 2604 3124 3238 3784 3575 3717 3563 3330 2567Part-time 264 280 346 454 496 541 573 640 530 432 336Full/Part-time Unknown 34 38 43 52 38 38 30 26 30 16 11.
Total Salaried Faculty 23686 26539 29874 33742 36655 39232 41520 43578 44807 45384 45544
Full-time 20357 22874 25802 29158 31651 34064 36067 37835 39056 39740 a9997Part-time 3035 3367 3774 4309 4754 4926 5223 5516 5559 5480 5394Full/Part-time Unknown 296 298 298 275 250 242 230 227 192 lfl 153
Volunteer Faculty 413 526 688 906 1161 1609 2057 2545 2888 2056 2273Salaried Faculty excluded due to
invalid or inconsistent data 3895 4630 5334 4489 3777 3536 3464 3433 3321 3259 3258
TOTAL NUMBER OF ACTIVE FACUM 27996 31695 35896 39137 41593 44377 47041 49556 51016 50699 51075
Number of Medical Schools 99 101 103 108 111 114 114 114 116 120 123*
*Includes provisionally accredited and accredited schools except two new schools (School of Medicine at Morehouse Co lege and Oral 11,bertsUniversity School of Medicine) who had not reported their faculty to AAMC as o, April 1980. The actual number of medical schools in 19/8-79was 125.
LI)13
4:
60
Figure 1
NUMBER OF TOTAL , SALARIED AND FULL -TIME FACULTY 1968-1978
1968 1970 1072 1974
II Total Faculty
1976 1978
0 All Salaried Faculty *Full-time Salaried Faculty
14 43
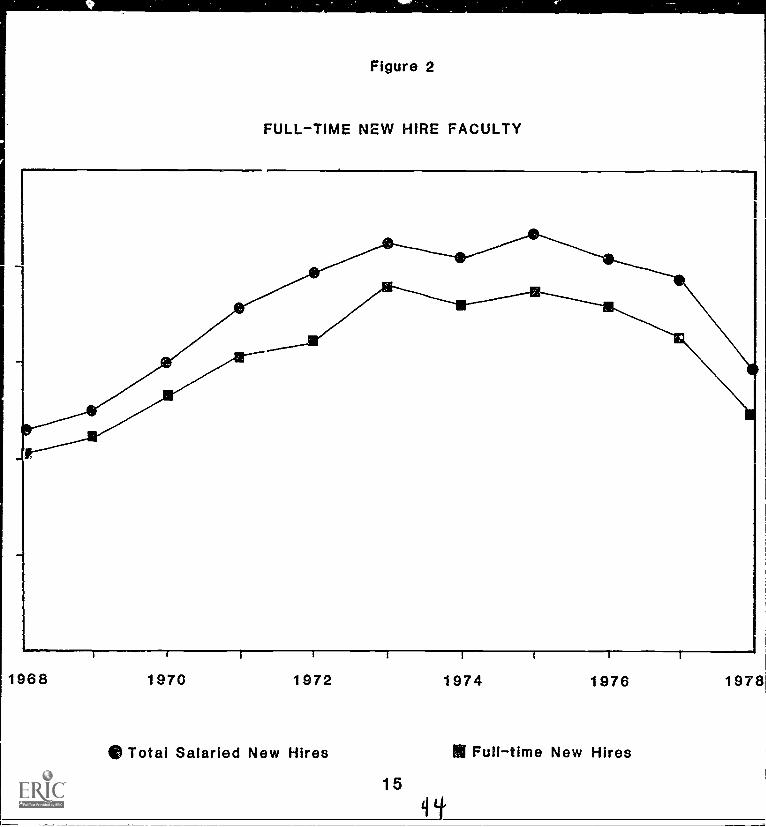
Figure 2
FULL -TIME NEW HIRE FACULTY
I I I I I I I I
1968 1970 1972 1974 1976 1978
0 Total Salaried New Hires illi Full-time New Hires
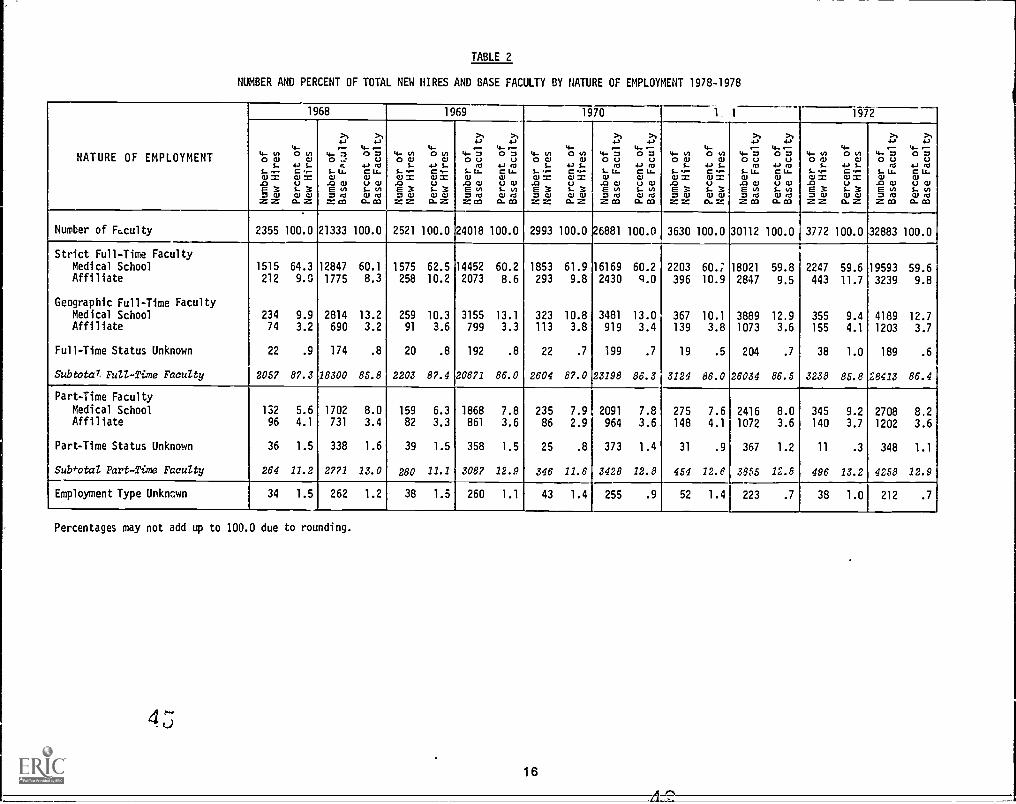
TABLE 2
NUMBER AND PERCENT OF TOTAL NEW HIRES AND BASE FACULTY BY NATURE OF EMPLOYMENT 1978-1978
NATURE OF EMPLOYMENT
1968 1969 1970 1 1 1972
4..4/1o alI..L..-as
JoE 37WZZ
OWa,
+Jr..c--as(.)S- 3WW0.Z
4..73o'it'.
s..u.wJawEvs7,15=ea
467U44mcu.
wuwi. vsWrcs0.M
4..WOW
I..s....-asJoE37WZZ
tWW
4.'1..c,-as(.)S- 3WW0.Z
4..SOUm
s..u.wJawEvs7r0ZM
tSU
4..,mcu.wuwS- vsaims0.M
4...OWI..
s....-asJoE37WZZ
t.w
+J r..c,..-asc.)S- 3WW0.Z
4..SOUm
$..u.wJawEvs7r0ZM
OSU
4..,mcu.wuwi. vsaims0.M
4...OW$s..,-as
JoE:i:7WZZ
t.w
+J r..c,--asc.)i. 3WW0.Z
4..SOUm
s..u.wJawEvs7r0ZM
OSc.)
4..,mcu.wuwS- vs(lira0.M
4...0 wI..s...,as
JoE37WZZ
t.w
+J r..c..-asc.)S- 3WW0.Z
>,4.,
4.-S0 um
s..u.wJawEvs7,0ZM
4.,>,
OSc.)
4..,mcu.wuwi. vsWrcsam
Number of Faculty 2355 100.0 21333 100.0 2521 100.0 24018 100.0 2993 100.0 26881 100.0 3630 100.0 30112 100.0 3772 100.0 32883 100.0
Strict Full-Time FacultyMedical School 1515 64.3 12847 60.1 1575 62.5 14452 60.2 1853 61.9 16169 60.2 2203 60.; 18021 59.8 2247 59.6 19593 59.6Affiliate 212 9.0 1775 8.3 258 10.2 2073 8.6 293 9.8 2430 q.0 396 10.9 2847 9.5 443 11.7 3239 9.8
Geographic Full-Time FacultyMedical School 234 9.9 2814 13.2 259 10.3 3155 13.1 323 10.8 3481 13.0 367 10.1 3889 12.9 355 9.4 4189 12.7Affiliate 74 3.2 690 3.2 91 3.6 799 3.3 113 3.8 919 3.4 139 3.8 1073 3.6 155 4.1 1203 3.7
Full-Time Status Unknown 22 .9 174 .8 20 .8 192 .8 22 .7 199 .7 19 .5 204 .7 38 1.0 189 .6
Subtotal Full-Time Faculty 2057 87.3 18300 85.8 2203 87.4 20671 86.0 2604 87.0 23198 86.3 3124 86.0 26034 86.5 3238 85.8 28413 86.4
Part-Time Faculty
Medical School 132 5.6 1702 8.0 159 6.3 1868 7.8 235 7.9 2091 7.8 275 7.6 2416 8.0 345 9.2 2708 8.2Affiliate 96 4.1 731 3.4 82 3.3 861 3.6 86 2.9 964 3.6 148 4.1 1072 3.6 140 3.7 1202 3.6
Part-Time Status Unknown 36 1.5 338 1.6 39 1.5 358 1.5 25 .8 373 1.4 31 .9 367 1.2 11 .3 348 1.1
Subtotal Part -Time Faculty 264 11.2 2771 13.0 280 11.1 3087 12.9 346 11.6 3428 12.8 454 12.6 3855 12.8 496 13.2 4258 12.9
Employment Type Unknown 34 1.5 262 1.2 38 1.5 260 1.1 43 1.4 255 .9 52 1.4 223 .7 38 1.0 212 .7
Percentages may not add up to 100.0 due to rounding.
4 3
16
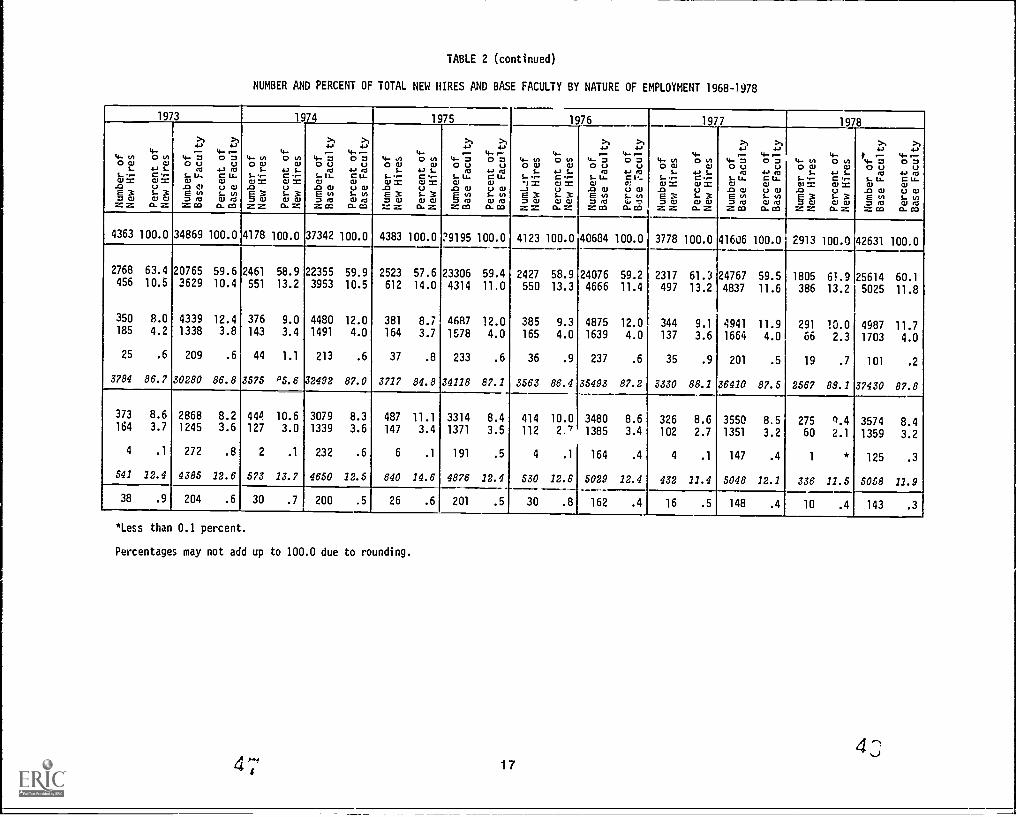
TABLE 2 (continued)
NUMBER AND PERCENT OF TOTAL NEW HIRES AND BASE FACULTY BY NATURE OF EMPLOYMENT 1968-1978
1973 1974 1975 1976 1977 1978
ooS-
5....-0) =.0E X= t1.1==
40 0co
4-1 S-C .-0) =US. 3CU WC.
4.,
4- 700 u
MS.. 1.4.0).0 0E to7 0:1
=CO
v- 70U
4-, raC Lc.0)U CUs. vb01 ICIC.
4-noo,
1.S.. ..-0) =.0E 37 W==
40 0W
4-1 S..0 r-0) =UI- 30.1 W0.=
4-700 Ura
S.. Is.01.0 4)E NI7 ICI=CO
4;7 7U
4-1 raC Lc.wU CUS. 0W fa
C.
4- o0 CL)
S-S.. et-0) =.0E 37 C11.1==
48 oW
4-1 S..C .-0) =S.)S. 30) 01
Q.
4- 7;0 Ura
S.. Lc.w
.0 0.1E NI7 ICI
=CO
4E; SU
4-1 raC Lc.CUU CUS. vbW fa
Q.
4-n0 WS..
S.. .-") =JE 37 W==
48 0W
4-1 S..C of-CU =US. 30) 0)
Q.
4- 7;0 U
raS.. Lc.0)
.0 CUE vb7 ra=CO
1;7;U
4-1 raC I-OSs.) 01s. vb,44 7"
Q.
4-v0 0.1
S..S......0) =.0E 37 W==
4,; 00)
.44 S..C .-a12s..)S.. 3cl) W
Q.
4-,
4- 7;0 Ura
S- Lc.CI)
.0 0.)E vb7 ra
=OD
1;7;U
4-1 r0C Lc.wU 01S. vbW ra
Q.
4-n0 CI)
1.-S.. 1-01Z.0E 37 W==
48 0114
4-1 1.-C or-0) =US. 301 WO.=
04.. r;0 U
eVt. Lc.CI).0 0.1E vb7 ra=CO
1;7;U
4-1 r0C Lc.CI)U 0)s. vb01 ra0.00
4363 100.0 34869 100.0 4178 100.0 37342 100.0 4383 100.0 ?9195 100.0 4123 100.0 40684 100.0 3778 100.0 41606 100.0 2913 100.0 42631 100.0
2768
456
350
185
25
3784
63.4
10.5
8.0
4.2
.6
86.7
207653629
4339
1338
209
30280
59.610.4
12.4
3.8
.6
86.8
2461
551
376
143
44
3575
58.9
13.2
9.0
3.4
1.1
P5.6
223553953
44801491
213
132492
59.9
10.5
12.0
4.0
.6
87.0
2523
612
381
164
37
3717
57.6
14.0
8.7
3.7
.8
84.8
23306
4314
46871578
233
34118
59.4
11.0
12.0
4.0
.6
87.1
2427
550
385
165
36
3563
58.9
13.3
9.3
4.0
.9
86.4
240764666
48751639
237
35493
59.2
11.4
12.0
4.0
.6
87.2
2317
497
344
137
35
3330
61.313.2
9.1
3.6
.9
88.1
24767
4837
4941
1664
201
36410
59.5
11.6
11.9
4.0
.5
87.5
1805386
291
66
19
2567
61.913.2
10.0
2.3
.7
88.1
25614
5025
4987
1703
101
37430
60.1
11.8
11.7
4.0
.2
87.8
373
164
4
541
8.63.7
.1
12.4
28681245
272
4385
8.23.6
.8
12.6
444127
2
573
10.63.0
.1
13.7
30791339
232
4650
8.3
3.6
.6
12.5
487
147
6
640
11.1
3.4
.1
14.6
3314
1371
191
4876
8.4
3.5
.5
12.4
414
112
4
530
10.0
2.7
.1
12.8
3480
1385
164
5029
8.6
3.4
.4
12.4
326
102
4
432
8.6
2.7
.1
11.4
35501351
147
5048
8.5
3.2
.4
12.1
275
60
1
336
9.4
2.1
*
11.5
3574
1359
125
5058
8.43.2
.3
11.9
38 .9 204 .6 30 .7 200 .5 26 .6 201 .5 30 .8 162 .4 16 .5 148 .4 10 .4 143 .3
*Less than 0.1 percent.
Percentages may not add up to 100.0 due to rounding.
17
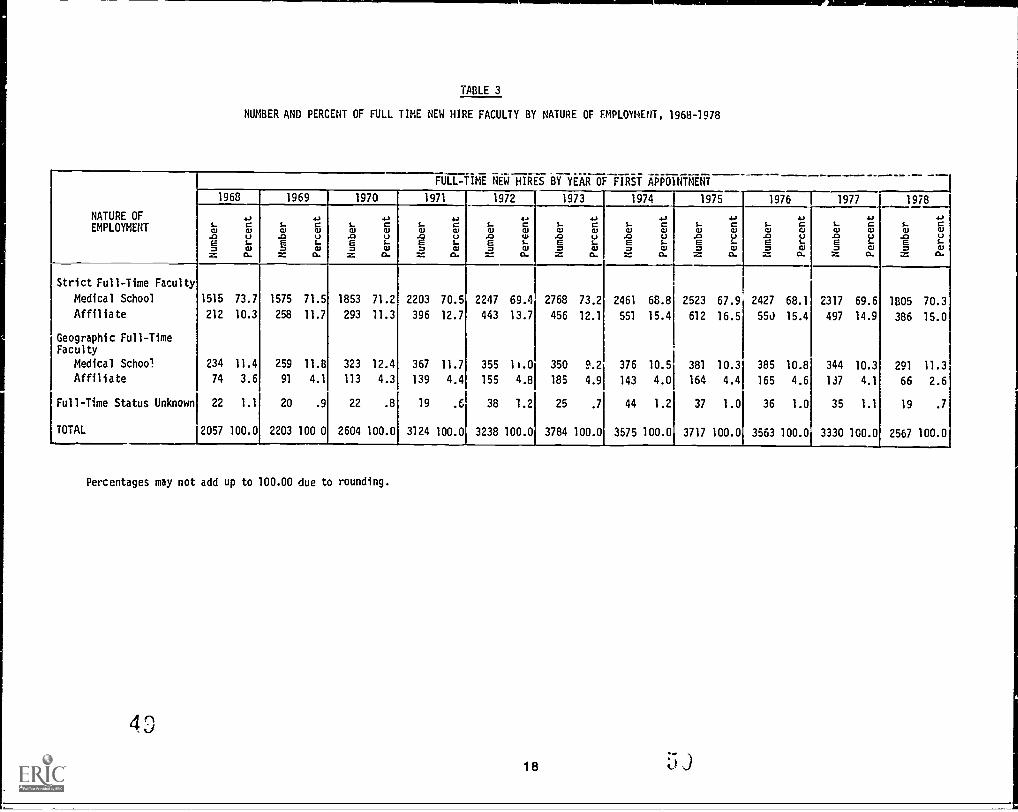
TABLE 3
NUMBER AND PERCENT OF FULL TIME NEW HIRE FACULTY BY NATURE OF EMPLOYMENT, 1968-1978
FULL-TIME NEW HIRES BY YEAR OF FIRST APPOINTMENT
1968 1969 1970 1971 1972 1973 1974 1975 1976 1977 1978
NATURE OF 4., 4a 4-) 4, 44 4a 4. 4 4a 4.1 4.1
EMPLOYMENT 1...
ClcCl
1...
ClcCl
s_Cl
cCl
s_Cl
cQ)
s_Cl
cCl
1...
ClcC)
1...
ClcCl
s_Cl
cCl
s_C)
cC)
s_C)
cCl
s_C)
Ca)
.ta C.) .0 L) .0 I.) .0 I.) .0 U) .0 1.) .0 LI .a C.) .0 LI .0 LI .a UE
Sal E kl seriE
17 2 seriE
seri g scr,E
sE, g C) g ser,E
ser,Z e. Z G._I
13.. Z O. e. z e. - e. :rez e. z e. z e. = 6.
Strict Full-Time Faculty
Medical School 1515 73.7 1575 71.5 1853 71.2 2203 70.5 2247 69.4 2768 73.2 2461 68.8 2523 67.9 2427 68.1 2317 69.6 11305 70.3
Affiliate 212 10.3 258 11.7 293 11.3 396 12.7 443 13.7 456 12.1 551 15.4 612 16.5 55J 15.4 497 14.9 386 15.0
Geographic Full-TimeFaculty
Medical School 234 11.4 259 11.B 323 12.4 367 11.7 355 11.0 350 9.2 376 10.5 381 10.3 385 10.8 344 10.3 291 11.3
Affiliate 74 3.6 91 4.1 113 4.3 139 4.4 155 4.8 185 4.9 143 4.0 164 4.4 165 4.6 137 4.1 66 2.6
Full-Time Status Unknown 22 1.1 20 .9 22 .8 19 .6 38 1.2 25 .7 44 1.2 37 1.0 36 1.0 35 1.1 19 .7
TOTAL 2057 100.0 2203 100 0 2604 100.0 3124 100.0 3238 100.0 3784 100.0 3575 100.0 3717 100.0 3563 100.0 3330 100.0 2567 100.0
Percentages may not add up to 100.00 due to rounding.
4
18 5
se
01
Migri -
este:4 -04411,
=----
r
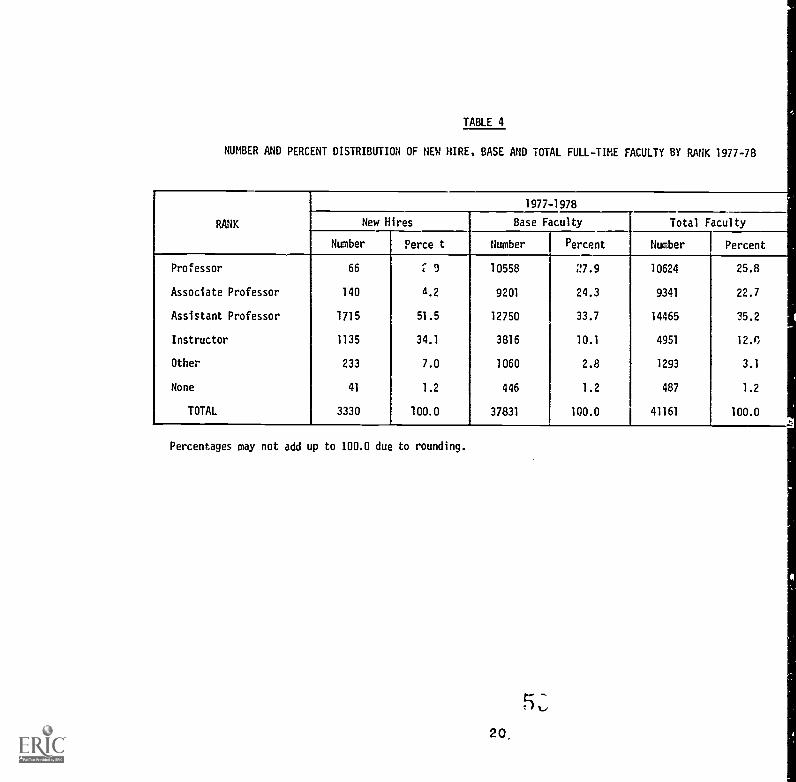
TABLE 4
NUMBER AND PERCENT DISTRIBUTION OF NEW HIRE, BASE AND TOTAL FULL-TIME FACULTY BY RANK 1977-78
RANK New Hires
Number Perce t
Professor 66 9
Associate Professor 140 4.2
Assistant Professor 1715 51.5
Instructor 1135 34.1
Other 233 7.0
None 41 1.2
TOTAL 3330 100.0
1977-1978
Base Faculty Total Faculty
Number Percent Number Percent
10558 27.9 10624 25.8
9201 24.3 9341 22.7
12750 33.7 14465 35.2
3816 10.1 4951 12.E
1060 2.8 1293 3.1
446 1.2 487 1.2
37831 100.0 41161 100.0
Percentages may not add up to 100.0 due to rounding.
20
Rank Distribution of Full-Time New Hires 1977-1978
Figure 4
Rank Distribution of Base Full-Time Faculty 1977-1978
Rank Distribution of Total Full-Time Faculty1977-1978
2i 1jj
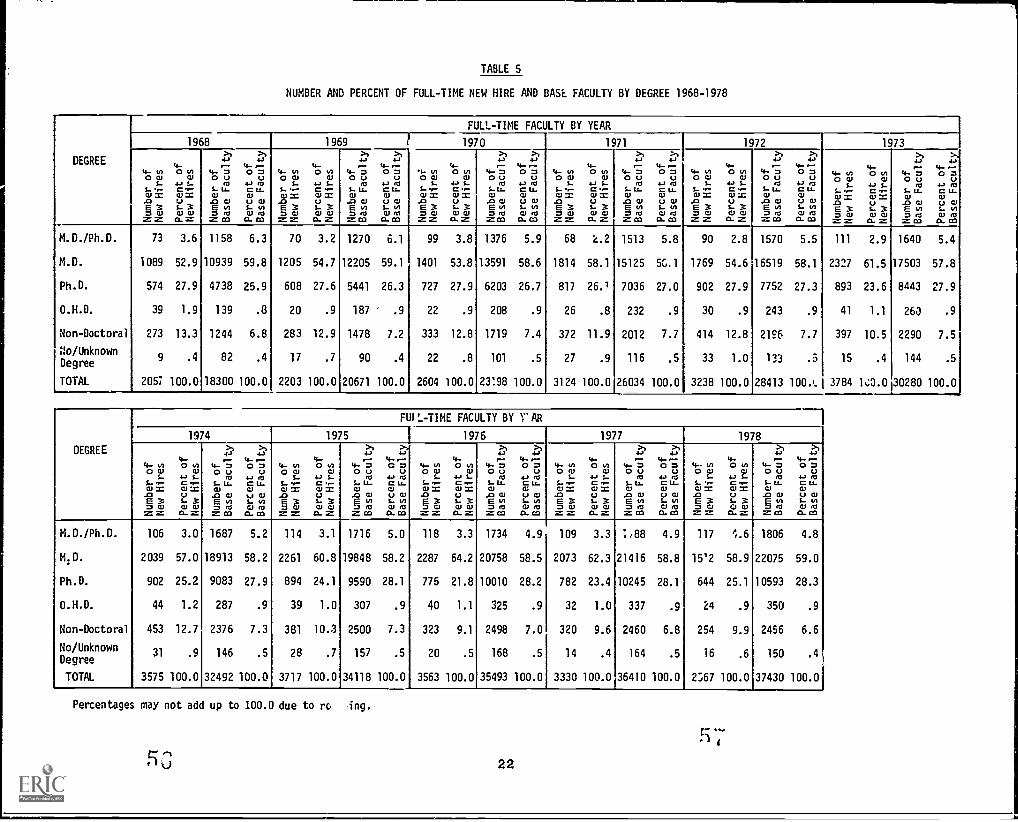
TABLE 5
NUMBER AND PERCENT OF FULL-TIME NEW HIRE AND BASE FACULTY BY DEGREE 1968-1978
DEGREE
FULL-TIME FACULTY BY YEAR
1968 1969 1970 1971 1972 1973
4-o0 Cl
L.1. PCl =..taEX7 OJzz
toCl
4/ S.C .-Cl =t.,1-3Cl Wta.z
4-S0 u
03S- LL.Cl-owEm7 M=co
OSV
4/ 03C LL.Cl(Jo,s-oCl Mam
4-oOWS..S...-
Cl =..taE37 OJzz
to0.1
4/ 1.C -Cl =us-XCl Wta.z
4-OLJ
031. LL.Cl
..ma,Ew= 03=co
tSV
43 03C LL.ClV Cls-oCl MIam
.4-oOW
1.S- ..-Cl =
XIEX7 0.1zz
to0.14/ 1.C r-
Cl =Vs-XCl Wta.z
4-OLJ
03S.. LL.Cl
.0 ClEw7 03
= CO
t.;V
4/ 03C LL.ClV Cls-oCl M
0. CO
4-oOW
S..S. r-Cl =
CIEX7 OJ==
to0.14/ 1.C r-
Cl =Vs...
Cl WO. =
4-OLJ
031. LL.Cl.0 ClEw7 03
= CO
t';(3
4/ 03C LL.ClV Cls-oCl 03
0. CO
4...OWS..
S. r-Cl =
JaEX7 OJ==
t.Cl
4/ 1.C r-Cl =Vs-XCl WO. =
4-OLJ
031. LL.Cl.0 ClE07 03
=. CO
tS.V4/ M
C LL.0.1V Cls-oCl M0. CO
4...,OW
s.s...,_.aj=
.c,Ex, a)==
"au,C.43 s..a .,-cu=ux
Cl a)a. =
4..;lou,,,,s. u.
a,j3 cyE,,,,= ,,= pa
1,-;u43 mia LL.a,u cuCl ,,,,
cy. co
M.D./Ph.D. 73 3.6 1158 6.3 70 3.2 1270 6.1 99 3.8 1376 5.9 68 2.2 1513 5.8 90 2.8 1570 5.5 111 2.9 1640 5.4
M.D. 1089 52.9 10939 59.8 1205 54.7 12205 59.1 1401 53.8 13591 58.6 1814 58.1 15125 5G.1 1769 54.6 16519 58.1 2327 61.5 17503 57.8
Ph.D. 574 27.9 4738 25.9 608 27.6 5441 26.3 727 27.9 6203 26.7 817 26.1 7036 27.0 902 27.9 7752 27.3 893 23.6 8443 27.9
0.H.D. 39 1.9 139 .8 20 .9 187 .9 22 .9 208 .9 26 .8 232 .9 30 .9 243 .9 41 1.1 260 .9
Non-Doctoral 273 13.3 1244 6.8 283 12.9 1478 7.2 333 12.8 1719 7.4 372 11.9 2012 7.7 414 12.8 2195 7.7 397 10.5 2290 7.5
No/UnknownDegree
9 .4 82 .4 17 .7 90 .4 22 .8 101 .5 27 .9 116 .5 33 1.0 133 .5 15 .4 144 .5
TOTAL 2057 100.0 18300 100.0 2203 100.0 20671 100.0 2604 100.0 23198 100.0 3124 100.0 26034 100.0 3238 100.0 28413 100.1., 3784 13.0 30280 100.0
DEGREE
F IL-TIME FACULTY BY ;"'AR
1974 1975 1 1976 1977 1978
4...0 Cl
S..3.....al=.0E3=as==
tmW4/ 1.C-
0.17.0V1-3CI CI0.=
4-0 LJ
033.. LL.WXi ClEw=ro=CO
t'L!V
4/ 03C LL.Cls/ Cls-mwm0.03
4..0 Cl..3...r-al=XiE3=sis==
t.W
4/ S.C /1112VwwC31
CU=
4.'4-2' t'L:0 LJ V
03 4/ 03Soy Lt.. C ii,.CD 0.1
Xi Cl V Cls.-0
.am wm=CO 0.03
4..0 Cl
S..S..fil=
Jagxzw==
t.W4/ 1.Cral=
Vs-xwwCU=
4.'1.!0 LJ
e3S.. Li-CD
Xi ClEul=ro=CO
ti'V
4/ 03C4.CU
V Cls-0Wm0.03
4..0 01
S.... ..-al=
.0E3=sis==
t.W
4/ S-CV=Vs-XCl C31
CU=
4.4-!0 LJ
03S.. Li-CD
Xi ClE0=ro=CO
t'4-:'V
4/ 03C LL.CD
V Cl1-0wmMM
4-00 W
S-S.. r-W=/3EX=c,==
t.fil
4/ S-CrW=Vs-X(JOCU=
4.4.!0 LJ
03S.. LL.CUXi OJE0703=CO
464-2'V4 03CU.
CVV Cls-0WMcum
M.D./Ph.D. 106 3.0 1687 5.2 114 3.1 1716 5.0 118 3.3 1734 4.9 109 3.3 1,88 4.9 117 1.6 1806 4.8
M:D. 2039 57.0 18913 58.2 2261 60.8 19848 58.2 2287 64.2 20758 58.5 2073 62.3 21416 58.8 15'2 58.9 22075 59.0
Ph.D. 902 25.2 9083 27.9 894 24.1 9590 28.1 775 21.8 10010 28.2 782 23.4 10245 28.1 644 25.1 10593 28.3
0.H.D. 44 1.2 287 .9 39 1.0 307 .9 40 1.1 325 .9 32 1.0 337 .9 24 .9 350 .9
Non-Doctoral 453 12.7 2376 7.3 381 10.3 2500 7.3 323 9.1 2498 7.0 320 9.6 2460 6.8 254 9.9 2456 6.6
No/UnknownDegree
31 .9 146 .5 28 .7 157 .5 20 .5 168 .5 14 .4 164 .5 16 .6 150 .4
TOTAL 3575 100.0 32492 100.0 3717 100.0 34118 100.0 3563 100.0 35493 100.0 3330 100.0 36410 100.0 27,67 100.0 37430 100.0
Percentages may not add up to 100.0 due to rc ing.
5C 22
BASE FACULTY
Figure 5
FULL TIME FACULTY BY DEGREE TYPES
1968
6% 7%
NEW FACULTY
53%
26%
1976
...................
..........................
...............................
................................................................................................
23
28%
22%
M.L.
....Ph.D.
M.D./Ph.D.
O.H.D.
NonDoctoral
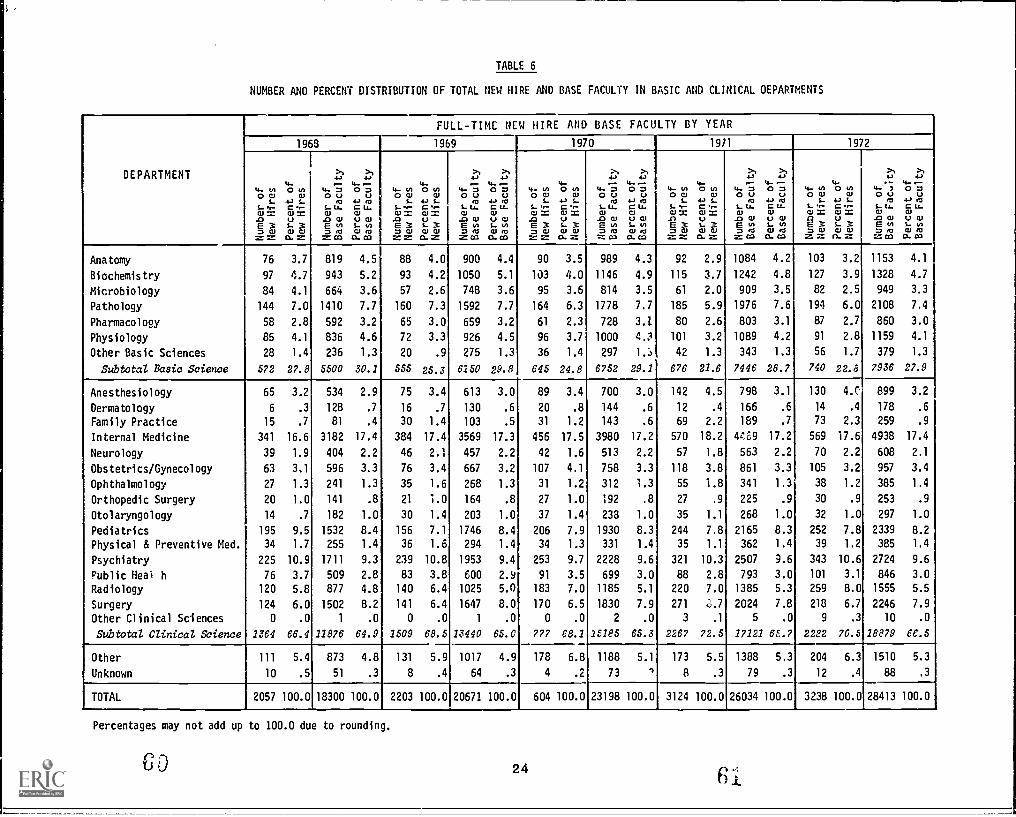
TABLE 6
NUMBER ANO PERCENT DISTRIBUTION OF TOTAL NEW HIRE AND BASE FACULTY IN BASIC AND CLINICAL OEPARTMENTS
I
FULL-TIME NEW HIRE AND BASE FACULTY BY YEAR
DEPARTMENT
1968 1969 1970 19)1 1972
in0 alS..
M.0E 3waszz
0 in4.)C *,C1=L 3wasoz
4-0 aS-
.0WEwm=co
4.>
0 7CUwLwmo. co
0 WVI,
.0E 3waszz
04->C
ML 3wasa.=
4.)
4- 70M
LW.U.00Ewm=co
4.)
0 74-> MCLL.Cl
ClLwm0. co
4.-0 VI
S- S..M
.0E 3
aw= z
0 VI04..> S-CC1 M
Las as0.
4-0 7m
W.0 WE VI7 .33%`: 03
o 7m
C 4.W
ClL VIa .3
O. 03
O 0s-
E= 0
4-0 04J S..
M
W W
4.)
4- 70S.. W-0.07 3
CO
4.)4- ,0 74.)
0 0S-W ro
O. CO
4-0 WLCl ME3=ass2.=
0 n
4.>CCl M
WarCI.
4- 30L tLW
WE= m.1= co
1-04-> MC LL.C1
ClLm
O. CO
Anatomy 76 3.7 819 4.5 88 4.0 900 4.4 90 3.5 989 4.3 92 2.9 1084 4.2 103 3.2 1153 4.1
Biochemistry 97 4.7 943 5.2 93 4.2 1050 5.1 103 4.0 1146 4.9 115 3.7 1242 4.8 127 3.9 1328 4.7
Microbiology 84 4.1 664 3.6 57 2.6 748 3.6 95 3.6 814 3.5 61 2.0 909 3.5 82 2.5 949 3.3
Pathology 144 7.0 1410 7.7 160 7.3 1592 7.7 164 6.3 1778 7.7 185 5.9 1976 7.6 194 6.0 2108 7.4
Pharmacology 58 2.8 592 3.2 65 3.0 659 3.2 61 2.3 728 3.1 80 2.6 803 3.1 87 2.7 860 3.0
Physiology 85 4.1 836 4.6 72 3.3 926 4.5 96 3.7 1000 4. 101 3.2 1089 4.2 91 2.8 1159 4.1
Other Basic Sciences 28 1.4 236 1.3 20 .9 275 1.3 36 1.4 297 42 1.3 343 1.3 56 1.7 379 1.3
Subtotal Basic Science 572 27.8 5500 30.1 555 25.3 6150 29.8 645 24.8 6752 29.1 676 21.6 7446 28.7 740 22.5 7936 27.9
Anesthesiology 65 3.2 534 2.9 75 3.4 613 3.0 89 3.4 700 3.0 142 4.5 798 3.1 130 4.0 899 3.2
Dermatology 6 .3 128 .7 16 .7 130 .6 20 .8 144 .6 12 .4 166 .6 14 .4 178 .6
Family Practice 15 .7 81 .4 30 1.4 103 .5 31 1.2 143 .6 69 2.2 189 .7 73 2.3 259 .9
Internal Medicine 341 16.6 3182 17.4 384 17.4 3569 17.3 456 17.5 3980 17.2 570 18.2 4469 17.2 569 17.6 4938 17.4
Neurology 39 1.9 404 2.2 46 2.1 457 2.2 42 1.6 513 2.2 57 1.8 563 2.2 70 2.2 608 2.1
Obstetrics/Gynecology 63 3.1 596 3.3 76 3.4 667 3.2 107 4.1 758 3.3 118 3.8 861 3.3 105 3.2 957 3.4
Ophthalmology 27 1.3 241 1.3 35 1.6 268 1.3 31 1.2 312 1.3 55 1.8 341 1.3 38 1.2 385 1.4
Orthopedic Surgery 20 1.0 141 .8 21 1.0 164 .8 27 1.0 192 .8 27 .9 225 .9 30 .9 253 .9
Otolaryngology 14 .7 182 1.0 30 1.4 203 1.0 37 1.4 238 1.0 35 1.1 268 1.0 32 1.0 297 1.0
Pediatrics 195 9.5 1532 8.4 156 7.1 1746 8.4 206 7.9 1930 8.3 244 7.8 2165 8.3 252 7.8 2339 8.2
Physical & Preventive Med. 34 1.7 255 1.4 36 1.6 294 1.4 34 1.3 331 1.4 35 1.1 362 1.4 39 1.2 385 1.4
Psychiatry 225 10.9 1711 9.3 239 10.8 1953 9.4 253 9.7 2228 9.6 321 10.3 2507 9.6 343 10.6 2724 9.6
Public Heal h 76 3.7 509 2.8 83 3.8 600 2.9 91 3.5 699 3.0 88 2.8 793 3.0 101 3.1 846 3.0
Radiology 120 5.8 877 4.8 140 6.4 1025 5.0 183 7.0 1185 5.1 220 7.0 1385 5.3 259 8.0 1555 5.5
Surgery 124 6.0 1502 8.2 141 6.4 1647 8.0 170 6.5 1830 7.9 271 2024 7.8 218 6.7 2246 7.9
Other Clinical Sciences 0 .0 1 .0 0 .0 1 .0 0 .0 2 .0 3 .1 5 .0 9 .3 10 .0
Subtotal Clinical Science 1364 66.4 11876 64.9 1509 68.5 13440 65.0 777 68.1 15185 65.3 2267 72.5 17121 66.7 2282 70.5 18879 66.5
Other 111 5.4 873 4.8 131 5.9 1017 4.9 178 6.8 1188 5.1 173 5.5 1388 5.3 204 6.3 1510 5.3
Unknown 10 .5 51 .3 8 .4 64 .3 4 .2 73 ' 8 .3 79 .3 12 .4 88 .3
TOTAL 2057 100.0 18300 100.0 2203 100.0 20671 100.0 604 100.0 23198 100.0 3124 100.0 26034 100.0 3238 100.0 28413 100.0
I
Percentages may not add up to 100.0 due to rounding.
60 24
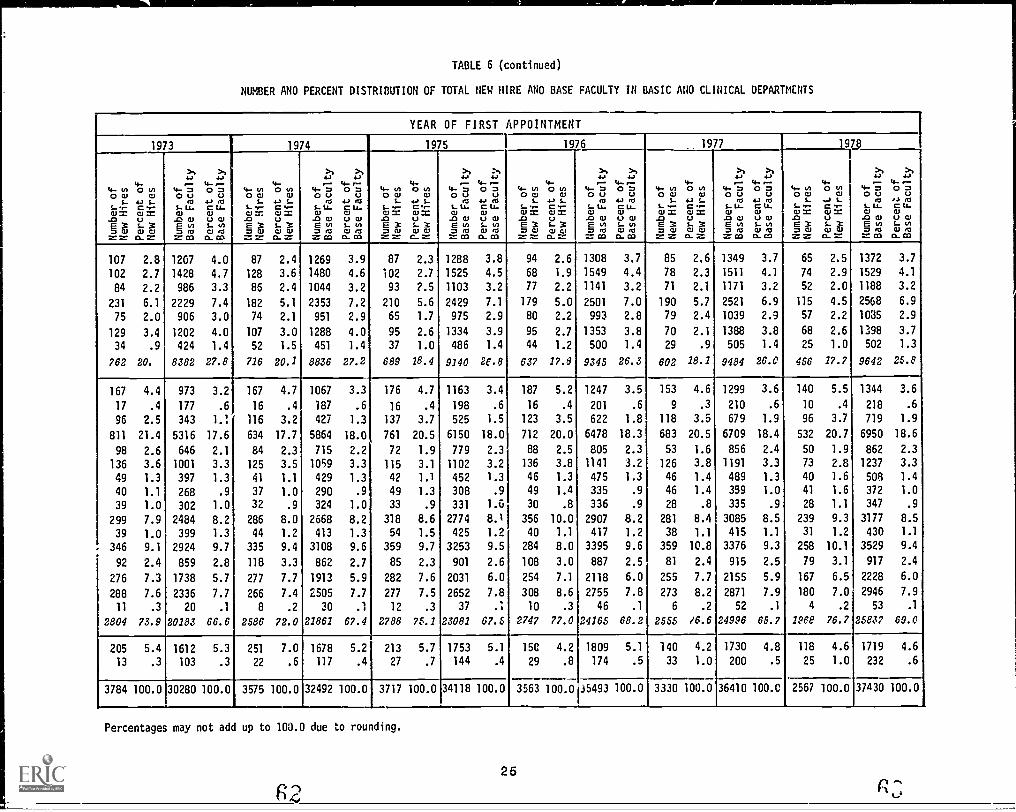
TABLE 6 (continued)
NUMBER ANO PERCENT DISTRIBUTION OF TOTAL NEW HIRE ANO BASE FACULTY IN BASIC ANO CLINICAL DEPARTMENTS
YEAR OF FIRST APPOINTMENT
1973 1974 1975 1976 1977 1978
(4. Ul0 W
L.L. -Cl =
10E37 Cl==
4-0 UlW
4.) L.C ...4Cl =0S. 3Cl ClO..=
4.))-'4.. 00 00L. Lt.0.1J ClE o7 0=CO
4.)4- c--0 004.) 0C Lt.Cl0 Cls- oCl 0
O.. CO
44 tif0 W
L.L. ..-Cl =.0E 3777..-=
4-0 Ul
W4.) L.C .-.W =0S. 3WWO..=
4.),-.)4 70 0L. lT.W
.0 ClErn7 0=CO
4444.0 70C12WLI ClL. cf)Cl 0
O.. CO
)4. Ul0 W
L.
t E.0E 37CU= =
4-0 1/1
W4.) L.5LIL. VWW
C.. =
4.)
'4.. 00 00L. LLCl.0 ClEN7 0= 03
.1:s14.)
4......0 004.) 06C4.Cl0 Cl1- UICl 0O.. CO
4.. tif0 W
L.L. ..4Cl =.0E377= =
4-0 tifCl
44) L.C 444., XLIS- 3701
Cl. 2...
4.)
V. 70 00L. LLCl.0 ClE VI7 0= 03
7".4.)
4..r...0 704.) 0CU.Cl
Cl CU
1- u)Cl 0
O.. CO
4- Ul0 WL. )-S-Cl X.0E377= =
4-0 UI
W
C S4Cl =LII.WW
O.. =
4.)r4- 70 00L. 1.1.Cl
.0 Cle 07 0= CO
4.)4- 4.-0 7044) 0C.Cl0 ClL. U1W )7O.. 03
40 W
L.
Cl.0
6= =
4-0 UI
W4.4 L.
5LI
t 1O. =
4.)
4- w0 0ro
L. LLCl
.0 Cle uf7 0:7: 03
107 2.8 1207 4.0 87 2.4 1269 3.9 87 2.3 1288 3.8 94 2.6 1308 3.7 85 2.6 1349 3.7 65 2.5 1372
102 2.7 1428 4.7 128 3.6 1480 4.6 102 2.7 1525 4.5 68 1.9 1549 4.4 78 2.3 1511 4.1 74 2.9 1529
84 2.2 986 3.3 85 2.4 1044 3.2 93 2.5 1103 3.2 77 2.2 1141 3.2 71 2.1 1171 3.2 52 2.0 1188
231 6.1 2229 7.4 182 5.1 2353 7.2 210 5.6 2429 7.1 179 5.0 2501 7.0 190 5.7 2521 6.9 115 4.5 2568
75 2.0 906 3.0 74 2.1 951 2.9 65 1.7 975 2.9 80 2.2 993 2.8 79 2.4 1039 2.9 57 2.2 1035
129 3.4 1202 4.0 107 3.0 1288 4.0 95 2.6 1334 3.9 95 2.7 1353 3.8 70 2.1 1388 3.8 68 2.6 1398
34 .9 424 1.4 52 1.5 451 1.4 37 1.0 486 1.4 44 1.2 500 1.4 29 .9 505 1.4 25 1.0 502
762 20. 8382 27.8 716 20.1 8836 27.2 689 18.4 9140 28.8 637 17.8 9345 26.3 602 18.1 9484 26.0 456 17.7 9642
167 4.4 973 3.2 167 4.7 1067 3.3 176 4.7 1163 3.4 187 5.2 1247 3.5 153 4.6 1299 3.6 140 5.5 1344
17 .4 177 .6 16 .4 187 .6 16 .4 198 .6 16 .4 201 .6 9 .3 210 .6 10 .4 218
96 2.5 343 1.1 116 3.2 427 1.3 137 3.7 525 1.5 123 3.5 622 1.8 118 3.5 679 1.9 96 3.7 719
811 21.4 5316 17.6 634 17.7 5864 18.0 761 20.5 6150 18.0 712 20.0 6478 18.3 683 20.5 6709 18.4 532 20.7 6950
98 2.6 646 2.1 84 2.3 715 2.2 72 1.9 779 2.3 88 2.5 805 2.3 53 1.6 856 2.4 50 1.9 862
136 3.6 1001 3.3 125 3.5 1059 3.3 115 3.1 1102 3.2 136 3.8 1141 3.2 126 3.8 1191 3.3 73 2.8 1237
49 1.3 397 1.3 41 1.1 429 1.3 42 1.1 452 1.3 46 1.3 475 1.3 46 1.4 489 1.3 40 1.6 508
40 1.1 268 .9 37 1.0 290 .9 49 1.3 308 .9 49 1.4 335 .9 46 1.4 359 1.0 41 1.6 372
39 1.0 302 1.0 32 .9 324 1.0 33 .9 331 1.0 30 .8 336 .9 28 .8 335 .9 28 1.1 347
299 7.9 2484 8.2 286 8.0 2668 8.2 318 8.6 2774 8.1 356 10.0 2907 8.2 281 8.4 3085 8.5 239 9.3 3177
39 1.0 399 1.3 44 1.2 413 1.3 54 1.5 425 1.9 40 1.1 417 1.2 38 1.1 415 1.1 31 1.2 430
346 9.1 2924 9.7 335 9.4 3108 9.6 359 9.7 3253 9.5 284 8.0 3395 9.6 359 10.8 3376 9.3 258 10.1 3529
92 2.4 859 2.8 118 3.3 862 2.7 85 2.3 901 2.6 108 3.0 887 2.5 81 2.4 915 2.5 79 3.1 917
276 7.3 1738 5.7 277 7.7 1913 5.9 282 7.6 2031 6.0 254 7.1 2118 6.0 255 7.7 2155 5.9 167 6.5 2228
288 7.6 2336 7.7 266 7.4 2505 7.7 277 7.5 2652 7.8 308 8.6 2755 7.8 273 8.2 2871 7.9 180 7.0 2946
11 .3 20 .1 8 .2 30 .1 12 .3 37 10 .3 46 .1 6 .2 52 .1 4 .2 53
2804 73.9 20183 66.6 2586 72.0 21861 67.4 2788 75.1 23081 67.5 2747 77.0 24165 68.2 2555 16.6 24996 68.7 1.988 76.7 25837
205 5.4 1612 5.3 251 7.0 1678 5.2 213 5.7 1753 5.1 15C 4.2 1809 5.1 140 4.2 1730 4.8 118 4.6 1719
13 .3 103 .3 22 .6 117 .4 27 .7 144 .4 29 .8 174 .5 33 1.0 200 .5 25 1.0 232
3784 100.0 30280 100.0 3575 100.0 32492 100.0 3717 100.0 34118 100.0 3563 100.0 35493 100.0 3330 100.0 36410 100.0 2567 100.0 37430
3.7
4.1
3.2
6.9
2.9
3.7
1.3
25.8
3.6
.6
1.9
18.6
2.3
3.3
1.4
1.0
.9
8.5
1.1
9.4
2.4
6.0
7.9
.1
69.0
4.6
.6
100.0
Percentages may not add up to 100.0 due to rounding.
25
II. DEMOGRAPHIC CHARACTERISTICS
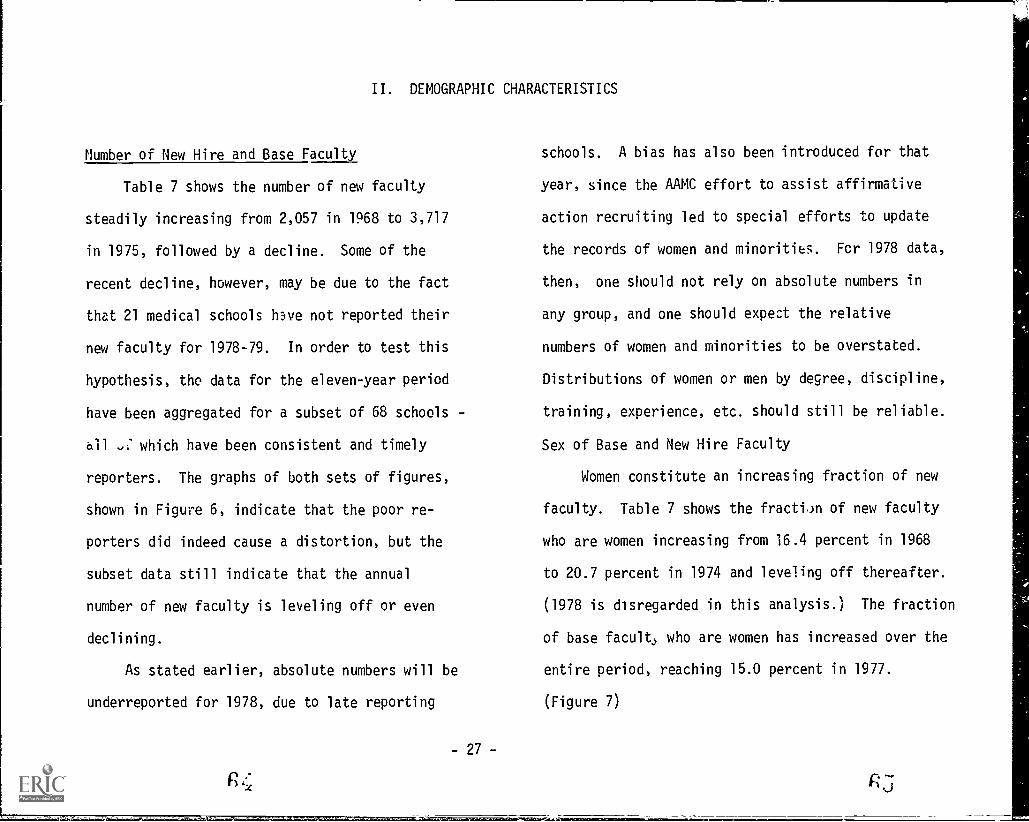
Number of New Hire and Base Faculty
Table 7 shows the number of new faculty
steadily increasing from 2,057 in 1968 to 3,717
in 1975, followed by a decline. Some of the
recent decline, however, may be due to the fact
that 21 medical schools have not reported their
new faculty for 1978-79. In order to test this
hypothesis, the data for the eleven-year period
have been aggregated for a subset of 68 schools -
all : which have been consistent and timely
reporters. The graphs of both sets of figures,
shown in Figure 6, indicate that the poor re-
porters did indeed cause a distortion, but the
subset data still indicate that the annual
number of new faculty is leveling off or even
declining.
As stated earlier, absolute numbers will be
underreported for 1978, due to late reporting
-27-
schools. A bias has also been introduced for that
year, since the AAMC effort to assist affirmative
action recruiting led to special efforts to update
the records of women and minorities. Fcr 1978 data,
then, one should not rely on absolute numbers in
any group, and one should expect the relative
numbers of women and minorities to be overstated.
Distributions of women or men by degree, discipline,
training, experience, etc. should still be reliable.
Sex of Base and New Hire Faculty
Women constitute an increasing fraction of new
faculty. Table 7 shows the fractiJn of new faculty
who are women increasing from 16.4 percent in 1968
to 20.7 percent in 1974 and leveling off thereafter.
(1978 is disregarded in this analysis.) The fraction
of base facult.> who are women has increased over the
entire period, reaching 15.0 percent in 1977.
(Figure 7)
Sex and Degree of New Hire Faculty
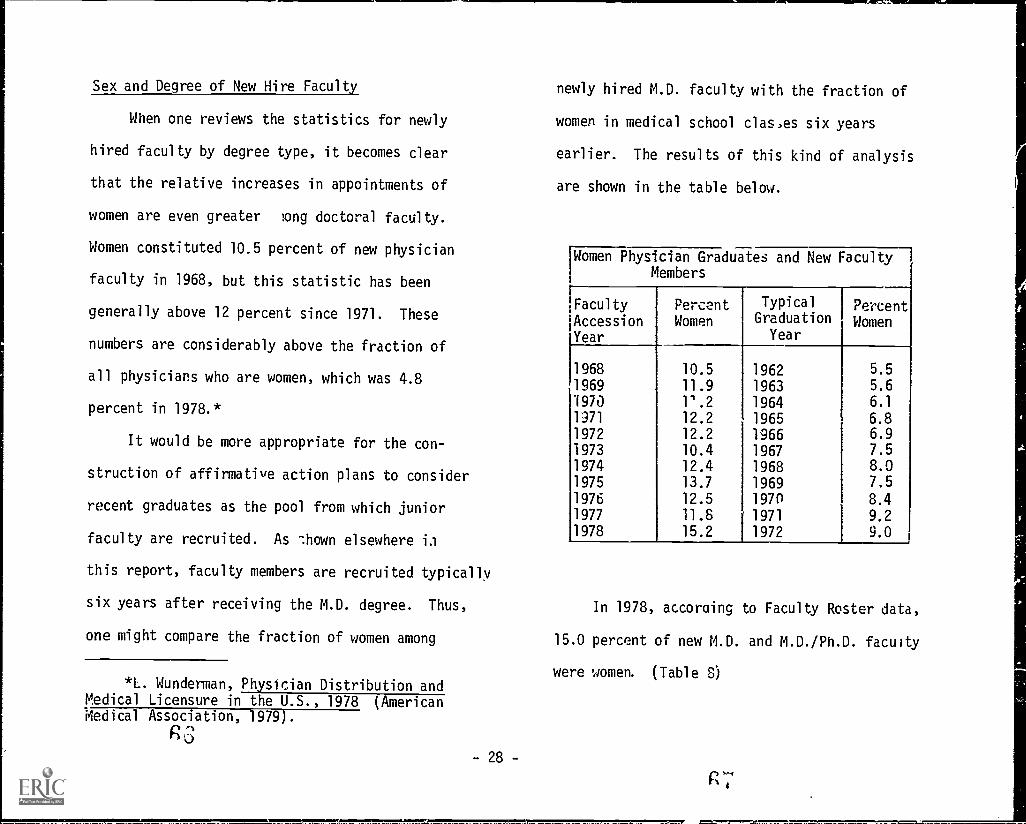
When one reviews the statistics for newly
hired faculty by degree type, it becomes clear
that the relative increases in appointments of
women are even greater long doctoral faculty.
Women constituted 10.5 percent of new physician
faculty in 1968, but this statistic has been
generally above 12 percent since 1971. These
numbers are considerably above the fraction of
all physicians who are women, which was 4.8
percent in 1978.*
It would be more appropriate for the con-
struction of affirmative action plans to consider
recent graduates as the pool from which junior
faculty are recruited. As shown elsewhere in
this report, faculty members are recruited typically
six years after receiving the M.D. degree. Thus,
one might compare the fraction of women among
*L. Wunderman, Physician Distribution andMedical Licensure in the U.S., 1978 (AmericanMedical Association, 1979).
RS-28-
newly hired M.D. faculty with the fraction of
women in medical school clas,es six years
earlier. The results of this kind of analysis
are shown in the table below.
Women Physician Graduates and New FacultyMembers
Faculty
AccessionPercentWomen
I-Typical
GraduationPercentWomen
Year Year
1968 10.5 1962 5.5
1969 11.9 1963 5.6
1970 1'.2 1964 6.1
1371 12.2 1965 6.81972 12.2 1966 6.91973 10.4 1967 7.51974 12.4 1968 8.01975 13.7 1969 7.5
1976 12.5 1970 8.41977 11.8 1971 9.21978 15.2 1972 9.0
In 1978, accoraing to Faculty Roster data,
15.0 percent of new M.D. and M.D./Ph.D. faculty
were women. (Table 8)
It would be fair to conclude that medical
school faculties are recruiting a higher than
proportionate share of available women physicians.
The same kind of analysis cannot so easily be
done for the Ph.D. faculty, since the data would
certainly have to be analyzed by discipline.
Women have made up approximately one-fourth
of first-year medical school entrants in recent
years.* If medical schools continue to recruit
a similar share of the available pool, (and if
female physicians continue to seek faculty em-
ployment), more than twenty-five percent of each
year's new faculty will be women within a very
few years. Of course, it will be a generation
before this change is fully reflected in the
total faculty.
The increasing proportion of new women
faculty with doctorates is of course paralleled
*edical School Admission Requirements 1981-82, (Association of American Medical Colleges,1980).
- 29 -
by a decline in new non-doctoral women. In 1968,
30.5 percent of new women faculty held th "ir high-
est degree at the master's level, and 9.5 ep.cent
held their highest degree at the baccalaureate
level. By 1978, these fractions had jeclined to
21.3 percent and 6.6 percent, respectively.
Sex and Age of New Hire and Base Faculty
The median age of new hire faculty in 1918
is younger than in preceding years -- 33.6 years
Of age in 1968; 32.8 years in 1974 and 32.5 years
in 1978 (Table 9).
Male new hire faculty are slightly older
than, :heir female counterparts in 1978 - 32.6
,rsu_ 31.8. This is a change which has been
occ rring gradually since 1969, when the male new
hire fauclty median age was 33.4 and the female
new hire median age was 33.2 years.
The median age of all faculty has gradually
increased over the period, from 41.1 in 1968 to
42.3 in 1978. Likewise, the median age of base
RD
male faculty has increased, from 41.7 years in
1968 to 43.4 years in 1978. The average female
faculty member is younger, however, 40.9 years
in 1978 versus 42.6 years in 1968.
The median age of the full-time salaried
M.D. faculty and Ph.D. faculty is shown below.
Median Age of Full-time M.D. and Ph.D. Faculty
M.D.'s Ph.D.'s
1968 41.3 41.0
1976 42.6 40.4
1978 43.6 41.2
Sex and Ethnic Identification of New
Hire Faculty
When comparng the ethnic origin of new 1968
faculty to that of 1975, the data show that un-
derrepresented minority faculty -- American Indian,
Black, Mexican-American and Puerto Rican ethnic
groups -- have not all increased. In 1975 and
1978 American Indian faculty comprised 0.1 per-
- 30 -
cent, as opposed to 0.0 percent in 1968; Mexican-
Americ-41 faculty have increased from 0.1 percent
in 1968 to 0.2 percent in 1975 and 0.4 percent in
1978; Puerto Rican faculty have increased from
0.4 percent in 1968 to 0.7 percent in 1S and
0.9 percent in 1978. Black faculty, however,
show a percent decline from 2.2 percent n 1968
to 2.1 percent in 1975 and 1.6 percent in 1978.
(The low figure in 1978 is in spite of the women
and minority effort wherein schools made a special
effort to report these faculty to the Roster.)
Among the minorities not underrepresented in
relation to the population, Other Hispanic faculty
show a slight decline from 1.5 percent in 1968 to
1.4 percent in 1978, after a high of 2.3 percent
in 1"4. Asian faculty have shown the largest
percelc increase, from 6.1 percent in 1968 to 9.2
percent in 1978 (Table 10).
Figure 8 illustrates minority distribution
of new hire faculty over this period of time.
Sex, Citizenship and Ethnic Origin of New
Hire Faculty.
Table 11 displays the ethnic group of new
hire full-time faculty who are U.S. citizens only.
When comparing this table with the previous Table
10 (using 1977 as an example), the difference is
quite substantial for the Asian faculty, de-
creasing from 277 total full-time new hires to
68 full-time new hires who are U.S. citizens and
for Other Hispanics the decline is from a total
of 61 new hires to 25 new hires who are U.S.
citizen faculty.
A slight decline of three faculty was noted
for Mexican-Americans and a decline of two
for black faculty and, of course, there
is no change in the mainland Puerto Rican and
American Indian figures since they are by defini-
tion U.S. citizens.
The new hire female faculty in the Caucasian
group show a significant increase from 269 in
- 31 -
72
1968 to 446 in 1977. Of the minority groups only
the Asian female faculty show a signiflcant increase.
Non U.S. citizens of this group shcG. . increase
of 49 by 1978, but for Asian females wi,.. a U.S.
citizeoship the increase is only 6. (See
Tables 10 and 11.)
The percent of new hire faculty who are non-
U.S. citizens has been increasing since 1968, with
the peak year being 1976 with 20.1 percent of the
faculty in this status. Table 12 shows a decline
by 1978 to 18.2 percent. (Figure 9)
7 o
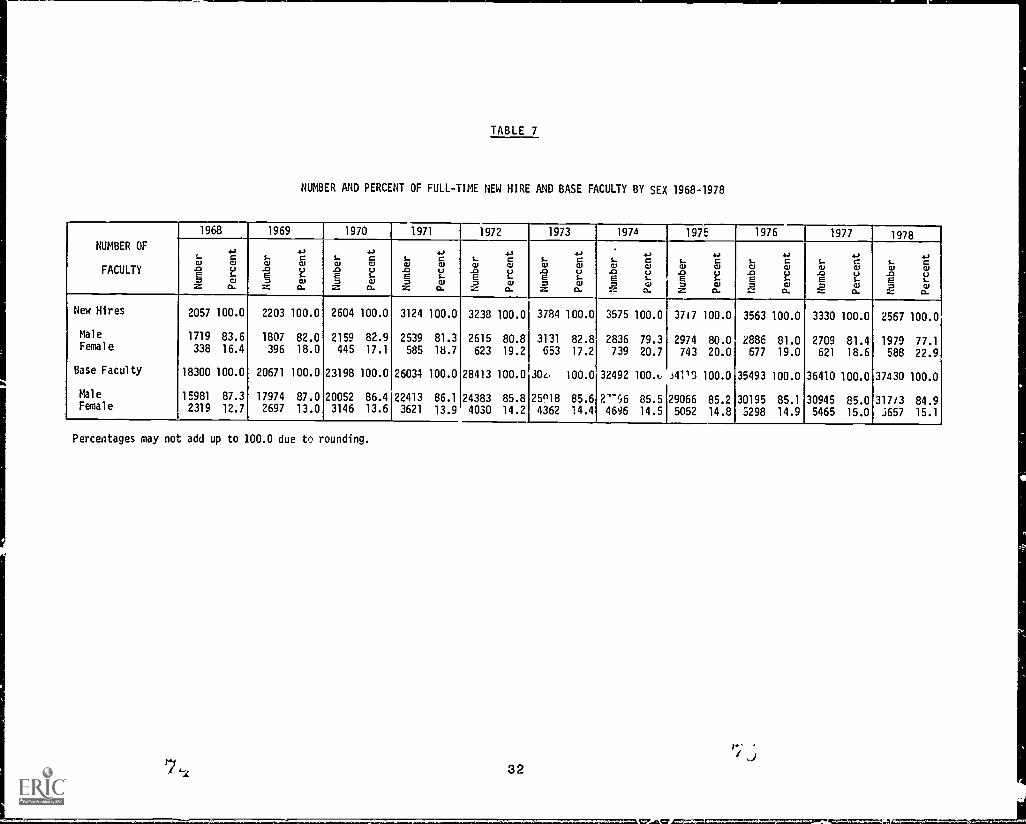
TABLE 7
NUMBER AND PERCENT OF FULL-TIME NEW HIRE AND BASE FACULTY BY SEX 1968-1978
NUMBER OF
FACULTY
1968 1969 1970 1971 1972 1973 1974 1975 1976 1977 1978
S...CI.0E
...,
CQloS-
S...Ql.0E
4.,
Cao1-
S...al.0E
4.,
CQSo1-
S...CU.0E
4.,
CQloS-
S-C1.1
..0E
4.,
CC1.1
oS..
S-Ql.0E
4.,
CQSoS-
S-Ql.0E
4-,
CC1.1
oS..
S...Ql.0E
4.,
CQloS..
S...Ql.0E
4,Ca,...)
5-
S...CU.0E
4.,
C.'CUoS-
S...cu.0E
SJCcuo5-=Z Ql
G.=Z CU
G.MZ QS
G.== Ql
G.=z CU
CI.MZ CII
G.== sTO
O.=Z QS
CI.=....
a,O.
=Z asCI.
=... QlCI.
New Hires 2057 100.0 2203 100.0 2604 100.0 3124 100.0 3238 100.0 3784 100.0 3575 100.0 3717 100.0 3563 100.0 3330 100.0 2567 100.0
Male 1719 83.6 1807 82.0 2159 82.9 2539 81.3 2615 80.8 3131 82.8 2836 79.3 2974 80.0 2886 81.0 2709 81.4 1979 77.1Female 338 16.4 396 18.0 445 17.1 585 18.7 623 19.2 653 17.2 739 20.7 743 20.0 677 19.0 621 18.6 588 22.9
Base Faculty 18300 100.0 20671 100.0 23198 100.0 26034 100.0 28413 100.0 306, 100.0 32492 1000, .$41,3 100.0 35493 100.0 36410 100.0 37430 100.0
Male 15981 87.3 17974 87.0 20052 86.4 22413 86.1 24383 85.8 25n18 85.6 2'-06 85.5 29066 85.2 30195 85.1 30945 85.0 317/3 84.9Female 2319 12.7 2697 13.0 3146 13.6 3621 13.9 4030 14.2 4362 14.4 4696 14.5 5052 14.8 5298 14.9 5465 15.0 5657 15.1
Percentages may not add up to 100.0 due to rounding.
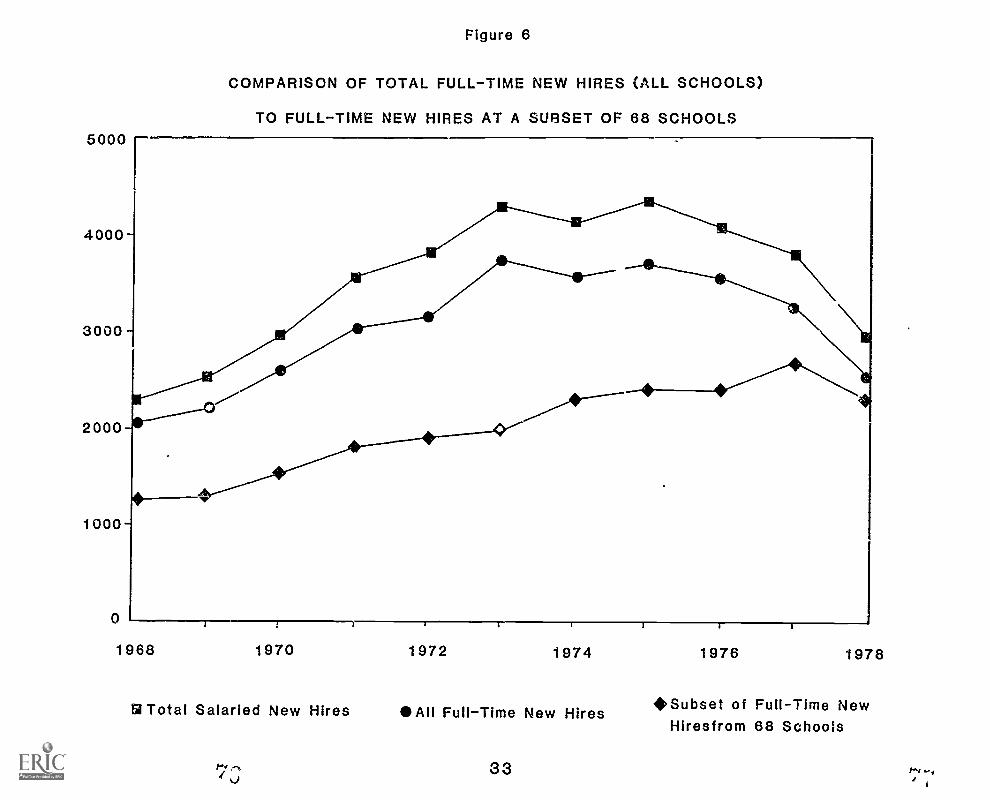
Figure 6
COMPARISON OF TOTAL FULLTIME NEW HIRES (ALL SCHOOLS)
TO FULLTIME NEW HIRES AT A SUBSET OF 68 SCHOOLS
1968 1970 1972 1974
I2 Total Salaried New Hires All FullTime New Hires
33
1976 1978
Subset of Full-Time NewHiresfrom 68 Schools
I-
0U.
xco
Cu
E
U-
cn
EG)U-
Fcs
2
co
2
NW.
///:
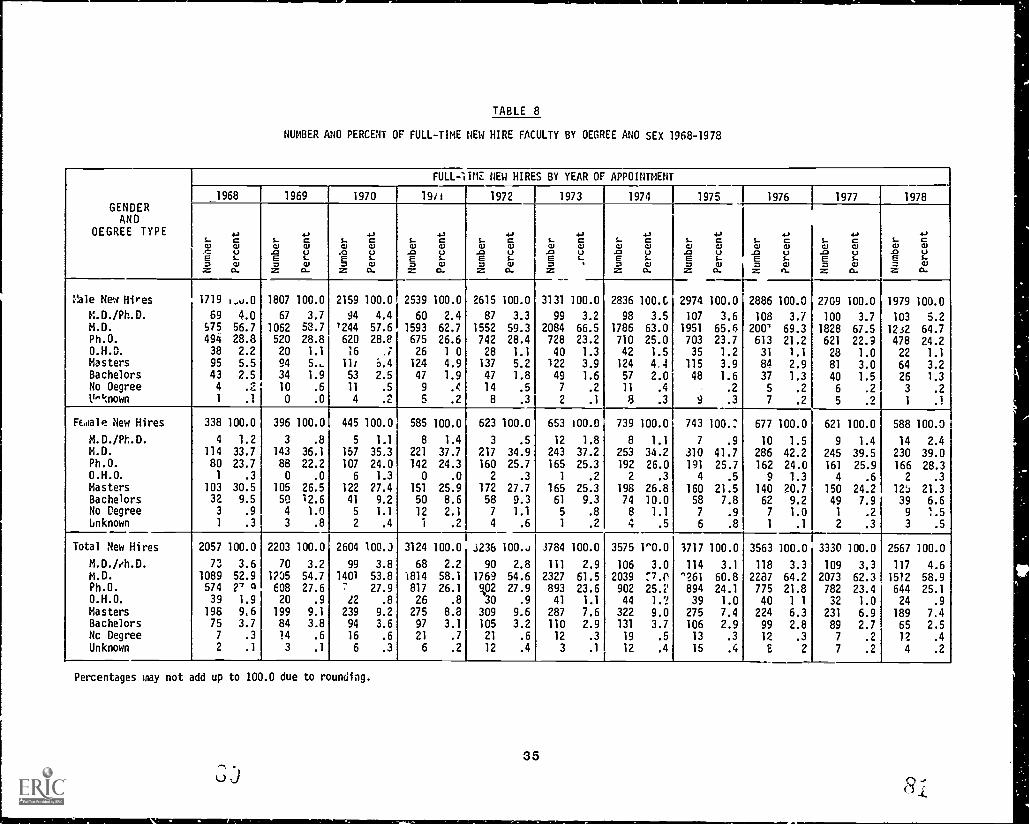
TABLE 8
NUMBER ANO PERCENT OF FULL-TIME NEW HIRE FACULTY BY OEGREE ANO SEX 1968-1978
GENDERAND
OEGREE TYPE
FULL-1IME NEW HIRES BY YEAR OF APPOINTMENT
1968 1969 L 1970 1911 1972 1973 1974 1975 1976 1977 1978
...3 ...3 ...3 ...3 ...3 ...3 4.3 4- 4.3 -3 asS. C S. C S. C S. C S. C S. C S. C S. C S. C S. C S. Cal al al al 0 al al a) al al al al al al 0 0 al al C.) al 0 (1)0E
0S..
.0E
0S..
.0E
0S..
.0E
0S..
.0E
0S..
.0E
0s-
.0E
0S..
.0E
0S..
.0E
05-
.0E
0S..
.0E
0S.-
al 7 al 7 al 7 al 7 al 7 . 7 al 7 al 7 al 7 al .. WZ O. Z Ca. z G. G. Z O. Z Z O. Z O. z n. O. O.
.ale New Hires 1719 k-u.0 1807 100.0 2159 100.0 2539 100.0 2615 100.0 3131 100.0 2836 100.0 2974 100.0 2886 100.0 27G9 100.0 1979 100.0
M.D./Ph.D. 69 4.0 67 3.7 94 4.4 60 2.4 87 3.3 99 3.2 98 3.5 107 3.6 108 3.7 100 3.7 103 5.2M.D. S75 56.7 1062 58.7 '244 57.6 1593 62.7 1552 59.3 2084 66.5 1786 63.0 1951 65.6 200' 69.3 1828 67.5 1232 64.7Ph.O. 494 28.8 520 28.8 620 28.8 675 26.6 742 28.4 728 23.2 710 25.0 703 23.7 613 21.2 621 22.9 478 24.2O.H.D. 38 2.2 20 1.1 16 ,i 26 1 0 28 1.1 40 1.3 42 1.5 35 1.2 31 1.1 28 1.0 22 1.1Masters 95 5.5 94 5., II, '6.4 124 4.9 137 5.2 122 3.9 124 4.4 115 3.9 84 2.9 81 3.0 64 3.2Bachelors 43 2.5 34 1.9 53 2.5 47 1.9 47 1.8 49 1.6 57 2.0 48 1.6 37 1.3 40 1.5 26 1.3No Oegree 4 .2 10 .6 11 .5 9 .4 14 .5 7 .2 11 .4 .2 5 .2 6 .2 3 .2
UP%nown 1 .1 0 .0 4 .2 5 .2 8 .3 2 .1 8 .3 9 .3 7 .2 5 .2 1 .1
FEmale New Hires 338 100.0 396 100.0 445 100.0 585 100.0 623 100.0 653 100.0 739 100.0 743 100.2 677 100.0 621 100.0 588 100.0
M.D./Ph.D. 4 1.2 3 .8 5 1.1 8 1.4 3 .5 12 1.8 8 1.1 7 .9 10 1.5 9 1.4 14 2.4M.D. 114 33.7 143 36.1 157 35.3 221 37.7 217 34.9 243 37.2 253 34.2 310 41.7 286 42.2 245 39.5 230 39.0Ph.O. 80 23.7 88 22.2 107 24.0 142 24.3 160 25.7 165 25.3 192 26.0 191 25.7 162 24.0 161 25.9 166 28.3O.N.O. 1 .3 0 .0 6 1.3 0 .0 2 .3 1 .2 2 .3 4 .5 9 1.3 4 .6 2 .3
Masters 103 30.5 105 26.5 122 ?7.4 151 25.9 172 27.7 165 25.3 198 26.8 160 21.5 140 20.7 150 24.2 120 21.3Bachelors 32 9.5 5e 12.6 41 9.2 50 8.6 58 9.3 61 9.3 74 10.0 58 7.8 62 9.2 49 7.9 39 6.6No Degree 3 .9 4 1.0 5 1.1 12 2.1 7 1.1 5 .8 8 1.1 7 .9 7 1.0 1 .2 9 1.5Unknown 1 .3 3 .8 2 .4 1 .2 4 .6 1 .2 4 .5 6 .8 1 .1 2 .3 3 .5
Total New Hires 2057 100.0 2203 100.0 2604 100.3 3124 100.0 3238 100..J 3784 100.0 3575 1'11.0 3717 100.0 3563 100.0 3330 100.0 2567 100.0
M.D./eh.D. 73 3.6 70 3.2 99 3.8 68 2.2 90 2.8 III 2.9 106 3.0 114 3.1 118 3.3 109 3.3 117 4.6M.D. 1089 52.9 1205 54.7 1401 53.8 1814 58.1 1769 54.6 2327 61.5 2039 :7.0 '261 60.8 2287 64.2 2073 62.3 1512 58.9Ph.O. 574 2' a 608 27.6 7 27.9 817 26.1 102 27.9 893 23.6 902 25.2 894 24.1 775 21.8 782 23.4 644 25.10.1-1.0. 39 1.9 20 .9 22 .8 26 .8 30 .9 41 1.1 44 I.? 39 1.0 40 1 1 32 1.0 24 .9
Masters 198 9.6 199 9.1 239 9.2 275 8.8 309 9.6 287 7.6 322 9.0 275 7.4 224 6.3 231 6.9 189 7.4Bachelors 75 3.7 84 3.8 94 3.6 97 3.1 105 3.2 110 2.9 131 3.7 106 2.9 99 2.8 89 2.7 65 2.5Nc Degree 7 .3 14 .6 16 .6 21 .7 21 .6 12 .3 19 .5 13 .3 12 .3 7 .2 12 .4
Unknown 2 .1 3 .1 6 .3 6 .2 12 .4 3 .1 12 .4 15 .4 E 2 7 .2 4 .2
Percentages may not add up to 100.0 due to rounding.
35
uJ
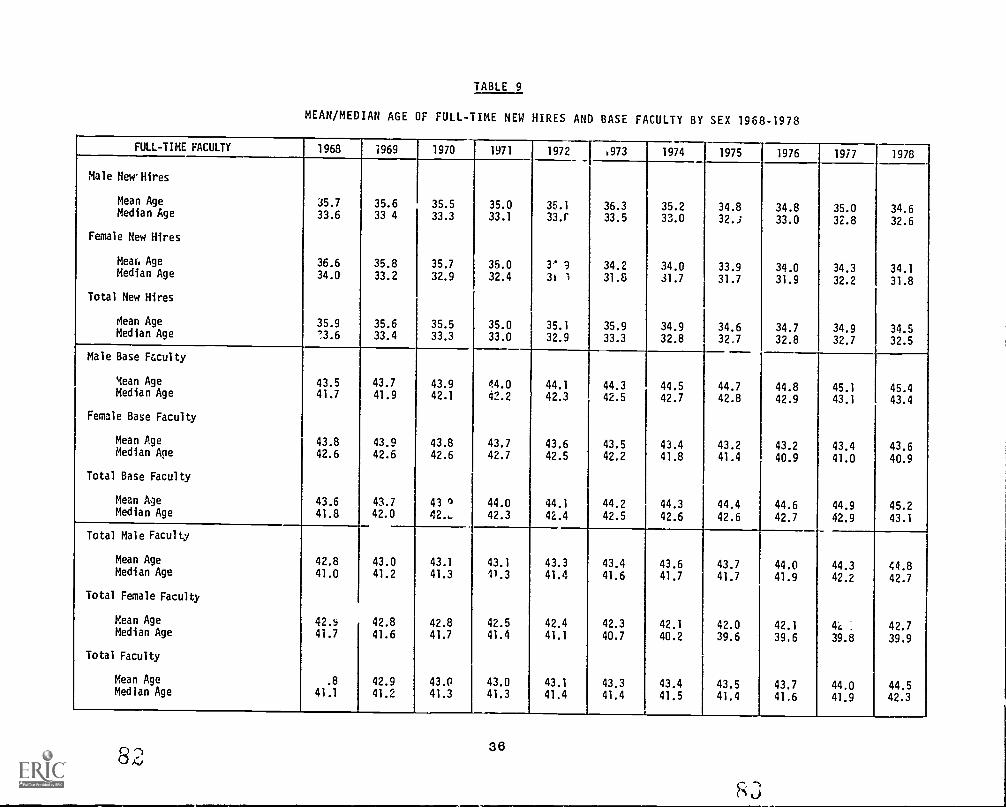
TABLE 9
MEAN/MEDIAN AGE OF FULL-TIME NEW HIRES AND BASE FACULTY BY SEX 1968-1978
FULL-TIME FACULTY 1968 7969 1970 1971 1972 973 1974 1975 1976 1977 1978
Male NeHires
Mean AgeMedian Age
Female New Hires
35.7
33.635.633 4
35.533.3
35.033.1
35.1
33.r36.333.5
35.233.0
34.832.J
34.833.0
35.032.8
34.6
32.6
Mear, Age 36.6 35.8 35.7 35.0 3'' 9 34.2 34.0 33.9 34.0 34.3 34.1Median Age 34.0 33.2 32.9 32.4 31 ) 31.8 31.7 31.7 31.9 32.2 31.8
Total New Hires
Mean Age 35.9 35.6 35.5 35.0 35.1 35.9 34.9 34.6 34.7 34.9 34.5Median Age 73.6 33.4 33.3 33.0 32.9 33.3 32.8 32.7 32.8 32.7 32.5
Male Base Faculty
Mean Age 43.5 43.7 43.9 44.0 44.1 44.3 44.5 44.7 44.8 45.1 45.4Median Age 41.7 41.9 42.1 42.2 42.3 42.5 42.7 42.8 42.9 43.1 43.4
Female Base Faculty
Mean Age 43.8 43.9 43.8 43.7 43.6 43.5 43.4 43.2 43.2 43.4 43.6Median Ape 42.6 42.6 42.6 42.7 42.5 42.2 41.8 41.4 40.9 41.0 40.9
Total Base Faculty
Mean Age 43.6 43.7 43 0 44.0 44.1 44.2 44.3 44.4 44.6 44.9 45.2Median Age 41.8 42.0 42... 42.3 42.4 42.5 42.6 42.6 42.7 42.9 43.1
Total Male Faculty
Mean Age 42.8 43.0 43.1 43.1 43.3 43.4 43.6 43.7 44.0 44.3 44.8Median Age 41.0 41.2 41.3 11.3 41.4 41.6 41.7 41.7 41.9 42.2 42.7
Total Female Faculty
Mean Age 42.5 42.8 42.8 42.5 42.4 42.3 42.1 42.0 42.1 44 : 42.7Median Age 41.7 41.6 41.7 41.4 41.1 40.7 40.2 39.6 39.6 39.8 39.9
Total Faculty
Mean Age .8 42.9 43.0 43.0 43.1 43.3 43.4 43.5 43.7 44.0 44.5Median Age 41.1 41.2 41.3 41.3 41.4 41.4 41.5 41.4 41.6 41.9 42.3
36
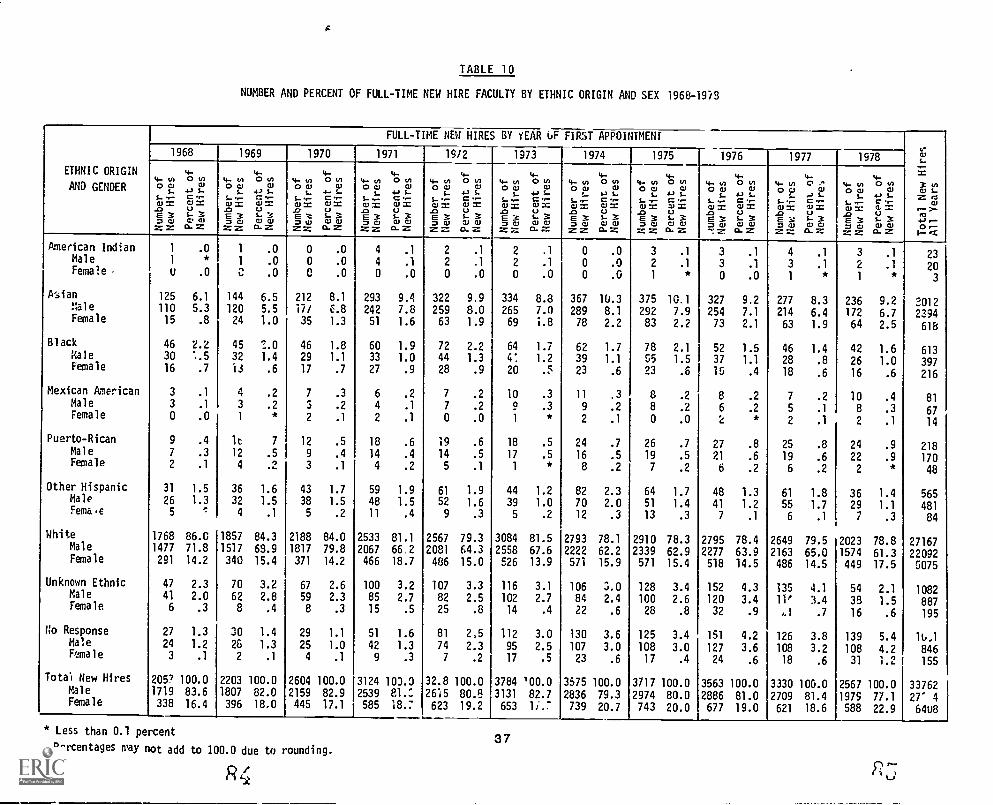
TABLE 10
NUMBER AND PERCENT OF FULL-TIME NEW HIRE FACULTY BY ETHNIC ORIGIN AND SEX 1968-1918
ETHNIC ORIGIN
AND GENDER
FULL-TIME NEW HIRES BY YEAR 8F FIRST APPOINTMENTwwL.
Sx,,,21.."" 23...-,..
.P....0,-1-<
1968 1969 1970 1971 19/2 1973 1974 1975 1976 1977 1978
4-(/)011).
L..-wsrsrsu..wuJuJoursursursuxt.0EX=W==
4-ON.EC.,-US1......,..,m=
4,0E.L.."wsEX7W==
4-ON?..C.,..-WS,St..Xwwc:L=
4.,0a,1....,-OSE==
4-ONE
CN.-US,,t1Xwwcy=
4,0E.s...,-
cosE37W==
4-ONe
c.,=s...3WWcy=
4-4, ON" ,E,1,.....- c.,-QS =E3 1.-X=w WW== cLy
4,0E.1.....-WsEX=0==
4-owEC...-=1...waia.=
4-wop1,...,-wSE3=0==
4-owwEc..-WS1.-Xww[LS
4-4-w owop. .E5,....- C..-cos w=EX S...X=0 wwss 0.-Z
4-w0E5,.......wsEX00-:=
4-owE=,--wS1.-Xwwta.=
4,021....,-wsE00ZS
4-of.E
c...-USf...ww0-7:
4,0Ej.....-w=EX00sZ
4-ow4,11).
c.,WSuL-3w0cl.=
American Indian 1 .0 1 .0 0 .0 4 .1 2 .1 2 .1 0 .0 3 .1 3 .1 4 .1 3 .1 23Male 1 * 1 .0 0 .0 4 .1 2 .1 2 .1 0 .0 2 .1 3 .1 3 .1 2 20Female . U .0 C .0 0 .0 0 .0 0 .0 0 .0 0 .0 1 0 .0 1 1 3
Asian 125 6.1 144 6.5 212 8.1 293 9.4 322 9.9 334 8.3 367 1U.3 375 10.1 327 9.2 277 8.3 236 9.2 3012Male 110 5.3 120 5.5 17/ 6.8 242 7.8 259 8.0 265 7.0 289 8.1 292 7.9 254 7.1 214 6.4 172 6.7 2394Female 15 .8 24 1.0 35 1.3 51 1.6 63 1.9 69 1.8 78 2.2 83 2.2 73 2.1 63 1.9 64 2.5 618
Black 46 2.2 45 7..0 46 1.8 60 1.9 72 2.2 64 1.7 62 1.7 78 2.1 52 1.5 46 1.4 42 1.6 613Male 30 '..5 32 1.4 29 1.1 33 1.0 44 1.3 4: 1.2 39 1.1 55 1.5 37 1.1 28 .8 26 1.0 397Female 16 .7 13 .6 17 .7 27 .9 28 .9 20 .5 23 .6 23 .6 15 .4 18 .6 16 .6 216
Mexican American 3 .1 4 .2 7 .3 6 .2 7 .2 10 .3 11 .3 8 .2 8 .2 7 .2 10 .4 81Male 3 .1 3 .2 5 .2 4 .1 7 .2 9 .3 9 .2 8 .2 6 .2 5 8 .3 67Female 0 .0 I 1 * 2 .1 2 .1 0 .0 1 * 2 .1 0 .0 2 2 .1 2 .1 14
Puerto-Rican 9 .4 It 7 12 .5 18 .6 19 .6 18 .5 24 .7 26 .7 27 .8 25 .8 24 .9 218Male 7 .3 12 .5 9 .4 14 .4 14 .5 17 .5 16 .5 19 .5 21 .6 19 .6 22 .9 170Female 2 .1 4 .2 3 .1 4 .2 5 .1 1 * 8 .2 7 .2 6 .2 6 .2 2 * 48
Other Hispanic 31 1.5 36 1.6 43 1.7 59 1.9 61 1.9 44 1.2 82 2.3 64 1.7 48 1.3 61 1.8 36 1.4 565Male 26 1.3 32 1.5 38 1.5 48 1.5 52 1.6 39 1.0 70 2.0 51 1.4 41 1.2 55 1.7 29 1.1 481Fema.c 5 , 4 .1 5 .2 11 .4 9 .3 5 .2 12 .3 13 .3 7 .1 6 .1 7 .3 84
White 1768 86.G 1857 84.3 2188 84.0 2533 81.1 2567 79.3 3084 81.5 2793 78.1 2910 78.3 2795 78.4 2649 79.5 2023 78.8 27167Male 1477 71.8 1517 63.9 1817 79.8 2067 66.2 2081 64.3 2558 67.6 2222 62.2 2339 62.9 2277 63.9 2163 65.0 1574 61.3 22092Female 291 14.2 340 15.4 371 14.2 466 18.7 486 15.0 526 13.9 57i 15.9 571 15.4 518 14.5 486 14.5 449 17.5 5075
Unknown Ethnic 47 2.3 70 3.2 67 2.6 100 3.2 107 3.3 116 3.1 106 3,0 128 3.4 152 4.3 135 4.1 54 2.1 1082Male 41 2.0 62 2.8 59 2.3 85 2,7 82 2.5 102 2.7 84 2.4 100 2.6 120 3.4 110 3.4 38 1.5 887Female 6 .3 8 ,4 8 .3 15 .5 25 .8 14 .4 22 .6 28 .8 32 .9 ,1 .7 16 .6 195
No Response 27 1.3 30 1.4 29 1.1 51 1.6 81 2,5 112 3.0 130 3.6 125 3.4 151 4.2 126 3.8 139 5.4 1u,1Male 24 1.2 26 1.3 25 1.0 42 1.3 74 2.3 95 2.5 107 3.0 108 3.0 127 3.6 108 3.2 108 4.2 846Female 3 .1 2 .1 4 .1 9 .3 7 .2 17 .5 23 .6 17 .4 24 .6 18 .6 31 1.2 155
Total New Hires 2057 100.0 2203 100.0 2604 100.0 3124 103.3 32.8 100.0 3784 100.0 3575 100.0 3717 100.0 3563 100.0 3330 10G.0 2567 100.0 33762Male 1719 83.6 1807 82.0 2159 82.9 2539 el.: 2615 80.8 3131 82.7 2836 79.3 2974 80.0 2886 81.0 2709 81.4 1979 77.1 27' 4Female 338 16.4 396 18.0 445 17.1 585 18.: 623 19.2 653 li.7 739 20.7 743 20.0 677 19.0 621 18.6 588 22.9 64u8
* Less than 0.1 percent
Percentages way not add to 100.0 due to rounding.
ft
37
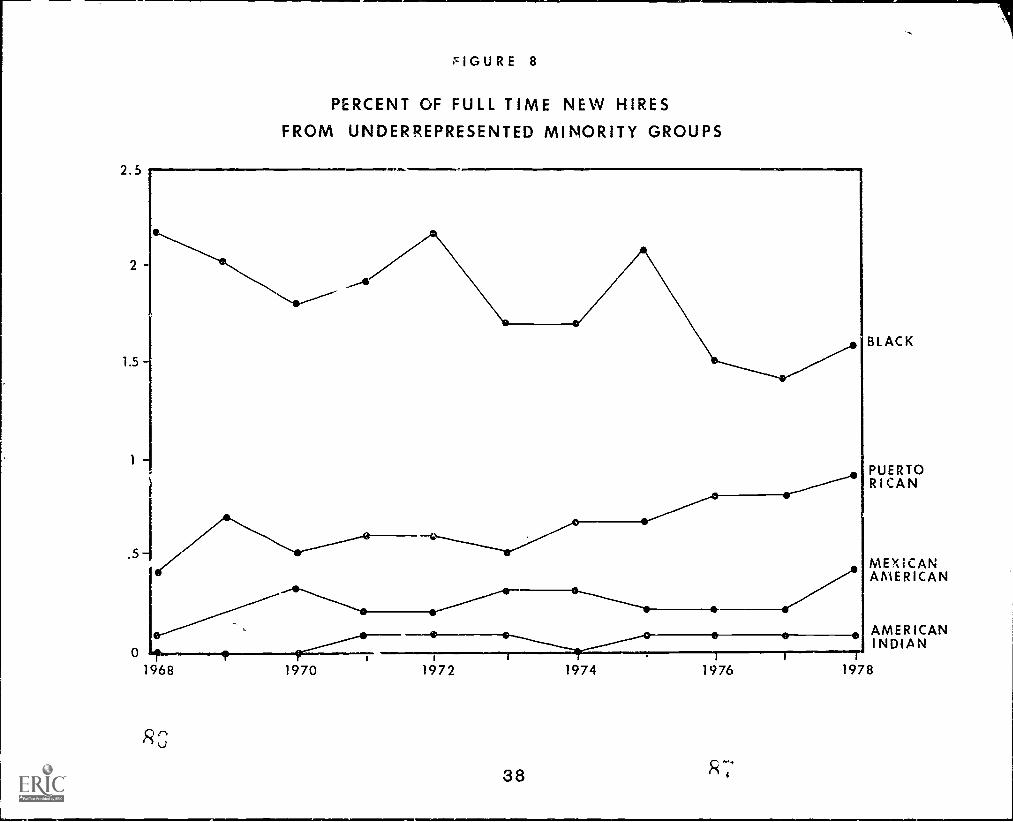
2.5
FIGURE 8
PERCENT OF FULL TIME NEW HIRESFROM UNDERREPRESENTED MINORITY GROUPS
2-
1.5
1
0
i
7:\BLACK
PUERTORICAN
e-/--- \.. .,_-e ( e
1968 1970
R^
r
1972 1974
38
I I I
MEXICANAMERICAN
AMERICANINDIAN
1976 1978
R 7
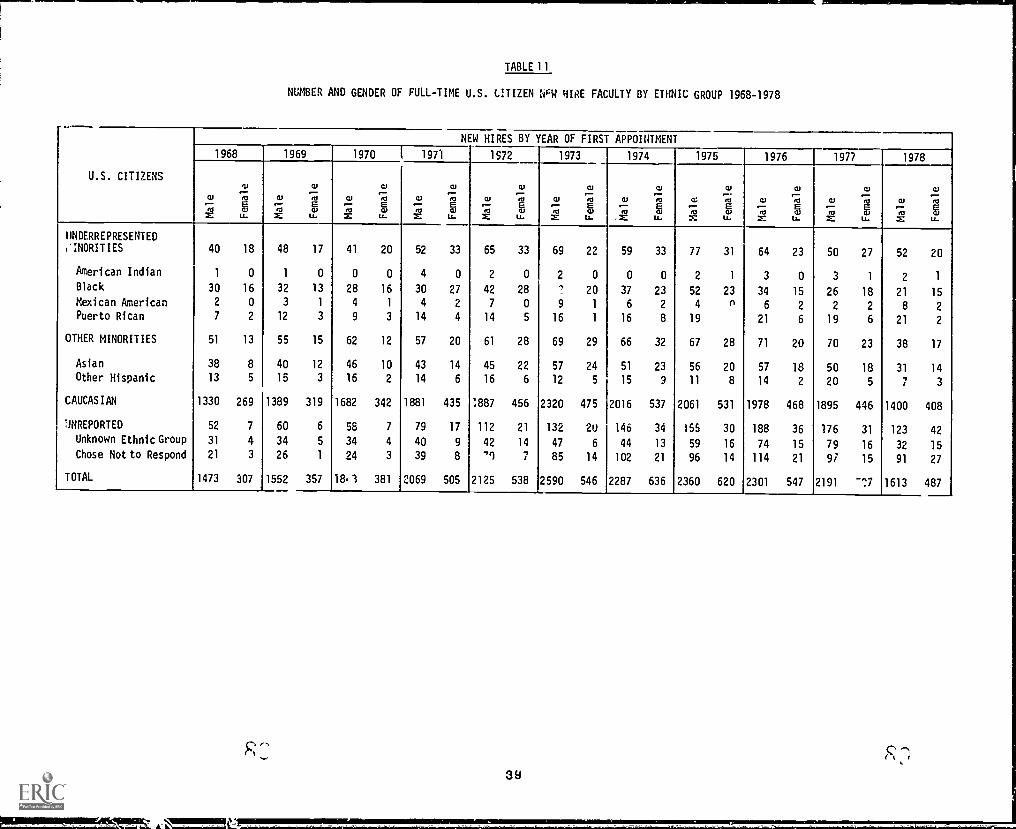
TABLE 11
NUMBER AND GENDER OF FULL-TIME U.S. CITIZEN VW HIRE FACULTY BY ETHNIC GROUP 1968-1978
U.S. CITIZENS
NEW HIRES BY YEAR OF FIRST APPOINTMENT
1968 1969 1970 1 1971 1572 1973 1974 1975 1976 1977 1978
E Ii LL u=
cu
cuLL
w of,ifT
70.
M rro
E;E
70x:
70
LL
UNDERREPRESENTED
40 18 48 17 41 20 52 33 65 33 69 22 59 33 77 31 64 23 50 27 52 20
American Indian 1 0 1 0 0 0 4 0 2 0 2 0 0 0 2 3 0 3 1 2 1
Black 30 16 32 13 28 16 30 27 42 28 20 37 23 52 23 34 15 26 18 21 15Mexican American 2 0 3 1 4 1 4 2 7 0 9 1 6 2 4 6 2 2 2 8 2Puerto RiCan 7 2 12 3 9 3 14 4 14 5 16 1 16 8 19 21 6 19 6 21 2
OTHER MINORITIES 51 13 55 15 62 12 57 20 61 28 69 29 66 32 67 28 71 20 70 23 38 17
Asian 38 8 40 12 46 10 43 14 45 22 57 24 51 23 56 20 57 18 50 18 31 14Other Hispanic 13 5 15 3 16 2 14 6 16 6 12 5 15 9 11 8 14 2 20 5 3
CAUCASIAN 1330 269 1389 319 1682 342 1881 435 1887 456 2320 475 2016 537 2061 531 1978 468 1895 446 1400 408
:JNREPORTED 52 7 60 6 58 7 79 17 112 21 132 2U 146 34 155 30 188 36 176 31 123 42Unknown Ethnic Group 31 4 34 5 34 4 40 9 42 14 47 6 44 13 59 16 74 15 79 16 32 15Chose Not to Respond 21 3 26 1 24 3 39 8 '9 7 85 14 102 21 96 14 114 21 9i 15 91 27
TOTAL 1473 307 1552 357 18.1 381 2069 505 2125 538 2590 546 2287 636 2360 620 2301 547 2191 1613 487
39
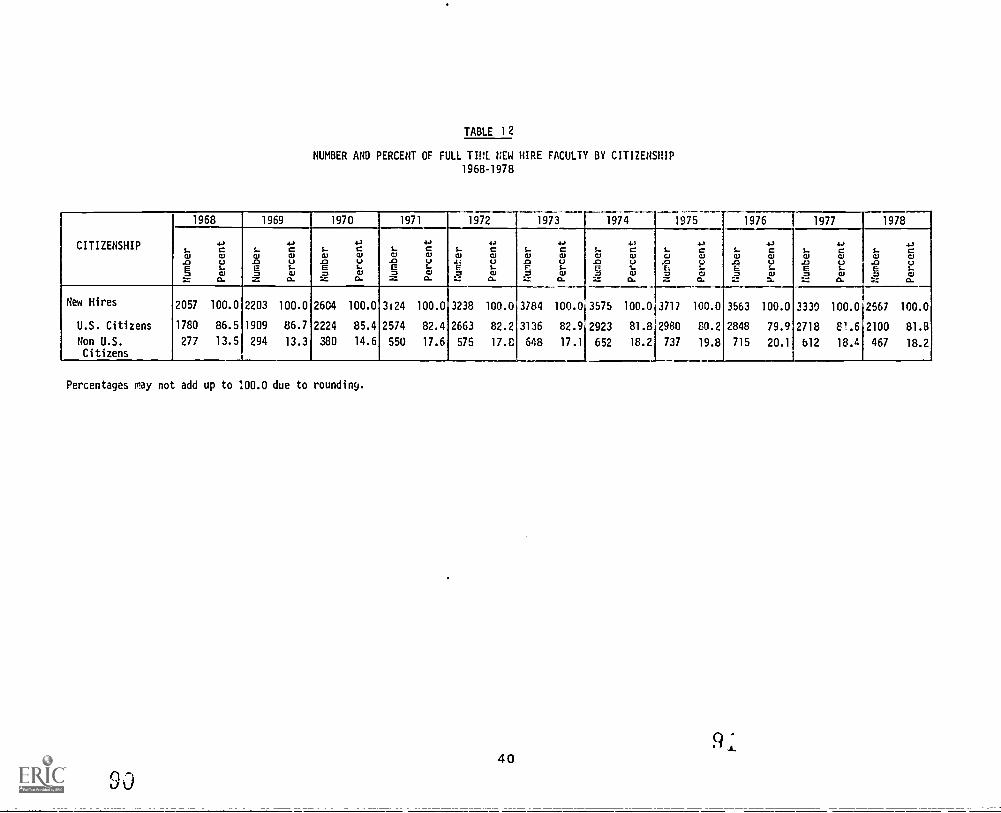
TABLE 12
NUMBER AND PERCENT OF FULL TIME NEW HIRE FACULTY BY CITIZENSHIP
1968-1978
1973- 1974 1975 1976 1977 19781968 1969 1970 1971 1972
CITIZENSHIP S..4,C L.
.0C S- C L.
a)
1,Ca)
1..41
4,CCU
L.CD
1,C4/
S..41
4.1C41
L.C1
4CC./
L.CU
4,C41
1..CU
4,C41
1..41
1,Cal.0 u .0 U .0 1.) .0 1.1
L..0
55: iiC
1-.! g :13:g riii 1 5Cf.' 5 I, 5 -;. 135. .; c't .ii, i:11!.
New Hires 2057 100.0 2203 100.0 2604 100.0 3i24 100.0 3238 100.0 3784 100.0 3575 100.0 3717 100.0 3563 100.0 3330 100.0 2567 100.0
U.S. Citizens 1780 86.5 1909 86.7 2224 85.4 2574 82.4 2663 82.2 3136 82.9 2923 81.8 2980 00.2 2848 79.9 2718 81.6
18.4
2100
467
81.8
18.2Non U.S. 277 13.5 294 13.3 380 14.6 550 17.6 575 17.8 648 17.1 652 18.2 737 19.8 715 20.1 612Citizens
Percentages may not add up to 100.0 due to rounding.
0 040
9 A.
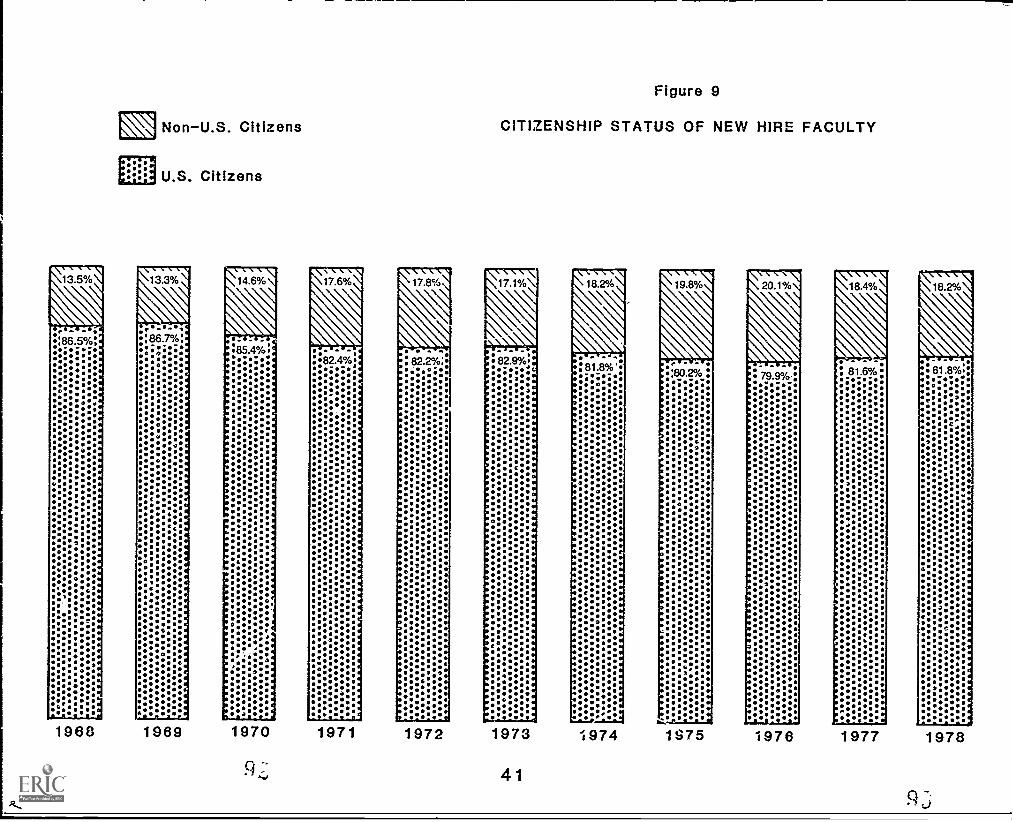
000000000000.1,0001104 000000.01:34,00000004400000W000000000000000000000000004.0.000.000410000.419rn0 4 0000001100 .000004100000 000000000000000I:600000000000400I0 00000000000000000000011000000000000000004100000410.00000
040000000000000000000,0000000000000000.0000000000000000000000000000000000000000000000080000000000000.00
41041004100460460410000000061000000000000000.000004.466644Trr,0610610000004100041006100004.04.000414141.41ci, 004.4.0004.00500 5000000000064.1000 0000/0000500034, 004.05100000.00000 0.0055555000041004100000000000000000000011.0alhiliMAAA4141AWitia.14.11.114Sia.0.2411.114ILLILILANLILL11124
i. ..6.0.00..5 0.,1,..o......................................................mi......................................................... IN...0000,00 00000.00000000
,._00000000000,400000000000000000000000000000000.0000000.00000000000000000000000000000000000000000000000000000.410.
0000000000000000000000000000000000000000000000000041,0
co
0)
titi0)
O OOOO 00000410644104011 555555....0004100000000000C1000.000w000 N.0000000000000000000000000000000000000000000.000W0004100100 0000000000 410000000410000000000000410000000041000000000000000041041000000, T.
00000000000000000000000000 000 60001.ei44054444414144414.54441414141***41414141414141414141415444164e0SrneW4104140444.444*0341414.4***41414141414,4irni441144141444441414141414141414144414141444141.4.44.444141444.44444 1.60000000041414
4.-.00000000000000000000000000400.00.0000414100000041000.000..0. CO031000000000000,0000040000000000000004.000000000000000000000000000000000000000001,00000000000000000000000000000000000
0004 3041440440411444505oei5511*e_1Ig0000000000000000000000000000000000W0000000000000011000000) II ft2,41770741%=1:11===4747474.Ve00000000000000000OOOOO 410000.0000 40004.0661000000000000004.0000004141000
0000000000000000000000000000000000000000004-4..400000000000000000000000000000000000000000000440004441007.4T9.0.07:471:074.0%%%70.4111=41.4.041u0,0000000610000000041000000061.
00000000006000000000000000000000000001000000000000000004100410011A0MillfmilA0001.60.0aa001100R0.00000241,90600.9000009,9001,0tOM
OOOOO 00000000000041,000000000000000000000000000000000000.0-.ft o n
I a, es,00410,000000400410000000000000041000000000400410041000C410000.000000090004000000000000000000000000000000000004100000CO 41600000000 .541001
000.00.0 wwiwu 0000 wwwwwwww06.,-wVww 1t,e0000041000000000000000000011000000000000000000060000000.0.000 11061,0000000000610000000000000000010000000000.0000 00
OOOOOO..........................................................
ew..0000000000000,000000,0000 000,000000000000000000000400000001).4Z10.0000000000000090000000000000000000000000000.0.000000000000tp...0000000000610000000000000000000000000,06161000000061.0000000040000000000003061000400001610seee**04004100000610000410004100
,Oww0000000000000000000000000000000000000000000040000000000..0m .iTTIPOOOOO 0000000200000000000000000000000000000000000000000000000000,Z1000000**00000000000000000000000000000004000000000000000410
R.010000041004146410041001.464146004604104604646004101.046410046004141004641.tlebeeeileseee410410004.000400400000006100000000000000
4
lww0000000. 00000000000000000000000000000400000000000000000000040e000000000000000000000000030000000000600000f0000000000000000.0000
N.CI)r-
ti
t*.0)1
0)r-
C)co
7
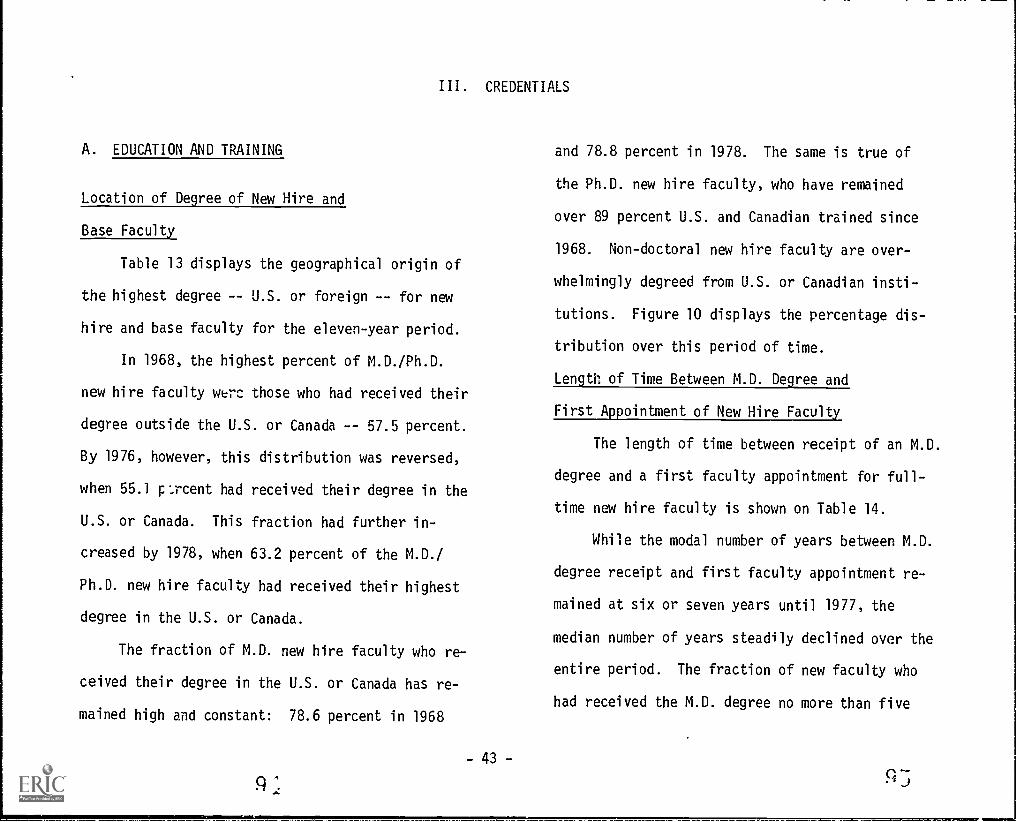
III. CREDENTIALS
A. EDUCATION AND TRAINING
Location of Degree of New Hire and
Base Faculty
Table 13 displays the geographical origin of
the highest degree -- U.S. or foreign -- for new
hire and base faculty for the eleven-year period.
In 1968, the highest percent of M.D./Ph.D.
new hire faculty were those who had received their
degree outside the U.S. or Canada -- 57.5 percent.
By 1976, however, this distribution was reversed,
when 55.1 percent had received their degree in the
U.S. or Canada. This fraction had further in-
creased by 1978, when 63.2 percent of the M.D./
Ph.D. new hire faculty had received their highest
degree in the U.S. or Canada.
The fraction of M.D. new hire faculty who re-
ceived their degree in the U.S. or Canada has re-
mained high and constant: 78.6 percent in 1968
-43-
and 78.8 percent in 1978. The same is true of
the Ph.D. new hire faculty, who have remained
over 89 percent U.S. and Canadian trained since
1968. Non-doctoral new hire faculty are over-
whelmingly degreed from U.S. or Canadian insti-
tutions. Figure 10 displays the percentage dis-
tribution over this period of time.
Length of Time Between M.D. Degree and
First Appointment of New Hire Faculty
The length of time between receipt of an M.D.
degree and a first faculty appointment for full-
time new hire faculty is shown on Table 14.
While the modal number of years between M.D.
degree receipt and first faculty appointment re-
mained at six or seven years until 1977, the
median number of years steadily declined over the
entire period. The fraction of new faculty who
had received the M.D. degree no more than five
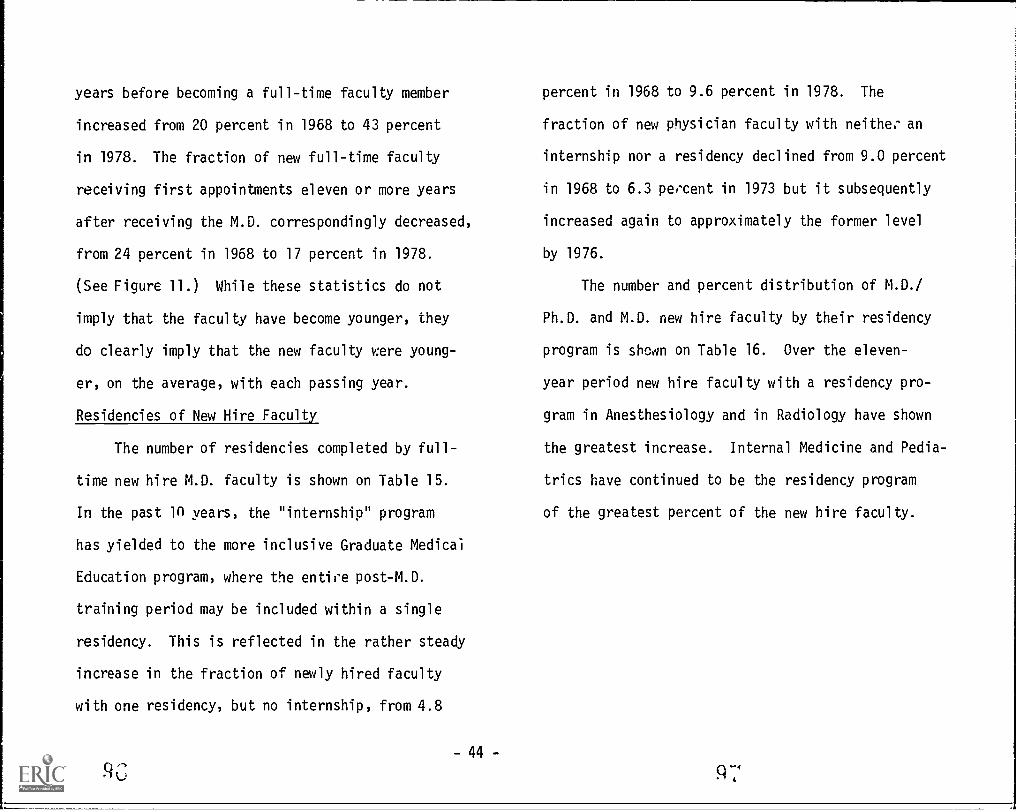
years before becoming a full-time faculty member
increased from 20 percent in 1968 to 43 percent
in 1978. The fraction of new full-time faculty
receiving first appointments eleven or more years
after receiving the M.D. correspondingly decreased,
from 24 percent in 1968 to 17 percent in 1978.
(See Figure 11.) While these statistics do not
imply that the faculty have become younger, they
do clearly imply that the new faculty were young-
er, on the average, with each passing year.
Residencies of New Hire Faculty
The number of residencies completed by full-
time new hire M.D. faculty is shown on Table 15.
In the past ln years, the "internship" program
has yielded to the more inclusive Graduate Medical
Education program, where the entire post-M.D.
training period may be included within a single
residency. This is reflected in the rather steady
increase in the fraction of newly hired faculty
with one residency, but no internship, from 4.8
-44-
percent in 1968 to 9.6 percent in 1978. The
fraction of new physician faculty with neither an
internship nor a residency declined from 9.0 percent
in 1968 to 6.3 percent in 1973 but it subsequently
increased again to approximately the former level
by 1976.
The number and percent distribution of M.D./
Ph.D. and M.D. new hire faculty by their residency
program is shoal on Table 16. Over the eleven-
year period new hire faculty with a residency pro-
gram in Anesthesiology and in Radiology have shown
the greatest increase. Internal Medicine and Pedia-
trics have continued to be the residency program
of the greatest percent of the new hire faculty.
q 4
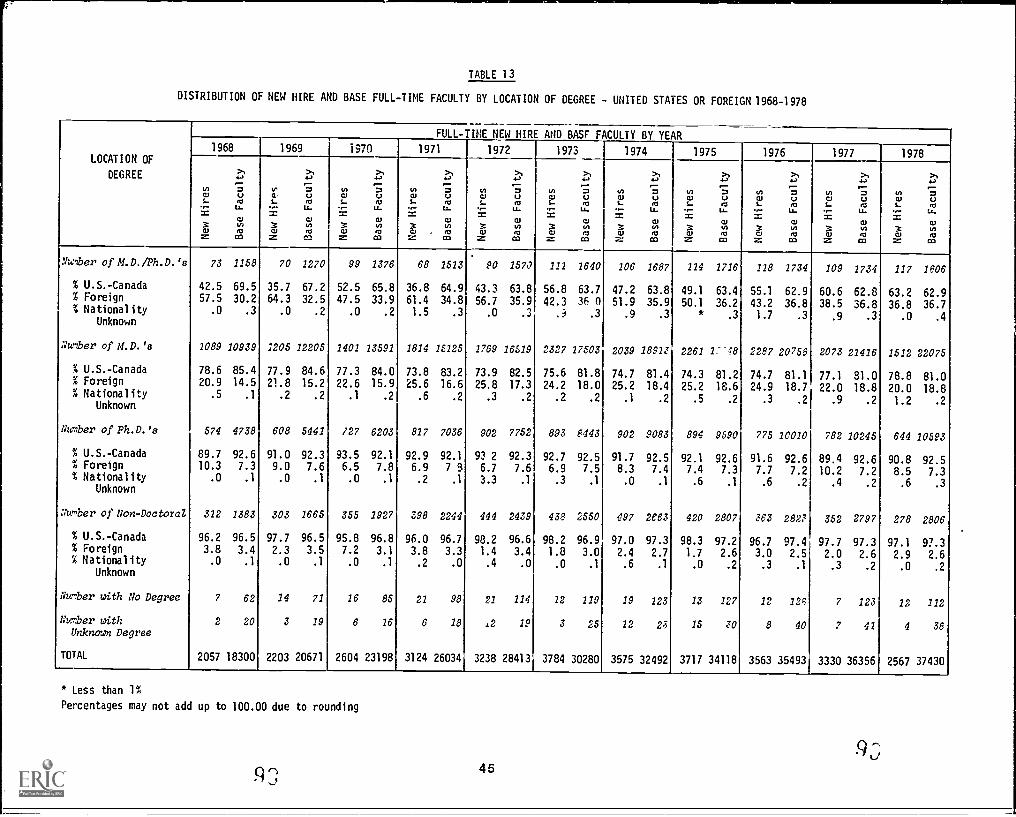
TABLE 13
DISTRIBUTION OF NEW HIRE AND BASE FULL-TIME FACULTY BY LOCATION OF DEGREE - UNITED STATES OR FOREIGN 1968-1978
LOCATION OF
DEGREE
FULL-TIME NEW HIRE AND BASF FACULTY BY YEAR
1968 1969 1970 1971 1972 1973 1974 1975 1976 1977 1978
inCUS-
=alZ
,;U33
WV)alCO
trCL
S-
=XalZ
>,4>
S.U33
aIA21
02
InCU
S-
=3CUZ
3.14>;Lsrt1
Wsn.1:1
CO
InCU
S-
=3W .z
3.14>
f;u33
Wsnr0CO
VICllS-
=XCUZ
'.'7Ur3
Win
.1:1
CO
inWS-
=XWZ
>,a>
GUr3
Wvsr303
v,3.1S-
=Xal2:
.rt-)7C.,r3
asr1r3
03
trlWS-
=3CllZ
3.14>
7u63
W1411:1
CO
InCUS-
=XCU=
>,4>
.;I-1r3
Win.1:1
CO
inCUS-
;CllZ
>,4>
7I-1r3
L'.Wvl.1:1
CO
VICUS-
;CUZ
>,4>
7-I-1r3
U.Winr0
CO
:II4rIber of M.D. /Ph.D.'s 73 1158 70 1270 99 1376 68 1513 90 1570 111 1640 106 1687 114 1716 118 1734 109 1734 117 1806
% U.S.-Canada 42.5 69.5 35.7 67.2 52.5 65.8 36.8 64.9 43.3 63.8 56.8 63.7 47.2 63.8 49.1 63.4 55.1 62.9 60.6 62.8 63.2 62.9% Foreign 57.5 30.2 64.3 32.5 47.5 33.9 61.4 34.8 56.7 35.9 42.3 36 0 51.9 35.9 50.1 36.2 43.2 36.8 38.5 36.8 36.8 36.7% Nationality .0 .3 .0 .2 .0 .2 1.5 .3 .0 .3 .9 .3 .9 .3 * .3 1.7 .3 .9 .3 .0 .4Unknown
Nunber of M.D. '13 1089 10939 1205 12205 1401 13591 1814 15125 1769 26.519 2327 17503 2039 1891 2261 1" 48 2287 20758 2073 21416 1512 22075
% U.S.-Canada 78.6 85.4 77.9 84.6 77.3 84.0 73.8 83.2 73.9 82.5 75.6 81.8 74.7 81.4 74.3 81.2 74.7 81.1 77.1 81.0 78.8 81.0% Foreign 20.9 14.5 21.8 15.2 22.6 15.9 25.6 16.6 25.8 17.3 24.2 18.0 25.2 18.4 25.2 18.6 24.9 18.7 22.0 18.8 20.0 18.8% Nationality .5 .1 .2 .2 .1 .2 .6 .2 .3 .2 .2 .2 .1 .2 .5 .2 .3 .2 .9 .2 1.2 .2Unknown
Number of Ph.D. 'a 574 4738 608 5441 127 6203 817 7036 902 7752 893 8443 902 9083 894 9590 775 10010 282 10245 644 10593
% U.S.-Canada 89.7 92.6 91.0 92.3 93.5 92.1 92.9 92.1 93 2 92.3 92.7 92.5 91.7 92.5 92.1 92.6 91.6 92.6 89.4 92.6 90.8 92.5% Foreign 10.3 7.3 9.0 7.6 6.5 7.8 6.9 7 3 6.7 7.6 6.9 7.5 8.3 7.4 7.4 7.3 7.7 7.2 10.2 7.2 8.5 7.3% Nationality .0 .1 .0 .1 .0 .1 .2 .1 3.3 .1 .3 .1 .0 .1 .6 .1 .6 .2 .4 .2 .6 .3
Unknown
Vumber of Non- Doctoral 312 1383 303 1665 355 1927 398 2244 444 2439 438 2550 497 2663 420 2807 363 282? 352 2797 278 2806
% U.S.-Canada 96.2 96.5 97.7 96.5 95.8 96.8 96.0 96.7 98.2 96.6 98.2 96.9 97.0 97.3 98.3 97.2 96.7 97.4 97.7 97.3 97.1 97.3% Foreign 3.8 3.4 2.3 3.5 7.2 3.1 3.8 3.3 1.4 3.4 1.8 3.0 2.4 2.7 1.7 2.6 3.0 2.5 2.0 2.6 2.9 2.6% Nationality .0 .1 .0 .1 .0 .1 .2 .0 .4 .0 .0 .1 .6 .1 .0 .2 .3 .1 .3 .2 .0 .2
Unknown
Nzeber with No Degree 7 62 14 71 16 85 21 98 21 114 12 119 19 123 13 127 12 126 7 123 12 112
Number with 2 20 3 19 6 16 6 18 A2 19 3 25 12 23 15 30 8 40 7 41 4 38Unknown Degree
TOTAL 2057 18300 2203 20671 2604 23198 3124 26034 3238 28413 3784 30280 3575 32492 3717 34118 3563 35493 3330 36356 2567 37430
* Less than 1%
Percentages may not add up to 100.00 due to rounding
45
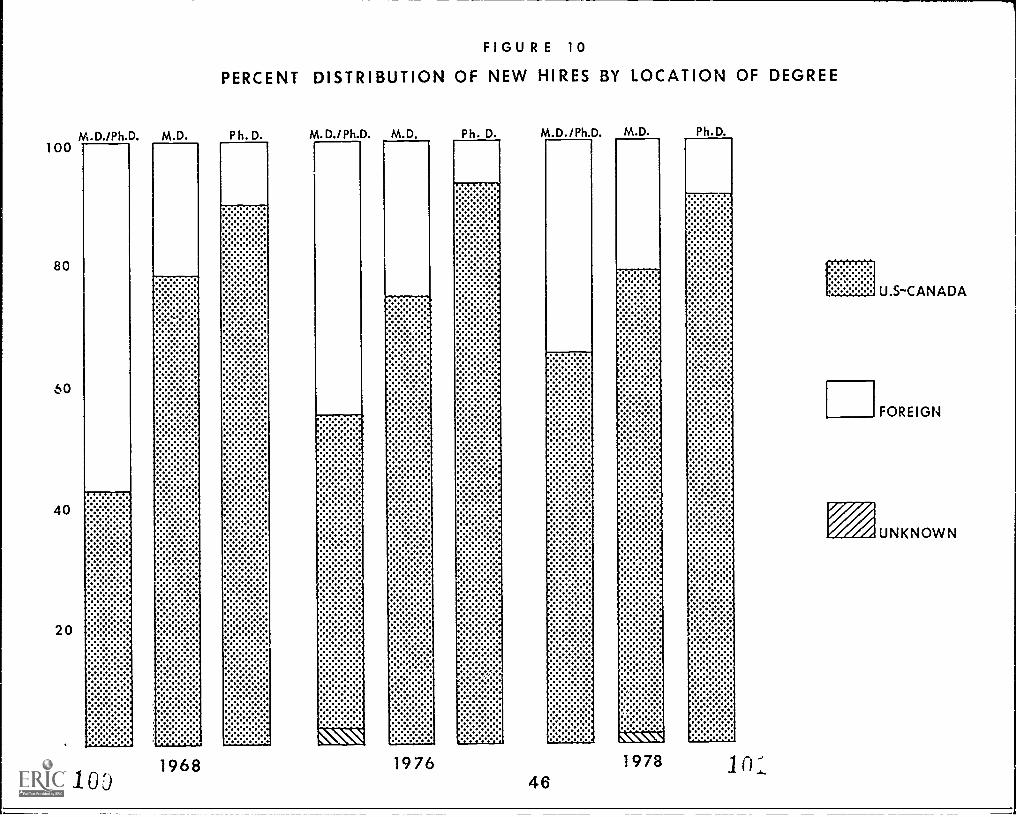
100
80
60
40
20
M.D./Ph.D. M.D.
1001968
FIGURE 10
PERCENT DISTRIBUTION OF NEW HIRES BY LOCATION OF DEGREE
Ph. D. M.D./Ph.D. M.D. Ph. D.
1976
M.D./Ph.D. M.D. Ph.D.
461978 1n:
::::::::::::.:::::,
/X
U S-CANADA
FOREIGN
UNKNOWN
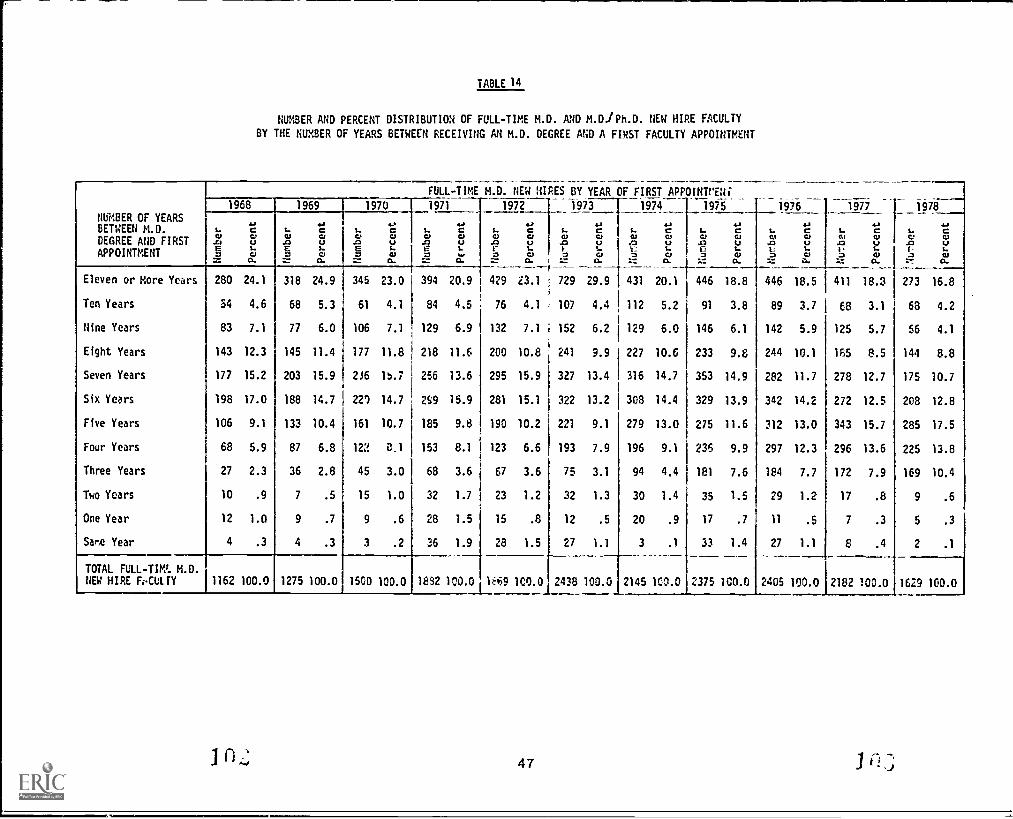
TABLE 14
NUMBER AND PERCENT DISTRIBUTION OF FULL -TIME M.D. AND M.DiPh.0. NEW HIRE FACULTY
BY THE NUMBER OF YEARS BETWEEN RECEIVING AN M.D. DEGREE AND A FIRST FACULTY APPOINTMENT
NUMBER OF YEARSBETWEEN M.D.
DEGREE AND FIRSTAPPOINTMENT
1968 1969 1970
Sf
=V0a.
CJ.0
CJ0.
I..QE=--
4.ACuuwa.
Eleven or More Years 280 24.1 318 24.9 345 23.0
Ten Years 54 4.6 68 5.3 61 4.1
Nine Years 83 7.1 77 6.0 106 7.1
Eight Years 143 12.3 145 11.4 177 11.8
Seven Years 177 15.2 203 15.9 2i6 lb.7
Six Years 198 17.0 188 14.7 221 14.7
Five Years 106 9.1 133 10.4 161 10.7
Four Years 68 5.9 87 6.8 12 em
Three Years 27 2.3 36 2.8 45 3.0
Two Years 10 .9 7 .5 15 1.0
One Year 12 1.0 9 .7 9 .6
Sane Year 4 .3 4 3 .2
TOTAL FULL-TIM M.D.NEW HIRE FoCULTY 1162 100.0 1275 100.0 1500 100.0
FULL-TIME M.D. NEW HIRES BY YEAR OF FIRST APPOINTVEN
1971
4,I. CCJ c.,
_a i.)
394 20.9
84 4.5
129 6.9
218 11.6
256 13.6
259 15.4
185 9.8
153 8.1
68 3.6
32 1.7
28 1.5
36 1.9
1832 100.0
1972 1973 1974
CJ
4J
UCI
G.
1975 1976
C.1.o
1977 _
I. CCl CJ.0 1,i . 1..=
1978
I.C.
0
4,CCJ
I.CJ
I.c.,.0r0
..d.Ceti.)uwa.
CI
=
as
LC:
z
CCIUuCJ0.
4,C01,I.CJ
429 23.1 1 729 29.91 431 20.1 446 18.8 446 18.5 411 18.3 273 16.8
76 4.1 1 107 4.4 112 5.2 91 3.8 89 3.7 68 3.1 68 4.2
132 7.1 152 6.2 129 6.0 146 6.1 142 5.9 125 5.7 56 4.1
200 10.8 241 9.9 227 10.6 233 9.8 244 10.1 185 8.5 144 8.8
295 15.9 327 13.4 316 14.7 353 14.9 282 11.7 278 12.7 175 10.7
281 15.1 322 13.2 308 14.4 329 13.9 342 14.2 272 12.5 208 12.8
190 10.2 221 9.1 279 13.0 275 11.6 212 13.0 343 15.7 285 17.5
123 6.6 193 7.9 196 9.1 236 9.9 297 12.3 296 13.6 225 13.8
67 3.6 75 3.1 94 4.4 181 7.6 184 7.7 172 7.9 169 10.4
23 1.2 32 1.3 30 1.4 35 1.5 29 1.2 17 .8 9 .6
15 .8 12 .5 20 .9 17 .7 11 .5 7 .3 5 .3
28 1.5 27 1.1 3 .1 33 1.4 27 1.1 8 .4 2 .1
1r69 100.0 2438 100.0 2145 100.0 2315 100.0 2405 100.0 2182 100.0 1629 100.0
47 I
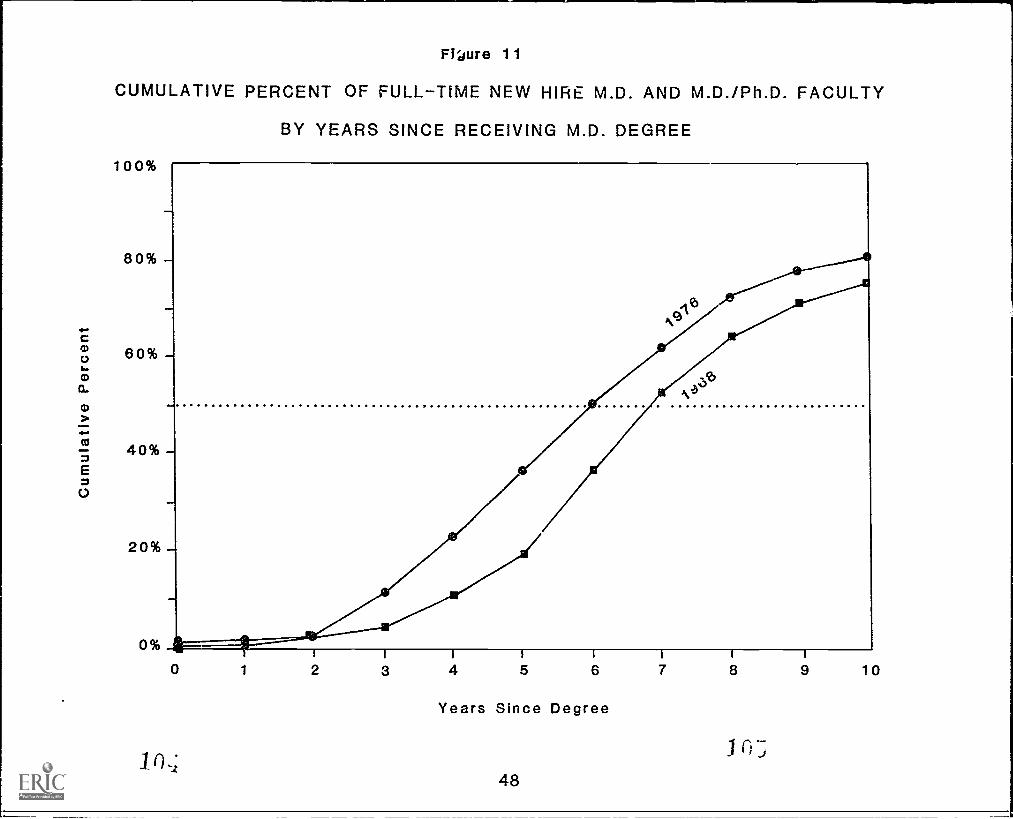
Figure 11
CUMULATIVE PERCENT OF FULLTIME NEW HIRE M.D. AND M.D./Ph.D. FACULTY
BY YEARS SINCE RECEIVING M.D. DEGREE
100%
80%-
60% -
40%
20%
o% I0 1 2 6
Years Since Degree
48
8 9 10
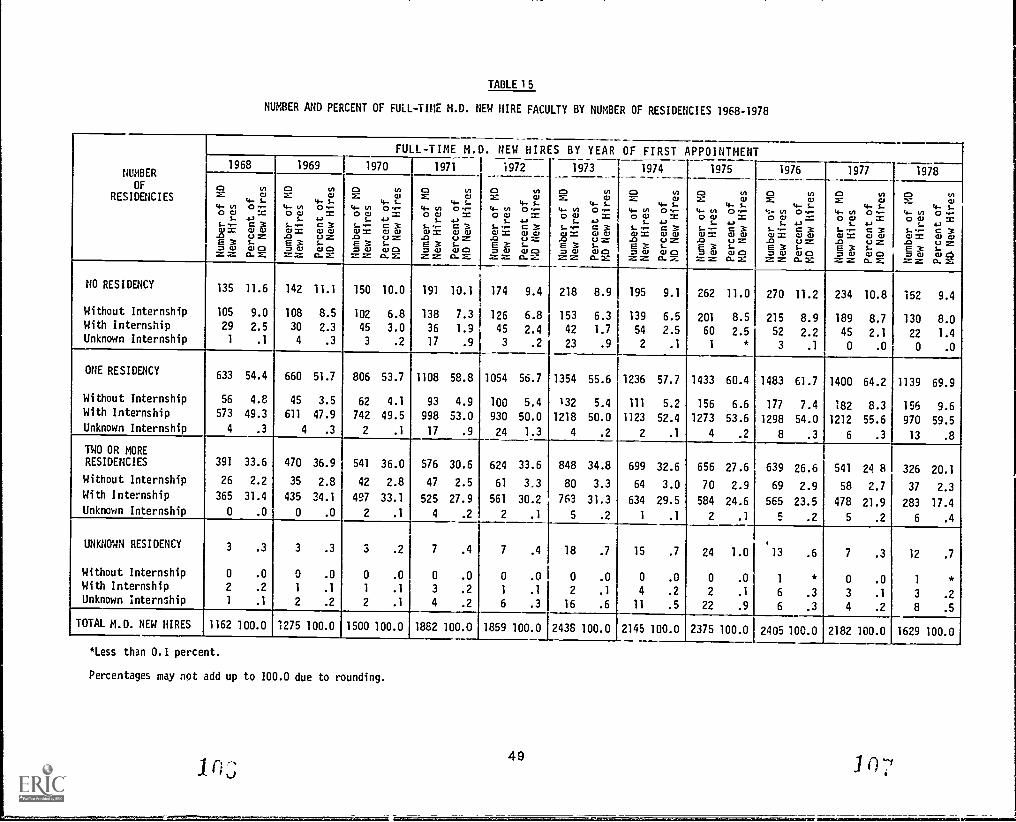
TABLE 15
NUMBER AND PERCENT OF FULL-TIME M.D. NEW HIRE FACULTY BY NUMBER OF RESIDENCIES 1968-1978
NUMBEROF
RESIDENCIES
FULL-TIME M.D. NEW HIRES
1972
BY
1973
YEAR OF FIRST APPOINTMENT1968 1969 1970 1971 1974
0 074: 4- S.-ej4- w 0.,0 0 1
S. 1.3C--..- C 3Cl = Cl C.1.0 LI ZE3 S...= Cl Cl 0Z.7- Cl. 7:
1975 1976 1977 1978
0z4- 00 Cl
S-L..-Cl =.0E3= Cl= =
.4.. wt.-0 .-=4-.C 30 ClLI ZS..Cl 0ct. Z
c:3 0= 4- 'VS-4- 0 0 ...-0 C.1 =
S.. 1.3S.-v.- C 30 = Cl C.1.0 C.) ZE3 S.= Cl 0 0Z = a. I,:
aZ4- 00 C.1
S.-S...,-Cl =.0E3= Cl= =
04 - L.°0 ..-=4-3C 3Cl CULI ZS-Cl 0a. =
aZ4- 00 C.1
S-S.-.6-Cl =.0E3= ClZS
.5_0
0 .-=4.3C 3Cl ClLI ZS.Cl 0
Cl.
a=4- vl0 CI
S.i-.Cl =.0E3= cu= =
0C)
4- s..0.,=1.3C 3Cl 0LI =S-Cl ci
a. :2:
ca>7.
4- 00 C.1
S.f--C. I S.0E3= Clz =
04 - WS-0-,=1.3C 3Cs) ClLI =S-Cl 0ct. =
ca
Z4- w0 0
5..C--,--Cl =.0E X= Cl= =
.Lai
0.,=1.3C 3CU ClLI ZS..cu 0a- Z
c=1=4- w0 Cl
5..C--..-C.1 =-0E X= Cl= =
004- S-0.,=
1.3C 3Cl Cl(.) ZS-a; 0a. Z
a=4-, 00 Cl
S.S-....-CU S.0E3= Cl= =
04- 4-15-0.,=1.3C 3CJ C)US5-Cl 0a. =
Ci=4- 00 Cli.S-..-Cl =.0E3= Cl= z
4- S.-0
0 --S1.3C
ClClLI ZS.Cla.
NO RESIDENCY 135 11.6 142 11.1 150 10.0 191 10.1 174 9.4 218 8.9 195 9.1 262 11.0 270 11.2 234 10.8 152 9.4
Without Internship 105 9.0 108 8.5 102 6.8 138 7.3 126 6.8 153 6.3 139 6.5 201 8.5 215 8.9 189 8.7 130 8.0With Internship 29 2.5 30 2.3 45 3.0 36 1.9 45 2.4 42 1.7 54 2.5 60 2.5 52 2.2 45 2.1 22 1.4Unknown Internship 1 .1 4 .3 3 .2 17 .9 3 .2 23 .9 2 .1 1 * 3 .1 0 .0 0 .0
ONE RESIDENCY633 54.4 660 51.7 806 53.7 1108 58.8 1054 56.7 1354 55.6 1236 57.7 1433 60.4 1483 61.7 1400 64.2 1139 69.9
Without Internship 56 4.8 45 3.5 62 4.1 93 4.9 100 5.4 132 5.4 111 5.2 156 6.6 177 7.4 182 8.3 156 9.6With Internship 573 49.3 611 47.9 742 49.5 998 53.0 930 50.0 1218 50.0 1123 52.4 1273 53.6 1298 54.0 1212 55.6 970 59.5Unknown Internship 4 .3 4 .3 2 .1 17 .9 24 1.3 4 .2 2 .1 4 .2 8 .3 6 .3 13 .8
TWO OR MORE
RESIDENCIES 391 33.6 470 36.9 541 36.0 576 30.6 624 33.6 848 34.8 699 32.6 656 27.6 639 26.6 541 24 8 326 20.1Without internship 26 2.2 35 2.8 42 2.8 47 2.5 61 3.3 80 3.3 64 3.0 70 2.9 69 2.9 58 2.7 37 2.3With Internship 365 31.4 435 34.1 497 33.1 525 27.9 561 30.2 763 31.3 634 29.5 584 24.6 565 23.5 478 21.9 283 17.4Unknown Internship 0 .0 0 .0 2 .1 4 .2 2 .1 5 .2 1 .1 2 .1 5 .2 5 .2 6 .4
UNKNOWN RESIDENCY 3 .3 3 .3 3 .2 7 .4 7 .4 18 .7 15 .7 24 1.0 113 .6 7 .3 12 .7
Without Internship 0 .0 0 .0 0 .0 0 .0 0 .0 0 .0 0 .0 0 .0 1 0 .0 1 *With Internship 2 .2 1 .1 1 .1 3 .2 1 .1 2 .1 4 .2 2 .1 6 .3 3 .1 3 .2Unknown internship 1 .1 2 .2 2 .1 4 .2 6 .3 16 .6 11 .5 22 .9 6 .3 4 .2 8 .5
TOTAL M.D. NEW HIRES 1162 100.0 1275 100.0 1500 100.0 1882 100.0 1859 100.0 2438 100.0 2145 100.0 2375 100.0 2405 100.0 2182 100.0 1629 100.0
*Less than 0.1 percent.
Percentages may not add up to 100.0 due to rounding.
10,349
1
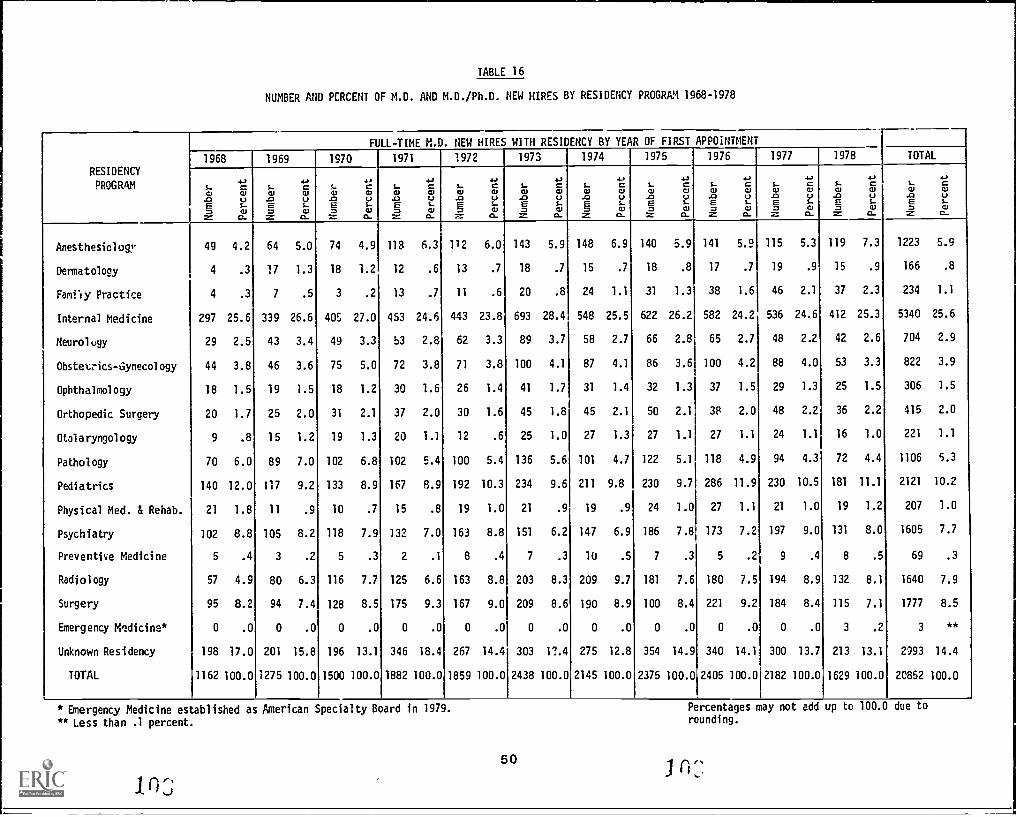
TABLE 16
NUMBER AND PCRCENT OF M.D. AND M.D./Ph.D. NEW HIRES BY RESIDENCY PROGRAM 1968-1978
RESIDENCY
PROGRAM
FULL-TIME M.D. NEW HIRES WITH RESIDENCY BY YEAR OF FIRST APPOINTMENT
1968 1969 1970 1971 1972 1973 1974 1975 1976 1977 1978 TOTAL
5,-.C/.0E72
4-,0elVs-el
12-
5-el.0E72
Cel(jS-el0-
5.LL,.0E=2
CelVS..el
C.
S.CJ.0E72
Cel0S.el0-
5-el.0E72
CelVs-CJ0-
5-el.0e72
CelVs-0a-
5-el.0E=2
CCJVs-el0-
5-el.0E=2
CelVs-el0-
5.CU.0E=2
CelVs-CD0-
..CU.0E=
CelUs-Cl0-
L.el.0E72
CelVS-el
01
5-el.0E=2
=CUssS.elC-
Anesthesiolov 49 4.2 64 5.0 74 4.9 118 6.3 112 6.0 143 5.9 148 6.9 140 5.9 141 5.9 115 5.3 119 7.3 1223 5.9
Dermatology 4 .3 37 1.3 18 1.2 12 .6 13 .7 18 .7 15 .7 18 .8 17 .7 19 .9 15 .9 166 .8
Family Practice 4 .3 7 .5 3 .2 13 .7 11 .6 20 .8 24 1.1 31 1.3 38 1.6 46 2.1 37 2.3 234 1.1
Internal Medicine 297 25.6 339 26.6 405 27.0 453 24.6 443 23.8 693 28.4 548 25.5 622 26.2 582 24.2 536 24.6 412 25.3 5340 25.6
Neurolcv 29 2.5 43 3.4 49 3.3 53 2.8 62 3.3 89 3.7 58 2.7 66 2.8 65 2.7 48 2.2 42 2.6 704 2.9
Obstetrics-Gynecology 44 3.8 46 3.6 75 5.0 72 3.8 71 3.8 100 4.1 87 4.1 86 3.6 100 4.2 88 4.0 53 3.3 822 3.9
Ophthalmology 18 1.5 19 1.5 18 1.2 30 1.6 26 1.4 41 1.7 31 1.4 32 1.3 37 1.5 29 1.3 25 1.5 306 1.5
Orthopedic Surgery 20 1.7 25 2.0 31 2.1 37 2.0 30 1.6 45 1.8 45 2.1 50 2.1 38 2.0 48 2.2 36 2.2 415 2.0
Otolaryngology 9 .8 15 1.2 19 1.3 20 1.1 12 .6 25 1.0 27 1.3 27 1.1 27 1.1 24 1.1 16 1.0 221 1.1
Pathology 70 6.0 89 7.0 102 6.8 102 5.4 100 5.4 136 5.6 101 4.7 122 5.1 118 4.9 94 4.3 72 4.4 1106 5.3
Pediatrics 140 12.0 117 9.2 133 8.9 167 8.9 192 10.3 234 9.6 211 9.8 230 9.7 286 11.9 230 10.5 181 11.1 2121 10.2
Physical Med. & Rehab. 21 1.8 11 .9 10 .7 15 .8 19 1.0 21 .9 19 .9 24 1.0 27 1.1 21 1.0 19 1.2 207 1.0
Psychiatry 102 8.8 105 8.2 118 7.9 132 7.0 163 8.8 151 6.2 147 6.9 186 7.8 173 7.2 197 9.0 131 8.0 1605 7.7
Preventive Medicine 5 .4 3 .2 5 .3 2 .1 8 .4 7 .3 10 .5 7 .3 5 .2 9 .4 8 .5 69 .3
Radiology 57 4.9 80 6.3 116 7.7 125 6.6 163 8.8 203 8.3 209 9.7 181 7.6 180 7.5 194 8.9 132 8.1 1640 7.9
Surgery 95 8.2 94 7.4 128 8.5 175 9.3 167 9.0 209 8.6 190 8.9 100 8.4 221 9.2 184 8.4 115 7.1 1777 8.5
Emergency Medicine* 0 .0 0 .0 0 .0 0 .0 0 .0 0 .0 0 .0 0 .0 0 .0 0 .0 3 .2 3 **
Unknown Residency 198 17.0 201 15.8 196 13.1 346 18.4 267 14.4 303 1?.4 275 12.8 354 14.9 340 14.1 300 13.7 213 13.1 2993 14.4
TOTAL 1162 100.0 1275 100.0 1500 100.0 1882 100.0 1859 100.0 2438 100.0 2145 100.0 2375 100.0 2405 100.0 2182 100.0 1629 100.0 20852 100.0
Emergency Medicine established as American Specialty Board in 1979.
** Less than .1 percent.
50
Percentages may not add up to 100.0 due to
rounding.
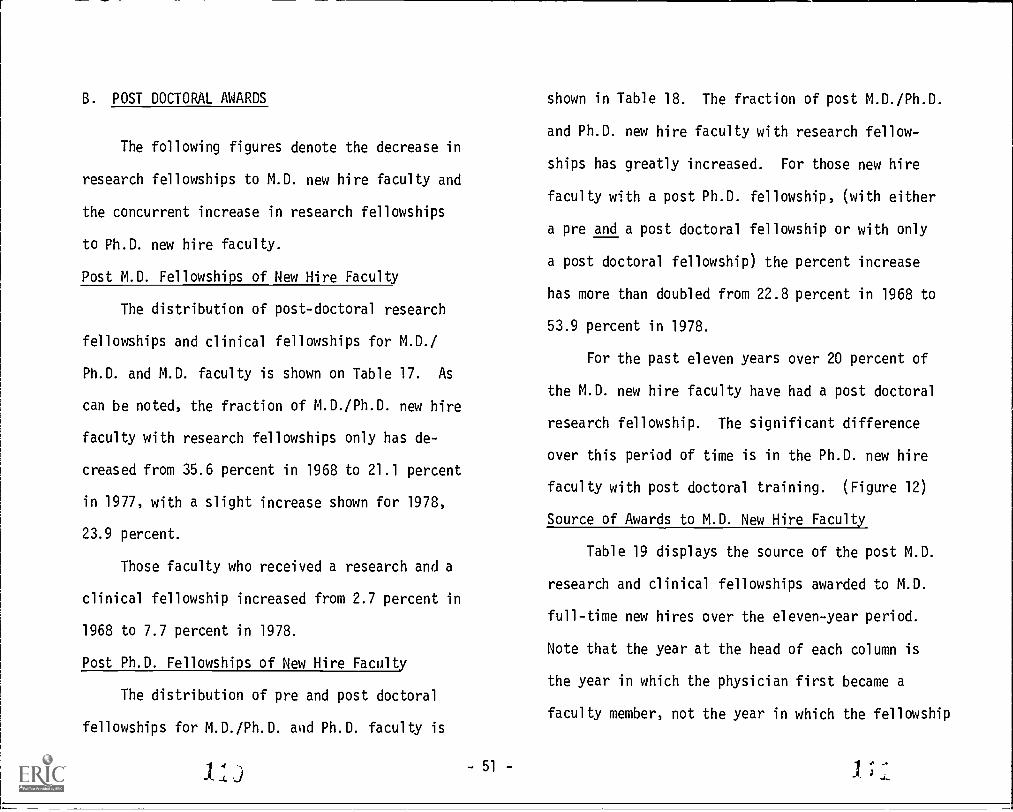
B. POST DOCTORAL AWARDS
The following figures denote the decrease in
research fellowships to M.D. new hire faculty and
the concurrent increase in research fellowships
to Ph.D. new hire faculty.
Post M.D. Fellowships of New Hire Faculty
The distribution of post-doctoral research
fellowships and clinical fellowships for M.D./
Ph.D. and M.D. faculty is shown on Table 17. As
can be noted, the fraction of M.D./Ph.D. new hire
faculty with research fellowships only has de-
creased from 35.6 percent in 1968 to 21.1 percent
in 1977, with a slight increase shown for 1978,
23.9 percent.
Those faculty who received a research and a
clinical fellowship increased from 2.7 percent in
1968 to 7.7 percent in 1978.
Post Ph.D. Fellowships of New Hire Faculty
The distribution of pre and post doctoral
fellowships for M.D./Ph.D. and Ph.D. faculty is
- 51 -
shown in Table 18. The fraction of post M.D./Ph.D.
and Ph.D. new hire faculty with research fellow-
ships has greatly increased. For those new hire
faculty with a post Ph.D. fellowship, (with either
a pre and a post doctoral fellowship or with only
a post doctoral fellowship) the percent increase
has more than doubled from 22.8 percent in 1968 to
53.9 percent in 1978.
For the past eleven years over 20 percent of
the M.D. new hire faculty have had a post doctoral
research fellowship. The significant difference
over this period of time is in the Ph.D. new hire
faculty with post doctoral training. (Figure 12)
Source of Awards to M.D. New Hire Faculty
Table 19 displays the source of the post M.D.
research and clinical fellowships awarded to M.D.
full-time new hires over the eleven-year period.
Note that the year at the head of each column is
the year in which the physician first became a
faculty member, not the year in which the fellowship
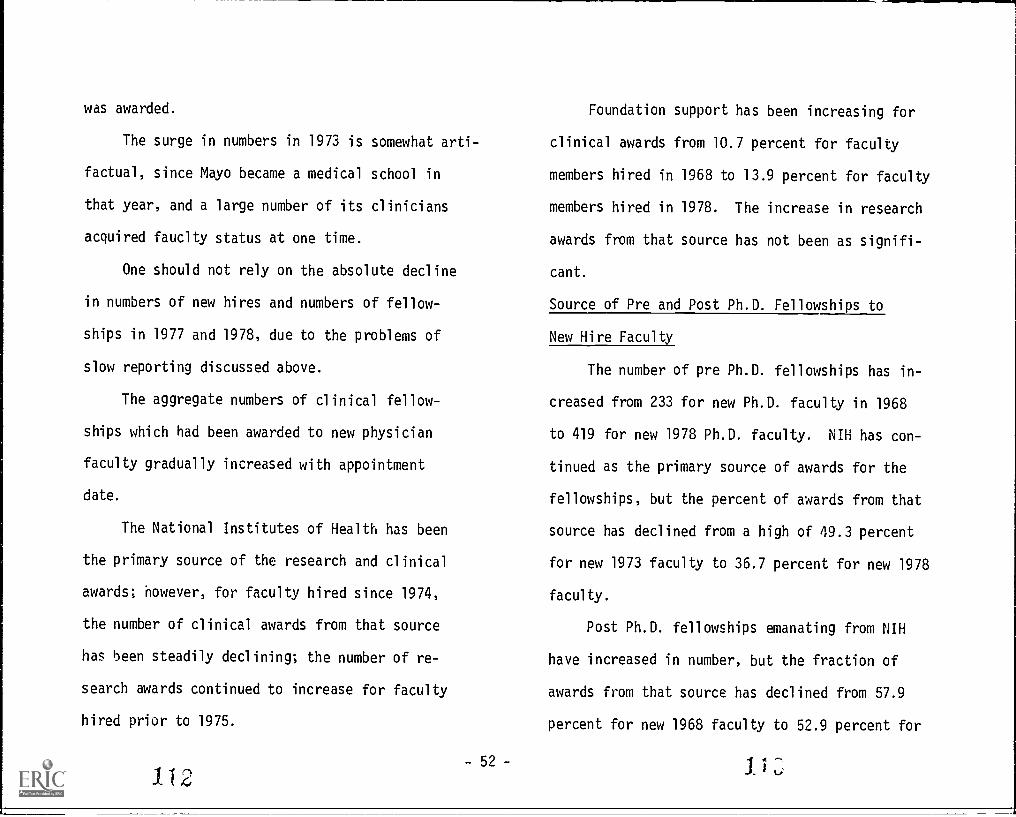
was awarded.
The surge in numbers in 1973 is somewhat arti-
factual, since Mayo became a medical school in
that year, and a large number of its clinicians
acquired fauclty status at one time.
One should not rely on the absolute decline
in numbers of new hires and numbers of fellow-
ships in 1977 and 1978, due to the problems of
slow reporting discussed above.
The aggregate numbers of clinical fellow-
ships which had been awarded to new physician
faculty gradually increased with appointment
date.
The National Institutes of Health has been
the primary source of the research and clinical
awards; however, for faculty hired since 1974,
the number of clinical awards from that source
has been steadily declining; the number of re-
search awards continued to increase for faculty
hired prior to 1975.
- 52 -
1 12
Foundation support has been increasing for
clinical awards from 10.7 percent for faculty
members hired in 1968 to 13.9 percent for faculty
members hired in 1978. The increase in research
awards from that source has not been as signifi-
cant.
Source of Pre and Post Ph.D. Fellowships to
New Hire Faculty
The number of pre Ph.D. fellowships has in-
creased from 233 for new Ph.D. faculty in 1968
to 419 for new 1978 Ph.D. faculty. NIH has con-
tinued as the primary source of awards for the
fellowships, but the percent of awards from that
source has declined from a high of 49.3 percent
for new 1973 faculty to 36.7 percent for new 1978
faculty.
Post Ph.D. fellowships emanating from NIH
have increased in number, but the fraction of
awards from that source has declined from 57.9
percent for new 1968 faculty to 52.9 percent for
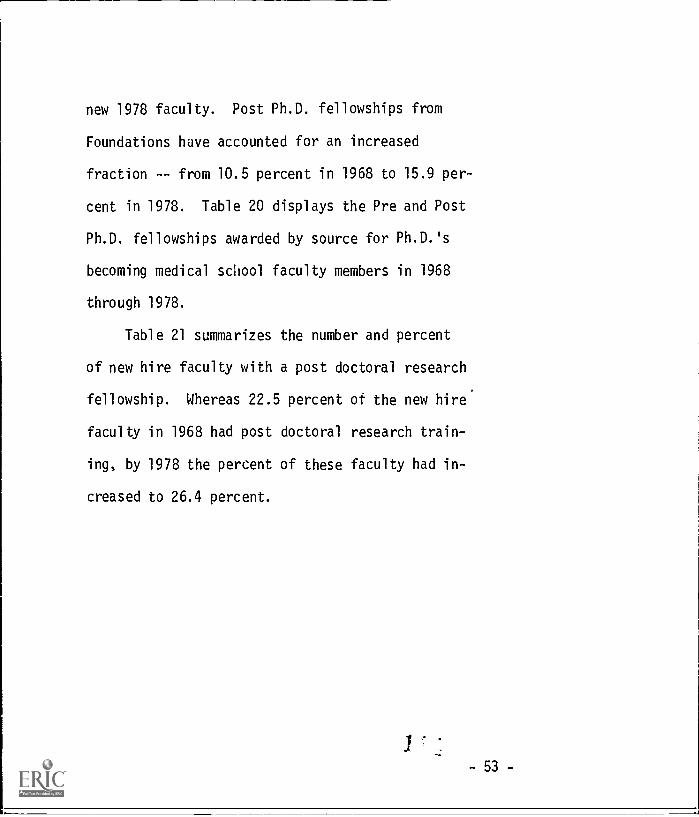
new 1978 faculty. Post Ph.D. fellowships from
Foundations have accounted for an increased
fraction -- from 10.5 percent in 1968 to 15.9 per-
cent in 1978. Table 20 displays the Pre and Post
Ph.D. fellowships awarded by source for Ph.D.'s
becoming medical school faculty members in 1968
through 1978.
Table 21 summarizes the number and percent
of new hire faculty with a post doctoral research
fellowship. Whereas 22.5 percent of the new hire*
faculty in 1968 had post doctoral research train-
ing, by 1978 the percent of these faculty had in-
creased to 26.4 percent.
-53-
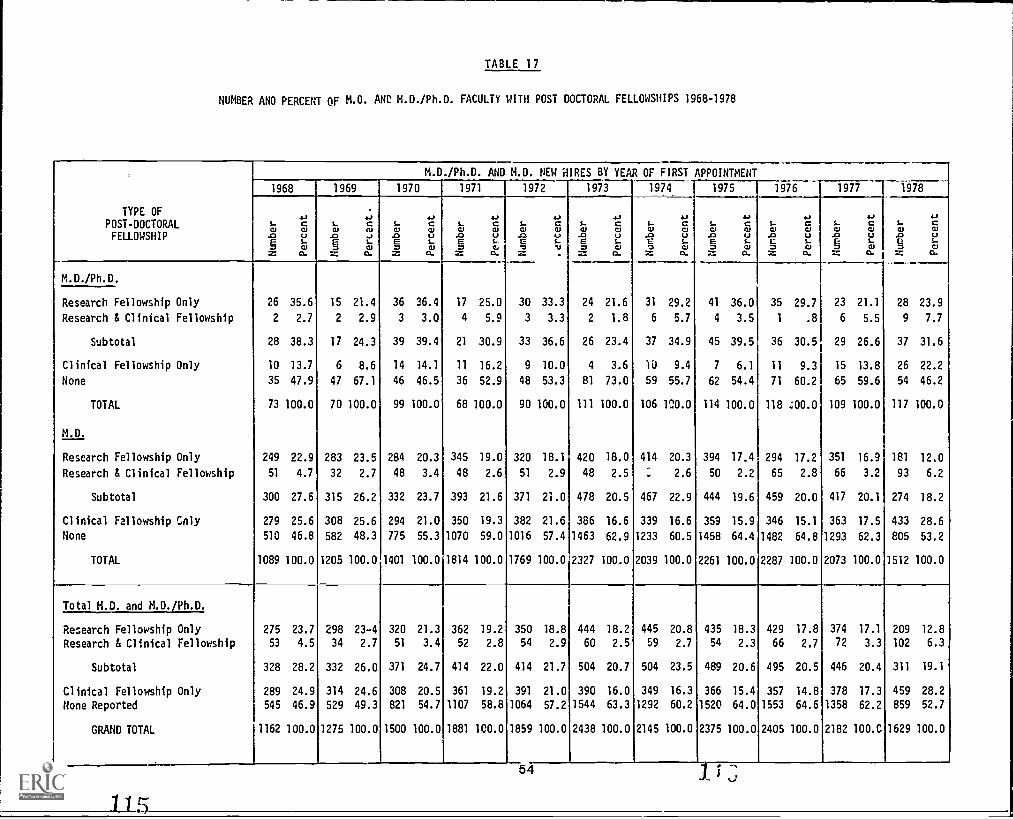
TABLE 17
NUMBER ANO PERCENT OF M.O. AND M.D./Ph.D. FACULTY WITH POST DOCTORAL FELLOWSHIPS 1968-1978
M.D./Ph.D. AND M.D. NEW HIRES BY YEAR OF FIRST APPOINTMENT
1968 1969 1970 1971 1972 1973 1974 1975 1976 1977 1978
TYPE OF 4) 4) 4) 4J 4.0 4) 4J 4.0 4.3 4.0 4.0
POST-DOCTORAL S.al
cal
1..al
cal
S.W
c0.1
S.W
cW
L.W
CW
S.J
cW
L.W
CW
L.W
cIII
S.W
CW
S.W
CW
S.W
CW
FELLOWSHIP .0E
uS.
.0E
JL.
.0E
US..
.0E
US.,
.0E
uL.
.0E
uS..
.0E
US.
.0E
UL.
.0E
US..
.0E
U1..
.0E.
UL.
7 al 7 W 7 W 7 C. 7 'V 7 0.1 7 0.1 7 0.1 7 C.1 7 CLI 7 CUZ O. Z O. Z 0. Z O. . .- 0. Z G. 06 G. Z a. ..... G.
M.D./Ph.D.
Research Fellowship Only 26 35.6 15 21.4 36 36.4 17 25.0 30 33.3 24 21.6 31 29.2 41 36.0 35 29.7 23 21.1 28 23.9
Research & Clinical Fellowship 2 2.7 2 2.9 3 3.0 4 5.9 3 3.3 2 1.8 6 5.7 4 3.5 1 .8 6 5.5 9 7.7
Subtotal 28 38.3 17 24.3 39 39.4 21 30.9 33 36.6 26 23.4 37 34.9 45 39.5 36 30.5 29 26.6 37 31.6
Clinical Fellowship Only 10 13.7 6 8.6 14 14.1 11 16.2 9 10.0 4 3.6 10 9.4 7 6.1 11 9.3 15 13.8 26 22.2
None 35 47.9 47 67.1 46 46.5 36 52.9 48 53.3 81 73.0 59 55.7 62 54.4 71 60.2 65 59.6 54 46.2
TOTAL 73 100.0 70 100.0 99 100.0 68 100.0 90 100.0 111 100.0 106 1(.10.0 114 100.0 118 ;00.0 109 100.0 117 100.0
M.D.
Research Fellowship Only 249 22.9 283 23.5 284 20.3 345 19.0 320 18.1 420 18.0 414 20.3 394 17.4 294 17.2 351 16.9 181 12.0
Research & Clinical Fellowship 51 4.7 32 2.7 48 3.4 48 2.6 51 2.9 48 2.5 : 2.6 50 2.2 65 2.8 66 3.2 93 6.2
Subtotal 300 27.6 315 26.2 332 23.7 393 21.6 371 21.0 478 20.5 467 22.9 444 19.6 459 20.0 417 20.1 274 18.2
Clinical Fellowship Snly 279 25.6 308 25.6 294 21.0 350 19.3 382 21.6 386 16.6 339 16.6 359 15.9 346 15.1 363 U.S 433 28.6
None 510 46.8 582 48.3 775 55.3 1070 59.0 1016 57.4 1463 62.9 1233 60.5 1458 64.4 1482 64.8 1293 62.3 805 53.2
TOTAL 1089 100.0 1205 100.0 1401 100.0 1814 100.0 1769 100.0 2327 100.0 2039 100.0 2261 100.0 2287 100.0 2073 100.0 1512 100.0
Total M.D. and M.D./Ph.D.
Research Fellowship Only 275 23.7 298 23-4 320 21.3 362 19.2 350 18.8 444 18.2 445 20.8 435 18.3 429 17.8 374 17.1 209 12.8
Research & Clinical Fellowship 53 4.5 34 2.7 51 3.4 52 2.8 54 2.9 60 2.5 59 2.7 54 2.3 66 2.7 72 3.3 102 6.3
Subtotal 328 28.2 332 26.0 371 24.7 414 22.0 414 21.7 504 20.7 504 23.5 489 20.6 495 20.5 446 20.4 311 19.1
Clinical Fellowship Only 289 24.9 314 24.6 308 20.5 361 19.2 391 21.0 390 16.0 349 16.3 366 15.4 357 14.8 378 17.3 459 28.2
None Reported 545 46.9 529 49.3 821 54.7 1107 58.8 1064 57.2 1544 63.3 1292 60.2 1520 64.0 1553 64.6 1358 62.2 859 52.7
GRAND TOTAL 1162 100.0 1275 100.0 1500 100.0 1881 100.0 1859 100.0 2438 100.0 2145 100.0 2375 100.0 2405 100.0 2182 100.0 1629 100.0
_.
11}
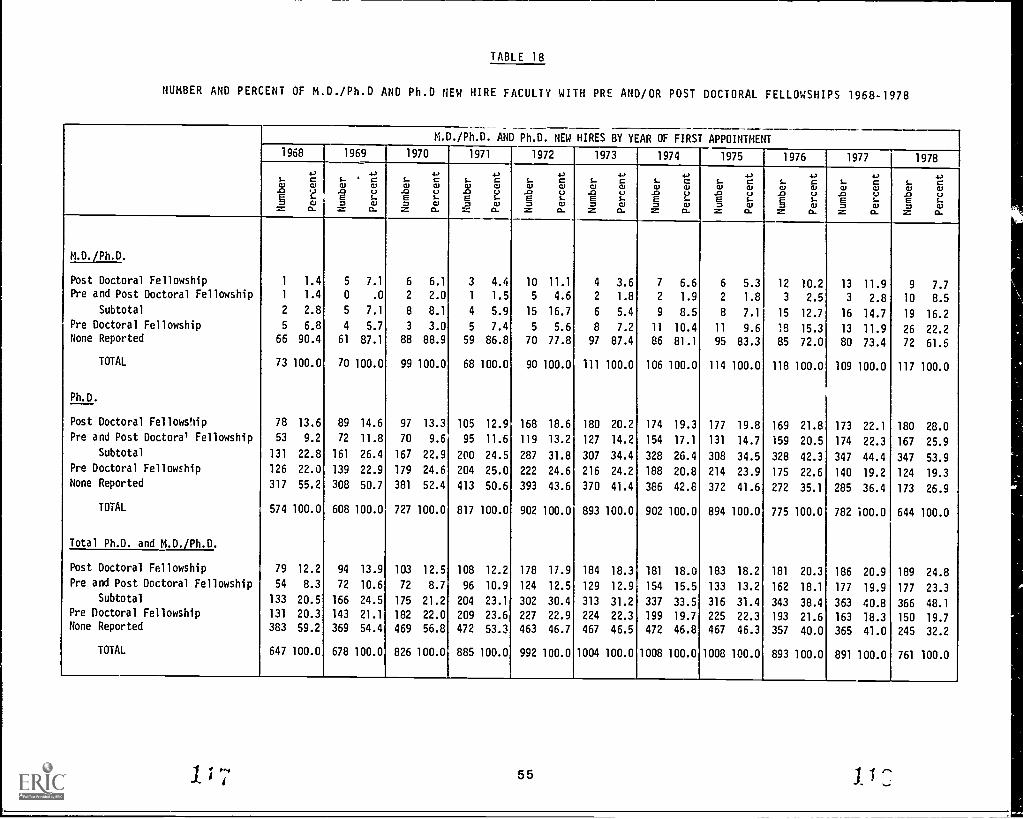
TABLE 18
NUMBER AND PERCENT OF M.D./Ph.D AND Ph.D NEW HIRE FACULTY WITH PRE AND/OR POST DOCTORAL FELLOWSHIPS 1968-1978
M.D./Ph.D. AND Ph.D. NEW HIRES BY YEAR OF FIRST APPOINTMENT
1968 1969 1970 1971 1972 1973 1974 1975 1976 1977 1978
S-CJ.0E7Z
4.,
CCJ...)S-70.
S-515
.0E7Z
4J. C
CJVS-CJa.
S.-CU.0E7Z
4.,
CCUVS-CUa.
S-CJ
13E7Z
.1.,CCUVS-CJ
Cl.
S-CU
.CtE7Z
.0CCUVS-CU0.
L.CU.0E77:
.0CCJVS-CJCI.
5-CD
./7E7Z
.0CCJ(.5S-CJ0.
S-CU.0E7Z
.0CCDVS-CJ
0-
S-0.0E7Z
.0CCJ
5.5
S-CJCI.
S-CU.0E7Z
.0CCJ5.5S-CJ
C.
S-CD
J53E7=
.0CCJ5.5S-CJ
CI.
M.D./Ph.D.
Post Doctoral Fellowship 1 1.4 5 7.1 6 6.1 3 4.4 10 11.1 4 3.6 7 6.6 6 5.3 12 10.2 13 11.9 9 7.7Pre and Post Doctoral Fellowship 1 1.4 0 .0 2 2.0 1 1.5 5 4.6 2 1.8 2 1.9 2 1.8 3 2.5 3 2.8 10 8.5
Subtotal 2 2.8 5 7.1 8 8.1 4 5.9 15 16.7 6 5.4 9 8.5 8 7.1 15 12.7 16 14.7 19 16.2Pre Doctoral Fellowship 5 6.8 4 5.7 3 3.0 5 7.4 5 5.6 8 7.2 11 10.4 11 9.6 18 15.3 13 11.9 26 22.2None Reported 66 90.4 61 87.1 88 88.9 59 86.8 70 77.8 97 87.4 86 81.1 95 83.3 85 72.0 80 73.4 72 61.5
TOTAL 73 100.0 70 100.0 99 100.0 68 100.0 90 100.0 111 100.0 106 100.0 114 100.0 118 100.0 109 100.0 117 100.0
Ph.D.
Post Doctoral Fellowship 78 13.6 89 14.6 97 13.3 105 12.9 168 18.6 180 20.2 174 19.3 177 19.8 169 21.8 173 22.1 180 28.0Pre and Post Doctoral Fellowship 53 9.2 72 11.8 70 9.6 95 11.6 119 13.2 127 14.2 154 17.1 131 14.7 159 20.5 174 22.3 167 25.9
Subtotal 131 22.8 161 26.4 167 22.9 200 24.5 287 31.8 307 34.4 328 26.4 308 34.5 328 42.3 347 44.4 347 53.9Pre Doctoral Fellowship 126 22.0 139 22.9 179 24.6 204 25.0 222 24.6 216 24.2 188 20.8 214 23.9 175 22.6 140 19.2 124 19.3None Reported 317 55.2 308 50.7 381 52.4 413 50.6 393 43.6 370 41.4 386 42.8 372 41.6 272 35.1 285 36.4 173 26.9
TOTAL 574 100.0 608 100.0 727 100.0 817 100.0 902 100.0 893 100.0 902 100.0 894 100.0 775 100.0 782 100.0 644 100.0
Total Ph.D. and M.D./Ph.D.
Post Doctoral Fellowship 79 12.2 94 13.9 103 12.5 108 12.2 178 17.9 184 18.3 181 18.0 183 18.2 181 20.3 186 20.9 189 24.8Pre and Post Doctoral Fellowship 54 8.3 72 10.6 72 8.7 96 10.9 124 12.5 129 12.9 154 15.5 133 13.2 162 18.1 177 19.9 177 23.3
Subtotal 133 20.5 166 24.5 175 21.2 204 23.1 302 30.4 313 31.2 337 33.5 316 31.4 343 38.4 363 40.8 366 48.1Pre Doctoral Fellowship 131 20.3 143 21.1 182 22.0 209 23.6 227 22.9 224 22.3 199 19.7 225 22.3 193 21.6 163 18.3 150 19.7None Reported 383 59.2 369 54.4 469 56.8 472 53.3 463 46.7 467 46.5 472 46.8 467 46.3 357 40.0 365 41.0 245 32.2
TOTAL 647 100.0 678 100.0 826 100.0 885 100.0 992 100.0 1004 100.0 1008 100.0 1008 100.0 893 100.0 891 100.0 761 100.0
.1) 55
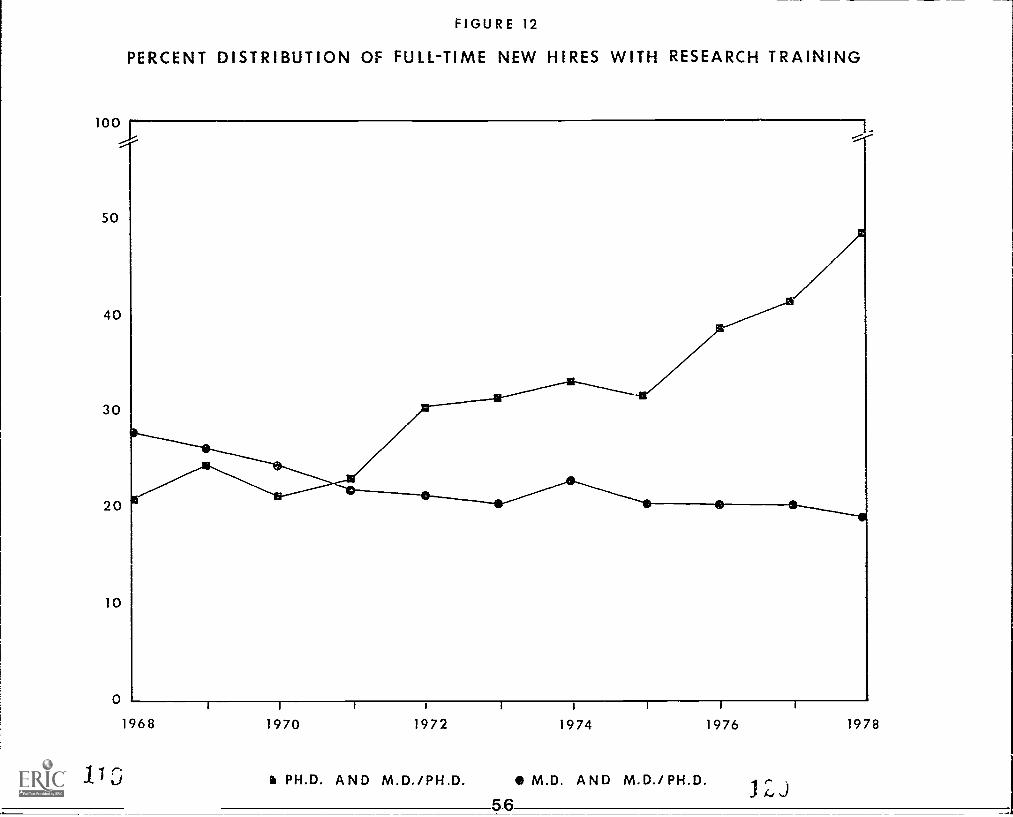
FIGURE 12
PERCENT DISTRIBUTION OF FULL-TIME NEW HIRES WITH RESEARCH TRAINING
100....--4--
50
40
30
20
10
0
113
1 I I I I I I I I
1968 1970 1972 1974 1976 1978
II PH.D. AND M.D./PH.D. M.D. AND M.D./PH.D.
56JZ,J
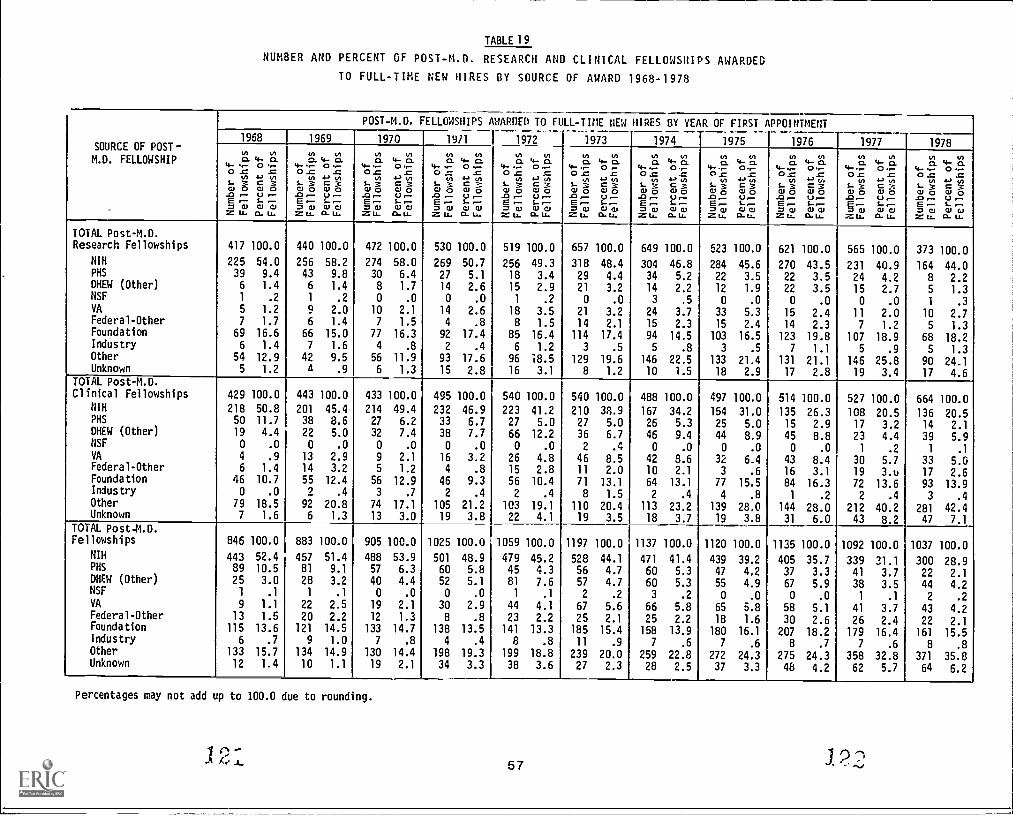
TABLE 19
NUMBER AND PERCENT OF POST-M.D. RESEARCH AND CLINICAL FELLOWSHIPS AWARDED
TO FULL-TIME NEW HIRES BY SOURCE OF AWARD 1968-1978
SOURCE OF POST-
M.D. FELLOWSHIP
POST-M.D. FELLOWSHIPS AWARDED TO FULL-TIME NEW HIRES BY YEAR OF
1975
FIRST APPOINTMENT
1968 1969 1970 19/1 1972 1973 1974 1976 1977 19780 0C1 4- CL
0 .2 °.^'-; ''' 'g0 0 0 0JO r Ur-
g z t z= U. a. u-
0 0CL 4- CL
0.2 °I.s_ 'g t"g0 0 0 0a,-- (-I,-Er it= u- a. u-
0CL
40:Zs_ 'g0 0Jaror= u.
4- CL
'3.2
t".',-)0 00.-a- u-
0 0CL 4- O.
157- ° 2s_ `,- 2. le ":2 2W 0 W 0.0 ,-- Urg 7, t; 'a;z u- a. t.:-
0 0CL 4- Ci
4-0-:= °'.2s.. 'g 4' '-'W 0 WO.0 ff Urg- 1 b'er,z L&. cl. u-
0CI
46-2s_ .4.;.'
W 0Jar57,z u_
04- CL
°.24a"gWO(-1,--
L-,..7,a. t._
VICL
46-.s_ '-')WO-O.-.EruZ Lt.
VI4- CL
c",E4.="gWOUrit
6. Lt.
LA VIO. 4- CL
4612 '''Zs- `12. 4= `..,1WO WOXI,- Uror tvz.,
Z Li. CL. L.
VIcL
t:EL 1)WO13,-.or= [t.
VI4- CL
c':2'3 -'WOU.-t7,-;6. 4.
VI VICL 4- CL
It:E c':'S '''' 4" .4 ):WO WOXI .- Urgq., itz u- Q.U.
VI VICI 4- CL
4,-D-. c".''S -.' t '' 'W 0 W 0-CI .- Uroar sarzz u_ a. u-
TOTAL Post-M.D.Research Fellowships 417 100.0 440 100.0 472 100.0 530 100.0 519 100.0 657 100.0 649 100.0 523 100.0 621 100.0 565 100.0 373 100.0
NIH 225 54.0 256 58.2 274 58.0 269 50.7 256 49.3 318 48.4 304 46.8 284 45.6 270 43.5 231 40.9 164 44.0PHS 39 9.4 43 9.8 30 6.4 27 5.1 18 3.4 29 4.4 34 5.2 22 3.5 22 3.5 24 4.2 8 2.2DHEW (Other) 6 1.4 6 1.4 8 1.7 14 2.6 15 2.9 21 3.2 14 2.2 12 1.9 22 3.5 15 2.7 5 1.3NSF 1 .2 1 .2 0 .0 0 .0 1 .2 0 .0 3 .5 0 .0 0 .0 0 .0 1 .3VA 5 1.2 9 2.0 10 2.1 14 2.6 18 3.5 21 3.2 24 3.7 33 5.3 15 2.4 11 2.0 10 2.7Federal-Other 7 1.7 6 1.4 7 1.5 4 .8 8 1.5 14 2.1 15 2.3 15 2.4 14 2.3 7 1.2 5 1.3Foundation 69 16.6 66 15.0 77 16.3 92 17.4 85 16.4 114 17.4 94 14.5 103 16.5 123 19.8 107 18.9 68 18.2Industry 6 1.4 7 1.6 4 .8 2 .4 6 1.2 3 .5 5 .8 3 .5 7 1.1 5 .9 5 1.3Other 54 12.9 42 9.5 56 11.9 93 17.6 96 18.5 129 19.6 146 22.5 133 21.4 131 21.1 146 25.8 90 24.1Unknown 5 1.2 a .9 6 1.3 15 2.8 16 3.1 8 1.2 10 1.5 18 2.9 17 2.8 19 3.4 17 4.6
TOTAL Post-M.D.
Clinical Fellowships 429 100.0 443 100.0 433 100.0 495 100.0 540 100.0 540 100.0 488 100.0 497 100.0 514 100.0 527 100.0 664 100.0NIH 218 50.8 201 45.4 214 49.4 232 46.9 223 41.2 210 38.9 167 34.2 154 31.0 135 26.3 108 20.5 136 20.5PHS 50 11.7 38 8.6 27 6.2 33 6.7 27 5.0 27 5.0 26 5.3 25 5.0 15 2.9 17 3.2 14 2.1DHEW (Other) 19 4.4 22 5.0 32 7.4 38 7.7 66 12.2 36 6.7 46 9.4 44 8.9 45 8.8 23 4.4 39 5.9NSF 0 .0 0 .0 0 .0 0 .0 0 .0 2 .4 0 .0 0 .0 0 .0 1 .2 1 .1VA 4 .9 13 2.9 9 2.1 16 3.2 26 4.8 46 8.5 42 8.6 32 6.4 43 8.4 30 5.7 33 5.0Federal-Other 6 1.4 14 3.2 5 1.2 4 .8 15 2.8 11 2.0 10 2.1 3 .6 16 3.1 19 3.b 17 2.6Foundation 46 10.7 55 12.4 56 12.9 46 9.3 56 10.4 71 13.1 64 13.1 77 15.5 84 16.3 72 13.6 93 13.9Industry 0 .0 2 .4 3 .7 2 .4 2 .4 8 1.5 2 .4 4 .8 1 .2 2 .4 3 .4Other 79 18.5 92 20.8 74 17.1 105 21.2 103 19.1 110 20.4 113 23.2 139 28.0 144 28.0 212 40.2 281 42.4Unknown 7 1.6 6 1.3 13 3.0 19 3.8 22 4.1 19 3.5 18 3.7 19 3.8 31 6.0 43 8.2 47 7.1
TOTAL Post..M.D.
Fellowships 846 100.0 883 100.0 905 100.0 1025 100.0 1059 100.0 1197 100.0 1137 100.0 1120 100.0 1135 100.0 1092 100.0 1037 100.0NIH 443 52.4 457 51.4 488 53.9 501 48.9 479 45.2 528 44.1 471 41.4 439 39.2 405 35.7 339 31.1 300 28.9PHS 89 10.5 81 9.1 57 6.3 60 5.8 45 4.3 56 4.7 60 5.3 47 4.2 37 3.3 41 3.7 22 2.1DHEW (Other) 25 3.0 28 3.2 40 4.4 52 5.1 81 7.6 57 4.7 60 5.3 55 4.9 67 5.9 38 3.5 44 4.2NSF 1 .1 1 .1 0 .0 0 .0 1 .1 2 .2 3 .2 0 .0 0 .0 1 .1 2 .2VA 9 1.1 22 2.5 19 2.1 30 2.9 44 4.1 67 5.6 66 5.8 65 5.8 58 5.1 41 3.7 43 4.2Federal-Other 13 1.5 20 2.2 12 1.3 8 .8 23 2.2 25 2.1 25 2.2 18 1.6 30 2.6 26 2.4 22 2.1Foundation 115 13.6 121 14.5 133 14.7 138 13.5 141 13.3 185 15.4 158 13.9 180 16.1 207 18.2 179 16.4 161 15.5Industry 6 .7 9 1.0 7 .8 4 .4 8 .8 11 .9 7 .6 7 .6 8 .7 7 .6 8 .8Other 133 15.7 134 14.9 130 14.4 198 19.3 199 18.8 239 20.0 259 22.8 272 24.3 275 24.3 358 32.8 371 35.8Unknown 12 1.4 10 1.1 19 2.1 34 3.3 38 3.6 27 2.3 28 2.5 37 3.3 48 4.2 62 5.7 64 6.2
Percentages may not add up to 100.0 due to rounding.
57
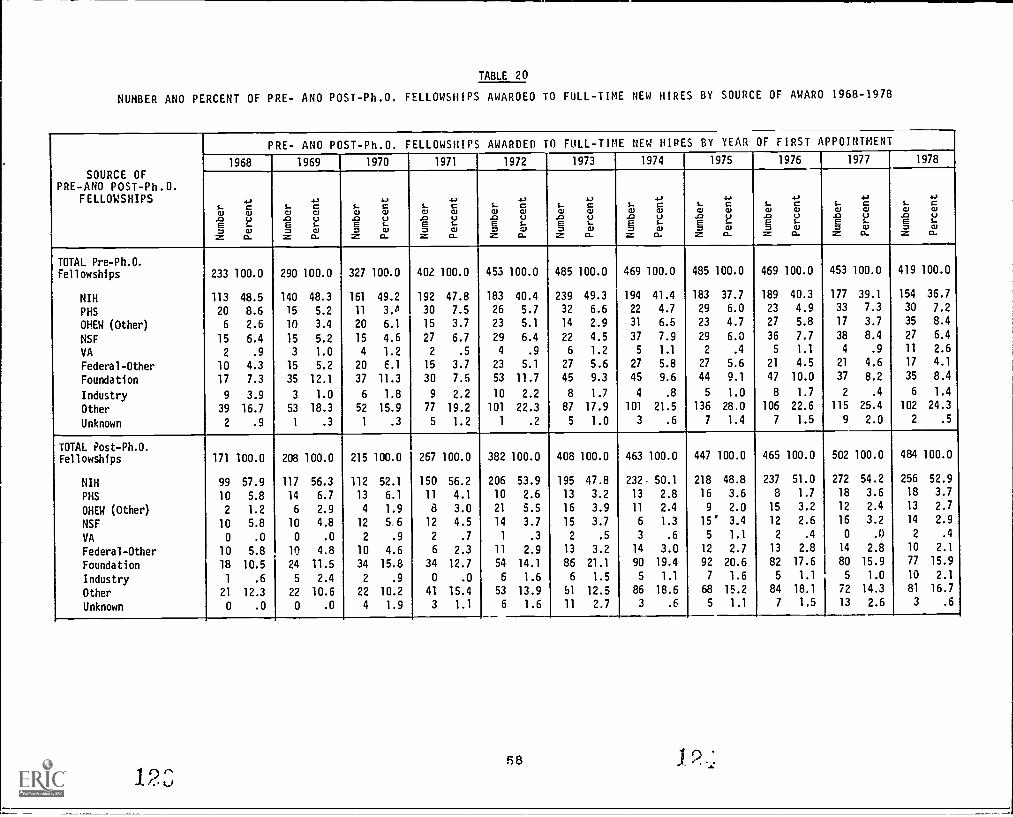
TABLE 20
NUMBER ANO PERCENT OF PRE- ANO POST-Ph.O. FELLOWSHIPS AWAROEO TO FULL-TIME NEW HIRES BY SOURCE OF AWARO 1968-1978
SOURCE OFPRE-ANO POST-Ph.O.
FELLOWSHIPS
PRE- ANO POST-Ph.O. FELLOWSHIPS AWARDED TO FULL-TIME NEW HIRES BY YEAR OF FIRST APPOINTMENT
1968 1969 1970 1971 1972 1973 1974 1975 1976 1977 1978
s_C11
.C1E=Z
4_,
cC11
ULCV
0.
C-O..7E7Z
4,CC11
UiC11
0-
1.-C.1.11.C1E7Z
4_,
CUL0.1
M.
5-0.1.11.7E7Z
4_,
CUL.3.1
0.
i0.1.7E7Z
4_,
CalUL.110.
L0.1.11.7E7Z
4_,
CULCV
G.
L0.1
.27E7Z
asC
0.1
ULCV0.
s_0.1
.27E7Z
4_,
C0.1
UL0.1
0.
s_01.7E7Z
asCC.1
ULCV
0.
s_CU
.C1E7Z
asCCV
ULCVG.
s_CV
.27E7Z
asCC11
ULCV
G.
TOTAL Pre-Ph.O.Fellowships 233 100.0 290 100.0 327 100.0 402 100.0 453 100.0 485 100.0 469 100.0 485 100.0 469 100.0 453 100.0 419 100.0
NIH 113 48.5 140 48.3 161 49.2 192 47.8 183 40.4 239 49.3 194 41.4 183 37.7 189 40.3 177 39.1 154 36.7
PHS 20 8.6 15 5.2 11 3.A 30 7.5 26 5.7 32 6.6 22 4.7 29 6.0 23 4.9 33 7.3 30 7.2
OHEW (Other) 6 2.6 10 3.4 20 6.1 15 3.7 23 5.1 14 2.9 31 6.5 23 4.7 27 5.8 17 3.7 35 8.4
NSF 15 6.4 15 5.2 15 4.6 27 6.7 29 6.4 22 4.5 37 7.9 29 6.0 36 7.7 38 8.4 27 6.4
VA 2 .9 3 1.0 4 1.2 2 .5 4 .9 6 1.2 5 1.1 2 .4 5 1.1 4 .9 11 2.6
Federal-Other 10 4.3 15 5.2 20 6.1 15 3.7 23 5.1 27 5.6 27 5.8 27 5.6 21 4.5 21 4.6 17 4.1
Foundation 17 7.3 35 12.1 37 11.3 30 7.5 53 11.7 45 9.3 45 9.6 44 9.1 47 10.0 37 8.2 35 8.4
Industry 9 3.9 3 1.0 6 1.8 9 2.2 10 2.2 8 1.7 4 .8 5 1.0 8 1.7 2 .4 6 1.4
Other 39 16.7 53 18.3 52 15.9 77 19.2 101 22.3 87 17.9 101 21.5 136 28.0 106 22.6 115 25.4 102 24.3
Unknown 2 .9 1 .3 1 .3 5 1.2 1 .2 5 1.0 3 .6 7 1.4 7 1.5 9 2.0 2 .5
TOTAL Post-Ph.O.Fellowships 171 100.0 208 100.0 215 100.0 267 100.0 382 100.0 408 100.0 463 100.0 447 100.0 465 100.0 502 100.0 484 100.0
NIH 99 57.9 117 56.3 112 52.1 150 56.2 206 53.9 195 47.8 232, 50.1 218 48.8 237 51.0 272 54.2 256 52.9
PHS 10 5.8 14 6.7 13 6.1 11 4.1 10 2.6 13 3.2 13 2.8 16 3.6 8 1.7 18 3.6 18 3.7
OHEW (Other) 2 1.2 6 2.9 4 1.9 8 3.0 21 5.5 16 3.9 11 2.4 9 2.0 15 3.2 12 2.4 13 2.7
NSF 10 5.8 10 4.8 12 5,6 12 4.5 14 3.7 15 3.7 6 1.3 15' 3.4 12 2.6 16 3.2 14 2.9
VA 0 .0 0 .0 2 .9 2 .7 1 .3 2 .5 3 .6 5 1.1 2 .4 0 .0 2 .4
Federal-Other 10 5.8 10 4.8 10 4.6 6 2.3 11 2.9 13 3.2 14 3.0 12 2.7 13 2.8 14 2.8 10 2.1
Foundation 18 10.5 24 11.5 34 15.8 34 12.7 54 14.1 86 21.1 90 19.4 92 20.6 82 17.6 80 15.9 77 15.9
Industry 1 .6 5 2.4 2 .9 0 .0 6 1.6 6 1.5 5 1.1 7 1.6 5 1.1 5 1.0 10 2.1
Other 21 12.3 22 10.6 22 10.2 41 15.4 53 13.9 61 12.5 86 18.6 68 15.2 84 18.1 72 14.3 81 16.7
Unknown 0 .0 0 .0 4 1.9 3 1.1 6 1.6 11 2.7 3 .6 5 1.1 7 1.5 13 2.6 3 .6
58i2
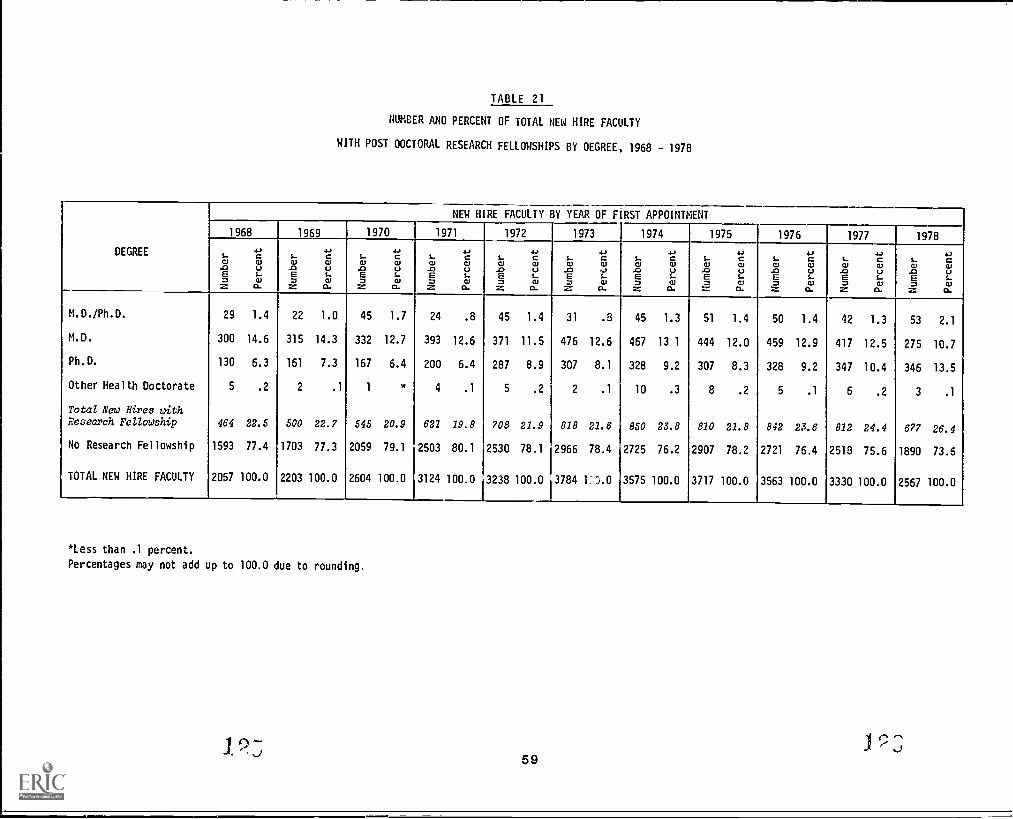
TABLE 21
NUMBER ANO PERCENT OF TOTAL NEW HIRE FACULTY
WITH POST DOCTORAL RESEARCH FELLOWSHIPS BY OEGREE, 1968 - 1978
DEGREE
NEW HIRE FACULTY BY YEAR OF FIRST APPOINTMENT
1968 1969 1970 1971 1972 1973 1974 1975 1976 1977 1978
S.CU-CIE2
4.,CWUS-
di.
S.CU.0E2
4.,CWUS..
if.
S.W
-CIE2
.S.,CCUUS-
ai
S.W.0E2
4-'CWUS..
ai
S..W.0E2
.S.,CWU..ai
S..W
.1:2E2
.S.,CCU..)S..
if.
S.W
.C1E2
.S.,CCI,US..
iij
S.W-CIE
P-
.S.,CWUS..
ci1
S.W-CIE'
.S.,CalUS..
c au1
S.CU.0E2
.S.,CCUUS..
if
S.CU-CIE
2
.S.,CaUS..
if
M.D./Ph.D. 29 1.4 22 1.0 45 1.7 24 .8 45 1.4 31 .8 45 1.3 51 1.4 50 1.4 42 1.3 53 2.1
M.D. 300 14.6 315 14.3 332 12.7 393 12.6 371 11.5 476 12.6 467 13 1 444 12.0 459 12.9 417 12.5 275 10.7
Ph.D. 130 6.3 161 7.3 167 6.4 200 6.4 287 8.9 307 8.1 328 9.2 307 8.3 328 9.2 347 10.4 346 13.5
Other Health Doctorate 5 .2 2 .1 1x 4 .1 5 .2 2 .1 10 .3 8 .2 5 .1 6 .2 3 .1
Total New Hires withResearch Fellowship 464 22.5 500 22.7 545 20.9 621 19.8 708 21.9 818 21.6 850 23.8 810 21.8 842 23.6 812 24.4 677 26.4
No Research Fellowship 1593 77.4 1703 77.3 2059 79.1 2503 80.1 2530 78.1 2966 78.4 2725 76.2 2907 78.2 2721 76.4 2518 75.6 1890 73.6
TOTAL NEW HIRE FACULTY 2057 100.0 2203 100.0 2604 100.0 3124 100.0 3238 100.0 3784 1:0.0 3575 100.0 3717 100.0 3563 100.0 3330 100.0 2567 100.0
*Less than .1 percent.
Percentages may not add up to 100.0 due to rounding.
12:59
C. SPECIALTIES MD DISCIPLINES
The distribution of the specialties of the
new hire full-time faculty are based on the M.D.
and the M.D./Ph.D. faculty. The Ph.D. discipline
distribution is based on the Ph.D. and the M.D./
Ph.D. faculty. Using 1968 as an example, (see
Table 5 for number distribution of faculty 1968-
78), there were 1089 M.D.'s and 73 M.D./Ph.D.'s
-- a total of 1162 faculty with an M.D. degree.
Adding the 73 M.D./Ph.D.'s to the 574 Ph.D.'s
gives a total of 647 faculty members with a Ph.D.
degree. Therefore, the sum of the faculty with
specialties and disciplines exceeds the total
full-time faculty numbers.
Specialties of M.D. New Hire and Base Faculty
As 25 percent of the M.D. new hires' special-
ties were not reported to the Faculty Roster in
1968, the years 1974 through 1977, when the "un-
known" figure was below 9 percent, will be used
to illustrate the percent changes in the
- 61 -
specialties.
Orthopedic Surgery, Psychiatry and Surgery
specialties have increased in the percent of new
hire faculty. Since 1974, Orthopedic Surgery has
increased by 0.7 percent; Psychiatry by 1.9 per-
cent and Surgery by 1.9 percent. The greatest
percent of the new hire M.D. faculty in any year
had as their specialty Internal Medicine followed
by Pediatrics.
All of the other specialtie: remained at a-
bout the same level or decreased. The percent de-
crease in base faculty in the Family Practice
specialty is due to the inclusion of the General
Medicine category in the earlier years and the
decline in that category as Family Practice be-
came a recognized specialty in 1970. (Table 22)
Board Certification of M.D. New Hires
The number and percent distribution of the
full-time M.D. new hires who are Board Certified
in their specialty for each of the eleven years
r. e".1
'L)
is shown on Table 23.
The percent of the faculty who are Board
Certified with a specially fluctuates to such an
extent that it is difficult to draw any but the
most general conclusions. Less new hir^ M.D.
faculty are Board Certified in their specialty
in 1978 than in peevious years. Some of the
specialties which show a consistently smaller
percent of the M.D. new hire faculty being
Board Certified over the eleven years are Anes-
thesiology, Ob-Gyn, Surgery and Orthopedic
Surgery. In the case of Orthopedic Surgery, it
may be helpful co note that in 1968, nine out of
ten new hire faculty were Board Certified (90 per-
cent) and in 1977 only 19 out of 52 (37 percent)
were Board Certified.
Specialties which have had the greatest per-
cent of Board Certified faculty, as reported to
the Faculty Roster, over the total eleven years,
are Otolaryngology, Pediatrics and Dermatology.
-62-
Disciplines of Ph.D. New Hire and Base faculty
In 1977 and 1978 several of the basic disci-
plineb show a percent increase in faculty. Bio-
chemistry has shown a consistent increase from
16.7 percent in 1968 to 13.7 percent in 1978,
Immunology has increased from 0.6 percent in 1968
to 1.2 percent in 1978. (Figure 13)
Genetics has fluctuated from 1.9 percent in
1968 to a high of 2.8 percent in 1970 to 1.4 per-
cent in 1978. Biology, Anatomy, Microbiology,
Nutrition, Physiology and Zoology all show a per-
cent decrease in 1977 and 1978.
The Social Sciences have shown the greatest
increase in percent of new hire faucity -- 14.8
percent in 1968 versus 18.8 percent in 1978. The
Physical Sciences showed a slight percentage gain
in 1977. In the Clinical Sciences, 14 of the dis-
ciplines either remained the same or had a slight
increase in percent of faculty. Four of the
disciplines showed a decrease. The faculty count
in the clinical disciplines for the Ph.D. faculty
is due to a difference in degree terminology be-
tween the British Commonwealth countries and the
United States. Again the figures for 1977 are
more reliable than those for 1978 due to in-
complete reporting. (See Table 24)
Disciplines of Non-Doctoral Faculty
Allied Health, Public Health and Adminis-
tration all have had a percent increase among
the non-doctoral faculty; however, the Social
Sciences have consistently declined in percent
of non-doctoral new hire faculty with 34.1 per-
cent in 1968, 29 percent in 1973 and 21.3 percent
in 1978. rhe percent of non-doctoral base fac-
ulty in the Social Sciences has fluctuated, in-
creasing from 23.5 percent in 1968 to 26.0 per-
cent in 1973 and then declining to 25.1 percent
in 1978. (Table 25)
.131-63-
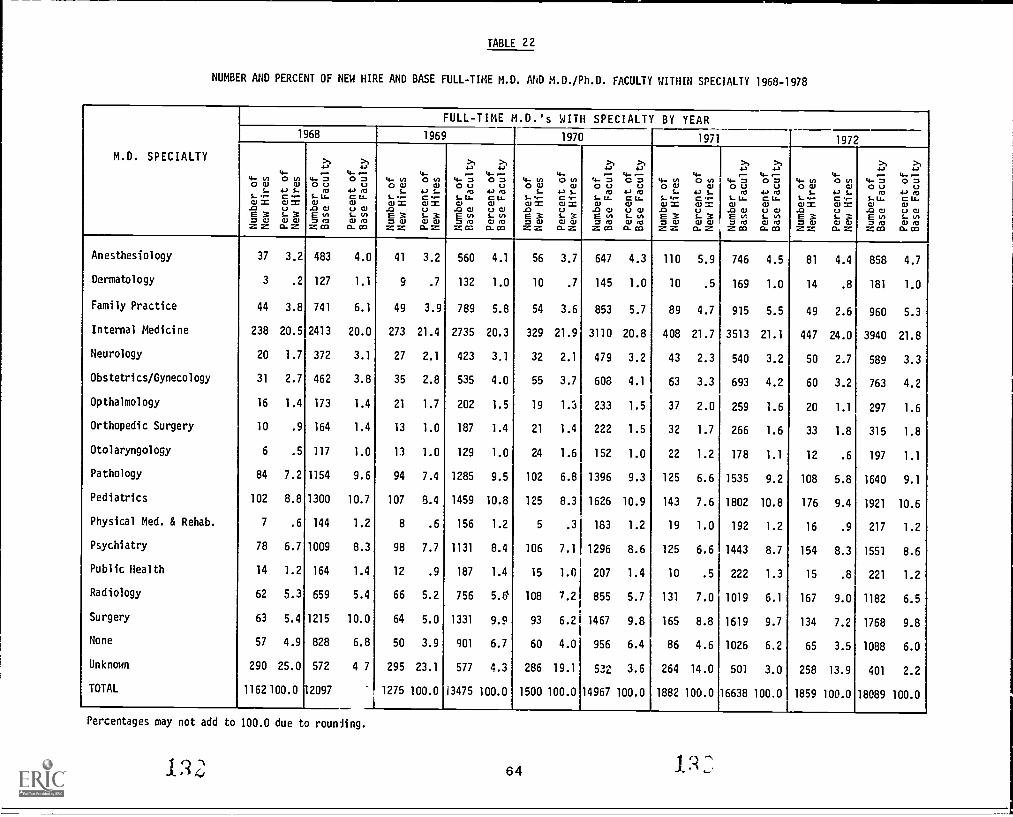
TABLE 22
NUMBER AND PERCENT OF NEW HIRE AND BASE FULL-TIME M.D. AND M.D./Ph.D. FACULTY WITHIN SPECIALTY 1968-1978
M.D. SPECIALTY
FULL-TIME M.D.'s WITH SPECIALTY BY YEAR1968 1969 1970 1971 1972
>, >, >, >, >, >, >, >, >, >,4- 4-
.40.;4-, 4 4- 4-
'46 .1-:/
4- .L.,
.4(-3
4-. .L.,
40"S4- of Otn .4-S. 4- of ttft .4-'; 40S. 4- of ttn 4- r; 7 4- VI of 4- 7 0 S W. of of 4- GOW CLI OU 0 OW W 00 0 OW CU 00 U 0 C11 CJ 0 U U OW W OU 0S.-1- r- 4- 7-C., ra
1- Lt.4-) (0C LL.
1-S.- -
1-, 1.C r- raL_ LL.
4.) roC LL.
1.-7.- r-
4- 1-C, ea7.- LL.
4- roC LL.
1.-1- r-
4- 1-C ...-
ra1- Lt.
4)C Li.
1-1- - 4- 1-C r- et,S.- LL.
4-, e0C LL.01, 2 CLI =0 0.1
.0 CLIW0 W CLI 2 CU 2
UCJ.0 III
III0 0.1
0.1 2.0
ax0 W.0 W
W0 CLI
CU =.0 0) =0 CLI
.0 0.1W0 W
O. 1 2.D
0.1 =0 CU
.0 CUCLI
Li CLI.0E3 s- 3 E v) s- 4/1.0ECU s- 3 E(0 1- .1) E3 s- 3 E v) s- tn E3 s- 3 E Ln s- tn E3 s- 3 EN Len= C.!Z Z CLI WD. Z 0 O
Z MICU ea
D. 030 CUz z al CU
Q. m.-0 (0z = CLI (0
ca. co7 CUz z 0.1 CU
ca. z7 e0z o3
CLI (0ca. oci
7 Wz z CU CLIca. z 7 eaz oci
CU eaO co
7 0.1z z CLI 0.1ca. z 7 21z co O. 1 ean. oci
Anesthesiology 37 3.2 483 4,0 41 3.2 560 4.1 56 3.7 647 4.3 110 5.9 746 4.5 81 4.4 858 4.7
Dermatology 3 .2 127 1.1 9 .7 132 1.0 10 .7 145 1.0 10 .5 169 1.0 14 .8 181 1.0
Family Practice 44 3.8 741 6.1 49 3.9 789 5.8 54 3.6 853 5.7 89 4.7 915 5.5 49 2.6 960 5.3
Internal Medicine 238 20.5 2413 20.0 273 21.4 2735 20.3 329 21.9 3110 20.8 408 21.7 3513 21.1 447 24.0 3940 21.8
Neurology 20 1.7 372 3.1 27 2.1 423 3.1 32 2.1 479 3.2 43 2.3 540 3.2 50 2.7 589 3.3
Obstetrics/Gynecology 31 2.7 462 3.8 35 2.8 535 4.0 55 3.7 608 4.1 63 3.3 693 4.2 60 3.2 763 4.2
Opthalmology 16 1.4 173 1.4 21 1.7 202 1.5 19 1.3 233 1.5 37 2.0 259 1.6 20 1.1 297 1.6
Orthopedic Surgery 10 .9 164 1.4 13 1.0 187 1.4 21 1.4 222 1.5 32 1.7 266 1.6 33 1.8 315 1.8
Otolaryngology 6 .5 117 1.0 13 1.0 129 1.0 24 1.6 152 1.0 22 1.2 178 1.1 12 .6 197 1.1
Pathology 84 7.2 1154 9.6 94 7.4 1285 9.5 102 6.8 1396 9.3 125 6.6 1535 9.2 108 5.8 1640 9.1
Pediatrics 102 8.8 1300 10.7 107 8.4 1459 10.8 125 8.3 1626 10.9 143 7.6 1802 10.8 176 9.4 1921 10.6
Physical Med. & Rehab. 7 .6 144 1.2 8 .6 156 1.2 5 .3 183 1.2 19 1.0 192 1.2 16 .9 217 1.2
Psychiatry 78 6.7 1009 8.3 98 7.7 1131 8.4 106 7.1 1296 8.6 125 6.6 1443 8.7 154 8.3 1551 8.6
Public Health 14 1.2 164 1.4 12 .9 187 1.4 15 1.0 207 1.4 10 .5 222 1.3 15 .8 221 1.2
Radiology 62 5.3 659 5.4 66 5.2 756 5.0 108 7.2 855 5.7 131 7.0 1019 6.1 167 9.0 1182 6.5
Surgery 63 5.4 1215 10.0 64 5.0 1331 9.9 93 6.2 1467 9.8 165 8.8 1619 9.7 134 7.2 1768 9.8
None 57 4.9 828 6.8 50 3.9 901 6.7 60 4.0 956 6.4 86 4.6 1026 6.2 65 3.5 1088 6.0
Unknown 290 25.0 572 4 7 295 23.1 577 4.3 286 19.1 532 3.6 264 14.0 501 3.0 258 13.9 401 2.2
TOTAL 1162100.0 12097 1275 100.0 i3475 100.0 1500 100.0 14967 100.0 1882 100.0 16638 100.0 1859 100.0 18089 100.0
Percentages may not add to 100.0 due to rounding.
64
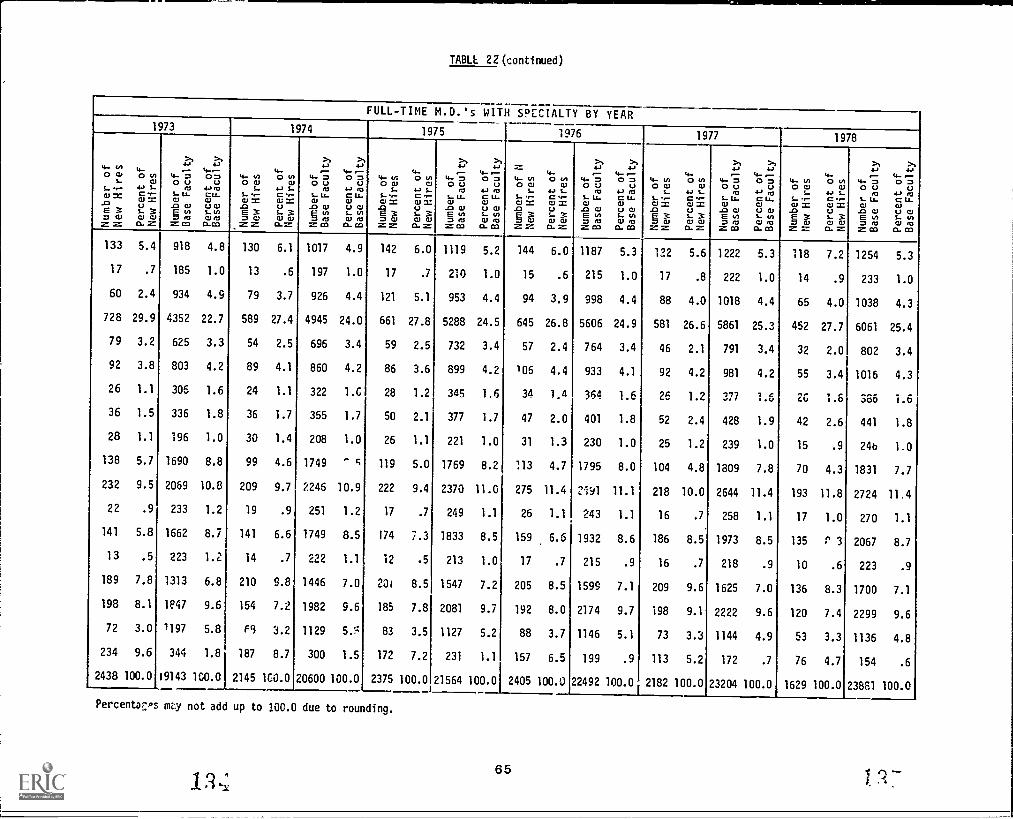
TABLE 22 (continued)
FULL-TIME M.D.'s WITH SPECIALTY BY YEAR1973 1974 1975 1976 1977 1978
4J,T.,...
,...-03=
....=,-mwzZ
tow
4J,..51"u1-3ww0.=
>.4J
4..s0,m
t'L..owEwmaszm
>.4Jts,
4.,mELL.uws-wwman
4...0w,5(E'lmE3mem==
t.w
4.4Cus....307 O7mz
>.4J
4..s0,m
t7IL.mwLOU'mmzm
>.4Jts,
4.4 00C
IL.uws-o07 00mm
4....0w,',i;"'mE3mwz=
t.w4,..
5*3-:'u1-307 07a.=
>.4-,
4..s0,m
tu-mwEulmmrz:m
>.4Jts,
4.4 00C
IL.uw1...o07 00mm
..--:
4_00w,III'mE3mwz=
t.w4,..
,T,"'u1-307 07mz
>.4J
4..s0,m
1-,'mwEwmas=ms
>.4JtS,
4.1 00C
IL.uw1...w.07 00mm
4...0w!..tlE3mw==
t.04.,!..TI
1-307 070.=
>.4J,s0,m
LI IL.
Ewmm=cm
>.4.,ts.,t'm
W II.uws-owmmm
,.0w,!..0) '$..oE3mw==
t.w
4.2..CWus....307 070.=
>.4J
4-S0,m
Ql."L.JawEwmm
CO=
>,4JtS,t'm
CU LLuwio07 000..m
133
17
60
728
79
92
26
36
28
138
232
22
141
13
189
198
72
234
2438
5.4
.7
2.4
29.9
3.2
3.8
1.1
1.5
1.1
5.7
9.5
.9
5.8
.5
7.8
8.1
3.0
9.6
100.0
918
185
934
4352
625
803
306
336
196
1690
2069
233
1662
223
1313
1P47
7197
344
19143
4.8
1.0
4.9
22.7
3.3
4.2
1.6
1.8
1.0
8.8
10.8
1.2
8.7
1.2
6.8
9.6
5.8
1.8
160.0
130
13
79
589
54
89
24
36
30
99
209
19
141
14
210
154
Fi
187
2145
6.1
.6
3.7
27.4
2.5
4.1
1.1
1.7
1.4
4.6
9.7
.9
6.6
.7
9.8
7.2
3.2
8.7
160.0
1017
197
926
4945
696
860
322
355
208
1749
2246
251
1749
222
1446
1982
1129
300
20600
4.9
1.0
4.4
24.0
3.4
4.2
1.G
1.7
1.0
c
10.9
1.2
8.5
1.1
7.0
9.6
5.5
1.5
100.0
142
17
121
661
59
86
28
50
26
119
222
17
174
12
201
185
83
172
2375
6.0
.7
5.1
27.8
2.5
3.6
1.2
2.1
1.1
5.0
9.4
.7
7.3
.5
8.5
7.8
3.5
7.2
100.0
1119
210
953
5288
732
899
345
377
221
1769
2370
249
1833
213
1547
2081
1127
231
21564
5.2
1.0
4.4
24.5
3.4
4.2
1.6
1.7
1.0
8.2
11.0
1.1
8.5
1.0
7.2
9.7
5.2
1.1
100.0
144
15
94
645
57
106
34
47
31
113
275
26
159
17
205
192
88
157
2405
6.0
.6
3.9
26.8
2.4
4.4
1.4
2.0
1.3
4.7
11.4
1.1
6.6
.7
8.5
8.0
3.7
6.5
100.0
1187
215
998
5606
764
933
364
401
230
1795
2i91
243
1932
215
1599
2174
1146
199
22492
5.3
1.0
4.4
24.9
3.4
4.1
1.6
1.8
1.0
8.0
11.1
1.1
8.6
.9
7.1
9.7
5.1
.9
100.0
122
17
88
581
46
92
26
52
25
104
218
16
186
16
209
198
73
113
2182
5.6
.8
4.0
26.6
2.1
4.2
1.2
2.4
1.2
4.8
10.0
.7
8.5
.7
9.6
9.1
3.3
5.2
100.0
1222
222
1018
5861
791
981
377
428
239
1809
2644
258
1973
218
1625
2222
1144
172
23204
5.3
1.0
4.4
25.3
3.4
4.2
1.6
1.9
1.0
7.8
11.4
1.1
8.5
.9
7.0
9.6
4.9
.7
100.0
118
14
65
452
32
55
26
42
15
70
193
17
135
10
136
120
53
76
1629
7.2
.9
4.0
27.7
2.0
3.4
1.6
2.6
.9
4.3
11.8
1.0
P 3
.6
8.3
7.4
3.3
4.7
100.0
1254
233
1038
6061
802
1016
386
441
246
1831
2724
270
2067
223
1700
2299
1136
154
23861
5.3
1.0
4.3
25.4
3.4
4.3
i.6
1.8
1.0
7.7
11.4
1.1
8.7
.9
7.1
9.6
4.8
.6
100.0
PercentaF:Ps my not add up to 100.0 due to rounding.
65
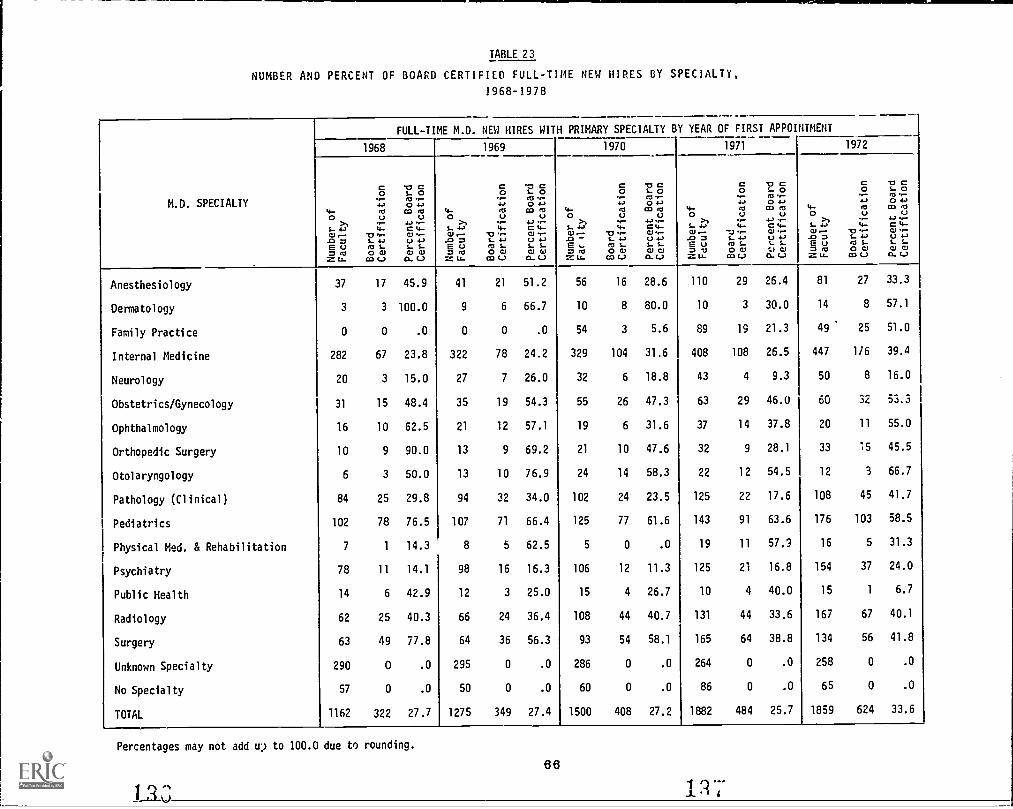
TABLE 23
NUMBER AND PERCENT OF BOARD CERTIFIED FULL-TIME NEW HIRES BY SPECIALTY,
1968-1978
FULL-TIME M.D. NEW HIRES WITH PRIMARY SPECIALTY BY YEAR OF FIRST APPOINTMENT
1968 1969 1970 1971 1972
CO
-0 cs_ O
Co Cs- O
Co 13 cs- o
Co 1:1 Cs- oCo 13 Cs- o
M.D. SPECIALTY 4., 0 4-, 4-, 0 4-, 4-,,- 0,0 ,-
4-,,-4-,
034-,-0 4 0 4-,
4- 03 CO rts 4- it1 co ec, 4- 21 CO rts 4- 21 CO rts 4- 03 co Mo U U 0 U U 0 U U 0 U U 0 U Q
S.- 4-, 4- C 4->1
S- 4-,,-4-
4-, ..-C 4- S.- 3T,-4-
4., -C 4-
>1S- 4-,
..,-4- 4., ,-C 4- S- 4-, 4- C 4-
S- 4., U 4., -0 7 S- 4-, U 4-, .0 - S._ 4-, U 4.) -0 0 S._ 4-, U 4-, -0 0 S.- 4-, U 4-,
E U M S- S- S- E U M S- S- S- E .... M S- S- 5-. E U M S- ,... s- E u ro s- s_ s-0 ro
Z g.,-0 CU
CO C.)0) CU
0. 6-.)7 coZ Lt.
0 0)CO (-)
01 410. 6-)
0 rts2: Lt.0 0)03 6-)
CU 010. 6-)
0 VZ U.
0 CUCO L
41 CUCI. 6-)
7 coZ La.
0 CI,CO 6-.)
CU CU0. 6-.)
Anesthesiology 37 17 45.9 41 21 51.2 56 16 28.6 110 29 26.4 81 27 33.3
Dermatology 3 3 100.0 9 6 66.7 10 8 80.0 10 3 30.0 14 8 57.1
Family Practice 0 0 .0 0 0 .0 54 3 5.6 89 19 21.3 49 25 51.0
Internal Medicine 282 67 23.8 322 78 24.2 329 104 31.6 408 108 26.5 447 1/6 39.4
Neurology 20 3 15.0 27 7 26.0 32 6 18.8 43 4 9.3 50 8 16.0
Obstetrics/Gynecology 31 15 48.4 35 19 54.3 55 26 47.3 63 29 46.0 60 32 53.3
Ophthalmology 16 10 62.5 21 12 57.1 19 6 31.6 37 14 37.8 20 11 55.0
Orthopedic Surgery 10 9 90.0 13 9 69.2 21 10 47.6 32 9 28.1 33 15 45.5
Otolaryngology 6 3 50.0 13 10 76.9 24 14 58.3 22 12 54.5 12 3 66.7
Pathology (Clinical) 84 25 29.8 94 32 34.0 102 24 23.5 125 22 17.6 108 45 41.7
Pediatrics 102 78 76.5 107 71 66.4 125 77 61.6 143 91 63.6 176 103 58.5
Physical Med. & Rehabilitation 7 1 14.3 8 5 62.5 5 0 .0 19 11 57.9 16 5 31.3
Psychiatry 78 11 14.1 98 16 16.3 106 12 11.3 125 21 16.8 154 37 24.0
Public Health 14 6 42.9 12 3 25.0 15 4 26.7 10 4 40.0 15 1 6.7
Radiology 62 25 40.3 66 24 36.4 108 44 40.7 131 44 33.6 167 67 40.1
Surgery 63 49 77.8 64 36 56.3 93 54 58.1 165 64 38.8 134 56 41.8
Unknown Specialty 290 0 .0 295 0 .0 286 0 .0 264 0 .0 258 0 .0
No Specialty 57 0 .0 50 0 .0 60 0 .0 86 0 .0 65 0 .0
TOTAL 1162 322 27.7 1275 349 27.4 1500 408 27.2 1882 484 25.7 1859 624 33.6
Percentages may not add u2 to 100.0 due to rounding.
66
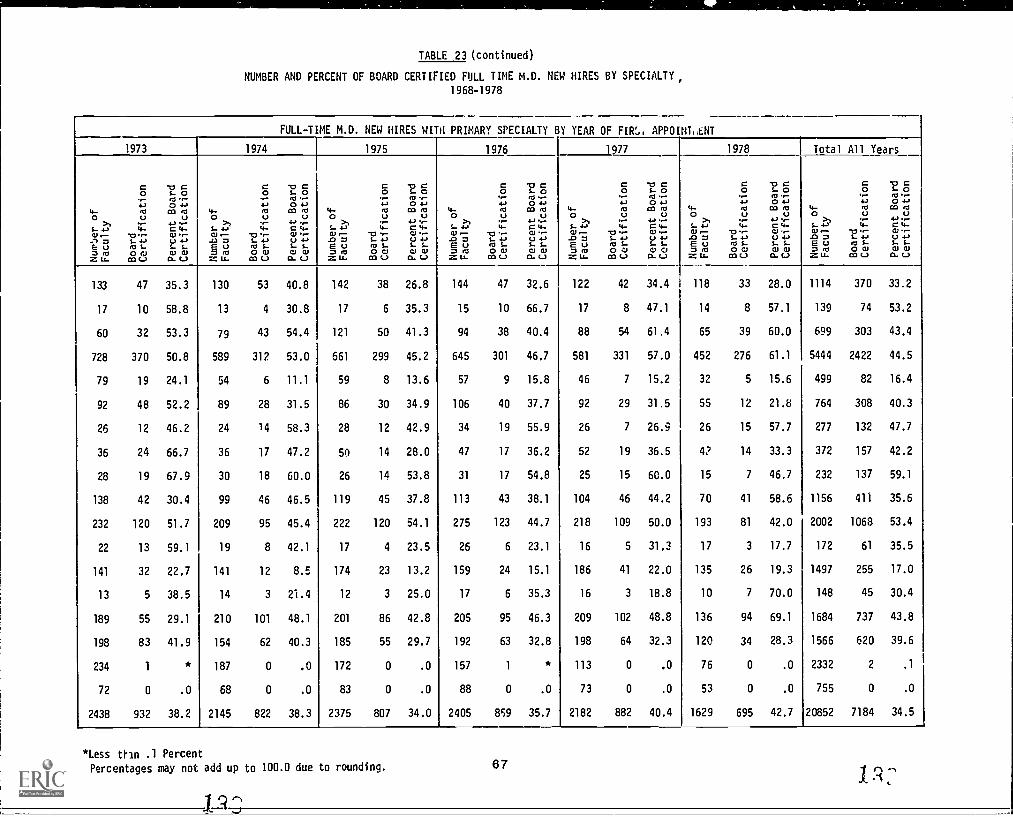
TABLE 23 (continued)
NUMBER AND PERCENT OF BOARD CERTIFIED FULL TIME M.D. NEW HIRES BY SPECIALTY,
1968-1978
FULL-T ME M.D. NEW HIRES WITH PRIMARY SPECIALTY BY YEAR OF FIR:. APPOINT HOT
1973 1974 1975 1976 1977 1978 Total All Years
C0 'V C5- 0C0 'V C5- 0 C0 'V C5- O
C0 O C5.- 0
C0 V C5.- 0
C0 V C5- 0C0 V C
5.- 0
4-4,MS
04mV 4-4e0
04,03 e0 4..
4,e0
04,CO W 4-
4,e0
04,CO ..0 4-
4MS
04,CO W <
4 04,CO W 4-
4e0
04,CO r0
0 U U 0 U U 0 U U 0 U U 0 U 0 0>
U U 0 U U
5-4, 4- C4- 5- .443 4- C 4- 5-4, 4- C4- 5- 4, 4- C4- 5- 4.. .4- C 4- 5- C 4- 5-4, 4- C4-
1 oEciZeOZ U-
S-4-$mi-OCJ
CO (...)
U 4,s...s...
WWCt. C.,
1.10U
Oe0Z U-
5-4,ms-OW
CO f-)
U 4,s...s...
W Wa. L.)
-0 OU
OMZ U-
5- 4.=ms-OW
CO C-.)
U 4Js......
WWCu L./
-0 oeuOn!Z U-
5-4,ms-OWCO (-)
U4,s.....
WWCt. L./
-0 oUOr0
Z U-
5-4,ms-OW
CO L)
U4,s.....
0.10a. L./
-0 OUOe0
Z U-
5-4,mls-00CO LI
U4,s......
WWa. (-.)
-0 OUOr0
Z U-
5-4,ms-OWCO LI
U4,s......
WWa. L.)
133 47 35.3 130 53 40.8 142 38 26.8 144 47 32.6 122 42 34.4 118 33 28.0 1114 370 33.2
17 10 58.8 13 4 30.8 17 6 35.3 15 10 66.7 17 8 47.1 14 8 57.1 139 74 53.2
60 32 53.3 79 43 54.4 121 50 41.3 94 38 40.4 88 54 61.4 65 39 60.0 699 303 43.4
728 370 50.8 589 312 53.0 661 299 45.2 645 301 46.7 581 331 57.0 452 276 61.1 5444 2422 44.5
79 19 24.1 54 6 11.1 59 8 13.6 57 9 15.8 46 7 15.2 32 5 15.6 499 82 16.4
92 48 52.2 89 28 31.5 86 30 34.9 106 40 37.7 92 29 31.5 55 12 21.8 764 308 40.3
26 12 46.2 24 14 58.3 28 12 42.9 34 19 55.9 26 7 26.3 26 15 57.7 277 132 47.7
36 24 66.7 36 17 47.2 50 14 28.0 47 17 36.2 52 19 36.5 4? 14 33.3 372 157 42.2
28 19 67.9 30 18 60.0 26 14 53.8 31 17 54.8 25 15 60.0 15 7 46.7 232 137 59.1
138 42 30.4 99 46 46.5 119 45 37.8 113 43 38.1 104 46 44.2 70 41 58.6 1156 411 35.6
232 120 51.7 209 95 45.4 222 120 54.1 275 123 44.7 218 109 50.0 193 81 42.0 2002 1068 53.4
22 13 59.1 19 8 42.1 17 4 23.5 26 6 23.1 16 5 31.3 17 3 17.7 172 61 35.5
141 32 22.7 141 12 8.5 174 23 13.2 159 24 15.1 186 41 22.0 135 26 19.3 1497 255 17.0
13 5 38.5 14 3 21.4 12 3 25.0 17 6 35.3 16 3 18.8 10 7 70.0 148 45 30.4
189 55 29.1 210 101 48.1 201 86 42.8 205 95 46.3 209 102 48.8 136 94 69.1 1684 737 43.8
198 83 41.9 154 62 40.3 185 55 29.7 192 63 32.8 198 64 32.3 120 34 28.3 1566 620 39.6
234 1 187 0 .0 172 0 .0 157 1 * 113 0 .0 76 0 .0 2332 2 .1
72 0 .0 68 0 .0 83 0 .0 88 0 .0 73 0 .0 53 0 .0 755 0 .0
2438 932 38.2 2145 822 38.3 2375 807 34.0 2405 859 35.7 2182 882 40.4 1629 695 42.7 20852 7184 34.5
*Less thin .1 Percent
Percentages may not add up to 100.0 due to rounding. 67
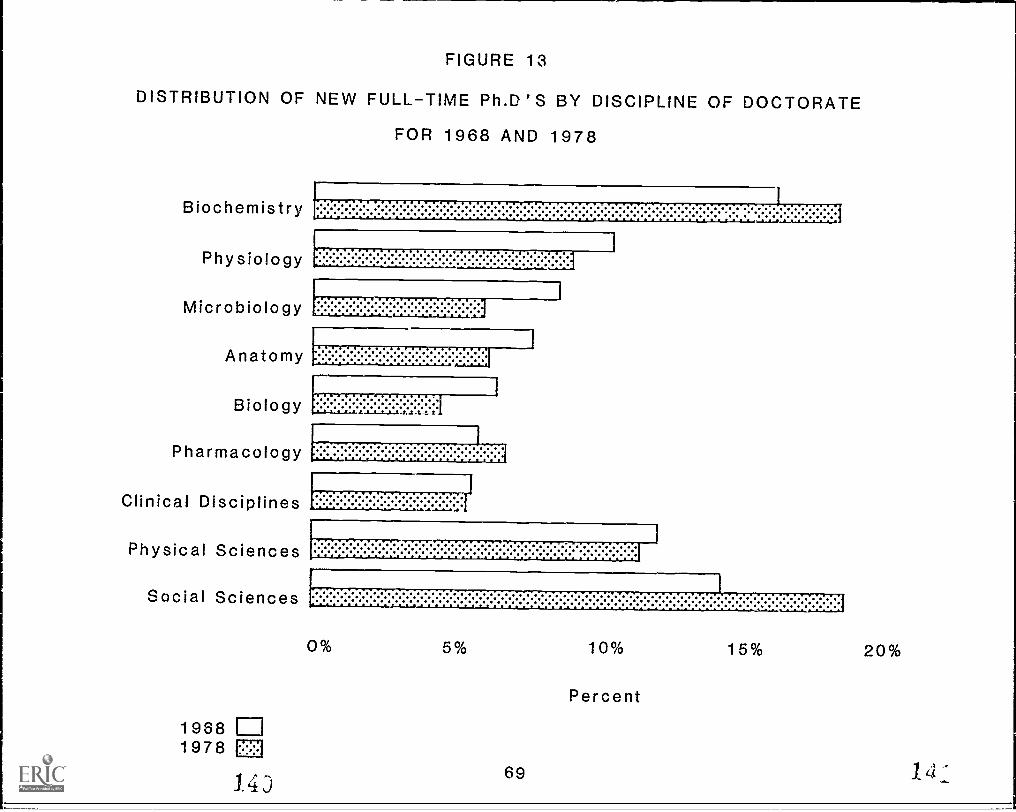
FIGURE 13
DISTRIBUTION OF NEW FULLTIME Ph.D S BY DISCIPLINE OF DOCTORATE
FOR 1968 AND 1978
Biochemistry
Physiology
Microbiology
Anatomy
Biology
rITTITITSa.J..i.S.J.-a-L-1-.11-4J-*
1
Pharmacology
Clinical Disciplines
Physical Sciences
Social Sciences
1968 El1978 F.
143
1
0% 5%
69
10%
Percent
15% 20%
14T
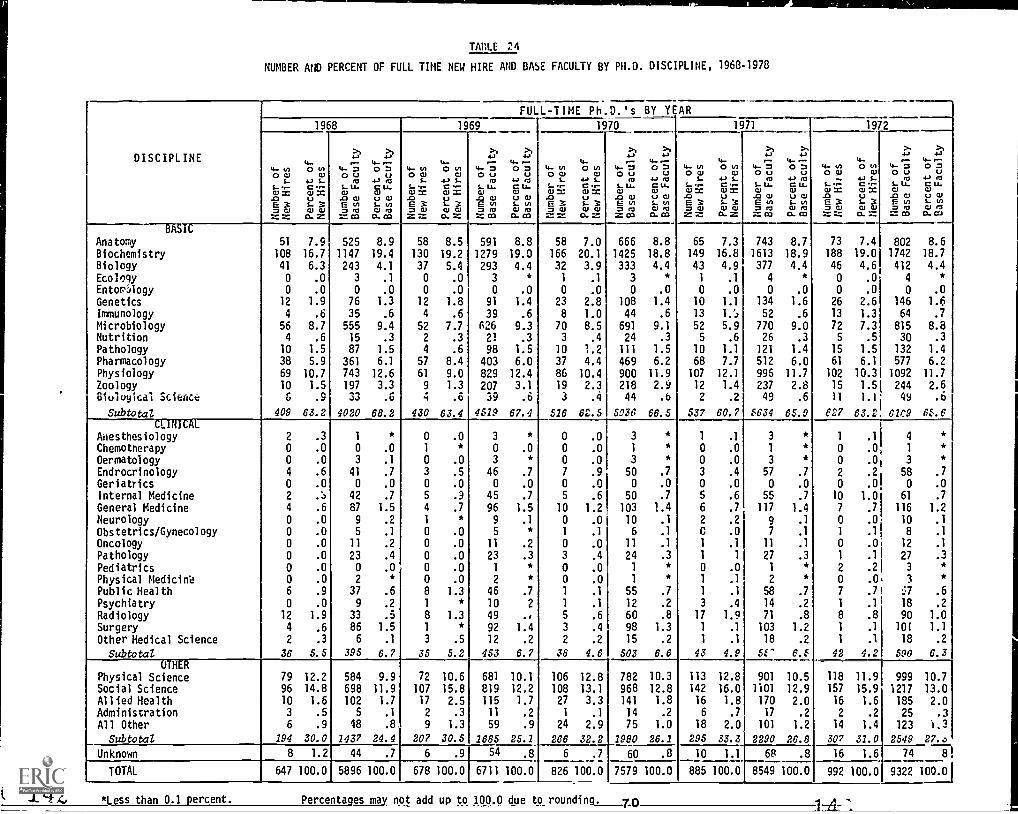
144,
TMLE
NUMBER AND PERCENT OF FULL TIME NEW HIRE AND BASE FACULTY BY PH.D. DISCIPLINE, 1968-1978
DISCIPLINE
FULL-TIME Ph.D.'s BY YEAR
1968 1969 1970
4-4- 1/1 OtnOW W
L 4.4 L.L " C "Cl x W =UE3 L3.w ww.. ...
>s >s4.. ro.
4.. 7 0 70u Ura 4-) f a
1.0 U. C U.W W.OW UWEtn Lo.m wm.c. ..c.
Um4.. 1/1 otnOw wL 4J LL ',- C .-Cl = Cl S.0 UE3 L3.w ww. 2.': M. =
>s >s4- ..-.
4-m 0mOu um 4-) m
L U. C U.W W.OW UWEo Lo.m wmL': CO 0. CO
4..4.. o 0tnOW W
L 4-) LL .,- C .Cl = W x.0 UE; L3.w ww...Z 0. M".
>s4.,>s
4..-4.. m OMOu U
ra 4., raL U. C U.W Cl
-taN 4e3;.m wm= CM 0. CO
4. 1/1OwLL..-CI =.0E3mw= Z.:
-73TSCIC
Anatomy 51 7.9 525 8.9 58 8.5 591 8.8 58 7.0 666 8.8 65
Biochemistry 108 16.7 1147 19.4 130 19.2 1279 19.0 166 20.1 1425 18.8 149
Biology 41 6.3 243 4.1 37 5.4 293 4.4 32 3.9 333 4.4 43
Ecology 0 .0 3 .1 0 .0 3 1 .1 3 1
EntomAogy 0 .0 0 .0 0 .0 0 .0 0 .0 0 .0 0
Genetics 12 1.9 76 1.3 12 1.8 91 1.4 23 2.8 108 1.4 10
Immunology 4 .6 35 .6 4 .6 39 .6 8 1.0 44 .6 13
Microbiology 56 8.7 555 9.4 52 7.7 626 9.3 70 8.5 691 9.1 52
Nutrition 4 .6 15 .3 2 .3 21 .3 3 .4 24 .3 5
Pathology 10 1.5 87 1.5 4 .6 98 1.5 10 1.2 111 1.5 10
Pharmacology 38 5.9 361 6.1 57 8.4 403 6.0 37 4.4 469 6.2 68
Physiology 69 10.7 743 12.6 61 9.0 829 12.4 86 10.4 900 11.9 107
Zoology 10 1.5 197 3.3 9 1.3 207 3.1 19 2.3 218 2.9 12
Bioloyical Science .9 33 .6 4 .6 39 .6 3 .4 44 .6 2
Subtotal 409 63.2 4020 68.2 430 63.4 4529 67.4 516 62.5 503e 66.5 537CLINICAL
Anesthesiology 2 .3 1 0 .0 3 0 .0 3 * 1
Chemotherapy 0 .0 0 .0 1 * 0 .0 0 .0 1 * 0
Oermatology 0 .0 3 .1 0 .0 3 * 0 .0 3 * 0
Endrocrinology 4 .6 41 .7 3 .5 46 .7 7 .9 50 .7 3
Geriatrics 0 .0 0 .0 0 .0 0 .0 0 .0 0 .0 0
Internal Medicine 2 2.) 42 .7 5 .9 45 .7 5 .6 50 .7 5
General Medicine 4 .6 87 1.5 4 .7 96 1.5 10 1.2 103 1.4 6
Neurology 0 .0 9 .2 1 * 9 .1 0 .0 10 .1 2
Obstetrics/Gynecology 0 .0 5 .1 0 .0 5 * 1 .1 6 .1 C
Oncology 0 .0 11 .2 0 .0 11 .2 0 .0 11 .1 1
Pathology 0 .0 23 .4 0 .0 23 .3 3 .4 24 .3 1
Pediatrics 0 .0 0 .0 0 .0 1 * 0 .0 1 * 0
Physical Medicirie 0 .0 2 * 0 .0 2 * 0 .0 1 * 1
Public Health 6 .9 37 .6 8 1.3 46 .7 1 .1 55 .7 1
Psychiatry 0 .0 9 .2 1 * 10 2 1 .1 12 .2 3
Radiology 12 1.9 33 .5 8 1.3 49 ., 5 .6 60 .8 17
Surgery 4 .6 86 1.5 1 * 92 1.4 3 .4 98 1.3 1
Other Medical Science 2 .3 6 .1 3 .5 12 .2 2 .2 15 .2 1
Subtotal 36 5.5 395 6.7 35 5.2 453 6.7 38 4.6 503 6.6 43
OTHERPhysical Science 79 12.2 584 9.9 72 10.6 681 10.1 106 12.8 782 10.3 113
Social Science 96 14.8 698 11.9 107 15.8 819 12.2 108 13.1 968 12.8 142
Allied Health 10 1.6 102 1.7 17 2.5 115 1.7 27 3.3 141 1.8 16
Administration 3 .5 5 .1 2 .3 11 .2 1 .1 14 .2 6
All Other 6 .9 48 .8 9 1.3 59 .9 24 2.9 75 1.0 18
Subtotal 194 30.0 1437 24.4 207 30.5 1685 25.1 266 32.2 1980 26.1 295
Unknown 8 1.2 44 .7 6 .9 54 .8 6 .7 60 .8 10
TOTAL 647 100.0 5896 100.0 678 100.0 6711 100.0 826 100.0 7579 100.0 885
*Less than 0.1 percent. Percentages may not add up to 100.0 due to rounding. 70
1971 1972
> >4.. 4.. .-.. 4.. 14, .-Oo 4-M OM 4.. 1/1 Otn 4-m OmW Ou u Ow W 0 U u
4-, !... ra 4., ra 4., L. fa 4-, 'aC..- L U. C U.. to ;: C 0- t- U. C U.W S Cl Cl w= W = Cl Cl
u .0 W U cl./ .0 u .0 W U WL3 E0 Lo E3 LX Eo LoC1 C1 mm wm mw C1 C1 mm WMo. = = co O. co = :_-. o- = = co o- cO
7.3 743 8.7 73 7.4 802 8.616.8 1613 18.9 188 19.0 1742 18.7
4.9 377 4.4 46 4.6 412 4.4
.1 4 0 .0 4
.0 0 .0 0 .0 0 .0
1.1 134 1.6 26 2.6 146 1.652 .6 13 1.3 64 .7
5.9 770 9.0 72 7.3 815 8.8.6 26 .3 5 .5 30 .3
1.1 121 1.4 15 1.5 132 1.4
7.7 512 6.0 61 6.1 577 6.2
12.1 996 11.7 102 10.3 1092 11.7
1.4 237 2.8 15 1.5 244 2.6
.2 49 .6 11 1.1 49 .6
60.7 6634 65.9 627 63.2 02e9 66.6
.1 3 1 .1 4 *
.0 1 * 0 .0 1 *
.0 3 * 0 .0 3 *
.4 57 .7 2 .2 58 .7
.0 0 .0 0 .0 0 .0
.6 55 .7 10 1.0 61 .7
.7 117 1.4 7 .7 116 1.2
.2 9 .1 0 .0 10 .1
.0 7 .1 1 .1 8 .1
.1 11 .1 0 .0 12 .1
1 27 .3 1 .1 27 .3
.0 1 * 2 .2 3 *
.1 2 * 0 .0, 3 *
.1 58 .7 7 .7 ::7 .6
.4 14 .2 1 .1 18 .2
1.9 71 .8 8 .8 90 1.0
.1 103 1.2 1 .1 101 1.1
.1 18 .2 1 .1 18 .2
4.9 5( 6.6 42 4.2 590 6.3
12.8 901 10.5 118 11.9
16.0 1101 12.9 157 15.91.8 170 2.0 16 1.6
.7 17 .2 2 .2
2.0 101 1.2 14 1.4
33.3 2290 26.8 307 31.0
999 10.7
1217 13.0185 2.0
25 .3
123 1.3
2549 27.o
1.1 68 .8 16 1.6 74 81100.0 8549 100.0 992 100.0 9322 100.01
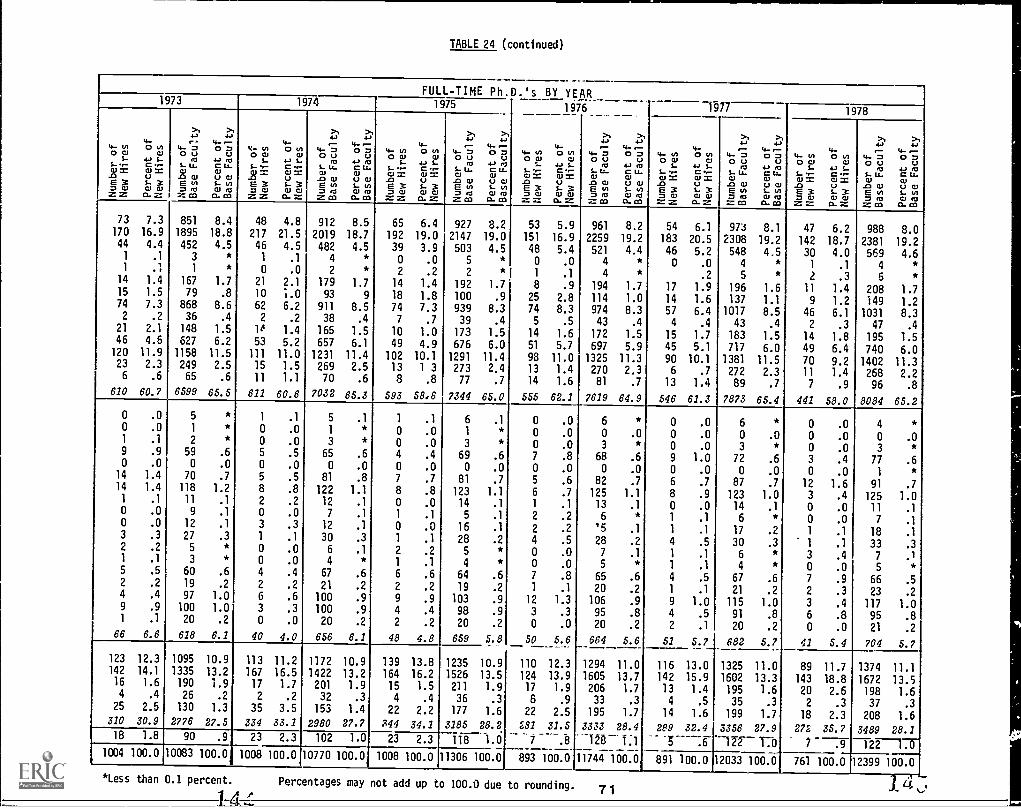
TABLE 24 (continued)
1974
.0
2 0.0J CU CU
0 WS...- CCU = =E 3 C. 3
S..
CX)
OJ
0Li.
E 0mm
O
4_,r.
73 7.3 851
170 16.9 189544 4.4 452
1 .1 3
1 .1 1
14 1.4 167
15 1.5 7974 7.3 8682 .2 36
21 2.1 148
46 4.6 627
120 11.9 115823 2.3 2496 .6 65
610 60.7 6599
0 .0
0 .0
1 .1
9 .9
0 .0
14 1.4
14 1.4
1 .1
0 .0
0 .0
3 .3
2 .2
1 .1
5 .5
2 .2
4 .4
9 .9
1 .1
66 6.6
5
1
2
59
0
70
118
11
9
12
27
5
3
60
19
97
10020
618
123 12.3
142 14.1
16 1.6
4 .4
25 2.5
310 30.9
1095
1335
190
26
130
2776
18 1.8 90
1004 100.0 10083
FULL-TIME Ph.D.'s BY YEAR1975 1976 -1977--------
4- -00
CU 0wm
O. CO
,4- 00 WLLCU =.0E 3= CU2Z 2
4-0 0L
CCU =
LW WO. 2
4- 70 U.C1
C.L. a
C11
ErnCO
4- -0 0r0
CUU aJLu
r0O. CO
4- 00 WLL =
_05 3wzz
4-0 0CCU =
3w cuz
4. 70 Utvta.
CU.0 W5 w
co2 CO
4-0
CliCUU cus..0J .ct
O. CO
4-NLCU =.0E7 W
Z..."
4-ONCCU =
L0 00.
8.4 48 4.8 912 8.5 65 6.4 927 3.2 53 5.918.8 217 21.5 2019 18.7 192 19.0 2147 19.0 151 16.94.5 46 4.5 482 4.5 39 3.9 503 4.5 48 5.4
1 .1 4 0 .0 5 0 .00 .0 2 2 .2 2 *f 1 .1
1.7 21 2.1 179 1.7 14 1.4 192 1.7 8 .9.8 10 .1.0 93 9 18 1.8 100 .9 25 2.8
8.6 62 6.2 911 8.5 74 7.3 939 8.3 74 8.3.4 2 .2 38 .4 7 .7 39 .4 5 .5
1.5 10 1.4 165 1.5 10 1.0 173 1.5 14 1.66.2 53 5.2 657 6.1 49 4.9 676 6.0 51 5.7
11.5 111 11.0 1231 11.4 102 10.1 1291 11.4 98 11.02.5 15 1.5 269 2.5 13 1 3 273 2.4 13 1.4.6 11 1.1 70 .6 8 .8 77 .7 14 1.6
65.5 611 60.6 7032 65.3 593 58e6 7344 65.0 555 62.1
1 .1 5 .1 1 .1 6 .1 0 .00 .0 1 0 .0 1 0 .00 .0 3 0 .0 3 0 .0
.6 5 .5 65 .6 4 .4 69 .6 7 .8
.0 0 .0 0 .0 0 .0 0 .0 0 .0
.7 5 .5 81 .8 7 .7 81 .7 5 .61.2 8 .8 122 1.1 8 .8 123 1.1 6 .7.1 2 .2 12 .1 0 .0 14 .1 1 .1.1 0 .0 7 .1 1 .1 5 .1 2 .2.1 3 .3 12 .1 0 .0 16 .1 2 .2.3 1 .1 30 .3 1 .1 28 .2 4 .5
0 .0 6 .1 2 .2 5 0 .00 .0 4 1 .1 4 0 .0
.6 4 .4 67 .6 6 .6 64 .6 7 .8
.2 2 .2 21 .2 2 .2 19 .2 1 .11.0 6 .6 100 .9 9 .9 103 .9 12 1.31.0 3 .3 100 .9 4 .4 98 .9 3 .3.2 0 .0 20 .2 2 .2 20 .2 0 .0
6.1 40 4.0 656 6.1 48 4.6 659 5.8 50 5.6
10.9 113 11.2 1172 10.9 139 13.8 1235 10.9 110 12.313.2 167 16.5 1422 13.2 164 16.2 1526 13.5 124 13.91.9 17 1.7 201 1.9 15 1.5 211 1.9 17 1.9.2 2 .2 32 .3 4 .4 36 .3 8 .9
1.3 35 3.5 153 1.4 22 2.2 177 1.6 22 2.527.5 334 33.1 2980 27.7 344 34.1 3185 28.2 261 31.5
.9 23 2.3 102 1.0 23 2.3 118 1.0
100.0 1008 100.0 10770 100.0 1008 100.0 11306 100.0 893 100.0
4-.--'4_n 0 7O U
. r0S. Lc- C
aJ0 a7 U CUE rn S- rn
0.1rf.: CO CL CO
19 78
>I >4-,
4- 4- t- 4-4- 0 0 0 4.. 7 0 7 4.. 0 0 1.01O w w o e., U 0 CI WS. 4 .1 S. rct 4., .C1 S. 4J S.S.. ..- C .- S. U. C lt. S. .- C .-CI 2 a, = a, W W = CU =-0 U -OW UW -0 UE3 L3 e 0 L 0 E3 L3O 0., w 0J 0 .C1 0J ,C1 7 CI 0J 0J2 2 0. 2 .7r.= 03 0.m z2.= 0. Z
e- r-4- 7 0O U
eCtC.U. C liCU CU
-0 CU U 0JE ul S. 0r0 CJ
CO 0.m
961 8.22259 19.2
521 4.44
4
194 1.7
114 1.0974 8.343 .4
172 1.5
697 5.91325 11.3270 2.381 .7
7619 64.9
54 6.1
183 20.546 5.20 .0
.2
17 1.9
14 1.657 6.44 .4
15 1.7
45 5.1
90 10.1
6 .7
13 1.4
546 61.3
973 8.1 47 6.22308 19.2 142 18.7548 4.5 30 4.0
4 1 .1
5 2 .3196 1.6 11 1.4137 1.1 9 1.2
1017 8.5 46 6.143 .4 2 .3
183 1.5 14 1.8717 6.0 49 6.4
1381 11.5 70 9.2272 2.3 11 1.489 .7 7 .9
7873 65.4 441 58.0
988 8.02381 19.2569 4.6
4
6
208 1.7
149 1.2
1031 8.347 .4
195 1.5
740 6.01402 11.3268 2.2
96 .8
8084 65.2
6
0 .0
3
68 .6
0 .0
82 .7
125 1.1
13 .1
6
'5 .1
28 .2
7 .1
5
65 .6
20 .2
106 .9
95 .8
20 .2
664 5.6
1294 11.01605 13.7206 1.7
33 .3
195 1.7
3333 28.4
-128- T:111744 100.0
.0
.0
.0
1.0
.0
.7
.9
.0
1 .1
1 .1
4 .5
1 .1
1 .1
4 .5
1 .1
9 1.04 .5
2 .1
51 5.7
116 13.0142 15.913 1.44 .5
14 1.6
289 32.4
6 0 .0
0 .0 0 .03 0 .072 .6 3 .4
0 .0 0 .087 .7 12 1.6123 1.0 3 .4
14 .1 0 .06 0 .0
17 .2 1 .1
30 .3 1 .1
6 3 .4
4 0 .0
67 .6 7 .9
21 .2 2 .3
115 1.0 3 .4
91 .8 6 .820 .2 0 .0
682 5.7 41 5.4
4
0 .0
3
77 .6
1
91 .7
125 1.011 .1
7 .1
18 .1
33 .3
7 .1
5
66 .5
23 .2
117 1.095 .8
21 .2
704 5.7
1325 11.0 89 11.71602 13.3 143 18.8195 1.6 20 2.635 .3 2 .3
199 1.7 18 2.3
3356 27.9 272 35.7
-172- rb 1 .9
891 100.0
1374 11.1
1672 13.5198 1.637 .3
208 1.6
3489 28.1
122 1.012033 100.01 761 100.0 12399 100.0
*Less than 0.1 percent.
1.4Th,Percentages may not add up to 100.0 due to rounding.
71 1 4
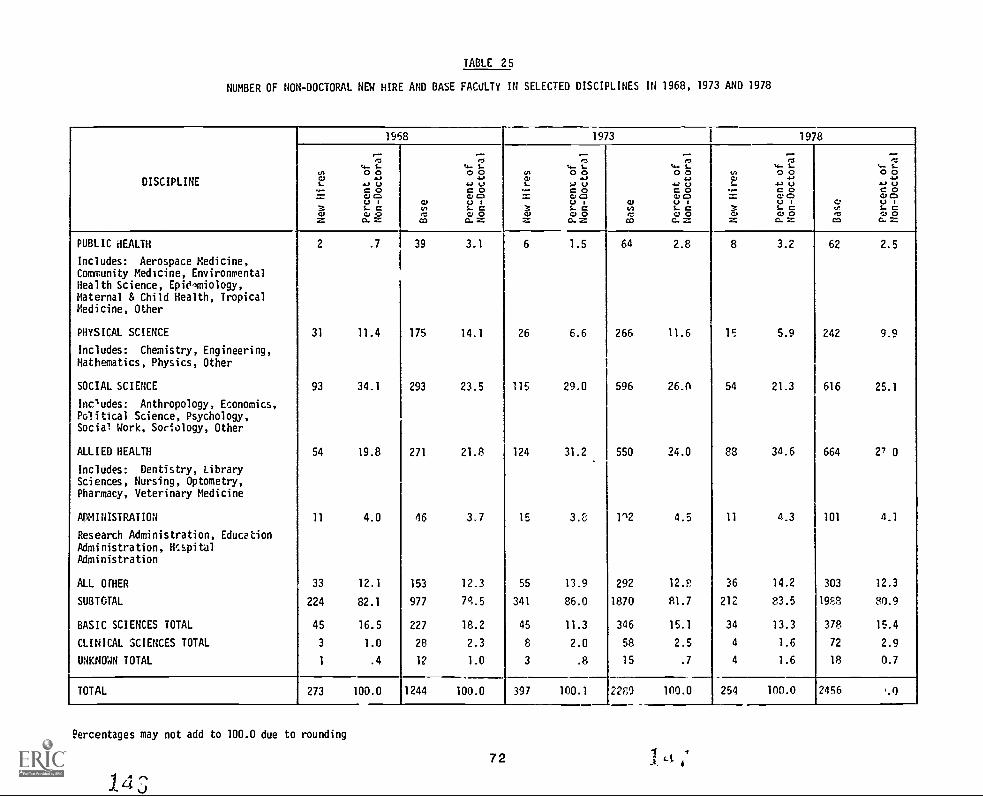
TABLE 25
NUMBER OF NON-DOCTORAL NEW HIRE AND BASE FACULTY IN SELECTED DISCIPLINES IN 1968, 1973 AND 1978
DISCIPLINE
1958 1973 1978
Nvs_
--r-
3WZ
,,- 1_0 04, uCOC.3 ClV1- CW 00- Z
C)0M
CO
,,_ 1_0 0.,.
.0 uCOCU C)V 11- CV 0
C... Z
N0.,
s_....=.,-VZ
-m
4- 1,-0 04_,
:, uCOO C:1L.) 1
1- C0 0O.. 2.'."
C)0M
CO
7z4- 1._0 01.,.. U
C OC., COV I1- CV 0C. ...
NC,
..-=30Z
,74- 1,-0 04.0COCI: C)V 11- CC 0G. 2:
C0MCO
-m
4- 1,-0 04.0 u4.0
C 0V C0V I1- Cr... 0
O. .7-'
PUBLIC HEALTH 2 .7 39 3.1 6 1.5 64 2.8 8 3.2 62 2.5
Includes: Aerospace Medicine,Community Medicine, EnvironmentalHealth Science, Epidemiology,Maternal & Child Health, TropicalMedicine, Other
PHYSICAL SCIENCE 31 11.4 175 14.1 26 6.6 266 11.6 15 5.9 242 9.9
Includes: Chemistry, Engineering,Mathematics, Physics, Other
SOCIAL SCIENCE 93 34.1 293 23.5 115 29.0 596 26.0 54 21.3 616 25.1
Includes: Anthropology, Economics,Political Science, Psychology,Social Work, Sociology, Other
ALLIED HEALTH 54 19.8 271 21.8 124 31.2 550 24.0 83 34.6 664 27 0
Includes: Dentistry, LibrarySciences, Nursing, Optometry,Pharmacy, Veterinary Medicine
MINISTRATION 11 4.0 46 3.7 15 3.8 112 4.5 11 4.3 101 4.1
Research Administration, Education
Administration, HcspitalAdministration
ALL OTHER 33 12.1 153 12.3 55 13.9 292 12.P 36 14.2 303 12.3
SUBTOTAL 224 82.1 977 71.5 341 86.0 1870 81.7 212 83.5 1988 80.9
BASIC SCIENCES TOTAL 45 16.5 227 18.2 45 11.3 346 15.1 34 13.3 378 15.4
CLINICAL SCIENCES TOTAL 3 1.0 28 2.3 8 2.0 58 2.5 4 1.6 72 2.9
UNKNOWN TOTAL 1 .4 12 1.0 3 .8 15 .7 4 1.6 18 0.7
TOTAL 273 100.0 1244 100.0 397 100.1 221 100.0 254 100.0 2456 '.0
Percentages may not add to 100.0 due to rounding
72
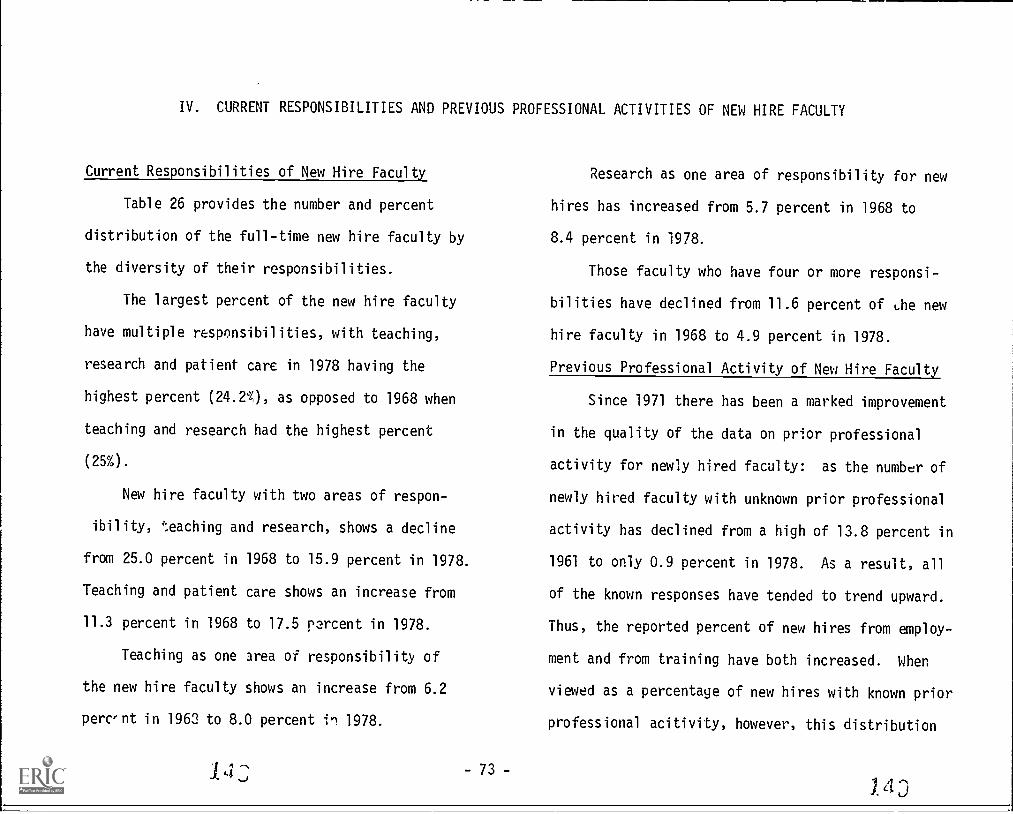
IV. CURRENT RESPONSIBILITIES AND PREVIOUS PROFESSIONAL ACTIVITIES OF NEW HIRE FACULTY
Current Responsibilities of New Hire Faculty
Table 26 provides the number and percent
distribution of the full-time new hire faculty by
the diversity of their responsibilities.
The largest percent of the new hire faculty
have multiple responsibilities, with teaching,
research and patient care in 1978 having the
highest percent (24.2%), as opposed to 1968 when
teaching and research had the highest percent
(25%).
New hire faculty with two areas of respon-
ibility, teaching and research, shows a decline
from 25.0 percent in 1968 to 15.9 percent in 1978.
Teaching and patient care shows an increase from
11.3 percent in 1968 to 17.5 parcent in 1978.
Teaching as one area of responsibility of
the new hire faculty shows an increase from 6.2
percent in 1963 to 8.0 percent in 1978.
14- 73 -
Research as one area of responsibility for new
hires has increased from 5.7 percent in 1968 to
8.4 percent in 1978.
Those faculty who have four or more responsi-
bilities have declined from 11.6 percent of he new
hire faculty in 1968 to 4.9 percent in 1978.
Previous Professional Activity of New Hire Faculty
Since 1971 there has been a marked improvement
in the quality of the data on prior professional
activity for newly hired faculty: as the number of
newly hired faculty with unknown prior professional
activity has declined from a high of 13.8 percent in
1961 to only 0.9 percent in 1978. As a result, all
of the known responses have tended to trend upward.
Thus, the reported percent of new hires from employ-
ment and from training have both increased. When
viewed as a percentage of new hires with known prior
professional acitivity, however, this distribution
14D
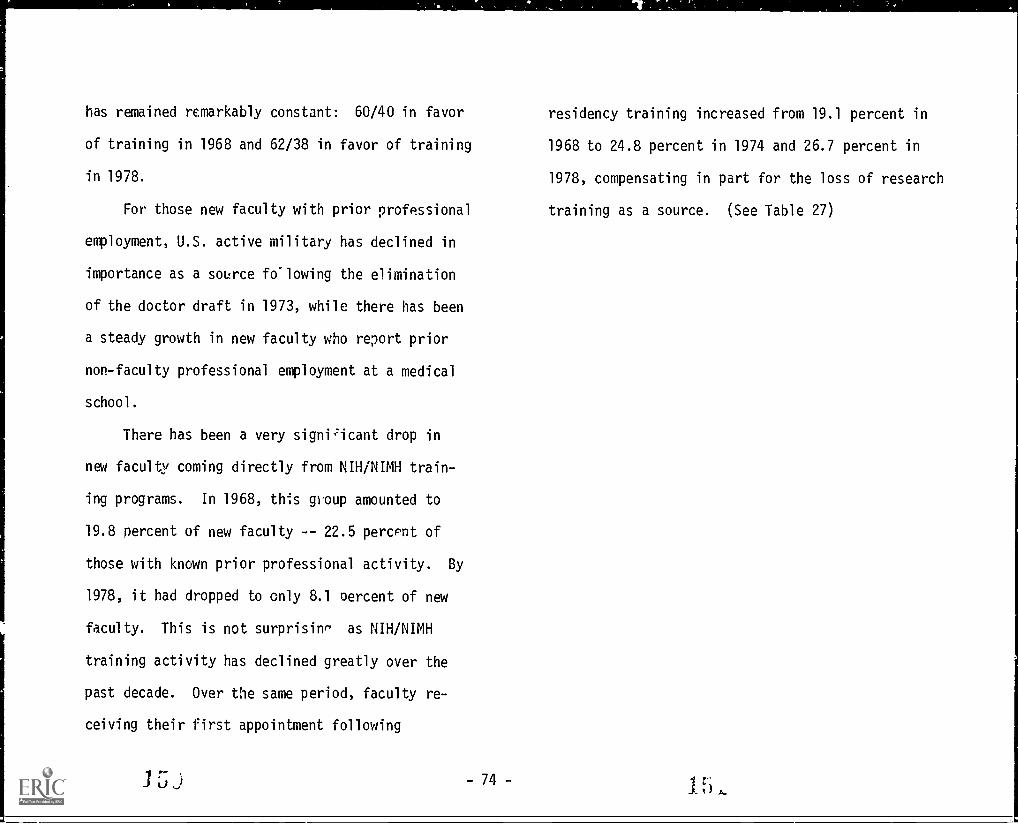
has remained remarkably constant: 60/40 in favor
of training in 1968 and 62/38 in favor of training
in 1978.
For those new faculty with prior professional
employment, U.S. active military has declined in
importance as a source fo'lowing the elimination
of the doctor draft in 1973, while there has been
a steady growth in new faculty who report prior
non-faculty professional employment at a medical
school.
There has been a very significant drop in
new faculty coming directly from NIH/NIMH train-
ing programs. In 1968, this group amounted to
19.8 percent of new faculty -- 22.5 percent of
those with known prior professional activity. By
1978, it had dropped to only 8.1 percent of new
faculty. This is not surprising as NIH/NIMH
training activity has declined greatly over the
past decade. Over the same period, faculty re-
ceiving their first appointment following
.15J -74-
residency training increased from 19.1 percent in
1968 to 24.8 percent in 1974 and 26.7 percent in
1978, compensating in part for the loss of research
training as a source. (See Table 27)
c'
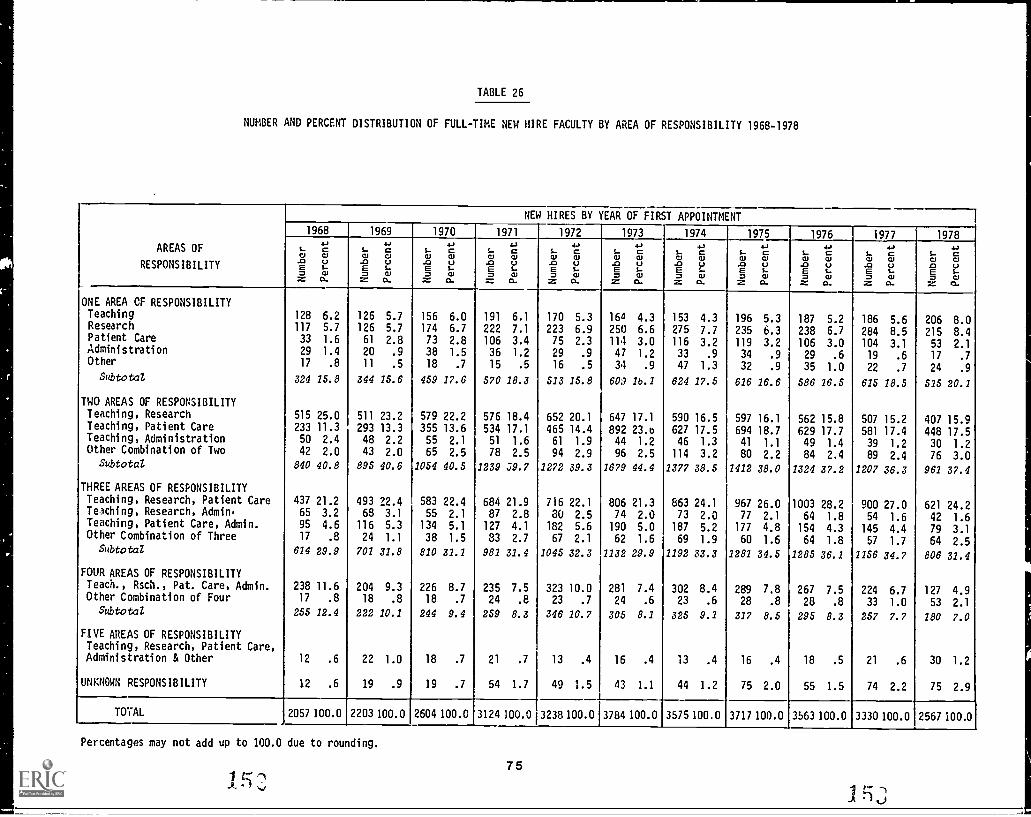
TABLE 26
NUMBER AND PERCENT DISTRIBUTION OF FULL-TIME NEW HIRE FACULTY BY AREA OF RESPONSIBILITY 1968-1978
AREAS OF
RESPONSIBILITY
NEW HIRES BY YEAR OF FIRST APPOINTMENT
1968 1969 1970 1971 1972 1973 1974 1975 1976 1977 19784.31..cs..cs..s..cs..cs..cs..ow
.0 LSE S.-M alZ 0.
4.1Wu.0 (.3E T-0 alZ O.
4.1ww.0 LSE S..V C1)Z 0.
.1-Tww.0 (.1E S...0 CV= 0.
ww.0 (.3E S..0 C1)= a
4.1ww.0 (.3E S-0 alZ a
4-,ww.0 (.3E S..0 alZ O.
4.1ww.0 LTE T-0 alZ O.
4.,ww.0 LTE S..0 alZ 0.
4.,
w w.0 LSE S..0 a= 0.
4.)
w w.0 (.3E T-0 az CL
ONE AREA CF RESPONSIBILITYTeaching 128 6.2 126 5.7 156 6.0 191 6.1 170 5.3 164 4.3 153 4.3 196 5.3 187 5.2 186 5.6 206 8.0Research 117 5.7 126 5.7 174 6.7 222 7.1 223 6.9 250 6.6 275 7.7 235 6.3 238 6.7 284 8.5 215 8.4Patient Care 33 1.6 61 2.8 73 2.8 106 3.4 75 2.3 114 3.0 116 3.2 119 3.2 106 3.0 104 3.1 53 2.1Administration 29 1.4 20 .9 38 1.5 36 1.2 29 .9 47 1.2 33 .9 34 .9 29 .6 19 .6 17 .7Other 17 .8 11 .5 18 .7 15 .5 16 .5 34 .9 47 1.3 32 .9 35 1.0 22 .7 24 .9
Subtotal 324 15.8 344 15.6 459 17.6 570 18.3 513 15.8 609 16.1 624 17.5 616 16.6 586 16.5 615 18.5 515 20.1
TWO AREAS OF RESPONSIBILITYTeaching, Research 515 25.0 511 23.2 579 22.2 576 18.4 652 20.1 647 17.1 590 16.5 597 16.1 562 15.8 507 15.2 407 15.9Teaching, Patient Care 233 11.3 293 13.3 355 13.6 534 17.1 465 14.4 892 23.b 627 17.5 694 18.7 629 17.7 581 17.4 448 17.5Teaching, Administration 50 2.4 48 2.2 55 2.1 51 1.6 61 1.9 44 1.2 46 1.3 41 1.1 49 1.4 39 1.2 30 1.2Other Combination of Two 42 2.0 43 2.0 65 2.5 78 2.5 94 2.9 96 2.5 114 3.2 80 2.2 84 2.4 89 2.4 76 3.0
Su1,tota/ 840 40.8 895 40.6 1054 40.5 1239 59.7 1272 39.3 1679 44.4 1377 38.5 1412 38.0 1324 37.2 1207 36.3 961 37.4
THREE AREAS OF RESPONSIBILITY
Teaching, Research, Patient Care 437 21.2 493 22.4 583 22.4 684 21.9 716 22.1 806 21.3 863 24.1 967 26.0 1003 28.2 900 27.0 621 24.2Texhing, Research, Admin. 65 3.2 68 3.1 55 2.1 87 2.8 a 2.5 74 2.0 73 2.0 77 2.1 64 1.8 54 1.6 42 1.6Teaching, Patient Care, Admin. 95 4.6 116 5.3 134 5.1 127 4.1 182 5.6 190 5.0 187 5.2 177 4.8 154 4.3 145 4.4 79 3.1Other Combination of Three 17 .8 24 1.1 38 1.5 33 2.7 67 2.1 62 1.6 69 1.9 60 1.6 64 1.8 57 1.7 64 2.5
Subtotal 614 29.9 701 31.8 810 31.1 981 31.4 1045 32.3 1132 29.9 1192 33.3 1281 34.5 1285 36.1 1156 34.7 806 31.4
FOUR AREAS OF RESPONSIBILITYTeach., Rsch., Pat. Care, Admin. 238 11.6 204 9.3 226 8.7 235 7.5 323 10.0 281 7.4 302 8.4 289 7.8 267 7.5 224 6.7 127 4.9Other Combination of Four 17 .8 18 .8 18 .7 24 .8 23 .7 24 .6 23 .6 28 .8 28 .8 33 1.0 53 2.1
Subtotal 255 12.4 222 10.1 244 9.4 259 8.3 346 10.7 305 8.1 325 9.1 317 8.5 295 8.3 257 7.7 180 7.0
FIVE AREAS OF RESPONSIBILITYTeaching, Research, Patient Care,Administration & Other 12 .6 22 1.0 18 .7 21 .7 13 .4 16 .4 13 .4 16 .4 18 .5 21 .6 30 1.2
UNKNOWN RESPONSIBILITY 12 .6 19 .9 19 .7 54 1.7 49 1.5 43 1.1 44 1.2 75 2.0 55 1.5 74 2.2 75 2.9
TOTAL 2057100.0 2203100.0 2604100.0 3124100.0 3238100.0 3784100.0 3575100.0 3717100.0 3563100.0 3330100.0 2567100.0
Percentages may not add up to 100.0 due to rounding.
751 C".
s,/
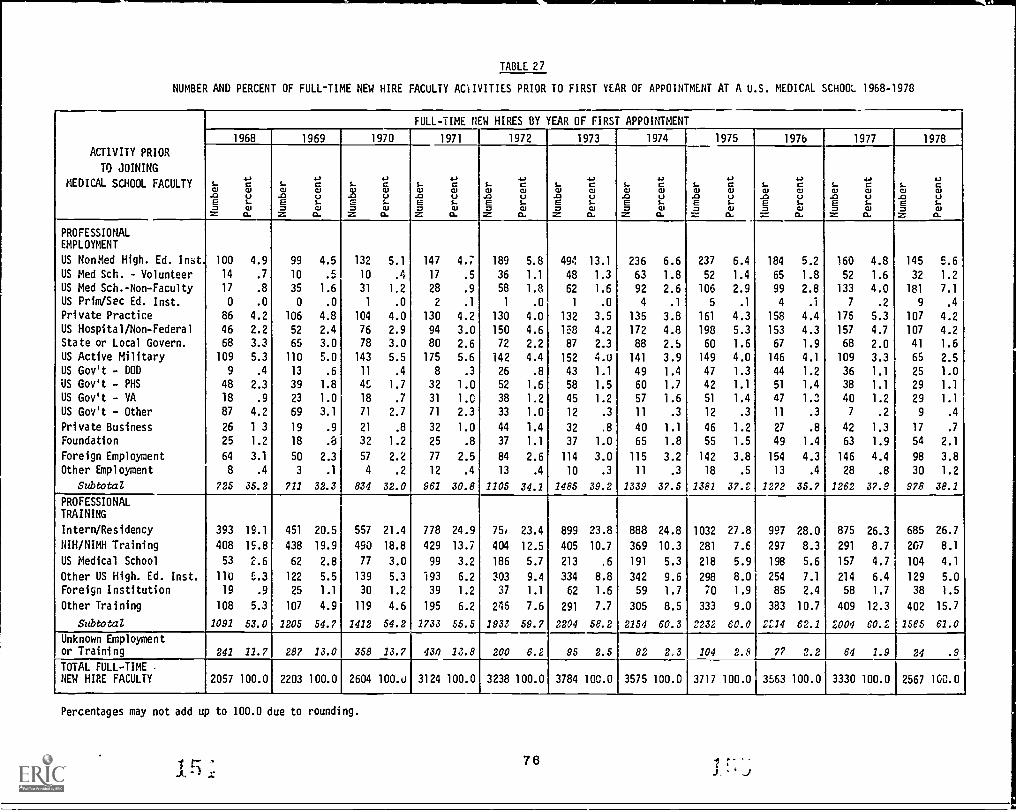
TABLE 27
NUMBER AND PERCENT OF FULL-TIME NEW HIRE FACULTY AC1IVITIES PRIOR TO FIRST YEAR OF APPOINTMENT AT A U.S. MEDICAL SCHOOL 1968-1978
ACTIVITY PRIOR
TO JOINING
MEDICAL SCHOOL FACULTY
FULL-TIME NEW HIRES BY YEAR OF FIRST APPOINTMENT
1968 1969 1970 1971 1972 1973 1974 1975 1976 1977 1978
s-CU.0E0Z
"tialU..Cl
G.
L.t1..t1..CU.0E0Z
CUUS.Cl
A.
CU.0..B.0Z
CUtiLCl
G.
CU.0E0=
4E1CUUS..Cl
G.
L.al.0E0Z
4E1
CUUs-Cl
G.
L.CU.0E0Z
4E1
CUU1...Cl
G.
s..tL.t1.t1.CU.0E0Z
CUULCl
G.
CU.0E0
....
cl.)UL.ClG.
CUXIE0
CUUS.-ClG.
CU.0E0Z
4E1CUtiLCl
Ct.
LCU
33E0=
tCUtiLClG.
PROFESSIONALEMPLOYMENT
US NonMed High. Ed. Inst. 100 4.9 99 4.5 132 5.1 147 4.7 189 5.8 494 13.1 236 6.6 237 6.4 184 5.2 160 4.8 145 5.6
US Med Sch. - Volunteer 14 .7 10 .5 10 .4 17 .5 36 1.1 48 1.3 63 1.8 52 1.4 65 1.8 52 1.6 32 1.2
US Med Sch.-Non-Faculty 17 .8 35 1.6 31 1.2 28 .9 58 1.8 62 1.6 92 2.6 106 2.9 99 2.8 133 4.0 181 7.1
US Prim/Sec Ed. Inst. 0 .0 0 .0 1 .0 2 .1 1 .0 1 .0 4 .1 5 .1 4 .1 7 .2 9 .4
Private Practice 86 4.2 106 4.8 104 4.0 130 4.2 130 4.0 132 3.5 135 3.8 161 4.3 158 4.4 176 5.3 107 4.2
US Hospital/Non-Federal 46 2.2 52 2.4 76 2.9 94 3.0 150 4.6 158 4.2 172 4.8 198 5.3 153 4.3 157 4.7 107 4.2
State or Local Govern. 68 3.3 65 3.0 78 3.0 80 2.6 72 2.2 87 2.3 88 2.5 60 1.6 67 1.9 68 2.0 41 1.6
US Active Military 109 5.3 110 5.0 143 5.5 175 5.6 142 4.4 152 4.0 141 3.9 149 4.0 146 4.1 109 3.3 65 2.5
US Gov't - DOD 9 .4 13 .6 11 .4 8 .3 26 .8 43 1.1 49 1.4 47 1.3 44 1.2 36 1.1 25 1.0
US Gov't - PHS 48 2.3 39 1.8 4S 1.7 32 1.0 52 1.6 58 1.5 60 1.7 42 1.1 51 1.4 38 1.1 29 1.1
US Gov't - VA 18 .9 23 1.0 18 .7 31 1.0 38 1.2 45 1.2 57 1.6 51 1.4 47 1.2 40 1.2 29 1.1
US Gov't - Other 87 4.2 69 3.1 71 2.7 71 2.3 33 1.0 12 .3 11 .3 12 .3 11 .3 7 .2 9 .4
Private Business 26 1 3 19 .9 21 .8 32 1.0 44 1.4 32 .8 40 1.1 46 1.2 27 .8 42 1.3 17 .7
Foundation 25 1.2 18 .8 32 1.2 25 .8 37 1.1 37 1.0 65 1.8 55 1.5 49 1.4 63 1.9 54 2.1
Foreign Employment 64 3.1 50 2.3 57 2.2 77 2.5 84 2.6 114 3.0 115 3.2 142 3.8 154 4.3 146 4.4 98 3.8
Other Employment 8 .4 3 .1 4 .2 12 .4 13 .4 10 .3 11 .3 18 .5 13 .4 28 .8 30 1.2
Subtotal 725 35.2 711 32.3 834 32.0 961 30.8 1105 34.1 1485 39.2 1339 37.5 1381 37.2 1272 35.7 1262 37.9 978 38.1
PROFESSIONALTRAINING
Intern/Residency 393 19.1 451 20.5 557 21.4 778 24.9 75, 23.4 899 23.8 888 24.8 1032 27.8 997 28.0 875 26.3 685 26.7
NIH/NIMH Training 408 1S.8 438 19.9 490 18.8 429 13.7 404 12.5 405 10.7 369 10.3 281 7.6 297 8.3 291 8.7 207 8.1
US Medical School 53 2.6 62 2.8 77 3.0 99 3.2 186 5.7 213 .6 191 5.3 218 5.9 198 5.6 157 4.7 104 4.1
Other US High. Ed. Inst. 110 C.3 122 5.5 139 5.3 193 6.2 303 9.4 334 8.8 342 9.6 298 8.0 254 7.1 214 6.4 129 5.0
Foreign Institution 19 .9 25 1.1 30 1.2 39 1.2 37 1.1 62 1.6 59 1.7 70 1.9 85 2.4 58 1.7 38 1.5
Other Training 108 5.3 107 4.9 119 4.6 195 6.2 246 7.6 291 7.7 305 8.5 333 9.0 383 10.7 409 12.3 402 15.7
Subtotal 1091 53.0 1205 54.7 1412 54.2 1733 55.5 1933 59.7 2204 58.2 2154 60.3 2232 60.0 2f14 62.1 2004 60.2 1565 61.0
Unknown Employmentor Training 241 11.7 287 13.0 358 13.7 430 13.8 200 6.2 95 2.5 82 2.3 104 2.8 77 2.2 64 1.9 24 .9
TOTAL FULL-TIME .
NEW HIRE FACULTY 2057 100.0 2203 100.0 2604 100.0 3124 100.0 3238 100.0 3784 100.0 3575 100.0 3717 100.0 3563 100.0 3330 100.0 2567 100.0
Percentages may not add up to 100.0 due to rounding.
9̂x
76 1 r"J.'

V. GEOGRAPHIC DISTRIBUTION
Increase in Number of Medical Schools
After a long p, Jd of stability, a period
of extraordinary growth in medical education be-
gan in the early sixties. Starting from a base
of eighty-five schools in 1959-60, forty new
medical schools were started in the period ending
1978-79, an increase of 47 percent in the number
of schools. Over the same period, enrollment in-
creased by 108 percent, while the number of full-
time faculty quadrupled. In the study interval
1968-1969 to 1978-1979, thirty schools were started,
and the number of faculty doubled. The total
number of new faculty recruited to medical edu-
cation in this period was 33,759, and this does
not include faculty members who moved from one
medical school to another. Some of these new
faculty did not stay in academe, and of course
some of the older faculty departed also, so that
-77-
the actual new growth was only about two-thirds
of this amount. (See Figure 14.)
Accession of New Hires in Public and Private Schools
The majority of the new medical schools which
have been created in recent years have been public
schools, and these public schools have been respon-
sible for recruitment of a majority of the new
faculty, as one can see from Table 28. The private
schools haie been doing more than their share of
the recruitment, however, when one takes into ac-
count the smaller number of private schools.
Over the period in question, the number of newly
recruited people per school shows a consistent
increase -- from twenty-one new hires per school
in 1968 to approximately thirty-three new hires
per school in 1975.
I 49
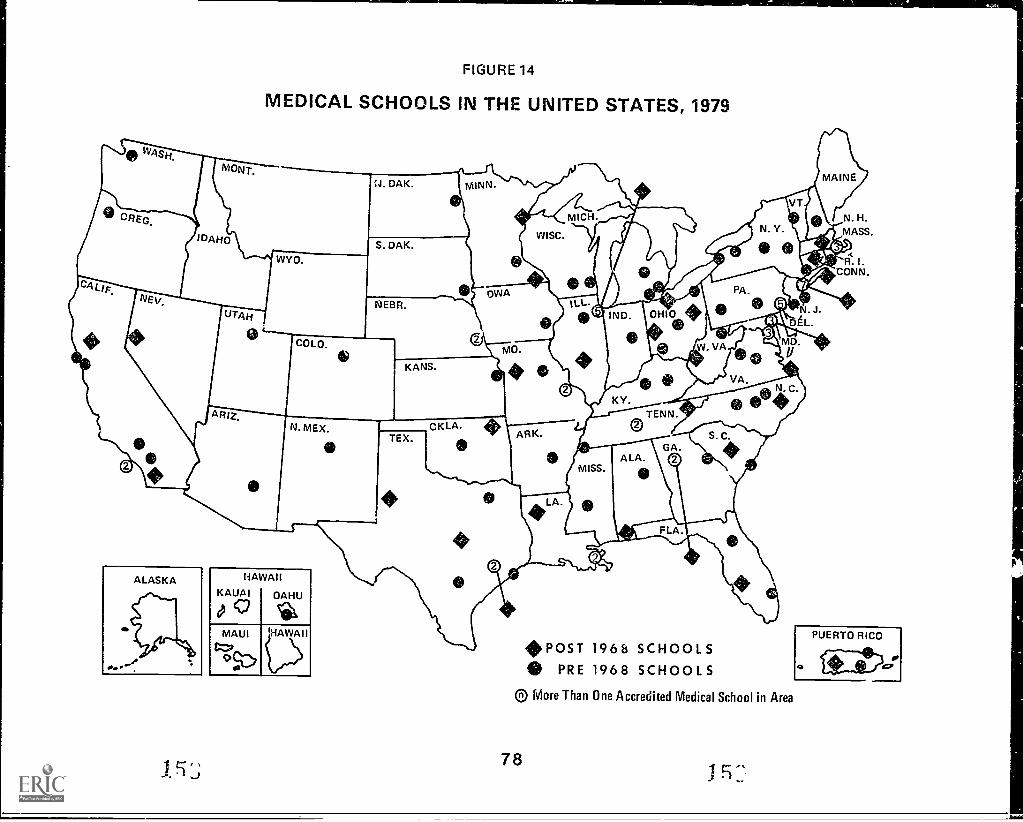
FIGURE 14
MEDICAL SCHOOLS IN THE UNITED STATES, 1979
HAWAII
KAUAI
e c'OAHU
Cal
*POST 1968 SCHOOLS0 PRE 1968 SCHOOLS
® More Than One Accredited Medical School in Area
1J
PUERTO RICO
or0 4:tics
Accession of New Hires in New and
Established Schools
The pattern of recruitment of faculty members
new to academe by new medical schools is examined
in Table 29. For , h year, the schools are seg-
regated by age, so that the number of newly re-
cruited faculty is shown separately for schools
new in 1968-69, schools one year old in 1968-e),
etc.
One might think that new schools would be the
principal places where new medical school faculty
begin their academic careers, but this is not the
case. In 1968-69, when the average school employed
20 faculty members new to medical education, the
average new school employed 17 faculty members new
to medical education. By 1976, new people averaged
29 per school at all schools, but 22 per school at
new schools. Presumably, the new schools were
also hiring senior faculty away from the established
schools, and they may have been responsible in-
10) - 79 -
directly for some of the new people at those es-
tblished schools.
New Hire Faculty and School Maturation
Another interesting question concerns the
evolution of recruitment of new faculty with the
age of the school. Table 29 allows the examination
cf this question, also. There is one unusual number
in the table, for schools 1 year old in 1973-74,
;Men the figures appear unusually high. This is
the result of the formal organization of the Mayo
Medical School in that year. Since large numbers
of Mayo physicians were given faculty appointments
in a single year, there was an unusually large
number of faculty new to medical education. This
situation is so atypical that it should be disre-
garded in efforts to generalize from data in the
table.
When the figures affected by the Mayo situation
are excluded, one observes a steady incease in the
number of new faculty per school with age of the
school in the first seven years, followed by a
decline. Since the numbers are small, one shc.ld
not attempt too fine an interpretation, but it
appears that the accession of new academic physi-
cians and biomedical scientists is a steady process.
Research Training of New Hire Faculty
Table 30 and Figure 15 provide the percent
of new hire faculty with research training at
public and private schools. Until 1977 a greater
percent of faculty with prior research training
was at private schools.
Regional Distribution of New Hire Faculty
In order to assess thc regional distribution
of hire of new faculty, Table 31 displays regional
locations of the m :hcal schools and the number of
M.D. and M.D./Ph.D. faculty who received their
M.D. degree in a region and their faculty appoint-
ment in the same region and those who received
their M.D. degree in a region but accepted their
first appointment outside the region Il 1968
- 80 -
the percent of faculty who met the first criterion
was 58.0 percent and this fraction remained fairly
steady until 1977 and 1978 when it decreased to
56.5 percent and 54.0 percent respectively.
In recent years, more academi.ally oriented
physicians who received their degrees in the North-
east have been leaving the reg.on to accept their
first faculty appointment, while grad "ates of
Southern Schools are staying in the region more than
ever. In the West and Midwest, the fraction re-
maining within the region continues to be around
50 percent.
A new faculty appointment for a person with
a U.S. degree indicates that the individual has not
held a previous faculty appointment; however,
foreign faculty with foreign degrees who may have
held a previous appointment at a non-U.S. medical
school are considered to be "new Hire" faculty on
the date of their first U.S. meaical school appoint-
ment. The distribution by reg'on of appointment for
M.D. and M.D./Ph.D. faculty with a U.S. and a
non-U.S. degree for six selected years, 1968, 1970,
1972, 1974, 1976, and 178 is shown on Table 31.
The total number of foreign M.D., M.D./Ph.D. new
hires has been increasing from 436 in 1968 to
841 in 1977. However, a substantial decrease is
noted for these faculty in 1978.
Within regions, the Southern and Western
areas have been hiring greater fractions of
foreign-trained faculty; the Southern region in-
creased from 16.3 percent of those with foreign
degrees in 1968 to 32.4 per:ent in 1978 and the
Western region increased from 12.8 percent of
those with foreign degrees in 1968 to 16.8 percent
in 1978.
Retention of New Hire Faculty
Table 37 displays the percent of total full-
time new hire faculty by year of their first ap-
pointment and their retention at any medical school
from one to ten years after hire.
- 81
It is interesting to note that faculty leaving
the salaried full-time status at any U.S. medical
school is increasing alony with the fact that
less new hire faculty are being appointed.
The figures for 1968 through 197L are suspect
as the Faculty Roster underwent a purge in 1977 of
incomplete records received prior to 1973. There
were approximately 5000 records deleted. There-
fore the rate of retention of faculty is exaggerated
in the early years. However, from 1973 to 1978 it
is readily apparent that faculty are departing
from the medical schools at a more rapid rate i.
the more current years.
Table 35 and Table 36 display tae retention
rate of the new hire faculty by gender
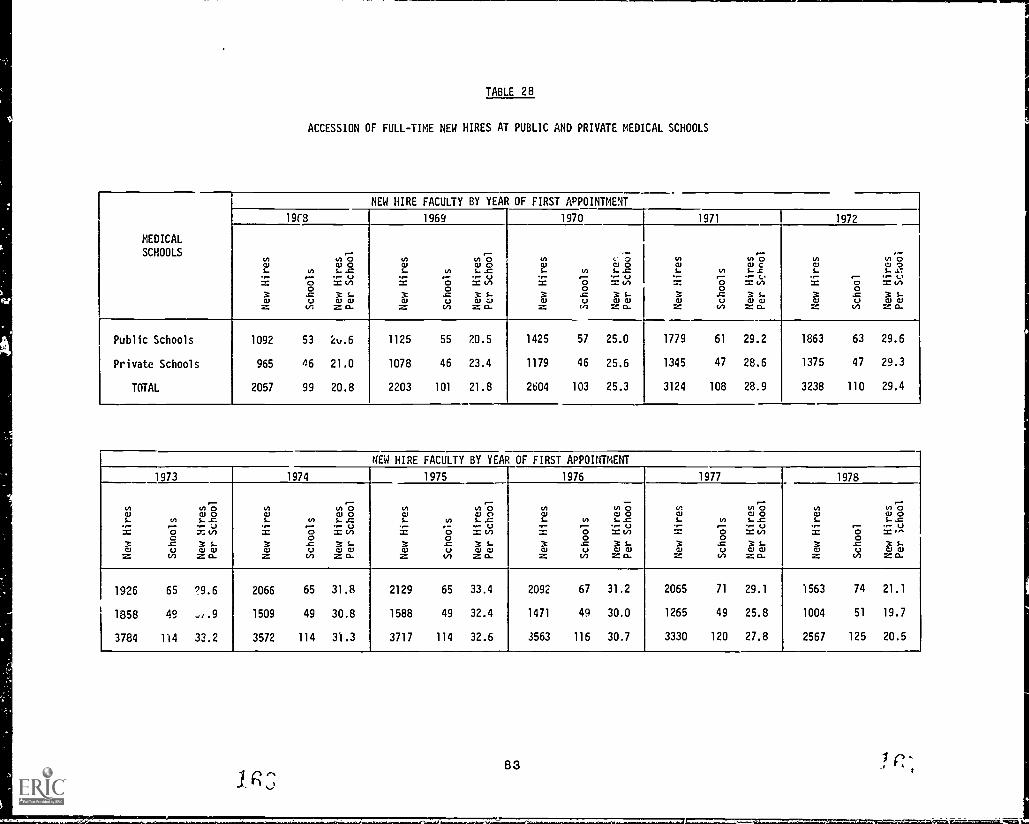
TABLE 28
ACCESSION OF FULL-TIME NEW HIRES AT PUBLIC AND PRIVATE MEDICAL SCHOOLS
MEDICAL
SCHOOLS
NEW HIRE FACULTY BY YEAR OF FIRST APPOINTMENT
191-8 1969 1970 1 1971 1972
.0i
...,=oZ
tri
O0..c4.,V:
.00 0S- ..0
=Ns_asZ Q.
.0iI-
0=
Vi
00...4.)VI
07)0 0S. ..0
(5",
s_0 :&)Z 0-
.0i=,6
Z
Vi
00
..c4.)(z)
, O0 0S. ..0
= v)s_asZ 0-
.0i..-.7.:
0Z
In
-;0..cC.)4./)
tnO0 CS- -C
I" :,.;s_asZ 0-
.0iI"6Z
-c;0..cLIVI
-. 0W 0S- ..t.:
I" (5;s-asZ C..
Public Schools
Private Schools
TOTAL
1092
965
2057
53
46
99
2u.6
21.0
20.8
1125
1078
2203
55
46
101
20.5
23.4
21.8
1425
1179
2604
57
46
103
25.0
25.6
25.3
1779
1345
3124
61
47
108
29.2
28.6
28.9
1863
1375
3238
63
47
110
29.6
29.3
29.4
NEW HIRE FACULTY BY YEAR OF FIRST APPOINTMENT
1973 1974 1975 1976 1977 1978
.EU,.=
30=
0:ac,
VI
0;0S. ..
U7-.. v)
,...0 0Z 0-
'an)
,...
I"0=
0-0-0...C)VI
0O0 0s....c
1" (51,
s_0 0Z D-
'an)
,....,=0=
000.C)
V)
GI) 0,......= v)
s_0 0Z 0-
.a
=6Z
U
00..c4)
VI
. 00 0s....c
= v),...0 0Z 0-
.0,...
.,.
2
0.0
...4)4./)
0O0 05....c
= v)s_0 0Z 0-
Ua
=6Z
00
..c4)
VI
00.
0
0 05......
= ,s-0 0Z 0_
1926
1858
3784
65
49
114
?9.6
,,.9
33.2
2066
1509
3572
65
49
114
31.8
30.8
31.3
2129
1588
3717
65
49
114
33.4
32.4
32.6
2092
1471
3563
67
49
116
31.2
30.0
30.7
2065
1265
3330
71
49
120
29.1
25.8
27.8
1563
1004
2567
74
51
125
21.1
19.7
20.5
83
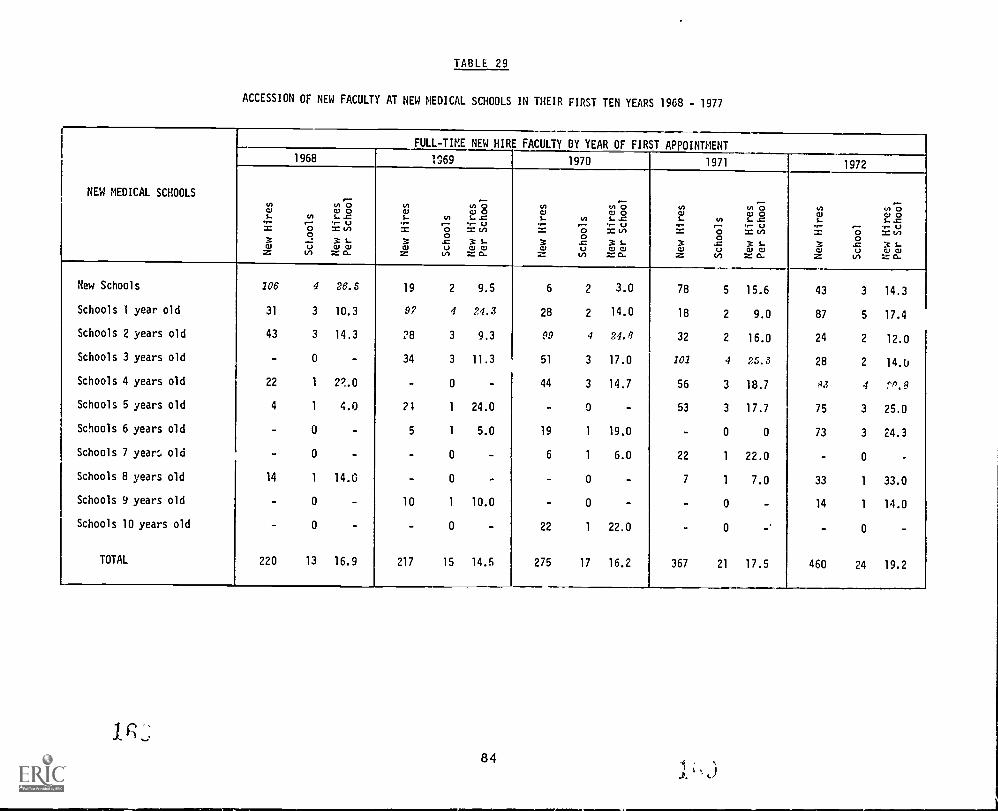
TABLE 29
ACCESSION OF NEW FACULTY AT NEW MEDICAL SCHOOLS IN THEIR FIRST TEN YEARS 1968 - 1977
FULL-TIME NEW HIRE FACULTY BY YEAR OF FIRST APPOINTMENT
NEW MEDICAL SCHOOLS
1968 1069 1970 1971
IAW1..
X
WX
1/1
00Uin
N 0W 0S. ..0
...- C.)X 1.1)
3 1...0) 0)Z O.
IAW1..
X
CUX
1/1
00.0V
V)
N 0W 0S. .0
X 1.1)
Sal alZ O.
IAW1..or
CUz.
IA
00.0LItr,
N 0W 0S.. .0
r- C.)= Ill1...w wz o-
IAW1..
WX
IA
00.0LIV)
N 0W 0S. ..0or- C..1X 1.1)
g S.CU CU= O.
New Schools 106 4 26.5 19 2 9.5 6 2 3.0 78 5 15.6
Schools 1 year old 31 3 10.3 97 4 24.3 28 2 14.0 18 2 9.0
Schools 2 years old 43 3 14.3 28 3 9.3 09 4 24.6 32 2 16.0
Schools 3 years old 0 34 3 11.3 51 3 17.0 101 4 25.3
Schools 4 years old 22 1 2'.O 0 44 3 14.7 56 3 18.7
Schools 5 years old 4 1 4.0 24 1 24.0 0 53 3 17.7
Schools 6 years old 0 5 1 5.0 19 1 19.0 0 0
Schools 7 years old 0 0 6 1 6.0 22 1 22.0
Schools 8 years old 14 1 14.0 0 0 7 1 7.0
Schools 9 years old 0 10 1 10.0 0 0
Schools 10 years old 0 0 22 1 22.0 0
TOTAL 220 13 16.9 217 15 14.5 275 17 16.2 367 21 17.5
1972
0 0 0W1...
C., 0S... .0
0 = V)0.0 Xa, 1.., CJ CL)= V) = O.
84
43 3 14.3
87 5 17.4
24 2 12.0
28 2 14.0
63 4 '1).6
75 3 25.0
73 3 24.3
0
33 1 33.0
14 1 14.0
0
460 24 19.2
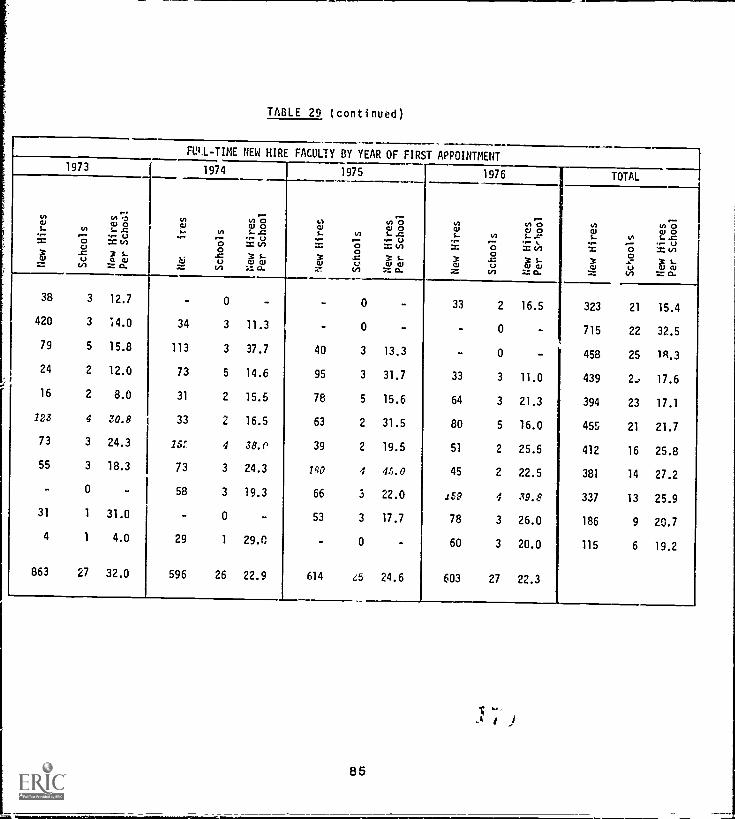
Alb.
TABLE 29 (continued)
FU L-TIME NEW HIRE FACULTY BY YEAR OF FIRST APPOINTMENT1973 1974 1975 1976 TOTAL
0wL
6-
in
G0..0en
0Gw oS.. =
..(`,4
3 LCt. hiz O.
reI.
Cl=
In
00.0Uin
0-0-as oL .0S VI
S.w w...= Cl.
2S..
=
5'4
IA
00
.0CY)
0';w oS. == VI3 %.-
5'4 ti
inwS..
=cT1Z
IA
00tl:Cn
to oo oL ..V.
= tn
t..1: G.
inwS..
"2
hiZ
in
"O0.-U
VI
in CIal 0S. =1-,Y)
S.W Ai
1.-- O.
38
420
79
24
16
123
73
55
-
31
4
863
3
3
5
2
2
4
3
3
0
1
1
27
12.7
'o1.0
15.8
12.0
8.0
30.8
24.3
18.3
-
31.0
4.0
32.0
-
34
113
73
31
33
15f
73
58
-
29
596
0
3
3
5
2
2
4
3
3
0
1
26
-
11.3
37.7
14.6
15.5
16.5
38.0
24.3
19.3
-
29.0
22.9
-
40
95
78
63
39
180
66
53
-
614
0
0
3
3
5
2
2
4
3
3
0
45
-
-
13.3
31.7
15.6
31.5
19.5
46.0
22.0
17.7
24.6
33
-
33
64
80
51
45
159
78
60
603
2
0
0
3
3
5
2
2
4
3
3
27
16.5
-
11.0
21.3
16.0
25.5
22.5
39.8
26.0
20.0
22.3
323
715
458
439
394
45S
412
381
337
186
115
21
22
25
2J
23
21
16
14
13
9
6
15.4
32.5
18.3
17.6
17.1
21.7
25.8
27.2
25.9
20.7
19.2
85
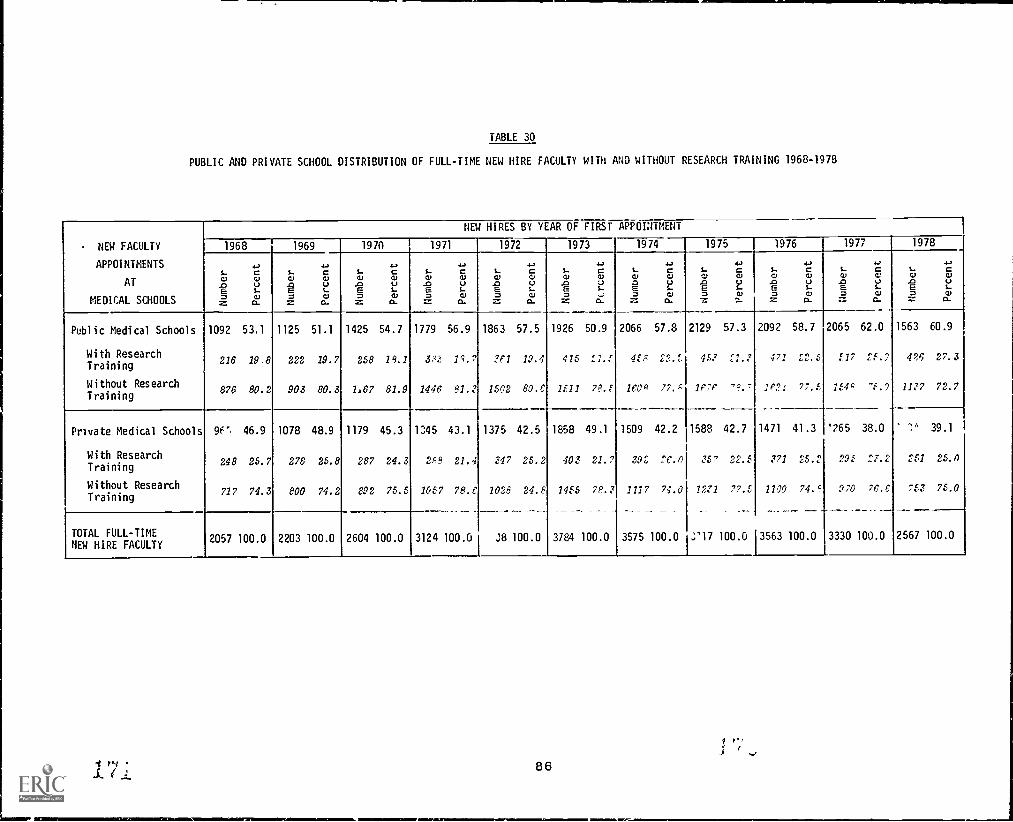
TABLE 30
PUBLIC AND PRIVATE SCHOOL DISTRIBUTION OF FULL-TIME NEW HIRE FACULTY WITH AND WITHOUT RESEARCH TRAINING 1968-1978
NEW FACULTY
APPOINTMENTS
AT
MEDICAL SCHOOLS
NEW HIRES BY YEAR OF FIRST APPOINTMENT
1968 1969 1970 1971 1972 1973 1974 1975 1976 1977 1978
s_
CJ.7EzZ
4.,
cC)C../
L.0,O.
s_
CU.7E7Z
4.,
cOJV%..GI
CL
s-
CL)
.7E7Z
4.,
cCUC../
S-CJO.
s-
CL)
XIE7
:11'.'
4.,
cCVC../
S-OJ
O.
s-CV
.7E7=
4.,
cCJVS-0,
O.
s-CU.C1E7Z
4.,
cCVJS-k..:
s-0,7E77,'.
.0cCUC../
S-CJO.
s-0.).C1E77.
4.,
cCJC../
S-0,
CL
s_
C).C1E7
7..."
4.,
cCUC../
S-0.)
O.
s_
CV.C1E7=
4.,
C0,0S.CV
C.-
L.C)
-7E7=
4.,
CC.)Vs-CV
O.
Public Medical Schools
With ResearchTraining
Without ResearchTraining
1092
216
876
53.1
19,8
80.2
1125
222
903
51.1
19.7
80.3
1425
258
1,67
54.7
19.1
81.9
1779
30.-',
1446
56.9
1 q.7
91.0
1863
361
1502
57.5
10.4
80.0
1926
415
1511
50.9
21.5
78.5
2066
45R
leOP
57.8
22.2
77.E
2129
.4.7
1e7r
57.3
fl.?
'
2092
471
1r21
1471
371
1100
3563
58.7
22.5
77..
2065
517
164
'265
295
970
3330
62.0
1:..?
"5.9
1563
46
1177
60.9
27.3
72.7
Private Medical Schools
With ResearchTraining
Without ResearchTraining
96c,
248
717
46.9
25.7
74.3
1078
278
800
48.9
25.8
74.2
1179
287
892
45.3
24.3
75.5
1345
2A8
1057
43.1
21.4
78.6
1375
347
1028
38
42.5
25.2
24.8
100.0
1858
400
1455
3784
49.1
21.7
78.$
100.0
1509
392
1117
3575
42.2
26.0
74.0
100.0
1588
057
1271
.-,-17
42.7
22.5
77.6
100.0
41.3
25.2
74.
100.0
38.0
f7.2
76.6
100.0
_Y
251
753
2567
39.1
25.0
75.0
100.0TOTAL FULL-TIMENEW HIRE FACULTY
2057 100.0 2203 100.0 2604 100.0 3124 100.0
171 86
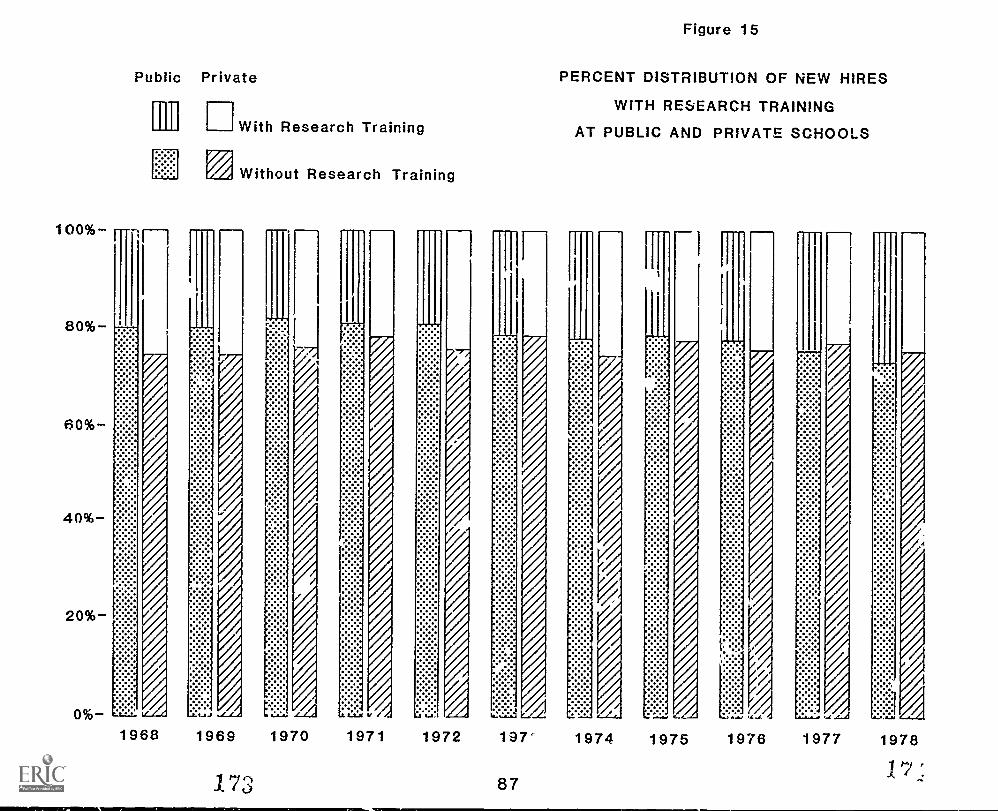
0r.a.
1 " : : : : : : : : : .:77:7; : : : : : : : .
.:
\\\\\%=,
L
r0)
. ""77777777777-.7=7.7"...77-"7:="77-. CD
.
-'''"":'":7:77:777:777: : : : : : : : : : :. : : : : :
"":":%":": :"': "*%"" : : *****`*':
IDN.0)
N.0)
CD: : : : : : : : : : : : : : : : : : : : : : : : : : : : : : : : : : : : : : : : : : : : : : :
..11,1,,,,WYRITYTIFT.Tr.,,,,,r,"rn
0)
coCOrn
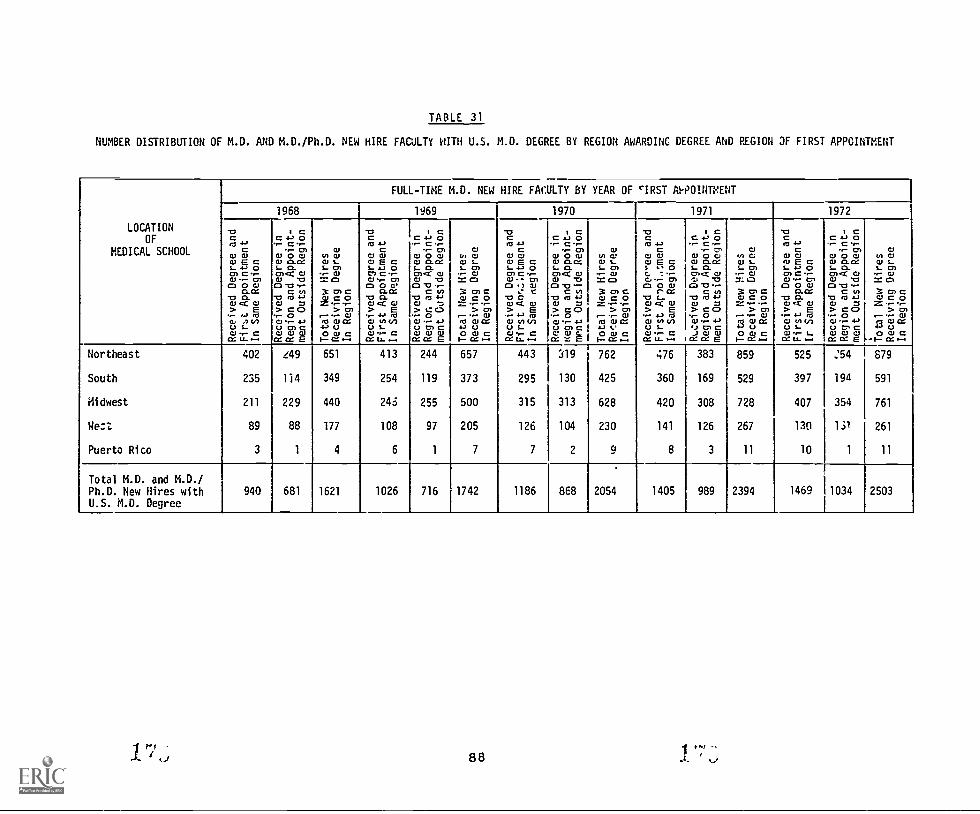
TABLE 31
NUMBER DISTRIBUTION OF M.D. AND M.D./Ph.D. NEW HIRE FACULTY WITH U.S. M.D. DEGREE BY REGION AWARDING DEGREE AND REGION 3F FIRST APPOINTMENT
LOCATIONOF
MED I CA L SCHOOL
FULL-TIME M.D. NEW HIRE FACULTY BY YEAR OF rIRST APPOINTMENT
1968 1969 1970 1971 1972
tsC,J 4-,c
CLI 0
112 5 501 C eal .... Cr)0 0 CI
C. CC-c, Cla, cc a,> E
-.-- 4-, CICLI I, V)I.) S-0 ..-. C
CC LI. .-4
I CC 4-) 0- C-
,-0 0 01! El-.=0)¢ alal 11CI II .-
C Inms Rs 0CI 7> CO- 0al ..- 4-,u vs cOJ OJ aJ
CC CC E
Il) 0cs'2 1,,
al= 001 C
as C cs= . .-> Cr .I-- al
CI 0 CC.0 u0 a1I- = .-4
IICR3 1-,c
CU CUal E CS- 1-, 0C) C .--al ... - 01CI 0 a.
0-CC-a cs.a, .c al> E.I. 1-, R30 V) V2
C..) S-0 ,- CCC LL. .-4
I CC 4.-, 0... C .-
..-0 0 0al 0-CC5- 0-01.4C alal 11CI "C1 .--
C 0-c, m 0al .=> C Q- 00 .- 4-)L.) CI Cal al OJCC CC E
co 00 S-S- 01
.." 0.)T 0..= 0,C0 C 0
,_ .1..> crl
... ..-, CLI
1.0 al CC1-, C.)0 CI CC ...
IICR3 4-,
CU C.)CC.)CUECS- 4- 001 C ,-al -- 01
CI . 3 alt.7 'CII C
IV cf. a)> E., 1-, laal V) V)C..) S-CI 4-- CCC i.L. .4
I CC 1.., 0..-. C -
a,wow (11CJ 0-CCS- 0-0)d W0 t)CI II "-C 0-CI ICI 4-,al => CO.I. 0al - 1-,C..) 01 C
CC = E
asVI 00S-S- 01-,-, C= C3
01c.11 C 0= .-- ...> 01. - 01.0 al C1-, V0 0 C1-. CC .-.
IICR3 4-,
ac)al al0 E C$ , 0C. '1 ..--C. ..- CI0 0 0
r. ccII L.C.) ct 0> E
- 4-, COal La U)C..) S-0 ..- C
CC I.1- I--
I CCEO..- C ,-CM
.21 0 CIal 0-CCS- ClON CC C)0 V)0 V .-
C m-0 0 4-,C) 7> COe 0al .- 1-,,..) CI CJ al OJ
CC cc
0*/) 11).
C.1 S-S- 0).e al
U.: 0Doc
al C 0= 4.- ,-> ICI- ..- 0
R3 0 CC1-, I../0 0 C
.-4
IIcR3 4-,c
CU CU4.I E CS- ...) 0D C .-.al .- C")CI 0 0
cl.ccII C.0 ,Z a,> E..-. 1-, R3O VI V)u s-0 , LCC
I CC 4-, 0.-. C ',-
..-wowWO.=S- 0.MCC C.)al 11CI II ,C m
10 0 4-,a, => CO.e 0a) - 4-,u e, c0 C.) 0 i
E
0NO)CIS-S- 01..- al= 03 cscC) C 0= . .> m- - (1.1ro al CL4-, u0 0 C
Northeast
South
Midwest
Wen:
Puerto Rico
402
235
211
89
3
z49
114
229
88
1
651
349
440
177
4
413
254
246
108
6
244
119
255
97
1
657
373
500
205
7
443
295
315
126
7
319
130
313
104
2
762
425
628
230
9
476
360
420
141
8
383
169
308
126
3
859
529
728
267
11
525
397
407
130
10
:54
194
354
131
1
879
591
761
261
11
Total M.D. and M.D./Ph.D. New Hires withU.S. M.D. Degree
940 681 1621 1026 716 1742 1186 868 2054 1405 989 2394 1469 1034 2503
1 P./ k:of 88
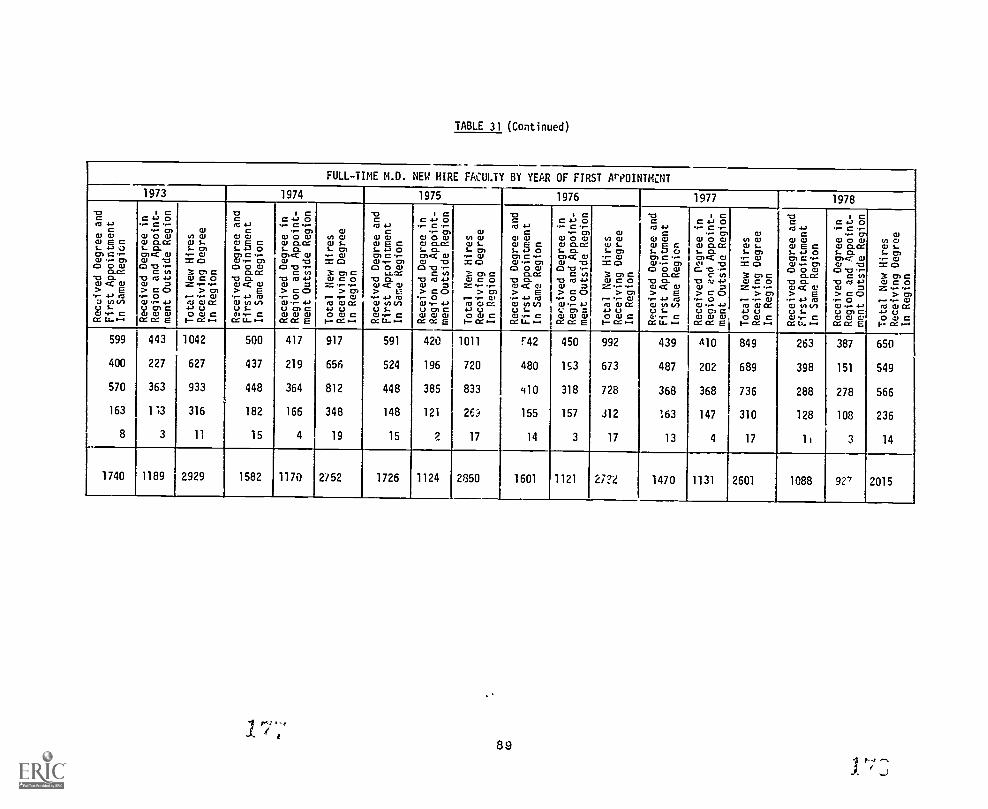
, .c. o
cog;
cr, 8
.p. 8
cr,
to
Received Degree and
First Appointment
In Same Region
..,.
`'I
-n = I--
1 I .... z m = z 2 = ;:;*
m -n D.
,--, c co -c m IT,
v° ,, vo. VI I 1. -c.'0 o .. :71 = re I
-' oo to(.
..)--
.C
U'e
n'(.
..)2
-I (...)
Received Degree in
Region and Appoint-
ment Outside Region
toto .. to:::
CO 01
to LI01 ".
21
7:5 It
Total New Hires
Receiving Degree
In Region
4.7, oo ...
47;
....
oo IV.c
.4t
.00
4t.
(...) ...I
cr, a 0
Received Degree and
First Appointment
In Same Region
--
1,-;
-.., o
4o.
(.S
a%a%
ol.
.o.
r. tO4o
. IReceived Degree in
Region and Appoint-
ment Outside Region
...
....,
cn ". to
co 4:.
coco -- "
a% cn 71to
Total New Hires
-- .--J
Receiving Degree
In Region
Region
-.., ... al
(.7.
7: 00it,
.00
tg;
-gt.
Received Degree and
Fr;
First Appointment
In
Sam
eRegion
zi-,
'
z-/
. " .c.
cv"
L.)
CrI
-- 'C'
ala
Received Degree in
Region and Appoint-
0ment Outside Region
... .x)
cn 0. ..*
4
r, ON
''' '
00 (A)
L'''
--,
IV C.
c)Total New Hires
. -.Receiving Degree
In Region
cy, o
__ -°.
u--; c°
-° c)--
-&:', c,
Received Degree and
-42
First Appointment
r,In Same Region
zi;
-c-,
',...
.L.
)
..._.
Cr' I
(A,
CO
CO
..._. I (.4
4,Received Degree in
Cr'
Region and Appoint-
asment Outside Region
IN.1 , ,...)
°- ".*
4 r C°
a% I (A)
U3
Total New Hires
ti3 "Receiving Degree
In Region
0L'
''..
.01 L'
''
L''' al C°
-It'
OD
..*4
Received Degree and
4'.
First Appointment
(...) U3
In Same Region
z'ol
(...)
-°'
L.,
mr. °
lo.
Received Degree in
Region
a nd Appoint-
ment Outside Region
... cy, O
. ,'-' a.
--'
L.)
cr%
m co to°°
Total New Hires
-gt
toReceiving Degree
In Region
oo oor7
;°°
,T,
c°t2
, °°
Received Degree and
f,r,
First Appointment
(-'
In Same Region
ter)
.
00'
ko -,1
,..3
coC
,,, .*4
.0,Received Degree in
F.A
.3Region and Appoint-
ment Outside Re.ion
IV 0 cr,
.c.
(T.)
cr%
tg a%yt
., tozg
Tot
alNew Hires
*=Receiving Degree
In Region
0 0 Ct.
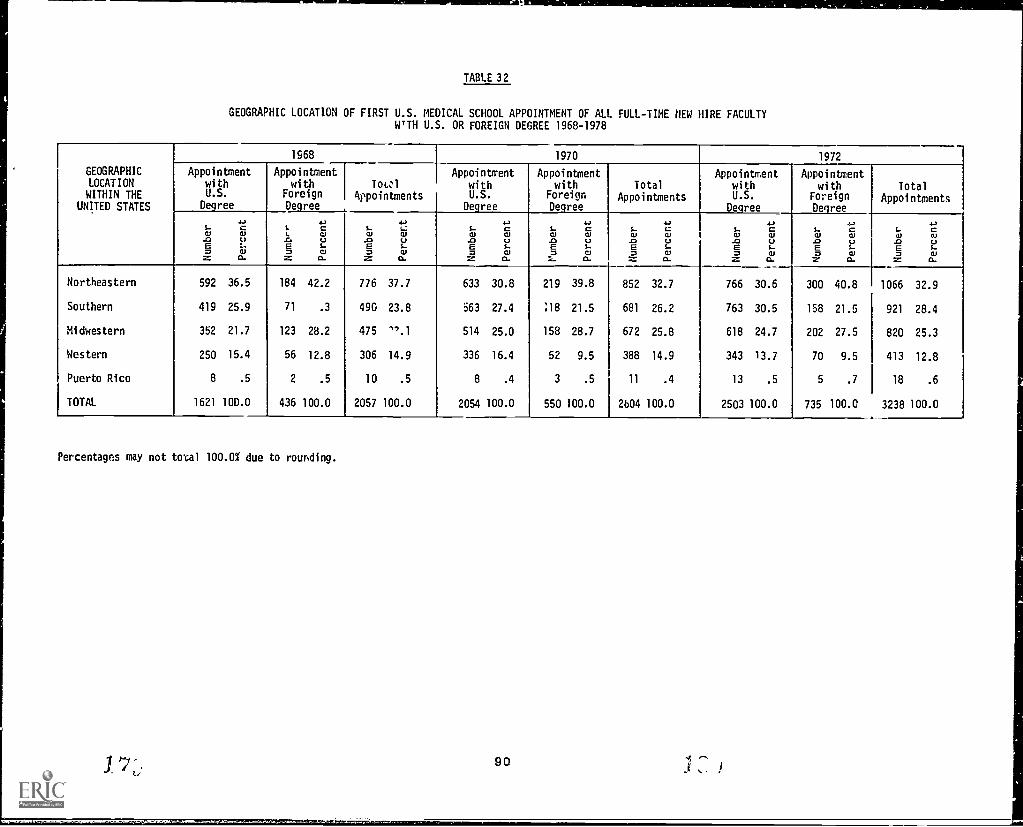
TABLE 32
GEOGRAPHIC LOCATION OF FIRST U.S. MEDICAL SCHOOL APPOINTMENT OF ALL FULL-TIME NEW HIRE FACULTYWTTH U.S. OR FOREIGN DEGREE 1968-1978
GEOGRAPHICLOCATIONWITHIN THE
UNITED STATES
1968 1970 1972
AppointmentwithU.S.
Degree
Appointmentwith
ForeignDegree
I TotalAppointments
Appointment
withU.S.
Degree
Appointmentwith
ForeignDegree
TotalAppointments
S. Cal al.0 UE Si0 cu::.. a.
AppointmentwithU.S.
Degree
S. Cal al.0 UE Si0 a.)= a.
Appointmentwith
ForeignDegree
S. C03 al.0 UE 3-0 a.)z a.
Total
Appointments
1.. CW 0.).0 UE 3-0 a.)z a.
S.al.0E0Z
CalUI.a.)a.
t.I.
.f..E0z
CalUS-a.)
G.
Sial.0E0z
S.:.alUS-a.)a.
S.al.0E0z
CalUS-a.)a.
S.al.0E0
:.-r...
CalU3-Wa.
Northeastern
Southern
Midwestern
Western
Puerto Rico
TOTAL
592
419
352
250
8
1621
36.5
25.9
21.7
15.4
.5
10D.0
184
71
123
56
2
436
42.2
.3
28.2
12.8
.5
100.0
776
49G
475
306
10
2057
37.7
23.8
"/.1
14.9
.5
100.0
633
563
514
336
8
2054
30.8
27.4
25.0
16.4
.4
100.0
219
118
158
52
3
550
39.8
21.5
28.7
9.5
.5
100.0
852
681
672
388
11
2604
32.7
26.2
25.8
14.9
.4
100.0
766
763
618
343
13
2503
30.6
30.5
24.7
13.7
.5
100.0
300
158
202
70
5
735
40.8
21.5
27.5
9.5
.7
100.0
1066
921
820
413
18
3238
32.9
28.4
25.3
12.8
.6
100.0
Percentages may not tonal 100.0% due to rounding.
90 3 .. )
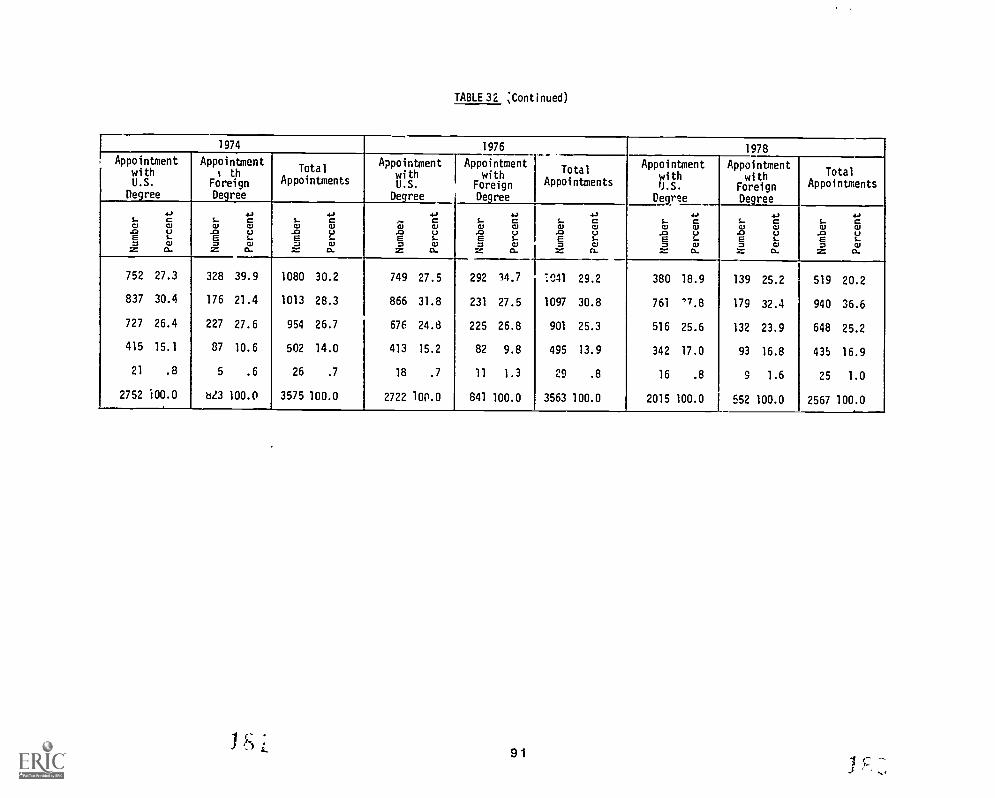
TABLE 32 ;Continued)
1974 1976 1978Appointment
withU.S.
Degree
Appointment1 th
ForeignDegree
Total
Appointments
AppointmentwithU.S.
Degree
,._ c01 01.0 UE s-7 01= 0.
Appointmentwith
ForeignDegree
S.- C01 01.0 UE s-7 01Z 0.
Total
Appointments
S.- C01 01.0 UE s-7 01Z CI.
AppointmentwithU.S.Degree
S.- C01 01.0 UE s-7 01Z 0.
Appointmentwith
ForeignDecree
TotalAppointments
S.- C01 01.0 UE s-= cuZ a.
S.-01.0E=Z
C01Us-010.
S.-01.0E=.1Z
C01Us-010.
S.-(1).0E7Z
CCI)Us-010.
S.01.0E7Z
C01Us-01
O.
752
837
727
415
21
2752
27.3
30.4
26.4
15.1
.8
100.0
328 39.9
176 21.4
227 27.6
87 10.6
5 .6
u13 100.0
1080
1013
954
502
26
3575
30.2
28.3
26.7
14.0
.7
100.0
749
866
676
413
18
2722
27.5
31.8
24.8
15.2
.7
100.0
292
231
225
82
11
841
34.7
27.5
26.8
9.8
1.3
100.0
041
1097
901
495
29
3563
29.2
30.8
25.3
13.9
.8
100.0
380
761
516
342
16
2015
18.9
'7.8
25.6
17.0
.8
100.0
139
179
132
93
9
552
25.2
32.4
23.9
16.8
1.6
100.0
519
940
648
435
25
2567
20.2
36.6
25.2
16.9
1.0
100.0
91
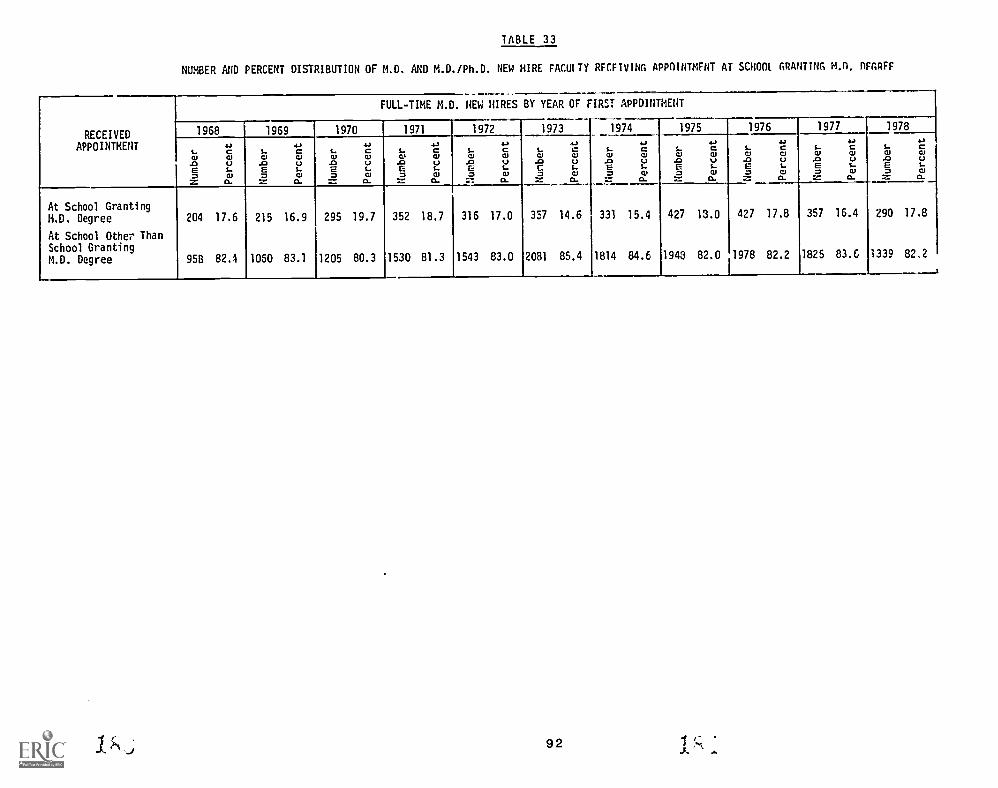
TABLE 33
NUMBER AND PERCENT DISTRIBUTION OF M.D. AND M.D./Ph.D. NEW HIRE FACUITY RFCF1V1NG APPOINTMENT AT SCHOOL GRANTING, m.n. OFGRFF
RECEIVEDAPPOINTMENT
FULL-TIME M.D. NEW HIRES BY YEAR OF FIRST APPOINTMENT
1968 1969 1970 1971 1972 1973 1974 1975
4., 4.1t 1...
0 4, g.0 u .0 uC 1.. E Lo a, = Cl
0. = 0.
1976
4.1L Cel Cil
.0 UE L= a).,- a
At School GrantingM.D. Degree
At School Other ThanSchool GrantingM.D. Degree
204 17.6
95B 82.4
215 16.9
1050 83.1
295 19.7
1205 80.3
352 18.7
1530 81.3
316 17.0
1543 83.0
357 14.6
2081 85.4
331 15.4
1814 84.6
427 13.0
1977 1978
427 17.8
1948 82.0 1978 82.2
357 16.4 290 17.8
1825 83.0 1339 82.2
I k 92
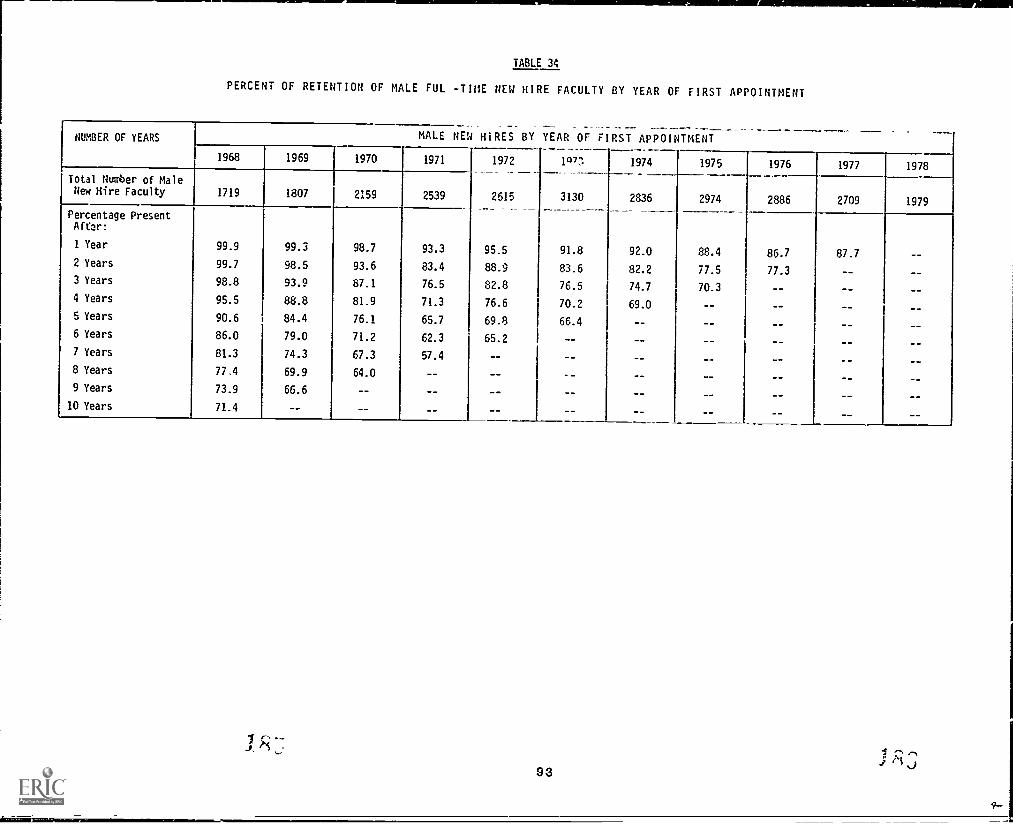
TABLE 34
PERCENT OF RETENTION OF MALE FUL -TIME NEW HIRE FACULTY BY YEAR OF FIRST APPOINTMENT
NUMBER OF YEARS
x--MALE NEW HIRES BY YEAR OF FIRST APPOINTMENT
1968 1969 1970 1971 1972
2615
I1077. 1974 1975 I
Total Number of MaleNew Hire Faculty 1719 1807 2159 2539 I 3130 2836 2974 I
Percentage PresentAft r:
1 Year 99.9 99.3 98.7 93.3 95.5 91.8 92.0 88.42 Years 99.7 98.5 93.6 83.4 88.9 83.6 82.2 77.53 Years 98.8 93.9 87.1 76.5 82.8 76.5 74.7 70.34 Years 95.5 88.8 81.9 71.3 76.6 70.2 69.05 Years 90.6 84.4 76.1 65.7 69.8 66.4
6 Years 86.0 79.0 71.2 62.3 65.2
7 Years 81.3 74.3 67.3 57.4
8 Years 77.4 69.9 64.0
9 Years 73.9 66.6
10 Years 71.4
1976 1977
2886 2709
1978
1979
86.7 87.7
77.3
IJ,
933 110
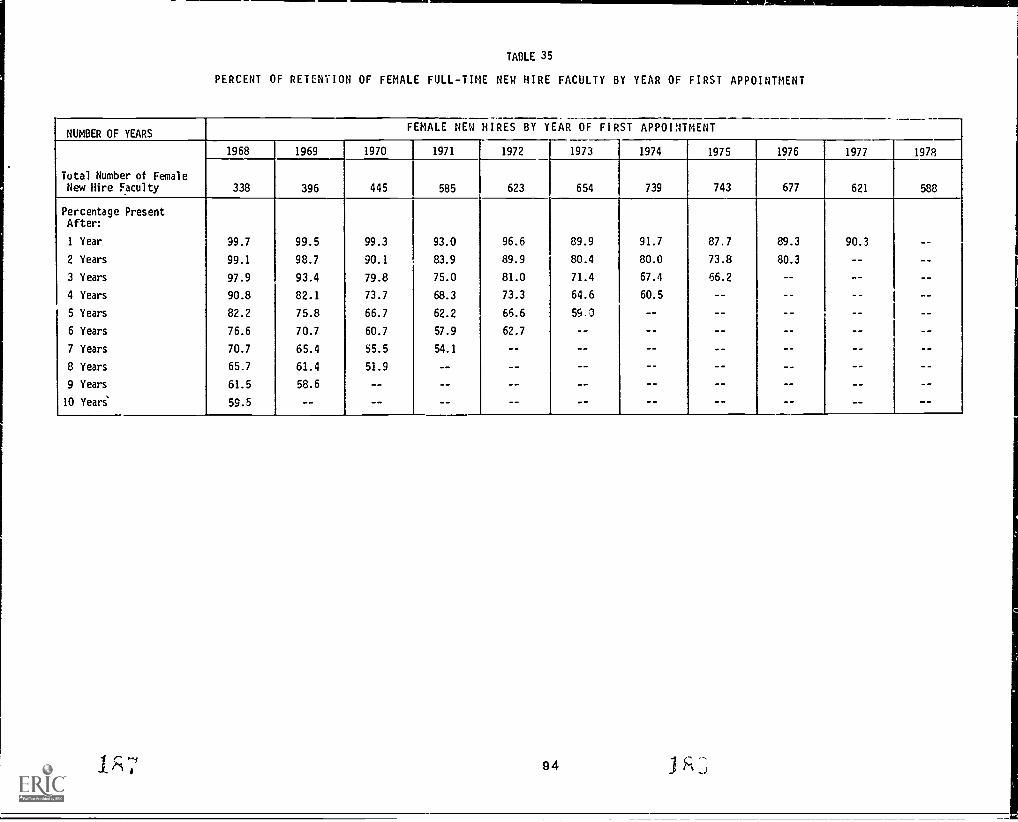
TABLE 35
PERCENT OF RETENTION OF FEMALE FULL-TIME NEW HIRE FACULTY BY YEAR OF FIRST APPOINTMENT
NUMBER OF YEARSFEMALE NEW HIRES BY YEAR OF FIRST APPOINTMENT
Total Number of FemaleNew Hire Faculty
1968 1969 1970 1971 1972 1973 1974 1975 1976 1977 1978
338 396 445 585 623 654 739 743 677 621 588
Percentage PresentAfter:
1 Year
2 Years
3 Years
4 Years
5 Years
6 Years
7 Years
8 Years
9 Years
10 Years
99.7
99.1
97.9
90.8
82.2
76.6
70.7
65.7
61.5
59.5
99.5
98.7
93.4
82.1
75.8
70.7
65.4
61.4
58.6
--
99.3
90.1
79.8
73.7
66.7
60.7
55.5
51.9
--
--
93.0
83.9
75.0
68.3
62.2
57.9
54.1
--
--
--
96.6
89.9
81.0
73.3
66.6
62.7
--
--
--
89.9
80.4
71.4
64.6
59.3
--
--
--
91.7
80.0
67.4
60.5
--
--
87.7
73.8
66.2
--
--
--
89.3
80.3
--
--
--
--
90.3
--
--
--
--
--
--
--
--
--
--
--
--
--
--
--
94
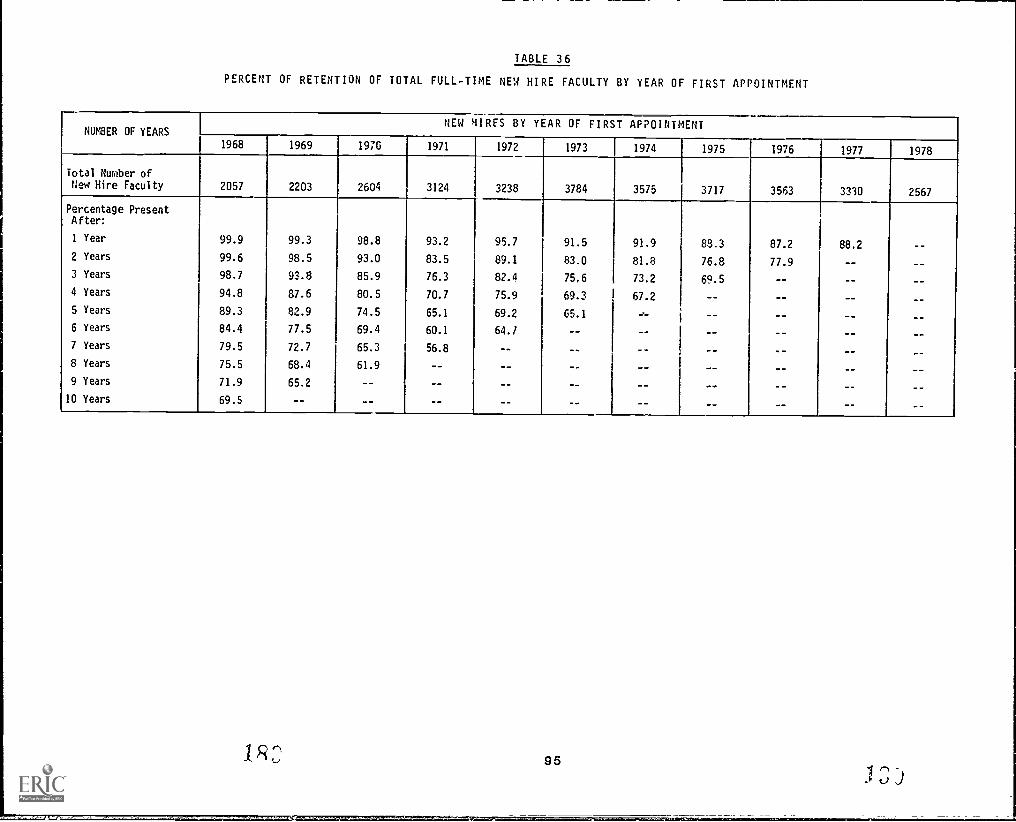
TABLE 36
PERCENT OF RETENTION OF TOTAL FULL-TIME NEW HIRE FACULTY BY YEAR OF FIRST APPOINTMENT
r NUMBER OF YEARSNEW HIRES BY YEAR OF FIRST APPOINTMENT
1968 1969 1970 1971 1972 1973 1974 1975 1976 1977 1978
Total Number ofNew Hire Faculty 2057 2203 2604 3124 3238 3784 3575 3717 3563 3330 2567
Percentage PresentAfter:
1 Year 99.9 99.3 98.8 93.2 95.7 91.5 91.9 88.3 87.2 88.2 --
2 Years 99.6 98.5 93.0 83.5 89.1 83.0 81.8 76.8 77.9 -- --3 Years 98.7 93.8 85.9 76.3 82.4 75.6 73.2 69.5 -- -- --4 Years 94.8 87.6 80.5 70.7 75.9 69.3 67.2 --
5 Years 89.3 82.9 74.5 65.1 69.2 65.1 -- -- -- -- --
6 Years 84.4 77.5 69.4 60.1 64./ -- -- -- -- -- --
7 Years 79.5 72.7 65.3 56.8 -- .... -- -- -- --
8 Years 75.5 68.4 61.9 -- -- -- -- -- -- --9 Years 71.9 65.2 -- -- -- -- --
10 Years 69.5 -- -- -- -- -- -- --
.R:; 95

APPENDICES
- 97 - 19 ',L
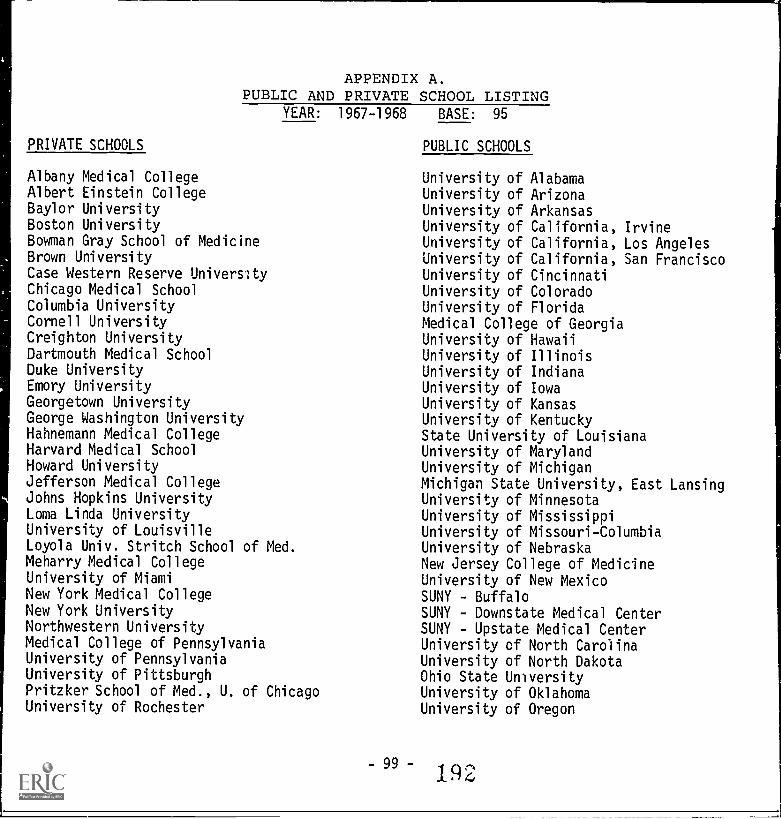
APPENDIX A.PUBLIC AND PRIVATE SCHOOL LISTING
YEAR: 1967-1968 BASE: 95
PRIVATE SCHOOLS
Albany Medical CollegeAlbert Einstein CollegeBaylor UniversityBoston UniversityBowman Gray School of MedicineBrown UniversityCase Western Reserve UniversityChicago Medical SchoolColumbia UniversityCornell UniversityCreighton UniversityDartmouth Medical SchoolDuke UniversityEmory UniversityGeorgetown UniversityGeorge Washington UniversityHahnemann Medical CollegeHarvard Medical SchoolHoward UniversityJefferson Medical CollegeJohns Hopkins UniversityLoma Linda UniversityUniversity of LouisvilleLoyola Univ. Stritch School of Med.Meharry Medical CollegeUniversity of MiamiNew York Medical CollegeNew York UniversityNorthwestern UniversityMedical College of PennsylvaniaUniversity of PennsylvaniaUniversity of PittsburghPritzker School of Med., U. of ChicagoUniversity of Rochester
PUBLIC SCHOOLS
University of AlabamaUniversity of ArizonaUniversity of ArkansasUniversity of California, IrvineUniversity of California, Los AngelesUniversity of California, San FranciscoUniversity of CincinnatiUniversity of ColoradoUniversity of FloridaMedical College of GeorgiaUniversity of HawaiiUniversity of IllinoisUniversity of IndianaUniversity of IowaUniversity of KansasUniversity of KentuckyState University of LouisianaUniversity of MarylandUniversity of MichiganMichigan State University, East LansingUniversity of MinnesotaUniversity of MississippiUniversity of Missouri-ColumbiaUniversity of NebraskaNew Jersey College of MedicineUniversity of New MexicoSUNY - BuffaloSUNY - Downstate Medical CenterSUNY - Upstate Medical CenterUniversity of North CarolinaUniversity of North DakotaOhio State UniversityUniversity of OklahomaUniversity of Oregon
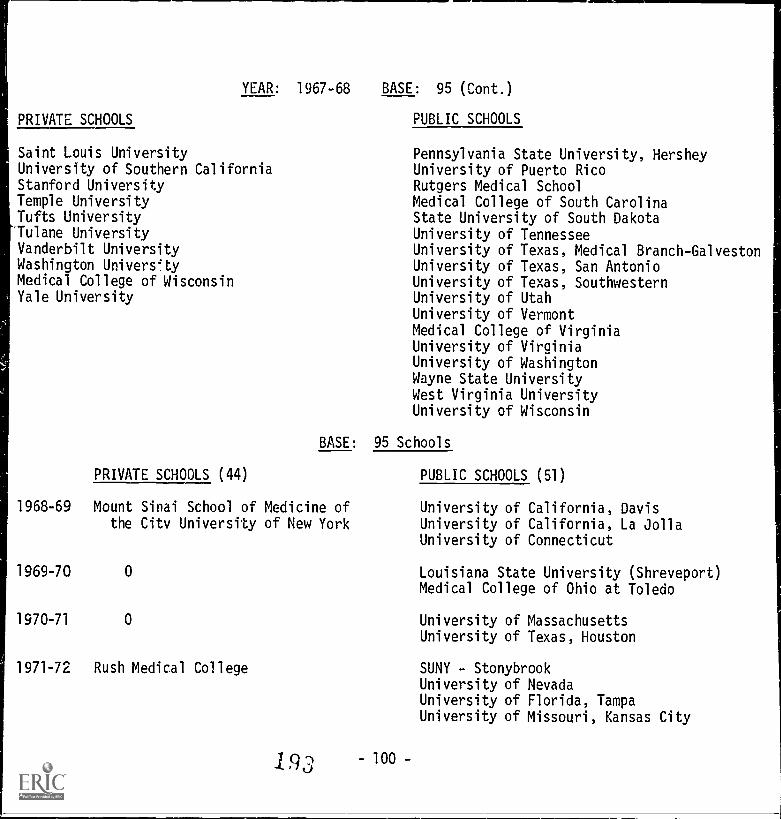
YEAR: 1967-68
PRIVATE SCHOOLS
Saint Louis UniversityUniversity of Southern CaliforniaStanford UniversityTemple UniversityTufts UniversityTulane UniversityVanderbilt UniversityWashington Univers -ty
Medical College of WisconsinYale University
BASE: 95 (Cont.)
PUBLIC SCHOOLS
Pennsylvania State University, HersheyUniversity of Puerto RicoRutgers Medical SchoolMedical College of South CarolinaState University of South DakotaUniversity of TennesseeUniversity of Texas, Medical Branch-GalvestonUniversity of Texas, San AntonioUniversity of Texas, SouthwesternUniversity of UtahUniversity of VermontMedical College of VirginiaUniversity of VirginiaUniversity of WashingtonWayne State UniversityWest Virginia UniversityUniversity of Wisconsin
BASE: 95 Schools
PRIVATE SCHOOLS (44) PUBLIC SCHOOLS (51)
1968-69 Mount Sinai School of Medicine of University of California, Davisthe City University of New York University of California, La Jolla
University of Connecticut
1969-70 0 Louisiana State University (Shreveport)Medical College of Ohio at Toledo
1970-71 0 University of MassachusettsUniversity of Texas, Houston
1971-72 Rush Medical College SUNY - StonybrookUniversity of NevadaUniversity of Florida, TampaUniversity of Missouri, Kansas City
193 -100-
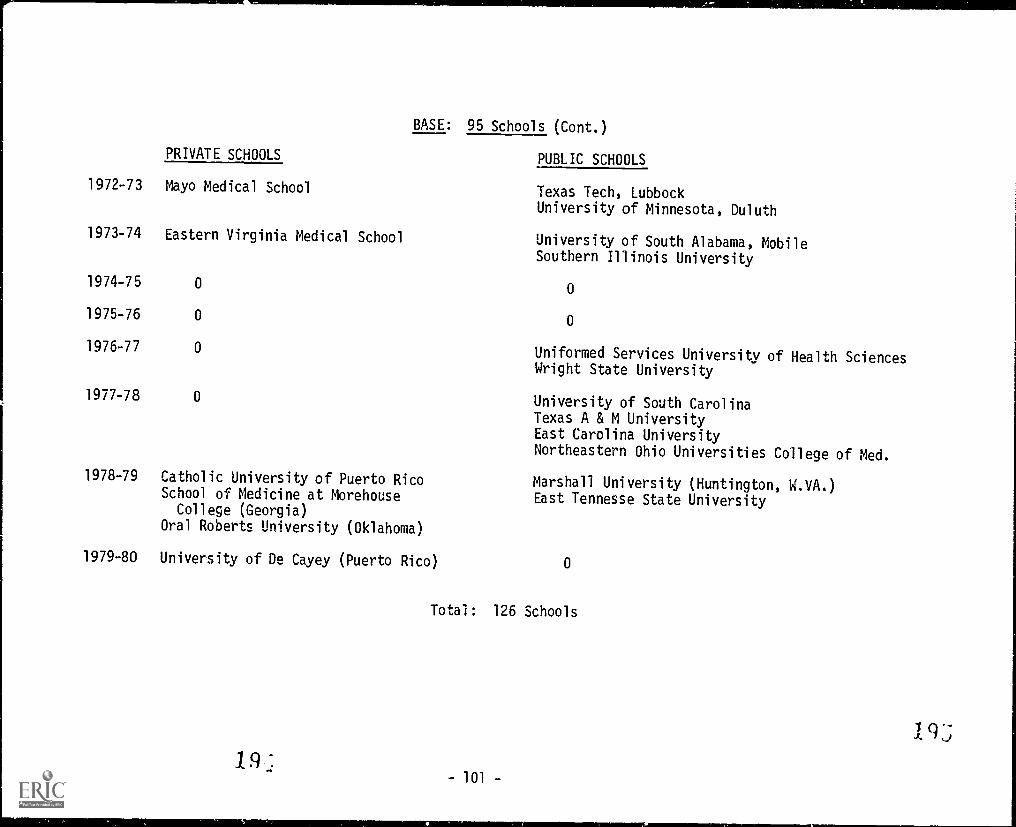
BASE: 95 Schools (Cont.)
PRIVATE SCHOOLS PUBLIC SCHOOLS
1972-73 Mayo Medical School Texas Tech, Lubbock
University of Minnesota, Duluth
1973-74 Eastern Virginia Medical School University of South Alabama, MobileSouthern Illinois University
1974-75 0 0
1975-76 0 0
1976-77 0 Uniformed Services University of Health SciencesWright State University
1977-78 0 University of South CarolinaTexas A & M UniversityEast Carolina University
Northeastern Ohio Universities College of Med.
1978-79 Catholic University of Puerto Rico Marshall University (Huntington, W.VA.)School of Medicine at Morehouse East Tennesse State UniversityCollege (Georgia)
Oral Roberts University (Oklahoma)
1979-80 University of De Cayey (Puerto Rico) 0
Total: 126 Schools
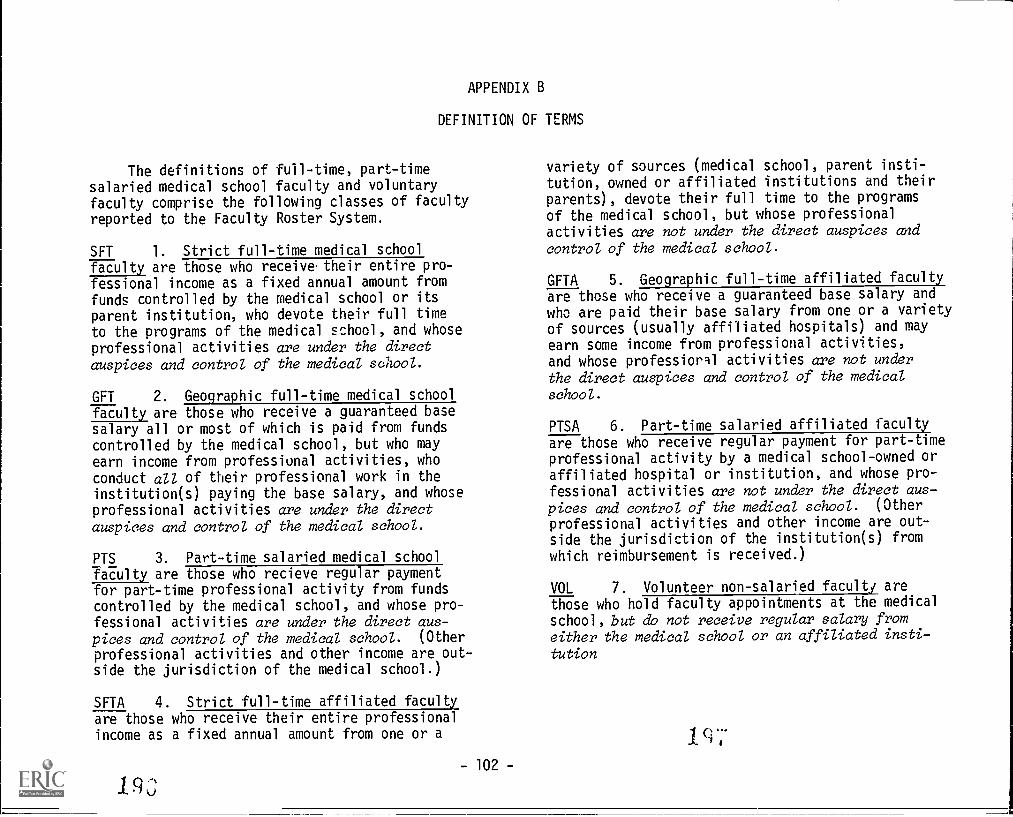
APPENDIX B
DEFINITION OF TERMS
The definitions of full-time, part-timesalaried medical school faculty and voluntaryfaculty comprise the following classes of facultyreported to the Faculty Roster System.
SFT 1. Strict full-time medical schoolfaculty are those who receive their entire pro-fessional income as a fixed annual amount fromfunds controlled by the medical school or itsparent institution, who devote their full timeto the programs of the medical school, and whoseprofessional activities are under the direct
auspices and control of the medical school.
GFT 2. Geographic full-time medical schoolfaculty are those who receive a guaranteed basesalary all or most of which is paid from fundscontrolled by the medical school, but who mayearn income from professional activities, whoconduct all of their professional work in theinstitution(s) paying the base salary, and whoseprofessional activities are under the directauspices and control of the medical school.
PTS 3. Part-time salaried medical schoolfaculty are those who recieve regular paymentfor part-time professional activity from fundscontrolled by the medical school, and whose pro-fessional activities are under the direct aus-pices and control of the medical school. (Other
professional activities and other income are out-side the jurisdiction of the medical school.)
SFTA 4. Strict full-time affiliated faculty
are those who receive their entire professionalincome as a fixed annual amount from one or a
-102-
variety of sources (medical school, parent insti-tution, owned or affiliated institutions and theirparents), devote their full time to the programs
of the medical school, but whose professionalactivities are not under the direct auspices andcontrol of the medical school.
GFTA 5. Geographic full-time affiliated faculty
are those who receive a guaranteed base salary and
who are paid their base salary from one or a varietyof sources (usually affiliated hospitals) and mayearn some income from professional activities,
and whose professiorll activities are not under
the direct auspices and control of the medical
school.
PTSA 6. Part-time salaried affiliated faculty
are those who receive regular payment for part-time
professional activity by a medical school-owned oraffiliated hospital or institution, and whose pro-fessional activities are not under the direct aus-
pices and control of the medical school. (Other
professional activities and other income are out-side the jurisdiction of the institution(s) from
which reimbursement is received.)
VOL 7. Volunteer non-salaried faculty are
those who hold faculty appointments at the medicalschool, but do not receive regular salary fromeither the medical school or an affiliated insti-
tution
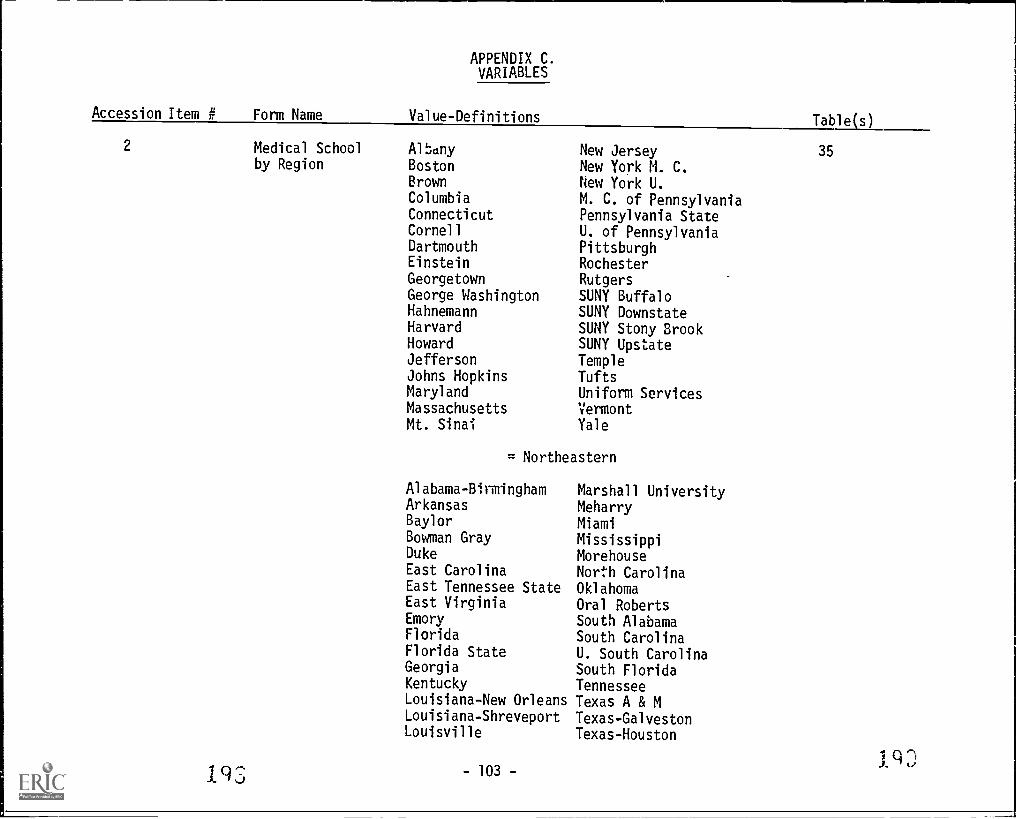
Accession Item # Form Name
APPENDIX C.VARIABLES
Value-Definitions
2 Medical Schoolby Region
AlbanyBostonBrownColumbiaConnecticutCornellDartmouthEinstein
GeorgetownGeorge WashingtonHahnemann
HarvardHowardJeffersonJohns HopkinsMarylandMassachusettsMt. Sinai
New JerseyNew York M. C.New York U.M. C. of Pennsylvania
Pennsylvania StateU. of PennsylvaniaPittsburghRochesterRutgersSUNY BuffaloSUNY DownstateSUNY Stony 3rookSUNY UpstateTempleTuftsUniform ServicesVermontYale
= Northeastern
Alabama-BirminghamArkansasBaylorBowman GrayDuke
East Carolina
East Tennessee StateEast VirginiaEmoryFlorida
Florida StateGeorgiaKentuckyLouisiana-New OrleansLouisiana-ShreveportLouisville
- 103 -
Marshall UniversityMeharryMiami
MississippiMorehouseNorth CarolinaOklahomaOral RobertsSouth AlabamaSouth CarolinaU. South CarolinaSouth FloridaTennesseeTexas A & M
Texas-GalvestonTexas-Houston
Table(s)
35
qA I.!
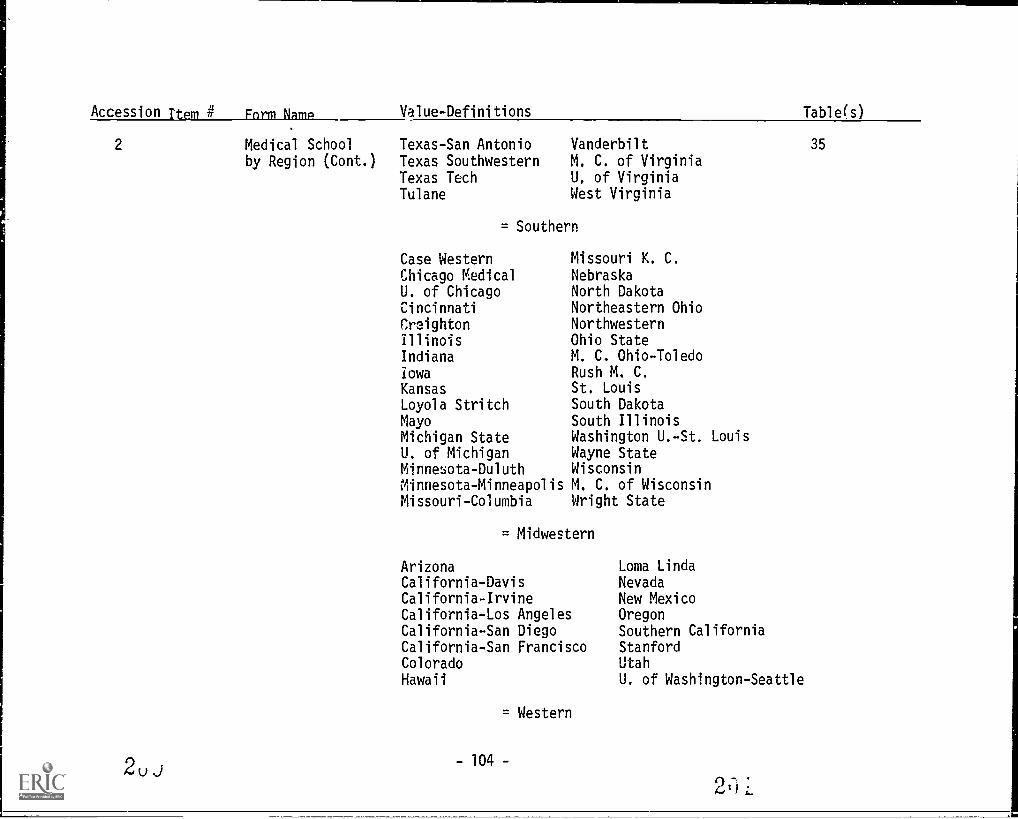
Accession Item # Form Name Value-Definitions
2 Medical Schoolby Region (Cont.)
Texas-San Antonio
Texas SouthwesternTexas TechTulane
VanderbiltM. C. of VirginiaU. of VirginiaWest Virginia
= Southern
Case WesternChicago MedicalU. of ChicagoCincinnatiCreightonIllinoisIndiana
IowaKansasLoyola StritchMayoMichigan State Washington U.-St. LouisU. of Michigan Wayne StateMinnesota- Duluth WisconsinMinnesota-Minneapolis M. C. of WisconsinMissouri-Columbia Wright State
Missouri K. C.NebraskaNorth DakotaNortheastern OhioNorthwesternOhio StateM. C. Ohio-ToledoRush M. C.St. LouisSouth DakotaSouth Illinois
= Midwestern
ArizonaCalifornia-DavisCalifornia-IrvineCalifornia-Los AngelesCalifornia-San DiegoCalifornia-San FranciscoColorado
Hawaii
= Western
-104-
Loma LindaNevadaNew MexicoOregonSouthern CaliforniaStanfordUtahU. of Washington-Seattle
0L., , 1 L
Table(s)
35
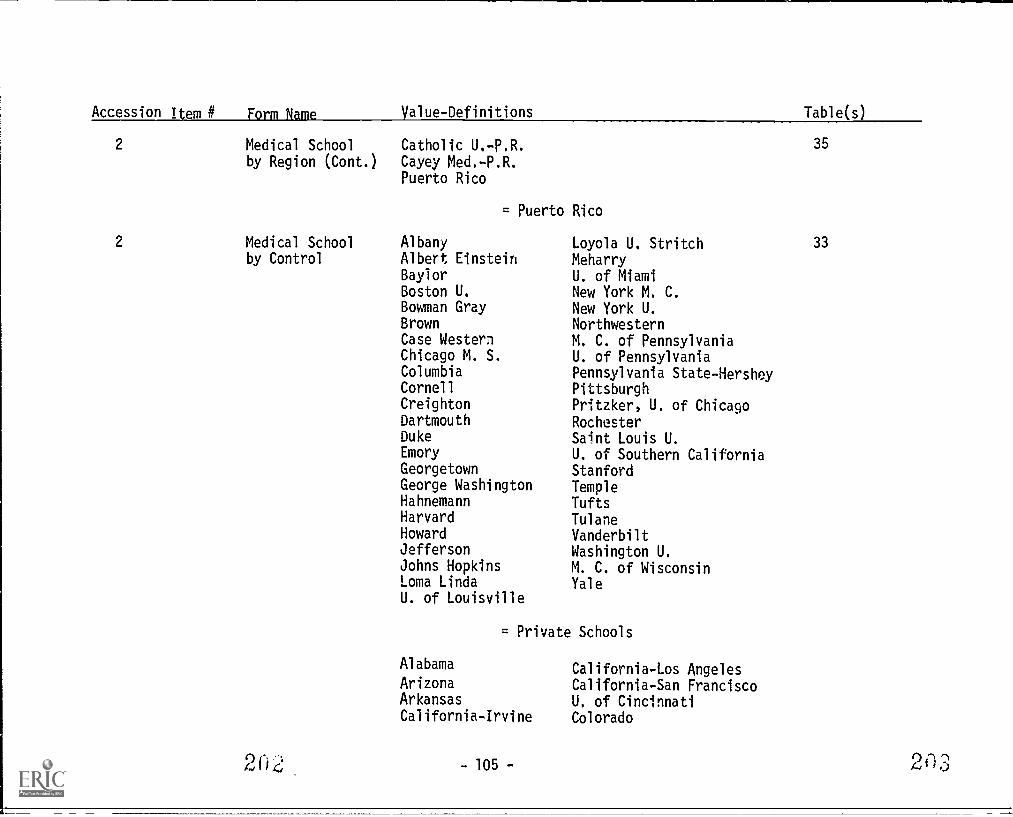
Accession I em # U alue-Definitions
2
2
Medical School Catholic U.-P.R.
by Region (Cont.) Cayey Med.-P.R.Puerto Rico
Medical Schoolby Control
= Puerto Rico
AlbanyAlbert EinsteinBaylorBoston U.Bowman GrayBrownCase WesternChicago M. S.ColumbiaCornellCreightonDartmouthDukeEmoryGeorgetownGeorge WashingtonHahnemannHarvardHowardJeffersonJohns HopkinsLoma LindaU. of Louisville
Loyola U. StritchMeharryU. of Miami
New York M. C.New York U.NorthwesternM. C. of PennsylvaniaU. of PennsylvaniaPennsylvania State-HersheyPittsburghPritzker, U. of ChicagoRochesterSaint Louis U.U. of Southern CaliforniaStanfordTempleTuftsTulaneVanderbiltWashington U.M. C. of WisconsinYale
= Private Schools
Alabama
ArizonaArkansasCalifornia-Irvine
California-Los AngelesCalifornia-San FranciscoU. of CincinnatiColorado
Table(s)
35
33
2n320'4, - 105
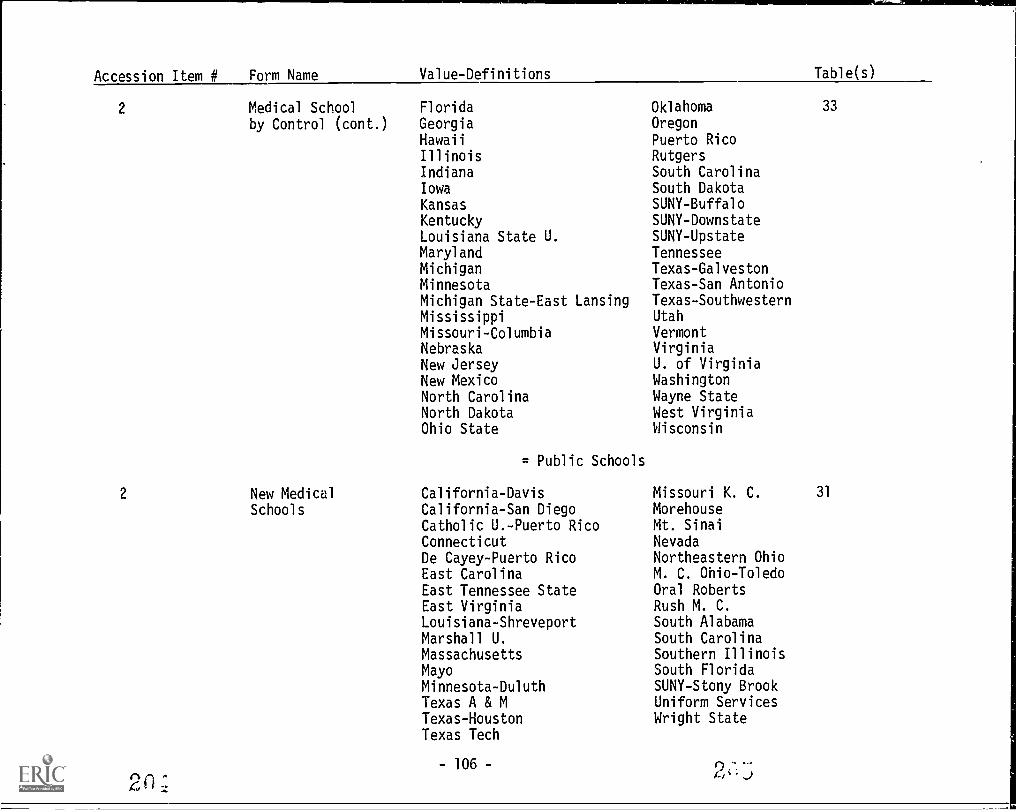
Accession Item # Form Name Value-Definitions Table(s)
2
2
Medical Schoolby Control (cont.)
New MedicalSchools
FloridaGeorgiaHawaii
IllinoisIndianaIowa
KansasKentuckyLouisiana State U.MarylandMichiganMinnesotaMichigan State-East LansingMississippiMissouri-ColumbiaNebraskaNew JerseyNew MexicoNorth CarolinaNorth DakotaOhio State
= Public Schools
California-DavisCalifornia-San DiegoCatholic U.-Puerto RicoConnecticutDe Cayey-Puerto RicoEast CarolinaEast Tennessee StateEast VirginiaLouisiana-ShreveportMarshall U.MassachusettsMayoMinnesota-DuluthTexas A & MTexas-HoustonTexas Tech
-106-
OklahomaOregon
Puerto RicoRutgersSouth CarolinaSouth DakotaSUNY-BuffaloSUNY-DownstateSUNY-UpstateTennesseeTexas-GalvestonTexas-San AntonioTexas-SouthwesternUtahVermontVirginiaU. of VirginiaWashingtonWayne StateWest VirginiaWisconsin
33
Missouri K. C. 31
MorehouseMt. SinaiNevadaNortheastern OhioM. C. Ohio-ToledoOral RobertsRush M. C.South AlabamaSouth CarolinaSouthern IllinoisSouth FloridaSUNY-Stony BrookUniform ServicesWright State
1-1 J
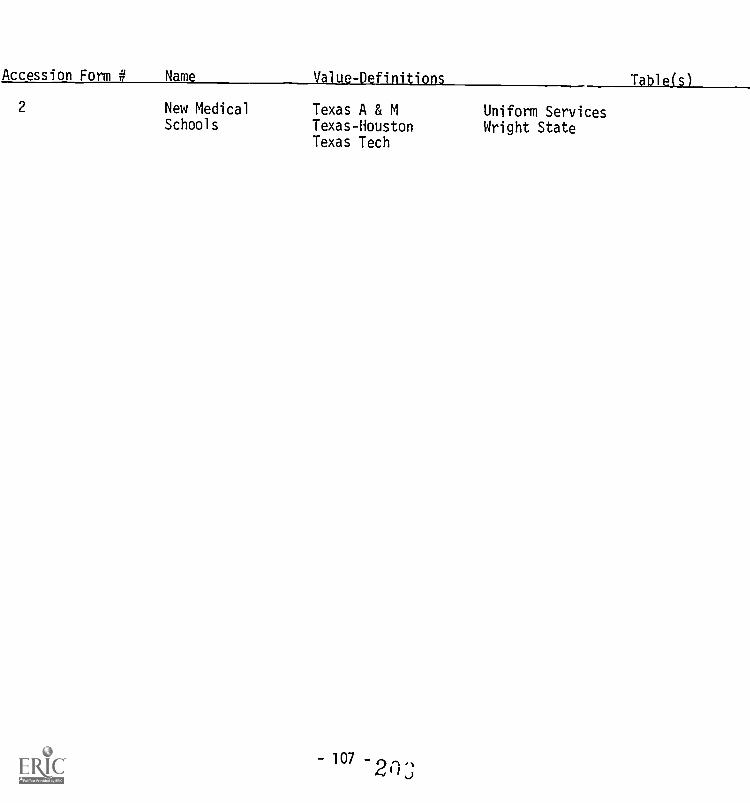
Accession Form
2
It Nam I-f i 1 T 1
New MedicalSchools
Texas A & MTexas-HoustonTexas Tech
- 107
Uniform ServicesWright State
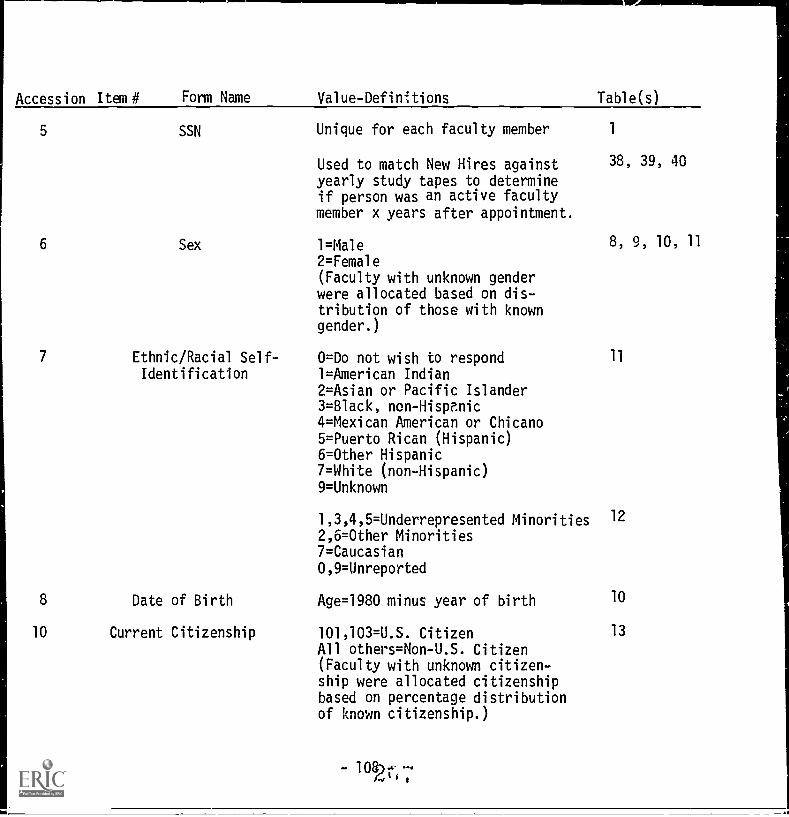
Accession Item it Form Name Value-Definitions Table(s)
5 SSN Unique for each faculty member 1
Used to match New Hires againstyearly study tapes to determineif person was an active facultymember x years after appointment.
38, 39, 40
6 Sex 1=Male2=Female
8, 9, 10,
(Faculty with unknown genderwere allocated based on dis-tribution of those with knowngender.)
7 Ethnic/Racial Self- 0=Do not wish to respond 11
Identification 1=American Indian2=Asian or Pacific Islander3=Black, non - Hispanic
4=Mexican American or Chicano5=Puerto Rican (Hispanic)6=Other Hispanic7=White (non-Hispanic)9=Unknown
1,3,4,5=Underrepresented Minorities 12
2,6=Other Minorities7=Caucasian
0,9=Unreported
8 Date of Birth Age =1980 minus year of birth 10
10 Current Citizenship 101,103=U.S. Citizen 13
All others=Non-U.S. Citizen(Faculty with unknown citizen-ship were allocated citizenshipbased on percentage distributionof known citizenship.)
- 10R)r- -.1...,
11
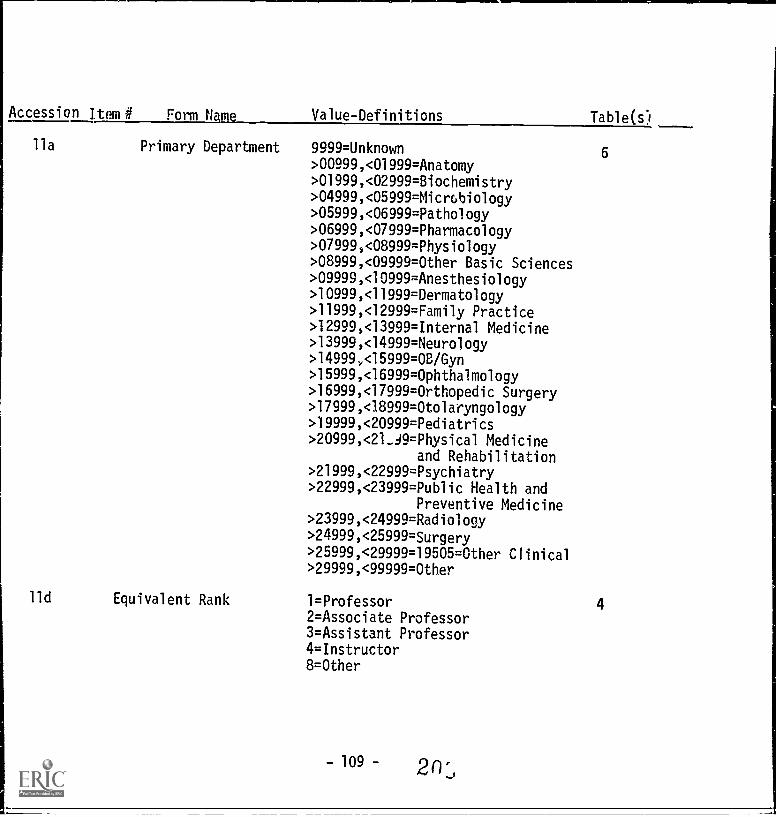
Accession Item # Form Hug Value-Definitions
lla
Table(s)
Primary Department 9999=Unknown>00999,<01999=Anatomy>01999,<02999=Biochemistry>04999,<05999=Microbiology>05999,<06999=Pathology>06999,<07999=Pharmacology>07999,<08999=Physiology>08999,<09999=Other Basic Sciences>09999, <10999 - Anesthesiology
>10999,<11999=Dermatology>11999,<12999=Family Practice>12999,<13999=1nternal Medicine>13999,<14999=NeurologY>14999,45999=0B/Gyn>15999,<16999=Ophthalmology>16999,<17999=Orthopedic Surgery>17999,<18999=Otolaryngology>19999,<20999=Pediatrics>20999,<21.J9=Physical Medicine
and Rehabilitation>21999,<22999=Psychiatry>22999,<23999=Public Health and
Preventive Medicine>23999,<24999=RadiologY>24999,<25999=Surgery
>25999,<29999=19505=Other Clinical>29999,<99999=Other
lld Equivalent Rank 1=Professor2=Associate Professor3=Assistant Professor4=Instructor8=Other
-109- 2n:,
6
4
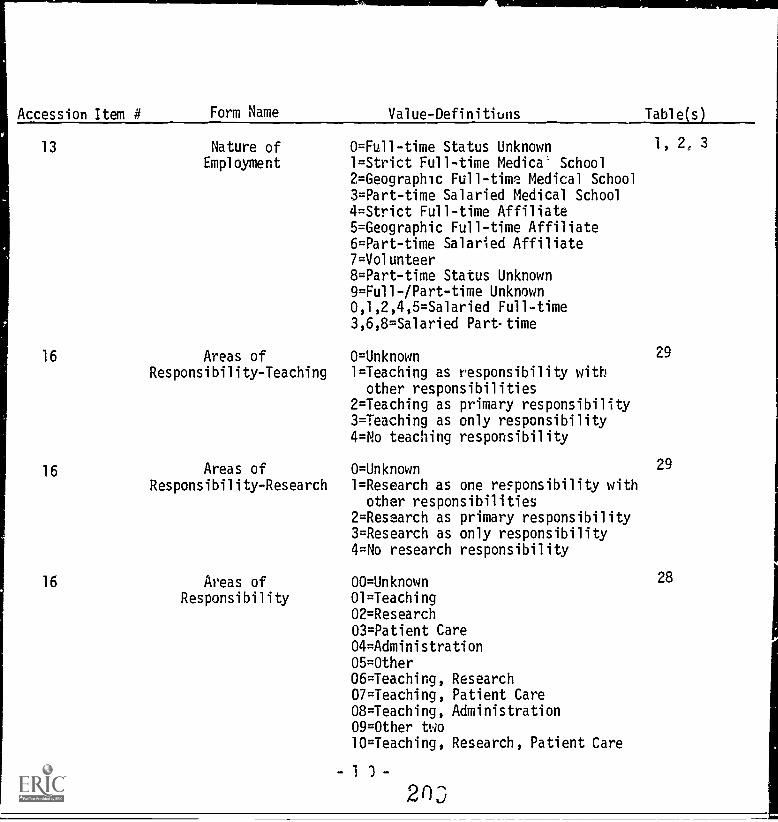
Accession Item 4 Form Name Value-Definitiuns Table(si
13 Nature of O =Full -time Status Unknown 1, 2, 3
Employment 1=Strict Full-time Medica' School2=Geographic Full-time Medical School3=Part-time Salaried Medical School4=Strict Full-time Affiliate5=Geographic Full-time Affiliate6=Part-time Salaried Affiliate7=Volunteer8=Part-time Status Unknown9=Full-/Part-time Unknown0,1,2,4,5=Salaried Full-time3,6,8=Salaried Part-time
16 Areas of 0=Unknown 29
Responsibility-Teaching 1=Teaching as responsibility withother responsibilities
2=Teaching as primary responsibility3=Teaching as only responsibility4=No teaching responsibility
16 Areas of 0=Unknown 29
Responsibility-Research 1=Research as one responsibility withother responsibilities
2=Research as primary responsibility3=Research as only responsibility4=No research responsibility
16 Areas of 00=Unknown 28
Responsibility 01=Teaching02=Research03=Patient Care04=Administration05=Other06=Teaching, Research07=Teaching, Patient Care08=Teaching, Administration09=Other two10=Teaching, Research, Patient Care
-1 3-
20-3
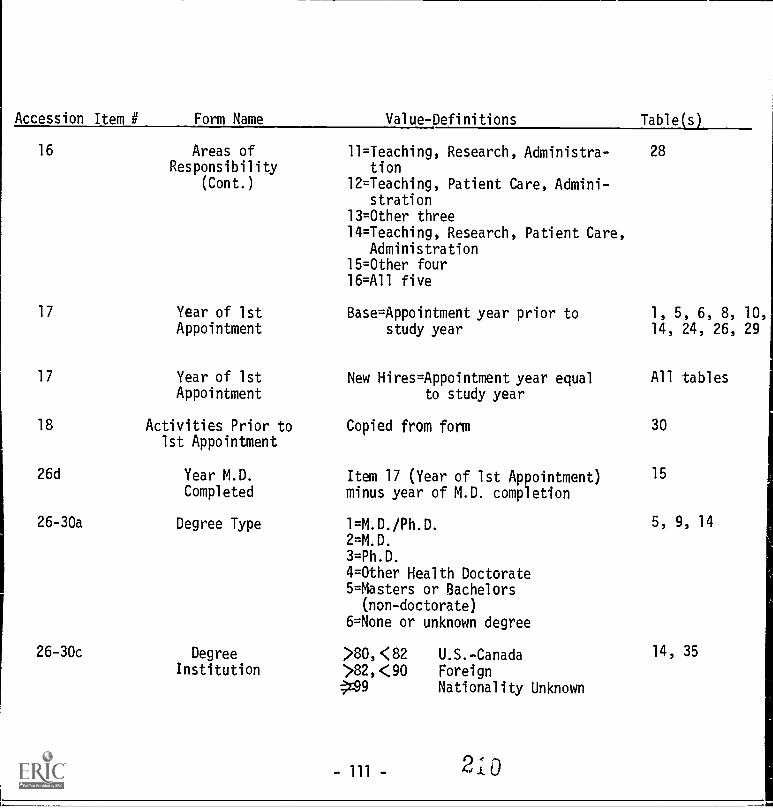
Accession Item # Form Name Value-Definitions Table(s)
16 Areas ofResponsibility
(Cont.)
17
17
18
26d
26-30a
26-30c
Year of 1stAppointment
Year of 1stAppointment
Activities Prior to1st Appointment
Year M.D.Completed
Degree Type
Degree
Institution
11=Teaching, Research, Administra- 28
tion12=Teaching, Patient Care, Admini-
stration13=Other three14=Teaching, Research, Patient Care,
Administration15=Other four16=All five
Base=Appointment year prior tostudy year
New Hires=Appointment year equalto study year
Copied from form
Item 17 (Year of 1st Appointment)minus year of M.D. completion
1=M.D./Ph.D.2 =M.D.
3=Ph.D.
4=Other Health Doctorate5=Masters or Bachelors
(non-doctorate)6=None or unknown degree
>80,<(82 U.S.-Canada
>82,<90 Foreignz99 Nationality Unknown
210
1, 5, 6, 8, 10,
14, 24, 26, 29
All tables
30
15
5, 9, 14
14,35
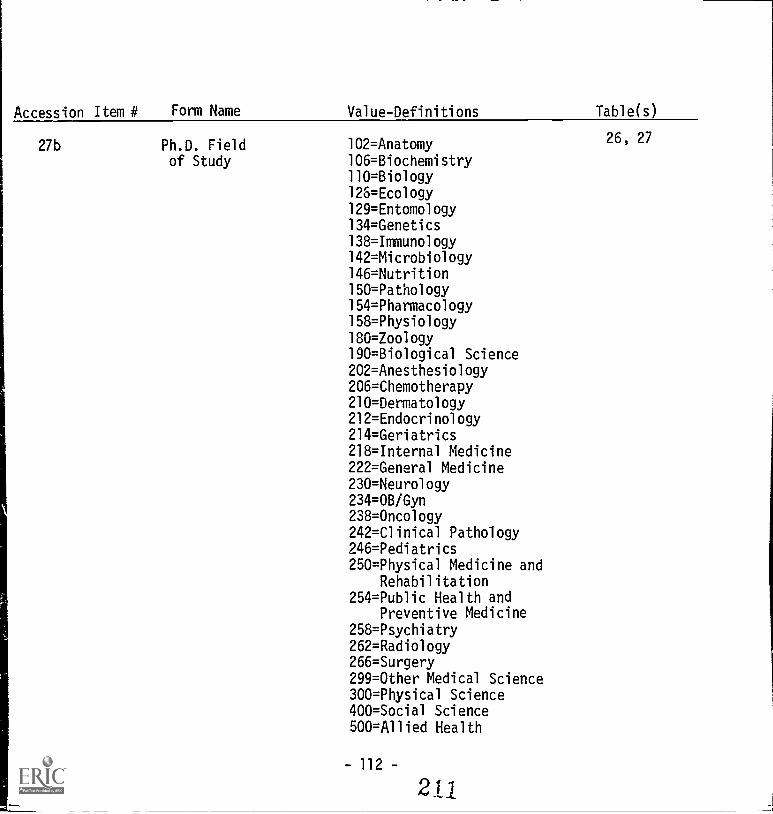
Accession Item 4
27b
Form Name
Ph.D. Fieldof Study
Value-Definitions
102=Anatomy106=Biochemistry110=Biology126=Ecology129=Entomology134=Genetics138=Immunology142=Microbiology146=Nutrition150=Pathology154=Pharmacology158=Physiology
180=Zoology190=Biological Science202=Anesthesiology206=Chemotherapy210=Dermatology212=Endocrinology214=Geriatrics218=Internal Medicine222=General Medicine230=Neurology234=0B/Gyn238=Oncology242=Clinical Pathology246=Pediatrics250=Physical Medicine and
Rehabilitation254=Public Health and
Preventive Medicine258=Psychiatry262=Radiology266=Surgery299=Other Medical Science300=Physical Science400=Social Science500=Allied Health
- 112 -
2 1.1.
Table(s)
26, 27
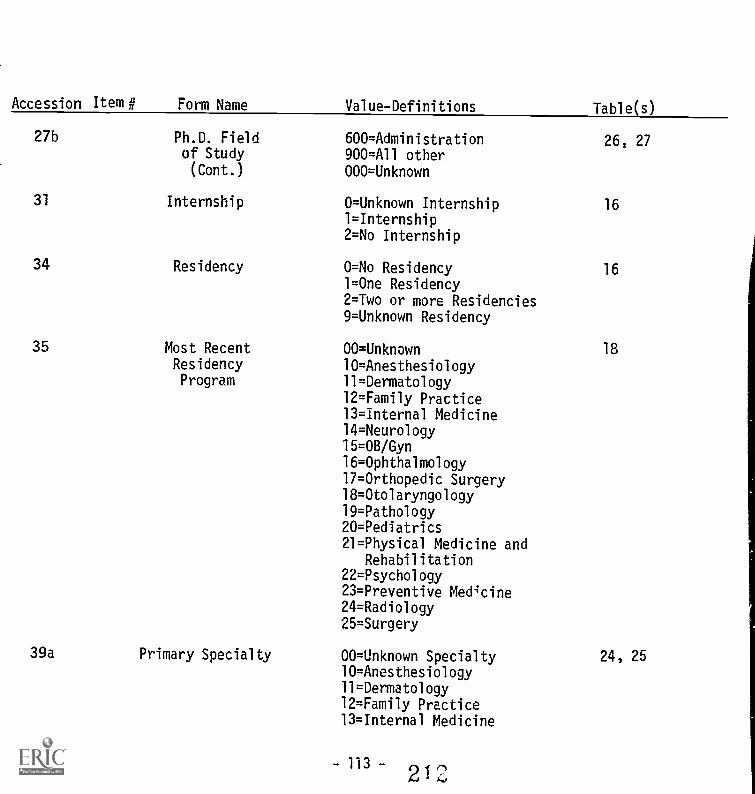
Accession Item # Form Name Value-Definitions
27b Ph.D. Field 600=Administrationof Study 900=All other(Cont.) 000=Unknown
31 Internship O= Unknown Internship
1=Internship2=No Internship
34 Residency O =No Residency
1=One Residency2=Two or more Residencies9=Unknown Residency
35 Most Recent 00=UnknownResidency 10=AnesthesiologyProgram 11=Dermatology
12=Family Practice13= Internal Medicine14=Neurology15=0B/Gyn
16=Ophthalmology17=Orthopedic Surgery18=Otolaryngology19=Pathology20=Pediatrics21=Physical Medicine and
Rehabilitation22=Psychology23=Preventive Medicine24=Radiology25=Surgery
39a Primary Specialty 00=Unknown Specialty10=Anesthesiology11=Dermatology12=Family Practice
13=Internal Medicine
-113-2
Table(s)
26, 27
16
16
18
24,25
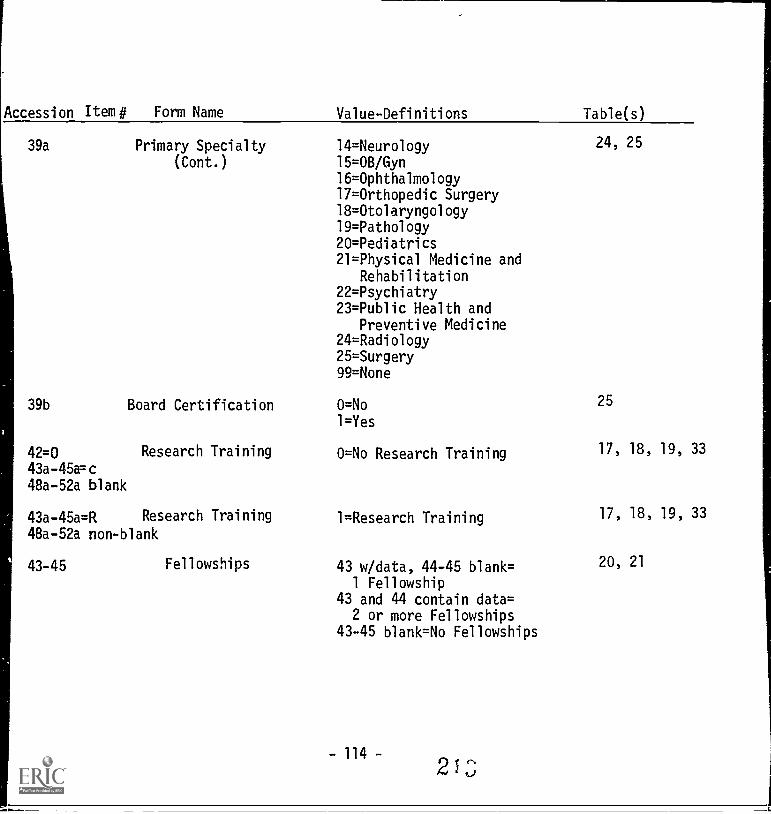
Accession Item# Form Name Value-Definitions
39a Primary Specialty
(Cont.)
39b Board Certification
42=0 Research Training
43a-45a= c
48a-52a blank
43a-45a=R Research Training
48a-52a non-blank
43-45 Fellowships
14=Neurology15=08/Gyn16=Ophthalmology17=Orthopedic Surgery18=Otolaryngology19=Pathology20=Pediatrics21=Physical Medicine and
Rehabilitation22=Psychiatry23=Public Health and
Preventive Medicine24=Radiology25=Surgery99=None
O =No
1=Yes
O =No Research Training
1=Research Training
43 w/data, 44-45 blank=1 Fellowship
43 and 44 contain data=2 or more Fellowships
43-45 blank=No Fellowships
- 114 -213
Table(s)
24, 25
25
17, 18, 19, 33
17, 18, 19, 33
20,21
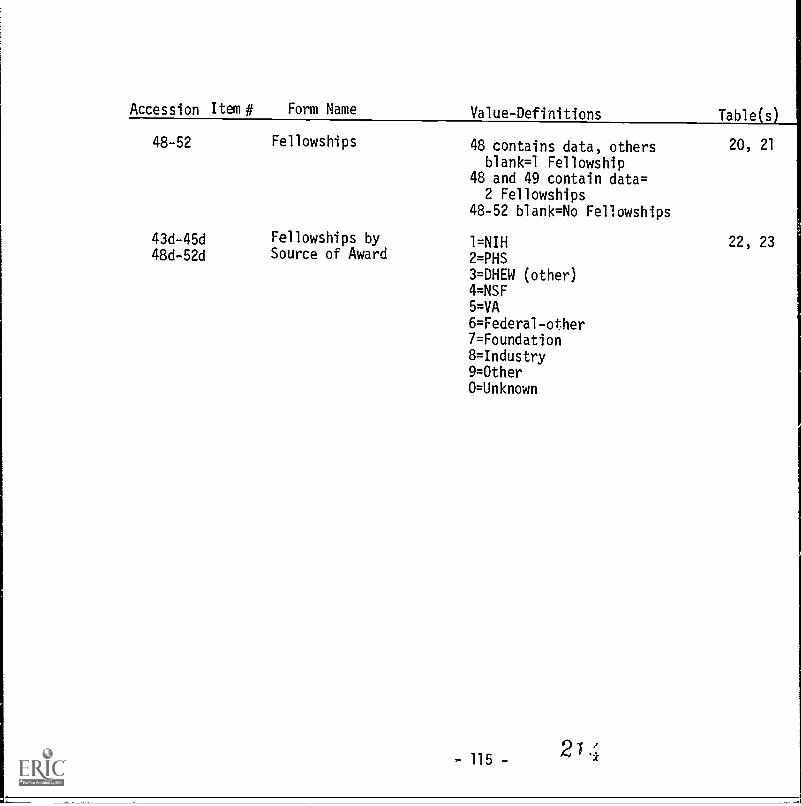
Accession Item # Form Name Value-Definitions Table s
48-52 Fellowships
43d-45d48d-52d
Fellowships bySource of Award
48 contains data, othersblank =l Fellowship
48 and 49 contain data=2 Fellowships
48-52 blank=No Fellowships
1=NIH2=PHS
3=DHEW (other)4=NSF5=VA
6=Federal-other7=Foundation8=Industry
9=OtherO= Unknown
20,21
22,23
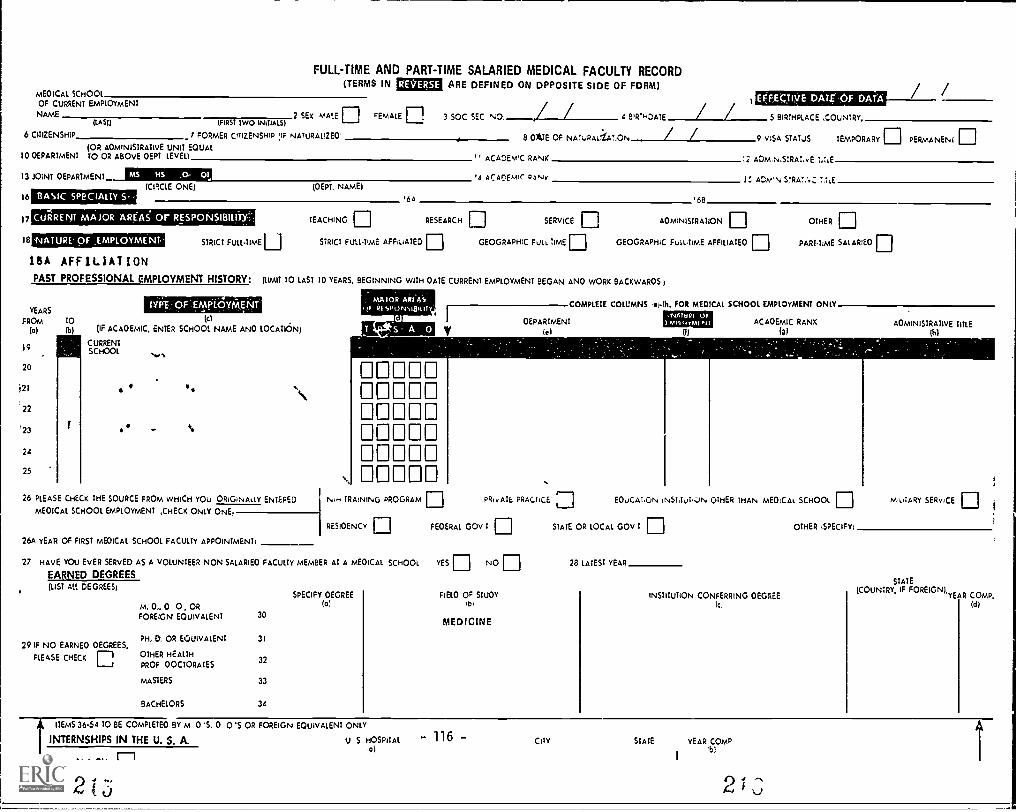
FULL -TIME AND PART-TIME SALARIED MEDICAL FACULTY RECORD(TERMS IN REVERSE ARE DEFINED ON OPPOSITE SIDE OF FORM)
MEDICAL SCHOOLOF CURRENT EMPLOYMENT
NAME 2 SEx MALE FEMALE D 3 SOC SEC NO 4 81VHDASE(LAST) (FIRST TWO INITIALS)
6 CITIZENSHIP 7 FORMER CITIZENSHIP AF NATURALIZED' 8 DATE OF NATuRALriAnON
EFFECTIVEDALE OF DATA
(OR ADMINISTRATIVE UNIT EQUAL10 DEPARTMENT TO OR ABOVE DEPT LEVELT " ACADEv,C RANK
5 BIRTHPLACE ,COUNTRY,
9 v)SA STATUS TEMPORARY El PERMANENT
'2 ADM,N,STRAT,vE T TIE
13 JOINT DEPARTMENT MS HS .0. 01 '4 ACADEMIC PAN( 2 A'AP SIR " LE(DEPT, NAME)
16
17
18
BASIC SPECIALTY S(CIRCLE ONE)
'AA '69
alliDENT MAJOR AREAS or RESPONSIBILITY:'
'NATURE OF ,EMPLOYMENT- STRICT FULL -TIME
IBA AFFILIATIONPAST PROFESSIONAL EMPLOYMENT HISTORY:
YEARS
FROM
(0)
19
TYPE; OF ' "EMPLOYMENT
TEACHING I:2 RESEARCH E] SERVICE 0 ADMINISTRATION El OTHER El
STRICT FULLTwE AFFILIATED GEOGRAPHIC FULL TIME GEOGRAPHIC FULL-TIME AFFILIATED PART-TIME SALARIED D
(LIMIT TO LAST 10 YEARS. BEGINNING WITH DATE CURRENT EMPLOYMENT BEGAN AND WORK BACKWARDS )
TO (c)
(IF ACADEMIC. ENTER SCHOOL NAME AND LOCATION)
CURRENTSCHOOL
20
j21 v.
22
123
24
25
26 PLEASE CHECK THE SOURCE FROM WHICH YOU ORiGiNALLY ENTEPE2MEDICAL SCHOOL EMPLOYMENT CHECK ONLY ONE)
26A YEAR OF FIRST MEDICAL SCHOOL FACULTY APPOINTMENT.
MAIOR ARIASR14,,p6t4,,LBILIty COMPLETE COLUMNS 11,1h, FOR MEDICAL SCHOOL EMPLOYMENT ONLY
DEPARTMENT'-r4Atutti 01
IleflOrMI Nt(I)
ACADEMIC RANK(9)
DOOMDDDDDDOOMDDDDDDDDDDDDDDD
N,H TRAINING
RESIDENCY El
27 HAVE YOU EVER SERVED AS A VOLUNTEER NON SALARIED FACULTY MEMBER AT A MEDICAL SCHOOL
EARNED DEGREES(LIST ALL DEGREES)
29 IF NO EARNED DEGREES.
P(E4SE CHECK D
M, D,. D 0, ORFOREIGN EQUIVALENT 30
PH, D. OR EQUIVALENT 31
OTHER HEALTH32
PROF DOCTORATES
MASTERS 33
BACHELORS 34
SPECIFY DEGREE(01
PRIVATE PRACTICE EDuCAI,ON iNSTITuTI.DN OTHER THAN MEDICAL SCHOOL
FEDERAL GOVT El STATE OR LOCAL GOV T
YES NO El 28 LATEST YEAR
FIELD OF STUDY1)1
MEDICINE
U
INSTITUTION CONFERRING DEGREEtc,
U MILITARY SERVICE I:2
OTHER iSPECIFYI
STATE(COUNTRY, IF FOREIGN).
YEAR COMP,(d)
ITEMS 36.54 TO BE COMPLETED BY M D "S, D O'S OR FOREIGN EQUIVALENT ONLY
INTERNSHIPS IN THE U. S. A. U S HOSPITAL 116ia)
21
CITY STATE YEAR COMPfb)
2f.
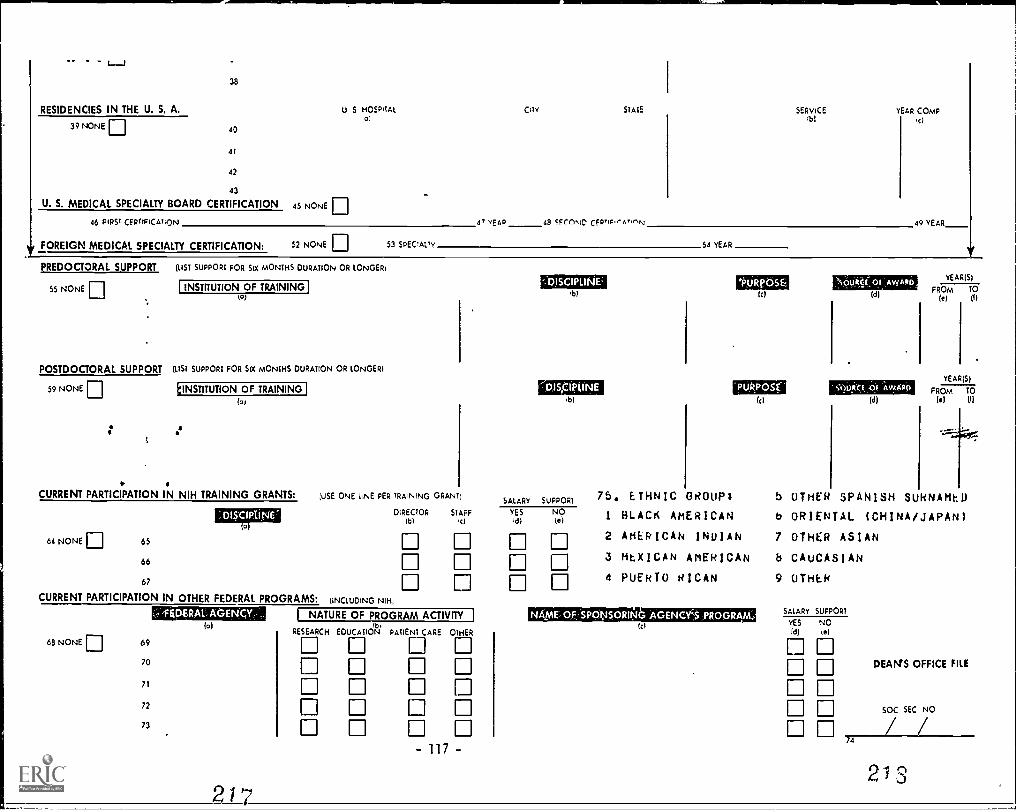
RESIDENCIES IN THE U. S. A.
39 NONE
38
40
41
42
43
U. S. MEDICAL SPECIALTY BOARD CERTIFICATION
U S HOSPITAL0)
45 NONE
46 FIRST CERTIFICATION OYEAP 48 SECOND cpoir,-,,,,,(N 49 YEAR
52 NONE El 53 SPECIAL,y 54 YEAR
CITY STATE SERVICE YEAR COMP(b)
FOREIGN MEDICAL SPECIALTY CERTIFICATION:
PREDOCTORAL SUPPORT (UST SUPPORT FOR SIX MONTHS DURATION OR LONGER(
55 NONE ID INSTITUTION OF TRAININGLo)
POSTDOCTORAL SUPPORT (LIST SUPPORT FOR SIX MONTHS DURATION OR LONGER)
59 NONE ID
a
INSTITUTION OF TRAINING I(01
CURRENT PARTICIPATION IN NIH TRAINING GRANTS:
.D1,5'CIPONE'
64 NONE 1:1 65
66
67
CURRENT PARTICIPATION IN OTHER FEDERAL PROGRAMS:
fEDERAI. AGENCY(a)
DISCIPLINE,b)
DIS,CIPLINE4b)
USE ONE LINE PER TRANrNO GRANSALARY SUPPORT
DIRECTOR STAFF YES NO0)) ,c) Id)
(INCLUDING NIHI
NATURE OF PROGRAM ACTIVITY
RESEARCH EDLICATiO1N1),
PATIENT CARE OTHER
68 NONE Ej 69
70
71
72
73
- 117 -
euRposE-(c)
'ptik?osc(4)
75. ETHNIC GROUP)
1 )(LACK AMERICAN
2 AMERICAN INDIAN
3 MEXICAN AMERICAN
4 PUERTO RICAN
NAIME-OF, SPONSORING AGENCYS PROGRAK(41
!:SOLIA4(01 'AWARD,
(d)
tir)111eCT 01 'AVVXRD
(d)
YEAR(S)
FROM TO(a) (I)
YEAR'S)
FROM TO
(*) (f)
5 OTHER SPANISH SURNAMtD
b ORIENTAL (CHINA/JAPAN)
7 OTHER ASIAN
CAUCASIAN
9 OTHER
SALARY SUPPORT
YES NO(el)
El 00 0
74
DEANS OFFICE FILE
SOC SEC NO
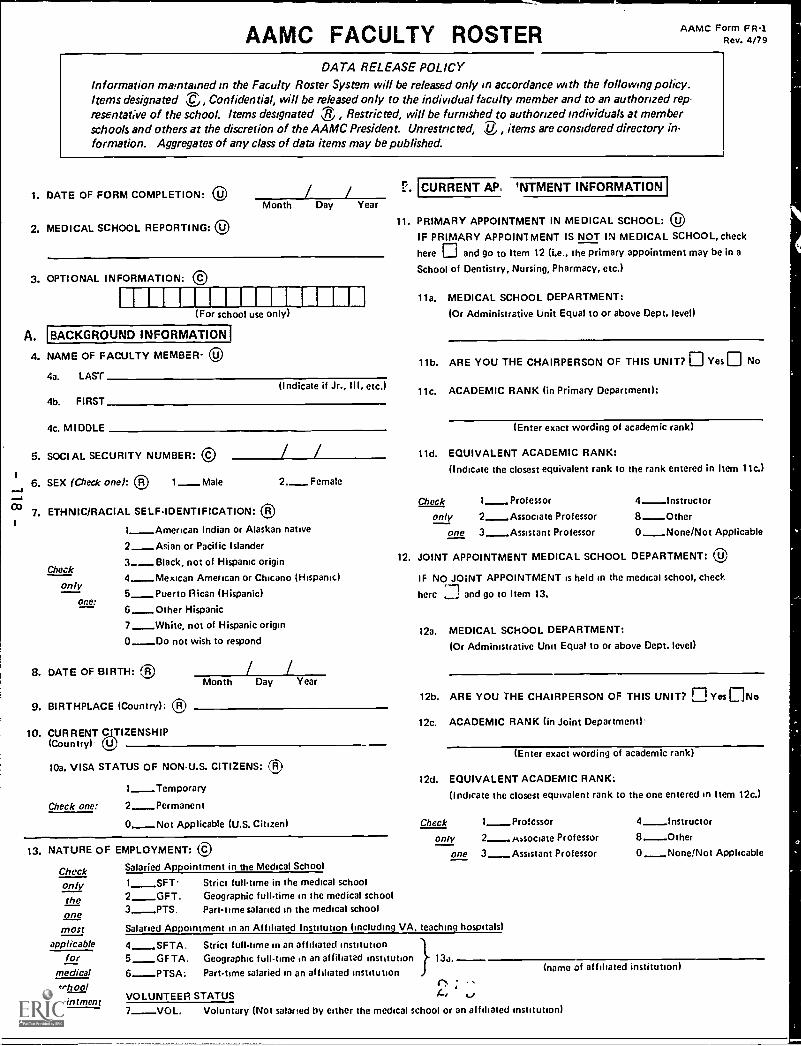
CO
AAMC FACULTY ROSTER AAMC Form FR-1Rev. 4/79
DATA RELEASE POLICYInformation maintained in the Faculty Roster System will be released only in accordance with the following policy.Items designated ©, Confidential, will be released only to the individual faculty member and to an authorized rep-resentative of the school. Items designated RJ , Restricted, will be furnished to authorized individuals at memberschools and others at the discretion of the AAMC President. Unrestricted, U , items are considered directory in-formation. Aggregates of any class of data items may be published.
1. DATE OF FORM COMPLETION: 0
2. MEDICAL SCHOOL REPORTING:
Month Day Year
3. OPTIONAL INFORMATION:
I I I I I I I I I I I I I I I I(For school use only)
A. [BACKGROUND INFORMATION!
4. NAME OF FACULTY MEMBER. OU
4a. LAST(Indicate if Jr., III, etc.)
4b. FIRST
4c. MIDDLE
5. SOCIAL SECURITY NUMBER:
6. SEX (Check one): ® 1-Male 2._ Female
7. ETHNIC/RACIAL SELF-IDENTIFICATION: (.:)
1 American Indian or Alaskan native
2_ Asian or Pacific Islander
Check3 Black, not of Hispanic origin
4-Mexican American or Chicano (Hispanic)only
S_Puerto Rican (Hispanic)one:
6 _ Other Hispanic7-White, not of Hispanic origin0 _Do not wish to respond
8. DATE OF BIRTH: RMonth Day Year
9. BIRTHPLACE (Country): ®
10. CURRENT 5TIZENSHIP(Country) U
10a. VISA STATUS OF NONU.S. CITIZENS:
I-TemporaryCheck one: 2-Permanent
O_Not Applicable (U.S. Citizen)
13. NATURE OF EMPLOYMENT: ©
Checkonlytheanemost
applftablefor
medicalschool
appointment
Salaried Appointment in the Medical School
1 SFT. Strict full-time in the medical school2_GFT. Geographic full-time in the medical school3-PTS. Part-time salaried in the medical school
Salaried A
. [CURRENT AP, 'NTMENT INFORMATION !
11. PRIMARY APPOINTMENT IN MEDICAL SCHOOL: 0IF PRIMARY APPOINTMENT IS NOT IN MEDICAL SCHOOL, check
here and go to Item 12 (i.e., the primary appointment may be in a
School of Dentistry, Nursing, Pharmacy, etc.)
11a. MEDICAL SCHOOL DEPARTMENT:
(Or Administrative Unit Equal to or above Dept. level)
11b. ARE YOU THE CHAIRPERSON OF THIS UNIT? Yes No
11c. ACADEMIC RANK (in Primary Department):
(Enter exact wording of academic rank)
11d. EQUIVALENT ACADEMIC RANK:(Indicate the closest equivalent rank to the rank entered in Item 11c.)
Check 1_Professor 4-Instructoronly 2_Associate Professor 8-Other
one 3_Assistant Professor 0 _None/Not Applicable
12. JOINT APPOINTMENT MEDICAL SCHOOL DEPARTMENT: el,
IF NO JOINT APPOINTMENT is held in the medical school, check
here and go to Item 13.
12a. MEDICAL SCHOOL DEPARTMENT:
(Or Administrative Unit Equal to or above Dept. level)
12b. ARE YOU THE CHAIRPERSON OF THIS UNIT? Yes N°
12c. ACADEMIC RANK (in Joint Department)'
(Enter exact wording of academic rank)
12d. EQUIVALENT ACADEMIC RANK:(Indicate the closest equivalent rank to the one entered in Item 12c.)
Check 1-Professor 4 Instructor
only 2-8Asociate Professor 8-Otherone 3_ Assistant Professor 0 _None/Not Applicable
ointment in an Affiliated Institution (includin VA. teachin hospitals)
4_SFTA. Strict full-time in an affiliated institution5___GFTA. Geographic full-time in an affiliated institution 13a.
6-PTSA: Part-time salaried in an affiliated institution
VOLUNTEER STATUS 4, Li
(name of affiliated institution)
7-VOL. Voluntary (Not salaried by either the medical school or an affiliated institution)
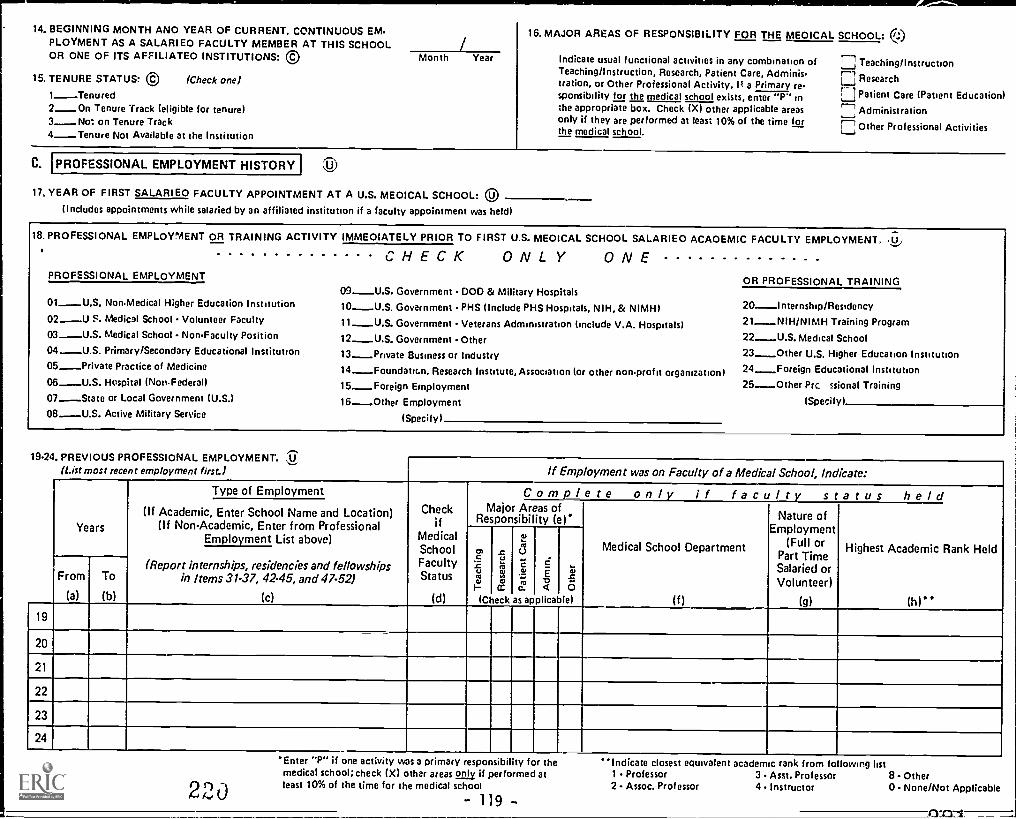
14. BEGINNING MONTH ANO YEAR OF CURRENT, CONTINUOUS EM.PLOYMENT AS A SALARIEO FACULTY MEMBER AT THIS SCHOOLOR ONE OF ITS AFFILIATED INSTITUTIONS: CI
15. TENURE STATUS: © (Check one)
1Tenured2On Tenure Track (eligible for tenure)3No on Tenure Track4Tenure Not Available at the Institution
Month Year
16. MAJOR AREAS OF RESPONSIBILITY FOR THE MEOICAL SCHOOL: (.:)
Indicate usual functional activities in any combination ofTeaching/Instruction, Research, Patient Care, Adminis-tration, or Other Professional Activity. If a Primary responsibility for the medical school exists, enter "P" inthe appropriate box. Check (X) other applicable areasonly if they are performed at least 10% of the time forthe medical school.
ETeaching/InstructionEResearch1.-] Patient Care (Patient Education)
"7 Administration
EOther Professional Activities
C. PROFESSIONAL EMPLOYMENT HISTORY
17. YEAR OF FIRST SALARIEO FACULTY APPOINTMENT AT A U.S. MEOICAL SCHOOL: CI
(Includes appointments while salaried by an affiliated institution if a faculty appointment was held)
18. PROFESSIONAL EMPLOYMENT OR TRAINING ACTIVITY IMMEOIATELY PRIOR TO FIRST U.S. MEOICAL SCHOOL SALARIEO ACAOEMIC FACULTY EMPLOYMENT. UJ
CHECK ONLY ONEPROFESSIONAL EMPLOYMENT
01U.S. NonMedical Higher Education Institution02.U S. Medical School - Volunteer Faculty03U.S. Medical School NonFaculty Position
04U.S. Primary/Secondary Educational Institution05 Private Practice of Medicine
06U.S. Hospital (No .Federal)07State or Local Government (U.S.)08.U.S. Active Military Service
09.U S Government DOD & Military Hospitals10U S Government PHS (Include PHS Hospitals, NIH, & NIMH)11 _U S Government Veterans Administration (include V.A. Hospitals)
12.U S Government - Other13Private Business or Industry14Foundatic.n, Research Institute, Association (or other nonprofit organization)15._ Foreign Employment
16.Other Employment(Specify)
OR PROFESSIONAL TRAINING
20-1 nternship/Residency21NIH/NIMH Training Program22U.S. Medical School23_0ther U.S. Higher Education Institution24_Foreign Educational Institution25Other Prc ssional Training
(Specify)
IV49.rricvILJUJrtivrcaolunf,AL cmrLu T nnc nil I.
(1.1st most recent employment first.) If Employment was on Faculty of a Medical School, Indicate:
Years
Type of Employment
Checkif
MedicalSchoolFacultyStatus
(d)
MaioResponsibility
Complete only if faculty status held(If Academic, Enter School Name and Location)
(If NonAcademic, Enter from ProfessionalEmployment List above)
Areas of(e)'
Medical School Department
(f)
Nature ofEmployment
(Full orPart TimeSalaried orVolunteer)
(g)
Highest Academic Rank Held
(h)..
CM
ga,1-
(Check
=-.
2?a,cc
c.i..'
ac
,.,C.
as applicable)
c
-0a07
o
(Report internships, residencies and fellowshipsin Items 31.37, 42-45, and 47-52)
(c)
From
(a)
To
(b)
19
20
21
22
23
24
22,0
Enter "I" if one activity was a primary esponsibi ity for themedical school; check (X) other areas only if performed atleast 10% of the time for the medical school
- 119 -
Indicate closest equivalent academic rank from following list1 - Professor 3 Asst. Professor 8 Other
2 Assoc. Professor 4 Instructor 0 None/Not Applicable
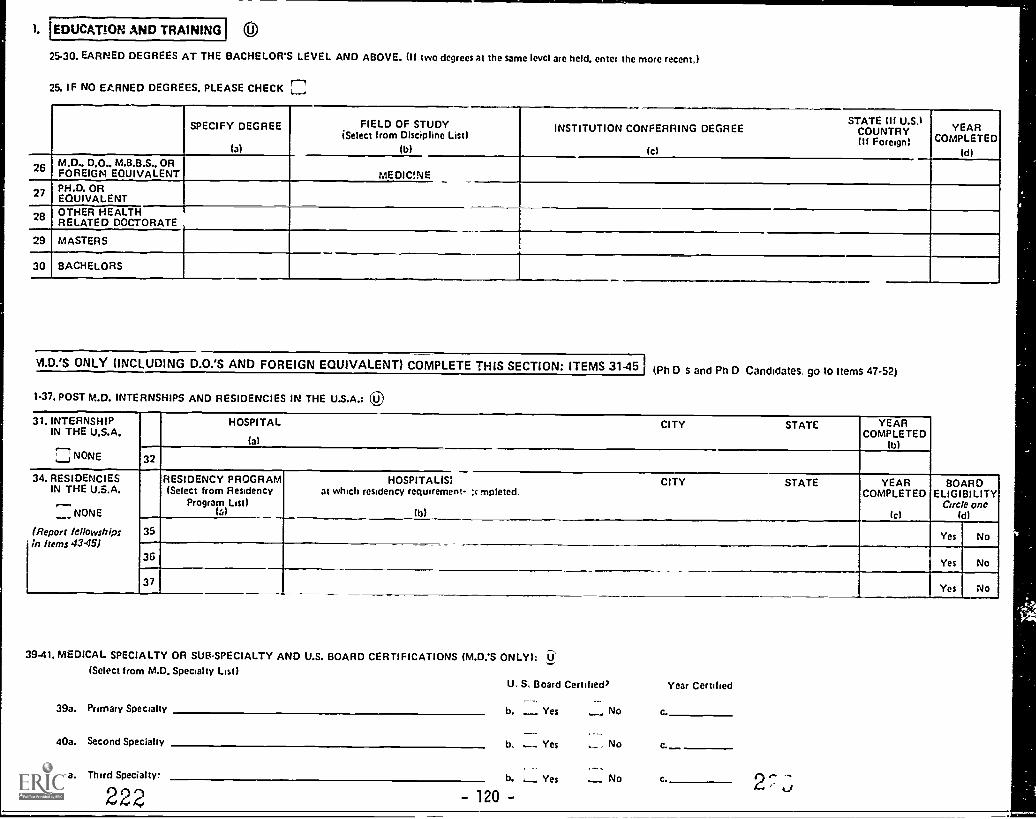
I. !EDUCATION AND TRAINING
25-30. EARNED DEGREES AT THE BACHELOR'S LEVEL AND ABOVE. IN two degrees at the same Ievcl are held, enter the more recent.)
25. IF NO EARNED DEGREES, PLEASE CHECK r"
SPECIFY DEGREE
(a)
FIELD OF STUDY(Select from Discipline List)
(b)
STATE (If U.S,1INSTITUTION CONFERRING DEGREE COUNTRY
,(I( Foreign,(c)
YEARCOMPLETED
(d)
26 MD DO MBBS ORFOREIGN EQUIVALENT MEDICINE
27 PH D OREQUIVALENT
28 OTHER HEALTHRELATED DOCTORATE
29 MASTERS
30 BACHELORS
11.D.'S ONLY (INCLUDING D.O.'S AND FOREIGN EQUIVALENT) COMPLETE THIS SECTION: ITEMS 31-45 (Ph D s and PhD Candidates go to Items 47-52)
1.37. POST M.D. INTERNSHIPS AND RESIDENCIES IN THE U.S.A.: (J
31. INTERNSHIPIN THE U.S.A.
1.-;NONE
HOSPITAL CITY STATE
(al
YEARCOMPLETED
(b)
32
34. RESIDENCIESIN THE U.S.A.
r---.NONE
(Report fellowshipsin Items 4345)
RESIDENCY PROGRAM(Select from Residency
Program List)(a)
HOSPITAL(S) CITY STATEat which residency requirement- xrnpleted.
(b)
YEARCOMPLETED
(c)
BOARDELIGIBILITY
Circ e one(d)
35 Yes No
36Yes No
37Yes No
39-41, MEDICAL SPECIALTY OR SUBSPECIALTY AND U.S. BOARD CERTIFICATIONS (M.D.'S ONLY): a(Select from M.D. Specialty List)
39a. Primary Specialty
40a. Second Specialty
41a. Third Specialty:
222
U. S. Board Certified) Year Certified
b. _ Yes No
b. Yes , No
b. Yes No c.
-120-
sonswwww.
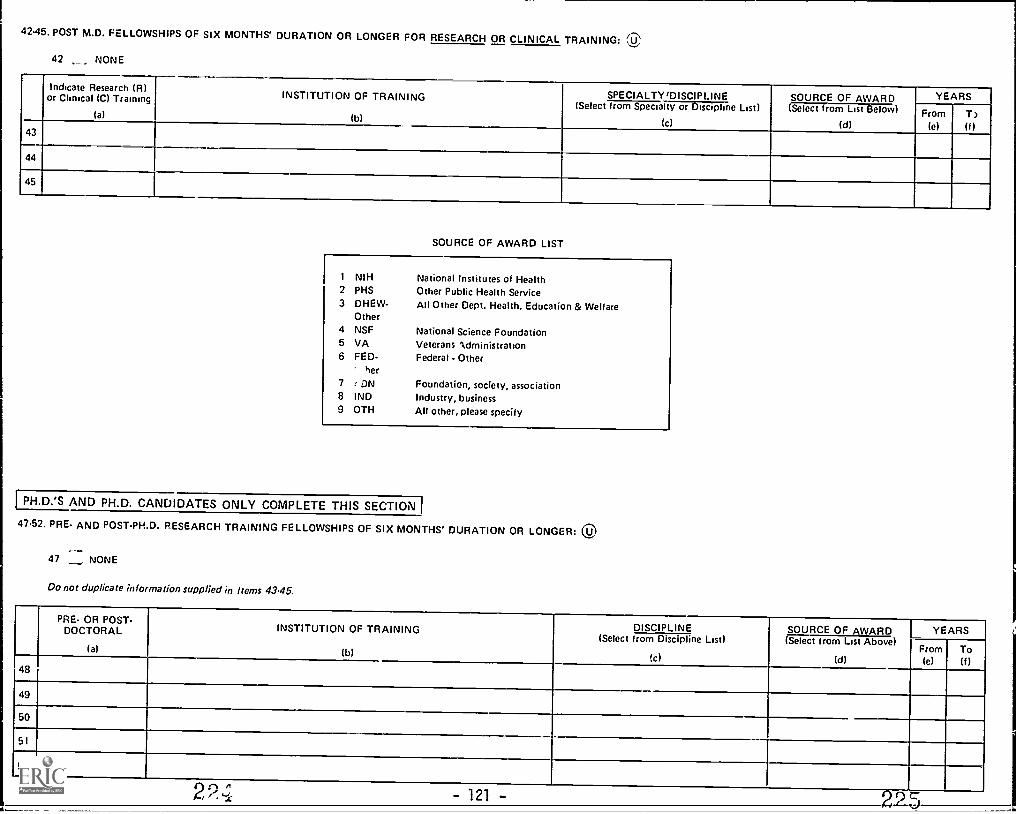
42.45. POST M.D. FELLOWSHIPS OF SIX MONTHS' DURATION OR LONGER FOR RESEARCH OR CLINICAL TRAINING:
42 NONE
Indicate Research (RIor Clinical (C) Training
(a)
INSTITUTION OF TRAINING
(b)
SPECIALTY'DISCIPLINE SOURCE OF AWARD YEARS(Select from Specialty or Discipline List)
(c)
(Select from List Below)
(d)From
(e)
T30 I43
44
45
SOURCE OF AWARD LIST
1 NIH2 PHS3 PHEW-
Other4 NSF5 VA6 FED-
her7 ON
8 IND9 0TH
National Institutes of HealthOther Public Health ServiceAll Other Dept. Health, Education & Welfare
National Science FoundationVeterans 'administrationFederal - Other
Foundation, society, associationIndustry, businessAll other, please specify
I PH.D.'S AND PH.D. CANDIDATES ONLY COMPLETE THIS SECTION I
47-52. PRE- AND POST-PH.D. RESEARCH TRAINING FELLOWSHIPS OF SIX MONTHS' DURATION OR LONGER: 0
47 NONE
Do not duplicate information supplied in Items 43-45.
PRE- OR POST-DOCTORAL
(a)
INSTITUTION OF TRAINING
lb)
DISCIPLINE SOURCE OF AWARD YEARS(Select from Discipline List)
(c)
(Select from List Above)
(d)From(e)
To(f)
48
49
50
51
52
- 121 -
APPENDIX E
REFERENCES
Anderson, P.W., Descriptive Study of SalariedMedical School Faculty. Washington, D.C.:Association of American Medical Colleges,December, 1975.
Bickel, J.W. and McRae, D.J., Estimates for Ac-curacy and Completeness of AAMC Faculty RosterSystem Data. Washington, D.C.: Associationof American Medical Colleges, December, 1977.
Faculty Roster Guide for Reporting Data.Washington, D.C.: Association of AmericanMedical Colleges, August, 1977.
Griffith, P.J. and Farlee, C., Description ofSalaried Medical School Faculty, 1971-72and 1976-77. Washington, D.C.: Associationof American Medical Colleges, December, 1977.
Griffith, P.J. and McRae, D.J., Description ofSalaried Medical School Faculty, 1969-70 and1974-75. Washington, D.C.: Association ofAmerican Medical Colleges, April, 1977.
Higgins, E.J., "Participation of Women andMinorities on U.S. Medical School Faculties,"Journal of Medical Education. Volume 54,No. 8, March, 1979, pg. 252.
Jolly, H.P. and Higgins, E.J., Participation ofWomen and Minorities on U.S. Medical SchoolFaculties, 1978. Washington, D.C.: Assoc-iation of American Medical Colleges, June,1979.
Liaison Committee on Medical Education, MedicalSchools of the U.S.A. Status of Accreditation.January, 1978.
Higgins, E.J., Comparison of Characteristics ofU.S. Medical School Salaried :-aculty inthe Past Decade, 1968-1978. Washington,D.C.: Association of American MedicalColleges, October, 1979.
Related Documents