699 31 ECOTERRA MODEL—APPLICATION OF ENVIRONMENTAL FISCAL REFORM IN LOCAL GOVERNMENT FINANCING IN PORTUGAL Joana Calado Araújo Prates and João Joanaz de Melo 1 A. Introduction 31.01 B. Land-Use Management in Portugal 31.06 C. Local Government Financing in Portugal 31.16 D. The Ecoterra Model 31.21 E. Data Sets and Criteria 31.22 F. Results and Discussion 31.23 G. Conclusion 31.40 A. Introduction Land use management is one of the least studied, more difficult, but possibly one of the most important fields for the application of economic instruments in envi- ronmental policy. Present biodiversity loss is a consequence of the decisions of many individual users of environmental products and service flows. This is a result of the ‘unpriced scarcity’ and ‘lack of property rights’ nature of the environment. The social value of various biodiversity goods and service flows is not or is insuffi- ciently reflected in market prices. As a result, an undesirable level of provision of these goods and services will result in their destruction or degradation. 2 1 Joana Prates, Researcher at the Department of Environmental Science and Engineering, School of Science and Technology, New University of Lisbon, Portugal. Joanaz de Melo, assistant professor at the Department of Environmental Science and Engineering, School of Science and Technology, New University of Lisbon, Portugal. The authors would like to thank Fundação para a Ciência e Tecnologia, who finances the EcoTerra project under the reference POCI/AMB/63087/2004; and the IMAR—Institute of Marine Research, at the School of Science and Technology, New University of Lisbon, which hosts the EcoTerra project. 2 PALD Nunes, JCJM Van den Bergh, and P Nijkamp, The ecological economics of biodiversity— methods and policy applications (Edward Elgar Publishing, 2003). 31.01 31-Cottrell-31.indd 699 31-Cottrell-31.indd 699 12/4/08 12:24:34 PM 12/4/08 12:24:34 PM

Welcome message from author
This document is posted to help you gain knowledge. Please leave a comment to let me know what you think about it! Share it to your friends and learn new things together.
Transcript
699
31
ECOTERRA MODEL—APPLICATION OF ENVIRONMENTAL FISCAL REFORM IN LOCAL GOVERNMENT FINANCING IN
PORTUGAL
Joana Calado Araújo Prates and João Joanaz de Melo1
A. Introduction 31.01
B. Land-Use Management in Portugal 31.06
C. Local Government Financing in Portugal 31.16
D. The Ecoterra Model 31.21
E. Data Sets and Criteria 31.22
F. Results and Discussion 31.23
G. Conclusion 31.40
A. Introduction
Land use management is one of the least studied, more diffi cult, but possibly one of the most important fi elds for the application of economic instruments in envi-ronmental policy. Present biodiversity loss is a consequence of the decisions of many individual users of environmental products and service fl ows. This is a result of the ‘unpriced scarcity’ and ‘lack of property rights’ nature of the environment. The social value of various biodiversity goods and service fl ows is not or is insuffi -ciently refl ected in market prices. As a result, an undesirable level of provision of these goods and services will result in their destruction or degradation.2
1 Joana Prates, Researcher at the Department of Environmental Science and Engineering, School of Science and Technology, New University of Lisbon, Portugal. Joanaz de Melo, assistant professor at the Department of Environmental Science and Engineering, School of Science and Technology, New University of Lisbon, Portugal. The authors would like to thank Fundação para a Ciência e Tecnologia, who fi nances the EcoTerra project under the reference POCI/AMB/63087/2004; and the IMAR—Institute of Marine Research, at the School of Science and Technology, New University of Lisbon, which hosts the EcoTerra project.
2 PALD Nunes, JCJM Van den Bergh, and P Nijkamp, The ecological economics of biodiversity—methods and policy applications (Edward Elgar Publishing, 2003).
31.01
31-Cottrell-31.indd 69931-Cottrell-31.indd 699 12/4/08 12:24:34 PM12/4/08 12:24:34 PM
Critical Issues in Environmental Taxation
700
If a resource is not owned by any party, then short-term exploitation is favoured and the common resource may be depleted or damaged. Two types of institu-tional approach have been used to deal with externalities associated with the environment. The fi rst includes the allocation of property rights: if the right holder can obtain benefi ts of regular resource use over the long term, he or she has an incentive to protect and sustain environmental resources. However, historical experience of the United Kingdom and other Western European countries shows that private land ownership provides no guarantee against environmental degradation. Thus, the second approach, explicit regulation, has become the dominant mode of environmental standard setting.3
The valuation of environmental and economic benefi ts of biodiversity has gained attention since the 1960s. This assessment demands the simplifi cation and trans-lation of biodiversity complexity and has led to several scientifi c studies, espe-cially in the fi eld of ecological economics.4
Portugal, like other countries, suffers a number of serious problems regarding land use, such as loss of natural and cultural heritage and other sensitive areas to urban sprawl, inadequate transportation policy, soil erosion, and pollution due to inadequate land use. Although some of this results from ignorance or malprac-tice, most of the critical actions have been fuelled by powerful economic incentives. Traditional command-and-control approaches by means of land-use plans and regulations have proved ineffectual to deal with most of the issues. Earlier research by the authors and others5 has identifi ed a number of economic instruments that may infl uence land use and its environmental consequences. Three main types of instrument have been referred: funds, charges, and taxes.
The main purpose of the EcoTerra project at the New University of Lisbon is to study improvements in economic instruments that will foster environmentally
3 R Lawrence, CL Spash, and C Carter, ‘Environmental Valuation in Europe—Property, rights and fairness’, policy research brief no 6 (2000). Concerted action funded by the European Commission DG-XII and the Swiss Federal Offi ce of Education and Science, and coordinated by Cambridge Research for the Environment (CRE).
4 R Constanza, R d’Arge, R de Groote, S Farber, M Grasso, B Hannon, K Limburg, S Naeem, R O’Neill, J Pruelo, R Raskin, P Sutton, and M van den Belt, ‘The value of the world’s ecosystem services and natural capital’ [1997] Nature 387, 253–60.
5 J Melo, A Torres, and P Veloso, ‘Os impostos relacionados com o uso da terra como instru-mento de Ordenamento do Território’ (1997) 10 O Economista 206–12 (Polimeios/Associação Portuguesa de Economistas); JJ Melo, C Furtado, L Rosado, and P Antunes, ‘Instrumentos fi nan-ceiros com infl uência no ordenamento do território’ (1998) 11 O Economista 159–63 (Polimeios/Associação Portuguesa de Economistas); I Ring, ‘Ecological public functions and fi scal equalisation at the local level in Germany’ (2002) 42 Ecological Economics 415–27, <http://www.elsevier.com/locate/ecolecon>; and J Prates, JJ Melo, and T Leonardo,‘Melhorar o ordenamento do território através do modelo de fi nanciamento das autarquias locais’ (Congresso Nacional de Engenharia do Ambiente, APEA, Lisboa, Novembro 2003).
31.02
31.03
31.04
31.05
31-Cottrell-31.indd 70031-Cottrell-31.indd 700 12/4/08 12:24:35 PM12/4/08 12:24:35 PM
Chapter 31: Ecoterra Model
701
friendly land-use planning. We follow the concept of the environmental fi scal reform currently being debated in the European Union (EU).6 Melo and Prates7 have advocated in particular the combined use of real estate taxation and state budget transfers to local authorities, to promote better land use. The concept is explored further here, looking at possible implications of this model to regional development and local fi nancing.
B. Land-Use Management in Portugal
Nature conservation policy in Portugal emerged in the 1970s with framework legislation on protected areas such as parks and preserves. This framework aims to defend the areas in which the natural habitat has to be preserved, as well as the rational usage and defence of natural resources. Protected areas now encompass 8 per ent of the country’s area, most under 1993 legislation.
During the 1980s, two other land-use management tools emerged. RAN—Reserva Agrícola Nacional (national agriculture reserve, instituted by Decreto-Lei nº 451/82) protects the best agriculture soils, representing 12 per cent of the country’s area. REN—Reserva Ecológica Nacional (national ecologic reserve, insti-tuted by Decreto-Lei nº 321/83) protects essential biophysical networks and resources such as rivers and their banks, major aquifers, coastal areas, and high-lands, representing about 40 per cent of the country’s area.
By 1982, municipal land use plans (planos directores municipais, PDM) were made mandatory (Decreto-Lei nº 208/82, 26 Maio 1982), mostly without practi-cal effect. In 1994, the government decreed that fi nancing for local projects under the European funds was restricted to municipalities with approved PDM, hence causing the rapid implementation of PDM.
In 1987, a major milestone was reached with the approval of the Lei de Bases do Ambiente (framework law on the environment, Lei nº 11/87). This became the basis for many environment-related pieces of legislation. Later, the Lei de Bases do Ordenamento do Território e Urbanismo (framework law on land manage-ment and urbanism, Lei nº 48/98) constituted the reference for regional and municipal land-use plans.
Further protection of unique and notable biodiversity values took place with the implementation of Birds and Habitats Directives, with the Natura 2000
6 EEB, <http://www.eeb.org/activities/env_fi scal_reform/Index.html> (October 2007).7 JJ Melo and J Prates, ‘EcoTerra Model—economic instruments for sustainable land use
management in Portugal’, Conference of the European Society for Environmental Economics (ESEE), Leipzig, Germany (5–7 June 2007) (published book of abstracts, papers available online).
31.06
31.07
31.08
31.09
31.10
31-Cottrell-31.indd 70131-Cottrell-31.indd 701 12/4/08 12:24:35 PM12/4/08 12:24:35 PM
Critical Issues in Environmental Taxation
702
Sectorial Plan. By 2007, designated sites covered about 22 per cent of the country, largely coincident with protected areas under national law.
Despite the effort to introduce a rational and integrated land-use management policy, these instruments did not have the expected outcome. REN and RAN are considered to be the more polemic land management instruments because of the restriction they impose on land uses. The constraint of property rights is socially badly accepted because it questions the personal welfare implied in land possession—especially because there is no compensation to the landowner for a restriction that is in the public interest. This confl ict is suggested as one of the major obstacles to the effi cient implementation of land-use instruments and nature conservation policy. Another obstacle to the implementation of REN is the delimitation process, conducted independently by each municipality, often controversial or poorly founded (sometimes too strict, sometimes too lax).8
Among other indicators of poor land use management, we can refer to the following.
Portugal has one of the highest rates of houses per family in Europe: 1.4 in 2005. However, 10 per cent of houses are not being used.9
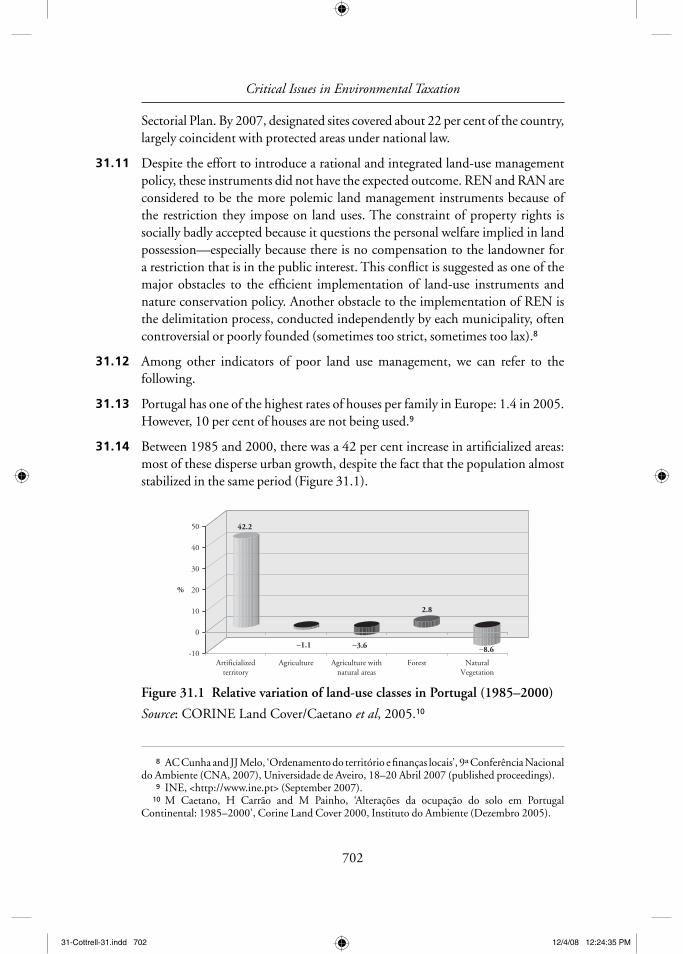
Between 1985 and 2000, there was a 42 per cent increase in artifi cialized areas: most of these disperse urban growth, despite the fact that the population almost stabilized in the same period (Figure 31.1).
Source: CORINE Land Cover/Caetano et al, 2005.10
8 AC Cunha and JJ Melo, ‘Ordenamento do território e fi nanças locais’, 9ª Conferência Nacional do Ambiente (CNA, 2007), Universidade de Aveiro, 18–20 Abril 2007 (published proceedings).
9 INE, <http://www.ine.pt> (September 2007).10 M Caetano, H Carrão and M Painho, ‘Alterações da ocupação do solo em Portugal
Continental: 1985–2000’, Corine Land Cover 2000, Instituto do Ambiente (Dezembro 2005).
Figure 31.1 Relative variation of land-use classes in Portugal (1985–2000)
42.2
−1.1 −3.6
2.8
−8.6-10
0
10
20
30
40
50
%
Artificializedterritory
Agriculture Agriculture withnatural areas
Forest NaturalVegetation
31.11
31.12
31.13
31.14
31-Cottrell-31.indd 70231-Cottrell-31.indd 702 12/4/08 12:24:35 PM12/4/08 12:24:35 PM
Chapter 31: Ecoterra Model
703
In short, existing legislation and planning efforts, although positive, have not been enough to curb most land-use management problems.
C. Local Government Financing in Portugal
The most important instance of local government in Portugal is the \municipal level, with signifi cant autonomy and competences in a wide range of issues, including land-use management. There are 308 municipalities in Portugal (278 in the mainland and 30 in the autonomous regions of Azores and Madeira).
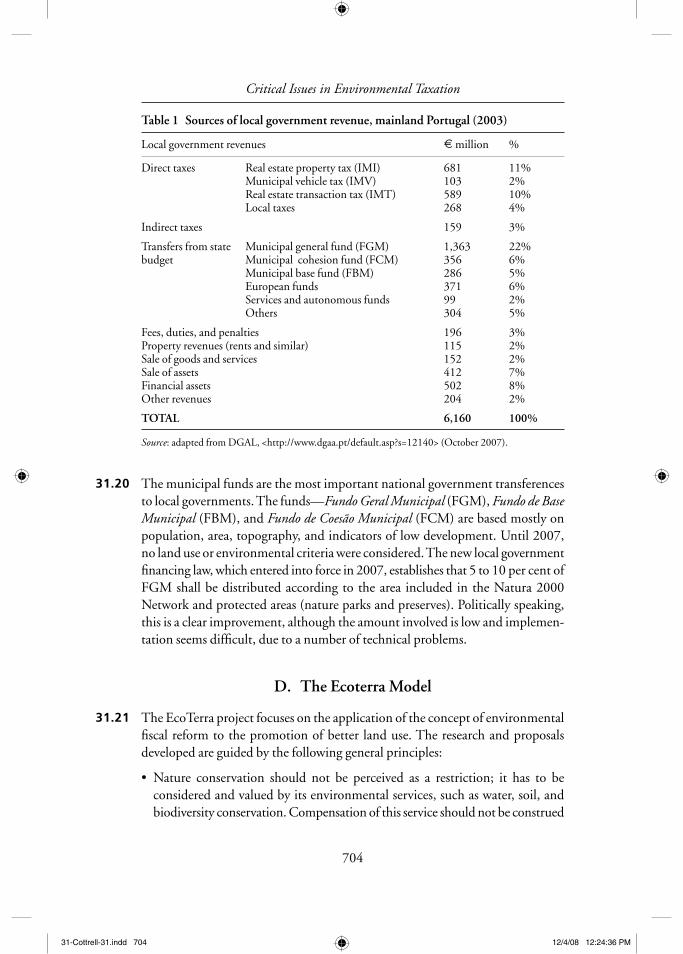
Table 1 shows the structure of local government revenues in Portugal. It should be noted that 21 per cent of local fi nancing is dependent on real estate taxes (real estate property tax, IMI; plus real estate transaction tax, IMT). This dependency is even higher if taking into account the revenue from construc-tion fees and licences. There are many inconveniences associated with this model: it incentivizes lax urban planning rules to maintain revenues, and also makes those revenues vulnerable to crisis in the construction business. Another 22 per cent of the municipal revenues come from the municipal general fund (FGM), which is mostly proportional to population. On both counts, local government revenue depends upon conditions that are objectively harmful for the environment.
In this chapter, we will focus our attention mostly on IMI and accessorily on FGM, the sources of municipal revenue that are most related with land use, and which depend only on national policies.
The municipal real estate tax has an increasingly important role in local fi nanc-ing. In 2005, IMI revenue was already about E730 million.11 At present, compu-tation of IMI for urban real estate is based on the useful area of the building, modulated by a number of coeffi cients considering use (housing, services, or industry), location (available infra-structure), quality (comfort, equipment), and age. The current formula is more objective and equitable than the old one (before 2003). However, it completely overlooks environmental issues. Treasury offi ces are updating information on urban real estate in Portugal, a process that is expected to take until about 2013 (for non-urban real estate, no systematic update has begun or is programmed). Due to information updating only, IMI revenue is expected to grow by 70 per cent in 10 years; it will probably be more due to increasing urban expansion. With the current system, this growth will benefi t essentially the densely populated coastal urban areas.
11 Reis, ‘Finanças Locais: Diagnóstico da situação actual’, Conferência no ISEG (Ministério das Finanças, 27 Janeiro de 2006).
31.15
31.16
31.17
31.18
31.19
31-Cottrell-31.indd 70331-Cottrell-31.indd 703 12/4/08 12:24:35 PM12/4/08 12:24:35 PM
Critical Issues in Environmental Taxation
704
The municipal funds are the most important national government transferences to local governments. The funds—Fundo Geral Municipal (FGM), Fundo de Base Municipal (FBM), and Fundo de Coesão Municipal (FCM) are based mostly on population, area, topography, and indicators of low development. Until 2007, no land use or environmental criteria were considered. The new local government fi nancing law, which entered into force in 2007, establishes that 5 to 10 per cent of FGM shall be distributed according to the area included in the Natura 2000 Network and protected areas (nature parks and preserves). Politically speaking, this is a clear improvement, although the amount involved is low and implemen-tation seems diffi cult, due to a number of technical problems.
D. The Ecoterra Model
The EcoTerra project focuses on the application of the concept of environmental fi scal reform to the promotion of better land use. The research and proposals developed are guided by the following general principles:
Nature conservation should not be perceived as a restriction; it has to be considered and valued by its environmental services, such as water, soil, and biodiversity conservation. Compensation of this service should not be construed
•
Table 1 Sources of local government revenue, mainland Portugal (2003)
Local government revenues E million %
Direct taxes Real estate property tax (IMI)Municipal vehicle tax (IMV)Real estate transaction tax (IMT)Local taxes
681103589268
11%2%10%4%
Indirect taxes 159 3%
Transfers from state budget
Municipal general fund (FGM)Municipal cohesion fund (FCM)Municipal base fund (FBM)European fundsServices and autonomous fundsOthers
1,36335628637199304
22%6%5%6%2%5%
Fees, duties, and penaltiesProperty revenues (rents and similar)Sale of goods and servicesSale of assetsFinancial assetsOther revenues
196115152412502204
3%2%2%7%8%2%
TOTAL 6,160 100%
Source: adapted from DGAL, <http://www.dgaa.pt/default.asp?s=12140> (October 2007).
31.20
31.21
31-Cottrell-31.indd 70431-Cottrell-31.indd 704 12/4/08 12:24:36 PM12/4/08 12:24:36 PM
Chapter 31: Ecoterra Model
705
as a payment for supposed lost income (often groundless anyway), but as a fair compensation for the public service those areas provide.
The proposed model aims to: create an economic incentive both for the land-owner and municipalities, regarding better environmental behaviour; give a sign to public opinion that the state values nature conservation and benefi ts whoever renders a public utility service in this domain; and create a fund to help fi nance nature conservation.
These economic incentives should be fi nanced by activities that, objectively, provoke environment depletion, such as urbanization of the land or intensive use of the soil, and should be balanced to guarantee an economic sustainability in the long term.
Whenever possible, existing taxes and funds should be modifi ed to comply with those aims, rather than creating new instruments (clearly, subsidies should be avoided, since they tend to be less equitable, more complex, and expensive to manage, and more liable to fraud).
In accordance with the principle of fi scal neutrality in the Environmental Fiscal Reform, overall tax and local fi nancing changes should be neutral for each group of stakeholders: government, regions, families, and companies. However, individual actors (for example, individual local governments and landowners) may be, and indeed should be, positively or negatively discriminated based on their environmental performance.
E. Data Sets and Criteria
The principles stated above can be applied with different scopes, practical criteria, and ambitions. In the present exercise, the following data and criteria were used:
The model was applied for mainland Portugal only, due to local government fi nancing differences in Azores and Madeira (mainland Portugal represents 95 per cent of the population and 97 per cent of the country’s area).
Local governments and landowners who hold Natura 2000 sites, protected areas, and/or national ecological reserve (REN) are awarded a monetary benefi t.
A new Nature Fund is proposed, specifi cally to fi nance nature conservation projects at a local level. Such a fund should be governed not as a typical state subsidy, but in close cooperation with local authorities and environmen-tal non-governmental organisations (NGOs) (nowadays, nature conservation in Portugal is severely hindered by dwindling funding from the state budget).
•
•
•
•
•
•
•
31.22
31-Cottrell-31.indd 70531-Cottrell-31.indd 705 12/4/08 12:24:36 PM12/4/08 12:24:36 PM
Critical Issues in Environmental Taxation
706
The additional money needed for the Nature Fund and the benefi ts to local governments and landowners should be fi nanced by the predicted increase in IMI revenues. The rationale for this is that urban IMI represents a tax on major environmental-consuming activities, and should therefore be ‘recycled’ into environmental protection. In this exercise, we propose that two-thirds of the predicted 70 per cent increase of IMI between 2004 and 2013 is allocated to nature-related purposes; and that 10 per cent of FGM is also allocated to nature-related purposes. Our reference year is 2003 (when the new IMI code was implemented and for which most relevant data sets are available).
The amount diverted from IMI, plus the amount already allocated to nature in FGM, is to be divided into three equal parts: local governments, landowners, and Nature Fund.
At present, no digital cartography is available for REN in most of the country, and it is thus impractical to cross-reference it with protected areas and Natura 2000. For the purpose of this exercise, those areas were simply added together, and are hereafter referred to as ‘classifi ed areas’.
Ideally, the benefi ts for classifi ed areas should be echeloned according to their intrinsic ecologic value, but that is a complex issue beyond the scope of this chapter. In this exercise we shall distribute the funds proportionally to total classifi ed area.
F. Results and Discussion
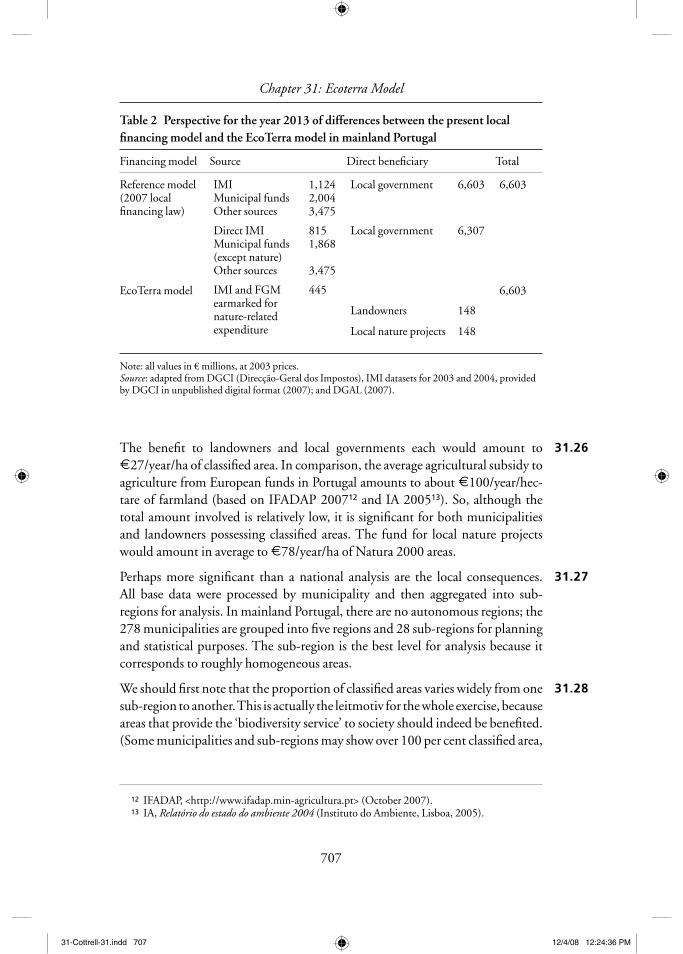
Table 2 shows a prediction, for the year 2013, of how the EcoTerra model (applied with the criteria discussed above) would change the structure of local fi nancing. We assumed that the sources of revenue other than IMI would remain constant, and that IMI revenue would increase by 70 per cent over 2003 levels.
In short, E445 million out of a total revenue of E6,603 million (6.7 per cent) would be allocated to nature-related expenditure: E148 million to local govern-ments proportionally to classifi ed areas; E148 million to landowners proportionally to classifi ed areas; and E148 million to nature conservation local projects through the Nature Fund, presumably invested locally proportionally to Natura 2000 area. (Note: minor discrepancies with other data are expected due to unresolved inconsistencies between information sources.)
Looking only at local government revenue, some local governments will receive less than before. However, taking into account that part of that money will be redistrib-uted to landowners and through local projects, it is quite probable that many more people will benefi t locally, and that will contribute to local development.
•
•
•
•
31.23
31.24
31.25
31-Cottrell-31.indd 70631-Cottrell-31.indd 706 12/4/08 12:24:36 PM12/4/08 12:24:36 PM
Chapter 31: Ecoterra Model
707
The benefi t to landowners and local governments each would amount to E27/year/ha of classifi ed area. In comparison, the average agricultural subsidy to agriculture from European funds in Portugal amounts to about E100/year/hec-tare of farmland (based on IFADAP 200712 and IA 200513). So, although the total amount involved is relatively low, it is signifi cant for both municipalities and landowners possessing classifi ed areas. The fund for local nature projects would amount in average to E78/year/ha of Natura 2000 areas.
Perhaps more signifi cant than a national analysis are the local consequences. All base data were processed by municipality and then aggregated into sub-regions for analysis. In mainland Portugal, there are no autonomous regions; the 278 municipalities are grouped into fi ve regions and 28 sub-regions for planning and statistical purposes. The sub-region is the best level for analysis because it corresponds to roughly homogeneous areas.
We should fi rst note that the proportion of classifi ed areas varies widely from one sub-region to another. This is actually the leitmotiv for the whole exercise, because areas that provide the ‘biodiversity service’ to society should indeed be benefi ted. (Some municipalities and sub-regions may show over 100 per cent classifi ed area,
12 IFADAP, <http://www.ifadap.min-agricultura.pt> (October 2007).13 IA, Relatório do estado do ambiente 2004 (Instituto do Ambiente, Lisboa, 2005).
Table 2 Perspective for the year 2013 of differences between the present local fi nancing model and the EcoTerra model in mainland Portugal
Financing model Source Direct benefi ciary Total
Reference model (2007 local fi nancing law)
IMIMunicipal funds Other sources
1,1242,0043,475
Local government 6,603 6,603
Direct IMIMunicipal funds (except nature)Other sources
8151,868
3,475
Local government 6,307
EcoTerra model IMI and FGM earmarked for nature-related expenditure
445 6,603
Landowners 148
Local nature projects 148
Note: all values in € millions, at 2003 prices.Source: adapted from DGCI (Direcção-Geral dos Impostos), IMI datasets for 2003 and 2004, provided by DGCI in unpublished digital format (2007); and DGAL (2007).
31.26
31.27
31.28
31-Cottrell-31.indd 70731-Cottrell-31.indd 707 12/4/08 12:24:36 PM12/4/08 12:24:36 PM
Critical Issues in Environmental Taxation
708
because in this simplifi ed exercise, area included both in Natura 2000 and REN was counted twice; in a real application, a fi ner analysis will be needed.)
Of course, a question then arises: what is the impact of the proposed model on the development ability of each region? We tried to answer this question by cross-ing the results of the model with selected demographic, land use, budgetary, and economic-development indicators.
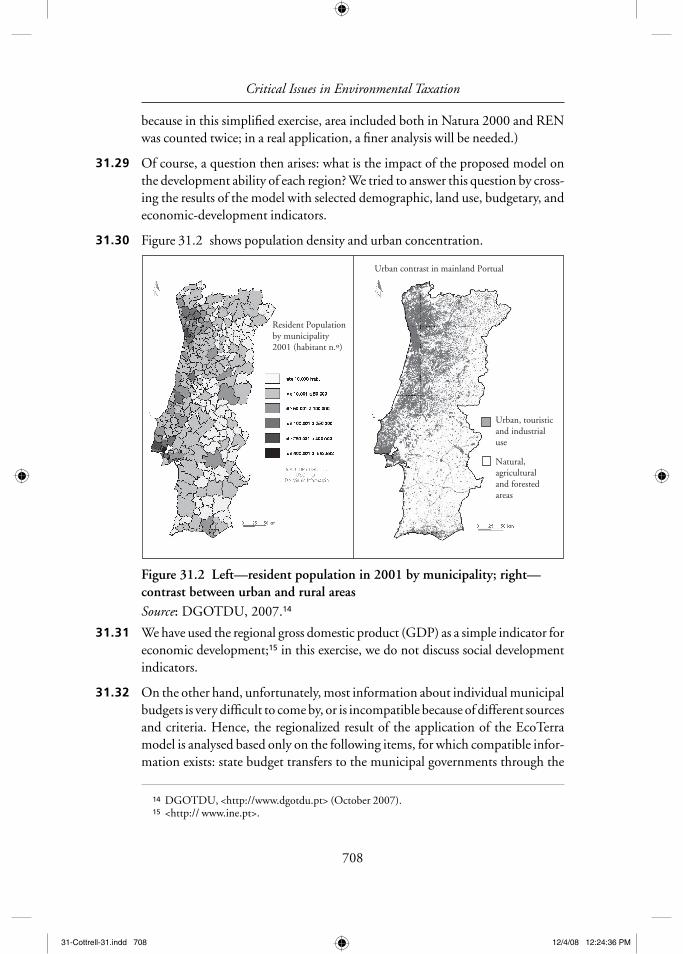
Figure 31.2 shows population density and urban concentration.
Source: DGOTDU, 2007.14
We have used the regional gross domestic product (GDP) as a simple indicator for economic development;15 in this exercise, we do not discuss social development indicators.
On the other hand, unfortunately, most information about individual municipal budgets is very diffi cult to come by, or is incompatible because of different sources and criteria. Hence, the regionalized result of the application of the EcoTerra model is analysed based only on the following items, for which compatible infor-mation exists: state budget transfers to the municipal governments through the
14 DGOTDU, <http://www.dgotdu.pt> (October 2007).15 <http:// www.ine.pt>.
Urban contrast in mainland Portual
Urban, touristicand industrialuse
Natural,agriculturaland forestedareas
Resident Populationby municipality2001 (habitant n.º)
Figure 31.2 Left—resident population in 2001 by municipality; right—contrast between urban and rural areas
31.29
31.30
31.31
31.32
31-Cottrell-31.indd 70831-Cottrell-31.indd 708 12/4/08 12:24:36 PM12/4/08 12:24:36 PM
Chapter 31: Ecoterra Model
709
municipal funds; IMI (both direct revenue and indirect revenue distributed according to the EcoTerra model); plus amounts distributed to landowners and the proposed Nature Fund, supposed to be spent locally. These items together represent 47 per cent of total municipal revenue predicted for 2013 (at 2003 prices), which we consider signifi cant enough for a preliminary analysis.
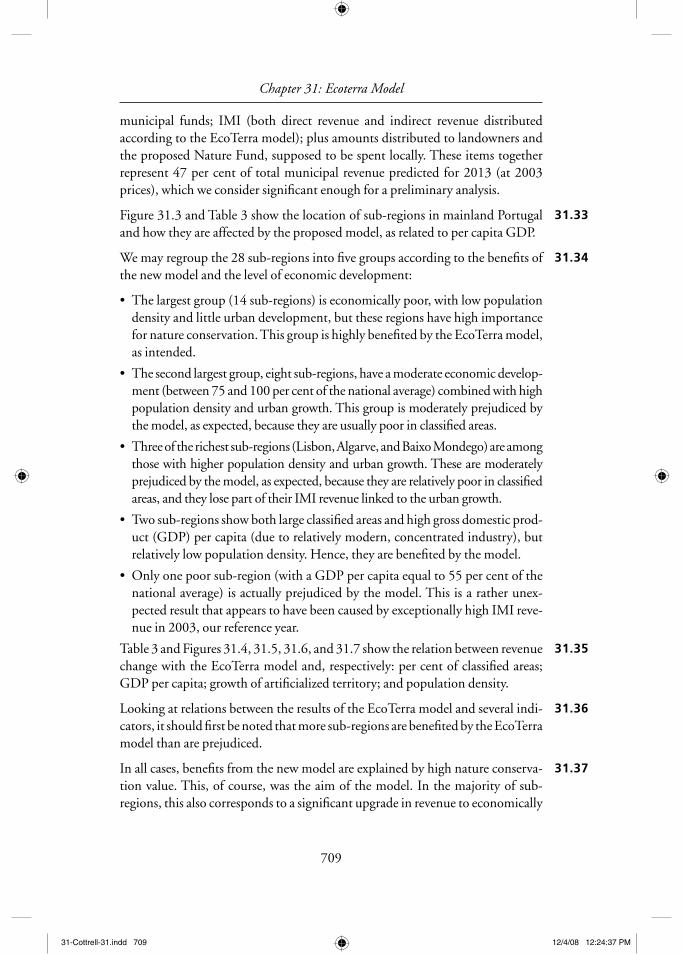
Figure 31.3 and Table 3 show the location of sub-regions in mainland Portugal and how they are affected by the proposed model, as related to per capita GDP.
We may regroup the 28 sub-regions into fi ve groups according to the benefi ts of the new model and the level of economic development:
The largest group (14 sub-regions) is economically poor, with low population density and little urban development, but these regions have high importance for nature conservation. This group is highly benefi ted by the EcoTerra model, as intended.
The second largest group, eight sub-regions, have a moderate economic develop-ment (between 75 and 100 per cent of the national average) combined with high population density and urban growth. This group is moderately prejudiced by the model, as expected, because they are usually poor in classifi ed areas.
Three of the richest sub-regions (Lisbon, Algarve, and Baixo Mondego) are among those with higher population density and urban growth. These are moderately prejudiced by the model, as expected, because they are relatively poor in classifi ed areas, and they lose part of their IMI revenue linked to the urban growth.
Two sub-regions show both large classifi ed areas and high gross domestic prod-uct (GDP) per capita (due to relatively modern, concentrated industry), but relatively low population density. Hence, they are benefi ted by the model.
Only one poor sub-region (with a GDP per capita equal to 55 per cent of the national average) is actually prejudiced by the model. This is a rather unex-pected result that appears to have been caused by exceptionally high IMI reve-nue in 2003, our reference year.
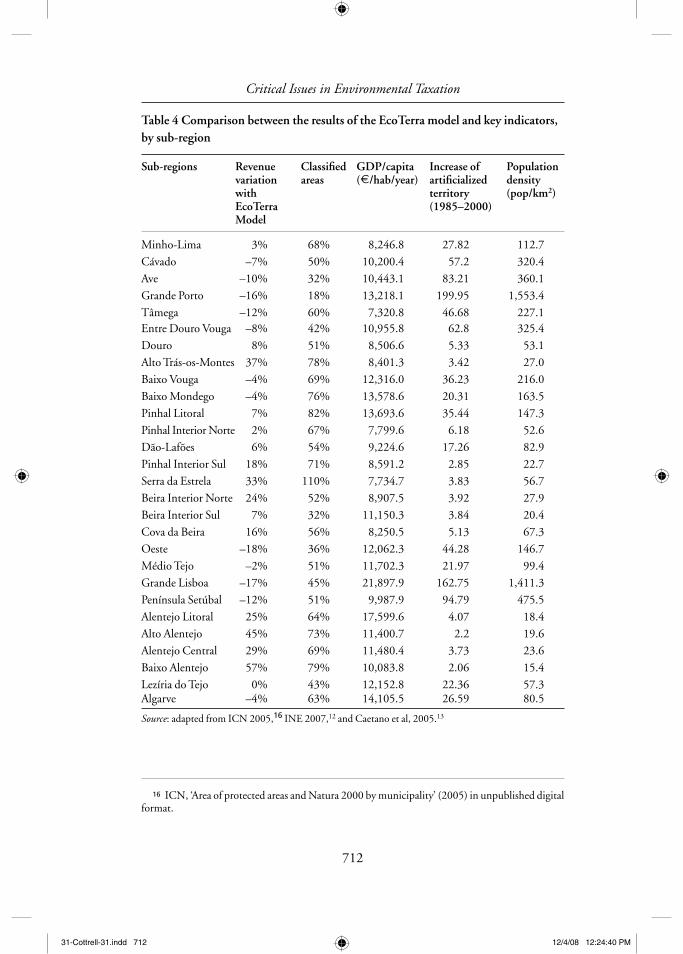
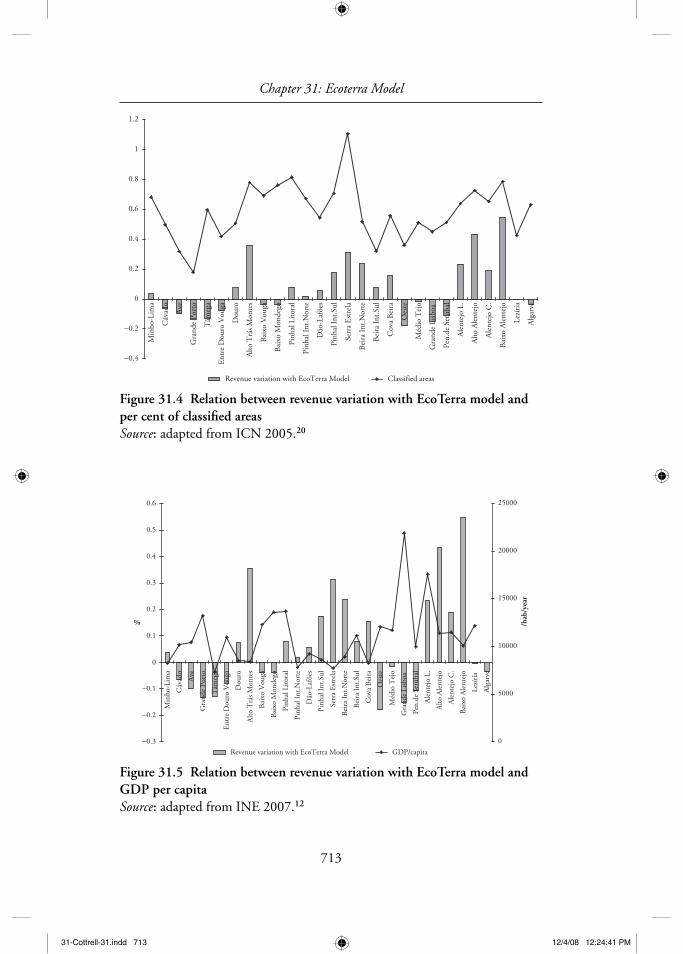
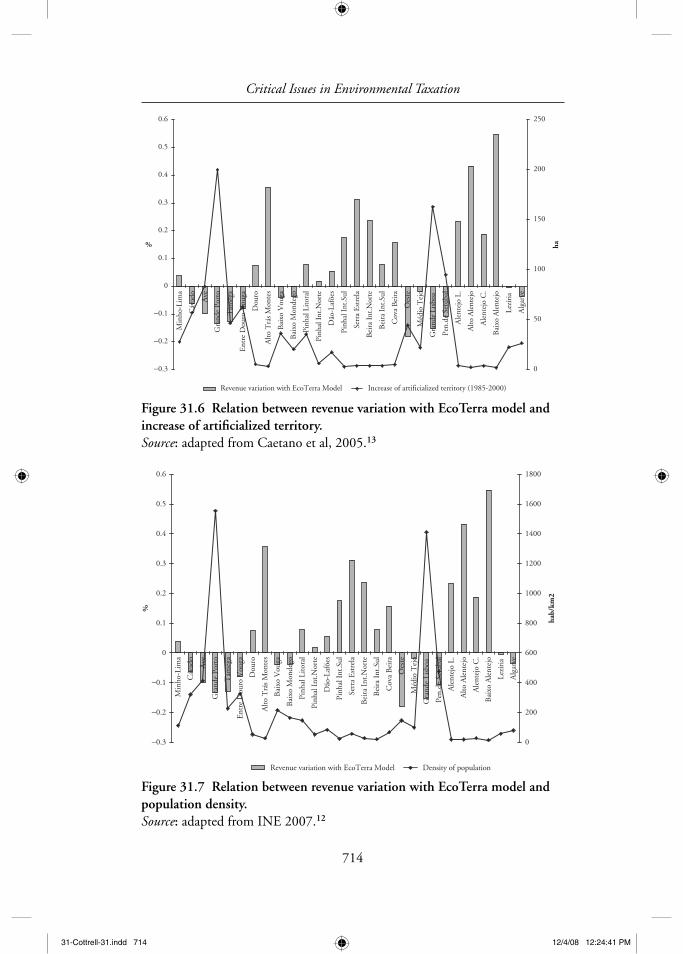
Table 3 and Figures 31.4, 31.5, 31.6, and 31.7 show the relation between revenue change with the EcoTerra model and, respectively: per cent of classifi ed areas; GDP per capita; growth of artifi cialized territory; and population density.
Looking at relations between the results of the EcoTerra model and several indi-cators, it should fi rst be noted that more sub-regions are benefi ted by the EcoTerra model than are prejudiced.
In all cases, benefi ts from the new model are explained by high nature conserva-tion value. This, of course, was the aim of the model. In the majority of sub-regions, this also corresponds to a signifi cant upgrade in revenue to economically
•
•
•
•
•
31.33
31.34
31.35
31.36
31.37
31-Cottrell-31.indd 70931-Cottrell-31.indd 709 12/4/08 12:24:37 PM12/4/08 12:24:37 PM
Critical Issues in Environmental Taxation
710
Figure 31.3 Results of application of the EcoTerra model by sub-region (adapted from DGOTDU 200719)
Legend:Sub-regions benefittedby the model
Medium/low GDP
High GDP
Sub-regions prejudicedby the model
High GDP
Medium GDP
Low GDP
Low GDP = GDP/capita < 0.75 national averageHigh GDP = GDP/capita > national average
31-Cottrell-31.indd 71031-Cottrell-31.indd 710 12/4/08 12:24:37 PM12/4/08 12:24:37 PM
manikandan.l
AU: The text was repeated twiice in MSS.It is inserted in FIgure. Is it ok? Please suggest.
manikandan.l
Legend: Sub-regions benefitted by the model Medium/low GDP High GDP Sub-regions prejudiced by the model High GDP Medium GDP Low GDP Low GDP = GDP/capita < 0.75 national average High GDP = GDP/capita > national average
Chapter 31: Ecoterra Model
711
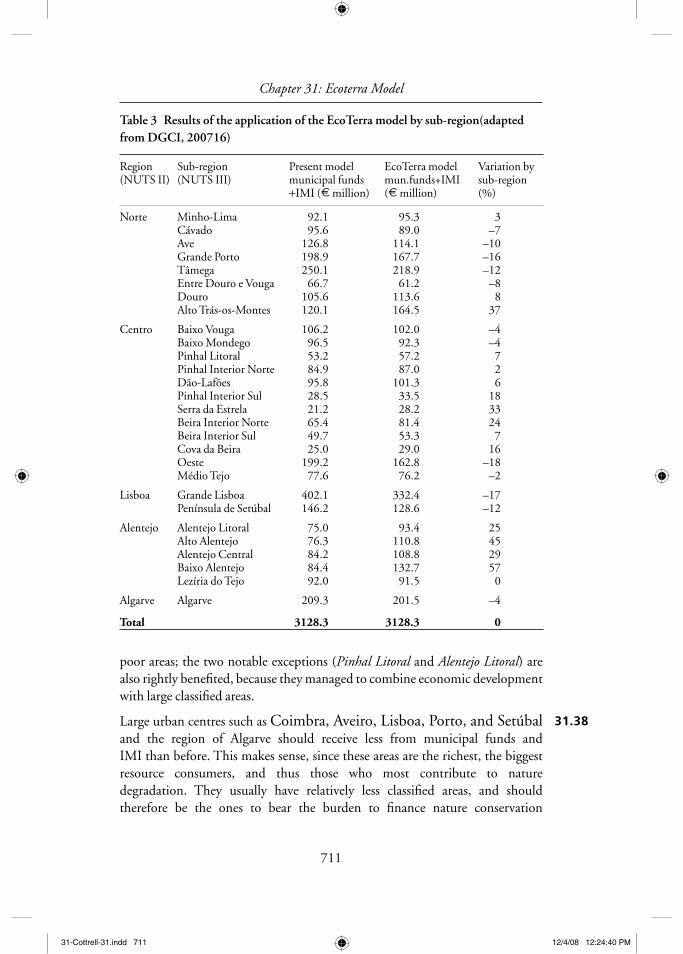
Table 3 Results of the application of the EcoTerra model by sub-region(adapted from DGCI, 200716)
Region (NUTS II)
Sub-region (NUTS III)
Present model municipal funds+IMI (E million)
EcoTerra model mun.funds+IMI (E million)
Variation by sub-region (%)
Norte Minho-LimaCávadoAveGrande PortoTâmegaEntre Douro e VougaDouroAlto Trás-os-Montes
92.195.6
126.8198.9250.166.7
105.6120.1
95.389.0
114.1167.7218.961.2
113.6164.5
3–7
–10–16–12–88
37
Centro Baixo VougaBaixo MondegoPinhal LitoralPinhal Interior NorteDão-LafõesPinhal Interior SulSerra da EstrelaBeira Interior NorteBeira Interior SulCova da BeiraOesteMédio Tejo
106.296.553.284.995.828.521.265.449.725.0
199.277.6
102.092.357.287.0
101.333.528.281.453.329.0
162.876.2
–4–4726
1833247
16–18–2
Lisboa Grande LisboaPenínsula de Setúbal
402.1146.2
332.4128.6
–17–12
Alentejo Alentejo LitoralAlto AlentejoAlentejo CentralBaixo AlentejoLezíria do Tejo
75.076.384.284.492.0
93.4110.8108.8132.791.5
254529570
Algarve Algarve 209.3 201.5 –4
Total 3128.3 3128.3 0
poor areas; the two notable exceptions (Pinhal Litoral and Alentejo Litoral) are also rightly benefi ted, because they managed to combine economic development with large classifi ed areas.
Large urban centres such as Coimbra, Aveiro, Lisboa, Porto, and Setúbal and the region of Algarve should receive less from municipal funds and IMI than before. This makes sense, since these areas are the richest, the biggest resource consumers, and thus those who most contribute to nature degradation. They usually have relatively less classifi ed areas, and should therefore be the ones to bear the burden to fi nance nature conservation
31.38
31-Cottrell-31.indd 71131-Cottrell-31.indd 711 12/4/08 12:24:40 PM12/4/08 12:24:40 PM
Critical Issues in Environmental Taxation
712
Table 4 Comparison between the results of the EcoTerra model and key indicators, by sub-region
Sub-regions Revenue variation with EcoTerra Model
Classifi ed areas
GDP/capita (E/hab/year)
Increase of artifi cialized territory (1985–2000)
Population density (pop/km2)
Minho-Lima 3% 68% 8,246.8 27.82 112.7
Cávado –7% 50% 10,200.4 57.2 320.4
Ave –10% 32% 10,443.1 83.21 360.1
Grande Porto –16% 18% 13,218.1 199.95 1,553.4
Tâmega –12% 60% 7,320.8 46.68 227.1Entre Douro Vouga –8% 42% 10,955.8 62.8 325.4
Douro 8% 51% 8,506.6 5.33 53.1
Alto Trás-os-Montes 37% 78% 8,401.3 3.42 27.0
Baixo Vouga –4% 69% 12,316.0 36.23 216.0
Baixo Mondego –4% 76% 13,578.6 20.31 163.5
Pinhal Litoral 7% 82% 13,693.6 35.44 147.3
Pinhal Interior Norte 2% 67% 7,799.6 6.18 52.6
Dão-Lafões 6% 54% 9,224.6 17.26 82.9
Pinhal Interior Sul 18% 71% 8,591.2 2.85 22.7
Serra da Estrela 33% 110% 7,734.7 3.83 56.7
Beira Interior Norte 24% 52% 8,907.5 3.92 27.9
Beira Interior Sul 7% 32% 11,150.3 3.84 20.4
Cova da Beira 16% 56% 8,250.5 5.13 67.3
Oeste –18% 36% 12,062.3 44.28 146.7
Médio Tejo –2% 51% 11,702.3 21.97 99.4
Grande Lisboa –17% 45% 21,897.9 162.75 1,411.3
Península Setúbal –12% 51% 9,987.9 94.79 475.5
Alentejo Litoral 25% 64% 17,599.6 4.07 18.4
Alto Alentejo 45% 73% 11,400.7 2.2 19.6
Alentejo Central 29% 69% 11,480.4 3.73 23.6
Baixo Alentejo 57% 79% 10,083.8 2.06 15.4
Lezíria do Tejo 0% 43% 12,152.8 22.36 57.3Algarve –4% 63% 14,105.5 26.59 80.5
Source: adapted from ICN 2005,16 INE 2007,12 and Caetano et al, 2005.13
16 ICN, ‘Area of protected areas and Natura 2000 by municipality’ (2005) in unpublished digital format.
31-Cottrell-31.indd 71231-Cottrell-31.indd 712 12/4/08 12:24:40 PM12/4/08 12:24:40 PM
Chapter 31: Ecoterra Model
713
−0.4
−0.2
0
0.2
0.4
0.6
0.8
1
1.2
Min
ho-L
ima
Cáv
ado
Ave
Gra
nde
Port
o
Tâm
ega
Ent
re D
ouro
Vou
ga
Dou
ro
Alto
Trá
s M
onte
s
Bai
xo V
ouga
Bai
xo M
onde
go
Pinh
al L
itor
al
Pinh
al I
nt.N
orte
Dão
-Laf
ões
Pinh
al I
nt.S
ul
Serr
a E
stre
la
Bei
ra I
nt.N
orte
Bei
ra I
nt.S
ul
Cov
a B
eira
Oes
te
Méd
io T
ejo
Gra
nde
Lisb
oa
Pen.
de S
etúb
al
Ale
ntej
o L.
Alto
Ale
ntej
o
Ale
ntej
o C
.
Bai
xo A
lent
ejo
Lezí
ria
Alg
arve
Revenue variation with EcoTerra Model Classified areas
Figure 31.4 Relation between revenue variation with EcoTerra model and per cent of classifi ed areasSource: adapted from ICN 2005.20
−0.3
−0.2
−0.1
0
0.1
0.2
0.3
0.4
0.5
0.6
Min
ho-L
ima
Cáv
ado
Ave
Gra
nde
Port
o
Tâm
ega
Ent
re D
ouro
Vou
ga
Dou
ro
Alto
Trá
s M
onte
s
Bai
xo V
ouga
Bai
xo M
onde
go
Pinh
al L
itor
al
Pinh
al I
nt.N
orte
Dão
-Laf
ões
Pinh
al I
nt.S
ul
Serr
a E
stre
la
Bei
ra I
nt.N
orte
Bei
ra I
nt.S
ul
Cov
a B
eira
Oes
te
Méd
io T
ejo
Gra
nde
Lisb
oa
Pen.
de S
etúb
al
Ale
ntej
o L.
Alto
Ale
ntej
o
Ale
ntej
o C
.
Bai
xo A
lent
ejo
Lezí
ria
Alg
arve
%
0
5000
10000
15000
20000
25000
/hab
/yea
r
Revenue variation with EcoTerra Model GDP/capita
Figure 31.5 Relation between revenue variation with EcoTerra model and GDP per capitaSource: adapted from INE 2007.12
31-Cottrell-31.indd 71331-Cottrell-31.indd 713 12/4/08 12:24:41 PM12/4/08 12:24:41 PM
Critical Issues in Environmental Taxation
714
−0.3
−0.2
−0.1
0
0.1
0.2
0.3
0.4
0.5
0.6
Min
ho-L
ima
Cáv
ado
Ave
Gra
nde
Port
o
Tâm
ega
Ent
re D
ouro
Vou
ga
Dou
ro
Alto
Trá
s M
onte
s
Bai
xo V
ouga
Bai
xo M
onde
go
Pinh
al L
itor
al
Pinh
al I
nt.N
orte
Dão
-Laf
ões
Pinh
al I
nt.S
ul
Serr
a E
stre
la
Bei
ra I
nt.N
orte
Bei
ra I
nt.S
ul
Cov
a B
eira
Oes
te
Méd
io T
ejo
Gra
nde
Lisb
oa
Pen.
de S
etúb
al
Ale
ntej
o L.
Alto
Ale
ntej
o
Ale
ntej
o C
.
Bai
xo A
lent
ejo
Lezí
ria
Alg
arve
%
0
50
100
150
200
250
ha
Revenue variation with EcoTerra Model Increase of artificialized territory (1985-2000)
−0.3
−0.2
−0.1
0
0.1
0.2
0.3
0.4
0.5
0.6
Min
ho-L
ima
Cáv
ado
Ave
Gra
nde
Port
o
Tâm
ega
Ent
re D
ouro
Vou
ga
Dou
ro
Alto
Trá
s M
onte
s
Bai
xo V
ouga
Bai
xo M
onde
go
Pinh
al L
itor
al
Pinh
al I
nt.N
orte
Dão
-Laf
ões
Pinh
al I
nt.S
ul
Serr
a E
stre
la
Bei
ra I
nt.N
orte
Bei
ra I
nt.S
ul
Cov
a B
eira
Oes
te
Méd
io T
ejo
Gra
nde
Lisb
oa
Pen.
de S
etúb
al
Ale
ntej
o L.
Alto
Ale
ntej
o
Ale
ntej
o C
.
Bai
xo A
lent
ejo
Lezí
ria
Alg
arve
%
0
200
400
600
800
1000
1200
1400
1600
1800
hab/
km2
Revenue variation with EcoTerra Model Density of population
Figure 31.6 Relation between revenue variation with EcoTerra model and increase of artifi cialized territory.Source: adapted from Caetano et al, 2005.13
Figure 31.7 Relation between revenue variation with EcoTerra model and population density.Source: adapted from INE 2007.12
31-Cottrell-31.indd 71431-Cottrell-31.indd 714 12/4/08 12:24:41 PM12/4/08 12:24:41 PM
Chapter 31: Ecoterra Model
715
in less developed regions. Moreover, because other fi nancing sources (such as IMT, direct taxes, urbanization fees, and participation in national taxes) are higher in richer sub-regions, actual budget implications should be lower then predicted in this exercise.
Exceptions to the general pattern discussed above, notably the Tâmega sub-region, should merit closer scrutiny in further research. The fi rst step will be to study the actual evolution of IMI, for which data is expected to be available shortly.
G. Conclusion
The exercise performed in this chapter proves the feasibility of a concept: tax col-lection can have policy aims, and nature conservation can be funded by taxes based on environment-consuming activities. The fi nancial resources exist, and relatively minor changes in existing instruments can do the job.
Public opinion is bound to be open to the idea, because most citizens, companies, and municipalities stand to gain with the proposed model.
Regarding regional development, the proposed scheme seems to be quite posi-tive: urban and economically strong regions receive marginally less revenue from a growing real estate property tax, while under-developed, nature-rich regions are signifi cantly benefi ted. Both receive an incentive to continue or begin environmentally friendly land-use policies.
The things that are missing are better information systems that allow for easier cross-reference of land use, planning and taxation information, and political will. This may stem from either an advanced concept of tax and environmental policy by the government, or by public opinion pressure.
31.39
31.40
31.41
31.42
31.43
31-Cottrell-31.indd 71531-Cottrell-31.indd 715 12/4/08 12:24:41 PM12/4/08 12:24:41 PM

31-Cottrell-31.indd 71631-Cottrell-31.indd 716 12/4/08 12:24:42 PM12/4/08 12:24:42 PM
Related Documents