1 Ecosystem Ecology 1. Overview of material and energy flows in ecosystems 2. Primary production 3. Secondary production and trophic efficiency 4. Ecological Pyramids 5. Nutrient cycling Trophic levels–energy flow through ecosystems • Autotrophs : primary producers • Heterotrophs : consumers • Primary, secondary, tertiary • Decomposers • Food webs depict complex relationships: omnivores? Many cross trophic levels Figure 54.1 Examples of terrestrial and marine food chains Figure 54.2 A food web Productivity and energy • Production is the amount of energy stored by a trophic level (kilocalories/sq meter). Productivity is a rate. • Gross productivity: amount of energy taken in by photosynthesis or by consuming the bodies of other orgs. • Net primary productivity : amount of energy left after losses due to autotrophic respiration are taken into account. Available to heterotrophs (next trophic level) • Primary productivity is a measure of how much energy an ecosystem has to work with. • Net community productivity is net primary minus heterotroph respiration. Figure 54.4 Primary production in different ecosystems. Notice that contribution to worldwide primary production (c) is a function of both geographic extent (a) and production per area (b).

Welcome message from author
This document is posted to help you gain knowledge. Please leave a comment to let me know what you think about it! Share it to your friends and learn new things together.
Transcript
1
Ecosystem Ecology
1. Overview of material and energy flows in ecosystems
2. Primary production
3. Secondary production and trophic efficiency
4. Ecological Pyramids
5. Nutrient cycling
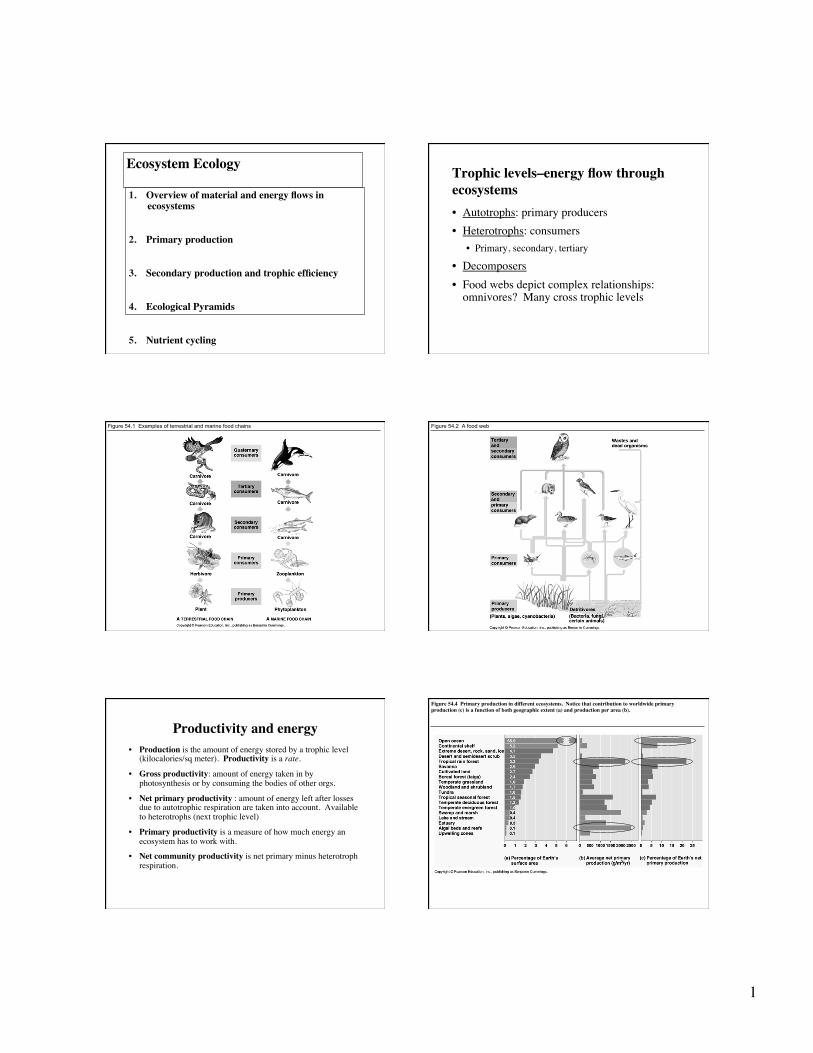
Trophic levels–energy flow through ecosystems • Autotrophs: primary producers • Heterotrophs: consumers
• Primary, secondary, tertiary
• Decomposers • Food webs depict complex relationships:
omnivores? Many cross trophic levels
Figure 54.1 Examples of terrestrial and marine food chains Figure 54.2 A food web
Productivity and energy • Production is the amount of energy stored by a trophic level
(kilocalories/sq meter). Productivity is a rate.
• Gross productivity: amount of energy taken in by photosynthesis or by consuming the bodies of other orgs.
• Net primary productivity : amount of energy left after losses due to autotrophic respiration are taken into account. Available to heterotrophs (next trophic level)
• Primary productivity is a measure of how much energy an ecosystem has to work with.
• Net community productivity is net primary minus heterotroph respiration.
Figure 54.4 Primary production in different ecosystems. Notice that contribution to worldwide primary production (c) is a function of both geographic extent (a) and production per area (b).�
2
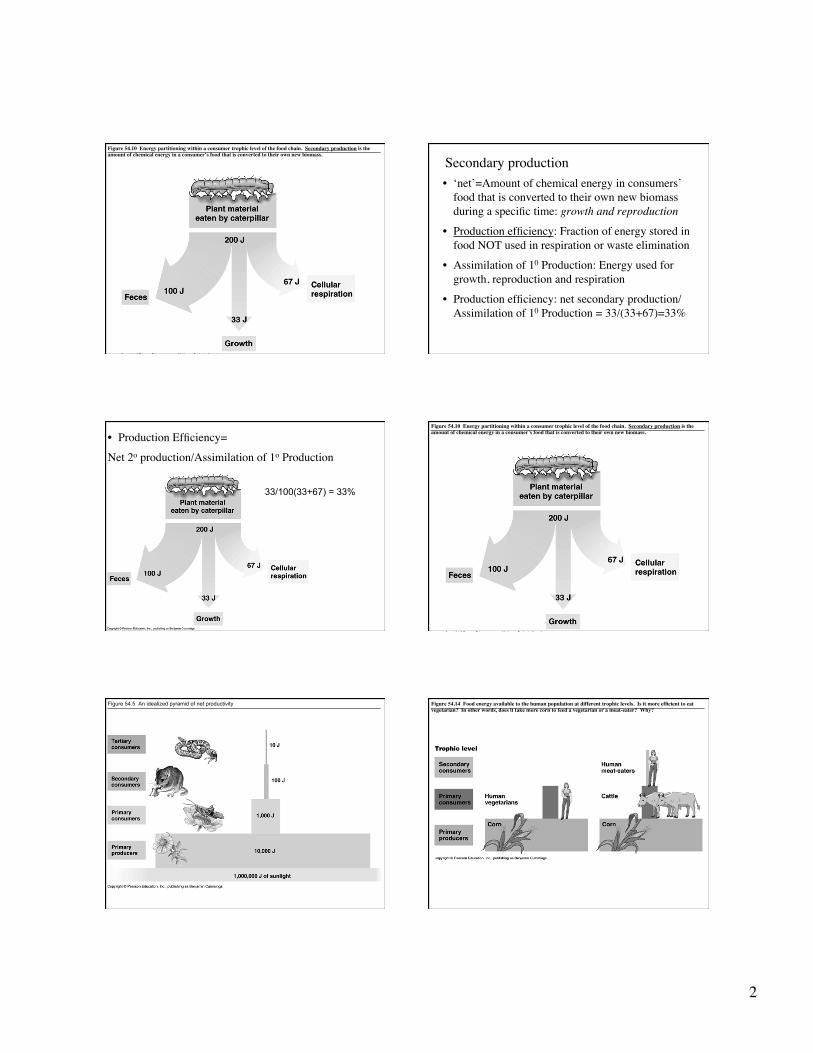
Figure 54.10 Energy partitioning within a consumer trophic level of the food chain. Secondary production is the amount of chemical energy in a consumer’s food that is converted to their own new biomass.
Secondary production • ‘net’=Amount of chemical energy in consumers’
food that is converted to their own new biomass during a specific time: growth and reproduction
• Production efficiency: Fraction of energy stored in food NOT used in respiration or waste elimination
• Assimilation of 10 Production: Energy used for growth, reproduction and respiration
• Production efficiency: net secondary production/Assimilation of 10 Production = 33/(33+67)=33%
• Production Efficiency=
Net 2o production/Assimilation of 1o Production
33/100(33+67) = 33%
Figure 54.10 Energy partitioning within a consumer trophic level of the food chain. Secondary production is the amount of chemical energy in a consumer’s food that is converted to their own new biomass.
Figure 54.5 An idealized pyramid of net productivity Figure 54.14 Food energy available to the human population at different trophic levels. Is it more efficient to eat vegetarian? In other words, does it take more corn to feed a vegetarian or a meat-eater? Why?

3
Ecological pyramids
• # individuals. Often first level is largest, but not always. Note that secondary carnivores are almost always less numerous.
• Biomass: usually greatest at the bottom level: plants can store organic matter better than heterotrophs.
• Energy: 10% transferred at each level. 90% of energy eaten in food by consumers is not stored as body structures (as in trees), but is lost in waste or used in maintaining the animal (eg lost in respiration). All that they do requires energy.
Figure 54.13 A pyramid of numbers. Not only is energy lost at each level, but organisms usually must be larger than the food items that they are eating. Hence, a steep decline in numbers of organisms along the food chain.
Figure 54.12 Pyramids of biomass (standing crop), unlike pyramids of production, can sometimes be inverted (see b below), for example if primary consumers eat the producers very fast.
This raises the question: Why are all ecosystems not like the English Channel? In other words, why is the world green?
Why is the world green?
Why is the world green? Plant defenses (the world is prickly and it tastes bad) Limits to herbivores: predators parasites diseases abiotic factors nutrient requirements
Chemical cycling
Elements accumulate in three major places • In the bodies of living organisms
• In exchange pools: readily available water soluble reserves of a mineral nutrient, such as nitrates in soil water easily taken up by plants
• Reservoirs: harder to get to places such as air, bones of animals, shells etc.

4
Productivity and energy • Production is the amount of energy stored by a trophic level
(kilocalories/sq meter). Productivity is a rate.
• Gross productivity: amount of energy taken in by photosynthesis or by consuming the bodies of other orgs.
• Net productivity : amount of energy left after losses due to respiration are taken into account.
• Primary productivity is a measure of how much energy an ecosystem has to work with.
• Net community productivity is net primary minus heterotroph respiration.
Figure 54.8 A general model of nutrient cycling
Figure 54.9 The water cycle Figure 54.17 The carbon cycle. Remember: burning of fossil fuels and wood is creating a net addition of CO2 to the atmosphere each year.
Fossilization
Carbon Cycle
• Global scale • Balance of respiration releasing C02 into atmosphere
and photosynthetic assimilation of C and release of 02
• Historically: net sequestration of C in fossils • Since industrial revolution: net release of CO2 from
burning fossil fuels
Figure 54.10 The carbon cycle

5
Figure 54.17 The nitrogen cycle. Notice the long-term importance of nitrogen-fixing bacteria. However, keep in mind that most nitrogen cycling takes place locally among organisms, soil, and water, via decomposition and reassimilation.
Nitrogen Cycle
• Animals can only use nitrogen from organic compounds, plants mainly use NO3- and can’t use N2
• Bacteria important in releasing N from detritus, converting to NH4+, NO2- to more usable forms
• Short term: local cycles in soil dominate
• Long term: N2 fixation from atmosphere (global)
Nitrates (NO3-) are a significant component of smog, and some nitrate is deposited onto the soil in polluted areas. Serpentine soils provide a refuge for native plants adapted to their lack of nutrients, like these plants on Coyote Ridge.
What do you think will happen (and already has started to happen) to these native plant refuges as San Jose expands south into Coyote Valley? Figure 54.17 The phosphorous cycle is simpler than the nitrogen and carbon cycles, in that phosphorus has no
gaseous form and occurs in only one inorganic form (the phosphate ion). As with nitrogen, most phosphorus cycling is quite local.

6
Phosphorous Cycle
• Mostly local: soil particles bind phosphates
• Only one significant chemical form, no gaseous state
• Weathering of rocks
• In ocean it accumulates in sediments and makes it back to land through geologic processes
Some of the best long-term thorough studies of nutrient cycling in ecosystems are taking place at Hubbard Brook Experimental Forest in New Hampshire. Concrete dams (left) were constructed to help measure water and nutrient runoff from watersheds. Watersheds were logged at different intensities (right) to understand the impact of forest trees on nutrient cycling.
Figure 54.19 Nutrient cycling in the Hubbard Brook Experimental Forest: an example of long-term ecological research�
Related Documents