Ecosystem Changes to the Bay-Delta Estuary: A Technical Assessment of Available Scientific Information State Water Resources Control Board Phase II Comprehensive Review of the Bay-Delta Plan Workshop 1: Ecosystem Changes and Low-Salinity Zone September 6, 2012 Submitted by: State Water Contractors, Inc. San Luis & Delta-Mendota Water Authority

Welcome message from author
This document is posted to help you gain knowledge. Please leave a comment to let me know what you think about it! Share it to your friends and learn new things together.
Transcript

Ecosystem Changes to the Bay-DeltaEstuary: A Technical Assessment ofAvailable Scientific Information
State Water Resources Control Board
Phase II Comprehensive Review of the Bay-Delta Plan
Workshop 1: Ecosystem Changes and Low-Salinity Zone
September 6, 2012
Submitted by: State Water Contractors, Inc.
San Luis & Delta-Mendota Water Authority

Bay-Delta Model?
Flow
X2/LSZ
?
More Fish
“Although increases in quantityof habitat may contribute, the
mechanism chiefly responsiblefor the X2 relationship for longfin
smelt remains unknown.”
Kimmerer (2009)
2


Investigating Ecosystem Changes
• Physical
• Biological
• Chemical
5
Delta outflow
ExportsConsumptive use
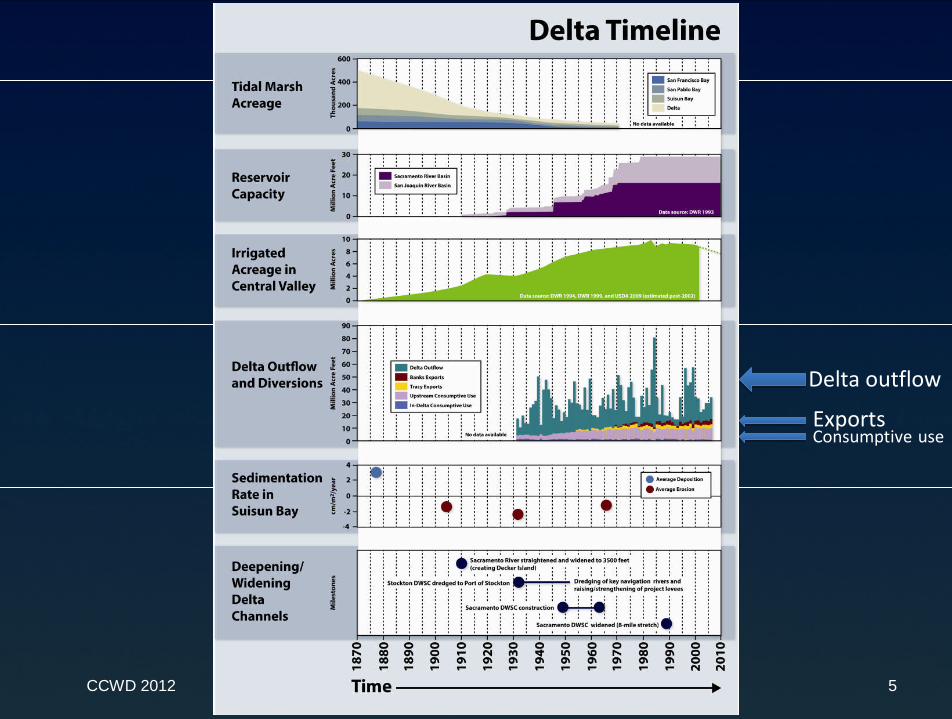
CCWD 2012

Changes inBay-DeltaPhysical LandscapeOver Time
Source: San Francisco Estuary Institute, 2012
Early 1800’s
Late 1990’s
6
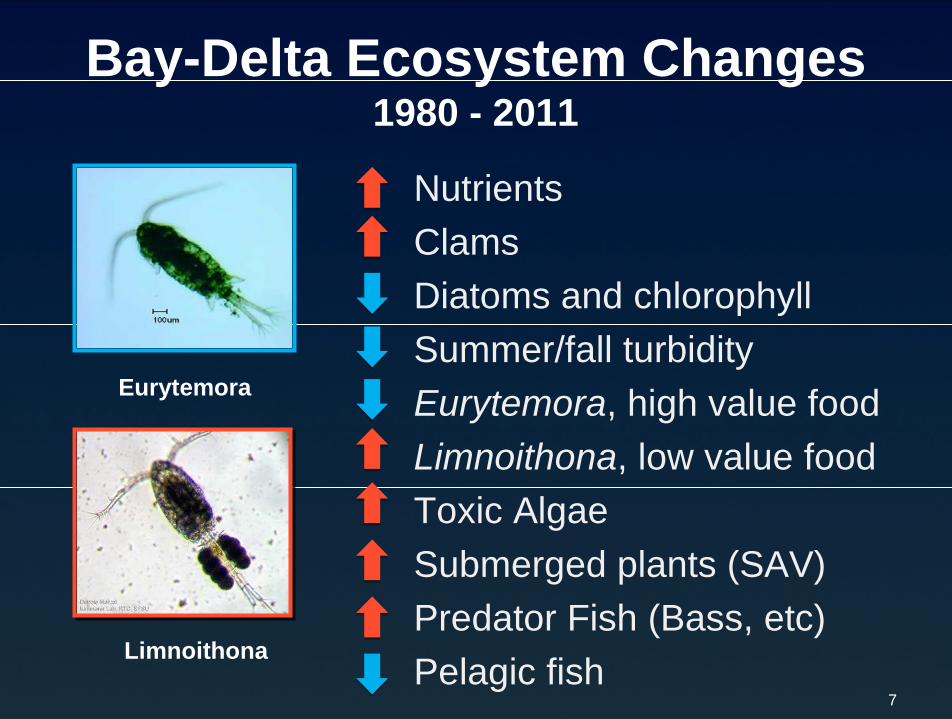
Bay-Delta Ecosystem Changes1980 - 2011
Nutrients
Clams
Diatoms and chlorophyll
Summer/fall turbidity
Eurytemora, high value food
Limnoithona, low value food
Toxic Algae
Submerged plants (SAV)
Predator Fish (Bass, etc)
Pelagic fish
Eurytemora
Limnoithona
7

Corbula and DiatomsSuisun Bay 1975 - 2011
Corbula amurensis(Overbite clam)
8

Limnoithona andEurytemora
Suisun Bay 19751975 -- 20112011Eurytemora Limnoithona
9
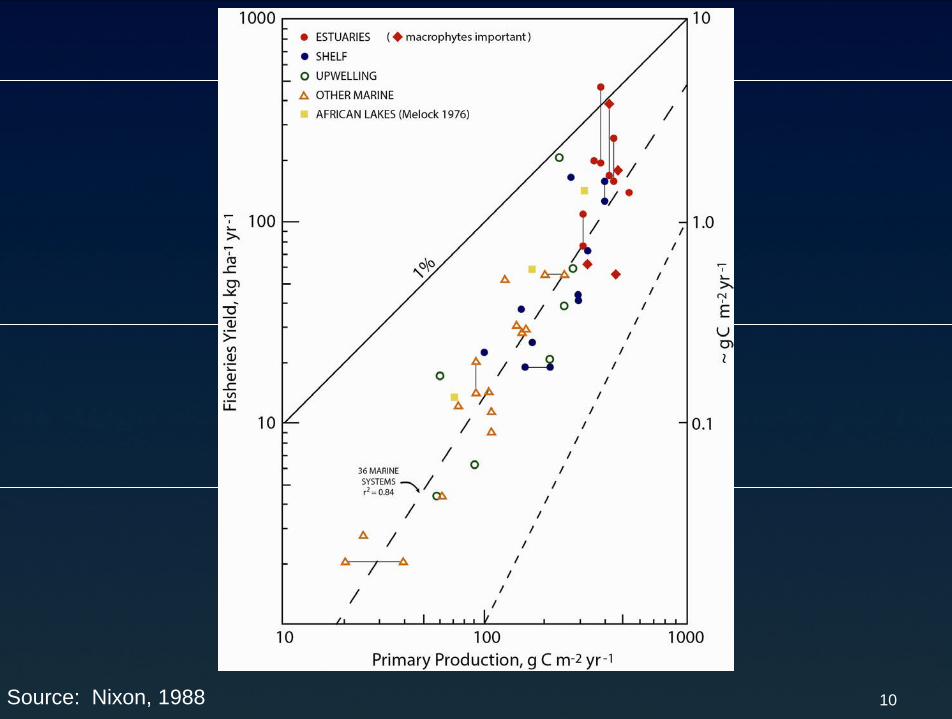
Source: Nixon, 1988 10

Centrarchid Predator Index andDelta Smelt Fall Abundance
1975 - 2011
11
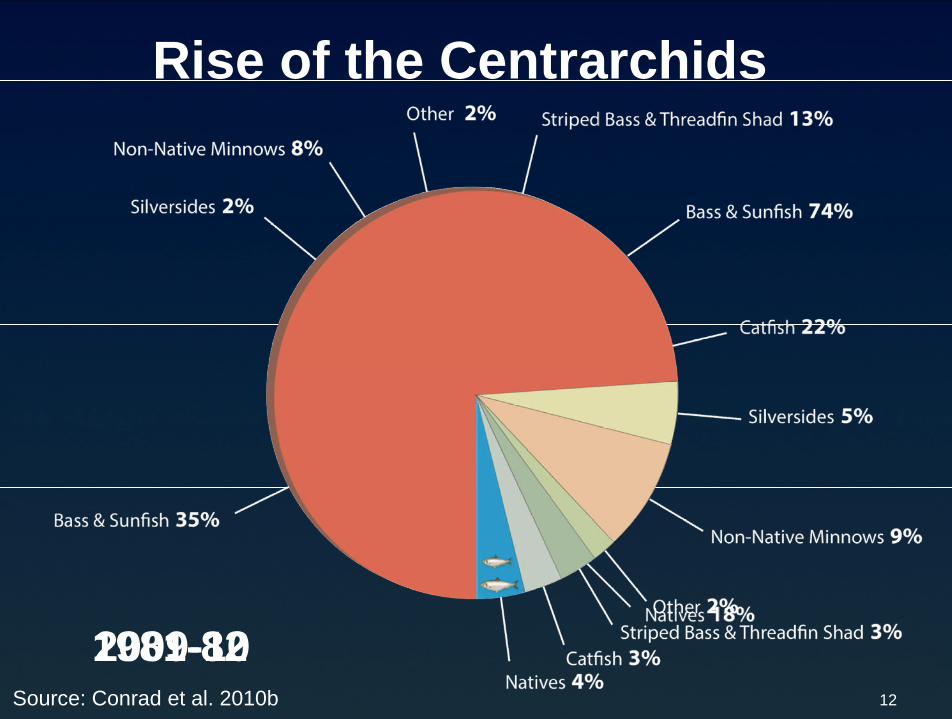
Rise of the Centrarchids
1981-822009-10Source: Conrad et al. 2010b 12

Possible Ecosystem Stressors
• Food web
• Physical landscape
• Water Temperature
• Turbidity
• Flows and diversions
13

Speakers and Topics
David Fullerton - Overview
Dr. Paul Hutton - Historical Flows
Sheila Greene - Natural Flow Functions
Dr. Chuck Hanson - Habitat & Invasives
Dr. Pat Glibert - Nutrients & the Food Web
14

Flow & Salinity Time Trendsin Perspective
• Unimpaired flow ≠ Natural flow
• Climate must be accounted for whenevaluating time trends
• CVP-SWP operation is NOT the primarydriver of change between the two mostrecent decades
15

Unimpaired ≠ Natural
• Unimpaired flow is a calculation
• Unimpaired flow calculations are NOTgood approximations for natural conditions
– Levees
– Channelization and dredging
• Early 20th Century conditions ≠ natural conditions
16

ClimateMeasured by Eight River Index
Data Sources: CDEC and Dept. of Public Works (1923) Flow in California Streams17

Annual Delta Outflow
Data Sources: DAYFLOW (Water Years 1930-2010) and DWR Bay-Delta Office(Water Years 1922-1929)
18
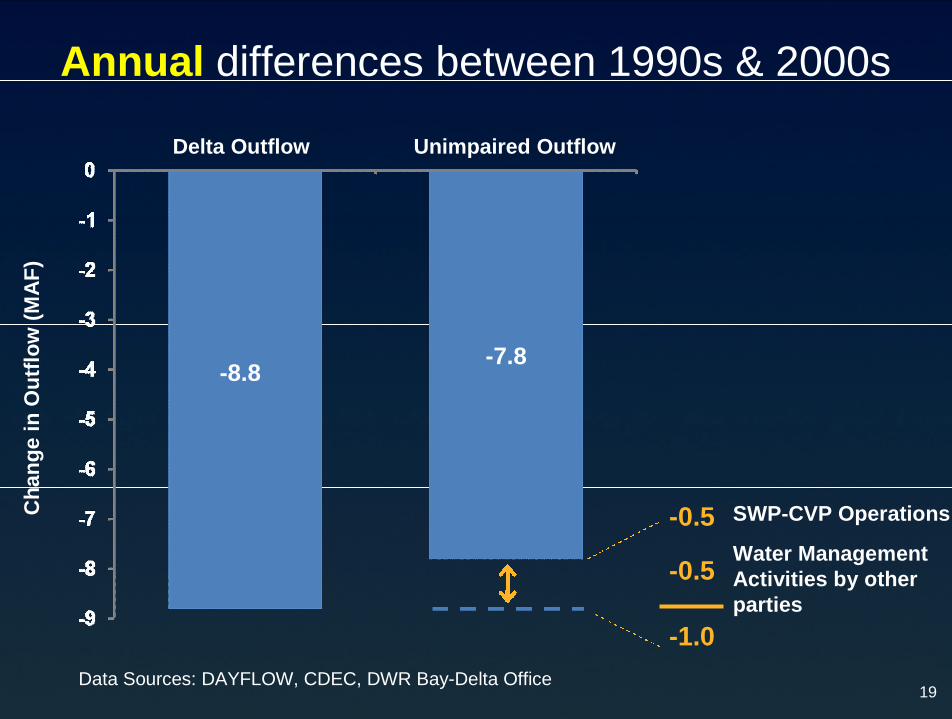
-0.5
Annual differences between 1990s & 2000s
Data Sources: DAYFLOW, CDEC, DWR Bay-Delta Office
Delta Outflow Unimpaired Outflow
SWP-CVP Operations
Water ManagementActivities by otherparties
19
-8.8-7.8
-0.5
-1.0
Ch
an
ge
inO
utf
low
(MA
F)

Fall X2 Position
Data Source: X2 position calculated from monthly flow using K-M equation (Jassby et. al. 1995)
September
October
20

-68
Data Sources: DAYFLOW, CDEC, DWR Bay-Delta Office
Delta Outflow Unimpaired Outflow
SWP-CVP Operations
Water ManagementActivities by otherparties
21
-171
- 4
-72
Ch
an
ge
inO
utf
low
(TA
F)
September differences between 1990s & 2000s
-99
-126
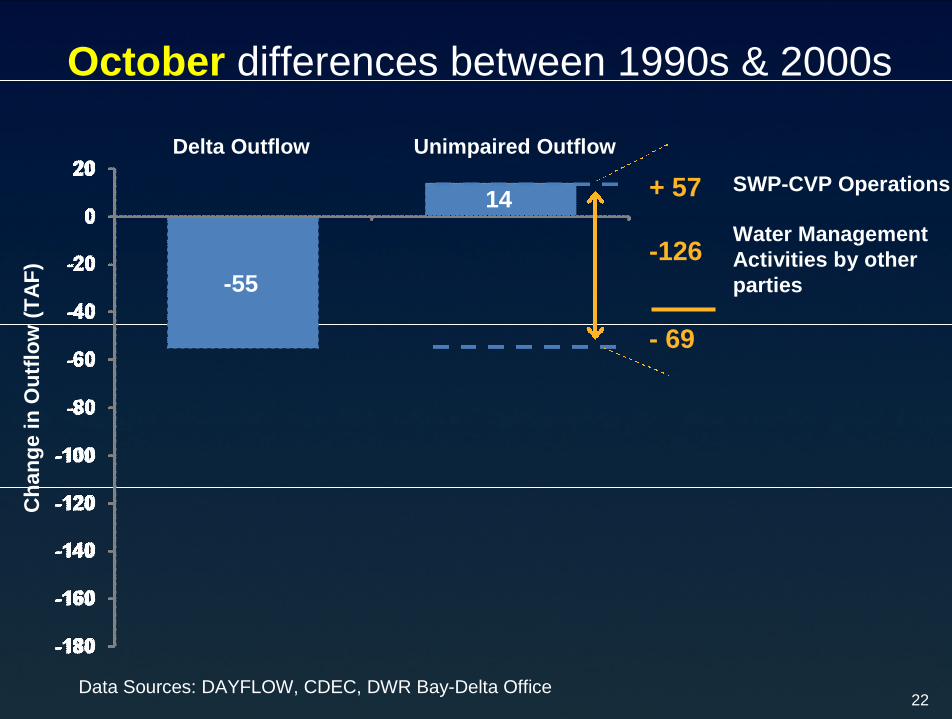
Data Sources: DAYFLOW, CDEC, DWR Bay-Delta Office
Delta Outflow Unimpaired Outflow
SWP-CVP Operations
Water ManagementActivities by otherparties
22
-55
+ 57
- 69
Ch
an
ge
inO
utf
low
(TA
F)
14
October differences between 1990s & 2000s


“Natural Flow” Approach isUncertain In Highly Altered System
“Can reestablishing the natural flow regimeserve as a useful management andrestoration goal? We believe that it can,
although to varying degrees, depending onthe present extent of human interventionand flow alteration affecting a particularriver.”
Poff et al. (1997)
24
“Natural Flow” Approach isUncertain In Highly Altered System
The advice from aquatic ecologists onenvironmental flows might be regarded at
this point in time “as largely untestedhypotheses about the flows that aquaticorganisms need and how rivers functionin relation to flow regime.”
Bunn and Arthington (2002)
25

Fluvial and Estuarine Systems DifferCharacteristic Rivers Estuaries
Body of pertinentliterature
Large Small
Understanding of floweffects
Limited Very limited
Biota Limited diversity More diverse
Ecological interactions Less complicated Much more complicated
Water masses Fresh only Fresh and salt
Flow direction Unidirectional Reversing
Antecedent effects Moderate Potentially very important
Pollutant flushing Rainfall runoff Rainfall runoff and tidal flows
Water Quality changes Downstream of sourceBoth upstream and downstream of
source
Depth determined in Flow Primarily tides
Flow cross section determined by: Sedimentary regimeSedimentary regime, flocculation,
littoral drift
Nutrient levels Richer Poorer
Source: Adapted from Pierson et al. 2002

Characteristic Rivers Estuaries
Body of pertinent literature Large Small
Understanding of flow effects Limited Very limited
Source: Adapted from Pierson et al. 2002
Fluvial and Estuarine Systems Differ
28

“Natural Flow” Approach isUncertain In Highly Altered System
Conservation/ Restoration of:
29

Uncertainty in the Bay Delta System
30
Changes in reservoir releases cannot:
• Restore habitat complexity
• Supply depositional materials
• Restore widespread seasonal
floodplain inundation
• Restore natural nutrient balance
• Decrease Delta water temperature

Proposed management of the
LSZ at 60 – 74 km
31
Without citation, and unsupported /inconclusive within the scientific literature:
•No citation provided
•No correlation between flow and phytoplankton inSuisun Complex after the clam (Alpine/Jassby 1992, Kimmerer2002)
•No correlation between X2 and Delta smelt abundanceor summer distribution (Kimmerer 2002, Nobriga et al, 2008)
•Delta smelt distribution shifted to more northerly andfresher location; Cache Slough Complex (Sommer et al 2011)

Proposed management of the
LSZ at 60 – 74 km
32
USEPA conceded:
“There are large scale declines over timein the abundance of species, especiallypelagic species, but there is not goodinformation, and a wider range ofopinion, on the cause(s) / mechanismsleading to these declines. The role of theLSZ in these abundance declines isuncertain.”
USEPA Workshop Summary: Technical Workshop on EstuarineHabitat in the Bay Delta Estuary (2012)

Proposed management of the
LSZ at 60 – 74 km
33
Preliminary results in Brown et al., stated:
“Many of the predictions either could not beevaluated with the data available or the neededdata are not being collected. Most of thepredictions that could be addressed involvedeither the abiotic habitat components (i.e., thephysical environment) or delta smeltresponses. In general, the FLaSHinvestigation has been largelyinconclusive as of the writing of thisreport.”
Brown et al (2012)
Proposed management of the
LSZ at 60 – 74 km
34
Asserted with no exploration of the biologicalmechanisms underlying correlations.
Jassby cautioned:
“By ignoring variables other than X2 (or Qout)we could therefore be in danger of imposinginappropriate standards, either too stringent ortoo lenient. The mere fact of a correlation betweensome ecosystem property and an indicator suchas X, is therefore not sufficient grounds for usingthe indicator as a policy variable.”
Jassby 1995

Proposed management of the
LSZ at 60 – 74 km
35
Asserted with no exploration of the biologicalmechanisms underlying correlations.
Kimmerer recognised:
“These relationships to flow may be due to severalpotential mechanisms, each with its own locus andperiod of effectiveness, but no mechanism hasbeen conclusively shown to underlie the flowrelationship of any species.”
kimmerer 2002

Disconnect between the LSZ andfood and turbidity
36
Uncertain or inconclusive or sometimes contradictedin the scientific literature
•No positive correlation between flow and phytoplankton inSuisun Bay, because of the invasion of the clam and nutrientimbalance (Alpine/Cloern 1992, Kimmerer 2002).
•The FLaSH studies reported lower phytoplankton in Suisun andhigher outside Suisun, AND delta smelt growth was not related tosalinity (FLaSH 2012).
•Potential food supply in Suisun Marsh, therefore recommendedrestoring marsh habitat (Muller et al 2002)

Based on our review of the
available science:
Given the highly altered state of the Bay-Delta estuary, it is highly uncertain that
mimicking “natural” flows wouldrestore biological functions.
37

Based on our review of the
available science:
Large changes in flow made underscientific uncertainty could lead to large
adverse impacts to beneficial uses.
38

39

Changes in Bay-DeltaPhysical LandscapeOver Time
Map Source: San Francisco Estuary Institute, 2012
Early 1800’s
Dendritic Channels
Access to HighElevation Habitat forSalmonids
Seasonal Floodplains
Tidal Wetlands
Shallow Water Biodiversityin Channel Margins

Map Source: San Francisco Estuary Institute, 2012
Late 1990’s
Within Delta Diversions
Reduced Sedimentand Gravel Input
Loss of Tidal Wetlands
Lost Floodplain Access
Lost Access to HighElevation Habitat
Upstream Water Diversions
South Delta Exports
Levees and Riprap
Channelization and Dredging
Altered Hydrodynamics
Changes in Bay-DeltaPhysical LandscapeOver Time
Resultant Changes to EcosystemFunctions
• Loss of wetland habitat
• Loss of access to floodplains
• Loss of shallow-water channel margin habitat
• Reduced production of organic matter and food
42
Potential Impacts of Flow Changes
In a highly altered system…
– Unimpaired flow could result in adverse impacts
– Increased winter-spring flow may provide uncertainbenefits for some species and adversely impactothers, such as Salmonids
43

Map Source: MBK 2012:
PotentialImpactof 50%UnimpairedFlow

Effect of Rim Dams on Salmonids
• Dams block access to higher elevation habitat
– Spawning and rearing occurs in downstream reaches– Exposure of eggs to high temperatures results in
mortality
• Requires balance between flow and coldwaterpool management
• Maintaining suitable temperature is challengingin dry years
• Increased winter-spring flows may reducecoldwater pool storage in the summer– Adverse impacts winter-run Chinook salmon
45

46
Sacramento River Cross-Section
HISTORIC
47
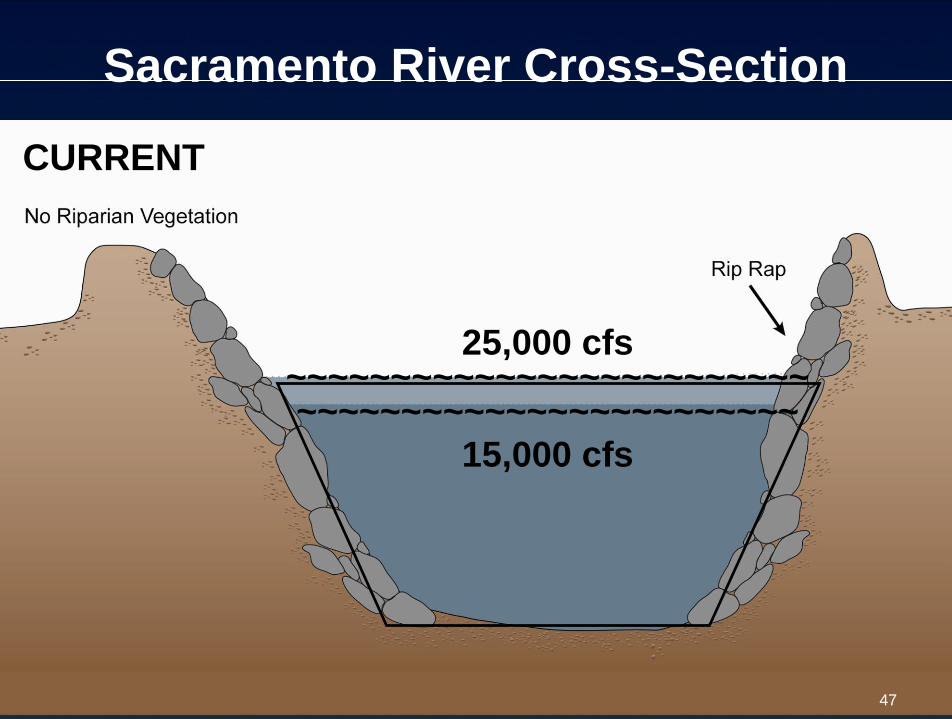
Sacramento River Cross-Section
25,000 cfs~~~~~~~~~~~~~~~~~~~~~~~~~~~~~~~~~~~~~~~~~~~~~~~~~
15,000 cfs
CURRENT
Improving Aquatic Species Functions
• Tidal wetlands– Cover, rearing, food production
• Seasonal floodplains– Spawning, rearing and connectivity
• Shallow water low velocity channel margin– Food production
48

Dealing with Uncertainty in Restoration
• Based on current research (at Liberty Island &Northwest), habitat design should be:
– Based on suitability and natural functions/processes
– Compatible with tidal and river hydrodynamics, waterquality, and natural processes such as sedimentresuspension (turbidity)
– Promote complexity such as depth, tidal currents,emergent vegetation
– Dispersed to support various species and functions
– Facilitate adaptive management
• Requires multidisciplinary collaborativemonitoring
49

Outflow and Invasive Species
• Recent study suggest without support that water exports haveproduced “waves of invertebrate invasions”
• Exotic species have changed the ecological community
• Winder et al. (2011) cite prolonged drought and increasedsalinity intrusion as dominant factors for non-nativeinvertebrate colonization
• Water operations also maintain Delta outflow and controlsalinity
• In dry years, there are dynamic interactions between salinityintrusion and water project operations
• The potential effect of water project operation on colonizationby invasive species has not been analyzed and is an untestedhypothesis 50
Key Points
• The SWB should seek to understand the physical,chemical and biological changes that have occurredin the Bay Delta Estuary
• The SWB should endeavor to understand theunderlying mechanisms stressing or the functions thatflow serves in the Bay Delta Estuary, beforeconsidering whether to dedicate more water forenvironmental purposes
• Scientific literature shows habitat restoration andnutrient regulation could produce meaningful, positivechanges to the Bay-Delta Estuary
Related Documents