Camille Ziegler Thesis for the Degree of Master of Science in Natural Sciences Plant Physiology 30 credits Department of Biological and Environmental Sciences Göteborg University Ecophysiological traits determine successional strategy in montane rainforest tree species in Rwanda

Welcome message from author
This document is posted to help you gain knowledge. Please leave a comment to let me know what you think about it! Share it to your friends and learn new things together.
Transcript

Camille Ziegler
Thesis for the Degree of Master of Science in Natural Sciences Plant Physiology
30 credits Department of Biological and Environmental Sciences
Göteborg University
Ecophysiological traits determine successional strategy in montane rainforest tree species in Rwanda

Master thesis Camille Ziegler - 2015
! ! !1!
Ecophysiological traits determine successional strategy in montane rainforest tree species in Rwanda Camille Ziegler
MSc thesis 30 credits - 2015
Under the supervision of Dr. Johan Uddling, Associate Professor
Göteborg University, Department of Biological and Environmental Sciences, AiroPlant
Abstract !Photosynthetic capacity of tree leaves is typically positively related to their nutrient content. This relationship is, however, often poorly supported for tropical trees, for which interspecific differences may be more strongly controlled by within-leaf nutrient allocation than by absolute leaf nutrient content. Tree species belonging to different successional groups differ in several ecophyisological traits related to their capacity to tolerate shade. To explore the influence of within-leaf nitrogen allocation and successional strategy regarding the photosynthetic capacity of montane rainforest tree species, we collected data on photosynthetic, chemical and morphological leaf traits of 12 tree species in Rwanda. Six species were classified as pioneers and six as climax, and all were studied in a cool, high-altitude montane rainforest (~2,500 m). Pioneer species showed a higher photosynthetic capacity and across species, interspecific variation in photosynthetic capacity was not related to total leaf nitrogen content but rather to different behaviors regarding within-leaf nitrogen allocation. The nitrogen allocated to the maximizing of photosynthetic capacities was a good predictor of photosynthetic capacities. Pioneer species showed a possible trade-off between investments into compounds related to photosynthetic capacity versus light-harvesting whereas climax species did not. We found that the carbon-gain hypothesis, defining shade-tolerance, did not apply for montane rainforest tree species and therefore more research following a trait-based approach is promising in order to better understand tropical montane carbon dynamics. !!Key!words:!Montane'rainforest','Successional'strategy','Photosynthesis','within'leaf'nitrogen'partitioning'! !

Master thesis Camille Ziegler - 2015
! ! !2!
Acknowledgments! I had been waiting for a great experience for my internship in both Sweden and Rwanda and I have to say I did not imagine it would be so enriching in several different aspects, thanks to many people I have worked with or encountered during this project. I first would like to thank my supervisor Johan Uddling Fredin for getting me interested in plant ecophysiology, giving me the opportunity to participate in such a project, supervising my work and reviewing this thesis in a very encouraging way. Many warm thanks and thoughts to Eric Mirindi Dusenge for being the best colleague and friend throughout the entire measurement campaign and beyond. Wishing you the best on your Canadian adventure. Thank you to all my co-workers from the University of Rwanda in Butare, especially Etienne Zibera, Pierre and Innocent who were central to this measuring campaign, taught me so much about the forest and with whom I shared great times of laughter. Thanks to Theresa Ibanez, Sofia Öberg and Sofie Fegerlund for those two months spent together in Rwanda and to my friends from Butare who made this experience unique. Thanks to all members of the AiroPlant research group at the Department of Biological and Environmental Sciences at the University of Gothenburg, especially Göran Wallin for sharing his experience about Rwanda, the project and for his thoughtful advice. I want to thank Brigitte Nyirambangutse and most of all Thomas Berg Hasper for taking their precious time to explain things to me, Mats Räntfors for being so kind and running the nitrogen analysis and of course Ellen Pagel, Felicien Uwizeye Karakezi, Theresa Ibanez, and Yann Cochet for the time spent sharing our workroom.
I want to thank the Department of Biology of the University of Rwanda (UR) in Butare for letting us use the laboratory, always in a friendly environment.
I also want to thank the Rwandan Agricultural Board (RAB) for welcoming us and the Rwandan Development Board (RDB) for authorizing the data collection in Nyungwe National Park.
Last but not least, I would like to thank my family and friends and all those who encouraged and followed me, even from a great distance.
! !
Master thesis Camille Ziegler - 2015
! ! !3!
Table of contents Abstract 2 Acknowledgments 3 Table of contents 4 Abbreviations 5 Introduction 6 Tropical forests 6 Shade tolerance 7 Photosynthesis 7 Carbon dynamics in tropical montane rainforests 8 Goals and hypothesizes 9 Materials and Methods 10 Study site and plant species 10 Measurements of leaf gas exchange 12 Measurements of leaf transmittance 13 Nitrogen analysis and other leaf traits 14 Modeling photosynthesis 14 Estimation of nitrogen allocation to photosynthetic functions 16 Statistical analysis 17 Results 18 Discussion 25 Conclusion 28 References 29 Appendices 32
Master thesis Camille Ziegler - 2015
! ! !4!
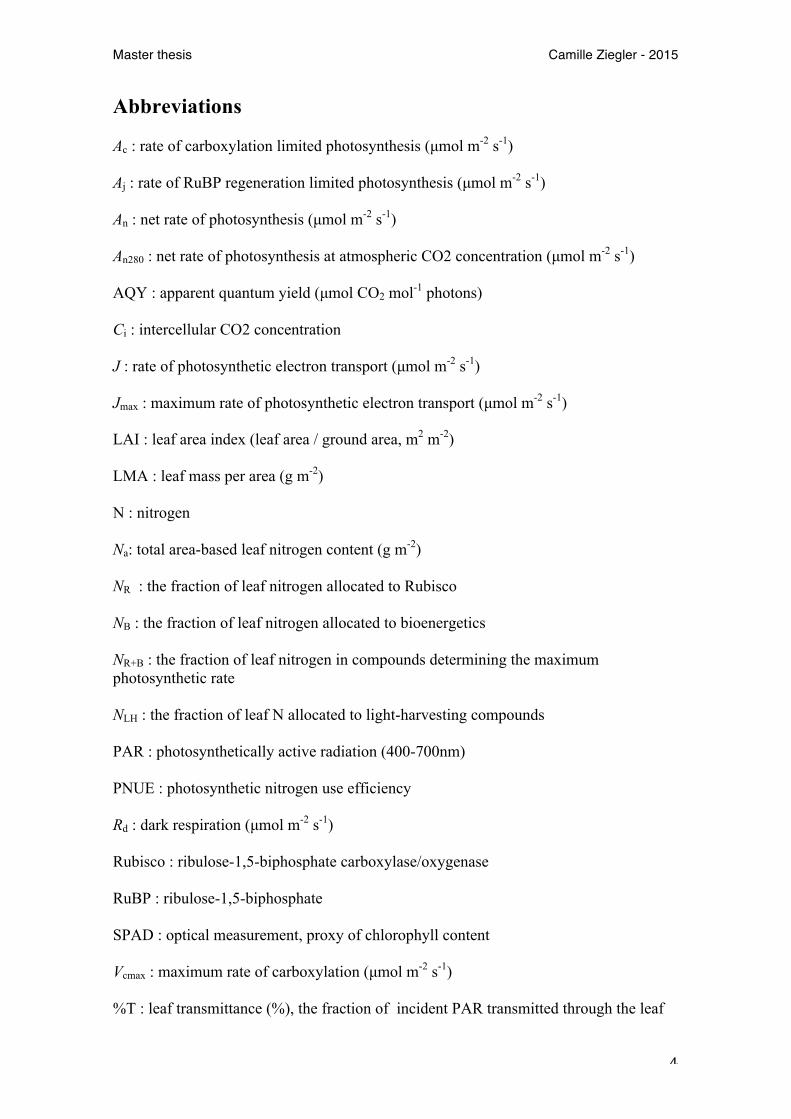
Abbreviations Ac : rate of carboxylation limited photosynthesis (µmol m-2 s-1) Aj : rate of RuBP regeneration limited photosynthesis (µmol m-2 s-1) An : net rate of photosynthesis (µmol m-2 s-1) An280 : net rate of photosynthesis at atmospheric CO2 concentration (µmol m-2 s-1) AQY : apparent quantum yield (µmol CO2 mol-1 photons) Ci : intercellular CO2 concentration J : rate of photosynthetic electron transport (µmol m-2 s-1) Jmax : maximum rate of photosynthetic electron transport (µmol m-2 s-1) LAI : leaf area index (leaf area / ground area, m2 m-2) LMA : leaf mass per area (g m-2) N : nitrogen Na: total area-based leaf nitrogen content (g m-2) NR : the fraction of leaf nitrogen allocated to Rubisco NB : the fraction of leaf nitrogen allocated to bioenergetics NR+B : the fraction of leaf nitrogen in compounds determining the maximum photosynthetic rate NLH : the fraction of leaf N allocated to light-harvesting compounds PAR : photosynthetically active radiation (400-700nm) PNUE : photosynthetic nitrogen use efficiency Rd : dark respiration (µmol m-2 s-1) Rubisco : ribulose-1,5-biphosphate carboxylase/oxygenase RuBP : ribulose-1,5-biphosphate SPAD : optical measurement, proxy of chlorophyll content Vcmax : maximum rate of carboxylation (µmol m-2 s-1) %T : leaf transmittance (%), the fraction of incident PAR transmitted through the leaf
Master thesis Camille Ziegler - 2015
! ! !5!
Introduction
Tropical forests
Forests contribute to the Earth’s balance in several ways: they help maintain the atmosphere's thermal balance through evapotranspiration and carbon sequestration, regulate hydrological cycles, soil and water quality, and support the highest biodiversity (Nsabimana et al., 2009). Covering about 8.5% of terrestrial land (Lewis et al., 2009) and 44% of all forests (FAO 2010), tropical forests store more than half of all forests’ carbon (Bonan et al., 2008) and contribute roughly to one-third of the global terrestrial primary production (Dusenge et al., 2015).
Tropicality is defined as the zone delimited by latitudes 23°26' north and south of the equator (between the Tropic of Capricorn and the Tropic of Cancer), where the sun is at the zenith at least once per solar year. The French botanist Francis Hallé, great admirer of the tropics, titled his last book "Un monde sans hiver", “A world without winter”, (Hallé, 2014). Indeed, in high and low latitudes seasons are marked by considerable photoperiodic and temperature changes due to the Earth's astronomical drivers, while in the tropics the main seasonal change has to do with rainfall patterns, alternations of dry and wet seasons and quite minor temperature fluctuations. However, at the equator the predicted rainfall and temperature is thought to be quite constant year-round with the length of seasons becoming greater as latitude increases. Tropical forests occur in the Neotropics (Central and South America) and in the Paleotropics (Africa and the Asian-Pacific area). Being in the Intertropical Convergence Zone (ITCZ), which harbors a band of clouds around the equator, they receive high precipitation. Latitude is not the only seasonal driver in the tropics as several other factors affect these patterns. For plants, belonging to the tropical rainforest means having a 12-month growth period. Two different successional statuses of forests can be determined. On the one hand, the presently most widespread forest type is the secondary forest (FAO, 2010). It can be created in a number of ways from degraded forest recovering from selective logging, to areas cleared for agriculture that have been reclaimed by forest. Other causes may be natural disturbances such as fire, wind throws or landslides. Consequently, this forest type is characterized by less developed canopy structure, rather smaller trees and less diversity. Due to the lack of full canopy, more light reaches the forest floor, supporting more understory vegetation, mostly shrubs, ferns and dense bushes. What is generally called jungle usually applies to secondary forests, which are dominated by fast-growing pioneer species. On the other hand, the untouched pristine forest that exists in its original condition is called primary forest. The primary forest accounts for 36% of the worldwide forest cover (FAO, 2010). It has been relatively unaffected by human activities and is the most biologically diverse type of forest. A full closed canopy and usually multi-layer tree canopy often characterize primary rainforests. The ground floor is generally clear of heavy vegetation because of the small amount of light reaching the ground. It takes several centuries to reach the ultimate successional status of the forest.

Master thesis Camille Ziegler - 2015
! ! !6!
It is then thought to be at its climax, a rather steady state, and dominated by climax species. Occasionally, a large tree will fall, due to a storm, an excess weight from its wet epiphytes, or any other disease or parasite. This creates a gap enabling high light intensities to reach the forest floor and allowing growth for understory species.
Shade tolerance
Light gradients are ubiquitous in nature, so all plants are exposed to some degree of shade during their lifetime. Photosynthesis and plant growth are highly dependent on light, which is a heterogeneous environmental factor decreasing substantially from the top of the canopy to the forest floor. As light is a key limiting resource, differences in minimum light requirements for survival of co-occurring species are central for ecosystem dynamics and community ecology (Valladares et al., 2008).
Shade tolerance is an ecological concept that refers to the capacity of a given plant to tolerate low light levels. Because morphological and physiological adaptations for coping with the lower end of the light gradient are frequently incompatible with those for coping with the upper end, no plant can perform optimally over the entire light gradient. They can be segregated into different successional types according to their tolerance to shade. Pioneer species are rather shade-intolerant while climax species are rather shade-tolerant. From a physiological point of view, the shade tolerance of a given plant is defined as the minimum light under which a plant can survive. A simple field measure of shade tolerance is, in fact, the whole-plant light compensation point. Still, shade tolerance is not an absolute value, but a relative concept depending on the ecological context. The co-occurrence of multiple factors can alter the capacity of a given species to tolerate low light. Species with varying shade tolerances differ in a large number of physiological and structural traits. According to the "carbon gain hypothesis", any trait that improves the light use efficiency at low light levels, and therefore improves carbon gain, increases species shade tolerance. This hypothesis has been recently challenged; many mechanisms and traits enhancing survival under low light being controversial (Valladares et al., 2008).
Photosynthesis
Photosynthesis is the process of plants converting light energy into chemical energy, thereby assimilating carbon. The C3 photosynthetic pathway is responsible for approximately 80% of terrestrial biomass productivity and the build-up of >95% of the world's biomass C pool. (Körner 2006)
Leaves are the central interface between plants and the atmosphere. Stomata control gas exchanges to and from the leaf. During photosynthesis, Rubisco is combined with CO2 at its active site, which leads to the formation of carbohydrates through the Calvin cycle. Rubisco molecules can also accept O2 molecules instead of CO2 in a process

Master thesis Camille Ziegler - 2015
! ! !7!
named photorespiration thereby reducing the carboxylation efficiency.
In the context of climate change, the effect of raising temperatures and CO2 concentrations on plants are commonly investigated in order to predict the response of terrestrial ecosystems. Grown under elevated CO2, C3 plants and especially trees showed an increase in photosynthesis, which was termed the "fertilization effect" (Ainsworth 2007). Tropical species usually respond negatively, however, to warming (Way & Oren, 2010), especially tropical montane rainforest species (Vårhammar et al., 2015).
Carbon dynamics in tropical montane rainforests
Africa harbors 34 % of all tropical forests (FAO 2010). However, the available data on African tropical forests is scarce mainly because of the lack of an extensive observation network (Lewis et al. 2009). It is of major importance to become more knowledgeable about tree processes in these tropical forests due to their impact on carbon cycling and thus on global climate (Reed, Wood & Cavaleri, 2015).
Tropical cloud forests are especially sensitive to warming because they are in areas with steep gradients and highly specific climatic conditions. The habitat for these species will shift up the mountains as they follow their optimum growing conditions, forcing them higher into reduced areas. The species at the top having nowhere to go will eventually disappear. The extreme sensitivity of the microclimates of tropical cloud forests to climate change makes their habitat a good witness regarding climate change (CIFOR, 2008). Unlike Europe and North America, there is a particular problem with the tropical mountain data, which is both sparse and inhomogeneous (Mountain Research Initiative EDW working group, about warming in mountain regions, Pepin et al., 2015).
At present, we will focus on montane rainforests and especially Nyungwe forest in Rwanda where this study was conducted. Since 2011, the carbon dynamics research project, led by the PhD student Brigitte Nyirambangutse, has been aiming to address questions on biodiversity, carbon stocks and fluxes within Nyungwe forest. This current study is encompassed in this research project, which contributes to collecting more data on the status of carbon stocks and fluxes in central Africa. It focuses on montane rainforests, where the lack of data is evident, with respect to biogeochemical processes in general and specifically to carbon dynamics. Understanding the source/sink relationship of tropical African forests is of great importance. It contributes to a better understanding of how ecosystem carbon fluxes will be affected in future environments as well as their feedback on climate.

Master thesis Camille Ziegler - 2015
! ! !8!
Goals and hypothesizes
The recently published Nyungwe study by Dusenge et al. (2015), “Photosynthetic capacity of tropical montane tree species in relation to leaf nutrients, successional strategy and growth temperature” has drawn interesting conclusions leading to several hypothesizes. This led to the carrying out of this present study, which is in continuity with the previous one. It was found that interspecific variation in photosynthetic capacity was not related to leaf nutrient content but was rather related to differences in within-leaf nitrogen (N) allocation. It was discovered that pioneer and climax species showed different allocation patterns. Pioneer and climax trees in Nyungwe exhibited strongly contrasting investments in photosynthetic enzymes (linked to Vcmax, the rate of carboxylation limited photosynthesis and Jmax, the maximum rate of photosynthetic electron transport) and compounds in light harvesting complexes (linked to SPAD values). Species with high photosynthetic capacities had lower SPAD (i.e. pioneers) and species with low photosynthetic capacities had higher SPAD (i.e. climax). However, the indication of a trade-off between these two traits was determined by comparing photosynthetic capacities and optical properties of species among groups. It was done without direct quantification of leaf N investments into compounds determining maximum photosynthetic rates and light-harvesting. In the present study, we applied a more precise measure of within-leaf nitrogen allocation as well as an investigation of its influence on the photosynthetic capacities of pioneer and climax tree species growing in secondary and primary forests. By investigating physiological, chemical, morphological and optical properties of 12 species from the two studied ecological successional types, the following hypothesizes were tested:
(1) Pioneer species have a higher photosynthetic capacity (higher Vcmax and Jmax) than climax species but don't differ in total N content.
(2) Within-leaf nitrogen allocation is a better predictor of photosynthetic
capacity than total area-based nitrogen.
(3) Successional groups differ in their within-leaf nitrogen partitioning and there is a trade-off between the allocation of nitrogen to the maximizing of photosynthetic capacities and to light harvesting.
(4) Many predictions of the "carbon-gain hypothesis" are incorrect and/or do not
apply for montane rainforest tree species.

Master thesis Camille Ziegler - 2015
! ! !9!
Materials and Methods Study site and plant species
Nyungwe national park is located in southwestern Rwanda in Central-East Africa, between 2°17’-2°49’S and 29°03’-29°29’E and is part of the Albertine Rift ecoregion. It is a tropical montane rainforest, also classified as a tropical montane cloud forest (Bruijnzeel, Scatena & Hamilton 2010) even though the oceanic influence is very weak, and covers 1013 km2 (Plumptre et al., 2002). The altitude ranges from around 1500m to 2925m (Mount Bigugu). Nyungwe is one of the largest blocks of montane rainforest remaining in Africa (Gharahi Ghehi et al. 2012). It is separating the Nile and Congo basins and is among other benefits of tremendous importance regarding the regions' hydrology (Plumptre et al., 2002). At a meteorological station located at Uwinka site (2° 28′ 43′′ S, 29° 12′ 00′′ E, 2465 m altitude; Nsabimana 2009), the average day and night air temperatures were 15.7 °C and 13.5 °C, respectively. The relative humidity was 81% and annual rainfall was 1879 mm during 2007 - 2013. The difference between the warmest and coldest month was 1.1 °C. The precipitation pattern generally forms 4 seasons: the short dry season goes from December to February and is followed by the long rainy season until May. The long dry season then extends until September, followed by the short rainy season. The soils derive mainly from schists, micaschists, quartzitic schists and granites (Gharahi Ghehi et al. 2012) and like most montane rainforests, Nyungwe appears to be nitrogen-limited, opposed to lowland tropical rainforests, thought to be more phosphorus-limited (Van de Weg et al., 2012).
Nyungwe National park was established in 2004 and is an important biodiversity hotspot mostly known for its primate and bird diversity. Nyungwe holds more than 260 tree species belonging to 45 families. Twenty four of these species are endemic to the Albertine Rift (Plumptre et al. 2002). From high viewpoints one can see steep hills covered in dense vegetation with sparse clearings mostly occurring close to the road crossing from east to west. Surrounded by villages, agricultural lands and tree plantations Nyungwe National Park is mostly covered in forests but also has a diversity of smaller-scale habitats including grasslands, swamps, bogs and bamboo. Nyungwe itself is composed of two different forest types. The eastern part is dominated by the secondary forest, annoying mosquitos and biting flies. In the quite sad and recent history of Rwanda, montane rainforests of the Albertine rift have been under important demographic pressure. The region is the most densely-populated in Africa with many people depending on forest resources. This creates disturbances reducing the forest area (Plumptre et al., 2002). During the beginning of the 1990's some parts of Nyungwe were even burned in order to track rebels taking refuge in the forest (Park ranger, personal communication). In the western area the primary forest dominates the landscape. Trees usually culminate at their highest around 30 m but can reach above 40 m. This contrasts with lowland tropical rainforest where the emerging canopy can easily reach 60 m.
Master thesis Camille Ziegler - 2015
! ! !10!
During my time in the forest, from February to May, I encountered both the short dry season and the long rainy season. During the dry season, the sky was usually clear until mid-afternoon where short but intense showers would cool down the air a bit. During the rainy season, the sky was generally covered in clouds and the air filled with humidity. From mid-March to the end of May it was raining on a daily basis, especially in the westernmost part of the park where the primary forest could be found. In fact, it often happened that the rain pattern was very different from one place to another within the park. Shortly after the rain, clouds would form from the forest canopies and rise up the hills forming new clouds that would maintain these rainy episodes. While we were taking measurements, the top of the canopy would sometimes be blurred by the newly formed clouds. Indeed, this type of forest is almost constantly wet and harbors a huge diversity of plant epiphytes taking advantage of the high air humidity and frequent rainfall. In the primary forest, the much closed canopy transmits very low light to the understory where there is often no wind and most of the trees are loaded with mosses, lichens, epiphytic ferns and orchids.
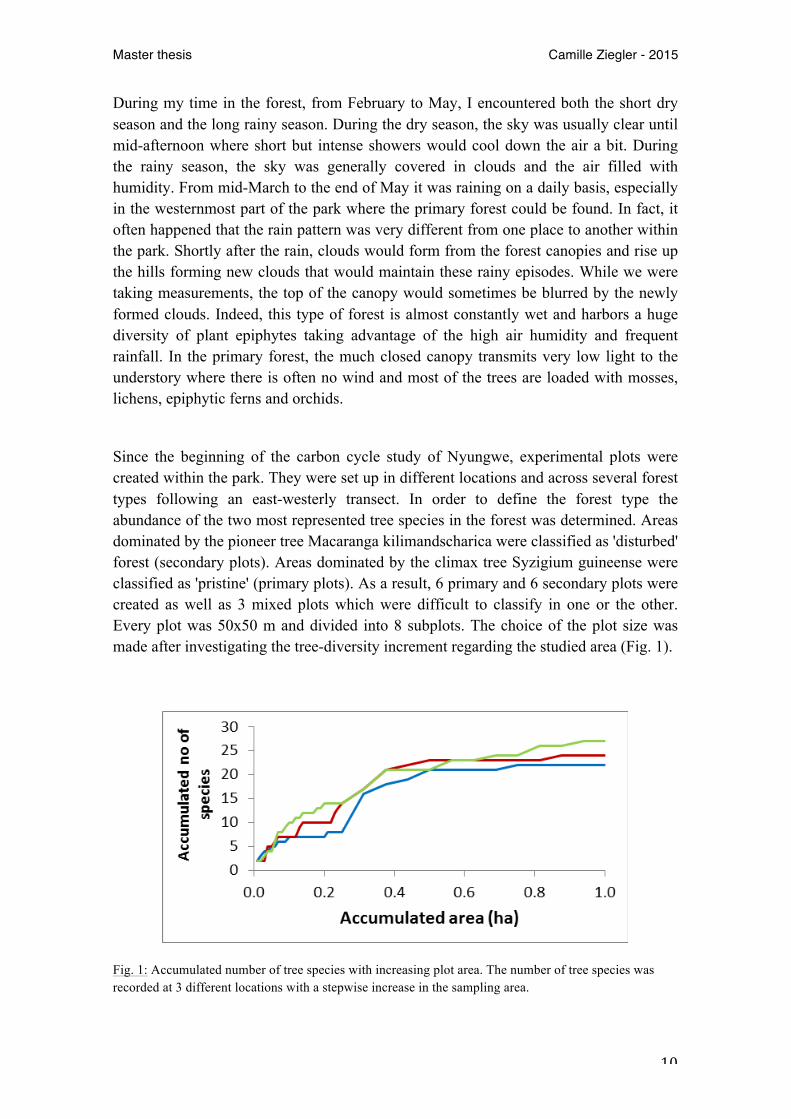
Since the beginning of the carbon cycle study of Nyungwe, experimental plots were created within the park. They were set up in different locations and across several forest types following an east-westerly transect. In order to define the forest type the abundance of the two most represented tree species in the forest was determined. Areas dominated by the pioneer tree Macaranga kilimandscharica were classified as 'disturbed' forest (secondary plots). Areas dominated by the climax tree Syzigium guineense were classified as 'pristine' (primary plots). As a result, 6 primary and 6 secondary plots were created as well as 3 mixed plots which were difficult to classify in one or the other. Every plot was 50x50 m and divided into 8 subplots. The choice of the plot size was made after investigating the tree-diversity increment regarding the studied area (Fig. 1).
Fig. 1: Accumulated number of tree species with increasing plot area. The number of tree species was recorded at 3 different locations with a stepwise increase in the sampling area.
Master thesis Camille Ziegler - 2015
! ! !11!
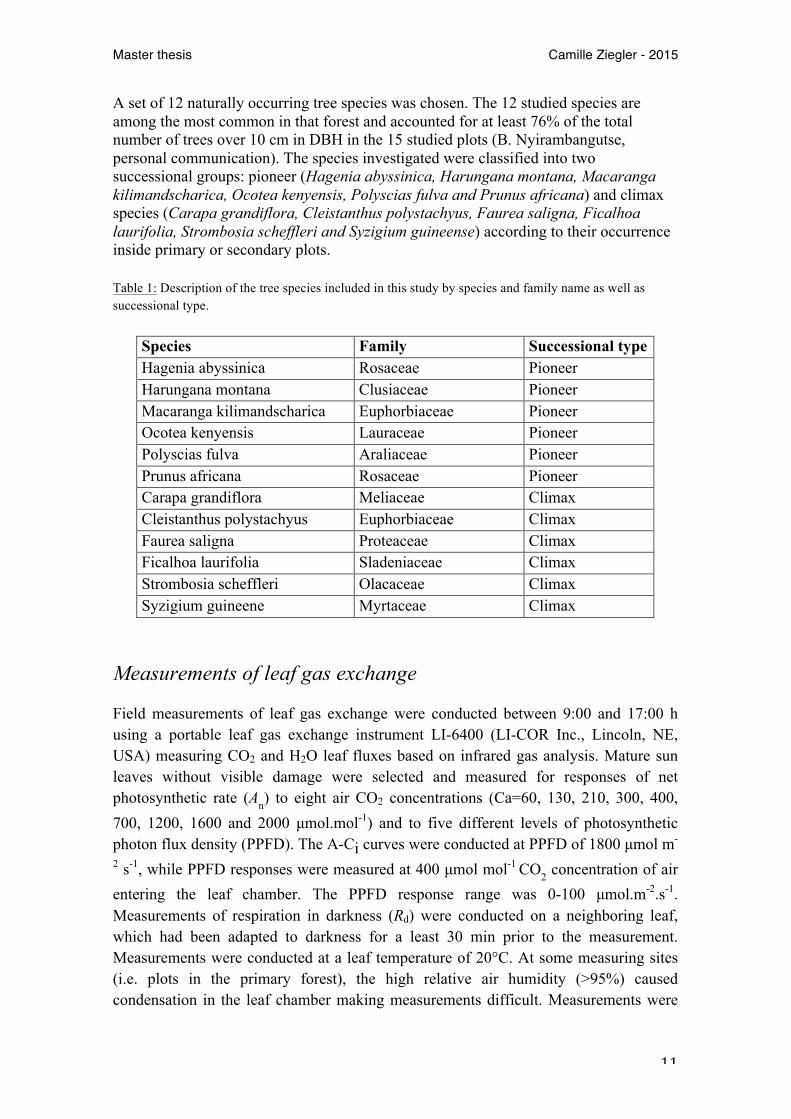
A set of 12 naturally occurring tree species was chosen. The 12 studied species are among the most common in that forest and accounted for at least 76% of the total number of trees over 10 cm in DBH in the 15 studied plots (B. Nyirambangutse, personal communication). The species investigated were classified into two successional groups: pioneer (Hagenia abyssinica, Harungana montana, Macaranga kilimandscharica, Ocotea kenyensis, Polyscias fulva and Prunus africana) and climax species (Carapa grandiflora, Cleistanthus polystachyus, Faurea saligna, Ficalhoa laurifolia, Strombosia scheffleri and Syzigium guineense) according to their occurrence inside primary or secondary plots. Table 1: Description of the tree species included in this study by species and family name as well as successional type.
Species Family Successional type Hagenia abyssinica Rosaceae Pioneer Harungana montana Clusiaceae Pioneer Macaranga kilimandscharica Euphorbiaceae Pioneer Ocotea kenyensis Lauraceae Pioneer Polyscias fulva Araliaceae Pioneer Prunus africana Rosaceae Pioneer Carapa grandiflora Meliaceae Climax Cleistanthus polystachyus Euphorbiaceae Climax Faurea saligna Proteaceae Climax Ficalhoa laurifolia Sladeniaceae Climax Strombosia scheffleri Olacaceae Climax Syzigium guineene Myrtaceae Climax
Measurements of leaf gas exchange
Field measurements of leaf gas exchange were conducted between 9:00 and 17:00 h using a portable leaf gas exchange instrument LI-6400 (LI-COR Inc., Lincoln, NE, USA) measuring CO2 and H2O leaf fluxes based on infrared gas analysis. Mature sun leaves without visible damage were selected and measured for responses of net photosynthetic rate (An) to eight air CO2 concentrations (Ca=60, 130, 210, 300, 400, 700, 1200, 1600 and 2000 µmol.mol-1) and to five different levels of photosynthetic photon flux density (PPFD). The A-Ci curves were conducted at PPFD of 1800 µmol m-
2 s-1, while PPFD responses were measured at 400 µmol mol-1 CO2 concentration of air entering the leaf chamber. The PPFD response range was 0-100 µmol.m-2.s-1. Measurements of respiration in darkness (Rd) were conducted on a neighboring leaf, which had been adapted to darkness for a least 30 min prior to the measurement. Measurements were conducted at a leaf temperature of 20°C. At some measuring sites (i.e. plots in the primary forest), the high relative air humidity (>95%) caused condensation in the leaf chamber making measurements difficult. Measurements were

Master thesis Camille Ziegler - 2015
! ! !12!
then performed in a clearing, at a leaf temperature of 25°C. The relative air humidity was kept between 60% and 80% during the measurements. Measurements were conducted only if the starting value of stomatal conductance was over 0.03 µmol H2O.m-2.s-1 and values under this threshold were not considered reliable due to the influence of cuticular transpiration on the calculated intercellular CO2 concentration (Ci).
Eight trees from each of the 12 tree species were selected on a maximum number of plots (i.e. primary, mixed and secondary) to account for differences between plots (i.e. fertility). Individual trees were considered as replicates, with one sun leaf per tree used to measure photosynthetic CO2 and PPFD responses whilst its neighbor was used for Rd. The total number of measured trees was thus 96.
Upper canopy sun leaves were made accessible by cutting 1 to 2 m branches using a saw mounted on a 20 m long telescopic pole. When the pole was of insufficient length, Etienne Zibera, an experienced field assistant, would take off his shoes and climb up with the saw attached to his belt in order to cut branches. Cut branches were placed into a bucket of water to avoid water transport disruption. The short-term effect on photosynthetic capacity by cutting the branch was investigated by Dusenge. et al. (2015). It showed no significant effect on Vcmax and there was a quite small negative effect (−8 %; P < 0.05) on Jmax.). Cut branches remained in water until morphological and optical measurements were performed.
Measurements of leaf transmittance
Field measurements of leaf transmittance were then conducted on every leaf measured for dark respiration using a StellarSphere IC2, a 2-inch diameter integrating sphere placed on a tripod. The light signal is transferred to a BLACK-comet, a portable spectrometer (StellarNet Inc., Tampa, FL, USA). A black plastic object in the form of a truncated cone was used to get fairly unidirectional incoming radiation entering the integrative sphere.
Before measuring each leaf's transmittance, a first measurement was performed and set as a reference (100% light) with the top of the sphere uncovered and pointed towards the sky but never directly to the sun. Leaves used for dark respiration measurements detached from their respective branches were immediately placed on the sphere opening. The percentage of transmitted light was recorded for every wavelength of incoming radiation. Values of transmittance were then averaged for photosynthetic active radiation (PAR; 400-700nm) and one single transmittance value per leaf was obtained for this spectrum.
Master thesis Camille Ziegler - 2015
! ! !13!
Nitrogen analysis and other leaf traits
All leaves were measured for length and width using a ruler and for thickness using an electronic calliper, care being taken to avoid the main veins. Leaves were also measured for SPAD. The SPAD value is a proxy of leaf chlorophyll content (Uddling et al. 2007), optically measured using a SPAD meter (SPAD model 502; Minolta corporation, Ltd., Osaka, Japan). For every leaf 10 evenly distributed readings across the leaf were made avoiding the major veins. Leaf disks were then punched using a 10 mm or 18 mm leaf puncher. As soon as the laboratory was reached some disks were stored at -25℃ until the chlorophyll extraction was performed. Other disks were put to dry at 70℃ for at least 48h. The dry material of known area was weighed and the leaf mass per area (LMA; g m-2) could be determined. The disks were then ground in a ball mill to fine powder which was analyzed for nitrogen (N) content. The N content was determined using an elemental analyzer (EA 1108; Fison Instruments, Rodano, Italy) at the Department of Biological and Environmental Sciences in Gothenburg. By multiplying the percentage of nitrogen in the sample by the corresponding LMA, the total area-based nitrogen content (Ntot) was obtained.
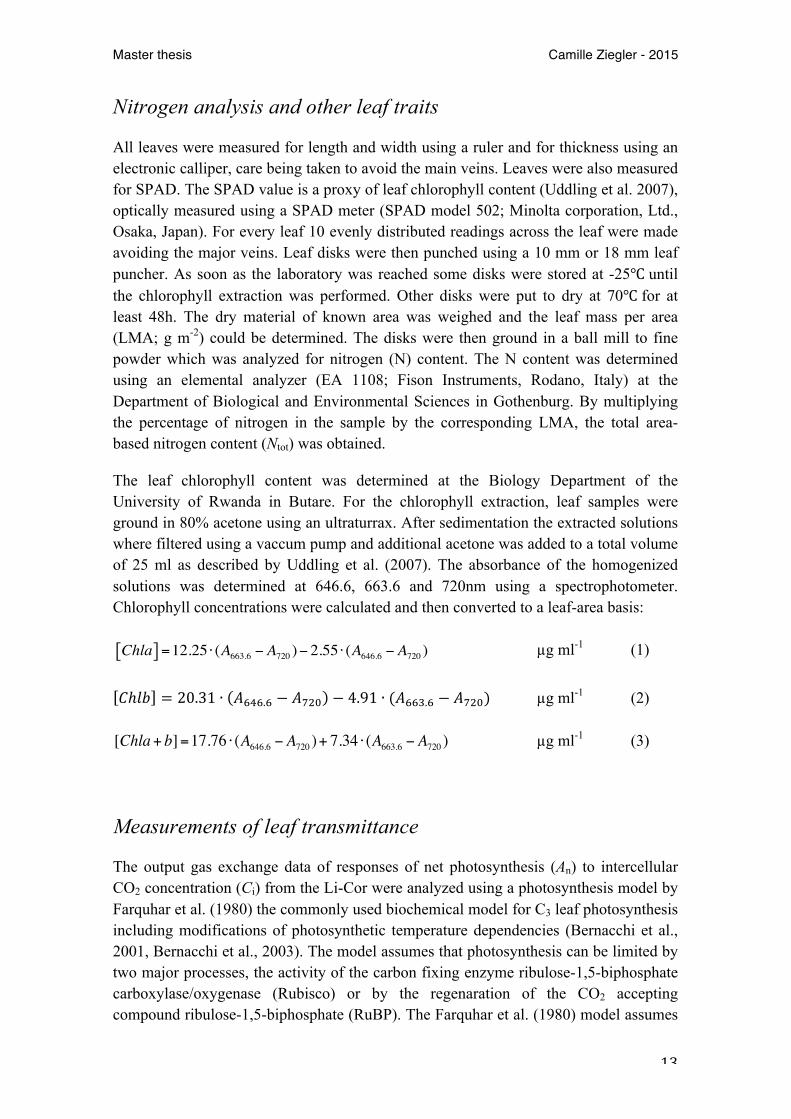
The leaf chlorophyll content was determined at the Biology Department of the University of Rwanda in Butare. For the chlorophyll extraction, leaf samples were ground in 80% acetone using an ultraturrax. After sedimentation the extracted solutions where filtered using a vaccum pump and additional acetone was added to a total volume of 25 ml as described by Uddling et al. (2007). The absorbance of the homogenized solutions was determined at 646.6, 663.6 and 720nm using a spectrophotometer. Chlorophyll concentrations were calculated and then converted to a leaf-area basis:
µg ml-1 (1)
!ℎ!" = 20.31 ∙ !!"!.! − !!"# − 4.91 ∙ (!!!".! − !!"#)! µg ml-1 (2)!
µg ml-1 (3)
Measurements of leaf transmittance
The output gas exchange data of responses of net photosynthesis (An) to intercellular CO2 concentration (Ci) from the Li-Cor were analyzed using a photosynthesis model by Farquhar et al. (1980) the commonly used biochemical model for C3 leaf photosynthesis including modifications of photosynthetic temperature dependencies (Bernacchi et al., 2001, Bernacchi et al., 2003). The model assumes that photosynthesis can be limited by two major processes, the activity of the carbon fixing enzyme ribulose-1,5-biphosphate carboxylase/oxygenase (Rubisco) or by the regenaration of the CO2 accepting compound ribulose-1,5-biphosphate (RuBP). The Farquhar et al. (1980) model assumes
Chla[ ] =12.25 ⋅ (A663.6 − A720 )− 2.55 ⋅ (A646.6 − A720 )
[Chla+ b]=17.76 ⋅ (A646.6 − A720 )+ 7.34 ⋅ (A663.6 − A720 )

Master thesis Camille Ziegler - 2015
! ! !14!
that net leaf photosynthesis is the minimum of the two limiting rates:
!! = !"#(!! ,!!)− !!"# With Ac, the carboxylation-limited photosynthesis, Aj, the RuBP-regeneration-limited photosynthesis and Rd, the rate of mitochondrial respiration in daylight. At low intercellular CO2 concentrations, the main limiting factor for An is the rate of carboxylation. The substrate for the reaction (CO2) does not saturate the enzymatic capacity. Rubisco-limited photosynthesis is given by:
!! =!!"#$(!! − !∗)!! + !! 1+ !!
!!
where Vcmax is the maximum rate of Rubisco carboxylation, Ci and Oi are the intercellular concentrations of CO2 and O2, respectively, Kc and Ko are the Michaelis-Menten coefficients of Rubisco carboxylation and oxygenation, respectively, and Γ* is the CO2 compensation point in the absence of mitochondrial respiration. At higher Ci, the regeneration of RuBP, dependent on the electron-transport chain providing the energy-rich molecules ATP and NADPH, limits photosynthesis. RuBP-regeneration-limited photosynthesis is given by:
!! =!4 × !! − !∗
!! + 2!∗
where J is the rate of electron transport. J is related to incident photosynthetically active photon flux density, Q, by: !!! − !" + !!"# ! + !"!!"# = 0 where ! is the curvature of the light response curve and was assumed to be 0.9, and ! is the quantum yield of electron transport fixed at 0.3 mol electrons mol-1 photons. This equation was solved to calculate Jmax, the potential maximum rate of electron transport. The uncertainty of the values of ! and ! used when calculating Jmax from actual electron transport (J) has only a slight effect on the estimated value of Jmax (Medlyn et al. 2002).
The model parameter Vcmax is derived from data at low Ci, whereas the parameter Jmax is obtained from the response curve at higher Ci (Sharkey et al., 2007). Both values of Vcmax and Jmax were calculated using the least-square method at leaf temperature as well as 25°C, which is conventionally used. In addition, An at a Ci:Ca ratio of 0.7 (i.e. 280ppm) was determined from the fitted model for each leaf. Internal leaf conductance

Master thesis Camille Ziegler - 2015
! ! !15!
(i.e. mesophyll conductance) for CO2 was not measured and assumed to be infinite, therefore apparent Vcmax and Jmax values were determined based on Ci rather than on Cc, the CO2 concentration at the chloroplast. When analyzing the data obtained from gas exchange measurements, it was observed that a leak had been present in one of the two instruments that were used. In order to account for the leak, data were compared to previous data recorded in 2014 with the same instrument at the same period of the year on 5 species common to both studies. A conductance of the leak was calculated based on the assumption that the value at lowest CO2 concentration (where An should be near zero) should have been the same for the two measurement campaigns. Based on the calculated leak conductance, new An and Ci
values were calculated.
Estimation of nitrogen allocation to photosynthetic functions
In order to estimate the relative within-leaf non-structural nitrogen allocation the photosynthetic apparatus was divided into three parts (Watanabe et al., 2013 and references cited therein): Rubisco, bioenergetics (electron carriers except for photosystems, coupling factor and Calvin cycle enzymes except Rubisco) and light-harvesting complex plus photosystems. The fraction of leaf N allocated to each function is denoted by NR, NB and NLH, respectively. The fraction of leaf N allocated to Rubisco was estimated following the equation described by Niinemets and Tenhunen (1997) using the parameters provided by them:
!! =!!"#$
6.25!!"!!"!
where Vcmax is the maximum rate of carboxylation, Ntot the area-based nitrogen content (gm-2) and Vcr the specific activity of Rubisco (20.78 µmol CO2 g-1 Rubisco s-1) calculated at 25°C (Niinemets and Tenhunen, 1997, appendix 1).
The value of NB was estimated according to the following equation (Watanabe et al., 2013):
!! = !!"#/(156×9.53!!"!)
It was assumed that N in bioenergetics is proportional to Jmax, where the ratio of Jmax to the cytochrome f content is 156 mmol.mol-1s-1 and the amount of cytochrome f per unit N is 9.53 mmol.mol-1. NR and NB together were defined as the nitrogen in compounds determining the maximum photosynthetic rate and will be termed NR+B. NLH was estimated according to the following equation:
!!" = 41!ℎ!/!!"!

Master thesis Camille Ziegler - 2015
! ! !16!
where Chl is the area-based chlorophyll content (mol m-2) and the N content per unit chlorophyll in light-harvesting complexes and photosystems in sun exposed leaves is 41 mol mol-1 (Evans and Poorter, 2001).
Statistical analysis
Data were statistically analyzed by analysis of variance (ANOVA) with a two-level nested ANOVA with 'species' nested within 'successional group', using a spreadsheet model (McDonald, J.H., 2014) on Microsoft Excel for Mac 2011, software version 14.5.3 (Microsoft Corporation, Redmond, WA, USA). The statistical significance of linear regressions was tested using StatPlus:mac LE, software version v5 (AnalystSoft Inc., Walnut, CA, USA).
Differences in slopes of the regressions among groups (e.g. successional types) were done by analysis of covariance (ANCOVA) using SAS version 9.3.1 (SAS Institute, NC, USA).
Differences were considered significant if P<0.05 and only marginally significant if 0.05<P<0.1.

Master thesis Camille Ziegler - 2015
! ! !17!
Results Pioneer and climax species did not differ significantly in LMA (P=0.37), leaf size (P=0.84), density (P=0.12) or thickness (P=0.65, data not shown). Climax species showed a significantly higher SPAD value (Fig. 2a; +30%; P=0.035), however, this did not reflect into a higher area-based chlorophyll content (Fig. 2b; P=0.35), chlorophyll a/b ratio (P=0.45; data not shown) nor transmittance (P=0.59; data not shown). The lack of significant difference in measured traits was mostly due to the important interspecific variations within successional types, which were a stronger variance component than differences between groups. As an example, the climax species S. scheffleri and C. grandiflora transmitted very low light (0.42% and 0.57% respectively) and were comparable to the pioneer species H. montana and P. fulva (0.53% and 0.92% respectively) but not to the climax species F. laurifolia (5.04%) nor to the pioneer species H. abyssinica (6.55%).
Fig. 2: SPAD values (a), chlorophyll content (b) and leaf transmittance (c) of two successional types in Nyungwe. Error bars represent standard errors (n=6 species per group). The P-value of a two-level analysis of variance with species nested within groups is shown.

Master thesis Camille Ziegler - 2015
! ! !18!
The relationship between chlorophyll content and SPAD for the 12 studied species was positive but weak and statistically non-significant (Fig. 3a; r2=0.14; P=0.23). In Dusenge et al. (2015), a strong relationship was found (r2=0.94; P<0.001) using 5 species (H. abyssinica, M. kilimandscharica, P. Fulva, S. guineense, C. grandiflora), all of them common to this present study. When plotting these same species, the relationship improved but remained non-significant (Fig. 3b; r2=0.79; P=0.18). Chlorophyll content and transmittance did not show a significant relationship (r2=0.06; P=0.46; data not shown) but SPAD and transmittance did (r2=0.41; P=0.026; data not shown).
Fig. 3: Relationships between SPAD values and area-based chlorophyll content of 12 montane rainforest species (pioneer species, blue; climax species, orange) in Nyungwe used in this study (a) and of 5 species common to Dusenge et al. (2015) and the present study (b). Residuals from (a) were plotted against LMA (c) and density (d). Each data point represents the mean of eight leaves. The P-values obtained from a linear regression are shown.

Master thesis Camille Ziegler - 2015
! ! !19!
Values of Vcmax ranged from 31.01 to 53.12 µmol m-2s-1 among climax species and from 50.88 to 91.04 µmol m-2s-1 among pioneers which had significantly higher mean Vcmax (Fig. 4a; +37%; P=0.019). Values of Jmax ranged from 58.41 to 113.41 µmol m-2s-1 among climax species and from 106.38 to 210.85 µmol m-2s-1 among pioneers which had significantly higher mean Jmax (Fig. 4b; +40%; P=0.015). Values of An280 ranged from 4.78 to 8.36 µmol m-2s-1 among climax species and from 7.64 to 15.06 µmol m-2s-1 among pioneers which had a significantly higher mean An280 (Fig. 4c; +37%; P=0.031). Quantum yield was higher in pioneer species (Fig. 4d; +24%; P=0.046) and Rd did not differ between groups (P=0.27 ; data not shown).
This could be explained by the significant influence of leaf morphological traits, as residuals for this relationship correlated with both LMA (Fig. 3c ; r2=0.33; P=0.049) and leaf density (Fig. 3d ; r2=0.33; P=0.049) but not leaf thickness (r2=0.05; P=0.51; data not shown).
The Jmax:Vcmax ratios did not differ significantly between successional types (P=0.13; data not shown). The slopes of the strong relationship between Jmax and Vcmax (Fig. 5; r2=0.98; P<0.001) did not differ between successional types.
SPAD and photosynthetic capacities (i.e. Vcmax and Jmax) were significantly related (Fig. 6; Vcmax: r2=0.44; P=0.023; Jmax: r2=0.53; P=0.006). The two groups showed two different strategies, pioneer species with higher photosynthetic capacities and lower SPAD being grouped at one end compared to climax species with lower photosynthetic capacities and higher SPAD grouped at the other end. However, this relationship did not persist between chlorophyll content and photosynthetic capacities (Vcmax: r2=0.06; P=0.23; Jmax: r2=0.09; P=0.32; data not shown).
Pioneer and climax trees did not differ in Ntot (Fig. 7a; P=0.79), nor did they in within-leaf nitrogen partitioning (Fig. 7b). There was no difference between groups for NLH (P=0.36) nor for NR+B. Even though it was higher in pioneers, it did not end up being significantly different (P=0.17). When expressed as a ratio, the average NR+B versus NLH differed quite a bit between groups with pioneers showing a marginally significant higher ratio (Fig. 8; +49%; P=0.083) than climax species. When excluding H. abyssinica from this analysis, which had quite a high and different ratio than the other pioneer species, there was a significant difference between groups. Pioneer species had a higher ratio (+33%; P=0.037; data not shown) than climax species indicating a different allocation pattern. There was no overall relationship between NR+B and NLH (r2=0.002; P=0.17; data not shown). However, even if the relationships for the two groups were both non-significant, their slopes were different (P=0.049), being negative in pioneers (Fig. 9; r2=0.41; P=0.22) and positive in climax species (Fig. 9; r2=067; P=0.40). This indicates that while the trade-off might be present in pioneers, the pattern is the opposite in climax species, with parallel changes in both NR+B and NLH.

Master thesis Camille Ziegler - 2015
! ! !20!
Fig. 4: Photosynthetic capacity and quantum yield of two successional types in Nyungwe. Comparisons are shown of the maximum rates of photosynthetic carboxylation (Vcmax; Fig. 4a) and electron transport (Jmax; Fig. 4b) as well as the maximum photosynthesis at an intercellular CO2 concentration of 280 µmol mol-1 (An280; Fig. 4c) and apparent quantum yield (AQY; Fig. 4d). Error bars represent standard errors (n=6 species per group). The P-values of two-level analysis of variance with species nested within groups are shown.

Master thesis Camille Ziegler - 2015
! ! !21!
Fig. 5: Relationship between the maximum rates of photosynthetic electron transport (Jmax) and carboxylation (Vcmax) at 25 °C for 12 montane rainforest species in Nyungwe (pioneer species, blue; climax species, orange). Each data point represents the mean of eight leaves. The P-value obtained from a linear regression is shown.
Fig. 6: Relationship between photosynthetic capacity (Vcmax and Jmax) and SPAD for 12 montane rainforest species in Nyungwe (pioneer species, blue; climax species, orange). Each data point represents the mean of eight leaves. The P-value obtained from a linear regression is shown.
Fig. 7: Total area-based foliar nitrogen (a) and partitioning (b) of two successional types in Nyungwe. The 3 components of nitrogen partitioning are shown in Fig. 7b with NR (dark), NB (medium) and NLH (light). Error bars represent standard errors (n=6 species per group). For N partitioning they represent the standard error for NR, NB and NLH combined. The P-values of a two-level analysis of variance with species nested within groups are shown.

Master thesis Camille Ziegler - 2015
! ! !22!
Fig. 8 and 9: Ratio between NR+B and NLH (Fig. 8, left) and the relationship between NR+B and NLH (Fig. 9, right) of two successional types in Nyungwe. Each data point represents the mean of eight leaves. The P-values obtained from a linear regression are shown. Error bars represent standard errors (n=6 species per group). The P-value of a two-level analysis of variance with species nested within groups as well as P-values obtained from linear regressions are shown. Differences in slopes between successional types were determined using an analysis of covariance. Photosynthetic capacities showed no relationship with Ntot (Fig. 10a), neither for Vcmax than for Jmax, therefore it is a bad predictor of photosynthetic capacities in our species. The proportion of Ntot allocated to compounds maximizing photosynthetic capacity (NR+B) was on the contrary well positively related to the actual observed Vcmax (Fig. 10b; r2=0.55; P=0.0078) and Jmax (Fig. 10b; r2=0.68; P=0.0026). There was no relationship between photosynthetic capacities and NLH (data not shown). Yet, NR+B had a negative and significant relationship with Ntot (Fig. 11; r2=0.45; P=0.009) whereas no relationship could be found between NLH and Na (Fig. 11; r2=0.12; P=0.20). The slopes for NR+B and NLH relative to Ntot were significantly different (P=0.029); NR+B covaried with Ntot but NLH did not, according to the respective P-values of the slope. The photosynthetic nitrogen use efficiency (PNUE) was somewhat higher in pioneer than in climax species (Fig. 12; P=0.0938), mostly due to the influence of H. abyssinica and P. africana, and was well correlated with the %N allocated to photosynthetic capacities (r2=0.87; P<0.001; data not shown).

Master thesis Camille Ziegler - 2015
! ! !23!
Fig. 10: Relationships between photosynthetic capacity and Ntot (a), photosynthetic capacity and NR+B (b). Each data point represents the mean of eight leaves. The P-values obtained from a linear regression are shown as well as the P-value describing differences between slopes determined using an analysis of covariance. Fig. 11: Relationship between the different components of within-leaf nitrogen allocation and Ntot. The P-values obtained from a linear regression are shown as well as the P-value describing differences between slopes determined using an analysis of covariance.
Fig. 12: Photosynthetic nitrogen use efficiency of two successional types in Nyungwe. Error bars represent standard errors (n=6 species per group). The P-values of two-level analysis of variance with species nested within groups are shown.

Master thesis Camille Ziegler - 2015
! ! !24!
Discussion Data were collected in a broad range of tree species in the montane rainforest of Nyungwe National Park. The species chosen represented more than ¾ of large trees in the forest plots and results can thus be applied to a large fraction of the tree communities. Several hypothesizes were formulated in order to explore some suggestions made by Dusenge et al. (2015). The Jmax:Vcmax ratios were similar to those previously reported (Dusenge et al., 2015). The two successional groups showed similar ratios with Jmax and Vcmax being strongly related (Fig. 5). Both groups showed large differences in photosynthetic capacities with climax species represented in the lower range of photosynthetic capacities whereas pioneer species were in the higher range (Fig. 4ab ; Fig 5), thereby confirming hypothesis (1). No differences in total area-based nitrogen content were found (Fig. 7). This resulted in a poor relationship between photosynthetic capacities and Ntot (Fig. 10a), in line with hypothesis (2) and previous tropical studies (Coste et al. 2005; van de Weg et al. 2012; Houter and Pons 2012). When testing hypothesis (3), no evidence for a trade-off between N invested in photosynthetic capacities and light-harvesting were found across the dataset (data not shown). If climax species had higher SPAD values, it did not always reflect higher chlorophyll content. This could be explained by the poor correlation we found between SPAD and chlorophyll content (Fig. 3a). We tested a homographic model provided by Coste et al. (2010) predicting chlorophyll content from SPAD. The chlorophyll content predicted by the model was overestimated by more than 50% and we conclude that this general relationship did not hold for our set of 12 montane rainforest tree species. We found that both LMA and leaf density had a high importance on this poor relationship (Fig 3cd). The quite small window of the SPAD-meter could lead to an unrealistic optical measurement: if light scattering occurs in the leaf between the light source and the sensor, less light intensity will cross the leaf and chlorophyll content will be overestimated. The absolute values of NR+B and NLH were not significantly different between groups (Fig 7b). On the other hand, the ratio between NR+B and NLH gave an indication that groups differed in their relative investment in one or the other function (Fig 8). When looking deeper into the relationship between NR+B and NLH, it was found that pioneer and climax species significantly differ in regard to their respective N allocation pattern (Fig. 9). By comparing slopes of the relationship between NR+B and NLH for both groups, we found that pioneer species may exhibit a trade-off between the two components of N allocation; investing more into NR+B when investing less in NLH. In climax species, NR+B and NLH changed in parallel.

Master thesis Camille Ziegler - 2015
! ! !25!
Hoping to link the chlorophyll content to the leaves’ optical properties and perhaps allocation patterns, we measured the transmittance of PAR for every species. Climax species transmitted on an average 30% less light than pioneers (Fig. 2c) but the difference was not significant. The interspecific differences among groups were the strongest variance component. Species identity were therefore more important than their respective successional strategy. The causes of the poor relationships between chlorophyll content, transmittance, Vcmax and Jmax remain unknown to us. Total area-based nitrogen was confirmed to be a poor predictor of photosynthetic capacities (Fig. 10a). NR+B was very well correlated with the measured Vcmax and Jmax and therefore was a better predictor of photosynthetic capacities (Fig. 10b) than Ntot, supporting similar conclusions from Coste et al. (2005). Models predicting global ecosystem-atmosphere fluxes sometimes account for variations in photosynthetic capacity related to the soil nutrient availability and therefore take into account the total N content. Using the within-leaf N allocation as a predictor of interspecific variation in photosynthetic capacity is potentially more promising (Dusenge et al., 2015). This result is in agreement with previous studies showing a wide range of variation in the relationship between leaf nitrogen content and photosynthesis. It was also previously found that the photosynthetic capacity was affected mainly through the impact on photosynthetic nitrogen use efficiency, rather than through leaf nitrogen content (Ali et al., 2015). As high photosynthesis and growth rates require a high concentration of photosynthetic enzymes that are bound to have large maintenance costs, the good performance of shade-tolerant species in low light has been attributed to their lower dark respiration rates. This results in a lower light compensation point. Actually, dark respiration was the strongest determinant of whole-plant light requirements in tropical tree saplings and was considered a reliable and simple estimate of shade tolerance. According to the carbon gain hypothesis, shade-tolerant species achieve superior performance in low light by minimizing CO2 losses in low light rather than by enhancing maximum potential carbon gain (Valladares et al., 2008 and reference cited therein). This was untrue for the tree species that we sampled as they had similar Rd between groups. Moreover, the quantum yield was lower in climax species (Fig. 4d). This gives an indication that our climax species might actually have a higher light compensation point than pioneer species.
Possible answers can then be found within the ecology of individual trees or in the functioning of the primary forest, which is in a dynamic but steady state. Kitajima (1994) proposed that the carbon gain hypothesis should be abandoned and that survival in shade is more strongly related to plant resistance to biotic and abiotic stresses (stress tolerance hypothesis). Shade tolerance does correlate positively with wood density and with resistance to pathogens and diseases in the shade (Valladares et al., 2008). Non-photosynthetic N in our climax species could thus be allocated to functions such as secondary defense compounds or storage (Meir et al., 2007 and references cited

Master thesis Camille Ziegler - 2015
! ! !26!
therein). The storage hypothesis of shade tolerance is akin to the stress tolerance hypothesis. According to this hypothesis, shade-tolerant species do not maximize growth in low light but invest a larger fraction of production in storage permitting the plants to tolerate periods of low light close to or below the whole-plant light compensation point. The stress-tolerance approach showed interesting explanations regarding strategies of shade-tolerant trees. Nevertheless, both hypotheses are not mutually exclusive (Valladares et al., 2008). Climax trees are thought to be better defended against herbivory and damage in general, exhibiting traits cited above and having a longer leaf life span (Evans and Poorter, 2001; Houter and Pons, 2012), which is frequently shown to have a trade-off with leaf N investment in photosynthesis (Coste et al., 2005). Canopy trees of shade-tolerant climax species generally accumulate more leaf area and form denser crowns with lower light transmittance than the canopy trees of intolerant species (Valladares et al., 2008). It was previously found in Nyungwe that the net primary production (NPP) was similar across primary and secondary plots even though the leaf area index was higher in primary plots (Nyirambangutse et al., personal communication). This could be explained by the lower photosynthetic capacities (Fig. 4ab) and the lower relative investment in NR+B of climax tree species dominating primary plots (Fig. 8). Higher An per unit leaf area thus counteracts the effect of higher LAI with respect to NPP. Although it is well known that crowns of shade-tolerant species are more efficiently organized for light capture, more studies demonstrate that a hierarchy of traits from leaf physiology to whole plant architecture is involved (Valladares et al., 2008). Ontogenic effects should also be considered as trees grow in contrasting light environments during their life (Houter and Pons, 2012). Future studies should therefore investigate at different organization levels and time scales in order to get a broader idea of the drivers controlling shade-tolerance and successional strategies in trees. Investigating the role of the overstorey (environment) in shade tolerance versus the species-specific factors such as successional type (genetic) is central in understanding forest dynamics. Differences between well-exposed pioneer and climax trees found previously as well as in this study indicate an important genetic control. However, Dusenge et al. (2015) showed no difference in interspecific variation for sun and shade leaves. This highlights the need for controlled experiments, which could help in the understanding of the complex community dynamics of tropical (montane) rainforests.
Interspecific differences in the responses to elevated CO2 may also change species’ shade tolerance, further amplifying the changes in the composition of future forests. As an example regarding climate change in the tropics, enhanced vigor of climbing plants under elevated CO2 may accelerate tropical forest dynamics and lead to greater abundance of early-successional tree species. More experimental work is needed to test the features conferring shade tolerance and to better delineate the role of shade tolerance in vegetation dynamics (Valladares et al. 2008), therefore contributing to a better understanding of carbon dynamics in forests and in the Earth-system.

Master thesis Camille Ziegler - 2015
! ! !27!
Conclusion
The present study increases the knowledge of natural variability of photosynthetic capacities and other ecophysiological traits in tropical tree species in Africa and thus contribute to more tropical data for global carbon and climate models. Trying to find a robust indicator for shade tolerance and successional strategies has been at the center of tropical forest research, especially in ecophysiology. Several attempts have concluded that species do not follow a strict classification with respect to different measured traits.
Hypothesis (1) predicted that pioneer species would have a higher photosynthetic capacity than climax species without differing in Ntot, which was confirmed for the species that we studied. This contradicts the general view that the photosynthetic capacity of tree leaves is positively related to nutrient content, which are often poorly supported for tropical trees. Hypothesis (2) predicted within-leaf N allocation was a better predictor of photosynthetic capacity than the absolute N content. This was confirmed for both successional types with NR+B, the nitrogen allocated in compounds determining the maximum photosynthetic rate, being a good predictor of photosynthetic capacity, highlighting its promising implications in the modeling of global ecosystem-atmosphere fluxes. Hypothesis (3) predicted that successional types differed in their within-leaf nitrogen partitioning following a trade-off between the allocation of nitrogen to the maximizing of photosynthetic capacities and to light harvesting. Both successional groups behaved in different ways with regard to within-leaf N allocation but the indication of a trade-off between NR+B and NLH was present only in pioneers and not in climax species. It was not possible to relate these findings to optical features of the leaves due to large uncertainties. Hypothesis (4) predicted that many predictions of the carbon-gain hypothesis are incorrect and/or do not apply to montane rainforest tree species. Some of our results challenged some of these predictions (Appendix 2). The carbon-gain hypothesis thus does not fully apply for montane rainforest tree species in Rwanda. Shade-tolerant climax species had the same nitrogen content, chlorophyll content, LMA, leaf size and density as pioneer species but had a lower quantum yield. More studies for investigating a possible trade-off in pioneers but not in climax tree species are needed. This is where no straightforward conclusions could be drawn and should be ideally investigated in different light environments.

Master thesis Camille Ziegler - 2015
! ! !28!
References Ainsworth EA & Rogers A (2007) The response of photosynthesis and stomatal conductance to rising [CO2]: mechanisms and environmental interactions. Plant, Cell & Environment. 30, 258–270 doi: 10.1111/j.1365-3040.2007.01641.x Ali AA, Xu C, Rogers A, McDowell NG, Medlyn B, Fisher RA, Wullschleger SD, Reich PB, Vrugt JA, Bauerle WL, Santiago LS, Wilson CJ (2015) Global scale environmental control of plant photosynthetic capacity. Ecological Applications; DOI: 10.1890/14-2111.1 Bernacchi CJ, Singsaas EL, Pimentel C, Portis AR, Long SP (2001) Improved temperature response functions for models of Rubiscolimited photosynthesis. Plant, Cell & Environment 24:253–259 Bernacchi CJ, Pimentel C, Long SP (2003) In vivo temperature response functions of parameters required to model RuBP-limited photosynthesis. Plant, Cell & Environment 26:1419–1430 Bonan GB (2008) Forest and Climate Change: Forcings, Feedbacks, and the Climate Benefits of Forests. Science 320, 1444-1449. Bruijnzeel LA, Scatena FN, Hamilton L (2010) Tropical montane cloud forests: science for conservation and management. Cambridge University Press, New York Cavaleri MA, Reed SC, Smith WK, Wood TA (2015) Urgent need for warming experiments in tropical forests. Global Change Biology 21, 2111–2121, doi: 10.1111/gcb.12860 CIFOR: Locatelli B, Kanninen M, Brockhaus M, Colfer CJP, Murdiyarso D & Santoso H (2008) Facing an uncertain future: How forests and people can adapt to climate change. Forest Perspectives no. 5. CIFOR, Bogor, Indonesia. Coste S, Roggy JC, Imbert P, Born C, Bonal D, Dreyer E (2005) Leaf photosynthetic traits of 14 tropical rain forest species in relation to leaf nitrogen concentration and shade tolerance. Tree Physiology 25:1127–1137 Coste S, Baraloto C, Leroy C, Marcon E, Renaud A, Richardsson AD, Roggy J-C, Schimann H, Uddling J, Hérault B (2010) Assessing foliar chlorophyll contents with the SPAD-502 chlorophyll meter: a calibration test with thirteen tree species of tropical rainforest in French Guiana. Annals of Forest Science 67:607

Master thesis Camille Ziegler - 2015
! ! !29!
Dusenge ME, Wallin G, Gårdesten J, Nlyonzima F, Adolfsson L, Nsabimana D, Uddling J (2015) Photosynthetic capacity of tropical montane tree species in relation to leaf nutrients, successional strategy and growth temperature. Oecologia. DOI 10.1007/s00442-015-3260-3 Evans JR & Poorter H (2001) Photosynthetic acclimation of plants to growth irradiance: the relative importance of specific leaf area and nitrogen partitioning in maximizing carbon gain. Plant, Cell & Environment (2001) 24, 755–767 FAO (2010) Global forest resources assessment 2010 - Main report. FAO Forestry Paper 163, Rome Farquhar GD, von Caemmerer S, Berry JA (1980) A biochemical model of photosynthetic CO2 assimilation in leaves of C3 species. Planta 149:78–90 Gharahi Ghehi N, Werner C, Cizungu NL, Mbonigaba MJJ, Van Ranst E, Butterbach-Bahl K, Kiese R, Boeckx P (2012) Spatial variations of nitrogen trace gas emissions from tropical mountain forests in Nyungwe, Rwanda. Biogeosciences 9:1451-1463 Hallé F. (2014) Un monde sans hiver. Les tropiques, nature et sociétés. Éditions du Seuil, ISBN 978-2-7578-3824-2 Houter NC, Pons TL (2012) Ontogenetic changes in leaf traits of tropical rainforest trees differing in juvenile light requirement. Oecologia 169:33–45 Körner C (2006) Plant CO2 responses: an issue of definition, time and resource supply. New Phytologist 172: 393–411
Lewis SL (2006) Tropical forests and the changing of earth system. Philosophical Transactions of the Royal Society B: Biological Sciences, London 361:195-210
Lewis SL (2009) Increasing carbon storage in intact African tropical forests, Nature 457 (19): 1003-1007 McDonald JH (2014). Handbook of Biological Statistics (3rd ed.) 165-172. Sparky House Publishing, Baltimore, Maryland Medlyn BE, Dreyer E, Ellsworth D, Forstreuter M, Harley PC, Kirschbaum MUF, Le Roux X, Montpied P, Strassemeyer J, Walcroft A, Wang K, Loustau D (2002) Temperature response of parameters of biochemically based model of photosynthesis. II. A review of experimental data. Plant, Cell & Environment 25:1167–1179 Meir P, Levy PE, Grace J, Jarvis PG (2007) Photosynthetic parameters from two contrasting woody vegetation types in West Africa. Plant Ecology 192:277–287
Master thesis Camille Ziegler - 2015
! ! !30!
Mountain Research Initiative EDW Working Group (2015) Elevation-dependent warming in mountain regions of the world. Nature Climate Change. DOI: 10.1038/NCLIMATE2563
Niinemets Ü & Tenhunen JD, (1997) A model separating leaf structural and physiological effects on carbon gain along light gradients for the shade-tolerant species Acer saccharum. Plant, Cell & Environment 20, 845e866. Nsabimana D (2009) Carbon stock and fluxes in Nyungwe forest and Ruhande Arboretum in Rwanda. PhD thesis, University of Gothenburg, Gothenburg Plumptre AJ, Masozera M, Fashing PJ, McNeilage A, Ewango C, Kaplin BA, Liengola I (2002) Biodiversity surveys of the Nyungwe forest reserve in SW Rwanda. WCS working papers no. 18 Sharkey TD, Bernacchi, CJ, Farquhar GD, Singsaa EL (2007). Fitting photosynthetic carbon dioxide response curves for C 3 leaves, Plant, Cell & Environment 30:1035-1040 Uddling J, Gelang-Alfredsson J, Piikki K, Pleijel H (2007) Evaluating the relationship between SPAD-502 chlorophyll meter readings and leaf chlorophyll concentration. Photosynthesis Research 91:37–46 Vårhammar A, Wallin G, McLean CM, Dusenge ME, Medlyn BE, Hasper TB, Nsabimana D, Uddling J (2015) Photosynthetic temperature responses of tree species in Rwanda: evidence of pronounced negative effects of high temperature in montane rainforest climax species. New Phytologist DOI: 10.1111/nph.13291 Valladares F & Niinemets Ü (2008) Shade tolerance, a key plant feature of complex nature and consequences. The Annual Review of Ecology, Evolution, and Systematics 39:237–257 van de Weg MJ, Meir P, Grace J, Ramos GD (2012) Photosynthetic parameters, dark respiration and leaf traits in the canopy of a peruvian tropical montane cloud forest. Oecologia 168:23–34 Watanabe M et al. (2013) Photosynthetic traits of Siebold’s beech and oak saplings grown under free air ozone exposure in northern Japan. Environmental Pollution 174 (2013) 50e56 Way DA & Oren R (2010) Differential responses to changes in growth temperature between trees from different functional groups and biomes: a review and synthesis of data. Tree Physiology 30:669–688

Master thesis Camille Ziegler - 2015
! ! !31!
Appendices Appendix 1: Description of the tree species included in this study, as well as the tree height, stem diameter at breast height (DBH), leaf size and leaf mass per unit area (LMA; mean ± standard deviation) of the trees investigated.
Species Family Succ. type Height (m) DBH (cm) Leaf size (cm2) LMA (g m-2) Hagenia abyssinica Rosaceae Pioneer 8 ± 2 27 ± 6 71 ± 6 67 ± 2 Harungana montana Clusiaceae Pioneer 20 ± 1 41 ± 8 28 ± 2 102 ± 3 Macaranga kilimandscharica
Euphorbiaceae Pioneer 15 ± 2 22 ± 2 44 ± 6 130 ± 6
Ocotea kenyensis Lauraceae Pioneer 22 ± 2 41 ± 12 60 ± 4 133 ± 3 Polyscias fulva Araliaceae Pioneer 20 ± 1 54 ± 5 80 ± 14 172 ± 6 Prunus africana Rosaceae Pioneer 19 ± 2 31 ± 4 39 ± 1 95 ± 14 Carapa grandiflora Meliaceae Climax 19 ± 2 44 ± 9 108 ± 17 167 ± 9 Cleistanthus polystachyus
Euphorbiaceae Climax 18 ± 2 25 ± 4 34 ± 4 109 ± 12
Faurea saligna Proteaceae Climax 25 ± 2 57 ± 7 38 ± 5 125 ± 7 Ficalhoa laurifolia Sladeniaceae Climax 22 ± 1 39 ± 4 17 ± 1 129 ± 8 Strombosia scheffleri Olacaceae Climax 20 ± 3 34 ± 4 77 ± 13 128 ± 4 Syzigium guineene Myrtaceae Climax 20 ± 2 35 ± 11 26 ± 3 156 ± 9
Appendix 2: Plant features associated with shade tolerance. “Low/High” refers to the value of the trait being lower or higher in shade-tolerant species compared to shade-intolerant species.
Feature' Expected'value' Previously'challenged' This'study:'value'/'challenged'?'Physiology'and'biochemistry' !! !! !!Light!compensation!point! Low! No! Predicted!high!/!Yes!Quantum!yield! High! Yes! Low!/!Yes!Dark!respiration!rate! Low! No! No!difference!/!Yes!Net!photosynthetic!rate! Low! Yes! Low!/!No!Electron!transport!rate! Low! No! Low!/!No!Carboxylation!efficiency! Low! No! Low!/!No!Nitrogen!content!per!area! Low! No! No!difference!/!Yes!Chlorophyll!content!per!area! High! Yes! No!difference!/!Yes!Chlorophyll!a/b!ratio! Low! Yes! No!difference!/!Yes!Anatomy'and'morphology' !! !! !!Leaf!mass!per!area! Low! Yes! No!difference!/!Yes!Leaf!thickness! Low! Yes! Low!/!No!Leaf!density! Low! No! No!difference!/!Yes!Leaf!size! Large! Yes! No!difference!/!Yes!

Master thesis Camille Ziegler - 2015
! ! !32!
Appendix 3: Parameters of the relationships between photosynthetic parameters (Vcmax, Jmax), total area-based nitrogen content and nitrogen allocation functions (Ntot, NR, NB, NR+B, NLH), chlorophyll content and optical measurements (SPAD, transmittance).
X' Y' Slope' YAintercept' r2' P'value'Jmax! Vcmax! 2.23! F12.67! 0.97! <0.001'Ntot! Vcmax! F5.11! 68.45! 0.03! 0.57!Ntot! Jmax! F17.7! 155.5! 0.06! 0.44!NR+B! Vcmax! 1.13! 29.43! 0.55! 0.008'NR+B! Jmax! 2.94! 44.06! 0.68! 0.003'NLH! Vcmax! F0.66! 57.66! 0.02! 0.61!NLH! Jmax! F2.71! 124.8! 0.04! 0.63!SPAD! Vcmax! F0.98! 116.3! 0.44! 0.02'SPAD! Jmax! F2.41! 260.4! 0.53! 0.006'SPAD! Ntot! 0.03! 0.64! 0.35! 0.054!Chl! Vcmax! F30.4! 74.36! 0.06! 0.23!Chl! Jmax! F93! 169.1! 0.09! 0.32!Ntot! NR+B! F13.3! 54.73! 0.45! 0.009'Ntot! NLH! F2.29! 21.79! 0.12! 0.2047!NLH! NR+B! F0.14! 26.29! 0.002! 0.16!PNUE! NR+B! 0.36! 3.14! 0.87! <0.001'SPAD! Chl! 0.004! 0.33! 0.14! 0.23!SPAD! %T! F0.09! 7.38! 0.41! 0.03'Chl! %T! F3.41! 3.77! 0.06! 0.46!!
Related Documents