i Report No. 47321-GH Economy-Wide Impact of Oil Discovery in Ghana November 30, 2009 PREM 4 Africa Region Document of the World Bank This document has a restricted distribution and may be used by recipients only in the performance of their official duties. Its contents may not otherwise be disclosed without World Bank authorization.

Welcome message from author
This document is posted to help you gain knowledge. Please leave a comment to let me know what you think about it! Share it to your friends and learn new things together.
Transcript

i
Report No. 47321-GH
Economy-Wide Impact of Oil Discovery in Ghana
November 30, 2009
PREM 4
Africa Region
Document of the World Bank
This document has a restricted distribution and may be used by recipients only in the performance of their official
duties. Its contents may not otherwise be disclosed without World Bank authorization.

ii
GHANA - GOVERNMENT FISCAL YEAR
January, 1 – December 31
CURRENCY EQUIVALENTS
(Exchange Rate Effective as of November 30, 2009)
Currency Unit = Ghana Cedi GH¢1 = US$0.70 US$1 = GH¢1.43
Weights and Measures Metric System
ABBREVIATION AND ACRONYMS
BPEMS - Budget and Public Expenditure Management System CGE - Computable General Equilibrium CPIA - Country Policy and Institutional Assessment DACF - District Common Assembly Fund EITI - Extractive Industries Transparency Initiative GDP - Gross Domestic Product GET - Ghana Education Trust Fund GIFMIS - Ghana Integrated Financial Management Information System GLSS - Ghana Living Standards Survey GNP - Gross National Product GNPC - Ghana National Petroleum Corporation GPRS - Growth and Poverty Reduction Strategy HIPC - Highly Indebted Poor Country IDA - International Development Association IMF - International Monetary Fund MDAs - Ministries, Departments, and Agencies MDGs - Millennium Development Goals MDRI - Multilateral Debt Relief Initiative MOFA - Ministry of Agriculture MoFEP - Ministry of Finance and Economic Planning MTEF - Medium Term Expenditure Framework NEPAD - New Partnership for Africa‘s Development NGL - Natural Gas Liquids NOC - National Oil Company NYEP - National Youth Employment Program ODA - Official Development Assistance PFM - Public Financial Management PIF - Permanent Income Fund PPB - Public Procurement Board PPP - Public Private Partnership PREM - Poverty Reduction Economic Management RER - Real Exchange Rate SF - Stabilization Fund SMEs - Small and Medium Enterprises WAGP - West Africa Gas Pipeline

iii
Vice President: Country Director:
Sector Director: Sector Manager:
Task Team Leader:
Obiageli K. Ezekwesili Ishac Diwan Sudhir Shetty Antonella Bassani Sébastien Dessus
Acknowledgments
The report was prepared by a team led by Sébastien Dessus (Chapter 1), and comprising Denis Medvedev
(Chapter 1), Bryan Land (Chapter 2), Katherine Bain and Smile Kwawukume (Chapter 3), Marcello
Andrade, Carlos Calvacanti and Michael Stevens (Chapter 4), Vivien Foster and Maria Vagliasindi
(Chapter 5), Christopher Costain (Chapter 6), Chris Jackson and Derek Byerlee (Chapter 7). Glaucia
Ferreira, Faye Hartbottle and Ayisha Terewina helped prepare this document. Overall guidance was
provided by Ishac Diwan and Antonella Bassani. Brian Pinto, Kapil Kapoor and Alexander Kyei peer
reviewed this report. Comments, inputs and suggestions were also received from Sunil Mathrani, David
Santley, Ventura Bengoechea, Arto Kovanen, Ross Worthington, Tuan Minh Le, Phillip Keefer, Stepehen
Ndewga, Andrew Norton and Catherine Gamper. Comments and suggestions from the Ministry of Finance
and Economic Planning were coordinated by Amoako Tuffour.

iv
Republic of Ghana
Economy-Wide Impact of Oil Discovery in Ghana
Table of Content
EXECUTIVE SUMMARY ................................................................................................................ VII
1. OVERVIEW ................................................................................................................................... 1
A. INTRODUCTION ............................................................................................................................ 1
B. INSTITUTIONAL AND PUBLIC FINANCIAL MANAGEMENT CHALLENGES ..................................... 4
C. MACRO-ECONOMIC CHALLENGES .............................................................................................. 7
D. PRODUCTIVITY, COMPETITIVENESS, AND SOCIAL CHALLENGES .............................................. 11
E. TRADE-OFFS AND A WAY FORWARD .......................................................................................... 16
2. REVENUE PROJECTIONS ...................................................................................................... 19
A. INTRODUCTION .......................................................................................................................... 19
B. JUBILEE PHASE I BASE CASE ..................................................................................................... 20
C. IMPACTS OF A LARGER RESOURCE BASE .................................................................................. 23
3. POLITICAL ECONOMY DIMENSIONS ................................................................................ 26
A. INTRODUCTION .......................................................................................................................... 26
B. THE ROLE OF POLITICS AND INSTITUTIONS IN DETERMINING THE IMPACT OF OIL ON A
COUNTRY ........................................................................................................................................... 26
C. APPLYING THE POLITICAL AND INSTITUTIONAL DETERMINANTS TO GHANA .......................... 27
D. TAILORING INTERNATIONAL EXPERIENCE IN DESIGNING INSTRUMENTS FOR GOOD
MANAGEMENT OF OIL RENTS TO GHANA .......................................................................................... 30
4. PUBLIC FINANCIAL MANAGEMENT ................................................................................. 35
A. THE ARRIVAL OF OIL REVENUE MAGNIFIES ALREADY EXISTING PUBLIC FINANCIAL
MANAGEMENT CHALLENGES ............................................................................................................. 35
B. STRATEGIC BUDGETING THROUGH A MORE EFFECTIVE MTEF ................................................ 35
C. DEVELOPING THE GIFMIS ........................................................................................................ 38
D. MANAGING THE PUBLIC SECTOR WAGE BILL ........................................................................... 38
E. PUBLIC INVESTMENT ................................................................................................................. 39
5. INFRASTRUCTURE .................................................................................................................. 40
A. FINANCING GAP ......................................................................................................................... 40
B. KEY POLICY ISSUES ................................................................................................................... 43
6. INVESTMENT CLIMATE ........................................................................................................ 45
A. GHANA ALREADY HAS MANY OF THE SYMPTOMS OF DUTCH DISEASE ................................... 45
B. GHANA HAS NOT DEVELOPED A COMPETITIVE MANUFACTURING SECTOR ............................ 45
C. GHANA‘S LACK OF COMPETITIVENESS APPEARS TO STEM FROM POOR PRODUCTIVITY ......... 46
D. LABOR MARKETS DO NOT COMPENSATE FOR LOW PRODUCTIVITY ......................................... 48
E. REGULATIONS ON ONGOING BUSINESS OPERATIONS ARE NOT CONSIDERED BINDING ........... 50
F. FOREIGN INVESTMENT HAS FAVORED COMMODITIES AND SERVICES ...................................... 50
G. ACCESS TO FINANCE IS COMPETITIVE ....................................................................................... 51
H. INCREASING THE DOMESTIC SUPPLY RESPONSE IN NON-TRADABLE SECTORS ....................... 53
I. OVERCOMING THE INFRASTRUCTURE CONSTRAINT ................................................................. 53
J. IMPROVING FACTOR MARKETS ................................................................................................. 53

v
7. AGRICULTURAL COMPETITIVENESS ............................................................................... 56
A. INTRODUCTION .......................................................................................................................... 56
B. OIL AND A CHANGING MACRO-ECONOMIC ENVIRONMENT FOR AGRICULTURE ...................... 56
C. IMPACTS OF EXCHANGE RATE MOVEMENTS AND THE EXTENT OF THE TRADABLE SECTOR.... 58
D. MAINTAINING THE COMPETITIVENESS OF AGRICULTURAL VALUE CHAINS ............................ 60
E. POLICY OPTIONS FOR IMPROVING COMPETITIVENESS .............................................................. 62
F. IMPROVING THE INVESTMENT CLIMATE FOR COMMERCIAL AGRICULTURE ............................ 66
G. CONCLUSION ............................................................................................................................. 67
List of Tables:
Table 1.1: Real Annual Permanent Income, Various Assumptions ......................................................... 8
Table 1.2: Widening Recurrent Deficits Contributed to a Deteriorated Fiscal Balance ......................... 10
Table 1.3: Spending Oil Revenue Would Hurt Agricultural Output and Exports .................................. 14
Table 1.4: An Oil Boom Could Induce Significant Redistribution Effects ............................................ 14
Table 2.1: Jubilee Phase I Base Case - $75/bbl ...................................................................................... 21
Table 3.1: Political Economy Classification of Oil Exporters ............................................................... 34
Table 4.1: Budget Deviations and Deficits Have Been Widening ......................................................... 35
Table 5.1: Indicative Infrastructure Spending Needs in Ghana .............................................................. 41
Table 5.2: Infrastructure Financing Flows to Ghana .............................................................................. 41
Table 5.3: Measures to Address the Infrastructure Financing Gap ........................................................ 42
Table 6.1: Doing Business Indicators ..................................................................................................... 50
Table 6.2: Inward FDI Stock as a Percentage of GDP ........................................................................... 51
Table 6.3: Analysis of Commercial Bank Lending to Enterprises ......................................................... 53
Table 6.4: Public Sector Wage Premiums Are High and Growing ........................................................ 55
Table 7.1: Returns to Public Investment in Agriculture and Impacts on Poverty Reduction ................. 64
List of Figures:
Figure 1.1: Peaking in 2011-16, Oil Extraction Could Add US$1 Billion to Ghana‘s Budget ................ 1
Figure 1.2: Without Reforms, Oil Could Lower Per Capita Incomes in the Long Run ......................... 12
Figure 1.3: Key Reforms Would Greatly Magnify the Developmental Impact of Oil ........................... 18
Figure 5.1: Historic and Potential Future Links Between Infrastructure and Growth ............................ 40
Figure 6.1: Since 2004, GDP Growth Has Been Concentrated in the Non-Tradable Sectors ................ 45
Figure 6.2: Labor Productivity is Particularly Low in Ghana‘s SMEs................................................... 47
Figure 6.3: Median Capital Intensity is Lowest for Ghana .................................................................... 47
Figure 6.4: In Ghana Relatively Fewer Firms Export ............................................................................ 48
Figure 6.5: Median Labor Productivity is Relatively Low in Ghana ..................................................... 49
Figure 6.6: Manufacturing Constitutes Only a Small Fraction of Ghana‘s GDP ................................... 49
Figure 6.7: Access to Land is Difficult in Urban Areas ......................................................................... 54
Figure 7.1: The Composition of Cocoa Marketing Costs in 1995–98 and 2006–08 .............................. 61
List of Boxes
Box 2.1: Some Parameters Affecting Pre-tax Petroleum Economics..................................................... 22
Box 2.2: The Fiscal Regime for the Jubilee Field .................................................................................. 23
Box 3.1: São Tomé‘s Oil Fund ............................................................................................................... 32
Box 6.1: Global Competitiveness Index ................................................................................................. 46
Box 7.1: Nigeria and Chile in a Resource Boom ................................................................................... 58
Box 7.2: Price Transmission and the Extent of Tradability ................................................................... 59

vi
Box 7.3: Exchange Rate Appreciation and Forward Cocoa Sales .......................................................... 61
Box 7.4: Can Ghana Increase Value Addition In Cocoa? ...................................................................... 61
Box 7.5: Subsidies versus Investments .................................................................................................. 65
Box 7.6: Exploiting the Agricultural Potential of Northern Ghana ........................................................ 66
Box 7.7: Extending the Benefits of Private Investments through Outgrower Schemes ......................... 67
List of Annexes
Annex 1: The Computable General Equilibrium (CGE) Model ............................................................. 69

vii
EXECUTIVE SUMMARY
Ghana‘s oil will start to flow in 2011, maybe even before, and most of its known reserves will be
extracted in the immediate years after. The promise of oil generates expectations of all sorts, the
more so as Ghana currently grapples with a macroeconomic crisis of significant proportions.
Ghana‘s reserves are relatively modest by international standards, and will thus not radically
transform Ghana‘s economy into one where oil becomes the major sector. Nonetheless, they are
already large enough to deeply affect the future of the non-oil economy, positively or negatively.
As liquidity constrained, Ghana‘s economy could expect high development returns from oil. But
without sufficient preparation, risks of misuse of oil revenue are considerable, to the extent that it
could even lead to a decline in per capita incomes in absolute terms after the initial boom years.
The political capture of oil rents could also revert some of the important progress made in Ghana
in terms of governance and executive accountability. Hence the huge premium and
responsibilities put on Ghana‘s successive authorities to wisely manage the oil wealth.
In Ghana, like in any country facing a similar challenge, the fundamental issue is the acceptance
and ability of ruling political forces to renounce the discretionary power provided by windfall
revenues. Indeed, political calendars might not align themselves well to the sequence of reforms
required to ensure that the spending of the oil rent is of sufficient quality. Various options are
technically possible to limit discretionary use, but their effective implementation is all predicated
on consensus building among political forces, and on the recognition that the threat of letting
other parties take advantage of a discretionary use of funds (and its consequences on institutional
stability) could be potentially more harmful than the benefit it could derive from such funds.
Given the now high likelihood of democratic power transition in Ghana, the current
administration could find interest in limiting future governments‘ discretionary use of oil revenue.
Building the right environment for ensuring a pro-developmental use of oil revenue comprises
many dimensions. First and foremost is transparency in oil revenue and its allocation, through
disclosure of contracts and its full inclusion in the budget process. In turn, increased transparency
should open the door to design a home-grown institutional response to the risk of political
capture. Various experiences from the rest of the world can inspire Ghana, but none of them will
become effective if not fully and broadly owned locally. Second is the need to raise
Government‘s ability to manage such additional oil revenue and channel it towards projects with
high social returns, through restored fiscal sustainability and improved capacity in public financial
management, macro-economic and debt management and cost-benefit analysis. Third is the need
to remove bottlenecks in the real economy which could generate rents and induce suboptimal
investment decisions. The report identifies the following set of actions as critical preparatory
steps for an effective pro-poor use of oil revenue:
Increase transparency on oil revenue. Transparency could be improved as Ghana adopts
and implements a Freedom of Information Act; and stipulates/enforces accountability
mechanisms regarding: (i) the publication of reports on revenue and their use, and (ii) the
disclosure of bidders‘ identity and bidding documents. The Extractive Industries Transparency
Initiative would support such actions.

viii
Restore fiscal sustainability. High fiscal deficits threaten macro-economic stability, and
using oil revenue to finance them would only postpone the adjustment while missing an important
development opportunity. The needed adjustment will call in particular for tackling long standing
issues in public sector and energy, while strengthening public financial management capacities.1
Restoring fiscal sustainability would also go against borrowing externally on non concessional
terms beyond reasonable limits, given associated risks for debt sustainability.
Remove bottlenecks in non-tradable sectors. Dutch disease effects would be mitigated
by removing constraint to competition and domestic supply response in non-tradable sectors,
including: high barriers to entry into formal sectors (starting a business, labor regulation and
minimum wages, access to finance, urban land tenure), and lacking infrastructure (water,
electricity) for urban SMEs. The latter would benefit from higher consideration to Public Private
Partnership options, leaving greater financial capacity for the Government to finance projects with
high social returns.
Introduce stabilization mechanisms for managing oil price volatility. The first
mechanism would consist in restoring the pass through of international prices into gasoline and
utilities tariff, along with establishing targeted mechanisms to protect the poor. A second
mechanism to shield the budget from oil price volatility and reserves uncertainty would consist in
establishing an Oil Fund, from which predictable transfers would be made to the budget.
Increase the provision of agricultural public goods. The agricultural sector might be the
most affected by an oil-related boom and bust cycle. Given the high social return and pro-poor
impact of investing in agriculture, greater than ever attention should be paid to support the
provision of various public goods for agriculture, including feeder roads, research, extension
services, water and power supplies, storage capacities, irrigation for smallholders, and safety
standards.
Many of these actions are currently contemplated by the Government to raise the quality of
spending the oil rent and some of them are already being implemented. But most of them will also
take time to be completed, which calls for sequencing and the prioritization of measures aimed at
raising transparency and restoring macro-economic stability, as oil extraction will peak in the
very next years. In the face of it, adopting a mechanism to ensure the channeling of a stable and
predictable amount to the budget in these years would minimize risks implied by possible delays
in structural reforms.
1 See World Bank (2009h) for a detailed discussion on the possible content of these reforms.

1. OVERVIEW
A. INTRODUCTION
1.1 Ghana recently found crude oil off the shores of its Western Atlantic Coast. Jubilee
field‘s estimated reserves2, as of October 2009, amount to 490 million barrels of high-quality oil
and justify commercial exploitation should barrel oil prices exceed US$30. At its peak (mid
2011- mid 2016), some 120,000 barrels of oil per day could be extracted – making Ghana a net
oil exporter for a short while,3 and the overall period of activity could span over two decades.
Based on the fiscal regime in place,4 and a price assumption of US$75 per barrel,
5 the World
Bank‘s central estimate puts potential government revenue at US$1.0 billion on average per year
between 2011 and 2029. By way of comparison, government revenue in 2008 reached US$3.7
billion (excluding grants) and GDP US$16.1 billion. Such level of proven reserves puts Ghana at
par with neighboring Cameroon (400 million barrels) and above Côte d‘Ivoire (100 million
barrels), but much below Nigeria (36,200 million barrels).
Figure 1.1: Peaking in 2011-16, Oil Extraction Could Add US$1 Billion to Ghana‘s Budget
Source: World Bank staff calculations
1.2 The oil revenue estimate is subject to a large sensitivity. A number of parameters
could modify this central estimate. Given fixed costs of extraction, higher/lower oil prices would
2 Certified proven reserves were still amounting to 278 million barrels by October 2009. However, GNPC‘s central
estimate (P50) was also at 490 million barrels, and most observers were considering the level of certified proven
reserves for Jubilee Phase 1 as severely underestimated. As this report tries to assess the economy wide impact of oil
discovery, the use GNPC‘s central estimate - rather than certified level - is preferred, acknowledging the uncertainty
attached to this number. A sensitivity analysis on reserves is presented in Chapter 2. 3 IMF(2009) projects that Ghana‘s oil supply (from Jubilee Phase I) will enjoy an exportable surplus between 2011
and 2016, before domestic demand re-exceeds supply. 4 The regime in place applies to the consortium in charge of the Jubilee field exploitation. The consortium comprises
Tullow Oil, Kosmos Energy, Anadarko Petroleum, Sabre Oil and Gas, and the EO group, all of which are small-
scale operators. The fiscal regime comprises the following elements: a 5 percent royalty for oil revenue; a 10 percent
tax on petroleum revenue net of royalty and operational expenses (i.e., the oil rent); a share of the oil rent growing
with the rent amounts; and 35 percent income tax. 5 Source: World Bank (2009a). The price is expressed in real terms and is assumed to span over the 20-year period
of extraction (that is, between 2011 and 2029).
Gross Revenue & Government Revenue
US$ millions (real)
0
500
1000
1500
2000
2500
3000
3500
2008
2010
2012
2014
2016
2018
2020
2022
2024
2026
2028
Government Revenues at different oil prices
US$mn
0
500
1000
1500
2000
2500
3000
3500
2011
2013
2015
2017
2019
2021
2023
2025
2027
2029
$100
$75
$50
$30

- 2 -
disproportionally affect revenue. At US$50 per barrel, government revenue would go down to an
average of US$0.4 billion per year; at US$100 per barrel, government revenue would conversely
go up to an average of US$1.6 billion per year. Besides, higher cost of extraction could also
significantly impact revenue. A 25 percent overrun in cumulated capital costs (estimated at
US$3.4 billion over the period 2009-12) would reduce government revenue by 14 percent. A
two-year production peak (instead of a five-year peak) could also reduce government revenue to
US$0.4 billion per year. On the other hand, additional reserves could be discovered in 2009 as
drilling goes on in the Jubilee Field, with the potential to double oil production (and increase
even more revenue if facilities already in place could be used to exploit these new reserves).
1.3 Changes in the equity structure could also affect the stream of Government revenue.
Following the initial exploration phase and the confirmation of commercial reserves, the
Government of Ghana, through its national company, the Ghana National Petroleum Corporation
(GNPC), could find interest in acquiring supplementary shares in the consortium. This could
give additional voice to the Government to promote national interests (e.g. local content,
environment preservation, greater control over investment and operation decisions), and, should
stakes be underpriced, be financially rewarding over the medium term. At the same time,
borrowing for it would reduce net public oil revenue in the initial years (given the need to service
the related debt and contribute to capital expenditures), and have important implications for
overall public debt sustainability.6 It would increase Ghana's exposure to oil risk, while also
reducing opportunities to use borrowed capital in other venture.
1.4 Gas comes along with oil. Gas would be produced in association with oil at a rate of one
thousand cubic feet of gas per barrel of oil. Thus, at peak Phase 1 Jubilee production, Ghana
could produce 120 million cubic feet of gas per day. Given Ghana‘s non-flaring policy, Jubilee
production facilities include capacity to re-inject gas. However, plans underway to build
pipelines and processing facilities would result in streams of dry processed gas for use in power
generation and natural gas liquids (NGL) for export and domestic use. At current world market
NGL prices and a dry gas price of US$2 per thousand cubic feet, gross revenues would be
roughly US$260 million per year, that is, less than a tenth of oil gross revenue. In turn, the
combination of corporate taxation and an assumed 50 percent equity ownership for GNPC in the
gas infrastructure would generate US$120 million per year for the Government. To this figure
could be added an implicit rent of US$140 million originating from the difference between a dry
gas market value of US$6 per thousand cubic feet (as measured by the delivered price of gas
from the West Africa Gas Pipeline, WAGP) and that of US$2 reflecting the cost of extracting,
transporting and processing the gas
1.5 In the medium term, gas exploitation could encourage the development of several
downstream activities. Unlike oil and NGL, dry gas cannot be easily stored and exported. But
with the availability of a gas pipeline, several downstream activities could be undertaken, the
most immediate being electricity generation through the conversion of existing and planned
power stations from oil to gas, which would generate significant cost reduction. At this stage,
derived job creation should remain modest. Further value added could be generated by
supplying gas to industries needing a direct heating source, such as cement, food processing,
smelting, etc. LNG, methanol or other large-scale gas conversion and export projects would
require much larger gas reserves than currently assessed – at least double, given the large fixed
6 As reported by the press in November 2009, the value of Kosmos‘s shares would broadly correspond to Ghana‘s
total external public debt by end-2008, US$4 billion.

- 3 -
capital costs needed to develop these activities over a long period of time in highly competitive
global markets. At that stage, the impact of job creation could be more substantial, depending on
the nature of industrial choices retained.7 In all events, the intended use of the gas rent would
require transparent decision making, as for any other public resource. While the rent could be
passed to electricity consumers8 - Ghanaian households and/or firms and foreign clients if
electricity is exported, other choices could be made. This could for instance include transferring
the rent to the consolidated fund, or leaving it to GNPC which could charge for gas supply at
market values.
1.6 Unlike gas, oil discovery will primarily impact the economy through the budget. As
located off-shore and demanding equipments and expertise not yet available in Ghana, the
extraction of oil will not generate significant backward linkages (in terms of demand for
domestic inputs and upstream activities) in the short to medium term. And unlike gas, forward
linkages and related downstream activities are also expected to be minimal, but through their
impact on the budget. Oil revenue will be shared among the Government and the foreign
companies in the consortium, with the assumption that the latter will repatriate all their revenue
abroad. From an analytical perspective, this report thus chooses to retain the Gross National
Product (GNP) as the measure of national welfare in its quantitative analyses, rather than a GDP
that is inflated with oil exports but whose proceeds would not stay in Ghana.
1.7 Oil discovery brings promises and raises expectations, given Ghana‘s high
development needs, and aspiration to quickly join the group of middle income countries.
The combined manifestos of the two major parties running for presidential elections in late 2008
expressed intentions to apply oil revenue to priority areas of infrastructure, agriculture and food
processing, ICT, education, health, rural development, housing, water and sanitation, among
others. In the shorter term, oil revenue as it comes on board in 2011 could also help Ghana
address its large fiscal and external imbalances, and cushion the negative impact of the current
global economic crisis. By end-2008, Ghana‘s fiscal and external deficits represented
respectively 14.5 and 18.7 percent of GDP.
1.8 But oil revenue also brings the so-well known challenges associated with it, in terms
of institutional and macro-economic absorptive capacities. These challenges are of various
natures, but reinforce each other. A first set of challenges concern the capture of oil resources by
groups or individuals to satisfy their personal interests rather than the public good. The second
set of challenges relates to the management and use of a volatile, uncertain and exhaustible
source of revenue. From a narrow economic perspective, these challenges can all be seen as that
of converting oil revenue into high social return investment projects which will effectively raise
the long-term growth rate of the economy, rather than financing immediate consumption. Such
challenges potentially raise concerns about Ghana‘s ability to protect the strong growth and
poverty alleviation momentum engendered since the early 1990s.
7 Preliminary calculations suggest that the arrival of gas in 2012 (from Jubilee Phase 1) could roughly generate 20-
30 thousand jobs (against a labor force of 9 million by that time) in the years after through derived demand for labor
in various sectors. A doubling of available gas resources from 2015 onwards could generate another 25-35 thousand
new jobs afterwards, depending on the pace of reforms needed to improve Ghana‘s economic environment, see
Section 1.E. 8 From an equity perspective, a case could be made for instance to subsidize electricity connections (through rural
electrification projects for instance) rather than subsidize the price of electricity, which only benefit to those already
connected.

- 4 -
1.9 This overview discusses the Ghana-specific nature of these challenges and explores
possible options to address them. In doing so, it builds on seven thematic chapters which look
at different aspects of the question: (1) oil facts, (2) political economy, (3) public financial
management, (4) infrastructure, (5) private sector development, (6) agriculture, and (7) poverty.9
While the overview tries to bring together the findings of these different chapters, further details
and discussions on each of these topics can be found in of the chapters themselves. It concludes
that while oil revenue will not be large enough to radically transform Ghana, it could, if
improperly managed, impose enough stress on non-oil sectors to severely undermine Ghana‘s
medium term development prospects. Hence the huge premium and responsibilities put on
Ghana‘s successive authorities to wisely manage the oil wealth to promote the development of
the non-oil sectors.
B. INSTITUTIONAL AND PUBLIC FINANCIAL MANAGEMENT CHALLENGES
1.10 With the exception of a few industrialized countries, the governance record of most
oil exporters is at best mixed – and thus possibly worrisome for Ghana. The recent example of
Chad, who denied its initial commitments on the use of oil proceeds, illustrates how challenging
it can be to design solid institutional mechanisms in this regard. Oil-related civil conflicts in
Nigeria also point to possible risks of social destabilization. Rent-seeking and corruption,
political patronage, lower entrepreneurship and capacity for investment, and increased
authoritarianism and civil conflict are common problems that confront countries that have
discovered oil.
1.11 Nonetheless, Ghana benefits from a strong institutional basis. Ghana can be
considered as a young democracy with several strengths: there is no dominant single party in
Ghana, parties are quite well institutionalized, traditional leaders provide some restraint on the
capacity of the Executive to pursue its own self-interest, and extra-institutional interventions (for
instance from the military) are rare in comparison to other neighboring countries (World Bank,
2007). These, and other quantifiable governance indicators,10
explain why Ghana does so well on
the World Bank‘s Country Performance Indicator Assessment (CPIA), where it ranked 5th
among the 75 low-income countries in 2007. The successful democratic transition from
December 2008 is another important expression of the maturity of Ghanaian institutions at their
highest level. Risks of institutional failures are thus reduced in comparison with other countries
endowed with poorer institutions, and the range of policy options to address the risk of
governance failure is probably wider.
1.12 At the same time, the review of Ghana's institutional framework points to serious
risks of political capture of oil revenue. Ghana‘s young democracy can also be considered
―factional.‖ World Bank (2007) shows how the political incentives in Ghana produce a high
level of clientele and patronage politics. Ghana spends more, on average, on targeted
expenditures, such as the public sector wage bill, energy subsidies, and earmarks – the very
reason of widening public deficits in the recent years (see Table 1.2 below), and less for the
provision of public goods, such as the rule of law, quality of education or the lengths it goes to
9 The overview and report focus only on the use of oil revenue, leaving aside contracting/revenue sharing and
environmental issues 10
Worldwide Governance indicators (World Bank, 2009b) also rank Ghana among the very first African countries
in terms of voice and accountability, regulatory quality, control of corruption, rule of law and government
effectiveness. For all these indicators, Ghana recorded significant progress between 1998 and 2007.
- 5 -
fight corruption. Besides, Ghana exhibits large and increasing social polarization (urban vs. rural,
south vs. north) and the role of ethnic identity seems to be increasing with ethnic grievances
rising. Finally, Ghana displays low levels of civic counterweight, for which a number of studies
show that information is the most binding constraint to more executive accountability through
vertical means.11
1.13 In the face of such challenges, the fundamental issue is the acceptance and ability of
ruling political forces to renounce the discretionary power provided by windfall revenues.
Indeed, political calendars might not align themselves well to the sequence of reforms required
to ensure sufficient quality of spending the oil rent. Various options are technically possible to
limit discretionary use (e.g. fiscal responsibility rules, oil funds, efficient public financial
management systems). But their effective implementation are all predicated on consensus
building among political forces and on the recognition that the threat of letting other parties take
advantage of a discretionary use of funds (and its consequences on institutional stability) could
be potentially more harmful than the benefit it could derive from such funds (Bourguignon and
Dessus, 2009). In the face of it, improved economic transparency is a sine qua non condition, and
probably the best vehicle for initiating momentum for reform, especially in vertical political
structures where programmatic parties are absent, as in Ghana. The fact that the current macro-
economic situation came as a surprise to the new government12
reflects the extent of progress
which can still be made in terms of economic transparency and commitment to sound budget
execution and public financial management principles.13
1.14 Given the now high likelihood of democratic transition in Ghana, the current
administration could find interest in limiting future governments‘ discretionary use of oil
revenue through improved transparency. Minimizing risks of political capture calls for the
establishment of an early consensus among all stakeholders (including agricultural producers) on
the management of oil, and a clear institutional framework with embedded accountability and
transparency mechanisms to deal with oil companies and oversee the channeling of these funds
to the budget. In contrast, technical solutions – such as the creation of special institutions for the
management of oil resources – are deemed to fail to deliver their intended objectives, unless
emanating from a civil society which can be mobilized against misuse and for better quality of
spending through greater transparency. The latter could be achieved as: (i) Ghana adopts a
Freedom of Information Act; and (ii) stipulates/enforces accountability mechanisms regarding
the publication of reports on revenue and their use, and the disclosure of bidders‘ identity and
bidding documents. Improved transparency could then pave the way for strengthening social
accountability mechanisms, at a juncture where the absence of absolute majority at the
Parliament also gives the authorities greater incentives to seek consensus. From an operational
perspective, social accountability could be reinforced by: (i) expanding the national dialogue on
oil initiated in 2008, focusing on the design of the institutional framework for transparently
11
Confused intergovernmental arrangements that limit potential entry points, weak enforcement capacity of the state
which leads citizens to put little value in participating since there is no ultimate recourse, a plethora of
uncoordinated instruments that do not add up to much impact at the national level and, finally, a weak and poorly
organized civil society that has little influence on policy debates or their oversight also contribute to the weakness of
Ghana‘s civic counterweights and executive accountability. 12
On January 19, 2009, soon after Presidential elections, the Economic Subcommittee of the Government Transition
Team declared the Government of Ghana ―broke,‖ when discovering the extent of macro-economic deficits. This
statement came in contrast to the promises made during the election campaign. 13
The decision to relax commitment controls for the Energy Ministry in late 2007 significantly contributed to the
build-up of arrears and outstanding commitments discovered by mid-2009.

- 6 -
managing oil revenue; and (ii) capacity building for effective Parliamentarian oversight of oil
issues and technical management within the Government.
1.15 At the extreme, a citizen fund could be envisaged, but this would imply renouncing
the ambition of Government to uses oil revenues for the collective good, rather than simply
transferring a portion of the rents to individual citizens. Although challenging from a
logistical perspective, the direct distribution of the oil rent to citizens in the form of cash
handouts could be envisaged in Ghana, would possibly receive popular support and could
provide the needed constituency for good governance of this new resource (Moss and Young,
2009). This solution, however, is only optimal if one considers the risks of misuse and poor
governance as high in Ghana, and if one is convinced that a direct transfer will solidify the social
contract between the Government and its citizens, as it is argued has been the case in Alaska.
For, in order to adopt a direct transfer model, there must be a strong case that the Government is
not capable of managing the resources, on behalf of its citizens, and cannot provide Ghana with
some of the collective goods it needs so badly to meet its common, development goals, notably
in the infrastructure and basic services sectors. Clearly, as this report points out, there is much
that needs to be done – both immediately and in the long-term - to ensure that Government does
indeed have the capacity and the incentives for managing well these rents. If this can be
accomplished, the rents could then be put towards collective goods that will likely have a greater
development impact than enhancing individual welfare through a direct transfer.
1.16 Another related risk is the inability of the administration and budget processes to
simply control the amounts and effective allocation of funds to their designated use. Large
and growing budget execution deviations illustrate Ghana‘s difficulties to enforce its budget law.
Unless addressed rapidly, risks of oil revenue being diverted from its designated use will remain
high, and Ghana could even enter in a cycle where mismanaged oil revenue could undermine
progress achieved in broad public financial management in the last years. However, earmarking
oil revenue to specific projects would not solve the problem, but would rather increase budget
rigidity and reduce people and Parliament oversight on public resource allocation. It would also
lessen the possibility to encourage program performance through an effective medium-term
expenditure framework (MTEF).
1.17 Prime attention should be given to payroll management. In the recent years, the
greatest source of budget deviation has originated from un-budgeted increases in public
employees‘ individual remunerations. As already argued above, these practices are driven by
political motivations, and thus need to be addressed politically, with a view to avoid the risk that
civil service capture the oil rent for itself. From a practical perspective, ongoing negotiations on
the payroll reform provide the opportunity to review the payroll in light of related service
delivery and fiscal affordability, and explore ways to improve public sector productivity
(capacity building, wage levels and structure, etc.). Once done, technical solutions envisaged to
improving payroll management (aligning budget and wage negotiation processes, strengthening
oversight of records regarding the entrance, exit and the transfers of employees, upgrading the
payroll management and control software - IPPD-2, as part of an upgraded GIFMIS) would then
become much more effective.
1.18 Public investment effectiveness is another important dimension to act on. Beyond
will, converting oil revenue into public investments requires a number of supportive elements.
The first one is budget revenue predictability, as in its absence public spending typically shifts
from investment to consumption activities (Celasun and Walliser, 2008). As oil revenue starts to

- 7 -
flow, budget predictability would be strengthened by (i) the development of tools to manage oil
price volatility and uncertainties related to extraction (reserves, costs), and (ii) reduced upward
expenditures deviations (which need financing). The second one is an effective MTEF, which
makes investment decisions consistent (and thus more realistic) with those related to other
spending categories,14
personal emoluments in particular. The complementarity between capital
and current expenditures is also central to effective service delivery. Finally, investment
effectiveness would be strengthened through greater screening capacities, requiring that
investment project selection be guided by clearly defined priorities, competitive bidding when
required,15
and the preparation of pre-feasibility studies (including the calculation of net present
social value using either cost-benefit or minimal-cost analysis). Should private participation be
sought, frameworks for soliciting, selecting and managing private investment in sectors of
interest (energy and telecommunications notably) should be developed.
C. MACRO-ECONOMIC CHALLENGES
1.19 With oil forthcoming, Ghana is confronted with two major macro-economic
challenges. The first one, specifically related to oil, is the management of oil price and output
volatility and the unpredictability associated with it. The second one is the nature and recent
evolution of the recurrent fiscal balance, which, if left unaddressed, will elevate pressure to use
oil revenue to cover public consumption expenditures rather than to finance needed investments.
1.20 Budget stabilization requirements prevent the direct transmission of oil revenue to
the budget. Ample variations in international oil prices (and hence oil revenue) are incompatible
with sound budget execution, and in turn negative for investment planning and the development
of medium-term frameworks. In practice, addressing volatile issues boils down to fixing the
share of oil revenue to be transferred to the budget,16
and investing the remainder abroad (given
the need to decouple these investments from Ghana‘s economic cycles). A first stabilization
mechanism consists of setting up a reference price (typically equal to the long- term price
forecast), and transferring only the revenue from oil production evaluated at that reference price
to the budget, and saving the remainder in a Stabilization Fund (SF) if the actual price is higher,
or tapping such a fund if the actual price is lower. A second mechanism consists of building a
Permanent Income Fund (PIF) - or ―heritage‖ fund, where only the interest rate revenue from the
accumulated assets is channeled to the budget. 17
World price and real interest rates assumptions
would determine the income which can be spent every year, even after oil reserves have been
14
In this endeavor, an effective MTEF would benefit from the re-classification of current vs. capital expenditures.
For instance, the development funds (the District Common Assembly Fund (DACF), the Road Fund, and the Ghana
Education Trust Fund (GET) – which represented 3.2 percent of GDP in 2008), which are classified as capital
expenditures, actually finance the National Youth Employment Program (NYEP) which employs above 100,000
people. 15
Since 2005, the Public Procurement Board (PPB) focuses on enforcing the use of open competition (national and
international competitive tender) above the minimum threshold, and on reviewing / authorizing requests from MDAs
that wish to use less competitive procurement methods. Nevertheless, the degree of adherence and compliance with
public procurement rules remains uncertain in the absence of a monitoring system of procurement by value. 16
For the sake of budget transparency though, all oil revenue would be accounted for in the budget, with some
portion being saved in oil fund(s) and the remainder treated just as the same as any other government income. 17
In contrast, the proposal tabled for discussion by MoFEP‘s fiscal regime technical team under Ghana‘s previous
administration to channel two-thirds of oil revenue to the budget would have failed to insulate the budget from
volatility in crude oil prices. The proposal was envisaging using the remainder to set up the Petroleum Regulatory
Authority and the National Oil Company (NOC) in a first phase (the first 3 years of extraction). In a second phase,
the remainder would have been used to set up a heritage fund (40 percent) and a stabilization fund (60 percent).

- 8 -
exhausted. Ongoing discussion related to the preparation of an oil revenue management bill
provides the opportunity to address these concerns in a transparent manner.
1.21 Stabilization and Permanent Income funds differ on several grounds. Beyond
sharing similar stabilization objectives, both funds also require solid institutional frameworks to
be effective, regarding in particular investment strategies. And none of these funds is effective to
protect fiscal sustainability in the absence of control mechanisms on the general budget.18
But
these funds also differ on two important grounds. The first one regards amounts to be channeled
to the budget and their exhaustive nature. With a SF, all oil revenue will have been spent at the
end of the extraction period, assuming that the reference price is correctly set (i.e. that forecasts
are fulfilled). In contrast, with a PIF, only a share of oil revenue will have (by definition, as
―permanent‖) been spent by the end of the extraction period. In the example set below, amounts
spent under a PIF over the extraction period would only represent 45 percent of Ghana‘s total oil
revenue over the same period. The second one regards the sensitivity of the spending rules
attached to the two funds with respect to a sudden change in world prices or new discovery.
1.22 Under conservative assumptions, a Permanent Income Fund in Ghana could
generate US$458 million per year, given the stream of expected oil revenue discussed above at
US$75 per barrel and a real interest rate at 3 percent.19
This amount (expressed in real terms
using 2008 prices) is broadly equivalent to the amount of official transfers (Official
Development Assistance, ODA) received annually in the last 5 years (2004-8), and represents 45
percent of the US$1,021 million expected annually from oil revenue (and to be spent with a SF
under perfect price forecasting). The table below gives a sense of the sensitivity of the permanent
income to various assumptions regarding oil prices and real interest rates.20
All amounts are
expressed in real terms (US$ 2008).
Table 1.1: Real Annual Permanent Income, Various Assumptions (US$ millions)
Real Interest rate 1% 3% 5%
Oil Price (US$ per barrel)
50 79 203 293
75 179 458 660
100 270 697 1,010
Source: World Bank staff calculations
1.23 It is worth emphasizing that a Permanent Income Fund would need to be invested
abroad. Beyond the need to decouple PIF investments from Ghana‘s cycles to manage
volatility, the permanency of incomes can only be insured if financial returns on the PIF are
guaranteed. For that reason, it is not advisable to invest in projects which can be justified for
their high social returns (and would thus be in almost all cases domestic), but with low
commercial returns (van Wijnbergen, 2008). This is the case of a number of public investment
18
The fiscal responsibility law currently in preparation with IMF technical assistance could help enforcing a hard
budget constraint along with PFM reforms addressing the issues discussed in the paper, and an effective MTEF (see
World Bank, 2009c, for greater discussion of these issues). 19
See van Winjbergen (2008) for a detailed discussion on permanent income funds. 20
An alternative way is to compute the permanent income in per capita terms, which is obtained by subtracting from
the real interest rate the population growth rate. With a 1.6 percent annual population growth rate projected for the
period 2010-2030 (Source: World Development Indicators), the real permanent income would be US$214 million
for a real interest rate of 3 percent and a barrel price at US$75.

- 9 -
projects, which are public to begin with because their low commercial returns make their
implementation uninteresting to the private sector. PIF should thus be constituted of commercial
investments abroad (e.g. stock markets and sovereign bonds of non-oil high income countries).
However, the permanent income (the annual interest income generated by the PIF) channeled to
the budget could certainly be used to finance domestic investment projects with high social
returns.
1.24 A Stabilization Fund would be more sensitive to changing price and oil reserve
assumptions, particularly during the peak period of extraction. Revisions in world oil price
assumptions (or similarly, oil price forecast errors) would affect similarly (in relative terms) the
amounts channeled to the budget from a Stabilization Fund or a Permanent Income Fund.21
Nonetheless, changes in amounts channeled to the budget in absolute terms following a revision
in world price assumptions or reserves could differ much more widely. For instance, with a
Stabilization Fund a revision upwards of long-term world oil prices to US$100 per barrel in 2015
would channel an additional US$1.1 billion to the Ghanaian economy, whereas with a Permanent
Income Fund, it would channel US$240 million. In turn, political pressures to frequently revise
world price assumptions might be more pronounced with a Stabilization Fund, as immediate
stakes are higher. Similarly, a sudden change in reserves assumptions would affect amounts
channeled to the budget much more immediately under a SF than under a PIF.
1.25 While a PIF can be considered as an extreme solution, there is probably still a need
to decouple transfers to the budget from the extraction profile. By equating transfers over an
infinite number of years, a PIF might be considered extremist as placing stabilization needs
before development needs, even if at the same time preserving inter-generational equity. But
aiming at neutralizing price volatility only would induce great budget volatility in the next
decade given the known extraction profile as of today (see Figure 1.1). In turn, the revenue
management framework could also consider including a mechanism to decouple transfers from
the yearly extraction profile.
1.26 Budget stabilization requirements also call for better management of energy-related
subsidies. Even more pressing in terms of budget execution is the management of subsidies to
energy related state-owned enterprises. Although benefiting from a favorable electricity
generation mix (hydro vs. thermal), public transfers to the energy sector still absorbed 1.2
percent of GDP in 2008. Transfers paid mostly for below-cost recovery tariffs and are therefore
largely absorbing oil prices fluctuations, transmitting them directly to the expenditure side of the
budget. In the face of it, the authorities could consider raising the pass through of world prices to
domestic consumer prices (i.e. aligning tariffs to production costs). This could be done while
protecting the most vulnerable consumers through a progressive tariff structure and/or targeted
transfers. The use of domestic gas in the near future could also be an element of greater
predictability in electricity costs.
1.27 More generally, the recent drop in the Ghana‘s fiscal recurrent balance undermines
its ability to use oil revenue for financing investment. In the last four years, Ghana‘s recurrent
21
Typically, the legal framework establishing such funds grants the Government with the possibility to amend
amounts transferred to the budget‘s consolidated fund based on the annual estimate of the permanent income
(certified by independent auditors), or of the revenue benchmark in case of a stabilization fund. In case where the
Government wants to exceed the legal appropriation, detailed explanation is generally to be provided to the
Parliament, such as in Timor-Leste‘s Petroleum Fund.

- 10 -
balance declined by more than 6 percentage points of GDP (from 8.3 to 2.1 percent of GDP),
mostly as a consequence of increased public sector wages and energy subsidies.22
The promised
―single spine‖ payroll reform, pending issues related to payroll management, and the absence of
cost-recovery mechanism in the energy sector are all threatening to bring this balance further
down. With a recurrent balance at 2 percent and concessional borrowing historically at 5 percent
of GDP, Ghana with Development Partners can now finance 7 percent worth of investment
expenditure, far below the 10-11 percent needed to rapidly close its infrastructure gap.23
Table 1.2: Widening Recurrent Deficits Contributed to a Deteriorated Fiscal Balance Ghana recurrent and overall fiscal balance, 2005-8 (as a percentage of GDP)
2005 2006 2007 2008
Total revenue 27.1 27.3 28.8 27.5
Recurrent expenditure 18.8 22.0 22.9 25.4
Wages 8.5 9.7 10.1 11.3
Good and services 3.2 3.7 4.0 3.7
Social transfers 2.7 2.9 4.3 3.8
Energy subsidies 0.7 1.5 0.0 1.2
Contingency fund 0.0 0.8 1.4 1.6
Domestic debt interest costs 2.8 2.6 2.3 2.7
External debt interest costs 0.9 0.8 0.8 1.1
Recurrent balance 8.3 5.3 5.9 2.1
Domestic-financed capital expenditures 5.9 7.9 9.2 10.5
ODA-financed capital expenditures 6.1 4.5 5.2 5.2
Arrears repayments 1.3 0.5 0.7 1.0
Overall fiscal balance -4.9 -7.5 -9.2 -14.5
Source: IMF.
1.28 Oil revenue will not suffice to restore fiscal sustainability. Although tempting in the
face of current imbalances and smoothing needs to avoid disrupting or delaying public programs,
borrowing on non concessional terms against future oil revenue (that is, forward selling oil) to
postpone fiscal consolidation would elevate risks of debt distress. Indeed, as pointed by the
recent joint Debt Sustainability Analysis (IMF and World Bank, 2009), even with oil production,
failure to reduce the large primary deficit and sustain this consolidation over the coming years
would result in a much less favorable debt sustainability outlook.24
22
These figures do not include arrears and contingent liabilities accumulated throughout 2008 and disclosed in
August 2009 at the mid-year budget review. The consideration of these arrears and contingent liabilities further
reinforces the trend of widening recurrent deficits observed since 2005. 23
Meeting Ghana‘s infrastructure needs could cost US$1.6 billion per year for the next decade, out of which US$0.6
billion for maintenance and US$1.0 billion in the form of capital expenditure, see Chapter 5. 24
With fiscal consolidation and oil, public debt to GDP, projected to reach 63 percent of GDP in 2009, could fall to
less than 40 percent by 2029. Under this baseline, Ghana is classified among countries at moderate risk of debt
distress.

- 11 -
D. PRODUCTIVITY, COMPETITIVENESS, AND SOCIAL CHALLENGES
1.29 Channeling windfall oil revenue into the economy poses a number of additional
challenges. The first one is the likely appreciation of the Real Exchange Rate (RER) - the
increase in the price of non-tradable goods and services, as demand for them increases with
windfall revenue in the face of a limited supply response, and its corollary in terms of lost export
competitiveness. The second one is the likely drop in productivity, as more factors get
concentrated in non-tradable sectors where potential productivity gains are much scarcer.25
The
third one is the existence of re-allocation (investments, migrations) and transition costs (lost
markets and know-how), which can make temporary specialization very costly overall if the
society has to return to its previous specialization patterns. This risk exists with oil, given its
exhaustible nature and the possibility that it conducts to an untenable pattern of specialization.
These challenges are often known as ―Dutch disease‖ in reference to the impact of gas discovery
in 1959 in the Netherlands which led to deep de-industrialization and economic stagnation when
gas was exhausted.
1.30 Ghana has already many of the symptoms of the Dutch disease. Ghana has a large
and growing non tradable (non-agricultural)26
sector, comprising many parts of the public sector
and a wide range of private activities (construction, finance, trade) servicing large resource-based
extractive industries (gold), and remittances and ODA.27
Structural transformation has been slow
in the face of low productivity levels, the latter also affecting export competitiveness as factor
prices (land, labor) remain high in comparison to their marginal productivity. In the last two
decades, ―non-traditional exports‖ have only grown modestly and not enough to shake the
position of traditional exports, gold, cocoa and timber, whose respective positions have only
varied in time with international prices. In 2007-9, the spending of Eurobonds proceeds (US$750
million, or 5 percent of GDP), even if entirely used for investment projects (mostly to expand
electricity generation capacity) coincided with an acceleration of domestic price inflation.
Although impossible to establish a strict causal relationship between the two events, this
nevertheless suggests a risk of real exchange rate appreciation with oil revenue (directly as
demand pressures rise, or indirectly through anticipations and related speculative bubbles). And
time series analyses of the impact of additional capital inflows28
on relative prices point to the
same conclusion.
1.31 Several structural factors may be at the origin of these symptoms. A low supply
response to increased demand in the non-tradable sector is theoretically at the origin of RER
appreciations. In Ghana, several factors could suggest that the potential supply response in non-
25
Larger potential productivity gains in tradable sectors are theoretically justified by the possibility to exploit
greater gains of specialization and larger economies of scale, greater access to knowledge and know-how and higher
competitive pressures. There is consistent empirical evidence to suggest that productivity gains are higher in
tradable sectors than in non-tradable sectors (Ito et al., 1997, De Gregorio et al., 1994, Baldi et al., 2004, Egert et al.,
2003). The distinction between tradable and non-tradable sectors is nevertheless tenuous, and evolving over time.
One way to think about it is to look at the cost required to transport some products and services from one economy
to another. 26
Ghana also has a subsistence agriculture sector which is mostly non-tradable, although for reasons of a very
different nature. 27
The sum of gold exports, remittances and ODA represented a third of GDP in 2008. 28
Opoku-Afari et al. (2004) suggest that permanent capital inflows have had a strong and significant impact on the
real exchange rate.

- 12 -
tradable (non-agricultural) sectors is indeed low. These include rigid land29
and formal labor
markets,30
a large duality between formal and informal markets,31
and a poor infrastructure
(energy and water in particular). Besides, the likely existence of speculative bubbles (for instance
in real estate) is not to be ignored, as fuelled with remittances in particular.
Figure 1.2: Without Reforms, Oil Could Lower Per Capita Incomes in the Long Run Real per capita disposable income (index 1: 2008)
Source: World Bank staff calculations
1.32 Quantitative simulations point to serious risks of Dutch disease and boom and bust
cycles. Simulations run over the period 2009-29 with a Computable General Equilibrium (CGE)
model specifically designed for this purpose illustrate this point. The model used here is
calibrated on 2008 data, comprises 26 economic sectors (including 6 for agriculture), and depicts
a number of important features of today‘s Ghanaian economy: a dual labor market (formal vs.
informal), rigid urban and rural land supplies, and fixed electricity tariffs. The model also
distinguishes new capital from that already installed - the latter being less mobile than the former
– to capture the existence of reallocation costs.32
We measure the impact of oil revenue on
economic activity by comparing a baseline scenario (without oil) with a first alternative scenario
where three-fourths of the entirety of oil revenue (i.e., no savings of oil revenue, as with a
29
Notwithstanding the reforms now under way with regards to land tenure, access to land continues to be an
important consideration for enterprises, particularly in the metropolitan areas. Delays in land registration and titling
create bottlenecks in access to land and in site development. 30
Ghana ranks particularly poorly in terms of Labor Market flexibility, ranking 145th
in Doing Business. Half formal
sector employees are in the public sector where wage setting is grossly de-linked from performance. 31
The high prevalence of informality in Ghana remains an important obstacle to improvements in productivity.
Some 87 percent of the Ghanaian workforce is employed informally as farmers (52 percent) or in self employment
(35 percent). The informal sector is less able to invest in business, gain access to credit, establish standards or
participate in industry bodies. Ghana ranks 137th
in the Doing Business survey for ease of starting a business. 32
See Annex 1 for a more detailed presentation of the model.
0.8
1.0
1.2
1.4
1.6
1.8
2.0
2.2
2.4
2008 2011 2014 2017 2020 2023 2026 2029
Oil mostly consumed oil mostly invested No oil

- 13 -
stabilization fund) would go to finance additional public consumption, the remainder financing
investments (public and private, through the equalization of marginal returns); a second scenario
where one-half of total oil revenue would go to finance additional public consumption, the
remainder financing investments. Comparing the baseline scenario (where real disposable per
capita incomes would grow by 3.4 percent per year) with the first alternative scenario suggests
that, after the initial demand boom (which would peak in 2015 and get exhausted by 2020),
Ghana‘s long-term growth trajectory would actually shift down in comparison to a non-oil
scenario. The long term per capita income growth rate would decelerate to 2.4 percent and, by
2029 real per capita incomes would be 14 percent lower.33
Investing a greater share (half) of the
oil revenue could narrow this gap – as real exchange rate appreciation would be partially offset
by greater productivity gains – but not close it. Indeed, irreversible private investment decisions
(and related specialization choices) made in the earlier years of extraction could prove to be sub-
optimal when the oil gets exhausted a few years after. By that time, lost external markets would
become extremely difficult to regain. Furthermore, Ghana‘s ability to effectively invest most of
its oil revenue – in the first years of extraction in particular given the amounts expected – is also
questionable in the face of the institutional and public financial management challenges evoked
above.
1.33 Agriculture could be particularly exposed to Dutch disease consequences during the
boom period. As one of the major tradable sector, Ghanaian agriculture would be particularly
exposed to the risk of losing external competitiveness through real exchange rate appreciation.
Given the large mobility of the labor force (between agricultural and informal labor markets), a
greater demand for labor in cities could exert upward pressure on agricultural wages and reduce
external competitiveness of both import competing and export oriented agricultural sectors. Non-
tradable agricultural goods could also suffer, if close substitutes to tradable goods. One reason
often advanced to explain the limited impact of recent food price spikes on food consumption
was the ability of Ghanaian households to replace imported food with domestic staples (e.g. rice
with cassava) in their consumption baskets. The symmetric effect could thus also happen, if the
price of imported food was to decline with respect to that of domestically produced food. On the
other hand, a RER appreciation could make imported inputs less costly, and oil revenue could be
invested in agriculture to raise its productivity. The Nigerian precedent (but also that of Ecuador,
Mexico, Algeria, Iran), where the oil boom of the 1970s severely affected agriculture, is a case in
point.34
And experience suggests that once market share is lost it can be extremely hard to regain
due to the loss of commodity-specific capital—both physical (e.g., processing plants) and human
(scientific knowledge and technical skills). This is particularly the case in export markets, when
supply chains are often complex and difficult to establish. Ghana is still trying to recover market
share in the European pineapple market having lost ground with the slow conversion to new
varieties demanded by European supermarkets.
1.34 An oil boom could exacerbate rural-urban spatial disparities. We use the same
simulations to illustrate this point, comparing a non-oil scenario to two alternative scenarios,
33
In net present value terms, given the initial boom, the difference would nonetheless become marginal. Using a
social discount rate of 7.5 percent would basically equate the discounted incomes in the two scenarios. 34
Nigeria experienced an oil boom in the 1970s that severely affected its agriculture. The real value of the Naira
more than doubled during the decade, leading to a sharp decline in the price of tradable agricultural commodities.
Per capita agricultural production fell by 40 percent from 1970 to 1982 and Nigeria rapidly became a large food
importer. Public investments financed by oil revenues and intended to boost productivity were largely wasted in
expensive and ultimately unproductive schemes, such as large scale irrigation.

- 14 -
where oil revenue is more or less consumed by the Government. The comparison is here made
for the year 2015, at the peak of extraction. Results indicate first that the real exchange rate
would significantly appreciate (by 11 to 12 percent), whatever the use of oil revenue
(consumption or investment), suggesting similar tradable/non tradable contents of public
consumption and investment expenditures patterns. But investment matters otherwise, as it
would increase productivity overall, and thus contain export losses at the economy-wide level.
Nonetheless, agriculture would not necessarily benefit from increased investment, as the latter
would rather go to other sectors - such as non-tradable sectors, and mining, if attracted by high
private rates of return. In the event, agricultural exports would decline by 5-6 percent (mostly
cocoa), while agricultural output would decline by 1 percent with respect to a baseline non-oil
scenario. These figures sharply contrast with the overall positive effect of oil revenue on per
capita incomes in the short run, and emphasize the risk of a widening urban-rural divide during
the boom period.
Table 1.3: Spending Oil Revenue Would Hurt Agricultural Output and Exports Deviations with Respect to a Non-oil Baseline Scenario in 2015
Alternative 1: oil revenue
mostly consumed
Alternative 2: oil revenue
half invested
Real exchange rate 13.0% 11.5%
Real disposable per capita income 12.5% 10.1%
Exports volumes -19.1% -14.0%
Agricultural exports volumes -6.5% -5.5%
Agricultural output volumes -1.0% -1.2%
Source: World Bank staff calculations
Table 1.4: An Oil Boom Could Induce Significant Redistribution Effects
B. Initial 10% RER
appreciation
25% RER appreciation
Poverty Headcount
National 28.6% 28.7% 28.8% Urban 10.7% 10.7% 10.7% Rural 39.3% 39.7% 39.8%
C.
Western 18.6% 19.3% 21.0% Central 19.9% 20.1% 18.4% Greater Accra 11.8% 11.8% 12.3% Volta 31.7% 32.5% 31.3% Eastern 14.7% 14.8% 15.4% Ashanti 20.5% 21.0% 20.7% Brong Ahafo 29.7% 29.3% 29.4% Northern 52.2% 52.3% 52.5% Upper East 70.5% 70.3% 70.3% Upper West 87.9% 87.8% 88.0%
Income change Public sector employees 0.6% 1.6% Private formal employees -0.1% -0.2% Private informal employees 0.4% 1.1% Export Farmers -3.0% -7.4% Food Crop Farmers 0.3% 0.7% Non-Farm Self-Employed 0.1% 0.3% Non-working 0.5% 1.2%
Source: World Bank staff calculations
1.35 Micro analysis confirms that export farmers would be the main direct losers from a
real exchange rate appreciation. A micro-accounting analysis of the most recent household
survey (GLSS5, for the years 2005/6) allows assessing the extent to which Ghanaian households‘
welfare would be impacted by a change in the price of tradable over non-tradable goods, on both
- 15 -
their revenue and consumption sides.35
Given households‘ initial position vis-à-vis the national
poverty line (broadly at $PPP1.25 a day), the same analysis also allows to measure the impact of
a RER appreciation on poverty. The analysis, however, ignores the primary income/spending
effect from oil revenue that is the cause of RER appreciation, and which could compensate
groups for lost welfare if redistributed. Results suggest small aggregate changes (in national
welfare or poverty), but a fair amount of distributional change for an assumed RER appreciation
of 10 percent (and more with 25 percent). The poorest segments and regions of the Ghanaian
society—food crop farmers in the Northern, Upper East, and Upper West regions—are likely to
benefit from an increase in the relative price of non-tradable goods, although often times not
enough to raise their incomes above the poverty line. On the other hand, export farmers (from the
Western region in particular) are likely to experience substantial welfare losses, with a number of
these households slipping below the poverty threshold.
1.36 Threats of Dutch disease contrast with agriculture‘s large potential for growth and
poverty reduction. Macro and micro analyses discussed in the preceding paragraphs suggest
that markets immediate reaction to the injection of oil revenue in Ghana‘s economy would tend
to affect negatively commercial agriculture, in spite of great agro-ecological potential.36
Subsistence farming would not be affected, as isolated from markets, but the deterioration of
commercial agriculture would weaken rural households‘ ability to grow out of poverty. In
2005/6, more than 85 percent of Ghana‘s poor were living in rural areas, and even if an oil boom
could induce accelerated rural-urban migration (as well as the development of off-farm
activities), agricultural development will continue to remain central to the growth and poverty
reduction agenda (World Bank, 2008) in Ghana for many years. There are indeed many reasons
to believe that agricultural productivity growth could be a key engine of industrialization and
economic take off in Ghana. First because agricultural goods are important inputs for the
industry, directly for some sectors (e.g., food processing, textile), and indirectly through their
impact on real wages (as households‘ consumption basket is skewed towards food and textile
items). Second because agricultural productivity growth creates surpluses, breaking the vicious
circle of subsistence farming, where nearly everything produced is consumed within the same
harvest cycle. In effect, enhanced productivity releases workers or time for other activities,
increases savings and investments, reduces farmers‘ vulnerability, and thus raises their ability to
take productive risks. It also creates demand for industrial products, which is crucial in the
presence of fixed costs in industry. And third because even when potential productivity growth is
weak, public support to agricultural development might still be considered as an efficient transfer
mechanism to target the poor (Bourguignon, 2006). These elements could justify greater public
35
The analysis considers households‘ individual patterns of consumption and sources of income, attaching to each
of them a degree of tradability. A net consumer (respectively producer) of tradable goods will record welfare gains
(resp. losses). See Medvedev (2009) for detailed discussion. 36
Northern Ghana, where most of the rural poor reside, is vastly unexploited for a number of reasons—diseases,
poor soils, climatic risk, and very low population and road density. However, the potential of this region is huge, as
demonstrated by the experience of the ‗Cerrado‘ in North Brazil and Northeast Thailand, which share similar
ecologies. Both regions were turned into highly competitive poles of commercial agriculture for cassava, soybeans,
sugar, rice, maize, cotton and beef. Factors that contributed to this success included: (i) improved agricultural
technology, both varieties and soil management; (ii) publicly financed infrastructure, rural credit, and business
development services; (iii) a dynamic private sector and a conducive investment climate; and (iv) a policy
environment that sets prices in line with world prices.

- 16 -
intervention in agriculture (in the North in particular)37
to mobilize this potential and reduce the
transitional costs which would result from an oil-driven boom and bust cycle. Such an
intervention could in part be financed with oil revenue, and take various forms, from the
provision of agricultural public goods (research, extension, infrastructure, investment climate) to
targeted interventions to raise people‘s economic mobility.38
E. TRADE-OFFS AND A WAY FORWARD
1.37 With oil revenue flowing, Ghana will be confronted with a number of choices. Ghana
needs first to decide what part of oil revenue it wants to spend now, versus later. This inter-
temporal choice should be dictated by absorptive capacities considerations (the social return of
oil revenue spending). Inter-generational considerations, however, could also be considered, as
choices made today (based on a given discount rate, or degree of preference for the present),
would have irreversible consequences on future generations (the first of which being the fact that
next generations will not be able themselves to choose how to use oil, as reserves would have
been depleted). The second choice relates to its distribution. Some groups might be more
affected than others at the margin by the direct impact of oil extraction (e.g. on the environment)
and spending (Dutch disease). But other groups might deserve greater support given their
disfavored initial situation. For instance, if households from the Western region are likely to lose
more from an untargeted spending of oil revenue, they would still remain far less poor than those
from the Northern regions (see Table 1.4).
1.38 Nonetheless, whatever choices made, a number of actions should be rapidly
undertaken to raise the potential developmental impact of oil. In turn, raising the social rate
of return of oil revenue spending will attenuate some of the trade-offs discussed above. Ghana
would strongly benefit from elevating its institutional and macroeconomic absorptive capacities
before channeling oil revenue into the economy. Raising such capacity will take time, while oil
revenue will grow extremely rapidly in the first years of extraction. The risk of misuse is thus
particularly high in these years. In the face of it, Ghana could consider the following actions,
most of which would be justified even in the absence of oil:
Increase transparency on oil revenue. Minimizing risks of political capture call for greater
social accountability, which cannot expand without economic transparency. The latter could
be improved as Ghana adopts and implements a Freedom of Information Act; and
stipulates/enforces accountability mechanisms regarding: (i) the publication of reports on
revenue and their use, and (ii) the disclosure of bidders‘ identity and bidding documents. The
EITI process could be used in this regard. In turn, increased transparency should open the
door to design a home-grown institutional response to the risk of political capture. Various
experiences from the rest of the World can inspire Ghana, but none of them will become
effective if not fully and broadly owned locally.
Restore fiscal sustainability. High fiscal deficits threaten macro-economic stability, and
using oil revenue to finance them would only postpone the adjustment while missing an
important development opportunity. The needed adjustment will call in particular for a
37
The Government of Ghana is envisaging in this regard to harness resources of the Savannah areas with value-
added processing, improved technology coupled with strategic investments in people and service (Government of
Ghana, 2009). 38
The relative merits of these approaches will be discussed in details in a forthcoming World Bank report on
poverty and spatial inequalities.

- 17 -
review of the public payroll and energy subsidies in light of (i) related service delivery and
poverty alleviation and (ii) fiscal affordability. Public financial management reforms
discussed above would consolidate the fiscal adjustment effort.
Remove bottlenecks in non-tradable sectors. Dutch disease effects would be mitigated by
removing constraint to competition and domestic supply response in non-tradable sectors,
including: high barriers to entry into formal sectors (starting a business, labor regulation and
minimum wages, access to finance, urban land tenure), and poor infrastructure (water,
electricity) for urban SMEs. The latter would benefit from higher consideration to PPP
options, leaving greater financial capacity for the Government to finance projects with high
social returns.
Introduce stabilization mechanisms for managing oil price volatility. The first
mechanism would consist in restoring the pass through of international prices into gasoline
and utilities tariff, along with establishing targeted mechanisms to protect the poor. A second
mechanism to shield the budget from oil price volatility would consist in establishing a fund
(between a stabilization fund and a permanent income fund, see above), from which
predictable transfers would be made to the budget.
Increase the provision of agricultural public goods. The reform would consist in raising
agricultural spending up to 10 percent of government budget (from 6-8 percent currently) to
support the provision of various public goods, including feeder roads, research, extension
services, water and power supplies, storage capacities, irrigation for smallholders, and safety
standards.
1.39 These policy actions would significantly magnify the potential developmental impact
of oil. Quantitative simulations suggest that the early implementation of the reforms in energy,
civil service, land regulation, PFM reform and agriculture39
evoked above could significantly
improve the developmental impact of oil revenue. The average real per capita disposable income
over the period 2010-29 could be 9-13 percent higher with these reforms than without, that is,
higher than in the non-oil scenario discussed before (see Figure 1.2). Simulations also suggest
that the effect of these reforms, which aim at raising public investment effectiveness, would take
time to materialize. Indeed, the discounted income40
(which gives preference to the first years of
the period) would be less enhanced than the undiscounted one. In particular, civil service, PFM
and private sector reforms would take time to generate important gains. By the same token,
delayed implementation of these reforms would entail high opportunity costs as a large share of
oil revenue would have been sub-optimally spent.
1.40 Although key to raise the quality of oil revenue spending, the reforms above would
not address all issues. The first one is the intergenerational equity issue, as next generations
would be deprived of the opportunity to decide how to manage oil if its revenue is fully spent
during the extraction period. The second one is the distribution issue, as these reforms would
only marginally contain a widening rural/urban gap in the boom period. The third one relates to
downside risks associated to these reforms: implementation delays, political feasibility, a large
exposure to changing price and reserve assumptions during the first years of extraction could all
39
We simulate the following reforms: energy reform: electricity tariffs match production costs; civil service reform:
formal sector wages are determined by their marginal productivity; private sector reform: the urban land supply is
made more responsive to its remuneration; and PFM reform: a larger share of oil revenue spent is allocated to
investment (75 against 50 percent); agricultural reform: improved rural land productivity. 40
A 7.5 percent social discount rate is used in the computations.

- 18 -
reduce the impact or effectiveness of these reforms. In contrast, a more gradual approach,
supported in its extreme form by a permanent income fund, would neutralize the equity issue,
attenuate the amplitude of boom and bust cycles, and improve budget predictability. In the end,
the decision on the pace at which oil revenue should be spent should ideally take into
consideration (i) the time it would take to improve the quality of oil revenue spending and (ii) the
degree of social preference for the present.
Figure 1.3: Key Reforms Would Greatly Magnify the Developmental Impact of Oil Revenue Change in Real Per Capita Disposable Income During 2011-29, with Respect to a Non-Reform Scenario
Source: World Bank staff calculations
0%
2%
4%
6%
8%
10%
12%
14%
Undiscounted income Discounted Income
3.6% 3.3%
2.0%
1.1%
1.7%
0.5%
5.1%
2.9%
0.9%
0.9%
Energy sector
reform
Civil service reform
Private sector
reform
PFM reform
Agriculture reform
- 19 -
2. REVENUE PROJECTIONS
A. INTRODUCTION
2.1 The exploitation of Ghana‘s newfound petroleum resources will undoubtedly have
an important impact on the economy of Ghana. This chapter assesses the likely scale, nature
and timing of that impact based on parameters known to the World Bank at the time of writing
and assumptions made about key economic factors such as the oil price, production costs and
product markets.
2.2 The chapter provides projections of: (i) the value of production and (ii) direct
government revenues.41 Broader economy impacts, such as job creation, imports, import
substitution, economic linkages to suppliers and the downstream processing of gas are not
measured but discussed qualitatively.
2.3 The ultimate scale of Ghana‘s petroleum resources is not known but more
information is becoming available as exploration progresses. In order of certainty, most to
least certain, the current knowledge of Ghana‘s petroleum resources can be summarized thus:
The Jubilee oil field has proven recoverable oil reserves of 490 million barrels (mmbbl),
which is already of sufficient size and quality to justify commercial exploitation.42
However, additional drilling and tests are being conducted to prove a higher reserve base
estimated to be at least 1,200 mmbbl and possibly as much as 1,800 mmbbl. The oil
consortium43
is therefore proceeding with development of the Jubilee field in phases,
with Phase I based on the ―core‖ area of the field where reserves have already been
proven.44
Phase I will produce 120,000 barrels of oil per day (bpd) at peak with field life
of the order of 15 to 20 years. Gas would be produced in association with oil at a rate of
120 million standard ft3 per day (mmscfd) but would initially be re-injected pending
availability of a gas pipeline and market.45
A further one or more phases of the Jubilee field development are under consideration,
dependent on the level of additional reserves proven up during a campaign of drilling in
2009. To date Phase II has been described as possibly expanding production to 250,000
bpd of oil at peak with a field life of the order of 25 to 30 years, commencing some two
to three years after completion of Phase I. Gas output would reach 250 mmscfd and by
then a gas pipeline and market is more likely to be available.
Less certain is the possibility that additional oil fields will be discovered by the same
consortium, some of which may be sufficiently close to Jubilee to allow the sharing of
41
Major levies on petroleum operations based on negotiated petroleum contracts (see Box 2). This does not include
dividend withholding, taxes on inputs, employee taxes and a variety of minor taxes. 42
Tullow Oil plc Trading Statement, January 21, 2009. 43
The oil consortium comprises Tullow Oil plc, Kosmos Energy, Anadarko Petroleum, Sabre Oil and Gas and the
EO Group. 44
The ―core‖ area of the field holds only a portion of the proven reserves, which according to data from GNPC is
269 mmbbl and this serves as the basis on which project design and commercial assessment has proceeded, even
though the field is considerably bigger than this. The IFC has itself, in relation to agreeing its loans to Kosmos and
Tullow, relied upon an independently certified reserves assessment of just 221 mmbbl in the ―core‖ area. 45
A small amount of gas will be used to generate power used by the oilfield facilities. The consortium plans to
commence commercial negotiations for the supply of gas and access to pipeline capacity during 2009.

- 20 -
facilities.46
Exploration drilling in 2009-2010 will test potential additional resources
based on prospects, some of which may contain up to 500 mmbbl.47
Other companies
hold exploration rights over adjacent areas displaying the same or similar geology. Over
the next few years several wells will be drilled to test whether similar sized resources
extend out to these areas. The first such well was completed by Amerada Hess in
December 2008 south of Jubilee but did not discover oil.
Finally, the development of a gas pipeline and markets based on Jubilee would increase
the likelihood of the existing Tano gas fields, which are located in shallow water nearer
the coast, being feasible to exploit using shared infrastructure.48
2.4 The level and quality of data available to the World Bank on Phase I are judged as
sufficient to allow a Base Case projection to be made together with sensitivities to higher and
lower oil price outlooks, a higher capital cost and shorter duration of peak production. The
projections are based on the January 2009 World Bank long-term oil price forecast of $75 per
barrel. Sensitivity has been tested at $30, $50 and at $100 per barrel.
2.5 A qualitative but not quantitative assessment of the impact of Phase II and other larger
but less certain petroleum resource scenarios is also made.
B. JUBILEE PHASE I BASE CASE
2.6 For purposes of this analysis the base case is defined as a single offshore field with 500
million bbl of recoverable oil reserves; output capacity of 120,000 bpd of oil and 120 mmscfd of
gas; output at peak capacity for 5 years followed by 14 years of declining output; first production
in 2011; re-injection of all gas; capital cost of $4 billion (including purchase of FPSO).49
Key Results (in real US dollars50) are:
Total field life value of petroleum of $37.5 billion, averaging $2 billion annually and
peaking at $3.3 billion from 2012 to 2015.
Total field life government revenues of $19.4 billion, averaging just over $1 billion
annually and peaking at $1.8 billion in 2016;
Government share of total value over field life of 52 percent; government share of net
cash flow of 69 percent (undiscounted) over field life;51
46
In January 2009 the Mahogany-3 well discovered a discrete deeper reservoir of oil underneath the known Jubilee
field. Additionally, a relatively small discovery called Odum was made in February 2008, which could possibly use
the same production facilities as Jubilee. 47
A prospect is a geological feature detected by seismic and other surveying methods thought likely to contain
petroleum but which has still to be tested by drilling. As such, present estimates of petroleum resources are highly
speculative. Several prospects have been identified and will be drilled in the coming year, beginning in late January
2009 with the Tweneboa prospect. 48
Until now, the viability of exploiting the Tano gas fields had been affected by their modest size and limited
market opportunity. 49
A Floating Production Storage and Offloading vessel (FPSO) will serve as the central surface facility receiving oil
from sub-surface wells and processing it for storage and offloading onto oil tankers and any pipeline connection. An
FPSO may be purchased or leased. The oil consortium plans to lease the FPSO but can exercise an option to
purchase it after two years, an option that is assumed will be taken at a cost of some $725 million. 50
January 2009 prices.

- 21 -
An oil price of $50 results in total government revenues of $8.6 billion (-56 percent) and
government share of net cash flow of 55 percent; a price of $100 results in total
government revenues of $29.3 billion (+51 percent) and government share of net cash
flow of 72 percent;
At an oil price of $30 the project is marginally economic (16 percent IRR pre-tax) and
generates just $3 billion of government revenue;
A 25 percent capital cost overrun on its own reduces total government revenues by 14
percent and, when combined with a $50 oil price, reduces total government revenues by
over 60 percent;
A two-year period of peak production, as against five years, on its own reduces total
government revenues by some 60 percent and, when combined with a $50 oil price,
reduces total government revenues by over 80 percent.
Table 2.1: Jubilee Phase I Base Case - $75/bbl
Year Output Gross Revenue Capital &
Operating Costs
Government
Revenue
‗000 bpd US$ million US$ million US$ million
2008 0 0 397.8 0
2009 0 0 1094.5 0
2010 0 0 1094.5 0
2011 106.9 2925.0 1108.9 899.7
2012 120.5 3300.0 1268.3 1010.8
2013 120.5 3300.0 350.3 1083.0
2014 120.5 3300.0 350.3 1483.8
2015 120.5 3300.0 350.3 1796.3
2016 101.4 2775.0 327.0 1804.1
2017 89.0 2437.5 312.1 1587.4
2018 79.5 2174.9 300.4 1400.4
2019 69.9 1912.4 288.8 1213.3
2020 61.6 1687.4 278.8 1053.0
2021 56.1 1536.8 272.1 945.7
2022 50.7 1387.6 265.5 839.4
2023 46.6 1275.1 260.5 759.3
2024 43.8 1200.1 257.2 705.8
2025 41.1 1125.1 253.9 652.4
2026 38.4 1050.1 250.6 599.0
2027 35.6 975.1 247.2 545.5
2028 34.3 937.6 245.6 518.8
2029 32.9 900.1 243.9 492.1
TOTAL 37500.0 9818.6 19389.8 Source: World Bank staff calculations
2.7 Other sensitivities which have not been tested in this analysis would include alternative
assumptions regarding the start date of production, the rate of output decline from peak levels,
operating cost levels, sale of gas at some stage and types of financing.52
51
The Government share is the sum of all fiscal receipts divided by the cash flow of the project after meeting all
capital and operating costs. 52
The project is assumed to be 100 percent equity financed. As a result, the project would not bear the cost of
servicing loans. Debt service costs increase the cost base of a project and reduce government fiscal receipts.

- 22 -
2.8 Other impacts of Jubilee Phase I on the economy are expected to include the
following:
Direct job creation: The oil consortium estimates a total workforce requirement of a little
over 200 during routine operations. The local staffing content would be of the order of 40
to 60 per cent in the initial years. During construction higher numbers can be expected,
comprising temporary contractors and their construction crews. The sources of
employment would include management and administrative offices in Accra and
personnel at supply bases, aviation and port facilities and on rigs, supply vessels and the
FPSO.
Local goods and services: The local content of supplies to the oilfield will be low in the
construction phase in terms of equipment and services needed for installation because of
the high level of specialization; in the production phase there is likely to be improved
scope for consumables to be procured locally and Ghana-based enterprises to supply a
range of non-specialist services.
Indirect taxes: Petroleum operations enjoy exemption of all duties and other charges on
imports of items which are not subject to rules requiring preference to be given to local
sourcing. In practice, this will mean that a very high proportion of imports during
construction and production operations will be brought into Ghana tax-free.
Downstream processing: Crude oil from Jubilee will be of high quality and readily find
buyers in the international oil market ready to pay international prices; accordingly there
is expected to be no price or marketing advantage to the oil consortium by selling the
crude oil to a domestic refinery.53
Box 2.1: Some Parameters Affecting Pre-tax Petroleum Economics
Recent dramatic oil price movements highlight the difficulty of reliably forecasting oil prices. However,
large and high quality oil deposits like Jubilee have a cost structure that should be able to withstand oil
price fluctuations. Moreover, the quality of Jubilee crude oil (light and sweet) will ensure that it commands
a price close to international marker crude oils like Brent.
Field production rates display a tendency to reach and then maintain peak output for only a few years
before decline sets in. This is largely a function of the pressure drive in the oil reservoir. Output can be
enhanced through the use of re-injection wells to artificially sustain pressure drive. In the Jubilee field, gas
is dissolved in oil and is released at lower pressures once oil is brought to the surface. The rate of gas
production is a direct function of oil production. Gas may be re-injected to enhance oil production rates or
for sub-surface storage.
Field costs are a function of numerous engineering considerations. Water depths, drilling depths, reservoir
size, shape and thickness, pressure drive, quality of oil-bearing sands, properties of the oil, to name a few,
impact on costs. Fixed costs tend to be high as a proportion of total costs, so that significant economies of
scale arise. However, some capital items are ―lumpy.‖ For example, the sizing of a Floating Production,
Storage and Offloading Vessel (through which all petroleum passes) must be optimized, since this is the
single biggest item to be purchased (or leased).
53
The Government may choose to exercise its option to take royalty, initial interest and AOE (but not income tax) in
crude oil rather than cash. In such case, oil could be supplied to a domestic refinery. However, the value of so
doing would depend, in part, on the compatibility of Jubilee crude oil and refinery feedstock requirements.

- 23 -
Box 2.2: The Fiscal Regime for the Jubilee Field
The fiscal regime under which the Jubilee field will be operated is defined by petroleum laws and detailed
fiscal terms of contracts for each of the two petroleum licenses which Jubilee straddles. In most respects
the fiscal terms of the two contracts are the same and comprise the following elements from which the
Government obtains revenue:
Royalty: 5 percent of gross oil revenue; 3 percent of gross gas revenue
Initial Interest: 10 percent of petroleum revenue net of royalty and operating expenses
Additional Oil Entitlement (AOE): a share of petroleum revenue net of royalty and initial interest
that is linked to the project rate of return (ROR) on a sliding scale; the terms of each contract are
understood to differ so, for this analysis, a four-point sliding scale has been assumed as follows:
@ ROR >18% AOE = 10%; @ ROR >23% AOE = 15%; @ ROR >28% AOE = 20%; @ ROR >33% AOE
= 25% (World Bank assumptions)
Income Tax: 35 percent of taxable income after deduction of expenses and depreciation of capital
expenditures over five years
An additional option exists for the Government to purchase a share of the Jubilee project on terms specified
in the petroleum contract. This option has not been included in the analysis. The new Government has
announced that it will exercise this option under which it will acquire a 3.75 percent interest in the Jubilee
field, through GNPC, for US$161 million.
The fiscal regime yields various revenue streams, some tied to turnover (royalty) and others tied to
profitability (initial interest, AOE and income tax). AOE ensures that the tax take rises progressively as a
function of profitability, with minimum Government take (pre-AOE) around 50 percent rising, once all
ROR thresholds have been crossed, to over 70 percent.
The fiscal regime only applies to upstream oil and gas operations – all revenues and costs up to the point of
disposal (oil tanker or inlet into oil or gas pipelines). There is scope for specific and different terms to be
negotiated for gas. For this analysis, except for the lower gas royalty rate, all other terms are assumed to
apply equally to oil and gas.
C. IMPACTS OF A LARGER RESOURCE BASE
2.9 Phase II of the Jubilee field development would be based on a higher proven reserve
base than Phase I and could be launched some two to three years after completion of Phase
I. The production rate could be double that of Phase I resulting in a peak level of gross revenues
of the order of $7 billion over some five years from as early as 2015. No cost estimates have
been provided by the oil consortium but economies of scale and sunk appraisal costs would
imply higher pre-tax returns than for Phase I. Because of the progressive structure of the fiscal
regime for any price level, the Government share of net cash flow would be higher under Phase
II than Phase I.
2.10 By the time of Phase II the sale of gas (made possible with the likely availability of a
pipeline), rather than its re-injection is much more likely. Accordingly, a value could be
attributed to gas based on sale at the oilfield (into a pipeline under separate ownership).54
The
54
A value of gas at the wellhead could be derived based on the netback value of gas after considering the cost to
transport and process gas downstream of the Jubilee field, as well as any gas handling facilities needed at the Jubilee
field. The netback value of gas is highly uncertain and subject to a wide margin of error. There may also be
additional value in the gas at the processing stage, where liquids would be stripped to generate, among other things,
Liquid Petroleum Gas (LPG), which can be used as a cooking fuel or motor fuel.

- 24 -
incremental value of gas to the Jubilee field is likely to be relatively low in gross revenue terms,
but it nonetheless can contribute directly to profitability and, hence, to government revenue.55
2.11 The sale of gas will have significant economic impact in addition to the incremental
contribution to government revenues from the Jubilee field. Without a defined gas
development plan only general observations can be made about this impact. However, positive
impacts are likely to include:
Investment and jobs associated with the gas chain downstream from the oilfield,
including a wet gas pipeline to shore, gas processing and storage facilities, dry gas trunk
pipeline(s), gas distribution pipelines and facilities for handling and distribution of by-
products of gas processing (e.g. LPG, propane, butane);56
Supply of gas feedstock for power-generation which would substitute for fuel oil at
existing and planned dual fuel Combined Cycle Generating Turbines, thereby saving
foreign exchange used to import fuel oil;
Taxation of transportation, processing, distribution and sale of gas.
Key conclusions are the following:
Phase I of the Jubilee oil field will proceed, with delay into 2011 increasingly likely;
The economic performance of Jubilee, and hence Government revenues, is critically
dependent on the oil price, with a Base Case revenue projection based on the World
Bank‘s current long-term price forecast of $19 billion ($75 oil price) and plausible
alternative oil price scenarios yielding Government revenue in a range between $9 billion
($50 oil price) and $29 billion ($100 oil price) over field life;
A number of other parameters are subject to uncertainty, in particular, how long peak
production of 120,000 barrels per day can be sustained - if the smaller reserve base that
has been used as a basis for evaluating Phase I by GNPC is used (implying a shorter
period of peak production and reduced project life), Government revenue would only be
$8 billion at $75 oil price and as little as $3.3 billion at $50 oil price;
The Government‘s share of net profits from Jubilee can be expected to respond strongly
to changes in oil prices, because of the structure of the fiscal regime, in a range between
approximately 50 percent and 70 percent.
A larger scale operation is increasingly likely to be developed some years after
completion of Phase I, and would yield more than double the expected economic benefits
of Phase I (for any given oil price), however, it is too early to provide more detailed
projections at this stage;
55
The incremental economics of gas sales in reality might depend on tradeoffs between re-injection and gas sale and
associated capital and operating expenses. These cannot be assessed on the basis of the information available. 56
Plans to establish a gas processing plant with the capacity to handle 150 mmscfd of gas were announced by the
Government in December 2008 to be sited on the coast in Western Province close to the Effasu barge-mounted
power generating facilities. The barge presently has 125MW generating capacity, equivalent to 30 mmscfd of dry
gas feed but expansion is planned. The Aboadze power plant at Takoradi has 530MW installed capacity, equivalent
to 130 mmscfd of dry gas feed. The Volta River Authority has already contracted to take 123 mmscfd of gas
supplied through the West African Gas Pipeline to meet feedstock requirements of Aboadze.

- 25 -
Government fiscal revenues are the principal mechanism through which economic
benefits will accrue to Ghana since, until the use of gas becomes viable, the Jubilee
operation is likely to generate limited economic linkages and input substitution
opportunities; and
The supply of gas for processing and use downstream in Ghana would provide
significantly greater opportunity for economic linkages and input substitution.

26
3. POLITICAL ECONOMY DIMENSIONS
A. INTRODUCTION
3.1 Africa‘s development depends, in large part, on its ability to use its natural
resources for sustainable and inclusive development. In principle, the fact that Africa is well
endowed with rich natural resources seems like a positive thing since it should provide the
opportunity for countries within the region to meet their considerable development needs.
However, in practice, the literature is full of examples of misfortunes with countries rich in such
resources performing poorly on the economic, social and political dimensions of development.57
3.2 Since the 1990s, there has been a growing body of literature that goes beyond the
macroeconomic and Dutch Disease issues to look at why some countries with natural
resources perform well, while others seem to miss the opportunity and perform worse than
countries that are less well-endowed. This literature looks broadly at the relationship between
social and political structures, institutions and policy choices. This chapter provides a brief
review of this growing body of literature and look at the different attempts to classify types of
countries and the political and institutional reasons that have led to policy decisions. It then looks
at how Ghana ranks in terms of institutional quality and uses the typologies of political regime as
well as Ghana‘s performance in the mining sector to ascertain whether there is cause for concern
as to whether Ghana has the right political incentives and sufficiently strong institutions to
manage its new oil rents well. Finally, it looks at how different countries have developed a range
of instruments to strengthen the institutional arrangements for effective management of oil and
discusses how these might be tailored to the Ghanaian context.
B. THE ROLE OF POLITICS AND INSTITUTIONS IN DETERMINING
THE IMPACT OF OIL ON A COUNTRY
3.3 The root of the institutional challenges for countries with concentrated natural
resources is a ―principal agent problem‖ (cited in Gelb and Turner, 2007). Oil resources are
usually declared as belonging to the whole country but are managed on behalf of all citizens by
their Government. However, lack of clarity about what ―ownership‖ really means, along with
weak institutions that neither constrain governments nor provide accountability has led to a
whole host of problems. The literature cites collusion with large oil companies, rent seeking and
corruption, increased political patronage, lower entrepreneurship and lower capacity for
investment, increased authoritarianism and even civil conflict as common problems that many
confront countries that have discovered oil.
3.4 There have been a number of attempts to establish the causality of the relationship
between the political and institutional dimensions on the one hand, and the performance of
the country on the other. While there is still much discussion on this issue, in general, the
literature agrees on two things. First, political and institutional dimensions are the most
important determinant of how a country with oil performs. As Eifert et al. (2002) note, ―the
variance of growth performance among resource rich countries is primarily due to how resource
57
Of 48 countries for which oil comprised more than 30 percent of total exports between 1965-1995, nearly half
scored in the bottom third of the UN Human Development Index. Closer to home, Nigeria is cited as an example of
a country that earned US$340 billion but living standards worsened.

- 27 -
rents are distributed via the institutional arrangements‖ (2006).58
Second, countries who do not
recognize this importance and who have weak institutional contexts will find weaknesses
exacerbated and oil is likely to result in a curse rather than a blessing (Eifert et al., 2002).
3.5 There have been a number of attempts in the literature to classify the political and
institutional reasons for policy failures and thus to establish some typologies. Ross (1999)
provides a good summary of three types of reasons for policy failure and offers the following
typology: (i) cognitive reasons – resource rents are seen to induce a ―get rich quickly‖ mentality,
resulting in short-sighted policy decisions and excessive spending; (ii) societal reasons –
countries often have existing interest groups with significant political leverage on the state who
block growth enhancing policies; and (iii) statist reasons – states are freed from the need to levy
domestic taxes and therefore become less accountable to citizens since they no longer need either
their votes or their taxes and devote rents to guarding the status quo. Mehlum et al. (2006) take a
different approach, focusing on institutional quality and construct an institutional quality index
based on data from the political risk services.59
The index runs from 1 to 0 with 1 suggesting
that institutions are ―producer friendly‖ and 0 being countries with institutions that are ―grabber
friendly.‖ The regressions show that, controlling for level of education and ethnic
fractionalization, the resource curse only hits countries with a lower level of institutional quality.
Finally, Eifert et al. (2002) expand on the societal and statist reasons offered by Ross (1999)
above and provide a useful classification of political features of five types of regimes and the
corresponding institutional implications (see Table 3.1). This provides us with the opportunity to
confirm whether the concerns raised by Mehlum et al. (2006) work on institutional quality
resonates with what we know about the political features of Ghana.
C. APPLYING THE POLITICAL AND INSTITUTIONAL DETERMINANTS TO GHANA
3.6 Ghana is a young democracy with four strengths (World Bank, 2007): there is no
dominant single party in Ghana, parties are quite well institutionalized, and traditional leaders
provide some restraint on the capacity of the Executive to pursuing their own self-interest and
extra-institutional interventions from the military, for example, seem to be rare particularly
relative to other neighboring countries. These, and other quantifiable governance indicators,
partially explain why Ghana does well on, for example, the Country Performance Indicator
Assessment (CPIA). However, as numerous political economists point out, there is a slightly
more complex governance picture beneath the surface that suggests that Ghana is more ―grabber
friendly‖ than ―producer friendly.‖ World Bank (2007a), Booth et al. (2005), Nugent (1999) and
others all show that Ghana does indeed exhibit the political characteristics of a ―factional
democracy‖ (Eifert et al., 2002) and perhaps even has some remnants of its recent past as an
autocracy. World Bank (2007a) shows how the political incentives in Ghana produce a high level
of clientelism and patronage politics with government responding to narrow interest groups.
Ghana spends far more, on average, on targeted expenditures, such as the civil service wage bill
and public investment, but is average or below average in terms of spending on the provision of
public goods, such as the rule of law, quality of education or the lengths it goes to push back
corruption. Within this context where some interest groups are particularly powerful, big
58
This is based on a series of cross country regressions using the data set used by Sachs and Warner on Dutch
Disease and controlling for education and social divisions. 59
For further discussion of the index see Knack and Keefer (1995).

- 28 -
business interests seem to be particularly strong with their influence deriving from personal
relationships and the funding of political campaigns (Booth, 2005).
3.7 Ghana also exhibits large (and increasing) social disparities and social polarization
is an increasing concern. There is a marked rural-urban divide (Nugent, 1999), regional
inequalities are increasing and the role of ethnic identity seems to be increasing with ethnic
grievances rising (Afrobarometer, 2005). While the traditional authorities have, in the past
played an important role in arbitrating and building social consensus, the modern state does not
appear to have similar mechanisms and, when faced with conflict in Bawku, for example, it turns
to the traditional authorities for help.
3.8 One would expect a factional democracy with a recent heritage as an autocracy to
also display low levels of civic counterweight. This is true in Ghana. A number of studies show
that information is the most important constraint to more accountability through vertical means,
although World Bank (2007a) also suggests that the fact that Ghana has fewer graduates from
secondary school also plays a role. A study (World Bank, 2007b) on the enabling environment
for social accountability points to five types of constraints including few political incentives
within the Executive to strengthen accountability mechanisms, centralized and confused
intergovernmental arrangements that limit potential entry points, weak enforcement capacity of
the state which leads citizens to put little value in participating since there is no ultimate
recourse, a plethora of uncoordinated instruments that don‘t add up to much impact at the
national level and, finally, a weak and poorly organized civil society that has little influence on
policy debates or their oversight. It is also worth noting that interest groups representing non-oil
sectors such as agriculture in Ghana are particularly weak, particularly when compared to large
business interests such as the Chamber of Commerce.
3.9 Ghana does not yet have a Freedom of Information Act and access to information is
weak. The External Review of Public Financial Management (World Bank, 2006) notes that
budget information is of poor quality, information on planned expenditures diverges from actuals
and its presentation is not reader friendly to anyone other than budget experts. World Bank
(2007a) also notes that, despite media liberalization, media regulation and self censorship remain
significant. In addition, relatively few Ghanaians read the newspaper and radio talk shows are the
most popular form of media, suggesting that there is little flow of information on policy issues.
3.10 Formal checks and balances exist in Ghana but are generally thought to be quite
weak. The 1992 Constitution of the Republic of Ghana separates the three arms of government
from each other and Parliament is expected to provide a check on the Executive. The Standing
Orders of Parliament provide for the minority party in Parliament to appoint a chair of the Public
Accounts Committee and this has been adhered to throughout the fourth republic (1993 to date).
However, the role of Parliament as an independent institution to hold the Executive to account is
weakened and contradicted by Article 78(1) which requires that the President appoint a majority
of cabinet ministers from Parliament, making more than 50 percent of ministers responsible for
implementing policy as well as providing the check and balance on this implementation.
According to the African Peer Review Mechanism (2005), this potentially diminishes the
independence of the legislature and its effectiveness in enforcing horizontal accountability. The
Office of the Auditor General also exists in Ghana and prepares annual audit reports which are
then presented to Parliament within the constitutional requirements (6 months after the end of the

- 29 -
financial year). Challenges however remain with the follow up of its recommendations on, for
example, prosecution for abuse.
3.11 There is some evidence that some elements of institutional quality have worsened
since 2000, although political incentives and institutional quality, of course, continue to evolve.
Using the International Country Risk Guide, World Bank (2007a) shows that with the advent of a
multi party system in 2000, Ghana moved from being a positive to a negative outlier in the
measure of bureaucratic quality, suggesting that the political incentives changed and there was
no longer a need to serve the public interest in the same way. However, the recent elections in
Ghana are undoubtedly a sign of a maturing democracy and may also be a sign that the political
incentives in the country are changing. Anecdotal evidence suggests that many people either
voted for or accepted a change in part because it is good to keep political parties ―on their toes.‖
The outcome of the elections also translates into a much more evenly split Parliament, ending the
huge majority of the ruling party and pointing to a potentially more meaningful role for
Parliament as a true check and balance. The role of the new Parliament has, in the first month of
the new Government, also become a subject of much public debate as many decisions approved
by Parliament at over the last year have come under criticism, including the ex gratia package
approved for former President Kufuor and the expenses approved for the Ghana at 50
celebrations. Finally, it should also be noted that the Ghanaian institutions that were tested
during the election – namely the Electoral Commission, Judiciary Branch and the security
agencies– withstood high levels of tension and came through a very tight and drawn out electoral
process unscathed.
3.12 Notwithstanding the evolving institutional and political landscape, the recent
political economy literature confirms that Ghana exhibits the traditional political and
institutional traits of a factional democracy and that this provides cause for concern on its
ability to manage oil reserves effectively. Based on countries with similar characteristics who
have discovered oil, one would expect there to be a strong state role in production, strong
interests around how expenditures are used with a preference for responding to big business,
short horizons, marked social divisions, little consensus about what and how to use oil rents and
low levels of transparency (Eifert et al. 2002). A recent review of political economy challenges
in the mining sector (World Bank, 2009d) confirms that political incentives and institutional
quality have indeed proved to be major constraints in better management of the minerals sector
(forthcoming). The report points to an inadequate consensus around a clear legal and institutional
framework leading to complex and conflicting legal regimes, poor implementation of policies
and laws, disproportionate influence by big business interests, unclear and non-transparent
transfer mechanisms of royalties, weak mechanisms of formal checks and balances, a powerful
executive style of politics with the President appointing all the members of the Minerals
Commission and potential conflicts of interest, with members of the Committee on Mines in
Parliament also being members of the Boards of large mining companies, Executive interference
in institutional processes of awarding contracts and cases of no competition and disclosure in the
awarding of contracts. This has led to high levels of conflict in mining communities and a
perception among many Ghanaians that the country‘s mineral reserves have not resulted in a
―good deal‖ for the country. Perhaps because of this, the mining sector has become one in which
civil society is becoming more involved both in the monitoring of transfers from companies to
the Government and how they are used as well as in advocacy around standards and abuses.

- 30 -
D. TAILORING INTERNATIONAL EXPERIENCE IN DESIGNING INSTRUMENTS FOR GOOD
MANAGEMENT OF OIL RENTS TO GHANA
3.13 Given the political incentives and the weak institutional quality discussed above,
what are the lessons from other countries as to how this might be addressed? Collier (2006)
cautions against a ―one size fits all‖ approach and points out developing countries should guard
against adopting a Norway model since they are already resource scarce. With this qualifier in
mind, however, the literature suggests that Ghana might consider a two-pronged approach, with a
number of immediate, if short-term, measures aimed at minimizing governance risks and
improving the level of consensus, transparency and accountability. However, these measures will
ultimately not be sustainable if they are not accompanied by a second set of measures, starting
with a new commitment to an ambitious and comprehensive public sector reform to deal with the
institutional deficit in the medium-term. Without this second set of measures any attempt to
broaden a social contract through consultations or increase the transparency and accountability
during the management phase of revenues will ultimately fail as existing political incentives and
broader institutional weaknesses will dominate. With this caveat, we discuss the possible
immediate measures first that aim to broaden the consensus or the ―social contract‖ around the
use of a country‘s resources, as well as increase the transparency and accountability with which
the rents are managed.
3.14 It is clear that considerable effort should be invested in creating real consensus at
the design stage around what the oil rents will be used for and how they will be managed,
as well as creating a constituency that has a direct interest in the their good management.
This has been done in countries like São Tomé who designed inclusive processes which have
created some consensus on the what and how questions. Since successful models seem to have
―influential constituencies with an interest in responsible resource management and the means to
hold government accountable‖ (Moss and Young, 2009), particular interest should be paid, at the
outset, to including interest groups from non-oil sectors that are likely to be affected by a
negative management of the resources, as well as those that stand to benefit directly from the
new rents. In Indonesia, this required strengthening civil society groups, for example, the voice
of agricultural producers, to express how new revenues will impact their sector vis-à-vis other
better connected interest groups, such as those representing big business. Agricultural producers
formed part of a broad coalition that supported the Indonesian regime and there was a broad
agreement around equity concerns, particularly the need to stabilize rural economies, and a clear
public priority to invest in local, rural communities. A large part of the funds were, thus, used to
finance a community-driven development type operation in rural communities, and agriculture
and labor-intensive industry more generally become the agent of restraint with a direct concern
for public spending as well as the need to avoid appreciation of the real exchange rate. In
Norway, policy makers responded to the demands of a broad-based coalition of non-oil exporters
by implementing policies that focused on maintaining the competitiveness of the non-oil sectors
during the 1970s and 1980s. In Alaska, such a constituency was artificially created through the
Permanent Fund Dividend (Moss and Young, 2009). Nigeria provides an example of the perils of
not listening to voices from non-oil sectors at the outset and proceeding without a social
consensus. And while an inclusive design process will not in itself change a political culture
based on narrow interests, it can help create consensus about what is to be financed and how.

- 31 -
3.15 In this regard, a commendable first attempt was initiated in 2008 in Ghana to
involve shareholders in the design stage through a national dialogue and a series of
regional consultations but more discussion of the details of fund management is needed,
particularly with stakeholders who stand to benefit directly from of the new rents or be
negatively affected by their mismanagement and could, therefore, become a constituency
for good governance of them. To-date, there has been little space for more in-depth discussions
with stakeholders on the details of what the rents will be used for and how they will be managed.
In this discussion, it might be advisable to ensure that non-oil sector interests, particularly those
of the agricultural sector, are heard and that these are not overshadowed by those of big oil
companies. Other stakeholders that stand to lose from poor mismanagement of the resources and
who are thus obvious advocates of a transparent and accountable management of the rents
include private sector actors in non-oil sectors that could lose competitiveness through currency
depreciation, as well as local communities who, at present, are faced with the possibility of
increased devolution of power and resource management to the local level. Until the Government
presents its revenue management plans it is not clear whether there are other constituents that
stand to benefit from holding Government accountable for using the money for the purposes that
it was intended. This is an important debate and will have to be carefully managed to balance the
need for a social consensus with regional and ethnic considerations which are a potentially
divisive force (and which have worsened as a results of oil revenues in neighboring Nigeria,).
There may also be the need to consider compensating (or providing some insurance to) the
populations whose livelihoods would be negatively affected by an environmental mishap, such
as the fishermen who earn their living from the same water.
3.16 Second, the cases of São Tome and Chad, as well as Ghana‘s experience in the
mining sector, all suggest that it is equally important to have, as a product of the design
stage, a clear institutional framework. This framework must provide clarity on specifics.
Issues such as which government institution(s) will run the concession auctions, how will
concessionaires be monitored, how will it actually report all the information that it needs for
transparency, how will the head(s) of this institution be appointed, on what basis will they be
removed, will there be an independent inspector general to review their work and what reporting
arrangements, and to whom, will all require definition. Ongoing discussion related to the
preparation of the Ghana Petroleum Regulatory Authority (GPRA) bill provides the opportunity
to do so.
3.17 Third, the literature describes how additional accountability and transparency
mechanisms can be built into institutional frameworks, through oil funds to improve weak
institutional contexts. Oil funds have been seen to be an important mechanisms for controlling
Dutch Disease and, while they do not provide magic bullet type solutions to weak institutional
environments, recent evidence suggests that they can provide an opportunity for better
management, if only temporarily. Humphrey‘s and Sandby (2007) note that for such funds to be
effective three things are necessary: (i) withdrawal decisions should be regulated by clear rules
rather than general guidelines; (ii) key decisions should be made by broad bodies representing
the interests of diverse political constituencies; and (iii) there should be high levels of
transparency governing their operation. Any earmarking through transfers to oil funds, of
course, should also be part of a transparent budget process. São Tomé, which adopted a revenue
law in 2004, provides perhaps the clearest example to-date of how this has been done.

- 32 -
Box 3.1: São Tomé‘s Oil Fund
The framework makes provisions for a number of additional windows of opportunity to increase transparency and
accountability by placing the responsibility on the company to disclose information in an accessible form to a public
information office and, if they fail to do so, they risk losing their contract. It also mandates, and gives wide ranging
power to, an inclusive oversight mechanism which includes a broad base of eleven stakeholders, only one of which
is appointed by the President (ministers, auditor general, 3 civil society representatives etc). The National Assembly
is also required to hold yearly public hearings on the performance of the fund.
3.18 Drawing on the experiences from other countries and the experience in the mining sector
in Ghana, the new set of laws currently in Parliament for consideration may, therefore, consider
the following: (i) create an independent regulatory body that does not depend on appointment by
the President and on the Executive for funding; (ii) include a wide range of stakeholders in
oversight mechanisms; (iii) be specific about conflicts of interest for members of any
mechanism; (iv) have clear disclosure rules, with responsibilities and implementation
arrangements defined; and (v) provide sufficient power to the mechanisms to investigate, probe
and rule at least until formal judicial institutions are capable of doing this.
3.19 Fourth, increasing transparency – both through additional mechanisms and beyond
- is perhaps the most powerful set of actions that a government can take to ensuring good
management of oil revenues. Beyond a general commitment to the principle of transparency, it
is important to ensure that commitments are specific enough to be monitored. Clarifying
precisely how a specific percentage of the rents will be used to fund specific actions in specific
sectors, with companies and government reporting both royalties received, and when,
government revenues broken down by other sources and regularly published, the number and
identity of bidders for concessions disclosed, publication of bidding documents, and auctions
conducted are all lessons from a range of sites including Texas, Alaska, Peru and Brazil. For
future contracts, Ghana may also want to consider international competitive bidding to, as
Collier (2006) notes, address the power asymmetry that exists between large oil companies and
developing countries. As Ghana reviews the final draft of its freedom of information bill which
is presently with Justice Crabbe, these issues will be important to consider and/or incorporate.60
3.20 Fifth, in countries where democratic institutions are maturing and there is limited
experience in civic counterweights as is the case with Ghana, additional capacity building
investments are often needed both for the executive, parliament and civil society. With
respect to the executive, the case of Chile and Indonesia point to the possibility of empowering a
group of technocrats within the civil service who can work in close coordination with politicians
to oversee the management of the rents and even bolster their credibility. For civil society and
the media, it may be possible to use the experiences of some CSOs that are working around
budget literacy, civic education, collective bargaining and accountability in applying
compensation standards in the mining sector, for example, to scale up knowledge and ultimately
social accountability instruments, particularly outside Accra. However, for civil society
stakeholders to do this effectively, Ghana will need to ensure access to information with the
passage of a freedom of information act which meets international standards.61
Additional
60
Justice Crabbe has been assigned from the Law Reform Commission, in charge of drafting and reviewing new
legislation, to prepare the Freedom of Information act. 61
A draft act exists which defines what information is accessible to the public, what information is exempt and the
process by which it can be solicited. It is presently being reviewed by Justice Crabbe. A coalition of CSOs has

- 33 -
training for parliamentarians in technical issues relating to the petroleum sector, as well as
budget literacy, may also be required given the fact that a large percentage of the new
parliamentarians are first time members of parliament and that that the political incentives
suggest that Parliament will become a stronger check and balance, under this Government.
3.21 Sixth and most importantly is the need to address the political incentives and
institutional deficit in the long-term in Ghana. Experience has shown that the institutions of
countries with low institutional quality and perverse political incentives are normally further
weakened and distorted once oil revenues begin to come on line and thus, in addition to the
short-term measures described above, the discovery of oil in Ghana clearly requires new
commitment and support for broader public sector reform. The time might now be right to do
this for at least four reasons. First, the new Government‘s manifesto describes its role as one of
an ―activist state‖ and there are indication that a single pay spine for civil servants will be
implemented in a phased way focusing on capacity, skills and greater clarity around roles,
responsibilities and institutional processes. Second, the delicate macro situation that the new
Government faces demands that inefficiencies, duplications and waste be identified and
addressed. The new Government has already held a series of retreats to attempt to do this within
the context of the budget for the remaining months of 2009. In addition, the Government, as
committed to in its manifesto, has made an attempt to consolidate ministries. Third, development
partners have been mobilized around the issue of capacity development since the publication of
the draft Aid Policy Paper in September 2008. The Aid Policy Paper acknowledges that public
sector capacity is low and calls for a more comprehensive approach to capacity development.
The World Bank and DFID have currently been charged with facilitating thinking on how
development partners might better support the Government in developing its public sector
capacity and a number of tools and products are under ` on net payments to government and
other public authorities (Revenue Watch). Ghana is already an EITI country and may want to
volunteer to abide by these standards, establish a code of ethics for the sector, draw on best
practice for corporate and social responsibility programs and start its new phase as an oil
producing country by disclosing the non-commercially sensitive parts of the increasing number
of contracts with oil companies.
provided extensive comments on this draft and if a large part of them were to be incorporated and then passed,
Ghana would have a conducive environment for increasing accountability.

- 34 -
Table 3.1: Political Economy Classification of Oil Exporters
Political Features Institutional Implications Economic Implications Mature Democracy:
Stable party system Long horizon Savings likely
Range of social consensus Policy stability, transparency Expenditure smoothing, stabilization
Strong, competent, insulated bureaucracy High competitiveness, low transactions costs Rent transferred to public through government-provided social services and insurance or direct transfers
Competent, professional judicial system Strong private/traded sector, pro-stabilization interests vis-à-vis pro-spending interests
Highly educated electorate
Factional Democracy:
Government and parties often unstable relative to interest groups Short horizon Savings very difficult
Political support gained through clientelistic ties and provision of patronage
Policy instability, non transparency, high transaction costs Procyclical expenditure; instability
Wide social disparities, lack of consensus Strong state role in production Rents transferred to different interests and to public through subsidies, policy distortions, public employment
Politicized bureaucracy and judicial system Strong interests attached directly to state expenditures; politically weak private non-oil sector and pro-stabilization interests
Paternalistic Autocracy:
Stable government; legitimacy originally from traditional role, maintained through rent distribution
Long horizon Procyclical expenditure, mixed success with stabilization
Strong cultural elements of consensus, clientelistic and nationalistic patterns
Policy stability, non transparency Risk of unsustainable long-term spending trajectory leading to political crisis
Bureaucracy provides both services and public employment Low competitiveness, -high transactions cost
Strong state role in production
Strong interest attached directly to state expenditures; weak private sector
Reformist Autocracy
Stable government, legitimized by development Long horizon Expenditure smoothing, stabilization
Social range of consensus towards development Policy stability, non transparency State investment complementary to competitive private sector
Constituency in non-oil traded sectors Drive for competitiveness low transactions costs Active exchange rate management to limit Dutch disease
Insulated technocracy Strong constituency for stabilization and fiscal restraint
Predatory Autocracy
Unstable government, legitimized by military force of arms Short horizon No savings
Lack of consensus building mechanisms Policy instability, non transparency Highly procyclical expenditure
Bureaucracy exists as mechanism of rent capture and distribution; corrupt judicial system
Low competitiveness, high transactions costs Very high government consumption, rent absorption by elites through petty corruption and patronage, capital flight
Little or no civic counterweight Spending interests strong vis-à-vis private sector or pro-stabilization interest

- 35 -
4. PUBLIC FINANCIAL MANAGEMENT
A. THE ARRIVAL OF OIL REVENUE MAGNIFIES ALREADY EXISTING PUBLIC FINANCIAL
MANAGEMENT CHALLENGES
4.1 Widening deviations in budget execution and growing deficit illustrate Ghana‘s
difficulties in enforcing its budget law, and highlights its public financial management
challenges. As oil revenue starts to flow into the budget from 2011 onwards, these challenges
will be exacerbated and, unless addressed rapidly, the risk of oil revenue being diverted from its
designated use will remain high.
Table 4.1: Budget Deviations and Deficits Have Been Widening Fiscal Deficit (% of GDP)
2005 2006 2007 2008
Budget 2.6 4.6 3.9 5.7
Actual 3.0 7.5 9.1 14.9
Deviation 0.4 2.9 5.2 9.2
Source: IMF
4.2 In the face of it, a number of reforms could help reduce fiscal deficits while making
the budget more supportive of Government‘s development priorities. It includes: (i) public
expenditure planning and budgeting through a more effective MTEF; (ii) developing Ghana‘s
Integrated Financial Management Information System, GIFMIS; (iii) strengthening payroll
management and control; and (iv) critically screening capital expenditures.
4.3 In selecting these areas for policy reform it is important to recognize the substantial
progress in Public Financial Management in recent years. Ghana has made good progress in
adding public sector agencies to the computerized personal and human resource management
database system (IPPD-2), with 60 percent of subvented agencies having already been added to
IPPD-2. Ghana has also strengthened internal review of public investments, establishing at the
Ministry of Finance and Economic Planning (MoFEP) a Project Finance Analysis (PFA) Unit
with responsibility for analyzing, monitoring and evaluating new investment projects deemed
eligible for Government support.62
There is also closer monitoring of transfers to the energy
utilities, with government‘s cross-debt clearing arrangement between the utility companies
settling inter-agency debts at the Ministry of Finance. And tax administration has improved by
further extending the Government‘s tax collection capacity.
B. STRATEGIC BUDGETING THROUGH A MORE EFFECTIVE MTEF
4.4 Reforming the MTEF would make the budget more strategic. Ghana was one of the
first countries in Sub-Saharan Africa to begin framing annual budgets within a regularly updated
Medium Term Expenditure Framework (MTEF). From the middle 1990s, capital and recurrent
62
This unit will also have the responsibility of assisting project sponsors leverage private financing by assisting
them in setting up Public-Private Partnership (PPP) Agreements and Private Finance Initiatives (PFIs). To realize
the Government‘s plans, DFID is providing support in the area of project evaluation, and the Bank is providing
technical assistance to review and upgrade the current framework for investment appraisal and PPPs to ensure that
Government resources are deployed in the most optimal manner for achieving the maximum economic benefits.

- 36 -
budgets were integrated within a unified program-based budget, inclusive of performance
information. But initial enthusiasm was premature. Over a decade after its launch, the MTEF still
fails to exert strategic influence on annual budgeting, which remains incremental, line item
based, and adversarial in character. Ministries, Departments and Agencies (MDAs) regularly
exceed MoFEP budget guidelines, and pay little attention to the efficiency and effectiveness of
existing resource use. At the same time, an enormous staff effort is devoted to assembling
volumes of detailed budget information, complete with indicators and objectives, which have no
discernable traction on real budget decisions.
4.5 The budget remains very fragmented, and the annual budget process is incremental
and poor at responding to changing policy priorities in a fiscally coherent way. As noted in
the recent External Review of Public Financial Management (World Bank, 2009c), the budget
process is very fragmented, with less than 45 percent of expenditure covered by the MTEF
(Items I & II are allocated outside the MTEF planning process, as are externally financed
investments). Budget ceilings are not credible and are ignored by MDAs. There is a large
variation between initial ceilings and what is finally negotiated between a line ministry and
MoFEP. Cabinet is not involved in resource allocation trade-offs, in-year releases are
unpredictable (even though aggregate revenue projections have been quite accurate) and MDAs
act rationally in ignoring MoFEP‘s MTEF derived budget ceilings. The outer years of projected
program spending are notional, and the performance information contained in the detailed MDA
volumes serves little purpose in budget implementation. Prioritization does take place, but by
default and not strategically.
4.6 There are many reasons to address these deficiencies and ensure that spending
decisions reflect the Government‘s policy priorities in a manner that is fiscally sustainable.
The first is to make better use of existing budget resources. Instead of responding to current
policy priorities, the budget funds policies, programs and staffing structures that have
accumulated over many years, with some of questionable relevance. Managers have little
incentive to examine critically the existing use of resources -- financial, physical and human.
Their motivation is to defend the status quo lest currently approved resources are lost. Adding oil
revenue to such an inefficient allocation system would mean that they, too, would be
inefficiently allocated and used. Current budgeting incentives encourage over-bidding and waste.
A well functioning MTEF, introduced early in the preparation process and made the basis of
annual budget ceilings (and cabinet level policy-making through the year) greatly changes these
incentives for the better. Additional reasons discussed below include underpinning the goals of a
Fiscal Responsibility Law, and ensuring that arrangements for stabilizing oil revenue and
preventing international price volatility do not undermine domestic budgeting.
4.7 The MTEF needs to be made more comprehensive, and more tightly tied into the
annual budget preparation process, and to be the fiscal reference against which future
policy decisions with spending implications are assessed. There are three key steps to make
Ghana‘s MTEF more effective as an instrument for strategic budgeting. First, the MTEF should
be expanded to cover all categories of Central Government spending and all sources of finance at
both the aggregate and the MDA level. Second, political commitment to the annual budget
process should be strengthened. The Cabinet could play a larger role in approving the
sectoral/MDA ceilings proposed by MoFEP on the basis of the macro-fiscal situation and the
MTEF rolled forward each year. Transparency of the budget should be increased by MoFEP

- 37 -
preparing a Budget Framework Paper (BFP) at the start of the process. This would set forth the
macro-fiscal situation, aggregate available resources, and the proposed sector/MDA allocations
consistent with the previous year‘s MTEF and new policy decisions taken during the year (and
anticipated). Third, the MTEF should be the resource availability reference against which all
policy decisions with financial implications in current and future years are evaluated. Further,
MDAs should be encouraged to prepare sector and sub-sector strategic plans consistent with the
overall resource framework.63
4.8 The amount transferred from the Oil Fund to the annual budget should be guided
by the MTEF and be subject to a fiscal rule. The solution lies in an arrangement which allows
the fiscal rule to determine the maximum that can be drawn in any year from the Fund. With a
Permanent Income Fund (PIF), the rule would be straightforward, with a same amount channeled
every year to the budget. With a Stabilization Fund, the actual amount transferred to the budget
should be discretionary within the limit of the fiscal rule. This would be decided by reference to
a Medium Term Fiscal Framework (MTFF), the macro-fiscal foundation of a MTEF.64
Furthermore, the implication here is that, whatever the ultimate use of Oil Fund revenues, all
withdrawals from the Fund pass through the annual budget, so that fragmentation is avoided, and
the budget presents a single picture of government spending. Thus, even if the source of a project
or program‘s funding might be the CPF, the amount spent would be appropriated through the
budget, and thus subject to normal budgetary spending rules, and reported as part of budget
execution.
4.9 The proposal for a Fiscal Responsibility Law (FRL) is a good one, but the
Government should proceed with deliberation, finalizing it only when other components of
the financial management system, such as the reformed MTEF and budget process, and oil
revenue arrangements are in place. Ghana has been considering enacting a Fiscal
Responsibility Law. The FRL was announced in the 2008 Budget Speech, and drafting is
underway with assistance from the IMF. It is understood that the FRL will incorporate a fiscal
rule based upon a reference level of public debt (probably 45 percent), above which fiscal
adjustment will be triggered, based upon a minimum improvement in the budget primary
balance. A Fiscal Council will be established to report compliance and advise the Government.
Such a law would be the capstone of Ghana‘s public financial management legal framework,
which could both enshrine principles of good PFM, incorporate key processes like the MTEF
and the annual budget preparation, and mandate standards of fiscal transparency, consistent with
international good practice. The Government should proceed with developing such a law, but
finalize it only when reforms to the MTEF and budget process have been agreed, and how the oil
and gas stabilization fund will operate is clearer.
63
Some strategic plans are prepared presently, but they are not consistent with available resources, thus do not
address intra-sectoral priorities and trade-offs, and serve chiefly as bidding documents to lever additional resources
from MoFEP during the budget preparation process. 64
Terminology varies, but a MTEF is normally seen as comprising two elements: (i) a 3 year macro-fiscal plan
embracing aggregate revenues, spending and budget balance, and, (ii) a 3 year breakdown of spending by sector
and/or main spending ministries. This is imposed top-down, but as costing improve, increasing the sector/MDA
envelopes will reflect the cost of existing policies and programs, leaving ―headroom‖ for new policies.

- 38 -
C. DEVELOPING THE GIFMIS
4.10 The Government should ensure full and effective implementation of budget
management support systems. Ghana‘s Budget and Public Expenditure Management System
(BPEMS) and its Integrated Payroll and Personnel Database (IPPD2) are, respectively, the
Government‘s integrated financial management system and human resources management
system. Implementation of BPEMS started in 1999 with the purchase of six Oracle Financials
modules,65
initially with donor support and since 2005 with the Government‘s own funding.
Both development and roll out have been problematic. Currently, BPEMS operates in 8 pilot
ministries, but only a fraction of transactions are processed through BPEMS, although the system
has the capability of processing all. At the same time, key functions like budget preparation,
releases and production of public accounts are done by alternative systems. 66
The
Government‘s intention is to build on BPEMS to develop the Ghana Integrated Financial
Management Information System (GIFMIS), able at fulfilling all these functions, and make it the
sole financial management system for all ministries and agencies. Until GIFMIS is fully
operational, Ghana will continue to lack a modern PFM system, capable of processing multiple
transactions rapidly, facilitating control systems, and providing comprehensive and timely
reports to management and for external scrutiny.
D. MANAGING THE PUBLIC SECTOR WAGE BILL
4.11 There is an urgent need to contain the growth of the public sector wage bill through
better control of hiring and a more coherent public sector wage policy. The original version
of the Government‘s payroll management system (currently IPPD2) was launched in 1995 and,
after problems emerged a few years ago, replaced with a new version partially implemented in
2007. Although Oracle based, it is not linked to BPEMS. Connectivity and staff capacity
problems have slowed roll out, and many MDAs use their own HR management systems – even
though pay scales, excepting for health, are essentially common across government. A major
problem is the absence of a consolidated establishment list, against which staffing can be
controlled. This contributes greatly to the difficulty the Ministry of Finance has encountered
holding the line on staff numbers. In turn, it contributes to the high and rapidly growing wage
bill. The larger point is that if oil revenue is not going to result in further uncontrolled staffing
expansion, priority must be given to completing the roll out of IPPD2 and the strengthening of
establishment controls. And if some subvented agencies are allowed to retain their own systems,
reporting back to government must be improved, and staffing approval processes and controls
established and followed.
4.12 Strengthening public sector payroll bill management and control should result from
actions on several fronts:
65
General Ledger (GL), Purchase Order (PO), Accounts Payable (AP), Cash Management (CM), Public Sector
Budgeting (PSB), and Accounts Receivable (AR). The system was extensively customized to fit traditional
processes rather than modernizing the latter. As a result, it is costly to maintain, future upgrades are difficult, and
ultimately will not be supported by Oracle. A joint donor PFM advisers‘ review in April 2008 estimated that only
6 percent of the value of budget expenditures was being processed through BPEMS. 66
ACCPAC is used by the CAGD for the production of public accounts, BMS for releases, NETS for Items III and
IV, and Activate by MoFEP and most MDAs for budget preparation, consistent with GPRS strategic objectives.

- 39 -
Strengthening oversight of records regarding enter, exit and transfers of employees
in the payroll system, beyond what the legal requirements stipulate. These oversight
weaknesses compounds the software problems outlined above, as neither the records of
employees who exit employment are promptly removed from the system, nor are records quickly
updated to reflect transfers within the public sector. The responsibility for updating the payroll
records is decentralized to the respective MDA, so at times it takes several months for records to
be updated. Even though heads of departments sign the on the number of employees in their
departments on a monthly basis, there is no structure within the MDA or from a central source
(e.g. CAGD or OHCS) to routinely check whether staff on the payroll are indeed at post.
Implementing a single payroll spine system that provides comparability across
sectors and guides the present system of decentralized wage negotiations. In the absence of a
system that provides comparability across sectors, the present process of decentralized wage
negotiations tends to distort pay reform. There are 9 different service unions that negotiate wage
agreements separately for their members with government. In this context, across the board pay
increases end up not recognizing distinct categories within these agreements, leaving to the
discretion of most agencies the decision of moving staff across grades. The result is that MDAs
tend to abuse the decentralized promotion system.
E. PUBLIC INVESTMENT
4.13 Given its magnitude in the budget and the emphasis that it has been given as an
engine of growth, there is scope for a more robust approach to the identification,
preparation and management of public investments. This would call for the following:
Screening public investment proposals, requiring that project selection is guided by
clearly defined priorities, and the preparation of pre-feasibility studies, including the calculation
of net present social value using either cost-benefits or minimal costs analysis. These steps
should allow funds to flow on the margin to projects with the highest rate of return or the lowest
cost of delivery to beneficiaries;
Broadening oversight over the finances of State Owned Enterprises (SOEs) and over
external borrowing by having the State Enterprise Commission submit to MoFEP quarterly
consolidated reports on the financial position of SOEs – at present the SEC receives only
individual SOE reports, but does not consolidate them.

- 40 -
5. INFRASTRUCTURE
5.1 Ghana‘s oil revenue could allow narrowing its infrastructure gap. This chapter looks
at opportunities and challenges in this domain. It concludes that Ghana‘s infrastructure needs,
though substantial, do not look daunting relative to the size of the country‘s economy and
historic levels of infrastructure spending. However, there are major inefficiencies in the way the
country deploys resources for infrastructure that urgently need to be addressed. Moreover, a
substantial amount is being absorbed by utility subsidies. Fine-tuning of the institutional and
regulatory framework will thus also be needed to get the most out of the country‘s existing
infrastructure endowment.
5.2 Infrastructure development contributed a net 0.5 percent to Ghana‘s improved
growth performance per capita in the period 2001-05 (Calderon, 2008). The net impact of
infrastructure on Ghana‘s growth performance lagged behind that in the ECOWAS region as a
whole. Whereas the telecom revolution contributed a full percentage point to improved per capita
growth performance in Ghana, deficient power infrastructure actually held growth back by half a
percentage point (Figure 5.1). These estimates predate the 2006/07 energy crisis that had an
even greater dampening effect on growth by constraining production in the mining,
manufacturing and services sectors.
Figure 5.1: Historic and Potential Future Links Between Infrastructure and Growth
(a) Historic changes in growth per capita (b) Potential improvements in growth per capita
Source: Africa Infrastructure Country Diagnostic.
5.3 Upgrading Ghana‘s infrastructure could potentially add four percentage points to
per capita GDP growth. If the quality and coverage of Ghana‘s infrastructure was improved to
the level currently enjoyed by Mauritius – the African country with the best infrastructure
endowment – the country‘s per capita growth performance could be enhanced by four percentage
points. The largest potential contribution would come from addressing deficiencies in power
infrastructure that would be responsible for 1.7 percentage points of this overall gain.
A. FINANCING GAP
5.4 The World Bank estimated the cost of providing a standardized infrastructure package in
a number of African countries, including Ghana. The package is designed to meet foreseeable
-1.0
-0.5
0.0
0.5
1.0
1.5
2.0
Mauritiu
s
EC
OW
AS
Gh
an
a
South
Afr
ica
Kenya
Guin
ea-B
issau
Telecom Electricity Roads-2
-1
0
1
2
3
4
5
Nig
er
Gh
an
a
Ke
nya
So
uth
Afr
ica
Ma
uri
tiu
s
Telecom Electricity Roads

- 41 -
economic and social demands for the next decade. In the case of Ghana, the package includes the
following:
For ICT, completing intra-regional fiber optic links and providing universal access to a GSM
voice signal and a public access broadband internet facility.
For power, 2,000 MW of new generation capacity67
, and an increase of electrification up to
76 percent coverage.
For transport, linking population centers to ports and borders via good quality paved roads,
raising rural access to 75 percent and increasing urban paved road density.
For water and sanitation, achieving the Millennium Development Goals.
5.5 Meeting Ghana‘s infrastructure needs would cost US$1.6 billion per year for the
next decade or around 10 percent of GDP (Table 5.1). About 60 percent of this requirement
relates to capital expenditure and the remaining 40 percent to operations and maintenance.
Almost half of the total spending requirement is associated with the power sector, with
investment needs for that sector alone as high as US$600 million per year.
Table 5.1: Indicative Infrastructure Spending Needs in Ghana
Sector
US$ billion per year
Capital
expenditure
Operation and
maintenance
Total
spending
ICT 0.03 0.03 0.07 Power 0.60 0.13* 0.73 Transport 0.27 0.22 0.49 WSS 0.12 0.20 0.31 Total 1.02 0.58 1.60
Source: Africa Infrastructure Country Diagnostic.
Note (*) does not include fuel used for electricity generation.
Table 5.2: Infrastructure Financing Flows to Ghana (average annual for 2003/06)
Sector
US$ billion per year
O&M Capital expenditure
Total Public
Sector
Public
Sector
OECD
Financiers
Non-
OECD
Financiers
PPI Total
Capex
ICT 0.18 0.06 0.00 0.03 0.13 0.22 0.39 Power 0.13* 0.06 0.02 0.06 0.01 0.15 0.27 Transport 0.12 0.05 0.12 0.01 0.00 0.17 0.29 WSS 0.04 0.02 0.10 0.00 0.00 0.12 0.16 Total 0.47 0.18 0.24 0.10 0.14 0.66 1.13
Source: Africa Infrastructure Country Diagnostic. Note (*) does not include fuel used for electricity generation.
5.6 During the mid-2000s, Ghana was already spending US$1.1 billion per year (or 10
percent of GDP) and that total has likely increased (Table 5.2). According to the AICD
review of infrastructure spending during the mid-2000s, Ghana emerged as a country with a
relatively high GDP share dedicated to infrastructure spending. This share has likely increased in
67
The doubling of existing capacity to 4,000 MW by 2017 would allow satisfying a domestic demand projected to
grow by 7 percent annually (including a small and constant proportion for exports to neighboring countries).
Additional capacity investment to become a large exporter of electricity in the region could be envisaged with higher
gas reserves than currently assessed, among other industrial choices for gas use.

- 42 -
recent years given that the 2007 Eurobond issue allowed additional infrastructure investments of
US$600 million in 2008 (out of which US$500 million was used for electricity), more than the
entire publicly funded infrastructure investment reported for the earlier period. During the mid-
2000s, public investment was predominantly funded from ODA and domestic public finance,
each at around US$0.2 billion per year. Both the private sector and non-OECD financiers also
contributed significantly each with around US$0.1 billion per year.
5.7 During the mid-2000s, Ghana‘s infrastructure financing gap amounted to US$0.8
billion (or 7 percent of GDP). Just over half of the financing gap was associated with shortfalls
in power sector investment alone. There were also significant shortfalls in transport as well as
water and sanitation spending, although these were primarily associated with operations and
maintenance. Lack of adequate maintenance in these sectors explains why some 26 percent of
main roads and 42 percent of urban water networks are currently in need of rehabilitation. The
rapid expansion of the feeder roads network, from 11,500 km in 2001 to 42,000 km in 2008, also
significantly raised the need for maintenance in the transport sector, given their particular
fragility.68
5.8 Ghana‘s financing gap could be substantially reduced to US$0.35 billion per year
(or 2 percent of GDP) if all the inefficiencies in existing spending could be addressed. The
value of operating inefficiencies in the utilities sector is very high, and tackling this problem
could save more than US$0.38 billion per year. Improving cost recovery in power and water
would save a further US$0.20 billion per year. Overall, these measures would substantially
reduce the financing gap, although significant shortfalls of around US$0.15 billion per year each
would remain for power and transport.
Table 5.3: Measures to Address the Infrastructure Financing Gap (average annual for 2003/06)
US$ billion ICT Power Transport WSS Total
Financing gap 0.00 0.46 0.19 0.15 0.80
Reallocate spending 0.03 - - - 0.03
Raise capital budget execution - - 0.01 - 0.01
Reduce operating inefficiencies 0.10 0.04 0.03 0.04 0.21
Improve cost recovery - 0.15 - 0.05 0.20
Remaining gap - 0.27 0.15 0.06 0.35 Source: Staff calculations.
There are a number of avenues that can be taken to raise the missing finance:
Some contribution could be made through non concessional external borrowing, within the
current debt sustainability framework.69
Further public finance on the requisite scale could
also be forthcoming from fiscal petroleum revenues.
68
It is estimated that about half of maintenance spending needs in transport are for feeder roads. 69
Under the debt sustainability framework baseline (IMF and World Bank 2009), a maximum of US$500 million
could be borrowed externally per year on a non concessional basis without raising the level of debt distress.

- 43 -
There is also scope to increase private financing flows. These have been relatively low to
date, standing at 0.8 percent of GDP compared to values of 1-2 percent of GDP among peers
such as Kenya, Nigeria, Senegal and Tanzania.
In the case of the road sector, there is a need to increase revenues allocated to the Road Fund
for maintenance purposes, by increasing the allocation of fuel levy resources from 90 to 100
percent or by increasing fees to DVLA.
B. KEY POLICY ISSUES
5.9 There is scope to reduce utilities‘ inefficiencies. The hidden cost of the inefficiencies
can be estimated by comparing revenues captured by Ghana‘s utilities with those of a well-
performing utility operating under similar circumstances. Taking institutional reform measures to
address these deficiencies needs to be a key priority area.
Ghana‘s power utility (ECG) loses as much as 0.3 percent of GDP due to high technical and
commercial losses (of about 27 percent, against 15 percent for best performers).
Ghana‘s water utility (GWCL) loses a further 0.3 percent of GDP due to high distribution
losses70
(estimated around 50 percent, against 20 percent for best performers).
Ghana Telecom has employment levels significantly higher than best practice levels with the
associated inefficiencies amounting to 0.1 percent of GDP.
5.10 Under-pricing is also a serious issue both in the power and water sectors.
ECG and VRA have historically under-priced power to large industrial customers, resulting
in financial losses of around 1.4 percent of GDP. Tariff reforms affecting most large
industrial customers in late 2007 have improved the situation, but a substantial subsidy of the
order of US$100 million (or about 0.6 percent of GDP) per year remains for the mining
industry that pays no more than US$0.06 per kilowatt-hour for power that costs over
US$0.13 per kilowatt-hour to produce. Also, commercial and residential tariffs did not keep
pace with inflation since the last adjustment in late 2007 and were by end 2009 significantly
below operating costs,71
not mentioning investment costs directly borne by the Budget.
GWCL‘s tariff structure, including a lifeline of US$0.45/m3 for the first 20m3, allows full
operating cost recovery. However, investment costs are financed through donors funding, and
their transmission to end-users would require significant tariff increases. However, given that
piped water connections are heavily skewed towards the upper income groups, increased
tariffs would allow reducing connection costs and would certainly benefit lower income
groups, who currently pay US$5/m3 for water containers.
5.11 Strengthening the financial position of the utilities would put them in a better
position to implement much needed investments.
70
Mostly commercial losses due to illegal connections by private vendors and people in general. In contrast, bills
collection rate, at almost 90 percent, is considered high by international standards. 71
The magnitude of the subsidy varies with the level of rainfall, which affects hydro-power production capacity and
in turn affects the extent to which costly oil imports are needed for supplementary power generation.

- 44 -
Large scale investments in power generation are needed, and are already underway.
However, these need to be complemented with significant investments to upgrade the ageing
and increasingly unreliable high voltage transmission network. Modernization of the
overloaded distribution network is also needed, though this should be done in conjunction
with measures to address problems of metering, billing, theft, and revenue collection.
Access to improved water sources in Ghana is increasing slowly, and access to piped water
has barely moved at all during the last decade. Access to improved sanitation is one of the
lowest in the sub-Saharan region. On current trends, the country will barely meet the MDGs
for access to improved water and will fail to meet the target for improved sanitation. A
concerted effort is needed to address the ―silent crisis‖ in this sector, which even in Accra has
been constraining economic and social activity in the public and private sectors and may pose
serious health and environmental consequences.
5.12 Continuing improvements to policy and regulatory frameworks are also needed so
ensure that Ghana‘s infrastructure can make its full potential economic contribution.
In power, weak management and regulation remains a key issue. Decision making is ad hoc
and dispersed (PURC, MOFEP, Ministry of Energy). There is no clearly defined power
sector investment plan based on least-cost principles that could provide the basis for
mobilizing both public and private resources in a systematic manner. Yet substantial public
funds and bilateral aid go to rural electrification (SHEP) without planning and coordination.
In transport, major institutional reforms are underway under the aegis of the National
Transport Policy. As part of this process, it is necessary to complete the establishment of the
new institutional framework with the creation of the National Roads Authority to act as asset
manager for the network and take on the roles of the Road Funds, as well as the Ghana Rail
Development Authority to develop an appropriate regulatory environment for the sector.
Supporting legislation in the form of the draft Road Traffic and Railways Acts also needs to
be ratified.
In ICT, the recent dissolution of the NCA Board puts into question the independence of
regulatory oversight for the sector. Key issues where further work is needed include
strengthening regulatory capacity for quality of service regulation, moving towards a more
transparent licensing framework for wireless services, developing a transparent strategy for
developing national backbone infrastructure with broad-based private sector participation,
and continuing to make progress with the liberalization of access to the SAT III submarine
cable.
In water and sanitation, the National Water Policy was approved in 2007 and the National
Sanitation Policy was submitted for approval in 2008. Strategic investment plans have been
prepared for both urban and rural water supply but they need to be prioritized and an action
plan developed for their implementation. A national action plan for sanitation is expected
during the third quarter of 2009. While water supply in urban areas is provided by a national
water company and in the rural and small towns coordinated by a national agency,72
sanitation is the responsibility of local governments who lack the necessary technical and
financial capacity. Proper operation and maintenance of water facilities in rural areas and of
sanitation facilities in general remains a key challenge for the WSS.
72
Community Water and Sanitation Agency (CWSA).

- 45 -
6. INVESTMENT CLIMATE
A. GHANA ALREADY HAS MANY OF THE SYMPTOMS OF DUTCH DISEASE
6.1 The arrival of an important oil industry in Ghana will accentuate the existing
private sector economic structure in which the dominant exports are cocoa and gold. Amongst other mineral resources, these do not lend themselves to substantive downstream value
added activity but support a relatively high real exchange rate and, with associated service
sectors, establish a floor for wage levels, hindering the development of the manufacturing sector.
B. GHANA HAS NOT DEVELOPED A COMPETITIVE MANUFACTURING SECTOR
6.2 The Ghanaian economy changed very little in the last two decades and that also
means that the economy‘s set of traditional exports have not changed as well. With respect
to the economic composition of production, the share of industry in total GDP has been steady at
25 percent over the past 25 years. The industrial sector has shown a level of growth which is
only slightly behind agriculture and services. Since 2004, this growth has been concentrated in
the non-tradable sectors, particularly energy and construction. Growth in these non-tradable
sectors was not accompanied by the same level of growth in new export products. While exports
have been increasing rapidly, from $ 2.8 billion in 2005 to $ 4.2 billion in 2007, this is largely
due to high commodity prices. Cocoa, gold, and timber continue to account for approximately
the same proportion of total exports as they did before economic growth accelerated.
Furthermore, the value of trade as a percent of GDP fell in 2007, GDP increased by 6.3 percent
but exports by 5 percent in real terms. This relatively modest performance in the tradable sectors
indicates that Ghanaian firms may not be competitive in international markets. The analysis of
manufacturing firm performance based on the data gathered through the Ghana Enterprise
Survey suggests that only a small number of manufacturing firms have succeeded in developing
new exports. In a group of 42 countries in Sub-Saharan Africa, Ghana ranked 30th
in the rate of
growth of total exports in the period 2000-06.
Figure 6.1: Since 2004, GDP Growth Has Been Concentrated in the Non-Tradable Sectors
Source: World Bank (2009e).
4.0 4.
4
6.1
7.5
6.5
5.7
4.3
2.9
4.7 5.1
5.1
5.6
7.3
7.4
5.1
4.7 4.7
4.7
5.4 6.
5
8.2
0.0
1.0
2.0
3.0
4.0
5.0
6.0
7.0
8.0
9.0
2001 2002 2003 2004 2005 2006 2007*
Sectorall GDP Growth Rates
Agriculture
Industry
Service

- 46 -
C. GHANA‘S LACK OF COMPETITIVENESS APPEARS TO STEM FROM POOR PRODUCTIVITY
6.3 Despite recent improvements in many sectors, Ghana remains somewhat
uncompetitive. In the 2009 WEF Competitiveness Report, Ghana is shown to be relatively
weak in the related areas of technology, innovation, education and labor market efficiency
suggesting that skills and productivity lie at the hard of the competitiveness challenge for Ghana.
Box 6.1: Global Competitiveness Index
Source: World Economic Forum (2009)
6.4 The key issue in determining the competitiveness and prospective path for private
sector development will be the ability to increase the productivity of enterprises. Ghanaian
firms are less productive than those of comparator countries mainly because they are less capital
and skill intensive and relatively small in size. Small firms in Ghana are less productive and less
capital intensive than small firms even in other low income countries in Sub-Saharan Africa,
while large firms are relatively productive and relatively capital intensive. Ghanaian firms are
primarily oriented toward the domestic market and those firms that do export do not have above
average productivity rates.

- 47 -
Figure 6.2: Labor Productivity is Particularly Low in Ghana‘s SMEs
Source: World Bank (2009e).
6.5 Firms in Ghana have less machinery and equipment per worker than firms in the
comparator countries. The median firm has about US$1,200 of machinery and equipment per
worker.73
While capital intensity is relatively low in Ghana, returns on capital, are
comparatively high.
Figure 6.3: Median Capital Intensity is Lowest for Ghana
Source: World Bank (2009e).
73
In comparison, firms in Nigeria have about US$2,600 of machinery and equipment per worker. Firms in South
Africa have close to US$16,000 per worker, and firms in Malaysia have approximately US$26,000 per worker.
$0 $5,000 $10,000 $15,000
Ethiopia
Ghana
Madagascar
Burundi
Uganda
Rwanda
Congo, DR
Tanzania
Nigeria
Benin
Mauritania
Malawi
Kenya
Senegal
Value-added per worker (US$)
Small
$0 $5,000 $10,000 $15,000
Ethiopia
Rwanda
Madagascar
Congo, DR
Malawi
Benin
Burundi
Uganda
Ghana
Nigeria
Kenya
Mauritania
Tanzania
Senegal
Value-added per worker (US$)
Large
0
5000
10000
15000
20000
25000
30000
35000
Ghana Nigeria Kenya South Africa Thailand Malaysia
Cap
ital
per
wo
rker
(U
S$)
All industries Garments Agro-porcessing

- 48 -
D. LABOR MARKETS DO NOT COMPENSATE FOR LOW PRODUCTIVITY
6.6 Firms in Ghana are less likely to export than in any of the comparator countries.
Whereas less than one-quarter of manufacturing enterprises from Ghana export, more than half
export in most comparator countries. Because the international market represents the frontier in
efficiency and productivity, Ghana‘s relatively low export participation suggests labor costs are
not low enough to compensate for low productivity.
Figure 6.4: In Ghana Relatively Fewer Firms Export
Source: World Bank Enterprise Surveys Note: Comparisons only include manufacturing enterprises.
6.7 Labor productivity is relatively low in Ghana. The median firm in Ghana produces
approximately US$1,000 of value-added per worker. In comparison, firms in China, Thailand,
Kenya, and Swaziland produce between six and seven times as much per worker. Firms in
Malaysia produce about fourteen times as much and firms in South Africa over twenty-five times
as much. The relatively small size of manufacturing firms may be a major factor in explaining
Ghana‘s low labor productivity. Labor productivity tends to be lower in small firms. The median
manufacturing establishment has only about 10 employees in Ghana. By comparison, the median
firm in Swaziland had about 60 employees and the median firm in Kenya had about 50
employees (it has been noted there has been a dramatic shift in Ghana over the past decade with
small, and potentially informal, firms becoming increasingly important (Teal et al., 2006).
0% 20% 40% 60%
Ghana
Swaziland
Kenya
South Africa
China
Malaysia
Thailand
Mauritius
% of firms exporting

- 49 -
Figure 6.5: Median Labor Productivity is Relatively Low in Ghana
Source: World Bank (2009e).
Figure 6.6: Manufacturing Constitutes Only a Small Fraction of Ghana‘s GDP
Source: World Bank (2009e).
6.8 The ratio of mandated minimum wage rates to labor productivity (value added per
worker) is also an important determinant of the demand for labor. The ratio is 0.56 for
Ghana as against 0.4 in Cambodia and 0.43 in China. Labor market policies such as minimum
wages, statutory redundancy pay, etc, have an obvious bearing on the labor market, setting the
rules of the game. The fact that hiring workers formally results in a very high cost makes many
Ghanaian employers continue to hire workers casually. Many of the recent gains in total factor
productivity have come from agriculture with little progress made by industry. In consequence,
0
2
4
6
8
10
12
14
16
18
20
Val
ue
add
ed in
man
ufa
ctu
rin
g (%
of
GD
P)
$0 $5,000 $10,000 $15,000
Ghana
Nigeria
Kenya
Swaziland
China
Thailand
Mauritius
Malaysia
Value-added per Worker (2005 US$)

- 50 -
Ghana has not had the competitiveness to attract internationally mobile labor-intensive industries
such as garments, footwear or electronic assembly.
E. REGULATIONS ON ONGOING BUSINESS OPERATIONS ARE NOT CONSIDERED BINDING
6.9 While Ghana has made significant strides in terms of removing the barriers to
private sector activity in Ghana, ranking in the top 10 reformers of 2006 and 2007 and now
ranking in the top half of countries assessed in the World Bank ―Doing Business‖ survey, it
is sometimes commented that Ghana has its worst rankings in the sectors which are most
important for a low-income country (those related to starting a business, labor regulation and
gaining access to finance). Equally, however, Ghana has by far the most attractive business
environment of any of the countries in West Africa.
Table 6.1: Doing Business Indicators
Ease of Doing Business 2007 2008
Starting a Business 137 143
Dealing with Licenses 142 139
Employing Workers 145 144
Registering Property 31 27
Getting Credit 109 102
Protecting Investors 38 33
Paying Taxes 65 83
Trading Across Borders 76 63
Enforcing Contracts 50 50
Closing a Business 104 99
Overall Ranking 87 82
Source: World Bank (2009f).
F. FOREIGN INVESTMENT HAS FAVORED COMMODITIES AND SERVICES
6.10 In part due to the favorable market for commodities in recent years, but also due to
the relative attractiveness of Ghana as the ―Gateway to West Africa,‖ the value of FDI and
the country‘s share of regional FDI flows have both increased. Unrest in several of Ghana‘s
neighboring countries has served to enhance Ghana‘s attractiveness as a regional location for
processing crops such as cocoa, as well as serving the regional markets. In addition, Ghana has
benefited from investment in logistics as it has reestablished its historic position as a trade route
to the landlocked countries of the Sahel due to continued uncertainty in Côte d‘Ivoire.
6.11 Extractive industries typically bring with them an international standard of
business services (accounting, finance, etc.). International mineral resource conglomerates are
essentially a conduit for mobilizing capital for emerging market investment. Internationally
capital markets are receptive to emerging market offerings for extractive industries (Ashanti
Gold was historically the only Ghanaian company with an international listing). It is possible
that the increased presence of ―international standard‖ companies in the oil sector will serve as a
catalyst for the provision of business services in Ghana, for which there is already a nascent
regional service cluster. There is strong anecdotal evidence to suggest that internationally
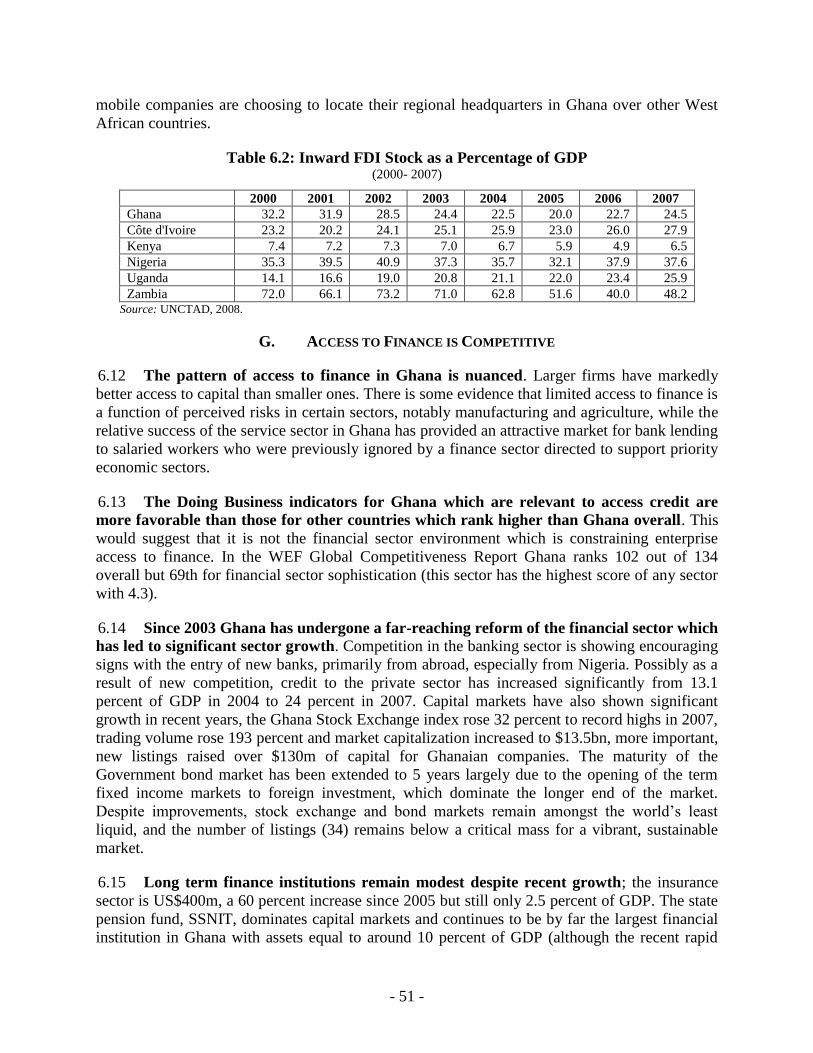
- 51 -
mobile companies are choosing to locate their regional headquarters in Ghana over other West
African countries.
Table 6.2: Inward FDI Stock as a Percentage of GDP (2000- 2007)
2000 2001 2002 2003 2004 2005 2006 2007
Ghana 32.2 31.9 28.5 24.4 22.5 20.0 22.7 24.5
Côte d'Ivoire 23.2 20.2 24.1 25.1 25.9 23.0 26.0 27.9
Kenya 7.4 7.2 7.3 7.0 6.7 5.9 4.9 6.5
Nigeria 35.3 39.5 40.9 37.3 35.7 32.1 37.9 37.6
Uganda 14.1 16.6 19.0 20.8 21.1 22.0 23.4 25.9
Zambia 72.0 66.1 73.2 71.0 62.8 51.6 40.0 48.2 Source: UNCTAD, 2008.
G. ACCESS TO FINANCE IS COMPETITIVE
6.12 The pattern of access to finance in Ghana is nuanced. Larger firms have markedly
better access to capital than smaller ones. There is some evidence that limited access to finance is
a function of perceived risks in certain sectors, notably manufacturing and agriculture, while the
relative success of the service sector in Ghana has provided an attractive market for bank lending
to salaried workers who were previously ignored by a finance sector directed to support priority
economic sectors.
6.13 The Doing Business indicators for Ghana which are relevant to access credit are
more favorable than those for other countries which rank higher than Ghana overall. This
would suggest that it is not the financial sector environment which is constraining enterprise
access to finance. In the WEF Global Competitiveness Report Ghana ranks 102 out of 134
overall but 69th for financial sector sophistication (this sector has the highest score of any sector
with 4.3).
6.14 Since 2003 Ghana has undergone a far-reaching reform of the financial sector which
has led to significant sector growth. Competition in the banking sector is showing encouraging
signs with the entry of new banks, primarily from abroad, especially from Nigeria. Possibly as a
result of new competition, credit to the private sector has increased significantly from 13.1
percent of GDP in 2004 to 24 percent in 2007. Capital markets have also shown significant
growth in recent years, the Ghana Stock Exchange index rose 32 percent to record highs in 2007,
trading volume rose 193 percent and market capitalization increased to $13.5bn, more important,
new listings raised over $130m of capital for Ghanaian companies. The maturity of the
Government bond market has been extended to 5 years largely due to the opening of the term
fixed income markets to foreign investment, which dominate the longer end of the market.
Despite improvements, stock exchange and bond markets remain amongst the world‘s least
liquid, and the number of listings (34) remains below a critical mass for a vibrant, sustainable
market.
6.15 Long term finance institutions remain modest despite recent growth; the insurance
sector is US$400m, a 60 percent increase since 2005 but still only 2.5 percent of GDP. The state
pension fund, SSNIT, dominates capital markets and continues to be by far the largest financial
institution in Ghana with assets equal to around 10 percent of GDP (although the recent rapid

- 52 -
growth of bank assets is bringing some banks closer to this position). New legislation will reduce
the role of SSNIT and this facilitation of private schemes will be vital to building the domestic
capital market. At present, state influence in the financial sector remains through significant
direct and indirect ownership stakes in several institutions and serves to direct capital to
microfinance and venture capital.
6.16 The changes and improvements in the financial sector have produced dramatic
results in a relatively short period of time. Institutions have been reformed to better establish
the value of credit and allow for allocation on the basis of comparative benefit. The greater
flexibility allowed to financial institutions in the allocation of credit has not only been as a result
of regulatory and policy reform, it has also been a function of technological innovation, which
has lowered individual transaction costs and facilitated down-scaling of banking operations.
Perhaps reflecting the wider options open to banks, Enterprise Survey data suggests the
manufacturing sector has yet to benefit fully from the substantial reforms to the financial
markets. The limited use of credit and low levels of investment by manufacturing firms shows
that use of financial instruments is not as far along in Ghana as in several of its cohort.
6.17 Interest rates remain high, most likely explained by the challenges in shaking off a
record of double digit inflation and high government borrowing as well as a history of a
high proportion of non-performing loans. Non-performing loans, having fallen from
23 percent in 2002 to 6.1 percent in September 2007, grew to 8.8 percent in May 2008; however,
the NPLs come from the traditional borrowers. Moreover, non-performing loan rates are
markedly higher than average at financial institutions with a history of state influence and which
have tended to support identified sectors of economic priority (Agricultural Development Bank,
National Investment Bank and Merchant Bank all have NPL rates higher than their peers).
6.18 Not surprisingly, the sectors with poor loan performance face high interest rates
and limited supply of credit. In the year to May 2008, these trends were even more marked,
with services receiving over 42 percent of all new credit while manufacturing received only 8.5
percent. More remarkably, the share of households in new credit rose to 33.4 percent, up from
19.2 percent for the same period in 2007, while enterprises shared 66 percent (down from 77.7
percent in 2007). On year to year basis, credit to households increased by 89 percent to
GH¢856.3 million, compared with 49 percent increase for the same period in 2007. Within
lending to the enterprise sector, there is a significant concentration in the Commerce and Finance
and the Services sectors, together representing more than half of all enterprise lending. The
interest rates payable by blue chip companies (such as large international conglomerates) is
broadly comparable to treasury bill rates, while the rates paid by SMEs is about the same as that
paid by individual borrowers, and notably lower than that paid by enterprises in the agricultural
sector. Details of a recent credit conditions survey contained in the July 2008 Financial Stability
Assessment published by the Bank of Ghana indicated that Small and Medium-sized Enterprises
continue to benefit from increased access to credit, despite an overall net tightening of credit
stance to enterprises. The report identified increased competition in the banking sector as the
main contributing factor to the net easing of credit to SMEs.
6.19 The finding that manufacturing companies have difficulty accessing credit could
possibly reflect the fact that manufacturers face challenges in competition, leading to high
default rates, while the banking sector is relatively efficient and competitive, directing the bulk

- 53 -
of new loans to consumer finance, addressing the needs of the burgeoning salaried workforce of
the service sector where risks are low.
Table 6.3: Analysis of Commercial Bank Lending to Enterprises (August 2008)
Sector GHC million Share of Lending
(June)
Percentage of Loans Non-
Performing Agriculture Forestry &
Fishing
195.1 4.1% 23.1%
Mining & Quarrying 156.5 3.3% 22.6%
Manufacturing 597.1 12.7% 12.8%
Construction 367.5 7.8% 13.5%
Electricity, Gas & Water 160.9 3.4% 2.3%
Commerce & Finance 1,506.2 32.0% 5.2%
Transport, Storage &
Communication
142.1 3.0% 8.7%
Services 1,177.0 25.0% 9.8%
Miscellaneous 406.2 8.6% 7.9%
4,708.6
Source: Bank of Ghana.
H. INCREASING THE DOMESTIC SUPPLY RESPONSE IN NON-TRADABLE SECTORS
6.20 The challenge for Ghana will be how to migrate from a position of low productivity,
basic technology and limited innovation in an environment in which a strong natural
resources sector and accompanying services establish a relative high real exchange rate and
an effective floor on wages. As low costs will not allow Ghana to compensate for low
productivity, an accommodating business regulatory environment and a free market in factors
(land, labor etc.) will not be sufficient to lift Ghana to the higher productivity platform necessary
to be competitive as a resource rich economy. Moreover, the wage floor established by the
service sector will continue to be centred on the urban areas, especially Accra, encouraging
migration. Ultimately, Ghana must migrate to a position of higher value added production (and
service delivery) through investment in education and technology. There is limited scope for
gradualism and support for agriculture and rural enterprises will be important to sustain
employment.
I. OVERCOMING THE INFRASTRUCTURE CONSTRAINT
6.21 Ghana‘s poor infrastructure emerged as by far the dominant perceived barrier to
development in the most recent Enterprise Survey with some 49 percent of companies
highlighting unreliable electricity supply as the biggest obstacle to growth. Access to water
is also frequently cited by companies as an important constraint. Investment in increased power
generation and distribution capacity as well as water availability have already been
acknowledged as a priority and this should be accompanied by a tariff and regulatory reform
which ensures availability of power and water on a sustainable basis, as discussed in Chapter 5.
J. IMPROVING FACTOR MARKETS
Land Tenure
6.22 Notwithstanding the reforms now under way with regards to land tenure, access to
land continues to be an important consideration for enterprises, particularly in the
metropolitan areas. Delays in land registration and titling create bottlenecks in access to land and

- 54 -
in site development. Although issues with land tenure are typically perceived to be greatest in the
rural areas and where traditional authorities have greater say, the recent Enterprise Survey
showed that for the manufacturing companies, Accra and Kumasi have the highest proportions of
firms indicating that access to land is a serious obstacle. Reforms to address this constraint could
include systematic land titling and customary boundary demarcation through implementation of
the Land Act and Land Use Planning Act. Implementation could be facilitated through the
development of one-stop-shop for land administration.
Figure 6.7: Access to Land is Difficult in Urban Areas
Source: World Bank (2009e).
Informality and Employment
6.23 The high prevalence of informality in Ghana remains an important obstacle to
improvements in productivity. Some 88 percent of the Ghanaian workforce is employed
informally as farmers or in self employment. The informal sector is less able to invest in
business, gain access to credit, establish standards or participate in industry bodies. This
challenge is particularly important outside of the metropolitan zones. In the Upper East region
there are at present only three privately-owned enterprises with more than 20 employees.
Increased access to credit is likely to be one of the major catalysts for enterprise formalization.
This process can also be encouraged through improvements in taxation, licensing and land
titling. Ghana still ranks 137th
in the Doing Business survey for ease of starting a business.
Ghana ranks particularly poorly in terms of labor market flexibility, ranking 145th
in Doing
Business. Rigidities in the labor market lead to a lack of training and this feeds into the weak
productivity, particularly for the informal sector which is reflected in relatively low private
sector wages, particularly for the informal sector.
6.24 In addition to the need for investment in education and skills development, the labor
markets can be supported through the implementation of a new Labor Act, amending and
consolidating existing legislation and establishing a National Labor Commission with a mandate
to address issues related to tripartite dialogue.
32.5% 32.0%
7.9%
3.6%
0%
5%
10%
15%
20%
25%
30%
35%
40%
Accra-Tema Kumasi Tamale Takoradi
Access to land
Pe
rce
nt
ind
icat
ing
seri
ou
s co
nst
rain
t

- 55 -
Table 6.4: Public Sector Wage Premiums Are High and Growing
K. 1991/92 1998/99 2005/06
Wage Public sector 1.15 1.12 1.47
Wage Private sector Formal 1.00 1.00 1.00
Wage Private sector Informal 0.65 0.49 0.63
All 0.22 0.16 0.27
Source: GLSS, various issues.

- 56 -
7. AGRICULTURAL COMPETITIVENESS
A. INTRODUCTION
7.1 Ghana is poised to enter a new period of macroeconomic management and growth,
driven by oil revenues that will begin to come on stream in 2011. Ghana‘s agricultural sector
– and the 70 percent of Ghana‘s poor who live in rural areas and whose livelihoods depend on
farming – stands to benefit from the surge in demand for agricultural commodities as well as the
increased public revenues available for agriculture-related investments. At the same time,
international experience shows that the competitiveness of the agricultural sector is often hurt
from a natural resource discovery.
7.2 There are three reasons why agriculture‘s performance will largely determine the
national benefit from the emerging oil sector. First, agriculture is often a relatively tradable
sector and therefore more at risk from ‗Dutch Disease,‘ resulting from the impacts of resource
booms on the exchange rate. Given that agriculture provides over one-third of GDP, agriculture‘s
performance remains critical to overall growth performance. Second, an estimated two-thirds of
Ghanaian manufacturing depends on agricultural inputs, so an uncompetitive and stagnating
agricultural sector would also undermine the competitiveness of manufacturing.74
Third, as the
recent World Development Report 2008 Agriculture for Development has emphasized, inclusive
agricultural growth is particularly effective in reducing poverty, especially when large numbers
of the poor depend on farming. Even with more rapid rural-urban migration, the majority of the
poor in Ghana will continue to be rural for decades to come.
7.3 This chapter outlines the risks of the rising oil economy to the agricultural sector,
and provides policy options for transforming oil resources into a positive opportunity to
spur pro-poor agricultural growth and competitiveness. It first outlines the pathways by
which oil revenues could impact the agricultural sector. Second, it reviews the current strengths
and weaknesses in Ghana‘s agricultural competitiveness. Finally, it suggests policies and priority
expenditures in the sector to maintain and improve competitiveness as well as instruments to
enhance the efficiency and effectiveness of increased public expenditures in the sector.
B. OIL AND A CHANGING MACRO-ECONOMIC ENVIRONMENT FOR AGRICULTURE
7.4 As discussed in the Overview, exploitation of newly-discovered natural resources
can provide substantial resources to Governments and to factors of production employed in
the ‗booming‘ sectors. However, how these ‗resource booms‘ are spent can create substantial
macroeconomic upheavals, including the so-called ‗Dutch Disease‘ whereby existing successful
sectors are harmed because of a loss of international competitiveness. These effects include
induced changes in the exchange rate, both the real exchange rate (the relative prices of non-
tradable and tradable goods) and the nominal exchange rate.
7.5 It is useful to distinguish three possible effects of an export-led natural resource boom:
74
Breisinger, 2008; Fiess and Verner, 2003.

- 57 -
An increase in the price of non-tradable goods and services due to a rapid expansion of
demand financed by oil revenues. This ‗spending effect‘ can be induced from demand
originating in the public or the private sectors;
Upward pressure on costs in both tradable and non-tradable sectors as production factors
such as labor are attracted into the booming sector in response to higher returns. This is
the ‗resource movement‘ effect;
An appreciation of the nominal exchange rate because of increased oil revenues leading
to a decline in the price that domestic producers of tradable products receive (as well as
reduced prices of their tradable inputs).
7.6 The ‗Dutch disease‘ would occur if any of these effects leads to a loss of
competitiveness among domestic producers. For instance, competing imports might become
cheaper, resulting in a loss of domestic market share. In the case of exports, a loss of
competitiveness vis-à-vis other exporters would see a decline in Ghana‘s exports.
7.7 A fourth consequence of the oil economy is also possible: the likelihood that urban
more politically powerful constituencies are better able to capture rents generated by oil
revenues leading to growing rural-urban and regional inequality.
7.8 Despite these potential risks, Ghana‘s oil economy presents an unparalleled
opportunity for the agricultural sector and for poverty reduction in particular.
Demand for food, especially higher valued products, such as horticulture and livestock
products, will increase as incomes rise. This is likely to be somewhat muted in the short
term, however, since the immediate employment potential in the oil sector will be low;
Urbanization and urban consumer preferences will lead to increasing demand for
processed and foods with greater domestic value-added. Provided Ghana‘s tradable
sectors can remain competitive, this provides an opportunity for both farming and the
food processing manufacturing sector;
Government revenues for public investment in agricultural sector will increase and help
alleviate chronic under-investment in public goods that has constrained agricultural
growth.
7.9 Yet, historical experience suggests that countries experiencing oil booms have often
ignored agriculture leading to decimation of vibrant agricultural export sectors, escalating
food imports, and growing inequality.75 Examples of the negative fallout to agriculture from
the oil booms of the 1970s and 1980s include Nigeria, Ecuador, Mexico, Algeria, Iran and Iraq.76
Even countries such as Chile, that have imposed safeguards to manage natural resource
windfalls, have experienced threats to their agricultural competitiveness (see Box 7.1). These
experiences underline the special challenge confronting Ghana in managing the emerging oil
economy.
75
It is also worth noting that in some instances, such as the commodity price spike in 2007—08, the agricultural
sector can actually be the cause of the boom and exchange rate appreciation. 76
On Ecuador, see Fiess and Verner (2003) and Byerlee (1989). On Mexico see Scherr (1985). See Pinto (1987) and
Watts (1987) for evidence on Nigeria.

- 58 -
Box 7.1: Nigeria and Chile in a Resource Boom
Nigeria experienced an oil boom in the 1970s that severely affected its agriculture. The real value of the Naira
more than doubled during the decade, leading to a sharp decline in the price of tradable agricultural
commodities. Per capita agricultural production fell by 40 percent from 1970 to 1982 and Nigeria rapidly
became a large food importer. Public investments financed by oil revenues and intended to boost productivity
were largely wasted in expensive and ultimately unproductive schemes, such as large scale irrigation.
More recently, Chile implemented a strong rule-based system to manage revenues from copper and other
minerals based on the ‗well-regarded Norway model‘ of maintaining revenues overseas during periods of high
prices. Nonetheless, during the last minerals‘ boom, the Chilean peso appreciated by about 50 percent relative to
the dollar over 2002–2008. This severely squeezed profits in a very dynamic agricultural export sector, based on
horticulture. Source: Pinto, 1987; Valdes, pers. comm.
7.10 Finally, Ghana's oil bonanza may well be temporary due to either limited oil
supplies or the volatility of oil prices, and future economic growth will again be dependent on
agriculture. Yet experience shows that once market share is lost it can be extremely hard to
regain due to the loss of commodity-specific capital—both physical (e.g., processing plants) and
human (scientific knowledge and technical skills). This is particularly the case in export markets,
when supply chains are often complex and difficult to establish. As an example, Ghana is still
trying to recover market share in the European pineapple market having lost ground with the
slow conversion to new varieties demanded by European supermarkets.
C. IMPACTS OF EXCHANGE RATE MOVEMENTS AND THE EXTENT OF THE
TRADABLE SECTOR
Differential impacts within agriculture
7.11 Exchange rate appreciation will have differential impacts across the agricultural
sector, depending on the extent of tradability. Knowing which agricultural commodities are
tradable and which are non-tradable is crucial for the appropriate policy response. Export
commodities such as cocoa and pineapples are unambiguously tradable and are adversely
affected in direct proportion to the exchange rate appreciation and the increase in the price of
production factors, land and labor. Staff analysis suggests that agricultural exports volumes could
be significantly affected by an oil boom-led real exchange rate appreciation. In 2015, agricultural
export volumes (mostly cocoa) could be 5-6 percent lower with oil than without oil. Import-
competing commodities such as rice, vegetable oils, sugar and poultry will experience similar
impacts.77
Some commodities appear to be non-tradable in that they are not physically traded
(e.g. cassava, yams, plantains, and millet). However, an exchange rate appreciation may have a
negative impact on the prices of non-tradables where there are tradables that are close substitutes
(e.g., rice for cassava). The available evidence from Ghana suggests that prices of imported rice
do pass through to prices of domestic staples, although the effect is not large, even for
domestically produced rice (see Box 7.2). Seemingly exchange rate appreciation would have
only modest impacts on the incomes of food crop farmers.
77
Ghana‘s imports as a share of total agricultural imports in 2003-05 were cereals (30 percent), sugar (13 percent),
diary and fruits and vegetables (9 percent each), and vegetable oils (8 percent). Wheat is a major cereal import but
Ghana does not produce wheat.

- 59 -
Box 7.2: Price Transmission and the Extent of Tradability
Examining the correlation between prices of imported and domestically produced commodities at different
locations can indicate the extent of tradability (see Table below) reports correlation coefficients between prices
of a sample of domestic food staples and the import price of rice – Ghana‘s main food import—for the period
2000-08. A high correlation indicates tradability and/or strong substitution effects (Cudjoe et al., 2008). This
reveals: (i) prices of domestically produced rice are only modestly related to the import price; (ii) price
transmission between imported rice and local maize, cassava and yam even though the last three are not traded
by Ghana in significant quantities (the bulk of imported maize is for the poultry industry); and (iii) that price
transmission varies by location, with prices in more remote locations being more affected by import prices,
counter to what would be predicted.
Correlation coefficients between real price of imported rice and real prices for local foods
Location Local
Rice
Maize Cassava Yam
Accra 0.119 0.409 -0.050 -0.085
Sunyani 0.246 0.185 -0.175 0.013
Tamale 0.208 0.193 0.235 -0.001
Kumasi 0.482 -0.129 -0.269 0.059
Mankesim 0.141 0.359 -0.128 -0.030
Wa 0.421 0.404 0.215 0.516 Source: Cudjoe et al. (2008); Italics denote statistical significance at the 5 percent level.
Exchange rate appreciation and the impact on intermediate inputs
7.12 The impact of exchange rate appreciation on competitiveness depends on the effects
on production costs as well. To the extent that inputs used in agriculture are tradable,
production costs will fall with exchange rate appreciation. In general, few inputs are applied in
agricultural production with fertilizer use particularly low compared to other countries in the
region. However, data for 2006 and 2007 indicates total fertilizer imports of 190,000mt –
equivalent to 26kg/ha. Other agro-chemical imports have also increased substantially to around
20,000mt from around one-tenth this amount in 2000.78
7.13 Although prices of fertilizer and the like comprise the bulk of purchased inputs and
may be reduced with an exchange rate appreciation, the low share in the aggregate cost
structure means that the impact on overall costs will be limited. Exceptions are rice and
maize where detailed farm budgets across a range of farms types and locations indicates that
tradable inputs account for between 22 – 46 percent of total costs for maize and 30 – 41 percent
for rice.79
This indicates that negative impacts of exchange rates for rice and maize would be
partly offset by lower input prices.
Will increasing world prices offset the ‗Dutch disease‘?
7.14 It might be tempting to believe that in the aftermath of the world food crisis, higher
prices for agricultural commodities in world markets will offset the negative effects of the
Dutch disease on agricultural competitiveness. However, agricultural commodity prices had
already sharply declined by the end of 2008. Available projections from the World Bank and
78
MoFA (2008). 79
Winters-Nelson and Aggrey-Fynn (2008).

- 60 -
FAO suggest that real prices of agricultural commodities over the next decade will be at
comparable levels to 2005, although somewhat higher than the period 1996 – 2000.80
Although
commodity prices may be more volatile, they are not likely to be the salvation for Ghana‘s
agriculture in an emerging oil economy.
D. MAINTAINING THE COMPETITIVENESS OF AGRICULTURAL VALUE CHAINS
7.15 The extent to which oil will be inimical to agricultural growth will depend on the
scope to improve competitiveness of agricultural value chains. Some interventions such as in
rural infrastructure are likely to be critical to competitiveness of most value chains. Other
priority interventions will be conditional on factors specific to each cost structure – many will be
firm-specific – but available qualitative and quantitative assessments of agricultural value chains
suggests a number of sources of inefficiencies that warrant urgent attention.
Threats to cocoa exports
7.16 Cocoa is clearly a special case in which Ghana is globally competitive – indeed,
cocoa beans command a quality premium against international competitors. But it is also
worth remembering that Nigeria‘s once vibrant cocoa sector never recovered from the effects of
the oil booms of the 1970s and 1980s. Nonetheless, recent achievements in Ghana are impressive
– an increase in production from 400,000mt annually in the late 1990s to over 650,000mt in
recent years – despite the negative nominal rate of assistance afforded the sector and a modest
appreciation of the exchange rate.81
Recent reforms by COCOBOD and CMC82
have increased
the share of the producer price to 70 percent of the net FOB price83
(from around 40 percent at
the start of the decade) which, combined with recent high cocoa prices, has been a boon to
producers. The 30 percent margin between export and farm prices is comprised of two elements:
(i) the costs associated with the operations of COCOBOD and CMC; and (ii) an official export
tax which is revised annually.84 For the 2007/08 crop year the official export tax was
11.1 percent.85
7.17 The exchange rate appreciation will reduce the Cedi price of cocoa (and poses a
threat to the finance operations – see Box 7.3). To sustain producer prices in absolute terms
producers‘ share of FOB prices needs to increase. This could be achieved by reducing the formal
export tax rate and/or by further increasing the efficiency of COCOBOD and CMC. As
illustrated in Figure 7.1, the composition of these costs has changed markedly in recent years,
with freight and administration costs having increased substantially both in absolute and
80
World Bank, 2008c; FAO/OECD, 2008. 81
Brooks et al. (2007) report nominal rates of assistance for the cocoa sector of -21.7 percent for the period 2000 –
2004; this is markedly lower than previous levels of 30.9 percent for the preceding five years and -36.2 percent for
1990 – 1994. 82
These are the Cocoa Board (COCOBOD) which is responsible for supporting cocoa production through targeted
programs and for domestic delivery of cocoa beans to the export warehouses. The Cocoa Marketing Company
(CMC) is the monopoly body responsible for selling Ghana‘s beans on the world market. 83
The use of net fob as the benchmark price allows for certain expenditures to be deducted from the fob price while
maintaining the 70 percent commitment. These include costs of activities such as mass spraying that purportedly
directly benefit farmers. In aggregate, payments to farmers account for about 60 – 65 percent of revenues from
exports and domestic sales. 84
IMF (2008). 85
WTO (2008).

- 61 -
proportionate terms. A closer scrutiny of these expenditures may identify efficiencies that can be
achieved without undermining the important role that COCOBOD plays in the marketing system.
Another option would be to increase value adding in line with Government‘s strategy, but this
may be even more challenging.
Box 7.3: Exchange Rate Appreciation and Forward Cocoa Sales
Under existing arrangements in the cocoa market, the CMC has access to Ghana‘s cocoa exports at a
predetermined price (denominated in Cedis). Forward sales typically occur 6 – 8 months prior to the start of the
main crop season, and are typically denominated in sterling. As well as allowing Bank of Ghana to anticipate
balance of payments developments, revenues from forward sale provide working capital for payments to cocoa
farmers at time of delivery.
Since producer prices are fixed, CMC avoids facing a price risk. It does, however, face a currency risk and could
lose substantially if the Cedi appreciates against the currency in which the forward sale is denominated. Source: LMC (1996)
Box 7.4: Can Ghana Increase Value Addition In Cocoa?
Increasing value addition in the cocoa sector is an important policy objective of Government. Recent investment
in new facilities means Ghana has the potential to process a substantial share of its production.86
Realizing this
potential faces a number of obstacles. First, beans are only a small fraction of input costs.87
Second, given the
high costs of shipping other ingredients combined with the high costs of shipping processed cocoa compared to
beans, efficient production typically requires processing in close proximity to (European) final consumers.
Third, tariff escalation in importing countries compounds this disadvantage. Fourth, efficient production
requires regular and predictable access to local supplies which is not the case in Ghana.
Figure 7.1: The Composition of Cocoa Marketing Costs in 1995–98 and 2006–08
Source: COCOBOD.
Competiveness of other value chains—room for improvement
7.18 Many value chains appear to have considerable ‗competitive space‘ and could
weather a modest exchange rate appreciation or increase in factor costs. Estimated rates of
return for plantation crops (oil palm and rubber), fruits (mangos, pineapples and citrus), soybean,
86
The manifesto of the new administration sets a target of 60 percent. 87
For the average chocolate bar, producer proceeds account for about 4 percent.
-
2
4
6
8
10
12
14
16
18
1995/96 - 1997/98 2005/06 - 2007/08
Co
sts
pe
r m
t (r
ea
l 1
99
0 n
ew
Gh
an
a c
ed
is)
Export handlingOtherAdministrationFinance costsFreightLBAs (margin)
0%
10%
20%
30%
40%
50%
60%
70%
80%
90%
100%
1995/96 - 1997/98 2005/06 - 2007/08

- 62 -
chilies, tomatoes, and guinea fowl are high in all cases, although the complexity of organizing
individual chains varies widely among them.88 Yet, even in these cases, the analysis has
identified considerable scope for improving efficiency, such as through reducing high post-
harvest losses for citrus and other horticulture crops where timely evacuation and marketing is
essential.
7.19 In other cases, efficiency improvements are critical for competitiveness; these
improvements should be achievable. For example, rice consistently shows high losses in
processing. The milling ratio for rice in major rice producing countries averages around 0.65kg
of milled rice per 1kg of paddy but this ratio is only 0.50 to 0.55 in Ghana. The combined effect
of raising the conversion rate to 0.65 and increasing yields to 3.2 tons per hectare by applying a
modest dose of nitrogen fertilizer would make all rice production systems privately profitable
even if world prices return to their low levels observed in 2002.89
Other countries in West Africa,
such as Sierra Leone, have achieved international levels for milling ratios, and there is no reason
why better coordination along the rice value chain and targeted technical assistance in processing
and milling could not succeed.
7.20 Finally, some value chains such as poultry and vegetable oils are especially
vulnerable since they appear to be barely competitive under a range of scenarios. There are
undoubtedly opportunities to increase the efficiency of such chains, but Ghana should also be
prepared to accept declining competitiveness and rising imports for some commodities where it
has little comparative advantage.
E. POLICY OPTIONS FOR IMPROVING COMPETITIVENESS
7.21 Robust agricultural growth is a precondition for achieving middle income status by
2015 – a stated policy objective.90
Investing in agriculture is an existing development objective
which demands renewed vigor (and resources) in light of oil revenues. Well-coordinated
interventions will be needed to maintain competitiveness and achieve rapid and sustainable
growth in agriculture. To a large extent, these recommendations reiterate existing approaches
espoused in the proposed national long-term development plan and the existing sector strategy
(FASDEP II). The threat and opportunity posed by the oil economy adds greater urgency to these
ongoing efforts.
7.22 Previous analysis has highlighted the growth impacts of applying existing
technology better – an additional two percentage points to agricultural GDP by some
estimates.91
In that sense, the policy response is one of intensification and scaling up of
numerous, relatively small-scale efforts in the sector that show initial success.
7.23 Interventions can be broadly grouped into the following:
revising trade and tax policies to reduce the impact of Dutch disease effects;
88
Owusuansah and Amoaku (2008). 89
Winters-Nelson and Aggrey-Fynn (2008). 90
Breisinger et al. (2007); Breisinger et al. (2008). 91
See Jackson and Acharya (2007).

- 63 -
public investments in core public goods, such as infrastructure, irrigation, and
research; and
providing matching grants to productivity-enhancing investments by private farmers
and agribusinesses.
Trade and tax policies
7.24 One option would be to implement a compensating tariff ‗surcharge‘ on import
substitutes tied to exchange rate movements. There are at least three reasons why this might
not be a good strategy for Ghana. First, cereal imports are already protected by a tariff of
20 percent and any higher tariff would impose tradeoffs of efficiency and further erosion of
economy-wide competitiveness through higher food prices. Second, poor consumers spend a
relatively higher share of their budgets on food so a tariff is anti-poor.92
Finally, it is difficult in
practice to establish rule-based tariff compensation, so that this approach runs a real risk of
political capture of tariff decisions that would impose even higher costs in terms of efficiency
and equity.
7.25 On the export side there is clearly the potential to reduce or remove export taxes to
compensate for any loss of competitiveness within the domestic cost structure – this should
be a priority consideration for the cocoa sector. Similarly, continued liberalization in key export
markets – especially to reduce tariff escalation on processed products – will improve Ghana‘s
competitive position although if pursued through multilateral approaches this poses a
simultaneous risk of preference erosion.
Investments in core public goods
7.26 Current spending on agriculture is below the 10 percent target committed to under
NEPAD. Total spending by MoFA amounts to about 1.8 percent of the budget, with additional
spending in the sector by other ministries raising the total to 6-8 percent.93
Carefully designed
public investment programs have considerable potential to use oil revenues to enhance
competitiveness and reduce poverty. Based on extensive research, the highest payoffs are likely
to be for investments in core public goods, especially agricultural R&D, infrastructure (rural
roads) and education and skills (see Table 7.1: ) all of which can improve productivity and
competitiveness. Recent evidence also points to good returns from investing in irrigation in Sub-
Saharan Africa.94
Indonesia during the 1970s, successfully transformed rural areas by tapping oil
revenues for these types of investments and increased its competiveness as measured by its share
of global agricultural markets. Some investments, especially rural infrastructure and education,
also helped develop the rural nonfarm sectors.
7.27 Evidence from Ghana is consistent with these findings: a 1 percent increase in
agricultural spending is estimated to increase per capita agricultural value added of
0.15 percent; this impact is higher than that observed from other sectors.
92
The proportion of expenditure spent on food is 65 percent for the poorest decile of rural households but only 36
percent for the richest decile of urban households (Cudjoe et al., 2008). 93
Ghana Strategy Support Program, 2008. 94
World Bank (2008a).

- 64 -
7.28 More specifically, the key investments for competitiveness of Ghanaian agriculture are:
Agricultural technology, including improved varieties, land and water management, and
post harvest issues, for both traditional commodities and emerging higher value
commodities. This is not business as usual: investments must be driven more by market
forces, be accountable to users, and involve partnership with the private sector, including
farmer organizations;
Roads, especially rural roads, and communications more generally. As in most Sub-
Saharan Africa, the high cost of transportation revealed in value chain analysis indicates
the high returns from improving market access. These returns are likely highest in the
North where infrastructure is especially poor;
Regular water and power supplies given the hygiene requirements of food processing,
especially refrigeration and the vulnerability of food stuffs to spoilage;95
Irrigation, but small scale rather than large scale (see below); and
Clear and credible quality and safety standards with efficient testing and enforcement,
including certification, to ensure access to sophisticated markets, especially overseas.
Table 7.1: Returns to Public Investment in Agriculture and Impacts on Poverty Reduction Rankings, from 1-best to 7-worst
China (2000) India (1993) Thailand (1999) Uganda (1999)
Expenditure Program return poverty return poverty return poverty return poverty
Agricultural R&D 2 2 1 2 1 2 1 1
Irrigation 5 6 4 7 5 5
Education 2 1 3 3 3 4 3 3
Roads 3 3 2 1 4 3 2 2
Telecommunication 4 5
Electricity 6 4 8 8 2 1
Health 7 6 4
Soil and water conservation 6 5 4
Anti-poverty programs 7 5 4
Source: Fan and Rao (2008).
Making better investments
7.29 Effective utilization of the greater fiscal space created by oil revenues assumes
domestic absorptive capacity to manage larger public expenditures - in this case both
investments and the provision of services such as extension advice. Notwithstanding a number of
systemic problems with public financial management exist (World Bank, 2009c) and institutional
constraints within MoFA (IFPRI, 2009) the fact that current spending is so low suggests
absorptive capacity does indeed exist. Overall procurement systems are judged to be sound
(Public Procurement Board, 2007,) and measures being adopted to streamline expenditure
management systems. These measures, combined with the fact that current expenditures so low,
provides prima facie evidence that bottlenecks are unlikely to be encountered should agriculture-
95
Loch and Boakye (2006).

- 65 -
related investments be increased significantly. It is less obvious that the current agricultural
extension system could rapidly scale-up additional funding. On the one hand, diagnostic
assessments report the absence of operational funds mean extension staff is often under-
employed, suggesting that the impact of existing staff could be enhanced relatively easily. On the
other hand, current activities focus on technology adoption and other farming practices with little
extension in broader competitiveness or value chain skills. To be sure, improved technology
adoption will certainly raise yields but a more substantive effort to improve competitiveness will
require greater access by farmers to a broader range of knowledge which current public system is
ill-suited to provide (IFPRI, 2009). Private provision - even with public funding - of such
services is one option, although the market for privately provided extension services remains
under-developed (on both the demand and supply side).
7.30 It may be tempting to use the increased flexibility in oil-financed public expenditures to
provide transfers and subsidies to reduce production costs. These may be justified in very select
cases, but in general competitiveness is best served by investments that spur long-run
productivity growth.
Box 7.5: Subsidies versus Investments
Given greater budget flexibility, there will be increased political pressure for subsidies and other transfers to
reduce production costs. Some subsidies may be seen as an investment—for example, carefully targeted
fertilizer subsidies to help develop a dynamic private fertilizer market and grants to help farmers buy small
irrigation pumps. Over time, these subsidies can be phased out, as the market develops. Other subsidies such as
tractor subsidies are much more difficult to justify since the private sector can usually develop tractor markets
when it is profitable to do so, and these subsidies are not sustainable in the long term. Some other transfers may
also be a good use of oil revenues to reduce rural poverty and inequality, especially safety nets and employment
schemes for those left behind due to lack of skills or old age.
Matching grants to farmers and the private sector
7.31 Additional public investments need to be complemented by innovative approaches
to ensure that increased spending is efficiently utilized and reaches its targets. These
approaches generally require working directly with the private sector and communities.
Community driven development grants focused on income generation. Matching
grants can be provided directly to community-based or farmer-based organizations for
small scale irrigation, market infrastructure, processing equipment, and capacity
building. The Fadama program in Nigeria now has more than a decade of experience in
channeling these grants to rural communities. The most recent evaluation estimates that
2.3 million people have benefited, with an average income gain of 60 percent in the
second phase of the program in 12 states.96
There is also experience in Ghana with these
approaches that could be scaled up using farmer-based organizations.
Innovation and technical assistance grants. These grants typically provide funds on a
matching basis to private industry and strong farmer organizations to test innovative
approaches, invest in collective goods such as cold chains, provide business services and
market analysis, and contract technical assistance to help coordinate and improve
96
Nkonya et al. (2008).

- 66 -
efficiency along the value chain. The Grains Development Partnership in Ghana is using
this approach. Other countries are using autonomous public-private agencies to manage
such services and grants, especially for horticulture value chains.
F. IMPROVING THE INVESTMENT CLIMATE FOR COMMERCIAL AGRICULTURE
7.32 Both the community driven funds and innovation funds require strong private
sector participation, which in turn requires an improved investment climate. This could provide
high payoffs to agriculture. According to a survey of 54 large companies in Ghana, agriculture
and the food and beverage sector is the most attractive industrial sector to invest in; from 1994 –
2002 over $204 m of FDI (11.5 percent of total FDI) was invested in agriculture and a large
share of the further $346 m invested in manufacturing occurred in food-related business.97
7.33 A supportive business climate is critical for improved competitiveness. Two issues
are of particular interest to agriculture:
Land availability, especially for commercial farming which requires substantial
contiguous plots for efficient production. The challenge is to reduce the currently
high transactions costs and time to assess land and provide tenure security for
medium term investments, while protecting the rights of current users;
Access to rural finance. While the rural finance network has expanded substantially in
recent years resulting in increased rural deposit mobilization, little is being recycled
into agricultural credit, especially for small-holders. Commercial bank lending to
agriculture remains extremely low at 4.1 percent.98
Making investments pro-poor
7.34 Careful targeting of expenditures by region and type of farmer will be needed to ensure
that investments are pro-poor and reduce the risk of rising inequality.
Box 7.6: Exploiting the Agricultural Potential of Northern Ghana
Northern Ghana, including much of Brong-Ahafo Region, is part of a broad agro-ecological zone, known as the
Guinea Savannah that occupies an estimated 7 million square km in sub-Saharan Africa. The agriculture of this
region is vastly unexploited for a number of reasons—historical (animal and human diseases), poor soils, climatic
risk, and very low population and road density. However, the potential of this region is huge, as demonstrated by
the experience of the Cerrado in Brazil and Northeast Thailand. In both cases, regions with very similar ecologies
and problems to the Guinea Savannah have been turned into major poles of commercial agriculture that are highly
competitive in global markets in commodities such as cassava, soybeans, sugar, rice, maize, cotton and beef.
Factors that contributed to this success included: (i) improved agricultural technology, both varieties and soil
management; (ii) publicly financed infrastructure, rural credit, and business development services; (iii) a dynamic
private sector and a conducive investment climate; and (iv) a policy environment that set prices in line with world
prices. Overall, however, Thailand which favored a smallholder led model has been more successful in combining
growth with poverty reduction.
Source: World Bank (2009g).
97
Aryeetey et al. (2008). 98
Data for the share of lending as at June 2008, while that for non-performing loans is at August 2008.

- 67 -
7.35 Regional priorities. The major potential area for expansion of competitive small and
medium-scale farming is in the guinea savannah zone where most commodities with strong
demand are produced – rice, maize, cassava, soya and beef (especially Brong Ahafo and
Northern Regions). These together with the Upper (East and West) Regions are also areas of
high poverty rates which merit special attention in any investment program. Given evidence from
other countries, investment in these less developed regions may be win-win – they would
provide higher payoffs since they are starting from a very low level, and they would directly
address the poor (see Box 7.6).99
7.36 Small versus large-scale farming. Larger-scale commercial farming has a role in
improving agricultural growth and competitiveness, but to be inclusive and achieve poverty
reduction targets, small and medium farmers must be at the core of a strategy to use oil revenues
to revamp the agricultural sector. Especially in the North of Ghana, there is considerable land
and water that could be brought into production through investment in large-scale commercial
farming. But even in this case, poverty reduction impacts can be enhanced through involvement
of smallholder farmers through contract and out-grower schemes which usually require some
donor or public sector support (see Box 7.7).
Box 7.7: Extending the Benefits of Private Investments through Outgrower Schemes
The Integrated Tamale Fruit Company (IFTC) involves 2,000 small-holder farmers each responsible for one
acre of organic mangos, alongside their own plantation of around 300 ha. Participants negotiate their own land
arrangements with customary authorities. ITFC provides an interest free loan for start-up inputs (quality planting
material, extension advice, etc.) equivalent to $2,400. Initiated only in 2000, some outgrowers are now
harvesting fruit for export.
Most rubber and oil palm plantations in Ghana include out-grower schemes of some form. UNILEVER is
supporting two oil palm plantations to strengthen out-grower arrangements. TOPP was established in 1983 and
now covers 255 farmers on 1,018 ha. The second, BOPP, began in 1995 on 1,650 ha involving 438 farmers.
Small-holder yields within the program are reportedly two-thirds above those outside the scheme. Contrary to
the mango example, both schemes acquired land from the Government and attracted beneficiaries into the area.
Note that, in all these cases, concessional finance from donors has been essential to fund the start-up costs and
provide working capital even though the operations are ostensibly private sector driven. Public budgets
augmented by oil revenues could be similarly utilized.
G. CONCLUSION
7.37 The lessons from many countries experiencing a sharp inflow of oil or other mineral
revenues suggest that Ghana‘s policy makers will have to pay particular attention to the
agricultural sector to ensure that its competitiveness is not undermined nor inequality
increased. However, the potential for increased public expenditure from oil revenues is also a
unique opportunity to enhance competitiveness, foster agricultural growth, and reduce poverty.
Doing this will require a carefully designed program of public expenditures focusing on core
public goods as well as community development funds and well targeted interventions in value
chains. Increased capacity at all levels of government will be needed to ensure better use of
public funds, complemented by autonomous public-private agencies. Increasing the voice of
99
Fan and Rao (2008).

- 68 -
famers and other agricultural interests will also be important in ensuring a just allocation of
public expenditures to the sector.

- 69 -
Annex 1: The Computable General Equilibrium (CGE) Model
1. The CGE model developed for this study is a typical neoclassical model with
endogenous prices, market clearing, and imperfect substitution between domestic and foreign
goods, allowing for endogenous factor accumulation (capital, land) and labor force participation.
As in any CGE prices are endogenous on each market (goods and factors) and equalize supplies
(imports; Ghanaian production for the domestic market; factors supply) and demands (final
demand from households, the Government, investors and the rest of the world; intermediate
demand from producers; factors demand), so as to obtain the equilibrium. The equilibrium is
general in the sense that it concerns all the markets simultaneously. This type of modeling allows
combining detailed databases with a sound micro-based theoretical framework capturing the
interdependence and inter-linkages of markets. With such characteristics, CGE models are useful
tools to assess the long term impact of shocks and structural reforms. The underlying assumption
of market clearance and monetary neutrality renders, on the contrary, CGE models improper to
address short-term impacts of macroeconomic policies.
2. The model is calibrated for the year 2008, updating with national accounts Ghana‘s
Social Accounting Matrix (SAM) for the year 2004 (Ghana Statistical Services, 2006). The SAM
and the model comprise 26 sectors of activity, one representative Ghanaian household and one
trading partner, the World. Production factors comprise two labor types, formal and informal,
physical capital, two land types, urban and rural, and one specific factor to generate electricity
(hydro-electric capacities).
3. Supply is modeled using nested constant elasticity of substitution (CES) functions,
which describe the substitution and complement relations among the various inputs.
Producers are cost-minimizers and constant returns to scale are assumed. Output results from two
composite goods: intermediate consumption and value added, combined in fixed proportions.
The intermediate aggregate is obtained by combining all products in fixed proportions (Leontieff
structure). The value-added is then decomposed in two substitutable parts: labor and a capital-
natural resource bundle. In formal sectors (administration, financial services), nominal wages are
indexed to urban land prices (with an elasticity of ¾). As such, the formal labor market clears
through reversing excess supply to the informal labor market where wages equalize supply and
demand. Capital, land (urban and rural), and hydro-electric capacities are fully employed and
imperfectly substitutable. Demand for capital makes a distinction between ―old capital‖ and
―new‖ capital. The model thus integrates the notion of vintage capital, to distinguish the process
of allocating capital already installed, from that resulting from contemporary investment
(putty/semi-putty production function). ―New‖ capital can be allocated more flexibly than ―old‖
capital. It substitutes for other types of capital more easily (land, hydro-electric capacities).
Accelerating investment therefore strengthens the capacity for adjustment of the productive
sector to changes in relative prices.
4. Income from labor and capital accrue to the representative household. This income
is allocated to consumption and savings using the Extended Linear Expenditure System (ELES)
specification. Household demand is derived from maximizing the utility function, subject to the
constraints of available income and consumer price vector. Household utility is a positive
function of consumption of the various products and savings. Income elasticities are

- 70 -
differentiated by product. The calibration of the model determines a per capita subsistence
minimum for each product, which will be consumed whatever the price and the income of the
households, while the remaining demand is derived through an optimization process. The
subsistence share in the consumption of basic goods is higher than in the consumption of luxury
goods. With lower disposable income, the households‘ savings rate declines to protect
subsistence consumption. Government and investment demands are disaggregated in sectoral
demands once their total value is determined according to fixed coefficient functions.
5. The model assumes imperfect substitution among goods originating from different
geographical areas. Import demand results from a CES aggregation function of domestic and
imported goods. Export supply is symmetrically modeled as a constant elasticity of
transformation (CET) function. Producers decide to allocate their output to domestic or foreign
markets responding to relative prices.
6. Several macro-economic constraints are introduced in this model. First, the small
country assumption holds, the Ghanaian economy being unable to change world prices; thus, its
imports and exports prices on world markets are exogenous. Capital transfers are exogenous as
well, and therefore the trade balance is fixed, so as to achieve the balance of payments
equilibrium. Second, the model imposes fixed real public expenditures, to reflect the
Government‘s choice of delivering a given amount and quality of public services and ability to
borrow. Tariff rates for electricity are exogenously set, and thus consumer subsidies
endogenously cover the difference between prices and costs. Tax rates and ODA are
exogenously determined and thus government savings are residually determined. Third,
investment is set by the availability of savings, the latter originating from households,
Government and abroad.
7. The dynamic path of the model strongly results from this savings-investment rule: a
change in investment influences physical capital accumulation in the following period. Land and
informal labor supplies also respond favorably (but moderately, with elasticity of 0.1 and 0.2
respectively) to their remunerations. Total factor productivity responds positively (with an
elasticity of 0.1) to the ratio of exports over GDP. Population and total labor force growth are set
exogenously, as well as hydro-electric capacities.

- 71 -
References
African Peer Review Mechanism (2005), Country Review Report and Programme of Action of the
Republic of Ghana, APRM Secretariat, Midrand, South Africa.
Afrobarometer (2005) ―Sustained Support for Democracy in Ghana‖ Afrobarometer Briefing Paper No.
18.
Aryeetey E., The Politics of Managing Oil wealth for Different Interest Groups, The New Legon
Observer Volume 2, No. 6, pp. 5-8.
Aryeetey, C., F. Barthel, M. Busse, C. Loehr and R. Ossei (2008), Empirical Study on the Determinants
and Pro-Development Impacts of Foreign Direct Investment in Ghana, Legon, Ghana: Institute of
Statistical, Social and Economic Research.
Baldi A.-L. and N. Mulder (2004), The Impact of Exchange rate regimes on real exchange rates in South
America, 1990-2002, OECD Economics Department Working Papers No. 396, Paris.
Benin, S., T. Mogues, G. Cudjoe and J. Randriamamonjy (2008), Reaching Middle Income Status in
Ghana by 2015: Public Expenditures and Agricultural Growth, Discussion Paper No 811,
Washington DC: International Food Policy Research Institute.
Booth D., R. Crook, E. Gyimah-Boadi, T. Killick and R. Luckham, with N. Boateng (2005), ―What are
the Drivers of Change in Ghana?‖. CDD/ODI (Centre for Democratic Development/Overseas
Development Institute) Policy Brief No. 1, November, London.
Bourguignon, F. (2006), ―Revisiting the Specific Role of Agriculture in Poverty Reduction,‖ Keynote
address, World Development 2008 Conference, September 4, Berlin.
Bourguignon, F. and S. Dessus (2009), Equity and Development: Political Economy Considerations,‖
with in Levy, S. and M. Walton (eds.), No Growth without Equity? Inequality, Interests and
Competition in Mexico, Palgrave-Macmillan.
Bourguignon, F., C. Diaz-Bonilla and H. Lofgren (2006), Aid, service delivery and the MDGs in an
economy-wide framework, World Bank, Washington D.C.
Breisinger, C., J. Thurlow, and M. Duncan (2007), A 2005 Social Accounting Matrix (SAM) for Ghana.
Ghana; Washington, D.C.: Ghana Statistical Services (GSS); International Food Policy Research
Institute (IFPRI)(datasets). http://www.ifpri.org/data/Ghana03.asp.
Breisinger, C., X. Diao, J. Thurlow, and R. M. Al-Hassan (2008), Agriculture for Development in Ghana:
New Opportunities and Challenges, Discussion Paper No 784, Washington DC: International
Food Policy Research Institute.
Brooks, J., A. Croppenstedt and E. Aggrey-Fynn (2007), Distortions to Agricultural Incentives in Ghana,
Agricultural Distortions Research Project Working Paper 47, Washington DC: World Bank.
Byerlee D. (1989), ―Bread and Butter Issues in Ecuadorian Food Policy: A Comparative Advantage
Approach,‖ World Development, 17(10):1585-1596.
Celasun, O. and J. Walliser (2008), ―Predictability of Aid,‖ Economic Policy, 545-94.
Collier P. (2006), ―International Political Economy: Some African Applications,‖ Centre for the Study of
African Economies, Department of Economics, Oxford University – A paper prepared for the
AERC.
- 72 -
Cudjoe, G., C. Breisinger, and X. Diao (2008), Local Impacts of a Global Crisis: Food Price Transmission
and Poverty Impacts in Ghana, Ghana Strategy Support Program, Accra, Ghana: International
Food Policy Research Institute.
De Gregorio, J., Giovannini, A. and Wolf, H. (1994), International evidence on tradables and non-
tradables inflation, European Economic Review 38: 1225–44.
Egert, B, Drine, I, Lommatzsch, K and Rault, C. (2003), The Balassa–Samuelson effect in central and
Eastern Europe: myth or reality, William Davidson Institute working paper 483.
Eifert B., A. Gelb, and N. Tallroth (October 2002). ―The Political Economy of Fiscal Policy and
Economic Management in Oil-Exporting Countries,‖ World Bank Policy Research Working
Paper 2899, Washington D.C.
Fan, S. and N. Rao (2008), Public Investment, Growth and Rural Poverty, in Public Expenditures, Growth
and Poverty, S. Fan (ed), Baltimore and Washington DC: The Johns Hopkins University Press
and International Food Policy Research Institute.
Fiess, N. M. and D. Verner (2003), Oil, Agriculture, and the Public Sector: Linking Intersector Dynamics
in Ecuador, World Bank Policy Working Paper 3094, Washington DC: World Bank.
Gelb A., and G. Turner (2007), Confronting the Resource Curse: Lessons of Experience for African Oil
Producers, World Bank, Washington D.C.
Ghana Statistical Services (2006), A 2004 Social Accounting Matrix (SAM) for Ghana, October, Accra.
Ghana Strategy Support Program (2008), Public Expenditure and Institutional Review, Accra, Ghana:
International Food Policy Research Institute.
Government of Ghana (2009), Abridged Version of the Budget Statement and Economic Policy, March 5,
Accra.
International Food Policy Research Institute (2009), Public Expenditure and Institutional Review, IFPRI:
Accra.
International Monetary Fund (2008), Ghana: Staff Report for the 2008 Article IV Consultation, IMF,
Washington DC.
International Monetary Fund (2009), Ghana: Staff Report for the 2009 Article IV Consultation and
Request for a Three-Year Arrangement Under the Poverty Reduction and Growth Facility, IMF,
Washington DC.
International Monetary Fund and World Bank (2009), Ghana: Joint IMF and World Bank Debt
Sustainability Analysis, June, Washington DC.
Ito, T., P. Isard and S. Symansky (1997), Economic Growth and Real Exchange Rate: An Overview of the
Balassa-Samuelson Hypothesis in Asia, NBER Working Papers 5979.
Jackson, C. and G. Acharya (2007), Ghana‘s Agricultural Potential: How to Raise Agricultural Output?
World Bank (2007), Washington DC.
Levy, S., (2006), Public Investment to Reverse Dutch Disease: The Case of Chad, Development Strategy
and Governance Division Discussion Paper 35, Washington DC: International Food Policy
Research Institute.
LMC (1996) The External Marketing of Ghana‘s Cocoa, mimeo, Oxford, UK: LMC International.
Loch, M and E. Boakye (2006), Survey on Fruit Juice Processing Companies in the Greater Accra
Region, Accra, Ghana: Association of Ghana Industries.

- 73 -
Medvedev, D. (2009), ―Income Distribution Dimensions of Ghana‘s Oil Discovery‖, background paper,
AFTP4, the World Bank, Washington D.C.
Mehlum H., K. Moene, and R. Torvik (2006), ―Institutions and the Resource Curse,‖ The Economic
Journal, Vol. 116, No. 508, pp. 1-20.
MoFA (2008), Agriculture in Ghana: Facts and Figures, mimeo, Accra, Ghana: Ministry of Food and
Agriculture
Morris, M. V. A. Kelly, R. J. Kopicki and D. Byerlee (2007), Fertilizer Use in African Agriculture:
Lessons Learned and Good Practice Guidelines, The World Bank, Washington DC.
Moss, T. and L. Young (2009), ―Saving Ghana from Its Oil: The Case for Direct Cash Distribution‖,
Working Paper 186, October, Center for Global Development, Washington DC.
Nkonya, E. D. Phillip, T. Mogues, J. Pender, M. K. Yahaya, G. Adebowale, T. Arokoyo, and E. Kato
(2008), From the Ground Up: Impacts of a Pro-Poor Community-Driven Development Project in
Nigeria, Discussion Paper No. 756, Washington DC: International Food Policy Research
Institute.
Nugent P. (1999), ―Living in the Past, Urban, Rural and Ethnic Themes in the 1992 and 1996 elections in
Ghana,‖ The Journal of Modern African Studies, Vol. 37, pp. 287-319.
OECD and FAO (2008), Agricultural Outlook 2008-2017, Paris and Rome: OECD and FAO.
Opoku-Afari, M., O. Morrissey and T. Lloyd (2004), Real Exchange Rate Response to Capital Inflows:
Dynamic Analysis for Ghana, CREDIT Research Paper, School of Economics, University of
Nottingham.
Owusuansah and Amoaku (2008), Study on Quantitative Assessment of Small and Medium Scale Value
Chains, mimeo, Accra, Ghana: Owusuansah, Amoaku and Associates.
Pinto, B. (1987), Nigeria During and After the Oil Boom: A Policy Comparison with Indonesia, The
World Bank Economic Review 1(1): 419-445.
Public Procurement Board (2007), Public Procurement Performance Assessment Report of MoFA, Accra.
Ross, M. (1999), ―The Political Economy of the Resource Curse‖ World Politics Vol. 51, pp. 297-322.
Scherr, S. J. (1985), The Oil Syndrome and Agricultural Development: Lessons from Tabasco, Mexico,
New York: Praeger.
United Nations Conference on Trade and Development (2008), World Investment Report 2008, Geneva.
van Winjbergen, S. (2008), The Permanent Income Approach in Practice, mimeo, The World Bank,
Washington D.C.
Watts, M. (eds) (1987), State, Oil and Agriculture in Nigeria, Berkeley: Institute of International
Agriculture, University of California.
Winters-Nelson, A. and E. Aggrey-Fynn (2008), Identifying Opportunities in Ghana‘s Agriculture:
Results from a Policy Analysis Matrix, Accra, Ghana: International Food Policy Research
Institute.
World Bank (2006) ―External Review of Public Financial Management‖ Vol. II. Public Finance
Management Performance Report and Performance Indicators, pages 7-37.
World Bank (2007a), Ghana Country Economic Memorandum: Meeting the Challenge of Accelerated
and Shared Growth, Report No. 40934-GH, Washington DC.

- 74 -
World Bank (2007b), ―Building the Demand Side of Good Governance: Enhancing Conditions for Social
Accountability in Ghana,‖ Washington DC.
World Bank (2008a), World Development Report: Agriculture for Development, Washington D.C.
World Bank (2008b), External Review of Public Financial Management, Washington DC: World Bank.
World Bank (2008c), Global Economic Prospects: Commodities at the Crossroads. World Bank,
Washington.
World Bank (2009a), Global Economic Prospects 2009, Washington D.C.
World Bank (2009b), Worldwide Governance Indicators 1996-2007, Washington D.C.
World Bank (2009c), Ghana: 2009 External Review of Public Financial Management, Report No. 47639-
GH, Washington D.C.
World Bank (2009d), The Political Economy of Mining in Ghana (forthcoming), Washington D.C.
World Bank (2009e), Ghana. Investment Climate Assessment: Accelerating Private Sector Growth,
(forthcoming), Washington D.C.
World Bank (2009f), Doing Business 2009, Washington D.C.
World Bank (2009g), Awakening Africa‘s Sleeping Giant: Prospects for Commercial Agriculture in the
Guinea Savannah Zone and Beyond, Washington, DC: World Bank.
World Bank (2009h), Ghana: Economic Governance and Poverty Reduction Credit, Report 47723-GH,
Washington, D.C.
World Economic Forum (2009), The Africa Competitiveness Report 2009, Geneva.
World Trade Organization (2008), Trade Policy Review: Ghana, Geneva.
Related Documents