PollcyRearch WORKING PAPERS Socioeconomic Data Intamational Economics Department The World Bank December 1992 WPS 1060 Economies of the Former SovietUnion An Input-Output Approach to the 1987 National Accounts Dmitri Steinberg An input-output approach is usedto deriveinternationally com- parable estimatesof GNP for the 15 economiesof the former SovietUnion. PhlicyRrseuchWozkingPapudiasntechfindaguofwoinp xgndme!mgethcucdungceoidas amumgBanszaffand aulo&.1 h edhd lpsvo isueLTbhpapeu, disubytdeRueuAtAdvisoyStaff.canythcmesiofhcauthn.rdfla aony*vews,andeh1db.uacdandcitedacoongly.Thefindimainpmaios,andconbasionsacthesuthos.own.lbeysbou1d nct benibuted tothc WcddBank.its Bourd of Dicto, its magemca, o gay ofitsmembercoutnes Public Disclosure Authorized Public Disclosure Authorized Public Disclosure Authorized Public Disclosure Authorized

Welcome message from author
This document is posted to help you gain knowledge. Please leave a comment to let me know what you think about it! Share it to your friends and learn new things together.
Transcript

Pollcy Rearch
WORKING PAPERS
Socioeconomic Data
Intamational Economics DepartmentThe World BankDecember 1992
WPS 1060
Economies of the FormerSoviet Union
An Input-Output Approachto the 1987 National Accounts
Dmitri Steinberg
An input-output approach is used to derive internationally com-parable estimates of GNP for the 15 economies of the formerSoviet Union.
PhlicyRrseuchWozkingPapudiasntechfindaguofwoinp xgndme!mgethcucdungceoidas amumgBanszaffandaulo&.1 h edhd lpsvo isueLTbhpapeu, disubytdeRueuAtAdvisoyStaff.canythcmesiofhcauthn.rdflaaony*vews,andeh1db.uacdandcitedacoongly.Thefindimainpmaios,andconbasionsacthesuthos.own.lbeysbou1dnct benibuted tothc Wcdd Bank. its Bourd of Dicto, its magemca, o gay ofitsmembercoutnes
Pub
lic D
iscl
osur
e A
utho
rized
Pub
lic D
iscl
osur
e A
utho
rized
Pub
lic D
iscl
osur
e A
utho
rized
Pub
lic D
iscl
osur
e A
utho
rized

Policy Research
Sohoeconomlc Date
WPS1060
This paper- a product of the Socio-Economic Data Division, International Economics Department - ispart of a larger effort in the Bank to provide an objective framework for detennining whether, and where,special problems of intemational comparability aise in reports about national accounts of economiesemerging from the former Soviet Union. Copies of the paper are available free from the World Bank, 1818H Street NW, Washington, DC 20433. Please contact Estela Zamora, room S7-136, extension 33706(December 1992, 113 pages).
Steinberg uses an input-output (1-0) approach to financial tables. The main adjustments are inderive intemationally comparable estimates of inter-republic trade, which is included in indi-GNP for the 15 economies of the former Soviet vidual FSU economies' I-Os, but not in theUnion (FSU). The commonly accepted measure overall 1-0 for the FSU, and for "unplanned"of economic output of GDP or GNP based on the sectors (military, police, and so on). AdditionalSystem of National Accounts (SNA) cannot be adjustments necessary to estimate GNP from netreadily estimated for these economies because material product - such as inclusion ofrelevant statistical reporting systems have yet to nonmaterial services - are explicitly shown inbe set up to replace the system used historically the appropriate 1-0 sectors. Appendices report- the Material Product System (MPS). details on these and other adjustments, notably
the apportionment and revaluation of inter-Steinberg's "three-ter' approach improves on republic trade from intemal to foreign tradethe short-cut method of "bridge tables (from prices.MPS to SNA)" by integrating addidonal finan-cial data and using the inherent cross-checks of The end product is one in which income,1-0 tables. The three steps in the orocess are to: output, and expenditures are estimated in a
consistent SNA-type framework for the overall* Analyze the official 20-sector MPS-type 1-0 FSU and for the 15 individual FSU economies.
tables. These 1-0 tables provide the information neededfor macroeconomic and sectoral analysis, and
* Integrate financial data on services, etc., form the basis for estimating per capita GNP forfrom National Economic Balance (NEB) tables. these economies.
* Convert the 1-0 table derived from the Steinberg presents the three-tier 1-0 tablesintegrated NEB tables to SNA forms. for the FSU region as a whole in this paper, but
presents only the SNA tier for individual econo-Steinberg resolves inconsistencies between mies. All tables for each FSU economy, with
Goskomstat 1-0 tables for the overall FSU supporting tables, are available on diskettes fromaccounts and those for the 15 individual FSU the contact person indicated above.economies by drawing on data from other
The Policy ResearchWorking PaperSeries disseminates the fmdings of work under way in theBank Anobjectiveof the seriesis to get these findings out quickdy. even if presentations are less than fully polished. The findings, interpretations, andconclusions in these papers do not nearily represent official Bank policy.
Poduced by the Policy Research Dism aion Center

ECONOMIES OF THE FORMER SOVIET UNION (FSU)
AN INPUI-OUTPUT APPROACH TO THE 1987 NATIONAJ, ACCOUNTS
Dmitri Steinberg
Socio-Economic Data DivisionInternational Economics Department

Economies of the former Soviet Union (FSU)An Input-Output Approach to The 1987 National Accounts
Dmitri Steinberg
Contents
Introduction ................................... . . I Comparison of Official, NEB and SNA Formats . ........... 3The Official Fornat: Iier I. . . . . . ... 4The NEB Format: Tier II .7....... ..... 7The SNA Format: TierM... . . ......... 9Conclusions ........ 11
Appendix A: Foreign Trade ... 12Appendix B: Labor Income .. .21Appendix C: Production and Financing of Seices 8...28Appendix D: Combining Reports from FSU Economies . . .41Appendix E: Second Economy . . .44
FSU Input-Output Tables, 1987, Tier I (Official format) . ....... 46FSU Input-Output Tables, 1987, Tier II (NEB format)... 48FSU Input-Output Tables, 1987, Tier m (SNA-type) .51
SNA-type (ier m) Input-Output Tables, 1987Armenia 5............ 54Azerbaijan ........... 58Belarus ........... 62Estonia ................ . . 6Georgia 70............. .70Kazakhstan ........... 74
Kyrgyzstan .7.................. . .78Latvia .8. ...... . . .......... 82Lithuania .......... . ..... 86Moldova 90............... .Russia .9..*................. 94Tajildstan 98................... 98Turkmenjstan ............. 102Ukraine ... 1.. ...... . . .. ..... ..... 106Uzbekistan .1................ .. 110

Preface
This study is part of an effort by the World Bank to provide an objective framework for determiningwhether, and where, special problems of international comparability arise in reports about national accountsof economies emerging from the former Soviet Union (FSU). It helped identify analytically significantstatistical issues, relative to official reports form some FSU economies, that are currently being explored.In the meantime, this paper provides researchers with the wealth of information generated by the exercise.
National accountants In FSU economies face a formidable task. Like other economies with a heritage ofcentral planning, they must move towards the UN system of national accounts (SNA). But they must do sowhile redefining the scope of their statistical systems, from subordinate parts in a very centralized processto tools for independent decision-making. This is complex in principle but even more in practice, andnational accounts emerging this soon from individual FSU economies may vary markedly in concept andinformation content despit e their shared statistical experience and the most diligent efforts of compilers.
The task confronting the new FSU national accountants is unusually difficult in principle. For example, theymust redraw the boundary between resident and nonresident economic units, shifting transactors in all otherFSU economies to the rest-of-the-world. This entails, among other issues, apportionment rules for economicunits whose accounts were kept on a Union-wide basis. The pervasiveness of central controls, and henceof the Union Government, means that such apportionment rules can have a significant impact on nationalaccounts. There is room for differing views about such rules but a strong case can be made for similarityof rules across the FSU economies. Practical problems further complicate matters. For example, crucialpieces of information, particularly on Union-wide economic agents, did not pass through the subordinate orFSU economy-level statistical systems; and may have been omitted or included in veiled form in Union-levelreporting, an assertion made by a number of outside experts in particular about defense and other securityactivities.
In order to gauge the extent of such disparities, and promote a dialogue about how to enhance internationalcomparability under such difficult circumstances, the World Bank sponsored two efforts by outside experts,to compile SNA-type data for each of the 15 economies emerging from the FSU. This working paperpresents the results of a study prepared by Intelligent Decisions Systems (IDS) of Berkeley, California. Themain author is Dmitri Steinberg, who has published a number of studies on the Soviet economy; withassistance from Lev Goldenberg, who was involved in official (Goskomstat) compilation of input-outputtables until late 1991, and others at the Bank and elsewhere. The views expressed are those of the authorsand are not necessarily those of the World Bank.
National compilers in the 15 FSU economies are now attempting to compile SNA-type accounts. Thus far,such efforts seem to have been limited to 'bridge-tables" that adjust NMP by a few key aggregates. Whilecertainly a worthwhile beginning, such efforts cannot provide standard SNA details (e.g., privateconsumption) and are potentially subject to a wide margin of error because 'bridge-tables' do not providecross-checks. National accounting experts from a number of international agencies and OECD countries areadvising their counterparts in FSU economies on their experiences in implementing SNA. However, suchadvise has limited applicability in the near-term because the information systems available to FSU compilersare fundamentally different from, and not readily changed over to, those of developed market economies.
While certainly flawed in many respects, earlier reporting systems do provide a great deal of usefilinformation and will have to continue playing a significant role in the monitoring of FSU economic processesin the near term. And FSU national compilers face a unique challenge in grafting new information sets ontoan as-yet unspecified remnants of earlier information systems. This exercise should help them in settingpriorities for new information, and deciding which existing reporting systems to preserve.
John C. O'ConnorChief, Socio-Economic Data DivisionInternational Economics Department
The World Bank

ABBREVIATILONS
CBT Compensation for Business TripsFSU Former Soviet UnionFT Foreign TradeFTOs Foreign Trade OrganizationsFTDs Foreign Trade Price DifferentialsGCC General Conversion CoefficientGNP Gross National ProductGVO Gross Value of OutputM11O Household monetary income and outlaysIDS Intelligent Decision Systems1-0 Input-OutputKGB State Committee on SecurityMPS Material Product SystemMVD Ministry of Internal AffairsNEB National Economic BalancesNMP Net Material ProductSNA System of National AccountsT&D Trade and DistributionT&C Transportation and Communications

Economies of the former Soviet UnionAn Input-Output Approach to The 1987 National Accounts
Dmitri Steinberg'
Introduction
In the late 1980s, official Soviet sources began to recast data from the Material ProductSystem (MPS) used by centrally planned economies into measures of the System of NationalAccounts (SNA), which is used by essentally all other economies and now accepted by all asthe international standard. However, only a few key indicators were reported and these werebased on so-called bridge tables, which do not provide the cross-checks inherent in good nationalaccounting, and specifically the harmonization of data from income, production, and expenditureapproaches. While there are significant differences between SNA and MPS, both systemsenvisage such harmonization efforts. And while such efforts can be constructive in less rigorousform, input-output (1-0) tables provide a convenient framework for such cross-checks.
This paper proposes a new procedure based on the 1-0 framework, which has the addedadvantage of being familiar to national accountants Lin both East and West. Within thisframework, conceptual as well as practical differences can be described succinctly as a processof recasting official ex-post 1-0 tables in current purchasers' prices into SNA format. This isfeasible in large part because Former Soviet Union (FSU) economies wok-ed with r morecomprehensive set of national accounting tables--called National Economic Balances (NEB)--which provide most if not all of the elements necessary to complete the recasting. Theprocedure consists of the following steps:
o analysis of the official 20-sector MPS-type 1-0 table contining data on p:-oduction flowso integration of financial data on services, etc., from NEB tables; ando conversion of the I-0 table derived from integrated NEB tables to an SNA format.
This three-tier approach clarifies methodological and estimation issues that underminedirect conversion of a few key MPS aggregates to SNA format. The new approach is firsttested for the FSU as a whole, where the results can be compared with official Soviet efforts atMPS-SNA conversion, and then applied to official 1-0 and other NEB tables compiled for eachof 15 FSU economies. The result is three sets of 30-sector 1-0 tables for each FSU economyand the region as a whole, following official, NEB and SNA formats.
The three I-0 tables for the FSU region as a whole are given below, but only the SNA-tier is given for individual economies. All tables for each FSU economy, with some supporting
'bi vetadon of a rport submled by nelligent Decisions Sytems (ID)M on March 4 includes some editoril cbhnges by IECSE adadditional text, notably in th induction and Appendix A. h does not, however, reflct subequent adjusmnts made as IDS receiAeadditionad information from the Wodd Bank and US Censs experts prepaing edimates according to an ;ncome-outay apprah.

tables, are available on diskettes from the Socio-Economic Data Division (IECSE), Room S7-131, The World Bank, Washington, D.C. 20433.
While a great deal can be learned from the FSU's 1-0 tables, it should be emphasizedat the outset that they value goods and services essentially at official or established prices.Given the considerable dAstortions in relative prices known to exist in such prices, special careshould be taken in drawing inferences from nominally equivalent estimates for FSU and marketeconomies. Market-oriented valuation schemes (purchasers' values, producers' versus basicprices, etc.) differ mainly with respect to fiscal wedges (indirect taxes minus subsidies) driveninto price structures. Reliance on these wedges is inherently greater in the FSU since centralplanning left no role for direct taxation of household income and blurred the always subtleboundary between direct and indirect taxation of enterprises (since "exceptional' profits/lossesof public enterprises should be treated as indirect taxes/subsidies).
The issue of fiscal price wedges takes on major importance in reporting the value offoreign trade. Appendix A provides some basic information on the differences between so-calledinternal and foreign prics for traded goods, for the FSU as a whole and for each FSU economy.Considerably more study will be required before definitive results can be expected in this area.
Appendices B-D consider some more technical aspects of sources and methods.Appendix B explains procedures for inserting data on labor income while Appendix C does thesame for production and financing of services.
Appendix D measures the importance of differences between the official 1987 I-0 tablefor the FSU as a whole, and the sum of the 1987 1-0 tables compiled by the 15 individual FSUeconomies. There are many plausible explanations, and a great deal of additional work wouldbe required to document all discrepancies. However, it provides circumstantial support tohypotheses that central FSU compilers had informnation that was not available to compilers inindividual economies.
This study does not attempt to go beyond official sources in estimating irregular orsecondary economy activities. The analytical significance of exclusion probably is not great in1987, relative to reporting problems with similar phenomena in market economies. However,the same cannot be said of the recent past, with some official estimates suggesting that as muchas 40% of household expenditure in some former FSU economies may have involved such"uncivil" activities, by the first half of 1991. Appendix E provides some additional information.
The present study focuses on 1987 as the last 'normal' year for which comprehensive1 10-sector 1-0 tables are available. Formally, a similar exercise was conducted again in 1990.However, inconsistencies in data reporting seem to have begun to affect macro-indicators evenfor that year before the collapse of the Union. It is expected that the differences will be largerin 1990 than in 1987. This would reinforce the case for more comprehensive cross-checldngof national accounting estimates as the FSU economies begin independent compilations.
2

Comparison of OMcial, NEB and SNA Formats
The official format was designed jointly by central and republic-level statisticaloffices--referred to below by their official name Goskomstat--to systematize the detailedinformation on domestic production and distribution, foreign trade and uses of goods whichconstitute what Goskomstat officials classify as the newly produced material wealth. Thus, 1-0tables compiled according to the official format contain information on production servicesrendered to distribute (transport, trade, etc.) goods from producers to users but excludeinformation on "non-material" services, i.e., those services which are not engaged in thedistribution of material wealth--household, banldng, insurance, advertisement, research, andgovernment administration , including defense, police, etc. National income estimated in official1-0 tables is often referred to as net material product (NMP) to emphasize that it excludesincome generated by "non-material" services.
To facilitate the conversion of the official format into the SNA format, the NEB formatwas designed to combine production data with financial data on services that are contained inofficial Goskomstat tables such as The monetary balance of household incomes and outlays (alsoincluded on diskettes), Incomes and outlays of the All-Union and All-FSUeconomy state budgets,Net profit by sector, Everyday services, Financing of socio-cultural services from all sources,Unfinished construction, Average annual employment by sector, and Average monthly salary bysector.
The last two tables together contain the only regularly avaiiable information on wagespaid in state service sectors. The table on households contains data on total wages and paidhousehold services. In official 1-0 tables, unfinished construction is treated together withinventories as working capital. Data on unfinished construction must be accounted for separatelyin order to estimate total fixed investment. Other listed tables contain useful information on freehousehold and government services which cannot be found elsewhere. In preparing this report,data was also used on household and state banking services financed by enterprises. These datawere experimentally collected by Goskomstat officials but not included in official NEB tables.
1-0 table in NEB format contains financial data absent from most official FSUeconomies' 1-0 tables:
o financing of business services included in NMP but excluded from gross national product(GNP),
o "non-material" services excluded from NMP but included in GNP,o unfinished construction,o other expenditure of national income,o net exports of goods, ando control totals for labor and non-labor income earned in all sectors of the economy.2
VCoftrol totals are usd in deriving output of 'unpnned- sectors a a residual. Ihm setors (primarly national acurity nd politicdorpnizAtions like the pay and Kosomor) did nort report to Goakomdat; their impnud account a included in the 'other- sctor of NEB tabl.
3

While designing the NEB format, various errors contained in official tables were locatedand corrected. After correcting for these errors, we discovered that FSU Goskomstat hasconsistently underestimated NMP by 3 pemrcent which has resulted in the underestimation of GNPby the same miargin. The margin of error contained in official 1-0 tables of other FSUeconomies fluctuated from 2 to 6 percent (see below).
NEB tables have most information required for estimating FSU economies' GNP bysector of origin and end use. GNP by sector of origin can be estimated by adding NMP(including net income from foreign trade but excluding losses), depreciation, value added inservice and "other" sectors and by subtracting all business services which are financed byenterprises and organizations. GNP by end use can be estimated by adding NMP (excludinglosses), paid and free household services, state budgetary outlays on research, administrationservices and defense, total fixed investment (excluding losses), additions to inventories, netexport of goods and services, net interest payments and sales of gold.
Since becoming sovereign states, FSU economies have begun to treat trade with eachother as foreign trade transactions. In 1987, however, FSU economies were still part of theFSU. This break in historical continuity poses two difficult methodological issues: 1) how todivide total foreign currency earnings of the FSU among FSU economies and 2) how to estimateintraFSU economy trade of services on which no data were collected. In this paper, we proposetentative solutions for these issues which require further testing. Official Goskomstat estimatesof FSU econc;nies' net exports in foreign trade prices can serve as the basis for dividing totalforeign currency earnings. The balance of payments connected with service activities areestimated for each FSU economy as a residual after accounting for all known uses of theseservices withir FSU economies.
The Official Format: Tier I
As in standard 1-0 tables, the official 1-0 data are stored on the intersection of rows andcolumns and are aggregated along four directions which are referred to here sometimes asvectors. In correspondence with four quadrants, these vectors are designated as 1.2, 1.3, 2.3 and3.4. For example, vector 1.2 is designated for rows extending from quadrant I to quadrant II.Quadrant I (the top left section) contains data on interindustry flows. Quadrant II (the top rightsection) contains data on end uses of goods. Quadrant m (the bottom left section) contains dataon value added in material production and "material"-type service sectors. Quadrant IV (thebottom right section) is usually empty in official 20-sector 1-0 tables, even though the NEBformat presupposes that it should contain data on value added in household, research, banking,insurance and state administration services.
Schematically, the information is arranged as follows:
&isoum\um 2. Inter-industr 4. End-us1. Material 1.2 or Quadrant I 1.3 or Quadrant II3. Non-material 2.3 or Quadrant m 3.4 or Quadrant IV
4

Quadrant IV was completed every five years in connection with the large 1 10-sector I-0table. However, there are indications that these data are significantly less reliable than datacontained in the first three quadrants of the table. The issue that remains unresolved is the extentto which the financial data on value added in service sectors which are collected annually aremore accurate than the 1-0 data. The issue of reliability arises because some services which wereprovided on FSU economies' territory were financed through centralized channels on which FSUeconomies could not collect information. Most of these services are provided by "unplanned"sectors which are excluded from official financial tables on labor and average monthly salary.
The extent to which "unplanned" sectors are excluded from official financial reports listedabove is still a subject of uncertainty. To preserve the inner consistency of official 1-0 andfinancial tables, we decided to rely on the financial data on service wages as opposed to theservice wage data contained in large 1-0 tables.
Value of goods produced in material production sectors is aggregated along vector 1.3.A summary row in Quadrant I stands for total outlays on material inputs that are included in thetotal price of goods.
In official and NEB formats, depreciation is not part of value added since it is excludedfrom NMP. For profit-making sectors, depreciation is estimated as deductions for replacementand repair of fixed capital deposited on special banking accounts plus the residual value ofscrapped capital which was not fully depreciated before retirement. This value, which is referredto in Soviet national accounts as unamortized writeoffs, is subtracted from total profit inquadrant IH. Depreciation in state budgetary and private housing sectors is estimated separatelyby Goskomstat officials using average replacement and capital repair rates.
Three summary rows in Quadrant HI contain data on national income generated inmaterial production sectors, total domestic output and supplies of goods produced in thesesectors and imported from other FSU economies and from abroad. National income is the sumof labor and non-labor income earned by state-cooperative, collective farns and private units.
Total labor income consists of: regular and bonus wages, other earnings (compensationsfor business trips plus other wages paid in addition to regular wages), payments received bycollective farmers, and net income of private producers. Regular wages and other earnings areentered enterprise accounts as part of the total production cost, while bonus wages are paid fromprofit.
The sum of regular, bw us and other wages equal total wages estimated by Goskomstatfor the purpose of determining comparative average annual and monthly wage rates by sector.Bonus wages are also paid in education, culture and health sectors, even though these sectorsdo not earn profit. For methodological reasons unknown to IDS, Goskomstat excludes bonuswages paid in these sectors from estimates of total and average wages.
S

Non-labor income consists of:
o social security deductions made by all enterprises and organizations,o total profit (including state taxes, interest payments made by enterprises, and purchases
of housing and socio-culturat services for employees and their families),o turnover taxes less net agricultural subsidies,o non-labor income of collective farms,o unamortized writeoffs (with a minus sign), ando other income treated as part of production cost and hence excluded from total profit3.
Total supply of goods equals total domestic output plus imports. Total domestic outputexceeds prices charged by producers (this output is often referred to as the gross value ofoutput--GVO) by the sum of a) the turnover tax less net subsidies and b) transportation andcommunications (T&C) plus trade and distribution (T&D) charges. All imports are measuredin domestic prices registered during the purchase transaction.
National income estimated in official 1-0 tables is smaller than total NMP estimated inofficial national income tables by the amount of total revenues from foreign trade. Theserevenues are estimated as the sum of foreign trade tariffs and net exports. Foreign trade tariffsequal imports minus exports each expressed in domestic prices. Net exports are estimated inofficial national income tables as net foreign currency earnings from commodity trade measuredin domestic prices. According to the NEB methodology, the coefficient for converting netexports to domestic prices is assumed to equal the ratio between exports in domestic and foreigntrade prices, when exports exceed imports both measured (annually) in foreign trade prices. Theimport conversion coefficient is used in years when imports exceed exports both measured inforeign trade prices. For this study, it was decided not to follow the NEB methodology ofestimating conversion coefficients for individual FSU economies and instead used data on netexports in foreign trade prices.4
Uses of goods are aggregated along vector 1.2. The summary co!umn in Quadrant Icontains data on total interindustry purchases of intermediate goods supplied by materialproduction sectors. The summary column for Quadrant II contains data on total uses comprising:
o total interindustry purchases,o purchases of goods for current consumption by households and "non-material' services,o net fixed investment (new fixed investment less depreciation and unfinished construction),o depreciated fixed capital,o additions to worldng capital (inventories, reserves and unfinished construction),
Lterestpayments mde by rade organizations,purcha of research rervicca, deductions on oil-gas and othergeologicl explocation works,deductions for road constauction made by trnaportation organizations, and payments to militarized Indudtial gurds.
'hM section and other ampects of how foreign trade should be repofted in 1-0 tables is curuvntl under review. Ihe main i concerntratment of o-caled foeign trade differentia, and whether such differentials should also be applied to inter-republic utde (which is includedindiinguIshably with exta-Union trsde in 1-0 tables for trpubliuc (but not for the USSR as a whole).
6

o losses',o exports estimated in domestic prices, ando other expenditures of national income (derived as a residual after subtracting all end uses
known to Goskomstat from national income),
Since total supply and total uses are balanced, a summary column must be identical toa summary row. In theory, the balance is achieved through adjustments in the other expenditurecolumn. However, republic-level Goskomstat's offices had little confidence in their estimates forthis column, as suggested by the absence of this column from most of their I-0 tables.
NEB Format: Tier II
The NEB format serves essentially two purposes: It facilitates conversion from officialto SNA format, and identification/correction of major errors in the coverage of materialproduction sectors as given in official 1-0 tables. Compared to official 1-0 tables, these tablesprepared according to the NEB format add for business trips (row 25), other wages (row 26),business services financed from total profit (row 32), business services financed from othernon-labor income (row 36), other net non-labor income (row 37), foreign trade revenues (row41); plus columns for nine "non-material" services (columns 21 through 31) and the annualaddition to unfinished construction (column 36). In addition, Quadrant IV contains estimates ofvalue added in "non-material" services, other ("unplanned") sectors (column 33), control totalsfor components of value added in aU sectors of the economy (a summary column 41), as wellas a memo item on total state wages (row 46).
In an attempt to test the inner consistency of the official Goskomstat data on wages, wecompared the official 1-0 and financial data on wages and concluded that:
1. Agricultural and industrial guard services are excluded from official 1-0 estimates of the GVOfor agriculture and other production sectors. For FSU, the output of these services amounted to2.5 and 2.7 billion rubles respectively. Agricultural services were found to be excluded from tenout of fifteen FSU economies' 1-0 tables, while industrial guards were excluded from all FSUeconomies' 1-0 tables. Since both agricultural and guarda services are "material"-type, the netoutput of these services in.-rease NMP as well as total uses of the industrial and agriculturaloutput. For this reason, IDS found it necessary to increase intermediate purchases of otherproduction services as well as purchases of the agricultural output by the state administrationsector.
2. Wages of the industial administration sector (1.0 billion rubles), are treated as part of totalindustrial wages. At the same time, in 1987 financial tables, the same sector is aggregated withstate administration. In order to avoid double counting, total GVO of state administration wasinitially adjusted downward by 1.2 billion rubles. Afterward, the same GVO was adjusted
SRtel trmde writeofri from sales of low quality induwtul goods below wholeslepice, havened gdicoltual goods and lvetckdtht pershdue to ntuml diatrs, and the value of abandoned conswztion alte-pdrimily oil and gaz fields.
7

upward by 1.6 billion rubles to account for "unplanned" party and other political organizationswhich are excluded from both I-0 and financial tables. This adjustment was based on theassumption that the sum of household membership dues and state budgetary outlays on stateadministration services was approximately the same in size as the GVO of these services.
3. Wages in the remaining "unplanned" sectors (18.1 billion rubles, primarily defense andpolice organizations) were derived in column 33 as the difference between control totals for theentire economy (287.3 billion rubles, column 41) and the sum of wages in "planned" production(195.5 billion rubles, column 20) and service (70.6 billion rubles, column 32) sectors. Totalwages of national security sectors amounted to 19.6 billion rubles (18.1 + 1.3 + 0.2), of whichwages received by the military and police accounted for around 10 billion rubles according tounpublished Goskomstat data. What state sectors paid the remaining 9.6 billion rubles in wagesremains unclear. But no matter which sectors paid these wages, the end result of the necessaryadjustments in official I-0 flows would be the same: NMP must be revised upward whichcauses other expenditures to increase by the same amount.
FSU data on business trips, business services (except for purchases of "non-material"transport and research services) and other income of "planned" sectors were all extracted fromunpublished Goskomstat materials. The latter were in turn compiled from detailed productionreports submitted by enterprises as well as from various sets of financial statistics collected bythe FSU Finance Ministry. Business trips account for around 1.1-1.2 percent of regular wages.Allocations from total profit consist of: 1) housing subsidies, 2) subsidies to socio-culturalsectors--professional schools, cultural and sporting events, resorts and children facilities, and 3)interest payments. Each of these three allocations accounted for 2-3 percent of total profit. Intrade and distribution (T&D) sectors, where interest payments regularly accounted for as muchas 40 percent of total profit, these payments were treated as part of production cost and hencewere included in other income in official 1-0 tables.
In the absence of data on purchases of 'non-material" transport, it was assumed that thesepurchases can be derived as follows: The official table Everyday services contains data on totalsuch purchases made by both households and enterprises, while the official table Householdmonetary incomes and outlays contains data nn the same purchases made by households. Dataon enterprises were thus derived by comparing the two tables. The derived data were thendistributed among sectors in proportion to compensations for business trips. Total payments forresearch made by production sectors and for communications services made by "non-material"sectors were estimated as residuals after accounting for all known elements of other income bysector. The PSU data were then applied to individual FSU economies in proportion to wages,profit and other income.
It appears that compilers in some FSU economies balanced supply and uses by adjusting"other income' downward. For example, Ukraine's Goskomstat seems to have reduced otherincome in machinery sectors by 1.5 billion rubles without apparent reason. Similarly, theLatvian Goskomstat reduced other income in the power sector by .05 billion rubles. In bothcases, adjustments resulted in the negative amount of other income, which is difficult to accept
8

given the fact that other income consists of net revenues and payments for services. Therefore,IDS decided to reverse these official adjustments, which resulted in an increase in GVO, NMPand other expenditures.
Foreign trade tariffs by sector (row 41) were estimated by subtracting exports (column40) from imports (row 44). As in official national income tables, estimates for foreign currencyearnings in foreign trade prices were entered as revenues of T&D sectors (intersection of column18 and row 41). For some FSU economies, this procedure for recording net exports on theproduction side caused the size of total output of T&D to become negative.
SNA Format: Tier m
A number of steps were involved in converting 1-0 tables from the NEB into SNAformat. After making some psentational changes to the 1-0 format, we introduced selectedsets of new data and made certain adjustments; finally, the 1-0 structure was completed byderiving key residuals. The first priority for future work, with national compilers, will be toconsider the reasonableness of the residuals, and in deciding whether additional sets of new dataand adjustments are necessary.
Presenfational
1. Rows and columns in Quadrant I were expanded to accommodate service and 'other"sectors of the economy, whereby a summary row 33 was estimated by adding business purchasesof both intermediate goods and services and a summary column 33 was estimated by adding allinterindustry uses of the same goods and services. A summary row for outlays on services wasderived by adding compensations for business trips and all purchases of business services.
2. Household consumption was divided into purchases and free government services.
3. Data on fixed capital formation were aggregated into one column.
4. Three additional columns were introduced--civilian government, defense and othernational security organizations, and net exports.
New Dat
5. Income of private producers was increased by unofficial estimates of income from privateservices.
6. Household purchases were increased by the amount of purchased government and privateservices. Insurance services were estimated as the balance of payments on insurance policies.Data on all purchased govemment services were extracted from the official table on householdmonetary incomes and outlays
9

7. Data on government purchases of TV and radio broadcasting and governmentadministration services were extracted from the official table on state budget outlays.
8. Government purchases of research services were estimated by adding outlays on civilianscience (18 percent of total budget outlays) and geological works.
Adjustments
9. All business purchases were removed from value added. Other earnings of stateemployees and collective farmers' pay were both reduced by the amount of compensations forbusiness trips. Net profit and other income of state-cooperative enterprises and non-labor incomeof collective farmers were reduced by purchases of business services.
10. Purchases of food and uniforms by defense and other national security organizations (4.8bi;lion rubles for the FSU) were removed from household purchases and added to the "other"column.
11. State budget purchases of agricultural and road administration services were added togovernment purchases in Quadrant H.
Key Residuals
12. Unamortized writeoffs were increased by losses, which were removed from end uses, toaccount for total losses of national income. In this way, it was possible to balance twoindependent estimates of GNP by sector of origin and end use.
13. Free education, culture and health services financed from the state budget were estimatedas a residual after subtracting purchases made by enterprises and households from total supplyof these services.
14. Government purchases of urban municipal services were estimated as a residual afteraccounting for all other purchases of housing-communal services.
15. Data on national security organizations' purchases of transport, communications,research and space services were derived as residuals after accounting for all known purchasesof these services.
16. Net exports were increased by the amount of net factor services. Published CIA dollarestimates for these services for the FSU were converted to foreign trade prices using the officialexchange rate. The total for net factor services for the FSU were distributed among FSUeconomies in proportion to the total domestic output of these services.
10

Conclusions
Official 1-0 tables contain estimates of NMP ("NMP 1") which excludes all foreign traderevenues that amounted to 55.3 billion rubles for the FSU in 1987. Goskomstat makes separateestimates of these revenues for FSU economies on the basis of the derived NMP 1 data. TotalNMP equals the sum of "NMP 1" and foreign trade revenues. Per capita estimates are derivedas the ratio between total aggregates - NMP or GNP - and total population in each FSUeconomy.
In NMP-type accounts, FSU economies with the highest per capita income are Russia,Belarus, Latvia and Estonia, while FSU economies with the lowest income are Uzbekistan andTadjildstan. The ratio between per capita income in the richest and poorest FSU economies -Russia and Tadjikistan - was 2.79. In GNP-type accounts, this ratio increases to 3.06. Severalother dramatic differences exist in the two estimates of FSU economies' relative standing. InNMP accounts, per capita income in Belarus and Lithuania was above the FSU average by 17and 7 percent respectively. In GNP-type accounts, per capita income for these FSU economiesdrops to 10 and 23 percent below the FSU average. Using the NMP-type accounts, the outputof the Russian economy was estimated as 61 percent of the total FSU output. Using GNP-typeaccounts, the ratio increases to 65 percent.
The GNP estimates derived in this exercise (column 42, row 33 in Tier III) differ fromthose compiled by national compilers, across-the-board because this report includes (in column41 and in row 38) an imputation for valuing inter-republic trade at Foreign Trade (F1) ratherthan internal prices, in keeping with the valuation of extra-republic trade. In addition, but notsystematically, these estimates are thought to differ from those reported by FSU economiesmainly because we have followed a uniform, and cross-checked, approach to estimating thecontribution of "other" activities (military, etc.); it appears likely that the estimates for someeconomies (e.g., Georgia) also differ from those given here because national accountants adopteda non-standard approach to revaluation of extra-republic trade (from internal to FT prices).However, such assumptions are based on circumstantial evidence and more definitive statementswill have to wait until national compilers have had an opportunity to comment on this paper.
11

Appendix A: Foreign Trade
Background
FSU foreign trade (FI) activities were normally reported in ruble terms, valued both ininternal and foreign or FT prices, but not in foreign currency (e.g., US dollar) terms. Thecorrect conversion factor for moving from rubles to dollars thus depends on whether the initialruble figure is valued in internal or FT terms.6 However, the main issue for this paper is therelationship between the two systems for reporting in ruble terms, and how they enter I-0 andother datasets.
Transactions between foreign trade organizations (FTOs) and internal suppliers wereregistered at internal prices; transactions between FTOs and the monetary authority (V-Bank)were at FT prices. Internal prices on exports cover the cost of producing and deliveringexported goods; on imports they are equivalent to wholesale and retail prices on foreign goodsat which they are purchased by internal buyers.7 Exports and imports in foreign currency arevalued in prices agreed by FTOs with foreign suppliers, but only the monetary authority waspermitted to handle the foreign currency; FT prices represent the rubles received by FTOs forexports, or paid by them for imports, vis-a-vis the monetary authority.
Hence, the system of dual ruble pricinge is an accounting artifice for dealing with theinconvertibility of intemal ruble into foreign currency-and systematic disparities between pricelevels and structures envisaged in central plans and those prevailing on world markets. Eachcross-border transaction was recorded first in foreign currency (with other currencies convertedto dollars at prevailing exchange rates, for statistical purposes) and then at both internal and FTprices.
Conceptually, sums in fore?gn currency terms (e.g., dollars), internal rubles, and FTrubles are available. However, until 1990 trade was reported primarily in FT prices; most dataon exports and imports in internal prices were considered confidential. Since then, all FT data,except in the defense area, have been de-classified although reporting of actual foreign currencyvalues has yet to begin, probably more for technical reasons (information systems may not havebeen set up to aggregate details in this dimension). However, so little written documentationexists on underlying sources and methods that considerable uncertainties remain, even amongexperts, on how to interpret the available data.
'&odly speaking, the officia rate makes - for converting value. at inteml prices whilo somethiqg like the commercal rate makes sensefor converting values at F1 pric (although the commerci rate formally came into exigtence only In late 1990-and then at a level that mayhave been more heavily depreciated thao in faa corresponds to the difforence inherent in the dual pricing sytem.
'It i sumed that this generaly included urnor taxs (eu contmr ubsidies). Hence, the protection or extent of multiple exchangerate practice Is probably les tn is sugested by comparisons of values at intal and Fl price, for consumer goods, etc.
Based on detailed information availble for other histodcay panned economies, the amy of pricing options wa probably even moreextensive, with the price of each good recorded at key points in it physical tovement from producer to finAl purchaser, in order to monitortanspotation and distrbution margins, or the take' of the relevant goveronmt monopolies.
12

In FSU national accounts, FT activities are registered in internal prices followingproduction, national income and financial methods. Hence, there is a fundamental differencebetween the values reported in some detail as foreign trade, and the very summary series, netexports, commonly given in national accounts. Further complicating superficial comparisons,net exports are often combined with errors and omissions, in FSU national accounts.
The production method, which is used in preparing 1-0 tables, is designed for estimatingtotal supply and uses of goods. Total imports equal the difference between total supply andinternal output, and total exports equal the difference between total and internal uses. Totalimports and exports are derived by adding the value of all imported and exported individualgoods aggregated into sectors of output that match the production classification.
The national income method, which is used for estimating NMP and gross mateialproduct, is designed for deriving total FT income as the sum of FT tariffs and net exports. Thissum in effect equals net revenues made by FTOs from dealing with internal and foreign suppliersrespectively on behalf of the FSU government. It must be emphasized that FT income is inreality generated by the FSU government by means of price differentials, i.e., the net differencebetween trade valued at internal and FT prices. In this respect, it should not be confused withincome earned by FTOs in return for performed trade services, i.e., the normal return forperforming wholesale/retail trade, transportation, or similar distribution services. Wages, profitand other elements of value added in the FTO sector are aggregated in 1-0 and other NEB tableswith value added in the internal trade and distribution sector. It is generally assumed that theoutput of the FTO sector is distributed evenly between import and export operations. Thisjustifies estimating FT tariffs as total imports minus total exports in internal prices because GVOof foreign trade organizations is relatively small, it assumed that trade markup included in priceson exports and imports cancel each other in estimating foreign trade revenues as Md-Xd.
Total net exports were estimated for FSU as net foreign currency earnings converted tointemal prices using a general conversion coefficient (GCC). The GCC is assumed to equal theratio between exports in internal and FT prices during those years when total exports exceedtotal imports both measured in FT prices. The import-side is used to derive the GCC when totalimports exceed total exports, both measured in foreign trade prices. We allocated total netexports among FSU economies in proportion to their NMP estimated without FT income.
The justification for estimating FT tariffs as imports minus exports in internal prices wasas follows:
FT income = (Md - Mf) + (Xf - Xd) =(Md - Xd) + (Xf - Mf)*m, if Mf > Xf= (Md - Xd) + (Xf- Mf)*x, if Xf > Mf,
where M and X stand for total imports and exports, d and f for internal and FT prices, and mand x for import and export conversion coefficient (m=Md/Mf and x=Xd/Xf).
13

In kleeping with usual FSU practice, official 1-0 tables record exports and imports atinternal prices. This can be seen by comparing figures in the "Tier m" 1-0 table for the FSUwith those in Chart Al, below. In the 1987 1-0 table, total exports (column 43, row 33) are44.35 billion rubles, which is repeated in Chart Al under extra-republic trade, in the subsetlabeled "D.P." for domestic or internal prices; with a similar equivalence for imports (I-0column 33, row 51).
These entries exclude the foreign trade price differential on FSU trade with the rest ofthe world, or the difference between the FSU's resource balance at FT and internal prices.However, the 1-0 total for net exports, 10.21 billion rubles, comprises the net of the two itemsalready discussed (7.70 billion rubles, in column 41, row 20) plus a net for nonmaterial services(2.51 billion rubles in column 41, row 31), valued at FT prices. Hence, the net of the I-O'sexport column (43) and import row (51), suggests an import surplus of 50.38 billion rubles,while the entry in the net export column (41) suggests an export surplus of 7.70 billion rublesbecause of the difference in valuation.
Note that there is no counterpart to column 41 in the official or NEB "tiers" of 1-0tables. In effect, this column moves valuation of foreign trade from intemal to FT prices; row48, captioned "net foreign trade," restores overall balance by recognizing that the valuation oftotal output should have been correspondingly higher, Cy the difference between net exports atinternal prices and excluded nonmaterial services (-50.38 billion rubles) and at FT prices afterallowing for nonmaterial services (+10.21 billion rubles).
In a round-about way, this is equivalent to revaluing the export column (43) and importrow (51) from internal to FT prices. The fact that the official exchange rate and the entireinternal price mechanism have not been driven by market forces makes it difficult to account forreal net exports in estimating GNP for the FSU as a whole, based on these estimates. Furthercomplicating matters, fundamentally different measures obtain depending on the treatment ofinter-republic trade.
Resource balance for individual FSU economies
Trade among the 15 FSU economies was significantly larger than their collective tradewith the rest of the world; how much larger depends on which economy is considered (some hadlittle direct trade with the rest of the world) and whether internal or FT prices are used. Thevaluation issues is of even greater analytical significance, however, in measuring the resourcebalance (exports minus imports of goods and nonfactor services).
Since each FSU economy is now a separate nation, each should classify trade with theothers as transactions with nonresidents. Until late 1991, the same transactions were amongresidents of the same nation and therefore not, strictly speaking, imports and exports. However,the 1987 1-0 tables for individual FSU economies were constructed as if each had been aseparate nation, meaning that exports and imports refer to totals comprising transactions withthe other 14 FSU economies as well as the rest of the world. Depending on whether the
14

objective is to account for actual conditions in 1987 or provide a starting point for analysis ofthe individual economies that emerged from the FSU by 1991, one might prefer to define tradeinclusive or exclusive of inter-republic transactions, in the 1987 I-0 tables.
The previous section explained the link between the Chart Al's entries unier extra-republic trade and the 1-0 tables, for the FSU as a whole. There, the narrower concept ofexports and imports, exclusive of trade among the 15 is used. But the export column (43) andimport row (51) in 1-0 tables for individual FSU economies refer to total trade, covering inter-republic as well as extra-republic accounts. No disparity arises in measuring the resource balancefor the FSU as a whole since inter-republic exports and imports are necessarily equal. And itseems clear that the measure of net export for column 41 should reflect FT rather than internalprices.
However, there is room for discussion about the apportionment of the foreign trade pricedifferentials (FTDs, difference between trade at internal and FT prices), particularly when it isrecognized that extra-republic trade "booked" to one FSU economy in the available accounts maywell have depended primarily on inputs from another FSU economy, which means that the FTDswould more logicaly accrue to the originating economy rather than the one finaUy trading withthe rest of the world. This is a specialized case of trying to apportion accounts of Union-wideenterprises/units among economies. While the underlying issue of repricing needs to consideredin much greater depth,9 an immediate issue is whether it is reasonable to revalue extra-republictrade, from internal to FT prices, while leaving inter-republic trade at internal prices. Thismeans that an intermediary able to acquire nearly finished exportables from another FSUeconomy at internal prices and selling them abroad at much higher FT prices, after minimaltransformation, would appear to have large profits; with corresponding losses or reduced profitaccruing to industries that do minimal processing of imports from outside the FSU that aredestined for other FSU economies.
The analytical significance of this issue lies in the way national accounts wiUl relateproductive activities with domestic absorption of resources, with,the resource balance being thedifference. To gauge the importance of the issue, one need only look at the difference betweennet values of inter-republic trade as reported in Chart Al. This shows not only the neutralityof the issue for the FSU as a whole but the massive swing from net importer to net exporter,inter-republic, for Russia (with a surprisingly similar outcome for Azerbaijan); while most otherFSU economies are then shown to be net importers rather than net exporters. Considering rootcauses, like the extraordinarily low price at which oil was booked in inter-republic trade, andthe steady moves towards world prices particularly by Russia, it may be that creation of anotional FTO handling inter-republic trade, much as actual FTOs intermediated between intemaland FT prices, would provide a more meaningful historical reference point than strict conformityto the criteria that "actual" purchasers' values are to be recorded.
'Such issues are being pproached noro genealy in the coatea of an inter-economy 1-0 fsmework being developed for IECSE by JeffHewings and Philip uaelivich of the Univerity of MIlnois, etc.
15

Overall, then, there exist five possible ways of accounting for republics' FT income:
1) follow the official Goskomstat practice, allocating total FT income in internal pricesamong republics in proportion to NMP;
2) adjust the official practice by allocating the total FT income in internal prices amongrepublics in proportion to GNP (estimated without FT income);
3) estimate FT net tariffs for each FSU economy (based on special Goskomstat reportsprepared for 1987-90) and convert net exports (extrarepublic trade) from FT prices to internalprices using export and import conversion coefficients derived for each republic;
4) combine data on republics' FT tariffs with estimates of net exports from extrarepublictrade in FT prices, or
5) estimate republics' FT tariffs and to use estimates of net exports from total trade in FTprices.
Data presented in Charts Al, A2 and A3 below make it possible to employ each of theabove five methods. Republics' total trade in FT prices was estimated by Goskomstat by addingextrarepublic and interrepublic trade in FT prices. While data on extrarepublic trade in FT priceswere regularly collected by Goskomstat, special effort was made to convert data on interrepublictrade into FT prices using various international comparison techniques based on applying exportconversion coefficients to the output of 110 i-o sectors. It is known that these coefficients werederived by comparing the value of total exports in foreign trade and internal prices. Furtherresearch must determine whether for the purpose of preserving some historical continuity itwould be more precise to use data on total trade with capitalist countries for estimatingappropriate export conversion coefficients before the breakdown of the USSR in 1992.
In preparing 1987 1-0 tables, IDS decided to use the fifth method as the most appropriatefor comparing republics' FT activities in 1987 and 1990. As evident from Charts Al, A2 andA3, Russia was the only net exporter in FT prices among republics in 1987-1990.
So far the discussion focused on merchandise trade balance. The financial method, whichis used in compiling state budgetary data, is designed to measure the total balance of paymentsor the current account balance, including payments which are not connected with merchandisetrade activities. The total balance of payments consists of net state budgetary revenues fromforeign transactions plus the balance of credit payments. The state budget collects revenues whenMd> Mf and Xf> Xd. The state budget subsidizes foreign economic transactions when Md < Mfand Xf<Xd.
USSR state budgetary revenues from foreign transactions grew from 69.3 to 75.2 billionrubles between 1987 and 1990. Total budget outlays on foreign trade grew from 24.6 to 28.5billion rubles. Thus, net budgetary revenues increased from 44.7 to 46.7 billion rubles. In
16

comparison, USSR FT tariffs increased from 50.4 to 68.5 billion rubles, while net merchandiseexports in FT rubles decreased from 7.7 to -8.4 billion or from 5 to -14 billion rubles. It isdifficult to compare estimates that result from using national income and financial methods forthree reasons: a) it remains unclear how the current account balance is exactly accounted for instate budgetary statistics, b) official estimates of factor services have never been published, andc) revenues from some exports (particularly shipments of armaments to Third World countries)do not increase state budgetary revenues because of delinquent debts on loans. As evident frompublished state budgetary statistics, outlays on foreign trade consist of subsidies to FTorganizations (when Xf< Xd), foreign aid and servicing the foreign debt, which amounted to10.8, 12.5 and 5.3 billion rubles in 1989 (Izvestiya, Sept. 26, 1989, p. 5).
Assuming that foreign aid amounted to 11.5 billion rubles in 1987, then current accountbalance in internal rubles can be approximately estimated as 55.2 (44.7+11.5) billion rubleswhich exceeds FT tariffs by the amount of net merchandise exports--5 billion rubles. There arethree possibilities: 1) net export of factor services were not entered in USSR state budgetaryaccounts, 2) forcign aid in 1987 was larger than in 1989 than in 1987, or 3) net factor serviceswere close to zero in 1987. The last possibility seems most likely.
According to CIA estimates presented in Chart A4 below, the USSR merchandise tradebalance, net interest payments and net export of factor services all payable in hard currencyamounted to $6164, -$2148 and $1100 million respectively with the total balance of $5116 in1987. If one applies the official exchange dollar-ruble rate of 0.65, then the total balance payablein hard currency was 3325 million in FT rubles. As estimated by CIA, the annual increase innet debt in hard currency increased in 1987 from 20.9 to 26.4 million dollars (see Chart AS).Both sets of CIA data were listed in the joint CIA/DIA report 'The FSU Economy StumblesBadly in 1989" submitted to the Joint Economic Committee of the U.S. Congress, 20 April1989.
17

Chart Al: Republcs' Commodity Trade in Domestic and Foreign Trade Prices in !987(Mwlons of current rubles)
ToI1 Tmade Ina.pub u Trade Ezpu b5c Tmade
Impo Expo NetnE N Expor! Impon Net mtppon!Expor Net Exponlmpnr INet
D.P.I D.P. iD.,P. F.P. F.P. t F.P. D.P. i D.P. iD.P. F.P. I F.P. F.P. D.P. 1 D.P. ID.P. F.P. F.P. F.P.
-4 1! - I 1- =-1- =__USSR 2763W222S971 S0381 246137 238433 7704 181621 1816211 0i177695 177695' 094731 443S05 0381 68442 60739 7703
Russia 1314715102711'287600140S43 992S9 41284 67207 708S5.-3648' 85149' 56682'28467 64264 31856 32408 S5394 42S77 12S17Ukraine 50179i 43998 6181: 439S6. 49374' -S418 361681 37729:-1561' 36409: 40296 -3887 140111 6269 7742' 7547 9078 -1S31
Belorus 17707. 18864! -1-ln 16469 189615-2492 14083; 17228;-3145 14489' 167351-2 46 36246 1636 1988' 1980 2226. *2
Uzbekistan 129744 8974' 4000' 6959' 113211 -4362 11374' 7458 3916' 6094! 10586,.4492 1600 1516 84: 865 735' 130
Kazakhstan 163S2, 88111 7S411 8494; 16147: -76S3 137687 U37i 5431' 8014' 14599'-6585 2584 474 2110; 480. 15489 106
Georgia 6069: 5744 32S! 351S. 5286 -5775 4810 5387i -77' 3128! 4663j-1S35 12S9_ 357 902: 387 623; -236
Aizerba!2n SS5l 6763'*12C19: S113. s16! -48 42515 6291 -2040 4796, 458S 211 1303i 4721 8311 317' S76' -259Lithuania 6968; 5870 1098 4326 7861! -353S S859. 5458' 401 3835' 75411-3306 11091 412! 697! 491' 720' .229
Moldova 5915' S627' 288 3185 50S5 -1870 4766 5399 -633; 2964- 4425,;.461 1149' 228j 9211 222' 630: -409
Latvia S593 4693 900 35S0 5271.-1721 4626' 4312' 314' 327S' 4682 -1407 967! 381j S86 27S; S89 -314
KyraNyzstan 34901 2324; 5566 IS19' 2924 -140S 2780 2269' 515' 1483: 2453; -970 710' 55 655 36 471 -435
Tadjikistan 34S5 2264 1187: IS58 2867"'1309 3077 1970 1107 5351. 27171-1366 374! 294: 80j 207 IS0 57
Armenia 40?1' 3937 134 2486 3025 *539 3282 3870 -588 2443 2708. -265 789 67! 722' 43 317 -274
Turmenistan 2925 2447 478 2500 2605 -I0S 2597 2327 270 2446 2474! -28 328' 120; 208 54 131 *77
Estonia 3633 2944 689 1964 3316 -1352 2973 2731 242 1819 2948' -1129 660 213 447 145 368 -223
Chart A2: Republics' Commodity Trade in Domestic and Foreign Trade Prices in 1990(millions of current rubles)
TomE Trade latcrrepublUc Trade Emw blUc Tm de
Import, Expon Net Expon Import Net Impon Expon Net Expron Import' Net Import 'Exporr Ne: lExportImport Net
D. P. D.P. .D.P.' F.P. F.P. F.P. D.P. D. P. .P. P. ! F.P F.P. D.P. D.P.! D. P. F.P. F.P. F.P.. ~ ~~~ ~ ~ ~~~~~ i ' . ! :1 i 'j
USSR 302642. 234178 68464 242732 252132 -8400 18854S 188545 0 182335 18233S 0 114097'45633 68464 60397 68797 -8400
Russia 142563 106795 35768 132917 103089 29828 67283 74710 -7427 86449 56583 29866 7S280 32085 43195 46468 46506 -38
Ukraine 54060' 45606 8454 43797 S1769 *7972 38989 38319 670 35968 42468 -6500 IS071j 7287. 7784 7829 9301 -1472
Belorus 19766. 18995: 771 18053 20332 -2279 14841 17225 -2384 16043; 172S91-1216 4925. 1770' 3155 2010 3073'-1063
Uzbekistan 14662. 9352' 5310' 7702 12289 .4587 15864 8169: 3695 6889 10993 K-4104 2798i 1183. 16155 813 1296' -483
Kazakhstan 178301 9349; 8481' 9489' 16470'-6981 14314: 8443' 5871 8450i 0 14 07602C 3516! 906' 2610 1039 1900 -861
6839 59831 8S6' 3153 5366. -2213 4948' 5724' -776' 2852' 4464.-1612 18911 259' 1632: 301 902 .601
Azerbaijan S752 6430 *678. 4999 5134 -135 4247 610S -1858 4576: 4308' 268 I505' 32S' 180 423 826 .403
uthulan 7638: 5763i 1875' 4552 8071:-3519 6022, 5349 673 4155 7169 -3014 1616' 414 1202 397 902 -505
Moldova 6462, 6176' 286' 2941 5784'-2843 4992. 5853 *861 2704 4947 -2243 1470: 328 1147' 237 837 -600
Latvia 6327: 5283 1044 4117 5833 -1716 4711 5028 -317. 3939. 4873 -934 1616' 255 1361 178 960 -782
Kyrg zstan 4242 2499 1743 2006 3669 .1663 3179' 2446 733 1954 2910' .956 1063! 53. 1010 52 759 -707
Tadjikistan 4126 2685 1441 1999 3465 -1466 3359' 2377 982 1643 3082 -1439 767 308 459 356 383 -27
Armenia 4868 3523 1345 2053 3655 -1602 3715 3428 287 1989 3155-4166 1153 95 1058 64 500 -436
Turmenistan 3608 2645 967 2887 2744 143 2923 2469 454 2773 2438 335 685 172: 513 114 306 -192
Estonia 3899 3098 801 2067 3462 .1395 3158 2900 258 1951 3116 .1165 741 i98 543 116 346 -230
18

Chart A3: Comparison of Republics' 1987 and 190 Export and Import Conversion Coefficients
ToWl Trde iang bUc Tad. .- Wubc Tfded
__pm lm Expm = imsnport __ Expo"m _ _-=1987 1987 i990 1990 1987 1987 1990 3 1987 1087 1390 1990
USSR 0.92 1.16 0.961 1.21 1.02. 1.02, 1.03 1.03 0.65: I.56 . 0.76 1.66Russia 0.73t 1.32 0.80 1.3 _ 0.83 1.191 0.86' 1.19 _ 0.58 jji 0.69 1.62Ukraine 1.00k 1.02. 1.04 3 1.0 1.04, 0.90 _ 1.07 0.92 0.83! 14 0.93 1.62
Belorus I.I.1S 0.931 1 .05 0.97' 1.i1 0.84' 1.07 .0.83. .63 0.88 3.60Uzbekistan 1.29| 1.1s 1211 319 1.22! 1.07 j 1.19 1.08 1.7$' 2.18 j 1.46 2.16KCazakhstan 1.04. 1.03 0.99: 1.81 1.04' 0.94: 1.00 0.98; 0.99, 167 0.87i I-S5Gerl 163r1 1.729' t2 .;1.031 2.01 , 1.11 0.92, 2.02 OS'.1~~~ ~~~i63 iis --. 0 .7 3.2 .3 ~ .I ~ ,.~ Z 0.86- 7.10Azerbaijan 1.321 1.08 3.29' 1.12! 1.31 0.93 1.33 0.99 1.49 2.26 0.77 1.82Uthuania 1.36. 0.89! 1.27: 0.9S; 1.42! 0.82 1.291 0.84 0.84! 1.54 1.04' 1.79
_ _ _ _ _ ~ ..7 I - _ IMoldova 3 .17, 2.10 1.12 1.82. 3.08 2.16 1.01 103 1.82' 1.36: 1.76. Z7' 7, 2.10 1, 2 ,2 .0,. 1.03 _Latvia 1.32i 1.06j ! 1.28! 1.08 1.32. 0.99 1.28 0.97 1.39, 1.64 I 1.43 1.68
1.53 39. , __________ -.------. , ~ 34KXUDzstan 1.53.; 1.19; i I.25i 1.16! 1.53! 3.33 1.25i 1.091. 1.53 1.511 1.02; 1.40Tadjkistan i.45: 1.204'' 1.193 1.46' 1.13 1 1.45 1.09 1.42! 2.49, Q.87 2.00
Armenia 1.58! 1.35! ! 1.72' 1.33' i 1.58' 1.21 1 1.72' 1.18!. 1.56 2.49 ! 1.48 2.31:Turmenistan 0.98' 1.12' 0.93 3.31 0.95 I.05 i 0.89 1.20' 2.22! 2.50! 1 1.51 ! 2.24Estonia 3.50 310 150 1.13 1.30 3.03 T 1.49' 1.01 .1 1.47' 1.79! 3.71 2,14
19

Chart A4: Unclassifled CIA Data on USSR Hard Currency Balance or Payments
(million U.S. dollars)
19r5 19U0 1981 198Z 1983 1964 1985 1966 196? 1968 1969o
current eccumt balanee -4565 1470 -387 4293 4760 1434 IS? 1383 5116 112 4gerchidlse trade balneo -4804 1814 365 4468 4712 4*2n 519 2013 6164 264r -§ W
gxports f.o.b. 9453 27874 26254 31975 32429 32173 26400 25Ilt 29092 3l145 33600hpforto f.e.b. 14257 26060 27889 27507 2771m 274S6 25881 23098 22928 28518 35000
Net Interest -521 -1234 r1752 *1275 1052 ' -1163 *1482 -1730 -2148 -2575 n 2993Other Invislbles nd 760 890 1000 1100 1100 1100 1100 1100 1100 1100 1150
truafers
Capital account belnceo 6981 284 5430 2965 1541 -124 1669 1794 *738 1378 4348Chnge In gross debt 6786 792 1977 640 116 224 6804 681 5011 1990 4120
Officfll debt 1492 *280 *1370 96r 340 -375 463 391 480 -1240 252Coarcial debt 5294 512 3347 -1607 -224 599 6340 6420 4532 3230 386t
Wet chanve In assets held *163 -35 *166 2122 277 *664 1787 1595 -5Z 1119 *505In festem banks
Estimt ted exshinge rate *22 -411 -1457 -817 .1070 -688 3248 3322 4977 -2205 -1722affect
Het credits to LOUC m 950 870 2120 3200 2700 1700 4100 4800 5500 5465Cotd .sofa n5 1580 2700 1100 1o 1000 I800 4000 3500 S302 3665
Not errors ed oielsIeon 2416 -1754 .5043 -1328 .3219 -4540 -2006 -.'? -4378 -2550 ;1105
1989 figures preliminary.chaone In gross debt Includes altions to short-term debt.Met errors nd omiselen Includes hard currency assistmnce to nd trade with Comnmlst countrfes. credits todevloped bunte"n countries to fin nce sales of ofll nd other nonspecifled hkrd currency etpenditures. a wellas errors ea emissions In other lIne IteoI ot the accounts.
Chart AS: Unclassiried CIA Data on USSR Hard Currency Debt to the West
(million U.S. dollars)
19M 1980 1961 198 183 1964 196S 1986 198 19 1989
Gross debt 12.5 20.5 22.5 21.9 22.0 22.2 29.0 3S5.8 40.8 42.6 47.0C _ rcial debt 8.2 11.0 14.4 12.8 12.6 13.2 19.5 25.9 30.4 33.7 3.6Governmfnt and 4.3 9.s 8.1 9.1 9.4 9.1 9.5 9.9 10.4 9.1 9.4
goverrwnt-becked debtAssets In Vestern banka 3.6 10.0 9.8 11.9 12.2 11.5 13.3 14.9 14.4 15.5 15.0Wet debt 8.7 10.6 12.r 10.0 9.6 10.7 IS.? 20.9 26.4 27.3 32.0
198 end 1989 figures preliminary.Estimates of goverinent-b6kekd nd cown rciel debt are measured In current dtltre nd raf2ect fluctumtlon In* chonge rates. Cemmrciml debt also Includes estimates for prmdeisory notes held outside banks.
20

Appendix B: Labor Income
1. Published Sectors
In FSU national accounts, labor income-total wages, compensation for business trips(CBT) and net income of individual producers--is estimated for employees of state-cooperativesectors, collective farms and private sectors. It is also estimated for two groups of sectorsengaged in production and service activities. Total wages are estimated by adding a) regularwages, b) one-time bonuses included in the production cost, c) other types of wages excludedfrom regular wages, d) CBT, and e) bonus wages paid from the operating profit and the statebudget. Official I-0 tables include data on (a), so-called "other labor income" (f) which isestimated as (b) plus (c) plus (d), as well as data on net income of individual producers, thusmaking it possible to estimate total labor income as it is defined in FSU national accounts.
Because CBT is a business expenditure, it is excluded from labor income in estimatingGNP. CBT equals the difference between labor income and total wages received by employeesof state-cooperative sectors and collective farmers. Household Monetary Income and Outlays(HIO) tables include data on total CBT for USSR and individual republics."0 The USSR dataon CBT by sector were extracted from unofficial Goskomstat tables. To disaggregate theseUSSR CBT data by sector into republics, the decision was made to use ratios between CBT and(f) for each I-0 sector. Thus, total wages (WI) were estimated by adding (a), (b), (c) and (e)for USSR and each republic. The objective of the following discussion is to compare these totalwages with those reported in official Narkioz and HIO tables.
Official publications include data on average annual employment (g) and average monthlywages (h) for major state-cooperative sectors and collective farms."1 In Narkhoz editions, (h)is defined as the ratio between the sum of (a) and (c) on the one hand and (h)*12 on theother.'2 Thus, wages for state-cooperative sectors listed in Narkhoz (W2) can be estimated asg*h*12.l3 It is difficult to compare WI and W2 for four reasons. First, WI - W2 = (c).Second, as was discussed above, special bonus wages paid in education, culture and healthsectors are excluded from W2. Third, wages paid by collective farmers to seasonal workers areincluded in W2 together with state agricultural employees but are excluded from Wl. Fourth,Wl are known to include some wages of "unplanned" defense production sectors which areexcluded from W2. Despite these four caveats, the decision was still made to compare Wl andW2 for major state-cooperative sectors for each republic (see Chart Bi) below."4
'CBT is repotted in row 2c of the H10 table.
"Na,hoz for 1989, pp. 48-49 and 76-77, and Thad v SSSR, pp. 77 and 148-149.
'1Nar*hoz for 1989, p. 702.
"This source reposts average monthly wages excluding the foresty, an aggregated group called 'other production" and asonal a8dcultunrworkers hired by collective fams. Wage data for foresq are as repoatd in Thud v SSSR while those fotr eaonal worken were taken from1110 table, raw 3c; total wages for other production are taken as a tesidul.
'To ptresere the format of 1-0 tables, the abSthoz data weoe aggragated for a) infomation and other production ectors and for b) cultureand as.
21

The comparison indicates that for USSR as a whole W2 exceeded WI by 954 mr afteraccounting for seasonal workers (572 mr), by 1362 mr after accounting for special bonuses inservice sectors (408 mr) or by 4064 mr after accounting for other wages which are excludedfrom W2 (2702 mr). The discrepancies between the two sets of data on industry and stateadministration partially cancel each other due to the fact that industrial administration is treatedin 1-0 tables as part of industry. At the same time, puzzling discrepancies in the coverage ofconstruction, agriculture and so-called "other production sectors" suggests the existence ofmethodological errors in Goskomstat's compilation of wage statistics.
The analysis of data listed in Table BI leads to two conclusions: 1) in officialpublications, wages of other production sectors include construction wages (2.3 billion rubles)and mysterious other sectors' wages (2.5 billion rubles) which are excluded from 1-0 tablesaltogether, and 2) wages in the amount of 1.5 billion rubles paid by some agricultural servicesare excluded from 1-0 tables as well."5 These conclusions are corroborated by Goldenberg, asenior Goskomstat expert who was in charge of compiling 1-0 tables in the 1980s. He claimsthat agricultural water and industrial guards services have been the only two sectors listed inNarkhoz whose output has been excluded from I-0 and all other NEB tables.16 What remainsunclear, however, is whether wages of industrial guards comprised as much as 2 billion rublesin 1987 and whether other sectors which report to Goskomstat have been excluded from NEBsectors. In any case, assuming that Goldenberg is correct, total wages of state-cooperativesectors which report to Goskomstat were underestimated in the 1987 1-0 table by 4 (1.5+2.5)billion rubles
2. 'Unplanned' Sectors
In addition to sectors which report to Goskomnstat there are sectors in the USSR economywhich are missing from both official publications and 1-0 tables but which are included incompiling financial tables, including financial tables on the state budget and household monetaryincomes and outlays. As opposed to NEB tables, financial tables encompass the entire USSReconomy. Furthermore, these tables are known to contain the most complete data on financialflows between public and household sectors which are available to the State Bank, Finance andEconomic Ministries and other top FSU government institutions that guard state and partyfinancial secrets. Among these secrets are operating budgets of the USSR Defense Ministry,Ministry of Internal Affairs (MVD), State Committee on Security (KGB), the central apparatusof party and other political organizations as well as unidentified ministries of defense industries.
Goskomstat officials claim at conferences and in private conversations that they attemptto account for wages paid by all defense industries, including those secretive industries whichare run by the Atommash (former Ministry of Medium Machine-Building) and the USSRDefense Ministry. Their estimates are supposedly based on comparing the GVO data on secretive
aIWages of other sectors were estimated by subtracting the agricultural wage gap from the total gap.
I"See Lev Goldenbers, '0 Neobkhodimosti Perebalansirovki Mezhotraslevogo Balansa Za 1988 God. An unpublhhed paper, May 1991,pp. 2-3. The methodological error in compiliog wages has supposedly occurred because agricultural water and guards services have beenexcluded from Gvo even though these sectors ar registered as pail of materal production.
22

defense industries which are received through separate centralized channels with the GVO dataon defense industries which submit reports to Goskomstat. Unfortunately, Goskomstat officialsavoided details about their procedure for extrapolating wages of secretive defense industries.According to Goldenberg, these wages were estimated as 5.7 billion rubles in 1988. He asserts,however, that after adding 5.7 billion rubles to the total industry wage bill Goskomstat officialsmade the unintentional error by reducing this total by 9 billion rubles"7 To support hisargument, he notes that regular wages paid by those industrial sectors that report to Goskomstatequaled 98.6 billion rubles and that total regular wages in reality equaled 104.3 (98.6+5.7)billion rubles as opposed to 95.3 billion rubles estimated in I-0 and other NEB tables.1"
Goldenberg's observations are supported by the admission made by Goskomstat officialsin the beginning of 1990 that they had failed to account for around 4.4 million state civilianemployees."' Given wage estimates derived below, it appears now that these 4.4 millionconsisted of 3 million employed in secretive defense industries, around 0.9 million civiliansemployed in the Defense Ministry, KGB, MVD, and around 0.4 million employed in politicalorganizations.
According to the 1989 USSR Defense Ministry data, total military personnel cost(excluding pensions) equaled 9.8 billion rubles, including wages of the military--4.4 billionrubles, civilian employees 2.5 billion rubles and outlays on food and uniforms--3 billionrubles20 Wages remained approximately the same 6.9 billion rubles in 1987-1989.21 Accordingto published budgetary statistics, the combined outlays of MVD and KGB equaled 8 billionrubles in 1988.? Combined MVD and KGB wages equaled around 4.billion rubles. Totalwages of national security organizations equaled around 11.4 (6.9+4.5) billion rubles.
'L. Goldenberg, PPmv li Vol'nyi Ekonomist?", pp. 74. A paper submitted to Eto for publication. Ihe error in Goskomsat's esimatesupposedly took place as a reslt of subtracting non-industrial wages twice from the total wage bill of industral enterprises.
'OTbe amount 98.6 billion rubles was supposedly estimated by adding regular wages of industral enteprises (97.6 billon ruble),adminration (0.1 billion rubles), transportation organizations of indural enterprises 03.7 billion rubles) and industrial units of agriculturljoint ventures (0.2 billion rubles).
'See P,maa 28 January 1989, p. 1; Nanwozfor 1989, pp. 47-48, and N. Zhelnorova, "Statistila Stanovitsya Ob'ektivnoi.0 ArgmenM iFaky, N4 1990, p. 1.
2Tis was published in Argumensy I Faky, N45, 1990, p. 2.
"See D.Steinberg, 'Soviet Defense Burden: Estimating Hidden Defense Costs.' SoWet SWdies, Spring 1992.
nEkowmika i Zdzn', NIS, 1990. p. 7.
23

Chart B!: Comparison of Financial and Input-Output Data on Total Vages in USSR and Republics in 1987(mmi nes
MOWOXVA_ LAlVIA KVRGYZSTAN TADZIKISTAN APJ4D4 RIWCMEFA _ESTCMA 1153
___MM 1-0 Dima MMh 8-0 DIsa MM. 1-0 Dr"c, 14. 8-0 Doer, MG. 8-0 Oisc, 1MG - Dic. MG 1-0 DIsc. lklaft8oz 8-0 Dimc.I Totl 3183 3199 -33 3106 3039 58 2594 2567 19 2291 2276 8 3165 298 S8S 2082 2108 -106 1968 1956 5 28869 287173 952 kWkiy_ _._ 928 978 -58 1 104 1201 -97 708 725 -24 484 512 -28 8127 1228 -1 337 36S -28 70 70 3 801S57 102910 -13543AgrivAdm 643 306 359 277 291 __ 126 led __ 8 _____ 25934 F.resby __ 8 12 6 4 9 _ 2 __ _ 7821S Agi.& Faes 15 603 33 388 277 26 365 393 -36 281 304 -32 300 240 60 128 I"9840 200 148 461 29414 27605 12316 Truupmt __ 267 ;28 _ 257 245 222 _ 281 _ _ 203 __ 29987 CoeINmINA*860 35 40 _ _ 33 27 _ 33 32 22 3375aUyrsapatf& COm. 302 240 62 368 297 71 290 890 800 272 885 87 256 280 46 383 230 83 225 233 -0 333fl289 52809 Camisucljon 306 402 -96 348 324 17 296 353 -57 _337 376 -39 463 430 33 432 576 -143 236 286 -S0 3689 45478 45731 Trumb6 Didfrb. 239 253 -83 238 245 -7 888 172 1 6 1 83 M47 27 163 838 25 865 832 33 IS0 173 -23 89306 I870 6088It crPow lNM 43 86 27 59 28 31 32 IS 17 3 12 -9 45 24 22 27 I8 86 49 83 36 4519 8249 327012 Hoausn. ek. 76 76 0 835 835 0 68 68 0 60 60 0 94 94 0 69 69 0 79 79 0 9370 9370 013 HeuIIh.ec. I86 8I8 -2 137 838 -8 137 138 -2 530 832 -2 809 880 -2 882 813 -8 86 88 -2 12818 12316 -82614 EdwcAtin 301 304 -3 893 894 -2 302 304 -2 366 369 -3 283 285 -2 262 263 -2 82 828 -3 20707 2088 -188is 5C.dh,. 29 28 le 23 _ 28 25 II _ 7 _ 214216 Aet 80 I8 I_ 0 80 13 to 0__ _ 9 _ _ 84417 Ctd8ue& Art_ 39 40 -8 39 40 -8 28 29 -8 32 34 -I 42 43 -8 35 36 -8 26 27 -8 2987 3082 -96is science 40 40 0 8 l87 0184 14 0 79 7 0 Il8 Il8 0 64 5 80 43i 43 0 88398 8839 019 Bankc I? 8 II0
8 8 0 8 5 0 8 4 4_ 4 0 8 0 0 8 III 0 8606 80 20 Sfae Aiuin. I4 6 I 70 5 8 5 501- 9 62 54 54 47 7 58 58 71 32F 27 W35 46 8
MKb-Nao. e K8.ozyalsv S5S3 (official laor .d awmaag wage slatisk)
DGsa.-Discepancy (In. dffweren between MG mud 8-0)Discrepancy for tota and agrkladWa wages Is ac.sbd to account for s.onon washous whuo receiewgs frm collecdiveamu
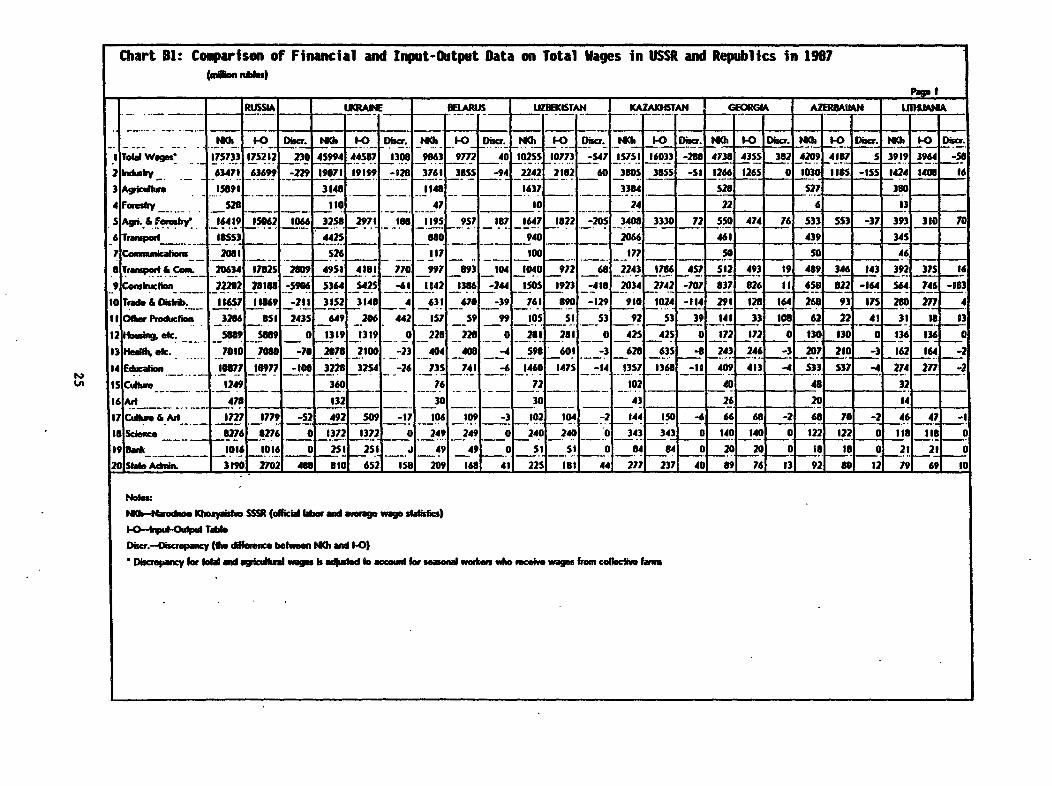
Chart Bi: Comparison of Financial and Input-Output Data on Total Wages in USSR and Republics in 1987
RU55bA _ _ tURAIE _ELAiJS UZIUCISTAN ICAZAKHSTAN __ERG _ AiIAI4 LIDUAMA. _ -- _ _ __ .__. _ = ................. _.___. _._ ....... __._ __._ _ _
lUG, 10 isc. lUOu Ch 3-0 D=sr H% 3-0 Dis= HM 6-0 D=s, MCI 1- Dwc, MCh 1-0 Dic, MOu 1 Dsc, MG 6-O Dmc,I Toma Wages - 15733 17S212 230 45"4 44587 1308 9063 9772 d4 1025S 10773 -547 15751 16033 -218 4738 4355 382 4209 487 S 3919 3964 -5826ncy - -- 63471 6369 -229 19071 19199 -028 3761 385I 94 2242 2162 60 380S 3855 -Sl 126 1265 0 1030 lies -355 1424 3041 163 Agklchne 156591 3145 1148 1637 3384 528 - L S27 3804 Foems _ry 528 _ 110 47 10 2__ _ 4 22 2; 6 135 Api. Fos I" 1649 35062 1066 325 2971 tB8 119S 957 187 1647 1822 -205 3406 3330 72 550 474 76 S33 S53 -37 393 3_0 706 Trmpd__ 18553 4425 So_ 50 940 20D6 461 439 3457 _C_ ._uuatio _ 206= S26 I? t0 _ 1 so ___ o0 46a Trpd & C.__ 20634 17825 2809 49SI 4181 770 _9 693 104 1040 972 68 2243 3766 457 532 493 f9 489 346 143 392 315 169 oskuion _ 22282 28115 -5906 5364 542S 461 142 1336 -244 1ss0 1923 _-460 2034 2742 -707 637 826 1 6S8 822 -164 54 746 -l0Glo Td&Disbh. 116S7 11669 -211 3352 3148 4 631 670 -39 763 890 -329 910 1024 -114 291 126 164 268 93 _S7 280 277 4I IO6ierPoduc6ion 3266 856 2435 649 206 442 15 59 99 lO _51 S3 92 S3 39 141 33 _OS 62 22 41 33 18 13I2 H _Ml dec. _ 5669 5689_ 01319 1319 _ 221 228 _ 0 281 281 0425 42 03 72 172 0130 130 03136136 013 Hedst ek-. 7010 1080 -70 2017 2100 -23 404 406 -4 S98 601 -3 621 635 -6 243 246 -3 207 260 -3 162 66 -214 Edcaon 3067 10977 -606 3221 32S4 -26 73S 741 -6 1460 M475 -14 13S7 1360 -11 409 413 -4 533 S37 -4 274 277 -2e 1!." Is Cidli 1249 360 76 72 302 __ 40 4= 3216 Art 478 132 30 _ 30 __ 43 26 20 64_ _Cuure Art 1727 1779 -s2 492 S09 -17 106 109 -3 102 104 -2 144 350 -6 6 -2 68 70 -2 46 47 -10 Sdince 0276 8276 0 1372 1372 0 249 249 0- 240 240 0 343 343 0 140 140 0 122 122 0 lie lie 0_9. _ 1016 11016 0 251 251 J 49 49 0 Si Si 0 84 64 0 20 20 0 18 Is 0 21 21 020Shia Abm 3190 270 48 810 652 158 209 168 43 22 t 44 277 237 40 85 76 33 92 60 3 79 69 0
M N-tmoduo Kh*zV"m SSSR 5 oll5i5il lbo ad anv ea wage datfics)IO-b-lpe-OuI;xd TableDOiu.-Di.crePany (6. Ehrec bewe MMa &M -0)* DiscyepWany for fWkl and qrlad _g bs a4sd boaccowd Ifr eason wownx _4.cvewags fnxn colectife

Chart B2: Comparison of Financial and Input-Output Data on Total Profit in USSR and Republics in 1987(mili nbles)
_IA U_RADE WAM _ UZIEKISTAN KAZAW KSUTAN C AA uInIA._ 1-0 DI-D. _Gi 1-0 Duct. .8 .h 1-0 D__ NM 1-0 D._ . _-o Disc. mm .- D_T. mm 0 . 1-0 Doil.I Tod_ P_O_I 122600 1398S6 -172.6 38084 38727 -643 1S57 11604 -1027 5645 6194 -549 8106 8420 -314 IB40 2022 -182 2668 3016 -349 3119 3422 -3032 hIAsfy _ 74800 83011 -8211 20437 21992 -1555 S772 6239 -467 2357 2306 Si 3877 3642 235 ItS 1213 -398 1120 1274 -154 1448 1701 -2533 Ag|uilah 13800 12989 811 7086 6602 484 2499 2302 197 1076 564 512 1173 880 293 227 121 106 572 46 108 85 729 164Cambmihon 11100 1295 -1156 2724 25s1 153 829 844 -1S 546 411 133 857 911 -s4 122 168 -46 319 331 -12 247 986 60
S rTqmpof t& ConL 11200 14" 1 -3791 3678 3111 567 436 594 - 158 785 551 234 1167 1190 -23 357 73 284 216 225 -10 208 195 126 Trad &t isfb. 4700 6662 -1962 2300 2379 -79 612 739 -127 578 571 8 75 725 31 178 334 -156 261 383 -123 250 290 -407 PnuIWC ce 248 49 52 _ 4 1 -36 32 23siConuuiSe,v. 503_ 63 27 4 20 369 7 + a 1267 -1267 751 353 398 1I? 102 II 79 45 34 45 37 -_ 6 22 34 55 30 4 59 33 26IS Oth s Se*ax 7000 7969 -969 110 1719 -611 317 784 -467 287 14 -1460 231 1035 -04 112 92 20 126 309 -163 10 28 -1
Chart B3: Comparison of Financial and Input-Output Data on Depreciation In USSR and Republics In 1987(nOan ndAn)
cn _| UKRJUNERUSSIA UKRAW _ ELARUS | UZEISTAN KAZAKGHSTAN AGEtORGIA | EU93IN | LJRIJAJ_f 1-0 Di= IN. I-O ct. ___ 1-0 N 1-0 Dt. t I t-. - I 1-0 Dt. IIt -0 III-i-.I Toa Deecatiaon 22268 9094 -75826 19341 24215 -4a74 4943j 2140 4697 -2556 _ 8797 1380 1647 -267 1769 2227 -4s8 20612 riAnby 400S 43682 -3967 9913 10427 -514 2165 57S 1604 -1030 3021 557 612 -SS 955 W99 -43 723
3 Agicdhgeu 8760 10883 -2123 4120 3634 486 801 796 721 7s 1795 262 207 56 200 246 -47 4284 Cor clion _1971 7034 -5063 1142 1292i -149 323 317 412 -96 567 119. 0 119 129 223 -94 139!Tramport 6 Conn 3438 15099 -11661 2584 357 -973 662 197 705 -508 1539 262 3S9 -77 280 373 -93 2696TradebDidrb. 1341 3052 -1711 479 671 -399 139 | 88 190 -103 279 44 49 -5 2s 46 -21 637 Persnnl C -i 233 23 9 _ _ 6fCAnumuwI Serv. 1747 - 478 _ -. 64 32 469 7 + 8 1980 9243 -7263 473 2821 -2343 45e 87 620 -533 959 41 249 -2081 52 211 -S9 2SIIA Other 773 9101 -8328 62S 1806 -1181 1 4031 82 444 -362 6361 651 171 -1061 128 1301 -2 88
NM -Nu'oho. Khoyalslo SSSR (aiael lbor and arage wages stsics)143-,pat)4s4 TableDiscr.-Oisaeparcy (the ffernce bewee NKt and 1-0)

Chart B2: Comparison of Financial and Input-Output Data on Total Profit in USSR and Republics in 1987
Pap2M_ _DOVA LA_V| A _ KGYZSTAI4 TADZKISTAN ARMENIUA TLVKJ* ESTONIA USSR
_ N -0 Dic MM 9-0 Dir tNu 9-0 DiDcr. M0 -0 D_r MM I-0 Dee M F-0 Ds. _ 1-0 D.ic. AI. 9-0 Disc,.I Toal Profit 2551 2813 -262 2427 2662 -23S 1292 1426 -134 9959 1131 20 1560 1834 -274 1469 1378 91 1472 1702 -231 224000 226996 -29962 twndusr 1104 1186 -83 12d1 1395 -954 586 672 -86 421 475 -S4 981 1156 -17S 476 531 -56 706 8S6 -149 116669 123029 -113683 Arici.i_r 877 822 55 223 319 -96 348 321 27 307 226 62 107 93 14 589 399 199 382 29S 87 30311 27113 3194 Colnsucion 138 122 16 196 953 43 902 109 -7 113 118 -S 106 183 -77 88 123 -3 82 55 27 18171 20074 -1903S Teaupod & COWL 96 908 -13 444 297 948 950 113 37 107 93 14 143 138 5 940 933 7 IIS 160 -4S 22941 22630 3116 Trade&Disfrib. 181 183 -1 223 278 -55 80 87 -7 99 94 s 130 141 -1I 93 95 -3 96 138 -42 14435 12124 231t7 PernalCar 14 14 _ _ 9 17 23 6 7 1250 8 Cenum_ Isav. 22 30 _4 _ 4 1_ 9 8_ 23389 7.8 __ _ 36 29 _5s 44 2 ?4 0| 95 __8 7 _29 _916 9|3 _427 95 17 9 7 Is 8 7 3588 1946 1642
Ito 0erSectors 79 372 -294 461 99 -95 36 196 -80 74 909 -35 66 990 44 67 9s 29 75 191 -116 97272 15061 2219
Chart B3: Comparison of Financial and Input-Output Data on Depreciation in USSR and Republics in 1987(nuilmon ahles)
- ________ _______ _______ _______ _______ _______ Page 2MOLDOVA LATVIA KYRGYZSTAN _TAOZU(ISTAN ARMENIA__ TURKMEIA _ ESTONIA USSR
NKh I-0 Dcta. thO I-0 DOscr. Wh I-0 Dner. WIh 11-0 Discr. 14Ch 1-0 D"cr. tIC 9-0 Dscr. IN" N -0 Discr. liaihoz 1-0 Discr.I Total Depreciation 1235 9480 -24S 1092 9693 -601 773 996 -223 703 970 -267 446 1157 -711 973 1305 -332 898 1903 -205 125629 9S4087 -284582 Indsry 406 477 -11 467 s29 -62 288 327 -39 280 324 -44 144 546 -402 417 4s2 -3s 384 4S9 -75 66924 66192 7323 Agricltwur _ 473 378 95 976 273 -97 234 IS7 77 969 943 26 920 96 2S 18S 182 3 236 189 55 13803 9882S -50224 Combuclion 94 00 14 91 77 14 84 61 23 98 118 -20 44 92 -49 119 158 -391 571 46 111 0366 90783 -4t7S Trasport T C on. 139 202 -63 176 331 -S9 82 144 -62 77 123 -46 67 142 -7S 112 280 -1I6 1351 173 -38l 20273 23674-4016 Trade 6Oistrib. 40 SS -16 36 55 -19 24 39 -15 20 33 -14 22 31 -9 22 30 -8 18 27 -9 29S4 4672 -17987 Penonal Cafe 7 8 . 6 _ _ S 3 ___ 6 456 _a cnmuna Ser,. 32 33 -4 912 _ 29 _ 97 30 29439 7 .8 ___ 39 160 -929 49 993 -9531 9!9 9 40 lB 144 -925 27 939 -5 2 9 -79 3637 -909 339915992-2
_0ll OerSectors 4S 121 -83 21 954 -929 421 909 -67 42 6 -44 23 920 -971 98904 -6 34 89 -7 7990 14031 492
Noi:
MlCh-Nroce lhoe loxyaiv SSSR (officialbw and arage wa statisics)
1-O vw-Ouhu Table
DiOcr.-Oisapancy (On dime between th and -0)

Appendix C: Production and Flnancing of Services
For the purpose of converting official 1-0 tables on material production flows into theSNA format, IDS collected the following sets of data on services:
1. 7he total volume of produced services.
IA. Planned sectors: The total output of planned service sectors was estimated as currentmaterial expenditure and depreciation plus labor and nonlabor costs and profit. Data on materialexpenditure and depreciation were extracted from 110-sector 1-0 tables. Data on labor costswere estimated as the sum of: a) total wages (see Appendix B), b) income of collective farmersengaged in service activities, and c) special bonuses paid in education, culture and health sectorswhich are excluded from regular wages. Data on (b) and (c) as weln as on nonlabor income(social security deductions, profit and other income) were extracted from unofficial Goskomstattables on the production of services by sector. Other income consists of regular outlays onservices as well as postage fees paid by social security and welfare organizations to send moneyorders by mail to pension recipients (this was first noted in Peshekhonov, "NetsentralizovannyeIstochniki Finansirovaniya Obshchestvennykh Fondov Potrebleniya," FYnansy SSR, Nll 1985,p. 32).
lB. Postage fees: In preparing previous estimates, IDS mistakenly omitted these postage fees,thus inadvertently underestimating other income and hence total output of health services. In theofficial statistics on free household services--also known as 'social consumption funds'--thesepostage fees are hidden as part of total outlays on pensions. Data on these fees were extractedfrom the unofficial Goskomstat table on financing of social security and welfare by the statebudget, enterprises and collective farms.
IC. Unplanned sectors: In official I-0 tables, the output of the state administration sectorexcludes activities of two "unplanned" sectors--a) the central apparatus of political organizationsand b) the police. The decision was made to add outlays on (a) to the official estimate for thestate administration and to list (b) separately as part of other sectors. Since no data on (a) areavailable, the total output of the state administration was estimated as the sum of state budgetoutlays on state administration and membership dues (see below). Outlays on (a) were thenassumed to equal the difference between the total and published output of state administration.The total police budget was officially reported as 8 billion rubles in 1988, 8.6 billion rubles in1989 and 9.2 billion rubles in 1990 (kzvestiya, September 26, 1989, pp. 5-6; and the article "UOpasnoi Cherty" by Deputy USSR Finance Minister Panskov in Ekonomika and Zhizn, N15,1990, p. 8). According to informed FSU officials, around 90-95 percent of residual All-RepublicBudget outlays are allocated on the police. All-Union budget outlays on police were derived asthe difference between the total and republic budgets. It was assumed that most All-Union budgetoutlays on state administration and police were spent on the territory of the Russian republic.
28

1D. Subsidies: Some services, particularly housing, urban transportation and pre-school andyouth facilities do not receive sufficient financing from households, requiring subsidization bymeans of financial support from enterprises and the state budget. At issue is how to measure thegross and net output of subsidized services: to treat subsidies as losses that must be chargedagainst profits or as free services in the same way as free education and health. It appears thatthere is no definitive consensus among experts on this issue. In preparing this study, the decisionwas made to treat subsidies as free services. The decision was based on the observation thatsince subsidized services were not profit-seeking in a sense that it is regularly understood theseservices in effect are no different from other free services provided by enterprises andgovernment.
2. Purchases of services by households. Data on these purchases were first extracted from theofficial Goskomstat table "Household monetary income and outlays" (HIO) and then adjustedin accordance with the classification of services used in compiling the official statistics on labor,wages and I-0 flows.
2A. Housing and utilities. The HIO table contains data on the combined purchases of housingand all utilities. Data on household payments for housing services (housing rent and charges forall types of dormitories and hotels) and utilities (power, gas, water, sewage, maintenance andcentral heating) were all extracted from unofficial Goskomstat tables. Payments for "material"-type" utilities-power, gas and water--are excluded from estimates of total "non-material"-typeservices because these utilities are accounted for as household purchases of material wealth inofficial 1-0 tables. The total for "non-material"-type utilities also can be derived as thedifference between combined outlays on housing and utilities reported in tables on HIO andpurchased services (see Chart C2).
2B. Personal care serices. The HIO table contains data on the combined purchases of totalpersonal care services (3436 mr) which are excluded from the retail trade statistics on goods andservices. In its previous estimates, IDS mistakenly assumed that all these purchases must beadded to the 1-0 data on household consumption. However, a careful analysis of unpublishedGoskomstat tables on personal care services led to a conclusion that these purchases are dividedinto those treated as the industrial output (large automated photo laboratories and laundries) and"non-material"-type services which are excluded from official 1-0 tables on production flows.Moreover, large automated services accounted for as much as 70 percent of total householdpurchases of photo and laundry services.
For the detailed published data on particular personal care services purchased by bothhouseholds and organizations one must refer to Narkhoz editions (the 1989 edition, p. 150).These published data are difficult to use for two reasons: it remains unclear how to disaggregatedata on other unlisted services--1811 mr in 1987 and 2645 mr in 1988--into those included andexcluded from retail trade and how to divide total purchases into those made by households andenterprises. According to Koryagina (Mezhotraslevye Svyazi Bytovogo Obsluzhivaniya, Moscow:Legpishcheprom, 1983, p. 118), the share of purchases made by enterprises in total purchasesof personal care services was particularly large for laundry and photo services where the share
29

reached 77.6 and 12.5 percent respectively in 1980. For other services--barber shops, bathhousesand rentals--the share was 0.3, 2.7 and 4.1 percent respectively. According to the unofficialGoskomstat table on personal care services in 1988, the share for the above listed services was61, 12.4, 0.5, 3 and 3.5 percent respectively. For gas heating and transportation, the share was0.7 and 32 percent respectively. Other "non-material"-type personal care services--religion andcults, delivery of goods in rural areas, management of ex-village markets and other--accountedfor 34 percent of all unlisted personal care services.
2C. Transportation and communications (T&CQ services. Data on T&C services were extractedfrom the HIO table. In the official table "Purchases of household services" (see Charts 1 and 2),data on these services exceed those reported in the HIO table. It is assumed that the discrepancybetween the two sets of data equals the amount of passenger transportation services purchasedby organizations. In this respect, it should be noted that one issue pertaining to passengertransportation that remain unresolved is how revenues received from foreign tourists are enteredin FSU national accounts. It is known that all revenues from foreign tourists are entered onseparate foreign trade banking accounts. At the same time, internal transportation agencies arepaid in rubles for performed services regardless of the nationality of their passengers. In allprobability, purchases made by foreign tourists must be excluded from the HIO table butincluded in the table "Purchases of household services." If this is the case, than the discrepancybetween the two noted sets of data may include purchases made by FSU foreign tradeorganizations on behalf of foreign tourists.
Another controversial issue is the size of subsidies on urban transportation financed fromthe state budget. As compiled in unofficial Goskomstat tables, operational losses incurred bytrams, metro, trolleys and buses in urban centers amounted to 326, 48, 239 and 387 mrrespectively in 1987 with total losses amounting to 1 billion rubles. In theory, these lossesshould have been charged against profits made by railroads, taxis, Aeroflot and sea transport.However, as reported in the fourth quadrant of the 1987 110-sector 1-0 table, the size of otherincome in the transportation sector was estimated as minus 0.9 billion rubles. This leads to ahypothesis that losses are not charged against profits in passenger transportation. The hypothesisis corroborated by Goldenberg, one of principal authors of the 1987 I-0 table. He notes that thenegative number was indeed derived by subtracting all known costs and profits from the totaloutput of the transportation sector where the I-0 data on the total output was compiled by addingall sales of transportation services. If the hypothesis is correct, then subsidies must be accountedfor as government purchases of transportation services. PSU planners followed the sameapproach when they estimated the total volume of transportation services (Gosplan SSSR,Metodicheskie Ukazaniya k Sostableniyu Gosudarstvennyki Planov..." (Moscow: Ekonomia,1980, p. 670).
2D. Education, culture, arts and health services. Payments for pre-school facilities weredivided into kindergartens (the education sector) and nurseries (the health sector) using a 98:2ratio established in the mid-1980s (Ministerstvo Finansov SSSR, Gosudarstvennyi Byudjet SSSR,1981-1985, pp. 58, 61). Payments for unaggregated services were divided between a) health andsports and b) banldng and legal services using a 50:50 ratio derived on the basis of data
30

published in the official table "Paid household services" (Narkhoz for 1987, p. 447-448).Services offered by cooperatives (70 million rubles--from the HIO table) were divided amongpersonal care, arts and health services using a 85:9:6 ratio based on the 1988 data (Ekonomikai Zhizn, N12, 1990, p. 5). Total purchases of health services were estimated by adding purchasesof recreation, nursery, health and cooperative services.
2C. Other household purchases of services. According to the official practice, insurance servicesare excluded from the total volume of purchased services. The decision was made to estimatepurchased insurance services as the difference between total outlays and income of householdsconnected with insurance services as compiled in the HIO table. Purchases of banking and legalservices were treated as consumption of banking and administration services. The HIO data onmembership fees were used in the estimation of the total output of the state administration sector(see item 1C above).
3. Purchases of services by enterprises and collective farms from profit and other income.
3A. Household services. Data on these purchases were extracted from unofficial Goskomstattables on free education, cultural, health and social security and welfare services as well as onhousing subsidies. These tables are described in detailed in Metodicheskie Ukazaniya..., op. cit.,pp. 666-671. These tables have been prepared annually using a standard procedure designed forcompiling the officially published data on free household services. In accord with the officialpractice, purchases of household services by enterprises and collective farms are estimated ascurrent expenditures which exclude a) social security deductions, b) postal fees (see item 1B),c) transfer payments (pensions, allowances, stipends and all types of education vacation pays),and d) capital depreciation charges. In order to preserve complete consistency between theofficial statistics and I-0 data it is necessary to add (a), (b) and (c) to the output of free servicesfinanced by enterprises and collective farms. The problem, however, is that data on (a), (b), (c)and (d) are compiled for estimating the total volume of particular free services regardless of theirsources of financing. Thus, the decision was made to derive estimates of these data in proportionto the share of purchases made by enterprises and collective farms in total current expenditureincurred by free services.
3B. Business services. In addition to household services, enterprises and collective farmspurchase business services: "non-material"-type personal care, passenger transportation,communications, research, banking and insurance and advertisement. Since purchases ofadvertisement services were insignificant in size in 1987, they were not estimated in preparingthis report. Personal care and transportation services were discussed in items 2B and 2C above.Purchases of banking and insurance services by sector of industry were extracted fromunofficial Goskomstat tables. Data on purchases of research services were derived as a residualafter accounting for all other purchases of services included in other income of profit-seekingsectors. Likewise, data on purchases of communications services were derived as a residual afteraccounting for all other purchases made by nonprofit sectors.
31

4. State budget. The general approach developed in this study was to derive state budget outlaysas the difference between the total output of particular services and purchases of these servicesmade by households, enterprises, non-profit organizations and collective farms. It was difficultto make direct estimates of state budget outlays on services for three reasons. First, the detailedAll-Union budgetary data on municipal scrvices (utilities), T&C and science were not availablein preparing this study. Second, it remains unclear how to disaggregate All-Union budget outlaysamong individual republics. Third, state budgetary statistics contain data on current and capitalexpenditure where the latter is practically impossible to divide into capital depreciation and netfixed investment.
Estimation results on state budget outlays are presented in Charts C6, C7 and C8. Resultson free services indicate that state budget outlays on education and health are underestimated in1-0 tables by 2.5 and 4.5 billion rubles respectively as a result of using the official statistics onmaterial and labor costs in these sectors which causes the supply of these services to be smallerthan financial statistics indicate. It can be speculated that the major reason for the discovereddiscrepancy between the budgetary and 1-0 statistics is that the latter exclude "unplanned"sectors performing education and health services,such as military schools and hospitals.
The derived state budget outlays on utilities represent government purchases of municipalservices. In T&C and research sectors, these outlays represent government subsidies on urbantransportation, TV and radio broadcasts as well as government purchases of hidden nationalsecurity services. It is interesting to observe that these outlays are 1) disproportionately large forthe Russian republic and Kazakhstan, which were more militarized than other FSU republics,and 2) negative for many republics. The negative amount indicates that uses of services onrepublics territories exceeded the internal output of these services. In other words, the negativeamount indicates that many republics were net importers of T&C and research services, whilethe Russian republic was the net exporter of these services.
32

Chart CI: Total Purhased Serices in USSR and Repuiblcs In 987
- P C | ~~~~T - p - - C gk PMS.ah CAMI T ____ICagM.c. I swnO.~mu1bu&Auts Towm I b R A L3I8ta Edc. 18afifl* Ofum TFab 9bpsl-
P/C TOtlW P/C Toa P/C ToW I P/C Tow 1 PiC Tobl Pic Tol P/C Totlw PiC Tom PiC TotaI P=& = i=aUSSR 43.1 12338 60.9 17166 112 3290 1 I.S 3231 7.1 2000 9.9 ~I 0.5 129.6 671 IO 252 73I7 1447 419 258 1551 53613 28168panda 452 6571 70.0 10172 13.5 196 14.4 2092 8.1 1162 8.9 _ 66.8 6.1 959 25.6 3720 914 19i 123 1123 3034S 145311
1aim 44. 236S S4.5 2792 11.6 594 9.5 486 7.2 369 9.6 4S21 0.4 22.5 10.6 543 32.9 I68M 23a 13 60 306 5004 51201Boeb" 546A SW7 4.2 546 12. 127 IS. 103 7.11 n7 9.1 92 C.5 45 5.3 531 1.9 201 54 24 13 S. 1911 10011Uzbe&ibn 27.9 531 35.4 674 4.4 I4 4.5 86 3.3 63 48 91 t3 4.9 1.9 36 13.3 301 42 16 9 101 2 1S2K1a&Ww 38.5 62S 5832 45 0.2 166 0.6 172 5.5 69 5.5 89 CA SJ 3.4 55 25. 413 84 32 16 6627591624"
S3.9 28 72.3 381 10.1 S5' 62 33. 1.8 462 21.4 113 1.3 7.1 13.5 71 102 51- a I S St ltfe _26Ipm Mjan 30- 20946.3 315 7.3 50-S1. 35. 3.9 27 4.5 31 0.3 1 3.64 _- 1.43801 4 4 30 SM,_6311LilhAm SIA 213 60.0 21 12.9 47 13.3 483 8.2 3, 17A 64 4A 36.9 32 23.3 31 20 9 6 2 04 3641
______ 39.9 167 40 167 9.0 3e 6. 271 5.6 4 13 47 03 .4 5.6 23 38.3 130 25 7 4' 22 62. 4185w ___L_ 515 IS7 76.0 201 16.5 44 11.9 311 10.5 28 176 4r 0.6 1.A 9.9 26 3J.S 0 id 3 3 24 674 26al
w ICynt 33.9 140 40.0 166 6.4 27 5.8 211 4.9 22 4J 19 0.3 2.0 4.3 20 IJJ 61 12 6 3 24 S21 41431Ta*kdsbn 29.81 133 29.8 143 4.0 89 4.0 19 3.2 15 2.9 14 02 1.1 3. 89.3 tl 6 3 2 22 435 497Aauagnia 423 141 49.5 169 _8. 35 221 5.6 191 1J 40 IA 4.8 4.7 16 23.4 83. I A 21 2058 34 2
Tua*east. 31.6 103 423 142 S.5 11 5.1 17 4.3 141 2 9 0.1 0.3 2.6 9 213 73 3- 3 2 22 422 3361Es__ _ 15.9 111 79. 124 1.2 24 20.3 32 11 17. 20.3 32 1.5j 2.4. 5.3 9 365 57 9 3 3 1i 4461 IS|umsr 5 12 _-1 6 5 31U I 8 . _ 2 S 4 3|360 0 3
Note: PC- Per CAit Epluenrr-1h d _heme between publbbe daht fort USSR and 15 r.pMli

Chart CZ: Ceuparisin of RIO and Published Data an Purchase of Services In USSR and Republics in IWB
_________ ~~Pmaona Cm, r.fhin Cofmam*a1leu HaIn timihie Cud?uw & Arks Touim&R ea,I Ecaclion Ohm ..Smi.a TCAI Su*.'m________ 11M0 Pub R 50 . 01ff. db Ds HI3O 5'ib. Di*.. HO mb. ff1. HID Pub. I D,uO. Mo l.b DiRf. ti " * VA 0 HO .h. D 5im HID . MRs.Us9t 343& 3716 280 14738 1736" 2423 3290 3290 Di 12157 a038-58 5944 2000 56 2835 4676 3843 1675 1447 -231 670 235 1688 40150 44991 4212Rwsla 1890 2043 152 8632 10)72 154-3 1971 1962 -9 746 812 15 1167 1162 -4 1667 2252 585L 1068 914 -554 368 1503 1136 24230 2532 3S91Mai~m 696 154 58 2398 2790 392 589 594 ___ 200 2171; 170 323 369 46 649 1035 3851 277 232 -45 121 488 368 705 8433, 33Y9Salons 5~~~243136310481 54 6531283127 - 395 303' -92 69 72 2 96 145 50~ 71 54 -17 269"73 1392 1453 90Wmektu 13ti I4" 1 637 674 37 85 84 -2 .137 380' -Si 66 63 -3 67 127, 60! 33 42 9 32: 129 98 14963 1649 159Kaa&aIn 153 164 133 781 945 165 159 166 1 626 5851-41 93 89 -3 81 144 63! 90 84 -4 30' 12.0 020102297 2BGeorgia 70986 7340 313 41 54 5 1569 86! -52 39 46 7 53184 127 21 a-13318 74 56 176 9203144Azmbtaijmn 63 6515 282 315 33150! 5010 149 136 -12 24 27 2 23 56 32 9 6 -3! 740 33 607-I69195Lilaz6 5963 13 218 35 47 d7 1 79: 135! -44 27 30 3 3496 62 23 2 -3'1314433 5631655 92MIkva 40, 4313 153 167 14 38. 381L0 12Y!'157- 29 20 23 4 29 70 4 1 25 2$ 0 9 34 26 441t S8e:1II1LahiAa 48 5214 579 203 22 44 4410o 1341 131 3 30 25 -2 23 73 51 16 14 -2: 10 331 231 483 574 92Kpgtnt __4_ 43 3 555 14 I I 27 27i A 89t 82 -7 3 9 20 1 22 39 59 12 321 0 15 35 24 373 424 501
___ W=27 2912 136 143 7 20i 19. a 801 64 24 16 15 0 22 22 a 1 6 -1 7 2921 323327 5Aimenla 26 21 2 163 169 6 38 38 1 114 102 -32 16 19 3 19 5 31 1 5-23 2 39 450 65Tw&mri,Iu, ~28 35 3 I1s 14 27 i9s8 a 94 90 -5 14 14. 3 12 18 6 7 U 1 6 2 21 26 39 5EsGanla 30 32 2 104 12 20 a...!..?1. a- 8 6 i 6 1
tNoie H10-From rnffkcil tbb obwAcho3d Mo.mfwylncouwaWrd osdfayto.-sm s pLblIAmble hd PI. 7w ated HIome"ea Smiious (Chat CI), nmd srnoiswka inudd in mfW bades
DAl-71. *RHewm be)..thu psM6isd md 110dM

Chart C3: USSR and Rexitlic Budget Outlays on Household Services, Science and Abdillstration
_USSIA CLA MELA UZIEC K&Y |G6R | H 3H _OK LAW IMG TADZ ARM TL__ EST_ AllRa. AIl-Vnion TW4
ITOTAL CULMAYS 27933.0 9171.1 2087.4 3555.9 MOSS. 1290.3 1359.8 950.S 917.6 668) 803.1 838.7 826.3 6964 432.2 5S037.3 254383.4 6047S.72 Edszcationi, CulIIw & Ikoadmt 15636.6 5251.0 1240.5 2205.3 2239.9 719.3 845.9 589.90 545.3 372.? 514.9 537.5 514.6 44S.2245.1 31983.9 4026.6 36010.53 T*W Edma6on 14492.8 4765.6 111 SA 2153.1 1956.4 621.7 748.6 512i:492.6 319.1 463.4 496.1 436.6 395.0 20.5 29176.0 2791.5 31967.54 Schooh 10112.2 3223.1 758.8 1616. 1365.7 438.2 539.9 3403 357.3 214.6 327.1 389.7 306.4 3D5.3 137.2 2D43312 1195.5 216287S CaraerAmwwcedt 4380.6 1542.5 356.4 541.A 590.7 183.5 208.7 172.2 135.3 104.5 135.6 107.0 130.2 2J 0.I. 3 8742.Si 1596.0 10338.6 Cuter 952.2 298.6 74A 59.6 98.6 4S.8 55.7 43.1 29.1 21.1 15.1 16.2 35.1 1t.7; 16.2 1781.5 26.9 1808C4T thdi&Ads 191.6 186.81 SW4. 67.8 184.9 51.8 41.6 37.3 23.7 26.5 36A 24.6 42.9 31.51 28.3 1024 1523.8 2550.e IV arid Ra. Il 1.6 IS7.4 44.6 S14 150.4 42.5 36.3 32.0 19.5 23.3 28.0 18.8 34.3 24.7i 249 79RJ 12514 2051.19 Pedca 57.0 7.0 o.o 8.3 12.3 3.1 0.3 3.8 I.J 0. 4.0 2.8 3.5 3.0 0.0 103.5 89.5 193.
10 Toaler 13.3 13.4! 3.7: 4.9 13.3 3.7 3.0 2.7 1.7 I.l 2.6 I.8 3.1 2.3 2.0; 73.4 103.6 177.0II OtturAft 9J 9.0 2.4 3.3 8.9 2.5 2.0 2.8 1.1 1.3 1.7 1.2 2.1 1.5 1.4 49.8 79.3 129.112 1.Mb ai $Pak 9380.3 2935.9 612.3 982.0 937.7 336.5 304.0 2623 255.6 202.4 202.0 226.6 192.7 17D.6 1I18. 171 39A 1026.9 181463
n 13 Heal"m 934S.8 292S.4 605.3 975.0 930.9 325A 290.6 2563 253.4 198.9 200.4 2243 18J.3 169.3 113.2 17002.1 996.S1799M.614 Sport 34.5 10.5. 7.0 7.0 6.8 11.1 13.4 5.1 2.2 3.5 16 1.1 5.4 1.3 5.3 117.3k 30.4 147.?1S Scidsu 474.1 27S.S; 76.0: 67.2 69.6 78.0 43.0 31.2 32.0 38.6 23.3 _1.5. 35.8 16.6 254 1305.6 14284.5 15590.116 Slae. Ad*I*tkAdm 1089.7 343.41 79.S I8. 131.3 48.5 37J 342 31.2 263 29.2 27.6 29.7 30.6 1.6 2042.8 38.0 2923.31701w OMe im det.) -013!2.3 3. 3 79.11 1SA 1265 1072 1292w 332' 53.5 28.7 33.7 2i_ 54.01 33A A 2sU16 5219A 7805.0

Table C4: Free Services, Pensions, Allowances and Stipends in USSR and Republics in I9W7Paie al)
PIsbk Ar. Balm. 3Mb. 1(A. Gue. Am. UL Md. Wt. KhK. T"& AM Twk. Est 1S
T0AL 93.60 29.64 679 7.14 JA6 2.60 2.5 2.4 2.15 185 1A3 "S 1.52 .3d t.17 162.0 -0.0EbOn_ _ 21.1 7.03 I.S3 2.59 2.78 0.72 0.36 0 0.68 DAS 0.58 0.5 0.49 0.49 0.29 41. L12
hdadnq S1mad 1.0 OA? 0Q10 0.15 0.16. 0.04 0.05 DA 0.04 DI02 0.J4 0.03 0.1 0.03 0.01 2.70 O012Ji 3.73 0.71 .07 1.12 0 0.34 033 033 GZ 0.24 0.24 0.21 018 0.15 22.20 0.0
SOaid Secsir 40.0 13.29 2.51 2.61 2.69 1.10 1.0O0 0.S3 0AS 2.78 0.S 0.62 0.56 O." 0.5t 69.20 0.02Posims & Allownes 39.00 12.86 2.4 2.56 2.79 1.06 0.96 0.9 .79 3.74 0.66 0.11 0.5S 0.43 40A 66.90 0.10
130. 10.42 1.91 1.AS 1.93 0.87 0.69 0A5 0.57? .0j OA2 aM! 0.40 028 0.35 51.7 0.0AMowas lAO 2_24 D.S1 1.11 0.87 0.19 029 04 0.22 3.14 023 0Q14 QIS 0.10 15.2D O.
o j .3 l1 OD, m.o s - 0.3 0.14 0 2 0.10___________SAO_0__3 LU 0.05 0.09 0.05 0.02i 0.4 ,.OS53.040.02 0.01 U.0 0O" 0.133 2.30 -0.06Hx*g&swes 7.20 1.25 525 0.24 BOiSI 00, 0.11 0.13 0.07 .12 006 0.06 . 0.0 6 I 0.03 14 0-5
abg 'm U.10 335 2 0.63 1.0; 0.40 0.26 0A 0.22 0;.2 0.17 Y O.IS 020 .14 0.15, 2D.0 -1,5
RApsMiembIbWmx 1969 l;98 19" 19? 196 191 1M 199 17 1963 19 3983 19 19J" 19J 19"7Pqs PV 139 p.84 p.390I p.218 p.45 p183 p.50 p.47 p.12 p. 5 p.36 p.SD p.34 p45 p. 404 p.2

Chart CS: FinancinG of Free Household Services in USSR and Republics in 1987(million rubes)
. -Id. I lA. Td.1 A uk o.II.,
_ Ru-l1 UIkr. Belo. Vb. | K. Cor. Asor. lth. MedL Lt. Y ad. Mm. Turlu Ft. I.SR1 Ed ue. & Cvl vurc 21180.0 7034.0 1533.0 2592.3 2776.0 724.0 860.6 702.1 68 44.43581.0 t8 487.1 489.9 287.3 40963.7
2 State Budget 15280.0 4715.2 1112.7 2079.5 2251.7 499.5 679.7 532.4 518.2 30.5 482.3 471.1 ' 38a.7 382.8 185.3 29822.83 Sod Securiy 23.3 67.1 14.8 28.7 26.6-8.1 _9.7 8.6 6.4 4.7 6.4 6.9 5.5 .4.8 2.9 _433.44 Trade Union 644.7 179.9 39.7 76.8 71.4 21.2 19.0 17. 17.1 12.6 17.1 1I.$ 10.7 12.9 7.7 1167.8
Enteriszo 2302.0 831.91 -2 225,0 261.2 126.0 9143 63.0 75.5 6245 40.0 4344.5 5I 4.0 53.5 5174.2Agri. Callecive 1. 8.9 2.0 3.S 34. 1.11 1.3 0.9 0.8 0.6 0.8 0.9 0.7 0.6 0.4 576
7 Flahin Coil. 21.6! 6.1 3.0 0.0 0.0 _ 0.0 0.9 34 0.6 2.5 0.0 0.0 0.0 0.0 1.6, 89.8U PubUL; Organ. IOO.S 28.5 6.3 1'2.2 11.3 3.4 4.1 2.8 2.7 2.0 2.7 2.9 2.3 2.0 1.21 18S.29 DepredOation . 78 134.01 1I.3 190.1 64.2 54.5 75.0 60.5 60.0 3.8 36.3 63.7 32.7 347 4081.0
10 ToUJ Educaon 00.9 08050 1481.0 2606.7 2724.1 6824 825.1 669.2 659.4 428.7 579.7 581.0 464.1 49S.8 269.1, 39740.0I Iducadon VU 188.3.9 62944 137. 32449.9 2.30.21 639.1 769.6 630.7 618.8 403.2 341.6 548.1 433.1 4SS.5 25445 36860.0
12 FAree 3ervlc 18069.61 6061.7 1319.3 2344.4 2458.0 609.61 731.1 610.9 597.11 389.3 319.* 21.7 412.7 431.1 245.8 35361.313 COnUMPOt 1o60$01 4896.3 1124.4 2147.1 2244.8 50771 3s.8 s 35.1 533.2 38.2 4&7.0 486.0 378.7. 387.3 201.11 31003.714 Buda= ExL;u 2010.61 1166.4 195.0 197.3 213.2 101.91 7S.4 54.U 01.8 53.1 32.8 it. 48 .8 44.8 4357.6Is S.3. DcducuoI 784.3, 232.6 j 3.0 I O.5 95.2 29.51 38's 19.8 217 1ii9 21.8 26.4 20. 424.4 8.71 1498.716 Tra.f 1587.0' 510.1 108.7 156.3 167.91 43.4 53.5 35 40.8! 2.5I 38.: 33.5 31.0 30.3 14.8 288.017 Stpends I50001 4065.0 1,01.0 149.0 158.8 .9.0 523 36.3 38.0 23.3 36.7 32.0 29.6 28.4 12.7 2700.01;81 Au. VActo 870 43 7 7.7 7.8 9.1 4.4 3.2 2.2 0 2.6 2.21 1.4 1.9 1.9 180.0
19 Culnarc&Aro OVO 1729.3! 484.01 111.1 99.2 172.3 77.2 79.0 $7.2 47. 42.8! 274 27.9 483 82.3, 30.3 3028420 Stat Budget I I185.0 321.0 804 67.7120.8 52.0 60 44.6 31.9 30 194' 19.2 40.Z 2141 19.6 2114.52t CalmUre 979.1 2108.6 74.4! 50.6 98.61 45.3 SS.J 40.1 29.11 27.j M.1 16.2 35.1 17.7 16. 1808.42I A. -205.9 22.4 6.11 .1 22.2 6 . 4. 2.8 3.2 4-4 3.0 S.1 34 3.41 306.123 The*ter 119.4 13.4 3.7 4.9[ 13 3.07 2. 1.7 1.9 2.6 1.8 3.1 2.3 2.01 181.424h Other 86.s[ 9.0 2.4 3.3 8.9 2 . 1.8 1.1 1.3 1.7 1.21 2.1 13 1.4J 124.7231 Eaterprisos $44.31 163.0 30.6 313 351. .25.2 18.3 12.6 1.1 12.5 8.0 8.71 8.3 10.8 10.71 914.0
26 Heath OVO 1335t.4 3875.0,3 84 1160J7 383.5 356.1 343.0 345.1 263.0 252.01251.91216.0 191.7 159.4 23063.627 Free Helith 12846.0! 3726.0i 776.011066.8 L1115.61 365.9 341.2 331.3 333.1 253.1 242.1 242.5 208.2 181.3 153.5 22182428 Stake Budga 9344.8 2630.0 570.61804.3 833 1 288.61242.21 194.3 183.2t 179.7 136.0 14.0 123.3J 16129529 SocI Security 775.4 222.9 48.51 76.61 71.8 26.4 23.0 20.7 20.9 155.3 15.31 17..1 15.6 53.4; 9.0 1372.03*) Trado unions 336.61 96.7 21.1 33.31 31.2 11.5, 50.0 9.0 9.1 6.7 6. 4 6.8 __ 3
E3'1 *ep 711.0 204.4 44.5 70.3 6S.8 24.2; 21.1 18.9 19.1 4.1 14.1 157 14.3 12.3 8.31 I257.932 C4Ul ew 41.1 11.8 2.6 4.1 3.8 1.4 1.2 1.1 1.1 I.8O. .I 0.8 0.81 .71 0.5 72.733 Pubic O!8' 118.01 33.9 7.4 11.7 10.9 4.01 3.5 3.1 3.2 3 2.3 2.61 2.4 2.0 1.4 208.834 DeprciatOn_ 1479.15 413. i 1 22.2133.3 39.1 36.6 34.3 38.7 284 28.9 24.9 16.7 2546.033 S. S. edeucdo 505.41 149.0 29.5 42.6 45. 117.6 '4.9, 11.7 12.0 9.9. 9.91 94 7.8 10.4 5.9 881.1
36 Sodal Securt 40400.0_20 2309.012610.1 2885.81104.9 101. 930.5846.0 .9j677.31622.0 558.4 456.9 507.3 69183.03I ovO 1722.61 543.9 125.1 64.2, 113.61 54.4 31.4 43.2i 595 48.7 26.7 17.7 17.7 29.8 30.1 2928S8s MUMh ScM. |a 1584.1 3$7.1 91.6 38.7! 79.7 39.1 19.21 31.71 4945 38.2 19.2 11.9 10. 24.| 23.i 2016.139 State Budge 212.9 64.2 16.5 7.0 14.31 7.0 3.5 5.71 8.9 6.9 3.5 2.1 1.9 43 4.21 362640 Eane e 904.2 272.7 09.9 29.5 60.9 29.8 14.7 24.2 37.8 29.1 14.7 9.1 8.1 18.9 17.9 15394N451 Coilective Farm 67.0 20.2 5.I 2.2 4.5 2.2 5.5 1.8 28i2.2i 1.1 0.7 0.6 1.4 1.3 114.042 Pos Fe 538.6 186.8 33.5 25. 339 15.3 122 I1 I0.1 10.6 735 5.8 7.1 50 6.7 912.443 Tmateus 3461 2669.2 2370.5 2535.7 2758.6 1044.4 965.6 U2.7 782.4 731.9 647.6 602.0 537.9 425.1 474.5 6588?.244 P*Os l614 4 142852 1872.5 14225 189L.2 854.4 680.2 641.5 $61.3 590.6 416.2 322.6 396.8 277.4 373.1 50787.645 Alowance 4 241.0 498.0 1113.2 07.41 190.0) 23.4 241.2 221.1 1413 231.4 279.4 141.1 147.7 101.4 15099.6
46 HoueaIg 7204.6, 1247.01 249.01 242.6 647.5 515.0 114.5 132.0 67.7 121.2 56.08 3.4 70.9 64.2 74.0 04655.247 SarL udget I150-71 417.6 1099 516.0 117.21 83.8 65.2 1.9i 34.3' 34.1 21.L 25.89 56.6 29.0 2S.2 2704.248 Eumeprtsx 5* 7.9 1 329.41.139,1 124.4 530.3 31.41 49.3 80.1 33.41 57. I 35;5 32.6 14.3 35.2| 48.8 7759.0
Noo; 3.3. Deducioor--9ocla Security Deducdons (xcl3uded from official c3dmatu of frc sccs)
37

-Chart C6; Comparison of Financial and 1-0 Data on Free Household Services InIn USSR and Republics In 1987
.. ~~~ ~ -,erAuv , 14__ _ _ _ _ _ h.. _ R4 | Uktr- ilbo. Vzb. Kaz. Maid Lat. Tadz. Arm., Turk. Rat. USSR
I Total OVO 39725 14249. 2661.6 3903.0 4280.0 1278.9 1295.1 1162.4 1141.6 830.5 903.0 893.2 763.1 74.9 546.4 72637.6
_ _ _.. _____- ....................... _ 6.3 5.22 Edcadon GYO 19S0O.S 6463.1 1415.$ 2470.2 2611.2 M61.7 774.9 6.5 634.3 413. 4 .d 52.4 439.0 459.8 260.6 57883.7
PFree Seimces 18853.9 6294.8 '1372.3 2449.9 256.2 639.1 769.6 .7 618.8 403.2 541.6 548.1 433.1I 455. 24.5 80.0
4 Coasimpuan 16756.0 5083.1 1169.5 2243.7 2334.5 532.3 690.3 374.2 554.7 348.2 507.4 510.6 397.S 409.2 -20.2 32317.7
51 Butlnen Exp. 2097,J 12 11.2 20 2.8 Z06.2 22 1.7 IG&II _79.3 56.6 d64.1 55.0 34.2 37 f35.6 46.31 46.41 4542.3
6 Paid SevIces 651.7 168.3 43.0 20.4 55.0 126 5.2 13.8 1S.S 9.9 7.2 4.3 5.9 4.3 6.1 1023.7
7 Cur re&A.r OVO 2895.9 806.81 180.4 164.8 265.1 516.1 103.2 84,1 4.9 72.4 46.9 43.4 64.3 46.1 53.6 4972.9
I I'me sm___ 1729.31 484.0 111.1 99.2 172.3 77.2 79.0 $7.2 47.0 42.8 27.5 27.9 48.5 32.3 30.3 3028.5
9 Couiazipeon 118.0 321.0 80.3 07.7 120.8 J3.0 W0.7 44.6 31.9 30.3 194. 19.2 40.2 21.5 19.6 2114.5
to BuislnExp. 544.31 163.0 30.61 31.5 25-$ 2.21 18.3 12.6 15.1 12.S . 8.7 8.3 10.8 10.7 914.0
11 PFod 8frvlcet 1164.61 322.81 69.3 65.6 92.8 38.9 24.2 26.9 19.9 29;61 19.4 1SJ I5.8 13.8 23.3 194.4
__…..I I I I -. ,- i- 1 1.- _
12 HeMlh GVO 17323.91 5229.9 IOQW.8 1267.9 1403.7 511.01 417.1| 433.81 447.4 345.0 308.2 297.4 238.8 239.0 232.2. 29781.0
13 FrcS 15074.01 4415.9 930.6 1173.6 1274.3 437.9 387.51 386.2 404.6 31.7278.7 269.6 233.7 221.5 189.5 25992.1
14 Coiuumpd*n 13350.S8 3909.9 808.4 1067.5 1139.3 380.2 349.51 340.z 343.8 20.6 248.0 243.3 209.9 188.1 161.6 23007.9
13 Buoneu Fp. 1723.21 509.0 122.2 106.0 135.0 57.7 38.0 46.0 60.8 46.2 30.6 >-3 23.7 33.4 27-9 2984.2
16 Pald Serices 2249.9 811.0 135.2 94.4 129.4 73.1 29.6 47.6 42.8 33.3 29.6 27.8 25.1 17.5 41.7 3788.9
17 NurerIes | 416.6 107.9. 27.5 13.0 35.1 8.1 3.4 8.81 9.9 6.4 4.6 2.8 8.8 2.7. 3.9 654.5
I8 Recreauon 1C66.6 649.4 95.9 67.3 80.81 57.5 23.3 34.1 29.3 224 19.7 21.8 19.0 11.71 36.3 2S8S.2
19 Heath&Sports , 166.7 53.7 11.9, 14.1 13.5 7.60 2.9 4.7 3.61 4.41 S.3. 3.3. 2.4 3.1 2.5 299.2
20 ToW GVO _ 3691l. 1 * 0365.1,23 1.41 3521.5 383S.4 1240.2 1235.61 987.0 961.2 t37.9 800.4 815.9 693.1 687-4 493.5 65569.9
21 Educadoi GVO 19669.8 5523.7 1279.112181.3 j2245.4 678.11 712.5 $52.61 546.91393.6 488.6 530.0 416.0 399.8 25.2 3932.6
22 Coumpton 17267,5 4885.81082.7 2035.0 1927.7 56.66 686.6 495.81 48.8 340.11456.3 501.3 880.4 348.7 W8.6! 31990.6
123l Pr:cScrr1ces 1601§5.8l 4717.0 1039.7 2014.6.1872.71 554.0 681.4 42.03 473.3 330.2 449.1 497.0 374.5 344.4 025 3.9
24 Paid SOerIS 651.7 168.8 43.0 20.4 55.01 12.6 5.2 13.8 154| 9.9 7.2 4.3 5.9 4.3 d.1 1023.7
2s Buines rp. 2402.3 637.9 196.4' 146.3 317.7 111.S 85.9, 56.8 58.1 53.5 32.3 28.7 35.6 51.1 46.61 3942.0
26 Culme&Arm GVO 2QS1.2, 806.5 181.0 189.4 2d2.2 104.5 100.3 81.5 69.0 63.3 8 31 S2.6 61.4 S4.0 44.9 5075.3
1271 C p 2406.91 643.5 150.4 157.9 210.7 79J 83.0 68.9 53.9 52.8 43.5 43.9 53.1 43.2 34.2 4161.3
28 Fres SoIfc.. 1862.6 480.5 119.8 126.4 159.2i 54.1 63.7 $6.3 38.8 40.3 35.5. 35.2 4.81 32.4 23.5 3247.3
29 Paid Sevic 1166.6 3228 69.3 65.6 92.8 38.9 24.2 26.9 19.9 29.6 19.4 15.5 15.8 13.8$ 2.3 19 .4
310 fusem Exp. 544.3 163.0 30.6 31.5 52.1 25.2 18.3 12.6 1S.1 12.5 8.0 8-.7 8.3 1081 10.71 914.0
31 Health GVO 14290.91 4034.9 851.3 1150.8 1327.8 457.6 362.8 352.9 345.3 279.0 240.3 233.3 215.7 203.7 193.4 24562.0
32 (;onnplO 12J350.3 3154.9 713.4 1056.6 1W1.2 S72.3 |298.1 307.9 .29. 1736.1 235.6 2t4.6 187.0 165.1 1$6.0 21395.0
33 Free ServIces 10106.4 2715.0 578.2 962.4 970.7 299.2 268.5 26023 236.3 202.8 206.0 180.8 101.9,147.5 113.3 17606.1134 Paid ServIs 2249.9 811.01 13S.2 94.4 129.4 73.1 29.6 47.6 42.8 33.3 29.6 27.81 25.11 17.5 42.71 3788.935l Budnes Exp. 1934.6 509.0[1379.2 94.0 227.0.1 I5.3 64.7 45.0l 4e.2 42.91 z4.7 8.7 2.7 38.64 37.4 3167.0
38

Chart C7s Financing of Housing. Utilities and Personal Care Servicesin USSR and Republics in 1987*(miflon rubles) _ _ _ _ _ _ _ _ _ _ _ _ _
______________ RuMIa LT0.DIo UEb. Xaz.- Cacr.1 Azcr. Lith. Mtold. LIUL KIrg. Tadz. Armf. Turk. Emt. IussRt
I ojas1ng-Com.. OVO 2043.3.3 0524.31 973.3 1082.81 1943.7 513.5 425.5 519.31 313.8 43S.8 2-78.7- 259.2 277.2 211.4 280.8 33523.02 HOuMdn3 16538.1 4101.2 713.5 841.1~ 1592.1 344.4 221.9 362.4 221.8 296.7 207.8 197.7 1856.7 16345 202.4 26191.2
31 Free ServIces 7204.6 1247.01 249.0 242.6 647.5 115.0 114.5 132.0 67722. 6.6 58.4 70.9 64.2 74.0 10465.2
4 Sim 3udget 2516.7 417.61' 109.9 128.0 117.2 8366 125.9 34.3 34.1. 21.1 25.8 56.6 29.0 25.2 2704.2
S Entet'prlme 5687.9 8-29.4 139.1L 124.6 $30.3 31.4 49.3 80.1 53.4 87.11 3545 32.6 14.3 35.2 468.8 7739.0
6 tousebtolds 2127 302.2 111.J 93.3 173.0 36.4 34.4 48.4. 30.1 33.5 21.2 19.3 23.8i 11.3 33*41 305.4
I Housing Rent 1568.0 380.0 _ 77.0 611.2 222.0 29.0 24.0 37.0 22.5 23. 15.0 14.7 17.9 14.2 20.01 2429.8
8 DW=Wddsle 20605 49.3 9.5 74s 15.0 3.6 3.1 4.9 2.9 3.8 1.8 1.8 2.2 2.0 243 316.5
9 otel. 353.0 72.9 25.0 24.91 28.0 3.9 3.3 6.5 -4.71 6.2 4.3 2.S1 3.7 1.1 8.91 559.1le DeprOClIoS11 7206.0128Un. 353.0 505.0 709.6 9. 7. 8. 124. 14. 3. 20.0 92.0 82.0 97.0 12520.6
lijUIue.O 18525 66*2 124.4 96.1 188.0 83.0 3545 93.6 51.0 84.7 . 32.2 624 17.1 46.0 asis..
12 smzeo Bu4gnt 551.2 374.91, 67.7 52 7 98.2 61.7 117.1 64. 1 33.7 62-.3 16.9 21.4 49.4 5.2 31.3. 1558.31*________________ ____ _____ ___ _ ____ ___ 1 4__ 4 - ___ _ __ _
13 Sewag 274.1 65.51 12.6 10.0 20.0 4.7k 1 6 3.8 5.01 2.5 2.4 2.9 2.6 3.31 420.014 ebeau~~~ti,g~ 27.2 6.3 2.3 _1,0 2.0 0J4 0.4 0.6 0.4 0.5i 0.2 0.2 0.3 0.3 0.141.7
is Ceniial leaUng 1000.0 222.4 42.8 34.0 67.8 16.2 13.9 22.21 13.1 17.01 8.3 8.2 9.0 9.0 12.1 F 14951.8
16 Personal Cane 2042.7 753.9 135.4 144.0 163.6 86.1 68.1 63.3 43.0 $2.41 43.0 29.3 28.01 30.8 32.4 3726.0
17~ EziteTrrte 152.3 57.7 9.8 10.5 12.3k 7.2 .5.2 4.6 3.4 4.2 2.9 2.4 2.31 2.8 2.4 280.01
18 tiouaehoida 1890.4 696.2 125.6 135.3 131.3 78.9 62.9 58.7 394d 48.2 40.1 26.9 2.71 28.0 80.0 3436.0
19 £1 lSaulnOnse 131.8 486 5.9 9.3 10.5 5.5 4.3 4.1 2.91 3.4 3.0 1. 1.7 2.0 2.2 239.6
20 W) Laundry 503 9.6 5. . . . . .1 18 20 18 12 1.0 1.2i 1.3 146.0
21 ci Photo 28.1 10.4 1.9 2.0 2.2 1.2 0.91 0.91 0.61 0.7 0.61 0.4 0.4 0.4 0.5 5.
22 d) Buabensops 542.9 200.4 36.5 38.5 43.4 22.7 17.8 16.8 121.81 13.8 12.2 7.9 6.9 8.2 8.9 987.
23 c) Renmis 175.1 64. 11.5 12.4 14.0 7.3 5.7 5.4 3.5 1 4.5 3.9~ 245 2.2 2.6 2.9 31835
24d) Traa3pondOn 310.8 114.7 20.9 22.0 24.9 13.0 10.2 9.6 6.51 7.9 7.0 4.5 4.0 4.7 5.1 3S6.l
25 el CGuffeadn.s 167.1L 61.7. 11.2 2. 23.4 7.0 13.3 5.2 3.61 4. 3.8 2.4 2.1j 2.5 2. 33.
26 f) ROflion 3945 _ .01 6.0 6.3 7.2 3.7 2.9 2.8_ 2.01 2.3 2.0 L.3 1.1 1.4 14 162.7
27 S) RUMa DelIvery 70.2 25.91 4.7 . 5. 0 5.0 2.9 2.3 2.21 1.51 1.8 1.6 1.0 0.9 1.1 1.1 127.628 h) Mark~et 56.3 20.81 3.8 4.0 4 . . 1.71 1.21 1.4, 1.3 08 07 08 09 0.
29 D Odier 237.9, 87.81 16.0 16.9 19.0 9.I. .4 52 61 =5.4 3.5 3.0 3.6 39!41
39

Chart CB: Financing of Transport, Communications, Science and Administration ServicesIn USSR and Republics in 1987
'_ _o(mlOn rubWas)
. . R W ~~~~~~4L V kr. B el Q. U Zb . Ki OcU r, AAhe r. I . lt h. b Id.1 En >-t K 4B T ^d Z. A. T Urk|%. Fast. V S S
I Traspot CGVO 12873.3 2961.6 613.2_ 72s.5 1317.2 378.7 334.6 254.3 181.3 243.41 180.7 167.1 202.0 173.6 232.5 20485.0
2 Stwte BudSet 2701.S 171.6 6.J21 321.5 372.2 2.3 19.6 36.5 14.3 42.4 14.7 24.1 33.0 31.6 108.5 3332.0
3! 2nterpreS 1540.4 392.0 04.8 37.3 164.4 41.2 33.1 34.8 13.7 22.2 10.8 6.6 6.3 27.0 20.2 2414.8
41 Spea1 rTM. 797.4 202.91 33.5 19.3 85.1 21.3 17.1 18.0 7.1 11.5 5.6 3.4 3.3 14.0 I0.5 1250.0
S PasnPr Tran. 743.0 189.l 31.3 18.0 79.3 19.91 16.0 16.8 6.6 10.7 S.2 3.2 3.0 13.0 9.7 116.4.8
6 Houusfold 8631.6 2398.0 481.2 638.7 780.6 339.8, 281.9 183.2 153.3 178.8 153.2 136.4 162.7 115.0 103.8 14738.2
7 CotmunlcaU OVO 5198.8J 1142.2 288.4 207.S5 404.2 135.5 114.0 101.3 90.0 95.4 80.O 62.6 917.3 70.0 $4.6 7974.0
8] Stam Budel 2299.2 Z6.7] 83.7 56.7 179.9 5:3. 40.81 3451 33.9 33.6 38.3 29.9 44.1 41.4 20.9 3088.3
T1 V ____ _ 1363.01 57.41 44.6 31.4 150.4 Q.3 36-31 32. t9.5 23.3 28.0 IJ.S 34 324.7 24.91 20s.1
1 Ott= (d3§al ex 936.2 102.81 39.1 .35 29.4 21.1 4.31 2.51 14.4 10.3 10.3, 11.2 9.8 16.7 -4.0 1037.2
11 Bnerpra 99.0 292.7 56.8 65.3 656 28.1 23.1 20.2 18.3 18.1 14.7 1.3.2 1l.2 10.0 10.3 195.4
12 Cunent Cbarges 3 -4 10s.91 23.3 40.0 .71 12 .9 8.7 8.2 7.5 7.2 7.4 .1 5.0 3.8 683.0
13 PwilPFew 538.6 186.81 33.3 25.5 33.9 15.31 12.21 1.3 10.10.6 7.3 3.8 1.1 5.0 6.? 9A2.4
14 Hosholds 9 170.6 589.3 127.9 83.31 23.7 53-8 50.1 46.6 37.8 4.71 27.0 19.3 88.0 18.6 23.4 3290.3
.IS &Jelac OVO 24817.1 230.8 461.4j 471.5 67S.7 241.3 208.1 221.9 81.0 147 173.8 142.4 218.41 20.Z 72.5 30807.0
16 -lSate Budge 27734.7 1907.6 -46.0 132.7 92.4 13.6 4.8 133.2 -0.8 75.5 101.0 8S.9 163.7 ** 13.8 20533.0
17 All-UnIM 17260.6 1632.1 -122.60 6s5. 2281 -63.2 -47.8 201.0 .32.8 36.9 77.7 67.4 127.9 ## -11., I247.4
18| All-Repubik 474.1 275.51 76.01 67.2| 69.6 78.8 43.0 31.2 32.0 38.6 23.3 18.5 35.8 16.6 25.4 1305.6
19 O1 -° u' xplor. 34*9.2 340.9 81.1 143.9 1833.0 38.2 114.0 4.0 3.1 7.6i 9.3 8.1 5.5 287.0 7.0 4179.0
120 Eerpr 3613.2 982.3 475.9' 194.9 450.3 187.5 98.9 M.?7 78.7 64.81 63. 48.4 49.2 57.3 51.7 6075.0
21 Admilnlmmau GVO 4772.5 1143.4 254.3 253.0k 374.6 227.4 110.4 100.0 85.6 78.6j 71.0 65.01 78.1 67.4 $2.01 7633.6
122! sate sude 1 1970.71 343.4 79.5 8s581 131.8 48.53 37.?, 34.2 3t.2 26.31 29.21 7.61 29.71 30.61 7.6 2923.8
231 Mbebi.lp Du I202.1! wu.o.0 174.8 .2F 24. 75.91 72.71 65.81 54.4 52.341.81 37.4 45.41 2L 4.41 4709.8
40

Appendix D: Combining Reports from FSU Economies
The main report notes that republic-level branches of the FSU's central C(oskomstat didnot receive direct reports on various Union-wide activities. Rather, the central Goskomstatwould provide its branches in each republic with processed information sets that, when combinedwith reports generated via the appropriate branch, would yield the center's assessment of thatrepublic's contribution to the 1-0 table, etc., for the FSU as a whole. Such detachment fromthe use of the information usually reduces a compiler's attention to the accuracy of the reportshe or she submits, which could explain why some republic-level 1-0 tables seem to havediscrepancies and errors. Hence, before the official format I-0 tables (Tier I) could be expandedto NEB format (Tier I), IDS had to make educated guesses about the reasons for discrepanciesbetween the 1987 1-0 table for the FSU as a whole and the sum of the 15 1-0 tables availablefrom individual republics. Chart Di summarizes the differences.
By far the largest discrepancy arises in the export column (29) and the import row (38).This reflects the inclusion of inter-republic trade in I-Os of individual republics, while thecomparable segments of the 1-0 for the FSU is confined to extra-republic trade. In effect, eachtotal should differ by about 180 billion rubles (see Chart Al, above), which is the case on theexport side. What is surprising, then, is the much smaller difference on the import side. Byinference, some republic-level I-Os did not in fact record all imports in their I-Os.
Other major discrepancies include working capital (column 25) where reports for the FSUas a whole again exceed the sum of the 15 republics; and "other" sectors (column 27) where theopposite is true. While the magnitude is similar, between the two, the distribution by type ofmaterial outlays is so different that they are unlikely to be mirror-images of the sameclassification issue.
41

Chart DI: Discrepancies between USSR and Republics' 1987 Input-Output Tables--Offcial Fornat(,lmo rublns)
________________ ______________ ~~~~~~~~~~~~~~~~~~Page I
I _ 2 1 3 2 4 5 1 6 7 1 8 i 9 1 0 I 11 12 1 13 1 14_Power Petro- j Coal Other 1 Ferr. N-Ferr. Chem. MB.MfW Wood & Constr. j Light Food Other Total
_i - G,as ! |Fuels! Metals Metals; Paper mater Ind. Industry
ItPower -39 64' 7j -3 48; 48. 481 *385 231 -64 251 -18 *195: -4422:Peto-Gas 648 -72, 1 -4 S0 43 I 8 1 Sl i 71 14: 9 14i 171 9233 Coal, 2221 0 399 0: 209 4. 4' 23- 0 311 0 -4 -1 887
|OtherFue 19, 0. I 20. 0o 51 16 0 5 0 1 0 6951Ferrous Metals -I .5i -10' 5! -351 26 0' -917! -1635 3 -7! 26 -1379
L~~ ~~ ~~~~~~ ~~ _ _ _ I . ll 6!.N-Ferrous0Meus 471 0i o; 0; 29 -123 30. 1052: 4: 8i o0 2! 162 11187 Chemitrs Meal . 3I 0 S1 I3. -13 4"; 146. 2 45- -4 *j 2- 2 -390
8MBMW _16: 6! 88. 4i -1091 7 34: -4018 4, .64 91 *38 72 -38909;Wood & Paper ' 0 39 O 0i 0' -97; 64. 259i 83; 49! 10- S - 41910Cost. at I1 -I 8 161 6; 4195
10:Constr. MVa,terials li 2 -1 0 -1 1 3 0 -33 -8 *67. 1 -6 *6- -3SII UghtIndustry O; 3, 0 0. 4! 10 177 352 III 32 2045 4 -35 260312;Food Indusy j I -5 0. 0 4 1 -75 4: -I! -3 -219 335 -18; 22313Otherlndustryv 34- *2 111 II -101 20 21 43; 33' 24 -16 -3: 7: 16214'ToWI Industry I 947 -3 527, 26 -136 28 -189 -3602 412: *208 2050 282 36 169IZSConsruction 0 0 0 0 o o 0 0 0 0 0 0: 0 0
16AgrL. & Forestry j 0: 0 0 0 I1j 0 -14' 1 50. 0: -77; 1262, 528 175017 Production T & C -2. 1267 431 -20 15 85 -294 -432 349 -374 -247 -144 -33 60218!T & D 0 -188 59 2: 224 8 39 105. 65 4' 278 -918' 123 -20019:Other Prod. Sectors, 4 4 3 0 -72 -53 16 -22 -6 8 -51 -29 24 -13S20MAteral Oulyay | 941' 1081' 1020 9: 311 67 -442 -3950 870 -570. 1999, 453 678 218621Depreciaaon 1 23 *165 -26 3 122 205 162 -127 -771 -188 -11: -38 -36, -153
22:Toa Outlays 964 915 994 11 153 271 -280 -4077. 793 -758 1988. 415 642 2032_ _ _ _i_!_i_,_ I I I :
23 Wages 7 3 14S 11 -82 -107 0 9 -59 -14 151IS -129. 203 13924 Other Earnings i 10 II 12 0 6 12 -16 96 14 8 I: 14 -2 182
25 Kolkhtoz Pay I1 0 0: 0 0 0 0 .24 4: 10 I1~ 99 13 104
26 Social Sectity 1i -3 51 -2 -5 -20 - -99 -28 33 34' -29 33 -1227 Kolkhoz Soc. Sec. 0. 0 0 0 0 0 0 -11; 2 1 0 26 2' 2028jTomiPmoIt -79 -114, -502 41 124 -173 -117' 2601 -182; -345 -582 -1378 -261, -96729 Bonus Wages 15' IS 6 3 0 30 28 52 8: 5 18* -21 65 22430'Turnover Tax 296 -78, 0: 0' 4 13 -233 0. -39~ -270 241 278; -212 031;.Net Subsidies ' 0, 01 0, 25 0 0 0' o 0 0 -108. 240 .47' 0
32.Other State Income ! 9 -108 -43 3 -210, -62 -207. 697, S3 -3 -3566; -295 -93 -128633 ICoUthoz Income I 3i 0 o! 0. 0. 0 4 437 2411 61' 133: 189 282, I35034:Prate Irncome 01 0i Oi O O; 0 0 0 0o 0o 0; O 0 035lUnaordzed Value -5 -30. 4 -I 8: -3 -6 33 -2; -I *i 4: *1. 036 National InCme 1 53: .319 -333 67; .255 -338 -580 3739. 4191; -877 -472 -1081. -83 -471
37 Total Output 1117- 596 661 78 -2 -67 -860 -337 601, -1635 2515 -666 560 IS6138 Import -1735 -14287 -1216 -38 -13693 -5889 -17900 -56835 -5698 -2644 -27718 23106 -3618 -12816639 Towl Supply -618 -13691 -555 41 -13696 -5956 -18761 -57173 -5096 -4279 -26203 22440 -3058 -126605
42

Chart DI: Discrepancies between USSR and Republics' 1987 Input-Output Tables--Official Formnat(million robin)
_______________ ______________________________ ~~~~~~~~~Page 2
_______ ~~~~15 1 6 1 8119 20 2 2213 25 126 27 28 9 3_________ ~~Coast Agri. T & C, T & DiOther, TOTAL,~ PrvtePubic Toual [Net Working ICapitali Other LesExporm' Tooal
______ -~~~~II Prod. PROD.J Cons. Con, Cons. Fixed, Capital I jy. -TVIoPer 4811 - _4 241 3641 -S 276: 493; 3071 800. 0 41 0I -1732; .618
3'Coal -71 -170' -27, *i12 *1 672; -13 370 234 0 .3601 0 16 5551 0 251 00 1 0 5 1 - -0 - 0 17 416
SPFerrousHetais 343; 14! 18! 3! 0~ .1003' 17' 62! 79 0 -1 1 9' O1 -12665 -33695N-Fe-ros Meaft .7' 3 6. 2 -II 319 0~ -S . 01 -33431 0 01 o -5730. -5957
7 Cheulcals t 207: 54: 187: -25. -61 -386: .283' .94! .377 01 -973 01 1312' 1 -18340 -187628;MB.f 3 4671 312! 52' -23; -3275: 796 '406 390 "490: -476 -3031! 12205' 78 .58283 -S73699IWood &Paper 343; 22' 9: -28' -21 762' -75' -42i .1171 88 .9 3 27 3.-6 -09
teCosr.Mistals -656 -411 -75; -70 .2' -979~ *128 .95; -2231 0, .49 21 III -2684 -42821IljLlSfttIndustry 1309. $g: 54- -26. -2, 2826 .872 -128,-4000, .611 425! -70' 188; .44 -28468 -26204
12'Food Industry I3' 204* 0 -30. I 1 420- .333, 325' 18 Oi .1671 0! 23 01 -228O1L -23769I3i Other Industry ] 26, 11o3i 308: .19. 90 1387: 593. -109: 483 1!.26j -856 64 -2, 10~ -3165 .3059
I4!Tota3 Indisan 369: 3188 299 -91 -36 1898, 270 *330 -59i, 4899 -11189, .3028'i 14330 88, -174146 -172815IS'Conswuctlon i ~0 . o: 0 0. 0~ 0 .6 0 *61! 830 -3187 i22311 0: 353: 0 0
16'Agrt. &Foreau, -22 366. -4 64 0. 1955;' -712 -88, -aoo: -638, .1 14!. -3231 -II13! .203 i-5709 -592017l Production T &C ' -399 -465 3 37 230 8. 0 .-8 .81 o of1 ol 0~ 0 1 0 0l38T &D I 0 129. 0 0 97 26 0 0. 0, 0' 0: 0: 0-26' 0 0191 Other Prod. 19 II: .4 86: -13 -25: 415 -75 340, 279, -10. .84. 13 o: .718 -20520411a1"I&I Outlays -33, 1029 295 95. 2931 3862 -32 .501 .533: 3' .3-4500, 31221; 14032' I -1-80572 -17894021:Deprecladon 33 -3300' -295' -96. 50: .3761 33 SoL 533. 0, .4 0 50 Il 0
22 Tom] Oudays 0, -271- 0 0 341 2302 0 0 0' 31 .4933' i 34462 0 .180572 .178940,
23 Wages 729 133 -250 685 -330 330624 Other Eamings -686 19 -302 -179 -3 -761.25,Kolkhoz Pay -450 294 -I! 0 44; -826 Social Security I-548 34 -198 -67 .30; -82027:Kolkhoz Soc. Sec. 0: 66 .1 0- 5' 9028 Total Profit I 834' 52 955 -973- 213. 31429i BonusWages 255 3I 3 .1090 -7; -61430: Tumover Tax 0 0; 0 0 0 031! Net Subsidies 0 0 0 0' 0. 032ZOther State Income i -8. -896 -404 532 .-43;' .2104
33'Kolkhoz Income 0 -571 0' 0 7; 130034'Prlvate Income 1 0 376. 0; 0. -86' 29035Unamortized Value 330, -I, . o . 0 336'National. cm 0 0. 0; 0. I! -47037lToul Output 0, .273 0 0 3413 3633138Ilmport 0 -56S0 0 0 .544 -13436139 Tota Supply 0 -5921 0 0 .203 -332729
43

Appendix E: The Second Economy
There is no agreement among specialists not only on the size and structure but also onthe definition of the second economy. Specialists agree, however, that during the last threedecades the second economy grew by 3-4 times faster than the official economy reaching a levelthat is at least 5 and as much as 15 percent of GNP. According to average estimates preparedby T. Koryagina, a top specialist on the USSR second economy, economic activities notsanctioned by the state grew from 5 to 90 billion rubles in 1960-1990 or by 14 times (see ChartAl below).23 These activities include sale of moonshine, repair, trade and personal careservices offered by individuals. Not all services increase economic welfare and hence GNP. Forexample, briberies taken by administration and trade officials, scalping practices, padding ofreports in agriculture and construction should not be considered as contributing to GNP. At thesame time, individuals who offer repair services often use materials stolen from the state as wellas tools and facilities that belong to the state. Moreover, these services are offered as a rule atthe expense of state services, which is another form of padding performance reports. Overall,we decided to accord with the international practice and not include production-type illegalactivities in estimates of republics' GNP.
Chart El: The Growth of The Second Economy in 1960-1990(in billion rubles)
Early LateSectors of the USSR Economy 196ds 1980sTotal for the USSR Economy 5.0 90.0Total for Material Production 2.5 73.0
Industry 0.3 10.0Aariculture 0.6 23.0Transport 0.2 8.0Construction 0.2 12.0Trade and Distribution 1.2 17.0SuDIlV and Procurement 0.0 2.0
Total for Services 2.5 17.0Housing-Communal 1.6 6.7Health and S orts 0.5 6.2Education 0.3 1.5Culture and Arts 0.0 0.3Science 0.0 0.3State Administration 0.1 1.7
"Tatyana Koryagina, 'renevaya Ekonomika v SSSR,0 Voprosy Ekonomni, N3, 1990, p. 117.
44

Koryagina estimated that in 1987 the total vo1wme of personal care services not sanctioned bythe state was around 14-16 billion rubles which was around one third of state services purchasedby households.' Of this total, criminal activities (bribes, etc.) equaled around 4 billion rubles,while "semi-legal" service activities-- 10-12 billion rubles. According to Rutgeizer, anotherspecialist on the second economy, the total volume of services provided by individuals amountedto 12-14 billion rubles.' G. Zoteev, a former FSU planner, reported that these services were"conventionally computed" as 2 percent of total household income, which amounted to 8 billionrubles in 1987.3 The average of the three estimates was around 10 billion rubles, which is thesame amount that Goskomstat officials accepted in their estimates of the official GNP.17
1 Tatyana Koryagina, 'Uslugi Tenwvye i Legal'nye,' Eko. N2, 1989, p. 60.
25Valcry Rutgaizer, Pyaleka-chelovehm. Moscow: Politizdat, 1986, p. 49.
26oennadi Zoteev, ehe National Product and Income in the Soviet Economic Syatem,' Moss, NI, 1991, p. 76.
2'From the unpublished Goakomstat table 'USSR GNP by wector of origin in 1985-1989.'
45

USSR 1: 1987 Input-Output Table in Purchasers' Prices--Official FonumatMMilons of Rubles. Current Prices
FPage II112 i3 14 15 i 6 i 7 1 8 1 lo1 I 11 1 12 13 114 I 15PoeiPetro- i Coal IOther iFew. i N-Ferr. Chem. i MBM%W Wood I Constri Light Food OteI Toal1const.
Galos I Fuels iMetmIs IMetals' PaeIMae. In'd. InldustryII Poer 130618880 544FT 6 1 18s01 1560! 38591 41791 8741 15281 897i 973i 5831 19069i 16142 iPetro-Gas 1103411 174211 73! 301 1851! 748 i3337!i 26531 9881 2.379! 2671 13931 4101 418911 2703I1Coal [3637 0 62721 3! 3990 1 10i 50i 2671 1301 3101 162! 441 15033 894 Other Fuels 2651 1 1 1151 0! I 1 13! 26: 121 291 21 2 1 2! 4691 54i Ferrous Metals 94 81j 1631 141 193191 6591 1285! 20148 i 5171 24161 1131 3491 1881 453461 819_8
6INFerou Meab 152 13 19211 146971 10621 118961 501 1341 401 1731 871! 310121 2137 iChemlcaLi 120 $901 271 261 6041 6041 203521 97201 16381 10961 557 8681 11331 425421 26878!MBMW 1417J 3761 844 33. 1901! 801! 17761 845'591 15711 11611 7821 12271 6661 .971141 133069 Wood &Paper 48 341 4651 7! 1971 159; 14611 3102! 136211 8131 5221 17581 9031 23090 626010 Constr. Materials ! 511 24i 751 3i 941 109! 3401 1316T 429! 7756. 761 4931 . 1211 10887 3029II, Llght Industry [ 521 _45! 861 Si 210! 991 18381 25111 13361 3621 710391 .11121 14331 801281 8161I2FoodlIndustry 341 391 10! I! I 51I 371 10541 3891 811 821 .6161 49975! 21791 54548! 10313 1Other Industry 3411 _55! 1011 I 1 75; 431 595! 610I 1421 176' 1681 994. 31481 6649! 28414lTotaJ Industr 165!259 820 2651 32063! 19627:370221 141576; 21389, 18242. 800971 5947911181477!66823
ii5c o Fsrcto 0l 01 0l 01 0l o- 0! 0o0 0 0!1 01 oi 01 00 016!Agl. & Forestry I 0i I 0 j 2i 21 58; 94! 9131 2! 166841,l108404! 83001 1344611 7617 IProduction T &C 2661170491 _33321 89! 40051 12231 32381 8228! 41311 93721 17581 4588! 10131 583421 26151187T& D 01 23751 413j 101 9881 117! 26141 4629; 12071 6271 6756! 18215! 1100! 392511 01910ther Prod. Sectors I 211 51 391 Ii ' 4491 ~86! 1351 335j 1011 176! 921 180, 1421 1808 1 315
20IMateria171Oud40s341 127051 365! 375071 21055! 43117! 15486T2; 771 286 I9: 1053871 1908661 223 714!6829
21I j reciton 65787 1661 26051 1651 48481 28231 6934[ 192971 3665j 42521 25181 5321! 2107! 682791 11331
22;TotaI Outlays 237241472001 15310! 5301 423551 23878! 50051!1 1741591 31406! 32871;1 07905i 196187! 24343j 769919, 81160
23 Wages I 1905 881 4869! 1721 36961 2203! 4393! 40548; 6936! 6121! 95941 6822! 3073! 912131 41805241 thr Enti I "I 81! 220 5~ 1411 128: 146! 1646! 2771j 1811 1961 2581 86! 3464! 145625i Busness Trips 221 101 57 21 43i 26! 511 - 4711 81! 71! 1121 79! 36! 10611 48626! Other Wages 771 71 1631 31 98! 102i 95j 1175 196! - 110 841 1791 SO! 2403! 97027 1KoIIkhoz Pay 4! 0~ 01 0! 01 0; 3! 555i 2591 70' 65i 399 2801 16351 1816Z8ISoclaSecurity 2991 144 51ll 221 417j 254! 657! 5883! 599' 739! 12171 842! 262j 11846! 396729iKolkhoz Soc. Sec. I I 0 0l 0! 01 0! 0; 63! 291 8! 71 62! 321 202! 18
30ITou Pmfit67761109341 29431 45! 8272! 61391i 9973! 438911 55131 4017! 135671 117431 26091 126422[ 20074311 Bnus Wa!o 26 186 2951 18. 3721 2501 5601 453514711 486! 889!1 601!1 345' 92941 269632 ITurnover Tax 2557111906 0IS(141 3621 31S4 116911 2941 1763! 208081 381461 2882! 944181 0~Net SubsidIes 0 0 .51141 0! 01 Oi .26861 .22241 Of 0' -36301 -5609 0.675 0
341OterStteinme 150 4004 1401 91 178! 347! 256! 2694! 761 262! 81! 1483! 1IS 96951 33463SI1(olkhoz Income 4 01 Of 01 0! 0' 6 4931 290! 69! 163! 61! 511 i[ 0,36 IPrivate Income 0 ol 0l 0! 0! 0! 0 0! of 0! 0! 0! 0! 0 280337lUnamo,lzd Value 1-205.-2231 .81 I -s -! 151 -88! .2-161 .5621 -1141 -132! -791 -1661 -661 -20871 -54838 INadIofal Income 1115901221 34881 2491 127071 93451 163861 1046781 141591 13098! 41990! 35511 9694i 2686621 7473739lTotiJ Output [353141749271 187981 779! 55062; 33223; 664371 278837;i 455651 ~45969i,1498951 199738; 34037110385811 15589740 Import 0 3311 2141 0! 3940! 13731 80831 29971 2298. 777! X221171 14831. 12071 85078! 0141 ITotsl Sup*l 1353141 752581 19012! 779! 59002: 3459674520' 308744' 47863! 46746i1720121214569! 352441 11236591 15589
46

USSR 1: 1987 InPut-Output Table in Purchaseirs' Plrices--Official Format
Page 2~~~1~~~~1 6 7 1I19~ 20 !21 123 1 25 1_2_1 9 31 133 1353137 1 39
As.T :& iOhrT AL-IomiTTLTOTAL I Net I nvew. 1Dpm I Other iI ExportiTTAmL
IForesry IProd I PROD. I holds i SERV. IN-PROD.1 Flixed i I clation I USESI PIIZIIIr I 1207. 22521 11281 _35j 253051 45961 480 3! O 91' 01 F 0 1 6141 35315
2 Peto-Ga 3471 69381-381 2' 55081 4771 5251 88021 0!9! O 14231 01 99231 752573 iCoal 2561 1521 1551 3 I156881 2561 1790! 20461 0 i 261 0I 2TI 01 12251 19010
4O0ther Fuels 116 31 - 61 01 6481 561 671 1231 0. *41 01 61 01 61 779
5 Feffos Me" 174 2401 331 1 53992 i 1141 12281 13421 0 1 -631 0 1 0 0 .37211 59002
6 N-FeffusMetals I 9 311 -7] 21 3 12741 0j 9871 9871 01 360 0 01 0j 1972J 34593
7 C7028c1422 184 361 53899 90371 4061 130931 01 -$951 0l 35101 19 34081 745248INIBMW j 938 260 741 531 123207q 29960 93091 392691 173431 1384 814341 329031 1611 130441 308745
& paper 10201 3221 6061 6341 31932 i98131 15261 113391 $581 .181 952! 2 73. 31891 47864tocn.mtdl I 9351 561 31441 51 435611 30591 11101 41691 0! -124 01 5 251 234i 46747
1 1U.h jdusL I 331 3941 493. 1011 827651 812601 2353! 836131 170i -21 484; 678! 11081 34041 17201112Fo Idsr 6705 -- 181- 6451 21 620211 1482571 71411 1523981 01 -152 01 711 01 16071 214568
13 Other lndusry j13639 3591 3101 8161 220571 103881 16531 120411 27! 1561 851 01 96! 7811 35243
14 Total Industry I 44787 152911 49761 17121 6013671 2980731 405461 3386191 180981 -6221 82956! 386331 148321 4312811123661
IS Construction 0 01 01 01 01 01 01 01I730091 2732: 743951 01 57611_ 0_ 15589716 Api. & Forustr 47171 91 7161 - 01 1824331 S74601 11871 586471 28131 71201 7201 01 17071 2001 253640
17 Production T &C 3075 1291 4231 10691 656S31 01 4563; 45631 01 01 0! 01 o1 1201 70336IST&D 7028 01 01 14371 47736r 01 0; 0l 01 0l 0 01 01 0l 4771619 OthterProd.Secta 269 f 16-71 4631 62-1 30841 '54601 9721 6432! 192! 91 0 ! 0 903 00
20 Material Ouftlys 102329 155961 65781 42801, 90025211 3609931 47268! 408261! 9-4112 94221 158071: 386331 89501 4435111366205221 DeprecIation 19758 181281 79 61121 12552T21103; 336551 17061 1j
22 TdOtaIOuIy 122087 33724 -11327!1 4746:10229631373545i 709561 444501 941121 9422113580711403471 89501 4435111820124
23 Wages 2524 15669 184211 12101 1935621 I 1 1 . f 124 Osher Earnln 490. 426 2251 471 6108! II_____j 25 BuaNsm Trips 2941 1821 214 4125 1
26 OfthrWages 1961 244i IlI 41 38571 T______r_____27IICoIkto Pay 233941 391 01 1321 270161 . _____i
28ISociAl Security 3392 13281 12571 71C 19861! I_____ __
29 lColkhoz Soc. Sec. US55 31 Gi IS! 2793 *
30 Totai Profit 12341 172112124; 1781 189 14 .j 1
31 Bonus Wagso 2165 956! 268!1 5 5
33 Net Subsidles 0 0 -0 0-691531 j! i 34O0thgr Statencame 551 215 M 4c12f - 7 201681 iT
38 Nadional Income 123280 36610! 36390 46801 5443591 -i
39 Total OutPut 245367 70334: 477171 942611567322 ______
41 lTotal Sup*4 253641 703341 47717; 30804: 16620S21 _____
47

USSR 2: 1987 Input-Output Table in Purchasers' Prices--NEB FormnatM(Wloas of Rubles. Current Prices
Page I1I 2 1 3 4 151 6 i7 1 8 9;1 1 1 211 1
______________I Poweril Petlo- I Coal I Other i Ferr. N-Ferr.I Chem., MDMW iWoQ(d I Coasw i LJght I Food I Other. Total I Coast.
_____________ ~~as I uels I Metals iMetals 1 i Paper iMaier. i I LInd. IlIndus-y II Pwer136! 881 $41261 1850! 15601 38591 41791 8741 1528 i 8971 9731 583! 190691 1614
2 Petuo-Gau 1034)!1741 7 301 1851 i 7481 33371 26531 9881 23791 2671 13931 4101 418911 237031coal 36371 0? 62721 3? 3990i 1 10! so; 2671 1301 3101 581 1621 44; 150331 894 Other Fuels 26S I II If 115; 0 ! Ij 13! 26! 121 29g 21 2! i 2; 4691 545 erou Metals 941 811 1631 141 193191 6591 12851 201481 i5171 2416; 1131 3491 388 i4S3461 8198
6 N-erros MeLls 1521 1 3 2 ?1 119211 146971 10621 118961 50? 134 40? 1731 8711 310121 2137 htcl 1201 5901 274? 261 6041 6041 203521 97201 16381 10961 55171 8681 11331 425421 2687
8 mamw ~~14171 3761 844 331 19011 801? 17761 845591 15711 11611 7821 12271 6661? 971141 133069IWood &Paper [481 34! 4651i 7' 1971 1591 14611 31021 136211 8131 -5-2-2? 17581 903? 230901 626010 Coast. Materials 1511 241 75? 3~ 941 109i 3401 13161 4291 7756, 761 4931 121! 108871 308291 1 Ught Industry [ 52! 451 86?1 5! 210? 991 18381 2511 i13361 362? 71039! 11121 14331 801281 81612, Food Induy 1 1 39i 10? I i Si! 37; 10541 389? 81l 82! 6161 49975; 21791 54548? 10313 OtherlIndustry I34 j 55? 101?i 1? 75? 431 5951 810' 1421 1761 1681 994? 31481 66491 28414 Totail ndusu 168' ~20S591 89201 265? 32063? 19627:137022? 141576! 21389i 18242? 80097 59479? F1168il-467778T 6682315 Construcdon )i 0 0 01 0' oi o 01 0 01 0? 01 0? Of 0? 01f 016 Aal. &Forestr _1 0 I? 0? 2? 2- 58i 941 913? 21 166841 108404? 8300? 1344611 7617 ProductIon T & C 2661 170491 3332? 891 40051 12231 32881 82281 41311 9372? 1758? 45881 1013! 583421 261518T&D 0? 2375 4131 101 9881 1171 26141 46291 1207? 827? 6756! 182151 11001_392511 019 Other Prod. Sectors 38?- 1271 48 21 465j 1181 1641 8251 115? 198; 107? 2951 145? 2647? 924i0 Mateia Outlavs 17163 411124 366? 375231 210871143146? 155352? 277551 286411105402! 1909811 222391 702479? 7043821 Depreladlon ? 6578? 7166 2605. 1651 48481 2823?i 69341 192971 3665? 4252? 2518? 53211 2137? 682791 1133122 Total Ouftays [237411 47276! 15319? 531? 42371? 23910' 0080o 174649? 314201 32893; 107920: 196302124346i 770758! 81769
i3 Wages I1905? 881 4869? 172? 3696! 2203? 4393? 40548? 69361 6121? 95941 6822? 3073? 91213? 4180524 Other Eantings 99? 81[ 220? SI 141? 1281 1461 1646? 277? 1811 1961 2581 86? 34641 1456
25 Busi_ew Trip 22 0 5T i 431 26? SI? 4711 81[ 71? 112: 791 36? 1061? 48626 Other Wages 771 71f 1631 31 98? 102? 951 117S1 1961 110? .84! 179? 50? 24031 97027 Kolkhoz Pay 4?1 O 0? 0, 0? 0? 3? 555? 259? 701! 651 399? 280? 1635? 181628 Socdal Security 29? 1441 5111 22? 4171 254? 657? 5883? 599? 739? 121.71-842? 262? 118461 396729icKhou z SOC. Sec. 1 0 0 0? 0i 0? 01 63? 29? Si 7? 62? 321 2021 1830 Toal Proflt 6776! M1094 2943. 451 82721 6139? 93 481 55131 4017? 135671 117431 2609g 1264221 20074
31 Bonus Wages 286? 1861 295? 18! 372! 2501 5601 4535? -471 486? 889? 6011 345j 92941 2696321 BudalzeSerylce 5621 907? 244? 41 6861 5091 828? 3642? 457? 333? 114 17671 216? 113031 124433ITurover Ta 2557_1119061 01 1? 154? 362? 38541 116911 294? 17631 20808 38146' 2882? 944181 034 Net SubIddie I 0 0? -51141 0 0? 01 -26861 -22241 0 0' 1-3630? -56099? 0? 4697531 03S OfterSate lncoe 1331 3928? 131? 8 1 1621 3151f 2271 22041 62? 2401 65? 1368? -15?I' 8858? 2737
36 BusleuServices[ 1331 339 411 61 741 1431 131i 22041 62? 98? 66? 5131 15? 3825I 273737 Odw Net Incom3589 g0! 2' 88? 1721 96! 0 0' 1421 -1? 8551 0:O 5033? 0
38 ok4 1co0o 601 oJ ~ O i 0 61 4931 290f 691 163? 611 5211 _1607? 039,PdteIn0 0 0 01 0l 0?_0? 0 0? 0? 0? 0l 0? 2803
40 Unamordzed value -205? -223 -81 1 -5 -151? -88? -216? -5621 -1141 -1321 -78? -1661 -661 -20871 -54841 INet Forelpi Trade j-614?1-9592? -lo] l?_ -6: 219 -599! 4675I 66 -8911 543? 18713'1 13224?' 476? 4195 042 NaIIooaacmen T10959118 i f2468 2,42! 129101 8714?21032? 1210511 132541 13619? 606871 16660 10120! 309775? 7412843 ToWk Outpu t333141 7497187981 7791 55062? 33223? 664371 278837f 45565? 459691 149894? 1997381 340401 10385831 13589744 Import 01 331 214_ 01 3940! 13731 8083? 29971 2298? 777? 221 171 14831? 12071 850781 0
45 TOWE Supply 351155,19012? 7791 590021 34596! 74520? 3087441 47863? 46746, 17201 159 54;1261159
Note.46ITotal State Wagso t2268? 1138? 537 91 4166? 25551 5048? 46258! 7603, 6717;. 105671 7602? 3468i 102910? 454-71
48

USSR 2: 1987 Input-Output Table in Purchasers' Prices--NEB Format
Page 2*1 _____________ 16 117 1 1is 19 1 20 -21 !22 ,23 24I25 , 26 i 27i 28 29 130 j 31___________IAgri. IT &C1 T & Di Other TOTAL, House-. Hous. Transp .Comma. Educ.: Cult. Health. E & C:Science.Blank&? State
____________ ~~~I I i Prod. : PROD. halds I , .Arta I Healt i nsuar. iAdmnnI Power ~ 12071 22S2?i 1128-1 35. 25305 i4S961 1665: 601 i 144; 877 i 106. 603 i 1586 741' I3 50-s
2!Petro-Gas 34771 69381 3181 24; 550181 42771 655; 27031 127! 2911 3S: 2001 526: 400; 231 903 1Coal 2561 152: 155I 3 . 15688?i 256? 747;. 311 13: SOS i 621 349, 9281 60i 4! 171410ther Fuels 11"61 31 61 0. 648 i 561 25! 0; o,0 211 2 i 14: 37: 3 : 0 : 1 SiFerrous Metals 1741 2401 331 1 539921 1141 1141 541 7I 171 2: 11! 30i 1020; 0 316N-Ferrous Metal 91 31 7J 2 174 ! 5 9 1I 101 I1. 7; 191 954j 01 07 Chemicais 70281 1422 1841 36! 53899 i 90371 3911 4001 45i 146i 1321i 16871 19651 11511 211 838 MBMW 93871 260 7471 53i 1232071 299601 6481 997! 1131 4161 50! 286! 7521 6746i III 449 Wood &Paper 10201 3221 6061 634 13193~21 98131 408 i 72; 25: 252! 30. 173! 4551 5061 121 49
10 consu. matetlas 9351 5611 3441 5: 43561 i 3059! 458: 531 10. 1401 171 96i 2,531 3281 1 1 71 1 Ught Industry 8331 3941 4931 lolli 82765 i 81260; 323: 108! 26: 8321 101!1 572! 1505! 3521 8! 3112 Food Industr 167051 181 645! 2! 62021; 1452571 157, 88: 01 36711 4571 2692. 6820: 75! 0! Ii13Other Indusn 136391 359! 3101 816! 220571 10388? 299. 1051 11; 4211 51: 290; 762 i 3371 281 III14 Totakl Industry 447871 152911 49761 '7121 601367:298073; 5896! 52211 5221 7602? 10471 69791 15628: 126711 .1211 487
15Costvcio 0 0 01 0! IiI16 Agi. &Foretr 47171! 9! 7161 01 1824331 57460i 75; 4i 311 c951 72! 409! 1076' 24: 1T1259117 Produacton T &C 30751 129 4231 10691 65653? 0! 14S6318 T &D 170281 0l 01 14371 47716j 0l I I 19 Other Prd. Sectozs 3251 5601 13131 631 58321 5460! 681 70? 281 2481 75! 1021 375! 2971 27, 10720 Matetal Outlas ~I0238i 159891 74281 42811 9-03-001 i360993! 6039: 5295! 5521 8444! 11441 74901 170791 129921 1491 774821 Depreciation I 19758' 181281 47491 4661 1227111 1 159121 46161_ 1261! 45711 482! 2562! 76171 37171 801 45522 TosaOudays 11221441 341171 12177! 4747 i1025712 -3609931 21951 i 9910; 18131 13015! 1626: 10057!24696i 167091 229! 8203
23 Wages I277051 15669i 184211 3738i 198551! 186291 7469? 2369! 20648i 2948! 12095: 356911 9746! 1.2211 549024,OfthrEartuinp 1, 90F 461I 2251 47 61081 272! 4Q01 90? 2961 72' 234! 6021 7581 681 212251 Buanew Trips j_ 322!. 1821 2141 43! 2309: 100: 871! 28! 240i 34! 1411 415? 113! 2-4T 68261 Other Wages 168!1 2441 III 4' 37991 172? 3131 62! 56! 381 0 31 187! 6451 44j 144271 olhz Pai 1 233941 39? 01 1321 27016: i 2281 281 1371 .393i I281SocIial Securtity 115151 1328! 12571 292! 202051 485i 628i 187! 3549: 212i 8511 2612: 9741 1141 42229lKOlkhoz Soc. Sec. ] 2555! 3! (%I IS! 2793!1 1 241 3! 161 43! I 30IToulI Pmofit j 12341117221! 121241 17811 18963k i 946, i945! 3464, 0 0~ 0 ! 0i 1678; 8953; 0
IBonus Wags 121651 9561 2681 35? 15414! 569! 735! 2751 1841 961 128! 4-08- 1008! 341! 032 Busittes ServiesI 1401! 15291 14451 148! 1706974 74 132i 0j 01 0 0. 64? 1611 033 Tu19:_ __ __ __ ___e_ __ ___741_ __ ___7_Tax 0 01 28i 0! 94446 I 34 Net Subsldles 0 0 .95
- I I 0: .6975~~~~~~~3! 35 OtherStat Incomne L 495! 1764! 3562! 6? 17422!1 240i 193i 88! 2821 128i 224! 634? 9421 142! 27436 Business Se 1csI 4951 741361 6 16! I20 9' 88i 282: 128! 224! 6341 9421 142 2737 OhrNtbm 0 i10221 01 0!i 60551 ( 0' 0 0'1 0 0' 0 1 o 0 01 038!IColkhoz Incme 114772! 01 0 19: 163981 . _ __ __131[I'rivaw income 1 434741! l 0 14081 47685! 40jUnamortlzed Value 1-9331 -233! -771 -lOi .38881i -61i -37i 1 T ____
411 Net ForeIgn Trade 18074! -1201 7703? 475i 58082!1 42INatlonalaconte 133882136097! 432431 7903! 6050281 '11572; 10575! 61611 232111 34871 13685j40383: 140981 10498! 6398
______Otpt_4_527034_4717_117:1 338 _332__4___________11__73765793007 _172 ___-
44~~I3port ...-.~!±L-...2L82741 0 13781 94730!45 Total Supply 1256226;70334! 47717; 13553!1667388; !33523.204851 7974 ; 36226? 51141237371657'387 021I0
Note:IT~ 46 Total State Wages I 3003816869! 187001 37771 217764' 0. 9370 851 7' 2706'20888; 3082: 12316.36286 31398, 1606' 5634
49

USSR 2: 1987 Input-Output Table in Purchasers' Prices-NEB Format
Page 332--i33 1 34 35 ' 36 i 37 i'38 139 i 40 41
___________ 'TOTAL; Other i TOTAL Net jUnfin. Depre- Invent.. Losses,Expon, TOTAL_ ____________ 1 SERV. I N-PROD. Fixed 'Const. ciatlon ! USES
I Power 4800i oi 4800: 0 0 0. 0 6141 353152!Petro-Gas 4525! 1423' 5948; 0' . 0 91' 0 9923! 752573'Coai 1790! 251 1815 0' 0 26. 0. 1225! 190104;Other Fuels 67! 6! 73 0G 0i -4 0' 6' 779S Ferrous Metals 1 1228: 101 1238' 0! 0. -63 0' .'211 590026 N-Ferrous Metals 1 9871 0' 987; oi 0' 360; 01 1972! 345937 Chemicals ! 4056. 35101 7566 01 O0 5951 191 34081 745248 MBMW j 93101 329031 42213'173431 6451 81434. 738' 1611 13044i 3087459 Wood & Paper '15271 21 1529! 5581 9521 -181! 73~ 3189i 47865
lOConstr. Materlals o1110 5: 1115. 0i 0. -12471 25 234i 46747IljLght Industry 1 23531 678: 3031: 170! 484' -211: 1108: 34041 172011I2iFood Industry 1 7141i 711 7212i 01 0. -1529! 0 16071 21456813Other Industry i 16531 li 1654' 271 i 85i 1561 96: 7811 35244_ ITotal industry 1 40546; 386341 79180: 18098! 6451 82955 -1269j 1482i43128 1123660l5IConstruction I Of 0. 0 73009; 2732. 74395 0; 57611 0: 15589716(Asri. & Forestry 3773 0 3773: 28131 720! 7121! 1707j 2001 256227171Production T & C 4563j 01 4563' 01 0; 0! 0 120: 7033618T&D 0; ol 0 ! 0 0! 0' 0; 47716
_11ther Prod. Sectors_ 9721 3j 975: 1921 0. 192! 0! 903i 13554
20 MaterialOutiays 498S3. 386371 88490 94112i 3377:158070, 6044i 8950 443511166738821 Depreciation 1 33656! 17061 35362: 1 15807322 Tot Outlays 83509 403431 123852 94112! 3378 158071! 6044' 8950 4435111825463
_ __ _I___ _!___ __ _ I i I ! i - I- - .
23 Wages 706151 18116! 88731!28
24 Other Eannings 24021 132Si 3727i . i 9835251 Business Trips ! 8351 2041 1039; ; 1 334826 Other Wages 1567! 11211 2688. i ' 648727 Kolkhoz Pay 3931 i 393i i : i ' 27409
8J'Scial Securt 54221 1772! 7194. ! ! 2734929jKolkhoz Soc. Sec. 431 i 43 . 283630 Total Profit 179861 26491 20635 ; i 21059831 Bonus Wages j 3336j 236i 35721 i I I 1898632 Business Services I 505; 2251 730i i 1779933 Turnover Tax I 1 94446
34 Net Subsidies I_ ol__ 01 .I -6975335 Other State Income 2513! 2513; i 1993536 Business Services i 25131 2513! | ?_ ! 13880371 Other Net Income i 0 1 01 1! 605538 Kolkhoz Income 0 : i 0' '_._' _; ____ 16398
39Prhvate Income 1 0: 0; i 1 4768540 Unamortized Value i -981 -98i -398641 Net Forelgn Trade 0 58082
42 Nafonal ncome 996851 238621 123547 . ; 72857543 Totd Output 1831941 642051 247399 1 1 1249595644 Import i 0 j Oi ii ___. _' _i ___94735
45 Tota Supply 1831941 6420S! 234364 1 2590686
I lNote:j ;46 Total State Wages 75518 194731 94991' , I 312755
50

USSR 3:41987 Input-Output Table in Purchasers' Prices--SNA FormatMillons of Rubles, Curren: Prices
_ _ _ _ _ _ _ _ _ _ _ _ _ _ _ _ _ _ _ _ _ _ _ _ _ _ _ _ _ _ _ _ _ _ _ _ _ _ _ _ _ _ _ _ _ _ _ _ _ _ _ _ _ _ _ _ _ _ _ _ _ _ _ _ _ _ _ _ _ _ _ _ _PP a g e I
-. ~~~~ ~II1 2 13 14 1 5 i 6 i17: 8 9 3 0 I 11 ! 12 I13 I 14 15i_____________ I Poweri Petro- ICoal Other I Ferr. i.N-Ferr.!Chem.! MBxW !wood I Consir ULght I Food Other; Total I Consi.______________ I Gas i I Fuels !Metals ;Metals' __iPaer_iMate __I Intd. I IndustryI
I lPower 13061 1880i 5541 26. 1850: 15601 3859j 41791 8741 15281 8971 973! 5831 190691i 16142!Petro-Gas -103411 174211 73: 301 18511 748 i33371 26531 9881 23791 2671 13931 410i 418911 23703Coal i 36371 0 162721i 3 3990! 1101 501 2671 1301 3101 58I 1621 441 150331 89
41 OherFuels 1 265 i II 1 115; 0; II 131 261 121 29: 2 2 1 2 1 4691 54SjFerrous Metals j 94! 811 1631 141 19319: 6591 12851 20148! 5171 2416! 1131 349j 188! 453461 81986IN-Ferrous Metals 1521 131 21 1 ! 1921: 146971 10621 118961 501 1341 401 _1731 8711 31012! 2137 he cb120! 5901 274! 261 6041 6041 203521 97201 16381 10961 55171 8681 11331 425421 2687
9 ?4BM` W14171j 3761 8441 331 19011i 8011 17761 84559! 15711 1161 i 7821 12271 6661 97t1414 133069 Wood &Paper 481 341 4651 71 197! 1591 14611l 31021 136211 8131 5221 1758; 9031 230901 6260
IO onw Mterab I II 24! 75i 3' 94' 109! 3401 13161 4291 77561 761 4931 1211 108871 30829~~J~i~d~~Z.ZZi 52! 45! 861 51 2101 "I1 18381 25111 13361 3621 710391 11121 14331 801281 8612 Food lndusty I 341 391 101 I11 51! 371 105S41 389j 811i 821 6161 499751 2179; 545481 103
13 OherIndutry3411 551 1Oll Ii1 751 43: 5951 8101 1421 1761 1681 994113-1448:-6-64791 28414 Toi Indstry 168581 20559i 89201 2651 32063! 19627!,370221 1415761 213891 182421 80071 S9479 1 1-16811 4677781 66823
1 0! Ol 01 01 0! oi o 01 0! 01 0! 0 0 0 .0 0l O 016IArt. ForstryI I 0; I i 0! 2: 2i 581 941 9131 2: 166841 1084041 83001 1344611 76
17Pouto C 12661 170491 33321 89! 40051 12231 3288! 82281 41311 93721 17581 45881 10131 583421 2615181T &D i 1 23751 4131 iol 988'i 1171 26141 46291 12071 8271 67561 182151 11001 392511 019O0ther Prod. Sectors 38! 1271 481 2! 4651 118! 1641 8251 1I15! 1981 1071 2951 1451 2647 i 92420IMawrla duays 37163! 401 101 12714! 366i 37523: 21087' 431461 155352! 277551 286411 105402: 190981 i 222391 702479' 70438
21 Housig-Communl I 2251 3631 98! I 1 2751 2041 3311 14571 1831 1331 4591 707!1 7 52 722 N-Prod. Transport 361 17! 931 31 701 42! 84l 771! 132! 1161 1821 1301 58! 17351 79523 N-Prod. Communlc. i 0 Ol 01 01 01 0101 - 0! 01 01 0l 0 01 024 Eduction 1 1211 171! 531 71 -148, ~1101 1781 704! 981 72! 182! 2601 471 2143! 43_925 Culture J 271 38! 321 01 321 241 391 1931 221 161 421 57! 10! 512 10126 Health, etc. 1 941 1331 411 1 1 115' 86i 139! 5711 771 561 1611 2021! 36i 17121 37727 Educ., Cult & HeathlI 2421! 341! 1051 21 2951 2191 3561 3468! 1971 1431 3851 5191 93i 43661 91728 ScienceT 1421 3561 20! SI 871 1571 1491 17191 381 721 521 104! 51 29041 119229 Banking &IUnsuncel 721 180! 271 0! 761 56! 91! 902! 51! 37! 2451 9001 24! 26611 69330IState Admin. T 0 1 0 1 0 1 0 0 1 0 1 0 1 0 1 0 1 0 1 0! 01_ 01 01 031 ServIc Outlaya T_7171 125S71 3421 121 8031 678i1 lOll 63171 600' 52 1 13231 23591 2671 161881 446732 Defense &Other I 0,1 0! 1 01 0 0 i 0 1 01 0 1 0 01 01 01 .01 0' 033 Total Outdays 178801 413671 130561 3781 383261 21765! 441571 1616691 283551 29143' 10672511933401 225061 7186671 74905
34 Depreciation J6578! 71661 26051 1651 48481 28231 69341 19297 36651 42521 25181 53211 21071 68279! 1133135 Wages I 90o1 881! 4869! 172! 3696j 22031 4393! 405481 69361 61211 9594! 68221 30731 912131 4180536 Other Wages 77! 711 1631 3 1 981 102! 951 11751 196 110! 841 3791 501 2403! 97037 IKolkhoz Pay 41 01 0l 01 0 1 01 3 1 5551 2591 701 65I 3991 2801 16351 181638 Solal Security i299! 1441 511! 22! 4171 2541 6S71 5883! 5991 7391 1217! 8421 2621 118461 396739 Kolkhoz -Soc.e I I 01 0!- 0! 01 01 0! 3 9 8 7 2 32! 202!_ 1840 Nt Prfit 62141100271 26991 411 75861 5630! 91451 402491 50561 36841 12421l 9976[ 23931 115119 1883041 7Bonus Wages I 286 1861 2951 181 3721 2501 560! 4535 4711 486! 8891 6011 345! 9294 2696
42 TummrTax 2.S57 119061 0l I 154! 362! 3854; 31691, 2941 17631 208081 381461 2882: 94418i 043INet Subsidies 0 01 -51141 0 0O1 01 -26861 -2224 0l 01 -36301 -560991 0 i -69753 044Ohr e ncm 35891 901 2' 881 1721 961 0 0 1421 0l 855I 0 1 5034 04S Kolkhoz Income 141 0 1 0 0 0!I 0 1 6 1 493 2901 691 1631 611 5211 16071 046Prtvate Income 0 0 0 0 0!1 0 0 0 0 0 0 1 0! 01 0 i 0280347 Total Lsses I -205! -2231 -811 -s1 -153! -88i -234! -7231 -1871 -157! -11861 .1661 -1621 -3568i -630948 Net Foreign Trade [ -614! -95921 -10111 -61 2191 -599 I4675, 168631 .8911 5431 18713! 13224: 4261 419501 049jGNP [168201 23968! 47311 3951 16955! 10859126938! 1338701 162461 173441 607741 196221 118641 3603851 75231SOlTotal Output I 35314! 749271 387981 7791 55062! 332231 66420: 278676! 454921 459441 148786' 1997381 33944i1037102! 150136
1I mor - 0 = 3311 2141 01 39401 13731 80831 29971 22981 7771 221171 148311 1207:, 85078T 0S2ITotai Supply 1 35314! 75258: 190121 779! 59002; 34596: 74503; 3085831 477901 46721! 1709031 214569! 3515111122180l 150136
51

USSR 3: 1987 InPut-Output Table in Purchasers' Prices--SNA Format
Page 216 17 18.-19 20 21 22 23 24.-25 26 ,27 :28.-29 30 ,31
Agri. : T & C T &D Other TOTAL Hous. -Trartsp Comm. Educ. Cult. Health E & C:Science:Bank&, State iTOTA
Prod. PROD. Arts 'Health. I lsur. .Admin.- SERV.I Power 1207 2252 1128 35 25305 1665. 601 14 877 106. 603; 1586. 741! 13' 50. 48002 Petro-Gas 3477 6938 318 24. 55018 655. 2703: 127 293. 35 200 526. 400. 23: 90' 4523. Coal 25. 152. 155- 3. 15688 747. 31; 13 508 62- 349. 918. 60i 4. 171 17904 Other Fuels 116: 3; 6' 0 648i 25: 0 0 231 2 14: 37. 33 0. I 675;Ferrous Memls 1741 240' 33. .-53992! 114: 54; 7. 17.6 2 31: 30 1020; 0 331 1225
63jOtherroudtaLsr 169 359 37:86232074 29 90 13 421;5I 290 762 3371 28i 11311677 4Themalndsv 447087 15291 1497 32603679 5896 5221! 4522 74602 1047: 16979; 6562 12671! 1211 487 40546
106.Ar. Matriasy 47173 9. 7364 0. 3843361 758 43. 30 595 172 49 106 2531 328 I; 71 1187II7 lgtrIdusotry 83075 129. 423 1069 826565 023 0: 09, 2 032 01 072 10.- 352 0 310 03121T& FodIdsr 37028 0 0:64372 4776201 05 0: 0 0 067 047 29 680 05; 0 , 0' 014139iOtherIndusetory 13259 3560 1313; 863 225832996 70:. 28 4248 25102 35 29076 371 27! 1071 972320;Mtei'alnustry 3023867 1529897428; 74281 96013001 603 5295: 552. 84442 31044. 67490 17079 12992, 149 59987; 420546
23i Cnstrudctonmzz. 0' 0. 0 0 0 I 20: 32 11 5 791 278 132 701 122 64216.duAion & o 5tr 7171 428 2716 20. 38073 750 46! 29 09. 0.: 409 0 0 1076 2l 0!5 1357175ICProucto e C 37 1261 94! 4 4 43109 884.5 11 101 6 0 0. 0 0 . 0 1 2 0 30181eaTh etc D102; 30,: 78 157 30761! 39; 36 23 0 0 0 0 O 0 8: 0 305
207IEdauc..CudHays 1023864159856 428 433 139037752 6390 592: 55.840. 014 . 0.0 0779 , 7920 049 59 270421 HosigComn al I 521: 4629: 2.305 391 5287, 102 746 28 0: 03. 0. 063 7323 03 0.1 788322.BNkProd& Tnsportn 73740 2981 3351' 716 77: 398 86' 120' 32i 30. 06 0'2 60! 1 43 034 077 847230:StProdm. Cmu ic 0: 0. 0: 0; 0 0s 20 02' 016 03 09 078 0.2 701 022 04341 Ed uctiaon 573419 42453 5222 297. 31976 414' 346 248. 522 162 365 104 19 327!; 341 13852
326DeHealh.e&tce. 780 0. 030 60' 09 06 0. 0. 0. 0. 0. 03 0: 0, 10337ToEduc. CIa&Halh 1148!854 1650 4478 934977.2 6453 5692!00 5896 106. 75581. 1411 476; 90. 2755
30: State Admin. I 0 0 0 0 0~~~~~~~ 0 .- 0 0 0 0 I
34 Depreciation 39758;1381281 4749; 466i 122711 315912' 4616 i1261: 457 482- 2562' 7635i 37171 80i 4551 3365635iWages 27705: 15669, 184211 3738, 198551; 8629; 74691 2369i 20648. 29483 12095: 356931 97463 12231 5490; 70615361 Other Wages 1 68! 244! 11I 4: 3799. 172' 3133 62: 56 38' 93; 187: 6451 44 1443 1567
37 1Kolkhoz Pay 23184;i 39. 0 132! 26806 0 0 0 228: 28' 137 i3933 0!i 0! 0 I 39338! Social Security ISIS. 3328- 1257 292: 20205. 485, 628: 187, 1549. 212, 8531 2612: 9743 1134 422! 542239!Kolkchoz Soc. Sec. 2555! . 0 1! 273 . 0 24; 3 316; 4 0! 0. 0; 4
4OiNet Profit i 10940, 15692, 30678- 1633, 172892. 1873 i1871! 3332: 0: 0 0' ; 16141 8792 i 03 3 7482411 BornusWages 2165' 956i 268. 35! 15414 569' 735 275, 184' 96. 128: 408' 3008! 3413 0! 333642 iTurnover Tax 0 0 28: 094446- ' 0 143l1Net Subsidies ; 0 0 0 0-69753 , 3 : I.! 04410ther Net Incomne 0: 1022. 0 0 6056:. 0, 0 0 0. 0. 0! 0, 01 01 0l 045 Kolkhoz Income 13751! 0: 0. '19. 15377; 0; 0 0 0-T
46 PrIvate Icome 43474! 0. 0. 1408: 47685' 3750- 1500: 0' 1650!20.50'40 965047 'Total Losses t-2640; -2331 -77 -10; .12837. -633 -37 ! I -9848iNet Foreign Trade 1 074. -1201 7703: 475 ~58082: I jIi 325073 250749!GNP 1148484'51772: 42770; 8172! 6868133 30821' 16337! 7174: 28930 4057'18382 51349; 16696.1 2758; 6511 i141645S0ITotal Output :246245, 70334, 47717 132375! I563708. 37273 219851: 79741 37876. 5364; 26237. 69477! 30807 3107271 74511 188201S1llimpot 182743i 0: 03378i394730 : 1 i I 52!Total Supply 254519 70334. 47717 3355321658438 37273' 23985, 7974 37876 5364. 26237 69477. 30807: 30727: 74513385694
52

USSR 3: 1987 Input-Output Table in Purchasers' Prices--SNA Format
_________________ ~~~~~~~~~~~~~~~~~~~~~~Page 3______i 32 33 34 . 35 36 37 38 39 40 14 42 43 144
i Defense TOTAL House- -./ -/- Govern. Defense Total . Invent i Net ! GNP i Export TOTAL- _______________ I & Other OUTLAY holds Paid Free &Other Fixed iExpor USES!Power 1 0, 30105. 4596 4596. 0 0. 0 0. ol 0 4596' 614i 35315
2.Petro-Gas | 14231 60966 42771 4277. 0 0 0 0- 911 0. 4368: 9923: 752573ICoal 25, 17503 256: 236; 0 0 0 0 26, 0 282: 12251 1901041Other Fuels I 6 721! 56 56, 0 0 0 0! -4 0: 52! 61 779SlFerrous Meals 10 55230, 114 114; 0 0 0 0, -63i 0 51i 3721i 590026jN-Ferrous Metals 0. 32261 0 0: 0 0 0 0 3601 0Q 360! 19721 345937.Chemicais 3510: 61465! 9037: 90371 0 0 0 0! 5951 0 96321 3408; 745058 MBMW 32903' 165420. 29960 29960 0. 0 0 99422: 738, 0: 1301201 13044. 3085849jWood & Paper 2i 334611 98131 98131 0; 0 0 15101 -1811 01 11142i 3189i 47792
I0lConstr. Materials i 5 44676 3059: 30591 0 0; 0 0: -12471 0: 18121 234i 46722II,IUght Industry 1658 86776- 80280 80280- 0 0 0' 654: -2111 0i 807231 34041 170903l2iFood Industry , 3531: 72693 141797 141797 0 0. 0. 0 -15291 0 140268; 1607 21456813iOther Industry ' 1 23711 10388i 10388. 0 0. 0 112! 156: 0 10656 7811 3514814iTotal lndusurv 43074 684987. 293633:293633 0 0 0 101698 -1269 0! 394062: 43128; 112217715 Construcdon . 0 0 0 0. 0- 0 0 150136 0! 0 150136: 0! 15013616Agr. & Forestry 370 183990- 7460. 57090' 0 2586 0. 3533 7121: 0° 70330. 200: 25452017lProducton T & C i 0, 65653- Oi 0 0. 4563: 0 0! 0, 0i 4563i 120: 70336181T & D 0 47716i 0i 0 0 0. 0! 0i 01 7703; 77031 0i 4771619f0ther Prod. Secor ± 3; 6807 54601 5460i 0. 0! 0! 191; 192: 0. 5843i 903! 1355320MatiWal Outlays 43447 989152 3565S3.356183. Oi 7149, 0: 255558 6044. 7703- 6326371 443511 165843721 jHousing-communal I 272! 853S 26245, 12383i 13862. 1803i 690; 28738. j -37273221N-Prod. Transport 116: 5578' 13196 13196, 0' 0 3211! : i 16407i ; 21985231N-Prod. Communic. 41. 683i 3290 3290' 0 2252. 1749 . 72911 ' 7974241 Education 0i 3942; 33934. 2678: 31256: 0 0 - .33934i : 3787625 CuWture 0 9141 4443i 21941 2249. 0 0 I4443, 535726iHealth. etc. 0 3167! 230671 59851 17082: 0- 0; : . 23067 ! 2623427jEduc.. Cult. & Health. 0 8023. 61444 10857, 50587 0 0. . 61444! 6946728iScience 0. 6075S 0 0 0. 6537- 18195. 24732 . 3080729 IBanking &Insumarce i 0. 7353! 3374' 33744 0 0- 0 . 2507: 58811 1323430;State Admin. 0 0. 4642. 4642: 0o 2809 0 ; 7451! . 74513li Servic Outzlays : 429 36-235712191 47742- 64449 13401. 23845 0 0.2507 151944w 0 18569432! Defense & Other 0 0; 0: 0. 0 0. 69015S 690151 6901533 Toul Outlays j 43876: 1025409 468744- 403925 64449. 20550 92860. 255558. 6044i 10210 853597 44351: 1913147
I ~ ~~ ~ i ; ; ____i_. i_i_i__34!Depreciatlon 1 1706- 158073; i . ! i _ ;_I_;3SIWages 1 38116 287282. , .i j i i36!Other Wages i 1116' 2688 i , I _ :___|_._j37 Kolkhoz Pay 271 38 Socal Security j 1772' 27399 : : ; ;39IKolkhoz Soc. Sec. i 2836' ,
40 fNet Profit 2429- 192803! . I I .41 BonusWags 236. 389861 42lTurnover Tax I 94446 * i i I
43!Net Subsidies -69753 . ; I44jOther Net Income 6056; . . *45iKolkhoz lincome 15377! : ,46IPrlvate Income 57335i i
47jTotal Lasses | -12935 - : -48Net Foreign Tde 60589: 49jGNP r 25139 853S96 50jTotal Output i 69015 1820925 . ,51 llmport 94730 I52 Toal Supply ' 69015 1913147
53

Armenia 3: 1987 Input-Output Table in Purchasers' Prices--SNA FormatMIlion Rubies. Current Prices
____________ Page 1I 2 i 3 4 1 5 ! 6 7 1 8 , 9 10 I I 11 12 I 13 14
Power Peiro- 1 Coal i Other Ferr. I N-Ferr.: Chem. MBMW. Wood I Constr.; Lght Food Other TotalGas I Fuels Memlis Metals ;Paper !Mater.I Ind.I Industry
I ]Power I 1.11 0.0' 0.0: 0.0, 1.0! 26.1: 56.6i 49.31 3.7; 22.21 14.91 9.7 3.01 187.72 ,Petro-Gas 129.0; 0.0 0.0: 0.0! 0.4. 6.2' 14.7; 26.8i 3.41i 28.81 5.31 11.21 1.9i 227.63. Coal 5.01 0.0 0.0 0.0' 0.0. 0.0 1.5. 1.01 0.01i 0.91 0.11 0.2! 0.01 8.741Other Fuels 0.01 0.0, 0.0 0.0' 0.0 0.01 0.0; 0.11i 0.O i 0.01 0.01 0.01 0.01 0.1S'Ferrous Metals I 0.5! O.01 0.01 0O.0- 13.5: 5.7: 6.61 138.31 3.8; 357 0.71 0.81 0.8i 206.46'N-Ferrous Metals O .11I 0.0: 0.0: 0.0 i 0.1 141.8. 14.41 148.91 0.11 1.11 0.1 i 1.61 16.01 32 4.17!1Chemicals 1.61- 0.0; 0.0; 0.0' 0.!; 9.6 i 239.01 95.01 7.71 8.8[ 100.11 34.91 7.7! 504.58 I B.MW [ 35.81 0.Oi 0.0 0.01 1.3. 9.71 9.51 1002.5i 5.31i 17.5! 14.41 7.61 2.71 1106.39 IWood & Pakper 0.31 0.0! 0.01 0.0; 0.21 4.8: 13.11 22.81 61.21 5.21 7.3! 20.61 4.8; 140.4
loiConstr. Materials 0.4! 0.01 0.01 0.0! 0.0! 0.61 2.91 22.61 2.21 102.41 1.31 8.1!1 2.811 143.411 1 lUght Industr 1 0.41 0.0' 0.O i 0.0, 0.3 0.9! 17.51 16.8 i 10.4 2.9! 1159.61 2.31 3.51 1214.612iFood Industry 0.11 0.0; 0.0. 0.0 0.11 0.31 1 0.8! 3.11i 0.21 0.41 2.11 710.3 i 20.6!i 748.213 1Other Industry 3.41 0.01 0.01 0.0! 0.0! 0.11 2.71 7.91 1.11 2.11 4.21 7.51 38.5! 67.514!Total Industry 177.81 0.0! 0.0: 0.0. 17.1; 205.9: 389.31; 1535.11 98.91r 228.01 1310.11 814.91 102.3;i 4879.415 1 onstrucUon 0.0; 0.0' 0.0 ! 0.0: 0.0.- 0.0!; 0.01 0.01 0.0! 0.01 0.0 i 0.01 0.0! 0.0l6i Agri. & Forestry 0.0. 0.01 0.0; 0.0' 0.0! 0.3: 5.61 0.91 0.6! 0.01 38.71 784.81 58.0! 888.917jProduction T & C 1.21 68.51 1.2: 0.0! 3.6 i 4.5 i 2.3.11 56.11 8.9! 105.51 16.21 26.7! 2.9: 318.4I8IT & D 0.01 29.4! 0.3' 0.0:. 3.8; 1.8: 26.91 45.81 9.71 11.51 65.31 162.7!j 14.7! 372.0191Other Prod. Sectors I 1.01 0.0! 0.0. 0.Oi 3.0; 6.0' 0.61 10.0! 2.3: 2.31 3.51 7.41 0.9! 37.120 materIa Outays 1 180.01 97.91 1.6; 0.0 i 27.5: 218.51 445.51 1647.91 120.4! 347.31 1433.81 1796.6! 178.91 6495.821 Housing-Communal 1 2.11 0.01 0.0! 0.01 0.4i 1.81 3.71 14.81 2.0! 2.11 10.01 6.2! 1.8i 44.822 N-Prod. Transpont T 0.31 0.01 0.0!i 0.0!i 0.i1 0.4! 0.91 7.91 1.4! 1.81 4.01 1.11 1.2! 19.223 N-Prod. Commiunc. i 0.01 0.0! 0.0! 0.01 0.01 0.0' 0.01 0.0! 0.01 0.01 0.01 0.01 0.0! 0.024 Education I 1.11 0.0! 0.0: 0.0! 0.2! 1.0! 2.0: 7.21 1.11 1.11 4.0! 2.31 1.01 20.92S ICultur 1 0.21 0.0! 0.01 0.0! 0.0, 0.21 0.41 2.0! 0.21 0.2! 0.91 0.5!1 0.21 5.026 Health. etc. T 0.91 0.01 0.0' 0.0! 0.2 0.7! 1.6! 5.8!i 0.8! 0.91 3.5! 1.8!1 0.8! 16.927 IEduc.. Cult. & Health: 2.31 0.0: 0.0 i 0.0! 0.4 1.91 4.01 15.01 2.11 2.2! 8.41 4.51 1.91 42.828 1Science j 1.3j 0.0' 0.01 0.0! 0.1!i 1.4! 1.71 17.5! 0.4' 1.11 1.11 0.91 0.1! 25.629!Banking & lsurance 0.7' 0.0! 0.0! 0.0' 0.1; 0.51 1.0! 9.2! 0.5! 0.61 5.31 7.9! 0.5! 26.330! State Admin. I
31 1Servce Outlays 7 6.71 0.01 0.0' 0.0! 1.1! 5.9: 11.4! 64.41 6.5Si 7.81 28.9! 20.61 5.61 158.732l Defense & Other I I1 I I 33I1Toula Outlays 186.71 97.91 1.61 0.01 28.6; 224.41 456.9! 1712.21 126.91 355.01 1462.6! 1817.2: 184.5. 6654.6
341Dpeito 62.91 0.01 0.0. 0.01 2.9 44.41 90.01 194.81 10.51 56.61 48.3! 51.61 11.01 573.035!Wages 17.11 0.0! 0.01 0.0! 3.91 33.6' 60.11 495.31 29.2! 98.41 246.41 73.9! 40.9i 1098.836I1Other Wages 0.31 0.01 0.01 0.01 0.11 0.9; 1.21 11.31 0.71 2.21 4.61 1.51 0.8! 23.637 1Kolkhoz Pay j -T 0.01 0.01 0.01 0.01 0.0! 0.01 0.01 0.61 0.21 0.21 0.01 0.21 0.31 1.438;Social Security i 2.9! .0 0.01 0.! .0! 0.4T 4.01 7.61 64.11 2.41 10.81 34.41 _9.1I 3.5j 139.239lKoIkhoz Soc. Sec. I 0.01 0.0! 0.0! 0.01 -! 0.01 0.0! 0.0 01 0.0! 0.01 0.0J 0.01 0.01 0.2
40I et Pofit52.41 0.0! 0.01 0.0! 2.8! 45.7! 87.11 438.71 38.01 47.9 226.91 94.71 23.4! 1057.6411 onu Waes .21 0.0! 0.01 0.0! 0.3i 3.7!i 7.31 47.1! 2.3; 5.51 25.81 5.6! 5.11 106.0
42 1 Turover Tax 21.0j 0.0: 0:0! 0.01 0.3; 2.8. 50.4! 65.1! 1.4! 26.2; 377.91 485.9' 222.61 1253.643 [Net Subsidies 0.0! 0.0;i 0.0! 0.0! 0.0, 0.0i *5.6 i -0.81 0.0! 0.01 -14.2! -338.3! 0.01 -358.944!Other Net Income I 0.0! 0.0! 0.0! 0.0! 0.0 1.5! 1.51 0.0! 0.01 2.51 0.01 4.0! 0.01 9.5451 Kolkhoz Income 0.01 0.0! 0.0! 0.0' 0.0! :0.-0! 1 0.0- 0.0!. 0.01 0.01 0.01 -4.61 0.11 -4.5
46 Prite Inome 1 0.01 0.0! 0.0: 0.0! 0.0! 0.0! 0.01 0.01 0.01 0.0! 0.01 0.0! 0.01 0.047To jm -3.3! 0.0! 0.0! 0.0! -0.1! -2.0' -4.3f -9.2! -0.6! -2.81 -20.0! .2.61 -0.71 -45.748!iNet Foreign Trade ;-32.21 354.5! 14.0! 0.11 232.3: 5.9:1 .50.8j -94.11 122 81 39.71 -483.71 9741 -112.91 5.0
49IG N P ~121.11 354.5! 14.0 0.1 i 242.51 136.81 _237.31 1165.9i 204.61 28.71 420.61 384.9j 189.0! 3752.8.j3OMIOutpu 1 339.91 97.9! 1.6! 0.0' 38.8! 355.3, 74.9 2972.21 208.8; 597.11 2366.91 2192.6! 486.31 10402.3151 I import 4.61 354.51 14.0! 0.1! 251.8 126.7! 390.81 933.9! 142.1!I 81.4! 1065.81 593.41~ 140.11 4099.2
52I TtlSupply 344.! 452.4! 15.6- 0.1 i 290.61 482.1! 1135.7! 3906.0; 350.9! 678.51 3432.71 2786.1! 626.51 14501.6
54

Armenia 3: 1987 Input-Output Table in Purchasers' Prices--SNA Format
Page 2-___ _ ISIi |1 815 1 16 17 18 19: 20 . 21 22 23 1 241 2S 26 i 27 i 28
Constr.Aicult T& C: T & D: Other TOTAL Housins Transp. Comm.: Educ. Cul. I Health 'Educ. &.ScienceI ; I Prod. i PROD. I Health!
I Power 7.11 7.1i 11.2 11.41 0.71 225.2. 9.8: 5.3 1.0: 6.31 0.81 4.31 11.41 2.021Petro-Gas I 29.9: 23.31 56.0i 1.9 0.4. 339.1 4.1; 37.4 3.61 5.81 0.7; 4.01 10.41 1.93SCoal t 0.11 0.8. 1.6! 0.1! 0.0: 11.3 0.1! 0.1 0.01 0.1j 0.0; 0.11 0.21 0.24jOther Fuels 0.5i 0.5 0.0; 0.01 0.0: 1.2. 0.2; 0.0 0.01 0.01 0.01 o.o! 0.01 0.0SlFerrousMetals t 65.11 2.11 0.9. 0.11 0.0i 274.7. 0.81 0.3 0.01 0.11 0.0! 0.0' 0.11 3.86 N-Ferrous Metals i 2.31 0.11 0.2' 0.01 0.0, 326.8 0.0i 0.11 O.01 0.11 0.01 0.01 0.1i 2.97 Chemicals 18.41 30.61 12.0; 2.6i 0.9! 568.9 2.11 5.4! 1.11 1.51 1.31 17.31 20.11 2.98 MBMW 118.41 24.01 16.4: 8.41 3.0, 1276.6. 4.31 13.5 1.71 5.11 0.61 3.51 9.31 21.59 Wood&Paper 49-71 2.71 1.0: 6.11 12.51 212.3: 1.61 0.81 0.0o 1.71 0.21 1.1i 3.01 1.4
lI0 Constr.Materlals 360.31 12.11 8.8; 3.81 0.11 528.41 8.11 0.41 0.11 1.81 0.21 1.21 3.21 1.71I Ught Indusiy 1 4.11 3.21 1.4. 6.21 2.31 1231.8: i.0: 0.8 0.11 30.3| .i2 7.11 18.61 1.812jFood Industry L 0.5i 15.71 0.11 7.01 0.01 771.5i 1.3: 0.5. 0.01 29.4 3.71 21.6i 54.71 0.2l3lOtherIndusfry I 0.71 101.51 1.7: 3.81 21.4 196.6- 1.9! 1.0A 0.01 6.3 0.81 4.31 11.4 0.614IToml Industry 6S7.2' 223.7i 111.4; 51.41 41.31 5964.4 35.2! 65.6 7.6i 78.81 9.51 54.2! 142.51 40.9151 Construction 0.01 0.0i 0.0 0.0; 0.01 .0 I i j16Api. & Forestry 0.01 265.11 0.3; 2.61 0.01 1156.9- 0.3; 0.0. 0-.1 2.41 - 0.3i 1.71 4.41 0.117 Production T & C 13.4 11.01 1.61 2.21 1.5' 348.0 I18 T& D 0.01 44.9j 0.Oi 0.0i 10.01 426.9i19 Other Prod. Sectors 3.51 5.41 0.3: 15.0 0.91 62.2: 0.0! 0.51 0.01 1.31 0.21 0.91 2.3i 3.020 MmdaJ Outlays 674.01 550.1I 1 3.6' 71.21 53.7; 7958.41 35.5i 66.11 7.61 82.51 10.01 56.71 149.21 44.021 Housing-Communal 4.1j 6.91 2.7: 10.11 0.21 68.8: 0.81 0.7: 1.11 0.8! 0.3j 0.61 1.81 0.622 N-Prod. Tqnon 3.81 9.11 1.31 3.81 0.21 37.3' 1.31 1.2! 0.91 3.11 1.11 2.71 6.91 1.823 N-PrA. Communlc. 0.0 0.01 0.0i O 0.01 0.0' o.0. 0. 0.21 0.71 1.1 . 0.71 0.91 2.71 1.424 Education i 2.11 7.11 1.9! 2.21 0.11 34.1i 0.41 0.41 0.61 0.01 0.0 0.0! 0.01 0.025 Culre 0.51 1.6i 0.4 0.51 0.01 8.0' 0.11 0.11 0.1! 0.0 0.0 0.01 0.0c 0.26 Health. etc. [ 1.8! S.51 1.5! 1.9j 0.11 27.61 0.31 0.31 0.51 0.01 0.0 0.01 0.0o 0.027 Educ.. Cult. & Healthi 4.3 14.11 3.7! 4.61 0.1! 69.7. 0.81 0.81 1.21 0.01 0.01 0.01 0.0! 0.02j Sience 5 5.6i 6.4i 3.9 1.7' 0.01 41.3 0.li 0.1: 0.61 0.01 0.01 0.01 0.01 7.129 Baaking & lurance 1 3.31 6.1! 1.1' 35.9i 0.1! 72.7; 0.1! 0.2: 0.71 0.0! .A 9L b0O 1301State Admin. - 1 ! - -31 Service Outlays j 21.11 42.61 10.7i 56.1j 0.7i 289.9 3.41 3.21 Slj 5.1lI 2.01 4.2j 11.3i 11.032 Defense & Other i i I i I33 ToteW OulyB 1 695.1 592.71 124.3j 127.21 54.4i 8248.3: 38.9i 69.3; 12.71 87.6i 12.0 60.91 160.5! 55.0
34 DepYsatlor _ j 94.41 103.11 77.9, 30.9! 3.01 882.3: 131.11 50.81 14.5! 30.6i 3.2 17.2! 51.01 25.035 Wages j 410.1 284.51 303.41 133.5; 47.81 2078.0: 86.11 57.0: 27.811 281.3j 41.3 17133 1436 Other Wages I 5.0 2.31 1.3: 1.31 0.31 33.7i 1.71 2.1: 0.81 1.3! 0.4 1.21 2.9 2.437 Kolkhoz Pay 4.7I 144.01 0.01 0.0! 0.01 150.1 i i 2.7i 0.31 1.71 4.7138 Socal SeauIty 40.4t 13.01 9.8'-10.5i 3.31 216.11 4.81 4.8 2.21 20.41 3.01 7.8! 31.21 13.039 Kolkhoz Soc. Sec. o0.11 15.0oi 0.0 0.0o 0.01 15.2, i ' 0.3 0.0! 0.2 0.5140 Net Profit 171.5S 31.01 70.71 123.8i -4.91 1449.6' 14.61 18.61 39.61 0.0 0.0 0.0! 0.0 18.941 Bonus Wages 15.0 13.0, 6.91 3.3! 0.9 145.1 5.81 7.11 3.2 2.2 442 TurnoverTax 0.0j 0.01 0.0: 0.2i 0.0' 3253.843 Net Subsidies 0.01 0.01 0.0! 0.01 0.0; *358.9 , 1 0 T44] Other Net Income o.ol 0.01 4.01 0.01 0.0; 13.5! 0.0i 0.01 0.01 0.0 0.0! 45 Kol*hoz Income 0.0i 53.71 0.01 0.01 0.0i 49.1 _ 1 I |746 Private Income 29.31 594.81 0.01 0.01 17.11 641.2! 25.01 35.0! 0.0 20.0 4.0 19.01 43.Oi
48 Net Foreign Trade 1 130.71 -539.01 -1.2! -404.5 !
4910 N P 742.31 1356.01 266.3! .239.3' 65.3, 5943.4 263.3i 147.7! 84.6; 358.8 53.41 156.31 568.51 163.4S0 Tot3 Output 1437.4) 18.01 390.61 426.9: 120.9! 14596.21 302.21 217.0! 97.31 446.41 65.41 217.11 729,01 218.451 I import 0.0j 145.5 0.0! 0.0! 4.61 4249.3: ,S2iTotwlSupply 1 437.41 1963.5i 390.61 426.91 125.35 18845.5 302.21 217.0! 97.31 446.41 65.41 217.1! 729.01 218.4
55

Armenia 3: 1987 Input-Output Table in Purcliasers' Prices--SNA Format
Page 3
j ~~~~~~~29-i 30 i 31 :32 i 33 -. 34 . 35 1 36 1 37 ' 38 ! 39 ' 40 1 41 1 42
1 ~~~~~~Ban km State ITOTAL.-Defense; TOTA.L House s*- i l/ Govern.Deferse I Total ilavent-I Net I G N P_ ~~~~~~~lutr. !Admiln.l SERV. :& Othe:O Y hls Pl re| d Other; Fixed i I Export I
I ItPower OM.2 0.61 30.31 0.0; 255.5s 52.21 S2.2. ! 0.01 0.01 0.01 52.2
3ICoal ! 1 0.1 .i o.o! 12.11 3.5: 3.Si I 0.0i -0.l i 0.01 3.4
5IFerrous me" I O.O-i 0.11 5.IT_ 0.01 279.8; 1.71 1.7! I 0.0j -10.41 0.0i -8.7
6=N_==t=_ o.o 00 3j1 o.ol 329.9s00 00 0.01 31.51 .1 3._ _eicl 0.21 0.91 32.71 II.31 612.9i 94.6: 94.61 1 I 0.0i -13.41 0.0i 81.2
9IWood &Paper 0.21 0.61 7.61 0.01 219.9; 97.91 97.91j ! 26.91 -13.11 0.01 Il1.7IO IConstr. Materials O.0 0.21 13.71 0.01 542.1 ! 66.41 66.4! 1 i 0 i 28.31 0.01 94.7
1 1lJght Indus"y 0.11 0.31 22.7; 19.71 1274.2 i 687.81 687.8 1 0.71 -79-41 0.01 609.1
o .ol 0.0i S56.71 20.51 848.71 1366.4. 1366.41 1 i 1 0.01 -13-01 0.0j 1353.4
13 Other lndunly 0.2! 0.71 175.8! 0.0i 212.41 137.Oi 137.01 i i 0.9j 23.1 i 0.0j 161.0
14 Tota Indus" 1.5i 5.21 298.5i 397.61 666O.5i 2878.6. 287S.Si I 1896.01 -27.91 0.0i 3746.7
ISConstontco 0.01 0.01 0.01 0.01 0-0! 0.O: 0.01 1 1 1437.41 0.01 0.01 1437.4
16JAg. & Foresry 6.0' 0.11 4.9: 4.2. 1166.01 731.31 731-3; 62.51 1 23.6; -34.51 0.0 782.9
17 1Production T&C I 0.01 0.01 _ .00! 0.0i 348.0i 0.0i 0-0! 42.61 -° 0.01 °°!1 42-6
18 jT & D 1 .O 0 0 .° ° 0.01 0.0o, 426.9; 0.01- 0-0! 01 0.01 o.oj -539.01 -539.019|0ther Prod. Setnj 0.2i 0.51 6.5! 0.0. 68.71 52.0: S2.0'1 .i--4 ! S.
20 Mame Outly 1.7 5.8i 309-9i 401.81 8670.1j 3661.9. 3661.8i 0.01 105.11 0.01 2357.4 -63.71 -539.01 35521.7
21 Housing-Commuasl 0.41 0.61 6.01 4-41 79.2! 196.1 i 87.31 108.8. 20.11j 6.8! 223.0
22 N-Prod. TnuBpon_ 0.6i 2-71 15-51 1.91 54.71 142.91 142.91 0.01 °-°l 31.6 -12.21 162.3
23 jN-Prod. C uac. ! 0.51 1.91 7.41 0.71 8.1 I 38.01 38.01 0.0i 3s-81 23-8 Ij-8.41 89.2
24JEucadora_ 1 °.°i 0.01 1.41 0.01 35.61 410.8i 25.91 384.91 0.01 0.0 i 410.8
251Culture I ~~~0.01 0.0! 0.45 0.01 8.31 57.11 19.81 37.31 0.0i o.ol i I $37.1
26 Health. etc. j .i .01 I.1 0.0;O 28.71 210.S1 41.8j 168.7i 0.01 o.ol i I 2~2.1 j188.4
27Educ.. Cult. & Health; 0.0. 0.01 2.9! 0.0i 72.6! 678.4i 875 90.9i 0.01 0.0i i |67.
-29 1 ankng& Lumce !- 0°°i °°! 1.1! 0.01 73.8. 3S.8 35.81 0.01 0.0j O-Oi ! IS.O 50.8
33 Toail Ouday | 3.2; "-°I 350.61 408.8 9007.7( 4800.7i 4101.0. 699.71 232.2! 854.31 2357.4; -a37l -525.71 7655.2
34 Deprelatlt -- 0.41 2.,1 274.9! 38.5i 1195.7! 5 ii 1
36 Other Wapes 0.41 1.9 12.21 8.3! 54.21 | i |
37 KoW= oPay 4I 15l4.81 i I !-1 _| ii
38 Soclal Security 0.71 4.0 6071 27.21 304.01 i I I !
39 oumhoz Soc. See. :0-51 IS1.7 iI j j 1
40 Net Profit 95.11i 0.0 186.81 0.01 1636.4 !_I _ 41 Bonus WagSo 3.3i 0-01 35.71 1 180.8 i i!. I1
42 Turnover Tax ! : . o.o 12538.8
43 Net Subsidies | _ 1 0.01 -358.9 -:1
44 Ote Net bmw °-°i 0.0 °.°g 13.5! i i
45 Kolkhoz 1Incle - I I -O.Oi 49.11i
46 Piftvte ino S13.0! 724.2 .i i
47ITotal Loissw I i 0.91 t 76.9 .§
48|Net Fore4n Tmde_ _ jlS.01 1 I.0i -389.5: -
49CN P I121.4 66. 14S3 29-6 765.2_
SOToXlOa tpilt 1109-61 77.41 1750-91 705S41 17052.51 i ii f51 1Xp01 I -1 t 4249.3i
TS2 SuppglyP 1109.61- 77-.41 1i 0.9! 70S.4i 21301.89| 1 1
56

Armenia 3: 1987 Input-Output Table in Purchasers' Prices-SNA Format
Page 4_ _ _1 43 44_ _____ ;____ EXPo r TOTAL
I ; USESI Power 36.81 344.621Peuo-Gas i 0.0 452.43jCoal | 001 15.641Other Fuels I 0-01 0°15I Ferrous Meta 19.51 290.56 N-Ferrous Metas 120.81 482.17 Chemicals 441.61 1135.7a MBMW 1028.0 3905.89 Wood & Paper 19S31 350.9
lOlConsr. Materials 4171 678.511 1Ught Industy 1549.5i 3432.812 Food Indusry 584.01 2786.113 Other Indusnry 253.01 626.414 Total luduwtry T4094.2; 14501.5IS Construction - 0.T ° 1437.416 A. & Formh , 14.81 1963.67 Producto T & C I O.oj 390.6
I8T&D 0.01 426.919 Other Prod. Sect 5.8! 125.520 O M syt 4114.8: 18845.521 lHousing-Cotmunal | 302.222IN-Prod. Transport 217.023JN-Prod. Communic. | 97.324 1 Educatin _ 446.425 C-ulture - _ _ 65.4261Health. etc. 217.127 Edue .. Cult. & Healthi _ 728.92U Sclence 218.4291anking & naurnce i 109.630Stat AdmLa. 77,431 Serve Outlays 0.01 1750.832IDefense & Other 705.433 ToldOudays i 4114.8i 21301.7
34 Deprociatlon #
35 Wages36 Odher Was i371 Kkhoz Pay38 Social Secrity39jKoltoz Soc. Sec I40 Net Profit i I41 Bonu Wages I42ITumoverTax 743 Net Subsdles i4Oiher Net Inctme45 Kolkhoz Incoe I 46 Prtate Income |47Totml L1 e48 Net Forign Trade I
49 0 N P50 Tool OuWt51 lIprt521Total Supp5y i i
57

Azerbaian 3: 1987 Input-Output Table in Purchasers' Prices--SNA FormatMIllon Rubles. Current Prices
_____________________ ~~~~~~~~~~~~~~~~~~~~~~~Page I
__________~~~~~~~ 1 12 13 4'S4 6 7 81i9 10 ! IIs 121i13 : 14_______________ ~~Power! Petro-- Coal Other Ferr. N-Ferr. Chiem. ?MBM`W' Wood & Coastr. 1 Light IFood . Other! Total
_____________________ ~~Gas i Fuels Metals Metals Paper i Mater. i laId. i Industr1'Power 3.9: 52.2 0.0 0.0- 6.1 46,8 67.5 31.2 4.2: 17.51 13.51 11.9' IRS! 256.52iPetro-Gas i163.3, 1056.9 0.0 0.0. 14.6. 1.0 49.6- 243.3 1.2. 30.21 14.91 15.5: 0.61 1372.23 coa1 I .o 0.0 .. 0.0 0.0 0.0 o.1 0.8 0.91 0.0: 0.2i 0.11 0.1!; 0.0: 2.14:Otler Fuels 0.0' 0.0. 0.0 0.01 0.0 0.0 0.0. 0.01 0.01 0.0! 0.01 0.01 0.0' 0.0SIlFerrous Metals 0.21 8.91 0.0' 0.01 137.5 2.6 17.6 198.7, 1.7i 35.51 4.21 1.1i 0.31 408.36 NFrosMetals i 0.21 0.71 0.0 0.0. 0.3 182.2; 3.6. 68.8. 0.0' 0.7k 0.31 2.9: 27.2: 287.17IChemir,als I 2.2! 23.3! 0.0 0.0' 0.5' 1.4: 310.2. 78.0: 8.0' 12.11 63.81 11.6: 5.51 516.681MBMW i 5.01 12.81 0.0 i 0.0: 6.9'i 2.0 26.2 882.5 _11.81 19.11 15.Si 17.01 4.91 1003.79 Wood & Paper I 0.71 0.71 0.0 0.0' 0.3. 1.5: 23.7. 19.Si 136.9! 4.81 4.31 30.5: 6.41 229.2
10rConsi.Materials 0.61 2.0i O.0. 0.0 0.1. 0.2' 8.7 7.6. 3.8- 92.51 1.9; 9.1! 0.11 126.71 1 iLIght Industry 0.5~ I 1I.21 OO 0.0 o. 0.3: 0.4: 39.8 16.8i 14.5, 7.3 i 1493.6 i 41.1! 5.41 1620.812! Food Industry 0.31 0.6' 0.0! 0.01 0.11 0.3 8.7 2.6! 0.3, 0.4! 1.41 1318.51 4.91 1338.213l1Other Industry 1 0.41 7.8; 0.0 0.0: 0.8. 0.5 4.5 4.11 1.5i 1.71 4.71 8.21 110.61 144.914Total Industry j177.41 1167.11 0.0 0.0- 167.6: 239.0 560.9. 1334.9: 183.81 222.11 1618.01 1467.71 167.81 7306.3l15Construction I 0.0! 0.0' 0.0, 0.0 0.0' 0.0. 0.0 0.0! 0.0! 0.01 0.0, 0.01 0.01 0.0161Agri. & Forestry i 0.01 0.0: 0.0. 0.0' 0.0- 0.0: 0.3. 0.1; 0.71 0.01 947-0I 1633.6;. 25.51i 2607.217 1Productlon T & C 0 .01 176.61 0.0 0.1! 589.9 11.7- 765.5 205.3: 42.51 57.11 47.11 94.11 17.31 687.218!T & D 0.01 37.5; 2.2 0.0. 12.3! 4.5. 36.7. 78.8. 24.8! 69.31 128.91i 213.61i 9.91 618.419 Other Prod. ScMToS 4.0! 10.61 0.0! 0.01 3.0. 1.1: 7.21 16.9' 4.3! 9.1 .1 .31 6.41 73.320 Mataula Outlays I 181.41 1391.8. 2.2. 0.1! 241.8. 256.4 681.6 1536.1. 256.1. 357.9' 2746.2: 3414.3!i 226.81 1 1292.421 IHousIng-Communal j 6.9! 6.0. 0.0 0.0! 2.0. 1.5 4.5. 16.0: 4.61 8.0! 11.41 14.11 7.21 82.222IN-Prod. Transport 1 .1! 0.3! 0.0. 0.0; 0.51 0.3. 1.1 9.01 3.41 7.9' 5.31 3.01 4.81 36.723!N-Prod. Comoiunlc. 1 0.01 0.0; 0.0 0.0! 0.0: 0.0 0.0. 0.01 0.01 0.01 0.01 0.01i 0.01 0.024 1Education [ 3.71 2.8; 0.0i 0.0! 1.1: 0.8: 2.4: 10.21 2.51 5.91 5.21- 6.9!i 3.8! 45.42SICulture 0.8 ! 0.6: 0.0, 0.01 0.2! 0.21 0.5. 2.21 0.61 1.11 1.2; 1.3! 0.8! 9.626!Health. etc. I 2.91 2.21 0.0, 0.01 0.8i 0.7i 1.9 6.7;t 2.0! 3.81 4.7! 4.61 3.01 33.127JEduc.. Cult. IcHealth! 7.41 5.6; 0.0: 0.0! 2.1' 1.7. 4.8 19.1! 5.01i 10.8! 11.11 12.8; 7.7' 88.12SIScience 4.3 I 5.9; 0.0: 0.0 0.61 1.2, 2.0 19.0, 1.01 4.8! 3.7 j 3.31 0.41 46.329IBanklng & Insumance I 2.21 3.0; 0.0- 0.0: o.s; 0.4 1.2 10.5 i 1.3! 2.51 7.21 20.51 2.0! -51.330IState Admin. [ I .. I j j 0.031 Srvl-ce Outlays I21.9! 20.8: 0.0 0.0' 5.8' 5.2 136.6 73.6, 15.2' 34.Oi 38.7! 53.61 22.1! 304.532iDefense &Othier II ! I 0.033ITotal Outlays I203.2! 1412.6;. 2.2: 0.1; 247.6: 262.5. 695.2. 1609.71i 271.3! 391.8! 2784.9: 3467.9: 248.91 21 596.9
I I .1 I I 1 ~~~~~~~~~~~~~~~~~~~~~0.034IDepreciadon 1 153.81 205.2; 0.0.- 0.0! 20.0! 19.1; 78.3 221.6! 7.71 69.51 81.21 131.4' 10.71 998.435 lWages !35.4! 50.6! 0.0- 0.0; 59.7: 27.4 94.8. 329.3. 36.51 102.91 209.8! 128.3' 23.6; 1098.3361Other Wages 0.4! 0.4' 0.0: 0.0! 0.3! 0.3! 0.8. 7.0: 0.5!i 0.7! 2.01 1.9! 0.41 14.737 1 olkho ay 0.0! 0.0! 0.0 0 .0i 0.0' 0.01 0.0 3.71 0.4! 0.1! 0.21 0.8! 0.7! 6.138I Soc~i~i euity i 3.61 4.71 0.0. 0.0: 4.3! 5.7! 18.6 52.1: 3.81 9.2! 24.511 13.2! 2.3! 141.839IKoIkhoz SOC.Sec. I 0.0! 0.0:! 0.0 0.0' 0.01 0.0. 0.0, 0.5f 0.1;i 0.01 0.0! 0.1! 0.1! 0.840O Net Pmofit 161.4! 171.3! 0.0 0.0' 3.1! -2.8. 48.7' 342.81 18.2! 62.61 21 1.0! 212.11 26.31 1154.641 ou ae i 3.11 7.2!j 0.0! 0.01 1.91 2.5. 7.1' 26.6: 2.11 4.2! 8.6! 7.4! 1.7! 72.4
42ITumoer Tax 1 43.8i 554.1; 0.0. 0.01 0.21 2.6. 437.7 125.61 2.11 15.6! 609.71 736.0: 76.5i 2209.843Nj ubsdies T 0.0! 0.01 0.0. 0.0: 0.01 0.0: -23.0, -8.6j 0.01 0.0! -115.61 -275.91 0.01 -423.1
440hrNet Income I -i 570'! 0.0; 0.0' 5.01 5.0, 7.0 0.0! 0.0! 40.01 0.0! 24.0! 0.0! 138.045S1KolkozlIncome I 0.0! 0.0! 0.0 0.01 0.0! 0.0! 0.0. 00O, -0.2! -0.1! -0.6! -0.8; -0.7! .2.446PIms icm 0.0! 0.0, 0.0: 0.0. 0.01 0.0' 0.0: 0.0! 0.0 i 0.01 0.0! 0.0, 0.Os 0.0
___________Losses _ 01 -0.3. 0.0 0.0.! 0.0 0.0. -0.3 -1.8; -1.0: -0.4! -3.4! -0.11 -1.2; -8.748!Net Foreig Trade 53:-693.7: 5.1 0.1 i 282.6i .23.8' -102.8 331.8, 169.41 85.71 -654.8! -549.4: 20.7! -1134.4
49G N P 292.9' 349.3 5.1 0.1 375.1, 33.4 165.7 1404.0: 237.6! 385.7' 364.1! 422. 5.! 49.S01O Tom Ouvwt 501 .5' 2455.6i 2.2 0.1: 340.0; 318.8' 963.7 2681.9 i 339.5 i 691.8; 3803.8! 4438.9 387.6 i 16925.3S1limport 28.61 445.61 5.1. OX1 380.7'i 109.3'i 525.2' 1238.8? 193.4 i 134.51 1 130.41 983.5! 127.3! 5302.552
Azerbaian 3:198 Azerbaijan 3: 1987 Input-Output Table in Purchasers' Prices--SNA Format
Page 225 16 i 17 18 199 20 . 21: 22 1 23 I 24 1 25 1 26 1 27 1 28
I Constr. Agricult T & C T & D Other, TOTAL Housing Transp. Comm.: Educ. I Cult. I Health i Educ. & ScienceProd. PROD. I i Health i
Z;Power . 50.1 10.1. 30.4 17.9; 0.4 365.5 15.01 18.9' 1.71 24.21 2.9, 16.61 43.71 1.82IPewo-Gas 41.6 59.8 77.9 4.1 0.2; 1555.7 8.1i 78.71 2.1; 17.S 2.1; 12.0 31.7: 2.031Coal ' 0.1 i 0.9: 0.3. 0.11 0.0i 3.4 0.0; 0.2. 0.0, 1.71 0.2: 1.1 3.0 0.141OtherFuels 0.0 0.0 0.0 0.0; 0.0 0.0, 0.0; 0.0 0.0 0.11 0.0 0.1i 0.2: 0.0S$ Ferrous Metals i 191.0 2.4 0.9 0.0' 0.0' 602.6 0.8, 0.8 0.01 0.11 0.0: 0.0. O.1 4.36|N-Ferrous Metals 1 2.3; 0.6i 0.1 0.0 0.0; 290.1. 0.0: 0.1; 0.0; 0.0! 0.0i 0.0: 0.01 1.67'Chemicals i 90.9; 96.8 10.2: 0.3. 1.5. 716.2. 2.6, 10.8 0.51 2.21 2.Oi 26.11 30.41 2.98|MBMW i 225.7 87.0i 21.2 8.1. 0.8: 1346.4 8.3: 24.8: 1.31 5.41 0.7i 3.7i 9.8' 13.99 Wood & Paper 1 72.1: 6.21 1.4: 11.0! 13.1, 333.1. 0.9 0.7. 0.5I 4.11 0.5! 2.9; 7.51 1.2
10 Constr. Materials 517.1 13.3i 5.9 12.1 0.2: 675.3 2.91 0.4 0.0 0.31 0.0! 0.2 0.6; 0.8
11 lght Industry 13.0 25.11 1.9. 10.3; 2.4: 1673.5. 1.7; 1.3; 0.3 5.2i 0.6: 3.6i 9.4. 1.212!Food Industry j 1.3 62.5i 0.71 7.31 0.01 1409.9 5.5 1.4: 0.0 33.7, 4.21 24.7i 62.6. 0.113 !Other Industry I 1.4i 93.9 2.2; 4.3' 8.71 255.4 3.7! 0.7i 0.0 12.7' 1.5; 8.7! 22.91 0.414ITotaI Industry I 1206.4: 458.7! 153.0: 75.5! 27.4: 9227.3. 49.5i 138.8; 6.4. 107.21 14.9i 99.81 221.9. 30.3IS Coastiaction ' O.O 0.0. 0.0 0 0.0i 0.0; 0.0 . I ! I16jAgr. & Forestry 0.11 226.1! 0.4 12.5. 0.0. 2846.2. 0.1, 0.0' 0.0: 7.0. 0.8' 4.8. 12.6. 0.017!Productlon T & C : 20.9, 36.6 1.2: 5.8, 10.7i 762.4 , i I II8|T & D i 0.01 143.0: 0.0. 0.0. 20.8: 782.2j9iother Prod. Sers i 6.5. 4.9 1.4 2.5! 2.2. 90.8 0.5: 2.8 1.2 4.6: 0.61 3.2. 8.4 0.820!Ma1l1 Outlays |1233.9: 869.3. 155.9; 96.3! 61.1, 13708.9 50.11 141.6; 7.6 118.8: 16.31 107.8i 242.9, 31.121 jHouslng-Communal I 23.6! 10.1! 6.61 37.0: 0.7; 160.1. 1.5. i.3! 1.2 1.5i 0.5!i 0.71 2.6: 0.6221N-Prod. Transport : 22.4; 13.3j 3.2' 13.8; 0.8: 90.2. 2.5; 2.3 1.0: 5.41 1.7i 3.0i 10.1! 2.123iN-Prod. Commuttic. i 0.0; 0.0 0.0 0.0i 0.0 0.0 0.3; 0.4 0.71 1.9i 1.0; 1.0i 4.01 1.524lEducation i 14.6 10.3. 4.6i 8.1: 0.2! 83.2' 0.7. 0.8; 0.7! 0.01 0.01 0.01 0.0i 0.023 Culture 1 2.8. 2.3! 1.0 1.9, 0.0! 17.7: 0.2! 0.2; 0.1, 0.0 1 0.0i 0.0! 0 0' 0.026IHealth. etc. 1 10.6; 8.0: 3.6 7.01 0.2 62.6: 0.6! 0.6. 0.S 0 0.0! 0.0i 00.0 .0! 0.027IEduc.. Cult. & Health! 28.11 20.5: 9.3: 17.0; 0.5i 163.5 1.5i 1.61 1.3 0.0. 0.01 0.0! 0.0i 0.028 Sclence i 32.4' 9.4' 4.7, 6.21 0.1! 98.9. 0.2. 0.3! 0.6 0.0! 0.0i 0.01 0.0i 8.329iBanking & Insuranee 19.6i 8.8! 2.8, 131.4, 0.2. 214.1 0.31 0.4 0.7, 0.0! 0.Oi 0.0i 0.0: 0.230State Admin. ! : - , I j31iServlce Outlays i126.1j 62.0. 26.6. 205.4: 2.31 726.8 6.2! 6.2: 5.5: 8.81 3.2! 4.7! 16.71 12.832Defense & Other . - - i I33 Toml Outlays i 1360.0: 931.4! 182.6! 301.6i 63.3. 14435.8 56.3i 147.8. 13.11 127.6: 19.5i 112.51 259.6. 43.9
34 Depreciadion I 225.8- 281.1i 335.1i 49.6! 6.0i 1895.9 211.4: 20.3. 20.2i 46.81 4.9! 26.3i 78.0! 22.03SjWages ' 768.2i 517.4' 164.1i 86.5! 62.4i 2697.0: 120.3: 114.0; 32.11 531.91 67.8! 205.81 805.5; 107.936 Other Wages 20.61 4.9 4.41 1 0.31 46.7; 2.5! 1.7i 0.71 1.41 0.41 1.3! 3.11 1.837 iKolkhoz Pay 12.81 608.4; 0.0. 0.0. 0.0! 627.3; _I 1 5.1! 0.6i 3.11 8.8!38 ISocial Security i 65.8: 46.9: 28.6 8.1i 5.01 296.3. 6.7i 9.6' 2.51 38.51 4.9! 14.9i 58.31 13.4391Kolkhoz Soc.Sec. I 0.21 80.7 00.0! .0 0.0 81.7i ! 0.61 0.1 i 0.31 I.040 Net Prfit 1310.2! 245.2: 121.41 337.81 20.2! 2189.4 29.3! 42.61 45.91 0.0! 0.01 o.0o 0.0! 29.141 Bonus,Wages 1 33.01 30.91 8.41 4.4j 0.01 149.11 8.11 16.5! 3.71 4.11 2.11 2.9! 9.1! 11.8
42 Tumover Tax 1 0.0; 0.0! 0.0! 0.0j 0.0 2209.8; I43 Net Subsidies 0.01 0.0; ' 0.0w 0.0o -423.1! i . i I_' I !4 Other Net Income 00! 0.0! 15.6. 0.01 0.0, 153.6, 0.0' 0.0! 0.0! 0.0! 0.0: 0.0! 0.01 0.045 KoLkhoz Income 0.0' 174.3! 0.0; 0.0! 0.0! 171.9. i I I
46 Private Income 167.5 I1573.0. 0.0! 0.0 22.31 1762.8 41.0. 23.0 0.01 33.0! 5.01 33.0; 71.0!47 Total L s i -121.51 -67.11 -0.5! -3.3! 0.0: -201.1 1.4; -0.5; I 48 Net Forein Trade . .64.21 , -48.0i -10.41 -1257.0 : , i ;491G N P 11449.6 3400.6. 668.7i 432.5! 105.8: 10251.2 410.2: 209.8; 100.9, 661.4! 85.8, 287.6! 1034.8j 164.2501To OuVut j 2809.6, 4396.1i 851.3! 782.1j 179.61 25944.0. 466.5! 357.6i 114.0; 789.0' 105.31 400.1 1294.4! 208.1Sl lmport i 0.01 247.11 0.0 0.0! 3.91 5553.5: , I I i52ITotaI Supply 1 2809.6! 4643.2: 851.3. 782.1! 183.5' 31497.5 466.5' 357.6 114.0! 789.0! 105-3: 400.12 1294.41 208.1
59

Axerbaijan 3: 1981 Input-Output Table in Purchasers' Prices--SNA Format29 31 - 32 1 33 34 i 35 40 ~~~~~~~~~~~~~ Page 3
29 30 31 I 32 I 33 34 i 35 ~~~~~~~~~36 1 37 -,38 139 40 41 1 42D3ank& iState i TOTAL Defence: TOTAL :House, ./ /- iGovern. iDefence i Total ilnvent.: Net i 0; N PInur. 'Admini.; SEUV.; & Other OUTLAY -holds Paid Free I &Other iFixed i ~ Exporti
IPower 0.3! 1-: $2.7. 0.0 44,2: 48.0 48.00.0: 0.01 0.Oj 48.02 iPetro-Gas 0.5 3.8. 124.9 23.2: 1701.8. 82.4 82.4! 0.0 -22.2! 0.01 .60.2
Coal OX~0.1 0.3i 33' 0.4; 7.5. 0.0. 0.0.1 I .. -0.31 0.01 -0.341 Other Fuels O.O. 0-0: 0.2. OX 0.3 0.0 o-O ~~* i 0.0' -0.11 0.01 -O.1I
Si Ferrous Metals 0.0; 0.0! 6.0 0.1; 608.7 12.3:. 12.3: 0.0 1.51 0.01 13.86 N-Feffous Meta" i . 0.0! 1,7~ 0.0: 291.8. 0.0. 0.01 0.01 3.11 0.0; 3.17fCltenlcals 0.4: 1.61 49.2: 52.31 8 17.7: 85.2 815.2! T i 0.01 -42.01 0.0! 43.28 IMBN1 0.2; 0.71 59.01 290.8! 1696.22 278.4 278.4! 1271.31-232.21 0.0; 1317.519I Wood & Paper 0.1, 0.6: 11.51 0.01 344.6i 13. 134.31 28.9; 1.01 0.01 164.21
10iottsir. Matwria" 0.0; 0.11 4.8' 0.12 680.2; 98.8. 98.81 0.0O!-.5L0.0 97.31 1 1Ught flduUm 0.11 0.41 24.4: 29.81 1717.7. 1369.0i 1369.0 .16.1 0013.121 Food lndustr I 0.01 0.0' 69.6: 21.41 1500.9 2189.6 2189.61 i i.!.19. i ~ 0.0Ii 2388.2
13 Oter ndutry0.11 0.6! 28.4; 0.0; 283.8; 104.5; 1045 ~]I 0.01 19.91 00 12388714I Tota Inuty1.81I 7.4i 456.21 ;416.21 1009.6, 440245. 4402.5; i T 03.011 19.92 0.01 124.42
16Ap1. & Fiorny I 00 0 0o 2809.61 0.02. 0.0! 20.616AM. & FlorT&C 0. I-O 37i 41i26..15. 216 127.01 89.2! 0.01i 1467.91_____________T __ C ___I__________ 762.4: 0.0 0.0! 88.91 0.02 0.0J 0.01 88.181T & D 0.0: ! 782.2 0.0.0 .01 1~ 0.0i 0.02 -48.01 -48.019IOther Prod. Sectof, I 0.2'i 0.4;1 14.2i I 105.0' 62.8' 62.8! T I I 0.01 1.51 0.0! 64.2ZOImabtial Outlays 1.9; 8.8! 484.0: 420.31 14623.2; 5716.9, 5716.9~ 0.0 88.91 0.01 4236.8; 79.22 -48.0i 10073.8121Iousina-Comq,unl 1.11i 0.61 9.0' 1.02 170.1;- 269.41 150.2i 119.2; 20.21 6.81iI i 9.22IN-Prod. Trnsipor i 1.6i 2.5! 22.21 2.22 114.6 259.9! 259-.9 0.021 0.02 25.81 1 -42.5; 243.223_N_P_od. ________ 0.2! 2.7! 8.81 2.1J-10.9; 501.1 50.22 0.Oi 39.41 22.32 -8.72 103.124IEducatlon I 0.51 0.0! 2.7j i 85.91 718.6i 38.32 680.31 0.01 0.01 1 718.6
2SICuluzre ~~~~~~~~~~~~~~~~~~~~~~~~~~~~~~0.12 0.01 0-6 18.32 87.0: 29.21 57.81 0.0! 0.02 ~ 8 .26 IHealth. etc. 2 0.4; 0.0' 21 , 64.7: 319.9! 59.61 260.31 0.01 0.02 1 319.927jEduc.. Cult. & Heathi 30 0.; 5 00 189 125 17.1 998.4; 0.0 0.1 ' 1125.52al1Scientce 0.0 0.0' 9.4 108.4: 0.0. 0.0! 0.01 157.01 41.81 -9.2 9.7291Danklng& Insurance I 0.0; 0.0' 1.5' , 215.6' 35.1; 35.112 001 0.02 '0.0' 25.01 60.13OIStwte Admln. ' .71.7! 71.72 0.01 37.7; 0.02 1 109.431 1Service Outlays . 4.0; 4.8. 56.2" 5.32 788.4: 181 1.7' 694.12i 1117.6: 254.32i 96.71 0.0 1 0.01I2S31 237.432;Defeuse &Other , *.51j I 4.33 Tota Outdays 5.9' 13.6i 540.2! 425.61 35401.6. 71528.6 64110! 1127.6' 343-22 841.21 4236.8. 79.21 -173.31 12855.7
34 Depreciatio 1 0.8. 4.41 357.11 18.62 2271.6' I ______
35 Wagso i 31.812 82.92 1274.5i 242.52 4214.01 I 36! Other Wages 0.41 1.22 10.41 1.92 59.01 ;37IKoIkhoPay 1 8.8! 636.1238!SocIa Security 1.2' 7.31 99.01 23.41 418.71 _____
39 KolkhtozSc Se.I 1.0i I 82.71 _____
40OSet Proft 230.6 0.0 367452 32.52 2589.4:41 Bonus Wages 54 0.02 54.612 .1 2078 I _____I
4r2ITurnoveTax 10.0. 2209.8 T ___
443ter NetInb m 0.; .0 0.02 is.42'1443lietSuNotde TIo 0 0.0 ' o 2 1423.612 ......4S KOlkho litw@e I 1 0.02 7.9
46PrlvatelnCoue _________ 1 135.0 : 1897.8; I I I247 TotaLl L055I 1 _ ___ -1.9! 1 -203.0!48 Net ForelignTmde 25.0, 1 25.0: -1232.0 I_____t49 G N P 269.8' 95.6. 22854' 318.9! 12855.7. I I i............... ..-~~~J*ota1Oulptat I250.7 3 09.41 2800.7' 744.5! 29489.22 i'
52 Total Suppy .250.71 109.41 2800.7;i 744.51 35042.7 . + '_____
60

AzerbaUan 3: 1987 Input-Output Table in Purchasers' Prices--SNA Format
Page 443 44
Export: TOTAL! fl USES
IlPower I 33.91 530.12 Petro-Gas 1139.3! 2901.231Coal 0.01 7.24 iOther Fuels I 0.0; 0.2SjFerrous Metals i 98.11 720.76iN-Ferrous Meals i 133.1! 428.07'Chemicals I 628.0 1489.08NMBMW ! 907.0 3920.79iWood & Paper 24.01 532.9
lOICons5. Materials 48.8: 826.3I I1I Ught Industry 17d5.2: 4934.112I Food Industry 1532.9 5422.31310ther Industry 106.6 514.814ITotal Industry i 6436.9 22227.7ISiConstrucdon I 0-0 2809.616IAgr. & Forestry 311.3. 4643.217 Production T & C 0.0i 851.3181T & D 0.0. 782.2191Other Prod. Sectors 1 14.31 183.5201matri Outoaly , 6762.5; 31497.521 i Housing-Communal 1 466.522 IN-Prod. Transpor r 357.8231N-Prod. Communic. 114.0
24lEducatlon I 804.52SICulture 105.3126IHealth. etc. 384.627jEduc., Cult. & Healthi 1294.4
28!Science i 208.129jBanking & Insumnce 1 250.7
30'State Admin. I 109.43 IService Oulay) s 0.0: 2800.832!Defense & Other 744.5331Toml Ouday 16762.5' 35042.8
34 Depreciation I35Wages3610ther Wages __I
37IKolkhoz Pay38 Soca Securty I391Kolkhoz Soc. Sec.40INet PmfIt I
411 BonusWages42jTurmover Tax43 Net Suidies4410ther Net Income
45KoLkhoz Income i
46jPrivate Income47ITotal Les!481Net Forelgn Trade491G N P
SO ToWl Oulput i51 import .S2,Tota Supply
61

Belarus 3: 1987 Input-Output Table in Purchasers' Prices--SNA FormatMltlioa Rubles. Current Prices
Page Ii I _2; 3 1 4 5 6 7 8 9 1 10 I 11 1 12 13 1 14
Power Petro- I Coal Other Ferr. N-Ferr. Chem. .MBMW .Wood F Consr.: LIght i Food I Other e TotalGas 'Fuels Metals Metals Paper Mater. I Ind. i Industry
IlPower 10.0 68.0 0.0 3.0; 13.2. 0.2 236.7. 213.2' 36.41 61.31 57.81 44.4: 65.0: 809.42!Petro-Gas 597.3 1259.8 0.0. 2.9; 3.7: 0.3 206.3 115.1: 24.21 92.91 10.71 44.9' 84.0i 2442.03 Coal 0.4; 0.0o 0.0 1.6 0.1- 0.0 0.5 4.1- 1.4i 3.21 3.01 2.41 0.81 17.64,Othee Fuels I 0.01 0.0' 0.0! 33.0 0.0 0.0 0.6 0.3! 0.4. 0.8' 0.3: 0.01 0.5 35.8SlFerro"s Memals 0.9. 1.61 0.01 0.7. 100.8 0.0 70.7; 959.9: 17.41 94.71 3.9' 16.91 5.3I 1272.96IN-Ferrous Metals 0.11 0.4i 0.0: 0.0 8.61 37.7! 10.3; 349.7: 1.8| 5.81 1.41 5.8! 2.31 423.97 Chemlcals j 3.8; 16.21 0.0: 0.9! 2.8: 0.11 1000.3i 647.1. 72.11 42.41 450.31 28.31 68.31 2332.68 MBMW 1 i O.81 5.31 0.0: 3.4 7.6: 0.4: 62.9i 4892.0i 68.01 38.7 35.11 32.8i 19.5i 5176.64 Wood & Paper j 0.71 0.41 0.0! 0.51 1.81 0.01 91.31 120.9i 554.9j 23.S 32.31 60.21 44.2 930.8
10 Constr. Materials 0.4! 0.41 0.0 0.4i 2.2 0.11 8.31 58.61 20.51 363.21 2.51 17.3! 13.7 487.51IIILght lndusry 1.41 0.91 0.0; 0.51 0.8. 0.21 34.11 92.2: 70.0 9.9: 3746.91 11.61 65.61 4034.3
i12 Food Industry _ 0.3i 0.41 0.0 0.1! 0.21 0.0: 76.21 10.81 6.3! 2.2; 35.91 1730.5 135.5i 1998.413 Other lIdusty i 2.51 0.2! 0.0 0.0: 0.2! 0.0' 3.5i 18.3! 2.31 2.11 5.71 42.01 131.01 207.814!Tomal Industry 628.7. 1353.7: 0.0 47.1; 142.0. 39.1; 1801.8! 7482.3. 875.81 740.71 4385.6. 2037.11 635.6i 20169.51S!Constructon 0.0 0.0! 0.0' 0.0: 0.0 0.01 0.01 0.0; 0.0! OOi 0.01 0.01 0.0! 0.016 Agl. & Forestry 0.0! 0.0. 0.0 0.0! 0.0i 0.0 0.11 0.2! 54.01 0.01 489.3i 7211.0j 378.0i 8132.617 Productlon T & C 3.8. 223.5 16.8; 15.5 79.91 1.1l 107.31 254.2 S7.31 458.81 102.5i 126.81 33.01 1480.4181T & D I 0.0: 143.4: 1.4: 1.6: 8.3 1.0! 75.21 199.6i 59.2j 44.91 . 310.7! 760.61 41.9! 1647.619Other Prod. Sectors I 5.1: 5.0 0.0! 0.0i 26.8 13.11 9.8! 41.11 6.7! 13.61 14.4! 21.2i 10.7! 167.5201Matenal Outlays i 637.6; 1725.6; 18.2! 64.21 257.0 .S4.2; 1994.2! 7977.3. 1052.91 1258.0! 5302.5i 10156.7! 1099.21 31597.6211Housing-Communal I 10.71 6.71 0.0; 0.3! 1.5! 0.3i 20.71 100.7i 12.71 6.41 19.6! 23.21 7.2j 210.1221N-Prod. Tmnsponr 2.01 0.3! 0.01 0.7. 0.4 0.1 6.2 41.81 8.21 5.61 5.1 5.4j 4.9j 80.623'N-Prod. Communic. I 0.0! 0.0! 0.0 0.01 0.0! o.oi 0.0i 0.01 0.0!. 0.0! 0.01 0.01 0.01 0.024|Education j S6.8i 3.1! 0.01 0.2! 0.8; 0.2: 13.3' 56.41 6-81 3-4 15.01 10.71 3.9! 120.725[Culture j 1.0; 0.3! 0.0! 0.0: 0.21 0.0! 2.0; 10.21 1.51 0.81 2.41 2.01 0.41 20.826!Health, etc. i 5.3; 2.4; 0.01 0.1 i 0.6; 0.1; 8.31 32.01 5.3! 2.71 8.5! 8.4i 3.01 76.927IEduc.. Cult. & Health: 13.1; 5.9. 0.0i 0.31 1.61 0.4! 23.6- 98.6! 13.71 6.9! 25.91 21.11 7.3! 218.428;Sdence I 10.5i 6.9i 0.0 1.1! 0.5i 0.3; 17.9; 212.6j 3.61 3.51 19.81 15.71 0.91 293.2291Banking & Insurance ' 4.1' 3.3! 0.0: 0.11 0.41 0.11 6.81 S2.2 3.5! 1.81 38.91 32.2i 2.0! 145.330iState Admin. ;3i dService Outays -i 40.4. 23.1! 0.0: 2.6: 4.31 1.2 7S.31 505.91 41.7 i 24.11 109.31 97.6i 22.3 947.632iDefence & Otherii ; iI !33ITotal Outays 6780 1748.71 18.2i 66.7! 261.3 i 5.4; 2069.4; 8483.2. 1094.6: 1282.11 5411.8; 10254.3! 1121.5 32545.2_
_~~~~ I _ _ _ _ _11iI I I !i I -j 34lDeprecutadon 2165.7 102.4 0.0! 20.51 47.9; 1.5! 497.9! 815.5i 87.8! 148.41 123.4! 128.51 8'.1j 2224.6351Wages i 54.61 16.41 0.0 15.41 26.11 6.01 232.61 1680.1i 240.5! 222.21 503.31 234.01 133.61 3364.836 Oter Wages 1 1.71 0.31 0.01 0.3; 0.4! 0.1i 5.3j 35.91 3.51 3.61 3.6! 3.1 j 3.21 61.037 olkhoz Pay i 0.01 0.01 0.01 0.0! 0.01 0.01 0.01 40.11 7.6: 0.81 1.21 9.61 5.9j 65.038 Sodal Se1iriy 8.8: 2.41 0.01 2.3! 2.71 0.8: 34.01 259.5; 21.01 25.71 63.4; 27.3! 9.91 457.839fKoL&hoz Soc. Sec i 0-0: 0.01 0.01 0.0;i 0.0: 0.0' 0.01 5.8! 1.lj 0.11 0.21 0.8! 1.51 9.540INet Profit 1 189.81 226.21 0.01 13.51 33.51 9.21 730.51 2313.61 304.9! 169.41 967.51 494.0j 198.4! 5650.2411 Bonus Wages ! 8.91 3.9i 0.0; 1.6i 3.41 0.9! 28.5' 243.1! 25.01 20.01 53.11 25.91 15.21 429.542ITurmover Tax j 79.81 835.61 0.0; 0.0! 4.2i 0.01 413.5; 464.91 30.81 120.31 1633.21 1617.9; 7.8! 5208.043!Net Subsidies i 0.01 0.01 0.01 -14.61 O.Oi 0.0 -340.1! -138.31 0.01 0.0o -149.51 -4168.8! 16.1 -4795.244IOther Net Income I 0.01 17.01 0.0. 1.8! 0.0! 0.2! 4.0' 0.0! 0.0j 8.5 0.8 13.4! 0.0! 44.94Sf Kolkhoz Income ! 0.0 0.Oi0' 0 0.0 0.0! 0.0: 0.; .0! 0.2! 0.7! 0.41 3.81- 24.51 5.11 34.646 Private Income 0.0' 0.0! 0.0; 0.0 0.01 0.0! 0.0; 0.0! 0.ol 0.01 0.0! 0.0! 0.0! 0.047iTomal IJ .a -4.4; -2.7! 0.0 -0.5! -1.3. 0.0: -14.3; -27.31 -6.9i -5.51 -64.41 -3.4; -8.0: .138.948!Net Foreign T.ade 72.21 339.41 65.41 0.11 1145.1: 367.7! -117.9i -2103.3i -32.5: 32.81 -1323.01 -142.51 -96.8! -1793.349jG N P ! 568.11 1537.01 65-41 38.7! 1258.6' 385.4! 1445.6 3346.Si 658.6i 726.61 1762.8: -1761.81 361.6! 10393.1SoIToamI Output 1 11,73.9"! 2946.3! 18.2! 105.31 374.8; 73.1! 3632.9' 13932.9! 1785.7! 1975.9! 8497.7; 8635.0! 1580.0 i 44731.6SljilMpon i 118.11 1793.81 65.41 1.11 1329.0; 435.71 2276.71 S816.3 444.11 264.11 2364.5. 1487.6; 262.01 16658.452Tomil Supply 1292.0! 4740.1Ii 83.6. 106.4! 1703.8; 508.8. 5909.6 19749.2! 2229.8: 2240.0! 10862.2: 10122.6 1842.0. 61390.0
62

Belarus 3: 1987 Input-Output Table in Purchasers' Prices--SNA Format
______________________ ____________________________________________________PaPage2
-~~~~ I ~~~~15 1 16 i 17 1 18 119 I 20 21 . 22 23 I 24 1 25 i 26 27 1 28Conwi. i Agreivt.L T & C I T &D. Other I TOTAL :Housing Tramsp.. COMM. I Educ. Cl.iHalthit E &C I Science
L ~~~~~~~~~~Pr~od. PROD. Arts I Health iI I Power ~ 30.81 $3.31 52.6! 36.5 1.7 984.2 47.2! 19.0' 3.81 30.2! 3.71 20.81 54.71 3.5
2 Petro-Gas i 79.71 234.71 213.9: 12.0 0.6' 2982.9. 39.4 77.4! 2.51 12.41 1.5: 8.61 22.5:i 2.93ICoal 1 2.21 13.1 i 4.21 4.4. 0.2' 41.6: 3.4. 1.5!. 0.31 15.5t 1.9! 10.61 28.01 0.241Other Fuels 0.7! 18.91 0.11 1.6i 0.01 57.1! 5.3i 0.0! 0.2! 8.1! 1.01 5.51 14.6! 0.05IFerrous Metals j 217.01 3.41 5.01 0.71 0.0: 1499.1- 1.3! 2.11 0.21 0.4i 0.1! 0.3! 0.81 6.8
6iN-Ferrous Metls 6.41 0.3! 0.6! 0.21 0.11 431.4: 0.2. 0.31 0.01 0.2! 0.0: 0.21 0.41 6.37Chemicals j 101.61 441.0! 50.71 6.91 1.5i 2934.2!i 12.2! 16.01 0.91 5.5! 5.01 64.21 747 6.88MJBMW 1 430.61 627.71 50.71 27.0Oi 5.0! 6317.6. 19.51 27.81 2.21 15.51 1.91 10.71 28.1! 47.39Wood & Paper 253.71 13.61 7.91 23.7! 16.31 1246.0. 11.0: 3.5! 0.81 10.51 1.31 7.21 19.01 1.9
10 Const. Materials 1301.3! 26.41 8.41 10.61 0.1! 1834.4: 8.9, 4.21 0.21 7.11 0.91 4.91 12.81 2.1U. 28ghtInd9.31y7.8 15.6! 7.5! 4122.8! 15.5- 3.81 1.21 36.9! 4.51 25.41 66.81 2.2
12IFoodIndusty 3.31 655.71 0.4! 18.5 i 0.0. 2676.3. 4.3. 0.61 0.01 109.21 13.61 80.41 203.21 0.213 1Other Industry 1 4.3! 651.7! 3.3' 15.2! 17.1! 899.3' 15.21 1.4 0.4! 24.8! 3.0! 17.0! 44.81i 1.314!Total Industry i 2459.91 2769.1! 405.6! 172.8; 50.0: 26027.0' 183.4' 157.6' 12.71 276.4:i 38.21 255.8'! 570.4! 81.515s Conwuctlon r 0.0! 0.01 0.01 0.0! 0.0: 0.0. I
6I6 viA l. & Forestry i 8.2! 3300.1! 0.6! 19.7; 0.0'i 11461.3 1.6' 0.0! 0.0! 24.41 3.0! 16.8, 44.21 0.217IPouto & 115.71 76.6' 5.71 17.81 7.5! 1703.6: : t
0.0 276.5 0.0! 0.01i 27.6! 1951.7. I ______
19 Other Prod. Sectoms 1 21.61 9.91 15.31 53.0; 1.5' 268.91i 1.5, 3.2! 1.3! 11.8! 1.4! 8.11 21.4! 3.320 Materia Outlays 12605.51 6432.2. 427.21 263.3! 86.6i 41412.4. 186.5: 160.8! 14.0! 312.7! 42.6!i 280.7; 636.0! 85.021 Housing-communal I 30.61 32.1! 9.5 23.71 2.7 308.7; 3.0: 2.2; 1.81 2.2! 0.71 1.41 4.3! 1.322 N-Prod. Transprt 30.7! 18.2' 5.61 9.5! 1.3' 146.0, 4.2:i 3.6! 1.8! 8.0! 2.7! 6.21 16.11 4.4
23NPo.Communic. 0.0! 0.0! -O 0.01 0.0! 00 0.0: 1.1! 1.01 0.91 2.81 1.6! 2.1! 7.21 3.41244Educatdon 17.01 37.21 8.1!1 7.4! 0.9! 191.2! 1.4! 1.4! 1.0 0.0! 0.0! 0.0! 0.0! 0.0251 Culture 2.6! 3.2; i .41 1.2 0.2: 29.4! 0.3! 0.3! 0.21 0.01 0.0! 0.0! 0.0! 0.026 Health. etc. 14.6! 29.0! 6.31 6.4! 0.7i 133.8! 1.11 1.1! 0.81 OO 0.01 0.0! 0.0! 0.0: 0.27 Educ.. Cult. & Health!I 34.11 69.3, 15.81 15.01 1.8; 354.5. 2.9! 2.8! 2.0! 0.01 0.0! 0.0; 0.0! 0.028 Science 60.3! 78.91 10.5! 11.7! 2.5! 457.2; 0.3! 0.5!I 1.0' 0.0' 0.0! 0.Ot 0.0!i 16.929 Banking &Ilsurmnce 16.81 26.1! 4.9! 127.3! 0.8! 321.21 0.51 0.6! 1.1! 0.0! 0.0! 0.0! 0.0' 0.330 Smte Admln. I 0.0! I I31 Senvice Outlays 1172.6! 224.7! 46.31 187.21 9.1 1 1587.5' 12.0! 10.7! 8.6! 13.0! 5.0! 9.7!i 27.71 26.332 Defence &Omher I 0.0! . 133 Tool Outlays 2778.11I 6656.9; 473.4! 450.5 95.7 i 42999.9! 198.5! 171.51 22.6! 325.7! 47.61 290.4! 663.7!i 111.3
34 Depreciatlon 1 330.51 831.2! 467.41 140.9! 19.2; 4013.8. 45 1.1 i 153.51 48.0! 150.7! 15.9! 84.4! 251.0' 59.035 Wages 23.1 1034.8, 516.3! 645.3! 163.7! 6958.6. 211.0! 221.01 78.7! 733.71 105.3! 402.6! 1241.6! 221.136 Other WagsM 58.8! 7.81 8.9! 12.0! I'l1 149.6! 3.01 3.3! 1.3! 0.91 0.5! 1.3j 2.71 3.537 Kolkhoz Pay 110.61 1430.9! 0.4: 0.0! 0.0! 1606.9! 1 !I 7.8! 1.0' 4.7; 13.5!38 Social Security 146.4! 54.01 41.6! 53.21 12.2! 765.2! 11.8! 18.61 6.21 53.0! 7.3! 29.5Si 89.8! 27.439 KoUlhoz Soc. Sec. 1.0! 209.91 0.0! 0.0! 0.0! 220.41 1 1 I 0.9! 0.1!i 0.5! 1.5!40,Net Profit 792.1! 83.7 390.4! 651 .1! 5 5.2! 8378.71 97.9! 46.8: 112.8! 0.0! 0.0! 0.01 0.0! 39.1411 Bonus Wages 93.8! 101.5i 36.0! 12.7' 2.8!i 676.4' 14.1! 18.0i -9. 1 6.41 3.31 4.4! 14.11 24.042 Turmover Ta" I 0.0! 0.0: 0.0' 0.6' 0.0! 5208.6 i I 43 Net Subsidies 1 0.0! 0.0! 0.01 0.01 0.0! -4795.2- 1 " Other NeitIncome 0 .0! 0.0! 1.71 0.0! 0.0! 46.6! 0.0! 0.0! 0.0! 0.0! 0.0: 0.01 0.0! 0.04- Kolkhoz Income 0.01 1260.8! 0.0! 0.0' 0.0! 1295.5! i I
46Private income 62.2! 2054.5! 0.0! 0.0 i 72.91 2!89.6. 40.0' 30.0! 0.01 50.0! 10.0! 70.0! 130.0!47,Total ILosses -85.11 9-86.6 .4-41 -1.9! -0.2: -317.1. -1.5' -1.2! I __________
48 Net ForeIgp Trade i 0.0! 505.5!f 0.01 -2492.0' 130.61 -3649.2 i I 49 G. N P 2650.2! 8142.5! 1422.4! -990.8! 454.7! 22072.0 814.8' 471.7! 245.81 1003.41. 143.4! 597.41 1744.2: 350.1SO Total Output '5428.31 14293.8! 1895.81 1951.7! 419.8! 68721.2' 1013.3, 643.21 268.4, 1329.11 191.01 887.8. 2407.9: 461.451 Import j 0.01 877.8! 0.01 0.1 109 1771
52,Total Supply 1 5428.31 15171.6' 1895.8' 1951.71 590.71 86428.3; 101i3.3: 643.2' 268.41 1329.1! 191.0: 887.8' 2407.9! 461.4
63

Belarus 3: 1987 Input-Output Table in Purchasers' Prices--SNA Format
Page 3j ~ 129 , 30 31 - 32 33 34 35 36 . 37 38 | 39 ! 40 1 41 1 421 I Bank& State: TOTAL: Defence: TOTAL House- -/- I/- Govern. Defence i Total i Invent. i Net I G N PI_______ I__ Insur. Admin.; SERV. & Other OUTLAY holds Paid Free & Other: Fixed : Export i
_powLer 0.2. 1.11 129.5i 0.0. 1113.7. 132.4 132.4. 0.0 0.0. 0.01 132.421Petro-Gas . .1 4.3; 150.11 61.0 3194.0- 88.0 88.0 ; 00 3.7 o0. 91.73iCoal I 0.2: 0.8 34.4. 1.1. 77.1 6.9 6.9! 0.0 -0.3; 0.0j 6.64IOther Fuets i 0.0: 0.2' 20.3i 0.3: 77.7; 21.7 21.71i 0.01 6.0: 0.01 27.75 FerrousiMetali ; 0.01 0.1! 11.3i 0.4 1510.81 4.0 4.01 0.0i 5.11 .01 9.16|N-Ferrous Metis I 0.01 0.01 7.2! 0.0 438.61 0.0. 0.0i j 0.01 2.21 0.O0 2.27IChemicals | 0.6 2.2 113.4i 150.4! 3198.0i 334.8. 334.8: I 0.0i -18.01 0.01 316.88 MBE.4W 0.41 14 126.71 1412.3. 7856.6. 1159.6 1159.6! 1 3981.11-1167.71 0.01 3973.09 Wood & Paper 0.8i 3.21 40.21 0.11 1286.31 441.6' 441.6i i i 1 35.2i -9.8i 0.01 467.0
1OlConnw. Matetrab I1 0. 0.21 28.51 0.2! 1863.11 112.6 112.6i ! o.0i 33.01 0.0! 145.611 LJght Industry I 0.2. 1.11 90.81 114.6' 4328.2: 3446.5. 3532.11 : 31.61 -631.6: 0.01 2846.512 Food Industry 0.01 0.11 208.41 91.3; 2976.0' 5763.8 5852.1: I j 0.0; -247.5 0.01 5516.3131Other Indunnr 1.01 3.8j 67.9; 0.0; 967.2 362.0 362.01 1 6.01 148.0 0.0o 515.914ITotai Industry 4.6; 18.5. 1028.7: 1831.7; 28887.4' 11873.9 12047.8. 1 .4053.8:-1876.9. 0.0! 14050.8I5iConatnzcon I 1 0.0; 0.0: 0.0; 00 001 . 5428.3; 0.01 0.01 5428.316iAgr. & Forestry 0.01 0.21 46.2. 18.0i 11525.5: 1931.2: 1949.2; 196.8. . I11.0: 1034.71 0.0! 3273.717|ProducUn T C j I ' 0.0° 1703.6 0.0- 0.0! - 192.2! 0.01 0.0 0.0j 192.2181T & D | i ; 0.0 1951.7! 0.0 0.0 1 0.01 0.0i -2492.01 -2492.019 OtherProd. Sectofs 0.4i 1.9 33.01 0.01 301.9: 201.4 201.4 . 1.71 45.61 0.01 248.720jMaterial Outlays I 5.0 20.61 1107.9; 1849.7. 44370.1 14006.5 14198.4. 0.01 389.0' 1 9594.8 -796.6i -2492.0j 20701.721 jHousisg-Commuaal I.61 1.21 15.41 6.01 330.1 i 630.0; 334.5i 295.5i 33.91 19.41 1 I 1 683.3221N-Prod. Transport 3.01 5.6i 39.41 2.51 187.9! 403.0. 403.0' 0.0! 0.Oi 116.91 -64.6! 455.323fN-Prod. Colmunic. [ 3.61 5.9: 22.41 0.91 23.31 127.91 127.9i 0.0! 96.0' 76.41 1 -55.21 245.224 Educatlon 1.31 0.01 5.2' 196.41 1132.7. 93.21 1039.5i 0.01 0.01 i 1132.725 Culture | 0.31 0.0; 1.11 1 30.61 160.4: 79.31 81.11 0.0 0.01 160.426|Health. etc. j 1.01 0.0; 4.01 137.91 750.0. 193.2! 556.81 0.0! 0.01 1 1 i 750.027jEduc.. Cult & Healt 2.6i 0.0i 10.31 364.8i 2043.1 365.7; 1677.4! 0.0. 0.0: 1 2043.128IScXence I 0.01 0.0 18.7 : 475.9 0.0 0.0! 0.0! 100.31 216.4' 1 -331.1 -14.429Iauking & Insurance 00 0.0. 2.61 323.7, 151.6 151.61 0.01 0.0: 0.0. 125.0i 276.630: State Admin. I : O.Oi 0.0 172.5; 172.5i 0.0: 79.5 0.0; I ; 252.031IServiceOutlays '0.8i 12.7! 108.9i 9.4 1705.7 3528.1: 1555.21 1972.9, 309.7: 429.1! 0.0. 0.01 -325.9! 3941.032jDefence & Other I I 0.0! 0.0; 0.0. 0.0! 0.0 0.0; 2911.3! . i 2911.333 Toal Outdays ! 15.8: 33.3. 1216.8 1859.1. 46075.8 17534.6 15753.6- 1972.9- 698.7; 3340.4 9594.8 -796.6; -2817.9: 27554.0
.1 _ __ _ _ __ _ __ _ _ __ _i. I i ! f I __ _ _ __ _ _ __ _ _ _ I i!34 Depreciadon 2.11 12.2! 976.9 59.2i 5049.9: i i -
35 Wags 36.41 189.2. 2199.0. 708.4. 9866.0 -. . i3610ti Wages 0.4; 1.6! IS.81 2.9: 168.3! ; : ' !37|KoikhozPay I 13.51 i 1620.4' - : j j38iSocial Security 35! 15.7 173.01 81.0. 1019.2i . ' I ' '39Colkhoz Soc.Sec. I I.5' I 221.9. ' . . i i40 Net Proft 417-11 0.0! 713.7; 259.9' 9352.3. !i
41 Bonus Waps i126 00 91.91 i 768.3i
42 Tunover Tax I I 0.01 5208.6 : : I i i43 jNct Subsidies i 0.01 -4795.2; Ii4410ther Net Incme 0.01 0.0 0.0! * 46.6i 1 i . - -
4S IKolkhoz Income i 0.0i , 1295.5' T I I I46 Private Income j 200.01 2389.6: 1 ;_;_I_| !
47 Totailtesas j I -2.71 -319.8 I ; I48 Net Foregn Trade I 125.0i 125.0! -3524.2, - i_!___!_I
490 N P 845f 218.71 4429.8i12052.2. 27554.0Oi_________ _____
50 Total Output 475.3! 252.0, 5521.6! 2911.3 771 54.0; 1 . j51 Impo 0.0 17707.11 ' I ! _|
52ITota Suppiy 475.31 252.0: 5521.61 2911.3 94862.1 ' ! ; i- -
64

Belarus 3: 1987 Input-Output Table in Purchasers' Prces-SNA Format
Page 41 43 i 44_Expons, TOTAL
_ _ _ _ ~~~~USESI Power i 45.9 1292.02 Petro-Gas i1454.41 4740.1
3ICoal 0.01 83.74 Other Fuels | I.0 106.45 Ferrous Metai i 183.91 1703.86 N-Ferrous Metai 68.0! 508.87 Chemicals 2394.61 590948 MBMW 7919.61 19749.29 Wood & Paper 476.6! 2229.8
10 Consa-. Materials 231.31 2240.0L ipht Industry I3687.3i 10862.2
12 Food Industry 1630.11 10122.413 Other Industry 358.81 1841.914 Total lndustry 1384SI.71 61389.9S Constructicn L 0 5428.316JAgri. & Fory j 372.3: 15171.517 Productiou T & C 0.01 1895.818T&D j 0.0i 1951.719 Other Prod. Seors 1 40.31 590.820 MaterIal Outlays 11 8843 86428.021 Housing-Communal I 1013.422 N-Prod. Transport 643.223 N-Prod. Communic. j 268.424iEducaton 1329.12S Cultue 191.026 Health etc. !887.927 Educ., Cut. & Health - 2407.928 Science 461.529IBanking & Insurnce i 475.330State Admin. L 252.0
31 Service Outlays 5521.7321Ddefece & Other | 1 2911.333TOutl 118864.3i 94861.1
34 Depeciadon3SjWages36 Other Wages37 Kolkhoz Pay
38TSodaJ Security I39 Kolkhoz Soc. Sec.40 Net Profit41 BonusWages
42 Tufnover Tax43 Net Subsidles
44 Other Net Income4S Kolkhoz Income46 Private Income r -47 Total ses I I
48 Net Foreigp Trade j I49,G N P _
SO Toal Output I
Sl Import52 Total Supply
65

Estonia 3: 1987 Input-Output Table in Purchasers' Prices--SNA FormatMUlloa Rubles. Current Prices
Page I________________ ~ 1 tep2 _I3 i 4 1 s 5 7 8 i 9 1 10 1 II 12 3 _3 1 14
___________ P_ wer Ptro- i Coal Othier i Ferr. I N-Ferr.r Chem. i MBMW Wood &! Constr. I LIght I FoodI Other: Total________ I ~~~~~Gas' 'Fuels IMetals iMetals Ppe i T ater. FIIn. _Idutr
IlPower T 1.21 2.21 0.0i 13.6, 0.41 0.11 25.Oi 21.21 14.31 17.11 18.11 10.21 4.lj' 127.42l1Petro-Gas 29.6' 19.71 0.01 11.11 0.1!i 0.0! 15.21 16.6!i 10.71 9.2! 3.!!1 28.11 2.3! 145.6
3ICoW ~ 0.11 0.01 0.0: 0.01 0.0: 0.0' 0.01 0.51 0.21 0.61 0.21 0.21 0.11 2.041Othier Fuels 1107.61 0.3; 0.0; 23.51 0.01 o.o: 1.8: 0.31 1.81 5.31 0.0' 0.21 0.11 140.75IFerros Metals 0.61 0.21 0.01 1.71 5.71 0.Ii 2.0; 105.71 8.21 14.81 0.91 7.81 2.61 150.46 IN-Feffous Metlsu I 0.21 0.01 0.01 0.0! 0.5 1 4.01 0.7! 67.2!i 1.31 3.5i 0.11 2.81 4.81 85.2
7 1 Chemicals1.11 0.41 0.01 16.81 0.21 0.0' 151.9 i 47.01 31.71 10.41 70.71 13.71 15.01 358.9S'MBMW 31! 0.31 0.01 5.31 0.21 0.Oi 6.5 i 358.11 20.31 6.11 8.91 24.81 6.01 439.8
9I Wood& Paper 031 0.21 0.01 0.81 0.21 0.01 7.51 25.01 157.81 8.41 7.1 J_ 26.91 23.61 257.914)[Coasi. Mateials 0.41 0.1! 0.01 0.41 0.11 0.0! 2.21 7.11 4.61 76.3! 0.71 10.11 _2.41 104.41 1 JUgh: Industry 0.71 0.01 0.0: 0.81 0.01 0.01 53.3 10.61 28.21 2.71 930.91 12.41 22.71 1014.5121 Food Industry 0.21 0.0! 0.01 0.21 0.0 i 0.01 3.4 ; 1.71 2.3!1 0.41 1.21 493.31 48.81 551.4131Other Industry 1 1.51 0.01 0.0: 0.11 0.11 0.0! 2.4; 6.51 7.51 0.91 3.01 14.71 26.2 62.8,14lTOtal Industry 1=146.71 23.51 0.0' 74.41 7.6! 4.3 ; 223.8! 667.41 288.71 155.71 1045.01 045.21 158.61 3440.8151construction I 0.01 0.Oi 0.0' 0.01 0.01 0.0' 0.0 I 0.0i 0.01 0.0! 0.01 0.01 0.01 0.0161Agri. & Forstry I 0.01 0.0. 0.0 0.0 i 0.01 0.OOi 0.01 0.0! 11.51 0.0: 58.91 1157.21 137.81 1365.417 Production T & C i 1.61 39.91 4.91 17.11 5.3! 0.3 15.61 43.11 14.9! 85.6! 16.81 112.41 10.41 367.9181T & D I 0.01 15.61 0.1' 0.01 5.81 OS5i 24.71 46.81 5.7! 8.9! 46.21 186.7 i 6.7 i 347.619!Other Prod. Sectors I 1.51 0.01 0.0. 0.1! 4.51 0.11 1.41 7.21 7.51 1.41 4.51 2.91 0.51 31.520!Matetla Outlays 1349.7! 78.9! 5.0! 91.Sj 2.3.31 5.2i 265.51 764.Si 328.31 251.61 1171.41 2104.31 314.01 5553.221 IHousing-Communal 3.41 0.31 0.01 0.-3! 0.2! 0.1 i 2.51 12.31 6.81 1.31 10.11 8.21 1.2! 46.722'N-Prod. Transpon 1 0.6! 0.01 0.0! 0.81 0.11 0.11 0.61 7.51 4.9! 1.1, 4.0! 1.51 0.8! 22.0231_N_Prod__Comm___c I 0.0! 0.01 0.0! 0.01 0.0! 0.01 0.0! 0.01 0.01 0.0 0.01 0.01 0.01 0.024lEducation j 1.8! 0.11 0.01 0.2! 0.1! 0.1! 1.41 5.91 3.6' 0.7 4.0! 3.0! 0.6! 21.625jCulture J 0.41 0.01 0.0! 0.0! 0.0! 0.01 0.3! 1.61 0.81 0.2 0.91 0.7! 0.1! 5.126JHealth. etc. 1.41 0.11 0.01 0.31 0.11 0.11 1.11 4.81 2.81 0.6! 3.51 2.3! 0.5!i 17.527!Educ.. Cult. & Healt 3.71 0.21 0.O i 0.41 0.31 0.1! 2.7: 12.41 7.31 1.4! 8.51 6.01 1.31 44.328 1Science 2.2 ! 0.2! 0.0! 1.1! 0.11 0.0, 1.1i 13.51 1.41 0.7! 1.1 ! 2.2! 0.11 23.729(lanklng & nsumancel 1.11 0.11 0.0! 0.11 0.31 0.0. 0.71 7.61 1.9i 0.41 5.41 9.41 0.31 27.1
30 I State Admin. ~ ~~I I
31(eU uly 1 10.91 0.9! 0.01 2.71 0.71 0.5- 7.8: 53.3! 22.2! 4.9! 29.1! 27.2! 3.71 1638.832IDefence &Other i I; i I33 Total Ouly 160.7! 79.8! 5.0' 94.21 24.01 5.6; 273.3 i 837.7: 350.5! 256.6!i 1200.51 2131.5i 317.71 5717.0
34!DepreciatUon 79.4! 1.5! 36.81 1.2! 0.61 34.4! 90.91 36.3! 34.8! 37.61 93.7! 38.21 465.435IWages ~13.41 1.4! 0.0! 41.01 2.0' 05I 25.5! 165.71 65.1 37.81 112.6! 91.2! 48.5! 604.7
361thr agesIZZ 0.4 0.0' 0.0! 0.81 0.1! 0.0; 0.91 5.3! I.1~ 0.91 2.4!1 1.71; 0.9 14.637 1Kotlkhoz Pay 0.1 0.0! 0.0! 0.2! 0.01 0.0! 0.0! 26.5i 9.3 0.2 _ 2.0F 33.1! 13.71 85.038 [Socila Security 2.0 0.2! 0.01 5.31 0.3! 0.l1 3.31 21.71 5.41 4.91 15.8! 11.41 4.6 75.039Klolkhoz Soc. Scc. 0.0! .0 0.01 0.01 0.0 ! 0.01 0.Oi 00 3.1!i 1.0 0.0! 0.3! 4.7!1 1.6 10.740 Net Profit 161.7! 8.1!I 0.01 12.2a 3.0; 1.3! 44.01 180.31 72.21 23.3! 171.8! 135.0! 13.8 706.641 Bonus Wages 0.9i 0.2! 0.01 5.31 0.31 0.1! 4.3! 22.1! 8.31 4.61 16.11 14.3 6.1 82.642 Turnover Tax 124.41 0.0' 0.01 0.11 0.01 0.0; 58.8! 12.9! 3.51 10.31 238.0 33.2 27.4 707.543 Net Subsidies 1 0. 0.01 0.0! 0.0 1 -i OO 0.01 00 -19.0! -1.3f 0.0! 0.0', -8.9! -692.21 0.0 -721.344lOther Net Income I . 0.01 0.01 0.5! 0.31 0.2! 2.0! 0.01 0.0! . . 1.1 00 1.45 Kolkhoz Income 0.01 0.0! 0.0! 2 -0.2 0.0. 0.0 0.0; -! 19.41 5.1 0.31 2.2! 34.8i 14.6 76.446jPrivate Income 1 0.0! 0.0: 0.0! 0.0! 0.0! 0.01- 0.0! 0.0! 0.0! 0.0- -0.0! 0.0! 0.0 0.047 [Total Ise J-1.1 0.0! 0.01 -0.5! 0.0! 0.0! .3.0! -3.9! -0.5T -051 -8.4! I1.3! -0.6 17.9148!Net Foreign Trade I 95.31 252.9, 0.6! .15.8! 348.3! 78.0! 182.5: 546.0! -58.8! 17.8! -172.61 -373.61 13.51 533.549IG N P 185.3! 264.0 30.6i 80.5! 155.1! 80.6! 331-41 1066.9 i 139.7! 333.81 392.7! -338.3i 156.21 2558.250 1Total Output 341.1l 91.0' 5.0i 190.51 30.8! 8.2! 422.21 1338.6i 549.01 372.51 1765.8! 2366.8! 6. 7741.751 1 on38.31 261.Oi 10.6! 0.2! 155.01 86.0: 490.6i 1114.6! 95.5! 50.31 666.5! 397.51 71.01 3437.0
52 ITotal Supply 1 379.4! 351.91 15.6' 190.61 185.8! 94.2!i 912.8. 2453.2 ; 644.5, 422.8; 2432.3' 256.2 531.31 31178.8
66
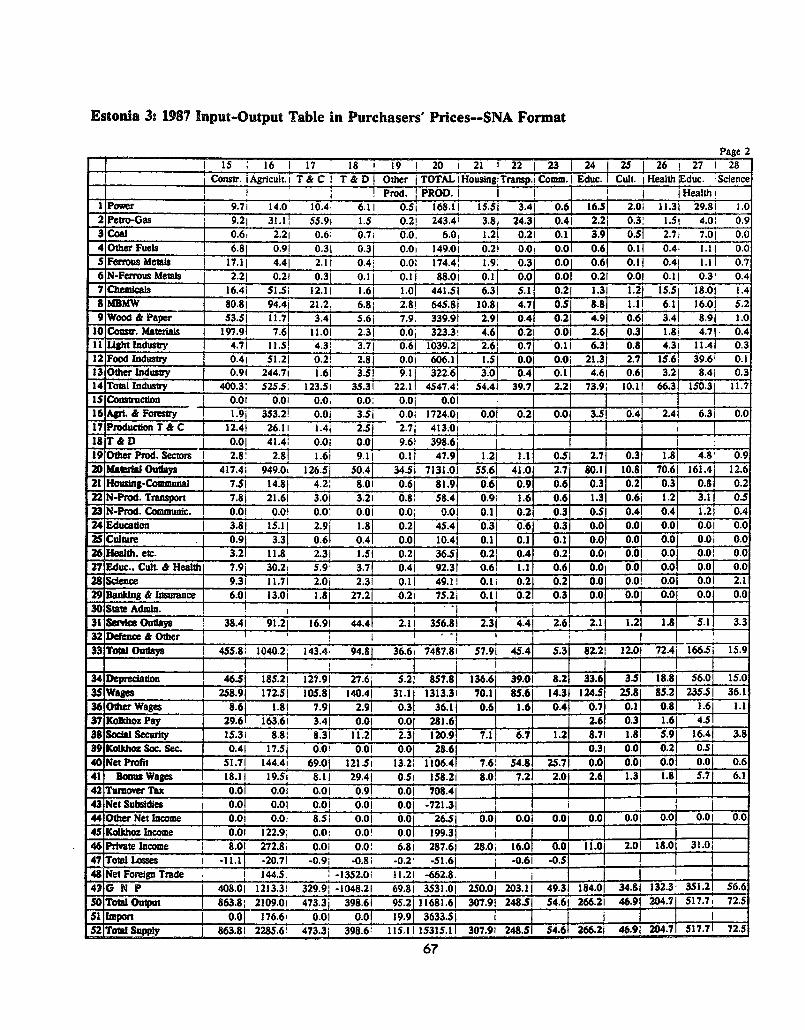
Estonia 3: 1987 Input-Output Table in Purchasers' Prices--SNA Format
Page 2j ______ _ 15 I 16 i 17 18 19 1 20 1 21 i 22 1 23 1 24 1 25 1 26 ! 27 1 28
_ ___________L Const. iAgiicult.i T & C I T & D Other j TOTAL! Housing:Transp.! Comm.l Educ. I Cult. I Health Educ. Science-I_____-___|__ I Prod. ' PROD. I I I j Health!
IPower 9.7i 14.0 10.4 6.1 1 2.0 11.31 29.81 1.02 Peuo-Gas 1 9.21 31.1! 55.91 I1.5 0.2! 243.4! 3.8, 24.31 0.41 2.21 0.3! 1.5! 4.0! 0.93 Coal 0.6i 2.2 i 0.6; 0.7 i 0.0, 6.0, 1.21 0.21 0.11 3.91 0.s 2.7!i 7.01 0.04 OtherFuels 6.81 0.91 0.31 0.31 0.0i 149.01 0.21 0.0 0.01 0.6 0.1! 0.4. 1.11 0.0S Ferrous Memis i 17.11 4.41 2.1! 0.4; 0.0; 174.4: 1.9: 0.3 0.01 0.61 0.11 0.41 1.11 0.76 N-Ferous Me"k 2.21 0.21 0.31 0.11 0.11 88.01 0.11 0.0 0.01 0.2! 0.01 0.11 0.3' 0.47 Clemlcai 16.4i 51.Si 12.11 1.61 1.01 441.51 6.31 5.1 0.21 1.31 1.21 1S.5! 18.01 1.48 MBMW _ 80.8! 94.4i 21.2 6.8! 2.8! 645.8 10.8! 4.7 0.51 8.81 1.1! 6.11 16.01 5.29 Wood & Paper 53.51 11.71 3.4j 5.6j 7.9. 339.9! 2.91 0.4 0.21 4.91 0.61 3.41 8.91 1.0
10 Coasr. Matrials 1 197.91 7.61 11.0! 2.3! 0.01 323.3! 4.61 0.21 0.01 2.61 0.3 1.8i 4.71 0.411 LAtlndustry 1 4.71 11.5! 4.31 3.71 0.6! 1039.21 2.61 0.7 0.11 6.31 0.8 4.31 11.41 0.312 Food Induauy 1 0.4i 51.21 0.2! 2.8 0.Oi 606.11 1.5 0.01 0.0! 21.31 2.7 15.61 39.6' 0.113 Other Industry 0.91 244.7i 1.6! 3.51 9.11 322.6! 3.0 0.41 0.1r 4.61 0.6 3.21 8.4! 0.314 IToral Industry 1 400.3 525.5: 123.51 35.31 22.11 4547.4! 54.41 39.71 2.21 73.9; 10.11 66.31 150.31 11.7is Cosuuction J 0.0! 0.01 O.0. 0.0: 0.01 0.01 I I I i16 ApI. & Forestry 1.9j 353.2! 0.0i 3.5; o.Oi 1724.01 0.01 0.21 0.01 3.51 0.41 2.4! 6.3!i 0.17 ProductionT&C 12.4! 26.11 1.4_ 2.51 2.7, 413.Oi J i
18 T & D j 0.0! 41.4; 0.0i 0.01 9.6! 398.6i j T19 Ofter Prod. Secnors _ 2.81 2.81 1.6i 9.11 0.1! 47.91 1.21 1.1 0.51 2.71 0.31 1.8j 4.8' 0.920 malIOutlays 417.41 949.0 126.51 50.41 34.5i 7131.01 55.61 41.0 2.71 80.11 10.81 70.6! 161.41 12.621 Housing-Cotmmunal 7.5! 14.81 4.2! 8.01 0.61 81.91 0.61 0.9 0.6 0.31 0.2j 0.3 0.81 0.222 N-Prod. Transport 7.8! 21.6! 3.0! 3.2! 0.8! 58.41 0.9i 1.6 0.6 1.31 0.6i 1.2 3.11 0.523 N-Prod. Communic. I 0.0 ! 0.0 0.0 0.01 0.0; 0.0! 0.11 0.2 0.3 0.51 0.41 0.4 1.21 0.424 Education j 3.8j 15.1 2.9j 1.8 0.2 45.41 0.31 0.6 0.3 0.0 0.0i 0.01 0.0! 0.025 Culure .I 0.9 3.3 0.6 0.41 0.0 10.41 0.1 0.1 0.11 0. 0.01 0.01 0.0i 0.026 Health. etc. ] 3.2 11.8 2.3i 1.51 0.21 36.5 0.2 0.4 0.21 0.0! 0.01 0.0 0.0! 0.027 Educ.. Cult. & Health 7.9' 30.2; 5.9 3.71 0.41 92.3! 0.61 1.1 0.61 0.0j 0.01 0.0 0.0j 0.028Sdence 9.3! 11.7! 2.0i 2.3! 0.11 49.11 0.11 0.2 0.2 0 0.0 1 0-0i 0.01 0.0! 2.129Banking & lurance 6.01 13.0i 1.81 27.2! 0.2i 75.21 0.1! 0.2 0.3 0.0 0.0 0.0! 0.0[0.030StateAdmin. , r ,
31 Sentea Outlays 38.41 91.21 16.9! 4414 2.11 356.81 2.31 4.4! 2.61 2.11 1.21 .8 s.d 3332 Defence & Other I,.33 Toal Outas 1 455.8! 1040.2; 143.4. 94.81 36.6j 7487.81 S7.9! 45.4 5.3 82.2 12.01 72.4 166.51 15.9
_ _ _ I . I
34 Depreciation 1 46.51 185.2! 127.91 27.6 5.21 857.81 136.61 39.01 8.2 33.61 3.5! 18.8 56.0 15.035 Wages 1 258.91 172.5! 105.81 140.4! 31.1j 1313.3' 70.11 85.61 14.3! 124.5! 25.81 85.2 235.51 36.136 Ohr Wages j 8.61 1.8! 7.91 2.91 0.31 36.11 0.61 1.61 0.4 0.71 0.11 0.8 1.6j 1.137 WU=ho Pay 29.61 163.6! 3.41 0.0! 0.01 281.6126 03 .6 4538 Sodal Securiv 15.3! 8.8! 8.3! 11.21 2.31 120.91 7.1! 6.7 1.2 8.71 1.81 5.9i 16.4 3.839 Kolkho Soc. Sec. 0.4! 17.51 0.0 0.0! 0.01 28.61 r 0.3! 0.01 0.2 0.5140 NetProfit 51.71 144.47 i 69.01 121.5i 13.2! 1106.41 7.61 54.8T 25.77 0.00. 001 °! 0°° 0.641 Bonus Waps 18.1! 19.Sw 8.1! 29.4! 0Si 158.2! 8.0! 7.2 2.01 2.6 I .1J . 71 6.142 Turover Tax 0.0o 0.0! 0.0! 0.9! 0.0o 708.41 II43 Net Subsidies I 0.01 0.0! 0.0! 0.0! 0.01 -721.31 j
44 OtherNet Income 1 O.Oj 0.0 8.5!i 0.0! 0.0 26.5! 0.0! 0.0! 0.0! 0.01 0.0! 0.0 0.0! 0.04s Kolkhoz Income I 0.0! 122.9' 0.0o 0.0' 0.0 199.31 i I i I46 Private Inoome 8.0! 272.8i 0.0! 0.o0 6.8i 287.61 28.0, 16.0! 0.0 11.! 2.0! 18.01 31.047 Total LsIs I -11.11 -20.71 -0.9; -0.8 -0.2! -51.61 ! -0.61 -0.51 ! 7-48 Net Foreign Trade . 144.5 1 -1352.0i 11.21 -662.8. 1 I I42G N P [ 408.01 1213.31 329.9: -1048.2! 69.81 3531.01 250.01 203.1! 49.3! 184.0! 34.8! 132.3 351.21 56.6S0 Total Ouut [ 863.8! 2109.01 473.3j 398.6i 95.21 11681.6! 307.91 248.51 S4.61 266.21 46-91 204-71 517.7i 72.551 Ibmpot 0.01 176.61 0.0! 0.0 19.91 3633.S5 I i I I I | I52 Totl Supply [ 863.81 2285.6! 473.3! 398.6! 115.1! 5315.11 307.9! 248.51 54.61 266.21 46.9! 24.7! 5
67

Estonia 3: M97 Input-Output Table in Purchasers' Prices-SNA Format
- - - - ~~~~~~~~~~~~~~~~~~~~~~pape 3
29 30 31 1 3[a3 34 3ITTa3 37 3s 39. 40 41 [4Bank & State TOTAL Defensef TOTAL House- -/- I -/- Gover. Daefene TotaJl Ivet. Net GON PInsur. Admin. SERV. & Othe {OUTLAY holds Paid Fe___& Othe Fixed IExport4
1 Power 0.2 0.6 51.1 0.0 219.2 2.6.6 26.6 0.0 0.0 0.0 276.2Petro-Gas 0.3 1.0 34.7 9.9 288.0 46.3 46.31 0.0 9.4' 5. 5.7
3 Coal ~~0.0 0.1 8.6 0.21 14.8 0.8, 0.8 0.0 0.0' 01 0.4 Other Fuels 0.0 0.01 1.31 0.0] 150.31 5.41 5.4 10.0 19.0 0.0, 24.45 Ferrous Metals 0.0 0.11 4.1 0.1T 178.6 0.9 0.9 0.0 -0.5 0.0~ 0.46 N-Ferrous Metals 0.0 0.0 0.8 0.0~ 88.8 0.0 0.0 0.0 42.7 0.0 ..2.77 Chemicals 0.1 0.5 31.6 24.3i 497.4 95.9 95.9 0.0 11.4 0.0 107.38 MBMW 0.2 0.8 38.2 228.31 912.3 244.6 244.6 740.7 .13.0 0.0 972.29 Wood &Paper 0.1 03 13.8 0.0 353.71 111.1 111.1, 8.7 16.6 0.0 136.5
10 Cont. matmarll 0.0 00O 9.9. 0.0 333.21 28.1 28.11 0.0 29.0 0.0, 57.21 1 Light Industry 0.0 0.2 15.3 18.9 1073.41 643.1 643.1 0.0 -123.3 0.0 519.812 Food Industry 0.0 0.0 ' 12 15.1- 662.41 1314.0 1314.0 0.0 -183.3 0.0 1180.813 Othe Industry 0.2 0.5 12.9 0.0 335.5: 55.4 55.4 0.0 83.0 0.0 j138.414,Totel Industry 1.1 4.1 26. 9. 510.!'2S2.3 2572.3 _ -749.4 -154.4 0.01 3167.315 Co1151ruwtolou0 0. 0.0. 0.0 0.0 - 863.91 0.0 0.0 863.916 Agil. & Forsuty 0.0 0.01 6.5 3.0 1733.6. 249.2. 249.2. 485 17.8 204.5 0.0 520.017 Prductlon T &C 0.0 0.01 0. . 413.Oj 0.01 0.0 60.3 0.0I 0.0 0.0 60.3
18 T & D _ 0:0, 0:0 398.61 0.0, 0.0 _ 0:01 0.0 41352.0 7.1352.019 Oter Pod. Smn 01 0_ 5. . 7.3 49.31 49.3 00 01 . 91
20 Material Otays 12 47 279.3 300.0 7710.2~ 2870.71 2870.7 0.01 108.8 0.0 1631.1 5. 41352.0 30.621 Housing-Commuznal 0.3 0. 3.6 0.2 85.71 205.41 101.9 103.51 11.9 4912.22 N-Prod. Transport: 0.5, 1.3 8.5 2.7 69.6 100.7 100.7 0.0 0.0 32.7 ___45.5j_178.9
* 23 N-Prod. Communlc. 0.3 0.9 3.6. 0.0 3.6 23.4 23.4 0.0 23.4 12.3 -81 51.024 Education 0.0 0.0 1.21 0.0 46.6 219.6. 17.1 202.5 0.0 0.0 219.6
25 Culture 0.0 0.0 0.3, 0.0 10.7 36.2 25.3 10.9 -0.0 0.0 36.226 Heath. etc. 0.0 0.0 -.9 -. 3 167.4 58.21 10. . . 167.4
'. 27 Educ.. Cult. & Healt 0.0 0.0 2.31 0.0 94.6 423.2 100.6 322.6 0.0 0. - - - f42228 Scienc 0.0. 0.0 2.51 0.0 51.71 0.01 0.0 0.0 67.0 101.6 .147.8] 20.829IBanIcing & Inumance 0.0: 0.0 0.71 0.01 75.9; 15.01 18.0 0.0, 0.0 0.0 - - 15.0' 33.0
30ISote Admin. -0.0 33.9i 33.9 0.0 17.6 0.0 I__31 service Outlay 1.1 2.5 21.3 2.9 381.0 804.6 378.5 426.1~ 119.9 151.5 0.0 0.01 -95.4~ 980.6132 Defence & Other - i0i F. 0 0.501_00 552.4 - I552.433 Tota Otay" 2.3, 7.2 30040 302.9 8091.3! 3675.31 3249.2 426.11 2287 7039 1631.1 50.01-1447.4' 4841.6
34 Depreciatkon 0.71 4.1 25.i 0.0 1174-35'Wages 6.7 36.6 484 9 3545 1933.7 1S6O0ther Wages 0.5 1.3 7.11 7.1 50.3 - - - - - -
37jKolkhoz Pay 4.1286.1 I
Ss pocial security 0.5 23 80 149 173.8i391ICokhoz Soc. Sec. ___ . 29.11i40ONet Profit 83.2j 0.0 171.9 92.0 1370.3i - -41 Bonus WagSW 3.5 0.0 32. 1 W. T,
42 Twwm Tax 0.0 ~ 708.4! 43 Net Subsidies 0.0 -7-2- - - -1
44Other Net Income 0.01 0.0 O.26.5'45 Kolkhoz Incm 10.01 199.3'46 Prtvate Income I__ 75.01 362.61 - -
47 Tot IamLses__ -1.1 -52.7
48. Net Foreign Trade I015.j__ 1. -647.8, - -
49 G N P 106.6 44.3 101.1 249.5' 4841.1 6'
51 lImport I 0.0!-- 3633.5:52ITotal Supply 9. 51.51 1346.7' 552.4 17214.21 - - - -

Estonia 3: 1987 Input-Output Table In Purchasers' Pr{ces-SNA Format
Pagp 4I I 43 1 44 1
_p TOTAL_ ___ USES
I Power 133.6 379.42 Peto-Gas 8.1 351.93 Coal 0.0 15.64 Other Fuels 16.0 190.65 Ferrous Mets 6.7 185.76 N-Ferrous Mes 8.0 94.17 Chemcals 308.1 912.88 MBMW 568.6 2453.19 Wood & Paper 154.3 644.5
10 Consu. Matrias 32.5 422.91 1 liht Industy 839.1 2432.412 Food Industry 771.1 2564.313 OtierIndutry 57.5 531.414 Toal ndutny 2903.6 11178.615 ConlS cdon 0.0 863.916 Agri. & ForeC 32.1 2285.717 Produon T & C 0.0 4733IST&D 0.0 398.619 Oe Prro Secmrs 8.7 115.220 Ml0 Outays I 2944.4 15315.221 Housing-Comrmunal 307.922 N-Prod. Tasport 248523,N-Prod. Contl.54.6; 24 EducatIon 266.225jCulture 46.926 Health. etc. 204.827 Educ.. Cult. & Heaith 517.828 Science 72529 Ranking & Insunce 93.930 Stat Admin. 51531 Sevice Ouafys 0. 1346.632 Defence & Other = 52.433 Total Outlays 2944.4 17214.3
34 Depredation35 Wages36 Other Wages _
37 lolkhoz Pay38 Sodal[ Security39 Kokhoz Sor Sec.40 Net Prt t41 Bos Wages 42 Turwver Tax _
43 Net Subsdles44 Othr Net Income45 h02lGlaoncome46 Pritte Income47 Total I48 Net Foreign Trade49 G N P50 Tatl OutputS1 Import52 Totad Supply
69

Georgia 3: 1987 Input-output Table in Purchasers' Prces--SNA FormatMillon Rubles Current Prices
__________ ~~~~~~~~~~~~~~~~~~~~Page I
________________ Ti 1 2 i3 j4 1 I6 7 ! 8 I 9 110 I 1 IJ 12 13 1 14___________~~ Power IPetro- I Coal iOther IFert, I N-Perr.;i Chem. MDMW! Wood &. Constr. IgUht Food I Other I Toua!
I C- Fels I Me"al I Me"al IPaper i Maier. I Ind. IIndustry
I Poer 0G.7 I0.61- 2.3; 0.0! 49.aT 1.7 i27.9: 34.0; 6.1;i 21.51 13.9i 30.21 26.11 214.52i CetoGal 969 45.11 0.6! 0.11 26.8i 1.0' 10.6i 14.4; 7.5! 26.01 7.51 24.71 2.1! 363.1
3 Coal ~~2.0 0.0. 34.1 i 0.0:. 2S.1: 0.i.3 17 . 0.31 0.11 0.4; 0.01 63.94 Other Fuels 0.0;O-O 0.O i 0.0 0.0; 0.0; 0.0; 0.0. 0.0; 0.01 0.0! 0.0. 0.01 0.01 0.0
5 Ferrous Metls 1.0! 0.31 0.6: 0.01 207.3 i 1.2 2.3 230.61 3.7' 47.51 0.61 1.5! 3.31 499.76 N-Ferrous Meals 0.11 0.0, 0.Oi 0.0' 1.-3; 17.6 i 7.7' 84.9.; 3.21 0.41 0.9j 4.7' 9.6; 130.47COeamcals 0.9' 0.61 0.8; 0.21 5.8 1.9; 249.6. 107.21 14.41 11.51 123.01 8.9 134.7 i 539.6
8 MDMW 5.21 0.71 1.0i 0.1!i 33.01 1.6! 6.01 658.0~ 11.31 23.31 13.51 19.211 2.0! 774.9.9 Wood &Paper 2.11 0.1! 2.41 0.01 6.51 0.5 , 6.4' 20.4, 194.9! 13.41 6.81 $3.81 37.0! 324.4
10 Consu. Matrials 0.21 0.61 0.0! 0.0! 1.81 0.71 3.8i 22.1! 6.5! 192.11 0.31 21.11 2.0; 251.2II Light Industry 0.31 0.1! 0.11i -60.j 1.6 0.2: 1.7: 12.41 12.7'i 2.11 1416.51 7511.51ii 1467.512 Food industry L 0.2 0.01 0.0'- 0.0! 1.21 0.1! 8.6! 2.4! 0.51 0.51 2.21 2116.11 21.41 2153.213 Other Industry 1 0.91 0.11 0.9: 0.0! 1.01 0.1! 4.3!i 14.31 2.71 1.11 9.01L 30.81 41.11 106.114 Total iudustry 1110.4! 348.11 42.9i 0.4; 360.71 -26.71 328.7 3 202.5i 263.7ji 339.61 1594.3! 2318.9i 151.8!j 6888.515 ConswtrcIon 1 0.0! 0.0 0.0; 0.0! 0.0! 0.0! 0.0: 0.0! 0.0; 0.0! 0.0k 0.0! 0.0! 0.016 Agri. & Foretr 0.01 0.0w 0.0: 0.00 0.0! 0.01 5.3! 0.01 3.6! 0.0! 376.71 1812.61 104.41 2302.517 Production T & C 1.41 11241 7.91 0.2! 57.51 1.3! 28 64 1. 7. 20 4. 32.8! 528.8
18 T &D 0-0, 44.11 1.9! 0.0! 31.31 0.3! 47.4'! 57.9! 24.01 25.3 85.81 227. 2961 554.619 Oter Prod. Sector 211 0.01 0.0: 0.0! 2.01 0.0! 2.81 14.8' 8.01 1 1.9. 6.0j 7.7 1.5! 56.820 Mateta Outlays 11391 304.6 52.7! 0.61 431.5. 28.4; 406.8' 1321.71 313.01 553.71 2074.81 4409.5~ 320.2! 10331.321 Housing-Communal 831 0.5! 0.7! 0.0! 2.5! 0.91 4.9; 26.71 9.11 6.0 20.91 38.0! 1.0! 99.
221 Prod Tmport 1.91 0.0' 0.7 0.1! 0.61 0.2' 1.2: 1 .7 ' 6.61 5.3 95 128 071 53
24 Education 02510.41 0.0! 1.41 0.51 2.7; 14.41 4.9! 3.2! 9.51 11.81 0.5! 55.9
26 Health. etc. 4.3( 0.2! 0.3! 0.0! 3.11 0.4! 2.13! 9.61 3.2! 2.51 7.2 9.21 0.41 40.427 Educ.. Cult. & Health 11.61 0.4! 0.1. '1.0! 2.7! 1.0! 5.3i 27.91 9.21 6.51 18.7 23.5! 1.11 308.6
28 Scin 12.81 0.51 0.3! 0.11 0.8! 0.7! 2.2! 40.1! 2.51 3.3 7.01 1 1.8 0.1 I 81.929,Bnki & Inuum 3.91 0.2! 0.21 0.01 0.71 0.2! 1.4! 18.4! 2.5! 3.71 12.711 20.81 0.3! 63.0
31 ServIce Outlays 38.51 1.6; 2.4: 05.3!i 7.3; 3.01 15.1! 128.8! 29.8! 22.71 68.8 9-1 31 0.
33 Total Outlay. 152.4j 306.2! 55.1! 0.91 438.8i 31.41 421.9: 3450.4! 342.9; 57.12143.6 4496.4; 323.31 10739.8
34 DepreclaCon 76.5! 20.0! 14.0i 0.0! 72.4! 8.5! 62.71 167.2: 25.21 61.41 499 127.9 19.61 705.235,Wages 20.2, 3.2! 22.41 0.21 63.4; 6.4: 52.5! 353.3! 70.61 168.41 198.81 6.12.115j36O0ther Wages 0.4! 0.1! 0.61 0.0! 1.41 0.2;i 0.9! 7.51 1.11 3.0 2.71 4.31 0.51 22.737 Kolk oz Pay T 0.0 0.01 0.0; 0.0i 0.0! 0.01 0.01 0.6; 0.6! 27 00 sr 07 .38 Social Security 2.1 j 0.4! 2.11 0.0! 6.51 0.7 6.5. 44.8' 6.81 17.41 25.0! 20.8! 2.51 135.739 Kolhoz Soc. Sec. 0.0! 0.01 0.0; 0.0! 0.0! 0.0, 0.0. 0.1! 0.3! 0.3 0.0! 0.31 0.1! 0.940 Net Profit 114.11 2.6. 12.5! 0.0! -0.41 31.01 5.4: 166.5 52.21 55.3 13I 1.12.119
41 Bnus ages2.5! 0.6! 1.4, 0.0! 5.7! 0.8 i 4.8: 28.3! 4.S1 6.0 15.71 11.9i 3.4! 85.342 iTurnover Tax j23.9i 85.2! 0.0; 0.0, 0.2! 0.0: 71.3: 43.6: 76 189 45. 895.71 80.91 3679.043 1Net Subsidies 1 0.0; 0.0; -18.3, 0.0; 0.0! 0.0, -11-.5 -0.6! 0.0! 0.0 -24-7- 0im F~ .01 -31.344O0therNet Income 0.0; 0.0!i 0.81 0.01 8.0; 3.5, 6.5: 0.01 0.0! 21.4] Z .01 _ II01 .0i 91.2,45 Kolkhox lIncoe 10.01 0.0; 0.0: 0.0; 0.01 0.0; 0.01 0.41 0.41 3.81 2. . 0.5! 6.546IPriatulIncoine T 0! .! 00 0.0; 0.01 0.0: 0.0: 0.0. 0.0! 0.0 y0. o0.0,47 TotalLosse t -9.4! -2.61 -1.9. 0.0' -9.6! -3.0: -9.2' -26.2'i -5.1! -8.7]-1. -37.01 -5.7. .117.848 Net Foreipn Trade t33.7'1 320.7!i 4.11i 0.2, 82.4! 54.7: 200.0 530.7; 176.7: 129.4! -1286.9; 31-1 222.449 0 N P 26 .5 429.5! 36.4' 0.41; 224.3! 84.0: 438.0 3287.7! 336.11 471.21 81241 339i 380.71 4576.1So ToaOMOutpu 380.2; 4350' 87.4' 1.1, 580.71 60.71 659.9 2207.4! 502.3! 918.21 3011.11 5797.2; 472.21 15093.551 Ipn49.71 420.3' 13.0! 0.2! 460.21 97.3- 521.11 1479.41 250.6i 162.9! 1214.3! 1145.71 124.51 5939.2521Total Supply 1429.91I 835.3! 100.41 1.3! 1040.9, 358.0' 3383.0 3686.8 752.9: 1083.1! 4225.4! 6942.9. 596.7! 21032.7
70

Georgia 3: 1987 Input-Output Table in Purchasers' Prices-SNA Format
_____________ ~~15 i16. 17 18 19 20 21 22 '.23 1 24 1 25' i 26 I 27 28Pg2____________ ~Constr. Agricul: T & C T &D Other TOTAL Housing Trmsp.' Com~m. i!Educ. I Cult. I Health: Educ. &,Science
Prod. i PROD. Heath I1 Power 32.2: 8.5- 20.3: 22.2 1.2. 298.8 16.71 10.6. 3.3 i 12.11 1.51 8.31 21.91 5.52 Petro-Gas 1 50.41 34.7'i 88.5! 4.4: 0.5i 541.7 10.4! 63.3. 0.0! 5.1! 0.61 3.5 i 9,2' 2.93 1Coal 1 0.1!i 2.7 i 0.7'i 1.1' 0.0, 68.5, 5.4! 0.3: 0.2 2.81 0.31 1.91 5.1! 0.141 Other Fuels 0.11i 1.11 0.0! 0.0' 0.0. 1.3 0.01i 0.0: 0.0. 0.01 0.0! 0.01 0.0i 0.05 Ferrus Memis 1 68.41 4.71i 2.8; 1.5: 0.0 577.0 0.5; 0.51 0.01 0.51 0.11 0.31 0.91 S.66 N-Ferrous Metmls 1.21 0.0! 0.1! 0.0; 0.5: 132.3 0.0! 0.1! 0.01 0.1! 0.01 0.0! 0.1! 3.07 Chemicals 25.01 64.91 20.4. 4.3; 2.2i 656.5 4.5; 11.91 o.0: 2.01 1.81 23.41 27.21 3.48 M3BMW 131.1! 43.71 41.01 11.51 3.9. 1006.1! 6.6 ! 18.2! 0.8: 9.81 1.21 6.7! 17.71 23.59 Wood & Paper i 95.0! 3.31 1.41 10.8! 9.9 444.81 1.7! 0.61 0.6. 7.00 0.8__ 4.81 12.61 1.610 Coastr. Naterials 544.2! 8.0! 1.7' 8.7! 0.0. 813.8 5.5 1 0.21 0.01 1.91 0.2! 1.3! 3.41 1.1II jLlshtlIndustry 4.6; 7.3; 2.5! 1 1.0; 0.6. 1493.6; 2.8! 0.8! 0.2, 14.4i 1.71 9.91 26.0i 1.112JFoDd ndustr I 1.0: 11.61 0.1 i 18.31 0.0 2184.2 2.3! 0.0! 0.0! 74.41 9.31 54.6 138.21 0.1
13 1Other lndlLsry 18.0' 205.1!1 2.41 5.1! 10.7: 347.4: 8.11 4.01 0.21 8.51 1.0! 5.91 15.4 0.614 lTomllIndustry 971.4; 395.6' 181.9: 99.0: 29.6 8565.9, 64.5! 110.51 5.3! 153.5! 18.6! 105.5! 277.5! 48.5151Construction 0.0. 0.0 0.0. 0.01 0.0! 0.o:; T;l6JAgrl. & Forestry 0.1! 412.6' 0.0. 8.31 0.0. 2723.6! 0.1! 0.0! 0.0! 9.5i 1.11 6.51 17 .11 0.117 ProductinT 2.3! 85.9 0.8! 3.61 20.4! 641.9r i .. j....18__T ___D ___ 0.0! 129.8: 0.01 0.0! 23.9; 708.4!11 F J . . .A - J 19 OiiePmdg. Sectot 11.2' 3.6' 2.0! 12.5i 0.4! 86.5! 0.01 0.51 3.6i 7.4! 091 5.1 13.4 1.6.20 MatulalOutlays 985.01 1027.5. 184.7! 123.4! 74.3. 12726.3. 64.6! 121.01 8.91 17031 20.6! 11701 308.0 50.221 Housing-Commuunal 28.31 18.7! 5.6- 15.8! 1.1. 169.0! 1.6i 1.81 1.21 1.3! 0.5! 0.91 2.7 0.622 N-Prod. Transport 1 34.11 31.7! 2.7. 7.3! 1.31 132.3: 2.5' 3.21 1.0. 4.9j 1.71 3.81 10.5 2.123,N-Prod. Coumunic. t 0.0! 0.0: 0.0. 0.0 0.0; 0.0' 0.3 0.5! 0.71 1.71 1.0! 1.3' 4.1 1.724 Education 18.8 25.2' 3.9; 4.3' 0.3i 108.41 0.8. 1.11 0.71 0.01 0.0! 0.01 0.0 0.025 Cultre 4.31 5.9. 0.9: 2.01 0.1 ; 24.5! 0.2. 0.21 0.11 0.01 0.0. 0.0! 0.0 0.026 Health. etc. 16.2! 19.31 3.0. 3.7. 0.3' 82.91 0.6 0.9! 0.5! 0.0! 0.01 0.01 0.0 0.027 Educ.. Cult. & Health' 39.3! 50.4! 7.8 9.0: 0.7' 215.8. 1.5. 2.2i 1.3j 0.0 0.01 0.0! 0.0 0.028 Science 60.0! 26.9; 3.9; 4.9i 0.21 177.8! 0.2' 0.41 0.6! 0.0 0.01 0.0 0.0. 8.529, Banking & Insurance 29.71 21.21 2.3- 51.6: 0.5i 168.31 0.3' 0.51 0.7! 0.0 0.0 0 0~.01 0.0 0.230OState Admin I _ _ _ _ _ _ _ _ _ _ _ _ _ _ _ _ _ _ _
31 Service Outlays i 192.3! 148.9i 223.3 88.6' 3.7: 863.2! 6.3. 8.6! 5.6! 8.0! 3.21 6.0! 17.2 13.132 Defense &Other: , III
33 Total Outla 1 1176.31 1176.4! 206.9: 212.01 78.1! 13589.51 70.91 11961 45 178.3! 23.81 123.0! 325.2 63.3
344DDemrecIot o3 ____ 2532__ 269_ 11_ 54____ 9_9__ 142_3__ 248_ 81_______ 13_ 51___ 21_7_11_37_ 71_112_0_17_
35 Wages 1 8 1560 S.i12. 58 998 5.1 118.0: 715140734j,714012.36 1Other Wage i 78 .' .! 18 0.51 92i 33 4.4! 2.51 2.1, 0.8 2.01 4.9 2.837 Kokhoz ay i 21.21 468.3 i 0.2!i 0.0. 0.01 499.3!1 4.51 0.6! 2.71 7.8,38 Social Security 69.4: 26.3 i 29.3! 9.8. 4.5! 275.0. 8.9, 9.9' 3.8! 29.51 4.71 17.61 51.81 15.439 Kolkh Soc. Sec. ' 0.5! 47.21 0.7! 0.0! 0.0! 49.3! i 0.5 I 0.1 0.3! 0.9!40 Nat Profit i157.8! -38.8I -14.0; 313.9: 20.2! 1533.7: 20.9i 47.11 31.2! 0.0! 0.01 0.0! 0.01 18.941 BonnaWages 21.6! 20.0! 20.31 4.5! 3.8! 155.6! 10.5! 28.11 4.11 3.7 1.91 2.5 8.11 13.42, Turnoe Tax ( 0.0! 0.01 0.0! 0.21 0.0' 2679.2' I T 43 1Net Subsidies ! 0.0! 0.0! 0.0! 0.01 o.o: -431.3 !"i10dierNtIncome O .0 0.01 20.8: 0.01 0.0! 2112.0; 0.0 0.; .0 0.0 0.0! 0.0! 0.0 0.045 KOD lkhz ncme 0.0! 140.81 0.0! 0.0! 0.0: 147.3! i I I46 PrIvte nu 71.0i 1773.2! 0.0! 0.0] L42.12886.0! 52.0: 2S.0! 0.0! 30.0 5.0! 47.01 2. 0.047 Total Loans -208.0! -80.7! -2.51 -5.41 -1.21 -415.6, -1.4~ -0.5! 48 NotFeiFoeleee87.4! -17.; 51 -1446.11 ! _____
490G N P t1051.7: 320b.9; 558.41-2274.61 156.6; 8275.2! 492.5!241 121.0! 544.81 85.5! 351.2i 9815. 177.9S0 TbOW put 2228.1! 4295.9; 765.3! 708.4! 219.51 23310.8: 563.41 403.71 135.5$ 723.21 109.31 474.2 1367 24351 Import I 0.01 371.0- 0.0! 0.01 26.1 i 6336.3~ i ~....521TIota Supply 1 2228.1 i 4666.9 765.3. 708.4: 245.6. 29647.1' 563.4, 403.71 135.5! 723.2 i 109.3! 474.2I12306.71241.3j
'71

Georgia 3 1987 Input-Output Table in Purchasers' Prices-SNA Format
-~~~~~~~~~~~~~~~~~~~~~ ~~~~~~~~~Page3T1 2910 31i 32 ! 33 34 35 36 1 37 38 i 39 1 40 1 4 2
-~~ 4uauk ~~~~S SWWf ITO'rAL:Ddeawe TO0TAL Hnoue-, q. /. ovrn Defence, Total In"Mi.t Net G NP
_Iustw. !A1.- 53EV. I& Oie OUIOlAY; holds . Paid i Free I &0theri _ 1_l 04 8.51i 0.01 37.3i 56.s5: 6.5 ! o.oi o o.o S6
0. : 1.8- 88.0 18.01 647.71 244.5: 244.5' J11100 87.
3Cca ! 0.11 0.3_ 1151 0.3 80.3S 2.3 2.3 1 10 00. 11.3
4Ofht Fueb j 0 _ 0.01 0.0: 0.1 1.4 0.0 O.: 0 IIS Fe s Mea I o.oi 0.0 7.51 Qli 5846 6.7 67 1 I.o 71.8 o0o0 78.5
6 N-Parom0.01 0.0! 3.2! -0.0! -135.5! 0.0 0.0: 0.01 -20.0 0.01 -20.0
Chemicas 0.21 0.71 47.9i 44.01 748.4. 196.-8 196.8 ! 0.0! -85.3j 0.0! 111.5
a8mo iiZ I0.11 0.4 673 219X: 1292.7; 598.2 598.2' 1 0.0 1445.5
9 wood Paw I 0.1 0.6! 17.8` 0.0! 462.71 170.-1 170.1! i _ 12.11 34.31 0.0 2165
10oCAM a= __ 0.11 10.31 O.1! 824.21 87.3: 87-31 - _r 01 1361 0-.0 2234
13 trIndusay 0.11 0.61 31.61i0 2401 345.75 1047.2. 104.2- 1 3s 1406I
12 Food lud -ty- | 0.0! 0.0! 140.6! 17.31 2342.1 2048.8. 2048. 1 2168.1
TY odie 14dua 0.21 .- as2.1- ~o.o 376.7 229.37 229.3; 1 .jl31 -103-0 0.01 127.5
14 TomIInduuyp 1.31 5.51 513.11 323.71 9402.7; 4687.7 4687.7| 11346.51-121.1 0.0' 5913.1
5SICcs-u--oo 0.0! . I2222 8.1 00.! 00.; 2228.1
16JAg-.&For,m 0.0!l oil 17.41 _3.3 274431 1425.8 1425.8i i 79.8 1 11.71 21.9 0.01 1639.1
17 PMactim T & C I 01! 641.91 0.011 o.o0 0 123.41 0 0.o . 00.0 123.4
Tl8 T1& 0D _ _708.41 0.0! 0_.0 _0.0 -1771.0 -liC=-0
190 Prod.se, I 1.01 42! 2O. - 110.8! 95.9! 9s.9s 10. 26.8 0.0 123.7
20 Mao u 231 9.8! 554.81 327.0! 3608.1 6209.31 6209.4 °.°1 203.2! O.O! 3687.3 -72.4 -1771.01 82S6.4
2l HowIC . 1 1.21 1 s! 10.21 5.21 14.4 350.8: 190.6; 160.2! 22.81 5-4! _379.0
N-Pro& Tr_po I 1.8! 471 25.81 17.81 175.9 295.8s 295.8: 0.0! 0.0! 3.6, -71.6! 227.8
23 N-Prd. Canic. I 2.31 3.2' 12.81 o.o: 12.8 53.8 53.8. 0.0! 43.4! 32.4! T -6.9 127
24 _diu 0.5 0 ° °° 3.1 T 111.51 611.7: 42.7: 569.0! 0.0! o. - 611.7
25Cu e [----- 0.11 0.01 0.71 I 25.2 84.1! 43.9; 40.21 0.0 0.0! 84.1
26 :0.4 ! 0 2.4j 85.3 388.95 112.5 276.41 0.0; 0.! 388.
727lEdu.CuIL.& II b 1.11 0.01 6.11 221.91 1084.7; 199.1! 88S.6: O.Oi o0.0! 1084.7
Banking& msirauc 0.0! 0.01 1.6! 170.01 9.21 9.1! o.o: 0.0! 0.0! 25.0 34.1
S30aSse Ad I Ad! 77.8: 77.81 0.01 4851 0.0 126132 SServIceOUa t 6.41 9.01 66.2! 23.0 95WT1872.0 8262: 1045.8i 221.81 108.7, 00.o o.o! -174.0 2028.5
32 m otb _ i 11330.6! [I i 1330.6
33TOMa Onsy.7! 38.8! 621.0! 350.0! 14s60.6: 80811.3: 7035.6! 104S.8! 425.0! 1439.3~ 3687.3T -72.4i -1945.0111615.6
343Deprafthas 1.07 5.71 479.11 26.61 1933.0
35 Wqea 14.51 93.0 1293.41 856.01 5059.21 ! I I
36 OdW We 0oil 1.7 19.11 24.81 93.1 i
37 Ka_klax 78 .1!
38 S SeC 1. 7.11.31 73.21 446.5i -; - -
39 OKol SOC. SeC. I0.9 5$0.21
40NetPrct 271.1 0.0, 1804.81 _
41 BanWaSg53 0iE.01 9 215.2'142 Twwwe Tx I I 1679.21 ; i i TI
Net 0.0 -~~~~~~~~~~431.31
4SKdkIaosJamm 1 3~~~~~~~47.3!46Puw .0 0 159.0° 2045°0,47 TowalLosw I-1.91 __ _4 _ __ __7_ __ _ i I__ _ __ _
48 Net Fo.up Tfe 25.0! 25.0 i -2421.3!1-1- __ _ _
4903 N P 954! 107.5i 2359.9i 980.6: 116561! ; I
___ 1 _3
50 T mlOus7. 12. 2956.0! 2330.6' 2759723! , 1 ,
________________ iW, 326.3 2956.01 1330.61 3933.6: '
72

Georgia 3: 1987 Input-Output Table in Purchasers' Prices-SNA Format
Pape 4i 43 ; 44I Expon, TOTAL_ i I USES
1 Power 16.0j 429.82 PenodGas j "99.61 835.23 Coal 1 8.91 100.54 Other Fuels I 0.01 1.3S Ferrous Metas i; 377.8! 1040.96 IN-Fernus Mets i 42.6 158.07 Chemtcb 321.11 1181.08 BI3MW 948.7i 3686.99 Wood & Paper 73.9i 753.1
10 Cousr. Materias 33.51 1081.0II UghtIndusty i 1269.4i 4225.612 Food Indury 2432.6 6942.813 Other Industry 1 92.7I 59.814 Tom! Industry 5716.9; 21032.615 Cnsutructin 0.01 2228.116,Ar. & Foramtry i 283.6i 4667.017 Productln T&C 0.01 765.318T & D 0.0! 708.419 Odher Pmd. Sectoun 11.0 245.520 Matmial Oudays 6011.4 29647.21 Housing-Coumnumal 5 563.422 N-Prod. Tmrnpon 403.723 N-Prod. Comu135ic24,Educaon 723.22S Clture 109.326 Healt. etc ! 1 474.227 Educ.. CuL & Healthi 1306.28 Science 241.429 Enng & Insunce - 179.130 Scate 'Ain 126.331 Serike OuClays - 2956.032ldnse&Oiher ! ; 1330.633 Total Outlay 6011.41 33933'
34 Depreciation35 wages36 Otwr Wages37IKolk oPay T38 .Socal Security39Kokhoz Soc. Sec.401 Not P"m !41 Bonus Wag I42 TunoverTax43 Net Subddies I
4Odier Naet Ime45 11 leca46 Prvate Ince47 Total Low48 NesPoftlgnTmde490 N P 50 Tool On"51 Import__ _ _ _ _
S2TotulSupply ______: _

Kazakhstan 3: 1987 Input-Output Table in Purchasers' Prices--SNA FormatMiLlon Rubles. Current Prices
_________________ ~~~~~~~~~~~~~~~~~~~~~~~Page I
________________ 1 2 3 I 4 5 6 7 8 ~~ ~~~ ~~~~~~~~~~~9 2 0 1 I1 12 13 4
-i___________ ~~Power. Petro-I CoalI Other I Ferr.i N-Ferr.* Chem. MB.MW -Wood Constr.i Uigh? Food Other Tota!~~~~~ ~ ~~~~~~Gas j Fuels :Metals: Metals Paper Mater. laId. Industry
lI Power 48.4! 49.1! 33.81 0.01 110.6! 138.0- 148.4 2 18.8. 29.7i 98.21I 42.8 70.0. 28.2 i 916.172 Petro-Gas 215.2. 632.31 7.3: 0.01 58.5 i 61.5 76.7 72.3 11.81 103.3 i 6.4i 31.6, 2.71 1279.43I1Coal i 208.1' 0.0! 198.1 i 0.0! 180.41 19.8' 3.3. -24.0, 1.5i 39.6, 3.6' 10.2: -09! 689.54Ote Fes2.4: 0.0: 0.0, 0.0; 0.01 0.0 0.0 0.7' 0.0! 0.11 0.0.- o.0; 0.0! 3.45Feffous Metals 14.1 2.21 12.81 0.0! 420.4! 50.0, 125.4, 768.3. 24.5i 136.8i 7.3. 16.81 7.6! 1580.46__N__e__ous_Met __ 1 4; 0.1T 0.2! 0.0' 53.21' 1530.4' 23.0: 204.5! 1.21 3.01 1.8; 9.5' 3.7. 1831.97 1Chemlcals 9.9! 11.2! 18.81 0.0! 41.3! 98.21i 625.3: 272.5: 34.2;i 31.8! 100.8. 18.3! 50.9: 1313.28IMBMW 72.5: 8.3! 48.21 0.0! 73.81 103.3; 82.2 2399.9 35.81 78.7! 42.7. 37.1! 1 8.8 3001.2___________Paper __ 2.51 1.0! 23.31 0.0; 8.61 18.7; 46.4 84.6. 352.0: 37.31 15.4; 55.91 29.3' 675.1IO0IConstr. Mdaterials 5.3' 0.4! 8.9: 0.01 5.0: 21.2, 14.61 47.11 30.8' 529.21 2.7: 15.7! 1.21 682.01 l lightl nduau I 3.9: 1.1; 7.01 0.01 5.6; 11.2, 29.7. 55.4;i 38.2! 12.0: 2392.9 59.9k 123.2. 2740.112IFood Industry r 4.2 02 23 0.0! 1.6: 5.7 i 38.9; 9.41 0.8! 3.6! 24.1 ; 1671.2: 76.31i 1837.2131Other Industry 20.61 -0.11i 0.8( 0.0! 2.1: 1.6! 3.11 17.2: 2.8!i 9.1; 5.1! 48.6;i 117.5! 228.714 Total Industry I 608.3: 706.0. 359.51 0.0!i 961.1! 2059.8; 1217.0 4074.7; 563.3' 1082.6: 2645.6 2044.8. 455.4 16778.015SIConstruction 0.0; 0.0! 0.0 i 0.0! 0.0. 0.0. 0.0' 0.0: 0.01 0.0'i 0.0 0.01 0.Oi 0.016 IAgri. & Forestr 0.3! 0.01 0.0! 0.01 0.1! 0.0, 26.0; 0.9: 6.7 i 0.0 1499.0. 6550.2! 293.3, 8 376.517!Production T & C 35.S 450!276 5.3' 241.21 174.3! 429.71i 612.6; 251.8 i 594.61 281.3. 344.8 i 56.6! 3680.4181T & D 0.0; 117.1! 62.51 0.01 .38.8! 6.2! 133.0; 223.01 39.9! 31.11i 314.9. 891.31 39.01 1896.719 Other Prod. Sectors 3.1! 5.51 3.31 0.0! 64.5! 20.3; 17.91 22.1 i 7.5! 13.01 13.5. 18.8! 7.41 196.9
_0 ____________ 647.11 127.6 632.9! 5.3. 1305.7: 2260.61 1823.5: 4933.3; 869.2; 1 7 2 1 .3 i 4754.3. 9849.9. 851.71 30928.521 Houslng-communal 7.9! 11.01 8.6! 0.0 i 12.9; 17.6: 11.71 33.8 i 6.5 ; 11.4! 27.9:; 30.0! 6.91 186.1T22 -P-rod. Trnsporn 2.9. 0.9i 6.3' 0.Oj 4.0! 5.6! 3.8' 17.91 4.71 10O.0! 1.1!1 5.5 i 4.61 77.323 N-Prod. Communic.r 0.0 0.0! oo 0.0 0.0!: 0.01 l: 0.0.- O.0 0.01 0.! 0.01 OO 0.0!i 0.0! 0.024 Education 4.2.i 5.2' 4.61 0.0! 6.9! 9.4;i 6.3: 16.3' 3.51 6.2! 11.11 11.0! 3.71 88.525 Culnir I 0.9; 1T1' 1.501 o.oI 1.21 1.8: 1.4i 3.6;1 0.8! 1.4! 1.81 2.0!i 0.81 17.826 He.altuh. e.tc. & { 0.0! 4.0' 3.61 0.0! 5.4! 7.4: 4.9i 13.2! 2.71 3.8! 7.8! 8.6! 2.91 64.427 Educ.. Cult. &Hatl 5.2! 10.3: 9.2! 0.0! 13.6! 18.6- 12.6. 33.1! 7.0! 11.3! 20.7! 21.6! 7.4. 170.728 Science 6.7! 10.4: 3.5 j 0.01 3.71 11.7, 4.4. 40.71 1.3! 7.21 5.91 4.8j 0.41 100.829 [Banking & Insmurac If 2.5' 5.5! 2.41 0.0! 3.6! 4.8, 3.2' 20.9i 1.8! 3.2! 14.9! 38.31 1.9i 102.9
30 1 State Admin.0.031 ISevice Outlays , 25.11 38.1' 30.01 0.0: 37.7! 58.31 35.7 i 146.4 21.3! 43.11 80.6! 100.3! 21.2! 637. 8
32IDefense &Other ORI0.
33 Total Outlas 672.2' 1311.7: 662.9j 5.3! 1343.5! 2318.9. 1859.2 5079.7 890.5i 1764.41i 4834.8; 9950.2! 872.9! 31566.3
34 Depreciaton 375.31 596.61 252.8! 0.01 330.0i: 289.31 322.5! 356.8: 49.21 221.71 86.7! 147.7! 55.5! 3084.035 Wages 157.11 48.8! 306.0, 0.01 219.2! 315.8! 194.6. 923.2! 150.0; 349.0! 397.6! 311.1! 87.3J 3459.636 Othe Wages 4.0! 1.2! 6.0! 0.0! 5.6! 7.8! 5.0! 26.4! _3.-6! 8.6!_ 10.8! 8.41 2.1j 89.6
37Kolkhoz Pay 0.2! 0.01 o.oI 0.0! 0.0! o.o! 0.0! 19.2! 6.41 2.7! 0.71 7.4! 4.1 40. 838 Sodial SecuIty 20.3! 6.9! 27.6! 0.01 21.31 31.3! 28.31 1235.1: 9.6! 31.9j 40.5! 32.6! 5.1 380.439 Kolkhoz Soc. Sec. 0.01 0.0! 0.01 0.0! 0.0! 0.0! 0.0! 1.8! 0.61 0.31 0.1! 1.0! _0.4T 4.240 Net Profit . 213.4! 357.0! 257.2! '0.0! 251.6! 459.8!i 214.511 606.2! 73.21 147.4! 407.2! 280.8! 62.31 3330.641 iious Wages 15.0! 4.1! 28.0! 0.0! 18.3' 25.2!i 15.6! 87.5i 13.0! 28.61 35.91 28.0! 6.8! 306.242 Tunover Tax 115.1! 368.7' 0.0! 0.01 21.9! 10.11 141.9' 61.3! 3.5! 48.71 702.6! 2009.8! 0.51 3484.143 Net Subsidies 0.0 0.0! -369.9! 0.01 0.0! 0.0! -117.8i -163.9! 0.0! 0.01 -268.61.-3793.21 0.0! -4713.4
1441therNet cme 1 0.0! 55.0 9.0; 0.0! 14.01 9.01 11.0! 0.0' 0.0! 35.0! 0.01 74_.9! -0.0!1 207.945 Kolkhoz Incom I -0.1! 0 0.01 0.0 ! 0.0 ! 0.0 ! .O 0.0' -4.9; -1.61 -0.71 -0.21 -1.9 -1.0 10.3
1 00'! 00! -5.8! 0.0; 0.0! 0.0! 0.0, 0.0 0.0! 0.0! 0.0; 0.! .! .
47 Total I1 -7-2! -5.7 i -. 1 00 -6.61 -8.4! -8.6; -18.9! -1.61 -5.3!- -68.11 -34 -2.4! -142.048 !Net Foreign Trde 112.0 364.81 -176.21 0.9! 58.81 -473.3!i 513.7!; 4573.71 922.91 166.4! 1134.7! -1322.8' 219.3! 8740.5.49 0 N P 990.11 1793.41 306.61 0.9 915.8' 641.3: 1305.0, 6506.0, 1215.8! 1005.71 2443.9! 398.11 4,33.2! 17956.050 Tota Output 1550.3' 2740.3! 1145.71 5.3; 2200.4! 3433.5 i 2650.6: 7012.11 1183.5- 2603.8!i 6144.0. 9025.51 1086.8. 40781.851 Import 321.3! 1318.7! 160.31 0.9! 1063.71 536.91 1535.7; 5395.6! 947.71 308.91 2656.5!i 1938.11 289.7! 16474.052 Total Supply 11871.6! 4059.0 2306.0! 6.2! 3264.1- 3970.4. 4186.3' 12407.7! 2131.2: 2912.7: 8800.S i 10963.6 1376.51 57255.8
74

Kazakhstan 3: 1987 Input-Output Table in Purchasers' Prices--SNA Format
______ _____ ______ _____ _____ ______ _____ ______ _____ _____ ______ _____ ______ ___PaPage2
15 i 16i117 18 !19 i 20 21 22 2 2 12 1 27 :28Constr. I Agricult. iT &C. T &D. Other i TOTAL i Housing Transp.lComm., Educ. ICult. IHealth !Educ. &. Science
Prod. : PROD. IHealthiI IPower 80.01 98.8: 92.6;~ 89.8, 3.2, 1280.6: 63.7 31.71 7.3 73.71 8.91 50.7; 133.31 8.72lPetro-Gas 1160.0: 347.1' 478.11 27.71 0.8! 2293.11; 91.8 206.6i 11.2! 19.51 2.4; 134.4 35.2: .17.53jCoa1 8.7 i 60.0. 31.8: 22.53 0.1; 812.6i 14.2 1.71 1.41 28.8 i 3.51 19.81i 52.1! 2.b4Otlter Fuels I 2.6: 0.0. 0.01 0.0 0.0' 6.01 0.0. 0.0 0.11 0.11i 0.01 0.01 0.1! 0.05Fenrot Me"al I510.1! 7.8! 12.3: 2.7 0.0' 2113.4: 7.0: 2.1:; 0.31 1.31 0.21 0.91 2.41 14.3
6 N-Ferrous Metals 8.2! 0.3i 2.0: 0.21 0.2 1842.71 0.0: 0.5! 0.0! 0.91 0.1! 0.6: 1.7; 2.87Chemicals i 267.61 369.31 87.3 19.3, 1.3, 2058.0i 12.2- 19.1, 5li 7.9 7.2' 91.7' 106.81 9.26 10W 731 .Si 951.5i 148.0: 48.81 9.5: 4890.4; 25.71 48.3; 9.61 28.01 3.41 19.2- 50.61 45.3
9 Wood & Paper 1320.81 127.11 20.7;i 32.41 18.5. 1194.51 6.61 5.01 1.51 18.71 2.31 12.9: 33.9: 6.410 Const. Materials 1817.41 :60.9'i 75.4. 26.91 0.2, 2822.8; 58.5! 2.21 1.21 7.41 0.91 5.11 13.3! 7.0II1 Ught lndusny 38.8; 23.11 23.1; 24.51 2.3: 2851.9 4.3 5.01 1.11 62.21 7.6E 43.0; 112.8. 5.712IFood Industry 1 7.11 297.7: 1.2i 22.21 0.01 2165.4i 6.S1 2.51 0.01 199.5 24.81 146.51 370.8. 0.413 1Odw Indiusty 1 10.2: 474.5: 26.9, 10.2! 24.4; 774.8' 6.9i 3.81 0.2 21.11 2.611 14.51 38.2! 3.314!Total Induany 1 4023.0 2918.0 999.5! 327.2: 60.5; 25106.2 i297.4' 328.51 39.01 469.11 63.8i 418.31 951.2: 123.215!Constructlon I 0.0. 0.0, 0.01 0.0i 0.0: 0.0! I 0.0! 0.01 0.0! 0.0116jApl. & Forestry 1.01 3642.1 1.0! 15.5! 0.0i 12036.0, 13.71 0.11 0.01 27.3 j 3.3! 18.81 49.41 0.017I[Production T &C 264.11 213.1 9.81 11.8! 62.5! 4241.6i 0.01 0.01 0.01 0.01ISIT &D ; 0.0! 673.6! 0.Oi 0.0' 66.31 2636.6: 0.01 0.0; 0.01 0.0l19'Oflher Prod. Sectors 59.21 43.31 15.91 53.6: 1.2' 370.1! 2.31 4.01 2.4 7.11 0.91 4.91 12.9! 2.8120 MaleeiallOudays 4347.31 7490.0; 1026.21 408.1 190.5 44390.61 313.41 332.61 41.41 503.61 67.91 442.01 1013.5! 126.021 HousIng-Communal i 91.21 105.31 72.81 52.81 2.0: 510.2! -3.5i 5.31 2.71 4.11 1.01 4.5 9.61 1.22 N-Prod. Trasport , 83.31 144.4! 35.5! 19.4; 2.4 362.3! 5.61 9.4 2.31 15.21 3.81 19.4! 38.41 6.023IN-Prod. Communic. I 0.01 0.0: 0.0; 0.01 0.0: 0.0! 0.6! 1.41 1.61 5.41 2.41 6.4 14.21 4.324 EducatIon ~ 46.01 111.7! 50.9! 11.41 0.7!i 309.21 1.7' 3.3 1.51 0.0 0.1 00 .1 U-25 Cuture 86! 13.6! 7.2: 2.6! 0.1 50.0 0.4i 0.4 0.31 0.0 0.1 00 00 .26 Health. ecm. 1 29.51 77.0' 39.7! 9.91 0.5: 221.01 1.31 2.61 1.2, 0.0 ZI.01 . OI 0.0 27 EAuc.. Cult & Health! 84.11 202.31 97.8; 23.9; 1.3i 580.2! 3.4! 6.21 3.0i 0.0 0.1 00 OO .28 Science 1 136.9j 123.01 55.0! 7.2! 0.41 423.3! 0.4, 141 1.41 0.ol 0.1 0012.29 Banking& Inmurnce [ 72.61 100.31 30.71 185.4: 0.6! 492.5: 0.6 1.4j 1.6! .01 ] 01 0.0 0.01 0.53OISIate Ad-in. I .0.01 .
31 I avio uftys 468.2 675.3 291.8: 288.7. 6.8: 2368.6i 14.2: 25.3! 12.8; 24.71 7.21 30.31 62.2! 36.232,Defese& Other I 0.01 _____33 TOW OuIIey 4815.5: 8165.3! 1318.01 696.8. 197.2i 46759.21 327.6: 357.9! 54.21 528.31 75.11 472.3!1057 162
34 DerWatin 1 53.611840.01 1287.81 296.2! 13.5i 7115.11 959.2i 208.91 66.01 235.9 24.91 132.2! 393.0 110.35wge 25S9.9i 3190.4; "998. 900.9i 151.3! 11260.21 390.21 516.01 116.711350.9 142.31 621.8! 2115.0i 303.436OhrWs 69.71 38.41 19.7! 27.91 0.9: 246.11 9.0[1 19-.2 3. . . . 14.51 6.937 Kolkho Pay 34.9i 540.81 2.4: 0.01 0.0i 618.9i 13.5 1.6. .1 3!3 I Social Security i 237.81 158.4! 91.6: 92.01 11.9: 972.2! 22.0! 43.31 9.2. 98.2~ 10.3 45.11 153.6! 37.839 IIolkhoz Soc. Sec. 1 0.4! 54.1! 0.3, 0.01 o.o: 59.0! 11 1.! 0.2! 0.8!1 2.5140 Net Proft 18954.0! 495.4' 770.91 639.1! 30.81 6120.71 357 142165 .1 0.0! 0.0! 0.01 55.4411 Bonus Wages 1112.1; 172.6: 71.81 95.01 0.0! 757.71 2. 275 13.6! 109 5.71 7.51 24.11 33.042ITurnoveTax __r 0.0! 0.0: 0.0! 0.81 0.0! 3484.9i I......43 Net Subsidies I .0. 0.01 0.0! 0.0! 0.01 -4713.4'44 Otder Net income : 0.0! 0.0! 280.7 0.0i 0.01 488.6i 0.0' .0 0.0 . .1 0.i 00 45 KolkchozlIncome 0.0! 298.61 0.0! 0.0! 0.0! 2881.3! I I L .. 146 PrIvate Income i 116.71 2725.0! 0.01 0.0; 38.8! 288045: 170.0: 90.0 I0.0! 9j5.0! -12.01 115.0! 222.0:47 Toad Loassn -352.1 i -222.3. .19.31 .17.01 -0.5i -753.2! 1 2 1.818! __________
48 Net Foreign Trade , -~~~~~~~ ~~1 212.5Sj 1.7653.O0 13.2: -111.8. j j . .490 N P 14115.0: 7906.2; 3432.21-5713.11 259.8- 27956.12' 1586.11 1049.3 350.01182.!199.1 I 936.6i 2947.9: 513.550 TeOW OuWf i 893041:17284.01 4750.2! 2636.7! 443.9: 74827.1! 1913.7!- 1407.2 404.21 305 7.2i 1408.9! 4023.6! 675.75I Import 0.0! 357.71 0.0! 0.0' 60.61 16892.3! 5 2ITeW Supply 8930.5i 17641.7' 4750.2! 2636.7! 504.5 91719.4 1913.7. 1407.21 404.212340.51 274.2' 1408.9! 4023.6: 675.7
75

Kazakhstan 3: 1987 Input-Output Table in Purchasers' Prices-SNA Format
Page 3j29 130 1 .31; 32'1 33 -34 35 j36 37 138 139 140 41.42_ _ nlB i State I TOTALIDWdace. TOTAL House- l/G i iGovern.iDefencel Total I InvenL Net IG N P_ 1 _aU. lAdmla. SIRV. I& Other OUTIAY: hold Paid i Free i &Other! Fixed j Expon i1Owr _.5 246.61 0.0 1527.21 135.1Oi 135.1 .2 Pewo-Gas 0.51 2.2i 365.0i 67.7; 2725.8! 275.0i 27S.0; i . 0.0 104.3j 0.01 379,3
3 Coal O.j 0.11 72.11 1.21 885.91 42.0 42.0: i 0.01 41.6i 0.01 83.64 OteiaFuels 0.0! 0-0: 0.21 0.31 65i 0.2' 0.21 ; J 0.01 -0.51 0.0! -0.35 FeoN Melas 0.-! 0.0 26.11 0.5i 2140.0! 3.8; 3.81 i 0.0o 11551 0.01 119.36N-Feo Mel o 0.01 5.01 0.01 1847.7! 0.0; 0.0! I 111224I 0.01 112.47 Cheals 0.21 0.91 153.5! 166.91 2378.41 454.71 454.71 1 _I . 331 11 0.0_ 785.88 M__W i_ 091 3.71 184.1 1567.9; 6642.4i 1436.Oi 1436I0; ' 6059.4 -2551 9 0,0 4943.49 Wood & Paper 221 8.71 64.31 0.11 1258.91 S81.9 581.9 758 1981 001 847.510 Coas. Nswta 0.1 0.41 82.71 0.21 2905.71 217.01 217.01 i 0.01 -352.51 001l -135.11 Ught Ilndusw 0.4 1.4! 130.7i 128.6 3111.2: 4258.3- 4258.3! 146.9 -237.61 0.0 4167.612 FoodlIndua. 00i 0.11 38031 102.8! 2648.5! 6548.7i 6548.71 001 11511.1 0.0 7699.813 Other Indaus 1.41 5.5 59.31 0.01 _34.1 424.9: 424.91 ' 13.91 33.31 0.0 472.014 TotallIndusy 6.1 24.51 1769.9, 2036.2: 28912.3: 14377.7 14377.7! I 6295.9i .63.4i 0.0 20610.11d- Z G I .0i 0.0! 0.0I 8730.51 0.0 0.0 8930.51 AUI. & FaOre 0.0 0.0! 63.2 20.31 12119.51 34U.61 3488.61 75.41 437.21 49.2! 0.01 3952.017 ProutinT&C I T g4241.61 0.0: I 1 508.61 0.° 0-°l 0.01 508.6.18T & D I j 2636.61 0.01 0.0 I 0.0 0.0 -7653.0 -7653.019 Oher Prod.i e 1.1_ 4.4 29.9 0.01 400.01 261.31 2613l -188.3 -15.9 0.0 57.120 Mamfia Odasp 7.2 28.9 1863.0 2056.5! 48310.11 18127.61 18127.6 0.0 584.01 0.0 15475.3 -128.6 -7653.0 26405.334 4eprea.74 2.97 29.4 I15 5-I1 I21 s720 684.28 9.33.1 1358.5 N-PWod. T pn 6.7 2.9 3 . 63.1! 6.81 254.2 29.7 962223 N-P6od. t muWic. 1.01 5.21 28.31 3.41 31.7i .0 8.71 I587 "I 108.11 132.7 -27.0 372-a4 Educaw 0.01 2.2 I 317.11 2022825 CulSr0 _ .41 5.4 2 .2 7.1 1331.51 222.71 10-LB- 117.9 0-01 0. I 22iLDm H i tWg 1 1.61 0.01 14. 0.01 227.6 1181.3- 230-71 950.61 0-0 01 1181- -uC e i1 7 9348 126t2
4lNetluhmldles I0.0 I 4377l2.4225-
23siec 0.0; 27.0; 0.0 i 450.3i Q0. 0.0i 0.01 197.61 46S.0 1 i - 32 2 f.425Othr Net °°ioo 0 o. 4.0 0-0, 496.61 -72- -172.6i °°! o ooi I 30- 20630 SIki Adin 0.0 239.3: 239.31 o .l131-8j O.0! iij371.131 Sp frde OhIbw 416! 14-41 181Jii-- 25.51 2S75.6 -5932.0 2306.7 MS2.31 so6.81 88S.0: _ .01 °-°l -404.6, 6919-;
3: DbMeD$e&Cnher- I ~~~~~~~~ :| t - i _~i 1 I -- -t - i 3279.0i 2933 To1 3 _ 08_0 111 j0 44 - 3118.1 46-0157.3 6 633…4
34- l Dpeiato 42 23l 1752 9l. l 7 5W 63 282.9 37891 63 ISS81 j -I - -
46 PrIWAIe I J 5. 61 60.I 336T I Tr37 VAM=h pay 1 23.21 1 642.11 1 1 1 1 1 1 1 1
4 ouSem* j1 6151 i i - -143 Net oSmSo STec 13.0 j 61 _ _1
50 Nt eal 0.g. 66.21 37.1. 9464.7 37t071 8757-0.8 ___ ____ _ 1 .-
44 Othert N o683 °l 0.0 0.07- 0.04.6i -4 _ X0o Inom I- 1 2883! -- I LLl 46Pae i § § 482.0t 33162Si 1
471 Too tse 4.1t 1 -7S7.3i f | | 4Net FerpTade j30-1 310.0j -81.81 ' i
52l7,w&b E1 6911.2 31.1 1 9464.7_ 3279.01 104463.1
76

Kazakhstan 3: 1987 Input-Output Table in Purchasers' Prices-SNA Format
Page 443 44
Exports TOTALUSES
I lPower 209.31 1871.6
21PetroGas 953.9 4059.0
3ICoa' 336.5i 1306.041 Other Fuels 0.01 6.2S|Fermus Me"E 1-1004.9: 3264.16IN-Ferrous Metals 1010.2 3970.37 Chemicals 1022.0i 4186.3
8!MBMW 821.9i 12407.7
9IWood & Paper 24.81 2131.2loiCons. Matials i 142.S 2912.7
IlILJght Lndustry | 1S21.8; 8800S12lFood Industy J615.31 10963.613 Other Industy 70-41 1376.5
Total Iodusry 7733.5; 572S5.7
i Constucon 0.01 8930S16 Api. & Fomtry 1570. 1 17641.7
7 Producdb T & C __ _ 47S0.2
IS T & D T 0.01 2636.619 Other Prod. SecKn 47.4i S0452CMAIW Outlw* ays 9351.11 91719.S21 lHousng-Communal I - 1913.
22 N-Prod. Tmulsxnsport 1407.2
23N-Ptod. Cmunuic.| 404.2
24RFucA,tio2 , | 2M3404'2SICulmmr 274.2261HeWdth. etc. . ! 1408.9
27JU .. Cult. & Hethl 1i 4023.729I!Sc 1 67s.29 Sanking & I¢ans ce i i 669.1
30 Stau Adt S n. I i 371.1
31 ISerde Criy 0.01 9899.332jDefiense & Oler _ 3279.
33iToid Ola"S i 9351.11 96840.2
34 Depnecation 35Wges Wi36 Other WaSes37 lolkhoz Pay a
38 SocialScrt39jKikhoz Soc. Sec.40INet Poflt41 Bonrn Wages I42 Turtover Tax _
43 Net Subddls 44 Other Net Inome4 Kolihoz lae46 Prfvtc income !
47 Total Lam48JN _Fore8p Tmde49GNP
SD TolatOmt COW51 Import
S2 Tot JSupply
77

Kyrgyzstan 3: 1987 Input-Output Table in Purchasers' Prices-SNA FormatMillion Rubesa. Current Prices
Page I__ 1 I~~ ~~~ ~~~ ~~ 1 3 4 5 i6 1 7 i 8 3 0 I 11 12 i 13 I 14
[Power i Peto. Coal !Other i Ferr. iN-Ferr.; Chem., iMD!4W;Wood ConrA. I Light I Food Other - Total= ________ j I Gas I Fuels I Mealsi Meab i Paper j Mater. i Ind. Industy
I Power j 1.81 0.S( 2.2j 0.01 0.1! 8.2, 0.8i 32.6: 2.01 13.11 14.4; 10.3; 3.6 89.82 Petro-Gas 31.11 I1.01 4.1 0.0; 0.11 4.21 1.21 17.6! 1.81 20.11 3.0. 10.8j 2.7: 97.53!coal [ 20.41 0.o0 0.8. 0.01 0.0 1.1 j 0.0' 2.2! 0.01 4.3i 0.51 1.21 2.8: 33.34 Other Fuels 0.01 0.01 0.0, 0.0! 0.01 0.01 0.Oi 0.01 0.01 0 31 0.01 0.0i 0.0: 0.35 Ferrous Metal I 0.31 0.01 0.71 0.01 0.4; 1.8i 0.21 147.7j 3.71 22.51 1.0. 1.61 1.2i 181.06JN-Fefous Metals I 0.0' 0.0j 0.01 0.0i 0.61 64.01 ° iI 99.41 0.21 0.7; 0.1: 1.41 1.2i 167.77IChemi_ als 1.11 0.21 3.11 0.01 0.2: 10.61 12.2 67.1! 4.81 4.9i 34.71 4.31 9.0 152.1.81MBMW i 3.6' 0.21 4.8! 0.0i 0.11 5.5 0.5s 546.81 7.21 11.3 10.1i 15.11 4.41 609.69iWood & Paper 0.2! 0.0o 3.31 0.0 0.01 1.1 0.7! 19.51 40.71 3.01 5.7i 7.7! 2.61 83.4
_0 Consir. Materials 06! 0.0l 0.1 0.0! 0.11 1.2! 1.01 4.5! 2.4' 64.9; 0.8, 10.0j 0.4 1 85.9Li1 ght Industry 10:31 0.1! 0.6i 0.01 0.01 1.0! 5.81 10.7! 6.51 2.0;! 848-5: 8.4! 5.4 889.2
12 FoM Industry H 0.31 0.01 0.01 0.0 0.Oi 0.41 2.9' i.2i 0.5i 0.71 7.6: 647.4! 32.4i 694.613 O&... Indutry 1 3.61 0.0i 0.0! 0.0. 0.0! 0.1! 0.11 3.1| 0.21 0.91 2.11 6.9i 24.31 41.314 Totl Indunry | 63.21 2.1 i 19.61 0.0; 1.6! 99.31 25.5! 953.3i 70.2i 147.71 928.3! 724.91 90.11 3125.7IS Constucton 0.0 0.01 0.01 0.0: o0.0 0.01 0.0! 0.01 0.0! 0.01 0T01 0.01 0.01 0.0161Agri. & Forestry 0.0!- 0.0° 0.0' 0.01 0.0i 0.01 0.01 0.11 1.4! 0.01 460.01 1154.11 90.01 1705.717i1ProductionT& C 2.0 19.8i 16.0: 0.0 9.5 7.3' 9.81 50.2 11.4i 70.31 9.5, 18.41 3.4i 227.618TT &D 0.01 19.0' 3.0: 0.01 3.11 3.8! 20.01 43.31 851 10.6! 72.01 168.71 6.8! 358.719 Other Prod. Sectors 1.1 0.0 0.01 0.01 7.2j 3.1! 0.1 7.6 0.71 1.61 2.51 1.9, 1.2! 27.120 maUJouta 66.3! 40.91 38.7! 0.0! 21.41 113.51 55.5i 1054.4; 92.2i 230.2! 1472.3' 2068.11 191.4i 5444.821 Hoiiiusl-CMUinal 2.5 0.1! 0.7; o.o 0.1i 1.9. 0.4' 15.0o 1.21 1.7! 5.31 5.41 1.3! 35.622 IN-Prod. Transport 0.41 0.01 0 .9i 0 .10 Q 0i 0.91 ol8.1509 .9j S0.4 0.0! 0.71 0.0! 0.01 0.; 0. .0 0. 1.5 21 10 09 1.23 N-Prod. Communic. 0.01 00 0.01 0.01 0.01 0.01 0.0! 0.0 0.0 o.o0 0.0! 0. 0.0 0.024 Educaton _ 1.0j 0 1 0.4, 0.0j 0.0! 1.01 0.21 6.21 0.61 0.91 1.81 2.0 0.71 14.925 Cul 0.31 00; 0.11 0.0! 0.01 0.21 0.0! 1.61 0.1! 0.21 0.5i 0.4! 0.2! 3.726 Heals, etc. 0.7 ! 00!; 0.31 0.0f 0.0j 0.8i 0.2! 4.51 0.5 0.71 1.4j 1.1 0.6! 11.227 Educ., Cult. Healh 20! 01 0.8! 0.01 0.1! 2.0i 0.41 12.31 1.31 1.S1 3.7! 3.91 1.4 29.828!Science e 2.21 0.1 0.1j 0.01 0.0i 1.41 0.2! 20.6! 0.21 0.9 1.41 0.81 0.1 28.1291Banking & lnsance 0.8! 0.11 0.21 0.0! 0.01 0.5! 0.11 9.31 03 0.51 2.8! 6.81 0.4 21.930jState Admin. I i I31ISeavcwbOozy* 7.91 0.4i 2.5! 0.0i 0.21 6.2! 1.2! 65.2 ' 3.91 6.31 15.41 17.9! 4.1 131.332jDefnse & Oder . I i I I I I ; I I _33 Toul Ouayst 74.2i 41.41 41.1: 0.01 21.6 119.71 56.7! 1119.6: 9 6.1 1 236.41 1487.71 2086.0; 195.5i 5576.1
34IDepreciatioa 52.71 6.71 16.4; 0.0! 0.6 27.6i 1.5! 109.1 5.41 37.11 31.5 32.11 16.31 337.035 Wages 14.81 1.0i 31.21 0.01 0.9; 21.7 5.91 291.8 21.91 54.0! 121.4! 55.4i 32.2; 652.136 OteSr WagSes 00 002117.71 0.0 0.0! 0.0! 0.0! -4. 0.0! 0.01-66.0! 52. 0.01 -50.37 Oho tPay 0.01 0.01 2.01- 0.0i 0.0! 0. 6.1 1.22 0.01 0.0! 1.61 4.15 13.034 Sodlo SIneo _e 205 0.20 3.0i 0.01 0-.1 2.71 0.71 40.3 1.0 6.4 15.31- 6.71 3.01 42.739 Kort Soc. Sec. 0.0! 0.0! O.Oi 0.0! 0.0 0.01 0.01 0.0 0.0! 0.01 0.0! 0.20 0.0I 0.040 NetaPofit 41.7 1.321 IL0O1 0.01 1.80 37.01 10.60 263.2 I.71 25.41 94.1 81.07 25.10 614.7419 Bonus Wag 2.7 0.21 1.551 0.71 001 4.21 185.201.71 4.1 9.81 5.1 1 3.012 28.842 junom t - 207 i6.9 O.Oi O.Oi 0.0! 0.01 2.21 2.30 68.4 1.9 j 12 214.6| .1 372621 7328143INetSubsidies 0.0 °°0 -17-71 °-Oi O.Oi O.Oi O.Oi -14.71 O.Oi 0.01 -66.01 -552.2j 0.01 -650.644lOthe Net 1 3803.0 1.131 2.01 0.61 01 3.!i 356.3 02.3 1.0! 7.91 O 7! 59l.6 3697.145IKkol Inoe .ol o.l .ol o.oi o.o1 o.oj o.oi 0.21 O.Oi 0.01 0-0; -4.21 -0.81 -4-846 Pdne #c -- 0.o0 -°°i oo! 01 0oo! o.o! 0.0i 0.0i 0~.0i o0.oj o.o1 o.o_ o.ol o.047 Totall La= -1.71 002 01 OQ .Oi -0.9i 0.01 -.3.41 .05 12 9.81 -I.Oi -081 -20.048 Not Forcin Tmade -3-7j 304.4j 9.41 0.61 189.11j -46.3i 333.5i -185.81 142-3! 545Si 112.71 197.5i 270.0 1135.2491G N P i_12951 314.6 55.2: 0.61 192.41 45.1! 354.8i 5B2.2i 18S.21 190.51 S15.11 186.2 133.2 288738SD Toal1 ia 207.41 51.61 87.01 0.0i 24.9l 211.2! 7s.0oi 18S7.6 -142.01 372.4j 1890.1| 2074.7- 301.7: 7328.7Sl -- 1 38.31 316.31 29.51 0.61 198.21 95.71 356-.31 _902.31 147.01 77.9i 746.81 M2861 59.61 3697.152iTo1l SUPPy T 245.71 367.9! 116.51 0.61 223.11 306.91 434.31 2790.01 289.o1 450.3! 2637.01 2803.31 361.3. 11025.81
78

Kyrgyzstan 3: 1987 Input-Output Table in Purchasers' Prices--SNA Format
Page 2
iS 16 117 i18 19 .20 121 22 :23 124 125 126 ' 27 i28ICovai. i Agrtclt.; T &C T & D Other TOTAL lHousing Tramp.:Comm.! Educ. iCult. IHealth Educ. &;. Science
Prod.: PROD. i Health I1 lPower 8.7; 21.6 2.6 5.6. 1.0. 129.3 11.1; 1.91 1.6! 10.71 1.3! 7.3. 19.3: 2.72 1Petro-Gas 37.5, 51.91 53.3; 1.9 0.3. 242.4: 6.2! 37.7! 0.2! 2.91 0.4i -2.0; 5.3! 2.83 coal 1.3 10.0, 0.9. 3.1 0.1 48.7!i 3.1: 0.21 0.31 5.41 0.61 3.7, 9.71 0.4
4 Othe Fuels 1 02 0.' 0.0 : -O 0.0. 0.0 0.51 0.0: 0.0! 0.0f 0.0! 0.0i 0.0: 0 0.0: .5 Ferrous Metals 41.0. 1.41 0.6. 0.4 0.0: 224.4j 0.5-; 0.1!i 0.0! 0.3! 0.0! 0.2! 0.6! 1.46 N-Feffous Memla 1.0: 0.11 0.2; . 0.01 OO 169.1! 0.0! 0.01 0.0'- 0.01 0.0: 0.01 0.0 0.87 Chemicals :: ]2$5.1 86.5! 14.5! 3. 4 0.6i 282.6. 3.4; 5.1 I 0.1! 1.7! 1.6- 20.01 23.3. 1.58 MBMW 1103.8i 133.01 12.81 10.4: 2.11 871.6; 3.21 7.2! 1.31 6.6! 0.8! 4.61 12.0- 1 1.89 Wood &Paper j 67.5! 5.4! 0.6! 8.61 7.8! 173.3: 1.61 0.1! 0.31 2.6: 0.3i 1.8!1 4.71 1.8
10 Couau. Msiezials 288.01 11.4i 1.01 __10.41 0.1! 396.81 3.6! -0.1! 0.2! 1.1; 0.1!i 0.71 1.9:1 2.0
II LIght ladusoy j 7.4! 6.41 1.41 8.8 i 0.5! 913.71 2.0!, 0.41 0.61 11.8i 1.4; 8.11 21.4! 0.812 Food Indusu 0.9! 68.8! 0.0! 3.21 0.01 767.6! 1.3! 0.6! 0.0! 34.4. 4.31 23.3! 64.01 0.113 OtherIndustry 1 2.0; 156.5' 0.3! 4.31 8.5i 213.1! 6.6! 0.0! 0.1! 3.2!i 0.41 2.2: 5.7!i 0.414 Toal Industry 1 58-4.9 i 552.9. 88.1 i 60.31 21.1! 4433.1 i 42.6! 53.4! 4.71 92.81 11.2! 63.8! 167i.9 26.5is conmuvc* I 0.0! 0.0! 0.0. OO 0.01 .o 0.0.16 ASpi. & Forestr 0.6; 483.3; 0.6! 4.81 0.0, 2195.1! 0.5: 0.0i 0.01 10.5i 1.3! 7.21 18.9! 0.0017 1Productioa T & C 3-3.3! 24.2: 1.2! 3.3! 2.31i 291.8: 18JT&D F 0.1 78.9-1 0.01 0.01 12.11 449.7! 11910ther Prod. Sectos 4.0 1.5!S 2.5! 11.8i 0.4! 47.3! 0.1! 0.71 4.01 3.31 0.4! 2.31 6.01 0.920IMamet1aOn"ty 622.8!i 1140.7! 92.41 80.21 36.0k 7416-.9. 43.21 54.11 8.7! 106.61 12.91i 73.31 192.8! 27.421 Housing-Coigainunai I 10.8! 7.21 3.4! 12.91 0.7! 70.6! 0.41 0.81 0.7! 0.9! 0.21 0.5! 1.61 0.422 N-Prod. Transport I 9.91 9.5! 1.61 4.8! 0.8!1 42.51 0.71 1.51 0.6! 3.41 0.7! 2.11 6.21 1.3
23NPo. omnc 0.0! 0.0! 0.0! 0.0! 0.01 0.0: 0.1! 0.21 0.6! 1.27 0.5 0.71 2.41 1.62412ducoLtion4.11 7.31 2.31 2.0! 0.21 30.9; 0.21 0.5 0.41 0.01 0.01 0.0! 0.01 0.02SICultin i 1.31 1.6! 0.5! 0.7 0.1!i 78 .; 01 .1O.i00 .1 00 .26IHeM etc.3.4i 5.71 1.8! 1.41 0.2! 23.8! 0.21 0.41 0.3! 0.0! 0.0! 0.0! 0.0! 0.0
27!Educ.. CulL &Healta 8.8! 14.71 4.71 4.1! 0.5' 62.5! 0.41 1.0! 0.8!I 0.01 0.0i 0.01 0.0! 0.028lSctence ~~~~~~~17.4! 6.7! 2.4j 4.1! 0.1' 58.8: 0.1 0.21 0.21 0.! 00 .0! 0.01 4.3
29IDanking &Insumnce i 8.6i 6.3i 1.41 46.0: 0.2j 84.4i 0.11 0.2! 0.41 00O' 0.0; 0.0! 0.0 0.1
30IState Admntt. ' I311aW O 55.4; 44.3. 13.5i 71.91 2.31 318.7! I-8i 3.9: 3.2! 5.5! 1.4! 3.3i 10.2! 7.7
32IDefenae & Othe '
33 Toud Oudlays 678.2. 1 185.0 105.8! 152.1; 38.3 7735.6! 45.0! 58.0. 11.9: 112.1! 14.3! 76.6! 203.0! 35.1
34 Depredlation 63.1 171.2! 102.5! 39.71 2.3L_ 7157:Z 159.01 32.4: 10.81 47.41 5.0! 26.61 79.01 5.35 Wages I 323.3 352.3: 83.4! 165.11 32.4! 1618.61 62.61 65.0i 22.4! 300.61 27.3! 135.11 463.0! 100.536 teWagsu r 107; 3.9: 1.2! 4.8! 0.2! 31.91 0.9 2.4! 0.7 1.41 0.4j 1.41 3.21 2.3
IKOM= oPay 1 10.4! 3. 0.0 0.0! 0.2! 355.0i 2.31 1.2! 1.61 5.1138 SocIa Security 25. 17.01 6.51 11.61 2.4 145.4i 3.5 5.51 1.81 21.8! 2.01 9.91 33.7!I 12.639 Kolldtoz Soc. Sec. 0.2! 38.41, 0.01 0.0!1 0.0! 40.1! _ 0.3! 0.1! 0.2! 0.6!4OINet Profit 102.5 93.5! 55.4 76.6! 5.7; 4. 7.71 18.0! 32.71 0.01 0.0! 0.01 0.0! 18.341 Bomus Wages 18.5! 26.7! 5.9. 2.21 0.3: 115.5! 4.51 6.81 2.61 2.41 1.2! 1.71 5.3! 11.042 Tumrover Tax00 . . 0.41 0.01 702.5. I 43 Net Subsidis00 0.0! 0.0' . 0.0: -650.6' I44 Othe Net Income j .0! 0.0; 9.0. 0.Oi 0.0: 22.8! 0.01 0.0! 0.01 0.0! 0.01 0.0!i 0.01 0.045 Colk.hInozneom i 0.0! 201.0, 0.0i 0.0' 0.0: 196.3!
46PiaeIncome i 58.0! 733.3! 0.Oi 0.0! 17.2- 808.15 28.0! 12.011 0.01 20.0 3.0! 23.0! 48.0!47 Too mLoae __ *38.7! S53.11 -0 7! -0.6: 0.0! -113.1! -0.6[ -0.3 I I48 NotForelgnkTrde !11.02 -1405.0: 19.9 -238.9! 490G N P I 554.8:i 1909.8! 157.4! -1107.4- 80.2! 4582-5: 261.7! 134.71 68.11 396.2! 40.2! 201.5, 637.9: 138.750ITOMI Out"u 23.!088 363.2! 449.71i 98.6! 12557.0; 306.7! 192.7! 80.01 S08.3! 54.51 278.01 840.9! 173.851 (iwpon 10.! 00I.:2.!3829.41 1 I I 52ITo Supply 112_33.01 3187.5! 363.2! 449.7 127.2! 16386.4! 306.7 i 192.7! 80.01 508.3! 54.51 278.0! 840.9! 173.8
79

Kyrgyzstan 3: 1987 Input-Output Table in Purchasers' Prices-SNA Format
Page 3
-. ~~~~~~1 29 130 131 132 -33 . 34 35 136 37 ;38 j 39 1 O] 41 42
1 Bank& State TOTAL: Defense. TOTAL Hfouse- i -/- : C/* overn-.Defense i Total Invent'1 Net t c iP
Iflsur. Admll.. SERV. I& Other! OUTLA~Y holds Paid I Free I & Othteri Fixed I IExportI
I POWet 10.2 0.8: 37.61 0.01 166.9: 36.8! 36.8] 0.01 0.0! 0.0! 36.82jPetrn-Gas 0.1 0.11 52.41 8.3 1 303.11 51.3! 51.31 0.01 1.61 o.or 52.9
3]coal ~~~~~0.0 0.11 13.8: 0.11 62.6. 16.7 i 16.71 _______ 0.01 17.0! 0.0] 33.8
4ldiher Fuels I 0.0' 0.01 0.0' 0.01 0.5! 0.0] -;00 0.01 0.________
S Ferros me"l 0.0, 0.0, 2.6' 0.11 227.1: 1.5i 1.5j j .Oj -14.81 0.0] -13.2
6 N-Fenua Me"al 0.01 0.0] 0.8 0.01 169.9: 0.01 0.01 i 1 0.01 -5.2,i 0.01 -5.2
C OemIcas 0.0] 0.3] 33.5: 20.51 336.61i 90.4i 90.41 0.1-5.6, 0.01 74.8
a 383MWj 0.1] 0.51 36.1! 193.01 1100.8! 263.8: 263.8!1 526.1 1-3898.8:i 0.0 601.2
9 Wood &Paper 0.31 1.11 9.91 0.0] 183.2; 97.31 97.31 1 2.41 1.5! 0.0 101.2
10 C~w.Mawer"a I 0.0! 0.I 7.9! 0.01 404.7. 42.3] 42.3] I 0.0 .20.1 I 0.0 22.2Y&lIh indusny 10.1] 0.11 25.4! 16.31 955.4, 990.4! 990.41] 4.81 52.41 0.0] 1047.6
12 Food Industry 0.0] 0.0] 66.0i 13.0] 846.61 1288.2,i 1288.2! I 0.0] 137.6] 0.0] 1425.8
131Odw Industry j0.31 0.91 14.01 0.Oi 227.1!- 86.5 T86.51 -0.71 16.0] 0.0] 101.8
14]TotallndusuY II-1f 3.8; 300.01 251.31 4984.4 2965.21 2965.21 1 332.61 -18.21 0.0] 3479.6lSlCoasuucuio I 0.01 0.0] 0.01 0.01 0.0! 0.0! 0.01 _____ 1232.91 0.0! 0.0' 1232.916 Agir. & Forestr 0.01 0.01 19.4' 2.71 2217.2: 644.7; 644.7, i 127.71 105.2! 0.0! 877.617Poud 0.0] 0.01 0.0] 0.0] 291.81i 0.0! 0.0! 71.4, 0.0] 0.01 0.0O1 71.4
IBIT & D 0.0] 0.0! 0.0] 0.0] 449.7] 0.01 0.0; I 0.0] 0.01 -140S.0] -1405.0190trPod etr 0.61 2.41 14.71 0.3] 62.31 56.9j 56.9: _______ 2.2] -3.0, 0.0] 56.2
20 MateIa Outlay. 1.71 6.2! 334.31 254.3! 8005.3! 3666.8; 3666.91 0.0 71.4: 0.0; 1895.5] 84.0 -1405.0' 4312.7
21 Houslng-Communm 0.2] 0.5] 4.6; 0.6' 75.71 217.11 128.71 88.4 9.7 i 4.21 : 231.022 N-Prod. Tmansporn 0.91 1.9T 13.1! 7.01 62.6] 132.0,- 132.01 0.0] 0.0: 19.61 i -21.5] 130.1
23 N-Prod. Costatnic. I 0.6] 1.31 6.8i 0.41 7.2_ 27.01 27.0! 0.0~ 31.1I 18.5] 1 -3.8 72.824 Education 0.2] 0.0! 1.3! 0.0] 32.3; 476.1! 27.2' 448.91 0.0! 0.0! _____ 476.1
25 Culium 0.0] 0.0] 0.2! 0.0! 8.0! 46.51! 24-2.1 .1 00 46.526IHelth.etc. .110.oi 1.0] 0.0] 24.7: 253.3' 49.3: 204.01 0.01 0.01 ' 253.3
27jEduc.. Cult. & Health! 0. .! 2S .0! 650 775.9 989670 0.01 0.0] 7.
28jSclenc i0.01 0.01 4.71 0.01 63.5, 0.0 0.0! 0.01 32.7:i 88.31 -10.7' 110.3
29,Dnku& Insurn I 0.0! 0.0' 0.81 0.0., 85.2! 21.9; 21.9! 0.0! 0.0i 0.01 I I 10.0] 31.930ISute Adadn. i ~~~~~41.2! 41.21 0.01 29.2i 0.0! I I 1 70.4
31 iSevica Oudtly 2.01 3.71 32.51 8.0; 359.2! 1215.1- 449.71 765.4: 102.7, i330.61 0.0! 0.0! -26.0! 1422.4
33 Total Outlay. ~3.7i 9.9: 366.61 262.3 8364.5: 4881.9. 4136.61 765.4: 174.1;i 612.11 1895.5! 84.0' -1431.0; 6216.6
3S Wna 11-31 $~~~2.4] 777.21 174.31 2570.1!1
37 KoWn oPay 5.1 360.1' 39 SColkb Scurt Sec. 4.6] 62.6! 14.01 222.0 4 I
39 Kdkbu Soc. Sec. I 1~ 0.6!1 40.7 40ONet Prol 190.31 0.0! 167.0; 0.01 1115.4 I- ~
43 BoomWages 3.6] ~~~~~0.0] 33.8: 149.3 IT3etublde i i o.o: -- 7024. I I
43INetSubsidn O. L!-650.6 ! d4 Other NetlIncome i0.01 0.0! 0.0] j 22.81 45 ICbuInCcome_ 00 196.3]
46 Prfto hmme 88.0] I 896.5i : I ______I
47 TOta Lone I__ -0.91 -114.0!48 Met Forepg Trade I i.01 10.0] -228.9: ;49,G N P113.4j1 60.51 1415.01 219.2! 6216.6 ' .
5 ___T ____O ___1I 701.41-A 1771.6] 481.51 14810.11 F__ __ __ __ __ __ __ _ I 3829.4 II,
51ONI Supply I 107.11 70.4] 1771.61 481.51 186395!1 ______________
80

Kyrgyzstan 3: 1987 Input-Output Table in Purchasers' Prices-SNA Format
Pale 4
Expor I TOTAL:1 ~~~~~USESI 1Pow±r 42.01 24S.72iPeto-Gas 11.91 367.93ICoal 20.11 116.44 Othf Fuels , 0.0' 0.5S Ferrous MetEis i 9.1 22.3.06IN-Ferrous Metas 142.0 306.87jChemIcals 1 22.8 434.281MDNW 1088.11 2790.19!Wood & Paper 4.7 289.1
10 Cionsr. Materias 23.41 450.41 light Indust r 634.11 2637.112,Food loduqr y31.1 2803.413iOther Indutry 32.6 361.614Totalladay ! 2562.11 11026.115;Coonwaruction 0.01 1232.916IAgI. & Forestry 92.71 3187517 IProductUon T &C 0.01. 363.218T&DISITl E D) 0 .01 449.7191Other Prod. Sectors 71 127.220 Matrial Outsla 2663.5 16386.521 Houdug Co¢mur J 306.722N-Prod. Tmuspon I 192.723NProd. N-P muic. 80.024|Educati 508.42SICuIu 54.S26 Health, etc. 278.027 Edu C aHth I 840.928 Sdence 173.8
29 Baning&Insumace I 107.1
3CIState Admin. I j 70.4
31 ISere CbOu 0.0i 1771.632Deense & Other i 481.5
33 Totu O s i 2663.5 18639.6
34IDepredafi4n i
36 Oher Wages I37 Kolkhoz Pay
3 Soial uSeidt-391Kolkhoz Sc. Som40 Net FPorit 41 Bonus Wage --42 Turiner Tax432Nat Subpidks I
Od10er Net w84S|lKona= lncome 46 Private htcone47 Tota Losse48INet Foeisn Tnmde4910 N P SDITotd COut _
I1 limport
52'ToWd Supply
81

Latvia 3: 1987 Input-Output Table in Purchasers' Prices--SNA FormatMiUlion Rubles. Current Prices
Page I_________ 1~~ II 1 2 1 3 1 4i 5 1 6 1 7 8 1 9 1 10 1 1 12 1 13 I 14_ __________ I Power IPetro- i Coal iOther Ferr. iN-Ferr.i Chem. MBMW.Wood i Constr. I Lght I Food I Other I Total= _______ _ & IGas I ,FueLs iMetals iMetalsj Paper j Mater. I| i Ind. I IndustryI TPower 1.41 0.11 0.01 0.3! 3.01 0.3! 17.2 47.91 12.2! 17.21 17.91 16.3i 7.71 141.62IPetro-Gas 5 53.61 8.71 0.0i 0.5 5.2! 0.01 7.3; 18.11 13.11 27.31 5.8j 38.51 3.7i 181.93Co I 0.0 0.0 i 0.01 0.01 0.0° o.o. 0.4 2.3: 0.71 1.41 1.5i 2.6! 0.3! 9.34!OtherFuels 1.3i 0.0; 0.01 2.4i 0.0; 0.0: 0.0! 0.01 0.01 0.11 0.01 0.0° 0.1I 4.05Ferrous Metals 0.3! 0.0! 0.01 0.3O 83.51 0.0 3.6 266.91 4j 5 22.8! 1.51 9.01 5.0! 397.66WN-Ferrous Metals . 0.1 0.0! 0.01 0.0 0.21 8.0 8.9! 90Sf 0.7! 1.21 2.1 4.91 12.31 128.87 Chemicls | 0.6! 0.1| 0.0i 0.5i 1.1' 0.31 300.11 124.2! 29.7! 14.91 130.5j 31.01 25.61 658.78,MBMW _.__ 0.j 00 1.0! 2.71 0.0! 13.61 1052.21 27.0i 10.1! 12.1! 44.51 12.2! 1183.39 Wood & Paper 0.41 0.21 0.0! 0.1 0.5i 0.0o 12.31 32.7i 229.31 6.5i 7.3! 41.3! 19.21 349.610 Constr. Materia 0.1! 0.0! 0.0! 0.0! 0.2! 0.0! 5.41 13.71 7.61 85.51 1.2! 11.1! 4.71 129.2_ Ugtladustry _ Z 0.3! 0.0! 0.0i 0.11 0.21 0.01 29.21 28.7i 26.2' 6.21 1203.21 16.1! 9.81 1320.212 FoodIndusty 0.l 0.5. 0.0! 0.0! 0.1 0.01 18.41 2.5; 2.5! 2..1j 38.21 986.81 54.91 1106.113 Other lndustry | 0.31 0.0' 0.0! 0.0! 0.1 0.0! 1.2i 3.9i 1.5 0.°51 1.51 12.5 67.1 88.614 Total Industry 66.4i 9.6, 0.0i 5.4i 96.8 8.31 417.51 1683.5i 355.2! 195.7! 1422.8! 1214.7! 222.71 5698.615!Constucon 0.0o 0.0o 0. .0 0.0° 0.0! 0.01 0.0! o.o; 0.0o 0.0! 0.0 0.0o 0.016 Agri. & Forestry 0.0! 0.0; 0.0 0.0i 0.0! 0.01 0.9i 0.01 11.0! 0.0! 100.01 1894.41 184.9! 2191.117 Produc0n T&C 1.7i 275.7! 12.61 1.1 22.61 1.61 65.81 79.21 22.9 80.87 30.81 106.0j 7.0! 707.618T&D _ 0.0' 148.91 0.71 0.0i 7.5i 2.11 43.71 54.71 19.7! 8.5! 90.4i 256.11 9.5i 641.719Othier Prod. Secors 0.71 0.0: 0.01 0.0! 0.1! 0.01 3.6! 99! 2.71 1.31 3.5! 7.41 0.6! 29.820 Nflff Oulays 68.81 434.11 13.3 i 6.51 127.0! 12.0! 531.51 1827.31 411.5i 286.21 1647.6! 3478.51 424.6! 9268.821 Housing-Communl 32 0.1! 0.01 0.0! 1.6! 0.71 6.2! 27.61 4.8i 1.81 9.01 18.91 1.11 74.322 N-Prod. Tmansport 0.5i 0.0 0.0: 0.1 I 0.4i 0.0! 1.6! 11.9f 3.5i 1.5! 3.61 3.31 0.71 27.123 N-Pmd. Communk. 0.01 00, 0.01 0.0 0.01 0.0! ° .0- 0.01 0.01 0.0o 0.0! 0.01 0.0! 0.024JEdmtio, 1 1.71 0.0! 0.0i 0.0! 0.8'I 0.11 3.3! 10.8! 2.6! 1.0! 3.6! 6.6! 0.6! 31.1.25JCWun 10.4: 0.0! 0.0i 0.0! 0.2; 0.0! 0.7! 3.01 0.61 0.2! 0.8! 1.41 0.1 7.526 jHaeith. etc. | 1.41 0.0! 0.01 0.0! 0.71 0.1! 2.6! 8.8! 2.01 0.71 3.1i S.1 0.4 25.07 Eduec.. Cult. & Health' 3.5 0.1| 0.01 0.11 I.?! 0.1i 6.61 22.61 5.2! 1.9! 7.5! 13.1 1.2i 63.528 _ S_e__ __ j 201 0.1! 0.0! 0.2j 0.5! 0.1! 2.7! 25.01 1.0: 1.01 1.21 3.81 0.11 37.729IBanklng& & suran 1.0o 0. o.ol 0.0 ' 0.4! 0. 0! 1.7! 10.2! 1.3!i 0.5! 4.6!i 20.5! 0.31 40.7301State Admin. I i .31!SewlA Oufays 10.3!i 0.3! 0.0i 0.4- 4.5,i 0.4! 18.81 97.3f 15.81 6.71 25.9! 59.6! 3.3! 243.332iDefense & Other
_ !33 jToal Ouays 79.1 434.4! 13.31 6.9 131.5' 12.41 550.21 1924.6; 427.21 292.9_ 1673.5 3538.1 427.9! 9512.0F ~ ~ i I ' I i jjt I I I , ! 34!Depmclaabon 49.6! 0.4! 0.0j 5.91 7.51 0.31 42.9! 166.21 42.6! 42.8, 40.3 118.31 23.91 540.6t35 Wages 16.71 0-3 0-0! 4.71 9.91 0.5! 55.31 472.6! 98.51 64.21 147.9. 129.7! 50.1! 1050.5361Other Wages 0.21 0.01 o.o! o.oi 0.21 0.0! 0.9! 14.21 1.2! 0.91 1.4: 1.3 0-9! 21.437 Kolkhoz Pay o0.0 0.0! 0.0! 0.0! 0.0! 0.0! 0.1! 31.71 19.6! 0.2! 4.41 35.11 13.81 104.838|SocIal Security 2.71 0.01 0.0 0.7! 1.0! 0.0! 7.81 58.6! 8.61 7.7! 19.3. 16.11 4.41 127.139 KoLkhozSoc. Sec. I0.0i 0.0' 0.0 0 0.0 0.0i 0.0! 0.0! 3.11 1.7 0.0i 0.5 4.61 1.71 11.740 Net Profit 1 98.01 1.2 0.0j -0.2! 34.6; 4.41 153.1 376.21 79.4 3S.6i 213.2i 170.8! 35.9! 1202.241 Bonu Wages I 3.1 00 0.0 0.51 1.31 0.1j 9.2 57.71 10.8! 5.91 18.9! 15.3! 5.9! 128.742 TurnoverTax | 13.7! 6.3 0.0! 0.21 1.3. 0.01 160.1 178.71 3.81 35.61 495.31 556.71 100.6! 1552.3j43 Net Subsidies _L 00 00 0.01 0.0 0.0' 0.0! -13.6! -4.6 0.0! 0.0 -9.81-1110.1i 0.0: -1138.1_ SOdie Nei Income 0.0 0.0! 0.01 0.1 0.0 0.01 3.01 0.0! 0.01 4.5 0.0! 35.0! 0.0 42.64S IKolkhoz Income !0.0 0.01 O.Oi 0 0.0! 0.0: 0.0! O.Oi 3.81 0.01 0.0 5.3i 17.01 45.4 71.546 Private Income i 0.0 001 0.0! 0.0 ! 0.0 0.0. 0.0! 0.0! 0.0! 0.0 0.0! 0.0! 0.0! 0.047TotalLcmes ~ I Z-0. T 0.01I 0.0! -0.1! -0.3: 0.0' -1.91 -7.11 -2.11 -1.3] -12.1!1 20 18 2.48!Net Foreign Tde 38.11 477.71 26.1! -1.0! 291.8 113.51 60.71 282.51 -5.91 14.41 -47.81 -477.8: -24.1! 748.24910 N P 12189!9 4859! 26.11 10.3! 346.1 118.8! 468.41 1575.9! 247.3! 204.7! 857.91 -505.3; 250.8! 4305.9STotal Output i 259.91 442.6 13.3! 18.21 185.8 17.71 958.01 3218.01 680.5! 483.21 2579.21 3510.6. 702.81 13069.51 Impon 1128.51 486.4! 26.11 0.21 399.4! 127.4i 694.21 1626.1! 155.6! 76.4! 850.91 623.3: 121.3! 5315.852 TotaSupply I 388.4! 929.01 39.41 18.41 585.2i 145.1: 1652.21 4844.13 836.11 559.61 3430.1! 4133.9: 824.1i 18385.6
82

Latvia 3: 1987 Input-Output Table in Purchasers' Prices--SNA Format
- _______________ I 15 1 16 1 1 7 1 8 I19 I 20 ,21 i22 I 23 124 12 !~ 2 12
______________I Cousr. i Agrieult., & C I T & D Otlher i TOTAL: Housing Tmnsp. i Comm. i Educ. Cult. i Health !Educ. &. Scicnce__________ I ~~~~~~~~~~~~~~ ~~Prod. . PROD.. I Health!1
I Power 1 5.1. 15.9: 7.0. 12.3! 0.4- 182.3; 25.6: 7.3 l.6j 12.71 1.5. 8.71 22.9; 2.62 Petrg-Gas 26.61i 70.71; 137.7: 4.01. 0.1 i -420.9 8W.1! 33.8' 0.31 3.9. 0.5. 2.71 7.01 0.73! Coal 0.7; 10.61 1.4' 2.6;! O.O, 24.7 j 4.0~ 0.5 0.21 4.4 i 0.5. 3.01 7.9! 0.1
4lOther Fuels ~~~~0.9 0.6- 0.0: 0.0 0.01 5.5. 0.41 0.0: 00 .1 00 .! 04 .S Ferrous Metajs 45.7 i 4.41 2.8i 0.4' 0.01 450.81 2.21 0.8, 0.11 0.21 0.O i 0.21 0.4a 1.66 N-Ferrous Metals I 0.61 0.6' 0.5j 0.01 0.0! 130.51; 0.0: 0.2 O.Oi 0.01 0.01 0.0; 0.01 1.07 Chemicals 27.01 107.41 18.8! 3.21 0.91 816.01i 4.71i 5.3 0.11 1.91 1.7i 22.4! 26.1! 5.98 MBMW 117.91 135.4- 22.5; 13.71 0.91 1473.7: 11.7i 8.9. 1.91 7.51 0.91 5.21 13.61 9.99 Wood & Paper 1 72.21 16.0: 3.31 9.61 7.9; 458.51 5.91 0.9; 0.31 5.21 0.6; 3.61 9.41 0.6
10 Constr. Materials 1 301.51 19.8' 17.41 4.31 0.1! 472.41 6.9; 0.21 0.21 1.81 0.21 1.21 3.2i 0.4II light Industry T 6.6! 8.4' 6.4i 5.51 1.0, 1348.21 2.81 1.0; 0.41 12.9!' 1.1 8.91 23.41 0.612 Food Industry I 0.8i 152.3: 0.2: 4.71 0.0. 1264.11 1.81 0.1 0.01 38.0i 4.7! 27.9; 70.61 0.313 Other Industry 1 1.6; 340.11 2.0' 7.21 9.5 449.01 2.2! 0.9! 0.1; 7.0! 0.81 4.81 i I2.61 0.614 Totgal Indusay 607.11 882.31 21 9.9, 67.51 20.9- 7496.21 76.3. 59.91 5.21 95.71 13.21 88.61 197.51 24.3.
15_Co _struct_on 0.0! 0.01 0.0 0.0; 0.0. 0.01
16Api. & Forestry J 0.11 664.91 0.01 2.2 0.0.- 2858.41 2.4 0.01 0.Oi 8.01 1.0! 5.5; 14.5! 0.117Pouto 1 9.01 122.61 1.61 4.3 1.8. 846.91I I
18 T& D 0.0! 72.1! i 0.01 0.0 21.01 734.7! L 19ohrPo.Sco 3.11, 11.31 10.1! 14.7i 0.9i 69.8! 1.1 0.71i 0.2j 10.21 1.2' 7.0' 18.41 0.6
2olMatcrlaloutlays 6193 ~1753.1' 231.6 887;445112006.0 798.8 60.6i 5.41 113.91 15.41 101.1! 230.4!1 5.
21 jHosing-mmuw 3.6! 58& 12.0! 15.5 ; 6.4! 117.7i 1.3! 0.71 1.11 0.5 0.31 0.4! 1.21 0.322NPd Tmpr 3.3;i 7.61 4.91 5.8; 7.71 56.41 2.1! 1.31i 0.9 2.0. 1.01 1.81 4.7 _1.-123 N-Prod. Communwc. 0.0! 0.0! 0.0! 0.01 0.0' 0.0: 0.2' 0.2i 0.8! 0.7; 0.6! 0.61 1.9! 1.3
24 PAuation1.8'i 5.9! 7.0! 3.4; 2.11 51.4i 0.6 0.5! 0.61 0.0: 0.0j 0.0! 0.01 0.0,25 Calun ~~0.4; 1.3! 1.5! r 0.8 1 0.5! 12.0: 0.11 0.11 0.1I -! 0.01 0.01 00 0.01 -0.0
26Halh et 1.6. 4.61 5.5; 2.9! 1.61 41.21 0.5! 0.4i 0.51 0.01 0.0! 0.0; 0.0! 0.027 Euc- CW. &Heathl 38 11.81 14.0! 7.11 4.2! 104.61 1.31 0.9; 1.2!- 0.Oj 0.0! 0.01 0.0! 0.0
28 1Sciece - __1 5.0; 6.4' 5.11 4.5! 1.21 59.8' 0.2i 0.21: 0.6r 0.01 0.0; 0.0! 0.01 4.1-29Iankiztg & Insurance T 2.9 4.11 4.2! 53.2! 1.8 i 106.91 0.21 0.2! 0.5!I 001 00 2 L 0~2.01 0 '0 0.130IStte Admin. I I I51 31I I ofts18.7: 35.81 40.21i 86.1! 21.3! 445.3; 5.3; 3.51j T- 3.2! 1.8i 2.81 7.81 -7.03lDelense &Other i I., I T I :
33 omiOauaty T 638.0' 1788.9 i 271.8; 174.81 65.7112451.3 85.11i 641i 05 130.6! 17.2: 90.4! 238.21 32.0
34 Devciaton 1 77.8! 279.3; 252.8! 55.4 i 12.21 1218.1! 193.4! 65.8 i15.21 51.61 5.41 28.9;i 86.0. 14.035 Wages 1 ~274.9! 268.8- 164.6! 233.8 i 56.2! 2048.7! 121.91 82.0. 27.7! 191.41 38.2! 135.8! 365.4i 76.8
36 Other Wages 17.6! 3.01 3.91 4.3! 0.6. 50.8! 3.0! 3.11 0.8 1 1.11 0.3! 1.11 2.5! 1.737 1 KoMm Pay 56.51 301.01 1.7 j 0.0! 0.0: 464.11 1 2 .31 0.3! 1.41 4.0;
38 ISocWSecuity29.81i 12.6! 17.3! 22.0! 4.3. 213.1( 6.9; 9.41 2.2; 13.91 2.8! _9.91 26.6: 9-.6
39lKoftaoz Soc. Sec. 1.3, 35.21 0.21 0.0! 0.0 48.4! I 0.2! 0.1! 0.11 0.4;40 1 et Prorit j 143.8 170.0! 215.4! 244.5 3.6, 1979.S! 23.51! 19.6! 39.41 0.0! 0.0! '0.0! 0.0. 13.8
F 31.9; ~30.41 4.5; 6.5- 2.7i 204.8! 10-5! 7.1 32 .1 .! 13 8.4
42!Turnover Tax 0.OI 0.01i 0.0; 0.2! O.Oi 1552.5! I
441ther Net Income 0.01 0.01 27.0, 0.0. 0.0! 69.61 0.0' 0.0! 0.0 0.0: 0.0: 0.0 0.01 0.0
46 Private Income 17.6: 482.31 0.01 0.0; 17.6! 517.51 44.0: 16.0j 0.0 17.0! 3.01 25.0 45.01 ___
47 Tol T -2.8:-36.7! -2.0; -0.4i -1.2! -82.11 -0.6; -0.4 148 _Nt _FoeignTrad 162 -0.1-1721.; -5.8! -820.9: T ___
49 G N P 1 606.5 1800.4 w 660.71 -1161.2' 99.1!1 6311.5, 392.7! 3195.3! 84.9! 279.41 5I.11i 203.5; 534.11 135.9S01O Tta Output 11244.5, 3423.1! 952.6; 734.61 159.1119583.7- 477.8! 259.4: 95.41 410.01 68.4! 293.91 772.3! 147.9
51 limpon 267.9; 0.0! 9.1 5593.5 0.0j 0.Oi 0.0! 0.0! 0.01 0.0! 0.01 0.052 Tota Supply 1244.5: 3691.0 952.6! 734.6! 168.9:25177.2' 477.8; 259.4! 95.4! 410.0! 68.4. 293.9! 772.3! 147.9
83

Latvia 3: 1987 Input-Output Table in Purchasers' Pices-SNA Format
________________________________________ ~~~~~Page 3
________ i29 1 30 1 31 1 321 33 ! 34 ! 35 ! 36 1 37 1 38 39 i 40 41 42__________ RakI State 1 TOTAL!ODefn TOTAL I Hoe- -/- I - o-D Iefe Total In-mt Net I G N P
_mr IAdmiu.ISERV.j&OtheIOULAY1 holds I_paid I & OtherI Fixed i Exponr Power t .3 1.11 61.41 0.01 243.7i 54.4; 54.41 0 0 °! l - 54.4
2 Peto-Gas 0.21 1.0; 51.1; 370.8 842.8: 60.01 60.01 i I 0.01 17.5 0.01 77.53 Coal j 00.11 .11 12.9: 0.31 37.9; 1.41 1.41 I 0.01 0.1| 0.01 1.54 Other Fuels 0.01 0.01 0.81 6.11 _12.41 O 0.01 0.01 1 1 - .0j 4.810 . .8SFerrousmemb 0.0 0.01 5.1. 0.2i 456.1! 1.21 1.21 0.01 20.4 0.0 21.66IN-FenruaMetals 0.0 0.11 1.3 0.0 131.8! 0.01 001 0.01 -0.61 0.0 -0.67 CBicai 0.31 0.81 43.21 13.31 872.51 152.91 152.91 jOi.Oj 6.71 L 146.281M3MW 0.21_ 0.4! 46.6j 148.41 1668.61 38W.01 388.01 1369.5! 74.41 0.Oi 1831.99IWood & aper 0.21 0.6 17.9' 29.5 506.01 166.3 166.3 8.61 -6.30.0 168.6
10 Con. Materl 0.0 0.1 11.01 3.41 486.8 39.1 39.1 _ | -0.0 -28.1 0.01 11.0
L ightIry ! 0.1 0.3 28.6. 16.6! 1393.4 1099.7! 1099.7 _ __ . 13.3 25.0 °-6l 1138.012 Food Industq 0.0 0. 72. 15.4 1352.3 1930.2! 1930.21 0.0-29.8 0.0 1680.413 Oher duy [ 0.2 0'1 17-31 17.8 484.1 65.01 68.01 0.0 126.7 O0. 194.714 Total Industy 1.6 . 370 621.8 488.0 3961.01 3961.011391.4 -22.6[ 0.0 5329.8
15 Conrction I °-°1_ 1239. 0.0 0.01 1244.616 Apt. a Foresy 0.0 19.81 3.2 2881.41 553.4 553.41 26.7 27.91 99.9 0.0! 707.917 Production T c ..9 0.0 0.0 6 5.6 1 0.0 0.0 0-0 85s.618T&D I i 0.01 0.0 734.7 0.01 _ _ 0.01 0.0 -1721.01-1721.019 Olher Prod. Seco j 0.21 0.8 22.01 0.1 91.9 83.2 83.2 [ J 1.8 -12.0 0.0! 73.02O 0 maUe Ouy I .1.8i 8.81 411.81 62.1! 13042.9 4603.11 4603.1 0.01 112.31 0.0' 2660.2 65.3U -1721.Oi 5719.921 Houiung-Co nl1 0.91 0.4 6.11 5.0O 128.71 319.2 52.1 167S-I24.8! 5.1 349.122 N-Pod. Tauspon 1 1.4 1.91 13.4! 2.1 71.9 170.2 170.2 0.0! 23.9' -6.61 187.523 N-Prod. Commnic. 1 1.0 1.3 6.71 0.8! 74! 43.71 43.7 oo0 24.01 22.81 . -2.6 87.9
2 ucation 0.4 0.0 2.1 0.0 53.5 s35.51 27.0 329.5 0.01 0.01 - i 3S6525 Cultue 0.11 0.0 0.51 0.0 12.5! 55.9 32.6 233 0.01 0.0! 1 1 _ 55.926 Heatlth. etc. 10.31 0.0 1.61 0.0 42. 251.0! 53.8. 197.2 0.01 0.01 I5.
27 du..CW Health .0.8~ 0.01 4.21 0.01 108.81 639.9 68.41 371.5. 0.090.0
287 Siuece I 0.01 0.01 5.01 0.01 64.81 0.01 0.01 0.0 46.21 82.31 - I -4541 t 3.129lBanking&nsluance i0.0! 0.01 1.0t 0.0 107.91 31.41 31.41 0.0 0.0o 0.0' ! 27.01 58.41 30State AudbL i r 00 0.0 0.0 51.51 515!1 0.0 26.3! 0.01 I ; I7n.831 ServlnOunlys _4_11 3.6: 36.41 7.91 489.71 1279.41 562.83 717.1 121.3! 134.11 0.01 0.0I -27.61 1507.232 Defense & a m I I z I - Ither i9I90.21 933 ToM! Odays 15.91 12.4! 448.2;' 633.0! 13532.51 5882.51 5165.4! 7171 233.611 24.3 1 2660.2j 6S.3 -1748.61 8217.3
34IDWeCirecoa 0.71 4.1 379.2; 38.1! 1635.4i 1 :_I_________~~~~~ _ _ _ _ _ _ _ _ _ _ _ _ _ If _ _ _ I351Wages 12.71 54.9 741.4' 248.81 3038.9; ! __ -
37 KolkhoZ PaY | °l 0-0lo 4-01 i 468.11 1 1 i
Ss_Soci alsty I 1.0' 5.2! 60.91 17.91 291.9! 1 ! !39 K1khz Soc. Sec. . ' I 0.41 1 48.840ONet Proft ________ I~48 70 233
41 nus Wages 4.31 0.01 38.11 3.5 246.4i - III42 Tumover Tax I 0.01 0.0 0.0! IS5243 Net Subddie I001 0.0 0.01 -1138.1
44 Other Net I 0.01 IV 0T.-1 6- -1 I!-|46 Prate Ime 105.0! 6225147Tot ltses -1.0 -83.11 I l48 NetForelpTrade 27.01 1 27.01 1 -793991 '-49 G N P 160.41 65.411548.71 357.21 8217._
Totl Output 139.3 77.81 1969.91 990.21 22543.8i i -
51 lImport 0.01 0.0! 0.0! 0.01 55934!51-521Tol Supply 139.3 77.81 1969.91 990.21 28137.31 _ I _ i
84

Latvia 3: 1987 Input-Output Table in Purchasers' Prices-SNA Format
Page 4
______________ _ . 43 1 44
_ ,o jG I USESI Power ,90.41 388.4
2|Petro-Gas 8 8.7i 929.0_3 Coal 0.01 39.44 1Other Fueb , 1.21 18.4
!S Ferus Mctals 1 107.61 585.26 N-FerTous Metas 13.91 145.I
7 Chemicals 1 633.5; 1652.28MBMW 1343.6! 4844.1
9 Wood & Pape_ r 1 161.51 836.0
10 Ciunr. Mater"is T 62.01 559.7II lJght Iadusty 898.71 3430.012 Food Induaty 1101.11 4133.813 Other Industry 145.4 824.114 Total lndusoy 4567.6 1838S.4
15 Counsuction I 0.01 1244.6
16 Aa.&Foresry 1 101.71 36910
1 Pex-wdm T & C 1 01 9/.
.8 iT &D i °-°0 734.7
19 Other Prod. Sectors 168.9
20OMaitlalOuUay 4693-41 25177.221 Housing-Communal 477.8
22 N-Prod. Transport I j 2S9.4123 N-Prod. Communic. ! 95.
24 Educatio 410.0
25 urI 1 68.4
26 Health. etc. - r 293.927 Educ.. Cult. & Helth! 748.7
28 Scinc 1147.929IBanking&Insmnace j 139.3
30IState Admin. 77.831 Srvice Outays I 0.0o 2024f
32'Detense & Oher 990.2
33|Toiai (iutlay i 4693.4 29885.9
3S Wages i
36 Owher Wages
37 Kolkoz Pay
38 Social Security
39 Kolkhoz Soc. Sec.
40 Net Profit
41 Bonus Wages _
42 Turnover Tax
43 1 Net Subsidies
44 Ofier Net Income
45 KOLkhoz Income i T46 lPrivate lacome
471 Total Losses w I
48 Not Foreign Trade49 G N P
SO Totd ObSut |
52IToul Supp1; i I
85

Lithuania 3: 1987 Input-Output Table in Purchasers' Prces-SNA FormatMIllon Rubles. Currnwt Pricem
- - - _ _ ~~~~~~~~~~~~~~~~~~~PagelI
- ~~~~~~~~Power* Petro- Coal Other Ferr. N-Ferr. Chein. MBF4WI Wood Const.1 Light Food Other 7otoaGas Fuels Metals Metals Ipprmtr n.Idsr
(- I Power 4.0 17.8 0.0 0.6 1.1 0.0 37.8 81.611 24.3 40.2 28.7 27.7 12.5 '276.32 Petro-Gas 2i193 384.7 0.0 0.9 0.5 0.0 38.4 24.3, 13.4 48.3 4.5 34.4 3.7 772.43 coal 0.0 0.0 0.j9O1 0.01 0.0 3JO 0.3 0.8 1. 1. 1.4 03 .4 Other Fuels 0.2 0.0 I L 0'1 0.0 0.0 0.4 1.6, 1.41 0.0! 0.0 0.01 6.3$ Ferrus Metals 1.8 0.3 0.0 0.1 22.2 0.0 3.51 242.7 7.01 49.2 2.21 14.3 4.61 347.96 N-Ferrous Metals 0.3 0.0 0.0j 0.1 0.6, 0.0 5.71 110.4 0.81 2.0 0.31 8.9 1.6 130.67 Cchbrs 3.0 3.1 0.01 0.6 0.41 0.0 180.31 124.2 31.4 23.3 177.7 15.5 21.9 581.48 MB3MW 20.3 1.4 0.0 i.2 1.1 0.0 13.5 1109.9 40.8 34.4 22.2 50.4 10.3 1305.69 Wood & Paper 0.9 0.5 0.0 0.1 0.7 0.0 9.8 76.1 224.0 19.7 10.0 49.3 19.7 410.8
10 Constr. Meatrials 1.0 0.2 0.0 0.1 0.11 0.0 5.3 20.4 8.1 124.7 2.1 9.3 1.2 172.31 1 Light Industry 1.8 0.4 0.0 0.2 0.41 0.0 16.1 22.5 27.7 6.4 1654.3 17.8 80.4Fi827.912 Food Industry 1.0 0.1 0.0 0.01 0.11 0.0 10.0 6.3 1.1 1.4 33.2 1027.7 84.811 1165.61i3 OtherIndusty - 26.0 0.0 0.0 0.1 0.11 0.0 0.9 10.0 1.4, 1.6 7.81 21. 90.51 159.814 Total Industry 279.5 408.6 0.0. 6.5 27.3 0.1 321.4 1829.0 382.41 354.2 1944.11 1278.0 331.51 7162.8IS ConstrctIon 0.0 0.0, 0.0 0.0 0.0 0.0 0.0 0.0 0.01 0.0 0.01 0.0 0.01 0.016 Agri. & Forestry 0.0 0.01 0.0 0.0 0.0' 0.0' 0.4 0.0! 4.51 0.1 70.51 2760.9~ 338.91 3175.117 Production T & C 1.8 158.8 5.4 2.1 8. . 23.3 37.91 20.7 113.7 15.81 91.8 i44.4 604.318 T & D 0.0 44.6, 0.3 0.0. 13.21 0.8 42.1 95.8j 15.5 7.01! 122.5 305.91 21.8 669.319 OtherProd. Sectors 0.7 0.6 0.0 0.01 11.51 7.8 3.4 10.6' 2.0 1.41 3.1 5.5 3.8 50.5,20 MaterIa Otays 282.0 612.6, 5.6 8.71 139.81 9.4, 3905.5! 1973.3 425.1 476.4 2156.0 4442.1 740.4 11662.021 Housing-Communal 2.91 1.8 0.0' 0.0 0.5' 0.1 3.71 14.31 5.2 2.3 10.9 13.6 4.1 59.422,N-Prod. Tmuranpr 0.51 0.1 0.01 0.1 0.1 0.0 0.91 7.6 3.8 2.0 4.4 2.5 2.8 24.723 N-Prod. Communlc. 0.01 0.0 0.0 0.0 0.Oj 0.01 0.0' 0.01 0.0 0.0 0.0 0.0 0.0. 0.0
-. 24 Education 1. 0.8 0.0 00. 0.3' 0.0 20 6.9 2.8 1.2 4.3, 7.0 2.2~ 29.2
25 Cultur 0.3~ 0.2 0.0 0.0! 0.11 o.o: 0.41 1.91 0.6 0.3 1.0 1.1 0.5.1 6.426 Heath, etc. 1.21 0.6 0.0 0.0 0.2. 0.Oi - 1.5 5.6 2.2 1.01 3.8 4.8 1.71 22.827 Educ.. Cult. & Health 3.1 1.7 0.0 0.0 0.6' 0.1! 3.91 14.4' 5.62 58.4428, Science 1.8 17 00 .2 0.2i 0.11 27 2. . . . 37.8
29 Bankingi & Insumnce 0.9 0.9 0.0 0.0 0.11 0.01 2.0 5. 1.4 0.6 3.-91 10.2 1.2. 25.930 State Admin. IFI I IT31 ServIc Oudlay 9.3 6.1 0.0 . 0.4 1.51 0.3! 21.21 61.9 17.21 8 .6 316 1 4f5 , 12.6' 20.32 Defense & Other I4It
33Total Ouftla 291.3 618.7 5.6 91 141.31 9.7 40. 052 442.3 485.01 2187.6 4487.51 753.0f 11868.1
34 DepreciatIon 118.0 16.6 0.01 4.7. 3.8' 0.3 57.5j 210.7 46.2 64.1 55.7 121.9 38.9 738.4.35 Wages 30.6 4.5 0.01 3.0 6.2 0.4 49.11 492.1 117.61 108.21 211.8 163.6 31.5 1218.736 Other Wages 0.8 ~0.21 0.0 0.1 0.1 0.01 2.1 18.4j 2.61 2.1 2.21 3.0 0.8 32.437 Kolkhoz Pay 0.0 0.0j 0.0 0.0 0.0 00. 0.0I 24.9' 9.6 0. 14. 7.2 40.3 82.538 Socia Security 4.3 0.8i 0.01 0.1 0.7 0.01 6.21 59.11 9.2 104 29.31 20.7 1.7 142.639 Kolkho Soc. Sec. 0.0 0.Oi 0.01 0.0 0.0, 0.0 0.0 4.01 1.2 . 0.1 0.8 2.8 8.840 Net Profit 90.1 48.1 0.0! 2.2 10.2 2.6' 81.3 459.11 156.2 65.3 281.4 228.1 62.9 1487.541 Bonus Wages 5.7 1.2 0.01 0.4 1.0 0. 04 15 1. 11i.9 36.8 19.1 5.5 157.042 Tumnover TAX 25.3 249.7 0.01 0.0, 0.1 0.0' 73.1! 142.9 7.0, 16.4 585.7 597.7 6.9 1704.943 Net SubsIdIes 0.0 0.0 0.0 0.0' -O 0.0 -60.111.7 0.01 0. -32.1 -1801.3 0.0 -1891.844 Oth NettIncoe 0.0 0.0 0.0 0.01 0.¶1 0.0i 2.0-.0 0.0 2.0 0.0, 7. 0.0 -11.045 Kolkhoz Income 0.0 0.01 0.0 0.0 0.0I 0.0' 0.0 12.5 3.8 0.0 0.312. 22.6 59.6-46 PrIvate Income 0.0 0.01 0.0 0.0 0. 0 r 1 00 0o.e 0.0 0.0 0.01 0.01 0.0 0.047 Total lame -2.S -0.3 0.0 -0.1 -0.1 0.0 -1.2 -4.4 -1.0 -1.3 -1.2 -2.5 -0.8 -15.448 Net Foreig Trade -49.5 534.0, 51.6 2.8 342.5' 151.5i 408.0 486.21 -36.0 15.1 -MOO ..SO 4t 48.3 984.1490NP 217.2856 51.61 12.8 363.Si 154.8 618.0 1907.2 316.41 282.3 693.6 .1163.7 25. 4563.3SO Total Outpu 558.0 938.3 5.6 19.1 162.41 13.1 611.7 3456.2 794.71 752.2 332-1.2 3854.2' 90715447.351 import 996 1017.6 1.6[ 4.4 375.0[ 159.71 767.1 2337.1 225.71 93I9 9739 539.41 96.01 6741.0
52 Total Supply ~~~657.6 i 57.2[ 23 .5 1 531-4! 172.821 1378.8 5793.3 1020.41 846.1 -429.1 4393.6105. 218.3
86

Lithuania 3: 1987 Input-Output Table in Purchasers' Prices-SNA Format
Page 2IS 1 16 117; 18 , 19 i 20 21:22 23 24 i25 i26 .27 28
COnstr. lApicultI T & C!I T & D!I Other iTOTAL; Hiouwsi Transp. Comm.' Educ. I Cult. iHealth iEduc. &.Science
~~~~~~~~~~~~~~ ~ ~~~~~Prod. iPROD.! I Health!II Power 21.41! 32.81 28.5: 19.9: 1.6i 380.6i 10.2j 6.1: 2.0 19Q .: 13.71i 36.01 4.42!Petr o-GaGas.2! 68.31 87.6 6.11i 0.3' 1025.0~ 22.9: 34.3. 1.0 5.81 0.71 4.0' 10.41 1.43 Coal 1.01 7.11 1.5: 2.9i 0.1: 18.5. 2.5! 0.2; 0.3 3.8f 0.51 2.6! 6.81 0.14O0ther Fuels 1.61 6.41 0.0: 0.0! 0.01 14.3: 0.11 0.01 0.0 0.11i 0.01 0.0: 0.1w 0.05 Feffis Met8b 93.21 4.3! 3.2, 0.41 0.01 449.2j 1I.81 0.Sj 0.5. 0.2; 0.01 0.21 0.41 3.56 N-Ferrou Metal 2.21 O.j -0.31 0.31 0.2! 133.9i 0.11 0.11 0.0. 0.01 0.0 0.01 0.01 2.27 Chemicals f 32.91 144.91 20.41 3.71 1.3' 784.71 6.21 6.41 0.3' 2.01 1.8 23.51 27.41 4.28 M3BMW 189.61 164.31 21.81 13.11 3.11 1697.4! 8.8! 11.6: 1.4' 9.41 1.1 6.51 17.0! 23.29 wood & Paper 150.01 6.11 4.01 21.0 11.4j 593.41 11.31 1.Oi OSi1 7.01 0.9 4.81 12.71 1.2
10 Cotzat. Materials 491.7 ! 21.0! 18.11 5.3! 0.1! 708.5. 19.01 0.71 0.2. 1.71 0.2! 1.11 3.01 0.81 1 Light Industry I 12.7; 20.81 4.4! 9.3; 2.41 1877.6 3.9! 1.41 0.4. 18.0j 2.2! 12.41 32.51 0.912 Food Industry 2.9; 117.31 0.11 11.31 0.0'i 1297.2' 2.4: 0.0 0.0. 51 .0; 6.41 37.4' 94.8 0.313 Othe Industry i 3.21 332451 2.5; 4.41 14.911 $517.2' 1.2: 1.31 0.3! 23.9i 2.9! 16.5! 43.31 0.814 Totia Industry :1092.71 926.4! 192.41 87.7 i 35.4. 9497.3: 90.4 63.61 6.9. 142.7; 19.11 122.61 284.41 43.015 comnsrcdo 0-.01 0.0: 0.01 0.0! 0.0: 0.0' 16 Api.r Fren 3.11 1177.1' 0.01 3.3! 0.0! 4358.7: 1.51 0.01 0.0: 6.0: 0.7; 4.11 10.81 0.117 Production T & C 30.51 28.7: 2.4' 3.41 1.0. 670.3: 18 TAD ~~~~~~~0.01 125.8! 0.01 0.1 34 78.!_ __________
18 T &__ __ __ __D_ __ __ __ __ __ __3_ __4_ __ _7_ __ __ __ __ __i
19 Othe Prod. Secwors I 10.7' 0.3 1 12.71i 21.91 0.2' 96.8. 5.5! 0.1 1.21 6.3! 0.8!i 4.3!i 11.4 1.21NQJMSeib1on"ay 1137-01 22488,I 207.5' 116.31 39.9: 15421.6' 97.4: 63.71 8.1 1 155.0! 20.51 131.0i 306.6 44.31
21Housing-communal 11.91 11.21 5.61 15.61 2.01 105.7: 1.4: 0.9; 0.6. 0.71 0.31 0.5i 1.6, 0.622 N-Prod. Transport I 10-91 14.8 2.71 5.8!I 2.41 61.3 2.3 1.6! 0.5i 2.8j 1.1! 2.2! 6.11 1.923IN-Prod. CommuLnic. I. 0.01 0.0 0.01 0.0! 0.0. 0.01i 0.21 0.2' 0.4! 1.0! 0.7! 0.71 2.4 1.5U4Education i1 6.01 11.41 3.91 3.41 0.71 54.6! 0.71 0.6! 0.3! 0.0! 0.0i 0.01 0.01 0.025 OlCulir ~14! 2.51 0.91 0.81 0.11 12.1: 0.2. 0.11 0.11 0.0! 0.0! 0.0! 0.0! 0.0
26 Hahh,etc.5212 8.91 3.01 3.01 0.5! 43.41 0.5!- 0. 4! 0.31 0.01 0.0: 0.0! 0.0! 0.027 Educ.. Cult. & Health( 12.61 22.91 7.8' 7.2! 2.3' 1 10.1 2.4LZ 1.1! 0.71 0.0! 0.0! 0.0: 0.0! 0.02____Sde ___e ___ 16.4! 11.4: 3*91 7.61 0.4. 77.5: 0.2' 0.21 0.3: 0.01 0.01 0.0; 0.0! 7.629 Banklng & Imnmi 9.51 8.8!1 2.3: 50.41 0.61 97.5: 0.2! 0.21 0.4' 0.OJ 0.01 0.01 0.01 0.130 Sate Amtifn. II .1 I31 SetvlwOuUa i 61.3- 69.11 22.3. 86.6' 6.7'i 4521.1 5.71 4.3!1 2.9! 4.5! 2.11 3.5i IO.1* 11.732 Ddefes & Othe i I I_33 ToII Ouftla 1198.4! 2317.9; 229.8; 202.9: 46.6!4 15863.8: 103.11 68.01 11.0: 159.51 22.61 134.5! 316.7! 56.0
34 Depreciation 144.3! 441.6i 182.6. 64.2! 7.4' 1578.5 , 250.51 67.11 20.8!j 78.6! 8.3!j 44.1! 131.0' 29.035 Wages 669.2g 342.6! 200.4! 261.41 55.0! 2747.2! 124.51 90.0! 29.51 272.7 45.1! _160.7i 478.51 104.1361Othe Wages 26.51 3.81 5.0 9.7!i 0.41 77.9! 2.8 33 0.9' 1.5. 0.41 1.4! 3.3 2.4.37icolkboz Pay 94.1! 493.1! 0.0; 0.01 0.0! 669.61 I 3.0 0.41 1.81 5.238 Social security 83.0! 19.31 11.91 21.9' 4.4! 283.11 6.9! 7.6! 2.31 19.8 3.31 11.7! 34.8 11.739gKolkhaSoc. Sec. 1 0.9' 52.2! 0.0! 0.0: 0.0' 61.9 I 0.31 0.11 0.2! 0.6!40 Net Profi 747 187.6! 124.5! 255.4: 23.41 2231 31.51 19.11 37.31 0.01 0.0! 0.0; 0.0 18.7411 BonusaWags 50.3! 33.7; 35.41 5.41 0.0, 282.8' 8.3! 7.31 3.4! 2.41 1.3! 1.7, 5.4 11.442ITwoover Tax z0 0.01 0.0: 0.3: 0.0! 1705.2- I43 Net Subsidies 0.0! 0.0! 0.0! 0.0! 0.01 -1891.844Other Net ncure 00 .!1.1 00 . 22.6. 0.07 00 0.01 0.0i 0.0 00 0.0 0.0145 IKolkhozacome I 0.0 482.0. 0.0! 0.0! 0.0! 541.7: 461 PrIvtie Income I60.61 828.2! 0.0! 0.01 30.9: 919.7: 53.0r 18.0' 0.01 25.01 4.01 _32.0! 61.047 Total LoMes -50.1: -55.61 -0.3! -27.4! -0.4; -149.2. -0.61 -0.5148 Net Foreign Trade 1113.61 '-3535.01i 0.0: -2437.349G0 N P 11203.1! 2908.4i 535.71 .2949.4: 121.1! 6382.1!i 469-21 2045; 903, 403.31 62.9! 253.6! 719.8 165.9
______________ 2401.4j 51 12.71 765.51 788.51 167.7; 24683.11 572.3. 272.5! 101.31 562.9! 855!388.11 1036.5j 221.951 Impart 0.0! 223.6! 0.01 0.0! .5 6968.1! S2ITOowISupply 1 2401.5. 5336.3!i 765.4! 788.5! 171.2 31651.1: 572.3 272.5' 101.3: 562.9! 85.51 388.1! iO6.51 221.9
87

Lithuana 3: 1971 mpt-Output Table in Purchasers' Prices-SNA Format
Page 3
-~~~ . '29f~~~~~T-30 I3 1 32; 33 .34 35 .36 137j138 r3 9 140_1_41 j 42
9M* i IWS TOTAL: ee TOTAL .House.! -/- -/. IGovern.iDefense Totaml Invent.i Net G GNPI Power ~~~~~law. i AdSi! ISRV. :& OdIw OTIAV holds . Paid I Frfte !& Other j Flixed i T' or,t.
I Power ~0.3! 1.2! .60.2. 0.0 440.8: 67.7 67.7! 0.0: 0.01 0.0! 67.7
2 Petl>4;as X03 1.3; 71.6 8.7 1105.3 102.8 102.8 0.0; 264.31 0.01 367.1
00, 02 10.1 0.2 2. 20.9 20.-9± O: 7.71 o.o0 28.61
00! 0.01 o.2i 0.0- 14S: 1.4' 1.4 0.01 6.11 0.01 74
S[Ferrouas m 00 O0O 6.7 0.1 456.0: 2.5. 2.5 0.01 46.4 0.0 48.9
6'N-Fart Mt"l i 0.0 0.01 2.4; 0.0; 136.3i 0.Oi 0.0 0.0; 28.1 o__ 28.17 ChemCiCM i 0.2 1.0k 45.7! 2I.5 55.9: 167.51 167. 0.01 0.4! 0.0' 167.9
8 MBMW I 0.2 0.61 62.81 302.21 201A4: 474.71 474.71 : 1 952.2. 453.01 0.0 1880.0
9 Wood& Pape . 0.2 0 .71 27.61 0.01 621.0 1594 1 59 .5
i I 24.91--46-8! 0.0 137.6
10 Const. Matu 0.01 0.0! 23.71 0.01 73&2. 36.Si 36.S j 0.0 -1.01 0.0 35.
II lahtlIdusty 0.1! 0.3! 39.5 21.71 193.8; 1188.7! 1118.71 i T 1.61-247.91 0.0 942
12 Food Idus"y I 0.0; 0.l0 -97.1 18.5! 1413.22 250.71 2508.7i 0.01-598.21 01 1910
1310ir00 24.21 342.11 o.oi 443.2lod y0.31 1.3i 48.51 0.0 565.7i 76.9i 76.91 ~ ~~21. 4.
14ITou l adusey I .61 6.61 496.5 372.9i130366.7: 4807.71 4807.7. 1029I2421 06048
1Sf Comabruc1Iom OGi 0. 01 0 0! 0.0. 024010. 0I24014
161A.I Foarsy - 0 0.1! 125: 3.71 4374.9 630.6; 630.61 74.0; _ 76.8! 70.01 0.0 851.4
1710.! T& C0.0! 9 0.0= 0.0 95.1
118jT D .O 0. 0.0 0.0' 788.5! 0.0! 0.0 i 0.01 0.0 35 -3535.
19109m Prod. 0.4 1.4 21.21 0.0; 318.0i 44.5! "I.51 4.0 0.0 49.6
301m2.0N * " -1 IS30.2i 376.6! 16318.4; $482.8! 5482.81 0.0.1 169.11 0.0j 3481.7j 328.7 -3535.0 5927.3
21 H C1n 1.2! 0.6! 6.5 119.1; 402.; 357.31 214.71 43.21 8.0; 453.2
22I-Prct.Taupon 1.8 U.j 16.6 2.81 80.71 168.4i 168.41 0.01 0.0! 28.11 [f -4.7 191.8
23 N-Prod. Cooinuai. 1.61 7.7! 11.01 8.7; 46.6. 46.61 0.01 33.1! 14.Sj .1.6 92.6
24 Educaga O-8 0.01 2.1! 0.01 56.8! 506.1. 38.8! 467-31 0.0! 0.0 i 506.1
25 Cute _0.1 0.01 Oi 0.01 12.6: 72.9! 30.9; 42.01 0.01 0.0 n729
6 Health. cm 0.4 O.Oi 1.6i 0.01 45.0; 343.1 74.9i 268.2! 0.01 0.0 343.1
-2 7 Educa.i .Cult. & ON 1.1 .0. 4.2i O.o. 114.3 922.1 144.6! 7775 0.0! 0.0 922.1
28 _ce0 0.0o' 8.3! O.Oi -5.7 0.0; 0.0 0.0; 35.1! 92.3 _8.8 136.
2g9 _ii& WSW=e t 0.0! 0.013- 1.0' 0.01 98.5: 571i 52.11 0.0; 0. OOi 0.0 25.0 77.1
30 Suit AdI . 64.9. 64.9 0.01
31 Swdat g0bp 5.4.1 4.6! 44.7i 10.3; 507.1: 1656.1 663.9: 992.2 145.6; 142.9i + 275 1972.1
32e ojw 627.61 ; 627.6
34 _ __ Dqoi ___ __ __ __ S. 0. 1..2i77 ._ | i i j310Told OnW,g* .. . 574.9: 3869. 16825.'T 7.389i 6146.7i 992.2. 314.7 770.5! 3481.71 328.7 357.5T, -i0
I
781SodglSawag -_1_ 1.21 6.2 70.71 3601 369.81 1
-0No= oc s I 0.0; 0.0. 0.61 i 62.Si rI 1 IW o Imettt 125.41 0.01 23101 I05.7i 2598.8; I1
411 BonusWon 14.9i 0.01 40711-0.0! 332.5
0.0- 1 9170.2
4OdhetNot ham 0.01 0.03 0.01 2216, iI- .
45 KoiSba10111 s Ene 41.7i - - j 46 FobeIcu 132.0!1111 10517SIX.....t..
47Tot al 33 -150.3 .
48N1 F*pTf 5j90-1 j 25.Oi .2412S.3
590 Th W& 15 6.43104. 240.7 8527.0'
Si6p V______ .0 6965.11- .- - - -
52TotI 11511.63 91I 4 627.6: 347-32.9!_____

Lithuania 3: 1987 Input-Output Table in Purchasers' Prices--SNA Format
Page 4_____ 43 1 44
I Expon i TOTAL_ _oerI UsesI IPoot 1--49.X1 65762 PetmGas 483.61 ISSS.93 Coal 04! _7.4
4 Other Fuels 1.61 23.5S Ferrous Metas 32.41 S37.46 N-Fenrmo Metals 8.21 172.67 Chemicals 359.1. 1378.18 _M_W -8S0.9i 5793.39 Wood & Paper 261.71 1020.
10 ConOw. Matarlst 78.81 846.4I1I Uhtlndus"y 1413. 4M.12 Food JAdusay 1069.8 4393^13 Oiler lnduy 47.71 iOS6.614 Total IndutY 5756.9i 22188.45Scotuucion 0 0! 2401.5
161AprL & Foretry I 110.01 5336.317 Producto T & C 0.01 765.4I8T&D 0.01 7°19 Othe Prod. Sectos 3.51 171.120 NairWtaOutya 5870.41 316SI.I21 Houlag-Commuaal I 572.322 N-Prod. Tramtpon I 272.523 N-Prd. CoMURUIC. I - 101.3
24 Educatin 1 562.9
2S Cultr 8526Healthh. etc. 3U8.127lEduc., Cut. & Health 1036428 Sceuee j 221.29IBMUS a&Jau rane i 150.63b0IStaAdmin. I99.1
31 Surrev Outtiy 2454.232 Defeae &Odher i 627.633 tTotlC Otis , 5870-4! 347330
34 DepreciatIn 32 Walge t3l Other W age !37 Kclkhoz Pay38 SocWi Secuilty39 Kikhos Soc. SOe. -40 Nkt FJfh_ _41 Boosm W4es42 Turaomr Tax i43 Not SubsidiS44 Oiier Net IcMlef45 Kolkhoa inome.46 Prlvae Inclce47 Tooal Loins48 Net ForeiP Traie I49 G N P
51 ToIOut I i
5i21omSup11 UP 89

Moldova 3: 1987 Input-Output Table in Purchasers' Prices--SNA Format?dIlilo Rubles. Current Prices
_______________ ~~ 1 2 i 3 4 1 5 6 i 7 8 9 I*' 11 12 13 14____________ ~Power iPe-o- i Coal IOther; Ferr. i N-Ferr.' Chem. MB.MW -Wood Constr.' iUght iFo te oa
1 1 1 ~~~~~~~~~Gas j Fuels IvMetals !Metals; Paper Mater.I nduVPower 1 3.2!1 1 15.01 0.0! 4.7. 46.2 i 8.1 i 23.9! 18.91 30.3. 15.71 166.12;Petro-Gas I116.9! I 2.51i 0.0; 1.5 26.3i 2.6. 69.71 8.0! 31.7 5.41 264.73'Coal 88.8' 0.0' 0.0. 0.0: 1.1' 0.11 1.41 0.71 2.2 0.31 94.54 -Other Fuels 0.0 0.0 0.0; 0.0! 0.0. 0.01 0.01 0.0! 0.01 0.05: Ferrous Metals i I.E; 29.7! 0.0: 1.7. 199.0! 6.11 28.81 1.51 8.21 8.91 285.06-N-Ferrous metals 0 .0 I . .! 440 49 0.1! I.s; 0.7! 2.6i 7.21 156.47IChemicals 1.6 T 0.5; 0.0! 111.9. 97.6; 19.4'i 11.21 123 61 19.1 i 18.41 403.481MBMW 8.6. T9.3' 0.0i. 2.0; 577.2! 18-01 22.31 13.11 47.51 3.51 701.49[ Wood & Paper 0 4 0.1! 0.0i 11.0;, 22.41 149.91 4.6i~1 13. 81 49.5i 12.6! 264.4
lOjConstr. Materials I 0.4!1 0.2! 0.0' 1.7 7.3 6.11 89.81 2.0' 21.1! 1.21 129.8IIlIUghit Industry 0.4; 0.3: 0.0: 7.0' 11.1. 17.51 2.61 1178.6: 7.9; 17.5: 1242.912!Food Industry 1 0.21 , I 0.1! 0.0; 4.5. 2.3: 1.0! 0.81 14.1!i 1230.41 76.1! 1329.613! OthertIndustrv 2.5! 1 T 0.1: 0.0! 0.5; 5.2! 0.7! 3.01 2.91 21.1!i 73.2! 109.214!Tota.1Industry 224.2! 0.01 0.0! 0.01 62.4' 0.6. 190.5: 1090.6: 229.5 i 2596.6! 1378.1 1 1471.71 240.11 5147.315 Construction I 0.01 I I 0.0 0.0 0.0: 0.0; 0.01 0.0' 0.0! 0.0! 0.0! 0.0161Av. & Forestry 1 0.0! 0.01 0.0 0.0. 0.1: 0.6i 0.0 115.61 2295.81 184.21 2596.217 Production T & C 1 2.91 33.5! 11.51 0.0; 17.01 1.I. 26.0 78.0! 39.8! 81.8. 10.91 37.51 5.91 346.1181T & D I 0.01 37.51 2.98 0.0! 3.71 0.5 17.0. 59.9i 17.91 14.9. 103.4 242.3:I 12.61 512.519IOther Prod. Sectors I 5.1 0.01 0.01 0.0! 13.8! 0.0- 0.61 7.7: 20 18 3.9 5.8! 1.0! 4.zolmateria Outlays- 1 232.2! 71.1! 14.3! 0.0! 96.9i 2.2;" 234.11 1236.31i 289.81 358.li 161 1.9i 405.1 4-43.81 8643.821lIHousing-Comimunal 1 &71 0.0! 0.01 0.0! 0.71 0.01 1.6; 16.11 2.9! 1.61 11.01 17.6! 2.01 60.3221N-Prod. Tranisport I 1.1; 0.01 0.0! 0.0! 0.2! 0.0! 0.4! 10.1! 2.1! 1.41 4.41 ".01 1.4! 25.023!N-Prod. Comtmunlc.1 0.0! 0.0! 0.01 0.01 0.01 0.0: 0.0: o.o 0. 0.0 ! 0.0! 0.01 .; 0.01 0.024lEducatlo 3.6: 0.0! 0.0! 0.0! 0.4! 0.0' 0.81 9.2! 1.6. 0.9! 4.4! 8.0!I 1.01 29.925tCultur 0.8; 0.0! 0.01 0.0!I 0.11 0.0 ! 0.2! 2.41 0.3;~ 0.4! 1.0. 2.2 0.2! 7.626 IHealth. etc. 1 2.8! 0.0' 0.0! 0.0!i 0.31 0.0! 0.7!1 7.5! 1.2' 0.7! 3.9! 6.3! 0.81 24.127JEduc.. CWlt. & Healthi 7.2: 0.01 0.01 0.0! 0.8! 0.0: 1.7! 19.1! 3.11 1.9' 9.2: 16.51 2.01 61.6
28 j Sciencei 4.2! 0.0 i 0.0! 0.0. 0.2! 0.0' 0.71 25.6: 0.6! 0.7 3.3! 7.0! 0.2! 42.629 akn &Isrn 1 2.1! 0.0! 0.0! 0.0! 0.21 0.0! 0.4! 11.8, 0. 0.4! 3.9;i 27.81 0.61 _48.130 [State Admin. _______________________
31 ISerMosOutlaya 21.3! 0.0! 0.0! 0.0! 2.2! 0.0! 4.8' 82.8. 9.51 6.11 31.81 72.91 6.21 237.6
33 ToldOutlays253.6! 71.1! 14.3 0.01 99.! 2.2 238.8! 1319.1! 299.4! 364.21 1643.8 I 4126.0! 450.0; 8881.4
34 Depreciatdon J 5 9 .1!O O 0.01 0.0! OO 19.1! 0.0 14.5! 116.3! 13.81 59.5! 44.9! -135.9! 28.6! 491.8351Wages 20.3 i I I 8.0; 0.0 15.31 341.7! 45.71 81.2! 173.11 140.2! 39.1! 8646.6361 Other Wases I 071 0.0! 0.0! 0.0J 0.21 0.0 i 0.3! 4.91 0.4! 0.71 0.9!_ 1.81 j0j._3 l 0.2
37 !Kolkhoz Pay I 00 o I r tI 0.0! 0.0! 0.0. 3.8i 2.21 0.3;- 0.01 1.6! 2.4! 10.338l1Socla Security j 3.3! 1 =91 0.0! 2.21 45.9! 4.6! 8.3 23.21 1 6. 4!I 3.11 107.939!1Koklloz Soc. Sec. 0.! 1 j O 0 031 0j 07! .4 0.01 0.0! 0.3 0.41 2.140 Net Profit t 67.6! .01 ! .h 0.0 6.41 0.01 40.5! 307.2! 54.7!i 41.Oj 262,51 26.31 39.31 1085.441! Bonus Wages 1 4.01 i : 13 0.0; 2.2: 39.9! 5.9! 66 23.81 150 3.7 10.42 Tumuove Tax I 31.9 I 1.51 0.0! 20.9! 44.6! 0.1!i 34.21 _536.51 629.8. 61.8i 1361.443 Net Subsidies t 0.01 0.01 0.01 0.0! 1-17.8! 0.0! 0.01 -3.!-3.! 0.01 .785.744 IOtheNet-Income ~0.0! 0-0 0.0! 0.0 0.0, 0.0! 0.6!1 0.0 0.! 0.00.0!53 0.00. 38.1
T 0.0! I 0.0, 0.01 0.0! 0.01 0.0; 0.0l 0.0-175 . 1.46I Private Incme .00! I 0.01 0.0 0.0: 0.01 0.0! 0.0 0 0.0 0.0 0.0 0.0
47TolalLoesea T 18' I~~~~~~~~~~ -0.6: 0.0: -0.91 -6.2! -3.0! -2.7! .25.3!1 41 4. 4.48 Nei Foreigp Trade -104.8! 498.21 128.7i 0.0! 242.4: 158.41 457.8. 594.31 150.7! 44.2194.8i 1774.4±L-14i71 475~~~~~~ ~~~~ 76.3 498.2! 128.7! 0.0! 278.0' 158.7! 551.2: 1435.4!: 269.6! 269.31 1078.91-1305.0 156139.50 Tool Output 1434.7 71.1! 14.31 0.0. 134.7!, 2.5: 332.21 21602! 418.31 589.31 27.!459.4 61312001.8S1I ha ' 16.71 498.2! 128.71 0.0j 301.1! 1-58.4 655.71 ; 1566.01 253.6! 115.6! 1169.31 4154.0; 135.1 5452.5152!ToUI Supply 451.4! 569.3' 142.91 0.0! 435.8! 161.0 987.9' 3726.2! 671.9; 704.9' 3797.2! 5049.4i 756.4! 17454.31
90

Moldova 3: 1987 Input-Output Table in Purchasers' Prices-SNA Format
________________________ ~~~Page 2
15 116 i 17 [18 I 19 i 20 21 22 i 23 .3.. 26 1 27 i 28___________ I~ Consr. 'Agricult.; T&C! T &DI Other TOTAL ! Houulns.Transp..Comm. iEduc.!I Cult. lHealth IEduc. &IScience3 I tT~~~~~~~~T~~IPRd iPOD.1 i Halh
I Power I 8.9: 20.5 6.11 11.4= 10T71 213.6; 21.2: 3.11 3.9[ 17.31 2.11 11.91 31.2 0.2 Petro-CGas ] 52.6 73.1. 50.71 7.11 0.2; 44..3 6.0 25.2: 2.11 3.31 0.41 2.2: 5.91 0.73ICoal 1 1.3; 11.4, 2.11 2.0 0.0. 3111.3' 2.1! 0.41 0.21 9.61 1.2i 6.6' 17.31 0.0410Other fuels 0.01 0.0: 0.0: 0.0; 0.01 0.0; 0.0, 0.0 0.0! 0.01 0.01 0.01 0.01 0.05 Ferrows Metals 80.01 4.11 1.9. 0.51 0.0. 371.6 0.8! 0.51 0.21 0.4: 0.1; 0.3! 0.81 1.56 N-Ferrous Metals 1.51 0.11 Oh1 0.11 0.21 158.4; 0.0 0.1! 0.01 0.0! 0.0! 0.0: o.oi 0.37 Chemicals 31.61 122.21 14.3- 5.0! 1.01 577.5: 3.8i 4.6 i 0.61 2.31 2.11 26.8! 31.21 2.28MEMW 1 141 157.41 20.6! 13.41 1.3! 1028.11 5.5: 10.71 2.01 8.5! 1 .o: 5.8i 15.3! 8.8
9 Wood &Paper f 67-51 2.3.51 2.8, 12.51 6.71 377.5! 2.61 0.7! 0.41 4.5i 0.5i 3.11 8.2! 0.4lo0Constr. Mateals 1442.1! 18.71 3.0 i 7.51 0.11 601.1! 6.8' 0.4! 0.1! 2.0! 0.21 1.4j 3.61 0.31 11 Ught lnduzsu 5.0! 20.51 2.0! 6.8! 0.9! 1278.1! 1.6! 0.9! 0.31 13.71 1.71 9.41 24.8! 0.4
12Food Induswr 1.01 74.0! 0. 27 6.0! 0.0: 1420.8i 2T3! 0. 0.0! 46.41 5.Si 34.01 86.2! 0.013 Other Indusrwy 3.11 303.11 1.21 4.41 10.8: 431.7 i 3.2i 0.41 0.11 7.21 0.91 4.9! 13.01 0.214 Total Industr 818.6! 828.6! 105.01 76.71 21.9' 6998.2! 55.9! 47.1! 9.91 115.11 15.9. 106.51 2.37.51 15.415 0onstruction 0.0! 0.0: 0.0! 0.0' 0.0; 0.0! 1!_ ____
16Agri. &Foresuy I 3.01 585.2! 0.7! 11.2! 0.0, 3196.21 OX1 0.0 0.0: 10.4!i 1.3: 7.1! 18.8! 0.017Pouto T & C 32.91 21.7! 1.51 5.2 5 .9! 413.1! i
I1IT &D I 0.01 143.2! 0.01 "IO 15.0! 670.6! i 19 Other Prod. Secrars I 10.01 5.2! 1.3! 14.3! 0.11 i 72.:7: 1.21 0.5! - 0.6i 3.9! 0.5! 2.71 7.01 0.6
20 user ouds" 864.5; 1583.9! 108.51 107.2[ 42.91 11350.8. 57.21 47.6; 10.5! 129.41 17.61 116.3! 263.31 16.021 Housing-Communal 8.41 14.01 3.71 13.0j 0.8! 100.2' 1.0! 0.4! 0.91 0.91 r 1061 17t22 N-Prod. Tranport 1 .61 19.7! 1.8i 5.31 1.0! 61.4 1.61 0.71 0._7r 3.4 J 61 241')6.fii0.723IN-Prod. CAm inic. - 0.01 0.0! 0.0! 0.0! 0.0!I 0.0 0.2' 0.l i 0.5! 1.21 0.61 0.81 2.6! 0.24 Education 4.81 15.21 2.61 3.8! 0.3! 56.5i 0.5: 0.2! 0.5! 0.0! 0.0! 0.0! 0.01 0.0125QCahur 1.8! 3.6! 0.71 1.0! 0.02 14.7! 0.1! 0.0! 0.21 0.0 0.0! 0.0! 0.0 0.0126 Healt. etc. 4.1! 11.91 2.0! 2.7! 0.21 45.0:! 0.4' 0.2! 0.41 0.0! 0.0! 0.0V o.ol 0.027 Eduac.. CuL. & Heath 10.61 30.71 5.31 7.51 0.5! 116.21 2.0; 0.4, 1.01 0.0! 0.01 -0.07 0.01 0.028 Scence 13.21 14.6! 2.41 2.51 0. 2 735.` Oh 0.1 0.4! 0.0! 0.0! 0.0! 0.0! 2.6
9 2Bankln&Iasuran 7.5! 13.1! 2.5 50.21 0.21 120.6; 0.2! 0.1! 0.51 0.0! 0.0! .0 0.01 oo 0.2
31 Secvlcaouilay 48.4! 92.1! 14.7! 78.41 2.81 473.9! 4.0! 1.9! 4.01 5.5! 1.91 3.8! 21i.2 4.032 Defense &Other !j. !33 ToW1 Oulasp 912.9! 1676.0i 123.2; 185.61 45.71 11824.7! 61.2! 49.5; 14.S! 134.9! 19.5m 120.1! 274.5! 20.0
34 Depreciatio 83.3 418.2! 143.8: 57.21 6.01 1200.3! 159.81' 44.6; 154f5.8 .2j 33.01 98.01 14.035 Waesm 371.7 570.0! 127.0; 241.81 44.9j 2220.0i 69.61 67.0 i 25.6! 299.9! 38.21 164.81 502.9 35.4-36 Odhw Wages 8.8 3.61 2.7! 5.21 0.51 31.0! 1.4! 3.11 0.7! -1.51 0L.5 1.41..L..3.4 0.837 ICokhoz Pay 23.0 558.71 0.51 0.01 1.51 593.91 3.21 0.1 .!38 Socda] SecurIty 36.6 57.7! 10.9! 21.3: 2.61 237.0! 3.9! 5.61 2.01 21.71 2.81 12.0! 36.5 4.439 KolkbozSo.Sc. 0.51 82.21 0.2! 0.0 0.0! 84.8:0.31 0.1! 0.2! 0.6
40 Net Prof14.1 368.41 57.01 161.41 11.3! 1803.6! 20.0; 11.9, 32.11 0.01 0.0: 0.0! 0.0 6.441 Bonus Wages j 21.21 62.8! 5.91 5.6! 0.2! 197.01 4.71 4.Si 3.0! 2.6! 1.3! 1.8 5.7 3.9
42 Turnover Tax 1361.4i! _____________
43 Net SubsidIes i 0.01 0.0! 0.0! 0.2! 0.0! -785.6: .0 0.01 o.oI0. 0.0 i -! 0.0[ 0.44 Othe Net lacome 0.0! 0.0! 9.71 0.0I 0.0! 47.8! Oi 0.0! 0.0' 001 0.01 ~ 0.01 0.01 0.045 Kolkiio Income 0.0! 378.41 0.0, 0.01 0.0! 361.3! ___________I__
46 PrIvte IncOme 47.0! 599.11 0.0! 0.01 12.21 658.3! 32.01 12.0: 0.0i 2-4.0! 3.0! 30.0! 57.0! 0.047 To1SILos -54.41 -65.0! *1.31 .2.0! 0.01 -171.4' -0.4, .0.38 1 ____
48 Net Foreig Trade T-2-03.3!1 -1870.0: 15.3! -1582.4 ! 491G N P i 630.41 2768.0! 350.31, -1385.0! 1 00.3 i 6060.1: 286.7! 143.8i 75.5! 412.0! 52.5! 245.i1! 709.6! 62.0SD Told OUtpu 1543.41 4647.2! 473.5J 670.6! 130.81 19467.2 347.9- 193.3 90.054. 7.0 365.2! 984.2! 81.0
__________o___ 0.0! 198.6! 0.0! 0.0! 22.8! 5673.9; 52 ToW Supply 11543.4! 4845.81 473.5! 670.61 253.51 25141.0- 347.9- 193.3! 90.0! 546.9i 72.0! 365.2 984.1! 81.0
91

Moldova 3:1987 Input-Output Table in Purchasers' Prices-SNA Format
____________ ____________ ____________ ____________ ______ _____ ___________Page 3
29 30 ! 31 32 33 34 as i 36 37 38 39 i 40 i 41 42DaBs" Stale I TOTAL!1 Defense: TOTAL House. -/- I -/- !G0vern. Defense TOti linvn.Net G N PIIluor. iAdmIin. SERV. i &Other;OUf-LAY holds Paid Free I & Other I Flxed i ExportI
lI Power [0.11 0.31 60.41 0.0; 274.0 55.8' 55.8: I _______ 0.01 0.01 0.? 5.82jPev*-as 0.31 1.21 41.41 7.8. 497.5, 63.6i 63.61 ________ 8.2: 0.01 71.8
3ICoa1 .1 0.21 20.3: 0.11 131.7; 17.0: 17.010.0 f 5.! 0.00 11.2410Oher Fuels I1 0.Oj 0.01 0.0- 0.0 0.0: 0.0! 0.0' ' !0 0.01 0.0 0.S Ferrols Meas I 0.01 0.01 3.81 0.11 375.5; 1.5; I.5JT 0.01 0.11 0.0? 1.66 -w ef 0.01 0.01 0.4! 0.01 158.81 0.0? 00 '1 0.01 2.oi 2,TF 0.0o 2.27 he1o 0.31 1.21 43.91 19.21 640.6! 119.51 119.5' 1 0.0? 29.81 0.0! 149.38 MDMW 0.21 0.8! 43.3? 179.91 1241.31 417.2: 417.21 1 981 .5 i 114.41 0.0 1513.1
9,Woo & Paer I 0.11 0.6[ 13.0i 0.0! 390.5' 171.51 171.51 15.91 -9.0! 0.0 178.4lOoasir. Maweri" 0.11 0.11 11.4; 0.01 612.51 63.5; 63.51 I0.0? .42.31 0.0 21.21 1 Ight Lnduauy 0.11 0.31 28.4? 3.7 i 1310.2! 1419.31 1419.11 I IT 1.41 -8.1! 0.0 1412.412 Food Induau 0.0! 0.0! 88.6i 0.41 1499.8! 1586.3, 1586.3 I 0.01-265.11 0.0 [1321.213 Odher Industry 0.21 1.0? 28.11 0.0; 449.81 123.21 123.2? 1.31 32.3, 0.0 [I56.8
141TOW ndustry1.51 5.71 373.01 211.2: 7582.4! 4038.2: 4038.2! f i 1000.11-143.31 0.0 [ 4895.00.0 0.01 0.01 0.0! 0.01 '11S43.41 0.0? 0.01 1543.4
16JAsrl. &Foruay I 0.91 0.1! 19.01 0.01 3215.2! &50.Sj 850.5! 34ii4T I 92.3? 251.51 0.0! 1228.617 ProductlonT &C V 1 oiF 0.0; 413.1! 0.0? 0.0! 60.4!1 0.0! 0.0? 0.01 60.418T ID 0.Oi 0.0! 670.61 0.0? 0.0 I 0.01 0.01-1870.01-1870.019 Otha Prod.Ssco, 0.41 1.91 12.2! 0.0; 84.91 64.11 64.1!1 84 1.1 00 120 ma1DeUa 1.91 7.71 404.2! 211.2: 11966.21 4952.7; 4952.71 0.0V 9481 .0? 2644.19 7.01-1870.0? 5918.621 Haan-ounI 0.8!1 0.7! 5.71 5.6i 111.4: 218.61 220.31 98.31 14.11 3.81 3-22,N-Prod. Tranport 1.2? -2.7? 14.4. 2.5. 78.3! 129.41 129.4! .? 00 12.51 -26.9? 115.023 N-Prod. Communlc. 1.0' 2.3! 7.2, 1.0. 8.21 37.8' 37.8? 0.0! 34.81 11.9 .- 2.71 18
24JEduedo 1 0.41 0.0? I.6. 58.1i 488.8: 39.61 449.21 0.01 0.0 4.....25!CuluzrI 0.1? 0.0? 0.41 15.1? 56.9? 22.91 34.01 0.0! 0.0 ii156.9
J61falh e 0.3; o.oI 1.2; 46.2! 319.0 69.11 24931.090. 027Jdu.. ul & oWh! 0.8! 0.0? 3.21 119.41 864.7: 131.617311 00 0.0 1 864.7
2813a cece0.01 0.0! 3.2!1 78.71 0.0! 0. 00 38.1!1 86- 6. 2.3
29 flanking & Imnsance I 0.0! o.oi 0.8' 121.5; 42.31 42.31 0.0! 0.0? o.oI I__ 15.0 57.330 State Admin. 1 0.01~~~~O-O 0.0, 53.6i 53.61 0.0? 31.1! .o
3 ISeWmwOutIas 3.8i 5.71 34.6: 9.21 i 517.6. 1346.4; 515.0! 831.4! 118.1! 56.81 0.0! 0.0? -7W0i442.332 Ddefes & Otber 1 .' 00 00 . .? 0.01 0.0: 446.3!1 __J 4
33 Tota Ouay~ 5.7! 13.4? 438.81 220.3? 12483.81 629.2 5: 467.71 8 31.4? 21.9! 503.1! 2644.1 97.01-1949.01 7807.1
34 Dpretdm0.3! 1.7f _3_33.8 7.7!1 1541.8!1? -- - -
35 Waeso 12.1 62.3! 774.9: 16.61 30114 -.
36 Other Waies 0.5 1.3! 11.2i1 4.01 57.41 !__ _ _ _ _ _ _ _ _ _ _ _ __ _ _ _ . - __ _ _ - - - -
38 SWWSecwtty 143 6.0! 59.3! is?1 297.8' 1
40INet Profit T 443 0.0! 214.7? 186.2! 2204.5 I
421TUGOW T I I0.0! 1361.4 '
43INetSubiadies 0.0k 0.01 0.01 I -785.61 : I.- I-44Othier Netluco0e 0.0! 0.01 0.0? 47.8: 45 Kolkh boznc. , 1 361.31 ' I I
46 Pdft i0 0.0 OI.0F 759.3147 TOU Loel -0.71 121 4l NotFotep Trade I15.0! i 15.0: '-1567.4 j 490G N PT 173.11 71.31. 1521.0! 226.0! 7807.1 ?
SOITO Omm 163.8i 84.7' 1944.8: 446.3i 21858.3! _____
5673.9; ?____ $21OW OP*163.8: 84.71 19448. 446.3 27532.1. . T _____
92

Moldova 3: 1987 Input-Output Table in Purchasers' Prices--SNA Format
Page 41 43 1 44i Export O TOTAL
Power 12151 4SI.42 _Petn _GaS 0.0 56933ICa 0.0' 142.941 Other Fuels I 0.01 0.05 FerroWS Ibtu $8.71 435.86 N-Fen%w ual y 0.01 161.07 ChemIcal _ 197.91 987.88 MBdMW 971.71 3726.19 Wood &per 1 102.91 671.8
10 CoDr. dautital 71.41 705.111 USht lndutry 1074.S! 3797.112 . Od Idusry |22284 5049413 Other Industry 1 149.81 7S6.414 Total ndsy I 4976.8: 17454.2IS Cossucuion I 0.0. 1543.416 Api. & Fo0nery 401.9: 4845.817,Producion T & C 1 0.01 473.518 T & D 0.0! . 670.119 OuerProd. Seco 7.S1 153.620 Mal uuIuIOua 5386.31 25141.121 HoUfing-Communal 347.922 N-Pnmd. Transpor t 193.323 N-Prod. Communic. I 90.024 EduCation | 46.915 Culture 1 12.026 Health. et- . 365.227 Edu.. CLt. & Heult; 1 984.12 SCRe _ 1 - 81.029 Bakag & -mm"; 163.830IState Adnin. _ 4.1
31 iSav rm I 0.0 1944.932 IDefeSe&OUr 1 - _ 446.333 IToW Ou S386.3 27532.1
34 DepodatWo 35 WSaXsa _ _ 36 ChherWaIe 37 1 adCZ PayI38ISodal Swety391KUdhoz Soc. Sec. I_40 Net Prfit j__41 Beous Wags !_;42 TurreTax Tax43 Net Subixdies44 Oher Net Income45 Koakh=income !__46 PraW Income ,47 Toa Lss 48 Net For, T _T e4910 N P__ ___
51]ipo-5211mX sup,Y* __ _9
______________* ~~~~93

Russia 3: 1987 Input-Output Table in Purchasers' Prices--SNA FormatMNiion Rubles. Cuffent Prices
page3 2 3 ,4 i5 6 7 8 9 i10 11 12 13 r14
Power Petro- Coal iOther Ferr. N-Ferr. Chem. iMBMW Wood COa. i- I ght Food 0tGas Fuels Metals Metals Paper Mater. In
3 Power 220.0 3506.3 244.0. 9.31 849.3 1094.0 2556.0, 3069.9i 628.91 9643! _454.6- 509.1' 40.2!Petro-Gas 6212.8 11304.9. 40.8 11.6 1081.8 528.2' 21836.6 1711.3. 735.7! 1366.5; 3 37.5! 779.11 21-,
3 1Coal 2136.6' 0.1, 2239.6 0.8 1644.8 72.5 25.0- 163.0. 117.217 167.6; 37.6! 110.2 214 1Otther Fuels 1347.7 0.0 0.4 23.4 0.4 0.0 5.2. 7.0: 8.51 15.1! 2.0' 0.4. 1.01
_5;Ferrous Metals 62.5 63.6 94.1' 5.2.105O52.9. S15.8 785.6: 12809.1, 338.8. 1536.0 47.0: 191.5-6 N-Ferrous Metals 124.4 10.4. 1.2 0.5 3479.7 11450.4 762.0, 7503.61 28.7. 73.9- 21.9. 83.07! Chemicals 82.8: 433.5: 164.4 8.3: 350.2 420.9 13322.3. 5983.2- 1119.41 684.41 3046.9j 497.9'8 1MBMW i821.5. 286.5- 372.0; 16.7. 1133.0. 586.6: 1261.6: 56923.9! 1113.7i 634.5i 398.81 699.5i9 Wood & Paper 28.0' 26.6 227.0; S.0. 112.6: 114.6. 1060.2; 1935.41 9458.5' 449.0 269.41 970.31_A
10OConst. Materials 32.9: 17.8' 46.Oi 2.1li 47.6: 71.3. 218.2! 876.71 271.7, 4542.41 44.21 211.21II Llght Industry 33.9 34.0 34.8 3.2 i132.8: 66.5 3175.3: 1453.9i 833.6! -193.4! 38868.5! 403.91 79312 Food Industry 20.1: 25.7 4.2; 0.5. 28.2 24.5 713.9 216.11 52.41 45.Si 280.31 25986.11 110.I13 Other Industry 233.7 42.8' 63.9' 0.4: 41.5. I15.0 506.5! 522.3 77.0- 100.3, 99.8! 554.1 1 1741E14! Total Industry :10144.0. 13752.3 3532.5- 87.0:137454.8- 14960.3 24581.5;1 93175.4,14784.1 10753.0; 43708.71 30996.3! 656]
I lSIcoasucton 0.0 0.0. 0.0. 0.0. 0.0.- 0.0 0.0 0.0; 0.0. 0.01 C. .0 I 0.0! 0.0,i Ar.& FOMrey 0.7. 0.1. 0.6: 0.2 0.7 1.2 29.5! 88.3 i705.7 i 2.1 4829.1 1 5489K.8! 4093.4 6464:
17 Prducation T : 754.0 3437.6 301.9 60.15 9351.6 860.0 21113 52.124.5] 62937i112.1 38.41 881 5865427.0 13862425I Culture 165 310.6; 65.8 0.0' 209.1 718.9 245.1, 103.4! 713.8! 8.4!8 203.7! 114.9! 5940.726 Heath. etod. Setr 558.5 612.0 24.10.1; 713.4. 167.61087.01 472.7 4911 30.0178.41 919 128.7!42.81 1087.420fEduc.. Cutl&Haly . 15033.0 28700.30 561.8 05.82.0183.18 1726.1 28423.3. 90208.3i 191635 1728.9 5418.8!110657.111954.71!12714721 HosilngCoe m :a 873.9: 269.2: 11.5] 0.8 530.8. 123.1:27~ 92. 3019.6; 24.31: 38.4 25j.31 331.2! 0 2.8!678.6122IBNkPlnd& Tnsportnc 224.6. 182.6 154.9: 0.1! 47-.0 32.9. 57.3! 64937 32.31 69.7! 119.0! 790.1 33.9! 1842.723INtProd Cdommic. I 0 . .. 00 : :0. :. I . . . .1 00 0.0C.
31Servce utly M44. 3105.9 201i.0 1. 97.7. 532.1 62.5! 4037.81 1383.1 28.71 4571 134.9 154.91 100.326Healthe &etc er 5- 120 41' .; 14. 6. 70 3S I 91 00 8-1137 I.1 08.033]Tuom ClOtL a eal !!077.7 2805.0.' 606.8015.62 126.1.5 1642.8 2205.0. 108039194711,765.7:i 1874.8:10317.1;154.11 42215.7
34!Dcepreclto 414.6' 5685.7 199.2 0861 25658.7 1388.6 431.6! 13432.3] 314.11 278.51 153801 318.9! 142.3! 45028.435 WBageis rne 120.3 659.2: 159805 87.4! 227.6. 166.8 2713.; 26851701 5356.61 3477.7 5063.9! $924.6 31 1842.3!5702
36 avc Other layes 4437.3 425.9 05.70 2.0 527.3 602.7! 63.6S! 6078.! 183.31 2687.4 645.9! 1001.1! 33.59 14304.0
331TolhOuPay 307.8: 205.0. 606.0: 05.621210.0' 069.0. 205.07 2703-01.5! 71120.! 2.5! 84046 135.3!212085.9612156.7
38 Soprciateuito 4177.4: 5116-.3 199".2.12.71 2515.3 2029.2 4185!6 1462.3; 3174.51:7a 414 6382.61 5086.2i13462.317627.8139 Kolkhos Sc. Sec. 202.3: 0S.0! 90.0 .0 .. 0..6.365.8!2.; 57O 116.5!i 247.71 1W.81 152.7 184.2 6758.5
41 Bonus Wae86.6 1507344 65 2227-.0 1.3 328] 928! 067 200 4.9 326.5i 177.51 5587.1420turoer Wages 1373.2 82011. 07.0 0.0 86.4. 332.7; 231240 6872.!299 193 684 15.13.21 55361.94 6.9437]Net Pay ides 0.0 . 0.0 -37. 0.0! 0.0; 0.0. 6-15.0 -340.2 10.9! 02.01 10.01. 135431. 05.0 -3872.44 Ncil ecrtIyo 07.0. 3362.0 519.5 12.7241.9. 117.9 47.71 406.0 07.0- 486.0] 0.0;6 5482.0 04.0 4011.239 Kolkhos IncomSec. 0.7: OO 0.0] .0 0.0: O 0.0 1 0.0 15 1.4'1 45.4 4.41 10.7 -162.01 46 751.4
47 Tota Lrossis -01528.6 362.4 1350.8 -26.8: 582.03 47-761.5 8-1333-7416.2 -362.4! -778.2 -707.3 61-96.0 1575.3 -2071.441 BnetFrisn W rades 168.6 13-O34029.3 536.7 23.9' 197. 51838.4 380.3 683.:9 502.83072! 0.6 1639.7. 1765971 102.4. 20987.749 G Nve Pa 10732.4 016.4 2288. 18.3 1267.0 7044.6 21422..884.0; 8711 2026.0 101497.5! 36852.41 21334.9; 6294.42264.
50!Toml Output 23659O.8. 5404027.6. 89. 31.0; 314.91 257.8 43095.0; 81409.2357 .32775 -17040.;17023034.18986.0138729160951 w Neot 469 .8 31235.0 48.: 45!85.5 2688..9 17.9 47094 .01 087 207.7 1287.9 243.6j 5219.6! 384.8!41195.2
45 Kon3o Sncome .23960 66.7! : 937.8: 30.54019.4 28064 5409.0 2239.9. 34647.9 2943.41 10037.671 16.020846.S 7951.494~~~~~~~~~~~~~~~~~~~~~~~~. .

Russia 3: 1987 Input-Output Table in Purchasers' Prices--SNA Format
I 15 16 1 17 1 18 119T 20 ,21 i: 22 23 i 24 i25 I 26 i 27 28___________ ~Constr.: Agricult. T & C T & Di OtherT TOTAL Housing: Transp. Comm.. Educ. iCuWt. i Health !Educ. & Science
_____ ______I i~~~~~~~~~~~~1Prd. PROD.! i Health II Power ~~713.11 717.0! 15S9.71 S84.5! 20.91 16145.11i 978.3: 385.6' 85.5; 438.91 53.2; 301.6: 793.6i 607.4
2 e 1Gs1477.11 17S6.3; 4626.51 162.8! 170Oi 34347.21 437.3! 1724.71 80.11 210.51 25.51 144.611 380.6! 331.8a CoalI 11111 54.51 207.4! 104.3! -86.6i' .i 79. 3.: 2.1 78 279 00 7.:".14
r 4 Othr Fuels30.41 79.41 2.01 2.2! 0.0. 312.2! 7.1! 0.31 0.11 4.4!i 0.ji 3.01 7.9! 2.75.FenousMetals 5081.5! 86.51 1497.7 16.7!j 0.81 32423.5! 75.2: 36.0! 3.61 9.0! 1.11 6.21 16.21 856.66 N-Ferrous Metals 157.01 3.51 16.8j 3.61 0.61 22183.41 3.71 5.4i 0.6 5.5. 0.71 3.81 9.91 876.1
7 h fb1690.0! 3369.8, 745.21 109.2! 19.7! 32726.1!i 260.61 231.4! 27.71 90.81 82.2! 1053.5! 1226.51 950.38 MBJW8336.01 4605.8 .1720.1 425.9: 27.0! 79776.4! 469.0! 661.4! 66.31 213.11 25.8;. 146.51 385.4' 6284.49 oo Pae 3523.3! 658.41 209.5!i 340 91 451.91 20398.6! 321.9j 45.01 13.61 147.3' 17.8! 101.21 266.31 417.3
ji ~~~~uia 11850071 457.51 420.71 192.6! 3. 622.6; 296.6: 30.91 5.81 88.1i -.0.71 60.61 159.4 _301.5I Sh dty 477.21 352.1! 200.3; 285.51 70.4 45410.0, 216.5! 70.2! 15.8i 500.1' 60.61 343.71 904.4. 2,86.112IFoodlIndus"r 1 64.31 3831.01 11.11 394.5i 1.3! 32800.8. 98.6, 63.01 0.31 2033.0! 252.71 1486.01 3771.7! 62.713 1Other Indusny J171.7! 6642.91 163.8! 179.11 575.1!i 11735.2! 217.5! 81.3i 7.0! 259.0 31.41 178.0- 468.3! 289.8,14 Tooal Indusuy !40276.8. 22767.5! 9969.6! 2784.0! 1189.71 361479.3: 3821.1i 3355.4; 314.2! 4247.5, 592.2! 3998.8;. 8838.5111315.215 Czanauctlon I 0.0! 0.0! 0.01 0.0! 0.0! 0.0:. 16 Agri. & Fares"y 12.1! 24807.2! 6.11 327.91 0.01 89795.8! 38.1! 2.71 2.21 397.3; 48.11 273.0i 718.4!- 20.417 Productlon T &C 18266.6 2288.8! 64.31 263.51 638.71 43703.1!1 18 T &D ]- 0.01 3237.01 0.0! 0.01 867.3: 27280.2!19 O1her Prod. Sectors 1473.27 261.11 177.6; 568.21 46.4j 3510.3! 42.21 41.31 9.81 113.2! 13.7! 77.8. 204.7 237.920 MateIal Ouftays 142588.71 53361.7:10217.7! 3943.6! 2742.0! 525768.81 3901.4 3399.4! 326.2: 4758.0; 654.0i 4349.6! 9761.6111573.5121 Housing-CommunaI i 553.51 291.01 430.01 471.2! 33.6! 4644.81 57.11 40.5! 32.31 46.9. 12.61 29.5; 89.0 38.222IN-Prod. Trampont j506.0! 383.0! 209.4j 172.8' 40.41 2373.8: 91.8: 72.31 27.61 174.7! 47.0! 126.6! 348.31 1. 23.523 N-Prod. Communic. I 0.0! 0.01 0.0! 0.0! 0.0! 0.01 10.1! 10.9! 19.61 61.71 29.0i 42.01 132.71 99.224 Education 279.3! 296.5! 300.71 102.11 11.11j 2344.1!i 21.8! 19.2! 11.6! 0.0 1 0.01 0.0!i 0.0! 0.025 CWultr 64.21 65.21 66.2! 23.51 2.41 527.2!! 6.21 5.5! 3.9! 0.01 -! 0.01 0.0! 0.0! .26 Health. etc. 240.0] 231.3! 234.6, 87.9! 8.6! 1889.8 i 18.0! 12.71 8.9i 0.0! 0.0! 0.01 0:0!: 0.027 Educ.. CuWt. & Heals i 583.51 593.0; 601.4; 213.51 22.21 4761.1; 45.9. 37.41 24.4' 0.0! 0.0! 0.01 0.01 0.02a,Sja ________ 698.5! 260.71 261.41 63.9! 6.5i 3073.6; 6.7j 8.81 17.2: 0.0. 0.0! 0.0. 0.0! 507.029 IBanking & Insuran i 500.9! 264.71 221.3! 1653.3! 9.31 4492.2! 20.0: 23.91 30.8: 0.0! 0.0! 0.0! 0.0! 10.03OIState Adnhin I 0.01 ! ______
31 lSenmr*Odaya 2842.3! 1792.5: 1723.5! 2574.6! 112.0! 19345.5: 231.6: 193.8! 151.9! 283.3! 88.5! 198.11 569.91 777.932 Defense &Other I 0.033 Total Outy 14S430-91 55154.2111941.2: 6518.2i2854.0: 545114.2! 4133.0' 3593.2! 478.1! 5041.3: 742.5! 4547.7110331.S 123 1 .4
34 Deprecafton 7442.6! 11203.3!11573.81 3088.71 271.6! 78608.41 9243.1! 29S2.9! 805.6! 2734.7! 288.2! 1532.1! 4555.01 2748.635 Wage 2584.0! 14579.3jl0l09.2i10685.3:! 234.01 120267.9; 5404.5! 4608.01 1524.7! 10836.11 1700.5;i 6944.0 i19480.61 7312.836,Odher Wages 690.01 182.8! 223.31 115.51 21.51 2637.1! 123.51 171.5f 44.41 41.01 26.4! 66.Oj 133.41 165.37 Kolkloz Pay 1324.8! 8907.01 25.Oi 0.0' 88.01 11001.6! I i1281 521741 13138 SocIa SecurIt 305 771.9! 1010.71 754.8j 185.41 13386.1: 307.41 387.7! 120.4! 784.31. 124.6! 505.4i 1414.3! 911.239 Kona= Soc. Sec. 731 89.i 20 0:01 10.j 985.71 1 8:71 1.6i 13.1 234!132.
40 Nt Pofi 1151-8 657.7i 14015 j 16361 1045:1109705.6! 1221.8! 1197.4! 2249.4' .! 00:12.41 Bonus Wage :1657. 1309.91 514.61 1067.8! 17.3' 10154.71 361.21 452.4; 177.0! 99.9! 52.1! 69.6! 221.6' 797.242,Turnover Tax I 0.0! 0.0! o.ol 16.8! 0.01 55378.71 43 Net SuheldIs 0.0 0.01 0.0! 0.01 0.0; -38722.0:44 Othe Net Income 586.1 0.01 839.5! 1974.01 0.0; 7410.81; 0.0; 0.0! 0.0 0.01 0.0 0.0! .! .45IKokhozlIncome I 0.01 5061.41 0.01 0.01 12.01 5022.0r,_= 46 Pstvate Income 826.9 19018.0i 0.0; 0.01 819.1'I 20664.0;i 2050.0: 850.0! 0.0; 950.01 150.0! 1500.Oi 2600.0147 Totakl Losses -3516.0! -1466.7! .172.2!1 -36.7! -4.6! -7267.6, i -37.2, -23.8' 41 Net Foreign Trade I 0.0! 7997.3! -70.0;141284.0' -166.0! 70043.9: '49 G N P 47789.1! 73712.9'33942.7!62046.0- 4687.4! 449122.2! 18350.31 10130.31 4720.71 15578.51 2358.6, 10704.6.28041.74i12465.7SD Tota OUq, 193220.01120869.9145953.9127280.2! 7707.51 924192.5! 22483.3i 13723.5! 51I98.8 20619.8! 31 01 .1 115252-3:38973.2124817. 1SI hIport I 0.0! 8736.6! 0.0! 0.0,1059.0' 129550.2! I I!
52,TOW Supply 193220.01129606.4'459S3.9; 27280.2: 8766.5 1053742.7 22483.3,13723.5! 5198.8! 20619.9! 3101.1115252.3:38973.3: 24817.11
95

Russia 3: 1987 Input-Output Table in Purchasers' Prices-SNA Fonnat
_________ ______________________________________ _________________________PPage3
____________ ~29 i 30 I 31 !32 1 33 ;34 i 35 i36 i37 38 139'i 40 41 21
__________ ~'Bank&' Stgate I Toal iDefense: TOTAL I Hogse- -/ / Goverm.:Defence i Total ,Invent. i Net I GNP___________~ Im. r Ad-ain.Iervicea,& Other .OUTLAY i holds Paid Free I !& Other: Fixed I i Expon I
I Mower ____ 841 33.41 2892.2.o 0.0, 19037.3 2493.9 2493.9; _______ 0.01 0.0; 0o.o2493g2Pein-Gas i 20.51 81.8i 3056.8. 855.2' 38259.2. 1877.3;, 1877.3 0.01 -61.2, 0.0: 1816.13Coal 2.8 11.41 977.8; 0.0: 8176.2: 149.7: 149.7 ______ 00 76 0.0, 177.3
4 Olhe Fuels 0.li 0.2i 18.4i 0.0. 330.6 32.5i 32.5; I_____ 0.01 .25.1! 0.0 7.45 Ferros Metals -i 0.41 1.71 989.71- 7.11 33420.3; 50.6, 50.61 T 0.01 -42.61 0.01 8.16 N-Ferrus Metals 1 0.31 0.21 896.0 0.0; 23079.41 0.0' 0.01 I 0.01 458.01 0.01 458.0
L7Cheoas £.8 59.21 2770.5! 2182.4!! 37679.0! 5432.8! 5432.81 I! 0.01 170.31 0.0! 5603.28 M5IMW I6.71i 26.8! 7900.0! 20207.2!: 107883.6i 16836.6 16836.6; iL______ 65172.1; 30.81 0.01 82039.59LWood &Paper I6.1 1 24.31 1094.51 0.01 21493.11 5417.2' 5417.21 ______ 825.21 -162.41 0.01 6079.9
fTh[coast. Materials 1.11 4.51 799.8: 0.01 26822.4: 1 465.1 I 1465.1; 1_____ 0.01 -531.41 0.01 933.7II iLight ladausty 1 5.41 21.41 1519.8 3733.7.i 48663.51 44415.5: 44415.5 T 418.31 -921.6 i 0.01 43912.1,12 IFood Industry I 0.1! 0.21 3996.6, 1332.9: 38130.3: 85865.5, 85865-Si - - 00.538 1 0.0~ 85271.7
131 the lnwmy 19.81 79.41 1163.11 0.01 329.152.;52.! T i 81.61 178.11 0.Oj 5485.614Tu Ij my 86.31 344JI 2807S.2: 26318.61 415873.11169262.4'169262.4; I ]66497.2 j1-473.2! 0.0i2342-86.4ISICovsuuctuon I I I 0.0 0.0! 0.0! 0.0: 0.01 II 93220.:0! 0.01 0.01 93220.0161ApI. & Forestry I0.91 3.61 786.3; 262.41 90844.5! 30598.8: 30598.81 1119.11 12503.81 3800.91 0.oj 38022.6i7IProi1FiT& I i .i 0.0; .o 43703.1; 0.0! o.o: 2380.8. 0.01 0.0! 0.01 2180.8.38 T &D I 0.01 27280.2! 0.01 0.0! I i 0.01 0.0141284.01 41284.019 Other Prod. Seda 23.71 95.0! 654.6 0.0! 4164.9, 3079.3. 3079.11 ! 136.5i 161.0! 0.01 3376.620 MaterIa Ouftays I 110.9! 443.11 29516.1 i26581.0- S81865.9:202940.3;202940.3! i 3299.9 1162357.5L 2488.8141284.01412370.521 Houuln-Commuual 1 53.51 21.51 332.11 68.1 i 5045.0' 15757.6' 7779.6! 7978.01 1252.71 428.0! i i 0.01 17438.322 N-Prod. Transpon 1 77.11 90.71 831.3 29.0! 3234.11 7776.9. 7776.9: 0.0i 0.01 2087.2: i 625.31 10489.423 N-Prod. Commuaic. i 45.11 62.51 380.11i 10.31 390.4; 1970.6! 1970.61 0.01 1397.01 1049.41 1 391.31 4808.3.
24 Education [ ~5.71 0.01 58.21 12402.3: 18217.6; 1604.4116613.21 0.01 0.0! 0.0! 18217.6
2SCltr 151 0.0 17.1L 544.3 i 2556.8. 1316.6! 1240.21 0.01 0.0! i 1 .01 2556.827Ednc.Cnh&Healt 524 O-Oi 44.8! 1934.6: 13317.7' 3580.5, 9737.2! 0.01 0.01 0.0! 13317.7
27 Edmcul &Heath 12410.0 120.2' I 4881.3: 34092.1- 65015.527590.61 0.01 0.01 T00 49.28 Scieuc I 0.0:! 0.0' 539.6 3613.2: 0.0, 0.01 0.01 5043.7; 14556.01 j4 1604.2! 21203.929D,rnking & nswanc 0.0: 0.01 84.71 4576.9i 19469.9 1946.9! 0.01 0.0; 0.01 I j1860.0!i 380.930 Sate AdmbLn ' I 0.0; j 0.01 2807.1 2871 .! 880 .0 0.0[ 4655.131 SeYide Outly 188.1 3174.8! 2288.0 107.4! 21740.91 64351.2: 28782.6:35568.6, 9541.4118120.61 4480.8~ 96494.0
32DefenseOtherI 00 00 141752.4; .1 O.0.41752.4
33IToto Oa" 1299.0! 617-9 31804.1,26688.4i 603606.7:267291 .5'231722.9 35568.612841-3: 59873.0:162357.5: 2488.8 4576.4.8!550616.9
34 Deprecation 52.11 294.91 20652.21 1183.6i 100444.2 I
35 WagSW 786.61 3469.8; 42587.0:11772.71 174627.6. I
36 Odher WAges 23.81 59.21 721.3! 801.0. 4159.4;37 Kalkhoz Pay t I j213.41 11215.0; ,-
38 SocIa SecurIt t71.2! 213.31 3425451 1306.7. 18118.3' Il-
39,Kolkhos Soc. Sec. [ I 23.41 I1009.11 i I '
40 Net Profit 15291.11 flfl! 11287.3: 0.0; 120992.9 : . 111 -41 Bomns Wages j 205.21 0.01 2214.61 _ _' _12369.3142 Twuover Tax I I 0.0 i 55378.7' _____
3NotSubildies I ; 0.0 '38722.0.~1 441therNet ncose :0.01 0.0' 0.01 1 ~7410.8. 1
456Ikn c utom e 5I 0 1 _ __ _ __ _ __ _ _ _ __ _47TotalLouea ~~ ~~ i 52636.0:45 lCctelko ncome T I 0.01 . 52216.01 47 Total Lam i ______6______ -7328.61 1
48 Net FcrelpTrade 11860.0; 1860.01 71903.9: !490 N P 808.81 4037.2; 837'1060;550616.9' ______I .)
50 Total Ouput 16523.814655.1 116343.7:1415064. 082319.7
S2ZToldISLvLI -6523.8'4655.1!116374.9'41752.4'1211869.9 ,I
96

Russia 3: 1987 Input-Output Table in Purchasers' Prices-SNA Format
Page 4________________ I 43 44_______________ 1 Export iTOTAL
I _ I X ~~~I 0USESPower 5 98.5i 22129.6
2 PcuGas I 16388.3i $6463.7
a cogi 1 1021.4- 9374.9_4 Dther Fuel 2.6: 340.5S Fefrous Metals 6771.0 40199.46 N-Ferrous Metls 4527.1 28064.57IChemica_ 10766.9. 54049.18iMBMW 36272.9 226196.09 Wood & Paper 7074.91 34647.9icoasu. .Materials 1287.31 29043.4
r IIf t lndusl 1 7801.9; 100377.512 Food Indusvy 3792.9. 127195.0
113 Othe Indjry 2450.2. 20834.1
E14 TotW Industry 9875s.91 748915.5IS Construction I 0.01 93220.016 Apt. & Foresny 739.31 129606.41 70.01 45953.918 T & D | 0.01 27280.219 Otc Prod. Scuns I 1225.01 8766.520 h5aterki Outhys 100790.3.10S3742.621 FHousing-Counnunal 22483.322 N-Prod. T por_t _ 13723.523 N-Prod. CommUnic. . 5198.724 Educati i 20619.92S Culnut . i 3101.126 1 5252.3
27IEduc .. Cult & Health!. ... 38973.328 __ _ __ _ _ i 24817.129 Bankins & Inhrsnee I 6S23.830 State Adain. i I 4655.131 ServcO Outays 1 0.01 116374.932 Defense&Oher Oi 41752.433 Tota Outlays 100790.31 1211869.9
34 Depreciation 1 35 wages
i6 Other Was37 Kolkb Pay 3S Sodalsecurity I 39 olkhos Soc. Sec.40,Net Profit411 Bos Wages ,42 Tuver TaX I43 Net Subsi-is44 Other Net Incme j45 KkhQoz ncae T46 Prttte e :47,Total TS f|
48 Net Foreign Tmde ___
49GNP N_ PS0IT tOu C I j
S2!Toal Sup -
97

Tadjikistan 3: 1987 Input-Output Table in Purchasers' Prices--SNA FormnatMillion Rubles. Current Prices
____________________________ ~~~~~~~~~~~~~~~~~~Page 1
I I 2 3 1 4 15 16 i 7 I 8 i 9 j 10 1 1 2 I - 13 14Power; iPetro- ICoal 1Other[ Fefr. !,-Ferr.: Chem. M BMW 1 Wood Constr.; LUght Food -Other iTotal
* Gas Fuels MetalsMetais, I Paper iMater. i I ndl. IIndustryI ;Power 1 0.6' 0.3, 0.2 0.0, 0.1 S3.8: 12.3' 10.21 1.6' 7.8i 11.51 6.7! 2.1' 107.42!Petro-Gas 126.8.: 4.41 0.1: 0.0-O 0.1i 28.91 6.4: 6.91 0.8 20.9: 3.8: 6.9i 0.7; 106.8-31Coal I 0.01 0.01: 0.41 0.0; 0.0' 0.21 0.01 0.21 0.01 2.0. 0.1 i 3.21 0.0! 6.14 Other Fuels 0.01 oo 0 01 0 0.01 0.01 0,01 0.01 0.01 0.010.; .0 0.01 0.0' 0.0' 0.0SlFerrous Metals I0.21 0.11 0.11 0.0! 0.61 14.21 1.41 75.5 1 2.41 20.41 3.9! 1.0! 0.21 120.06IN-Ferrous Metals 0.0; 0.01 0.01 0.0: 0.0; 193.3. 2.11 24.31 0.17 I.2 0.11 0.6i 0.61 222.27 Chiemicals I0.71 0.1 ; 0.2: 0.0; 0.01 7.2: 91.5! 29.61 3.41 4.11 89.91 5.81 3.11 235.58 MBMW I 2.l.1 0.21 0.41- 0.01 0.0; 14.81 13.11 166.0; 6.1 i 8.7 i 10.4! 8.81 2.11 232.89IWood & Paper ! 0.4 0.01 1.31 0.0! 0.01 1.3' 3.5, 6.5i 48.01 3.31 4.51 12.71 0.6! 82.1
T0 o]zw~. Materials ! 0.22 0.01 0.01 0.01 0.01 0.41 0.61 2.31 1.8; 80.41 0.91 5.8: 0.2! 92.71 1 lght lndusuy 0.11 0.01 0.11 0.0: 0.01 1.31 3.31 4.2! 5.81 1.2! 846.81 65.8i 3.61 932.412!Food Industry 0.0: 0.0! 0.01 0.0: 0.01 0.41 2.91 0.81 0.31 0.71 5.1! 261.61 18.21 290.113 Other Industry 0.11 0.01 0.0 0.0: 0.01 0.11 0.1 i 0.8! 0.21 0.71 2.01 4.71 13.81 22.514OTotallIndutry I31.41 5.31~ 2.81 0.01 0.9i 316.1! 137.31 327.3! 70.41 151.41 979.1! 383.71 45.11 2450.8151lc o ntuto 0.0' 0.01 0.0; 0.01, 0.0i 0.01 0.0! 0.01 0.0! 0.0! 0.0i 1 o 0.0! .;1 0.0161A5r. & Forestry T 0.01i oo 0.01 0.01 0.0! 0.0; 0.0! 0.0! .0 0.0; 0.0; 8 88.0: 569.6' 39.91 1497.517 !Production T & C .0.5, 23.0! 2.51 0.01 6.7 i 4.91 12.81 26.91 9.31 45.5 i 12.81 17.7! 3.51 216.2181T & D 0.0! 28.41 0.Si 0.0. 2.31 0.8 1 21.71 35.01 10.41 5.01 57.51 129.81 10.01 301.519 Other Prod. Sectors1 2.4; -O 0.01 00 0.0; 4.3! 3.7i 0.61 4.9- 0.1!i 1.01 5.31 1.01 0.31 23.620 MatetIa OUlly 34.3i $6.71 5.81 0.0! 14.31 325.5! 172.41 394.2! 90.1! 2530.0 1942.6; 1101.8! 98.81 4489.521 Housing-Communal 3.81 0.2f 0. 0.01 o.iI 1.0! 0.61 5.9j 0.8! 1.0! 10.1! 2.7. 0.61 27.022 N-Prod. Transport 10.6! 0.0!1 3. OO 0.1 0.01 0.1 0.21 02 3lj 0.61 0.91 4.0! 0.5! 0.4! 10.623 1N-Prod. Communic. 0.0; 0.0! 0.0~ 0.0, 00! 00 0.01 0.01 0.0j 0.01 0.0 0.01 0.01 0.0
2.; 0.11 0.1: 0.Oi 0.0, 0.5! 0.3! 2.9. 0.4. 0.5!1 4.01 1.0! 0.31 12.32S Culture i0.9; 0.01 0.01 0.0! 0.01 01 0.! 1.4! 0.i; 0.1; 1.01 0.2! 0.11 4.026 ealh. tc.1.1! 0.11 06.0!- 0.0. 0.0! .1 03 2.01 0.31 0.41 2.51 0.8& 0.31 8.22~7Edc Cult & Heithi 4.11 0.2! 0.1! 0.0! 0.11 1.11 0.71 6.31 0.81 1.1 1 7.51 2.0; 0.7! 24.6
28iScience 1725 0.21 0.0; 0.0! 0.01 0.81 0.31 6.71 0.21 0.51 2.1 I 0.4; 0.0! 13.729gBanking & nswace T 1.2; 0.1! 0.01 0.0! 0.Oi 0.3' 0.21 3.7; 0.21 0.31 5.4! 3.5! 0.21 15.030IState Admnin. 1 i 'I
31 Servtcoutlays ;12.2! 0.71 0.31 0.0! 0.2! 3.4! 2.01 2S.71 2.5i 3.8: 29.11 9.2! 1.9: 90.932lDefense &Other .. ,
33 1Toul Ouiays 46.5; 57.41 6.11i 0.01 14.51 328.81 174.41 419.9; 92.71 256.8i 1971.7 i1111.0. 100971 480.4
43.31 14.51 2.9! 0.0. 0.6i 61.0; 41.71 58.8! 5.31 32.7' 43.41 26.91i 1-1.51 342 .435Wg 11.4! 1.91 8.2; 0.01 0.61 37.0' 25.51 123.91 17.8; 42.0; 136.9! 46.5; 14-3 F4-6i361 Other Waam 0.1; 0.31 0.11 0.0; 0.01 0.6j 0.21 5.I 0.2! 0.41 1.4! 0.61 0.11 9.03IKolkhozPay' .1 00 0.0! 0.01 0.0! 0.01 0.0! . 06 0.51 0.01 0.31 0.6[ 4.5
38 ISocIal Security 1.. 0.2! 0.71 0.0! 0.ii 4.1 3.81 15.11 1.51 4.81 17.7! 4.9i i.0f 5.391KO M soc see.0.01 -! 0.01 -! 0.0 0.0! 0.01 Of 0.3! 0.1! 0.1! 0.0! 0.01 0.1! 0.5
40 Net Profit 89.91 4.41 -4.9! 0.0; 1.5!- 4.6 3.1; 77.31: 7.2; 19.6! 186.1! 38.71 10.11 437.541 Bonus Wages 1.9: 0.3i 0.11 0.01 0.11i 451 2.21 8.21 0.81 2.9 11.01 3.61 1.0: 36.642 Turnover Tax i 15.6; 2.81 0.01 0.0 0.0 - 0.3! l.8; 5.41 0.91 3.21 516.81 231.2! 4.71 782.743 Net Subsidies ; .0. 0.01 -2.5. 0.0, 0.01 0.01 -6.41 -5.6 0.01 0.01 -152.31 -182.51 5.31 -344.244 Other Net lncoie 0.0! 1.9; 0.5 1 0.01 0.01 2.0: 1.01 0.01 0.0; 2.71 0.0 4.0! 0.01 12.145 Kolkhoz Income 1 0.01 0.1 0. .0 I 0.01 0.0 0.0! 0.0! 0.0; 0.01 0.0 -4.71 -0.11 -4.946 Private Income 0.01 0.0! 0.01 0.0l 0.01 0.0! 0.01 0.01 0.0! 0.0! 0.01 0.0! 0.0!; 0.047 Total I.eses -2.41 -0.8! -0.2! 0.0! 0.01 -3.41 -2.41 -3.5! -0-51 -1.9! -18.21 -15i -0.91 -35.648 1Net Foreip Trade i 10.7! 273.6! 6.3! 0.1! 134.6! -175.61 248.0! 579.01 133.51 32.41 -439.81 261.0, 65.31 1129.149 G1P170.6; 298.7! 11.1 i 0.1! 137.3; -69.31 316.3! 858.0! 3 66.61 136.3!i 292.0! 425.4; 112.21 2855.3
so WIoauwu 1 206.41 82.51 11.0, 0.0; 1 7.21 435.11 242.7 i 698.91 125.71 360.7! 2703.5; 1275.31 147.6! 6306.7$1 Import 71.71 293.6! 9.81 0.1II 137.9; 177.6! 335.31 804.3! 140.6! 63.8! 700.61 498.31 68.81 3302.4
52ITotal Supply 1278.11 376.1! 20.81 0.1; 155.2; 612.71 578.0! 1503.21 266.3! 424.51 3404.1,i 1773.6!: 216.4. 9609.11
98

Tadjildstan 3: 1987 Input-Output Table in Purchasers' Prices--SNA Format
_ ~~~~~~~~Cons;tr. IAgricult. I T&CF T &D i Othe i TOTA.L HouwnI Transp.I romt. IEduC. I Cult. IHealth iECLUc. &Science
_ _ _ I | Prod. i PROD. i I t Health II Power 12.51 7.7; 3.3! 9.1i 1.0i 141.2 8.3: 1.41 2.9 10.91 1.31 7.41 19.71 2.62 Petoo-Gaa 40.6i 31.81 58.6. 6.6; 0.3i 244.51 10.9! 30.61 0.71 4.4' 0.51 3.01 7.91 4.13SCol _ 0.41 1.6. 0.2 1.6' 0.0' 10.01 0.1 0.11 0.0 2.31 0.31 1.6i 4.11 0.14 Otier Fuels 0.1 i 0.0! 0.0. 0.0; OQI 0.1: o .o 0 0.01 0.0! 0.01 0.01 0.01 0.0O 0.05 Ferro Metals S0.6 1.0I 0.5 0.3' 0.0! 172.3; 1.3i 0.1j 0.01 0.11 0.01 0.1 0.2; 1.5
6 N-Ferrous Metals 8.1 0.11 0.1. 0.0. 0.1, 230.6 0.31 0.01 0.01 0.01 0.01 0.0j 0.01 0.17 Chemicals 27.7. 60.81 12.1. 3.1' 0.9; 340.1' 1.8: 3.51 0.11 1.71 1.51 19.61 22.8i 5.48 MBMW 103.01 34.81 13.8' 12.8, 0.9 398.1! 5.8 6.71 0.81 4.9i 0.61 3.31 8.8, 6.59,Wood & Paper 59.71 2.3i 0.91 6.0 4.7 155.8 1.0; 0.21 0.21 1.5S 0.2i 1.1! 2.8| 1.5
10 Coisr. Materials 295.21 2.81 1.8. 3.0 0.1 395.7; 1.7 0.11 0.0j 1.2! 0.11 0.81 2.2! 0.811 Lt Industry 5.5! 29.11 1.4i 10.0 0.7. 979.0 1.9. 0.51 0.21 9.9j 1.21 6.8j 17.91 1.012 Food Indus"y 1.3, 14.8i 0.01 5.2. 0.0 311.5 1.3; 0.0i 0.01 29.61 3.71 21.81 55.11 0.313 Other Industry 2.1j 81.71 0.81 4.6: 6.4 118.0. 2.01 0.5S 0.21 5.0! 0.61 3.51 9.11 0.9
141Totl Industry ! 606.8! 268.7: 93.4; 62.2- 15.1. 3496.9 36.4; 43.7! 5.1j 71.51 10.11 68.9! 150.61 24.8IS Comnructio; O.Oi 0.0. 0. 0.01 0.0 0.0 : j16 AgrL & Foresry I 0.01 224.8: 0.0, 2.51 0.0. 1724.9i 0.3i 0.01 0.0 5.41 0.71 3.7! 9.8! 0.117 Production T & C 1 43.9i 32.3i 0.2 1.2! 4.5 298.2; I
18 T & D 0.01 88.31 0.0; 0.0 2.3 392.1 i . 5 0i4191Other Prod. SectorsI 5.71 1.2: 2.61 9.9! 0.4; 43.51 0.21 0.71 0.0o 3.01 0.41 20 54 0.420 IM&W s O!a 656.41 615.21 96.3i 15.81 22.4: 5955.6i 36.9i 44.4i 5.1 80.01 11.11 74.7j 165.8 25.321 Houing-Coimmunal i 11.41 5l 2.3! 8.4! 1.2i 55.8! 0.9j 0.5! 0.6! 1.01 021 0.41 1.7! 0.622 N-Prod. Tramnsport 10.4- 7.2 1.1 3.1 1.5! 34.01 1.4 0.9i 0.5 3.9 0.8 1.9! 6.7 2.123 N-Prod. Commiunic. 0.0j 0.01 0.0; 0.01 0.0! 0.0! 0.2_ 0.1 0.31 1.4 0.5! 0.6 2.5 1.724 Educadon 5.8j 5.6i 1.61 1.9' 0.4: 27.5 0.4! 0.3! 0.3! 0.0 0.0! 0.01 0.0 0.025 Culture 1.31 1.8! 0.71 0.5j 0.1! 8.51 0.1. 0.11 0.1 0.01 0.0 0.01 0.0 n.026 Health, etu r 3.01 4.41 1.1i 1.0o 0.3i 18.0: 0.21 0.21 0.2 0.0 0.01 0.01 0.0 n
27JEduc.. CWL & Healthl 10.11.71 3.41 3.4 0.81 54.01 0.7' 0.61 0.6 0.0 0.0 0.0! 0.0 0.028 Science 17.6Mt 4.5! 1.41 1.9! 0.2! 39.4! 0.2! 0.2' 0.3 0.0 0.01 0.01 0.0 8.32*911ankig & Isrce 9. I 4,81 1.0: 29.91 0.3: 60.2! 0.21 0.1' 0.3 0! 0.01 ° ° 0.0 0.230 State Admin. .31 Serca Ou¢ays 58.71 33.71 9.2 46.81 4.1. 243.41 3.6: 2.5: 2.6 6.3 1.6! 3.0i 10.9 12.932 Dkefese & Other I i j33 Toybd Oikys 715.01 649.01 IOS.SI 122.6:i 26.51 61 ".0; 40.5S 46.9i .18.11.1 7.77_ 3 S.7 28.
34 Depredation 124.11 ISO10. 78.41 33.8! 4.11 732.8! 143.51 36.9; 9.91 33.0 3.51 18.5! 55.0 18.035 Wuaes 349.61 291.8' 91.0i 141.61 27.0! 1367.31 53.61 61.01 17.6! 364.1! 31.81 128.6! 52451 69.536 Other Wages 11.6! 3.81 1.4! 2.1j 0.31 28.2! 0.8! 2.3! 0.5' 1.61 0.5! 1.5! 3.6! 1.637 Kalkho2 Pay 6.71 405.31 0.8i 0.01 O.Oi 417.2! I 291 0.41 1.81 S.l 38 Socl Secuity 37.4! 15.7' 8.0j 9.9j 1.9! 128.81 4.81 5.1! 1.41 26.4! 2.31 9.4 3811i 8.739jBidkbce Soc. Sec 0.11 48.71 °-°1 0.01 0.0; 49.31 , I i 0.3i 0.1 j 0.11 O S
40INetFYcfi| 110.4P 10.!r 46.5! 82.8! 4.51 791.8i 16.01 15.4! 25.8 0.0! 0.0 0.01 0.01 6.441 BDonUS Wases 14.41 8.8i 3.2! 2.8! 0.0! 65.8i 5.51 5.81 2.0 2.81 1.31 1.9! 6.01 7.6
42TurnovrTax | .0 0.01 o .o: o.l; 0.01 782.8 j. i |43 Ne-t Subsidks; 0.01 0.0;, 0.0; .0 0.01 OO -344.2i 44 Oher Net Income i 0.0! 0.01 5.3, 0.0 0.0 17.41 0.0 .0.0! 0.0 0.0o 0.0! 0.0! 0.0 0.04S Kolkbz I"ncme- 0 .Oi 94.51 0.01 O.Oj 0.01 89.61 : I 46 Prvte Ineome 1 69.11 547.3! 0.01 0.0! 18.71 635.11 2601 11.0 00 21.01 4.0! 23.01 48.0 0.047,Toud Uses f -108.21 -13.81 -1.0; -0.8, 0.0! -159.4 -0.5 -0.3 I -
48 Net Foreign Trde 64.4! -1309.01 -6.5' -122.0; .__________ 49jG N P 1 600.71 1717.5 230.51 -1039.5i 50.0! 4414.71 244.7 131.2, 54.91 452.11 43.9 184.8! 680.81 104.2
SO5Test! OU1 1315.8! 2302.1! 336.0, 392.1! 83.11 10735.7; 285.2i 178.1! 62.61 538.41 56.61 26251 8557.5 142.451 Import 0.01 145.31 0. 01 0.0 3.5! 3451.21 1 r !S2ITolal Supp*y 1315.8! 2447.41 336.0! 392.1. 86.6 14186.9 285.2 178.1! 62.6!36 262.5! 857.59 142.4
99

Tadjikistan 3: 1987 Input-Output Table in Purchasers' Prices-SNA Format
L 29 1 30 i 31 32 33 34 35 36 1 37 1 381 39 1 40 1 41 1 42R___________ Bak &; State TTAL Defense TOTAL House- -/- -/- Govey. Defense ! Total jitvent-! Net C NP
___________ ~1 Insu. iAdmin. SERV. i& Othe iOUTIAY holds Paid Free & Otherti Fixed I ExponI Power NIQ21O.9 36.01 0.0 177.1 40.11 40.1 ! 0.01 0.0! 0.01 40.12 Petro-Gs 0.2i 3.0 57.4: 9.S 311.4 51.91 51.9 I 0.01 -7.2! 0.01 44.7
3 Coal 0 0.8 5S.3. 0.2! IS.S: 1.9 1.9 i 0.01 -0.11 0.0o 1.84 Other Fuels I 0.!0.°l 0.0! 0.0 0 x 0.0: 0.0i .i 0-0i 0-01 0.0i 0S Ferrus Mem I 0.0j 0.0i 3.11 0.1! 17S.S; 0.9! 0.9!i 0.0! -24.6i 0.0j -23.76N-em Me _ I0I0- .51 0.0; 231.1: 0.01 0.01 0 °°1 28-41 0.01 28.47 ____cis_ _ _ _ _ _ _ _ _ _ _ _ _ _ _ _ _ _ _ _ _ _ _ _ _ _ _ _ _ _
8 NBHW _! 021 0.12-1294 4..329 1.:441 9.1 00 3.9 Wood &Paper 0.1 -0.3i 61i1 0.0i 161.9i 91.9! 91-91 : 11.21 -5.71 0-0l 97.4
10 Con h. __ __
11 Ught I_du_I 0.11 0.21 21.8! 17S! 10181.3: 1012.6 1012.6! 1 T1i6.71 215.9 0.0 124512 Food Industy 1 0.01 0.2! 56.9! 13.9: 382.3! 1174.5! 1174 0.01 -20.6 0.01 IIS3.13 Other Indusry 0.31 1.31 14.3: 0.01 132.3. 86.3j 86.31 -0.1 i5.61 0.0 80.614 Total ladusty 1.41 8.71 270.6! 284.01 4051.6. 2893.31 2893.31 441.91 48.8 0.0 3384.015 Con0con 0.0; 0.0; O.O, 0.01 0.0; i 131.71 001 00 1315.716 As.&Foremty 0.Oi 0.1! 10.3; 2.8! 1738.0; 585.085.05.0 888 -45-11 0.0 628.617 PmoducUon T & C 0.01 0.0 0.01 0.01 298.2i 0.01 0.01 1 i 0.0 Oj 0.0 37.81ST&D 0.0! 0.01 0.01 392.11 0.01 0.01 [ 0.0.1 0.01 -1309.0 -1309.019 IttPod. Secor 0 0.1 6.91 0.0! 50.41 3S.41 35.4 jo.81 -9.91 0.0 26.320,mamw OuIy 1.5! 8.91 287.81 286.8i 6530.2i 3513.7! 3513.71 0.01 37.81 0.0 1847.11 -6.31 -130.0 4083.421 HHou!ns-Cosmmnal 0.31 0.51 5.1 5.61 66-5 149.9. 81.5 118.41 14.31 4.51 i1 218.722 N-Prod.Tnspon 0.8j 2.0! 14.41 2.4: 50.81 118.11 118.11 0.0! 0.0 21.01 1 11.8J 127.323 N-Prod. Communic. 0.41 1.4i 6.6! 0.8 7.4' 19.51 19.5i 001 19-71 18.51 -2.51 5.224 Education 0.1i 0.0i 1.2: 0.0: 28.7i 509.7 i 25.31 484.41 0.01 0.01 _ 09.7ZS CWultue 0.0i 0.0j 0.31 0.0i 8.7i 37.9. I9.Si 18.41 0.0i 10.01 47.926 Healtih. etc. 0.11 0.01 0.7, 0.01 18.7; 243.81 47.6! 196.2i 0.0! 0.0° 243.827iEduc.. Cult Health 0.21 0.01 2.11 0.0. 56.1: 791.4i 92.41 699.01 0.01 10.0 01.428I Science I 0.0O 0.0! 9.0i 0.01 48.4- 0.0! 0.0! 0.01 26.11 94.5i1 - -26.61 94.29IBmn os& ImumnceI .0.01 0.0° 0.81 0.01 61.0; IS.31 15.31 0.0! 0.01 0.01 I 7.0 22.330 StaU Mal. j I.. 0.0; 36.9: 36.91 0.01 27.6! 20.31 84.831 SeMceaOuI"' I1.71 3.81 38.0! 8.8! 290.2: 1181.1 363.7! 817.41 87.7 i 168.81 0.0! 0.01 -33.9 1403.7,32Ddense&Other j j I . I. - 471.9 [ 1 471.933 Tot1_ Oia 1 3.2! 12.71 325.81 295.61 6820.5 4694.8 3877.4! 817.4; 125.5 640.71 1847.11 -6.3! -1342.9 5959.0_~~~~~~~~~~ -.
34 Depreclation 0.5 2.61 266.4! 5.61 1004.8.35 Wages 9.1 63.5 79S.4i 115.2i 2281.9! J !36 OerWage 0.5j 1.51 10.8! 1S.8i 54;8 - t j . _37 Kolkhoz Pay 0.0! 0.01 5.1! 422.3' t ; I . -
38 Sodi'Securty 0.71 4.S1 63.31 11.01 203.11 i 'I_
39 Kolkho Soc.Se. 0.5! j i 49.8_ 40 Net Profit t61.71 0.0! 12S.31 28.7! 945.8. ; I.......4 ~41 Bonus Wagss 3.71 0.0! 30.6 j 96.4! i i42lTuover Tax 0.01 782.8: ; i43 Net Subides I 0.0! -344.21 ; j,i
44 OtherNetIieome 0 0.0! o.0o 17.4! ! .;.45 lCkhoz Income I 1 0.01 89.6' ! t46iPrbate Ine 0.01 0.01 85.01 : _720.11 i i ;47TITalLotl Lr - i -0-.8 -160.2i -
48jNetFoaelp Tmde 7.0! i 7.0I -1350 -49 0 N P 80.1 Ti 7.1 1368.0! 176.3! 5959.0. 1SO_To_ __u| 76.384.81 1686.81 471.9! 12894.4! li I i -
Si ilWon " j O.Oi 3451.2 1 ! i : ! I I0.52 Toha Supply 76.31 84.8; 1686.81 471.9i 16345.6: . , i
100

Tadjikdstan 3: 1987 Input-Output Table In Purchasers Prices-SNA FoMat
_____________ Page3
_ 1 ~~~~~~~43 44_
C_ ~~~~~Exo i TOTAL
I Power 61.01 278.2
2 Pno-as I 20.01 376.13 Cowl - 3.51 20.i
4 Oher Fues 0.01 0.1SFerrown mets 3.31 15.16 N-Feuom Mleals 353.2 612.7
7 ChmIrls 87.3 578.18BnMW 225.3 1503.0
9_Wood & Paper 7.1 266.4
l0 Cmnr. Materis 31.4 424
11 ghtm 1nddu 1140.41 3404.012 Food Indurny 237.3 1773
13 Other lidusty 35 216.4
14 Toul Indutry 2173.31 9608.9ISConocUom 0.01 1315.716 Agpi. & Forstry 80.91 2447.5
17 ProducUon T & C 0.0 336.018 TY D 0.0 392.1
19 OCher Prod. Sectns 10.01 86.7
20 Mm Wouls0 . 2264.21 14186.8
21 louslng-Comaunw 1 285.2
22 N-Prod. Tranot ___ 178.1
23 N-Prod. Camumnc. 62.6
24 EducI 538.4
25Cnture 5 6.6
26 Helth etc. 262
27 Educ. C8S&Health, 857.
28 Sdence 142.4
29 anking & Inurance , 76.3
30 State Admin. $4.8
31 Swr,c lOuday 0.°i 1686.9
32 Defese & Odher i 471.9
33 Toha Onu"ly 2264.21 16345.6_ _ -
34 Depredaion |
3 Wages36 Odier Waes e-37 KYclko Pay38 Socra SOecufY39 Kkhoz Smc, Sec 40 NetProfit I _
41 BSans Wage I
42 Tumover Tax43 Net Subsidies44 Odher Netn e Incom45 KDolk*oz Income46 Prtvate Income 47 Tolal Ics_ a_48 Net Forign Trade i
490 N P50 Tool OUa ,51 import
52 Toutd Suppb It10

Turkmenis-tan 3: 1987 Input-output Table in Purchasers' Prices-SNA FormatMillion Rubles. Current Puices
I1 2 i3 1 4 5.7 a8 9 !10 U i12:13 '14Power. Peuo- i CoalI Other Ferr. 1X-Ferr.: Chem. MBMW IWood I Consan. Light 1 FoodI Other ITotal
Gas , Fuels i Me"alsMetals' Paper i e. a. idunI !Power 0.2. 24.3!i 0.0 0.0: 0.0; 0.0 8.1 4.9i 1.71 10.5 6.6! 4.71 0.71 61.5
2IPeuro-Gas 73.41 246.5- 0.0, 0.01 0.0, 3. 85 25 06 26 .1 4.8, 0.31 372.4
3ICoal ~~0.01 0.01 0.0. 0.01 0.0! 0.0. 0.1i 0.11 0.01 0.61 0.11 0.0; 0.01 0.9,4 Oter Fels0.01 0.0: 0.0; 0.01 0.01 0.0 0.0. 0.0: 0.0; 0.01 0.01 0.01 0.01 0.05 Fermu Mttab0.31 2.31 0.0. 0.01 0.Oi 0.1, 2.9; 28.11 0.6i 14.91 2.31 1.11 0.11 52.9
6 -erusMtf 0.0, 0.11 0.0, 0.01 0.01 2.6! 0.1 8.41 0.0! 1.01 0.01 03 .1 1.
7Chemicals 1.81 9.4 0.0; 0.01 0.2! 0.0;i 55.91 12.0. 1.11 4.5 9.81 2.31 1.51 98.58'IMBMW 1 6.3 'I 21.4 0.0, 0.01 2.1; 0.0; 2.1,i 89.71 1.21 10.0! 8.91 2.31 0.21 144.9 Wod & aper j 0.31 0.51 0.0. 0.01 0.01 0.21 4.1! i 5.81 29.71 £.71 2.91 4.81 0.4. 54.3
10 Costr. ate I 031 0.21 0.0 0.01 0.01 0.0' 3.51 4.41 1.21 68.7ji 0.61 1.21 0.01 0..1
IIL&Inut 0.21 07 0.01 0.01 0.0! 0.1: 2.11 3.11 1.21 1.1! 296.51 45.81 2.3! 353.1
12 Fod ndusry 0.0 0.0! 0.0; 0.01 0.0; 0.01 1.41 -0.41 0.11 0.41 0.71 226.11 2.21 231.413 Ofr Indstry0.0 10O 0.0: 0.0! 0.01 0.01 8.9! 2.01 0.1! 0.9! 2.51 7.71 8.81 32.0
14 Toni odusry82.91 306.51 0.0. 0.0! 2.41 3.11 11 i7.71 161.5i 37.5! 131.0; 333.91 301.11 16.61 1494.2
15 C410trUtiOU0.01 00'i 0.0. 0.0; 0.01 0.0; 0.0: 0.01 0.01 0.0! 0.0! 0.0! 0.0! 0.016 AV. &Fratty 0.0! 0.0. 0.0; 0.01 0.01 0.01 0.11 0.0! 0.11 0.0! 1424.11 299.6! 8.0! 1732.4
17 Productlon T & C 0.61 98.01 3.3 i 0.0; 10.3! 1.11 23.81 58.01 23.2! 108.8! 25.91 37.01 14.11 404.0IST&D 0.0! 43.3! 0.31 0.0! 4.41 1.01 12.41 40.4! 7.11 8.0! 56.21! 112.3! 5.8i 2 93.219 Other Prod. Sector 1 2.01 3.1! 0.0! 0.01 0.01i 0.01 0.71 2.91 0.0' 4.5! 2.4! 3.8i 0.0! 19.4
20 Material Outlays . 5.41 450.9; 3.71 0.01 17.01 5.2! 154.7! 262.81 67.91 252.31 1843.0; 753.8 44.51 3941.221 Houngu-Commural I 5.71 13.61 0.01 0.0' 0.2! 0.0' 1.11 2.41 0.3 i 2.0: 10.2! 2.1 0.01 37.622 N-Prod. Traspor 0.9! 0.6! 0.Oi 00 0.01 0.i .0; 0.3 1.31 0.21 1.8 4.1!i 0.4 0.01 9.6
23 NPro. Cmmuic. 0.01 0.01 0.0: 0.01 0.0! 0.01 0,01 0.0' 0.01 0.0: 0.0' 0.0 0.0! 0.024 EduciLdon3.1! 6.4! 0.01 0.01 0.11i 0.0; 0.61 1.2: 0.21 1.11i 3.0! 0.81 0.0! 16.3
2S CWu1re 0.71 1.4! .0 0.00.0! 0.0: 0.1 i 0.31 0.0! 0.21 0.9! 0.21 0.0! 3.926 Health. etc. ~ 2.41 5.01 0.0! 0.01 0.11 0.0! 0.51 0.9. 0.11 0.8! 3.61 0.6! 0.0! 14.0
27 Educ.. CWtL & Health! 6.1! 12.81 0.0- 0.0: 0.21 0.0! 1.2: 2.41 0.3! 2.21 7.5! I.Sj 0.Oji 34.3
28Sience 7 T 3.61 13.31 0.0! 0.01 0.1! 0.Oi 0.5! 2.8; 0.1! 1.11 2.2! 0.31 0.01 24.029snds&lm c 1 1.8! 6.7: 0.01 0.01 0.0! 0.0: 0.3; 1.51 0.11 0.61 5.51 2.6! 0.01 19.130 IState Admin. 1 . , ,1
31iUayesAmOutIays i18.2! 47.01 0.0! 0.01 0.5: 0.0 3.4. 10.51 1.01 7.6' 29.4! 6.9! 0.1 1245-
32.Defcne& Other i 'I .II
33 Total OubysB 103.61 497.91 3.7i 0.0!_ 175.5 5.2- 158-U. 273.3' 68.9! 259.9! 1872.4! 760.7! 44.61 4065.8
34Dpecaf 39.8i 256.71 0.0! 0.0! -0.31 0.1! 26.2i 43.0! 2.3! 40.31 26.21 19.61 -7.31 461.9Wa 14.8 24.21 0.01 0.01 0.6, 0.5' 23.11i 60.81 10.61 41.51 71.31 30.91 6.31 284.8
36Ohr au0.41 0.91 0.01 0.01 0.0: 0.0, 0.71 2.31 0.41 0.9 1.71 0.91 0.3 8.2
37 Kolkhoz Pay 0.0! 0.01 0.0! 0.01 0.01 0.0: 0.0! 7.4! 0.0! 0.81 0.0! 1.1! 0.21 9.438 Sodal Securiy 3.0i 4.910 0.0 0.0 0.11 0.3 3.Si 4.6! 0.8 3-3: 9.51 4.3! 0.3! 34.3,
39 ColkhowSoc. Sx. 1 0.0! 0.0! 0.0! 0.0! 0.0! 0.0. 0.0; 0.81 0.0! 0.11 0.0$ 0.2! .1 .40 Net Profit 156.3! 222.1! 0.0! 0.0! 0.9 i 0.4: 3.21 39.6!- 5.11 24.51 117.9 22.0! 0.6 -492.4
41 Bonus Wages 2.8! 5.11 0.0! 0.0! 0.11i 0.0 1.9q! 3.21 0.3! 2.71 53.31 1.9! 0.3! 71.542 Turnover Tax 18.21 147.6i 0.0! 0.0! 0.0; 0.0' 6.71 2.7! 0.0! 2.11 124.8! 228.8! 1.9; 532.8
43 Net Subsidies 0.01 0.0! 0.0; 0.0! 0.0! 0.0: -15.0! 0.0! 0.01 0.01 -375.61 -109.9 0.01 -500.544 Other Net Incme 0.0! 280.0! 0.0; 0.0! 0.0! 0.0! 2.01 0.01 0.0! 5.01 0.01 4.51 0.01 291.5
45 Kolkho Income 0.0! 0.0$ 0.0! 0.0! 0.0! 0Oli 0.01 0.0 0.01 0.2 0.0! I61$ 0.0$ -5.8
46 Private Income ±0.! 00 0.01 0.0: -! 0.0! 0.0! 0.0! 0.0! 0.01 0.01 0.0! 0.0 I0.01 0.0Tota Lose -0.9! -5.41 0.01 0.01 0.0! 0.0! -1.0! .0.8! -0.1! -0.61 -21.01 .0.4 -2.21 -32.4
48 Net Foreig Trade -56.11 -642.4 6.91 0.2! 112.41 5.0! 74.1! 898.1J 148.3! 37.01 -646.1! 467.7 110.51 515.649IG N P I75.2? 288.6; 6.9; 0.2; 114.2! 6.2; 123.5! 3058.5 167.5! 155.11 4691.3! 63612.!092
50 Total Output 1235.01 1428.91 3.7! 0.01 19.3; 6.4; 207.5; 433.71 8.1! 378.01 3827.2! 9S56.59s.11 5643.351Ipr .6 0.V. 0.2! 1 15.7!i 9.3! 215.2' 942.4!1348.6, 57.91 577.3150611225.
S2ITotal Suppl 243.6 1529.0' 10.6! 0.2! 135.01 15.71 422.71 3376.0' 236.7! 435.81 2404.61 1517.11 170.3! 8497.4
102

Turkmenistan 3: 1987 Input-Output Table in Purchasers' Prices-~-SNA Format
________________ ___________________________ ~~~~~~~~Page 2
1 15 -I 16 117 18is 19 120 ' 21 22 123 124 125 126I1 27 28___________ C6i IAgrictaI T &C I T &D! Other TOAMuig rnp om Eu! iCl.IHat dc cec
_________ I ~~~~~~~~~~~~~~Prod. PROD.; I Health iI Power 15.81 11.11 8.71 5.61 0.5. 103.2! 13.8' 1.4 1.41 7.91 1.Oi 5.41 14.31 0.6
2Petro-Ca 1.1 541 32.51 1.8! 0.3; 522.5' 11j.71 [ 3 1.3 1.01 2,81 0.3i 1.9! S.0 2.3 Cad 1.21 1.31 0.51 1.0! 0.0' 4.9; 0.0i 0.11 0.0 1.61 0.2: 1.1! 2.9r 0.04 OthetFuck 0.21 0.01 0.0! 0.0: 0.01 0.2! 0.01 0.01 0.01 0.01 0.0! 0.01 0.01 0.05 FerrouNevis 88.SI 0.51 06i 0.31 0.11 I1A2.91 0.01 0.2. 0.01 0.31 0.01 0.21 0.51 0.96 W-Fvrromu Me"al 0.81 0.0 0.11 0.1 0.01 13.71 0.01 0.01 0.01 0.01 0.0; 0.01 0.01 0.47. Chemicals 45.71 92.41 4.9' 1.5 0.7! 243.71 0.5! 2.91 0.01 0.8 0.71 9.31 10.81 2.18 148MW 138.4 89.71 14.51 9.4 0.5! 396.8: I.S1 8.1I1 1.31 5.6 0.71 39 1.1 8.49 Wood & Paper 74.2 0.8 I 1.0: 7.7 2.21 140.2!_ 0.3 0.61 0.01 2.9 0.41 2.21 5.4, 0.4
10 Coas. Matarais 291.71 2.91 1.8!1 3.9J 1.6i 382.01 0.81 0.51 0.01 2.01 0.21 1.41 3.61 0.71 1 Ught industry 5.21 25.71 1.51. 10.21 0.41 396.01 0.91 ~0.7 0.11 5.61 0.71 3.91 10.2' 2.312 lOadI Indus"' 0.5 391 0.2! 20.11 0.01 291.2; 0.71 0.91 0.0 24.41 3.31 19.51 47.2 0.113 Otber Industry 8. 83 1.61 4.4 2.61 87.61 1.1 04 06 . .1 3.51 9.2 0.714,Tota Industry 732.3 355.91 67.71 66.11 8.91 2725.01 31.21 47.11 4. 9.01 8.1 52.1 119.3 19.4,
IS Coastructlce ~~~0.0! 0.01 0.0: 0.01 0.01 0.0116 Agrt & FormyW 0.11 222.21 0.5: 8.01 0.0i 1963.21 0.81 0.01 0.01 1.31 0.41 2.2 3.91 0.0117 ProduclkoaT &C 23.81 51.1 1 0.5! 1.21 5.91 486.6i I
18 T & D ~ 0.01 106.61 0.0! 0.01 3.8' 401.6i 19 Odier P 7od0.0ec0.51 6.21 3.61 32.4 1.lj 0.6! 0.61 5.41 0.61 3.6 9. 0520maw ufys 175-9 75.1 69.21 81.61 22.21 5608.8 33.11 47.71 5.01 6S.71 9.21 57.91 132.81 19.9
21,111using-Communai 9.1 1 18.91 4.11 12.01 1.11 82.8! 0.51 0.61 0.71 0.71 0.21 0.4 1.3 0.222IN-Prod. Traaapon 8.31 240-2.0i~ 5 .4 06 0.81 1.2j. 06 271 0.81 1.61 5.1 I 0.823 N-Pwd. Cammuimc. 1 0.01 0.01 0.01 0.01 0.0: 0.Oi 0.11 0.2! 0.41 0.91 0.51 0.51 2.01 0.624 Educaikn 1 6.61 20.31 2.9 i 3.61 0.41 50.11 0.21 0.41 0.4 0.01 0.01 0OjO 0.01 0.025 Culiw 1.1 I 4.2! 0.61 06i 0.11 10.5Sj . 0.11 0.lj 0.1 0.01 0.0 1 0.0 0.026 Health. etc 3.91 15.01 F2.2; 2.31 0.31 37.8!i 0.21 0.31 0.310.Oi0 .01 0 .01 0.0 0.027 Edua.. Cult. & Healthl 1 1.6i 39.61 5.7; 6.51 0.7! 98.41 0.51 0.81 0.8 0.01 0.0 0.01 0.0 0.0,28,SdIence i 10.4i 15.3! 2.91 1.11 0.2: 53.8; 0.11 0.11 0.4 0. . 0.01 004 3.029BRan1dog & Iunca 7.3' 17.8! 1.7; 42.8! 0.3 89.1; 0.11 0.21 0.4 0.0 0.01 0.01 0.0{ 0.130:Stase Ad.lf. I t 2 ..- 31 Setlca Oudays 46.6i 116.4! 16.4 66.91 3.8! 374.6 2.0! 3.11 3.41 4.3[ 1.61 2.51 8.4l1 4.732 Defeus & Odwe 1Z~ _
33 TobbI O~ia 805.51 852.11 85.6i 148.51 25.91 5983.4 35.1 50.8! 8.1 70.0! 1. 04 4. 24.6
344 Depreciatica 162.71 193.9j 245.71 30.0: 27 1096.91 99.21 28.31 . 24 . 82 54iZ .I0 18035,WaMe 550.91 185.01 121.61 127.11 24.01 1293.41 63.18 70.01 20.9! 259.9 371110.8 p405.4 46.336 Odher WaeSo 23.31 1.8 1.91 2.01 0.31 37J51 1.31 _2._6E 0.61 1.3 0.1 1. . 1.337 IColkha Pay 154 2. 0.01 0.01 0.01 644.s; 0.1 2.0 5.838 Sodal Secwtn 44-01JZZ7A Y 10.61 10.21 1.9i 109.4! 3.0- 5.11 1.4! 24.4! 3.3I 10.4 38.11 8.7.39 Kolkloz Soc. Sec. 0.21 77.8 o.oi 0.0! 0.01 79.11 1 i I 0.3 0.11 0.1 06___40 Net Profit 115.2 73.9. 76.21 8 4.01 -5.21 836.41 9.01 17.31 30.21 0.0 0.01 1 0. 10.3141, BonnaWage 1.4 11.3 3.1 2.91 0.61 90.71 4.21 6.61 2.4 2.21 1.01 1.41 4.6 6.2421 T1urwovr Tax 0.0 0.0 0.0! 0.11 0.01 532.9!431Iet Subuddsa 0.0 0.0 0.0' 0.01 0.0, -500.51 44 Othe Neo Inaa 0.0 0.01 10.51- 0.0! 0.01 302.01 0.01 0.0i 0.0 0.0 0.0, 0.01 0.0 0.045 ICoIdhhzincome 0.0 286.1 1 0.0 0.0! 0.0j 280.21 i I -.
46 Prlvatalnoue 53.4 431.6i 0.0 0.01 6.71 491-71 2-0.01 12.0Ot 0.0 15.01 3.0 -15.0! 33.0 __
47 TomlILama -180.21 -12.9, -1-.8 .0.3! -0.71 -222.3:: 1 -0.51 40.31 1_______48 Net Foreig Trade I-64.81I -105.01 27.01 372.8! 1 49,G N P 784.8 1 180.8!1 464.71 148.11 56.71 534,8.3: 196.31 134.8; 6_1.6 338.9! 46.21 159.2. 544.31 84.650'sOwIoupiZ t 1590.31 2717.71 550.3! 401.61 55.61 10958.9; 231.41 185.61 70.01 408.91 5.1296 W5 9251 Wispo I 0.0 70.41 0.0! 0.01 32.8! 2951.21!S2 ToalupIy 11590.31 2788.11 550.31 401.61 88.4; 13916.11 i231.4! 185.6! 70.01 408-.9! S7.01 219.6: 685.5! 109.21
103

Turkuseuisma 331987 InPut-Output Table in Purchasers' Prices-SNA Format
Page 3'29 10 3112 33 ~~~~~34 35133131940 41 142
I DMk& SUaW ITOTAL!Defeuge; TOTAL Hts-i -/- -I-Govern.'ecs Tu ivnt;NtI0N P_________ 1~M. IAdW. ISE-RV.IAu.UT ;holds iPaid I Fre ! &Othor I Fixed I 1 Expon I
1 pow,, I ~~~~0.2 0.71 -32.41 1.8; 137.4; 4131i 41.5 I0.01 0.0! 0.01 41.5.2 Poll'o-Gu 0.8! 52.8 13.3; 589.1! 72.0 7201 i 0.01 125.31 0.01 197.33.Cou1 0.110' 3.2 -i 83 .1 26 4IOihuzFuls 0.01 .2! 0.2 8.31 2.1 2.6 II 0.01 .0.41 0.0 2.
4 10die Fooft0.01 0.0 ! - 0.lj 0.31; -O 0.0 00 0.0 -- 0.11 0.0 .0.1FMovs Moab 0.0; O~.0i -13.4! 0.0 .12,9~~ ]i~i 0.01 1.6: at;0.1 144.61 0.5k 0.5!
0.!0.0! 0.41 0.01 14.1!: 0.0I ac I .0 2.! 0. 2.7~~~~~ ~~~ 0.21 0.61 17.11 14.13i 294.9: 82.41 82.4 1 0.01 -95.71 0.0 -13.3
NRM 0. 0.61- 3-0.3! 220.0 647. 295.01 295.0 619-282.41 0.0 684.3,wow * paw0.1 71! .01 147.3i 72.81 72.81 1514.81 0.0 89.1
10CR. ar 0.01 0.0: S.61 0.0'i 387.6! 29.11 29.1; _____ . -1.8! 0.0 27.3lit.itiaonIwui -7 .1 1 0.3* 14.61 21.?! 432.3 i 765.6; 765.6! 0.01 .16.7! 0.0 748.912iFood lodustry 10.01 0.0; 48.91 16.4, 15~ 1003.6! 1003.61' 0.0' 64.11 0.0 1067.7
,131d Ote aua 0.31 0.91 13.11 0.0! 100.?76.1 65.0. 6I 0.41 3.41 0.0 68.914Total ladutY ~ 1.44.~ 2271! 73-08.2 3260.3!210 24240 .1 673.8 i-205.3!i 0.0 2898.5
15 Camvuc'Jea ________ 0~~~~~~~~.0! .0.0 1590.31 0.0! 0.01 1590.3161Agu1.& Foresgy 0.0 0.11- 4.8 3.2 1971.2! 43.7; T434.7 .41.8 205.31 0.0 68i.717PmuoTb C 48&6.6 0.0; 0.0 63.7 0.0 0.01 0.0 63.718 T&D . 401.61 0.0; . 0.0 - 0.01 -305.0 -105.0
Tg' odw Proi. scam -0 .81' 0.01 45.21 34.61 34. ~~~~~~~~~~~~~~~~ I 0 221 0.0 3.2ONaWrIaIOuUays T~IJ 4.71 244.71 311.4; 6164.9I 28995893 0.01 63.71 0.01 23064 1. -105.0 5166.621 Hoi6Cmua1 04 0.4! 4.21 1.01 88.01 11.8j 80.4 38.41 14.81 9.8 -- - 143.422 N-Prod. Tapo 1. I1.8' 07 0.41 61.7 i 104.41 104.41 0.0! 0.01 24.2 [1 4.7, 123.9
-0.4 I.2 4.9! 0.3. 5.0' 18.6! 18.61 0.01 26.0j 22.3 -1.9 65.023 N.Prod. Commute. 0.01 0.0 1.01 0.0! SIXi 357.81 19.31 338.S! 0.0! 0.0358
2Cwultr 0 0.0; 0.3, 0.0! 10.6 36.61 16.81 19.8! 0.01 9.6 46.226 Heul" e1 6:o .! .! 0.0! 38.6! 181.0! 29.41 151.61 0.0! 0.0! ..... 8.27 Edia..t CuIlt Hu & 0.0 2.1; 0.0! 100.5! 597.7; 65.3! 532.21 ! 0.0! .I5977.7
1.6! 0.01 57.3J 0.0! 0.0! 0.0~ 203.61 28.3 i180.0; 51.929BamMag&Imuram -0.01 0.01 o.81 0.01 89.8! 10.7i 10.71 0.0' 0.0! o.oI100 2.
30Staa Adwa. I I 01-.0! 36.3! 36.3! 0.01 30.6i 8.91 ! 75.831 Beft Ovii 11.31 3.4! 26. 1.51 402.4! 864.21 315.9 548.31 273.01 103.1 0.0! 0.0i -176.6! 1065.7
32 0 odw _ I I 0.0! 0.0. 0.0 0.01O 0.01 481.9 1F 481.933 TOWousys T 2.b! Sal 271.0. 112.9! 6567.3' 3763.7! 3215.41 548.3i 338.71 585.0 20511.91 -281.6 6714.3
34 OWedado ~~~~~~~0.61 3.1 L 262 3S235Wags 6.6! 59.11 672.31 328.1! 2093.6!1 I m,Waasse 0.41 70.9! 9.f 4.5I 53.91 ij
18 SocIa Scity 0.61 4.5; 61.41 10.21 381.01I_____i19 Kolkoa Soc.See. I0.6! 797'
40 NotPrFlg 89.5; 0.01 356.3 0.0 M-741 SocuaWato" 3.31 0.01 27.31 118.0!421 oveTAX !0.0; 53.M& 4S Net lubudlbea 0.0i -500.5 1 F7 l
4Othp Net imnom 0.Oi 0.01 0.01 302.0!- - T- 45 Kolhuln om ________ 2___0___2 ___
46 P " i___ ___ 556.7: _ _ _ _ _ _ _ _I_ _ _ _ _
4?ToL.ams j -08i -229.-48Nt agTwade 10.0i . - I 3_____
90NP. 107.7! 67.71 1197.Oi 169.0;1 6714-3.3 ____ ____
Thb10.IPU* .~~~~ 1005 75.8; 1458.Oi 481.918883 51 Sagan ~~~~~~~~~~~~~~~~i 2957.2:
S2 hbIu0I l004; 75.81 1458.01 481.9: 15856.0 ____
104

Turkunenistan 3: 1987 Input-Output Table in Purchasers' Prices-SNA Fonmat
___43___r4Page 4
z~~~~~~4 1 .rOr_ _ _ _ EW jTOTAL
________ _ USBS-I 1Poser i 64.71 243.62jPeu*-Gaa ] 74261 1529.13lCoai ! 0o0 10.64Otbe Fues I 0.0 0.25 FenRns MetRs 3.31 13S.06IN-Fsrxm 14eta5 i 4.31 IS.77ChemicaLs 1 141.1 422.7
mBMW 44.3 1375.99 Wood & Paper 0.3 236.7
10 Conrfr. MfaerOua j 20.91 435.8_ 1Sht Industry 1223.4 2404.612 Food Industy 92.9 1517.213 Chhe Induary 0.7. 170.314 Toal India" 2338 4 8497.3Is c sutcd_on 0.01590.316 Aswt. & Forety 135.21 2788.17 ProducUou T & C 0.0! 550.3
18 T & D 0.0i 401.619 Other Prod. SePrbI 5.8i 88.420 Matll Outlays 2479.Si 13916.021 Housing-Conal -t 1 231.422 N-Prod. Transpon| 185.623 N-Prod. Cmoamnn 70.024 Education 408.925 Culture - 57.0
26 Hoeath ea. 219.627 Edu.. Cut. & Healt - T 685.528 SdIence W.229 Banking & Isurvoce 100.5-30 State Admin. - 75.E31 S-eOtnlc I 0.01 1458.132IDefens e& Ot I 1 481.9*33TatuO uUas 12479.51 15856.1
34 Dep#lmxE __3S Waes_36 Otber Waes37 Xlkhoz Pay3 ISocW Secuity39 soU Soc. Sece.
40 Net Prflt c41 BTonlL es W-42 Terw Tax43 Net Sub adies4410dher Not Inm
46 P _mLo47 Totel 1,oe48 Not Fom Trade490 N P50 TOWl Ct_1 Import7
S2ITl Supply I I
105

Ukraine 3: 1987 Input-Output Table in Purchasers' Prices--SNA FormatMillon Rubles. Current Prices
______________________ ~~~~~~~~~~~~~~~~~~~~~~~Page I
______________ ~~ 1 I2 ;3 4 5 6 7 8 :9 -10 I 11 12 !13 i. 14-. iP~~~~~~~owe-ri Petni i Coal I Other i Fewr. .N-Fewr. Chem. . MBMfW Wood Constr.: Ught I Food IOther i Total
______________ 1 1 ~~Gas I Fuels Memals iMetals .Paper iMater. i i d. IdsrI1 Power I 3S.9i S9.0; 262.0i 1.7! 747.6. 101.2. 450.31 744.8 71.01 22S.71 105.7; 179.2i 158.8; 3142.92 Pevo-Gas j1416.0. 2023.5: 23.0. 1.7. 602.4: 61.2 560.8' 493.5 i 87.9; 441.4 i 31.7 i 297.61 63.61 ~6104.33 1Coal I 917.9; 0.0 3399.6- 0.4. 1 930.4. 9.8 15S.0; 42.2: 8.5, 49.5; 8.41 30.7 i 10.21 6422.54 iOther Fuels 0.01 0.0 0.5 10.3 0.1 ! 0.0 0.0: 1.0 0.Oi 0.61 0.11 - 0.11 0.31 13.05 Ferrous Metals I 8.9i 3.21 64.5' 0.6i 8010.11 27.7: 246.2, 4548.7'~ 69.0, 440.61 13.3 i 80.41 19.3!F 13-532.561N-Ferrous Metals 1 71.0; 1.2: 0.6i 0.0: 330.7'" 752.2: 135.7 i 1582.61 7.2' 26.5; 9.2! 40.21 138.51 3095.57 Chemicals 15.51 S8.81 86.9! 0.41 196.51 49.6. 3551.4: 17640.0 238.61 247.51 910.51 156.21 196.6; 7472.48 MBMW 1285. 1! 26.8! 324.7; 2.1! 730.11 47.11 182.1116957.8: 180.51 257.6; 99.71 238.6; 87.91 19419.9.9IWood & Paper 1 3.6! 2.61 167.71 0.4; 64.3; 12.3! 202.5! -603.71 1558.61 105.91 66.31 325:0! 155.2! 3268.1
10! Constr. Materials I 3.5! 0.8! 20.9! 0.3: 47.5 1 8.0: 56.8:i 238.01 61.0i 1046.21i 7.31 121.81 28.21 1640.1IIIlLAght Industry 6.8! 2.5; 42.7!i 0.4' 62.9, 5.9 i252.3:i 389.91 207.8: 69.11 9811.01 122.61 309.71 11283.612;Food Industry I 4.6 i 16.41 '4.31 0.0;' 15.6. 2.51 192.91 121.4i 14.0i 24.11 184.6! 9546.5! 484.01 10610.913 1Other Indusury 7.6; 2.41 24.7! 0.01 39.31 4.61 29.81 143.61 10.3. 22.8! 17.11 183.3! 541.01 1026.5
14'Toul ndatry 2776.S i 2197.2: 4422.0: 18.3:.12777.5. 1082.1: 5875.8:27631.1! 2514.3. 2957.4!11264.8i 11322.1! 2193.21i 87032.215 1 oLto i 001 0.0 0.0. 0.01 0.0: 0.0: 0.0: 0.0! 0.0, 0.0! 0.0! 0.01 0.Oj 0.016 Agri. & Forestry 0.01 0.0 0.2: 0.0; 0.2V 0,1; 3.8 i 1.71 61.1:i 0.31 1390.9! 22088.91 1712.91 25260.117 Production T &C 56.51 1891.2! 477.1! 6.8! 949.2. 13-3.07 5-26.161 1491.01 350.5 i 1294.6! 230.6! 585.41 115.11 8107.618 T &D I 0.0! 376.0! 112.1: 0.9! 82.71 13.8' 360.61 623.11 147.71 130.0! 1010.21 3457.81 166.91 6481.819 Other Prod. Secuon T 15.2! 15.4r 15.21 0.0 19.5! 1.71 54.1!i 149.3! 44.1 i -- 3-8.81 19.51 49.8! 18.71 441.3
M0 iaLR Outlay 2848.2! 4479.8i 5026.6. 26.0113829.1! 1230.7: 6820.9; 29896.3 ;3117.5i 4421. 1! 13916.0 i37503.91 4206.9,127323.0
21iHouzsig-Communal 9.41 12.5! 41.6i 0.0! 98.6! .13.91 66.81 254.8 i 26.4! 31.71 72.4! 91.6! 18.61 738.422 N-Prod. Tmanspor 15 0.61 39.5! 0.01 25.3! 2.9' 16.91 134.9: 19.0i 27.61 32.8: 29.71 12.5! 343.223 N-Prod. Commtnic. 0.1 .0. 0.0. 0.0 0.0: 0.0 0.0: 0.0, 0.01 0.0: 0.01 0.0: 0.0! 0.0,24 Education j .1 5.9: 22.4: 0.0: 43.1- 7.5 36.0: 100.2i 14.2 17.01 32.7! 39.01 10.01 333.025 CultureJ 11 1.31: 4.9. 0.0. 21.1: 1.7: 7.9 33.8, 3.1' 3.71 7.61 13.11i 2.2! 101.526 Health. etc. f 3.9. 4.6~ 15.5: 0.0 31.4 5.9 28.0; 79.9: 11.1. 13.3! 28.9! 30.3, 7.81 260.527 Educ.. Cult. &Heat 10.1: 11.7! 42.8: 0/), 95.6- 15.0 71.91 213.9; 28.4, 34.1 i 69.11 82.4; 20.0! 695.028 Science __ _ 5.9! 12.3! 13.3: 0.0: 47.8, 10.7; 29.81 352.81 5.41 17.1! 12.51 15.0! 1.01 523.729 Banking & Insumance I &0! 6.2; 8.5! 0.0: 21.21 3.9: 18.51 148.6! 7.3; 8.71 50.8! 141.8j 5.1! 423.630 State Admin. i; I ,1I
31 Sevmo Otlays i 29.9! 43.2i 145.7 i 0.1I 288.4i 46.4: 203.9; 1105.11 86.5i 119.2! 237.61 360.4! 57.31 2723.832IDefenae& Othe I 33IToui OuftayB 2878.2! 4523.0: 5172.41 26.11 14117.51 1277.1! 7024.81 31001.3 3204.0. 4540.3!114153.6: 37864.31 4264.2!104.
3?4 Depreciation 1 98.81 295.8i 1134.3; 8.1!1 1635.41 176.7! 1092.7 i 3120.2! 249.41 665.4; 297.3!i 917.3! 270.91 10812.335 Wages 1 228.5! 46.8! 2365.8: 8.9! 1149.7: 109.6: 727.9! 7647.81i 666.5; 1065.71i 1401.51i 1263.31 409.51 17091.2
36Other Wages 9.31 1.4! 69.5. 0.2! 27.6! 3.1! 19.7! 184.3! 16.2! 16.51 12.01 25.71 11.6j 397.137 IColkhoz Pay 0.2! _0.01 0.0! 0.0' 0.01 0.0: 1.31 125.7! 73.8! 24.81 36.6! 59.01 92.61 413.938 Social SecurIty 38.2! 7.11 225.6! 1.1! 130.9! 12.8; 108.51 1055.8! 63.3! 130.91 175.01 160.81 36.01 2145.939 Kolkhos Soc. Sec. 0.0! .0 0.01 0.0i -! 0.0! 0.0!. 0.2;i 15.5! 9.5! 3.11 4.6! 7.01 11.71 51.740 Net Profit i996.71 397.01 1135.0! 0.9: 2078.2. 413.0. 1494.81 6820.1 i 682.1! 778.6! 2243.81 2662.3! 467.51 20170.041 Bonus Wages 1 37.3! 9.61 123.1! 0.9i 116.1:i 19.2! 102.6! 847.1! 59.9! 87.81 145.0! 121.6! 40.4! 1710.642 Turmover Tax 1326.31i 1544.6! 0.0; 0.0i 33.8; 0.1! 856.8! 1700.41 56.4! 498.8! 2684.7!i 5966.8! 676.21 14344.843 Net Subsidies 0.01 0.01 -23-10.1 0.01 0.0: 0.0: -416.31 -389.8;i 0.0! 0.0 -43.6-947.81 25.11-12472.544 Other Net Income i 0.0! 70.0i 47.5; 0.0' 107.9. 10.3!i 45.21 0.0; 0.0! 60.0! 0.01 142.3j 0.0! 483.2
45 KColkhox Income .1 0.01 0.0! 0.0: 0.01 0.0! . 04 21.81 -4.9! 1.31 8.5!I -15.51 106.01 117.7
490G N ? ~ 2162.4i 5564.1! 2037.4;: 24.1! 549.9 1862.9; 5486.8.20167.0, 3376.7, 2895.1'12251.71 -157.5; 2371.74 55979.3OToToniOOupptt 5392_31_685_2__7799___ 45_ 0119222______ 6_3_ 1093_3____I_70___4989_0__755_5120392_9_40072_8__639_01182964_
51 import J189.51 3962.5! 376.6! 5.2 i 3043.2; 2066.4 S286.2i 16206.91 2036.91 410.11 8764.6! 4633.3 i 1139.5! 48120.952 row Supply : 581.810837.7! 816.1 50.2:22265.94062.7.16199.5: 67377.41 7025.9: 8165.6! 29157.514470.!785!215.
106

Ukraine 3: 1987 Input-output Table In Purchasers' Prices--SNA Format
--- 1 ~ ~~~~~~~~~~-Pa3e 2
- 1~~~~~~~~~15 161i.17 18 19. 20 21 221231i241i2 1 26 127 28
IC=. IAgz1cult.I T&C; T&D! Other TOTAL iHouslng'Transp.iComm. i Educ. i Cult. IHWe-ah. E& Cl~Science
______________ ,~~FOreutryt !Prod.. PROD.; I 1..L . Heath!II Powe r 96.81 193.1- 209.5i 98.9: 6.3, 3747.5. 234.6' 81.4! 21.41 91.71 11.11 63.0.' 165.915.
2 Petzo-Gs 1286.91 944.0, 947.9. 75.6. 3.0 8361.7'. 93.8. 391.2i 30.0: 48.91 5.91 33.6! 8.1 51
3 COalk r 22.31 89.71 26.1: 36.3' 1.3 6598.2. 117.2: 5.Oi 1.91 50.41 6.1, 34.71 91.21 7.2
4Other Fuels 4.31 18.71 0.01 0.4, 0.0 36.4- 2.8 0.1! 0.0! 1.9! 0.2! 1.31 3.51 0.4SFerrous Me"a II 1089.8 1 26.1' 31.Si 6.21 0.2. 14686.3; 13.8. 9.0! 0.9, 2.7: 0.3i 1.91 4.91 55.914-FernouMe"aa 24.41 1.0!O 3.6; 0.91 0.1; 312S.5. 0.9, 1.41 0.21 1.71 0.21 1.11 3.0! 56.8Chem cals t 397.11 1551.11- 17-8.-I11 39.6!1 7.6: 9645.8 6S.1 1 57.81 6.9; 24.4!_ 22.01 282.41 328.81 142.0
21016.51 1487.5: 302.2: _131.1! 12.7 i 23370.0. 94.7. 137.9: 16.6; 55.41 6.71 _38.01 100.11 54-6.6per f 719.01 ~~99.81 50.4i 122.7: 56.3' 4316.31 70.5 11.3! 3.4, 24.0; 2.91 16.51 43.41 55.1
risal 1 4711.6! 171.31 56.4:. 97.7, 0.4. 6677.6! 70.5:- 7.7' 1.51 23.4! 2.81 16.11 42.31 39.5341 i 90.11 76.61 92.0 10.4 11636.0; 54.1! 17.61 4.01 138.6! 16.81 95.31 250.71 42.8
v 1 13.51 974.7 i 3.3, 106.11 0.2! 11708.6:. 24.71 15.71 0.1! 596.9i 74.21 436.21 1107.31 9.4ry 1 23.61 25866.6 34.6! 70.6! 64.9! 3806.9 47.9:1 17.8,1 1.71 54.21i 6.61 37.31 98.1! 42.0
ry "__ 9489.1!8233.91 1920.2! 878.11 163.4: 107-716.9: 890.6- 753.9; 88.61 1114.4. 156.01 105.41 2327.7! 1108.60.0!- 0.01 0.0, 0.0, 0.0: 0.0, 1 I i I I
~: 67.21 9802.21 2.11 204.1!1 0.0. 35335.8' 9.51 0.61 0.5i 98.0!i 11.9: 67.31 177.21 3.1
431.71 410.41 26.2! 52.! 49.8; 9078.3 i0.0, 1275.Si 0.0; 0.0! 244.71 8002.0'
Seceiu 103.6i 50.1!1 120.9; 149.3i 3.7. 868.9 10.6; 10.31 2.4, 39.01 4.71 26.8! 70.6! 43.6
Wy I10091.61 19772.11 2069.5: 1~284.11 4 61.5S 161001.8, 910.7- 764.8;! 91.5i 1251.4: 172.6 1151.61 257.5! 1155.3ainmnual ~184.81 88.51 79.1!i 177.2: 8.2; 1276.2: 15.4; 12.9; 7.71 12.4 1.7P 7.11 21.21 7.8
aUspor 150.61 116.5! 38.51 82.7! 9.9 741.4i 24.7! 23.1! 6.5! 37.1! 6.21 20.01 63.31 26.0:01nmunic. I 0.0-1 0.0! 0.0! o.o; 0.01 0.0; 2.7: 3.51 4.6; 27.11i 3.6! 19.41 50.1! 18.8
8-3.-2! 90.11 55.41 48.81 2.7! 613.2! 7.5; 8.01 4.2! 0.01 0.01 0.01 0.0! 70.
________ ~~16.11 17.81 12.2! 9.2! 0-6i1 157.4' 1.71 1.8M 0.91 0.0! 0.0! 0.0! 0.0! 0.0
________ ~~71.41 70.31! _4 3. 2' 42.11 2.1-: 489.71 5.9 6.31 3.3;i O0- 0.01 0.0! 0.01 0.0121t. &Heahl 170.71 178.3! 110.7-,- 100.1 S.4 1260.2: 15.3! 16.1 i 8.5, 0.0!- 0.0! 0.0! 0.0! 0.0
- 1 ~~~~179.81 76.61 55.51 34.41 1.6 871.6!; 1.8! 2.8! 4.1 00 00 0.0! 0.0! 102.1* & Insuanc 160.3! 85.2! 33.4i 290.0: 2.3; 994.7: 2.71 3.5! 4.61 0.0! 0.0! 0.01 0.0! 2.0
ont"y 846.3! 545.0!F 317.2! 684.4! 27.4 5144.1: 62.4; 61.9; -36.0! 76.61 11.51 46.51 134.61 156.7
e Od2ter II)UIIsy 10937.9 2017.11 ~2386.7: 3968.5. 489.0 166145.9: 973.1; 826.7, 127.5! 1328.0; 18-!19.210.11 1312.0
dadoan 1324.71 3829.9! 2726.9; -683.2] 40.4 19417.4; 2905.0; 643.0! 176.61 670.4!I 70.71 375.6 i 1116.7!16.
________ ~4895.61 2890.8 2319.5 i 3019.1! 635.5; 30851.8. 1218.9. 1105.0! 334.2! 3219.1 i 490.6I 2071.8! 5781.5! 1217.0
~~es 22~~9.1! 27.7: 45.11 60.2! 4.3. 763.5' 19.5i 26.61 7.81 53! 31 8.01 16.41 23.0ay____ 521.3! 6219.0! 5.3! 0.0! 0.0; 7159.6, , 35.11 5.SJ 22.51 63.11
lurlty ~~493.7! 184.41 196.7 i 234.2; 48.9' 3303.8: 68.2, 92.8, 26.4! 232.6! 36.5! 149.0! 418.11 151.1
cc. Sec I 5.01 665.5 0.6; 0.0;: 0.0 722.8i I 3.81 0.6! 2.51 6.9'
I 229.41 141.3.41 2123.3' 2034.5: 128.6, 28162.21 339.6, 276.4! 474.91 0.0! 0.0! 0.0 0.0; 211.7
urn 300.5! 240.11 195.2! 68.8! 12.4! 2527.51 80.51 108.5i 38.81 29-5! 154j 20.6 65.5! 132.21I 0.0 0.0. 0.0 7.41 0.0. 14352,2! I
0.0! 0.0! 0.0. 0.0 0.0; -12472.5.______ come 0.01 0.0! 113.7i 0.0, 0.0 596.9:
0.01 4845.61 0.0!- 0.01 0.0 4963.3! I 'wue 943.11 9066.2! 0.0 0.0! 276.8. 10286.1; 650.0! 00O 0.01 230.01 50U! 450.0; 730.0!
I-1334.5'! -441.4' -15.8 -5.2; -0.4 -2435.3. -8.91 -5.21
Trade 0.0! 318.8' -30.0i -5418.0:, 217.8! 763.6 I I I________ 9370.~4! 292.17485.4 615.5' 1351.8;: 106435.3; 5201.2; 2334.9 1-014.7; 4425.8 i 672.4! 31 00.0 8i~19821198.8
______ 20308.31 49018B.21 9902.0: 8002.0; 1623.0: 271817.6: 6174.3! 3161.6! 1142.21 5753.8! 856.5! 4298.1 10908.31 3230.80.0! 1391.71 0.0! 0.0! 420.6. 49933.2!
upply '~~20308.3150409.9' 9902.0: 8002.0! 2043.6 321750.8 6174.3: 3161.61 3142.2: 5753.8!i 856.5, 4298.1110908.31 3230.8,
107

Ukraine 3: 1987 Input-Output Table in Purchasers' Prices--SNA Format
Page 3
'29 30 31 32 33 34 35 36 37 38 f 39 . 40 ;41 1 42
_______________'Bank&,i State Total i Defence, TOTAL .House- */ -. Govern. Defencei Total ilnvent.i Net G NP
______________ insur. Admin. Service & Other. OUTLAY. holds Paid Free & Otherl Fixed I Export
I_____Power __ . 54 S56.8 0.0. 4313.3 727.2 727.2. i 0.0! 0.0.77.2jPelro-Gas 1 2.41 9.5- 670.5 259.2! 9291.4 719.7, 719.7. i 0.0' 76.0 J 795.7
3!Coal 1 0.57 1.8 224.8. 4.7 6827.7' 100.1 100-1 I 0.0!i 282.0! 1 382.1
4 1Other Fuels 0.-0: 0.1 6.9 1.1; 44. 3.7 3.7! 0.01 2.1! 5.8
SFerrousMetals 1 0.1! 0.2 84.8. 1.8: 14772.9 7.5 7.5!i .!-130 -105.5
6iN-Feffous Metals 0.Oji 0.0 62.3! 0.0- 3187.8- 0.0 0.0, o.0I -47.81!4.
7IChemicals 2.2' 8.8 i611.6. 639.0 10896.4 1600.5 1600.5 0.O i 14.71 11615.28 MDMW 1.2. 4.61 901.7 6318.7 30590.4 4967.7 4967.7 16204.7 i -594.51 120577.99Wood & Paper 1.3! 5.1! I 90.1. 0.4 4506.8 1813.3 1813.3. 1127.9j 132.81 2074.0
10 Conmu. materials 0.1 0.81 -162.4 0.9; 6840.9 692.2 692.2! 0.0! -97.81 594.4
II LIght Inldustry 0.8! 3.4: 373.4 500.6, 12510.0; 13536.8. 13536.8! 13.51 345.01 13993.3
12 Fod 1dtry 0.01 0.11 I1157.3' 401.9 13267.8 24108.5 ! 24108.51 0.01 330.51 24439.0
13 Other Industry t 3.0! 11.8; 222.3. 0.0 i 4029.2! 2381.9! 2381.9: 9 i.g 222.91 2606.7
14,Total Indusitry f12.9; 51.6: 5233.9. 8128.3. 121079.1: 50659.1 50659.11 51390 52.91 67560.0
l5lCOnstruction 0.0! 0.01 0.01 0.0. 0.0! 2393 0.0; 20308.3
161Agrl. & Forestry I 0.11 0.6! 191.6; 79.51 35 .606.9 11763.5. 11763.5!i 197.5: 448.-61 1320.S1 . 13730.1
17[ProducinT_& C o.o; O.o: 0.0! 9078.3: O.o: 0.0J 793.7i I 0.0! 0.01ISIT & D 0.0; 0.0 i 8002.0; 0.0! 0.0! I 0. .15180 51.
19 Othe Prod. Sectors i 4.0, 16.0: 157.5! 1.0 1027.4' 820.2: 820.2; 18.6! -25.51 1 813.420 usm Oufys i17.01 68.2- 5583.0 8208.8: 174793.6 63242.8 63242.8! 0.01 991.2, 0.01 313514.i51.97721 ousng-ommnal 11.7! 4.7. 81.4. 19.4 1377.1: 4429.0 1992.11 24369.9 238.5! 129.71 472 .J 8 8 .- 4 8 O 9778.2
22 N-Prod. Transpot 16.8! 19.8: 180.2 8.6. 930.2 2035.1 2035.11 0.0' 0.0! 503.41! -307.1 2231.4
231 N-rd Communic. . 9.6!i 13.6! 103.0 2.9 105. 9. 589.3 589.3 0.0 170.0! 318.7' 1 41.71 1036.3
24 Education 4.9: 0.0. 24.7, 0.0. 637.9 5115.9: 399.5 4716.4. 0.0. 0.0 j 1.
25 Cultue 1.3. 0.0 5.7. 0.0i 163.0 693.5-. 372.8 320.7 0.0! 0.0! 693.526 Heath. etc. 3.9! 0.0.- 19.4; 0.0, 509.0 3789.1 i1206.6; 2582.5 0.0. 0.0! 3789.1
27 Educ.. Cult. & Healt 10.1! 0.0, 49.7- 0.0' 1310.0 9598.5 1978.9: 7619.6 0.0 0.01 I19598.5
281sclemc ! 0.01 0.0 110.8: 0.0 982.3 0.0. O.0. 0.0; 616.9 2356.7 -751 24.29f Banking & Insurance: 0.01 0.0, 12.8. 0.0: 1007.5' 623.3 623.3!! 0.0 0.01 0.0! 1 385.01 1008.330IState Admin. O .01 788.5 788.5! 0-0: 352.0i 0.0' 1140.S
31iService Outlays 48.2! 38.1. 537.9. 30.9' 5712.9- 18063.7. 8007.2; 10056.5: 1377.4m 3308.51 I689 26.32lDefense & Other I .0*,. 12048.11 i ' 12048.1
33 lTotaI Outlays 65.2! 106.3 6120.9 8239.7. 180506.5 81306.5 71250.0. 10056.5: 2368.6 15356.6i 37123.51 848.0.-6106.91131896.3
34cDpreciatin 13.1 i74.0 5244.4- 203.31 24865.1 I
35.Wages I198.7! 897.2 10752.5 3480.6 45084.9.
36 _Other Wages 1.71 4.2; 99.2 80.2 942.9.-
38 SocIa Security 17.9 58.8.' 833.3- 44.3 4181.4
40 INet Profit 1 1334.2 i 0.0: 2636.8; 0.0: 30799.0 411 Bonus Wages i 50.21i 0.0, 475.7' 3003.2 . I
42 1Tumcover Tax :0.0 14352.2. i i
43 1Net Subsidies i ;0.0 '-12472.5 . r440ther Net Income : 0.0 596.9 .... .I
45 Kolkhoz Income I0.0' 4963.3-.[
46 Private Income ! 1580.0 .11866.1 , .I I______47 Totallosms -14.1 . -2449.4 IrI
48Ne oreign Trade 385.0 i 38S.0 1148.6 .I________
49j N 1950.6 1034.2, 21652.6 3808.4 131896.3 S0 ONTtI Output 1630.8.1140.5; 27388.5 12048.1 311254.2.51 jJbrt I : 0.0 49933.2 52IToml Suapply :1630.8.1140.5: 27388.5 12048.1: 361187.4
108

Ukraine 3: 1987 Input-Output Table in Purchasers' Prices--SNA Format
Page4_ ____ -__________ 43 44
_ Expoms TOTAL
_ USESI POW_ _ W 541.3; 5581.82 Petuo-Gh 750.6- 10837.73 Coal 966.4. 8176.24 Oher Fuels 0.0: 50.25 Ferous MeWis 7598.51 22265.96 N-Fenous Metls 922.7: 4062.77 Chemicals 3687.9 16199.58 145MW 116209.0 67377.39 Wood & Paper I 445.2i 7023.9
1o lCO . mdatrals 1 730.21 8165.5I I light Industy 2752.2: 29157.512 Food lndsusy 6999.31 44706.213 OCher Industry 842.6: 7478.514 Totul Industy i 42445.9; 231085.0IS Cnstucltion _ 0.0! 20308.316 Agi. & Forestry 1072.9; 50409.917|Producton T & C j 30.01 9902.018ET & D I 0.01 8002.019 Other Prod. Sectors 202.8 2043.6203Ia "IaOudtas 43751.6 321750.821 Hodng.sCommunai 6174.322 N-Prod. Tnsport 3161.623 N-Prod. Communic. I 1142.224 Educaton 5753.84 Cultue 1 856.526 Health. et I 4298.127EduA. Cut & Health i 10908.528 ScIen e 3230.829 RankIng & Insrance I 1630.830 State Admtin. I 1 1140.531 ScndvIe OuUys 27388.632IDdeee & Other I 12048.133 Tud Oaf ys 143751.6; 361187.4
34Depfton I - 24s9.,35 Wages ! 45119.936 Oher Wages i 978.9371 KOlkhz Pay 1 7259.738lSoca Secouity 4219.439 ICkho Soc. Sec. 768.7401 NeT Profit 30839.041 Bonus Wages 3044.242 Turnover Tax i 1 14394.243 Net Subsidies 2429.S44 Other Net Income 640.94_ Kolkhoz Income 5 5008.346 PrvtelncomeM 11912.147 Total loses -2402.448 Net Foregn Trade 1 196.6490 N P 131945.3SD Tot Ouipot i 1311304.251 hi,Port I49984.252 Totl Supply 1 361239.4
109

Uzbekistan 3: 1987 Input-Output Table in Purchasers' Prices--SNA Format?dllUon Rubles, Current Prices
_____________________________________ ~~~~~~~~~~~~~~~Page I
1 [.3 ! ~~ ~~~4 5 6 7 8 9 I 10 1 11 12!f 13 14Power4 Petro-I Coal I Other i Ferr. I 'N-Ferr. Ch,em. iMBMW! Wood& Coast. I Ught I Food Other Tot'al
_____________________ ~~GasI Fuels iMe"i Metals Paper Maler.F:I__ Inld. IndustryI IPower 13.21 35.31 2.0 0.0: 5.11 41.0: 162.3: 58.01 6.41 51.41 52.71 30.71 44.6i 502.9
2'Petro-31.4Ga4.8 061 0.01 5.11 12.2! 55.6! 32.51 2.41 67.81 12.6; 18.81 6.01 930.83lC-oal 35.61 r 0_.0 1.11 0.0, 0.01 1.8: 0.31 0.81I 0.11 4.81 0.4' 1.5 0.21 46.64i1Other Fuels 0.01 0.01 0.0' 0.0 0.01 0.0, 0.0! 0.11 0.01O 0.11 0.01 0.0. 0.01 0.25IFerrous Metals 1.31 2.61 0.7' 0.0, 85.8: 13.7: 15.31 346.0' 11.21 98.91 20.11 4.0, 1.17 6-00.76iN-Ferrous Me"al 0.21 0.0! 0.0, 0.0: 11.2: 434.8! 14.61 406.21 0.21 3.51 0.8! 1.61 22.81 895.97; Chemlcals *7.7! 27.71 2.2! 0.0' 2.2: 17.0: 561.71 126.01 20.01 28.51 140.2 17.71 20.61 971.4
-8MBM%W- 14.11 5.61 4.5. 0.01 8.91. 23.0! 60.5i 961.11 20.11 53.51 68.3! 20.01 7.21 1246.89iWood & Paper i 0.51 0.31 1.6. 0.01 1.0l 3.5 i 65.01 42.41 165.21 41.71 19. 39.01 4.81 384.4
lIOIConstr. Materials 3.91 0.21 0.1; 0.01 0.6. 1.8, 7.2' 16.91 8.4i 365.51 6.5. 36.11 2.3 1 "9.4I I LightIndustry 0.7_ 0.31 0.2! 0.01 0.31 1.8. 42.0! 31.31 25.41 11.9r 3146.3 285.41 15.1 , 3566.712IFood Industry 1 0.41 0.3! 0.01 0.01 0.2. 1.7- 36.71 4.01 0.51 2.3! 4.911688.61 36.31 1775.8131Otherlndusu 3.7! 1.91 0.0! 0.01 0.0' 0.8. 5.61 7.8! 0.31 3.81 16.9! 34.11 111.7! 186.51I4Totai Industy 1 9.7 479.1! 13.0' 0.0;' 120.4! 553.1! 1026.6- 2033.0i 260.3! 733.71 3489.112177.5!_ 272.6! 11552.0M5construction i 0.0! 0.01 0.0~ 0.0 0.01 0.0; 0.01 0.0! 0.0! 0.01 0.01 0.0! 0.0! 0.016.Api. & Foresny I .0 0.01 0.01 0.0 i 0.01 0-! .0. 0.11 0.2! 1. 2 0.2! 4072.71 2038.0! 123.41 6235.717Pouto & I 4.31 337.6! 17.8! 0.0; 65.81 14.5. 71.3L 178.51 71.6! 483.3! 60.21 92.4! 44.51 1441.9
281T & D I~ -0.01 178.01 6.5! 0.0; 27.3! 0.1i 156.61 197.3! 33.2! 34.7! 375.41 519.11 51.9! 1580.0.19! Othier Prod. Sectors 1 6.11 4.6! 0.Oi 0.0, 16.2; 23.6 _1_2.5,_, 28.61 5.4! 8.3T 13.31 9.2! 21.41 149.220 1 ldasrsi outlays 404.1 i 999.21 37.3! 0.0! 229.7: 591.4. 1267.0. 2437.7!i 371.71 1260.11 8010.61 4836.11 513.8! 20958.821 H-ousing-Communal 10.6! 6-.3! 0.31 0.01 1.8. 4.3: 10.91 40.2! 4.71 12.01 38.6! 18.01 9751 157.122IN-Prod. Transport 1 2.0! 0.31 0.3!_ 0.0! 0.4, 2.0i 3.2i 27.5! 4.1! 12.1! 19.8! _ 3.31 7.7! 82.7231N-Prod. Communic. i 0.0i1 0.0! 0.0! 0.0! 0.0. 0.0: 0.0! 0.01 0.0! 0.0! 0.0! 0.0! 0.0! 0.024 Educakton 6.81 3.0! 0.1! 0.0! 0.9. 7.81 6.81 25.11 3.11 7.41 17.21 6.6! 6.2! 91.025!ICulture .j 1.51 0.6' 0.0' 0.0! 0.21 1.11i 1.5! 6.96 0.7 1.61 4.6 1.5 1.4! 21.626 'Health, etc. - i 5'.0! 2.3. 0.11 0.0! 0.7' 3.8: 5.3! 16.21 2.4f 5.8! 11.4 4.6! 4.8! 62.527 jE4uc.. Cult. & Healthl 13.31 5.9i 0.31 0.0! 1.9! 12.71 13.6i 48.2! 6.11 14.9! 33.2! 12.71 12.41 175.028!Science I 8.2i 5.21, oil 0.0! 0.6! 10.3i 6.4! 68.9! 2.2J 9.31 12.3! 3.21 2.61 129.129f Banking & Inswurac i 6.011 4.11 0.1!j 0.0i 0.5: 2.6; 4.51 40.11 1.6! 3.8! 39.6! 22.9! 3.2! 129.030 1State Admirn. - ____
31 ServlseOutlays 40.11 21.8! 1.01 0.01 5.11 31.9: 38.6! 224.9! 18.6 52.0 143.5! 60.1! 35.4! 673.032:.Defease &Other .
33.Total Outlays 444.2! 1021.01 33.3! 0.01 234.9. 623.31 1305.61; 2662.5! 390.3! 131_2.1 8154.1! 4896.3: 549.2! 21631.8
34Depreciation 18g8.3! 128.81 11.71 0.01 18.6i 98.71 293.21 320.81 26.0! 177.3 I 181.9! 119.2! 62.5! 1626.93SlWages 160.4! 19.61 10.41 0.0! 10.3! 8s.o;' 117.8! 643.4! 67.31 221.81 446.01 190.2! 81.61 1953.7361 Other Wages 1 2.0! 0.8! 0.11 0.0! 0.2! 3.3: 4.6! 19.2! 1.2! 5.1! 6.61 5.3! 1.6! 50.037!Kolkhoz Pay 0.3! -o 0.0! -0.0! 0.01 0.010Oi .! 15.2! 2.01 4.6 . 27 . 27.43SI[Social Security I 7.71 2.31 1.31 0.0! 1.6 9.6! 12.3! 72.4! 3.9i 38.1 47.71 18.3 6.0 201.239 Ko1khoz Soc. Suc. I 0.01 0.0! 0.0! .0 0.01 0.0 0.0! 1.7! 0.2! 0.5 0.0! 0.3 0.2 3.140 Net Profit 1 22.:191.2! 7.81 0.0' 12.8; 140.8, 121.21 405.7! 54.1! 156.7 529 .4 208.2 57211411 BomiaWages 9 .3,; 3.8! 1.1!F 0.0! 0.6! 8.0- 9.91 77-5! aol 10.7 25. 4.11 178.342 iTurnover Tax i 71.81 177.71 0.0! 0.0i 0.4! 0.0' 61.5! 52.8! 6.01 43.0 1787.411262.51 69.01 3532.043tNet Subsidies I 0.0i 0.0! *18.31 0.0 0.0! 0.0 .157.9! -71.4! 0.0! 0.0- -839.9' -717.8j 0.0! -1805.344!te Nticm 0.01 47.3! 0.6_ 0.0! 4.6' 21.2: 38.8; 0.0! 0.0! 51.4!- 0.01 34.3f 0.0! 178.245 1Kolkchoz Income I 0.0! 0.0! 0.0! 0.01 0.0; 0.0; 0.0! 1.41 0.31 0.11 0.0, -11.5! 0.1 f.9.746 IPrivate Income 0.01 0.0! 0.0! 0.0! 0.0' 0.0' 0.0: 0.0! 0.0! 0.0! 0.0! 0.0! 0.0! 0.047!Tota Losse i -2.5! .2.01 -0.2! 0.0! -- 0.21 -1.3. -6.5 i -16.4i -. 0! 5-56! -57.5! -1.61 -13.0! -116.7
48!Ne: Foregn Trade !-50.1!1 388.3! 34.0i 0.21 56041i 39.6 243.4!i 2164.5: 708.8!15.-1291718 196.5! 94.4910 N P 1 .502.71 954.Oj 47.2: 0.2! 608.7! 397.0! 708.41 3609.4; 859.81 826.S1 439.2! 2281.9, 465.4! 11700.3
Z ~T j UV 997.0! 1586.7! 51.5! 0.0! 283.0! 980.7! 1770.7! 4107.4! 541.41 1985.21 10256.2! 6006.4! 818.0 2934.1511impon I 151.8! M901! 47.8T! 0.2! 671.8! 387.0! 979.5! 3292.0! 7414!1 235.8! 2616.7!191%.1! 231.41 12M30.52!TaMl Supply 1 148.8' 2576.8! 99.31 0.21 954.8! 1367.7. 2750.2! 7399.4! 3282.9! 2221.01 12872.91 7967.5! 1049.4! 41690.
110

Uzbekistan 3: 1987 Input-Output Table in Purchasers' Prices--SNA FoDrMat
______________I 15 16 i 17 . 18 ! 19 I 20 21 ;22 l23 24 j 25 I 26 27 4 28__________~~I Constr. lAgIcult.! T&C -I T&DI Other iTOTAL ;Housing Trnsp. iComm. i Educ. ICWlt I HealhhlEdu. &-.Sdence
_l t Power 40.5! I ~~~~~~~~~~~~ ~~Prod. iPROD.!I IHetiI Peo-Gas i 0 39.61 45.11 32.21 3.11 663.3, 59.1! 9.2! 5.7! 36.71 4.4: 25.2! 66.41 6.82 P__-____10___14_8 19.3 18.81 1.0i 1436.2: 12.7: 116.71 2.2! 18.41 2.2- 12.71 33.31 12.7
3 Coakl 1 0.8 6.9; 2.8; 1.71 0.2! 58.91 0.0, 0.1! 0.21 10.81 1.3; 7.4! 19.51 0.34 OtheFuel O.O. 0.0: 0.Oi 0.01 0.0, 0.2. 0.0: 0.0' 0.01 0.01 0.0! 0.0! 0.01 0.0S Ferrous Mem] 215.9: 6.9i 7.8; 1.6; 0.0: 832.9, 1.2! 0.81 1.11 0.41 0.1 i 0.31 0.8 1 4.06 N-Ferrouseral 2.11 0.21 0.3! 0.2! 0.1: 8987.7 0.01 0.21 0.0! 1.71 0.21 1.1 i 3.0! 3.97 Ctemlcal 97.2: 384.6: 34.1! 4.6; 0.9, 1492.7 5.41 15.0; 1.01 6.41 5.8!1 73.8; 85.9! 10.38813mwI 347.6. 284.01 61.2! 58.4! 3.11 2001.1; 12.21 41.9i 4.91 25.2: 3.1! 17.3; 45.61 31.19 Wood 5 Paper 338.8. 21.0i 4.5i 25.5! 9.0: 783.2i 8.0! 1.3! 2.91 15.2! 1.81 10.5! 27.51 6.6
10omsunt. Mauteral 1363.6: 41.4: 4.5- 24.9! 0.21 1884.1!' 4.8i 4.5!1 0.0! 6.41 0.8! 4.4! 11.61 6.61 1 L1Sht Indus"y 10.2' 92.3i 4.2i 19.4! 0.6! 3687.4; 11.1 2.41 1.61 56.91 6.91 39.11 102.9! 4.912 Food lnduaty 2.9, 134.2, 0.3. 27.4! 0.1 1940.7 2.6! 3.0, 0.0! 176.8! 22.0! 129.81 328.71 0.313 Other Indus". f 7.Oi * 285.6: 6.3, 7.11 22.1: 514.5! 5.0! 1.1. 0.0: 14.81 1.81I 10.11 26.7! 3.1
14ITol Indstry 2S27.1j 1491.5! 361.3! 221.6- 40.4; 16193.9! 122.1! 196.2! 19.6i 369.71 50.4! 331.8! 751.9! 90.6ISicosuuctlou 0.01 0.0! 0.0. 0.01 0.0. 0.0: 16jA5r. & Foety0.61 838.!! 0.2! 25.9' 0.0: 7100.6. 5.6! 0.1v 0.0! 31.5! 3.81 21.6j 56.9! 0.117 Prodction T &C r152.91 11 1.2! 7.0! 8.4! 23.11i 1744.5! IST &D 0.01 472.5j 0.01 0.0i 12.01 2064.5 I19 Othe Prod. Sectors [ 11.8 9.8 1.9: 15.2! 2.2: 190.11 0.81 2.81 0.01 6.4! 0.8! 4.41 11.5! 6.120 U&WW uOtUay 12692.4 2923.11 370.4i 271.1:1 77.71 27293.61 128.4; 199.11 19.6! 407.51 55.01 357.81 820.3! 96.821 HoisCuus 87 12.4! 11.2i 28.9! 2.71 231.1! 3.01 3.21 14 . . . . .22,N-Prod. Tranpor 1 19.0 15.6! 5.9; 13.7! 3.2. 140.1! 4.81 5.71 1.21 15.41 2.7! 16.1! 34.21 4.123 N-Prod. ca nc .! 00 .. 0.0: 0.0;. 0.01 0.51 0.91 0.9! 5.41 1. . 15.11 4.924 Education 1 18.61 12.71 8.5! 9.1! 0.9' 140.8i 1.4! 2.0! 0.8! 0. 01.0 ~ 0. 01 25 Cuturte 1 2.1! 2.8-.r 1.91 1.71 0.2! 30.31 0.31 0.41 0.21 0.0 0.00 ! 0.0! 0.0
26 HoWth. ew.9 5.1 5.01 0.7.! ~89.6: 1.1! 1.51 0.61 .01 0.01 ! 1 0.1 0.027 Educ.. Cut. & Healdth! 28.7! 23.4! 16.0! 15.81 1.8, 260.7: 2.9; 4.0! 1.61 0.01 0.0! .0 0.01 0.0! 2'sScieace 20.71 12.61 10.61 5.31 0.5! 178.9i 0.3' 0.7! 0.81 0.01 0.0 0.0i 0.0! 14.229flBaklng& mnauwae 19.51 12.6! 5.1 1 141.0! 0.7! 308.0: 0.5: 0.91 0.9! 0.0[ 0.0 0.01 0.0! 0.3,
30OStaleAdmin II*
31 Seewlm Oudsy T10631 76.71 48.91 204.8! 9.0. 1 1 18.8 12.0. 15.31 6.71 24.91 5.1 83 58.31 24.733 Totld Outlay 2798.91 2999.81 419.3! 475.9; 86.7- 28412.4. 140.4 214.4! 26.3! 432.4! 60.1 386.11 878.61 121.5
34 DepreciatIon 4495 876.21 550.4! 192.71 12.5! 3708.2! 619.9! 141.2! 27.4! 153.71 16.21 86.11 _256.01 69.035 Wags 1782.81 1718.71 565.6! 833.01 122.6! 6976.5i 258.0. 230.0! 60.31 1453.6! 100.0! 831 24.1 211.636 Othe Wage 89.01 19.0- -21.21 9.91 0.61 189.9! 5.9! 8.61 1.8! 6.51 2.01 6.21 14.71 4.837 Koftho Pay 1 0.01 1700.5! 0.01 0.0! 0.0i 1728.01 I 13.61 1.71 8.21 23.5,38 Socia1 security 154.81 74.3! 44.31 52.8! 9.0' 536.4! 14.5' 19.31 4.81 10S.51 7.31 42.6' 155.41 26.439Kama ~SOC. Sec. 0.01 173.91 0.01 0.0! 0.0! 177.0! I 1.51 0.21 0.9 2.6140 Net Profit 385.71 216.41 309.21 502.6t; 6.5' 3531.9. 43.1! 115.6 -87.8! 0.0 0.01 0.0! 0.0! 38.241 BonnsWage . 1.21 84.51 33.81 46.81 0.0. 394.6: 17.11 43.3i 7.0: 14.4 2.01 7.91 24.31 23.142 Twrover Tax 0.01 0.0! 0.01 0.31 0.0! 3532.3!1 43 NotSubddies I 0.01 0.0! 0.01 0.0! 0.0! -1805.3i 44 Other Net Incme 0I 0~.01 100 0 .br F .Oi188.2i .01 0.01 0.01 0.01 0.01 0.01 0.0! 0.045 Kolk hozln I 0.01 297.8! 0.01 0.0! 0.0! 288.1' 46 Private Income 272.8 2399.11 0.0! 0.0! 94.61 2766.5: 109.0!- 49.0!1 90.0! 9.01 102.0j 201.0!47 Told Loses20.7 -203.11 -9.4! -2.7! -0.5;" -533.1: -3.6' -0.9! 48 Net Foreipn Trade I 21.41 0.0! -4362.0; 30.2: -362.4 !490G N P 2934.0' 7294.31 1491.41 -2773.3! 275.5: 20922.1, 1050.4! 560.11 18.2 1838.8: 138.41 841.21 2818.4! 350.050 TOtal OutpU 5732.9! 10272.6! 19-10.7!i 2064.5. 332.0! 49696.9. 1190.81 774.5! 207.5: 2271.2! 198.5! 1227.3; 3697.01 471.551 limport 0.0! 610.8! 0.01 0.0! 56.1! 12973.61
52 Total Supply ~5732.9! 10883.4; 1910.7! 2064.51 388.1! 62670.6 1190.8- 774.51 207.5: 2271.2' 198.51 1227.31 3697.0! 471.5
III

Uzbekistan 3: 1987 Input-Output Table in Purchasers' Prices--SNA Format
________________________________________________________________________Page 3
I 1~2 9 130 i31 i32: 33 34 i35 36 37 38 139 140 1 41 142_______________Bank& i State i TOTAL!I Defence, TOTAL House- -- I-I Govern. i Defence!I Total i Invent.: Net IGNP
I Power ~ ~ inu. Amn. EV.&Ote OnA holds '!Paid Free i I& Other! Fixed i Export jIPower _____ I 0.31 1.21 148.7; 0.01 812.0 134.9. 134.9! t 1O . 0I 0.1 0.0! 134.9
2 Petro-Gas I 0.9, 3.6i 182.11 33.31 1651.6: 296.0! 296.0; r 0.01 27.4 0.01 323.43~ Coal 0.11 0.7; 20.91 0.6i 80.41- 7.01- 7.0! ! _ I 0.0 -1.8i o.o 5.24 Other Fuels I 0.0 0.1~ 0.1! 0.1! 0.4! 0.0; 0.0! I~J 0.0' -0.1! 0.0 -0.15 Ferrou Mets I 0Oi 0.0! 7.9! 0.21 841.01 14 1.4( I 0.01 1.01 0.0; 2.46 N-Ferrous Metals I 0.01 0.0! 7.11 0.01 905.8: 0.0I 0.0! _____ 0.01 114.51 0.0- 114.57 QChlcals I 0.9j 3.4j 121.9! 82.11 1696.7: 333.6; 333-6, 0.01 -16.11 0.01 317.5a 149MW T 0.31 1.21 137.2; 771.11 2909.4. 1178.11 1178-11 2786.9! -602.61 0.0! 3362.49 Wood &Paper 1 0.2! 1.01 475 0.0; 830.71 361.2 361.21 90.1 22. 0. J49.
10 Consir. MAterial 1 .0. 0.21 27.71 0.11 191 1.9! 166.4' 166.41 J.0 60f.31 0.01 226.7I1 Igh Indsy 1 0.31 1.0! 124.2; 65.51 3877.1! 4255.9 4255.9:' 1 13671323.71 .0I4716.312 Food Industry I 0.01 0.01 334.6. 52.91 2328.2; 4834.2; 4834.21 1 I0.01 15. 0ol40.113 Oter n.!lust,' 0.61 2.3: 38.8'i 0.0; 553.3, 368.7; 368.7 71. 0.0j~ŽI 1 461.314 Total IziduStrY 3.61 14.7 i 1198.7' 1005.9. 18398.5~ 11937.3; 119374; 3076.0 79.5 0.0114933.81s Coamruction I o.0; o.o1 5732.91 0.01 0.01 5732.9
1Ao.&ForesftrY 0._I1 0.21 63.0! 10.5' 7174.1' 2612.2! 2612.2'1263 7. 0.01 3120.117 Production T & C I 0.0 -0.0! 0.0! 1744.5 o.o! 0.01 1 66.2! 0.01 0.0! 0.01 166.218T&D I 0.01 0.0i 206.5i 0.0! 0.0' I 0.0! 0.01 -4362.0; -4362.019 Other Prod. Sectos 1.41 5.51 28.11 0.0: 218.2! 104.6! 104C; 1113-01 26.3! 0.0 143.920 MamIa Outlays 5.1! 20.41 1289.71 1016.4' 29599.7:14654.1 j14654.2. 0.0; 166.2! o.oT 9058.11 218.4 -4362.0 19734.9-21 HNouslng-Commwza I 2.7! 1.4! 21.91 74.8! 327.8: 789.61 370.51 419.11 58.1! 15.3! I f 863.022 IN-Prod. Transport j 3.0! 5.81 58.71 31.8! 230.7i 559.9! 559.9! 0.0! 0.01 59.41 [ 45.5! 543.823 N-Prod. Communuic. I 2.5i 4.01 28.71 11.3! 40.0~ 85.3! 85.31 0.0i 55.71 43.3! -16.81 167.524JEducation t 1.3! 0.0j 5.6! 1 146.3i 2124.9!- 110SJ) 2014.4:; 0.01 0.0! I 2124.925 CWslar ( J 0.3! 0.0i 1.21 1 31.5! 167.01 74.61 92.41 0.0! 0.0! 167.026 Health. etc. I 1.0! 0.0! 4.31 94.01 1133.3i 182.21 951.1!I 0.01 0.01 { - 1133.327 Educ.. CulL & Healthl 2.7! O.01 11.11 271.81 3425.21 367.3! 3057.91 0.01 0.0! 3425.228 ScIence 0.01 0.0! 16.0;i I 194.9! 0.0! 0.0! 0.0! 211.1! 217.51 ; .152.01 276.6
29 aniag Inurace 0.01 0.01 2.51 1 310.5; 74.91 74.91 0.01 0.0! 0.01 - 00 1.30 StateJ Admin i164.8! 164.81 0.0, 59 0.01 1250.6
31 ServiceOutlam I 10.9! 11.2! 139.0! 1 17.91 1375.7! 5099.7: 1622.71 3477.01 410.71 335.51 0.0! 0.01 -204.35641.6,32 Defcnse &Other i ! I.I.' 'i 'i 2847.91 12847.933 Tooal Ouftla 116.0! 31.6! 1428.71 1134.3; 30975.4; 19753.9; 16276.9; 3477.0j 576.91 3183.4i 9058.1! 218.41 -4566.3128224.3
34IDepr'eciation 2.4! 13.6! 1129.5! 90.61 4928.31 i i. 35Wages 36418.!3121.71 332.71 10430.91 i 1i
36 Other Wags . 1.21 4.2! 41.2! 9.21 240.3137S8khz ty 3.; 16.1 2 59I155'5-1 --
40NetProf 1 325.8 .0! 610.5 125. 1539.6!
39 alko So. Sec. I I 2.6; 1 179.6;
411 Bonus Wages 13.5. 0.0: 128.3; 12.1~ 535.0! 7 42ITuroverTa J: 0.0! 3532.3 ______I 'I43 Net Subimdies 0.0! 1 1805.3 i____
44 OtheNet noe I 0.0 0.0! 0.01 188.2 -I
45 Kolkhoz Incoen O! 288.1146 PrIvate Income 1 359.0 3125.5!_ _ _ _ _ t- ~-
47 Toul____I____4__51__ 537___6__I_ _ _ _ l48 Net Foreign Trade 4___0___ _40_0 _____322__4i
490 N P 409.4! 219.0t 5588.5! 1713.6i 28224.3i I______- *.-50 Total Output 385.4! 250.61 6977.2! 2847.91 59522.11 r________ ________
51 Import I 27I6 ' II
52[Total Sup*l [ 385.41 250.6! 6977.2! 2847.9; 72495.8 ., i 112

Uzbeldstan 3: 1987 Input-Output Table in Purchasers' Prices-SNA Format
_ Page 4
1 43i 44_ Expors TOTAL
USESI PoWer 201.9, 1148.8
2 Peo-Gas 601.8; 2576.83 Coal r 3.81 99.44 Othr Fuels O.Oi 0.3S Fenum Metas X 1.3i 954.86 N-Ferrous Me"ls 347.41 1367.77,Chemicals 1 736.11 2750.3SdBMW I 1l27.! 7399.3
9 Wood & Paper i 32.71 1282.710 Canw. Materials 82.41 2221.01I Uht Industzy 4279.61 12873.012 Food Industry 789.31 7967.613 O>er Industry 34.91 1049._14 Totl Industry 8358.7i 41691.0
IS Co0ncfion 0-0: 5732.s
16 ASri. & Forastry 589.4. 10883.617 Pioducton T & C 0.01 1910.718T&D O.Oi 2064.519 Othe Prod. Secsr 25.91 388.020 Maer Ouna 1 8974.0! 62670.621 -Housin-Communal j II90.822 N-Prod. Traspon i 774.523 N-Prod. Communlc. ] 207.524 Education i 2271.22S Cu r 198.526 Health. etc. i1227.3
2 Edi. ~CUIL & Health! 3697.028!sdeaf 471.5
B9fanking &lnunc'385.430StLate Ad -in 250.631ISet"CleOuday I 0.0 7221.632IDdense & Other i 2847.933'Total OuT- 8974.0' 72495.8
34 Deprecda _
36 Odier Wages37 IClkltoz Pay38 Social Secudty __ -_ -39 Kolbkoz Soc Sec.40 Net Profit41 Bonus Wages I42 Tuxover Tax
43 Net Subsidies44IOther Net Income4S Kolkhoz Incoame
46iPrivate Income47 Total LIsae48 Net Foreign Trade49 N P50 Totl Output
52 Totl Supply113

Policy Research Working Paper Series
ContactTitle Author Date for paper
WPS1 048 Targets and Indicators in World George Baldwin November 1992 0. NadoraBank Population Projects 31091
WPS1049 Money Demand and Seignorage- William Easterly November 1992 R. MartinMaximizing Inflation Paolo Mauro 31448
Klaus Schmidt-Hebbel
WPS1050 Marginal Income Tax Rates and William Easterly November 1992 R. MartinEconomic Growth in Developing Sergio Rebelo 31448Countries
WPS1051 The Legal Framework for Private Cheryl W. Gray November 1992 M. BergSector Activity in the Czech and 36969Slovak Federal Republic
WPS1052 A Reappraisal of How Oral Hoda Rashad November 1992 0. NadoraRehydration Therapy Affected Mortality 31091in Egypt
WPSI 053 Development of the Zimbabwe Alex F. Zinanga December 1992 0. NadoraFamily Planning Program 31091
WPS1054 Distributional Impact of Cash and Branko Milanovic December 1992 S. MoussaIn-Kind Social Transfers in Eastern 39019Europe and Russia
WPS1055 Wealth, Weather Risk, and the Mark R. Rosenzweig December 1992 C. BantonComposition and Profitability of Hans P. Binswanger 34783Agricultural Investments
WPS1056 Earnings and Education in Latin George Psacharopoulos December 1992 L. LongoAmerica: Assessing Priorities for Ying Chu Ng 39244Schooling Investments
WPS1057 Measurir.g the Incomes of Economies Socio-Economic Data December 1992 E. Zamoraof the Former Soviet Union Division 33706
International EconomicsDepartment
WPS1 058 The Pricing of Country Funds and Ishac Diwan December 1992 R. VoTheir Role in Capital Mobilization for Vihang Errunza 31047Emerging Economies Lemma W. Senbet
WPS1059 Political Economy of Policy Reform ZIya 6nis December 1992 S. Gustafsonin Turkey in the 1980s Steven B. Webb 37856
WPS1060 Economies of the Former Soviet Dmitri Steinberg December 1992 E. ZamoraUnion: An Input-Output Approach 33706to the 1987 National Accounts

Policy Research Working Paper Series
ContactTitle Author Date for paper
WPS1034 Revising Financial Sector Policy David H. Scott November 1992 K. Waeltiin Transitional Socialist Economies: 37664Will Universal Banks Prove Viable?
WPS1035 How Import Protection Affects the Wendy E. Takacs November 1992 D. BallantynePhilippines' Motor Vehicle Industry 37947
WPS1036 Output Decline in Hungary Simon Commander November 1992 0. del Cidand Poland in 1990-91: Structural Fabrizio Coricelli 35195Change and Aggregate Shocks
WPS1037 Vocational Secondary Schooling, Ana-Maria Arriagada November 1992 C. CristobalOccupational Choice, and Earnings Adrian Ziderman 33640in Brazil
WPS1038 Determinants of Expatriate Workers' Ibrahim A. Elbadawi November 1992 A. MaranionRemittances in North Africa and Robert de Rezende Rocha 31450Europe
WPS1039 Education, Externalities, Fertility, Martin Weale November 1992 PHREEand Economic Growth 33680
WPS1040 Lessons of Trade Liberalization in Jaime de Melo November 1992 D. BallantyneLatin America for Economies in Sumana Dhar 37947Transition
WPS1041 Family Planning Success Stories in Moni Nag November 1992 0. NadoraBangladesh and India 31091
WPS1042 Family Planning Success in Two Jane T. Bertrand November 1992 0. NadoraCities in Zaire Judith E. Brown 31091
WPS1043 Deriving Developing Country Stijn Claessens November 1992 R. VoRepayment Capacity from the Market George Pennacchi 33722Prices of Sovereign Debt
WPS1044 Hospital Cost Functions for Adam Wagstaff November 1992 0. NadoraDeveloping Countries Howard Barnum 31091
WPS1045 Social Gains from Female Education: Kalanidhi Subbarao November 1992 M. AbundoA Cross-National Study Laura Raney 36820
WPS1 046 World Bank Project-Financed J. Price Gittinger November 1992 0. NadoraResearch on Population, Health, Carol Bradford 31091and Nutrition
WPS1047 Cote d'lvoire: Private Sector Enrique Rueda-Sabater November 1992 P. InfanteDynamics and Constraints Andrew Stone 37642
Related Documents