ECONOMIE ŞI SOCIOLOGIE / ECONOMY AND SOCIOLOGY 1 E CONOMIE şi SOCIOLOGI E REVISTĂ Ministerul Economiei al Republicii Moldova Academia de Ştiinţe a Moldovei revistă teoretico-ştiinţifică, fondată în anul 1953 publicaţie ştiinţifică de profil Nr. 1-2 / 2017 ISSN: 1857-4130 Chişinău, 2017

Welcome message from author
This document is posted to help you gain knowledge. Please leave a comment to let me know what you think about it! Share it to your friends and learn new things together.
Transcript

ECONOMIE ŞI SOCIOLOGIE / ECONOMY AND SOCIOLOGY
1
No. 1-2 / 2017
ECONOMIE şi SOCIOLOGIE
REVISTĂ
Ministerul Economiei
al Republicii Moldova
Academia de Ştiinţe
a Moldovei
revistă teoretico-ştiinţifică, fondată în anul 1953
publicaţie ştiinţifică de profil
Nr. 1-2 / 2017
ISSN: 1857-4130
Chişinău, 2017
Revistă teoretico-ştiinţifică / Theoretical and scientifical journal
2
No. 1-2 / 2017
COLEGIUL DE REDACŢIE:
Redactor-şef:
Alexandru STRATAN, doctor habilitat, profesor, Republica Moldova
Membrii:
Gheorghe MIŞCOI, membru corespondent, Republica Moldova
Andrei TIMUŞ, membru corespondent AȘM, fondator, Republica Moldova Gheorghe ILIADI, doctor habilitat, profesor, Republica Moldova
David SMALLBONE, doctor, profesor, Marea Britanie
Michael GRINGS, doctor, profesor, Germania
Luminiţa CHIVU, doctor, profesor, România
Vasa LASZLO, doctor, conferenţiar, Ungaria
Thomas RESL, ing., M. Sc., Austria
Stasys RIMANTAS, doctor, profesor, Lituania Jamila BOPIEVA, doctor habilitat, profesor, Kazahstan
Vilayat VALIYEV, doctor habilitat, Azerbaidjan
Karl William VIEHE, B.A., M.A., J.D., M.L.T., SUA
Tomas KUCERA, doctor, Republica Cehă
Gemma MASAHIKO, doctor, profesor, Japonia
Apostolos PAPAPHILIPPOU, doctor, Grecia
Euphrasia Susy SUHENDRA, doctor, profesor universitar, Indonezia
Dimitre NIKOLOV, doctor, profesor, Bulgaria
Serghei PIROJCOV, Ucraina
Nina WEBER, M. Sc., Austria
Dumitru MOLDOVAN, membru corespondent, Republica Moldova
Elena PĂDUREAN, doctor, România
Dorina ROȘCA, doctor, Franța
Andrzej KOWALSKI, doctor habilitat, profesor, Polonia
Emil DINGA, doctor, profesor universitar, România
Zinaida ARICOVA, doctor, conferenţiar, Republica Moldova
Galina ULIAN, doctor habilitat, profesor, Republica Moldova
Dmitrii PARMACLI, doctor habilitat, profesor, Republica Moldova
Alexandru GRIBINCEA, doctor habilitat, profesor, Republica Moldova
Ludmila COBZARI, doctor habilitat, profesor universitar, Republica Moldova
Victoria GANEA, doctor habilitat, conferenţiar, Republica Moldova
Tudor BAJURA, doctor habilitat, profesor, Republica Moldova
Valeriu DOGA, doctor habilitat, profesor, Republica Moldova
Tatiana MANOLE, doctor habilitat, profesor, Republica Moldova
Olga GAGAUZ, doctor habilitat, conferenţiar cercetător, Republica Moldova
Larisa ŞAVGA, doctor habilitat, profesor universitar, Republica Moldova
Vadim MACARI, doctor, conferenţiar cercetător, Republica Moldova
Victoria TROFIMOV, doctor, conferenţiar, Republica Moldova
Rodica PERCIUN, doctor, conferenţiar, Republica Moldova
Victor MOCANU, doctor, conferenţiar, Republica Moldova
Anatol ROJCO, doctor, conferenţiar, Republica Moldova Angela TIMUŞ, doctor, conferenţiar, Republica Moldova
Marica DUMITRAŞCO, doctor, conferenţiar, Republica Moldova
Galina SAVELIEVA, doctor, conferenţiar, Republica Moldova
Radu CUHAL, doctor, conferenţiar, Republica Moldova
Victoria IORDACHI, doctor, conferenţiar, Republica Moldova
REDACTORI LITERARI:
Redactor-şef al Complexului Editorial: Iulita BÎRCĂ
Redactare, machetare computerizată: Corina CAZACLIU, Victoria BORDOS,
Eugenia LUCAŞENCO, Viorica CELPAN
Designer copertă: Svetlana FILIMON
Redactare bibliografică: A. CATANA, N.DALINIŢCHI, D. PELEPCIUC
Indexator: Elena MIGUNOVA
Revista este indexată în următoarele baze de date internaţionale: DOAJ http://doaj.org/toc/ce81782df3c444cb81f8079767e0d9a1 IDEAS https://ideas.repec.org/s/nos/ycriat.html EconPapers http://econpapers.repec.org/article/nosycriat/ LogEc http://logec.repec.org/scripts/seritemstat.pf?h=RePEc:nos:ycriat SOCIONET http://socionet.ru/collection.xml?h=spz:brtsbiblioteca:ycriat INDEX COPERNICUS http://www.journals.indexcopernicus.com/Economie+si+Sociologie+,p24780207,3.html OAJI http://oaji.net/journal-detail.html?number=1568 RePEc https://edirc.repec.org/data/iefscmd.html EZB http://rzblx1.uni-regensburg.de/ezeit/searchres.phtml?bibid=AAAAA&colors=7&lang=
en&jq_type1=QS&jq_term1=economy+and+sociology IBN https://ibn.idsi.md/ru/vizualizare_revista/79 eLIBRARY.RU https://elibrary.ru/title_about.asp?id=53992
© Institutul Naţional de Cercetări Economice al AŞM şi ME
© Secţia de Sociologie a Institutului de Cercetări Juridice şi Politice al AŞM © Universitatea de Stat din Comrat
Preluarea textelor editate în revista „Economie şi Sociologie” este posibilă doar cu acordul autorului. Responsabilitatea asupra fiecărui text publicat aparţine autorilor. Autorii declară pe propria răspundere că articolele sunt autentice şi nu există niciun conflict de interese, totodată, transmite dreptul de
autor şi editorului. Opinia redacţiei nu coincide întotdeauna cu opinia autorilor.

ECONOMIE ŞI SOCIOLOGIE / ECONOMY AND SOCIOLOGY
3
No. 1-2 / 2017
ECONOMY and SOCIOLOGY
REVISTĂ
Academy of Sciences
of Moldova
Ministry of Economy
of the Republic of Moldova
theoretical and scientifical journal, founded in 1953
scientific profile publication
Chisinau, 2017
No. 1-2 / 2017
ISSN: 1857-4130

Revistă teoretico-ştiinţifică / Theoretical and scientifical journal
4
No. 1-2 / 2017
EDITORIAL BOARD:
Editor-in-chief: Alexandru STRATAN, PhD, Professor, Republic of Moldova
Members: Gheorghe MISCOI, Associate Member, Republic of Moldova Andrei TIMUS, Associate Member ASM, founder, Republic of Moldova Gheorghe ILIADI, PhD, Professor, Republic of Moldova David SMALLBONE, PhD, Professor, Great Britain Michael GRINGS, PhD, Professor, Germany Luminita CHIVU, PhD, Professor, Romania Vasa LASZLO, PhD, Hungary Thomas RESL, eng., M. Sc., Austria Stasys RIMANTAS, PhD, Professor, Lithuania Jamila BOPIEVA, PhD, Director, Kazakhstan Vilayat VALIYEV, PhD, Azerbaijan
Karl William VIEHE, B.A., M.A., J.D., M.L.T., USA Tomas KUCERA, PhD, Czech Republic Gemma MASAHIKO, PhD, Professor, Japan Apostolos PAPAPHILIPPOU, PhD, Greece Euphrasia Susy SUHENDRA, PhD, Professor, Indonesia Dimitre NIKOLOV, PhD, Professor, Director, Bulgaria Sergei PIROJKOV, vicepresident of the National Academy of Sciences, Ukraine Nina WEBER, M. Sc., Austria
Dumitru MOLDOVAN, Associate Member, Republic of Moldova Elena PADUREAN, PhD, Romania Dorina ROSCA, PhD, France Andrzej KOWALSKI, PhD, Professor, Poland Emil DINGA, PhD, Professor, Romania
Zinaida ARICOVA, PhD, Associate Professor, Republic of Moldova Galina ULIAN, PhD, Professor, Republic of Moldova Dmitrii PARMACLI, PhD, Professor, Republic of Moldova
Alexandru GRIBINCEA, PhD, Professor, Republic of Moldova Ludmila COBZARI, PhD, Professor, Republica Moldova Victoria GANEA, PhD, Associate Professor, Republic of Moldova
Tudor BAJURA, PhD, Professor, Republic of Moldova Valeriu DOGA, PhD, Professor, Republic of Moldova Tatiana MANOLE, PhD, Professor, Republic of Moldova Olga GAGAUZ, PhD, Associate Professor, Republic of Moldova Larisa SAVGA, PhD, Professor, Republic of Moldova Vadim MACARI, PhD, Associate Professor, Republic of Moldova Victoria TROFIMOV, PhD, Associate Professor, Republic of Moldova Rodica PERCIUN, PhD, Associate Professor, Republic of Moldova
Victor MOCANU, PhD, Associate Professor, Republic of Moldova Anatol ROJCO, PhD, Associate Professor, Republic of Moldova Angela TIMUS, PhD, Associate Professor, Republic of Moldova Marica DUMITRASCO, PhD, Associate Professor, Republic of Moldova Galina SAVELIEVA, PhD, Associate Professor, Republic of Moldova Radu CUHAL, PhD, Associate Professor, Republic of Moldova Victoria IORDACHI, PhD, Associate Professor, Republic of Moldova
LITERARY EDITORS: Editor-in-chief of Editorial Complex: Iulita BIRCA Editors, Pages layout: Corina CAZACLIU, Victoria BORDOS
Eugenia LUCASENCO, Viorica CELPAN Designer: Svetlana FILIMON
Bibliographic editors: A.CATANA, N. DALINITCHI, D. PELEPCIUC Indexer: Elena MIGUNOVA
The journal is indexed in the following international databases:
DOAJ http://doaj.org/toc/ce81782df3c444cb81f8079767e0d9a1 IDEAS https://ideas.repec.org/s/nos/ycriat.html EconPapers http://econpapers.repec.org/article/nosycriat/ LogEc http://logec.repec.org/scripts/seritemstat.pf?h=RePEc:nos:ycriat SOCIONET http://socionet.ru/collection.xml?h=spz:brtsbiblioteca:ycriat INDEX COPERNICUS http://www.journals.indexcopernicus.com/Economie+si+Sociologie+,p24780207,3.html OAJI http://oaji.net/journal-detail.html?number=1568 RePEc https://edirc.repec.org/data/iefscmd.html EZB http://rzblx1.uni-regensburg.de/ezeit/searchres.phtml?bibid=AAAAA&colors=7&lang=
en&jq_type1=QS&jq_term1=economy+and+sociology IBN https://ibn.idsi.md/ru/vizualizare_revista/79 eLIBRARY.RU https://elibrary.ru/title_about.asp?id=53992
© National Institute of Economic Research of ASM and ME
© Sociology Department of Research Institute of Legal and Political of ASM
© Comrat State University
The taking over of the texts that are published in the journal “Economy and Sociology” is possible only with the author’s agreement. Responsibility for each
published text belongs to the authors. The authors declare on their own responsibility that the articles are authentic and there is no conflict of interest and also
transmit the copyright to the publisher. Authors views are not always accorded with the editorial board’s opinion.
ECONOMIE ŞI SOCIOLOGIE / ECONOMY AND SOCIOLOGY
5
No. 1-2 / 2017
CUPRINS
Tatiana MANOLE, doctor habilitat în economie, profesor universitar, Institutul National de
Cercetări Economice al AȘM, Republica Moldova
Alexandru STRATAN, doctor habilitat în economie, profesor universitar, Institutul National de
Cercetări Economice al AȘM, Republica Moldova
CONSOLIDAREA FINANCIARĂ A UNITĂȚILOR ADMINISTRATIV-TERITORIALE
PRIN PRISMA DESCENTRALIZĂRII.............................………………………………………… 13
Rodica PERCIUN, doctor habilitat în științe economice, conferențiar cercetător, Institutul Național
de Cercetări Economice, Republica Moldova
Dorina CLICHICI, doctor în științe economice, cercetător ştiinţific gradul III, Institutul de
Economie Mondială, România
МANAGEMENTUL STABILITĂȚII FINANCIARE ÎN STRATEGIILE NAȚIONALE…… 23
Victoria BLYZNIUK, doctor, conferențiar cercetător, Institutul de Economie și Prognoză al
Academiei Naționale de Științe a Ukrainei
Anatolii ROJCO, doctor, conferențiar cercetător, Institutul Naţional de Cercetări Economice al
Academiei de Ştiinţe a Moldovei
EVALUAREA COMPARATIVĂ A DEZVOLTĂRII PIEȚELOR MUNCII DIN
REPUBLICA MOLDOVA ȘI UKRAINA …………………………………………………………. 33
Olga GAGAUZ, doctor habilitat în sociologie, Centrul de Cercetări Demografice, Institutul
Național de Cercetări Economice, Republica Moldova
Cristina AVRAM, doctorand, Universitatea Charles, Praga, Republica Cehă
Irina PAHOMII, cercetător ştiinţific, Centrul de Cercetări Demografice, Institutul Național de
Cercetări Economice, Republica Moldova
AUTOAPRECIEREA SĂNĂTĂȚII DE CĂTRE VÂRSTNICI: INEGALITATEA
ECONOMICĂ ȘI SOCIODEMOGRAFICĂ……………………………………………………..... 45
Elena ACULAI, doctor habilitat în științe economice, conferențiar cercetător, Institutul Național de
Cercetări Economice, Republica Moldova
Lidia MAIER, cercetător știinţific, Institutul Național de Cercetări Economice, Republica Moldova
Alexandra NOVAC, doctor, conferențiar cercetător, Institutul Național de Cercetări Economice,
Republica Moldova
UTILIZAREA CLASAMENTELOR INTERNAȚIONALE PENTRU EVALUAREA
POLITICII DE DEZVOLTARE A AFACERILOR ÎN REPUBLICA MOLDOVA…………… 54
Victoria IORDACHI, doctor conferenţiar, Institutul Naţional de Cercetări Economice,
Republica Moldova
Mariana Rodica ŢÎRLEA, doctor, Universitatea Creştină, „Dimitrie Cantemir”, Bucureşti, România
Tatiana PETROVA, cercetător ştiinţific, Institutul Naţional de Cercetări Economice,
Republica Moldova
GESTIONAREA REZERVEI OFICIALE INTERNAŢIONALE A REPUBLICII MOLDOVA....... 65
Tudor BAJURA, doctor habilitat, profesor cercetător, Institutul Naţional de Cercetări Economice,
Republica Moldova
PROCESUL INVESTIŢIONAL ŞI ASIGURAREA TEHNICĂ ACTUALĂ A SECTORULUI
AGRICOL AUTOHTON…………………………………………………………………………..... 75
Tatiana KONIEVА, doctor în economie, conferenţiar, Universitatea Națională Cernomoră „Petro
Mohyla”, Nicolaev, Ucraina
FACTORII DE INFLUENȚĂ ASUPRA COSTULUI DE CAPITAL AL
ÎNTREPRINDERILOR DIN UCRAINA.......................................................................................... 82

Revistă teoretico-ştiinţifică / Theoretical and scientifical journal
6
No. 1-2 / 2017
Igor ENICOV, doctor habilitat, profesor, Universitatea Liberă Internațională din Moldova
APLICAREA EXTENSIILOR REȚELELOR PETRI ÎN MODELAREA ACTIVITĂȚII
BĂNCII COMERCIALE……………………………………………………………………………. 90
Tatiana PETROVA, cercetător ştiinţific, Institutul Naţional de Cercetări Economice, Republica Moldova
Victoria IORDACHI, doctor în economie, conferenţiar cercetator, Institutul Naţional de Cercetări
Economice, Republica Moldova
Dorina CLICHICI, doctor în științe economice, cercetător ştiinţific gradul III, Institutul de
Economie Mondială, România
EVALUAREA FLUXURILOR ILEGALE DE CAPITAL ÎN REPUBLICA MOLDOVA……. 95
Ludmila MALCOCI, doctor habilitat în sociologie, profesor cercetător, Centrul Sociologie și
Psihologie Socială, Institutul de Cercetări Juridice și Politice al AȘM, Moldova
Victor MOCANU, doctor în sociologie, conferențiar cercetător, Centrul Sociologie și Psihologie
Socială, Institutul de Cercetări Juridice și Politice al AȘM, Moldova
CLASA MEDIE ÎN REPUBLICA MOLDOVA: FACTORII DETERMINANȚI AI
CONSTITUIRII.................................................................................................................................... 103
Mihail POISIC, doctor în economie, cercetător științific superior, Institutul Național de Cercetări
Economice, Republica Moldova
ÎNCASĂRILE ÎN NUMERAR DIN STRĂINĂTATE LA PERSOANELE FIZICE. METODE
DE EVALUARE…………………………………………………………………………………….... 112
Elena ȘCERBACOV, doctor, lector universitar, Universitatea Agrară de Stat din Moldova
COMPETITIVITATEA SECTORULUI AGROALIMENTAR AL REPUBLICII MOLDOVA
ÎN DOMENIUL COMERȚULUI CU PRODUSE ALIMENTARE DE ORIGINE
VEGETALĂ ȘI ANIMALIERĂ….....………………………………………………………………. 117
Angela TIMUŞ, doctor în economie, conferenţiar cercetător, Institutul Naţional de Cercetări
Economice, Republica Moldova
Cristina UNGUR, сercetător ştiinţific, Institutul Naţional de Cercetări Economice, Republica Moldova
Irina RABOSAPCA, doctor, lector, Universitatea Babeș-Bolyai, Cluj-Napoca, România
ASIMILAREA POTENŢIALULUI INVESTIŢIONAL AL COMPANIILOR DE
ASIGURĂRI PRIN PRISMA VALORILOR MOBILIARE DE STAT………………………….. 124
Viorel TUREŢCHI, doctorand, cercetător ştiinţific, Institutul Naţional de Cercetări Economice,
Republica Moldova
Tatiana BORZDOVA, doctor, conferenţiar cercetător, Institutul de Stat de Management și
Tehnologii Sociale al Universității de Stat, Departamentul de management al bunurilor imobiliare,
Belarus
PIAȚA IMOBILIARĂ ÎN SPAŢIUL RURAL AL REPUBLICII MOLDOVA: STRUCTURA
ACTUALĂ ȘI OPORTUNITĂȚILE DE DEZVOLTARE ………………………………………. 133
Corina BULGAC, doctorandă, lector universitar, Academia de Studii Economice din Moldova
MECANISMUL DE EVALUARE A PRESIUNII FISCALE ASUPRA ECONOMIEI ÎN
REPUBLICA MOLDOVA.................................................................................................................. 140
Elena HRUȘCIOV, cercetător științific, Centrul de Cercetări Demografice, Institutul Naţional de
Cercetări Economice, Republica Moldova
DETERMINANȚII ÎMBĂTRÂNIRII POPULAȚIEI ÎN REPUBLICA MOLDOVA ȘI
UNELE ȚĂRI EUROPENE................................................................................................................. 148
ECONOMIE ŞI SOCIOLOGIE / ECONOMY AND SOCIOLOGY
7
No. 1-2 / 2017
ALTE COMPARTIMENTE
RECENZIE la monografia: „TRATAT DESPRE PĂMÂNT: IMPORTANȚA, STAREA,
EFICIENȚA UTILIZĂRII ÎN AGRICULTURĂ”
Autori: Dumitru PARMACLI, doctor habilitat în științe economice, profesor, Universitatea de Stat
din Comrat
Alexandru STRATAN, doctor habilitat în științe economice, profesor, Institutul Naţional de
Cercetări Economice, Republica Moldova
Recenzenți: Petru SABLUC, doctor în științe economice, profesor, academician al ANȘA a Ucrainei
Valeriu DOGA, doctor habilitat în științe economice, profesor, consultant ştiinţific Institutul
Naţional de Cercetări Economice, Republica Moldova…………………………………………………….
159
RECENZIE la monografia: „TRATAT DESPRE PĂMÂNT: IMPORTANȚA, STAREA,
EFICIENȚA UTILIZĂRII ÎN AGRICULTURĂ”
Autori: Dumitru PARMACLI, doctor habilitat, profesor, Universitatea de Stat din Comrat
Alexandru STRATAN, doctor habilitat, profesor, Institutul Naţional de Cercetări Economice,
Republica Moldova
Recenzent: Dinu GAVRILESCU, profesor, doctor, Acad. ASAS, România........................................... 161
RECENZIE la monografia: „TRATAT DESPRE PĂMÂNT: IMPORTANȚA, STAREA,
EFICIENȚA UTILIZĂRII ÎN AGRICULTURĂ”
Autori: Dumitru PARMACLI, doctor habilitat, profesor, Universitatea de Stat din Comrat
Alexandru STRATAN, doctor habilitat, profesor, Institutul Naţional de Cercetări Economice,
Republica Moldova
Recenzent: M.D.VRONSCHIH, doctor habilitat în științe biologice, profesor, membru corespondent
AȘM......................................................................................................................................................... 162
REGULAMENTUL DE PUBLICARE A ARTICOLELOR ŞTIINŢIFICE ÎN REVISTA
„ECONOMIE ŞI SOCIOLOGIE”, CATEGORIA B……………………………………………… 164
Revistă teoretico-ştiinţifică / Theoretical and scientifical journal
8
No. 1-2 / 2017
CONTENTS
Tatiana MANOLE, PhD, Professor, National Institute for Economic Research, Moldova Alexandru STRATAN, PhD, Professor, National Institute for Economic Research, Moldova
FINANCIAL CONSOLIDATION OF THE ADMINISTRATIVE-TERRITORIAL ENTITY IN
THE LIGHT OF DECENTRALIZATION………………………....................................................... 13
Rodica PERCIUN, PhD, Associate Professor, National Institute for Economic Research, Moldova Dorina CLICHICI, PhD, Senior Researcher III, Institute for World Economy, Romania
ТHE MANAGEMENT OF FINANCIAL STABILITY IN NATIONAL STRATEGIES………. 23
Victoria BLYZNIUK, PhD, Associate Professor, Institute for Economics and Forecasting Ukrainian National Academy of Sciences Anatolii ROJCO, PhD, Associate Professor, National Institute for Economic Research, Moldova
COMPARATIVE EVALUATION OF THE LABOUR MARKETS DEVELOPMENT IN THE
REPUBLIC OF MOLDOVA AND UKRAINE………………………………………………......... 33
Olga GAGAUZ, PhD, Associate Professor, Centre for Demographic Research, National Institute for Economic Research, Moldova Cristina AVRAM, PhD Student, University Charles, Prague, Czech Republic Irina PAHOMII, Researcher, Centre for Demographic Research, National Institute for Economic Research, Moldova
SELF-PERCEIVED HEALTH OF THE ELDERLY: ECONOMIC AND
SOCIODEMOGRAPHIC INEQUALITIES ………………………………………………………. 45
Elena ACULAI, PhD, Associate Researcher, National Institute for Economic Research, Moldova Lidia MAIER, Researcher, National Institute for Economic Research, Moldova Alexandra NOVAC, PhD, Associate Researcher, National Institute for Economic Research, Moldova
THE USE OF INTERNATIONAL RANKINGS FOR BUSINESS DEVELOPMENT POLICY
EVALUATION IN THE REPUBLIC OF MOLDOVA …………………………………………... 54
Victoria IORDACHI, PhD, Associate Professor, National Institute for Economic Research, Moldova Mariana Rodica ŢÎRLEA, PhD, Dimitrie Cantemir Christian University Bucharest, Romania Tatiana PETROVA, Researcher, National Institute for Economic Research, Moldova
INTERNATIONAL RESERVES MANAGEMENT IN THE REPUBLIC OF MOLDOVA…… 65
Tudor BAJURA, PhD, Professor, National Institute for Economic Research, Moldova
INVESTMENT PROCESS AND ACTUAL TEHNICAL PROVIDING OF MOLDAVIAN
AGRICULTURE ……………………………………………………………………………………. 75
Tetiana KONIEVА, PhD, Associate Professor, Petro Mohyla Black Sea National University Mykolaiv Ukraine
FACTORS AFFECTING THE ENTERPRISE’S COST OF CAPITAL IN UKRAINE………... 82
Igor ENICOV, PhD, Professor, Free International University of Moldova
APPLYING PETRI NETS EXTENSIONS TO MODELING COMMERCIAL BANK ACTIVITY.. 90 Tatiana PETROVA, Researcher, National Institute for Economic Research, Moldova Victoria IORDACHI, PhD, Associate Professor, National Institute for Economic Research, Moldova Dorina CLICHICI, PhD, Senior Researcher III, Institute for World Economy Romania
ASSESSMENT OF ILLEGAL CAPITAL FLOWS IN THE REPUBLIC OF MOLDOVA…… 95 Ludmila MALCOCI, PhD, Professor Researcher, Sociology and Social Psychology Centre, Political and Juridical Research Institute of the ASM, Moldova Victor MOCANU, PhD, Associate Professor, Director of the Sociology and Social Psychology Centre, Political and Juridical Research Institute of the ASM, Moldova
THE MIDDLE CLASS IN THE REPUBLIC OF MOLDOVA: DETERMINANT FACTORS
OF FORMATION...................................................................................................................................... 103

ECONOMIE ŞI SOCIOLOGIE / ECONOMY AND SOCIOLOGY
9
No. 1-2 / 2017
Mihail POISIC, PhD, Senior Researcher, National Institute for Economic Research, Moldova
MONETARY RECEIPTS FROM ABROAD TO INDIVIDUALS: EVALUATION
METHODS…………………………………………………………………………………………...... 112 Elena SCERBACOV, PhD, University Lecturer, The State Agrarian University of Moldova
THE COMPETITIVENESS OF THE AGRIFOOD SECTOR FROM THE REPUBLIC OF
MOLDOVA IN THE FIELD OF ALIMENTARY PRODUCTS OF PLANT AND ANIMAL
ORIGIN……………………………………………………………………………............................... 117 Angela TIMUS, PhD, Associate Professor, National Institute for Economic Research, Moldova Cristina UNGUR, Researcher, National Institute for Economic Research, Moldova
Irina RABOSAPCA, PhD, Lecturer, Babes-Bolyai University, Cluj-Napoca, Romania
ASSIMILATION OF INVESTMENT POTENTIAL OF INSURANCE COMPANIES
THROUGH GOVERNMENT SECURITIES ……………………………………………………... 124 Viorel TURETCHI, PhD Student, Researcher, National Institute for Economic Research, Moldova Tatiana BORZDOVA, PhD, Associate Professor, State Institute of Management and Social Technologies of the Belarusian State University, Department of real estate management, Belarus
REAL ESTATE MARKET IN RURAL AREA OF THE REPUBLIC OF MOLDOVA:
ACTUAL CONDITION AND OPPORTUNITIES OF DEVELOPMENT…..………………….. 133
Corina BULGAC, PhD Student, University Lecturer, Academy of Economic Studies of Moldova
THE EVALUATION MECHANISM OF THE TAX PRESSURE ON THE ECONOMY
IN THE REPUBLIC OF MOLDOVA……………………………………………………………… 140 Elena HRUSCIOV, Scientific Researcher, Centre for Demographic Research, National Institute for Economic Research, Moldova
POPULATION AGEING DETERMINANTS IN THE REPUBLIC OF MOLDOVA AND
SELECTED EUROPEAN COUNTRIES…………………………………………………………... 148
OTHER COMPARTIMENTS
REVIEW on the monograph: „TREATY ON LAND: IMPORTANCE, CONDITION,
EFFICIENCY OF USE IN AGRICULTURE” Authors: Dumitru PARMACLI, PhD, Professor, Comrat State University Alexandru STRATAN, PhD, Professor, National Institute for Economic Research, Moldova Reviewers: Petru SABLUC, PhD in economy, Professor, Academician of ANSA of Ukraine Valeriu DOGA, PhD, Professor, Scientific consultant, National Institute for Economic Research, Moldova...
159
REVIEW on the monograph: „TREATY ON LAND: IMPORTANCE, CONDITION,
EFFICIENCY OF USE IN AGRICULTURE” Authors: Dumitru PARMACLI, PhD, Professor, Comrat State University Alexandru STRATAN, PhD, Professor, National Institute for Economic Research, Moldova Reviewer: Dinu GAVRILESCU, PhD, Professor, Acad. ASAS, Romania.............................................. 161
REVIEW on the monograph: „TREATY ON LAND: IMPORTANCE, CONDITION,
EFFICIENCY OF USE IN AGRICULTURE” Authors: Dumitru PARMACLI, PhD, Professor, Comrat State University Alexandru STRATAN, PhD, Professor, National Institute for Economic Research, Moldova Reviewer: M.D.VRONSCHIH, PhD, Professor, corresponding member ASM...................................... 162
REQUIREMENTS FOR PRESENTATION OF SCIENTIFIC PAPERS IN ORDER
TO BE PUBLISHED IN THE JOURNAL „ECONOMY AND SOCIOLOGY”,
OF „B” CATEGORY................................................................................................................................ 164
Revistă teoretico-ştiinţifică / Theoretical and scientifical journal
10
No. 1-2 / 2017
СОДЕРЖАНИЕ
Татьяна МАНОЛЕ, доктор хабилитат, профессор, Национальный Институт
Экономических Исследований, Молдова
Александру СТРАТАН, доктор хабилитат, профессор, Национальный Институт
Экономических Исследований, Молдова
ФИНАНСОВОЕ УКРЕПЛЕНИЕ АДМИНИСТРАТИВНО-ТЕРРИТОРИАЛЬНЫХ
ЕДИНИЦ В СВЕТЕ ДЕЦЕНТРАЛИЗАЦИИ …………………………………………………….. 13
Родика ПЕРЧУН, доктор хабилитат, конференциар, Национальный Институт
Экономических Исследований, Молдова
Дорина КЛИКИЧ, доктор, старший научный сотрудник III, Институт Мировой Экономики,
Румыния
МЕНЕДЖМЕНТ ФИНАНСОВОЙ БЕЗОПАСНОСТИ В НАЦИОНАЛЬНЫХ
СТРАТЕГИЯХ..................................................................................................................................... 23
Виктория БЛИЗНЮК, кандидат экономических наук, старший научный сотрудник,
Институт экономики и прогнозирования Национальной академии наук Украины
Анатолий РОЖКО, кандидат экономических наук, старший научный сотрудник,
Национальный институт экономических исследований Академии наук Молдовы
СРАВНИТЕЛЬНАЯ ОЦЕНКА РАЗВИТИЯ РЫНКОВ ТРУДА РЕСПУБЛИКИ
МОЛДОВА И УКРАИНЫ……………………………………………………................................ 33
Ольга ГАГАУЗ, доктор социологии, Центр Демографических Исследований, Национальный
Институт Экономических Исследований, Молдова,
Кристина АВРАМ, докторанд, Карлов Университет, Прага, Чешская Республика
Ирина ПАХОМИЙ, научный исследователь, Центр Демографических Исследований,
Национальный Институт Экономических Исследований, Молдова
САМООЦЕНКА ЗДОРОВЬЯ ПОЖИЛЫМИ ЛЮДЬМИ: ЭКОНОМИЧЕСКОЕ И
СОЦИАЛЬНО-ДЕМОГРАФИЧЕСКОЕ НЕРАВЕНСТВО………………………………........ 45
Елена АКУЛАЙ, доктор хабилитат, конференциар исследователь, Национальный
Институт Экономических Исследований, Молдова
Лидия МАЙЕР, научный исследователь, Национальный Институт Экономических
Исследований, Молдова
Александра НОВАК, доктор экономики, конференциар исследователь, Национальный
Институт Экономических Исследований, Молдова
ИСПОЛЬЗОВАНИЕ МЕЖДУНАРОДНЫХ РЕЙТИНГОВ ДЛЯ ОЦЕНКИ ПОЛИТИКИ
РАЗВИТИЯ БИЗНЕСА В РЕСПУБЛИКЕ МОЛДОВА……………………….....……….......... 54
Виктория ИОРДАКИ, доктор, конференциар, Национальный Институт Экономических
Исследований, Молдова
Мариана Родика ЦЫРЛЯ, доктор, Христианский Университет «Димитрие Кантемир»,
Бухарест, Румыния
Татьяна ПЕТРОВА, научный исследователь, Национальный Институт Экономических
Исследований, Молдова
УПРАВЛЕНИЕ МЕЖДУНАРОДНЫМИ РЕЗЕРВАМИ РЕСПУБЛИКИ МОЛДОВА……. 65
Тудор БАЖУРА, доктор хабилитат, профессор, Национальный Институт Экономических
Исследований, Молдова
ИНВЕСТИЦИОННЫЙ ПРОЦЕСС И СОВРЕМЕННОЕ ТЕХНИЧЕСКОЕ
ОБЕСПЕЧЕНИЕ СЕЛЬСКОГО ХОЗЯЙСТВА РЕСПУБЛИКИ МОЛДОВА ………........... 75
ECONOMIE ŞI SOCIOLOGIE / ECONOMY AND SOCIOLOGY
11
No. 1-2 / 2017
Татьяна КОНИЕВА, кандидат экономических наук, конференциар, Черноморский
национальный университет имени Петра Могилы, Николаев, Украина
ФАКТОРЫ ВЛИЯНИЯ НА СТОИМОСТЬ КАПИТАЛА ПРЕДПРИЯТИЯ В УКРАИНЕ... 82
Игорь ЕНИКОВ, доктор хабилитат, профессор, Международный Независимый
Университет Молдовы
ПРИМЕНЕНИЕ РАСШИРЕНИЙ СЕТЕЙ ПЕТРИ В МОДЕЛИРОВАНИИИ
ДЕЯТЕЛЬНОСТИ КОММЕРЧЕСКОГО БАНКА…………………………………………....... 90
Татьяна ПЕТРОВА, научный исследователь, Национальный Институт Экономических
Исследований, Молдова
Виктория ИОРДАКИ, доктор, конференциар, Национальный Институт Экономических
Исследований, Молдова
Дорина КЛИКИЧ, доктор, старший научный сотрудник III, Институт Мировой Экономики, Румыния
ОЦЕНКА НЕЛЕГАЛЬНЫХ ПОТОКОВ КАПИТАЛА В РЕСПУБЛИКЕ МОЛДОВА…... 95
Людмила МАЛКОЧ, доктор хабилитат, профессор исследователь, Центр Социологии и
Социальной Психологии, Институт Юридических и Политических Наук АНМ, Молдова
Виктор МОКАНУ, доктор, конференциар, Центр Социологии и Социальной Психологии,
Политико-юридический научно-исследовательский институт АНМ, Молдова
СРЕДНИЙ КЛАСС В РЕСПУБЛИКЕ МОЛДОВА: ОСНОВНЫЕ ФАКТОРЫ
ФОРМИРОВАНИЯ............................................................................................................................ 103
Михаил ПОЙСИК, доктор экономики, старший научный сотрудник, Национальный
институт экономических исследований, Молдова
ДЕНЕЖНЫЕ ПОСТУПЛЕНИЯ ИЗ-ЗА РУБЕЖА В АДРЕС ФИЗИЧЕСКИХ ЛИЦ.
МЕТОДЫ ОЦЕНКИ……………………………………………..........………………………........ 112
Елена ЩЕРБАКОВ, доктор экономических наук, Государственный Аграрный Университет
Республики Молдова
КОНКУРЕНТОСПОСОБНОСТЬ АГРОПРОДОВОЛЬСТВЕННОГО СЕКТОРА
РЕСПУБЛИКИ МОЛДОВА ЧЕРЕЗ ПРИЗМУ ТОРГОВЛИ ПИЩЕВЫМИ
ПРОДУКТАМИ РАСТИТЕЛЬНОГО И ЖИВОТНОГО ПРОИСХОЖДЕНИЯ…………… 117
Анжела ТИМУШ, доктор экономических наук, доцент, Национальный Институт
Экономических Исследований, Молдова
Кристина УНГУР, научный исследователь, Национальный Институт Экономических
Исследований
Ирина РАБОШАПКА, доктор, преподаватель, Университет Бабеш-Бойяй, Клуж-Напока,
Румыния
АССИМИЛЯЦИЯ ИНВЕСТИЦИОННОГО ПОТЕНЦИАЛА СТРАХОВЫХ
КОМПАНИЙ ЧЕРЕЗ ГОСУДАРСТВЕННЫЕ ЦЕННЫЕ БУМАГИ………………………... 124
Виорел ТУРЕЦКИ, докторант, научный исследователь, Национальный Институт
Экономических Исследований, Молдова
Татьяна БОРЗДОВА, кандидат технических наук, доцент, Государственный институт
управления и социальных технологий Белорусского государственного университета, Кафедра
управления недвижимостью, Беларусь
РЫНОК НЕДВИЖИМОСТИ В СЕЛЬСКОЙ МЕСТНОСТИ РЕСПУБЛИКИ
МОЛДОВA: ТЕКУЩЕЕ СОСТОЯНИЕ И ВОЗМОЖНОСТИ РАЗВИТИЯ……………….. 133
Корина БУЛГАК, докторант, преподаватель, Молдавская Экономическая Академия
МЕХАНИЗМ ОЦЕНКИ НАЛОГОВОЙ НАГРУЗКИ НА ЭКОНОМИКУ В
РЕСПУБЛИКЕ МОЛДОВА.............................................................................................................. 140
Revistă teoretico-ştiinţifică / Theoretical and scientifical journal
12
No. 1-2 / 2017
Елена ХРУЩЕВ, научный сотрудник, Центр Демографических Исследований, Национальный
Институт Экономических Исследований, Молдова
ФАКТОРЫ ДЕМОГРАФИЧЕСКОГО СТАРЕНИЯ В РЕСПУБЛИКЕ МОЛДОВА И
НЕКОТОРЫХ ЕВРОПЕЙСКИХ CТРАНАХ............................................................................... 148
ДРУГИЕ РАЗДЕЛЫ
РЕЦЕНЗИЯ на монографию: «ТРАКТАТ О ЗЕМЛЕ: ЗНАЧЕНИЕ, СОСТОЯНИЕ,
ЭФФЕКТИВНОСТЬ ИСПОЛЬЗОВАНИЯ В СЕЛЬСКОМ ХОЗЯЙСТВЕ»
Авторы: Дмитрий ПАРМАКЛИ, доктор хабилитат экономических наук, профессор,
Комратский Государственный Университет
Александру СТРАТАН, доктор хабилитат, профессор, Национальный Институт
Экономических Исследований, Молдова
Рецензенты: Петру САБЛУК, доктор экономических наук, профессор, академик НАН
Украины
Валериу ДОГА, доктор хабилитат экономических наук, профессор, научный консультант,
Национальный Институт Экономических Исследований, Молдова………………………………... 159
РЕЦЕНЗИЯ на монографию: «ТРАКТАТ О ЗЕМЛЕ: ЗНАЧЕНИЕ, СОСТОЯНИЕ,
ЭФФЕКТИВНОСТЬ ИСПОЛЬЗОВАНИЯ В СЕЛЬСКОМ ХОЗЯЙСТВЕ»
Авторы: Дмитрий ПАРМАКЛИ, доктор хабилитат экономических наук, профессор,
Комратский Государственный Университет
Александру СТРАТАН, доктор хабилитат, профессор, Национальный Институт
Экономических Исследований, Молдова
Рецензент: Дину ГАВРИЛЕСКУ, доктор, профессор, акад. ASAS, Румыния............................... 161
РЕЦЕНЗИЯ на монографию: «ТРАКТАТ О ЗЕМЛЕ: ЗНАЧЕНИЕ, СОСТОЯНИЕ,
ЭФФЕКТИВНОСТЬ ИСПОЛЬЗОВАНИЯ В СЕЛЬСКОМ ХОЗЯЙСТВЕ»
Авторы: Дмитрий ПАРМАКЛИ, доктор хабилитат экономических наук, профессор,
Комратский Государственный Университет
Александру СТРАТАН, доктор хабилитат, профессор, Национальный Институт
Экономических Исследований, Молдова
Рецензент: М.Д. ВРОНСКИХ, доктор хабилитат, профессор, член-корреспонденты АНМ... 162
ТРЕБОВАНИЯ К НАУЧНЫМ СТАТЬЯМ ДЛЯ ПУБЛИКАЦИИ В ЖУРНАЛЕ
«ЭКОНОМИКА И СОЦИОЛОГИЯ», КАТЕГОРИЯ B………………....................................... 164

ECONOMIE ŞI SOCIOLOGIE / ECONOMY AND SOCIOLOGY
13
No. 1-2 / 2017
FINANCIAL CONSOLIDATION OF THE
ADMINISTRATIVE-TERRITORIAL ENTITY
IN THE LIGHT OF DECENTRALIZATION
Tatiana MANOLE1, PhD, Professor,
National Institute for Economic Research, Moldova
Alexandru STRATAN2, PhD, Professor,
National Institute for Economic Research, Moldova
„Should we head towards ‘self-government’ required by many of the participants, would that be a self-
government of the citizens or the elect representatives? Whatever would happen, decentralization is, in
a way, the book of our society, a book in which we find its aspirations, discrepancies and questions…
It is well led from above, but it is well administered from the bottom.”
(Xavier Frège, Paris, 1986)
This article presents the results of study regarding the decentralization process, which is currently
underway in the Republic of Moldova. The purpose of the study is to highlight the fundamental concept of
decentralization, the areas of administrative decentralization, the forms of manifestation of financial
decentralization (fiscal decentralization and budget decentralization), to identify the priorities of the
decentralization process, and to establish the indicators for measuring the degree of decentralization. In
base of the statistical analysis and synthesis method, it was determined the current state of the art in the
administrative-territorial entities in the course of the decentralization process in relation to the public
finance management reform. It were formulate proposals to accelerate the process of financial
decentralization and self-government.
Keywords: decentralization, financial, tax and budget decentralization. Measurement indicators,
degree of decentralization, tax capacity, budget, inter-budgetary relations, transfers.
În articol sunt prezentate rezultatele cercetării cu privire la procesul de descentralizare ce are
loc actualmente în Republica Moldova. Scopul studiului este de a evidenția conceptul fundamental al
descentralizării, domeniile de descentralizare administrativă, formele de manifestare a descentralizării
financiare: descentralizare fiscală şi descentralizare bugetară, a identifica priorităţile procesului de
descentralizare, precum și a stabili indicatorii de măsurare a gradului de descentralizare. Utilizând
metoda statistică de analiză şi sinteză, a fost evidenţiată situaţia actuală din unităţile administrativ-
teritoriale ale Republicii Moldova privind mersul procesului de descentralizare în corelare cu reforma
managementului finanţelor publice și formulate propuneri pentru accelerarea procesului de
descentralizare şi autonomie financiară.
Cuvinte-cheie: descentralizare, descentralizare financiară, fiscală şi bugetară, indicatori de
măsurare, grad de descentralizare, capacitate fiscală, buget, raporturi interbugetare, transferuri.
В статье представлены результаты исследования процесса децентрализации в Республике
Молдова. Цель исследования: выделение фундаментальной концепции децентрализации, сфер
административной децентрализации, форм проявления финансовой децентрализации (фискальной
и бюджетной), определение приоритетов процесса децентрализации, а также показателей
измерения уровня децентрализации. Используя статистический метод анализа и синтеза была
определена текущая ситуация в административно-территориальных единицах в ходе процесса
децентрализации в связи с реформой управления государственными финансами. На основе
результатов исследования сформулированы предложения по ускорению процесса децентрализации
и финансовой автономии.
1 © Tatiana MANOLE, [email protected] 2 © Alexandru STRATAN, [email protected]
Revistă teoretico-ştiinţifică / Theoretical and scientifical journal
14
No. 1-2 / 2017
Ключевые слова: децентрализация, финансовая децентрализация, фискальная
децентрализация, бюджетная децентрализация, показатели измерения, степень децентрализации,
налоговый потенциал, бюджет, межбюджетные отношения, переводы.
JEL Classification: E62, H61, F24, O23.
UDC: 352/353.071.6(478)
Introduction. The Republic of Moldova is currently going through a process of reforming its
public finance management. Decentralization is at the heart of the success of this reform. The main
purpose of decentralization is to improve the quality of provided public services. Given these, the local
public authorities must have more competences to accomplish this purpose.
The practice of developed countries shows that decentralization is a time consuming, arduous
process, which requires, however, not only financial resources, but also human resources prepared to take
the risk of conducting a real reform.
The Government of the Republic of Moldova approved a set of laws on public finance
modernization, these documents being compliant with the European Union requirements. The Parliament
of the Republic of Moldova passed the Law on approving the National decentralization strategy and the
Action plan for the implementation of the National decentralization strategy for 2012-2015, no. 68 dated
05.04.12. (Official Gazette of the Republic of Moldova no. 143-148 dated 13.07.2012, art. 465). This law
highlights a range of issues, referring to the decentralization of services and competences, financial,
property decentralization, as well as the local development and administrative capacity of the local public
government system.
The ratification of the European Charter by the Republic of Moldova on 16 July 1997 was an
important step towards guaranteeing efficient real budget self-government for the communities throughout
the country, adopting, on this occasion, a series of good practice rules with significant positive impact on
the local public finance. By this document, the Republic of Moldova assumed a certain stability
of the main local self-administration mechanisms, including financial ones, through setting them out in the
Constitution and organic laws.
Decentralization and local self-government concept Decentralization is a process of transferring administrative and financial competences from the
level of central public administration to the level of local public administration or to the private sector.
Public administration decentralization refers to the process of enhancing the self-government
of the administrative-territorial entities, the local collectivities through the transfer of new decision-
making responsibilities, such as financial and property resources, in line with the principle of subsidiarity
(resolving the issues that arise… at the decision-making level that is the closest), cutting current
(recurrent) costs and enhancing transparency in the relationship with the citizens, enhancing the quality
and access to public services.
Local self-government is the basis of decentralization. Local self-government is understood as the
right and effective ability of the local public authorities to regulate and manage, within the framework of
the law, a significant share of public affairs, under their own responsibility and in the interest of the local
population (European Charter of Local Self-government, signed in 1985 in Strassbourg, art.3).
The European Charter of Local Self-government was ratified by the Republic of Moldova on 16 July 1997
and entered into effect for our country on 1 February 1998 [5, pages 20-22; 4, pages 425-440].
Local self-government can be also defined as a right of an entity to self-administration within the
framework of a state led by a central power. Thus, the citizens’ needs are better served, because they are
better known at the local level than at the central level.
Local self-government is conceived, within the European context, as an element of democratic
principles, shared among all member states of the Council of Europe, which, through its legal regulation
and correct enactment, makes the power decentralization possible.
The role of local self-government is drawn, thus, from the fact that the responsibility
for conducting activities of public interest must rest with those authorities which are the closest ones to the
citizens. According to the European charter of local self-government, local public administration
authorities must be able to establish their internal administrative structures by themselves in order to adapt
them to their specific needs and to substantiate efficient public management. When the mandate and
responsibilities of the local public administration authorities grow, they must have qualified personnel that

ECONOMIE ŞI SOCIOLOGIE / ECONOMY AND SOCIOLOGY
15
No. 1-2 / 2017
would meet the requirements of making public management more efficient and modern. Local public
authorities must assure quality recruitment, based on the principles of meritocracy and professional skills.
Also, local public authorities must take care of the continuous staff training, adequate remuneration and
career building opportunities to all staff.
Local self-government can be achieved in the light of real decentralization of power.
Power decentralization implies a cessation (concession, delegation) of administrative and
financial mandate from the central public administration level to the local public administration.
Decentralization, however, places a high degree of responsibility for the exercise provided for the benefit
of the local community on the shoulders of the local public government.
The main objective of decentralization is to provide public services of top quality and improve
the entire budget system, both at institutional level, as well as from financial standpoint.
The purpose of decentralization process is to improve the quality of public services
management, assuring a more efficient resource allocation and enhance accountability for the budget
spending [5, pages 24-28].
Power decentralization contributes to establishing local public authorities which would be capable
of fulfilling public duties of local interest in the most efficient manner.
Administrative decentralization can appear in a number of perspectives:
- from the legal perspective, the administrative-territorial entities become distinct subjects of law,
with their own public interests;
- from the institutional perspective, the local public authorities have their own administrative
institutions, separate from the central administrative system;
- from the decision-making perspective, local authorities take decisions for the benefit of the
communities which they administer, having their own mandate;
- from the financial perspective, local communities have their own budgets and may decide on
establishing and charging taxes and fees, within the provisions of the domestic legislation.
The local self-government, from the administrative perspective, implies a concomitant existence
of financial self-government at the local level, especially as regards the charging of their own taxes and
fees and the existence of their own budget. The local communities are aware of their own possibilities
concerning public means and, especially, the needs for expenses which should be covered to produce local
level public services.
There are two types of financial decentralization: fiscal decentralization, which is linked to the
revenues of the local authorities, and budget decentralization, which refers to the local public spending.
Fiscal decentralization is fiscal self-government, which characterizes the relationship between
own local revenues and transfers from the state budget. It measures, thus, the degree of self-financing
[4, pg. 438].
The realization of financial and administrative decentralization must base on the respect of all
basic principles, that had been formulated as a result of theoretic research and experience accumulated in
developed countries. They refer, to a great extent, to the delegation of responsibilities to the local public
administration, orienting, at the same time, sources of revenues towards it.
The principles of local financial self-government are formulated in the European Charter of Local
Self-Government.
Decentralization is, thus, a process of transferring the authority and administrative
responsibilities from the central to the local administration in planning, decision-making, legal
responsibility and public services management.
Deconcentration, unlike decentralization, is a process of delegating and exercising the authority
and administrative and financial responsibilities from central to local level, within the framework of the
same entity. Priorities of decentralization process
It is understood both at central and local level that decentralization is the way towards
modernizing the Republic of Moldova. Decentralization has a range of priorities, which contribute to:
1. Improved system of decentralized public services provision;
2. Clarified competences at different levels and entities of public administration;
3. Enhanced financial self-government;
4. Citizen engagement in the local decision-making process and accountability of the local public
authorities, etc.

Revistă teoretico-ştiinţifică / Theoretical and scientifical journal
16
No. 1-2 / 2017
At the same time, the practice proves that public administration reform requires that certain rules
(principles) are observed:
a) Clear distinction between various levels of government, in order to possibly cover the costs of
specific competence services
b) Specific decisions on the sources of revenues which would belong exclusively to the local
authorities (shared sources should be specified in a certain proportion and provided for in the state budget)
should be taken;
c) Grant the local authorities certain powers to establish the responsibilities in taxes, fees and local
expenses;
d) A redistribution system, which would assure an approximate equality of expenses per capita is
needed. In this regard, we can note that in the Republic of Moldova this principle is realized by calculating
(general purpose) balancing transfers. However, here also an issue arises: how shall a balance between
equalization and stimulation be obtained? This is an issue faced by the local and central governments
of the Republic of Moldova.
e) An issue is the requirement of efficiency and equity. The coming into being and development of
the public-private partnership takes over a part of public services from the local government. In this case,
the efficiency and quality of public services goes up, as well as the costs do, the tariffs becoming higher.
Thus, the one who pays more also has higher quality and more efficient services. What should be done in
such a situation? The answer would be: nothing can be changed without hard work and investments.
f) The greater the extent of fiscal decentralization, the bigger the need for improved (performing)
accountability systems. Therefore, it is necessary to develop local government external audit systems and
cut current (recurrent) spending. The greater the extent of fiscal decentralization, the greater the extent
of financial self-government. Fiscal decentralization measures the extent of self-financing [10].
The practice of the European Union countries proves that financial self-government does not mean
to leave the community cover its financing needs from its own resources. All communities have the right to
provide quality services, for which funding is required. Thus, this is why the existence of balancing transfers
from the state budget is a natural process. It is known that the volume of transfers is not the same for all
administrative-territorial entities’ structures, being so depending on the level of economic development.
This is why, when speaking of financial self-government, we must mean the right of the
administrative-territorial authorities to freely dispose of these resources, regardless of where they come
from, whether they are their own resources or are allocated from the state budget via transfers. But equity
must be combined with the efficient use of these sources, the responsibility and future incentives for
enhancing own economic potential.
Referring to the role of transfers from the state budget, we should, at the same time, note the
efforts undertaken by the state to finance the growing needs of the TAE. Financial balancing efforts of the state budget
Below, the state budget effort to finance the administrative-territorial entities is presented.
This effort is manifested by the sum of balancing transfers for each administrative-territorial
entity. Reviewing the sum of transfers for each administrative-territorial entity at the level of the local
consolidated budget (except for the municipalities of Chisinau and Balti, according to the law no.181 on
“Public finance and budgetary-fiscal responsibilities” and the “Peculiarities of developing draft local
budgets for 2017 and estimations for 2018-2019”) we see that they are quite significant, especially in the
second tier TAE, where there is big discrepancy between the fiscal capacity per capita at the local level in
a specific entity and the fiscal capacity per capita at the national level (FCCi and FCCn) [1].
We also note that the deadline for the use of the compensation fund expires.
According to the law no.267, art. IV: “In the first and the second year from the entry into force of
this law, the Government is empowered with the right to form within the state budget, a compensation
fund, which would be up to 1% of the state budget revenues, for covering eventual discrepancies (risks)
related to the reform of the inter-budgetary relations system” [7].
For 2015, this percentage was 0.7%, for the budgetary year 2016 the compensation fund was 0.3%
of the estimated state budget revenues. For the budget year 2017, the ratio was maintained at the level of
2016 (The law on amending and completing some legislative acts no.267 dated 01.11.2013 (Official
Gazette of the RM No. 262-267/748 dated 22.11.2013)).
However, according to the specific peculiarities of establishing inter-budgetary relations and
setting the limits of transfers from the state budget to the local budgets, it is noted that “considering
ECONOMIE ŞI SOCIOLOGIE / ECONOMY AND SOCIOLOGY
17
No. 1-2 / 2017
modest results with reference to the block the consolidation of the fiscal basis of own revenues of the local
public administration authorities, as well as the fact that the year 2016 is the last year in which temporary
compensation transfers to the local budgets are envisaged, the Ministry of Finance drafted proposals for
extending the term of Government empowerment to make up the compensation fund within the state
budget for 3 more years. Along with the consolidation of the base of revenues, the volume of the
compensation fund will be gradually reduced during these 3 years”1.
Inter-budgetary relations. In the state budget law for 2016 in the chapter “General actions”
(annex no.3)2 the amounts allocated for the local administration via the following relations are identified:
• Inter-budgetary relations for balancing the financial possibilities, the amount of 1,167,254.3
thousand MDL being specified;
• Inter-budgetary relations with special designation, the amount of 21,242.8 thousand MDL
being specified;
• Inter-budgetary relations of compensation, with the specification of the amount of 100,055.2
thousand MDL.
Thus, according to the State budget law for 2016, the chapter “General actions” identified
financial allocations to the budgets of the local public authorities, with the total amount of 1,288,552.3
thousand MDL, which is 3.62% of the total expenses in the state budget [2].
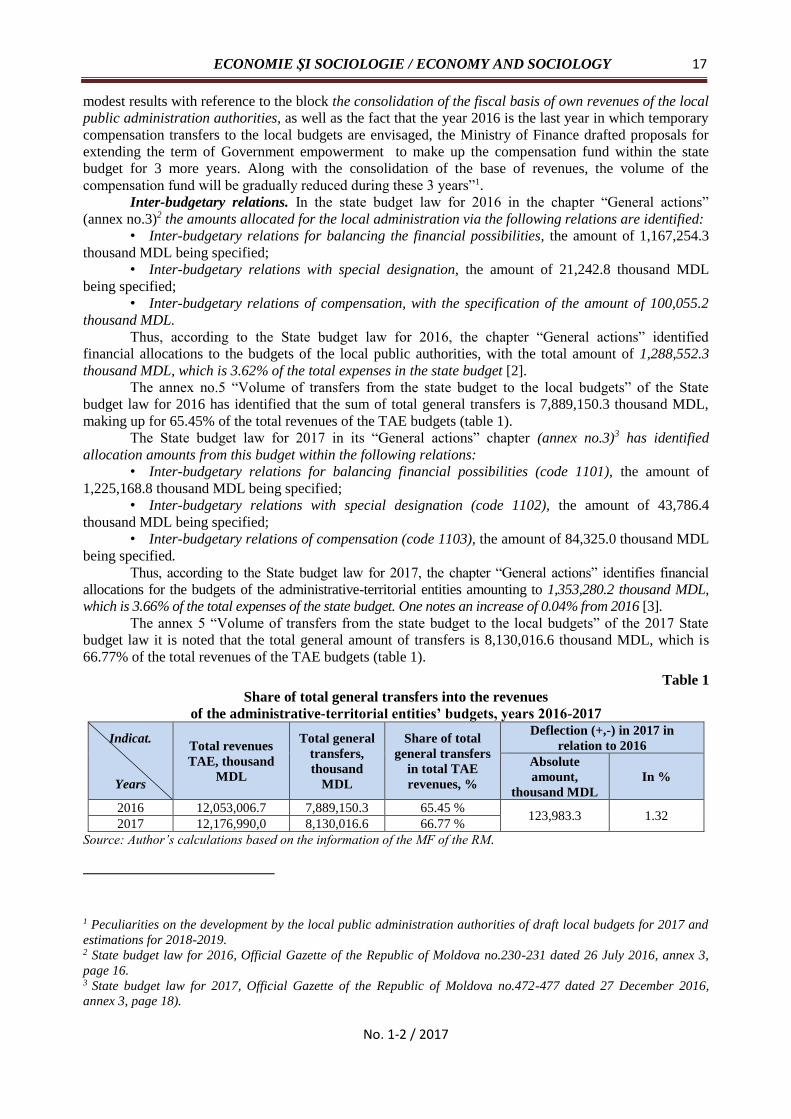
The annex no.5 “Volume of transfers from the state budget to the local budgets” of the State
budget law for 2016 has identified that the sum of total general transfers is 7,889,150.3 thousand MDL,
making up for 65.45% of the total revenues of the TAE budgets (table 1).
The State budget law for 2017 in its “General actions” chapter (annex no.3)3 has identified
allocation amounts from this budget within the following relations:
• Inter-budgetary relations for balancing financial possibilities (code 1101), the amount of
1,225,168.8 thousand MDL being specified;
• Inter-budgetary relations with special designation (code 1102), the amount of 43,786.4
thousand MDL being specified;
• Inter-budgetary relations of compensation (code 1103), the amount of 84,325.0 thousand MDL
being specified.
Thus, according to the State budget law for 2017, the chapter “General actions” identifies financial
allocations for the budgets of the administrative-territorial entities amounting to 1,353,280.2 thousand MDL,
which is 3.66% of the total expenses of the state budget. One notes an increase of 0.04% from 2016 [3].
The annex 5 “Volume of transfers from the state budget to the local budgets” of the 2017 State
budget law it is noted that the total general amount of transfers is 8,130,016.6 thousand MDL, which is
66.77% of the total revenues of the TAE budgets (table 1).
Table 1
Share of total general transfers into the revenues
of the administrative-territorial entities’ budgets, years 2016-2017
Indicat.
Years
Total revenues
TAE, thousand
MDL
Total general
transfers,
thousand
MDL
Share of total
general transfers
in total TAE
revenues, %
Deflection (+,-) in 2017 in
relation to 2016
Absolute
amount,
thousand MDL
In %
2016 12,053,006.7 7,889,150.3 65.45 % 123,983.3 1.32
2017 12,176,990,0 8,130,016.6 66.77 %
Source: Author’s calculations based on the information of the MF of the RM.
1 Peculiarities on the development by the local public administration authorities of draft local budgets for 2017 and
estimations for 2018-2019. 2 State budget law for 2016, Official Gazette of the Republic of Moldova no.230-231 dated 26 July 2016, annex 3,
page 16. 3 State budget law for 2017, Official Gazette of the Republic of Moldova no.472-477 dated 27 December 2016,
annex 3, page 18).

Revistă teoretico-ştiinţifică / Theoretical and scientifical journal
18
No. 1-2 / 2017
Therefore, it is noted that also the transfers in 2017 went up in absolute figures by 240,866.3
thousand MDL or by 1.32% as compared to the 2016 budget year.
At the same time, the state budget maintains the balancing of the financial possibilities also for the
remaining components of the national public budget. Thus, the resources of the state budget are
redistributed among the component budgets of the national public budget: the budgets of the
administrative-territorial entities, the budget of the state social insurance and the funds of compulsory
healthcare insurance. Around 40% of own revenues of the state budget are redistributed via transfers.
The real state of the art in relation to the decentralization process in the Republic
of Moldova
The decentralization process is closely linked to the public administration reform, being, even the
key of this process. One of the main issues of the Republic of Moldova, which needs reforms and heads
towards integration with the European Union, is decentralization. We believe that the Republic
of Moldova made serious steps in this direction. One of the main steps is the reform of the process of
drafting local budgets, by introducing a new formula of calculating general purpose (balancing) transfers.
However, when calculating transfers, an important role is played by the fiscal capacity per capita
from the specific community in relation to the fiscal capacity per capita at the national level. Our results
are presented in the table below. Table 2
The situation in the TAE of the Republic of Moldova in relation
to the fiscal capacity for 2015-2019
TAE
Years
TAE, total LFC N
MDL / capita
LFC I > LFC N LFC I < LFC N
NO. % NO. %
2015 871 259.7 83 9.5 788 90.5
2016 871 295.4 79 9.1 792 90.9
2017 871 333.5 81 9.3 790 90.7
2018 871 377.4 81 9.3 790 90.7
2019 871 406.2 80 9.2 791 90.8
Source: Author’s calculations based on general purpose transfers from the State budget to the TAE
budgets for the respective years (except for TAE Gagauzia). Ministry of finance of the Republic of
Moldova.
The review of the data in the table above proves that on average, the number of TAE with fiscal
capacity per capita bigger than the fiscal capacity per capita at the national level is, on average, about 81
administrative-territorial entities, which is about 9.0% of the total TAE.
At the same time, the number of TAE with a fiscal capacity lower than the national one is on
average 790 entities or 91%.
The overall conclusion would be that the economic situation in the TAE is scarce.
Should we also take into account the number of the population in the administrative-territorial
entities, which have up to 4,000 inhabitants, then according to European standards they fit into the
category of small local entities. There are very few administrative-territorial entities in the Republic of
Moldova with over 4,000 inhabitants, the majority being under this figure.
Thus, the research conducted in 2017 proves that only in Chisinau municipality, over 72% of the
total component entities have over 4,000 inhabitants. In the remaining TAE, in principle, only the towns
that are headquarters of the District councils have over 4,000 residents, while in others the number of
residents is below this figure. For instance, the Anenii Noi district consists of 26 villages and communes.
Only in Anenii Noi there are 11,468 inhabitants, while the remaining administrative entities, or 85%
of the total, have under 4,000 inhabitants. Such a situation is noted in all administrative-territorial entities
of the Republic of Moldova.
These small entities simply do not have the necessary capacity to fulfil the tasks which would be
carried out by the local self-government. This capacity does not refer only to financial resources, but also
to human resources.
As noted earlier, the transfers from the state budget for the TAE budgets come with an
incontestable support. The calculation of the transfers for each TAE budget is made depending on the base
indicators, set out in the calculation formula (table 3).

ECONOMIE ŞI SOCIOLOGIE / ECONOMY AND SOCIOLOGY
19
No. 1-2 / 2017
Table 3
Balancing transfers, years 2015-2019 (village Malinovscoe, district Riscani)
Budget indicators 2015
2016
New
classific.
2017
New
classific.
2018
New
classific.
2019
New
classific.
LFCn/cap. 259,7 lei/loc. 295,4 lei/loc. 333,5 lei/loc. 377,4
lei/loc.
406,2
lei/loc.
Basic indicators:
- Area (km2) 39,87 39,87 39,87 39,87 39,87
- Population (inhabitants) 1185 1149 1136 1136 1136
- LFCi (MDL/cap.) 128,7 194,8 202,3 228,9 246,4
Total ET, MDL
(general purpose) 404 612,1 387 168,0 447 272,2 506 190,1 544 801,9
Source: Author’s calculations based on general purpose transfers from the State budget to the TAE budgets
for the respective years (except for TAE Gagauzia). Ministry of finance of the Republic of Moldova.
The review of the table proves the following:
– LFCn MDL/capita goes up;
– The number of the population slowly goes down;
– LFCi MDL/capita goes up, because the contingent VIPF goes up;
– Total ET with general designation goes up.
The review of this process in other communities (village Recea and village Sumna) from Riscani
district proved same trends.
The legal framework related to the decentralization process and financial self-government
in the Republic of Moldova
1. In 1998 the Parliament of the Republic of Moldova passed the Public finance law no.186-XIV
dated 6 November 1998, which regulates inter-budgetary relations;
2. In 2003 the Parliament of the Republic of Moldova passes a new law on local public finance,
no.397-XV dated 16.10.2003, compliant with the administrative-territorial organization reform;
3. The law on administrative decentralization no.435 dated 28.12.2006, Official Gazette of the
Republic of Moldova no.029 dated 02.03.2007, with its subsequent changes and completions;
4. The law on approving the National decentralization strategy and the Action plan for implementing
the National decentralization strategy for 2012-2015, no.68 dated 05.04.12 (Official Gazette of the Republic
of Moldova no.143-148 dated 13.07.2012, art. 465), which reveals a range of issues making reference to the
decentralization of services and competences, financial, property decentralization, as well as local
development and the capacity of the administrative local public authorities system;
5. Public finance management development strategy 2013-2020 (OG of the RM no. 173-176 dated
9 August 2013);
6. Local public finance law no. 267 dated 01.11.2013 (OG no. 262-267 dated 22.11.2013);
7. The Law on public finance and budgetary-fiscal responsibility no.181 dated 25.07.2014 (Official
Gazette of the Republic of Moldova no. 223-230 dated 08.08.2014, art. 519. Modified: LP89 dated 14.05.15,
OG No. 139-143/05.06.15 art. 257). The purpose of this law (no. 181): to assure sustainable public finance
development, consolidate the budgetary-fiscal discipline and assure efficient and transparent management of
financial resources.
Achievements in decentralization and financial self-government in the Republic of Moldova
A new system of forming the budgets of the TAE (a new formula), which brings along new elements
of decentralization and financial self-government, has been implemented:
1. The system of general purpose transfers (for budgetary balancing) to the budgets of the
administrative-territorial entities is based on revenues and not on average normative costs per capita,
estimated at central level, as was the case in the old system.
2. Norms of deductions from taxes and state fees are established by law per types of budgets
of the administrative-territorial entities (tier I, tier II, municipality of Chisinau and the municipality of Balti,
TAE Gagauzia).

Revistă teoretico-ştiinţifică / Theoretical and scientifical journal
20
No. 1-2 / 2017
3. The general purpose transfers are allocated directly, based on a formula, there are no financial subordination relations.
4. Basic indicators which are considered when determining general purpose (balancing) transfers as follows:
a) fiscal capacity per capita, b) number of the population and c) area. 5. Pre-school, primary, secondary general, special and complementary (extra-school) education, as
well as the competences delegated to the local public administration authorities by law, are financed via special purpose transfers from the state budget.
6. Pre-university education (school, gymnasium, lyceum) is financed from the state budget through category-specific transfers according to the financing methodology based on the standard „per capita” („weighted pupil”) based on formulas; (DG No.868 dated 8 October 2014 – Allocations fund for inclusive education – I, maximum of 2% from the composition).
7. The remaining own competences of the local public authorities of tier I and II are financed from own revenues, deductions from the individual income tax, established in line with the law, and general purpose transfers according to the formula.
8. Establishing priorities in the use of available financial resources, according to the new system, belongs exclusively to the local public authorities.
Decentralization measurement indicators It is significant that the decentralization process can be appreciated, evaluated through a number of
performance indicators. Performance indicators define the extent of change for the results identified within a reference framework. When well chosen, they become measurement instruments which describe the extent of achievement of the objectives of a program. Unlike the results, which identify expectations, the indicators specify which is the standard in relation to which the results would be evaluated.
Performance measurement is based on two principles: 1. It focuses on specific results, on the effects which a program or a project produces. 2. Evaluates the quality of the service in relation to the needs and requirements of the clients and
community. Performance indicators are the units which make up a performance measurement system. Decentralization indicators: There are two types of decentralization performance indicators: quantitative and qualitative, which
are represented by: • Efficiency indicators (example: the cost providing a service) • Effectiveness indicators (example: percentage of the total population which has access to the
provision of a public service) and • Client satisfaction (by means of a poll) [12]. Types of performance indicators: When evaluating the merits of decentralization process, same types of performance indicators, with
certain peculiarities which are specific to decentralization as a process, apply: • Resources indicators (Example: the number of personnel engaged in a project). • Results indicators (Example: the number of conducted projects). • Effects indicators (Example: percentage of renovations conducted within a period of time). • Efficiency and output indicators.
Decentralization indicators and their role in consolidating local self-government Decentralization indicators contribute to the following: • Strengthen local administrative legitimacy; • Build local capacity to converse with the central public administration, international bodies and
private sector; • Improve the forms of public policies’ monitoring; • Improve the process of monitoring decisions with regard to public investments; • Build the capacity to monitor public services [15]. The purpose of decentralization indicators: • To monitor the manner in which the central administration enacts decentralization measures; • To describe how the decentralization-related legal system, in particular, and the local
self-government, in general, are implemented; • Monitor democracy development through dialogue/cooperation between the central, local and citizens; • Understand the modus operandi of the local public finance system in order to assure services and

ECONOMIE ŞI SOCIOLOGIE / ECONOMY AND SOCIOLOGY
21
No. 1-2 / 2017
public utilities by monitoring local taxes, transfers from the state, balancing mechanisms, access to external markets;
• Verify transparency of the decision-making process in financial decisions’ management, use of resources;
• Verify accessibility of public services, as regards quantity, quality and price; • Monitor the process of local human resources development in coordination with the national
strategy of civil servants [15]. To accomplish the goals, decentralization indicators must meet certain conditions: • Indicators must reflect local conditions from political, legal, technological standpoints; • Indicators must be in line with the vision of the local communities, facilitating their participation;
• Indicators must be coordinated with national and international data bases. Table 4
Correlation between decentralization performance indicators, criteria and success factors
Criteria Indicators Success factors
Fiscal self-government The relationship between own local revenues and transfers from the state budget
- The capacity of the local administration to create conditions for small business development;
- The capacity of LPA to collect revenues - The level of local economic development
Transfer of competences List of competences Transfer of resources and local management capacity
Decision-making power Identification of decision-making areas between local and central
LPA capacity for decision-making
Etc. Etc. Etc.
Source: Developed by authors.
Overall conclusions and proposals
1. The concept of decentralization does not base itself only on the traditional understanding of this
process as a transfer of power and resources from the national level (central) to the local level (territorial
decentralization), but also as a need to decentralize certain functions of the state (functional decentralization)
and to establish certain specialized and autonomous central administrative entities, which would exercise
functions of oversight and regulation, and which would have legal, functional and financial self-government
(independence from the central state authorities).
2. Administrative decentralization would mean the extension of the basis for developing adequate
public policies, for building administrative capacities to implement these policies, whose implementation
would grant maximal attention to the public interests.
3. Our research shows that on average, the number of TAE with fiscal capacity per capita bigger
than the fiscal capacity per capita at the national level is of about 81 administrative-territorial entities, which
is about 9.0% of the total TAE per country, while the number of TAE with a fiscal capacity lower than the
one at the national level is, on average, of 790 entities, or 91%. So, the general conclusion would be that the
economic situation in TAE is scarce.
4. The conducted reviews underline that the general purpose balancing transfers tend to go down,
because of the increase of the fiscal capacity per capita in the most of TAE, while the special purpose
transfers go up, because they are financed unconditionally from the state budget, including for pre-school,
primary, secondary general, special and complementary (extra-school) education.
5. The share of general purpose transfers in the budget revenues of the administrative-territorial
entities from the Republic of Moldova, for the reviewed years of 2016-2017, is slowly going up. Thus, their
share in 2016 is 65.45%, while in 2017 – 66.77%, showing a 1.32% increase.
Recommendations:
1. There is a big need to support small and medium enterprises in rural areas, which would generate
revenues and would pay taxes to the local budgets.
2. Also, it is not possible to advance with such administrative-territorial organization, with districts
which have few TAE, for example, Basarabeasca, which has 7 entities, while for the operation of this TAE
the state budget allocates balancing transfers for the second tier of about 4.5 million MDL, while for the first

Revistă teoretico-ştiinţifică / Theoretical and scientifical journal
22
No. 1-2 / 2017
tier – about 6.8 million MDL. There are also mayoralties where the number of population is under 500
inhabitants. Therefore, shock therapy is required.
3. Should local self-government, which would include financial and fiscal self-government be
desired, then the things must be changed based on an administrative-territorial reform. The reform would
imply the consolidation of the economic and financial potential through regionalization.
4. TAE must consolidate its efforts to develop local economy, and infrastructure. Small districts
cannot resolve economic-social and other types of issues.
5. Regionalization is required. Infrastructure development would resolve the issue of
“distance” to the center, which had been one of the reasons for pushing for anti-administrative-territorial
reform in 2000.
6. Decentralization would bring services closer to people. Many of the citizens’ issues would be
addressed on-site.
7. Administrative-territorial reform must be conducted and administrative-territorial entities, which
would assure the economic-social development of the respective territory, must be put in place.
We agree with the experts that rightly believe that in the Republic of Moldova there should be 111
communities with 3-4 regions instead of the 871 existing ones, each community having about 23,800
inhabitants, while each region – about 700,000 inhabitants.
REFERENCES 1. Particularităţilor privind elaborarea de către autorităţile administraţie publice locale a proiectelor
bugetelor locale pentru anul 2017 şi a estimărilor pe anii 2018-2019 [accesat 24 ianuarie 2017].
Disponibil: http://www.mf.gov.md/actnorm/budget/notenormmetod
2. Legea bugetului de stat pentru anul 2016: nr. 154 din 01.07.2016. In: Monitorul Oficial al Republicii
Moldova. 2016, nr. 230-231, art. 486.
3. Legea bugetului de stat pentru anul 2017: nr. 279 din 16.12.2016. In: Monitorul Oficial al Republicii
Moldova. 2016, nr. 472-477, art. 943.
4. MANOLE, Tatiana. Managementul Finanţelor Publice. Chişinău: Tehnica-Info, 2016. 803 p. ISBN 978-
9975-63-401-4. 5. MANOLE, Tatiana, STRATAN, Alexandru. Managementul Finanţelor Publice Locale: probleme şi
oportunităţi. Chişinău: Ed. INCE, 2014. 161 p. ISBN 978-9975-9932-3-4.
6. Strategiei de dezvoltare a managementului finanţelor publice 2013-2020: nr. 573 din 06.08.2013. In:
Monitorul Oficial al Republicii Moldova. 2013, nr. 173-176, art. 669.
7. Legea Finanţelor Publice Locale: nr. 267 din 01.11.2013. In: Monitorul Oficial al Republicii Moldova.
2013, nr. 262-267, art. 748.
8. Legea finanţelor publice şi responsabilităţi bugetar-fiscale: nr. 181 din 25.07.2014. In: Monitorul Oficial
al Republicii Moldova. 2014, nr. 223-230, art. 519.
9. Legea privind descentralizarea administrativă: nr. 435 din 28.12.2006. In: Monitorul Oficial al Republicii
Moldova. 2007, nr. 29-31, art. 91.
10. Legea pentru aprobarea Strategiei Naţionale de Descentralizare şi a Planului de acţiuni privind
implementarea Strategiei Naţionale de Descentralizare pentru anii 2012-2015: nr. 68 din 05.04.12. In:
Monitorul Oficial al Republicii Moldova. 2012, nr. 143-148, art. nr. 465.
11. Hotărârea Guvernului pentru aprobarea Strategiei privind reforma administraţiei publice pentru anii 2016-
2020: nr. 911 din 25.07.2016. In: Monitorul Oficial al Republicii Moldova. 2016, nr. 256-264, art. 1033.
12. Hotărârea Parlamentului privind ratificarea Cartei Europene pentru Autoadministrare locală: nr. 1253-XIII
din 16.07.97. In: Monitorul Oficial al Republicii Moldova. 1997, nr. 48.
13. FREGE, X. Descentralizarea. Bucureşti: Ed. Humanitas, 1991. 159 p. ISBN 973-28-0189-1.
14. BUŞMACHIU, Eugenia. Aspecte privind descentralizarea fiscală în Republica Moldova = Fiscal
descentralization aspects in the Republic of Moldova. In: Economie şi Sociologie = Economy and
Sociology. 2011, nr. 1, pp. 104-110.
15. Program de formare în Descentralizare pentru autorităţile publice centrale şi locale din Republica Moldova
– Ghidul participantului. Pregătit pentru AAP. Chişinău, 2012, mai.
Note: All materials are analyzed by the authors. There were made authentic calculations based on official
materials and were elaborated tables. Required sources are indicated. Conclusions and recommendations from research conducted by authors.
Recommended for publication: 19.05.2017
ECONOMIE ŞI SOCIOLOGIE / ECONOMY AND SOCIOLOGY
23
No. 1-2 / 2017
ТHE MANAGEMENT OF FINANCIAL STABILITY
IN NATIONAL STRATEGIES
Rodica PERCIUN1, PhD, Associate Professor,
National Institute for Economic Research, Moldova
Dorina CLICHICI2, PhD, Senior Researcher III,
Institute for World Economy, Romania
In this article authors provide an overview of national strategies that directly or indirectly
consider the management of financial stability. The actuality of this research topic is based on several
factors. Firstly, the depth of the global financial crisis that started in 2007 has shown that financial
stability must be ensured and monitored by competent authorities. Secondly, the situation of the national
economy has been worsened since 2015, as a result of massive dilapidation of funds and serious violations
with regard to preserving the systemic financial stability of the Republic of Moldova. Under the present
state the issue of ensuring financial stability becomes more significant and important. The purpose of the
research is to analyze and synthesize national strategies which reflect the management of financial
stability and to detect the existing gaps. The scientific methods used are the following: systemic approach,
analysis and synthesis, induction and deduction, logical analysis, critical analysis, etc. The research has
found that the policy of preserving the systemic financial stability is missing from the current national
strategies, and there is a huge gap with regard to banking supervision and the objective of ensuring
systemic financial stability.
Keywords: financial stability, strategy, management, central bank, economic security, national
security, etc.
În acest articol autorii efectuează o sinteză a strategiilor naționale care, în mod direct sau
indirect, reflectă gestiunea stabilității financiare. Tema de cercetare este actuală datorită mai multor
factori. În primul rând, profunzimea crizei financiare globale, ce a demarat în anul 2007, a demonstrat că
stabilitatea financiară trebuie să fie asigurată și monitorizată de către autoritățile abilitate. În al doilea
rând, situația în care se regăsește economia națională din anul 2015, drept consecință a unor delapidări
masive de fonduri și încălcări grave privind menţinerea stabilității financiare sistemice a Republicii
Moldova. În condiţiile actuale, problema asigurării stabilității financiare capătă o amploare şi o
importanţă tot mai semnificativă. Scopul cercetării este analiza și sinteza strategiilor naționale în care
este reflectată gestiunea stabilității financiare și depistarea lacunelor. Metodele ştiinţifice utilizate sunt:
abordarea sistemică, analiza şi sinteza, inducţia şi deducţia, analiza logică, analiza critică a materialelor
etc. Cercetarea a constatat că politica de menținere a stabilității financiare sistemice lipsește din cadrul
strategiilor naționale actuale și a identificat diferențe majore privind supravegherea bancară și obiectivul
asigurării stabilității financiare sistemice.
Cuvinte-cheie: stabilitate financiară, strategie, management, banca centrală, securitate
economică, securitate națională etc.
В этой статье авторы представляют обзор национальных стратегий, которые прямо или
косвенно рассматривают менеджмент финансовой стабильности. Тема исследования является
актуальной из-за нескольких факторов. Во-первых, глобальный финансовый кризис, начавшийся в
2007 году, показал, что финансовая стабильность должна быть обеспечена и контролироваться
компетентными органами. Во-вторых, ситуация национальной экономики ухудшилась с 2015 года
в результате массовых хищений денежных средств и серьезных нарушений в отношении
сохранения системной финансовой стабильности Республики Молдова. В современных условиях
проблема обеспечения финансовой стабильности приобретает более значительный масштаб и
важность. Целью исследования был анализ и синтез национальных стратегий, в которых
1© Rodica PERCIUN, [email protected] 2 © Dorina CLICHICI, [email protected]

Revistă teoretico-ştiinţifică / Theoretical and scientifical journal
24
No. 1-2 / 2017
отражается менеджмент финансовой стабильности и выявление пробелов в данных документах.
Используемые научные методы: системный подход, анализ и синтез, индукция и дедукция,
логический анализ, критический анализ материалов и т.д. Исследование показало, что политика
обеспечения системной финансовой стабильности отсутствует в текущих национальных
стратегиях, а также существует огромный разрыв между банковским надзором и целью
обеспечения системной финансовой стабильности.
Ключевые слова: финансовая безопасность, стратегия, управление, центральный банк,
экономическая безопасность, национальная безопасность и т.д.
JEL Classification: E00, E02, G01, G28.
UDC: 336.1/.7(478)
Introduction. The systemic financial stability is an essential component of economic and national
security. The purpose of studying the management of systemic financial stability is to analyze and predict
a wide range of determinants of the financial system stability, by revealing the dangers and weaknesses
within its functioning. The systemic financial stability is preserved by a series of activities carried out in
the financial area in connection with the following sectors: monetary and credit, economic, social,
international financial etc. Consequently, the concept and the strategy of systemic financial stability
should be reflected and addressed in the general concept of the state strategy of economic security as well
as in the economic, budgetary and monetary policy.
Scientific approach. The starting point in the research of financial stability as a scientific
dimension was the year 1974, along with the coming out of Financial Instability Hypothesis by Hyman P.
Minsky. The global financial crisis has “awoken the interest” for thorough research of both financial
stability concept and its measurement methodology. There were developed a series of research papers
which specify and define the financial stability, financial instability, crisis warning instruments etc.; the
main western authors are: W. Allen, G. Wood, J. Chant, A. Crockett, F.S. Mishkin, H.P. Minsky, M. Foot,
M. Illing, O. Evans, A. Leone etc. The Romanian researchers that have approached this subject are:
Dinga E., Cerna S., Albulescu C., Donath L., Seulean V., Herbei M., Batrancea I., Barglazan D., Boldea
B., Chiritescu D.D., Vasilescu M., Campeanu E., Chiriacescu B., Danila A., Dardac N., Diacunu R.,
Isarescu M., Moinescu B., Nedelescu O., etc. As well as Russian scientists that have revealed the issues
connected to economic and financial security are: Abalkin L., Arhipov A., Gorodețky A., Mihailov B.,
Bulihvald E., Glovațkaya N., Lazurenco S., Vasilik S., Vecikanov G., Vorobiov A., Chenușina T.,
Glaziev S., Goncearenco L., Drobisevsky S., Senceacov V., Trunin P. etc. However, we have to mention
that the concept of systemic financial stability especially the management of systemic financial stability
in the Republic of Moldova is still insufficiently studied.
Applied research methods. In the research process were firstly applied the general scientific
methods such as: systemic approach, analysis and synthesis, induction and deduction, logical analysis,
critical analysis of materials, monographic analysis, typology method, analogy method etc. Informational
support of the study represents scientific publications on the topic of research; analytical materials and
results of institutional research projects applied within NIER; national legislation in the analyzed field,
policy documents; strategies of the National Bank of Moldova, Government of the Republic of Moldova,
Ministry of Economy, National Commission for Financial Markets, Ministry of Finance etc. as well as
draft laws and regulations, other informational resources on-line available.
Results obtained. The main activity directions of the Government of the Republic of Moldova,
according to the Law no.64 of May 31, 1990 on Government, are to create conditions for establishing and
ensuring economic and political sovereignty of the Republic of Moldova, providing the protection of
national interests within the external economic activity, promoting the free trade policy and national
security policy [5].
Moreover, the vision of the Republic of Moldova on economic growth and medium and long term
prospects for development is provided by the National Development Strategy „Moldova 2020” [16]. This
strategy seeks to change the development paradigm – from the current economic model based on domestic
consumption sustained by remittances to a model based on domestic and foreign investment and on the
increased export of goods and services, which would support the creation of jobs and the economic
welfare in after years. As mentioned in the Strategy – „The economic growth, wherever it occurs, is based
on three pillars – factors of production function, i.e. accumulation of production factors – capital and labor
ECONOMIE ŞI SOCIOLOGIE / ECONOMY AND SOCIOLOGY
25
No. 1-2 / 2017
and their productivity degree, including any other parameters, such as: technologies, efficient government,
skills etc. In the view of the National Development Strategy „Moldova 2020” the Government has made
an attempt to shape the historical and future growth of the Republic of Moldova”.
The same Strategy indicates 8 critical issues which are the basis for goals identification:
1) Aligning the educational system to labor market requirements in order to increase labor
efficiency and the employment in the economy;
2) Increasing public investment in local and national road infrastructure for mitigating transport
expenditures and raising speed of access;
3) Reducing financing costs by increasing competition in the financial sector and developing risks
management tools;
4) Improving business environment, promoting a competition policy, optimization of regulatory
framework and application of information technologies in public services for the business environment
and citizens;
5) Reducing energy consumption by increasing energy efficiency and using renewable energy
sources;
6) Ensuring financial sustainability of pension system to secure an appropriate rate of salary
replacement;
7) Increasing the quality of justice and fighting against corruption for insuring an equitable access
to public goods for all citizens;
8) Increasing the ccompetitiveness of agri-food products and insuring sustainable rural
development [16, p.47].
Given the mentioned goals we conclude that the Government has no direct goal related to
assurance of systemic financial stability. According to this Strategy the focus is to produce a socio-
economic impact on each of the dimensions mentioned above. The cumulated effect of the concerned
issues is to eliminate the critical barriers which block the optimal development of resources. This
approach makes possible the prioritization of state intervention fields and their submission to a well-
defined goal of the Strategy: assurance of qualitative economic development and implicitly the poverty
alleviation [16]. Accordingly, the systemic financial stability is a topic eliminated from strategic goals list
of the Government and the provision of systemic financial stability is the first condition to ensure a
qualitative development and poverty alleviation. The Ministry of Economy is the central body of public
administration which compiles and promotes the macroeconomic single policy. However, in the annual
report of the Ministry there is no goal or direction to ensure the macroeconomic stability. According to its
Activity Report for 2015, the Ministry of Economy has contributed to the promotion and implementation
of the policies focused on main activity directions for which in the Action Plan of the Ministry of Finance
for 2015 there were planned 134 goals and 369 actions (during the year, the plan was expanded up to 376
actions). These goals were achieved as follow: 55% fulfilled, 40% – partially fulfilled and 5% –
unfulfilled. The goals related to such areas as: business environment (regulation of entrepreneurial
activity), small and middle enterprises (access to finance, business support infrastructure, entrepreneurial
culture), domestic trade, administration and privatization of public property, investment and exports
promotion (ensuring the implementation of state policy on attracting investment and export promotion),
industrial and competition policy, economic cooperation with EU [13].
According to the Law of public finances and budgetary-fiscal responsibilities no. 181 of June 25,
2014, the Ministry of Finance is the central public authority in the public finances area and has the
following basic skills and responsibilities: compiles and ensures the budgetary-fiscal policy according to
the established budgetary-fiscal principles and rules; prepares and submits to the Government for
approval the medium term budgetary framework and the draft law on mid-term macro budget limits;
administers the public debt and state guarantees, as well as monitors public debt [6].
In the Republic of Moldova, the budget process lies behind the budgetary policy and is open for
negotiation. Those who have economic goals try to achieve them by providing amendments on the budget
process. The degree in which the interest groups and the public have access to the formulation of
budgetary policies and the degree of decisional transparency are tools which can influence the budgets.
The budgetary policy also depends on the behavior of political and administrative bodies [8].
In this context it should be noted that the budgetary policy can be also seen as a process which
indicates where, when and by whom the resources are more efficiently allocated. To answer these
questions it is necessary to perform a synthesis of the legal and institutional framework analysis in the
Revistă teoretico-ştiinţifică / Theoretical and scientifical journal
26
No. 1-2 / 2017
field of public finances of the Republic of Moldova [9].
In the field of finances are reflected the results of activities conducted by millions of people, their
participation in the establishment of financial resources funds, redistribution of funds between different
recipients and their impact on socio-economic development. As a result, the progress of financial relations
is no accidental and it is necessary to be rigorously regulated.
The financial system seen as relations in public finances is composed of the budget system, which
is an aggregate of joined public budgets, composed of many components which are invidualised by a
series of specific features (programming competences, adoption, implementation and resolution powers,
sources of revenues formation, expenditures purpose, degree of territorial scope etc.), and others,
including public nature of needs and resources which are defining [11]. In the Republic of Moldova, the
fiscal governance is ensured by the Law on public finances and budgetary-fiscal responsibilities and Law
on public sector debt, state guarantees and refinancing [4, 6].
The budgetary-fiscal policy at macroeconomic level influences the macroeconomic variables such
as the balance of payments, inflation, general level of economic development, external debt and, finally,
systemic financial stability. The fiscal policy for 2017 is mainly oriented to accumulate more resources for
the budget. The main cause of this policy is the consequence of the economic recession and financial
crises caused by significant funds dilapidation. This is explained by the fact that the authorities urgently
need money to meet their commitments and only by tightening the policy it could accumulate the
necessary financial amounts into the budget, but very often the expectations are not the same as reality. In
the article „Tax burden – an essential component to ensure financial stability of the state”, the authors
Perciun R., Popa V. argue on the role of tax burden analysis for financial stability. In this article is shown
that in different periods there are applied various fiscal burden shares by the decision-makers [10].
The analysis of the public finance situation shows that the fiscal and customs policy measures are
not sufficient to supplement the national public budget revenues. As well the efficientization of budget
spending is imminent, it will allow finding the necessary sources for other problems of social and
economic importance.
It should be noted that the public finance management is an important instrument for providing
fiscal policies and achieving the final goal of sustainable growth and development. According to the
Strategy of public finance management development 2013-2020 [3], „Government is committed to
achieve the accession to high standards of responsibility and transparency in the public sector which are
essential to provide public services and other activities falling within the power of Government”, and „the
responsible body for the Strategy of public finance management development 2013-2020 will be the
Ministry of Finance” [3, p.2]. This strategy presents a „consolidation in a single document of several
policy actions and dedicated ongoing strategies in more critical components of the public finance
management” [3, p.2].
Thus, according to the annual Report on Action Plan implementation for the Strategy of public
finance management development 2013-2020, in 2015, under division „Ensuring a debt management in
accordance with good practices”, subparagraph „Annual Development of mid-term State Debt
Management Program”, the Ministry of Finance has reported „Action in course of implementation (it will
end during the I quarter of 2016)” [13]. In order to ensure a prudential management of the state debt
according to the good practices in the field it was elaborated the Program „Mid-term management of state
debt (2016-2018)” [7]. The basis of the Program is the reviewed Forecast of macroeconomic indicators for
the period 2016-2018, compiled by the Ministry of Economy, and the evaluations of the state budget
during 2016-2018, presented within MTBF 2016-2018. At the same time, the political instability
and frequent changes in the Cabinet of Ministers during 2015 slowed down the promotion and
the approval of the Program „Medium-term management of state debt (2016-2018)” by the Government.
As a consequence, the Program was submitted to the Government for approval in the first quarter of 2016.
In the Program „Medium-term management of state debt (2015-2017)”, it is noted that the Minister
of Finance has analyzed 4 Funding Strategies [7].
„Strategy I presents prospects on funding sources according to indicators which are at the basis
of the Medium-Term Budgetary Framework 2016-2018 and emerging from the current market conditions.
The Ministry of Finance forecasts the following indicators (table 1):
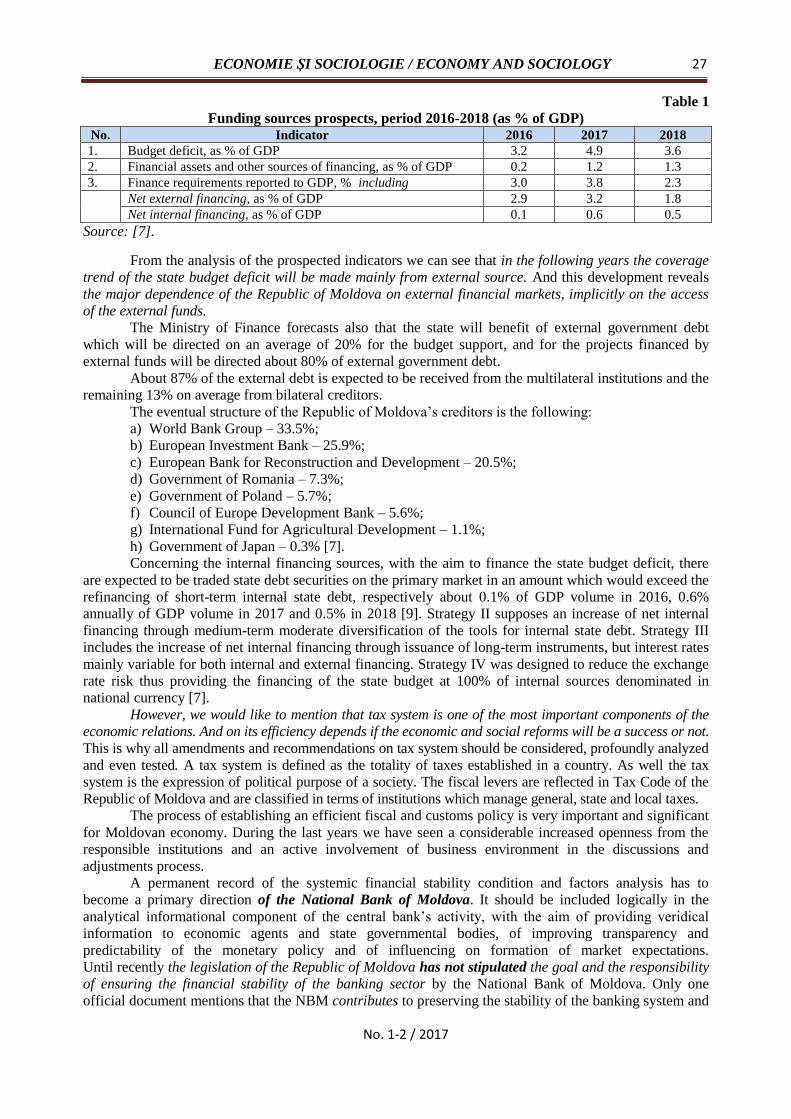
ECONOMIE ŞI SOCIOLOGIE / ECONOMY AND SOCIOLOGY
27
No. 1-2 / 2017
Table 1
Funding sources prospects, period 2016-2018 (as % of GDP) No. Indicator 2016 2017 2018
1. Budget deficit, as % of GDP 3.2 4.9 3.6
2. Financial assets and other sources of financing, as % of GDP 0.2 1.2 1.3
3. Finance requirements reported to GDP, % including 3.0 3.8 2.3
Net external financing, as % of GDP 2.9 3.2 1.8
Net internal financing, as % of GDP 0.1 0.6 0.5
Source: [7].
From the analysis of the prospected indicators we can see that in the following years the coverage
trend of the state budget deficit will be made mainly from external source. And this development reveals
the major dependence of the Republic of Moldova on external financial markets, implicitly on the access
of the external funds.
The Ministry of Finance forecasts also that the state will benefit of external government debt
which will be directed on an average of 20% for the budget support, and for the projects financed by
external funds will be directed about 80% of external government debt.
About 87% of the external debt is expected to be received from the multilateral institutions and the
remaining 13% on average from bilateral creditors.
The eventual structure of the Republic of Moldova’s creditors is the following:
a) World Bank Group – 33.5%;
b) European Investment Bank – 25.9%;
c) European Bank for Reconstruction and Development – 20.5%;
d) Government of Romania – 7.3%;
e) Government of Poland – 5.7%;
f) Council of Europe Development Bank – 5.6%;
g) International Fund for Agricultural Development – 1.1%;
h) Government of Japan – 0.3% [7].
Concerning the internal financing sources, with the aim to finance the state budget deficit, there
are expected to be traded state debt securities on the primary market in an amount which would exceed the
refinancing of short-term internal state debt, respectively about 0.1% of GDP volume in 2016, 0.6%
annually of GDP volume in 2017 and 0.5% in 2018 [9]. Strategy II supposes an increase of net internal
financing through medium-term moderate diversification of the tools for internal state debt. Strategy III
includes the increase of net internal financing through issuance of long-term instruments, but interest rates
mainly variable for both internal and external financing. Strategy IV was designed to reduce the exchange
rate risk thus providing the financing of the state budget at 100% of internal sources denominated in
national currency [7].
However, we would like to mention that tax system is one of the most important components of the
economic relations. And on its efficiency depends if the economic and social reforms will be a success or not.
This is why all amendments and recommendations on tax system should be considered, profoundly analyzed
and even tested. A tax system is defined as the totality of taxes established in a country. As well the tax
system is the expression of political purpose of a society. The fiscal levers are reflected in Tax Code of the
Republic of Moldova and are classified in terms of institutions which manage general, state and local taxes.
The process of establishing an efficient fiscal and customs policy is very important and significant
for Moldovan economy. During the last years we have seen a considerable increased openness from the
responsible institutions and an active involvement of business environment in the discussions and
adjustments process.
A permanent record of the systemic financial stability condition and factors analysis has to
become a primary direction of the National Bank of Moldova. It should be included logically in the
analytical informational component of the central bank’s activity, with the aim of providing veridical
information to economic agents and state governmental bodies, of improving transparency and
predictability of the monetary policy and of influencing on formation of market expectations.
Until recently the legislation of the Republic of Moldova has not stipulated the goal and the responsibility
of ensuring the financial stability of the banking sector by the National Bank of Moldova. Only one
official document mentions that the NBM contributes to preserving the stability of the banking system and
Revistă teoretico-ştiinţifică / Theoretical and scientifical journal
28
No. 1-2 / 2017
of supervised financial institutions – Memorandum of Understanding on Maintaining the Financial
Stability. Within the NBM, the attributions pertaining to financial stability are carried out by issued
regulations and prudential supervision, by an efficient transmission of monetary policy and by supervision
of the payments system.
As scholar Cerna mentions ”Until the outbreak of the crisis, the central banks grounded their
monetary policy strategies on the hypothesis that the monetary stability leads necessarily to financial
stability and both contribute to a sustainable economic growth”. The countries with emerging market
economy have additionally tried to achieve exchange rate stability. It is true that these countries, as others
argued, are concerned about exchange rate only if it influences the inflation and do not follow a certain
target in connection with it [1, p.8].
From the analysis of the legal framework it can be noted that under the provisions of art. 4 of the
Law on National Bank of Moldova, the main goal of the NBM is ensuring and maintaining price stability.
The medium-trem monetary policy of the National Bank of Moldova (approved by the Decision of the
Executive Board of the National Bank of Moldova no. 303 of December 27, 2012) states that price stability
can be defined as a situation in which the prices advance is sufficiently reduced and stable so that not to
exercise a significant influence on economic decisions of the society. In the above mentioned Strategy it is
also specified that ensuring price stability and maintaining inflation rate at a low level will contribute to
the creation of a new relatively stable economic framework which will assure the economic development
and a sustained level of economic growth. Also, the National Bank of Moldova considers that a low,
relatively stable and credible target of inflation:
– will keep the nominal interest rate at a low level which stimulates the long-term investment and
allows to keep the economic agents competitiveness internally and externally;
– will discourage speculative activities and consolidate financial stability;
– will support sustainable economic growth, job creation and lead to an increased productivity
and an improved quality of life;
– will protect population with fixed incomes and socially disadvantaged groups that are affected
especially by high rate of inflation and by the erosion of investment revenues and social payments
(pensions, allowances etc.) [2].
Since 2011, the NBM has approved the publication of Report on Inflation, which reflects a
detailed analysis on the achievement of the established goal in the context of eventual risks which may
affect the process of meeting the target, and in case of exceeding the rate of inflation and the forecasted
inflation over the established limits, the NBM has proposed to present a corrective action plan in this
direction. It is also provided a medium-term inflation forecast taking into consideration the analysis of the
external environment (rates of economic growth in advanced and emerging economies, unemployment
rate in advanced economies etc.), aggregate demand, risks and uncertainties [2].
The permanent concern of the NBM for consolidation of its institutional capacities has resulted on
the one hand in the efficiency of bank supervision activity and on the other hand in the consolidation of
the legal framework. Also, the process of prudential supervision is favored by the existence of an
appropriate legal framework which regulates the organization of the entire banking activity according to
the rules of prudential and healthy banking practices.
In the Republic of Moldova the supervision of the banking sector is more important than that of
other sectors of the financial system. According to some authors (S. Cerna, E. Dinga, etc.), key
characteristics that a regulation and financial supervision authority should possess are: independence,
responsibility and transparency. The authors agree with this opinion and consider that the NBM
independence is the main element which will ensure the financial stability goal but this presumes the
capacity to resist to any political influence in the decision-making process. The responsibility is the degree
in which the supervision authorities are accountable for their actions, decisions and performances and can
explain and justify to the market participants. The transparency is the information exposure on
government activities to the general public.
Discussions. As a result of the analysis of the current situation in the Republic of Moldova we
have found that a series of serious reforms should be initiated, as well as implemented a series of modern
concepts; we need scientific and well-argued approaches of a well-functioning management of systemic
financial stability.
The new concept has to encompass the object of management, purpose, tasks, methodological
principles, solution instruments, evaluation target indicators.

ECONOMIE ŞI SOCIOLOGIE / ECONOMY AND SOCIOLOGY
29
No. 1-2 / 2017
The main priority of state activity regarding the ensuring of financial stability is the security
of citizens of the state and the improvement of quality of life. The purpose of the management is to
ensure financial sustainability and independence which are manifested by macroeconomic balancing,
reduction of state debt, a strong national currency and an increased welfare. The main methodological
principles of management of financial stability are: macroeconomic balance of all economic sectors,
interests’ correspondence of all members of the society, use of economic laws, considering the internal
and external political and economic conditions according to real capabilities. The main condition of
financial stability is to protect the financial interests at all levels of financial relations.
It is very important that nowadays the financial stability to be analyzed not only as a state (and
mostly it is noted the financial-economic situation of the banks) but also as a strategic process which consist
in ensuring economic security of the state. This is a long-term process. Respectively, it is also necessary to
determine the stability criteria specific to the Republic of Moldova. It should be taken into account that in
modern conditions, the notion of “financial stability” turns gradually into an efficient risk management and
financial control. Thus, the first problem that arises is that of informational assurance, namely how the
management control the activity of the financial system, especially the banking one and how quickly and
efficiently can it respond to a changing situation, to determine various options of events development and to
take necessary measures to accomplish the financial stability and to minimize the risks.
The analysis of the international experience in this field has shown that since 2009 all central
banks, governments pay a special attention to financial stability management. The financial organizations,
especially the IMF, recommend reducing the macrofinancial risks and imbalances based on broadening the
spectrum of monetary instruments by improving the supervision system of financial stability and
macroprudential supervision. For our country which is characterized by an unstable economy, the new
concept of systemic financial stability management has to include all particularities of financial instability
and actual state of the economic and financial system, and to represent a flexible complex of goals which
shall be included and achieved by a systemic financial stability and macroeconomic strategy. This strategy
should involve: creating conditions and ensuring balanced and sustainable economic growth; providing
stability of the financial system; restructuring the production and resources potential according to the
demand, indispensable for building a modern and developed economy; effective inclusion in the world
economic system; increasing employment and social stability; creating a state institutional management
and non-state institutions according to the international practices; ensuring an efficient legal framework.
The effectiveness of stability programs depends largely on the crisis nature and the national
economy particularities. The strategy mission shall take into consideration the following characteristics:
a) formation of a flexible structure to monitor efficiently the systemic financial stability;
b) sustainability of national financial system;
c) economy specialization;
d) management modernization of financial area.
In most emerging economies, the systemic financial stability strategies are an integral part of
strategies related to the state economic security. Under adverse circumstances, internal and/or external
ones, the systemic financial stability can be ensured only by a system framed in the economic security.
In authors’ opinion, a modern concept of systemic financial stability management shall be guided
and shall contain: 3 mechanisms, 3 directions and 3 characteristics – Rule of three dimensions (figure 1).
Figure 1. Rule of three dimensions
Source: Compiled by authors.
• 3 mechanisms Mechanism of a proper economic policy as a whole Prevention and warning mechanism of financial instability and crises emergence
Macroprudential mechanisms of protection and supervision of financial stability
• 3 directions
• 3 characteristics
Development of market discipline at the national level Improving national supervision systems Adoption of a holistic approach
structure consecutiveness institutional support
Revistă teoretico-ştiinţifică / Theoretical and scientifical journal
30
No. 1-2 / 2017
– 3 mechanisms. After analyzing the historical experiences of the countries which overcame
similar crises and succeeded to stabilize the financial situation we can emphasize 3 main mechanisms that
should be taken into consideration:
Mechanism of a proper economic policy as a whole. The systemic financial stability strategy
has to be an integral part of the macroeconomic strategy of the Republic of Moldova. Firstly, this shall
become the main instrument for achieving the long-term interests of the country, ensuring the economic
independence and security of the Republic of Moldova. The main national interest of the Republic of
Moldova shall remain the sustainable development of economy, competitiveness on external markets and
an increased welfare. However, the above mentioned strategy has to meet the social efficiency criteria, i.e.
on the one hand the strategy shall involve the innovative development, financial system balance, resilience
capacity of the financial system to various risk factors, on the other hand the good results of the economic
policy, GDP growth and population welfare. Only such a strategy oriented towards the welfare of society
and based on a financial system ready to ensure the economic growth by financial intermediation can
be called effective.
We must consider new policies which would solve one of the most difficult and complicated
problems – building the aggregate financial potential of Moldovan economy, that includes the state and
local budgets and extra-budget funds, corporate finances, as well as households finance. In the broad sense
of finance, the banking resources are also situated in this aggregate potential. Each defined segment keeps
its independence and functions, while the consolidated financial potential serves as a basis to achieve the
national interests of the state, mentioned previously. The systemic financial stability Strategy includes not
only the public finance strategy, but it should be as well a strategy of the corporate sector finance and
other private financial institutions.
The development of the mentioned strategy shall be long-lasting and shall imply a complex
management of the external and internal public debt of the Republic of Moldova, as well private debts.
This shall also respect the capital inflows and outflows. The flight of capital is a phenomenon
hardly to identify and prove, however there must be a methodology at the state level, based on the
international standards to follow the capital inflows and outflows in our country.
The concerned strategy implies the use of all instruments and relevant institutions and creation of
a well-organized system. For example, the fiscal policy shall emphasize the development of some
indicators which could forecast on long-term the increase of tax basis by substituting some taxes to other
modern forms, which could reduce the discrimination and would ensure the equity of tax-payers. At the
same time, it will allow diminishing the phenomenon of tax evasion. The public investment should be
made based on a qualitative analysis and prioritization of national economy sectors, which bring added
value (the so-called SMART specialization), to create advantageous conditions to enterprises that have a
competitive advantage on external markets. In such a way, could be created a greater fiscal potential based
on these sectors. Certainly, a special element in the creation of a systemic financial stability Strategy is the
monetary policy. Since 2015 the dilemma of financial stability against price stability has persisted in the
Republic of Moldova. A sustainable economic growth is impossible without the ability of the banking
system to create money and to direct these resources to crediting the real sector. The generation of new
financial resources should be coordinated between the NBM and Ministry of Finance.
Prevention and warning mechanism of financial instability and crises emergence
The current financial crisis calls for a mix reorientation of promoted policies, thus requiring a new
vision to address the financial stability of the state. In this respect, it is imminent and necessary to
determine a modern prevention and warning mechanism of financial instability by applying new
methodologies which will help to:
- assess the potential of the country to face eventual external shocks;
- develop protection policies of the economic growth and reduction of poverty.
We suggest replacing the existent National Committee for Financial Stability, which has failed to
manage the banking crisis, with a new macroprudential structure which shall be established under a law
(for example the Romanian case, Law on macroprudential supervision of the national financial system).
The suggested National Committee for Macroprudential Supervision could be composed of the
following institutions:
1. National Bank of Moldova;
2. Ministry of Finance and Economy which represent the Government;
3. National Commission of Financial Markets;

ECONOMIE ŞI SOCIOLOGIE / ECONOMY AND SOCIOLOGY
31
No. 1-2 / 2017
4. Deposit Guarantee Fund of the Banking System;
5. Independent Expert in the field (perhaps even from academia).
This Committee is an interinstitutional cooperation structure having as a major role ensuring the
coordination of the macroprudential supervision at the national level and the systemic financial stability.
The Chairman of the Committee should be the Governor of the NBM. At the same time there must
be a Decisional Body called the General Council composed of the following members:
• governor, deputy governor of the National Bank of Moldova;
• chairman and deputy chairman of NCFM;
• ministers and prime ministers of the Economic and Finance Ministers.
Macroprudential mechanisms of protection and supervision of financial stability
As well, it should be taken into account the distributions of resources, ensuring simultaneously the
balance between the interests of all participants. The rotation on the national financial markets is a formal
efficiency criterion in the context of attracting the savings on the financial market, distributing and
transforming them into investment. The main directions of increasing this indicator are – the development
of bank crediting of the real sector and encouraging banks in intermediation activity to prepare
investment projects and attract external and internal investors.
Achievement of the mentioned measures is possible only under the existence of a performing
banking system, capital market and efficient instruments of public finance adjustment.
– 3 directions. Strategy for attaining financial stability shall also provide the following
3 directions:
• Development of market discipline at the national level (emphasizing the role of the National
Bank of Moldova as national supervising and resolution authority).
• Improving national supervision systems (an established National Committee for
Macroprudential Supervision).
• Embracement of a holistic approach.
The holistic approach1 emphasizes the importance of a general protection against global
imbalances. The main protection tools against global imbalances transmission suggested by the IMF are
the following:
- To introduce regulation mechanisms with the purpose to reduce the weight of borrowed
resources from the world banks and to use regulation methods of capital draws from the country made by
the largest companies managing the assets.
- To allow a higher appreciation of the national currency.
- To introduce control measures of operations on capital and regulation of capital flows.
- To mitigate the effects of inflows through the macroprudential policy measures – that is
regulation policies regarding the risk of collapse reduction of the entire financial system and not with the
help of traditional measures of economic policy oriented towards private companies [16].
– 3 characteristics. In order to ensure the systemic financial stability, the modern concept of its
management has to include 3 main characteristics: structure, consecutiveness and institutional
support.
Conclusions. The research has revealed that there is no strategy to preserve financial stability in
the Republic of Moldova. As well as a policy on a systemic financial stability within the current national
strategies is missing, and there is not much difference between banking supervision and systemic financial
stability objective. Currently, in Moldova there is no organized and implemented system for monitoring
the financial stability. However, financial stability monitoring system is the first component related to the
organization of the management of financial stability. This measure is applied practically in all countries.
Currently, the following institutions have direct responsibilities on systemic financial stability
management: National Bank of Moldova, NCFM supervising non-banking financial market, Ministry of
Finance in charge of public financial management. In addition to these authorities there are also the
Parliament of the Republic of Moldova, Government of the Republic of Moldova, Ministry of Economy.
From the analysis, it was concluded that the responsible institutions do not coordinate their actions
and decisions in an efficient manner both essentially and in time. As example is the activity of the
1 Principle of totality on parts and its irreductibility to the amount of integral parts.

Revistă teoretico-ştiinţifică / Theoretical and scientifical journal
32
No. 1-2 / 2017
National Committee for Financial Stability. Emerging from the events of 2014-2015 and the way that the
state institutions have worked in this period it was stated several times the necessity of an additional
regulation of the activity of this Committee, which would ensure a more efficient coordination of actions
preventing financial shocks; establishment of the whole functioning mechanism; clear delimitation of each
state institution responsibility involved in the coordinated actions in the process of crisis management;
establishing a permanent coordination framework between the authorities represented in NCFM;
transparency, exchange of information and public information.
The starting point of implementation of the concept suggested by authors is the National Security
Strategy. In 2016, the Presidency of the Republic of Moldova has initiated the process of public debates
on National Security Strategy project of the Republic of Moldova. In this Strategy have been defined
national interests; main threats; risks and vulnerabilities to the national security. The main components of
the external policy and defense policy related to national security assurance were outlined. At the same
time, there are identified ways to ensure the national security and guidelines of the national security sector
reform. In the aforesaid act, the financial stability is an ignored matter. Thus, we mention that the
national security is a synergistic notion including a series of components, such as: economic security,
financial stability, technological security, energy, demographic and food security etc.
REFERENCES 1. CERNA, Silviu. Băncile centrale în epoca postcriză. Centrul pentru economie şi libertate. 2014 [accesat 24
ianuarie 2017]. Disponibil: http://www.ecol.ro/index.php?go=content&id=1089
2. Strategia politicii monetare a Băncii Naţionale a Moldovei pe termen mediu: nr. 303 din 27.12.2012 [accesat
22 februarie 2017]. Disponibil: http://www.bnm.org/ro/content/strategia-politicii-monetare-bancii-nationale-
moldovei-pe-termen-mediu
3. Hotărârea Guvernului privind aprobarea Strategiei de dezvoltare a managementului finanţelor publice 2013-
2020: nr. 573 din 06.08.2013. In: Monitorul Oficial al Republicii Moldova. 2013, nr. 173-176, art. 669.
4. Legea cu privire la datoria sectorului public, garanţiile de stat şi recreditarea de stat: nr. 419 din 22.12.2006.
In: Monitorul Oficial al Republicii Moldova. 2007, nr. 32-35, art. 114.
5. Legea cu privire la Guvern: nr. 64 din 31.05.1990. In: Monitorul Oficial al Republicii Moldova. 2002, nr.
131-133, art. 1018.
6. Legea finanţelor publice şi responsabilităţii bugetar-fiscale: nr. 181 din 25.07.2014. In: Monitorul Oficial al
Republicii Moldova. 2014, nr. 223-230, art. 519.
7. Managementul datoriei de stat pe termen mediu (2016-2018): program. Colegiul Ministerului Finanţelor.
2015, extras nr. 4/1, 10 august [accesat 17 februarie 2017]. Disponibil:
http://www.mf.gov.md/files/files/Achizitii%20publice/Program%202016-2018.pdf
8. PERCIUN, Rodica. Analiza principalelor măsuri ale politicii fiscale a Republicii Moldova: realităţi,
prognoze şi impactul acestora. In: Creşterea economică în condiţiile internaţionalizării: conferinţa
internaţională ştiinţifico-practică, 20-21 octombrie 2011. Ediţia a VI-a. Chişinău, 2011, vol. 2, pp. 352-357.
9. PERCIUN, Rodica. Politicile bugetare – instrumente de decizie ale statului în finanţele publice. In: Analele
Institutului de Economie, Finanţe şi Statistică. Chişinău, 2011, pp. 100-104.
10. PERCIUN, Rodica, POPA, Viorica. Presiunea fiscală – un element esenţial în asigurarea stabilităţii
financiare a statului. In: Analele Institutului de Economie, Finanţe şi Statistică. Ediţia a 3-a. Chişinău, 2013,
pp. 125-132.
11. PERCIUN, Rodica, ŞEPTELICI, Viorica, TIMUŞ, Angela. Analiza politicii bugetare a Republicii Moldova.
In: Creşterea economică în condiţiile internaţionalizării: conferinţa internaţională ştiinţifico-practică, 20-21
octombrie 2011. Ediţia a VI-a. Chişinău, 2011, vol. 2, pp. 291-298.
12. Raportul anual de activitate a Ministerului Economiei pentru anul 2015 [accesat 12 ianuarie 2017].
Disponibil: http://www.mec.gov.md/sites/default/files/document/raport_pa_al_mec_2015.pdf
13. Raportul anual privind realizarea Planului de acţiuni pentru implementarea Strategiei de dezvoltare a
managementului finanţelor publice 2013-2020 pe anul 2015 [accesat 14 februarie 2017]. Disponibil:
http://www.mf.gov.md/politici/sdmfp
14. Strategia Naţională de Dezvoltare “Moldova 2020”: nr. 166 din 11.07.2012. In: Monitorul Oficial al
Republicii Moldova. 2012, nr. 245-247, art. 791.
15. TIMOFEI, Olga. The role of banking sector for state’s financial stability. In: Economie şi Sociologie =
Economy and Sociology. 2015, nr. 1, pp. 127-133.
16. УАЙТ, У.Р. Системный сбой. B: Финансы и развитие. 2015, март, сс. 44-47.
Recommended for publication: 31.03.2017
http://www.bnm.org/ro/content/strategia-politicii-monetare-bancii-nationale-moldovei-pe-termen-mediu

ECONOMIE ŞI SOCIOLOGIE / ECONOMY AND SOCIOLOGY
33
No. 1-2 / 2017
COMPARATIVE EVALUATION OF THE LABOR MARKETS
DEVELOPMENT IN THE REPUBLIC OF MOLDOVA AND UKRAINE
Victoria BLYZNIUK1, PhD, Associate Professor,
Institute for Economics and Forecasting,
Ukrainian National Academy of Sciences
Anatolii ROJCO2, PhD, Associate Professor,
National Institute for Economic Research, Moldova
The relevance of the article is due to the fact that the functioning of labour markets in the
Republic of Moldova and Ukraine is facing a number of serious problems. Among them, the most acute
are the problem of inefficient employment, the widespread informal employment, and the imperfect wage
system. The aim of the research is to analyze the challenges and risks in the labour sphere of Moldova and
Ukraine, to identify commonalities and differences in the process of transforming the labour markets of
both countries, and to develop proposals for resolving the most acute problems. Information base of the
research is represented by data of national statistics, international databases, legislative and normative
acts. The authors are using the following methods: monographic, statistical, analogue based, and
comparison based ones. They proposes various measures to bring the minimum wage to European
standards, reduce the level of informal employment, and improve the system of social protection of the
unemployed.
Keywords: employment, informal employment, nominal wages, sectoral wage differentiation,
labour productivity, minimum wage, subsistence minimum of an able-bodied person, unemployment rate,
unemployment benefit.
În ultimii ani, funcționarea piețelor muncii în Republica Moldova şi Ukraina prezintă o serie de
probleme complexe, printre care: ocuparea ineficientă a forţei de muncă, prevalenţa pe scară largă a
ocupării informale, imperfecţiunea sistemului de remunerare a muncii. Scopul cercetării este analiza
provocărilor şi a riscurilor în domeniul muncii în Republica Moldova şi Ukraina, identificarea
convergențelor și divergenților în procesul de transformare a pieţelor forţei de muncă, elaborarea
propunerilor privind soluţionarea celor mai acute probleme. Baza informațională a cercetării constituie
datele statisticii de stat, bazele de date internaționale, actele legislative și normative. În cercetare sunt
aplicate metodele: monografică, statistică, analogică, comparaţie. Conform rezultatelor cercetării se
propun măsuri privind apropierea cuantumului salariului minim la standardele europene, reducerea
ocupării informale, perfecţionarea sistemului de protecţie socială a şomerilor.
Cuvinte-cheie: ocuparea forţei de muncă, ocuparea forţei de muncă informală, salariul nominal,
diferenţierea sectorială a salariului, productivitatea muncii, salariul minim, minimumul de existenţă a
persoanei apte de muncă, şomaj, ajutor de şomaj.
В настоящее время функционирование рынков труда в Республике Молдова и Украине
сталкивается с рядом серьезных проблем. Среди них наиболее острыми являются проблема
неэффективной занятости, масштабная распространенность неформальной занятости,
несовершенство системы оплаты труда. Целью исследования является анализ вызовов и рисков в
трудовой сфере Республики Молдова и Украины, выявление общности и различий в процессе
трансформации рынков труда, разработка предложений по решению наиболее острых проблем.
Информационную базу исследования представляют данные государственной статистики,
международные базы данных, законодательные и нормативные акты. Методы исследования:
монографический, статистический, аналогов, сравнения. Предложены меры по приближению
размера минимальной заработной платы к европейским стандартам, снижению уровня
неформальной занятости, совершенствованию системы социальной защиты безработных.
1©Victoria BLYZNYUK, [email protected] 2© Anatolii ROJCO, [email protected]

Revistă teoretico-ştiinţifică / Theoretical and scientifical journal
34
No. 1-2 / 2017
Ключевые слова: занятость, неформальная занятость, номинальная заработная плата,
отраслевая дифференциация заработной платы, производительность труда, минимальная
заработная плата, прожиточный минимум трудоспособного человека, уровень безработицы,
пособие по безработице.
JEL Clasification: E24, J24, J31.
UDC: 331.5(478+477)
Introduction. Nowadays, an actual problem is the improvement of the performance of labour
markets in the Republic of Moldova and Ukraine. In order to solve this problem, it is necessary to conduct
an analysis of the functioning and to identify common and different sides in the development of the labour
sphere in both countries. Consequently, we will identify measures to improve employment policy in the
labour markets of the Republic of Moldova and Ukraine. This research will be better done on the basis of
a comparative analysis of social processes.
The method of comparative analysis provides an understanding and description of social
processes, as well as the dynamics of change in any country, which makes it possible to go from the
description (what, where, when) to the explanation and, as a consequence, to reveal the causal links
(If… that…). The reasons for the comparison are written by Tom Mackie and David Marsh: “The main
reason for the comparative study reflects the basic nature of social scientific research; it almost always is
unable to use the experimental method… More specifically, we can identify two main reasons, why the
comparative analysis is significant: firstly, to avoid ethnocentrism in the analysis, secondly, to compile,
verify and, accordingly, to reformulate theory and related concepts and hypotheses about the relationship
between political phenomena” [1]. By comparing different processes, facts, elements, structure,
phenomena, concepts, we can identify something common or different between them. That is, the
comparison is a way of revealing the general and the particular in the phenomena being studied. If we ask
the question of how to do this comparison, we will have a lot of problems.
One of them is the problem of comparability. That is, in the study of several countries, the
question always arises whether they are comparable. Alasdair MacIntyre [2, p.8-26] considers that all
countries are unique and each of them represents a special set of political, economic, social and other
institutions, and therefore, if we make an intercountry comparison, this leads to a simplification of reality.
If we take the risk of identifying such elements, we will not have any guarantee that there are the same
causal links in different countries. Roy Macridis [3] believes that intercountry comparison is possible if we
choose countries that are either similar in most parameters (based on economic, social, cultural, historical,
etc. proximity) or are opposite in these indicators.
The Republic of Moldova and Ukraine are suitable for cross-country comparison, given in [3].
They have a common history within the former USSR, and huge social and economic transformations that
have occurred in the last quarter of a century. The collapse of the Soviet era and the emergence of market-
based management took place against the backdrop of impoverishment of the majority of population and
deepening property differentiation. There was a large-scale destruction of infrastructure, the redistribution
of property, formation of private capital with a simultaneous multiple declines in output, especially in
industry, rising unemployment and a drop in real incomes. Each neighboring country experienced the
above processes in different ways, because initially they had different potentials, and initially they chose
different market transition strategies. For the Republic of Moldova, active use of shock tools and rapid de-
industrialization were characteristic. Ukraine, on the contrary, chose a gradual, slow transition to a market
economy based on the goal of preserving and developing the existing industrial potential.
All of the above historical and economic aspects, as well as the revival of globalization, have left
their imprint on social and labor relations and the labor market in both countries. In this context, taking
into account the European orientation of either country, we consider it relevant to analyze the current
situation in the labor sphere, and identify commonalities and differences in the transformation of labour
markets in the Republic of Moldova and Ukraine. This is the purpose of the article.
When a comparative analysis is made, one must take into account that the term comparative
analysis causes certain difficulties in its definition, since it is difficult to imagine an analysis in the social
sciences that is not comparative. Émile Durkheim understood this more than a hundred years ago:
“Comparative sociology is not a special branch of sociology. This is sociology itself, when it ceases to be
merely descriptive and begins to take into account the facts” [4, p. 139]. However, this general truth is too
universal. For concrete comparative studies, the definition given by Neil J.Smelser in [5] is much more
ECONOMIE ŞI SOCIOLOGIE / ECONOMY AND SOCIOLOGY
35
No. 1-2 / 2017
appropriate. In his opinion, comparative analysis is considered to describe and explain the similarities and
differences (mainly differences) of the conditions or results of the development of large social units,
usually regions, countries, societies, cultures and social systems [6, 3-44; 7, p.1-21]. This approach is
shared by the authors of this article. The functioning of labor markets in the Republic of Moldova and Ukraine is subject to the
following principles:
We use the comparative analysis methodology and the same research tools;
Comparisons should be based on 17 key labor market indicators (KILM) developed by the International Labor Office and used by researchers around the world [8]: KILM 1. Labor force participation rate; KILM 2. Employment-to-population ratio; KILM 3. Status in employment; KILM 4. Employment by sector; KILM 5. Employment by occupation; KILM 6. Part-time workers; KILM 7. Hours of work; KILM 8. Employment in the informal economy; KILM 9. Unemployment; KILM 10. Youth unemployment; KILM 11. Long-term unemployment; KILM 12. Time-related underemployment; KILM 13. Persons outside the labor force; KILM 14. Educational attainment and illiteracy; KILM 15. Wages and compensation costs; KILM 16. Labor productivity; KILM 17. Poverty, income distribution, employment by economic class and working poverty.
In this article it is not possible to carry out a comprehensive assessment of all 17 KILMs, therefore
only those KILMs that are most relevant for the Republic of Moldova and Ukraine are covered by the
comparative analysis. Labor markets in the Republic of Moldova and Ukraine. The transformation of social and
labour relations and the principles of government social policy are manifested in the crisis phenomena of “social state”, which means social equality and development of the middle class in the developed countries. At the same time, the emerging markets are looking for a compromise between a socially satisfied and efficient worker and commercialization of the welfare state. Those are the external determinants that define the development of labor markets and social and labor spheres in the Republic of Moldova and Ukraine. In this context, in either country, statements about the need to create an innovative model of economic development seldom go beyond slogans, so both economies are characterized by various non-concerted tendencies with the predominance of raw material based patterns that minimize the involvement of intellectual resource and human capital.
Currently, the Republic of Moldova and Ukraine are characterized by negative demographic trends, which have a significant impact on the labor market and determine the supply in the labor market. The total population of the Republic of Moldova in 2015 numbered 3.55 million inhabitants, most of whom (57.6%) lived in rural areas. The demographic trend is marked by continuing negative annual growth, with a declining average annual rate of 0.2% from 2000 also partly due to heavy outward migration (12.9% of the population working abroad in 2015) – table 1.
Today is high risk of deterioration of the demographic situation, due to population ageing, migration of the active population and the declining birth rate. The share of younger age groups has declined with 15-24 year-olds falling from 25.1% of the population in 2011 to 19.7% in 2015, while the oldest age group (65+) has increased to 10.3%. The dependency ratios of youth (21.2) and the elderly (13.4) in 2015 have different economic and social implications, threatening sustainable growth and future funding of social protection such as pensions.
Ukraine’s population stood at 42.7 million in 2015, 69% of which is urban and 31% rural. Population growth continues to be negative although the decline has been slightly slowing in recent years. Ukraine ranks among the top 30 oldest countries of the world by share of the population aged 60 years and above. Life expectancy at birth is around 70 years, which is among the lowest levels of life expectancy at birth in Europe.
The Republic of Moldova had a low activity rate of 42.4% in 2015 and 42.6% in 2016 with a 5.2% gender gap, standing at 45.1% for men and 39.9% for women. The employment rate was also very low at 40.3% in 2015 and 40.8% in 2016, with a smaller difference of 3.9% between the 42.3% for men and 38.4% for women. Ukraine’s labor market faces challenges such as fell an activity rate that slightly from 64.2% in 2011 to 62.2% in 2016 (69.2% for males and 56.2% for females) and rise of unemployment rate from 6.8% in 2006 to 9.3% in 2016.
The significant difference in levels of activity and employment is explained by the peculiarities of
statistical recording, namely, in the Republic of Moldova, national statistics do not classify migrants as
economically active population, because they work abroad, and there are differences in the comparative
basis for calculations.

Revistă teoretico-ştiinţifică / Theoretical and scientifical journal
36
No. 1-2 / 2017
Table 1
Indicators of labor market development in the Republic of Moldova
and Ukraine, in 2006-2016
2006 2014 2015 2016
2016 as
% of
2006
Number of economically active
population, thousand people
Republic of Moldova 1,357.2 1,232.4 1,265.6 1,272.8 93.8
Ukraine 22,245.4 19,920.9 18,097.9 17,955.1 80.7
Level of economic activity, % Republic of Moldova 46.3 41.2 42.4 42.6 92.0
Ukraine 62.2 62.4 62.4 62.2 100.0
Number of employed people,
thousand people.
Republic of Moldova 1,257.3 1,184.9 1,203.6 1,219.5 97.0
Ukraine 20,730.4 18,073.3 16,443.2 16,276.9 78.5
Employment rate, % Republic of Moldova 42.9 39.6 40.3 40.8 95.1
Ukraine 57.9 56.6 56.7 56.3 97.2
Number of unemployed,
thousand people.
Republic of Moldova 99.9 47.5 62.1 53.3 53.4
Ukraine 1,515.0 1,847.6 1,654.7 1,678.2 110.8
Unemployment rate, % Republic of Moldova 7.4 3.9 4.9 4.2 56.8
Ukraine 6.8 9.3 9.1 9.3 136.8
Number of inactive population,
thousand people
Republic of Moldova 1,576.0 1,756.1 1,721.7 1,712.7 108.7
Ukraine 13,542.1 12,023.0 10,925.5 10,934.1 80.7
Labour migrants, thousand
people Republic of Moldova 310.1 341.9 325.4 319,0 102.9
Source: [9, 10].
Labor is one of the main factors of production, determines the dynamics and structure of the economy. At the same time, structural and dynamic changes in employment depend on a number of macroeconomic and sectoral factors. The main characteristic at the macro level, which assesses the level of the country's economic development, its type and structure, is the dynamics of gross domestic product or gross value added.
All two countries are characterized by rather low income levels and belong to the lower-middle income level group according to the World Bank’s classification. The Republic of Moldova, being the poorest country in Europe, had an estimated per capita GDP (at PPP) of some EUR 3000 in 2015, slightly more than 10% of the EU average, while Ukraine – about twice as high as Moldova’s (figure 1).
Figure 1. GDP per capita in the Republic of Moldova and Ukraine, PPP $
Source: Calculated by the authors according to [11].
1824,3 1839,7
2945,1
3723,4 3531,0
4700,25017,1 5049,0
6763,2
3411,03802,5
6452,1
8395,8
7239,6
8629,7 8683,6
7939,6
0,0
9500,0
1990 1996 2000 2005 2008 2009 2013 2014 2015
The Republic of Moldova Ukraine

ECONOMIE ŞI SOCIOLOGIE / ECONOMY AND SOCIOLOGY
37
No. 1-2 / 2017
The deterioration of the macroeconomic situation in Ukraine in late 2014 and in 2015 transformed
into the stagnation of domestic industry (particularly metallurgy, as one of the budget revenue-generating
sectors of the economy), the deterioration of economic relations between domestic producers,
the destruction of the industrial, transport and social infrastructure in the Donetsk and Luhansk regions,
etc. The financial and economic crisis, as well as a massive budget deficit, made it challenging to achieve
macroeconomic stabilization and increase economic demand for labor.
Since 2014, the overall economic growth in the Republic of Moldova has followed a relatively
positive trend. Data show that it was positive from 2014 to 2015, at which point the economic growth rate
registered a decrease. However, the state debt (internal and external) increased significantly. The external
dependence of the national economy remains high. Trade trends show that the level of imports is higher than
the level of exports, despite efforts to develop policies to promote private initiative and increase its contribution
to GDP. As a result, the production of goods and services, external trade, etc., has decreased.
Comparative analysis of the structure of the GVA of the Republic of Moldova and Ukraine allows
drawing certain conclusions (table 2).
Table 2
Gross value added by activity, country and year, percent share of GVA 2000 2003 2005 2008 2009 2010 2013
GVA in agriculture, hunting &
forestry; fishing
Republic of Moldova 28.3 20.9 19.1 10.4 9.9 14.1 14.5
Ukraine 16.4 11.7 10.1 7.5 8.0 8.4 9.9
GVA in industry, including energy Republic of Moldova 18.2 20.1 18.3 16.5 15.5 15.5 16.8
Ukraine 32.8 29.1 29.7 28.6 25.8 26.1 22.8
GVA in construction Republic of Moldova 3.0 3.4 3.9 5.9 4.1 4.0 3.9
Ukraine 3.8 4.1 4.0 3.4 2.6 3.3 2.7
GVA in wholesale & retail trade,
repairs; hotels & restaurants;
transport & communications
Republic of Moldova 25.3 25.7 27.6 31.3 30.9 29.7 29.3
Ukraine 23.4 27.3 26.2 26.3 28.3 28.8 27.2
GVA in financial, real estate,
renting & business activities
Republic of Moldova 11.1 11.1 12.8 16.9 17.4 16.2 15.5
Ukraine 7.5 10.5 12.4 17.8 19.6 17.2 16.7
GVA in other service activities Republic of Moldova 14.2 18.8 18.3 19.1 22.2 20.6 20.0
Ukraine 13.2 15.0 15.5 15.7 17.8 17.0 18.4
Source: Calculated by the authors according to [11].
The share of productive sectors in the structure of added value decreased due to the share of
agriculture (for the Republic of Moldova this reduction was 13.8 pp, for Ukraine – 6.5 pp). In developed
countries, the growth of the service sector does not occur at the expense of the productive sector, but
rather on its basis and at the same time is a determinant of its development at a qualitatively different
level. Many service activities are directly related to production, namely R&D, marketing, engineering and
consulting services that contribute to the building up and qualitative renovation of material production,
which not only satisfies the basic needs of the population, but also boosts the level of consumption.
Ukraine, on the contrary, is characterized by a weak development of the secondary sector, due to
the poor performance of the construction (compared to general European trends, where construction
rapidly became an engine of GDP and employment growth, as well as a stimulus for the development of
related sectors).
Post-industrial development itself does not imply a fall or stagnation of industrial output, but rather a
moderate growth, while some slowdown of its rate is due to a relative satisfaction of the needs for industrial
development. However, these characteristics do not apply to Ukraine, where today there are no grounds for
assessing the current level of production as sufficient for solving this country’s basic problems.
The structure of production directly determines the structure of employment and the quality of life
of the population. The economic constraints on the development of the social and labor spheres of both
countries are similar, but the institutional features that have developed are different. Differences and
imbalances in the labor sphere, on the one hand, impart dynamism to the processes of the social and labor
sphere, and on the other, strengthen the gap and the depth of stratification.

Revistă teoretico-ştiinţifică / Theoretical and scientifical journal
38
No. 1-2 / 2017
On the one hand, the peculiarities of the social and labor sphere and the presence of structural
disproportions of employment represent limits to economic development, and on the other side they are a
consequence of the processes of integration and globalization in the world. In this context, a sectoral
analysis of employment in Ukraine and the Republic of Moldova could be indicative. The sectoral
structure of employment characterizes civilization changes in the structure of the economy and the
efficiency of economic employment policy in the country, which is manifested in changes in the shares of
the primary, secondary and tertiary sectors in the GDP structure.
The long-term dynamics of the world economy testifies to a significant flow of workers from the
sphere of agriculture, where almost 80% of the workforces were employed in the beginning of the
industrial age, to the manufacturing industry, and later to the service sector. These tendencies of decrease
in the share of those employed in the primary and secondary sectors are also observed in the structure of
Ukraine’s labor market (table 3). The quantitative characteristics of the developments in the social and
labor sphere of Ukraine and the Republic of Moldova, namely the growth of the tertiary employment
sector from 47.2% in 2000 up to 60.1% in 2015, and from 30.8% to 39.6%, respectively, could have been
interpreted as a civilization transition to the phase of post-industrial development, if we did not take into
account the cause-effect relationships of those changes.
hus, in contrast to the European countries where such shifts take place within a single economic
system, in Ukraine and the Republic of Moldova structural changes have occurred mainly against the
background of the destruction of the old economic system. The existing sectoral differences deepened and
aggravated the contradictions inherited from the previous system (being one of them the disparity of the
sector structure of the economy) and a new restructuring took place as a result of the formation of the new
system (changes in the value system, formation of new sectors, and change demand structure on the
domestic and foreign markets).
Table 3
Employment distribution in the Republic of Moldova and Ukraine, %
Reference area Years
Employment distribution –
ILO estimates and projections (%)
Total Agriculture Industry Services
Republic of Moldova
2000 100.0 36.0 33.2 30.8
2005 100.0 32.9 32.5 34.6
2010 100.0 27.5 32.2 40.3
2015 100.0 28.4 31.9 39.6
Ukraine
2000 100.0 28.5 24.3 47.2
2005 100.0 27.9 22.7 49.4
2010 100.0 20.3 25.7 54.0
2015 100.0 15.3 24.7 60.1
2020 100.0 15.0 24.7 60.4
Source: Calculated by the authors according to [11].
The sectoral structure of employment in the Republic of Moldova indicates a high degree
of employment insecurity, as the share of agrarian employed remains very high. In 2015,
the share of employed in agriculture was 28.4% and, unlike neighboring countries, tended to increase.
Compared to 2010, the share of employed in the Republic of Moldova's agriculture increased
by 0.9 percentage points (table 3). This was a direct consequence of the privatization of land and the
dominance of small-scale production in the agricultural sector, which is characterized by low added value
and productivity. The lowest rates of employment in agriculture are observed in Ukraine (15.3%), where
the rural residents’ work in the agro-holdings has become a common phenomenon.
Sectoral changes in the employment structure of developed countries were due to the flow of labor
from secondary to tertiary sector as a result of the outstripping growth in labor productivity in industry and
a higher income elasticity of demand for services than for goods.
For Ukraine, however, the change in the ratio between sectors is not only due to purely economic
factors, but as a result of the processes of integration and disintegration. Disintegration processes were the
cause of the de-industrialization. This process, in Ukraine, began as far back as in the late 80s of the last
century with the increase in the level of depreciation of industrial fixed assets, which in 1990 amounted to
almost 48.7% compared to 37.4% in 1980. Deindustrialization led to the redistribution of national income
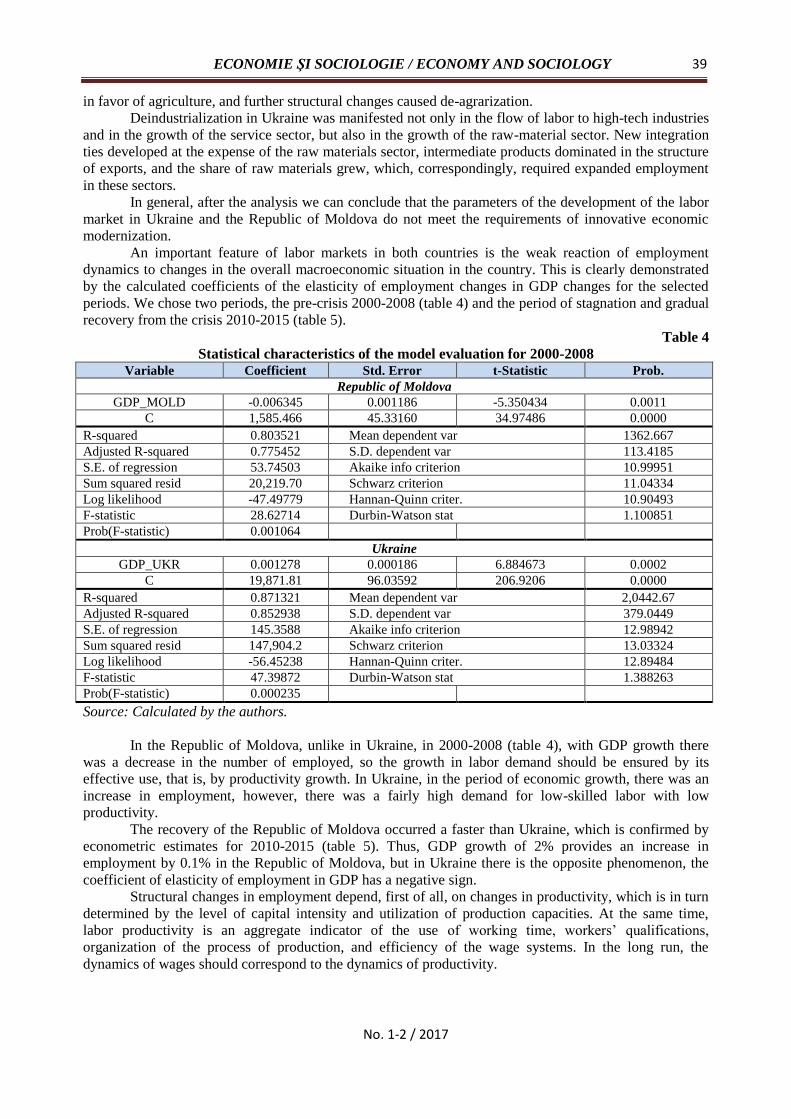
ECONOMIE ŞI SOCIOLOGIE / ECONOMY AND SOCIOLOGY
39
No. 1-2 / 2017
in favor of agriculture, and further structural changes caused de-agrarization.
Deindustrialization in Ukraine was manifested not only in the flow of labor to high-tech industries
and in the growth of the service sector, but also in the growth of the raw-material sector. New integration
ties developed at the expense of the raw materials sector, intermediate products dominated in the structure
of exports, and the share of raw materials grew, which, correspondingly, required expanded employment
in these sectors.
In general, after the analysis we can conclude that the parameters of the development of the labor
market in Ukraine and the Republic of Moldova do not meet the requirements of innovative economic
modernization.
An important feature of labor markets in both countries is the weak reaction of employment
dynamics to changes in the overall macroeconomic situation in the country. This is clearly demonstrated
by the calculated coefficients of the elasticity of employment changes in GDP changes for the selected
periods. We chose two periods, the pre-crisis 2000-2008 (table 4) and the period of stagnation and gradual
recovery from the crisis 2010-2015 (table 5).
Table 4
Statistical characteristics of the model evaluation for 2000-2008 Variable Coefficient Std. Error t-Statistic Prob.
Republic of Moldova
GDP_MOLD -0.006345 0.001186 -5.350434 0.0011
C 1,585.466 45.33160 34.97486 0.0000
R-squared 0.803521 Mean dependent var 1362.667
Adjusted R-squared 0.775452 S.D. dependent var 113.4185
S.E. of regression 53.74503 Akaike info criterion 10.99951
Sum squared resid 20,219.70 Schwarz criterion 11.04334
Log likelihood -47.49779 Hannan-Quinn criter. 10.90493
F-statistic 28.62714 Durbin-Watson stat 1.100851
Prob(F-statistic) 0.001064
Ukraine
GDP_UKR 0.001278 0.000186 6.884673 0.0002
C 19,871.81 96.03592 206.9206 0.0000
R-squared 0.871321 Mean dependent var 2,0442.67
Adjusted R-squared 0.852938 S.D. dependent var 379.0449
S.E. of regression 145.3588 Akaike info criterion 12.98942
Sum squared resid 147,904.2 Schwarz criterion 13.03324
Log likelihood -56.45238 Hannan-Quinn criter. 12.89484
F-statistic 47.39872 Durbin-Watson stat 1.388263
Prob(F-statistic) 0.000235
Source: Calculated by the authors.
In the Republic of Moldova, unlike in Ukraine, in 2000-2008 (table 4), with GDP growth there
was a decrease in the number of employed, so the growth in labor demand should be ensured by its
effective use, that is, by productivity growth. In Ukraine, in the period of economic growth, there was an
increase in employment, however, there was a fairly high demand for low-skilled labor with low
productivity.
The recovery of the Republic of Moldova occurred a faster than Ukraine, which is confirmed by
econometric estimates for 2010-2015 (table 5). Thus, GDP growth of 2% provides an increase in
employment by 0.1% in the Republic of Moldova, but in Ukraine there is the opposite phenomenon, the
coefficient of elasticity of employment in GDP has a negative sign.
Structural changes in employment depend, first of all, on changes in productivity, which is in turn
determined by the level of capital intensity and utilization of production capacities. At the same time,
labor productivity is an aggregate indicator of the use of working time, workers’ qualifications,
organization of the process of production, and efficiency of the wage systems. In the long run, the
dynamics of wages should correspond to the dynamics of productivity.

Revistă teoretico-ştiinţifică / Theoretical and scientifical journal
40
No. 1-2 / 2017
Table 5
Statistical characteristics of the model evaluation for 2010-2015
Variable Coefficient Std. Error t-Statistic Prob.
Republic of Moldova
GDP_MOLD 0.001079 0.000282 3.829013 0.0186
C 1,067.055 27.53688 38.75002 0.0000
R-squared 0.785653 Mean dependent var 1,170.833
Adjusted R-squared 0.732066 S.D. dependent var 23.03403
S.E. of regression 11.92295 Akaike info criterion 8.056008
Sum squared resid 568.6265 Schwarz criterion 7.986595
Log likelihood -22.16802 Hannan-Quinn criter. 7.778140
F-statistic 14.66134 Durbin-Watson stat 2.856424
Prob(F-statistic) 0.018634
Ukraine
GDP_UKR -0.004961 0.001565 -3.171195 0.0338
C 26,767.68 2386.467 11.21645 0.0004
R-squared 0.715434 Mean dependent var 19,310.67
Adjusted R-squared 0.644292 S.D. dependent var 1,672.050
S.E. of regression 997.2317 Akaike info criterion 16.90904
Sum squared resid 3,977,884. Schwarz criterion 16.83963
Log likelihood -48.72713 Hannan-Quinn criter. 16.63118
F-statistic 10.05648 Durbin-Watson stat 1.517269
Prob(F-statistic) 0.033819
Source: Calculated by the authors.
The dynamics of the recent 15 years indicate a trend of the growth of nominal wage in both the
Republic of Moldova and Ukraine (figure 2). An exception is the period of the global financial and
economic crisis, which caused significant losses in both economies. In the Republic of Moldova in recent
years, the nominal wage has been demonstrating a steady growth. Thus, in 2015 an employee’s average
monthly salary was 4538.4 lei, which is by 11.0% more than in 2014.
However, due to the devaluation of national currency, nominal wages in dollar terms decreased
from $ 291.3 in 2014 to $ 241.2 in 2015, that is, by 50.1 dollars, or by 17.2%. In Ukraine, the rate of
reduction in the nominal wage was even more significant, from $ 293 in 2014 to $ 193 in 2015, i.е. by
$ 100, or by 34.1% [12]. As a result, for the first time in recent twenty years, the nominal wage in dollar
terms in the Republic of Moldova exceeded its level in Ukraine.
Figure 2. Dynamics of average nominal wages in the Republic of Moldova and Ukraine
Source: Calculated by the authors according to [11].

ECONOMIE ŞI SOCIOLOGIE / ECONOMY AND SOCIOLOGY
41
No. 1-2 / 2017
In the Republic of Moldova in recent years, the nominal wage has been demonstrating a steady
growth. Thus, in 2015 an employee’s average monthly salary was 4,538.4 lei, which is by 11.0% more
than in 2014. However, due to the devaluation of national currency, nominal wages in dollar terms
decreased from $ 291.3 in 2014 to $ 241.2 in 2015, that is by 50.1 dollars or by 17.2%. In Ukraine, the
rate of reduction in the nominal wage was even more significant, from $ 293 in 2014 to $ 193 in 2015,
i.е. by $ 100 or by 34.1% [10]. As a result, for the first time in recent twenty years, the nominal wage in
dollar terms in the Republic of Moldova exceeded its level in Ukraine.
For the analysis of the labor price, which qualitatively characterizes the labour market, two
alternative indicators can be used: “consumer wages” (adjustment of wages for the growth of consumer
prices) and “producer wages” (adjusted nominal wages for producer price increases). The first indicator
characterizes the change in the purchasing power of wages by the employees, the second – the change in
the cost of labor by the employer (figure 3).
Figure 3. Real wage growth in the Republic of Moldova and Ukraine in 2000-2016
Source: Calculated by the authors.
In figure 3 rates of growth of two indicators of a payment of labour are presented. The demand for
labor is determined by real wages – “productive”. During periods of crisis and stagnation, both indicators
of real wages have declined, however, if the labor costs for an employer grow at a slower rate than
consumer wages, this characterizes the potential for economic development. Comparing the situation in

Revistă teoretico-ştiinţifică / Theoretical and scientifical journal
42
No. 1-2 / 2017
both countries, we can say that the Republic of Moldova has more opportunities for development and
renovation of fixed assets, as labor costs grow more slowly than consumer wages. The conclusion about
appreciation or cheapening of the labor force can be made only by comparing the dynamics of real wages
and labor productivity. Labor productivity is an aggregate indicator of the use of working time, workers’
qualifications, organization of the process of production, and efficiency of the wage systems. In the long
run, the dynamics of wages should correspond to the dynamics of productivity.
The dynamics of the recent 15 years indicate a predominant trend of excess of the growth of
nominal wage over that of labor productivity in both the Republic of Moldova and Ukraine. An exception
is the period of the global financial and economic crisis, which caused significant losses in both
economies. The existence of such a long-term trend is unacceptable, since it does not promote not only
expanded, but even a simple reproduction, and leads to an imbalance between supply and demand. The
long-term growth of aggregate demand and wages, exceeding productivity growth, only leads to price
increase without affecting output growth and unemployment.
Due to the extremely low minimum wage in the Republic of Moldova and Ukraine, a significant
stratum of the poor is preserved in both countries. In 2015, the proportion of employees who had wages
below the minimum wage was 0.2% in the Republic of Moldova and 4.4% in Ukraine (table 6).
For Ukraine, a positive fact is a decrease in the proportion of workers with wages below the
minimum wage, from 5.2% in 2012 to 4.4% in 2015, i.е. by 0.8 percentage points. The Republic of
Moldova and Ukraine are characterized by the phenomenon of the working poor, when the availability of
work does not guarantee the workers an exit from poverty. In fact, workers living below the poverty line
are on the brink of survival. Many of them, trying to earn their living, are forced to work in several places
to the detriment of their health.
Table 6
Distribution of workers by the amount of wages in the
Republic of Moldova and Ukraine, % of total
Years Total
workers
Distribution of workers
less than 1
minimum wage (MW) 1-3 (MW) over 3 (MW)
Republic of Moldova 2012 100.0 0.1 29.6 70.3
2015 100.0 0.2 42.7 57.1
Ukraine 2012 100.0 5.2 62.1 32.7
2015 100.0 4.4 79.5 16.1
Source: [9, 10].
One of the significant challenges for both countries is the so-called hidden unemployment or
employment in the informal sector, which serves as a shock absorber of unemployment, because it is in
this sector where the least competitive part of the labour force is absorbed during periods of economic
decline or stagnation. Unemployment, strengthening social inequality, determines the risks of what is
called “social exclusion”.
Recently, informal employment in Ukraine and the Republic of Moldova has been rapidly
expanding, covering a significant number of jobs in the formal and informal sectors of the economy
[14, 15]. The negative consequences of this phenomenon are manifested in limited opportunities for the
realization of most social rights provided for by the Constitution and labour legislation; increased risk of
unstable employment and income; inefficient use of available labour potential.
According to official statistics, the share of informal employment in either country is quite high
and covers more than a quarter (Ukraine) and more than a third (the Republic of Moldova) of employed
population (table 7).
Table 7
Informal employment in the Republic of Moldova and Ukraine
(share of total employment), % 2003 2005 2008 2009 2010 2011 2013 2014 2015
Republic of Moldova 38.04 33.44 31.14 30.01 30.92 30.74 30.93 32.53 34.76
Ukraine 17.17 21.45 21.76 22.14 24.24 24.47 24.88 25.12 26.17
Source: [16, 17].
ECONOMIE ŞI SOCIOLOGIE / ECONOMY AND SOCIOLOGY
43
No. 1-2 / 2017
This shows a significant deformalization of labour relations. Traditionally, informal employment is represented in both countries by workers in agriculture, construction, and services. In the Republic of Moldova, informal employment mainly includes workers engaged in agriculture, hunting, forestry and fishing (73.2%), while workers in the construction sector account for 10.4% of total [16]. Among the informal workers, the share of the youngest and oldest age groups is higher than among those formally employed. In the Republic of Moldova, in the structure of the informal employment, the share of people aged 15-24 years is 1.3 times higher than among the formally employed, and the share of workers at the age of 65 and over is 3.1 times higher. And, conversely, the proportion of middle-aged people among informal workers is lower than among the formally employed [16].
The spread of informal employment among young people is explained by the strategy of smooth transition from study to work, while people of pension age are engaged in this sector mainly due to low pensions, which cause a high level of poverty among the elderly and force them search for informal means of subsistence. The desire to continue working makes older people agree to informal employment and to jobs unattractive for their younger counterparts.
Describing the employment in the informal sector, it is necessary to emphasize the lack of legal regulation of social and labor relations and social protection of employees. At the same time, informal employment creates a reserve of labor force, thus satisfying the dynamic needs of the real sector.
Informal employment, with the significantly rigid legislation [19], allows expanding opportunities when a person chooses a comfortable work schedule, depending on family and life circumstances, and becomes a source of income for part of the workforce. In crisis conditions, the role of the informal sector as a shock absorber of the economic recession is unquestionable. But it is necessary to understand that the prevalence of this form of employment practically excludes innovative development of the country.
Conclusions. The conducted research has shown that in the sphere of employment, the most acute problems in the Republic of Moldova and Ukraine are the widespread informal employment, the shortcomings in the wage system and unemployment.
1. Based on international experience, we propose the following measures to reduce informal employment in the Republic of Moldova and Ukraine:
- preventive measures to simplify procedures, as well as reduce costs and restrictions that impede the creation and development of business;
- sanctions aimed at strengthening the oversight on and applying appropriate sanctions against those who benefit from hidden / shadow work;
raising public awareness of the negative effects of informal employment. 2. In the area of labor remuneration, the following measures should be taken: а) for the Republic of Moldova: - to ensure the establishment of a minimum wage at the subsistence level of an able-bodied person; - to develop measures for transition to the definition of a minimum wage in accordance with the
principles of the European Social Charter (minimum wage cannot be less than 60% of average); b) for the Republic of Moldova and Ukraine: - to provide for the increase in the amount of the 1st category of labor remuneration for workers in
the budget funded sector to the level of the subsistence minimum of an able-bodied person; - to use as a reference point the tariff-wage proportion of no less than 50% as the optimal for the
current state of the economy; - in order to ensure the timely payment of wages, it is necessary to additionally envisage indexing of
the amount of delayed wages by the employer in the amount of inflation that has occurred since the moment of the emergence of the wage debt;
- to develop and implement measures to bring closer the levels of remuneration for women and men (measures to promote women’s carrier advancement, to upgrade their skills, to eliminate unjustified reduction of women’s pay rate in comparison with men in equivalent jobs);
3. In order to reduce unemployment, it is necessary: - to encourage the companies’ activities on creating new jobs, first of all, in terms of tax privileges to
the companies saving and creating economically expedient jobs. - to improve the mechanism of organizing paid public works in terms of increasing their social
status, taking into account the region’s needs in the development of social infrastructure, implementation of national projects and financial support for unemployed citizens;
- to promote youth employment through: professional advice and psychological support; vocational training; employment on permanent job; promoting business activities.
Revistă teoretico-ştiinţifică / Theoretical and scientifical journal
44
No. 1-2 / 2017
REFERENCES
1. MACKIE, T., MARSH, D. The Comparative Method. In: Marsh, D., Stoker, G. The Theory and Methods in Political Science. London: MacMillan Press, 1995. 400 p. ISBN 978-0230576278.
2. MACINTYRE, Alasdair. Is a Science of Comparative Politics Possible? In: P. LASLETT, W.G. RUNCIMAN, Q. SKINNER. Philosophy, Politics, and Society. 4th series. Oxford: Basil Blackwell, 1972, pp. 8-26. ISBN 978-0631048909.
3. MACRIDIS, Roy C. The Study of Comparative Government. New York: Random House, 1955. 77 p.
4. DURKHEIM, E. The Division of Labour in Society. Chapter 2: Mechanical Solidarity or Solidarity by Similarities. New York: Macmillan, 1933. 416 p. ISBN 978-0684836386.
5. СМЕЛЗЕР, Н.Дж. О компаративном анализе, междисциплинарности и интернационализации в социологии. В: Социологические исследования. 2004, № 11, cс. 3-12 [accesat 11 ianuarie 2017]. Disponibil: http://www.isras.ru/files/File/Socis/2004-11/Smelser.pdf
6. SYMONDS, Anthea, KELLY, Anne. The social reconstruction: from the state to the ‘Community’. In: The Social Reconstruction of Community Care. London. 1998, pp. 33-51. ISBN 9780333662984.
7. THATCHER, Margaret. The speech to Women’s Royal Voluntary Service National Conference. 1981, january [accesat 11 ianuarie 2017]. Disponibil: http://www.margaretthatcher.org/document/104551
8. INTERNATIONAL LABOUR OFFICE. Key Indicators of the Labour Market. Ninth edition. Geneva, 2016. 150 p. ISBN 978-92-2-030122-7 [accesat 11 ianuarie 2017]. Disponibil: http://www.ilo.org/wcmsp5/groups/public/---dgreports/---stat/documents/publication/wcms_498929.pdf
9. State Statistics Service of Ukraine [accesat 11 ianuarie 2017]. Disponibil: http://www.ukrstat.gov.ua/
10. Anuarul Statistic al Republicii Moldova = Статистический Ежегодник Куспублики Молдова = Statistical Yearbook of the Republic of Moldova 2016. Chişinău, 2016. 688 p. ISBN 978-9975-53-766-7.
11. Site of the statistics service of United Nations Economic Commission for Europe [accesat 24 ianuarie 2017]. Disponibil: http://w3.unece.org/pxweb/Dialog/varval.asp?ma
12. World Development Indicators [accesat 24 ianuarie 2017]. Disponibil:
http://databank.worldbank.org/Data/reports.aspx?source=world-development-indicators
13. ПОГАМ, С. Исключение: социальная инструментализация и результаты исследования. В:
Журнал социологии и социальной антропологии. Том II. Специальный выпуск: Современная
французская социология, 1999, сс. 140-156. ISSN 1029-8053.
14. БЛИЗНЮК, В.В. Український ринок праці: історичні виклики та нові. В: Український соціум.
2016, № 3, сс. 58-71. ISSN 1681-116X [accesat 19 ianuarie 2017]. Disponibil:
http://nbuv.gov.ua/UJRN/Usoc_2016_3_7
15. РОЖКО, Анатолий, СТРЕМЕНОВСКАЯ, Зоя. Неформальная занятость в Республике Молдова:
масштабы и меры по ее сокращению. In Creşterea economica in condiţiile globalizării = Economic
growth in conditions of globalization: international conference on theoretical and applied economic
practices, 13-14 octombrie 2016. Ediţia a XI-a. Chişinău: INCE, 2016, vol. 2, рp. 236-241. ISBN
978-9975-4000-6-0.
16. BECHMANN, Ulrike, RADEKE, Jorg. Measures to reduce informal employment in Moldova.
German Economic Team Moldova. Policy Paper PP/04/2014. Berlin/Chisinau, 2014, june [accesat 16
martie 2017]. Disponibil: https://get-moldau.de/download/policypapers/2014/PP_04_2014_en.pdf
17. WORLD BANK. The Scope and Main Characteristics of Informal Employment in Ukraine. Technical
Note for the Government of Ukraine by the World Bank. 2011, april [accesat 17 martie 2017].
Disponibil: http://siteresources.worldbank.org/UKRAINEINUKRAINIANEXTN/Resources/455680-
1310372404373/InformalEmploymentinUkraineEng.pdf
18. ROJCO, Anatolii. Justification of minimal quantum of wage in the Republic of Moldova. In:
Economie şi Sociologie = Economy and Sociology. 2016, nr. 3, pp. 63-68.
19. ЮРИК, Я.І. Оцінка та порівняльний аналіз жорсткості українського законодавства про захист
зайнятості. В: Економіка і прогнозування. 2015, № 1, сс. 23-39. ISSN 1605-7988 [accesat 11
ianuarie 2017]. Disponibil: http://nbuv.gov.ua/UJRN/econprog_2015_1_4
Recommended for publication: 15.05.2017

ECONOMIE ŞI SOCIOLOGIE / ECONOMY AND SOCIOLOGY
45
No. 1-2 / 2017
SELF-PERCEIVED HEALTH OF THE ELDERLY:
ECONOMIC AND SOCIODEMOGRAPHIC INEQUALITIES
Olga GAGAUZ1, PhD, Associate Professor,
Centre for Demographic Research,
National Institute for Economic Research, Moldova
Cristina AVRAM2, PhD Student,
University Charles, Prague, Czech Republic
Irina PAHOMII3, Researcher,
Centre for Demographic Research,
National Institute for Economic Research, Moldova
Given the rapid increase in the number and share of the elderly in the total population, good health
and healthy ageing are an important factor in the socio-economic development of ageing societies. Self-perceived health is one of the most important health and well-being indicators. The article presents the results of research on self-perceived elderly health based on data from "Household Budget Survey" for 2006-2015 (NBS). The study reveals a slow increase in life expectancy and healthy life expectancy, as well as time spent in good health. The life expectancy without chronic illness is lower than healthy life expectancy. There is a positive rise in the self-assessment of the elderly for both sexes and at different ages after 60 years. The regression analysis of factors influencing self-perceived health (age, sex, education level, welfare level, degree of disability and civil status), demonstrates that among the most important factors with which self-responding health is associated, as bad and very bad were highlighted the low level of education and material welfare, as well as the presence of behavioural vices (smoking).
Keywords: healthy life expectancy, self-perceived health, elderly, determinant factors.
În condițiile creșterii rapide a numărului și ponderii vârstnicilor în totalul populației, starea bună de sănătate și îmbătrânirea sănătoasă prezintă un factor esențial de dezvoltare socioeconomică a societăților îmbătrânite. Sănătatea auto-percepută este unul din cei mai importanți indicatori ai sănătății și bunăstării. În articol sunt prezentate rezultatele cercetării cu privire la sănătatea auto-percepută a vârstnicilor în baza datelor din „Cercetarea bugetelor gospodăriilor casnice” pentru anii 2006-2015 (BNS). Studiul relevă o creștere lentă a speranței de viață și speranței de viață sănătoasă, precum și a timpului petrecut într-o stare bună de sănătate. Speranța de viață fără boli cronice este mai scăzută decât speranța de viață sănătoasă. Se constată creșterea pozitivă a autoaprecierii sănătății persoanelor vârstnice pentru ambele sexe și la diferite vârste după 60 de ani. Analiza regresională a factorilor care influențează sănătatea auto-percepută (vârsta, sex, nivelul de educație, nivelul de bunăstare, gradul de invaliditate și starea civilă) demonstrează că printre cei mai importanți factori cu care se asociază autoraportarea sănătății ca rea și foarte rea s-au reliefat nivelul de studii scăzut și cel al bunăstării materiale, precum și prezența viciilor comportamentale (fumatul).
Cuvinte-cheie: speranța de viață sănătoasă, autoaprecierea sănătății, vârstnici, factori determinanți.
В условиях быстрого роста численности и доли пожилых людей в общей численности населения хорошее здоровье и здоровое старение являются важными факторами, способствующими социально-экономическому развитию стареющего общества. Самооценка здоровья представляет собой один из важных показателей здоровья и благополучия. В статье представлены результаты исследования самооценки здоровья пожилых людей на основе данных «Обследования бюджетов домашних хозяйств» за 2006-2015 годы (НБС). Полученные результаты демонстрируют медленное увеличение продолжительности жизни и ожидаемой продолжительности здоровой жизни, а также увеличение времени, прожитого в хорошем
1 © Olga GAGAUZ, [email protected] 2 © Cristina AVRAM, [email protected] 3 © Irina PAHOMII, [email protected]

Revistă teoretico-ştiinţifică / Theoretical and scientifical journal
46
No. 1-2 / 2017
состоянии здоровья. Продолжительность жизни без хронических заболеваний несколько ниже, чем ожидаемая продолжительность здоровой жизни. Наблюдается рост положительной самооценки здоровья пожилыми людьми для обоих полов и разных возрастов после 60 лет. Регрессионный анализ факторов, влияющих на самооценку здоровья (возраст, пол, уровень образования, уровень благосостояния, наличие группы инвалидности, семейное положения) показал, что наиболее важными факторами, ассоциирующимися с плохой самооценкой здоровья, являются низкий уровень образования и материального благосостояния, а также наличие поведенческих зависимостей (курение).
Ключевые слова: ожидаемая продолжительность здоровой жизни, самооценка здоровья, пожилые люди, определяющие факторы.
JEL Classification: I10, I15, N3.
UDC: 316.346.32-053.9
Introduction. The continuous growth in the number and proportion of elderly in the total population dynamics and potential implications for society will be increasingly salient. Therefore, there is an increased need to study further the health and functional status of this population, and provide the argumentation for appropriate policies for ensuring quality of life for elderly people and an active ageing.
Improved health is associated with national wealth; and the contribution of better health to economic growth has been recognised only recently. There is evidence that improved health can promote earnings and the labour supply. Poor health, on the other hand, increases the likelihood of early retirement. All these provide powerful arguments for investing in health, both as an objective in its own, and because it is an
important determinant of economic growth and competitiveness [5, 18].
The health status of the ageing population is essential not only to those who comprise this age group, but also to the broader population because of the impacts on social and economic systems. Understanding the problems of older populations’ health it is critical to plan health care services and social support systems and to design health policies to population.
Self-perceived health is one of the main indicators of health and well-being used by WHO for monitoring the population’s health and quality of life n and is also on the list of health indicators of European countries. Self-perceived health remains a cornerstone of health and epidemiological studies and presents a subjective measure of overall health and well-being. Perception of individual state of health is based on the general feeling of life, including the parameters of the physical and non-physical health, and it is associated with a wide range of health indicators: medical, psychological, social and behavioural health outcomes. Among adults, the subjective indicators of health are closely related to availability and use of health care services, rates of morbidity and mortality.
The existing research demonstrates the importance of self-perceived health, presenting a predictor of chronic disease, a characteristic of the physical capabilities of people and opportunities to work, a demand for medical services and welfare and mortality [15]. There is an extensive evidence of considerable social
inequalities in the health of older people in Europe [23, 278, 25].
Data on public health are less reliable and comparable than data on mortality and age structure of the population. Most countries face a lack of such data. The situation improves due to selective research of the population. Currently, the Republic of Moldova has limited data regarding the age-specific health and disability, necessary to determine basic population health parameters. It is difficult to understand the trajectory of elderly morbidity, if it follows − expansion of morbidity, where people are living longer with disease and disability [10, 24], compression of morbidity, with delays the age at onset and progression of
disease [6], or a dynamic equilibrium, where disability increases but is not severe [13, 14].
The present study seeks to fill these gaps by providing new evidence from the Republic of Moldova. Our objective is to analyse recent trends in self-perceived health (SPH), and to assess the factors that have been associated with it. Exploring elderly's health will help us understand better the trends in its dynamics. To get a clearer picture of the determinants of SPH, such variables as education level, economic and marital status of the elderly were analysed.
This article is a continuation of our previous work on Healthy Adjusted Life Expectancy (HALE) in
the Republic of Moldova [7].
Data and methods. This analysis is based on the Household Budget Survey (HBS), which is the only source in the Republic of Moldova which includes questions about SPH with two variables: self-perceived health and presence of chronic diseases (self-reported chronic morbidity). The survey covers all types of households, with the exception of those individuals living in institutions (e.g., nursing homes,

ECONOMIE ŞI SOCIOLOGIE / ECONOMY AND SOCIOLOGY
47
No. 1-2 / 2017
prisons, monasteries). It is restricted to a single calendar year, and is designed as a sequence of four quarterly interviews of the same sample of households. The survey questionnaire contains a number of variables, including health (e.g. the influence of health on the ability to work, health self-evaluation, the ability to get dressed without assistance, medical visits, expenditures on medical service); demography (e.g. age, sex, place of residence), socioeconomics (e.g. education, income), and lifestyle (e.g. smoking). The calculations of the HALE indicator were done by using the prevalence-based method, methodology developed by Sullivan [11]. The years lived are divided in HALE (self-rated very good/good and fair health) and LE in bad/very bad health (loss of healthy years). Life tables were computed based on the adjusted population estimates [16] regarding usual residence population (exposure population). Life tables were combined with data regarding the subjective assessment of health from the HBS (2006-2015).
The most important relationship between health indicators and socioeconomics has a dependent form - "the better economic situation, the better health" and "the better education, the better health".
To assess the association between a number of socioeconomic, demographic, and lifestyle variables and self-perceived health, we used a binary logistic regression model. This was based on the primary data of the Health Status Module included in the HBS (2016). The regression was performed on the sub-sample of people aged 60+. Thus, 770 cases were included in the regression analysis. The independent variables included in the model comprised several areas: socio-economic (welfare quintiles, study level, marital status), demographic (age, sex, place of residence), health (disability grade, chronical diseases, visit the family doctor, health problems during the last 4 weeks, beneficiary of medical services during the last 4 weeks), lifestyle (smoking).
The dependent variable „bad” self-perceived health was built on two alternative answers on self-perceived health-bad and very bad.
The dependent variables introduced in the model are as follows: Socio-economic variables. Three variables were usedwhich refer to the socio-economic field: the
level of education and the quintile of well-being. These two variables are categorical. The level of education is measured by three categories: primary / no education, secondary level and tertiary level. The welfare level is presented by the five quintiles, the first of which is the poorest and the last one is the richest.
Demographic variables: age, sex, type of residence, and marital status. The marital status was recodified and measured only by two categories: 0 for married or living in consensual unions, and 1 for single, divorced or widowed.
The variables which characterize lifestyle. Based on regression basic model, only the smoking variable was extracted from the base sample, and recoded. Thus, people who did not smoke were coded with 0, and smokers with 1. In the second regression model, some variables were also introduced which explain the behaviour of smokers: the age at which they started smoking, how many years they smoked and the number of cigarettes smoked over a day. The variables included in the second regression model were of the continuous type.
Variables that describe health. In the regression analysis, 5 dependent variables were included: the degree of disability, the existence of chronic diseases, the visit to the doctor during the last 12 months, the existence of health problems during the last 4 weeks and the use of medical services during the last 4 weeks. Of all variables included in the model, only the degree of disability is categorical. The other variables are measured on two levels.
The summary statistics for all independent variables are shown in table 1.
Table 1
Descriptive statistics for sample included in regression model
Frequency %
Quintiles
I quintile (lowest income) 128 16.6
II quintile 205 26.6
III quintile 197 25.6
IV quintile 131 17.0
V quintile (highest income) 109 14.2
Disability grade
No 670 87.0
I grade 16 2.1
II grade 71 9.2
III grade 13 1.7
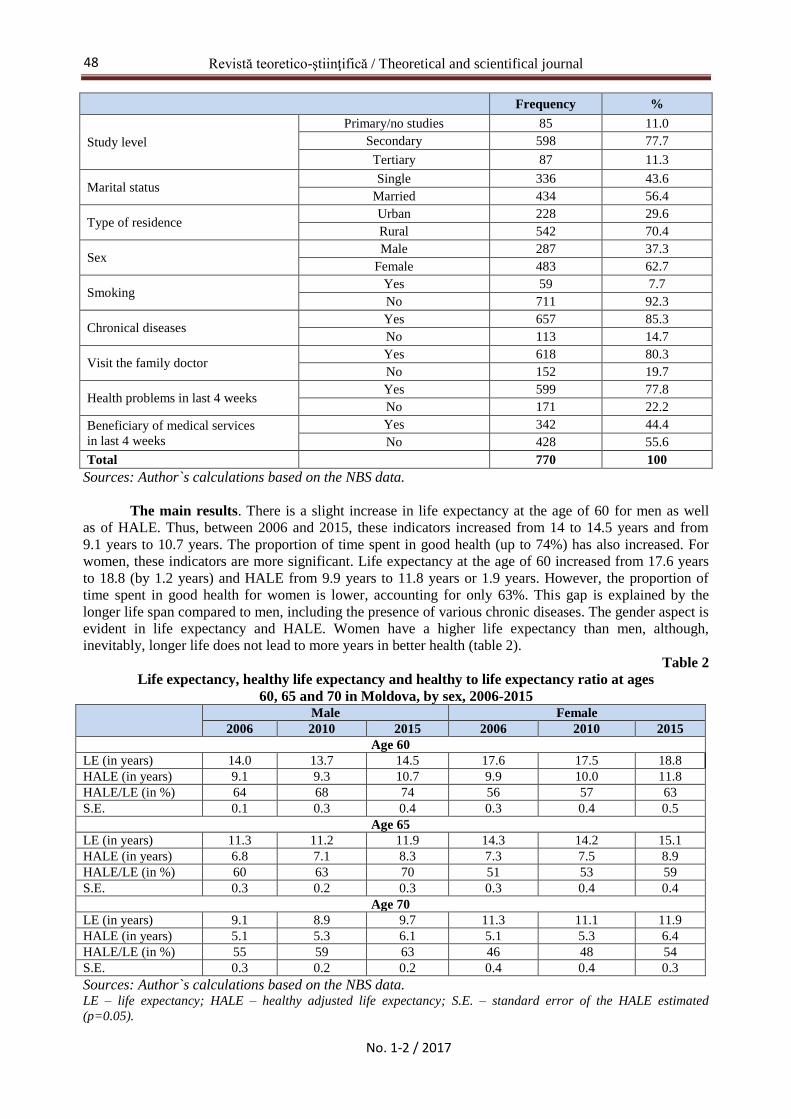
Revistă teoretico-ştiinţifică / Theoretical and scientifical journal
48
No. 1-2 / 2017
Frequency %
Study level
Primary/no studies 85 11.0
Secondary 598 77.7
Tertiary 87 11.3
Marital status Single 336 43.6
Married 434 56.4
Type of residence Urban 228 29.6
Rural 542 70.4
Sex Male 287 37.3
Female 483 62.7
Smoking Yes 59 7.7
No 711 92.3
Chronical diseases Yes 657 85.3
No 113 14.7
Visit the family doctor Yes 618 80.3
No 152 19.7
Health problems in last 4 weeks Yes 599 77.8
No 171 22.2
Beneficiary of medical services
in last 4 weeks
Yes 342 44.4
No 428 55.6
Total 770 100
Sources: Author`s calculations based on the NBS data.
The main results. There is a slight increase in life expectancy at the age of 60 for men as well
as of HALE. Thus, between 2006 and 2015, these indicators increased from 14 to 14.5 years and from
9.1 years to 10.7 years. The proportion of time spent in good health (up to 74%) has also increased. For
women, these indicators are more significant. Life expectancy at the age of 60 increased from 17.6 years
to 18.8 (by 1.2 years) and HALE from 9.9 years to 11.8 years or 1.9 years. However, the proportion of
time spent in good health for women is lower, accounting for only 63%. This gap is explained by the
longer life span compared to men, including the presence of various chronic diseases. The gender aspect is
evident in life expectancy and HALE. Women have a higher life expectancy than men, although,
inevitably, longer life does not lead to more years in better health (table 2).
Table 2
Life expectancy, healthy life expectancy and healthy to life expectancy ratio at ages
60, 65 and 70 in Moldova, by sex, 2006-2015 Male Female
2006 2010 2015 2006 2010 2015
Age 60
LE (in years) 14.0 13.7 14.5 17.6 17.5 18.8
HALE (in years) 9.1 9.3 10.7 9.9 10.0 11.8
HALE/LE (in %) 64 68 74 56 57 63
S.E. 0.1 0.3 0.4 0.3 0.4 0.5
Age 65
LE (in years) 11.3 11.2 11.9 14.3 14.2 15.1
HALE (in years) 6.8 7.1 8.3 7.3 7.5 8.9
HALE/LE (in %) 60 63 70 51 53 59
S.E. 0.3 0.2 0.3 0.3 0.4 0.4
Age 70
LE (in years) 9.1 8.9 9.7 11.3 11.1 11.9
HALE (in years) 5.1 5.3 6.1 5.1 5.3 6.4
HALE/LE (in %) 55 59 63 46 48 54
S.E. 0.3 0.2 0.2 0.4 0.4 0.3
Sources: Author`s calculations based on the NBS data. LE – life expectancy; HALE – healthy adjusted life expectancy; S.E. – standard error of the HALE estimated
(p=0.05).
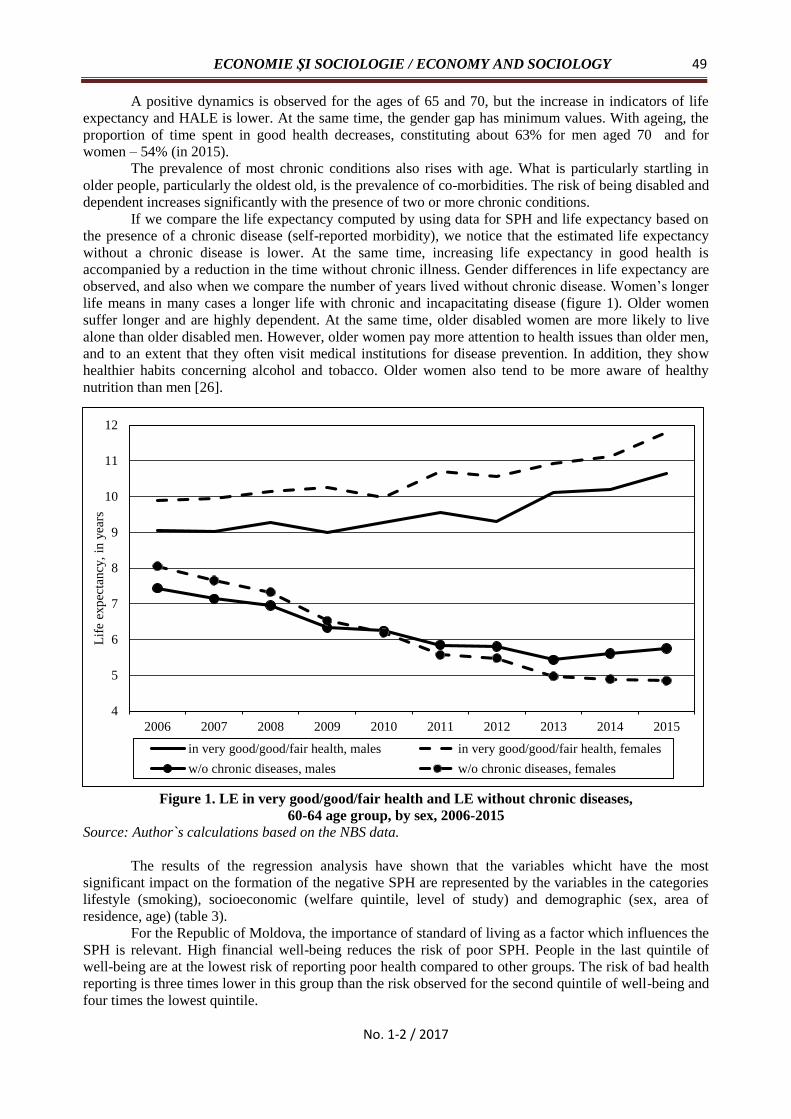
ECONOMIE ŞI SOCIOLOGIE / ECONOMY AND SOCIOLOGY
49
No. 1-2 / 2017
A positive dynamics is observed for the ages of 65 and 70, but the increase in indicators of life
expectancy and HALE is lower. At the same time, the gender gap has minimum values. With ageing, the
proportion of time spent in good health decreases, constituting about 63% for men aged 70 and for
women – 54% (in 2015).
The prevalence of most chronic conditions also rises with age. What is particularly startling in
older people, particularly the oldest old, is the prevalence of co-morbidities. The risk of being disabled and
dependent increases significantly with the presence of two or more chronic conditions.
If we compare the life expectancy computed by using data for SPH and life expectancy based on
the presence of a chronic disease (self-reported morbidity), we notice that the estimated life expectancy
without a chronic disease is lower. At the same time, increasing life expectancy in good health is
accompanied by a reduction in the time without chronic illness. Gender differences in life expectancy are
observed, and also when we compare the number of years lived without chronic disease. Women’s longer
life means in many cases a longer life with chronic and incapacitating disease (figure 1). Older women
suffer longer and are highly dependent. At the same time, older disabled women are more likely to live
alone than older disabled men. However, older women pay more attention to health issues than older men,
and to an extent that they often visit medical institutions for disease prevention. In addition, they show
healthier habits concerning alcohol and tobacco. Older women also tend to be more aware of healthy
nutrition than men [26].
Figure 1. LE in very good/good/fair health and LE without chronic diseases,
60-64 age group, by sex, 2006-2015
Source: Author`s calculations based on the NBS data.
The results of the regression analysis have shown that the variables whicht have the most
significant impact on the formation of the negative SPH are represented by the variables in the categories
lifestyle (smoking), socioeconomic (welfare quintile, level of study) and demographic (sex, area of
residence, age) (table 3).
For the Republic of Moldova, the importance of standard of living as a factor which influences the
SPH is relevant. High financial well-being reduces the risk of poor SPH. People in the last quintile of
well-being are at the lowest risk of reporting poor health compared to other groups. The risk of bad health
reporting is three times lower in this group than the risk observed for the second quintile of well-being and
four times the lowest quintile.
4
5
6
7
8
9
10
11
12
2006 2007 2008 2009 2010 2011 2012 2013 2014 2015
Lif
e ex
pec
tancy
, in
yea
rs
in very good/good/fair health, males in very good/good/fair health, females
w/o chronic diseases, males w/o chronic diseases, females

Revistă teoretico-ştiinţifică / Theoretical and scientifical journal
50
No. 1-2 / 2017
Table 3
Logit regression of „bad” self-perceived health (95% standard errors)
B S.E. Wald df Sig. Exp(B)
Step 1
(a)
Marital status -0.040 0.008 28.041 1 0.000 0.960
Primary/no studies*
1,648.084 2 0.000
Secondary 0.632 0.016 1,628.597 1 0.000 1.881
Tertiary 0.300 0.011 779.809 1 0.000 1.350
I quintile (the poorest)*
9,982.246 4 0.000
II quintile 0.773 0.013 3,625.023 1 0.000 2.166
III quintile 0.132 0.011 134.264 1 0.000 1.141
IV quintile 0.329 0.011 912.801 1 0.000 1.389
V quintile (the richest) -0.355 0.012 895.383 1 0.000 0.701
Area of residence 0.119 0.007 268.504 1 0.000 1.127
Age 0.072 0.001 20,259.020 1 0.000 1.075
Sex 0.684 0.008 6,646.579 1 0.000 1.982
Smoking 0.723 0.014 2,515.823 1 0.000 2.061
No disability grade*
40,124.172 3 0.000
I grade -3.587 0.036 9,806.016 1 0.000 0.028
II grade -1.800 0.041 1,905.968 1 0.000 0.165
III grade -1.620 0.037 1,895.031 1 0.000 0.198
Chronical diseases -1.255 0.017 5,568.171 1 0.000 0.285
Visit the family doctor -0.564 0.012 2,122.042 1 0.000 0.569
Health problems during the last 4
weeks -0.833 0.011 5,752.191 1 0.000 0.435
Beneficiary of medical services
during the last 4 weeks -0.485 0.008 4,055.989 1 0.000 0.616
Constant -0.119 0.060 3.909 1 0.048 0.888
Note: All variables included in the model are statistically significant. Statistical significance – Sig <0.01
*the marked variables included in the model were declared categorized. Thus, each category was
compared to the first. For example, each subsequent quintile was compared to the first one.
Socio-economic differences are an important factor influencing SPH. This is determined by the
correlation between the state of health and the socio-economic inequality of individuals [1, 2, 17, 18].
Income level determines differences in living standards: the quantity and quality of goods and consumed
services. These, at their turn, influence the caloric content, variety and balance of diet, safety and sanitary
properties of clothing and footwear, the convenience and comfort of the habitat. Differences in living
conditions form unequal adaptive capacities, resistance to physical and emotional stress. Inequality in the
standard of living determines the inequality of chances in using effective measures and methods to combat
health deviations. Volume of income and inequality in its distribution are significant factors in
determining public health. Economic inequality has both current and prolonged health effects. The long-
term influence of the poor financial situation determines the likelihood of "losing" more health [17].
The existence of health inequalities is best illustrated by the gap in life expectancy between people
from low socioeconomic groups and those from high ones. In many European countries, men in higher
socioeconomic groups can expect to live up to six years longer than men in lower ones [4]. People with a
higher income or higher standard of living have a better health and experience less disability [3]. Older
persons belonging to lower socio-economic groups have a 30-65% higher risk of almost all chronic
diseases than those in more privileged social groups. Whilst this is true across all countries, the gap
between the best off and the worst off is particularly acute in Central and East European countries [25].
At the same time, the risk of reporting poor health decreases while the level of education
increases. Thus, people with higher education are less at risk of assessing personal health as being worse
than people with lower levels of education.
It is known that income gaps also reflect differences in education levels. In many countries,
educational status is used as the main indicator that determines the position of individuals in the socio-
economic hierarchy, as well as an indicator that characterizes the quality of human potential. Apart from
ECONOMIE ŞI SOCIOLOGIE / ECONOMY AND SOCIOLOGY
51
No. 1-2 / 2017
the above mentioned, the level of education can be considered as an indicator which characterizes the
human capacity to perceive information, to make reasonable and competent decisions regarding the self-
protection behaviour, the preservation and the maintenance of health. Obviously there is a relationship
between income and occupation. Small incomes, as a rule, are associated with unskilled work, which is
characterized by an increased risk of accidents, heavy working conditions, etc. Thus, it is difficult to
identify the net effect of health education. Often higher education is associated with higher incomes, with
changing personality characteristics.
People with upper secondary, tertiary and post-secondary education spend more time in very
good/good and fair health than those with pre-primary education or no education. This can be explained
by the fact that it can be related to better access to information among the educated people [21, 9].
Ageing leads directly to the increased risk of worse SPH. Sex is an important factor that
differentiates SPH considerations. A higher risk of reporting poor health is noted for women, they are
practically twice as likely to assess their health as poor, comparatively to men.
Another risk factor in self-assessment of health is the type of residence. Thus, people in rural areas
appreciate their own health worse than urban people do.
It is known that married people live longer than the unmarried. During recent decades, new data
have piqued interest in the distribution of life expectancy by health status for men and women. Partnered
people, both men and women, are healthier than singles. However, these differences in unhealthy life are
varied. For the length of healthy life, the effect of disability dominates the effect of mortality for women
strongly and for men weakly, while the effect of mortality is more important for the length of unhealthy
life of women. Populations in Eastern Europe are more disadvantaged than those in Western Europe with
respect to length of life and of healthy life; these differences are larger for singles and lower for the
partnered [17]. Marriage is found to be protective insofar as partners can help each other economically,
emotionally, and in diverse aspects of everyday life [22]. The link between mortality and marital status
was researched by Lund et al. – who concluded, that single persons experienced a significantly higher
mortality compared to individuals living with somebody/married [12].
Our study shows there is a correlation between SPH and marital status. Married or living in
consensual unions people are less likely to perceive their health as poor compared to those who are single,
divorced or widowed. Thus, the risk of reporting poor health is lower for people living with someone,
being about 10% less compared to single people. In our research, we notice that the married people from
both rural and urban types of residences perceive their health better.
The variables from health category form a negative link with the dependent variable - negative
self-perception of health. The most significant impact, in this regard, is due to - receiving medical services
during the last 4 weeks (0.616), visiting the family doctor (0.569) and the existence of health problems
over the last 4 weeks (0.435). Thus, receiving health care during the last 4 weeks and visiting a family
doctor increases the risk of reporting a poor health by about 6%, and the existence of health problems over
the last 4 weeks causes a 4% increase of risk. Thus, being a beneficiary of medical services is a
characteristic of unsatisfactory health and the need to visit medical institutions.
The predictor variable – the existence of chronic disease has a lower impact on the risk of
reporting poor health (0.285). However, people who have mentioned that they have a chronic illness more
often appreciate their health negatively than those who have said they don’t have chronic diseases.
The degree of disability has the lowest impact on the formation of a negative health assessment.
People who have declared the third group of disability are only 2% more at risk of reporting poor health
than those who have no disability. In this context, we should mention that there is a high level of the
population disability in the Republic of Moldova. In the total number of pensioners, people receiving
pensions on grounds of disability account for about 20% [24]. The high share of people with a certain
degree of disability is not a relevant indicator for population health and is explained by the conjunctural-
motivational factors, namely by decreasing the real incomes of the population and the substantial
reduction of the employment opportunities. One of the opportunities to survive in such conditions for
citizens is to use all the available sources of income, including social security.
People with a degree of disability benefit from some compensations, such as free medication, free
public transport, and facilities to pay communal services. People who have chosen their old-age pension
are not deprived of the benefits and compensations in case of a disability degree. Thus, at present,
“achieving” a disability degree is an opportunity for the poorest segments of the population and the
unemployed to maintain the standard of living.

Revistă teoretico-ştiinţifică / Theoretical and scientifical journal
52
No. 1-2 / 2017
Behavioural factors are a determinant of health. Thus, the risk of reporting bad health is higher for
smokers than for non-smokers.
Thus, the formation of a negative self-perception of health is more influenced by factors which are
not directly related to the health of the respondent, but by the factors which influence it subjectively,
indirectly, such as socio-economic, demographic characteristics, and the most important is, of course, the
lifestyle.
Conclusions
In the context of declining mortality and demographic ageing, information on changes in the
health and functional status of the elderly is especially important, including objective biomedical data.
Research in this area is an important scientific priority.
The compression of morbidity observed in the Republic of Moldova will have social
consequences in the future. With the shift of morbidity toward older ages, the number of elderly people
who need support will increase in the coming years.
The excess of premature mortality distinguish the Republic of Moldova from the advanced
industrialized countries. The lag in the life expectancy and healthy life expectancy from EU countries is
largely due to higher mortality among the working-age population, wich especially affects men.
Among all the variables considered, wealth and education appears to be the most important factors
associated with self-perceived health. A clear educational gradient was found in both men and women.
Although the healthcare system in the Republic of Moldova was improving in the last decade,
which had contributed to reducing mortality and increasing life expectancy, there are serious problems
with access to health services. This particularly applies to socially vulnerable people, including the
elderly, who do not ask for help when they need it [24]. The lack of sufficient material resources to
support and maintain health at the appropriate level is an important issue for a large proportion of the
elderly. Therefore, the main purpose of social policy in this area should be to limit the impact of poverty
and income inequality on health and to increase the accessibility of high quality medical services for
socially vulnerable groups.
REFERENCES
1. ABIKULOVA, Akmaral K. et al. Inequalities in self-rated health among 45+ year-olds in Almaty,
Kazakhstan: a cross-sectional study. In: BMC public health. 2013. ISSN 1471-2458 [accesat 11
ianuarie 2017]. Disponibil:
https://www.researchgate.net/publication/249646435_Inequalities_in_self-
rated_health_among_45_year-olds_in_Almaty_Kazakhstan_A_cross-sectional_study
2. ANDREEV, E.M. et al. Algorithm for decomposition of differences between aggregate demographic
measures and its application to life expectancies, healthy life expectancies, parity progression ratios
and total fertility rates. In: Demographic Research. 2002, vol. 7, pp. 499-522.
3. BLAKELY, T. A. et al. Metropolitan area income inequality and self-rated health – a multi-level
study. In: Social science & medicine. 2002, vol. 54 (1), pp. 65-77.
4. What are the social benefits of education? In: Education indicators in focus. 2013, january [accesat
11 ianuarie 2017]. Disponibil: https://www.oecd.org/education/skills-beyond-school/EDIF%202013--
N%C2%B010%20(eng)--v9%20FINAL%20bis.pdf
5. SUHRCKE, Marc et al. The contribution of health to the economy in the European Union. 2005
[accesat 11 ianuarie 2017]. Disponibil:
https://ec.europa.eu/health/archive/ph_overview/documents/health_economy_en.pdf
6. FRIES, James F. Aging, Natural Death, and the Compression of Morbidity. In: New England Journal
of Medicine. 1980, vol. 303, pp. 130-135.
7. GAGAUZ, O., AVRAM, C. Speranţa de viaţă sănătoasă – indicatorul integral de evaluare a sănătăţii
populaţiei. In: Revista de Filosofie, Sociologie şi Ştiinţe Politice. 2015, nr. 2, pp. 109-116.
8. GAGAUZ, O., BUCIUCEANU-VRABIE, M. Discriminarea, abuzul şi violenţa asupra vîrstnicilor.
Help Age International. Chişinău, 2015. 144 p.
9. GLIED, Sherry, LLERAS-MUNEY, Adriana. Technological innovation and inequality in health. In:
Demography. 2008, vol. 45 (3), pp. 741-761.
10. GRUENBERG, Ernest M. The Failure of Success. In: Milbank Memorial Fund Quarterly/ Health and
Society. 1977, no. 55, pp. 3-24.

ECONOMIE ŞI SOCIOLOGIE / ECONOMY AND SOCIOLOGY
53
No. 1-2 / 2017
11. Health Expectancy Calculation by the Sullivan Method: a Practical Guide. REVES Paper no. 408.
2001. 29 p. [accesat 17 martie 2017]. Disponibil:
https://reves.site.ined.fr/fichier/s_rubrique/20184/rp408.fr.pdf
12. LUND, R. et al. Cohabitation and marital status as predictors of mortality – an eight year follow-up
study. In: Social Science& Medicine. 2002, vol. 55 (4), pp. 673-679.
13. MANTON, Kenneth G. Changing Concepts of Morbidity and Mortality in the Elderly Population. In:
Milbank Memorial Fund Quarterly/Health and Society. 1982, vol. 60, pp. 183-244.
14. MANTON, Kenneth G. et al. Change in Chronic Disability from 1982 to 2004/2005 as Measured by
Long Term Changes in Function and Health in the U.S. Elderly Population. Proceedings of the
National Academy of Sciences. 2006 [accesat 21 februarie 2017]. Disponibil:
http://www.pnas.org/content/103/48/18374.full.pdf
15. MOSSEY, J.M., SHAPIRO, E. Self-Rated Health: a Predictor of Mortality Among the Elderly //
American Journal of Public Health. 1982, no. 72, pp. 800-808.
16. PENINA, O. et al. Producing reliable mortality estimates in the context of distorted population
statistics: the case of Moldova. MPIDR Working Paper WP-2015-011 [accesat 21 februarie 2017].
Disponibil:
https://www.demogr.mpg.de/en/projects_publications/publications_1904/mpidr_working_papers/pro
ducing_reliable_mortality_estimates_in_the_context_of_distorted_population_statistics_the_case_54
98.htm
17. PHILIPOV, D., SCHERBOV, S. Differences by union status in health and mortality at older ages:
Results for 16 European countries. In: Demographic Research. 2016, vol. 35, pp. 533-554.
18. VOBECKA, J. et al. Population Trends and Policies in the UNECE Region: Outcomes, Policies and
Possibilities. 2013, july [accesat 16 ianuarie 2017]. Disponibil:
https://papers.ssrn.com/sol3/papers.cfm?abstract_id=2309337
19. PRITCHETT, L., SUMMERS, L.H. Wealthier is Healthier. In: Journal of Human Resources. 1996,
vol. 31, pp. 841-868 [accesat 16 ianuarie 2017]. Disponibil:
http://documents.worldbank.org/curated/en/684651468741004317/pdf/multi0page.pdf
20. MINISTERUL MUNCII, PROTECŢIEI SOCIALE ŞI FAMILIEI. Raportul Social Anual 2015.
Chişinău, 2016. 166 p.
21. REINHOLD, S., JÜRGES, H. Secondary school fees and the causal effect of schooling on health
behavior. In: Health Economics. 2010, vol. 19 (8), pp. 994-1001.
22. RENDALL, M.S. et al. The protective effect of marriage for survival: a review and update. In:
Demography. 2011, no. 48 (2), pp. 481-506.
23. Report on health inequalities in the European Union. Brussels. 2013, september [accesat 11 ianuarie
2017]. Disponibil:
http://ec.europa.eu/health//sites/health/files/social_determinants/docs/report_healthinequalities_swd_
2013_328_en.pdf
24. SCHNEIDER, Edward L., BRODY, Jacob A. Aging, Natural Death and the Compression of
Morbidity: another View. In: New England Journal of Medicine. 1983, vol. 309, pp. 854-857.
25. The State of Ageing and Health in Europe. International Longevity Centre-UK and The Merck
Company Foundation. London, 2006. 33 p.
26. Women and health: Today`s evidence tomorrow`s agenda. WHO. 2009[accesat 11 ianuarie 2017].
Disponibil: http://www.who.int/gender/women_health_report/full_report_20091104_en.pdf
27. GAGAUZ, Olga. Problemele persoanelor vîrstnice în societatea tranzitivă. In: Economie şi
Sociologie. 2004, nr. 4, pp. 138-146.
28. ТАПИЛИНА, B.C. Социально-экономический статус и здоровье населения.
В: Социологические исследования. 2004, № 3, сс. 126-137.
Recommended for publication: 10.05.2017
Revistă teoretico-ştiinţifică / Theoretical and scientifical journal
54
No. 1-2 / 2017
THE USE OF INTERNATIONAL RANKINGS FOR BUSINESS
DEVELOPMENT POLICY EVALUATION IN THE REPUBLIC OF MOLDOVA
Elena ACULAI1, PhD, Associate Researcher,
National Institute for Economic Research, Moldova
Lidia MAIER2, Researcher,
National Institute for Economic Research, Moldova
Alexandra NOVAC3, PhD, Associate Researcher,
National Institute for Economic Research, Moldova
The assessment of the business environment and its trends represents an important
source of information for business development strategies and decision making by investors. International
rankings, related to the assessment of the business environment, enable a qualitative comparison
of the business development conditions in many countries. Therefore, the results of these rankings often
serve as a basis for monitoring and improving the state policies at national and regional levels.
The purpose of this article is to analyze the position of Moldova in international rankings, which reflect
the business environment and to evaluate the advantages and constraints of using these rankings in the
state entrepreneurship policy. The article includes: (i) the experience of using the international rankings
in national strategies abroad and in Moldova; (ii) the assessment of Moldova’s position in the
international rankings, which refer to business development; (iii) the identification of the advantages and
constraints in using the international rankings for monitoring, evaluating and improving the state policy
(on the example of Moldova). The research methodology is based on a comparative analysis of
international rankings methods and results, as well as on a critical analysis of using the ratings in
assessing the state policy.
Keywords: international ranking, enterpreneurship, assessment of business environment, business
development state policies.
Evaluarea mediului de afaceri și a tendințelor de schimbare a acestuia reprezintă o sursă
importantă de informație pentru elaborarea strategiilor de dezvoltare a întreprinderilor și luarea
deciziilor de către investitori. Clasamentele internaționale, ce țin de evaluarea mediului de afaceri, permit
compararea calitativă a condițiilor de dezvoltare a antreprenoriatului în multe țări ale lumii. De aceea,
rezultatele acestor clasamente adesea servesc drept bază pentru monitorizarea și îmbunătățirea
politicilor de stat la nivel național și regional. Scopul acestui studiu este de a analiza poziția Republicii
Moldova în clasamentele internaționale, care reflectă mediul de afaceri, precum și de a evalua avantajele
și constrângerile în utilizarea acestor clasamente în politica de stat de dezvoltare a antreprenoriatului.
Articolul include: (i) experiența utilizării clasamentelor internaționale în strategiile naționale în
străinătate și în Republica Moldova; (ii) evaluarea poziției Republicii Moldova în clasamentele
internaționale, care se referă la dezvoltarea mediului de afaceri; (iii) identificarea avantajelor și
constrângerilor în utilizarea clasamentelor internaționale la monitorizarea, evaluarea și îmbunătățirea
politicii de stat (în baza Republicii Moldova). Metodologia cercetării se bazează pe analiza comparativă a
metodelor și rezultatelor clasamentelor internaționale, precum și pe analiza critică a utilizării acestora la
evaluarea politicii de stat.
Cuvinte-cheie: clasament internațional, antreprenoriat, evaluarea mediului de afaceri, politica de
stat de dezvoltare a antreprenoriatului.
Оценка бизнес-среды и тенденций ее изменения является важным источником
информации для разработки стратегий развития предприятий и принятия решений инвесторами.
Международные рейтинги, связанные с оценкой бизнес-среды, позволяют количественно
1 © Elena ACULAI, [email protected] 2 © Lidia MAIER, [email protected] 3 © Alexandra NOVAC, [email protected]
ECONOMIE ŞI SOCIOLOGIE / ECONOMY AND SOCIOLOGY
55
No. 1-2 / 2017
сопоставить условия развития предпринимательства во многих странах мира. Поэтому
результаты этих рейтингов нередко служат базой для мониторинга и совершенствования
государственных политик на национальном и региональном уровнях. Целью исследования является
анализ позиции Р.Молдова в международных рейтингах, отражающих бизнес-среду, а также
оценка преимуществ и ограничений при использовании этих рейтингов в государственной
политике развития предпринимательства. Статья включает: (i) опыт использования
международных рейтингов в национальных стратегиях за рубежом и в Р.Молдова; (ii) оценку
позиции Молдовы в международных рейтингах; отражающих бизнес-среду; (iii) выявление
преимуществ и ограничений в использовании международных рейтингов при мониторинге, оценке
и совершенствовании государственной политики (на примере Молдовы). Методология
исследования базируется на сравнительном анализе методов и результатов международных
рейтингов, а также критическом анализе их использования для оценки государственной
политики.
Ключевые слова: международный рейтинг, предпринимательство, оценка бизнес-среды,
государственная политика развития предпринимательства.
JEL Classification: O20, O29, O57, P29.
UDC: 334.72(478)
Introduction. The business environment assessment is gaining a lot of attention from the
politicians, investors and business managers around the world, as it allows making more informed
management decisions. As a rule, the business environment research is based on the evaluation of a large
number of indicators in order to fully take into account the variety of factors which are analyzed in
dynamics to reveal not only the status quo but also its main trends.
A number of recognized international institutions (the World Bank, the World Economic Forum,
the Wall Street Journal and the Heritage Foundation, etc.) in recent years have initiated and are carrying
out different researches covering dozens of states located on all continents in order to provide a
comparative assessment of the position of each country on various aspects of economic development,
competitiveness, entrepreneurship. The results of the ratings make it possible to compare the economic
and political conditions of business development in a particular country, institutional and personnel
potential, financial and innovative mechanisms, as well as the implemented public policies.
Despite the difference in the international ratings goals and methodologies, their results are used
by the governments of some countries, including the Republic of Moldova, to improve the state policy in
the field of entrepreneurship. In addition to the advantages of these ratings, there are a number of
limitations which must be taken into account when using them in order to monitor and improve the
national strategies and programs. In this context, Moldova's positions in the main international ratings
concerning the business environment will be analyzed, as well as the appropriateness of using such ratings
for the state policy evaluation.
Foreign experience of using international ratings in national strategies. The policy documents
analysis in some states, primarily in Central and Eastern Europe revealed that international rankings are
used to assess the country's position in the business environment and competitiveness fields. The results of
the ratings not only serve as a basis for measuring the results of the earlier taken actions, but also allow
outlining the measures for improving the business environment and increasing the competitiveness of
national economies. The achieved progress should be reflected in the advancement of the country's
position in international ratings on certain indicators.
For example, the position and situation of the Czech Republic regarding the competitiveness and
business environment are evaluated in the National Research and Innovation Strategy for the Smart
Specialization through 2 international reports (the Global Competitiveness Report and the Doing Business
Report). It is noted that the Czech Republic's decline in some of its aspects is so obvious that it must be taken
into account. At the same time, the analysis of the indicators of the Czech Republic in the Global
Competitiveness Report take into account the position of the country in the European context. The Ease of
Doing Business Index is mentioned in the same strategy for evaluating the conditions of doing business in
Czech Republic in comparison to other countries from Central Europe. Both of these ratings will measure
whether the Czech Republic is successful in fulfilling the vision and in progressing in the direction of the
Strategy vision.

Revistă teoretico-ştiinţifică / Theoretical and scientifical journal
56
No. 1-2 / 2017
Romania's National Competitiveness Strategy 2014-2020 sets a series of priorities and indicators to
achieve, and among the expected results is the improvement of Romania's position within the Global
Competitiveness Report and the Corruption Perception Index. For example, it tends to improve the position
in international rankings in the following directions: Improving the transparency of authorities and public
enterprises (improving Romania's position within the Index of Corruption Perception from 69 to 40 until
2020); Reducing the burden taxation on the companies (increasing the position in the Global
Competitiveness Report at the following indicators: Effect of taxation on incentives to invest; Total tax rate,
profits; Effect of taxation on incentives to work); Improving the access to finance for companies and
especially SMEs (improving the position in the Global Competitiveness Report for the following indicators:
Availability of financial services; Affordability of financial services; Regulation of securities exchanges).
References to international ratings are also present in the state strategies of other EU countries: the
Estonian Entrepreneurship Growth Strategy 2020, the National Development Strategy 2007-2015 of Poland,
the Sustainable Development Strategy of Latvia until 2030, which use indicators aiming to measure the
results (benefits) which reflect the progression of the specified long-term objectives.
The use of international ratings in the policy documents of the Republic of Moldova. In our
country, in most economic policy documents adopted by the Government, it is emphasized on need to
ameliorate the business development conditions. In particular, such goals and measures are present in the
National Development Strategy "Moldova 2020", the Government's action programs, the Roadmap for the
Competitiveness Improvement, the Strategy for the Development of the SMEs sector in the period
2012-2020, the Strategy "Innovation for Competitiveness" and other national strategies and programs.
Within these strategic documents the analysis of Moldova's business development is reflected by the
country's position in international rankings.
Thus, in order to describe the business situation the National Development Strategy
of the Republic of Moldova "Moldova 2020" [15] is referring to the following rankings: the Doing Business
Report, the Global Competitiveness Report, the Economic Freedom Index. Moreover, one of eight priorities
of economic development is to improve the business environment, and the effect of "ease of doing business"
will be evaluated by advancing the Republic of Moldova’s position in the international rankings – the Doing
Business Report, the Index of Economic Freedom and the Global Competitiveness Report.
Another example is the Strategy "Innovation for Competitiveness" for the period 2013-2020 [14],
where a detailed assessment of the situation in the field is made based on the Global Innovation Index
Report indicators. The Strategy sets the key indicators and their values that are expected to be achieved by
2020. Among these indicators, there can be mentioned the indicators from the Doing Business ranking of
the World Bank: Starting a business, Resolving Insolvency, Paying taxes, Protecting minority Investors;
and indicators developed by the World Economic Forum: University-industry collaboration in R&D.
The analysis of Moldova's position in the Doing business rating, as well as a detailed assessment
of its individual indicators, was used in the Strategy for the Development of the Small and Medium-sized
Enterprises Sector for 2012-2020 [13] in order to determine the main achievements, barriers and tasks in
the area of SMEs support. For example, a significant progress was registered in the field of business
registration, and at the same time, significant obstacles in the activities of companies engaged in cross-
border trade. Herewith, Moldova's position in the rating and the trend of its change are compared with the
situation in neighboring countries (Romania and Ukraine) and the countries of Eastern Europe and Central
Asia, which are closer in terms of economic development.
In all these policy documents, it is assumed that the improvement of Moldova’s position in the
corresponding rating clearly indicates toward a positive change of the country situation, and at the same
time reflects the results of the reforms carried out by the government.
The Republic of Moldova's position in international rankings reflecting the business
environment development. Moldova is currently included in many ratings developed by international
organizations, which makes it possible to compare its position with other countries and compare the trends
on many indicators. Below there is a brief description of the main international ratings, directly or
indirectly reflecting the business environment, and Moldova’s place in it.
1. „Doing Business” is the main ranking reflecting the business environment development in the
country. The Doing Business report, starting from 2003, is produced annually by the World Bank. Today
the ranking includes about 190 world economies. The report covers 10 economic indicators which analyze
the economic results and determine what reforms of business regulation have worked, where and why.
The report offers quantitative indicators on regulation for starting a business, dealing with construction

ECONOMIE ŞI SOCIOLOGIE / ECONOMY AND SOCIOLOGY
57
No. 1-2 / 2017
permits, getting electricity, registering property, getting credit, protecting minority investors, paying taxes,
trading across borders, enforcing contracts and resolving insolvency.
The report is not limited just to the evaluation of the relative changes of the country’s position in
the ranking, but also uses the indicator ”Distance to Frontier” score (DTF). The DTF score is based on a
reference scale benchmarking economies according to regulatory best practice, showing the best
performance, ranging from 0% in the case of the worst performance and 100% in the case of conformity
with the best existing practice.
In 2016, the Republic of Moldova [5] ranks number 44 of 190 countries included in the ranking,
showing an improvement of 3 positions (table 1). In 2016 it shows a positive trend. The lowest position in
the ranking Moldova has obtained at Dealing with construction permits indicator (165th position), which
last year has worsened its position with 3 points and Getting electricity indicator (73rd position). The most
significant worsening was registered for the Starting a business indicator (-6 positions).
However some indicators recorded an improvement. The biggest improvement was registered in
Getting electricity indicator, Paying Taxes indicator (+24 positions respectively); Enforcing contracts
indicator (+8 positions).
Moldova accumulated in 2016 a total score of 71.64 for the DTF indicator, which reflects a
worsening of 1.11 points compared to previous year, 2015.
Table 1
Moldova’s position in Doing business ranking, edition 2017
Source: Data of the international ranking Doing Business, 2017 [5].
2. The Global Competitiveness Index is a public policy tool, published since 1979 by the World
Economic Forum aiming to serve as a benchmarking tool for the governments, private sector, and civil society. At the moment, the ranking assesses the competitiveness of 138 economies. Some countries have used the Index to build the entire competitiveness system and formally organize their institutions for competitiveness.
The GCI covers 114 indicators which are grouped into 12 pillars: institutions, infrastructure, macroeconomic environment, health and primary education, higher education and training, goods market efficiency, labor market efficiency, financial market development, technological readiness, market size, business sophistication, and innovation. These pillars are organized into three subindexes: basic requirements, efficiency enhancers, and innovation and sophistication factors.
In 2016 Moldova is ranked number 100 among 138 countries included in the ranking. In the analyzed period Moldova’s place has worsened by 16 positions (table 2).
The lowest positions Moldova has obtained for the pillars: Innovations (133), Financial market development (129), Institutions (128), Business sophistication (127) and Market size (124).
In the analyzed period, Moldova has not registered any positive change, on the contrary, all changes were negative and only for the Business sophistication pillar the country's position has not been changed, remaining on 127th position as in the previous year. The most significant negative changes were registered in the following pillars:
- The macroeconomic environment (-45 positions), this change is due to a drastic worsening of the
Indicators
Position The
change
DTF (% points) Change in
DTF (%
points)
2015
2016
(DB 2017) 2015
2016
(DB 2017)
Position of the Republic of Moldova in
„Doing business” report 47 44 +3 72.75 71.64 -1.11
1.Starting a business 38 44 -6 91.96 92.19 +0.23
2.Dealing with construction permits 162 165 -3 54.14 54.09 -0.05
3.Getting electricity 97 73 +24 74.60 67.48 -7.12
4.Registering property 20 21 -1 82.92 82.91 -0.01
5.Getting Credit 29 32 -3 70.00 70.00 0
6.Protecting minority Investors 40 42 -2 63.33 63.33 0
7.Paying Taxes 55 31 +24 84.76 80.16 -4.6
8.Trading across Borders 34 34 - 92.32 92.39 +0.07
9. Enforcing Contracts 70 62 +8 60.87 59.94 -0.93
10.Resolving Insolvency 58 60 -2 52.61 53.85 +1.24
Number of countries 189 190

Revistă teoretico-ştiinţifică / Theoretical and scientifical journal
58
No. 1-2 / 2017
position for the indicators: Gross national savings % GDP (-35 positions); Inflation annual % change (-27 positions); Country credit rating 0-100 (best) (-9 positions).
- Financial market development (-14 positions), change due to the worsening of all indicators, especially: Affordability of financial services (-23 positions); Financial services meeting business needs (-12 positions); Venture capital availability (-10 positions).
- Higher education and training (-12 positions), change due to the worsening of the following indicators: Internet access in schools (-13 positions); Secondary education enrollment rate gross % (-8 positions); Quality of management schools (-7 positions); Extent of staff training (-7 positions).
Table 2
Moldova’s position in the international ranking Global Competitiveness Index
Source: Data of the international ranking The Global Competitiveness Report [6;7].
3. The Index of Economic Freedom is the main economic indicator for the economic activity and investment process. It reflects the openness of the economy, the efficiency of government regulations, the rule of law and competitiveness. The Index of Economic Freedom is an annual ranking, created by The Wall Street Journal and The Heritage Foundation. The aim of the Index is to measure the degree of economic freedom in the world's nations. It covers 4 policy areas which have an impact on economic freedom: Rule of law; Government size; Regulatory efficiency; and Open markets. In 2015 the study covered 186 countries. The economic freedom is measured based on 12 indicators named also 12 economic freedoms (edition 2017): 1) Business freedom; 2) Trade freedom; 3) Fiscal health; 4) Government spending; 5) Monetary freedom; 6) Investment freedom; 7) Financial Freedom; 8) Property rights; 9) Judicial effectiveness; 10) Labor freedom; 11) Tax burden; 12) Government integrity.
In 2016 (edition 2017), in the Index of Economic Freedom ranking the Republic of Moldova ranks number 110 among 186 countries included in the rating. In the analyzed period Moldova’s place has improved with 7 positions (table 3). According to the Index of Economic Freedom, driven largely by remittance-based consumption and credit expansion, Moldova’s relatively resilient economic growth over the past five years has created some momentum for improving the business environment and liberalizing the trade regime. However, the ongoing transition to a more stable market-oriented economy remains fragile [2].
For our country, the Index of Economic Freedom reveals the following trends: The lowest positions Moldova registered in the indicators: Labor Freedom (171), Government
Spending (127), Judicial effectiveness (150), Government integrity (155) and Monetary Freedom (139), followed by Investment Freedom (103).
The negative change was recorded in the indicators: Property rights (-27 positions), Monetary Freedom (-34positions), Government spending (-1 position), Investment freedom (-1 position).
The most advanced positions in the ranking, Moldova has recorded in the indicators: Fiscal health (51), Tax burden (43) and Financial Freedom (70).
Indicators Position in the ranking
The change 2015-2016 2016-2017
Total, including 84 100 -16
Subindex A: Basic requirements 89 101 -12
1st pillar: Institutions 123 128 -5
2nd pillar: Infrastructure 83 86 -3
3rd pillar: Macroeconomic environment 55 100 -45
4th pillar: Health and primary education 91 95 -4
Subindex B: Efficiency enhancers 94 102 -8
5th pillar: Higher education and training 79 91 -12
6th pillar: Goods market efficiency 103 107 -4
7th pillar: Labor market efficiency 85 91 -6
8th pillar: Financial market development 115 129 -14
9th pillar: Technological readiness 53 58 -5
10th pillar: Market size 121 124 -3
Subindex C: Innovation and sophistication factors 128 131 -3
11th pillar: Business sophistication 127 127 -
12th pillar: Innovation 130 133 -3
Number of countries in the ranking 140 138

ECONOMIE ŞI SOCIOLOGIE / ECONOMY AND SOCIOLOGY
59
No. 1-2 / 2017
Table 3
Moldova’s position in the ranking Index of Economic Freedom
Position in the ranking The change
2015 (edition 2016) 2016 (edition 2017)
Total, including: 117 110 +7
Rule of law
Property Rights 69 96 -27
Government integrity n/a 155
Judicial effectiveness n/a 150
Government size
Government spending 126 127 -1
Tax burden n/a 43
Fiscal health n/a 51
Regulatory Efficiency
Business Freedom 95 89 +6
Labor Freedom 173 171 +2
Monetary Freedom 105 139 -34
Open Markets
Trade Freedom 105 81 +24
Investment Freedom 102 103 -1
Financial Freedom 72 70 +2
Number of countries in the ranking 178 186
Source: Based on The Index of Economic Freedom ranking [1; 2].
4. The Global Innovation Index (GII) is an annual ranking of countries published by Cornell
University, INSEAD (European Institute of Business Administration), and the WIPO (The World Intellectual Property Organization), in partnership with other organizations and institutions. The Global Innovation Index aims to evaluate the capacity , and success in innovation of the countries including about 130-140 countries. The GII is used by businesses and policy-makers and examine the impact of innovation-oriented policies on economic growth and development.
The GII relies on two sub-indices – the Innovation Input Sub-Index and the Innovation Output Sub-Index – each built around pillars. Four measures are calculated:
1. Innovation Input Sub-Index: Five input pillars capture elements of the national economy which enable innovative activities.
2. Innovation Output Sub-Index: Innovation outputs are the results of innovative activities within the economy. Although the Output Sub-Index includes only two pillars, it has the same weight in calculating the overall GII scores as the Input Sub-Index.
3. The overall GII score is the simple average of the Input and Output Sub-Indices. 4. The Innovation Efficiency Ratio is the ratio of the Output Sub-Index to the Input Sub-Index.
It shows how much innovation output a given country is getting for its inputs. In 2016 Moldova is ranked number 46 among 128 countries included in the ranking. In the
analyzed period Moldova’s position worsened by 2 points (table 4). The lowest positions in the ranking Moldova has registered in the Innovation Input Sub-Index
(74), in particular, the pillars of Market sophistication (93), Business sophistication (89), Infrastructure (75), Institutions (68).
The most negative change was recorded for the Market sophistication pillar (-41 positions). The most advanced position in the ranking Moldova has recorded at the Innovation efficiency
index (4th position) showing among the most efficient countries in turning ideas into innovative practical results. This indicator does not reflect the innovation potential (in Moldova, as in some other countries, which recorded advanced positions in innovation efficiency, this potential is very limited), but the degree of using the existing potential. In 2016 Moldova ranks number 4 at this indicator (in 2015 – 5th place, and in 2014 – number 1 in the list of countries).
The most significant positive change in the country's position was recorded at the Human capital
and research pillar (+23 positions).

Revistă teoretico-ştiinţifică / Theoretical and scientifical journal
60
No. 1-2 / 2017
Table 4
Moldova’s position in the international ranking Global Innovation Index
Source: Based on international ranking the Global Innovation Index [10; 11].
5. The Logistics Performance Index is performed from 2007 and is calculated by the World
Bank every two years. The LPI includes 160 countries worldwide. The LPI is an interactive benchmarking tool aiming to help countries identifying the challenges and opportunities they face in their performance on trade logistics. The LPI is based on a worldwide survey of operators on the ground (global freight forwarders and express carriers), providing feedback on the logistics “friendliness” of the countries in which they operate and those with which they trade. They combine in-depth knowledge of the countries in which they operate with informed qualitative assessments of other countries where they trade and experience the global logistics environment. Feedback from operators is supplemented with quantitative data on the performance of key components of the logistics chain in the country of work. The LPI consists therefore of both qualitative and quantitative measures and helps build profiles of logistics friendliness for these countries. It measures performance along the logistics supply chain within a country and offers two different perspectives: international and domestic.
The 2016 LPI survey follows the same methodology as the previous four editions of Connecting to Compete: a standardized questionnaire with two parts, international and domestic. In the international questionnaire, respondents evaluate six core pillars of logistics performance in up to eight of their main overseas partner countries. In the domestic questionnaire, respondents are asked to provide qualitative and quantitative data on the logistics environment in the country in which they work.
In the ranking Logistics Performance Index 2016, the Republic of Moldova ranks number 93 in the list of 160 countries. In the analyzed period, Moldova’s situation has improved by 1 position (table 5).
The lowest positions in the ranking Moldova has registered in the following indicators:
Competence and quality of logistics services (103), Infrastructure (100) and Customs (99), and the most
significant worsening was recorded at the International transport (-42).
The most advanced position (slightly above the world average – rank 85th and 86th respectively)
are recorded at Tracking and tracing indicator and Timeliness indicator and the biggest improvement was
registered the Tracking and tracing indicator (+46 positions).
Table 5
Moldova’s position in the international ranking Logistics Performance Index
Source: Based on data of the international ranking Logistics Performance Index [3; 4].
Indicator Position in the ranking
The change 2015 2016
Total, including 44 46 -2
Innovation Input Sub-Index 74 74 -
1) Institutions 75 68 +7
2) Human capital & research 74 51 +23
3) Infrastructure 82 75 +7
4) Market sophistication 52 93 -41
5) Business sophistication 83 89 -6
Innovation Output Sub-Index 31 36 -5
6) Knowledge and technology outputs 26 31 -5
7) Creative outputs 38 34 +4
The Innovation Efficiency Ratio 5 4 +1
Number of countries in the ranking 141 128
Indicator Position in the ranking
The change 2014 2016
Total, including 94 93 +1
Customs 98 99 -1
Infrastructure 85 100 -15
International transport 52 94 -42
Competence and quality of logistic services 118 103 +15
Tracking and tracing 131 85 +46
Timeliness 109 86 +23
Number of countries in the ranking 160 160

ECONOMIE ŞI SOCIOLOGIE / ECONOMY AND SOCIOLOGY
61
No. 1-2 / 2017
6. The Global Enabling Trade Index is performed from 2008, every two years by the World Economic Forum and assesses the extent at which economies have in place institutions, policies, infrastructures and services facilitating the free flow of goods over borders and to their destination.
The ETI is a composite index of several individual indicators on the basis of underlying ETI framework. The ETI framework captures the different area of trade divided into four subindexes:
A. Market access, aiming to evaluate the extent and complexity of a country’s tariff regime, tariff barriers faced and preferences enjoyed by a country’s exporters in foreign markets.
B. Border administration, aiming to assess the quality, transparency and efficiency of border administration of a country.
C. Infrastructure, aiming to assess the availability and quality of transport infrastructure of a country, associated services, and communication infrastructure.
D. Operating environment, aiming to measure the quality of the key institutional factors impacting the business of active importers and exporters in a country.
These four subindexes are in turn subdivided into pillars which capture more specific aspects within their respective broad issue areas. Each of them is composed of a number of indicators. In the analyzed period Moldova ranks number 79 among 136 countries included in the Global Enabling Trade Index ranking. During the 2014-2016 period Moldova has improved its rank by 13 positions (table 6).
Table 6
Moldova’s position in the Global Enabling Trade Index ranking
Source: Based on international ranking The Global Enabling Trade Index [8; 9].
The lowest positions in the ranking Moldova has registered in the following indicators: Operating environment (103), which in the last 2 years dropped by 3 positions and Availability & quality of transport infrastructure (102), which in the same period significantly worsened in the ranking – with 16 positions.
The most advanced positions in the rankings Moldova has recorded at: Foreign market access indicator (49), Domestic market access (65), although both indicators showed the most negative changes, with 16, respectively 27 positions.
The most positive change is related to Efficiency & transparency of border administration indicator (+42 positions), other indicators showing significant changes both positive and negative.
Based on data of Moldova's position in the analyzed international rankings, it is important to mention that its change in 2016 in comparison with the previous year registered contradictory trends (table 7). This is explained by the fact that each of these rankings examines a range of different aspects related to business environment.
Table 7
Source: Elaborated by the authors based on international rankings [1; 2; 3; 4; 5; 6; 7; 8; 9; 10; 11].
Indicator Position in the ranking
The change 2014 2016
Total, including 92 79 +13
SUBINDEX A: MARKET ACCESS (25%) 27 50 -23
Pillar 1: Domestic market access 38 65 -27
Pillar 2: Foreign market access 33 49 -16
SUBINDEX B: BORDER ADMINISTRATION (25%) 116 74 +42
Pillar 3: Efficiency & transparency of border administration 116 74 +42
SUBINDEX C: INFRASTRUCTURE (25%) 87 88 -1
Pillar 4: Availability & quality of transport infrastructure 86 102 -16
Pillar 5: Availability & quality of transport services 91 88 +3
Pillar 6: Availability & use of ICTs 77 71 +6
SUBINDEX D: OPERATING ENVIRONMENT (25%) 100 103 -3
Pillar 7: Operating environment 100 103 -3
Number of countries in the ranking 138 136
Rankings Moldova’s position in the ranking
The change 2015 2016
Doing Business 47 44 +3
Global Competitiveness Index 84 100 -16
Index of Economic Freedom 117 100 +7
Global Innovation Index 44 46 -2
Logistics Performance Index 94 (2014) 93 +1
Global Enabling Trade Index 92 (2014) 79 +13

Revistă teoretico-ştiinţifică / Theoretical and scientifical journal
62
No. 1-2 / 2017
In the rankings of the last years drawn up by various international rating organizations and
agencies, the Republic of Moldova is on rather modest positions, which is an indirect indication of the
structural deficiencies of the national economy.
The advantages and limitations in the use of international ratings for monitoring and
improving the state policy in the Republic of Moldova.
The position of our country in the international rankings, as well as the evolution of its position in
relation to previous years, gives a lot of valuable information for the analysis of the situation. One of the
advantages of using international ratings for the public policy monitoring is the possibility of a
quantitative assessment. The quantitative approach favorably distinguishes the ratings from other
assessments of a qualitative nature, which are often expressed by researchers, politicians or business
representatives.
A feature of the international ratings is the multifactor analysis, which allows a fairly multifaceted
analysis of the situation. For example, in the report on Global Competitiveness, 12 pillars are used, for the
specification of which serve more than 100 indicators. This allows us to reveal in a more detail manner the
factors influence. For example, Moldova ranks number 128 at the Institutions pillar and this position is
calculated on the basis of 22 indicators.
The results of international ratings provide an opportunity to compare the situation and trends of
its change (in this case – the business environment) in different countries, and also to compare the
analyzed situation in the country with the average level in the region.
Some ratings give an opportunity to quantify not only the place of the country in the rating,
but also its difference from the best indicator in the region or the world. For example, Doing Business
ranking since 2015 rely no longer on changes of the position, but on the indicator "distance to frontier"
[18], which shows on a scale of 0-100, how far/close is a state of the most successful practices
in a particular field. Thus, our country in 2016 (2017 edition) ranked number 44 of 190 countries, with a
total score of 71.64.
At the same time, the use of the analyzed ratings for public policy monitoring, evaluation and
improvement has certain limitations which must be taken into account. First of all, any international rating
focuses its attention on the barriers and indicators that are of interest to a large number of countries, but
considering not enough the specifics of a particular country. For example, to assess the business
environment in Moldova, it is very important to take into account such indicators as the threat of external
risks, the independence of the judicial system, as evidenced by the results of other studies (Stratan A.,
Aculai E., Vinogradova N., 2015, p. 19-30) [12].
However, these indicators are not included in the Doing Business report, which characterizes the
"ease of doing business", and contains other 10 indicators. In this situation, for a more complete and
detailed assessment of the business environment, it is advisable to supplement the results of the
international ratings with data from the national studies which take into account the real situation of
the country.
Another limitation in the use of international ratings for the policy monitoring is that the country's
position in the rating depends not only on the actions of a particular country’s government, but also on
the pace of reform in other countries.
For example, according to the Global Competitiveness Index ranking, India, whose economy is on
first stage based on factors of production, in 2014 after the government stabilization, reconsidered its
policies and is strongly committed to the necessary reforms for competitiveness improvement. Thus, due
to some active reforms in monetary and fiscal policies and measures for lower oil prices, actively
promoting innovation policies, India’s economy has stabilized and now has the highest growth among
G20 countries.
Recent reform efforts have focused on improving public institutions, opening up the economy to
foreign investors and international trade, and increase transparency in the financial system. Thus, from
2014 India has advanced in the ranking with 32 positions (from number 71 in 2014 to 39 in 2016).
This means that it is hardly possible to forecast an improvement of the country's position in the
rating in a certain number of years, since the government can plan some measures related to the changing
situation in its country. In this case, it is more rational to use indicators similar to the “Distance to
frontier”.
International ratings, implemented by different organizations, are based on a different
methodology. This leads to the fact that the positions of individual countries and their evolutions in the

ECONOMIE ŞI SOCIOLOGIE / ECONOMY AND SOCIOLOGY
63
No. 1-2 / 2017
ratings vary significantly, which is clearly shown in table 7. In particular, if we analyze the same indicator,
for example, Business sophistication, in the Global Competitiveness Index ranking Moldova ranks number
127, but in the Global Innovation Index ranking our country ranks number 89.
This raises the need for a detailed study of the methodology of individual ratings when used in the
policy documents. For example, it is important to take into account that the Doing Business methodology
provides the following:
– The implementation of reforms is measured not by the achieved results in the economy, but on
the basis of the adopted laws and other legal acts. That is, the actual implementation of the actions is not
always taken into account by the rating. For example, in a Moldavian economic newspaper is mentioned:
“Doing Business 2015 shows that Moldova made a significant jump with 19 positions, ranking number 63
in the list of countries with the most favorable business environment. The country has made the most
important progress at the indicators related to the availability of credits and paying taxes, while regressed
in terms of construction permits, access to electricity, etc. Despite the apparent improvements, the State
Registration Chamber data show that in the last three years fewer new businesses were registered, and
experts believe that the progress is visible only on paper, as the data of the World Bank report are far from
businessmen expectations” [16].
– The survey of respondents, on which the results of the study are based, is conducted only in the
capital. This does not allow to fully identifying the unfavorable conditions for the business development which
are much worse outside Chisinau mun. (which is confirmed, in particular, by the high concentration of the
enterprises in the capital, where 65% of all economic agents work).
– Respondents can be not only the entrepreneurs, but also the representatives of institutions that
regulate this sector; as a result, they have the opportunity to assess their own activity. For example, at the
working groups meeting established at the level of Economic Council of the Prime Minister of Moldova
aiming to improve Moldova's position in the world economic rankings, was proposed that specialists from
national authorities (the National Commission of Financial Market, Customs Service, etc.) should register
as respondents for the Doing Business survey, in order to complete the questionnaire for the current year
ranking.
– An ilustrative example serves the trend of the main indicators of the Doing business in 1 year.
To assess the trends over a longer period is much more difficult, since the methodology of the study is
adjusted annually. If this circumstance is not taken into account, then erroneous interpretations may arise.
For example, before the change of the methodology, in 2016 Moldova was ranked number 52 in the Doing
business ranking. After changing the methodology and recalculating the positions of all countries for
2016, Moldova's place was number 47 (a difference of +5 positions).
The noted limitations are important to consider when monitoring, analyzing and improving the
business development policy.
Results and conclusions. The results of the international ratings provide valuable information for
entrepreneurs and investors, allowing them to solve practical business development problems, justifying
investment and other management decisions. The foreign experience in the national strategies and
programs development demonstrates that the international ratings are also actively used for monitoring
and improving the state policy.
The Republic of Moldova has participated in many international ratings in recent years. However,
the country's positions in the individual ratings vary significantly. In 2016 the positions changed from
number 44 in the Doing Business ranking, to number 117 in the Index of Economic Freedom. Moreover,
individual ratings show an improvement of the situation (up to + 13 positions in the Global Enabling
Trade Index), others – a deterioration (to – 16 positions in the Global Competitiveness Index).
In Moldova, ratings related to the conditions of the business environment and the competitiveness
levels are also widely used for the analysis and public policy development. In particular, they are an
integral part of the national strategies: "Moldova 2020", "Innovations for competitiveness", and Strategy
for the Development of the Sector of Small and Medium sized Enterprises for 2012-2020.
When using the results of international ratings in the process of monitoring, evaluating and
improving the state policy in the Republic of Moldova, it is important to keep in mind not only the
advantages, but also the limitations of the above ratings.
Revistă teoretico-ştiinţifică / Theoretical and scientifical journal
64
No. 1-2 / 2017
REFERENCES
1. Moldova: Economic freedom score. 2015 [accesat 11 februarie 2017]. Disponibil:
http://www.heritage.org/index/pdf/2015/countries/moldova.pdf
2. Moldova: Economic freedom score. 2016 [accesat 20 februarie 2017]. Disponibil:
http://www.heritage.org/index/pdf/2016/countries/moldova.pdf
3. ARVIS, J-F., SASLAVSKY, D. et al. Connecting to Compete 2014. Trade Logistics in the Global
Economy. The Logistics Performance Index and Its Indicators. The International Bank for
Reconstruction and Development, The World Bank [accesat 28 ianuarie 2017]. Disponibil:
http://d21a6b425f3bbaf58824-
9ec594b5f9dc5376fe36450505ae1164.r12.cf2.rackcdn.com/LPI_Report_2014.pdf
4. ARVIS, J-F., SASLAVSKY, D. et al. Connecting to Compete 2016. Trade Logistics in the Global
Economy. The Logistics Performance Index and Its Indicators. The World Bank. 2016 [accesat 28
ianuarie 2017]. Disponibil: https://wb-lpi-media.s3.amazonaws.com/LPI_Report_2016.pdf
5. Ease of Doing Business in Moldova. The World Bank. 2017 [accesat 14 februarie 2017]. Disponibil:
http://www.doingbusiness.org/data/exploreeconomies/moldova
6. SCHWAB, K. et al. The Global Competitiveness Report 2015-2016: insight report. Geneva, 2015
[accesat 15 februarie 2017]. Disponibil: http://www3.weforum.org/docs/gcr/2015-
2016/Global_Competitiveness_Report_2015-2016.pdf
7. SCHWAB, K. et al. The Global Competitiveness Report 2016-2017: insight report. Geneva, 2016
[accesat 15 februarie 2017]. Disponibil: http://www3.weforum.org/docs/GCR2016-
2017/05FullReport/TheGlobalCompetitivenessReport2016-2017_FINAL.pdf
8. DRZENIEK HANOUZ, M. et al. The Global Enabling Trade Report 2014: insight report. Geneva,
2014 [accesat 9 februarie 2017]. Disponibil:
http://www3.weforum.org/docs/WEF_GlobalEnablingTrade_Report_2014.pdf
9. The Global Enabling Trade Report 2016. Moldova [accesat 9 februarie 2017]. Disponibil:
http://reports.weforum.org/global-enabling-trade-report-2016/economy-profiles/#economy=MDA
10. DUTTA, S. et al. The Global Innovation Index 2015: Effective Innovation Policies for Development.
Cornell University. Geneva, 2015 [accesat 20 februarie 2017]. Disponibil:
https://www.globalinnovationindex.org/userfiles/file/reportpdf/GII-2015-v5.pdf
11. DUTTA, S. et al. The Global Innovation Index 2016: Winning with Global Innovation. Cornell
University. Geneva, 2016 [accesat 20 februarie 2017]. Disponibil:
http://www.wipo.int/edocs/pubdocs/en/wipo_pub_gii_2016.pdf
12. STRATAN, Alexandru, ACULAI, Elena, VINOGRADOVA, Natalia. Assessment of the business
environment in the Republic of Moldova: key trends and determining factors. In: Economie şi
Sociologie = Economy and Sociology. 2015, nr. 1, pp. 19-30.
13. Hotărârea Guvernului cu privire la aprobarea Strategiei de dezvoltare a sectorului întreprinderilor
mici şi mijlocii pentru anii 2012-2020: nr. 685 din 13.09.2012. In: Monitorul Oficial al Republicii
Moldova. 2012, nr. 198-204, art. 740.
14. Hotărârea Guvernului cu privire la aprobarea Strategiei inovaţionale a Republicii Moldova pentru
perioada 2013-2020 „Inovaţii pentru Competitivitate” [accesat 17 februarie 2017]. Disponibil:
http://www.mec.gov.md/sites/default/files/document/proba16.pdf
15. Moldova 2020. Strategia Naţională de Dezvoltare a Republicii Moldova 2012-2020 [accesat 15
februarie 2017]. Disponibil: http://particip.gov.md/public/files/strategia/Moldova_2020_proiect.pdf
16. ŞALAMAC, Mariana. Doing Business 2015: progrese pe hârtie, departe de starea reală a lucrurilor.
2014 [accesat 9 februarie 2017]. Disponibil: http://www.eco.md/index.php/home/rss/item/2472-
doing-business-2015-progrese-pe-h%C3%A2rtie-departe-de-starea-real%C4%83-a-lucrurilor/
17. STRATAN, A., ACULAI, E., VINOGRADOVA, N. Assessment of the business environment in the
Republic of Moldova: key trends and determining factors. In: Economie şi Sociologie = Economy
and Sociology. 2015, nr. 1, pp. 19-30.
18. Doing Business 2015: going beyond efficiency [accesat 15 februarie 2017]. Disponibil:
http://russian.doingbusiness.org/~/media/WBG/DoingBusiness/Documents/Annual-
Reports/English/DB15-Full-Report.pdf
Recommended for publication: 19.04.2017
http://d21a6b425f3bbaf58824-9ec594b5f9dc5376fe36450505ae1164.r12.cf2.rackcdn.com/LPI_Report_2014.pdf

ECONOMIE ŞI SOCIOLOGIE / ECONOMY AND SOCIOLOGY
65
No. 1-2 / 2017
INTERNATIONAL RESERVES MANAGEMENT
IN THE REPUBLIC OF MOLDOVA
Victoria IORDACHI1, PhD, Associate Profesor,
National Institute for Economic Research, Moldova
Mariana Rodica TIRLEA2, PhD,
Dimitrie Cantemir Christian Univeristy, Bucharest, Romania
Tatiana PETROVA3, Researcher,
National Institute for Economic Research, Moldova
The actuality of the given research is determined by the importance of establishing the adequate
volume of international reserves held by the Central Bank. The main purpose of the article is investigation
of new methods of calculating the adequate level of international reserves for emerging economies,
proposed by the IMF and those existing in international practice. The main research methods were
systemic analysis and logic synthesis. The main result obtained in this article, as a result of the research,
is proposing a special approach in applying the IMF methodology in the Republic of Moldova,
considering the dependence of the economy on the export of labor. The conducted calculations show a
significant decrease in the level of international reserves of NBM over the past two years and their
approach to the critical value. To overcome internal imbalances, the international reserves management
should suppose the accumulation of a higher volume than the average, which would partly compensate the
shortcomings in implementing reforms of transforming the economy of the Republic of Moldova,
improving their efficiency and quality of domestic policy.
Keywords: economic growth, reserve assets, central bank, official foreign exchange reserves,
capital adequacy, broad money, short-term debt, International Monetary Fund.
Actualitatea prezentului studiu este determinată de importanţa stabilirii volumului adecvat al
rezervelor internaţionale deţinute de către Banca Centrală. Scopul principal al studiului este investigarea
unor noi metode de estimare a nivelului adecvat al rezervelor internaţionale pentru economiile emergente,
propuse de FMI şi cele existente în practica internaţională. Metodele principale de cercetare au fost
analiza sistemică şi sinteza logică. Rezultatul important, ca urmare a cercetării, este propunerea unei
abordări diferite în Republica Moldova, reieşind din aplicarea metodologiei FMI şi considerându-se
dependenţa economiei naţionale cu privire la exportul forţei de muncă. Calculele efectuate arată o
scădere semnificativă a nivelului rezervelor internaţionale ale BNM în ultimii doi ani şi apropierea
acestora de valoarea critică. Pentru a depăşi dezechilibrele interne, gestionarea rezervelor internaţionale
trebuie să presupună acumularea unui volum mai mare decât media, ceea ce ar compensa parţial
deficienţele în punerea în aplicare a reformelor de transformare a economiei Republicii Moldova,
îmbunătăţirea eficienţei şi a calităţii politicii interne a acestora.
Cuvinte-cheie: creştere economică, active oficiale de rezervă, banca centrală, rezerve valutare,
adecvarea capitalului, masa monetară amplă, datorii pe termen scurt, Fondul Monetar Internaţional.
Актуальность данного исследования связана с важностью определения необходимого
объёма международных резервов Национального Банка. Основная цель статьи – исследование
новых методов расчётов адекватного уровня международных резервов для стран с формируемой
экономикой, предложенных МВФ и существующих в международной практике. Основные методы
исследования: системный анализ и синтез логики. Основные результаты, полученные в статье,
предложен особый подход в применении методики МВФ в Республике Молдова, учитывающий
зависимость экономики от экспорта рабочей силы. Проведенные расчёты показывают
значительное снижение уровня международных резервов БНМ за последние два года и
1 © Victoria IORDACHI, [email protected] 2 © Mariana Rodica ŢÎRLEA, [email protected] 3 © Tatiana PETROVA, [email protected]

Revistă teoretico-ştiinţifică / Theoretical and scientifical journal
66
No. 1-2 / 2017
приближение их к критической величине. Управление международными резервами в целях
преодоления внутренних диспропорций предполагает накопление большего по сравнению со
средними значениями объёма международных резервов, которые могут частично компенсировать
недостатки в проведении реформ по трансформации экономики Республики Молдова, повысить
их эффективность и улучшить качество внутренней политики.
Ключевые слова: экономический рост, официальные резервные активы, центральный банк,
валютные резервы, достаточность капитала, широкая денежная масса, краткосрочный долг,
Международный Валютный Фонд.
JEL Classification: E51, E58.
UDC: 336.711.642(478)
Introduction. Solid reserve management policies are important because they can increase
a country’s resilience to shocks that could result from global financial markets or within the
domestic financial system. The scope followed by central banks is to create appropriate principles of the
country’s official reserve management and implement adequate institutional and operational infrastructure
for optimal reserve management practices. At the same time, within the process of managing international
reserves, central banks often face the problem of determining what their adequate level is. It is important
to review the existent methodologies for calculating the optimum amount of reserves, as well as new
approaches proposed by IMF.
At present, there are multiple indicators that create different criteria which could be used to
determine an adequate level of international reserves a country should hold. Nevertheless, it is important
to consider all limitations and possible problems that a specific methodology implies.
Literature review and empirical evidence. According to IMF (2009), foreign exchange reserves
are foreign currency deposits of central banks or other monetary authorities. These reserves currencies are
used to guarantee central bank’s liabilities, such as the local currency issued, the reserve deposits of various
deposit money banks, government or other financial institutions [4]. The central bank has an exclusive
responsibility of managing the country’s foreign reserves. In the Republic of Moldova this responsibility is
ensured by the Law on National Bank of Moldova, according to which one of the attributions exercised by
the National Bank of Moldova is maintenance and management of the country’s foreign exchange reserves
[13]. Also, according to art. 53 of the above mentioned law, the National Bank maintains the international
reserves at a level which according to its vision is adequate to achieve monetary and exchange rate policy of
the state. If the volume of the international reserves reduces or the National Bank appreciates that there is a
danger of their declining to a level that would jeopardize the execution of foreign exchange policy or
execution of international transactions in time, the National Bank will submit to the Parliament and
Government a report on the international reserves and causes that led or could lead to their reduction.
Approaches relating to the management of foreign reserves vary from country to country and
depend on the objectives fallowed by central monetary authority. According to some economists (Carlos,
Cardon, etc, 2004) in the context of fixed or managed exchange rate regimes, foreign reserves act as a
buffer against capital outflows in excess of the trade balance [3]. Holding foreign reserves within fixed
and floating exchange rate regimes also acts as a “shock absorber” for fluctuations in international
transactions, such as fluctuations in import activities resulting from trade shocks, or in the capital account
due to financial shocks. According to the European Central Bank (2006), the holding of foreign reserves
as self-insurance against currency crisis is important if a currency is overvalued. Lawrence (2006) argued
in his studies that the management of international reserves does not necessarily suppose holding large
amounts: foreign reserves will help in combating inflation or deflation, but large foreign reserves
accumulation serves more for precautionary purposes. At the same time, in his opinion, the precautionary
motives of maintaining foreign reserves are not significant in advanced economies due to the flexible
exchange rate and strong macroeconomic policies [13].
Other economists argued that stockpiling of foreign reserves is critical in this era of open capital
markets as a means of safeguarding against capital account crisis [4]. Thus, Fischer (2001) noted that
reserves are important because they represent the key determinant of a country’s capacity to avoid
economic and financial crisis. The availability of capital flow to offset current account shocks reduce the
amount of reserves a country needs. Also, Fischer pointed that lessons from the financial crisis of the late
1990s and the recent global financial crisis showed that countries with robust foreign reserves, by and
large, did better in withstanding the contagion than those with smaller foreign reserves [8].
ECONOMIE ŞI SOCIOLOGIE / ECONOMY AND SOCIOLOGY
67
No. 1-2 / 2017
A strong study on reserves adequacy and reserve management was written by Pablo Guidotti,
former Argentine deputy minister of finance, in 1997. He suggested that a country’s reserves should equal
its short-term external debt (of one year or less maturity). The rationale was that countries should have
enough reserves to resist a withdrawal of short-term foreign capital and the closure of capital markets for
refinancing [8]. In subsequent researches, the economists Guzman Calafell and Padilla del Bosque found
that the ratio of reserves to external debt is a relevant predictor of an external crisis [12].
In its April 2015 report, the IMF declared that mature market economies are increasing to build
reserves to protect against disorderly markets. The IMF has also stressed a need for a more flexible
assessment of reserves adequacy. Methodology and data. The analyzes are based on IMF Reports on assessing international
reserve adequacy, as well as revised Guidelines for Foreign Exchange Reserve Management and other related reports and work papers of some selected economists.
Regarding the Methodology of research on management of international reserves, the complexity and diversity of the addressed problems have required the use of the following Methods, Techniques, and Procedures tools, as well as interpretation of scientific Investigation:
- Documentation – studying and analyzing reports and working papers elaborated by international financial organizations, as well as economists and researchers;
- Analysis and synthesis, abstraction and concretization, comparison, generalization and systematization;
- Statistical methods, through the use of descriptive statistics and statistical analysis; - Data analysis and interpretation through the use of graphs, charts and figures to highlight
evolution of official foreign reserves in different countries and international reserve adequacy according to indicators.
Own contribution of authors resulted in calculation of reserve adequacy according to new IMF methodology.
Foreign reserve management: strategies, policy objectives and recent trends. Central banks are institutions which are responsible for controlling and management of the country’s international reserves to meet in the best way national objectives and ensure financial stability. In this way, the official foreign exchange reserves are held by central banks to meet the following objectives [16]:
- Helping governments to face foreign exchange needs and external debt obligations;
- Ensuring financial resources in case of emergencies or national disasters;
- Covering domestic currency by external assets;
- Absorbing internal and external disequilibrium;
- Strengthening confidence in monetary policy which is promoted by central bank.
At the same time, the strategies of foreign reserves management should consider policies for
adequate management of the country’s external debt in order to reduce external vulnerability. An
important component of the reserve management strategy is investment policy. While selecting the
optimal policy of reserves’ allocation, a high attention should be paid to the risk of possible disturbing
impact on credit and financial markets and of excessive liquidation or high acquisition costs. The risk of
an impact on markets depends on external market conditions, volume of transactions performed and
speed of the portfolio adjustment [16].
Within the process of the foreign exchange reserves management, it is important to determine the
optimal volume of reserves that will be capable to reduce disequilibrium on internal and external markets.
Foreign reserves in emerging countries together with sound policies and economic determinants, can bring
significant benefits in the Government’s efforts to reduce the probability of balance of payments’ crisis
and maintain economic and financial stability" [11]. At the same time, central banks should be able to
liquidate reserves in a prompt and efficient manner to provide the necessary quantity of foreign exchange
for the implementation of policy objectives, market interventions or limiting external shocks.
According to the international statistics data, over the last decade, all countries have been
increasing their foreign exchange reserves at an impressive rate, especially after the world financial crisis.
Thus, if, in 2004, advanced economies held nearly 20% more reserves in comparison to emerging and
developing economies, by 2013 this relationship changed: thus emerging and developing economies were
controlling more than double of the reserves of the advanced economies (7,9 trillion US$ to 3,8 trillion
US$). During the Great Recession of 2007-2009 the global reserves dropped from 7,5 trillion US$
in mid-2008 to just under 7 trillion US$ in February 2009, due to the fact that countries tried to manage
currency depreciation and used reserves to finance the Government’ stimulus packages. By the end of the

Revistă teoretico-ştiinţifică / Theoretical and scientifical journal
68
No. 1-2 / 2017
first quarter of 2009, the foreign reserves started to increase. Thus, the total volume of foreign exchange
reserves in the first quarter of 2015 was 11,433 trillion US$ (although decreasing from $11,589 trillion in
the fourth quarter of 2014).
According to some estimations during the periods of the exchange market pressures, emerging
countries with higher reserve holdings were more able to maintain stable consumption growth (relative to
the pre-event trend) than those with lower reserve funds. These economies were also more able to expand
fiscal policy to help offset the effects of the crisis, whereas low levels of reserves were associated with
pro-cyclical fiscal contraction. In both cases the effects were more apparent in moving from low to
moderate levels of reserves than in moving from moderate to high levels [1, 2]. In these countries the
foreign exchange reserves are massively used to diminish macroeconomic and financial risks and prevent
development of crisis scenario. During the last years characterized by increase of financial and
macroeconomic vulnerabilities the foreign exchange reserves decreased in low income countries like
Romania, Belorussia, Ukraine, as well as Moldova (table 1)1.
Table 1
Official foreign exchange reserves in some
low and middle income countries, in million US dollars (2013-2015) Years Bulgaria Romania Azerbaidjan Belorussia Armenia Georgia Ukraine Moldova
2015 20783,3 35166,7 - 2743,6 1771,2 2520,7 12368,1 1740,4
2014 20129,7 43186,3 15816,4 5067,7 1489,4 2699,2 7538,8 2156,7
2013 19883,3 48827,6 15175,7 6655,1 2251,6 2823,4 20413,6 2820,6
Source: http://data.worldbank.org
In comparison to other emerging markets, in the Republic of Moldova the volume of accumulated
reserves of the National Bank of Moldova in 2015 was much lower, reaching 1740,4 million US$,
compared to Georgia, for example, where the volume of reserves registered 2520,7 million US$.
Estimation of international reserves adequacy of the Republic of Moldova according to
traditional indicators. In the Republic of Moldova, in the context of the financial and banking crisis, a
decline in economic growth, an increase in inflation, speculation in the foreign exchange market, and
insufficient financial supervision, the problem of international reserve adequate management and use
becomes of crucial importance.
Figure 1. Level of official foreign exchange reserves related to GDP in selected countries,
in 2014, in %
Source: Compiled by authors according to the data from http://data.worldbank.org
1 As of 1st July 2014, low income countries are those where GNI per capita (calculated by the method of the
World Bank Atlas) in 2013 was no more than 1045 US$. Within this category the following countries are
included: Armenia, Georgia, Ukraine, Moldova, Uzbekistan. The group of middle-income countries supposes the
GNI per capita higher than 1045 US$, but less than 12746 US$. Countries with high income register the value
of 12746 US$.
Within the group of middle-income countries two segments are emphasized: countries with lower middle income
(GNI per capita ranges from 1046 to 4125 USD), and those with incomes above the average (from 4125 to 12746 US
dollars) – Bulgaria, Belarus, Azerbaijan, Romania.
44,13
18,05
7,64
13,80
26,75
16,86
21,75
14,68
0
10
20
30
40
50
Bulgaria Georgia Belarus Azerbaijan Moldova Armenia Romania Ukraine
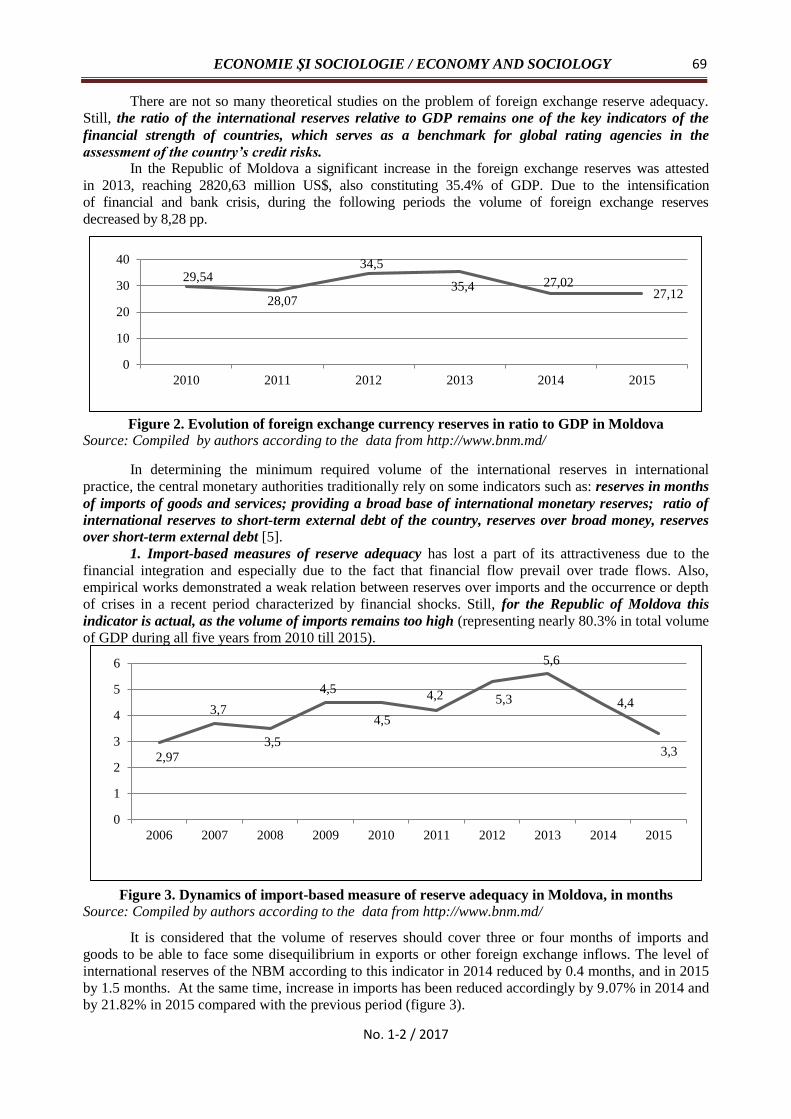
ECONOMIE ŞI SOCIOLOGIE / ECONOMY AND SOCIOLOGY
69
No. 1-2 / 2017
There are not so many theoretical studies on the problem of foreign exchange reserve adequacy.
Still, the ratio of the international reserves relative to GDP remains one of the key indicators of the
financial strength of countries, which serves as a benchmark for global rating agencies in the
assessment of the country’s credit risks. In the Republic of Moldova a significant increase in the foreign exchange reserves was attested
in 2013, reaching 2820,63 million US$, also constituting 35.4% of GDP. Due to the intensification
of financial and bank crisis, during the following periods the volume of foreign exchange reserves
decreased by 8,28 pp.
Figure 2. Evolution of foreign exchange currency reserves in ratio to GDP in Moldova
Source: Compiled by authors according to the data from http://www.bnm.md/
In determining the minimum required volume of the international reserves in international
practice, the central monetary authorities traditionally rely on some indicators such as: reserves in months
of imports of goods and services; providing a broad base of international monetary reserves; ratio of
international reserves to short-term external debt of the country, reserves over broad money, reserves
over short-term external debt [5].
1. Import-based measures of reserve adequacy has lost a part of its attractiveness due to the
financial integration and especially due to the fact that financial flow prevail over trade flows. Also,
empirical works demonstrated a weak relation between reserves over imports and the occurrence or depth
of crises in a recent period characterized by financial shocks. Still, for the Republic of Moldova this
indicator is actual, as the volume of imports remains too high (representing nearly 80.3% in total volume
of GDP during all five years from 2010 till 2015).
Figure 3. Dynamics of import-based measure of reserve adequacy in Moldova, in months
Source: Compiled by authors according to the data from http://www.bnm.md/
It is considered that the volume of reserves should cover three or four months of imports and
goods to be able to face some disequilibrium in exports or other foreign exchange inflows. The level of
international reserves of the NBM according to this indicator in 2014 reduced by 0.4 months, and in 2015
by 1.5 months. At the same time, increase in imports has been reduced accordingly by 9.07% in 2014 and
by 21.82% in 2015 compared with the previous period (figure 3).
29,54
28,07
34,5
35,4 27,0227,12
0
10
20
30
40
2010 2011 2012 2013 2014 2015
2,97
3,7
3,5
4,5
4,5
4,2 5,3
5,6
4,4
3,3
0
1
2
3
4
5
6
2006 2007 2008 2009 2010 2011 2012 2013 2014 2015

Revistă teoretico-ştiinţifică / Theoretical and scientifical journal
70
No. 1-2 / 2017
2. Reserve to monetary base ratio is one of the most conventional measures of estimating the
country’s capital flight exposure. Still, empirical studies suggest that it indicates a potential capital flight,
but say nothing about its probability.
Figure 4. Dynamics of ratio of NBM official international
reserves to broad money (M3), in %
Source: Compiled by authors according to the data from http://www.bnm.md/
The recommended coverage value for countries with regulated floating exchange rate is 10-20%
of the broad money (M2 or M3). In 2015, the level of the NBM international reserves estimation
according to this criterion after the decline in 2013-2014 remained almost at the level of 2014, which
significantly exceeds the threshold level of 20% of the broad money supply and registered 51.16%.
3. Short-term debt (STD) is considered an indicator of the crisis risk and is assessed as ratio of the
volume of international currency reserved to short term debt – the so called “Greenspan-Guidotty” rule.
If the country’s currency reserves cover 100% of the short term external debt and the forecasted deficit of
the current account of the balance payment for one year, their level is considered sufficient for preventing
a currency crisis. If this level is lower than 100%, a probability appears that the government or country’s
residents will have difficulties or delays in realizing payments on external debt.
Figure 5. Dynamics of ratio of NBM official international
reserves to short-term debt, in %
Source: www.bnm.md/ro/content/datoria-externa-2015-date provizorii
According to figure 5, the level of the international reserves of NBM is below the minimum value
of the "empirical rule", which should be not less than 100%, This indicates a high vulnerability of the
Republic of Moldova to "external pressure", as our country is not able to avoid new borrowings. In 2014,
the level of evaluation according to this criterion fell by 30.46 p.p., and in 2015 by another 14,3 p.p.
amounting to 74.08%.
52,19
59,1954,85
50,33
57,33
56,29
61,5256,70
46,22
51,16
0
10
20
30
40
50
60
70
2006 2007 2008 2009 2010 2011 2012 2013 2014 2015
86,59
114,23119,62
105,49
113,14
107,52
129,15118,92
88,4674,08
0
20
40
60
80
100
120
140
2006 2007 2008 2009 2010 2011 2012 2013 2014 2015

ECONOMIE ŞI SOCIOLOGIE / ECONOMY AND SOCIOLOGY
71
No. 1-2 / 2017
Still, experience of several countries raises questions on both the relevance of STD as an exclusive
indicator of reserves held, and of 100 percent as the threshold level. In recent IMF studies on the adequacy
of international reserves, specific examples show that traditional indicators are often poorly adapted to
specific circumstances in different countries and can give conflicting results on the adequacy of reserves
in a crisis situation [2].
Criteria for the sufficiency of international reserves should take into account all sources
of risks faced by emerging market countries. In such countries, external shocks can affect the
performance of both the financial account and the current balance of payments account. In addition, there
is instability of demand for the national currency and its sharp fluctuations under the influence of negative
expectations of market participants.
Assessing international reserve adequacy in the Republic of Moldova according to new IMF
methodology
In 2011 IMF experts have developed new indicators for assessing the adequacy of reserves, which
complement the traditional thresholds. The new framework classifies countries based on the degree of
access to markets, depth and liquidity of their markets and flexibility of their economies. Based on the
relevant characteristics and external risks, countries were divided into three groups (mature markets,
emerging financial markets, and emerging economies which are limited in access to the capital market).
For emerging markets with limited access to the capital market, various methods were used to
assess the adequacy of the level of reserves:
- mathematical models based on the actual data on outflow of capital or on the reduction of
incomes during crisis periods in different low- and middle-income countries to determine the relative level
of risks of potential sources of instability on the part of the balance of payments;
- expert assessments of the level of requirements for international reserves to cover certain sources
of risks.
The IMF methodology is based on the sources of problems that occur on the foreign exchange
market:
1) The decrease in the receipt of currency due to the decrease in export earnings (EX);
2) Growth in demand for currency due to repayment of external debt (STD – short-term, LTD –
long-term debt);
3) The growth in demand for currency due to the desire of the population and organizations to
maintain the purchasing power of savings.
The IMF experts propose to estimate the minimum allowable level of international reserves in
the fixed exchange rate regime using the following formula:
Capital Adequacy
of gold and foreign
currency reserves
in the fixed exchange
rate regime
=
30% of
short-term
external debt
+
15% of foreign
portfolio
investments
+
10% of
broad money
М2(М3)
+
10% of
exports of
goods and
services
Within a regulated floating exchange rate, the monetary authority is not responsible for
retaining the pre-set exchange rate values, so it can afford to have lower amounts of gold and foreign
exchange reserves.
Capital Adequacy of
gold and foreign
currency reserves in
the regulated floating
exchange rate regime
=
30% of short-
term external
debt
+
10% of
foreign
portfolio
investments
+
5% of broad
money
М2(М3)
+
5% of
exports of
goods and
services
The IMF methodology takes into account specific sources of risks, which in crisis conditions turn
into channels for withdrawing international reserves. In emerging markets, for precautionary purposes of
smoothing negative trends during stressful events, the threshold levels of international reserve adequacy
can be increased from 100 to 150 percent of the estimated reserve adequacy. Within these limits,
the international reserves are recognized by the IMF as "broadly adequate" [1]. The calculation
of the threshold levels of the adequacy of the international reserves should be adjusted for the specific

Revistă teoretico-ştiinţifică / Theoretical and scientifical journal
72
No. 1-2 / 2017
features of the economic development of each particular country.
A special approach in the implementation of the methodology in the Republic of Moldova will be
consistent with the conclusions justified by the IMF:
- The weight of exports, should be much higher in case if exports rely on special goods.
- The level of demand for reserves in terms of dollarization of the economy or their demand for
foreign currency may differ from other countries.
- A country which is dependent on remittances can supplement the proposed assessment with
weight conditions for this source of risk [1].
The Republic of Moldova, being the poorest country in Europe with an emerging market, an
economy based on exports of commodities and labor, and as a country with low credit ratings, has
limited access to international capital markets. In these conditions, for effective management and
overcoming of internal imbalances, the NBM should accumulate a larger amount of international
reserves in comparison with the average values.
Calculation of an adequate level of international reserves of the NBM should be supplemented
with data on the export of labor. The level of remuneration of workers of residents and personal transfers
to the Republic of Moldova registered 26.2% of GDP in 2014 and 23.7% in 2015. At the same time,
according to the World Bank, official transfers of migrants constitute only 29% of real money transfers.
To calculate the adequate level of the international reserves, it is necessary to take into account this
circumstance and the fact that the volumes of income from the export of labor as well as the revenues
from the export of goods and services reflect the potential losses of international reserves.
Figure 6. Threshold level of sufficiency of official international reserves of NBM1
Source: Compiled by authors according to the data from http://www.bnm.md/, calculations made by
authors.
The figures calculated according to data from the national statistics show that the official gold and
currency reserves of the NBM approach the threshold level.
Alongside the falling indicators of GDP growth rates and investments in fixed assets, an even
more important criterion for estimating the level of international reserves for the Republic of Moldova is
associated with the growth of foreign trade debt. In countries with emerging economies, the country's total
external obligations represent the best indicator for assessing the risks associated with the instability of the
financial account of the balance of payments. Therefore, in some studies, it is suggested as a key indicator
in the analysis of external vulnerability – the use of the ratio of international reserves to the total
1In this calculation, the income from the export of labor is represented by such indicators of the balance of payments
as "wages" and "remittances of workers"
0
500
1000
1500
2000
2500
3000
2006 2007 2008 2009 2010 2011 2012 2013 2014 2015
actual level of
international
reserves
150% of the
estimated adequate
level of
international
reserves, taking
into account the
export of labor
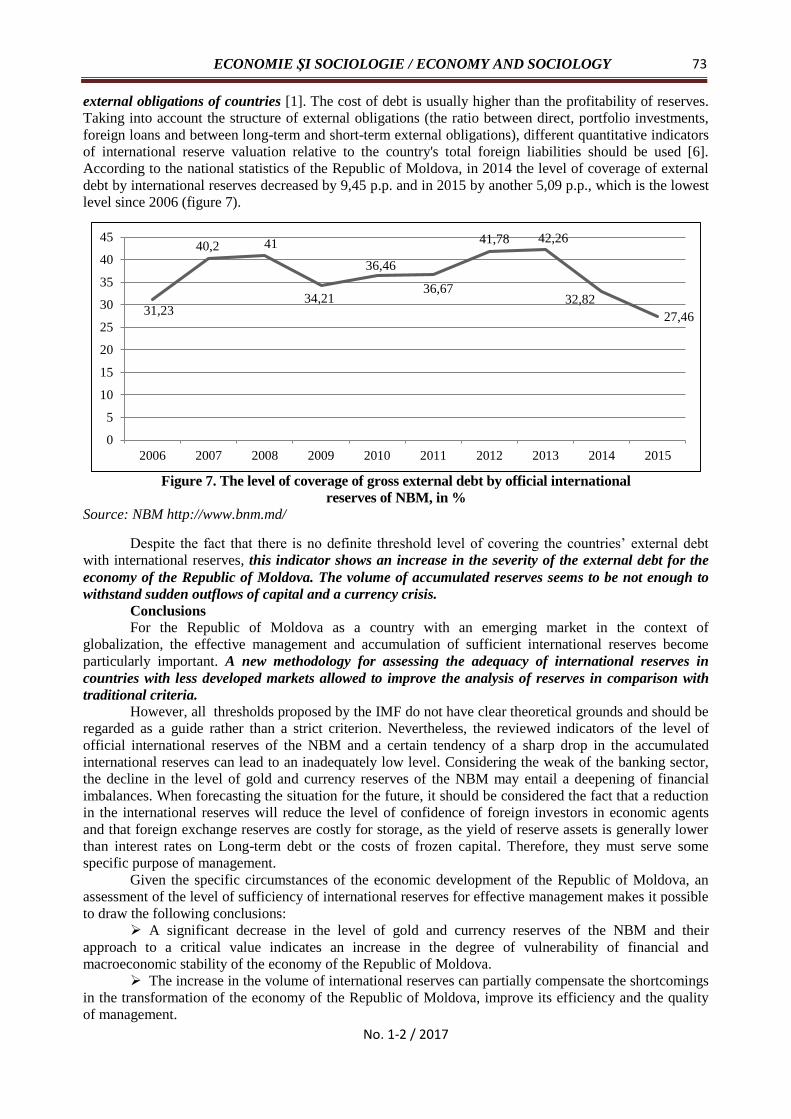
ECONOMIE ŞI SOCIOLOGIE / ECONOMY AND SOCIOLOGY
73
No. 1-2 / 2017
external obligations of countries [1]. The cost of debt is usually higher than the profitability of reserves.
Taking into account the structure of external obligations (the ratio between direct, portfolio investments,
foreign loans and between long-term and short-term external obligations), different quantitative indicators
of international reserve valuation relative to the country's total foreign liabilities should be used [6].
According to the national statistics of the Republic of Moldova, in 2014 the level of coverage of external
debt by international reserves decreased by 9,45 p.p. and in 2015 by another 5,09 p.p., which is the lowest
level since 2006 (figure 7).
Figure 7. The level of coverage of gross external debt by official international
reserves of NBM, in %
Source: NBM http://www.bnm.md/
Despite the fact that there is no definite threshold level of covering the countries’ external debt
with international reserves, this indicator shows an increase in the severity of the external debt for the
economy of the Republic of Moldova. The volume of accumulated reserves seems to be not enough to
withstand sudden outflows of capital and a currency crisis.
Conclusions
For the Republic of Moldova as a country with an emerging market in the context of
globalization, the effective management and accumulation of sufficient international reserves become
particularly important. A new methodology for assessing the adequacy of international reserves in
countries with less developed markets allowed to improve the analysis of reserves in comparison with
traditional criteria. However, all thresholds proposed by the IMF do not have clear theoretical grounds and should be
regarded as a guide rather than a strict criterion. Nevertheless, the reviewed indicators of the level of
official international reserves of the NBM and a certain tendency of a sharp drop in the accumulated
international reserves can lead to an inadequately low level. Considering the weak of the banking sector,
the decline in the level of gold and currency reserves of the NBM may entail a deepening of financial
imbalances. When forecasting the situation for the future, it should be considered the fact that a reduction
in the international reserves will reduce the level of confidence of foreign investors in economic agents
and that foreign exchange reserves are costly for storage, as the yield of reserve assets is generally lower
than interest rates on Long-term debt or the costs of frozen capital. Therefore, they must serve some
specific purpose of management.
Given the specific circumstances of the economic development of the Republic of Moldova, an
assessment of the level of sufficiency of international reserves for effective management makes it possible
to draw the following conclusions:
A significant decrease in the level of gold and currency reserves of the NBM and their
approach to a critical value indicates an increase in the degree of vulnerability of financial and
macroeconomic stability of the economy of the Republic of Moldova.
The increase in the volume of international reserves can partially compensate the shortcomings
in the transformation of the economy of the Republic of Moldova, improve its efficiency and the quality
of management.
31,23
40,2 41
34,21
36,46
36,67
41,78 42,26
32,82
27,46
0
5
10
15
20
25
30
35
40
45
2006 2007 2008 2009 2010 2011 2012 2013 2014 2015

Revistă teoretico-ştiinţifică / Theoretical and scientifical journal
74
No. 1-2 / 2017
REFERENCES
1. Assessing Reserve Adequacy. Prepared by Monetary and Capital Markets, Research, and Strategy,
Policy, and Review Departments. 2011, february 14 [accesat 17 februarie 2017]. Disponibil:
http://www.imf.org/external/np/pp/eng/2011/021411b.pdf
2. Assessing Reserve Adequacy – Specific Proposals. 2015, april [accesat 21 ianuarie 2017]. Disponibil:
http://www.imf.org/external/np/pp/eng/2014/121914.pdf
3. BERNADELL, C. et al. Risk management for central bank foreign reserves. 2004, may [accesat 17
februarie 2017]. Disponibil:
https://www.ecb.europa.eu/pub/pdf/other/riskmanagecbreserves2004en.pdf
4. CLICHICI, D. Rethinking the institutional framework for financial stability in the Republic of
Moldova. In: Journal of Financial and Monetary Economics. Bucharest, 2015, vol 2, issue 1, pp. 59-
66 [accesat 10 februarie 2017]. Disponibil: ftp://www.ipe.ro/RePEc/vls/vls_pdf_jfme/vol2i1p59-
66.pdf
5. IREFIN, David, YAABA, Baba N. Determinants of foreign reserves in Nigeria: An autoregressive
distributed lag approach. In: CBN Journal of Applied Statistics. 2011, vol. 2, no. 2 [accesat 17
februarie 2017]. Disponibil:
https://www.cbn.gov.ng/out/2012/ccd/cbn%20jas%20vol%202%20no%202_article%20five.pdf
6. Public information notice: Debt- and Reserve-Related Indicators of External Vulnerability.
International Monetary Fund. 2000 [accesat 17 februarie 2017]. Disponibil:
http://www.imf.org/external/np/sec/pn/2000/pn0037.htm
7. Debt- and Reserve-Related Indicators of External Vulnerability. International Monetary Fund. 2000
[accesat 17 februarie 2017]. Disponibil: https://www.imf.org/external/np/pdr/debtres/
8. FISCHER, S. IMF/World Bank International Reserves: Policy Issues Forum. Opening Remarks.
2001, april [accesat 21 ianuarie 2017]. Disponibil:
www.imf.org/external/np/speeches/2001/042801.htm
9. SMITH, Gary, NUGEE, John. The changing role of central bank foreign exchange reserves. 2015,
september [accesat 26 februarie 2017]. Disponibil: https://www.omfif.org/media/1122865/jn-gs-
report-master.pdf
10. Guidelines for Foreign Exchange Reserve Management. 2001, september [accesat 21 februarie 2017].
Disponibil: https://www.imf.org/external/np/mae/ferm/eng/
11. Tackling Challenges Together: IMF anual reроrt 2015 [accesat 17 ianuarie 2017]. Disponibil:
https://www.imf.org/external/pubs/ft/ar/2015/eng/pdf/ar15_eng.pdf
12. CALAFELL, J.G., PADILLA DEL BOSQUE, R. The ratio of international reserves to short-term
external debt as an indicator of external vulnerability: some lessons from the experience of Mexico
and other emerging economies [accesat 10 februarie 2017]. Disponibil: https://g24.org/wp-
content/uploads/2016/01/Session-1_5.pdf
13. SUMMERS, Lawrence H. Reflections on Global Account imbalances and Emerging Markets
Reserves Accumulation. 2006, march [accesat 6 februarie 2017]. Disponibil:
http://www.harvard.edu/president/speeches/summers_2006/0324_rbi.php
14. Legea cu privire la Banca Naţională a Moldovei: nr. 548-XIII din 21.07.1995. In: Monitorul Oficial
al Republicii Moldova. 1995, nr. 56-57, art. 624.
15. TIPA, Pavel. Foreign exchange risk management in the Republic of Moldova in conditions of
currency crisis. In: Economie şi Sociologie = Economy and Sociology. 2016, nr. 3, pp. 88-93.
16. Revised Guidelines for Foreign Exchange Reserve Management. 2014 [accesat 11 februarie 2017].
Disponibil: http://www.imf.org/external/np/mae/ferm/2014/revgudferm14.pdf
Recommended for publication: 21.04.2017

ECONOMIE ŞI SOCIOLOGIE / ECONOMY AND SOCIOLOGY
75
No. 1-2 / 2017
INVESTMENT PROCESS AND ACTUAL TEHNICAL PROVIDING
OF MOLDAVIAN AGRICULTURE
Tudor BAJURA1, PhD, Professor,
National Institute for Economic Research, Moldova
The investment process in rural areas of Moldova, especially – in agricultural sector of the national
economy, in last decades is under considerable strain caused by permanent lack of financial resources on
agribusinesses enterprises and almost symbolic financial aid from the state. As a result, large parts of
agricultural land remain unprocessed years in a row, which is why both farmers and entirely national
economy suffer essential economic losses. Given the fact that the possibilities of state financial assistance in
the agricultural sector in our country are limited, in this article we propose alternative ways to overcome the
crisis, argued from the ecological point of view and acceptable from economic considerations of villagers.
The purpose of the study is to identify obstacles on the way of carrying out the investment process in rural
areas of the country, establishing ways to overcome the deep and long lasting crisis both in the investment
activity and efficiency of the agro-industrial sector of the Republic of Moldova entirely. As a basic source of
information for the article there were used different information collections of "General Agricultural Census
2011 in Moldova". As a basis of the research methods there were used analysis and synthesis, comparison,
trend identification methods, dynamic lines and their analysis, etc. According to the established goal, the
main results of the carried out investigations are expected as rational and efficient use of tens of thousands
of hectares of agricultural land which, beginning from the first stage of reforming of the agricultural sector
and ending with today, remain outside of the application process, simultaneously being removed from their
market circuit and converted into fallow areas.
Keywords: investments, farmland, market circuit, alternative energy sources, agricultural
machinery, forestry crops, orchards of nuts etc.
Procesul investiţional în spaţiul rural al Republicii Moldova, în special în sectorul agrar al
economiei naţionale, în ultimele decenii este supus unor presiuni considerabile, cauzate de lipsa permanentă
a surselor financiare în conturile întreprinderilor agricole şi ajutorul financiar, aproape simbolic, din
partea statului. Drept consecinţă, o bună parte a terenurilor agricole, ani la rând, rămân neprelucrate
(pârlogite), din care cauză atât producătorii agricoli, cât şi economia naţională în întregime suferă de
pierderi economice esenţiale. Reieşind din faptul că posibilităţile statului de asistenţa financiară privind
sectorul agrar sunt limitate, în prezentul articol sunt propuse variante alternative de depăşire a situaţiei de
criză, argumentate din punctul de vedere ecologic şi acceptabile din considerentele economice ale
locuitorilor satelor. Scopul cercetării îl constituie identificarea piedicilor pe calea desfăşurării procesului
investiţional în spaţiul rural al ţării, stabilind căile de depăşire a situaţiei de criză profundă şi de lungă
durată atât în ceea ce priveşte activitatea investiţională, cât şi sporirea nivelului de eficienţă a ramurii agro-
industriale a Republicii Moldova în întregime. În calitate de sursă informaţională de bază au fost folosite
diferite culegeri informaţionale ale „Recensământului General Agricol 2011 în Republica Moldova”. Drept
metode de bază ale cercetărilor efectuate au servit: analiza şi sinteza, metoda comparaţiei, metodele
identificării trendurilor, dinamicii și analiza acestora etc. Conform scopului stabilit, rezultatele principale
ale investigaţiilor efectuate sunt aşteptate sub forma utilizării raţionale şi eficiente a suprafeţelor agricole în
mărime de zeci de mii de hectare, care, începând cu prima etapă a reformării sectorului agrar şi terminând
cu ziua de astăzi, rămân în afară procesului de utilizare, concomitent fiind eliminate din circuitul lor de
piaţă şi transformate în suprafeţe de pârloagă.
Cuvinte-cheie: investiţii, terenuri agricole, circuit de piaţă, surse energetice alternative, tehnică
agricolă, culturi silvice, livezi nucifere etc.
Инвестиционный процесс в сельской местности Республики Молдова, и в первую очередь,
в аграрном секторе национальной экономики, в последние десятилетия сталкивается с большими
1 ©Tudor BAJURA, [email protected]
Revistă teoretico-ştiinţifică / Theoretical and scientifical journal
76
No. 1-2 / 2017
трудностями, вызванными постоянной нехваткой финансовых средств на счетах
сельхозпредприятий и почти символической финансовой помощью со стороны государства. В
результате, значительная часть сельскохозяйственных угодий остаётся из года в год
необработанной, в связи с чем как фермеры, так и национальная экономика в целом, несут
существенные экономические потери. Учитывая тот факт, что возможности государственной
финансовой помощи сельскохозяйственному сектору ограничены, в настоящей статье
предлагаются альтернативные варианты для преодоления кризисной ситуации, обоснованные с
экологической точки зрения и экономически приемлемые для сельских жителей. Цель исследования
состоит в выявлении препятствий на пути осуществления инвестиционного процесса в сельских
районах страны, установлении путей преодоления глубокого и продолжительного кризиса, как в
отношении инвестиционной деятельности, так и относительно повышения эффективности
агропромышленного сектора Республики Молдова в целом. В качестве основного источника
информации использовались различные данные из серии публикаций "Общая сельскохозяйственная
перепись 2011 года в Республике Молдова". В качестве основных методов были использованы
методы анализа и синтеза, сравнения, методы выявления тенденций динамических рядов и их
анализа, а также другие методы экономических исследований. Основным результатом проведенных
исследований должно стать рациональное и эффективное использование земельных участков
сельскохозяйственного назначения площадью в десятки тысяч гектаров, которые, начиная с
первого этапа реформирования аграрного сектора и заканчивая сегодняшним днем, остаются не
использованными, исключены из рыночного оборота и превратились в запущенные заросли сорняков
и кустарников.
Ключевые слова: инвестиции, земли сельскохозяйственного назначения; рыночный оборот;
альтернативные источники энергии, сельскохозяйственная техника, лесные культуры, ореховые
сады и т.д.
JEL Classification: E2, O13, Q13, Q14, Q15, Q16, R14, Q42.
UDC: 338.434(478)
Introduction. As the result of the mass privatization of agricultural lands, finalized in mid-2000, a
new tendency has emerged in the agrarian sector of the Republic of Moldova, which is poorly analyzed by
the local economists and public authorities. It is envisaged by the drastic decrease of the number of the
workers, occupied in agriculture, but also in other agrarian fields such as fishing, forestry, hunting etc.
Statistical data shows that in the post-privatization period the number of persons, employed in the
agrarian sector, decreased from 766 thousand persons (2000) to 381 thousand persons (2016) or by 50.3%.
At the same time there was a radical division of agricultural workers into two large groups: the first group
– land ownership, respectively – the ownerships of agricultural business; the second group – employed
workers (workers in labor, employees). It should be emphasized, that the second group of agricultural
workers suffered the most during the post-privatization years, currently accounting for approximately
50.0 thousand persons or one employed worker on a land area of 42.2 ha farm.
Obviously, such a big shrinking of agrarian workers should be replaced by new agricultural
techniques, involving modern plant cultivation technologies (animal care) etc., by attracting massive
investment to replace the live labor of permanently shrinking agricultural workers.
Equally necessary is the state contribution under the form of increasing agricultural subsidies,
specifically for investment purposes, in order to increase the productivity of farmers' work, the number of
which diminishes with the passing of the day, giving the fact, that the necessity in the food products,
conversely, is increasing or, as the case may be, remains at the same level. Hence, that is the actuality of
the topic addressed, the profound analysis and the appropriate assessment which will allow the
elaboration of the reasoned recommendations regarding the technical and technological insurance of the
agricultural activity, based on the private property on the means of production.
The degree of scientific approach to the topic. The investment activity in rural area and
especially in the agro-food economic branches is an important object of the scientific researches both in
the Republic of Moldova and abroad. Along with the quantitative aspects of this activity there are studied
the main directions of investments, sources of money origin, state participation in the investment activity
of agrarian operators etc. The detailed analysis of the bibliographic sources regarding the dimensions and
forms of materialization of investments in the agrarian sector demonstrates both the wide diversification of
the directions and forms of implementation of the investments as well as the active participation of the

ECONOMIE ŞI SOCIOLOGIE / ECONOMY AND SOCIOLOGY
77
No. 1-2 / 2017
state bodies in the development of the investment activity.
The lack of own investment sources, for example, so specific for agricultural enterprises in the
Republic of Moldova, is equally specific for other countries with the comparable level of economic
development. The real possibilities for making investments from own sources of agricultural enterprises
are estimated at 1/3 of their total volume in several European countries, including in the Republic of
Moldova [1].
According to the data of the National Bureau of Statistics as a consequence of the lack of own
money sources and the extremely low subsidy level of the agricultural branches from the state, the total
debt of the economic agents in agriculture, forestry and fishing on 01.01.2016 reached 13,9 bln. lei MD,
which far exceeds the market value of all agrarian assets [2, p. 334]. From the total number of agricultural
enterprises, which presented the statistical reports for the year 2015 (3168 units), 1457 or 46.0%
completed the year with losses [2, p. 332]. Namely because of the deplorable financial situation of the agrarian sector, as other authors
point out "... this branch is increasingly unattractive for the population due to the low level of employees in agriculture. Thus, in 2014, according to the region of residence, it is found that the average monthly salary of an employee in agriculture accounts for about 65% of the average monthly salary in economy” [3].
So, the negative consequences of poverty are felt in both the living force and the materialized force, both of them have been the main factors of functioning of the indigenous agricultural sector.
The results obtained. According to the situation at the beginning of 2015, the contribution of the agricultural sector (agriculture, forestry, fishing and hunting) to the gross domestic product of the Republic of Moldova achieved the level of 13.1%. It has to be mentioned that an approximately equal share of agricultural sector in the country's GDP last time was manifested almost 10 years ago – in 2006. It was the last year before the economic and financial crisis of 2007-2008 began.
Taking into consideration that in 2008-2009 (the years of the beginning of the above mentioned crisis) the share of agriculture in national GDP was reduced to 8.8 and even 8.5 percent correspondingly, we can appreciate the results of 2014 as a great achievement for agrarians.
The net value of agricultural production this year reached 27.3 billion lei, of which the crop sector amounted to – 17,3 bln. lei and livestock sector – 9.4 bln. lei. It is also to be noted, that there was a considerable increase in investment in long-term tangible assets of the agricultural sector. Their record figure for 2014 – 2.3 billion lei or 26.0 percent more compared to the previous year, has installed confidence and optimism in the future of the agricultural branch of national economy.
However, due to the adverse weather conditions, as well as difficult economic, political, demographic etc., considerations, the next year, namely – 2015 acted as a year of considerable reduction of both the volume of gross product and the volume of investment in the agricultural sector, which was reduced this year by more than 530 mil. lei or 22.8 percent over the previous year. It has to be noted, that the share of investment in long-term farm assets was virtually permanently lower than the weight of this area of economic activity in the total GDP of the country.
As a result, there is a constant process of decrease of intensification of the agricultural sector, which constitutes the main labor creator in rural area.
As a general assessments, but less optimistic, we have to mention, that in recent years virtually every second of the agricultural enterprises, from those submitted financial reports, have shown a lack of profits and, respectively, generating essential losses.
As it was already mentioned, the total debt on 01.01.2015 of the agrarian sector has increased to 11.6 billion lei, while on 01.01.2016 – was up to 13.9 billion lei, which is almost 100 percent in comparison to the gross value added of this sector for that year (2015).
From another perspective, the average investment, calculated per hectare of the agricultural land is not so high as only 1025 lei / ha in 2014 and only 788.9 lei / ha in 2015 [2].
The final results of the General Agricultural Census (GAC) published recently, have established
that the total number of tractors, which are the main source of energy in the agricultural sector, based on
the date of the GAC (March, 2011) constituted only 24 695 units (without districts on the left bank of river
Dniester and Bender city) [4].
Remembering, that at the beginning of the 90th of the previous century, the Moldovan agriculture
had more than 51100 tractors, that is 2.07 times more than over two decades after (table 1).

Revistă teoretico-ştiinţifică / Theoretical and scientifical journal
78
No. 1-2 / 2017
Table 1
Agricultural machines and equipment existing under property
as on March 1, 2011 and utilized in agricultural sector
Types of agricultural machines and
equipment
Utilized property
machines and
equipment in
agricultural sector
Machines and equipment existing
under property as on 1 March 2011
total
of which:
aged 10 years
and over
share of total,
%
Tractors of all types, of which - Crawler - Wheeled
23381 2004
21377
24695 2392 22303
19092 2120
16972
77 89 76
Mini-tractors 965 1090 449 41
Trucks 6260 7604 6788 89
Combines and harvesters of all types 2854 3000 1997 67
Seeders and planters 8915 8431 5436 65
Mechanical cultivators 12154 12045 8198 68
Plows for tractors 13882 13782 9736 71
Machinery and equipment for irrigation
712 773 266 34
Milking machines and aggregates 164 191 69 36
Machinery for sprayer and application of treatments
2445 2627 1374 52
Other agricultural machinery and equipments
8497 9382 6214 66
Source: "Thematic study on equipping farms of Moldova with agricultural construction, technical means
and equipment", National Bureau of Statistics of the Republic of Moldova, GAC, 2011, p. 81.
As experts from the National Bureau of Statistics of the Republic of Moldova have noted,
a major share of the existing agricultural machinery is the equipment with a history of 10 years and older.
But really a major problem for indigenous modern agriculture is that rather limited amount of the
agricultural and technological machinery serves as the technical basis for an extremely large number of
agricultural farms. Also, based on data of GAC in 2011 we have found out that the number of those
holdings at the time of the census was 902 214 units of which 3446 units – corporative farms (legal
entities) and 898 768 units – unincorporated farms (so called – household farms).
Obviously, agricultural holdings with legal entity are now major producers of commodity
production that means – production for the sale to the market, irrespective of whether it is considered
internal or external market.
The average area of a farm with a legal personality is 369.3 ha, while its organizational forms and
physical dimensions (absolute and/or weighted average) are shown in the table 2 (figure 1).
Table 2
Farms with legal personality in Moldovan agriculture
Type units Total units
(number)
Surface (area),
ha
including agricultural
temporary non-utilized area
Total on average at
one enterprise
surface,
ha
average weight, %
(share of total)
1. Agricultural cooperatives 204 148737,1 729,1 9,87 0.01
2. Joint stock companies 158 52788,2 334,1 1763,93 3.34
3. Limited liability companies 1986 694868,67 349,9 9250,46 1.35
4. State enterprises 89 18430,04 207,1 1250,2 6.78
5. Other type of holdings 1009 357841,99 354,7 1229,31 0.34
Total agricultural holdings
with juridical status 3446 1272666,01 369,3 13503,77 1.061
Source: General Agricultural Census, National Bureau of Statistics of the Republic of Moldova, vol.1,
p.44-45.
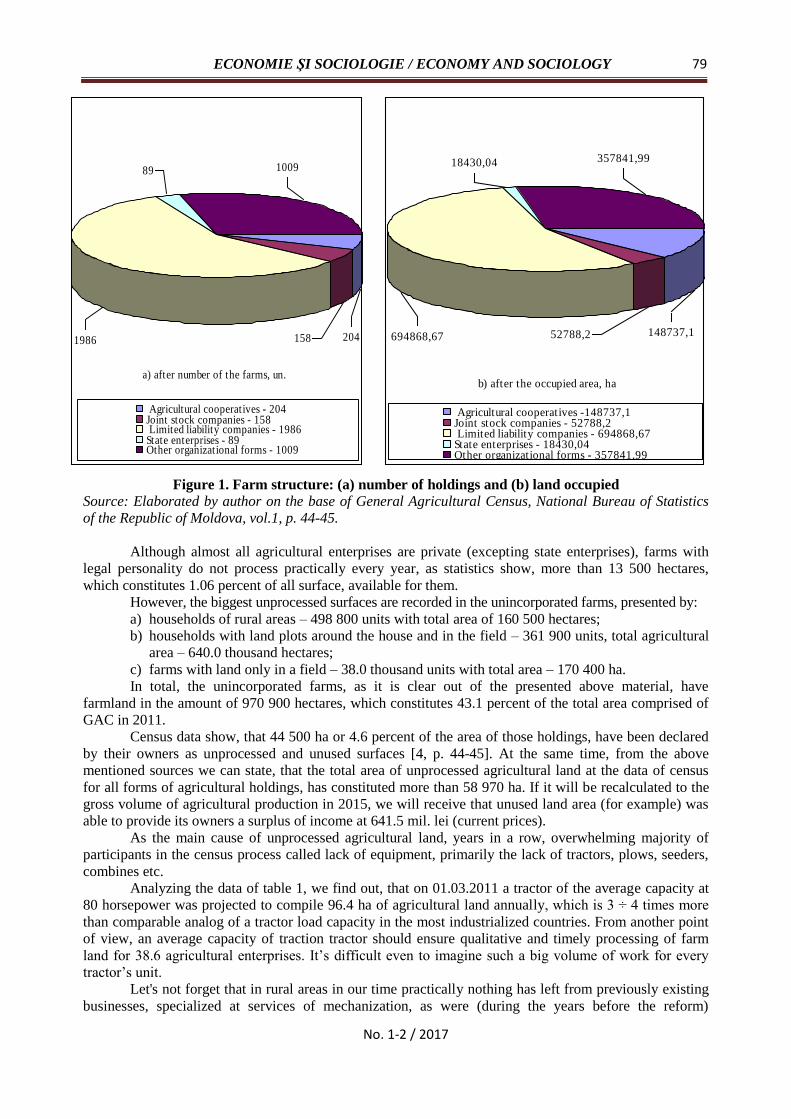
ECONOMIE ŞI SOCIOLOGIE / ECONOMY AND SOCIOLOGY
79
No. 1-2 / 2017
Figure 1. Farm structure: (a) number of holdings and (b) land occupied
Source: Elaborated by author on the base of General Agricultural Census, National Bureau of Statistics
of the Republic of Moldova, vol.1, p. 44-45.
Although almost all agricultural enterprises are private (excepting state enterprises), farms with
legal personality do not process practically every year, as statistics show, more than 13 500 hectares,
which constitutes 1.06 percent of all surface, available for them.
However, the biggest unprocessed surfaces are recorded in the unincorporated farms, presented by:
a) households of rural areas – 498 800 units with total area of 160 500 hectares;
b) households with land plots around the house and in the field – 361 900 units, total agricultural
area – 640.0 thousand hectares;
c) farms with land only in a field – 38.0 thousand units with total area – 170 400 ha.
In total, the unincorporated farms, as it is clear out of the presented above material, have
farmland in the amount of 970 900 hectares, which constitutes 43.1 percent of the total area comprised of
GAC in 2011.
Census data show, that 44 500 ha or 4.6 percent of the area of those holdings, have been declared
by their owners as unprocessed and unused surfaces [4, p. 44-45]. At the same time, from the above
mentioned sources we can state, that the total area of unprocessed agricultural land at the data of census
for all forms of agricultural holdings, has constituted more than 58 970 ha. If it will be recalculated to the
gross volume of agricultural production in 2015, we will receive that unused land area (for example) was
able to provide its owners a surplus of income at 641.5 mil. lei (current prices).
As the main cause of unprocessed agricultural land, years in a row, overwhelming majority of
participants in the census process called lack of equipment, primarily the lack of tractors, plows, seeders,
combines etc.
Analyzing the data of table 1, we find out, that on 01.03.2011 a tractor of the average capacity at
80 horsepower was projected to compile 96.4 ha of agricultural land annually, which is 3 ÷ 4 times more
than comparable analog of a tractor load capacity in the most industrialized countries. From another point
of view, an average capacity of traction tractor should ensure qualitative and timely processing of farm
land for 38.6 agricultural enterprises. It’s difficult even to imagine such a big volume of work for every
tractor’s unit.
Let's not forget that in rural areas in our time practically nothing has left from previously existing
businesses, specialized at services of mechanization, as were (during the years before the reform)
a) after number of the farms, un.
1986
89 1009
158 204
Agricultural cooperatives - 204Joint stock companies - 158 Limited liability companies - 1986State enterprises - 89Other organizational forms - 1009
b) after the occupied area, ha
148737,152788,2
357841,9918430,04
694868,67
Agricultural cooperatives -148737,1Joint stock companies - 52788,2 Limited liability companies - 694868,67State enterprises - 18430,04Other organizational forms - 357841,99
Revistă teoretico-ştiinţifică / Theoretical and scientifical journal
80
No. 1-2 / 2017
associations of "Agrotehnica", "Agrochimy", "Agromelioration" etc. At present virtually all existing
capacities of agricultural machinery, automobiles, irrigation facilities etc., are owned by concrete
agribusinesses enterprises which have – as the first task, the processing of own agricultural land. Only
after completion of plowing, sowing, watering, harvesting etc. of their owned fields, these agro businesses
enterprises are able to help its neighbors, but given that the right time to perform agricultural works is
really strictly limited, usually those lands remain fallow.
It is important to note, that in the initial version of the report "Preliminary results for
General Agricultural Census 2011", the unused land area was evaluated at approximately 247.0 thousand
ha or 4.2 times more than in the final report [6].
Lack of a proper mechanical performance is reflected by the fact that their volume, fixed by the
National Bureau of Statistics, year after year remains at the same level, being only 527 mil. lei or 1.94
percent in comparison to the gross agricultural product (y. 2015). In some districts, for example, the initial
variant of the above mentioned statistical report as unprocessed and unused agricultural land were
indicated:
- Hancesti district: 19 thousand ha or 20.4%;
- Calarasi district: 13 thousand ha or 31.7%;
- Ialoveni district: 14 thousand ha or 25.9%;
- Cahul district: 27 thousand ha or 23.1%, etc.
In the case, that the initial version of the report from 2011 General Agricultural Census was more
objective and truly reflected the existing situation in the agriculture, the sector's losses because of non-
used agricultural land are even greater.
Along with the lack of investment, above reflected situation is aggravated because of the lack
of markets for a big part of agricultural products and even more important – labor shortages in the
agricultural and rural area in its entirety.
As it was already mentioned, the number of hired workers in agriculture is steadily decreasing,
reaching to the end of 2015 the figure of 49 200 pers. or just one person into account at the 42-43 ha of
agricultural land.
If at the beginning of the process of reformation of the national economy the total number
of workers in the agricultural sector (year 2000) amounted to 766 000 people (including the left side of
the r. Dniester), then at the beginning of 2016 the total number of agricultural workers decreased
to 381.0 thousand pers., from which the number of hired workers was only 49.2 thousand person (without
Transnistria).
So far, the lack of investment from one side and, consecutively, precarious technical equipment
of agrarian sector from the another side, and the loss of considerable part of foreign and even internal
market plus massive emigration of workers from rural areas, primarily from the agriculture, have
constituted the principal factors on the sharp need to continue reforms of this sector.
Conclusions and recommendations. At the basis of the carried out analysis, local agrarian
sector in the process of adaptation to the harsh conditions of the market economy, has not
devoid of essential shortcomings and gaps. As negative phenomena arising from the results
of economic reforms in last two decades, the mass emigration of workers (mainly specialists), lack
of investment and slow growth in the labor productivity can be called essential dimensions of unprocessed
agricultural lands.
As practical recommendations of efficient functioning of the agricultural sector, which can be
considered as key components of the continuing reforms process, there has to be reprofilation of unused
agricultural lands through:
- planting forest crops endowed with a high level of accumulation of wood in order to use them as
an alternative energy source;
- planting of nuts orchards;
- partial re-cultivation of unused farmland, endowed with high level of reliability and their return
in agricultural circuit through domestic land market, encouraged their market transactions with more
transparency, publicity etc.
It has to be mentioned, that the owners of the agricultural currently unused land, not only need
technical help from authorized state bodies (primarily – Ministry of Agriculture and Food Industry,
Agency of Land Relations and Cadastre), but also they need an essential financial aid. It has to be taken
into account the need of ensuring the respective owners with forest and / or nuts plant seedlings, which

ECONOMIE ŞI SOCIOLOGIE / ECONOMY AND SOCIOLOGY
81
No. 1-2 / 2017
must be centrally organized, using the financial capacities of Agency for Payments and Intervention in
Agriculture (APIA).
It is worth to be mentioned, that according to the effectuated investigations so nut crops and
products of processing of forestry plants (pellets, briquettes, wood mass in other geometric shapes) along
with extensive domestic market, can serve as an important group of goods for export, which will ensure
not only active substitution of import energy sources, but also a palpable compensation of money, spent
for this import.
REFERENCES
1. Anuarul Statistic al Republicii Moldova = Статистический Ежегодник Республики Молдова =
Statistical Yearbook of the Republic of Moldova 2016. Biroul Naţional de Statistică al Republicii
Moldova. Chisinau, 2016. 688 p.
2. Recensământ general agricol. Biroul Naţional de Statistică al Republicii Moldova [accesat 16 februarie
2017]. Disponibil: http://www.statistica.md/pageview.php?l=ro&idc=352&
3. Economia Naţională a Republicii Moldova 1991 = Народное хозяйство Республики Молдова: anuar
statistic. Chisinau: Statistica, 1992. 406 p.
4. Rezultatele preliminare privind recensământul general agricol 2011 [accesat 10 februarie 2017].
Disponibil: http://www.statistica.md/print.php?!=ro&ide=30&id=3477
5. BAJURA, T. Forests of Moldova – the main indigenous energy source to the national economy. In:
Energy Moldova: international conference, october 4-6 2012. Chişinău: ASM Printing House, 2012,
pp. 388-390.
6. ZAKHARCHENCO, Oleg. Development of the agricultural sector in the context of economic
globalization. In: Economie şi Sociologie = Economy and Sociology. 2014, nr. 3, pp. 93-95.
Recommended for publication: 05.05.2017
Revistă teoretico-ştiinţifică / Theoretical and scientifical journal
82
No. 1-2 / 2017
FACTORS AFFECTING THE ENTERPRISE’S COST
OF CAPITAL IN UKRAINE
Tetiana KONIEVA1, PhD, Associate Professor,
Petro Mohyla Black Sea National University Mykolaiv Ukraine
Reducing the cost of capital is one of the main tasks of financial management of any enterprise.
Because of dynamism of market conditions, the economic situation in the country, the existing
requirements of the legislation, the volume, structure, cost of financial resources of the enterprise fall
under the influence of various factors. The goal of this article is to analyze the specific features of the
influence of different factors on the weighted average cost of capital in Ukraine as a basis for
development of methods for its reducing. Investigation of factors that influence on the company's financial
resources was carried out in the directions determined by the classical formula of the weighted average
cost of capital (WACC), estimation of the cost of net assets’ attracting (CAPM model). Special attention
was paid to the analysis of the domestic legislative base concerning the permitted forms of business
organization in Ukraine, requirements for the emission and dividend policy of the enterprise, size of its
registered, reserve capital, share of net assets in financial resources. Based on the statistical data of
domestic business entities, their ownership structure, sources of financing, specific features of the
economic sector’s influence were analyzed. As a result, the prevalence of corporate enterprises in Ukraine
was revealed, which is connected with relatively low costs and favorable conditions for establishment and
registration. As part of the analysis of the financial resources’ structure high level of dependence from
debts, the popularity of commercial credit, negative effect of financial leverage were found at the
Ukrainian enterprises. The features of the economic sector of enterprise were analyzed, that determine the
volume of capital investments for creation and development, duration of the operational cycle,
seasonality, operating and investment activities, the level of profitability, which affect the volume,
structure, cost of the capital of business entity.
Keywords: net assets, loan capital, cost of capital, taxation, dividends, economic sector.
Reducerea costului capitalului este una dintre principalele sarcini ale managementului financiar
al oricărei întreprinderi. Datorită condițiilor dinamice de piață, situației economice din țară, cerințelor
actuale ale legislației, volumul, structura, costul resurselor financiare ale întreprinderii nimeresc sub
influența diferitor factori. Scopul acestui studiu este de a analiza caracteristicile influenței diverșilor
factori asupra costului mediu ponderat al capitalului în Ucraina ca bază pentru elaborarea metodelor de
reducere a acestuia în continuare. Cercetarea factorilor de influenţă asupra resurselor financiare ale
întreprinderii a fost realizată conform formulei clasice a costului mediu ponderat al capitalului (WACC)
şi evaluarea costului de atragere a activelor nete (modelul CAPM). În cadrul acestui studiu, o atenție
deosebită a fost acordată analizei bazei legislative interne cu privire la formele de organizare a afacerilor
permise în Ucraina, cerinţele politicii de emisie şi dividende a întreprinderii, mărimea capitalului de
rezervă înregistrat, cota activelor nete în resursele financiare. În baza datelor statistice ale entităţilor
economice interne a fost analizată structura proprietăţii lor, sursele de finanţare și particularităţile de
influenţă a sectorului economic. Ca rezultat, a fost determinată prevalența întreprinderilor corporative în
Ucraina, care este asociată cu cheltuieli relativ minore și condiții favorabile pentru înfiinţare și
înregistrare. În cadrul analizei structurii resurselor financiare ale întreprinderilor din Ucraina a fost
determinat nivelul sporit al dependenței de datorii, popularitatea creditului comercial, efectul negativ de
levier financiar. Sunt analizate particularităţile economice ale întreprinderii, care condiţionează volumul
investiţiilor de capital pentru creare şi dezvoltare, durata ciclului operaţional, sezonalitatea, raportul
dintre activităţile operaţionale şi investiţionale, nivelul rentabilităţii, care influenţează asupra valorii,
structurii şi costului de capital al unei entități economice.
Cuvinte-cheie: active nete, capital de împrumut, cost de capital, impozitare, dividende, ramură.
1 © Tetiana KONIEVA, [email protected]
ECONOMIE ŞI SOCIOLOGIE / ECONOMY AND SOCIOLOGY
83
No. 1-2 / 2017
Уменьшение стоимости капитала является одной из основных задач финансового
менеджмента любого предприятия. В связи с динамичностью рыночных условий, экономической
ситуацией в стране, существующими требованиями законодательства, объемы, структура,
стоимость финансовых ресурсов предприятия попадают под влияние разнообразных факторов.
Целью данной статьи является анализ особенностей влияния того или иного фактора на
средневзвешенную стоимость капитала в Украине как основы для разработки методов ее
снижения в дальнейшем. Исследование факторов влияния на финансовые ресурсы предприятия
было осуществлено по направлениям, обусловленным классической формулой средневзвешенной
стоимости капитала (WACC), оценки стоимости привлечения чистых активов (модель САРМ).
В рамках работы особенное внимание было уделено анализу отечественной законодательной базы
касательно разрешенных в Украине форм организации бизнеса, требований к эмиссионной и
дивидендной политикам предприятия, размеру его зарегистрированного, резервного капиталов,
доли чистых активов в финансовых ресурсах. На основе статистических данных отечественных
субъектов хозяйствования была проанализирована структура собственности, источники
финансирования, особенности влияния отраслевого фактора. В результате была выявлена
распространенность корпоративных предприятий в Украине, что связано с относительно
незначительными расходами и благоприятными условиями для учреждения и регистрации.
В рамках анализа структуры финансовых ресурсов предприятий Украины были установлены
высокий уровень зависимости от долгов, популярность коммерческого кредита, отрицательный
эффект финансового левериджа. Проанализированы отраслевые особенности предприятий,
которые обуславливают объем капиталовложений для создания и развития, продолжительность
операционного цикла, сезонность, соотношение операционной и инвестиционной деятельности,
уровень рентабельности, которые влияют на величину, структуру, стоимость капитала
хозяйствующего субъекта.
Ключевые слова: чистые активы, заемный капитал, стоимость капитала,
налогообложение, дивиденды, отрасль.
JEL Classification: D24, E22, G32, H21.
UDC: 336.647/.648(477)
Introduction. Formation of financial resources from own or borrowed sources connected with
various costs for their involvement and as a result should provide a certain level of income to investors
(owners or creditors). Thus, the weighted average cost of capital of any business entity will be determined
by the amount of internal or external financing, correlation between them and their respective value.
Reducing the cost of capital is one of the head tasks of financial management in the market
economy as a criterion of business entity’s effectiveness, which determines the feasibility of investment in
enterprise, its competitiveness and positive impacts on the business price.
The problem of financial resources’ formation, assessment of their value is examined in concepts
of F. Modigliani and M. Miller, G. Donaldson, theories of static compromise and asymmetric information.
Considering the various aspects of the problem the qualitative and quantitative impact of the structure of
financial sources on the cost of equity and loan capital, the cost of the enterprise as a whole are evaluated
in these approaches
At present stage the problem of capital valuation, besides equity, is important among scientists of
the world. Determining it on basis of CAPM-model, along with traditional factors, they add a risk factor of
the country where business is located as an investment object. Scientists define country risk premium with
the help of credit default swaps (A. Damodaran), credit rating of country, risk of transferring money
through countries (M. P. Horn, H. Emmel, M. Schmidt, S. Gatzer).
Despite of defined list of factors in the literature which influence the cost of capital, searching the
ways of its reducing remains an important issue for any company. Decreasing the cost of capital is a
complex problem. The factors show their influence differently in a given situation (country, enterprise).
The conditions of market economy are dynamic generating new risks for the growth of the weighted
average cost of capital of business entity at the macro and micro level.
In this context, the aim of this research is to analyze the influence of different factors on the
weighted average cost of capital in Ukraine as a basis for the development of methods to decrease it.
Factors forming cost of equity’s attracting at the enterprise. According to the classical
formula, the weighted average cost of capital (WACC) is determined by the volume of attracted financial

Revistă teoretico-ştiinţifică / Theoretical and scientifical journal
84
No. 1-2 / 2017
resources, the ratio between owned and borrowed funds and their cost.
One of the main types of financial resources, especially of newly established company,
is equity, attraction cost of which is counted by WACC. There are different approaches to determine the
cost of equity.
Traditionally, the cost of net assets is calculated by the level of dividends, required by owners that
form the share capital, and by costs of emission of the corporate rights.
Modern scientists observe this issue more broadly. Counting the cost of equity basing on
CAPM-model, they include the yield on risk-free investments in the capital market (the minimum level of
income in case of investing in assets with minimal risk); average income from investments in the market
and -coefficient, which describes the enterprise in which investments are made, besides the level of its
operational and financial risk.
Ukrainian scientists determine the need to include the risk of default in the cost of equity’s
attracting by domestic enterprises, because of its possibility in emerging markets [1].
The cost of equity is determined considering the risk premium of the country, where object of
investments is located. Many scientists at this stage calculate this kind of premium taking into account
government USD bonds, credit default swaps of the USA and country where investments are made
(A.Damodaran) [2]. M. P. Horn, H. Emmel, M. Schmidt, S. Gatzer include the risk of transferring money
through countries, credit rating of the country, access to capital markets, susceptibility of investment to
political risk, importance of the investment for the investing company [2].
It seems that there is no contradiction between the existing concepts, they complement each other.
All these factors in any way determine the level of income that require future owners from investments in
the company.
However, it is important to note the following points, which are not paid attention or which were
not clearly represented in scientific approaches of assessing the cost of capital, besides equity.
The part of equity is a registered capital – fixed in the statutes amount of contributions from
owners. The cost of its involvement depends on the ownership and forms of business organization. The
way of creation and formation of the registered capital in Ukraine determines the unitary and corporate
type of enterprise.
The unitary enterprise is established by one founder (owner), who solves the major issues
concerning the management, income distribution, formation of the personnel, reorganization, etc. In this
case, the costs of business registration and organization are minimal. Such entity registers business in the
form of private enterprise with no requirements for initial and reserved capital, which operates on the basis
of the statute [3].
Corporate enterprises (cooperatives, business partnerships) are established by several persons, so
there is need for additional coordination of conditions for joint activities, size and structure of the
registered capital, terms and procedure of its formation, changes of contributions of every participant that
recorded in the founding treaty [3]. This type of business organization certainly needs more costs for
registration procedures and the formation of net assets.
The statistics of the quantitative distribution of entities by different forms of business organization
in Ukraine is arguing for corporate enterprises. On 01.02.2017 private enterprises (unitary) make up 17%
of all business entities of Ukraine and corporate enterprises, including cooperatives, limited liability and
additional liability companies, general and limited partnerships – 47% [4].
Unlike other business partnerships, founding of the stock-joint company always is connected with
the emission of securities – shares. Under national legislation [5] this procedure is accompanied by
registration moments and cooperation with the National Securities and Stock Market Commission,
preparing an emission prospectus, bringing into compliance the management system, concluding
agreements with owners. The emission procedure is accompanied the costs for publication and disclosure
of relevant information to future investors, conclusion of contracts with the underwriter, depository,
payment of state duty and other transaction costs.
Each of these preparatory stages requires financing.
The type of securities’ placement – private (through determined group of shareholders) or public
(through stock exchange) affects directly on the cost of registered capital attracting. In addition,
requirements for the size of the minimum share capital of the company are established that is 1250
minimum wages in Ukraine [6]. On 01.01.2017 this amount reaches 4 millions UAH, which must be
formed at the date of registration. The activity of stock-joint company is accompanied by serious

ECONOMIE ŞI SOCIOLOGIE / ECONOMY AND SOCIOLOGY
85
No. 1-2 / 2017
requirements for reporting, dividend policy and mandatory annual audit. Perhaps it causes low share of
such type of business among entities of Ukraine – 1.3% [4].
Low capitalization, limited investment opportunities in the domestic stock market lead to
transition of Ukrainian business in the international exchanges, besides the Warsaw Stock Exchange. Such
domestic companies in sphere of production and processing of agricultural products are presented on this
stock exchange: AGROTON PUBLIC LIMITED, ASTARTA HOLDING N.V., INDUSTRIAL MILK
COMPANY S.A., KERNEL HOLDING S.A., KSG AGRO S.A., MILKILAND N.V., OVOSTAR
UNION N.V. [7].
IPO on the international stock exchanges requires additional costs for the transition to
international accounting standards and financial reporting standards, preparation of emission prospectus,
payment of marketing services, services of intermediaries. The enterprise must be characterized by
positive credit history holding as minimum capitalization at least 15 millions Euro [8].
Experts note that the preparatory procedures for the IPO could take up to two years and require
2-3 millions USD in case of expected amount of the received financial resources – 100 millions USD.
These costs do not include spending for the placement of securities [9].
Taking into account such level of costs for registered capital formation, IPO can be done only by
large, prospective and financially stable companies.
The influence of dividends’ level on the cost of equity. Despite of business organization’s form,
future owners will expect dividends. Except factors, noted above, which determine their level, the
important point is stage of the life cycle of the company. Typically, in phase of the business establishment,
access to market, accumulation of production capacity, the company is able to provide a conservative
dividend policy due to the lack of financial resources for payments to shareholders or reinvesting the
profits for needs of the enterprise.
However, in countries with developed stock markets, where there is competition
between enterprises for investment capital, an important factor is the level of dividends that are
offered by other companies with similar risk. Thus, issuers, even on the early stages of the life cycle
are forced to implement an aggressive dividend policy with annually increasing income for the
investor. This policy often does not depend on the financial results and creates a financial burden for the
company.
The cost of equity’s attracting is influenced by the level of taxation of paid dividends. Toward the
national legislation, the issuing company must pay the advance payment of income tax in the amount for
18% of the dividends. For shareholders the received dividends create the duty to pay military fee 1.5%
and personal tax income 5% (common shares) and 18% (preferred shares) [10]. There are some legal
restrictions for the form and possibilities of dividend payments, besides joint stock company.
In certain cases, it can lead to the relevant decision of the investor to buy, demand the desired
income level or to reject of corporate rights of the company.
Internal financial resources as part of capital
Calculating the cost of equity for WACC the existing scientific concepts include the value of
shares (common or preferred). However, such components as additional and reserve capital, retained
earnings are not considered significant. The same is applied for other own financial resources, such as
depreciation fund, stable liabilities.
Statistical data of domestic enterprises’ activity indicate insignificant role of these financial
resources (table 1).
Table 1
Financial resources of large and medium enterprises in Ukraine on 01.01.2016, %
Reserve
capital /
Registered
capital
Additional
capital /
Net assets
Index of
financial
autonomy =
Equity/
(Equity+
Liabilities)
(Current
provision +
Deferred
income) /
(Equity+
Liabilities)
Short-term bank
credit / (Equity+
Liabilities)
Long-term
liabilities
and provisions /
(Equity+
Liabilities)
Accounts
payable /
(Equity+
Liabilities)
3,3 69,5 28,3 0,77 5,6 20 27
Source: Calculated by the author on the basis of statistical data (Economic statistics of activity of
Ukrainian enterprises, State Statistics Committee of Ukraine, 2016) [4].
Revistă teoretico-ştiinţifică / Theoretical and scientifical journal
86
No. 1-2 / 2017
The share of current provisions and deferred incomes (so-called stable liabilities) in financial
resources is not even 1%. There is uncovered losses in equity on 01.01.2016, and reserve capital reaches
for only 3.3% of registered capital at norm 15-25% for business partnerships.
In turn, additional capital generates 69.5% of net assets of domestic enterprises.
F. Modigliani and M. Miller in their researches noted the possibility of using retained earnings
for financing of enterprise, especially when there is a high level of personal taxation of investor’s
income [11].
The importance of internal financial resources is considered by G. Donaldson in his concept of
subordination of sources of capital structure, where the main role belongs to retained earnings and
depreciation. Besides, unlike the rest of Ukrainian enterprises, the retained earnings in agriculture reach
68.9% of equity at the beginning of 2016. G. Donaldson proposed to provide a conservative dividend
policy to increase the retained earnings for reinvestment. The author assumed that company might attract
external sources only in case of the exhaustion of internal funds, in such order: bank loans, debt securities,
issue of shares.
That is why the problem of formation, using, evaluation of the internal financial resources, their
impact on the WACC requires additional investigation.
Except the cost of equity attracting, WACC is influenced by the amount of the generated net
assets. On the one hand, their volume depend on the mentality of the owners or managers of the company
that carry out conservative financial policy and do not want to lose control over the firm due to the
possible increasing of financial dependence from debts.
On the other hand, there are certain legal requirements for volume of registered capital and other
components of net assets of business partnerships in Ukraine. For example, according to the
Methodical recommendations of Ministry of Economy in Ukraine one of the signs of insolvency is low
share (less than 50%) of equity in property of business entity [12]. It means that on 01.01.2016, the index
of financial autonomy in Ukraine is only 28% (table 1). Besides, the gap in this index of different
economic sectors is very serious. Thus, the equity of agricultural enterprises is 40% of the financial
resources as well as complete financial dependence on debts in trade and construction industry due to the
negative net assets [4].
Impact factors on cost of debts’ attracting. The existing scientific concepts relate to role of loan
capital differently. The concept of Modigliani-Miller emphasizes that the enterprise value is independent
of its capital structure. The only difference is in the cost of equity of enterprise that involves debt. The cost
of equity of such business entity is bigger on the risk premium than net assets of financially independent
company. This risk premium depends on the difference between the cost of equity and debt, as well as the
financial leverage of the company. In addition, involving debts, the company receives certain benefits
connected with the optimization of tax payments.
Traditional financial theory considers it necessary to determine the optimal value of weighted
average cost of capital, which for certain structure and cost of financial resources should be minimal.
Thus, there is U-determined relationship between the ratio of debt to equity and index of WACC.
The static compromise theory believes that the increasing of financial leverage shoulder leads to
financial risk growing that makes the market value of the company falling down.
Despite of the equity’s cost, the possibility of its formation, successful development of the
business in the market economy is almost impossible without attracting the debts. The need of loans is a
result of the providing of favorable credit policy of customers, seasonality and cycles in business,
peculiarities of technology of production and sales. These lead to a lack of cash inflows, make impossible
the timely financing of operational activity and threat further development of the company.
The advantage of attracting debts is so-called tax shield. Payments of interest rate by loans,
bonds, unlike dividends, are the financial costs for the company, which as a result reduce income tax.
For example, the interest rate of loans provided in the national currency to non-financial corporations
in february 2017 in Ukraine is 15.6% [13]. Thus, taking into account the tax shield, the interest rate
will be 12.79%1.
1 15,6%*(1-0,18) =12,79%, where 0,18 (18%) is the rate of income tax in Ukraine.

ECONOMIE ŞI SOCIOLOGIE / ECONOMY AND SOCIOLOGY
87
No. 1-2 / 2017
Moreover, the effect of financial leverage allows to increase return on equity, attracting loan
capital. The effect of financial leverage, calculated on the basis of statistical data of the domestic
enterprises, unfortunately, is negative because the gross return on assets does not exceed the interest rate
on loans (table 2).
Table 2
The effect of financial leverage of large and medium enterprises in Ukraine on 01.01.2016
Coefficient of gross return
on assets, %
Interest rate,
%1
Coefficient of gross return
on assets – Interest rate
13.34 17.67 - 4,33
Source: Calculated by the author on the basis of statistical data (Economic statistics of activity of
Ukrainian enterprises, State Statistics Committee of Ukraine, 2016) [4].
The high level of interest rates and the cost of attracting bank loans in Ukraine lead to their
insignificant share in the property of business. The share of short-term bank loans in the property of
domestic enterprises is 5.6%, long-term liabilities – 20% (table 1). This, besides, determines the popularity
of commercial credit.
Influence of economic sector’s features on financial resources. One of the main factors which
affects the amount, structure, cost of financial resources, including debts, is the economic sector, where
enterprise operates.
Industrial features of the enterprise determine the amount of capital investments required for the
establishment and development, characteristics of the technological process and sales, including the
duration of the production and operational cycles, the balance between operating and investing activities,
the level of profitability. In a way, they identify the level of operational and financial risks of the
enterprise of any economic sector.
Previous researches allow revealing the following features of enterprises in sphere of material
production: industry, agriculture, construction and trade [16]. Industrial enterprises are stationary,
characterized by a strong technological base. They need for relevant labor resources, raw materials and
infrastructure. The main condition for the development of industrial enterprises is implementing
innovative technologies.
The seasonal nature of agriculture is accompanied by production processes which are long, often
urgent and fall under the impact of unexpected weather conditions.
Production of construction industry requires an individual approach to the customer, taking into
account the current requirements for quality of buildings, is characterized by preparatory procedures
connected with budgeting, obtaining permits, researching the territory of the construction, etc.
These aspects are not critical for trade enterprises, which are distinguished by high degree of
mobility compared to the rest of the economical sectors. It explains their significant share in the quantity
and volume of sales of Ukrainian business entities. Trade does not require big capital investments for
beginning and development of activity. In this case, the most capital intensive concerning investments in
tangible and intangible assets is industry. The share of such assets in the property of industrial enterprises
is 44% compared with the trade sector – 7.6% [17].
The production cycle of trade enterprises, providing the role of intermediaries, is much shorter
than in industry, construction and agriculture. The duration of the operating cycle directly influences the
rhythm and amounts of cash inflows, which determines the investment activity of enterprises. For
example, the share of long-term and short-term financial investments in property of trade companies is
14.37%, comparing with agriculture – 5.24% or industry 3.24% [17].
These features form a different proportion of fixed and current assets of the companies as well as
the structure of their financial resources. The continued payback period of fixed assets requires long-term
financing by own or borrowed capital. Sources of current assets’ financing can be working capital,
commercial credit, short-term bank credit, stable liabilities.
1 Interest rates on new loans, given to non-financial corporations by types of activity in december 2015 [14].

Revistă teoretico-ştiinţifică / Theoretical and scientifical journal
88
No. 1-2 / 2017
Seasonality of a business makes it necessary to reserve funds, involve the credit lines for immediate
production operations. Therefore, such type of financing as cooperation, leasing, insurance, various
government support are important, for example, in capital structure of agricultural enterprises.
The correlation between financial resources – the policy of fixed and current assets’ financing –
determines the cost of capital. Low share of equity and debt’s structure of the Ukrainian enterprises on
01.01.2016 lead to aggressive policy of financing, which is a threat of default for companies in those
economic sectors which are characterized by long operating cycle. This problem is very important,
considering the level of losses of domestic enterprises. Thus, optimization of the current assets’ size,
increasing of capital productivity of non-current assets are the ways to reduce the cost of capital.
The role of commercial credit and alternative sources of financing in capital structure’s
formation. Insignificant amounts of internal financial resources, inaccessibility and high cost of bank
loans increase the role of commercial credit in the liabilities of the company. On 01.01.2016 account
payables are 27% of the financial resources of domestic enterprises (table 1). Besides, in trade sector they
are 49%.
The absence of cost for attracting makes commercial credit so popular in the country. But
providing the favorable credit policy for customers leads to decreasing of current assets’ liquidity. The
term of repayment of account receivables is often twice longer than production cycle of enterprise [18].
Low cost of commercial credit does not directly affect the weighted average cost of capital, but such
situation causes the disruption of financial stability, and therefore the falling of business value.
The existing scientific concepts calculate the cost of debt capital as part of WACC, traditionally
using bank credits and bond loans. But there are wide spread alternative sources of financing at this stage
in the world, including factoring, franchising, leasing, etc. They are cheap and have favourable conditions
to attract and resolve specific problems faced by business entities. In the case of factoring, it provides an
opportunity to solve problems with accounts receivable, speed up capital turnover, rhythm of production
and sales. Leasing promotes the financing of fixed assets and reduces the cost of their services.
Each alternative source of non-bank crediting has its value, and the problem of their
integration into the formula of WACC, determining their influence on the cost of capital of the company
remains important.
Results and Conclusions. The provided research gave an opportunity to identify the main factors
which affect the cost of capital of Ukrainian companies. The absence of the registered capital
requirements, low costs for the foundation, the type of owners’ responsibility determine the prevalence of
the business organization’s form in type of limited partnership in Ukraine. The insignificant percentage of
stock-joint companies in amount of business entities is connected with large size of minimum
contributions of owners required at the time of registration, the costs of securities’ emission, agreements
with various intermediaries, IPO on international stock exchanges.
Forming financial resources through equity, the company must take into account the level of
dividends’ taxation in the country. Due to the certain conditions, company-issuer has to pay 18% from
paid dividends in Ukraine.
Statistical data of domestic enterprises indicate minor role of internal financial resources. Growing
of uncovered losses, absence of reserves, provisions cause financial dependence of Ukrainian business
entities from debts.
Involvement of debts, which in theory should lead to tax shield and increasing of return on equity
at the company, unfortunately, in Ukraine does not provide such effect. On the one hand, the differential
of financial leverage of domestic firms is negative, on the other hand – free of charge commercial credit
(accounts payable) reaches the third, and in some economic sectors half of the resources.
Sectoral features of enterprises determine the amount of capital investments for creation and
development, duration of the operating cycle, seasonality, the operating and investing activities. Thus, the
most prevalent by the number and volume of sales trade enterprises are characterized by low share of
tangible and intangible assets in property compared to capital-intensive industrial companies. Short
operating cycle, rhythm of cash inflows promote active investing operations. The share of financial
investments in assets of trade enterprises is 3 times higher than in agriculture and 4 times in industry. This
affects the size, structure and cost of business entity.
The received results give a basis for more detailed investigation of the impact of mentioned
factors on the cost of financial resources of the business entity and development of the ways to reduce
costs of attraction of net assets and liabilities in further researches.

ECONOMIE ŞI SOCIOLOGIE / ECONOMY AND SOCIOLOGY
89
No. 1-2 / 2017
REFERENCES
1. ТЕРЕЩЕНКО, О.О. Ймовірність дефолту підприємств та витрати на залучення
капіталу. В: Вісник Інституту економіки та прогнозування. 2013, сс. 65-71.
2. HORN, M. et al. Estimating the Country Risk Premium: Presenting an alternative to Damodaran’s
country risk premium data base. In: Corporate Finance. 2015, vol. 6, pр. 157-166.
3. Цивільний кодекс України: № 435-IV від 16.01.2003 [accesat 21 februarie 2017]. Disponibil:
http://zakon0.rada.gov.ua/laws/show/435-15
4. Економічна статистика діяльності підприємств України. Державна служба статистики
України. [accesat 10 februarie 2017]. Disponibil: http://ukrstat.gov.ua/
5. Закон України Про цінні папери та фондовий ринок: № 3480-IV від 23.02.2006 [accesat 2
februarie 2017]. Disponibil: http://zakon5.rada.gov.ua/laws/show/3480-15/ed20120214
6. Закон України Про акціонерні товариства: № 514-VI від 17.09.2008. [accesat 10 februarie 2017].
Disponibil: http://zakon2.rada.gov.ua/laws/show/514-17
7. Варшавская фондовая биржа. [accesat 10 februarie 2017]. Disponibil:
https://www.gpw.pl/o_spolce_ru
8. ГУЗЕНКО, Т.С., ГЕЄНКО, М.М. Перспективи залучення довгострокових інвестицій в
аграрний сектор за допомогою IPO. В: Глобальні та національні проблеми економіки. 2016,
випуск 11, сс. 682-686 [accesat 10 februarie 2017]. Disponibil: http://global-
national.in.ua/archive/11-2016/143.pdf
9. РIЗНИЧЕНКО, Є. IPO для українських компаній: нелегкі гроші [accesat 10 februarie 2017].
Disponibil:
http://www.bankchart.com.ua/biznes/rozvitok_biznesu/statti/ipo_dlya_ukrayinskih_kompaniy_nelegk
i_groshi
10. Податковий кодекс України: № 2755-VI від 02.12.2010 [accesat 22 februarie 2017]. Disponibil:
http://zakon5.rada.gov.ua/laws/show/2755-17
11. MODIGLIANI, F., MILLER, M.H. Corporate Income Taxes and the Cost of Capital: A Correction.
In: The American Economic Review. 1963, vol. 53, no. 3, pp. 433-443.
12. Методичні рекомендації щодо виявлення ознак неплатоспроможності підприємства та ознак
дій з приховування банкрутства, фіктивного банкрутства чи доведення до банкрутства [accesat
10 februarie 2017]. Disponibil: http://www.me.gov.ua/Documents/Detail?lang=uk-
UA&id=111503bd-ca7f-4dee-b07c-
c66c2aa28e03&title=MetodichniRekomendatsiiSchodoViiavlenniaOznakNeplatospromozhnost
iPidpriiemstvaTaOznakDiiZPrikhovuvanniaBankrutstvaFiktivnogoBankrutstvaChiDovedenniaDoBa
nkrutstva-1
13. Економічні та фінансові показники України. Національний банк України [accesat 21 februarie
2017]. Disponibil: https://bank.gov.ua/control/uk/publish/article?art_id=36728
14. Статистичний випуск. Проценті ставки. Національний банк України [accesat 10 februarie
2017]. Disponibil: https://www.bank.gov.ua/doccatalog/document?id=66237
15. ULIAN, G., MÎRZAC, M. Ways overcome the constraints through strategic development of support
system for financing small and medium business. In: Economie şi Sociologie = Economy and
Sociology. 2015, nr. 1, pp. 61-68.
16. KONIEVA, Tetiana A. Characteristic of economic sector influence on the financial resources
formation of enterprise. В: Nauka i studia. 2015, № 4 (135), сс. 76-82.
17. KONIEVA, Tetiana A. Financial provision of investment activity in material production sector of
Ukraine. В: Актуальні проблеми економіки. 2015, № 10(172), сс. 185-191.
18. KONIEVA, Tetiana A. Ways of operating cycle reduction in material production of Ukraine. В:
Актуальні проблеми економіки. 2017, № 1 (187), сс. 158-167.
Recommended for publication: 10.05.2017

Revistă teoretico-ştiinţifică / Theoretical and scientifical journal
90
No. 1-2 / 2017
APPLYING PETRI NETS EXTENSIONS TO
MODELING COMMERCIAL BANK ACTIVITY
Igor ENICOV1, PhD, Professor,
Free International University of Moldova
The relevance of the study is determined by the need to improve the methods of modeling and
simulating commercial bank activity, including for the purpose of calculating, controlling and managing
the risk of the bank, in the context of the transition to the application of Basel III standards. This
improvement becomes necessary due to a direct transition to new regulatory standards when the internal
assessments of the main risks become the initial data for calculating the capital adequacy of a bank. The
purpose of this article is to argue the opportunity to formulate a theory of the commercial bank model on
the extensions of Petri nets theory. The main methods of research were the method of scientific abstraction
and method of logical analysis. The main result obtained in the study and presented in the article is the
argumentation of the possibility to analyze the quantitative and qualitative characteristics of a
commercial bank with the help of Petri net extensions.
Keywords: commercial bank, modeling, bank risk, Petri nets, extensions of Petri nets theory,
qualitative properties, quantitative properties.
Actualitatea studiului este determinată de necesitatea perfecționării metodelor de modelare și
simulare a activității băncii comerciale, inclusiv în scopul evaluării, controlului și gestiunii riscului
băncii, în contextul trecerii la aplicarea standardelor Basel III. Această perfecționare se impune odată cu
trecerea efectivă la cadrul nou de reglementare când estimările interne ale riscurilor de bază devin date
primare pentru calculul cerinței de capital al unei bănci. Scopul prezentului studiu este de a argumenta
oportunitatea formulării unei teorii a modelului băncii comercale pe extensii ale teoriei rețelelor Petri.
Metodele principale de cercetare au fost metoda abstracției științifice și metoda logică. Principalul
rezultat obținut în articol, urmare a cercetării, a fost argumentarea posibilității explorării proprietăților
calitative și cantitative ale activității băncii comerciale pe extensii ale rețelelor Petri.
Cuvinte-cheie: bancă comercială, modelare, riscul băncii, rețele Petri, extinderi ale teoriei
rețelelor Petri, proprietăți calitative, proprietăți cantitative.
Актуальность исследования определяется необходимостью улучшения методов
моделирования и симуляции деятельности коммерческого банка, в том числе с целью расчета,
контроля и управления риском банка, в контексте перехода к применению стандартов Базель III.
Это улучшения становится необходимым так как при непосредственном переходе на новые
стандарты регулирования внутренние оценки основных рисков становятся исходными данными
для расчёта достаточности капитала банка. Основными методами исследования были метод
научной абстракции и метод логического анализа. Основным результатом полученным в статье,
в результате исследования, является аргументирование возможности исследования
количественных и качественных характеристик коммерческого банка с помощью расширений
сетей Петри.
Ключевые слова: коммерческий банк, моделирование, банковский риск, сети Петри,
расширения теории сетей Петри, качественные характеристики, количественные
характеристики.
JEL Classification: G17, G21, G31, C60.
UDC: 336.713:330.4
Introduction. In recent years, the National Bank of Moldova has carried out some remedial
measures to improve the situation in the banking sector. Thus „since June 2015, the National Bank of
Moldova has been benefiting from the assistance provided by the central banks of Romania and the
1© Igor ENICOV, [email protected]
ECONOMIE ŞI SOCIOLOGIE / ECONOMY AND SOCIOLOGY
91
No. 1-2 / 2017
Netherlands through a Twinning project related to strengthening the NBM capacity in the field of banking
regulation and supervision in the context of the Directive 2013/36 / EU and Regulation 575 / 2013 related
to the banking sector (so-called CRD IV package)" [9].
Also, „entry into force of the Law on banking activity and activity of investment firms, which is
planned for the end of 2017 and the subsequent entry into force of the secondary normative framework for
implementing its provisions will address the transition from international standards Basel I to latest
standards in the field – Basel III" [8].
Even if we assume that "the NBM will not allow the use of the model based on the fundamental
internal ratings-based approach (FIRB) and the model based on the advanced internal ratings-based
approach (AIRB) for a long period of time” [9], we believe that commercial banks are interested in
developing existing practices of modeling and simulating activities, including risk management purposes.
In other words, we must improve the formalization of logical and mathematical representation of
connections, regularities and the explanatory theory for the operations in commercial bank. The main
purpose of this article is to justify the opportunity to formulate an explanatory theory on the extensions of
Petri nets theory.
We believe that attaining similitude between commercial bank and its model by Petri nets has a
number of advantages compared to other instruments. This involves some opportunities of continuous
improvement of the theoretical model, the possibility of slight changes of the degree of homomorphism,
the possibility of concomitantly including variables typical of deterministic models, stochastic models, as
well as fuzzy (vague) models. It is important that Petri nets have a graphic representation with a
particularly effective impact on intuitively understanding the systems dynamics.
Basic content. It is known that "Petri nets can model phenomena characteristic of discrete event
systems such as succession (one evolution follow another), choice or conflict (selecting one of several
evolution possibilities), concurrency (state of parallel evolutions), synchronization (completion of parallel
evolutions), mutual exclusion (mutual determination of some evolutions), which can be formulated in
timed or non-timed contexts. In addition, the study of Petri nets is usually accompanied by a visual
approach through expressive charts” [6].
It is known that a Petri net is a representation of a system that can decompose into a structural part
and a dynamic one [5].
A structural part of a Petri net is essentially a bipartite directed graph (P, T, A, Kp, w), where:
P = {p1, p2, …, pn} is a finite set of places;
T = {t1, t2, …, tk}. is a finite set of transitions ;
A is a set of arcs, a subset of the set ;
Kp : P IN is a function of the place capacity (the ability of a place is considered implicitly
unlimited);
w is a function that assigns weight to arcs, w: A{1,2,3 ...} (the weight of an arc is considered
implicitly uniform).
The dynamic component of a Petri net, initially marked (P, T, A, w, M0) consists in identifying
ways (laws) of the evolution of these markings.
Un The marking of a Petri net at a certain moment of its evolution is defined by a vector M=[m1,
m2,…,mn], where n is the number of places in a Petri net, and mi = M(pi), with index i showing the number
of tokens in a place pi, . M0 is the initial marking of a Petri net.
The state of a certain Petri net (structurally defined) is completely described by its marking
M = [m1, m2,…, mn]. The state space of a marked Petri net is fully defined by the reachable marking out of
M0, that is to say, all n-dimensional vectors, whose elements are positive M = {0, 1, 2, …}n.
In order to be able to use a Petri net for modeling a discrete event system, it must be equipped
with a dynamic and defining mechanism similar to the one of the state transition. This mechanism is
highly suggestive in its representation of the tokens exchange between the net places determined by
enabling and firing of the net transition. A transition tjT in a marked Petri net is enabled if:
M(pi) >= w(pi, tj), for each piI(tj); M(pk) <= Kp(pi)-w(tj, pk), for each pkO(tj)- I(tj);
M(p) <= Kp(p)-w(tj, p) + w(p, tj), for each pO(tj) I(tj).
In other words, in order to produce a transition, first it is required that the number of the tokens on
a place at the input of the transition is, at least, the same as the weight of the arcs that connect the
corresponding places of the transition. When a transition is enabled by current marking M, (notation
TP
)()( PTTP
,...}2,1,0{)( ipM

Revistă teoretico-ştiinţifică / Theoretical and scientifical journal
92
No. 1-2 / 2017
M [tj > ), we say that this transition can be fired. The set of the enabled transitions by current marking M is
noted as T(M).
The firing of a transition is visually equivalent to withdrawing a number of tokens (equal to the
weight of the connecting arc) on each place of the transition input and adding a number of tokens (equal to
the weight of the connecting arc) on each place of the transition output:
M’(pi) = M(pi) - w(pi, tj), for each piI(tj) - O(tj);
M’(pk) = M(pk) + w(tj, pk), for each pkO(tj) - I(tj);
M(p) = M(p) - w(p, tj) + w(tj, p), for each pO(tj) I(tj).
The function of the state transition of a marked Petri net, , f : {0, 1, 2, …}n T {0, 1, 2, …}n is
defined for transition , if it is enabled, i.e. if M(pi) w(pi, tj) for each pi out of I(tj).
According to transition f(x,tj), the new marking is:
M’ = f(x, tj), where M’(pi) = M(pi) - w(pi, tj) + w(tj, pi), i = 1, 2, 3, …
This relation is noted as . We say that is directly reachable from M by firing
transition tj.
The analysis of the marked Petri nets can be performed on the basis of their dynamic behavior or
their structure.
The first method is called the analysis of reachability because its main goal is to identify the set of
states (reachable). It uses algebraic rules which describe the processes of enabling and firing transitions
and lead to representing the dynamic evolution of a Petri net through some equations.
The second method, which is a structural analysis, focuses on eliminating space derivation
resulting in avoiding the “state explosion” problem.
Petri nets extensions correspond to the models that have acquired some additional rules to allow
treating a greater number of applications and models. The most significant models that extend the
descriptive power of a model are generalized Petri nets, timed Petri nets, stochastic Petri nets, continuous
Petri nets and hybrid Petri nets.
Generalized Petri nets adequately describe the discreet events processes, which take place in a
system [3]. In generalized Petri nets, events are viewed as transitions. A transition, or an event, takes place
only when it is enabled, which means that a set of conditions is applied. Places can be input transitions in
cases when they are associated with the conditions, which must be applied in order to enable it. Or, they
can be output transitions and in this case they represent new conditions which appeared due to the
production of the transition. It is important that generalized Petri nets involve local determination of the
state change, thus the transitions, i.e. events, can be controlled independently [5]. In other words, in case
of modeling commercial bank activity, we can have a Petri net in which the transition representing an
event has an input place, which stands for the state of the bank with a range of conditions to be fulfilled so
that the event takes place, and an output place, which stands for a new condition that appeared after
producing the event.
In case of Petri nets, the net dynamics are associated with a succession of transitions that are
dependent only on logical considerations. As it was mentioned above, transitions can be fired only on
condition that they are enabled, i.e. only if a set of described conditions is carried out in the input place. In
this context, time is not taken into account, i.e. we do not relate the production of the event to the
necessary tie intervals. Yet, in order to simulate commercial bank activity in some cases it is necessary to
consider time. In these cases, the necessary time can be related to either place or transition.
In case it is necessary to take into account time in a modeled system, then it can be related to
places and transitions in the following way:
a) The time interval of the transition is the time between the start (the consumption of tokens at
the input place) and the completion of the event (the production of tokens at the output place). These time
intervals are called action time.
b) The time interval of places is the time needed for consumption so that tokens can become
permanent in a place until the moment they are able to contribute to the firing of the following transition.
These time intervals are called waiting times [3].
A variant of generalized timed Petri nets, which can be used to model and assess the risks of
commercial bank activity, can be observed in [3].
In the context of modeling commercial bank activity, action times can be represented by,
for example, the time required for making a bank transfer (in this case, the transition is the time consumed
Tt j
MtMj
[ M
ECONOMIE ŞI SOCIOLOGIE / ECONOMY AND SOCIOLOGY
93
No. 1-2 / 2017
for making the bank transfer). Similarly, the waiting times can be time intervals necessary for firing a
transition, i.e. the commencement of the transfer, or the termination of the transfer. Starting with the
initiation of the transfer, the time is consumed to verify the conditions necessary for the transfer, action
times are the time needed to verify each of the existing conditions to debit the payer's account. When the
conditions are fulfilled, in other words, when the transition is enabled (the event – the transfer is fired),
there will be consumed the waiting times, i.e. the durations required to verify the necessary conditions to
enroll the money to the beneficiary’s account.
Timed Continuous Petri nets extensions were first introduced by H. Alla and R. David in [1].
The particularities of this Petri nets extension are in the fact that the marking of a place, the number
of the tokens and the incidence function are defined by a real number. In the extension of this kind, firing
of the transition is carried out by a continuous flow of fluid. Timed continuous Petri nets allow the
modeling of situations in which the number of reachable markings becomes too high to be modeled by
Petri nets [4].
For modeling real processes, transitions of generalized Petri nets can have durations related to
random or concrete values. In case of random values, we obtain a generalized stochastic Petri net. In other
words, in this case, the duration needed to produce an event will follow a probability distribution that will
relate to the corresponding duration. In case of concrete values, we can observe a generalized
deterministic Petri net, which in its turn is a specific case of generalized stochastic Petri nets.
In the context of a stochastic Petri net, if the transition is enabled, there will be selected all the
markings necessary for the production of the respective transition and they will be relevant for a time
interval generated according to the law of repartition associated with the respective transition. If it is
possible to produce more transitions simultaneously, first there will be carried out the transitions that have
the shortest delay time.
Any generalized stochastic Petri net with exponential distributions, a Markovian Petri net, can be
assigned to a homogeneous continuous Markovian chain. So, along with the general methods used to
analyze generalized Petri nets, there can be used the methods of analyzing a homogeneous Markovian
chain [3].
The choice between the various possible interpretations of Markovian Petri nets generally depends
on the modeling techniques and objectives. According to [2], a Markovian Petri net is a generalized Petri
net in which:
each transition is associated with a random variable that models the duration needed for
action while firing;
every random variable is characterized by a negative-exponential distribution function (with
a corresponding parameter) of the cumulative time of firing of each transition apart.
Based on the above, we can determine a set of possible executions of a Markovian Petri net, which
is a Markovian random process with continuous, discrete states. Due to lack of memory of negative
exponential law, at each iteration, "memory loss of cumulative actions" occurs; thus the behavior of a
Markovian Petri net is described by a continuous Markovian chain, i.e. the states previously held have no
influence on the subsequent evolution. General interpretation of the behavior of a Markovian Petri net
allows to create a simple model of discrete event systems.
Timed hybrid Petri nets are well suited for modeling continuous operation with naturally
continuous flows. However, in a banking system operation, processes are typically discrete-continuous
and there can often be situations of malfunctions when one or more resources are not available. The
concurrency of these events leads to a sudden change in the operating mode of the net, which is equivalent
to having another timed Petri net unexpectedly.
Suchlike situations can be modeled through generalized hybrid Petri nets, which contain
continuous places and transitions and discreet places and transitions. Put in other words, in a hybrid Petri
net a set of places and transitions is divided into two distinct parts: every place and every transition can be
either discreet or continuous, in which the marking of the continuous place is a real number, whereas the
marking of a discreet place is an integer [5].
Results and conclusions. Generalizing all the above mentioned points, we can affirm that the
construction of a model of commercial bank activity can be made by identifying two discrete sets (finite or
infinite): T-state space and E-event set as well as formulating a mathematical description
kt
k
kt
k
Revistă teoretico-ştiinţifică / Theoretical and scientifical journal
94
No. 1-2 / 2017
of the connections by means of which the occurrence of events from set E determines transactions in state
space T. This can be achieved:
a) qualitatively, when logical behavior is considered, regardless time, which also means that the
mathematical model does not contain information on the moments when events are produced and in this
case we speak of a logical, untimed model;
b) and/or quantitatively, when time-dependent behavior is considered, which means that in the
mathematical model events are presented as pairs (e1,m1), (e2,m2), ..., (en,mn), where m1, m2, ..., mn note
the moments of occurrence of the respective events and in this case we speak of a timed model. Thus, such
models reveal the quantitative properties of systems behavior. It is important that the process of
identifying moments can be deterministic (deterministic models) or probabilistic (stochastic models).
Such quantitative and qualitative properties of commercial bank activity can be explored through
Petri nets extensions, ensuring a relative simplicity of formulating logical and mathematical representation
of connections, regularities and explanatory theory for processes of commercial bank and, simultaneously,
providing graphic support with a highly efficient impact on understanding the dynamics of the model
intuitively.
REFERENCES
1. HASSANE, Alla, RENE, David. Discrete, Continuous and hybrid Petri nets. In: Journal of Systems
Circuits and Computers. 1998, no. 8 (1), pp. 159-188.
2. AJMONE-MARSAM, M. et al. A class of Generalized Stochastic Petri Nets for Performance
Evaluation of Multiprocessor System. In: ACM Transactions on Computer Systems. 1984, vol. 2,
may, pp. 93-122.
3. GUŢULEAC, E. Evaluarea performanţelor sistemelor de calcul prin reţele Petri stocastice.
Chişinău: Tehnica Info, 2004. 276 p. ISBN 9975-63-228-9.
4. ENICOV, I., GUŢULEAC, E. Modelarea activităţii băncii comerciale prin reţele Petri hibride
temporizate. In: Studia Universitatis. Ştiinţe exacte şi economice. Chişinău 2007, anul I, nr. 2,
pp.218-225.
5. ENICOV, I., GUŢULEAC, E. Modelarea şi evaluarea performanţelor băncii comerciale prin reţele
Petri. In: Studia Universitatis. Ştiinţe exacte şi economice. Chişinău, 2007, anul I, nr. 2, pp. 177-178.
6. PĂSTRĂVANU, O., MATCOVSCHI, M., MAHULEA, C. Aplicaţii ale reţelelor Petri în studierea
sistemelor cu evenimente discrete. Iaşi: Ed. Gheorghe Asachi, 2002. ISBN 973-8292-86-7.
7. BEDA, O. et al. Problems of financial stability of commercial banks in the Republic of Moldova. In:
Economie şi Sociologie = Economy and Sociology. 2015, nr. 4, pp. 49-54.
8. Situaţia financiară a sectorului bancar în anul 2016 [accesat 12 februarie 2017]. Disponibil:
http://bnm.md/ro/content/situatia-financiara-sectorului-bancar-anul-2016
9. Strategia de implementare a standardelor BASEL III prin prisma cadrului legislativ european (CRD
IV) [accesat 17 ianuarie 2017] Disponibil: http://bnm.md/files/Strategia%20(web).pdf
Recommended for publication: 31.03.2017

ECONOMIE ŞI SOCIOLOGIE / ECONOMY AND SOCIOLOGY
95
No. 1-2 / 2017
ASSESSMENT OF ILLEGAL
CAPITAL FLOWS IN THE REPUBLIC OF MOLDOVA
Tatiana PETROVA1, Researcher, National Institute for Economic Research, Moldova
Victoria IORDACHI2, PhD, Associate Professor, National Institute for Economic Research, Moldova
Dorina CLICHICI 3, PhD, Senior researcher III, Institute for World Economy, Romania
This paper analyses the existent methodologies used in international practice to estimate illegal
capital outflows. Also, authors carried out an assessment of the illegal capital outflows in the Republic of Moldova on the basis of two models: the general method based on the balance of payments and the World Bank’s "residual" model. The paper reflects the exceptional situation of the financial system of the Republic of Moldova and trends in evolution of capital flows. The analysis of illegal flows should be part of the monitoring system of the country’s financial stability, which will allow identifying in time negative trends that threaten Moldova's financial security. The main research methods were systemic analysis and logic synthesis; data analysis and interpretation; statistical methods, etc. The main conclusions obtained within the research of this topic are: for more reliable estimates for analytical purposes, it is necessary to develop an adequate methodological base that would help to measure and analyze shadow cross-border flows; for the assessment of the financial security of the Republic of Moldova, as a transition economy, it is important to monitor, analyze and forecast a broader list of financial indicators, as well as their critical values.
Keywords: capital outflow; illegal flows, balance of payments; financial stability, capital flight, World Bank, Residual model, Trade misinvoicing model.
În această lucrare sunt analizate metodologiile existente utilizate în practica internațională
pentru a estima ieșirile ilegale de capital. De asemenea, autorii au realizat o evaluare a ieșirilor ilegale de capital în Republica Moldova în baza a două modele: metoda generală bazată pe balanța de plăți și modelul rezidual al Băncii Mondiale. Lucrarea reflectă situația excepțională a sistemului financiar al Republicii Moldova și tendințele în evoluţia fluxurilor de capital. Analiza fluxurilor ilegale ar trebui să fie parte a sistemului de monitorizare a stabilității financiare a țării, ceea ce va permite identificarea în timp a unor tendințe negative care amenință securitatea financiară a Republicii Moldova. Principalele metode de cercetare au fost: analiza sistemică și sinteza logică; analiza și interpretarea datelor; metodele statistice etc. Principalele concluzii ale cercetării subiectului dat sunt: pentru realizarea unor estimări mai fiabile în scopuri analitice, este necesară elaborarea unei baze metodologice adecvate pentru măsurarea și analiza fluxurilor ilegale transfrontaliere; pentru evaluarea securității financiare a Republicii Moldova, fiind o economie în tranziție, este important de a monitoriza, a analiza și a prognoza o listă mai vastă a indicatorilor financiari, precum și valorile lor critice.
Cuvinte-cheie: ieşiri de capital, fluxuri ilegale, balanţă de plăţi, stabilitate financiară, fuga capitalului, Banca Mondială, modelul rezidual, modelul denaturării comerţului.
В настоящей статье анализируются существующие методологии, используемые в
международной практике для оценки незаконного оттока капитала. Кроме того, авторы провели оценку незаконного оттока капитала в Республике Молдова на основе двух моделей: общего метода, основанного на платежном балансе, и «остаточной» модели Всемирного банка. В документе отражена чрезвычайная ситуация в финансовой системе Республики Молдова и тенденции в потоках капитала. Анализ незаконных потоков должен быть частью системы мониторинга финансовой стабильности страны, что позволит вовремя выявить негативные тенденции, которые угрожают финансовой безопасности Республики Молдова. Основными
1 © Tatiana PETROVA, [email protected] 2 © Victoria IORDACHI, [email protected] 3 © Dorina CLICHICI, [email protected]
Revistă teoretico-ştiinţifică / Theoretical and scientifical journal
96
No. 1-2 / 2017
методами исследования были системный анализ и логический синтез; анализ и интерпретация данных; статистические методы и т.д. Основные выводы исследования: для более надежных оценок для аналитических целей необходимо разработать адекватную методологическую базу для измерения и анализа теневых трансграничных потоков; для оценки финансовой стабильности Республики Молдова как страны с переходной экономикой важно отслеживать, анализировать и прогнозировать более широкий перечень финансовых показателей, а также их критические значения.
Ключевые слова: поток капитала, незаконные потоки, платежный баланс, финансовая стабильность, отток капитала, всемирный банк, остаточная модель, модель торгового искажения.
JEL Classification: F21, F32.
UDC: 339.727.244(478)
Introduction. Over the last years, more than one thousand billion dollars are illegally “leaking”
from developing countries due to various reasons like corruption, organized crime and tax evasion, as well
as lack of property rights, general lawlessness. These outflows largely exceed the volume of inflows from
foreign direct investments and financial aid. Therefore, a great attention is paid to methods of measuring
capital flight as well as explaining causes that launch this phenomenon.
According to the IMF recommendations, "the vulnerability of low-income countries should be
focused on the vulnerability of these countries in case of a sharp drop in economic growth due to external
shocks, such as dramatic changes in terms of trade and fluctuations in external financial flows. These
shocks can cause instability in the budgetary sphere and in the foreign economic sector, worsening of the
debt situation, tensions in the banking system and a sharp drop in output. All these factors can lead to a
significant reduction in welfare and even to social disruption" [7]. The characteristics of foreign economic
financial instruments, such as the current account balance and the growth of the country's official external
debt form the movement of capital and its dynamics.
According to the Global Financial Integrity rating, the Republic of Moldova was ranked 77th
among 149 countries in terms of flows illegally withdrawn from the country [6].
Literature review and empirical evidence. There is a variety of approaches in defining the term
of capital flight. According to some specialists, capital flight represents a sort of reallocation of capital
from the home country to other countries due to greater opportunities for risk insurance and portfolio
diversification [3]. Another strong reason is money laundering through illegal origin of capital and its
conversion into legal income abroad.
Central banks and other government institutions, as well as financial organizations have been
continuously searching new ways of measuring the “capital flight” dimension. Due to the fact that these
flows are not recorded, all of estimations are based on the difference between recorded sources and used
funds within the country [2]. This definition was firstly developed by the specialists of the World Bank, in
1985, and is known as “residual method”. According to some specialists, this method of measuring capital
flight is most appropriate due to the fact that it allows to indirectly estimate capital flight using the balance of
payments and international assets data [8]. It estimates the country’s sources of funds in form of net increase
of external debt and the net inflow of foreign investments against the uses of these sources that are reflected
in the current account deficit and the change in foreign reserves. If the registered sources are higher than the
registered funds used than it can be assumed the existence of a capital flight from the country [2].
The residual method is widely used by international organizations like the World Bank and the
United Nations, non-governmental organizations like the Tax Justice Network, as well as academic studies.
Methodology and data. It is difficult to process the statistics of illegal outflow of capital, since it is
extremely difficult to assess this outflow methodologically, not only on the scale of all developing countries,
but also in a single country. The actual volumes of this phenomenon significantly exceed the data obtained
with the help of available national statistics. The most important estimations oh the extent of capital flight
and illicit capital flows are based on imperfect methods that allow great margin for errors and have serious
drawbacks. Due to financial problems in the countries with economies in transition, during the crisis periods,
capital is transferred towards the developed countries. In the most general sense, illegal outflow or flight of capital is a form of outflow of national assets and can be carried out in three ways:
- Firstly, by transfer of foreign assets purchased in the country abroad (cross-border outflow of capital);
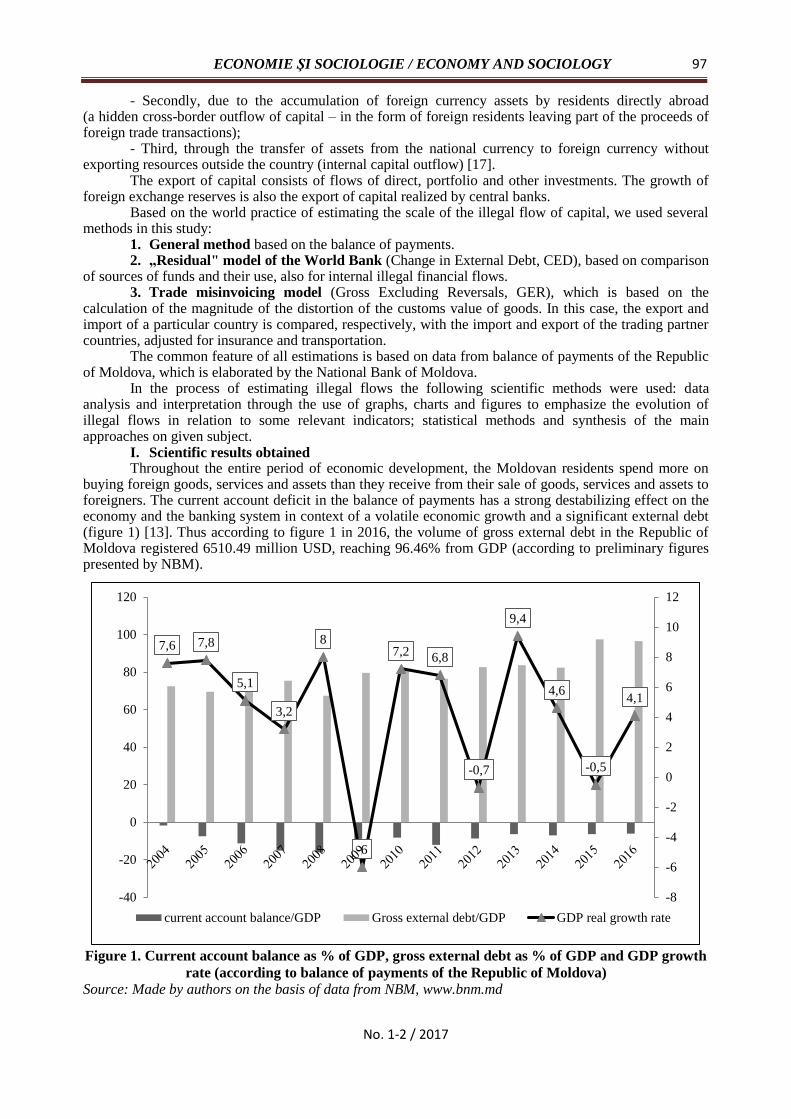
ECONOMIE ŞI SOCIOLOGIE / ECONOMY AND SOCIOLOGY
97
No. 1-2 / 2017
- Secondly, due to the accumulation of foreign currency assets by residents directly abroad (a hidden cross-border outflow of capital – in the form of foreign residents leaving part of the proceeds of foreign trade transactions);
- Third, through the transfer of assets from the national currency to foreign currency without exporting resources outside the country (internal capital outflow) [17].
The export of capital consists of flows of direct, portfolio and other investments. The growth of foreign exchange reserves is also the export of capital realized by central banks.
Based on the world practice of estimating the scale of the illegal flow of capital, we used several methods in this study:
1. General method based on the balance of payments. 2. „Residual" model of the World Bank (Change in External Debt, CED), based on comparison
of sources of funds and their use, also for internal illegal financial flows. 3. Trade misinvoicing model (Gross Excluding Reversals, GER), which is based on the
calculation of the magnitude of the distortion of the customs value of goods. In this case, the export and import of a particular country is compared, respectively, with the import and export of the trading partner countries, adjusted for insurance and transportation.
The common feature of all estimations is based on data from balance of payments of the Republic of Moldova, which is elaborated by the National Bank of Moldova.
In the process of estimating illegal flows the following scientific methods were used: data analysis and interpretation through the use of graphs, charts and figures to emphasize the evolution of illegal flows in relation to some relevant indicators; statistical methods and synthesis of the main approaches on given subject.
I. Scientific results obtained Throughout the entire period of economic development, the Moldovan residents spend more on
buying foreign goods, services and assets than they receive from their sale of goods, services and assets to foreigners. The current account deficit in the balance of payments has a strong destabilizing effect on the economy and the banking system in context of a volatile economic growth and a significant external debt (figure 1) [13]. Thus according to figure 1 in 2016, the volume of gross external debt in the Republic of Moldova registered 6510.49 million USD, reaching 96.46% from GDP (according to preliminary figures presented by NBM).
Figure 1. Current account balance as % of GDP, gross external debt as % of GDP and GDP growth
rate (according to balance of payments of the Republic of Moldova)
Source: Made by authors on the basis of data from NBM, www.bnm.md
7,6 7,8
5,1
3,2
8
-6
7,2 6,8
-0,7
9,4
4,6
-0,5
4,1
-8
-6
-4
-2
0
2
4
6
8
10
12
-40
-20
0
20
40
60
80
100
120
current account balance/GDP Gross external debt/GDP GDP real growth rate
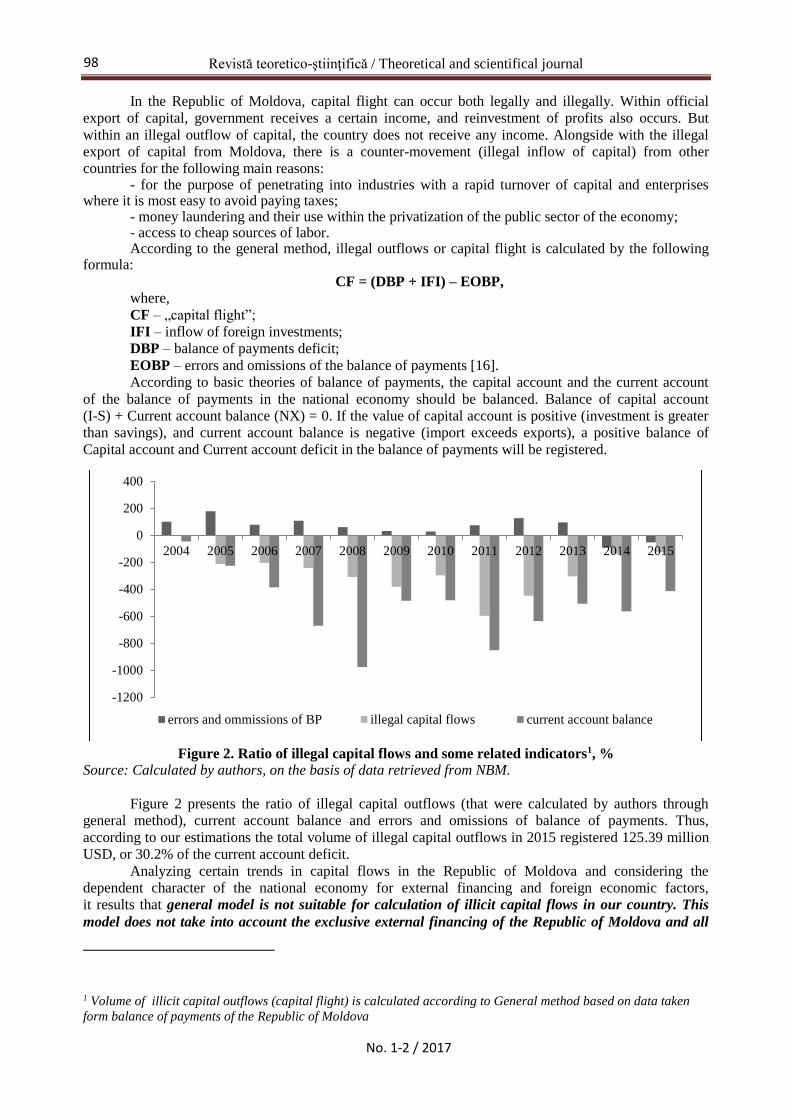
Revistă teoretico-ştiinţifică / Theoretical and scientifical journal
98
No. 1-2 / 2017
In the Republic of Moldova, capital flight can occur both legally and illegally. Within official
export of capital, government receives a certain income, and reinvestment of profits also occurs. But
within an illegal outflow of capital, the country does not receive any income. Alongside with the illegal
export of capital from Moldova, there is a counter-movement (illegal inflow of capital) from other
countries for the following main reasons: - for the purpose of penetrating into industries with a rapid turnover of capital and enterprises
where it is most easy to avoid paying taxes; - money laundering and their use within the privatization of the public sector of the economy; - access to cheap sources of labor. According to the general method, illegal outflows or capital flight is calculated by the following
formula:
CF = (DBP + IFI) – EOBP,
where,
CF – „capital flight”;
IFI – inflow of foreign investments;
DBP – balance of payments deficit;
EOBP – errors and omissions of the balance of payments [16].
According to basic theories of balance of payments, the capital account and the current account
of the balance of payments in the national economy should be balanced. Balance of capital account
(I-S) + Current account balance (NX) = 0. If the value of capital account is positive (investment is greater
than savings), and current account balance is negative (import exceeds exports), a positive balance of
Capital account and Current account deficit in the balance of payments will be registered.
Figure 2. Ratio of illegal capital flows and some related indicators1, %
Source: Calculated by authors, on the basis of data retrieved from NBM.
Figure 2 presents the ratio of illegal capital outflows (that were calculated by authors through
general method), current account balance and errors and omissions of balance of payments. Thus,
according to our estimations the total volume of illegal capital outflows in 2015 registered 125.39 million
USD, or 30.2% of the current account deficit.
Analyzing certain trends in capital flows in the Republic of Moldova and considering the
dependent character of the national economy for external financing and foreign economic factors,
it results that general model is not suitable for calculation of illicit capital flows in our country. This
model does not take into account the exclusive external financing of the Republic of Moldova and all
1 Volume of illicit capital outflows (capital flight) is calculated according to General method based on data taken
form balance of payments of the Republic of Moldova
-1200
-1000
-800
-600
-400
-200
0
200
400
2004 2005 2006 2007 2008 2009 2010 2011 2012 2013 2014 2015
errors and ommissions of BP illegal capital flows current account balance

ECONOMIE ŞI SOCIOLOGIE / ECONOMY AND SOCIOLOGY
99
No. 1-2 / 2017
long-term and short-term loans received, including sources that are used for the formation of foreign
exchange reserves. The balance of official settlements is reduced to a deficit, and debt repayment is
carried out by the National Bank of Moldova on the account of reduction of official foreign exchange
reserves and is guaranteed mainly by attracting external loans. Therefore, in the Moldovan economy, the
source of illegal capital flows is formed both due to the illegal export of goods and unofficial foreign
exchange transfers, as well as a positive balance sheet for the account of operations with capital and
financial instruments. Analyzing the current account deficit in the balance of payments of the Republic of Moldova and
considering the basic balance identities, the current account deficit is financed by the reduction of the gold
and currency reserves and by inflow of foreign capital.
For a more accurate definition of the scale of the illegal outflow of capital, we applied the
calculation of measuring illegal capital flows in Moldova used by the World Bank – the residual model.
According to this methodology, the amount of capital flight is calculated without reference to the detailed
components of the balance of payments statistics (due to the World Bank's distrust of the relevant statistics
of the debtor countries or the lack of necessary data). This methodology supposes the comparison on an
annual basis of the sources of capital inflows (that is, the net increase in external debt and the net inflow of
foreign investment) to the nature of these flows’ use (that is, the current account deficit and changes in
foreign reserves). Excess sources of funds indicate an illegal outflow of financial resources. In this way,
the residual model allows to better determine unregistered capital inflows in the balance of payments.
Such calculations are expressed by the following formula:
CF =∆ED +IFI – DBP – ∆FR,
where: ∆ – change; CF – “capital flight”; ED – amount of external debt; IFI – inflow of foreign
investments; DBP – deficit of balance of payments; FR – foreign reserves [5].
Figure 3. Illegal flows (calculated according
to residual model) and some selected indicators, in million USD
Source: Calculated by authors on the basis of data retrieved from the balance of payments of the Republic
of Moldova, www.bnm.md
Figure 3 provides the results of calculating the volume of illegal capital flows for the period of 2005-2015. Thus, after 2006 an increasing trend in the illegal outflow of capital is registered, with an increase in the volume of external debt. In 2015, the volume of external debt reached 6338,39 million USD.
In Republic of Moldova, the threat of a combination of the balance of payments crisis and the external debt crisis arises when the government increases the debt from foreign loans, the amounts of which far exceed the current account deficit. If these borrowed funds are not used for investments in the
national economy, then unused foreign loans finance the outflow of private capital from the country. In 2015, the ratio of foreign investments inflows to external debt marked robust result – 3.7%, which
demonstrates the residual method theory that unused funds “fuel” capital flight in Moldova. In Republic of Moldova, the trend of capital flows was affected by the transformational
decline in the economy during the “perestroika” period, the crisis of ’98-99s, the "flowering" of illegal trade, the unstable political conditions and the weak potential of economic institutions in the face of
-2000,00
0,00
2000,00
4000,00
6000,00
8000,00
2004 2005 2006 2007 2008 2009 2010 2011 2012 2013 2014 2015
illegal capital flows Foreing investments inflow External debt external debt change

Revistă teoretico-ştiinţifică / Theoretical and scientifical journal
100
No. 1-2 / 2017
inconsistent reforms.
The implementation of residual method within estimations of illegal flows does not suppose
detailed accuracy of calculations, but, as shown by the analysis of international organizations, it allows
us to obtain a sound macroeconomic assessment of unaccounted financial flows. The assessment of illegal flows directly affects the decision-making of foreign investors and the
level of national economy and financial system confidence. In the crisis periods of the development of the Moldovan economy, a sharp decrease in the level of foreign investment inflow is observed. So, in 2009 the level of inflow of net investments reached 135,15 million USD, decreasing by 591,46 million USD in comparison to previous year. The international financial crisis was strongly felt in Moldova in the fourth quarter of 2008, thus 2009 was deeply marked by its effects, including:
- decrease of demand both on internal market and external markets, which led to decrease of external trade;
- a substantial reduction in share capital of foreign investors; - increase of payments for foreign investments; - prevalence of reimbursements on foreign loans capitalization (including amounts attracted from
foreign investors); - allocations of SDRs by the IMF; - postpone of current payments, leading to growth of economic arrears in other sectors [1]. While applying the residual method it is necessary to understand how to estimate cash holdings of
the residents and what is the level of dollarization/euroization of economy, as well as the role of exchange rate fluctuations. Thus, if some of debt and reserves are denominated in foreign exchange currency, then any exchange rate fluctuations, even unessential, could generate changes in the total value and influence the results of the equation, which could be wrongly interpreted.
Another source for assessing capital flight is represented through estimations realized by Global Financial Integrity (GFI) within reports on illicit financial flows from developing countries. All estimations on illicit flows are based on so called „Trade misinvoicing model”.
According to GFI methodology, there are three sources that generate unrecorded movement of money across borders:
- Corrupt flows generated from proceeds of bribery and theft by officials; - Criminal flows from proceeds of drug trading, human trafficking, counterfeiting, contraband, etc. - Commercial flows generated from proceeds arising from import and export transactions and all
manipulations with customs duties, VAT taxes, income taxes, excise taxes, or other sources of government revenues.
Basically, these data sources define illicit financial flows according to GFI methodologies, which are formed from gaps in balance of payments data and gaps in trade data. In all positions where recorded sources and uses of funds in balance of payments do not match, the difference is net errors and omissions indicate an inflow or outflow that was not recorded. If bilateral trade information does not match, this shows re-invoicing of transactions between export from one country and import into another country [18].
According to the last report “Illicit financial flows from developing countries: 2004-2013”, the cumulative volume of trade misinvoicing outflows in Moldova reached over 2004-2013 period 9,079 million US dollars (see table 1 for comparing data with some other selected countries) [6].
Table 1
Trade misinvoicing outflows,
in million of US dollars, nominal (some selected countries)
2003-2009 2010 2011 2012 2013 Cumulative
Belarus 42,971 7,911 12,622 12,929 10,348 86,781
Bulgaria 9,35 0,681 1,595 1,660 1,521 14,807
Georgia 9,472 1,194 1,479 1,369 1,162 14,676
Moldova 4,889 0,784 1,268 1,131 1,007 9,079
Poland 8,613 3,041 4,612 5,115 5,006 26,387
Romania 19,394 1,885 2,462 2,544 3,199 29,484
Russian Federation 450,005 127,488 174,849 119,174 110,061 981,577
Ukraine 49,578 13,843 17,949 21,001 13,271 115,642
Source: Global Financial Integrity, Illicit financial flows from developing countries: 2004-2013,
December 2015, http://www.gfintegrity.org/wp-content/uploads/2015/12/IFF-Update_2015-Final-1.pdf
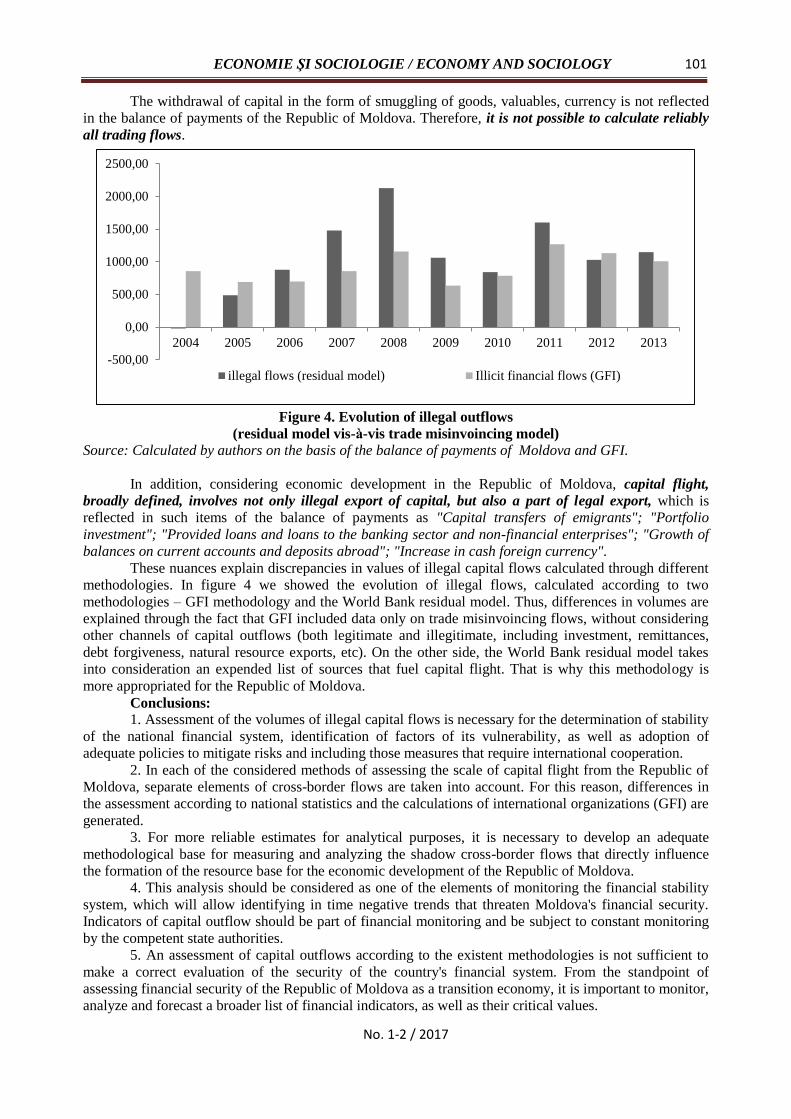
ECONOMIE ŞI SOCIOLOGIE / ECONOMY AND SOCIOLOGY
101
No. 1-2 / 2017
The withdrawal of capital in the form of smuggling of goods, valuables, currency is not reflected
in the balance of payments of the Republic of Moldova. Therefore, it is not possible to calculate reliably
all trading flows.
Figure 4. Evolution of illegal outflows
(residual model vis-à-vis trade misinvoincing model)
Source: Calculated by authors on the basis of the balance of payments of Moldova and GFI.
In addition, considering economic development in the Republic of Moldova, capital flight,
broadly defined, involves not only illegal export of capital, but also a part of legal export, which is
reflected in such items of the balance of payments as "Capital transfers of emigrants"; "Portfolio
investment"; "Provided loans and loans to the banking sector and non-financial enterprises"; "Growth of
balances on current accounts and deposits abroad"; "Increase in cash foreign currency".
These nuances explain discrepancies in values of illegal capital flows calculated through different
methodologies. In figure 4 we showed the evolution of illegal flows, calculated according to two
methodologies – GFI methodology and the World Bank residual model. Thus, differences in volumes are
explained through the fact that GFI included data only on trade misinvoincing flows, without considering
other channels of capital outflows (both legitimate and illegitimate, including investment, remittances,
debt forgiveness, natural resource exports, etc). On the other side, the World Bank residual model takes
into consideration an expended list of sources that fuel capital flight. That is why this methodology is
more appropriated for the Republic of Moldova.
Conclusions:
1. Assessment of the volumes of illegal capital flows is necessary for the determination of stability
of the national financial system, identification of factors of its vulnerability, as well as adoption of
adequate policies to mitigate risks and including those measures that require international cooperation.
2. In each of the considered methods of assessing the scale of capital flight from the Republic of
Moldova, separate elements of cross-border flows are taken into account. For this reason, differences in
the assessment according to national statistics and the calculations of international organizations (GFI) are
generated.
3. For more reliable estimates for analytical purposes, it is necessary to develop an adequate
methodological base for measuring and analyzing the shadow cross-border flows that directly influence
the formation of the resource base for the economic development of the Republic of Moldova.
4. This analysis should be considered as one of the elements of monitoring the financial stability
system, which will allow identifying in time negative trends that threaten Moldova's financial security.
Indicators of capital outflow should be part of financial monitoring and be subject to constant monitoring
by the competent state authorities.
5. An assessment of capital outflows according to the existent methodologies is not sufficient to
make a correct evaluation of the security of the country's financial system. From the standpoint of
assessing financial security of the Republic of Moldova as a transition economy, it is important to monitor,
analyze and forecast a broader list of financial indicators, as well as their critical values.
-500,00
0,00
500,00
1000,00
1500,00
2000,00
2500,00
2004 2005 2006 2007 2008 2009 2010 2011 2012 2013
illegal flows (residual model) Illicit financial flows (GFI)

Revistă teoretico-ştiinţifică / Theoretical and scientifical journal
102
No. 1-2 / 2017
REFERENCES
1. Raport Annual 2009. Banca Naţională a Moldovei [accesat 10 februarie 2017]. Disponibil:
http://www.bnm.md/files/2009_ro.pdf
2. BRADA, J., KUTAN, A., VUKSIC, G. Capital flight from Central and East European Countries:
estimates and causes. 2008, september [accesat 10 februarie 2017]. Disponibil:
https://www.cass.city.ac.uk/__data/assets/pdf_file/0006/29265/Capital_Flight_from_EE_-Sept-22.pdf
3. BUITER, W.H., SZEGVARI, I. Capital lfight and capital outflows from Russia: symptom, cause and
cure. 2002 [accesat 10 februarie 2017]. Disponibil:
http://www.ebrd.com/downloads/research/economics/workingpapers/wp0073.pdf
4. Global Financial Integrity. Illicit financial flows from developing countries: 2004-2013, December
2015 [accesat 10 februarie 2017]. Disponibil: http://www.gfintegrity.org/wp-
content/uploads/2015/12/IFF-Update_2015-Final-1.pdf
5. Central Banking Lessons from the Crisis. International Monetary Fund [accesat 10 februarie 2017].
Disponibil: https://www.imf.org/external/np/pp/eng/2010/052710.pdf
6. HARRIGAN, J., MAVROTAS, G., YUSOP, Z. On the determinants of capital flight: a new approach.
In: Journal of the Asia Pacific Economy. 2002, vol. 7, nr. 2, pp. 377-381.
7. KAR, D., CARTWRIGHT-SMITH, D. Illicit Financial Flows from Developing Countries: 2002-2006.
Global Financial Integrity. A Program of the Center for International [accesat 10 februarie 2017].
Disponibil: http://www.gfintegrity.org/storage/gfip/economist%20-%20final%20version%201-2-
09.pdf
8. NDIAYE, A.S. Impact of Capital Flight on Domestic Investment in the Franc Zone [accesat 10
februarie 2017]. Disponibil:
https://www.afdb.org/fileadmin/uploads/afdb/Documents/Knowledge/Conference_2007_anglais_13-
part-III-1.pdf
9. ПЕРЧУН, Р., ПЕТРОВА, Т. Финансовая безопасность Республики Молдова. Саарбрюккен: LAP
Lambert Academic Publishing, 2014. 119 с. ISBN 978-3-659-45754-8.
10. PERCIUN, R. Stabilitatea financiară a statului: între teorie şi practică. Chişinău: Ed. INCE, 2014. 184
p. ISBN 978-9975-9799-3-1.
11. ПЕТРОВА, Т. Методики оценки маштабов нелегальных потоков капитала для мониторинга
финансовой устойчивости Республики Молдова, In: Economic Growth in Conditions of
Globalization: international scientific and practical conference, 17-18 october 2013. Chişinău, 2013,
vol. 2, pp. 87-92. ISBN 978-9975-4185-2-2
12. TIMUŞ, V. Gestiunea fluxurilor financiare în condiţiile crizei financiare internaţionale. In: Progrese în
teoria deciziilor economice în condiţiile de risc şi incertitudine. Sisteme FUZZY în economie: sesiunea
ştiinţifică naţională, 18 septembrie 2009. Ediţia XXIV. Iaşi: Institutul de Cercetări Economice şi
Sociale „Gh. Zane”, 2009, vol. 7, pp. 154-159.
13. TIMUŞ, V., TIMUŞ, A. Reflecţii asupra surselor de vulnerabilitate ai economiei mondiale sub
incidenţa mişcării internaţionale a capitalului. In: Revista economică. 2008, nr. 1 (38), pp. 49-55.
14. СЕНЧАГОВ, В.К. Экономическая безопасность России: общий курс: учебник. 2-е издание.
Москва: Дело, 2005. 896 с. ISBN 5-7749-0391-5.
15. ЗАМЯТИН, Д.В. Бегство капитала из России и проблемы формирования государственной
экономической политики: дис. канд. экон. наук. Москва, 2004. 165 c.
16. Illicit financial flows: analitycal methodologies utilized by global financial integrity [accesat 10
februarie 2017]. Disponibil: http://www.gfintegrity.org/wp-content/uploads/2014/09/GFI-Analytics.pdf
17. KAR, D., SPANJERS, J. Illicit financial flows from developing countries: 2004-2013. 2015, december
[accesat 10 februarie 2017]. Disponibil: http://www.gfintegrity.org/wp-content/uploads/2015/12/IFF-
Update_2015-Final-1.pdf
18. BEDA, O. et al. Problems of financial stability of commercial banks in the Republic of Moldova. In:
Economie şi Sociologie = Economy and Sociology. 2015, nr. 4, pp. 49-54.
Recommended for publication: 03.04.2017
ECONOMIE ŞI SOCIOLOGIE / ECONOMY AND SOCIOLOGY
103
No. 1-2 / 2017
THE MIDDLE CLASS IN THE REPUBLIC OF MOLDOVA:
DETERMINANT FACTORS OF FORMATION
Ludmila MALCOCI1, PhD, Professor Researcher,
Sociology and Social Psychology Centre,
Political and Juridical Research Institute of the ASM, Moldova
Victor MOCANU2, PhD in sociology, Associate Professor,
Sociology and Social Psychology Centre,
Political and Juridical Research Institute of the ASM, Moldova
The research of the middle class formation process in the Republic of Moldova is of major
importance, as it allows to identify its main elements and the possibilities of formation under the current
conditions. The article presents the results of the sociological study on the premises of the middle class
formation in the Republic of Moldova, carried out during June-September 2016. The results from this
study show that the society is distributed in 6 social strata that vary by socio-professional status, level of
education and level of wellbeing. The status inconsistency and low level of status crystallisation are
characteristics for all strata within the conditions of dysfunctionality of logical chain: education-social
occupational status-welfare. As per the research, the process of classes’ formation is just at the initial
stage in the Republic of Moldova. The analysis of the social strata in terms of middle class criteria: high
socio professional status, high education level, high level of welfare, shows some prospects of formation
of the middle class in the upper strata within the following conditions: development of wage policies;
reforming tax policies by promoting the progressive taxation of income; ensuring equitable distribution of
wages according to work; elimination of corruption in power structures; improving legislation; ensuring
access of the population to decision – making process; creating favourable conditions for development of
small and medium business; development of a transparent environment for the market economy; guaranty
of fair conditions to population to ensure access to education and health services.
Keywords: social stratification, social class, socio-occupational status, social self-identification,
middle class.
Cercetarea procesului de formare a clasei medii în Republica Moldova prezintă o importanță
majoră, dat fiind faptul că permite identificarea elementelor principale ale acestuia și posibilităților de
formare în condițiile actuale. În articol sunt prezentate rezultatele studiului sociologic сu privire la
premisele formării clasei medii în Republica Moldova, efectuat în perioada iunie-septembrie 2016.
Rezultatele obținute denotă faptul că societatea este repartizată în 6 straturi sociale care diferă după
statutul socio-profesional, nivelul de educație și nivelul de bunăstare. Toate straturile sociale se
caracterizează prin inconsistența/incongruența statutului și nivelul redus de cristalizare a statutului
acestora, fapt determinat de disfuncționalitatea lanțului logic: educație – statut socio-profesional –
bunăstare. Formarea claselor este la etapa inițială în Republica Moldova. Analiza straturilor sociale din
perspectiva parametrilor clasei medii (nivel de educație înalt, statut socio-profesional înalt și nivel de
bunăstare înalt) denotă anumite premise ale creării acestei clase în straturile de sus în următoarele
condiții: dezvoltarea politicilor salariale și reformarea politicilor de impozitare prin promovarea
impozitării progresive a veniturilor; asigurarea distribuirii echitabile a salariilor în funcție de munca
depusă; eliminarea corupției din structurile puterii; perfecționarea legislației; asigurarea accesului
populației în procesul de luare a deciziilor; crearea condițiilor favorabile pentru dezvoltarea
businessului mic și mijlociu; formarea unui mediu transparent pentru dezvoltarea economiei de piață;
garantarea condițiilor echitabile pentru asigurarea accesului tuturor cetățenilor la educație și servicii
de sănătate.
Cuvinte-cheie: stratificare socială, clasă socială, statut socio-ocupațional, autoidentificare
socială, clasă medie.
1 ©Ludmila MALCOCI, [email protected] 2 ©Victor MOCANU, [email protected]

Revistă teoretico-ştiinţifică / Theoretical and scientifical journal
104
No. 1-2 / 2017
Исследование формирования среднего класса в Республике Молдова представляет особую
актуальность, так как позволяет выявить основные его элементы и возможности его становления
в современных условиях. В статье представлены основные результаты социологического
исследования о предпосылках формирования среднего класса в Республике Молдова, проведенного в
июне-сентябре 2016 года. Согласно результатам исследования, общество разделяется на шесть
социальных страт, различающихся по социально-профессиональному статусу, уровню образования
и благосостояния. Для всех страт характерны низкий уровень кристаллизации статуса
респондентов и несогласованность между различными статусами, что обусловлено
дисфункциональностью логической цепочки: уровень образования – профессиональный статус –
материальное обеспечение. Согласно исследованию, процесс формирования классов в Республике
Молдова находится на начальном этапе. Анализ социальных страт с точки зрения критериев
среднего класса: высокий социально-профессиональный статус, высокий уровень образования,
высокий уровень благосостояния, показывает некоторые перспективы формирования среднего
класса в высших стратах. Вместе с тем, развитие среднего класса возможно только при
определенных условиях: совершенствование политики в области заработной платы;
реформирование политики налогообложения, путем введения прогрессивного налога; обеспечение
справедливого распределения заработной платы; устранение коррупции; совершенствование
законодательства; обеспечение доступа населения к процессу принятия решений; создание
благоприятных, прозрачных условий для развития малого и среднего бизнеса; обеспечение
справедливого доступа всех слоев населения к образованию и медицинскому обслуживанию.
Ключевые слова: социальная стратификация, социальный класс, социально-
профессиональный статус, социальная самоидентификация, средний класс.
JEL Classification: A14, D71, M14.
UDC: 316.343.654(478)
Introduction. The importance and actuality of the social stratification research is incontestable within the conditions of socio-economic and political changes occurred in Moldova with the country's EU association. The studies conducted over the past 20 years show significant changes in the social structure of the Moldova’s population. The transition to market economy influenced the formation of new social groups, which differ by size of income, property, education, political and economic power, social status. The emergence of new social groups requires thorough and complex studies to identify their determinants, size, essential characteristics, value system, as well as their economic, social and political situation. The research on Moldova’s middle class formation premises is also important due to the fact that a strong middle class is an important indicator of both: the country's socio-economic welfare and the reforms sustainability. In accordance with existing sociological theories, as the middle class is larger, the wellbeing of the given country is higher and vice versa. The research results and conclusions served for the development of recommendations regarding the socio-economic and political changes needed to be implemented to promote the further development of the middle class at the country level. The research is important also from the practical and methodological points of view. The research data will serve as a base line for determination of size of different social strata in Moldova and the developed research methodology will be used for further researches in the field.
The theoretical-methodological approach used for measuring the middle class. The research was based on analysis of social theories related to social stratification and social classes, including the
Marxist theory 7; the Weberian theory 15, the theory of functionalists (K. Davis, W. Moore, T. Parsons,
B. Barber), the Pitirim Sorokin theory on social mobility 16, as well as the division of social classes’ theory
developed by Anthony Giddens 7. Based on those theories we concluded that the social stratification is the distribution of people in groups based on their occupation and income, wealth and social status, or social and political power. P. Sorokin identified at least three forms of stratification: 1) economical stratification (differences of property, income and lifestyle, distribution between rich and poor), 2) political stratification (different levels of prestige, rank, position, distribution of the governing and those who are governed, etc.), 3) professional stratification (different levels of education, functions, professional prestige, distribution managers and subordinates). The social inequality is the main determinant of social stratification and is
influenced by various social, political, economic and professional factors 16.
The social class means the shared lifestyle based on social factors like occupation, education, income
and wealth. According to A. Giddens, there are three classes in a contemporary society: upper class (the rich,

ECONOMIE ŞI SOCIOLOGIE / ECONOMY AND SOCIOLOGY
105
No. 1-2 / 2017
entrepreneurs, industrialists and top layer of managers, who owns or directly controls the means
of production), the middle class (which includes most "collars white" and specialists) and working class
("blue-collar" or people engaged in manual labour). Giddens notes that in some industrialized countries such
as France and Japan, an important role is assigned to the fourth class – peasants, people engaged in
traditional agricultural production. In third world peasants still constitute the largest class 7.
Based on Giddens theory we can conclude that the middle class is a group of population that
occupies a middle position between the lower class (class of poor people ) and the upper class (class of rich
people); it is a socioeconomic heterogeneous group of people with high level of vocational education from
different sectors, highly qualified professionals, managers of divisions / subdivisions , etc.; the middle class
has high level of income that meets their own economic, social and cultural needs and are owners of
immovable and movable properties.
Literature review and previous researches in the class structure show that there are various
methodological approaches for measuring the middle class in different countries. We will try to compare the
methodological approaches for measuring the middle class in USA and Russia. As per the literature review,
in USA were identified three methodological approaches for measuring the middle class: 1) based on annual
household income, 2) based on the analysis of income earned by three middle quintiles, and 3) based on
level of education. The limitation of the first approach is the lack of unique criteria and scale for determining
the level of annual income appropriate for the middle class. Thus, Brian D'Agostino (2012) identifies as
middle class households whose annual income is between $ 20,000 and $ 200,000. Elwell (2014) identifies
as middle class households with annual income on a scale from $ 19,000 to $ 91,000 and Gary Burtless
considers the middle class the group of population with an income from $ 24,000 to $ 96,000 (2000)
12, p.3. Meantime, the official poverty line for a family of four was $ 21,200 in 2010 in USA. Some of the
families included in the middle class by the above mentioned researchers were considered as poor by the US
Government. As regarding the second approach, it is based on the analysis of income earned by three middle
quintiles (determined based on household budget survey), the bottom quintile being considered as lower
middle class and the upper quintile – as upper middle class. Nobel laureate economist Robert Solow used
this approach (Estache and Leipziger 2009) and defined the middle class as 60% of those who are employed
and have salaries 12, p.3. The limitation of this approach is that it allows us to calculate the amount of
income earned by the middle class instead of the size of the middle class. The three quintiles always will be
equal to 60%. The third approach implies taking into account only the level of education. Robert Putnam
(2015), in his book "Our Kids" defined classes based on latest school attended by members of the household.
Although Putnam's book refers to the rich and poor and ignores the middle class and middle-class children, it
includes a definition of the middle class. According to Putnam, upper-class households are those where at
least one parent has a higher level of education and lower class households are those where no parent has
completed another school than secondary one. So, the middle class households are those households where
parents have a level of education higher than secondary school, but do not have finished high
level of education 12, p.5. The limitation of this methodological approach is that many families
with high level of education, but low level of income will be considered as middle class, and other families
with lower level of education, but high level of income will not be included in the middle class.
The literature review of the researches on middle class in Russia, shows also several
methodological approaches for measuring the middle class, including: 1) based on perception of respondents
regarding their affordability to buy things based on needs, 2) based on integrated indicators (level of income,
wealth, education, self-identification), and 3) based on market economy approach (level of consumption and
lifestyle) 20. In the first case, the main criteria for determining the middle class is the level of affordability
of respondents to buy things according to their needs. Thus, the middle class includes the group of
population that has income for basic needs and can procure even more expensive items. According to this
criteria, in 2001, 27% of the population could be considered as middle class in Russia. In 2010, the share of
the population that has income enough for food and clothes increased to more than half 20, p.3. The
limitation of this approach is that it is based only on subjective criteria and do not take into consideration the
objective criteria, like level of income, level of education, level of consumption, lifestyle etc. The second
methodological approach for measuring the middle class in Russia is based on using the integrated
indicators. The Institute of Sociology of the Russian Academy of Sciences used the following parameters to
measure the middle class in 2006: level of income, wealth, education, self-identification. The research found
that the middle class constitute 20-22% of the economically active population 20, p.5. The third
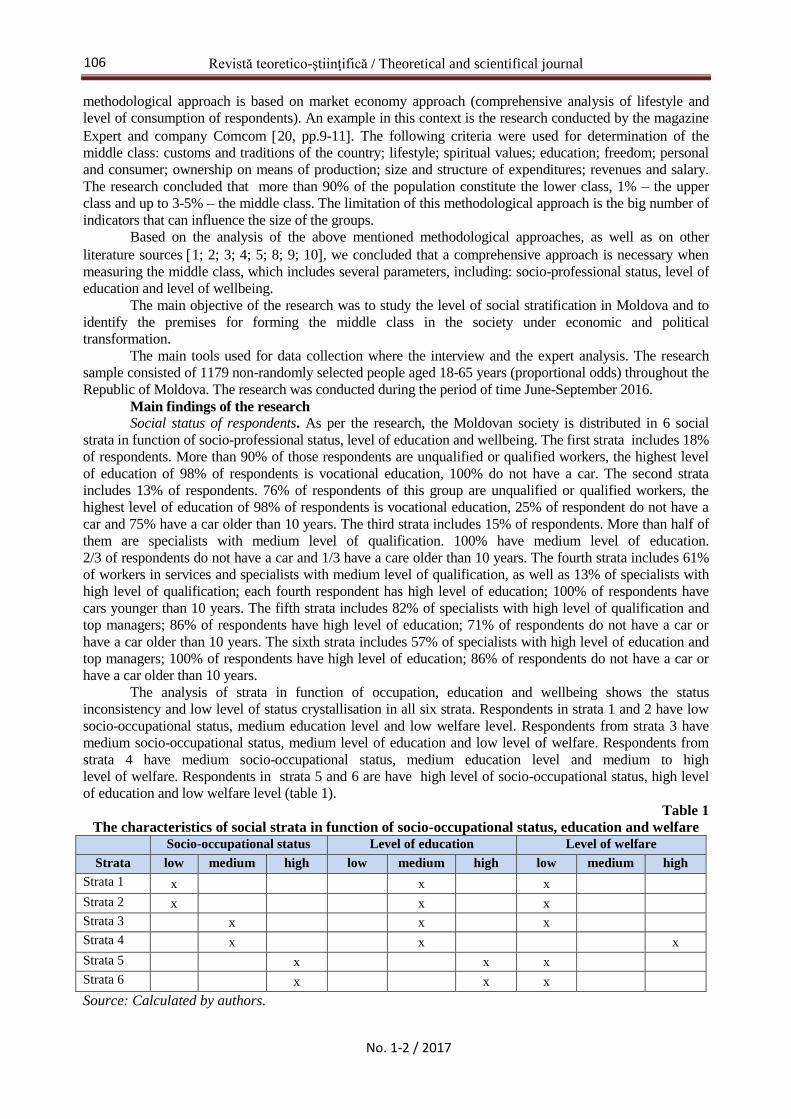
Revistă teoretico-ştiinţifică / Theoretical and scientifical journal
106
No. 1-2 / 2017
methodological approach is based on market economy approach (comprehensive analysis of lifestyle and
level of consumption of respondents). An example in this context is the research conducted by the magazine
Expert and company Comcom 20, pp.9-11. The following criteria were used for determination of the
middle class: customs and traditions of the country; lifestyle; spiritual values; education; freedom; personal
and consumer; ownership on means of production; size and structure of expenditures; revenues and salary.
The research concluded that more than 90% of the population constitute the lower class, 1% – the upper
class and up to 3-5% – the middle class. The limitation of this methodological approach is the big number of
indicators that can influence the size of the groups.
Based on the analysis of the above mentioned methodological approaches, as well as on other
literature sources 1; 2; 3; 4; 5; 8; 9; 10, we concluded that a comprehensive approach is necessary when
measuring the middle class, which includes several parameters, including: socio-professional status, level of
education and level of wellbeing.
The main objective of the research was to study the level of social stratification in Moldova and to
identify the premises for forming the middle class in the society under economic and political
transformation.
The main tools used for data collection where the interview and the expert analysis. The research
sample consisted of 1179 non-randomly selected people aged 18-65 years (proportional odds) throughout the
Republic of Moldova. The research was conducted during the period of time June-September 2016.
Main findings of the research
Social status of respondents. As per the research, the Moldovan society is distributed in 6 social
strata in function of socio-professional status, level of education and wellbeing. The first strata includes 18%
of respondents. More than 90% of those respondents are unqualified or qualified workers, the highest level
of education of 98% of respondents is vocational education, 100% do not have a car. The second strata
includes 13% of respondents. 76% of respondents of this group are unqualified or qualified workers, the
highest level of education of 98% of respondents is vocational education, 25% of respondent do not have a
car and 75% have a car older than 10 years. The third strata includes 15% of respondents. More than half of
them are specialists with medium level of qualification. 100% have medium level of education.
2/3 of respondents do not have a car and 1/3 have a care older than 10 years. The fourth strata includes 61%
of workers in services and specialists with medium level of qualification, as well as 13% of specialists with
high level of qualification; each fourth respondent has high level of education; 100% of respondents have
cars younger than 10 years. The fifth strata includes 82% of specialists with high level of qualification and
top managers; 86% of respondents have high level of education; 71% of respondents do not have a car or
have a car older than 10 years. The sixth strata includes 57% of specialists with high level of education and
top managers; 100% of respondents have high level of education; 86% of respondents do not have a car or
have a car older than 10 years.
The analysis of strata in function of occupation, education and wellbeing shows the status
inconsistency and low level of status crystallisation in all six strata. Respondents in strata 1 and 2 have low
socio-occupational status, medium education level and low welfare level. Respondents from strata 3 have
medium socio-occupational status, medium level of education and low level of welfare. Respondents from
strata 4 have medium socio-occupational status, medium education level and medium to high
level of welfare. Respondents in strata 5 and 6 are have high level of socio-occupational status, high level
of education and low welfare level (table 1).
Table 1
The characteristics of social strata in function of socio-occupational status, education and welfare Socio-occupational status Level of education Level of welfare
Strata low medium high low medium high low medium high
Strata 1 x x x
Strata 2 x x x
Strata 3 x x x
Strata 4 x x x
Strata 5 x x x
Strata 6 x x x
Source: Calculated by authors.
ECONOMIE ŞI SOCIOLOGIE / ECONOMY AND SOCIOLOGY
107
No. 1-2 / 2017
Based on the status inconsistency and low level of status crystallisation we can conclude that the
process of classes formation is just at the initial stage in the Republic of Moldova. Analysis of social strata
in terms of the middle class criteria: high socio-professional status, high education level, high level
of welfare shows some prospects of formation of the middle class in the strata 4, 5 and 6. Respondents in
strata 5 and 6 are characterized by high socio-occupational level, high education level and low welfare
level. Respondents in strata 4 are characterized by medium socio-occupational level, medium education
level and from medium to high welfare level.
Factors influencing social status. According to the research, the social status of respondents
depends on certain personal characteristics (education level, socio-occupational status, income, socio-
occupational status in the beginning of professional career); parents social status (socio-occupational
status and level of education), and social status of respondent partner (socio-occupational status and level
of education).
With reference to personal characteristics, the research shows a significant statistical association
between the following factors: a) the level of education of the respondent and his socio-occupational status
(Cramer's V = 0.139), b) the socio-occupational status of respondent and monthly income per family
member (Cramer's V = 0.218), c) the level of education of respondent and income per family member
(Cramer's V = 0.192), d) the socio-occupational status of respondent in the present and his
socio=occupational status at the first job (Cramer's V = 0.669). However the intensity of the relationship
between educations and socio-occupational status, socio-occupational status and income is poor. This fact
shows that the social transformations that took place in the Moldovan society broke the logical link
between the most important factors influencing the social status, like level of education and socio-
occupational status, level of education and income, socio-occupational status and income. This also means
that the level of education in Moldova does not always lead to high socio-occupational status and result in
a high quality of life. Within the conditions of a society with poor quality of education, high level of
corruption, shadow economy, professional promotion based on relations and affiliation with different
parties, the motivational mechanism of social stratification becomes dysfunctional. However, as per the
research, the intensity of correlation between socio-occupational status of respondents at the first job and
the current socio-occupational status is medium to high, which shows, on the one hand, the importance
of socio-occupational status at the first job for career promotion, on the other hand, argues a reduced
level of professional mobility due to underdeveloped economy, limited jobs and high unemployment.
According to the research, there is a statistically significant correlation between the following
factors: a) socio-occupational status of respondents and socio-occupational status of their parents
(Cramer's V = 0.187), and b) the level of education of respondents and the level of education of their
parents (Cramer's V = 0.266). However, the intensity is also weak.
The research has confirmed a statistically significant correlation between a) socio-occupational
status of respondents and socio-occupational status of their partners (Cramer's V = 0.231), and b) the level
of education of respondents and the level of education of their partners (Cramer's V = 0.509). However,
the intensity of the correlation between socio-occupational status of respondents and socio-occupational
status of their partners is low. As for the correlation – the level of education of respondents and the level
of education of their partners – the level of intensity is medium to high. This confirms once again that the
social stratification researches shall be household based instead of person based.
The labour activity of the respondents. As per the research, 80% of respondents are employed
and one fifth – are not employed; the share of unemployed is higher in rural areas, in the group aged
18-24, as well as in the group of respondents with low level of education.
To overcome the problems of poverty, over 1/3 of respondents work over – program (more than
41 hours per week) in their job places or have several jobs in the same time, and every tenth person is
working partially or full-time abroad. The share of those working abroad or over-program is higher in
strata 4; the share of those working part-time – is higher in strata 1; the part-time job is characteristic for
women, elderly people, students, self-employed.
Every second employed respondent is working in public institutions, 43% – in private institutions,
and every tenth – in the informal sector or in the household. Per social strata, 2/3 of respondents in strata
5 and 6 are employed in the public sector and more than half of respondents from strata 4 – in the private
sector. The share of respondents who are employed on a permanent basis and receive social insurance,
paid sick leave, annual leave is higher in the public sector than in the private one. As a result, the share
of respondents receiving social security benefits is higher in strata 5 and 6 and is lower in strata 1-4.

Revistă teoretico-ştiinţifică / Theoretical and scientifical journal
108
No. 1-2 / 2017
The share of respondents that have subordinated employees is also higher in strata 5-6.
The level of adaptability to new conditions (no fear of job loss, no fear of unemployment, no fear
to change the occupation) is higher in strata 4-5 and is lower in strata 1-3. About 1/3 of respondents have a
previous experience with unemployment or are currently unemployed. The share of those who
experienced unemployment is higher among people with low level of education, in rural area, as well as in
strata 1-3.
Income of respondents. Over 60% of respondents have a monthly income per family member
less than 2,000 lei, which also is below the subsistence minimum for 2015 (1,734 lei) or slightly above the
subsistence minimum. Every third respondent indicated a monthly income per family member between
2001 and 5000 lei and 7% – more than 5000 lei. The share of respondents with monthly income per family
member higher than 2,500 lei is higher in strata 4, 5, 6 and is lower in strata 1, 2, 3. More than half of
respondents said that their incomes are much lower than their needs, every fourth respondent said that
their income is slightly lower than their needs, and every fifth – that incomes are equal to or even higher
than their needs. The share of people with incomes much lower than their needs is higher in rural areas,
in small towns, among respondents with low level of education, as well as among respondents in strata
1-3. About 90% of respondents from strata 1, 2, 3, 5, 6 declared as their main source of income salary,
pension, and allowances. In case of strata 4.75% of respondents mentioned salary, pension, stipend as the
main source of income, and 25% – individual entrepreneurship, rent of properties, remittances.
More than 80% of respondents have properties. The share of those who do not own properties is
higher in strata 1. More than 2/3 of respondents who own properties mentioned that if they would sell all
the properties and pay all debts would still remain with some savings.
According to the research, the purchasing capacity of the respondents is quite low. Thus, more
than 2/3 of respondents could not afford to support financially a child to study abroad, more than half of
respondents cannot afford trips abroad, 90% of respondents would not be able to buy apartment,
83% – would not be able to buy the car, 46% – would not be able to buy technical equipment for the
household. The share of those who could afford to buy the mentioned above things is higher in strata
4, 5, 6 and is lower in strata 1, 2, 3.
Self-identification of respondents with social class. The majority of respondents are not aware
of the characteristics of a social class and identified themselves with the class, which in their view would
correspond more to their social position in the community, neighbourhood, and family. Thus, about 82%
identified themselves with the positions that correspond to the lower middle class (43%), core middle class
(27%) or upper middle class (12%) and only 18% identified themselves with the lower class. The share of
respondents who identified themselves with the upper middle class is higher among respondents aged
18-24 years; the share of respondents who identified themselves with the lower class is higher among
persons aged 65 years and older.
Analysis of the results of self-identification per social strata shows that the percentage of
respondents who identified themselves with the lower class or lower middle class is higher in strata 1; the
percentage of respondents who identified themselves with core middle class core is higher in strata 2 and
3; the percentage of respondents who identified themselves with – the upper middle class – is higher in
strata 4, 5, 6.
The majority of respondents believe that in Moldova exist large/very large conflicts between the
class of politicians and other citizens, between people from the top of the society and the bottom of the
society, between rich and poor persons.
According to most respondents, the factors that contribute to the promotion of people on the social
scale and their positioning in upper classes-elite circles – are as following: 1) relationships, 2) money,
welfare, 3) social origin – rich families, 4) studies and 5) political connections or party. Analysis of
respondents opinions in strata 6 (this strata includes a large number of leaders/top managers), highlighted
three basic factors that contribute to the promotion of people in upper strata: 1) relationships, 2) money,
welfare and 3) political connections or party.
Health status. Although more than 2/3 of respondents declared their health status as good and
very good, over 50% of respondents said they would feel not really good or really bad if they would be in
the situation to lift several floors or something heavy. The share of people who would feel not really good
or really bad is higher among respondents aged over 45 years, among those with low level of education, as
well as in lower strata (1, 2, 3).

ECONOMIE ŞI SOCIOLOGIE / ECONOMY AND SOCIOLOGY
109
No. 1-2 / 2017
More than 40% of respondents (in particular those with high level of education, from the urban
areas, from the upper strata) felt hurried, pressured always or frequently at his job place in the past month;
every fourth respondent (especially in rural areas, with low level of education) felt always or frequently
discouraged. Every fourth person has indicated that had some limitations, constraints at his job place,
could not finish the planned activities because of psycho-emotional state.
About 80% of respondents indicated that they do not smoke, and every fifth – that they smoke.
The percentage of those who smoke is higher in rural areas, in the aged group of 18-24, with low level of
education. About 2/3 of smokers consume more than 11 cigarettes a day.
More than 50% of respondents have a normal body mass index and each third respondent is
overweight or obese. The share of overweight or obese respondents is higher among men, people older
than 45 years, those that live in urban areas, the respondents from strata 1, 2, 3.
More than half of respondents reported that they encountered health problems in the last
12 months. The most frequently reported health problems include: back pain, high blood pressure,
migraine, allergies. The most frequently reported health problem in the lower strata are back pain and high
blood pressure. The most frequently reported health problem in the upper strata are allergies, migraine and
blood circulation.
More than 50% of respondents addressed the doctor in recent months. Every second of them
addressed the doctor more than twice. The share of respondents who addressed the doctor more than twice
is higher among those with low education, older than 45 years.
There are many respondents that eat unhealthy food frequently; they use frequently white bread,
toasted products, sweets, cakes and more rarely – vegetables and fruit. The share of men consuming
alcoholic beverages (beer, wine, brandy, and cognac) quite frequently – every day or at least once a week
is quite high.
Working conditions. More than half of respondents reported unhealthy working conditions:
working overtime, noise, dust, gas evaporation, time pressure, unhealthy competition. More than 40% of
respondents said they had a hard physical work or unhealthy competition at that their job place.
Living conditions. Over 50% of respondents have their own house / apartment, 1/3 – live in the
house / apartment of parents and only 8% – live in rent. The share of respondents with own house /
apartment increases with age and level of education. The share of respondents who own house / apartment
is higher in strata 4, 5, 6 and is lower in strata 1, 2, 3.
More than 40% of respondents reported that their house is located in a prestigious place;
1/3 said that their house is repaired according to European standards, it is connected to central heating;
60% mentioned that their house is connected to centralized water, and has bathroom / toilet in the house;
more than 70% indicated that they have the modern equipment in the kitchen and that the house is
connected to cable TV and internet. The living conditions of people depend on place of residence and
income. Thus, respondents in rural areas, small towns with low incomes, from lower strata (1, 2, 3)
indicated worse living conditions than those living in towns, that have higher incomes and are positioned
in the top strata.
Free time. The majority of respondents spend their free time working around the house or
passively: listening to music, on the Internet, meet with friends, walking. Less than 20% of respondents
play sports, go to the cinema, go to church, and make handmade or artistic activities at least once a week.
The share of people who listen to music, play sports, read books, stay on the internet, go to the cinema is
higher in the age group 18-24 years, among people with higher levels of education, among those who live
in big cities.
According to the survey, 46% of respondents are watching TV broadcasts 7 days a week, 26% –
4-6 days a week, 17% – 1-3 days a week and 11% – at all. TV watching time analysis reveals essential
differences between TV consumption on weekdays and on weekends. Thus, on weekdays, about 60% of
respondents consume 1-2 hours for watching TV, 29% – 3-4 hours, 9% – 5 hours and more. On weekends,
increase the share of respondents who watch TV 3-4 hours (from 29% to 35%) and 5hours and more (from
9% to 36%). More than 2/3 of respondents are interested in news; every second respondent is interested in
films and more than 1/3 in political programs. The share of people interested in news and political
programs increases with age and education. The share of respondents interested in news and political
programs is higher in the upper strata and lower in the bottom strata.
Every fifth respondent is involved actively or passively in the activities of public associations,
religious organizations, parents associations or some clubs. More than 80% of respondents are not
Revistă teoretico-ştiinţifică / Theoretical and scientifical journal
110
No. 1-2 / 2017
involved in public activities.
Political interest and involvement in politics. More than 2/3 of respondents said that they are
interested in politics. The share of people interested in politics is higher among men, age groups 35-44 years,
55-64 years, people with high levels of education, those from large cities, respondents in strata 2 and 6.
Although the percentage of those interested in politics is quite high, only every fifth respondent
mentioned that participated in any political action in the last five years. The share of people involved in
political activities /events is higher among men; respondents aged 18-24 years, among those with high
level of education, from cities, from the strata 5 and 6.
About 40% of respondents are ready to participate in legal political actions (strikes,
demonstrations), if someone would organize. From 6 to 11% of respondents said they are ready to
participate even in illegal political actions such as illegal strikes, blocking streets, occupying buildings,
etc. The share of people ready to participate in political actions is higher among men; people aged 18-24
years, those with high educational level, employees of private institutions, those from the informal sector
or self-employed.
2/3 of respondents indicated that they will go to vote for sure, if the elections will be organized the
next Sunday, 21% said that may be they will go to vote, and 16% will not go to vote. The share of people
who would go to vote is higher in the age groups over 45 years, among those with higher level of
education, among respondents from large cities. The percentage of those who likely would not go to vote
is highest in the age group of 18-24 years, among those with low level of education, from rural areas. The
percentage of people who would go to vote is higher in opposite strata – strata 1 and the strata 5, 6 and is
lower in strata 4. The strata 4 includes the greater share of respondents with high incomes, many who
work partially or full time abroad, as well as in several places, for more than 40 hours per week. Those
respondents have less confidence that the elections would change anything and rely more on own forces.
Conclusions
As per the research, the formation of the middle class in Moldova faces the following barriers:
a) low labour cost leading to increased poverty, including among skilled workers; b) reduced opportunities
and social mobility for persons from lower strata to advance in upper strata; c) failure of the motivational
mechanism to increase human, social and cultural capital; d) devaluation of studies as a key factor for
advancing on occupational scale, as well as for income increase; e) increased level of shadow economy,
leading to illegal salaries, limited access to social insurance / social benefits and reduced opportunities for
legal employment; j) undeveloped small and medium enterprises; z) crisis of legal system, which leads to
violations of law, selective justice and imperfect legislation; i) high level of corruption in all structures of
power and imitation of fight against corruption, leading to non – transparent approval of political and
economic decisions.
The formation of the middle class in Moldova would be possible based on strata 4, 5, 6, which are
characterized by high level of education, and high socio-occupational status, within the following
conditions: development of wage policies; reforming tax policies by promoting the progressive taxation of
income; ensuring equitable distribution of wages according to work; elimination of corruption in power
structures; improving legislation; ensuring access of the population to decision – making process; creating
favourable conditions for development of small and medium business; development of a transparent
environment for the market economy; guarantees fair conditions to population to ensure access to
education and health services.
Population values, level of economic consciousness are also of particular importance in the
process of formation of middle class. Orientations toward pragmatic values of the market economy,
increasing growth trends in human, social and cultural capital can contribute to enhancing the involvement
of population in development of different economic activities.
REFERENCES 1. BARBER, Bernard. Social Stratification. A Comparative Analysis of Structure and Process. New York:
Harcourt: Brace and Company Inc., 2011.
2. BENDIX, R., LIPSET, S.M., eds. Class, Status, and Power. New York: Free Press, 1966.
3. CLARK, Terry Nichols., LIPSET, Seymour Martin. Are Social Classes Dying? In: International
Sociology. 1991, vol. 6, no. 4, pp. 397-410 [accesat 25 noiembrie 2016]. Disponibil:
http://isites.harvard.edu/fs/docs/icb.topic1049846.files/Unit%201%20Readings/clark_lipsit.pdf
4. DOGAN, Mattei. Status Incongruence in Advanced Societies [accesat 26 noiembrie 2016]. Disponibil:
ECONOMIE ŞI SOCIOLOGIE / ECONOMY AND SOCIOLOGY
111
No. 1-2 / 2017
http://www.fupress.net/index.php/smp/article/download/10332/9517
5. DOMAŃSKI, Henryk, SAWIŃSKI, Zbigniew, SŁOMCZYŃSKI, Kazimierz M. Sociological Tools
Measuring Occupations. New Classification and Scales. Warsaw: IfIS Publishers, 2009. 332 p. ISBN
978-83-7388-177-8 [accesat 25 noiembrie 2016]. Disponibil:
http://rcin.org.pl/Content/48420/WA004_51894_P83131_Domanski-Sociolo_op1h.pdf
6. FULTON, D., FURMAN, D., FINLAY, N. A longitudinal study of the middle class: Growth, size and
marketing strategies [accesat 26 noiembrie 2016]. Disponibil:
http://www.aabri.com/manuscripts/142031.pdf
7. GIDDENS, Anthony, SUTTON, Philip W. Sociology [accesat 26 noiembrie 2016]. Disponibil:
http://www.gumer.info/bibliotek_Buks/Sociolog/gidd/07.php#_ftnref1
8. ERIKSON, Robert, JONSSON, Janne O. How to ascertain the socio-structural position of the individual
in society. [accesat 25 noiembrie 2016]. Disponibil:
https://www.europeansocialsurvey.org/docs/methodology/core_ess_questionnaire/ESS_core_questionnair
e_measuring_social_structure.pdf
9. KELLEY, Jonathan, PERLMAN, Melvin L. Social Mobility in Toro: Some Preliminary Results from
Western Uganda. In: Economic Development and Cultural Change. 1971, vol. 19, pp. 204-221 [accesat
26 noiembrie 2016]. Disponibil: http://www.international-
survey.org/Social%20Mobility%20in%20Toro%201971.pdf
10. Middle class in Ukraine: Identification Criteria. Kiev: «Zapovit» Publishing House, 2014. 64 p. ISBN
978-966-2050-04-2 [accesat 25 noiembrie 2016]. Disponibil:
http://fnst.org/sites/default/files/uploads/2016/08/02/1416488152file1.pdf
11. PARSONS, P. Essays in Sociological Theory. Glencoe: Free Press, 1949. 166 p.
12. PRESSMAN, Steven. Defining and Measuring the Middle Class. In: Working Paper. 2015, nr. 007,
pp. 1-27. [accesat 26 noiembrie 2016]. Disponibil:
https://www.aier.org/sites/default/files/Files/Documents/Standard/WP007-Middle%20Class.pdf
13. RADULEȚ-PAVELEA, Ani. Stratificarea socială. In: Revista Transilvană de Ştiinţe ale Comunicării.
2011, nr. 3 (14), pp. 93-104 [accesat 26 noiembrie 2016].
Disponibil: http://ekphrasis.accentpublisher.ro/files/articles_content/353/7%20RTSC%2014.pdf
14. SHAH, Shelly. Social Stratification: Meaning, Origin, Development and other Details [accesat 26
noiembrie 2016]. Disponibil: http://www.sociologydiscussion.com/social-stratification/social-
stratification-meaning-origin-development-and-other-details/2260
15. SHORTELL, Timothy. Weber's Theory of Social Class [accesat 25 noiembrie 2016]. Disponibil:
http://www.brooklynsoc.org/courses/43.1/weber.html
16. SOROKIN, Pitirim. Social and Cultural Mobility. NewYork: Free Press, 1959. [accesat 25 noiembrie
2016]. Disponibil: http://media.pfeiffer.edu/lridener/DSS/Sorokin/SOCMOBLT.HTML
17. TARKHNISHVILI, Anna, TARKHNISHVILI, Levan. Middle Class: Definition, Role and Development.
In: Global Journal of Human Social Science. Sociology & Culture. 2013, volume 13, issue 7, pp. 21-31.
ISSN 2249-460X [accesat 25 noiembrie 2016]. Disponibil:
https://globaljournals.org/GJHSS_Volume13/3-Middle-Class-Definition-Role-and-Development.pdf
18. АВРААМОВА, Е. Формирование среднего класса в России: определение, методология,
количественные оценки. В: Общественные Науки и Современность. 2002, № 1, сс. 17-24 [accesat 25
noiembrie 2016]. Disponibil: http://ecsocman.hse.ru/data/799/893/1231/2.pdf
19. БАКШТАНОВСКИЙ, В., СОГОМОНОВ, Ю. Этос среднего класса: Нормативная модель и отечественные реалии. Тюмень, 2000. 272 с. [accesat 25 noiembrie 2016]. Disponibil:
http://www.tyuiu.ru/wp-content/uploads/2015/10/Bakshtanovskij-V.I.-Sogomonov-YU.V.-Etos-srednego-
klassa.pdf
20. СОБОЛЕВ, Алексей Евгеньевич. Дифференциация подходов к исследованию среднего класса в
стратификационной модели современного российского общества: aвтореферат на соискание
степени кандидата социологических наук : 22.00.04 - Социальная структура, социальные
институты и процессы. Mосква, 2013. 135 c. [accesat 26 noiembrie 2016]. Disponibil:
http://www.dissercat.com/content/differentsiatsiya-podkhodov-k-issledovaniyu-srednego-klassa-v-
stratifikatsionnoi-modeli-sovr
21. MOCANU, Victor. Autoidentificarea populaţiei în ierarhia socială a Republicii Moldova = Population's
self-identification in the social hierarchy of the Republic of Moldova. In: Economie şi sociologie =
Economy and sociology. 2012, nr. 3, pp. 182-192. ISSN 1857-4130.
Recommended for publication: 14.04.2017

Revistă teoretico-ştiinţifică / Theoretical and scientifical journal
112
No. 1-2 / 2017
MONETARY RECEIPTS FROM ABROAD TO INDIVIDUALS:
EVALUATION METHODS
Mihail POISIC1, PhD, Senior Researcher,
National Institute for Economic Research, Moldova
The commonly used approaches for assessing the volume of foreign currency flows to individuals
provide estimates, which do not entirely reflect the total amount of foreign currency in cash introduced in
the country. When these differences are significant, as in the case of the Republic of Moldova, it is
necessary to apply additional methods for obtaining reliable estimates on the volume of monetary flows.
The article presents the results of the research on a reliable estimation of the foreign currency flows to
individuals. The methodological basis of the research consists in the analysis of the dynamic series of
foreign exchange and cash flows, comparison method, other methodological approaches for the
estimation of foreign currency flows. According to the research, foreign exchange flows to individuals are
one third higher than official ones. These estimates give a meaningful assessment of the level of consumer
demand as well as other parameters of financial flows in the country.
Keywords: migrants, remittances, the balance of exchange offices, payment balance, currency
exchange, cash.
Abordările frecvent utilizate pentru evaluarea volumului fluxurilor valutare din străinătate către
persoanele fizice furnizează estimări ce nu reflectă suma totală de valută străină în numerar introdusă în
țară. Când aceste diferențe sunt semnificative, ca în cazul Republicii Moldova, este necesar de a recurge
la metode suplimentare pentru a obține estimări mai fiabile privind volumul fluxurilor bănești. Articolul
prezintă rezultatele cercetării cu privire la determinarea relevantă a fluxurilor de valută străină către
persoanele fizice. Baza metodologică a cercetării a constituit analiza seriilor dinamice ale fluxurilor
valutare de numerar și prin virament, metoda de comparație, alte abordări metodologice pentru
estimarea fluxurilor valutare. Potrivit cercetării, fluxurile valutare către persoanele fizice sunt cu o treime
mai mari decât arată instituțiile oficiale. Aceste estimări permit o evaluare relevantă a nivelului cererii de
consum, precum și a altor parametri de fluxuri financiare în țară.
Cuvinte-cheie: migranți, remiteri, soldul caselor de schimb valutar, balanța de plăți, schimb
valutar, numerar.
Общепринятые подходы в оценке объёмов валютных поступлений из-за рубежа в адрес
физических лиц дают оценки, которые не отражают в полной мере количество наличности
в иностранной валюте, ввозимой в страну. И когда эти расхождения значительны, как в
Республике Молдова, требуются дополнительные методы, позволяющие получить более
достоверные данные о масштабах денежных потоков в стране. В статье представлены
результаты исследования по определению более репрезентативные данных о денежных
поступлениях из-за рубежа в адрес физических лиц. Методологической основой исследования
является анализ динамических рядов движения безналичной и наличной иностранной валюты,
метод сравнения и другие методологические подходы оценки валютных потоков. Согласно
полученным результатам поступления иностранной валюты из-за рубежа в адрес физических лиц
более чем на треть превышают официальные данные. Сделанные оценки позволяют более
адекватно определять уровень потребительского спроса, а также другие параметры финансовых
потоков в стране.
Ключевые слова: мигранты, денежные переводы, cальдо валютных касс, платёжный
баланс, иностранная валюта, наличность.
JEL Classification: F2, F3.
UDC: 336.74+331.556.46
1© Mihail POISIC, [email protected]

ECONOMIE ŞI SOCIOLOGIE / ECONOMY AND SOCIOLOGY
113
No. 1-2 / 2017
The World Bank [3], as well as various expert organizations [1] deal with the problems of
population migration and its impact on the economy of the states, in the most consistent and detailed
manner. The publication of a large number of researchers [6-10] is devoted to them.
The emigration of a large scale of working age population raised a serious problem, the deficit of
skilled labour force for the organization of production in the country.
The amount of foreign currency coming from abroad to individuals, in a number of countries with
a depressed economy, has become so significant that it determines the income level of the population [6].
A significant part of the currency is imported into the country in cash, which, unfortunately, is not
fully taken into account by state structures in terms of an adequate assessment of these currency flows,
consumer demand and other problems of social and economic development.
Nevertheless, the reporting data of the National Bank of Moldova, allow making quite
representative estimates of the amounts of foreign currency inflow to individuals. The study aims to solve
this problem.
The study is based on the statistical reports of the National Bank of Moldova, World Bank reports,
other sources of information, including different monographic studies, for the last 10 years.
According to the National Bureau of Statistics data, the number of jobs in the formal sector is
declining. During the period of "pro-European governance", since 2008, their number decreased to 776.2
thousand, by 85.2 thousand (9.9%), including for 2016 – by 9.0 thousand. Because of the discontent and
hopelessness of the situation in the country, Moldovan citizens go abroad massively. Their total number is
huge. A number of experts estimate it at more than one million. However, the official statistics data for
2016 on the number of persons that went abroad to work in search for a job amounts for 319.0 thousand
people [2].
The Ministry of Foreign Affairs and European Integration carries out its own accounting. At the
end of 2014, it reported a number of citizens of the Republic of Moldova who were at that time abroad, of
805 509 people. Most of them were in Russia – 477949 people, Italy – 142266 people and
USA – 47754. Large Moldovan diasporas were recorded in Canada – 17565 people, Ukraine – 17 237,
Spain – 16202, Germany – 14815 and Israel – 13005. About 45 countries were present in the list [10].
Many of them have families at home that they support financially. In addition, a number of
citizens work for foreign organizations, receiving there a salary in foreign currency, other monetary
receipts come from immigrants into the Republic of Moldova. All of these, as well as other sources are
forming the flow of foreign currency for individuals. These revenues, taking into account their scale, are
of particular importance for the economy of the Republic of Moldova.
In recent years, the scale of monetary receipts from abroad to individuals has played a decisive role
in shaping consumer demand in the Republic of Moldova, filling the state budget, primarily through VAT,
excise taxes and customs duties on imports, as well as in smoothing out a number of negative trends in the
economy and social sphere of the country. At the same time, the data on the sizes of these revenues, given in
various sources, are substantially underestimated.
In general, the inflow of foreign currency to individuals in previous years grew at a high rate and
began to exceed the payroll fund in all sectors of the economy, which in 2013 amounted to 2372.9 million
US dollars, which was calculated by multiplying the average money income of the population to its
number. Then, in the subsequent years, the average annual rate of the national currency decreased
drastically from 12.5907 lei per dollar to 19.9238 lei in 2016. This was the result of thefts in November
2014 from the banking sector of monetary amounts equivalent to one billion EUR. As a result, the payroll,
despite the growth in the national currency, amounted only 1854.2 million US dollars. The conclusion is
made based on the 3555.2 thousand inhabitant people at the end of 2014, which is given by the official
statistics. At the same time, as it became known from the results of the 2014 census, the population in
Moldova was only 2 913 281 people. It means, that the total wage fund in the country is with 18.1% less.
The currency, coming from abroad, largely formed the domestic consumer demand and covered
about two times the excess of imports over exports. The state budget received more than half of VAT and
excises from imports. Jobs and services in the spheres of trade were created. Given the scale of these cash
receipts and their impact on the economy of the state, it is extremely important adequately assess the
amount of money coming from abroad to individuals.
At the same time, experts usually consider two indicators: Money Transfers from Abroad in Favor
of Individuals (on gross basis) and (net basis). Both are calculated according to the Activity indicators
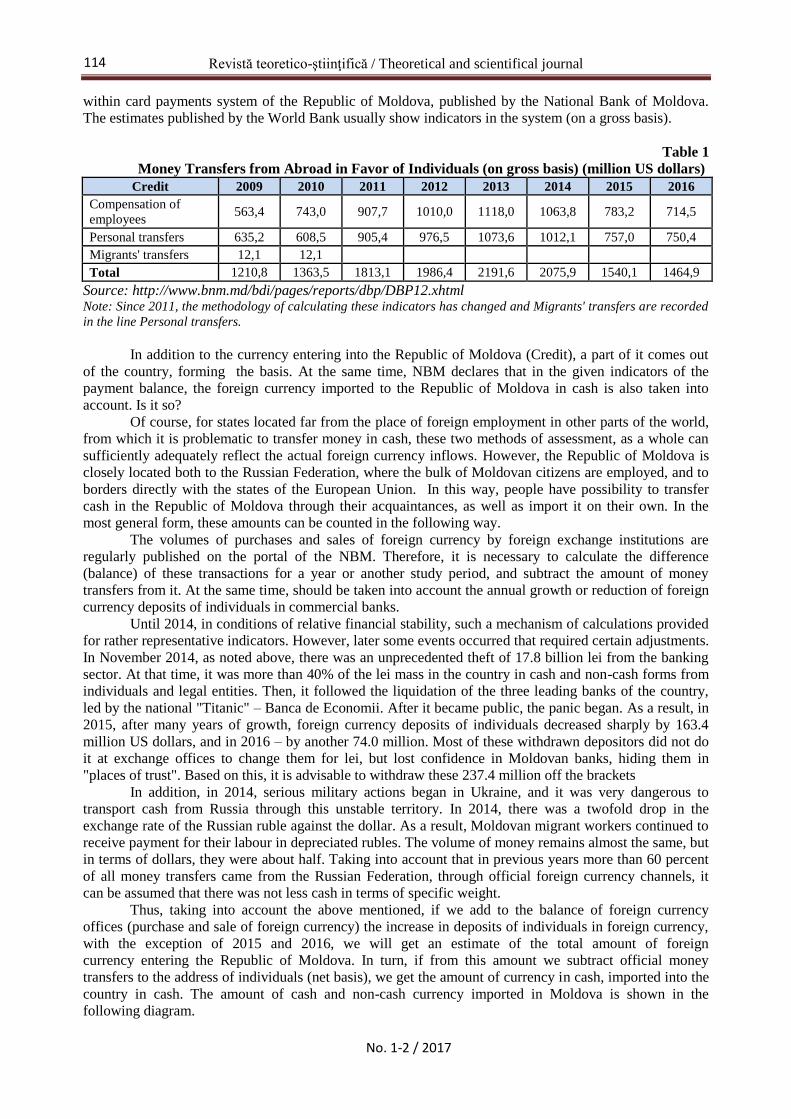
Revistă teoretico-ştiinţifică / Theoretical and scientifical journal
114
No. 1-2 / 2017
within card payments system of the Republic of Moldova, published by the National Bank of Moldova.
The estimates published by the World Bank usually show indicators in the system (on a gross basis).
Table 1
Money Transfers from Abroad in Favor of Individuals (on gross basis) (million US dollars)
Credit 2009 2010 2011 2012 2013 2014 2015 2016
Compensation of
employees 563,4 743,0 907,7 1010,0 1118,0 1063,8 783,2 714,5
Personal transfers 635,2 608,5 905,4 976,5 1073,6 1012,1 757,0 750,4
Migrants' transfers 12,1 12,1
Total 1210,8 1363,5 1813,1 1986,4 2191,6 2075,9 1540,1 1464,9
Source: http://www.bnm.md/bdi/pages/reports/dbp/DBP12.xhtml Note: Since 2011, the methodology of calculating these indicators has changed and Migrants' transfers are recorded
in the line Personal transfers.
In addition to the currency entering into the Republic of Moldova (Credit), a part of it comes out
of the country, forming the basis. At the same time, NBM declares that in the given indicators of the
payment balance, the foreign currency imported to the Republic of Moldova in cash is also taken into
account. Is it so?
Of course, for states located far from the place of foreign employment in other parts of the world,
from which it is problematic to transfer money in cash, these two methods of assessment, as a whole can
sufficiently adequately reflect the actual foreign currency inflows. However, the Republic of Moldova is
closely located both to the Russian Federation, where the bulk of Moldovan citizens are employed, and to
borders directly with the states of the European Union. In this way, people have possibility to transfer
cash in the Republic of Moldova through their acquaintances, as well as import it on their own. In the
most general form, these amounts can be counted in the following way.
The volumes of purchases and sales of foreign currency by foreign exchange institutions are
regularly published on the portal of the NBM. Therefore, it is necessary to calculate the difference
(balance) of these transactions for a year or another study period, and subtract the amount of money
transfers from it. At the same time, should be taken into account the annual growth or reduction of foreign
currency deposits of individuals in commercial banks.
Until 2014, in conditions of relative financial stability, such a mechanism of calculations provided
for rather representative indicators. However, later some events occurred that required certain adjustments.
In November 2014, as noted above, there was an unprecedented theft of 17.8 billion lei from the banking
sector. At that time, it was more than 40% of the lei mass in the country in cash and non-cash forms from
individuals and legal entities. Then, it followed the liquidation of the three leading banks of the country,
led by the national "Titanic" – Banca de Economii. After it became public, the panic began. As a result, in
2015, after many years of growth, foreign currency deposits of individuals decreased sharply by 163.4
million US dollars, and in 2016 – by another 74.0 million. Most of these withdrawn depositors did not do
it at exchange offices to change them for lei, but lost confidence in Moldovan banks, hiding them in
"places of trust". Based on this, it is advisable to withdraw these 237.4 million off the brackets
In addition, in 2014, serious military actions began in Ukraine, and it was very dangerous to
transport cash from Russia through this unstable territory. In 2014, there was a twofold drop in the
exchange rate of the Russian ruble against the dollar. As a result, Moldovan migrant workers continued to
receive payment for their labour in depreciated rubles. The volume of money remains almost the same, but
in terms of dollars, they were about half. Taking into account that in previous years more than 60 percent
of all money transfers came from the Russian Federation, through official foreign currency channels, it
can be assumed that there was not less cash in terms of specific weight.
Thus, taking into account the above mentioned, if we add to the balance of foreign currency
offices (purchase and sale of foreign currency) the increase in deposits of individuals in foreign currency,
with the exception of 2015 and 2016, we will get an estimate of the total amount of foreign
currency entering the Republic of Moldova. In turn, if from this amount we subtract official money
transfers to the address of individuals (net basis), we get the amount of currency in cash, imported into the
country in cash. The amount of cash and non-cash currency imported in Moldova is shown in the
following diagram.
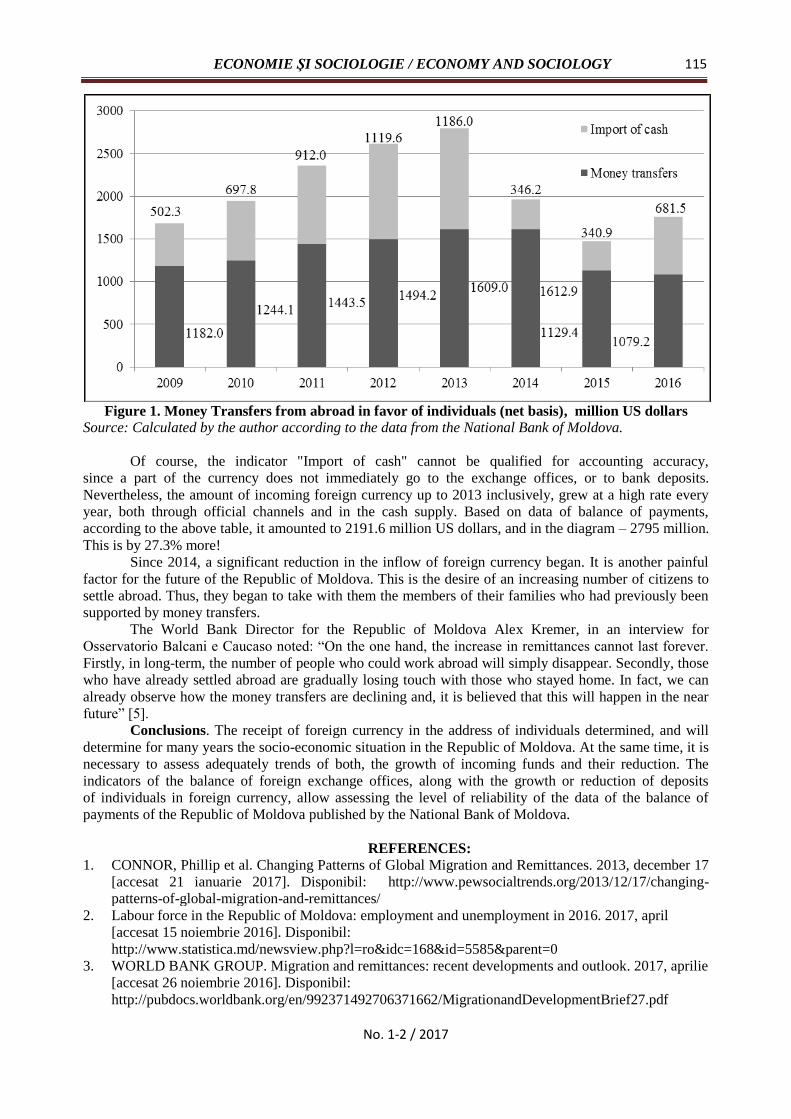
ECONOMIE ŞI SOCIOLOGIE / ECONOMY AND SOCIOLOGY
115
No. 1-2 / 2017
Figure 1. Money Transfers from abroad in favor of individuals (net basis), million US dollars
Source: Calculated by the author according to the data from the National Bank of Moldova.
Of course, the indicator "Import of cash" cannot be qualified for accounting accuracy,
since a part of the currency does not immediately go to the exchange offices, or to bank deposits.
Nevertheless, the amount of incoming foreign currency up to 2013 inclusively, grew at a high rate every
year, both through official channels and in the cash supply. Based on data of balance of payments,
according to the above table, it amounted to 2191.6 million US dollars, and in the diagram – 2795 million.
This is by 27.3% more!
Since 2014, a significant reduction in the inflow of foreign currency began. It is another painful
factor for the future of the Republic of Moldova. This is the desire of an increasing number of citizens to
settle abroad. Thus, they began to take with them the members of their families who had previously been
supported by money transfers.
The World Bank Director for the Republic of Moldova Alex Kremer, in an interview for
Osservatorio Balcani e Caucaso noted: “On the one hand, the increase in remittances cannot last forever.
Firstly, in long-term, the number of people who could work abroad will simply disappear. Secondly, those
who have already settled abroad are gradually losing touch with those who stayed home. In fact, we can
already observe how the money transfers are declining and, it is believed that this will happen in the near
future” [5].
Conclusions. The receipt of foreign currency in the address of individuals determined, and will
determine for many years the socio-economic situation in the Republic of Moldova. At the same time, it is
necessary to assess adequately trends of both, the growth of incoming funds and their reduction. The
indicators of the balance of foreign exchange offices, along with the growth or reduction of deposits
of individuals in foreign currency, allow assessing the level of reliability of the data of the balance of
payments of the Republic of Moldova published by the National Bank of Moldova.
REFERENCES: 1. CONNOR, Phillip et al. Changing Patterns of Global Migration and Remittances. 2013, december 17
[accesat 21 ianuarie 2017]. Disponibil: http://www.pewsocialtrends.org/2013/12/17/changing-
patterns-of-global-migration-and-remittances/
2. Labour force in the Republic of Moldova: employment and unemployment in 2016. 2017, april
[accesat 15 noiembrie 2016]. Disponibil:
http://www.statistica.md/newsview.php?l=ro&idc=168&id=5585&parent=0
3. WORLD BANK GROUP. Migration and remittances: recent developments and outlook. 2017, aprilie
[accesat 26 noiembrie 2016]. Disponibil:
http://pubdocs.worldbank.org/en/992371492706371662/MigrationandDevelopmentBrief27.pdf

Revistă teoretico-ştiinţifică / Theoretical and scientifical journal
116
No. 1-2 / 2017
4. Money Transfers from Abroad in Favor of Individuals [accesat 26 noiembrie 2016]. Disponibil:
http://bnm.md/bdi/pages/reports/dbp/DBP4.xhtml;jsessionid=24d6b88b0cba0adef1b322adeebd
5. Всемирный банк делает печальные прогнозы для РМ: Денежные переводы – основной фактор
снижения уровня бедности – в ближайшее время сократятся еще больше; Единственное
решение – борьба с коррупцией. 2016 [accesat 26 noiembrie 2016]. Disponibil:
http://jurnal.md/ru/economic/2016/12/29/vsemirnyj-bank-delaet-pecal-nye-prognozy-dla-rm-
deneznye-perevody-osnovnoj-faktor-snizenia-urovna-bednosti-v-blizajsee-vrema-sokratatsa-ese-bol-
se-edinstvennoe-resenie-bor-ba-s-korrupciej
6. АБДУЛАЕВА, А.Т. Трудовая миграция, как фактор социальной стабильности в Республике
Таджикистан. Вестник Таджикского государственного университета права, бизнеса и
политики. 2013 [accesat 15 noiembrie 2016]. Disponibil:
https://cyberleninka.ru/article/v/trudovaya-migratsiya-kak-faktor-sotsialnoy-stabilnosti-v-respublike-
tadzhikistan
7. ГЛУМСКОВ, В. В Индии некому работать. 2006 [accesat 15 noiembrie 2016]. Disponibil:
http://expert.ru/kazakhstan/2006/43/v_indii_nekomu_rabotat/
8. КИСЛОВА, О.Е. Трудовая миграция в зарубежных странах: анализ причин и последствий.
2015 [accesat 11 februarie 2017]. Disponibil: https://cyberleninka.ru/article/v/trudovaya-
migratsiya-v-zarubezhnyh-stranah-analiz-prichin-i-posledstviy
9. ПОЙСИК, М. Экономическая жизнь Молдовы: состояние и перспективы. В: Молдово-
Приднестроский регион. 2016, № 5-6, октябрь, сс. 63-66. ISSN 2221-1209.
10. ПОЙСИК, М. Макроэкономические показатели страны и тенденции энергетического сектора.
In: Energetica Moldovei-2016. Aspecte regionale de dezvoltare: conferinţă internaţională, 29
septembrie-1 octombrie 2016, Ediţia a 3-a. Институт энергетики АНМ. Chisinau, 2016, pp. 83-89.
11. Официальные данные: за рубежом работают 805 509 молдаван. 2016, 30 августа [accesat 15
noiembrie 2016]. Disponibil: http://www.allmoldova.com/ru/news/ofitsial-nyie-dannyie-za-
rubiezhom-rabotaiut-805-509-moldavan
12. LAZARI, Silvia. Migration issues and their economic impact. In: Economie şi sociologie = Economy
and sociology. 2015, nr. 4, pp. 43-48. ISSN 1857-4130.
Recommended for publication: 17.05.2017

ECONOMIE ŞI SOCIOLOGIE / ECONOMY AND SOCIOLOGY
117
No. 1-2 / 2017
THE COMPETITIVENESS OF THE AGRIFOOD SECTOR
FROM THE REPUBLIC OF MOLDOVA IN THE FIELD
OF ALIMENTARY PRODUCTS OF PLANT AND ANIMAL ORIGIN
Elena SCERBACOV 1, PhD, University Lecturer,
The State Agrarian University of Moldova
Competitiveness is a category that expresses the economic, technical, scientific, production,
managerial, organizational, marketing, etc. possibilities of an enterprise, branch, country's economy,
which is focused on goods and services, both on the domestic markets and on external ones. This work
aims to analyze the competitiveness of the agrifood sector of the Republic of Moldova through the prism of
trade with food products of vegetable and animal origin. In the investigation process there were used
methods of analysis, synthesis and comparison, and the informational base constituted recent works from
the field as well as statistical reports of the NBS. The obtained results show that the fruits and nuts,
cereals, oilseeds and oleaginous fruits predominate in Moldovan export of food products of vegetable
origin. The reduction in the import of the food products of animal origin during the analyzed period is
explained by the fact that the livestock sector has suffered from droughts from the recent years and many
farmers have had to sacrifice a part of cattle and poultry livestock.
Keywords: competitiveness, trade, agrifood sector, export, import, alimentary products.
Competitivitatea este o categorie care exprimă posibilitățile economice, tehnico-științifice, de
producție, manageriale, organizatorice, de marketing etc. ale unei întreprinderi, ramuri, economii a țării,
care se concretizează în mărfuri și servicii, atât pe piețele interne, cât și pe cele externe. Studiul are drept
scop analiza competitivitătii sectorului agroalimentar al Republicii Moldova prin prisma comerțului cu
produse alimentare de origine vegetală și animalieră. În procesul investigației au fost utilizate metodele
analizei, sintezei și comparației, iar baza informațională a constituit-o lucrările recente din domeniu,
precum și rapoartele statistice ale BNS. Rezultatele obținute arată că în exportul Republicii Moldova de
produse alimentare de origine vegetală predomină fructele și nucile, cerealele, semințele și fructele
oleaginoase. Reducerea importului de produse alimentare de origine animală în perioada analizată se
explică prin faptul că sectorul zootehnic a suferit de pe urma secetelor din ultimii ani și mulți fermieri au
fost nevoiți să sacrifice o parte din șeptelul de animale și păsări.
Cuvinte-cheie: competitivitate, comert, sector agroalimentar, export, import, produse alimentare.
Конкурентоспособность является категорией, которая выражает экономические, научно-
технические, производственные, управленческие, организационные, маркетинговые и т.д.
возможности предприятия, отрасли, экономики страны, которая находит свое отражение в
товарах и услугах, как на внутреннем, так и внешнем рынке. Целью данной работы является
анализ конкурентоспособности агропродовольственного сектора Республики Молдова с точки
зрения торговли пищевыми продуктами растительного и животного происхождения. В процессе
исследования были использованы методы анализа, синтеза и сравнения, а информационную базу
составили последние работы в данной области, а также статистические отчёты НБС.
Полученные результаты показывают, что в экспорте пищевых продуктов растительного
происхождения Республики Молдова преобладают фрукты и орехи, зерновые, масличные семена и
плоды. Уменьшение импорта пищевых продуктов животного происхождения в течение
анализируемого периода объясняется тем, что в последние годы сектор животноводства
пострадал от засух и многие фермеры были вынуждены забить часть поголовья скота и птиц.
Ключевые слова: конкурентоспособность, торговля, агропродовольственный сектор,
экспорт, импорт, пищевые продукты.
JEL Classification: F11, L66, Q18.
UDC: 338.439.5:339.137.2](478)
1 © Elena SCERBACOV, [email protected]
Revistă teoretico-ştiinţifică / Theoretical and scientifical journal
118
No. 1-2 / 2017
Introduction. In a functional economy, the allocation and the use of resources is based on competitiveness criteria, in a transparent economic framework dominated by market forces. The idea that we want to promote can be summarized in a few words: in a world of increasing interdependences, competitiveness is the motor of development and economic growth.
A lot of arguments plead for the study of the competitiveness: - the globalization trends, the fortification of integration processes, as well as the food system’s
current global crisis determine the necessity of increasing the production competitiveness of the national agroindustrial complex;
- in the conditions of the open economy, high production competitiveness allows selling of the production on the global markets,this fact permits the entry of foreign currency and, as a result, obtaining a positive trade balance;
- on the global food markets the orientation towards quality is growing. The first conceptual delimitations of competitiveness were stated by economists, but over time,
managers, businessmen and marketing specialists brought substantial amendments to classical approaches which have exacerbated the number of "definitions" of this phenomenon. The intensity of supporting the competitiveness importance in policies’s analysis and design at micro and macroeconomic level fluctuated in time, there existed pros and cons related to the importance of this issue, as well as divergent views regarding the approach to this subject.
In their researches, our scientists define competitiveness as a complex economic phenomenon that is specific to the contemporary economy, which has a special importance both in the creation and added value distribution process within the national economic system, as well as in the efficient integration process of the Republic of Moldova into the international economic circuit. They also pay a particular attention to the defining characteristics of the competitiveness, they highlight the determinant competitiveness factors and determine the interactions between the competitiveness concept of the national economy with other economic and social life concepts and fields (economic growth and development, sustainable development, productivity, globalization, national and economic security etc.). National economic competitiveness is a priority research field in the following scientists’s works: Bajura T., Burlacu N., Cimpoies D., Clipa V., Cotelnic A., Fala A., Gumeniuc I., Ionita I., Litvin A., Smîc A., Stratan A., Timofti E., Turcanu P. ș. a. According to the World Bank, competitiveness "cumulates the elements that confer a superior positioning to an economic entity compared to its competitors" [5, p. 41].
In the opinion of Ovidiu Nicolescu and Dumitru Zaiț, competitiveness is "capacity, trait or characteristic of a system- firm, branch, national economy etc. - to obtain, in economic, scientific, technical, technological etc. fields, superior results in competition with similar systems at the international or national level [3, p.23].
The factor of competitiveness is a direct reason whose presence is necessary and sufficient to change one or more criteria of competitiveness [7, p. 16].
At the country level, the notion of competitiveness gets more complex significances. The final goal for a country is to increase the life and the welfare of its citizens [1, p. 37].
In terms of microeconomics, competitiveness can be defined as "the capacity of a microeconomic entity (unit, company, etc.) to gain or defend a market segment". The definition can be extended at the macrolevel, "the capacity of a macroeconomic structure to gain or defend parts of foreign and domestic markets" or, in other words, "the capacity of a country to expand its exports and to defend and limit its imports" [2, p. 244].
The firm's competitiveness is the firm’s possibility to produce competitive production, as well as to have advantages over another firm from the same branch, from the country or abroad.
According to Сetîrkina N., the firm's competitiveness management consists in adopting a series of managerial decisions aimed at the elimination of external factors’ action and leadership exercising in accordance with strategic goals [8, p. 6].
The manager’s competitiveness represents the advantage of this manager compared with another manager, which is characterized by the possibility to elaborate the respective unit’s competitiveness insurance system, to manage the team, in order to achieve the system’s purpose. The requirements for a manager are: knowledge and use of modern research methods and the elaboration of the methods teams creation, of labor organization and motivation, of health improving and the culture level increasing.
Competitiveness, as many economists say, becomes a hot topic in the context of globalization, not only as a result of the progress achieved in its conceptualization (by including competitive advantages), but also of the transformations occurred in relational systems between national economies [6, p. 23].
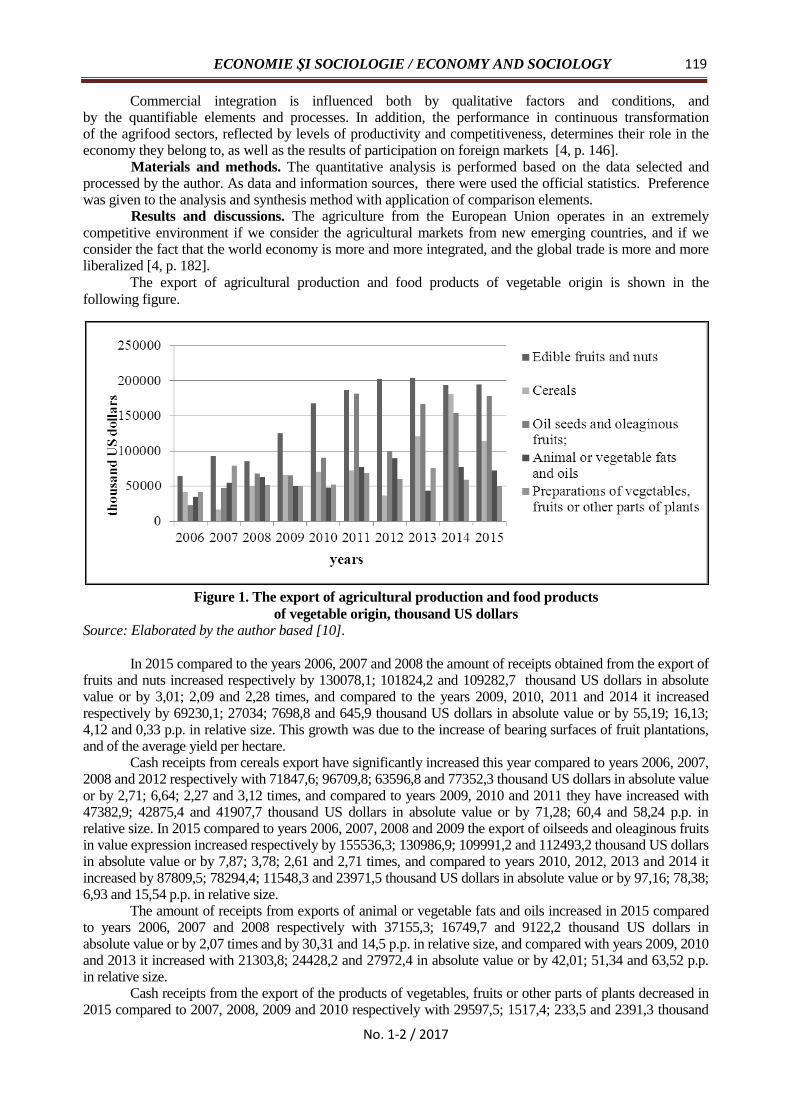
ECONOMIE ŞI SOCIOLOGIE / ECONOMY AND SOCIOLOGY
119
No. 1-2 / 2017
Commercial integration is influenced both by qualitative factors and conditions, and by the quantifiable elements and processes. In addition, the performance in continuous transformation of the agrifood sectors, reflected by levels of productivity and competitiveness, determines their role in the economy they belong to, as well as the results of participation on foreign markets [4, p. 146].
Materials and methods. The quantitative analysis is performed based on the data selected and processed by the author. As data and information sources, there were used the official statistics. Preference was given to the analysis and synthesis method with application of comparison elements.
Results and discussions. The agriculture from the European Union operates in an extremely competitive environment if we consider the agricultural markets from new emerging countries, and if we consider the fact that the world economy is more and more integrated, and the global trade is more and more liberalized [4, p. 182].
The export of agricultural production and food products of vegetable origin is shown in the
following figure.
Figure 1. The export of agricultural production and food products
of vegetable origin, thousand US dollars
Source: Elaborated by the author based [10].
In 2015 compared to the years 2006, 2007 and 2008 the amount of receipts obtained from the export of
fruits and nuts increased respectively by 130078,1; 101824,2 and 109282,7 thousand US dollars in absolute value or by 3,01; 2,09 and 2,28 times, and compared to the years 2009, 2010, 2011 and 2014 it increased respectively by 69230,1; 27034; 7698,8 and 645,9 thousand US dollars in absolute value or by 55,19; 16,13; 4,12 and 0,33 p.p. in relative size. This growth was due to the increase of bearing surfaces of fruit plantations, and of the average yield per hectare.
Cash receipts from cereals export have significantly increased this year compared to years 2006, 2007, 2008 and 2012 respectively with 71847,6; 96709,8; 63596,8 and 77352,3 thousand US dollars in absolute value or by 2,71; 6,64; 2,27 and 3,12 times, and compared to years 2009, 2010 and 2011 they have increased with 47382,9; 42875,4 and 41907,7 thousand US dollars in absolute value or by 71,28; 60,4 and 58,24 p.p. in relative size. In 2015 compared to years 2006, 2007, 2008 and 2009 the export of oilseeds and oleaginous fruits in value expression increased respectively by 155536,3; 130986,9; 109991,2 and 112493,2 thousand US dollars in absolute value or by 7,87; 3,78; 2,61 and 2,71 times, and compared to years 2010, 2012, 2013 and 2014 it increased by 87809,5; 78294,4; 11548,3 and 23971,5 thousand US dollars in absolute value or by 97,16; 78,38; 6,93 and 15,54 p.p. in relative size.
The amount of receipts from exports of animal or vegetable fats and oils increased in 2015 compared to years 2006, 2007 and 2008 respectively with 37155,3; 16749,7 and 9122,2 thousand US dollars in absolute value or by 2,07 times and by 30,31 and 14,5 p.p. in relative size, and compared with years 2009, 2010 and 2013 it increased with 21303,8; 24428,2 and 27972,4 in absolute value or by 42,01; 51,34 and 63,52 p.p. in relative size.
Cash receipts from the export of the products of vegetables, fruits or other parts of plants decreased in 2015 compared to 2007, 2008, 2009 and 2010 respectively with 29597,5; 1517,4; 233,5 and 2391,3 thousand

Revistă teoretico-ştiinţifică / Theoretical and scientifical journal
120
No. 1-2 / 2017
US dollars in absolute value or by 37,24; 2,95; 0,47 and 4,57 p.p. in relative size, and compared to years 2011, 2012, 2013 and 2014 they decreased with 18885,4; 10488,6; 26185,1 and 9782,1 thousand US dollars in absolute value or by 27,46; 17,37; 34,42 and 16,40 p.p. in relative size. So in the Republic of Moldova’s export of alimentary products of vegetable origin fruits and nuts, cereals, oilseeds and oleaginous fruits predominate.
The export of production of animal origin in value expression is shown in the following figure.
Figure 2. The export of production of animal origin, thousand US dollars
Source: Elaborated by the author based [10].
Analyzing the data of the above graph we can say that the cash receipts from the export of meat and
edible offals increased in 2015 compared to the years 2006, 2007, 2008 and 2009 respectively with 7051,9;
4282,1; 7511,3 and 7367,9 thousand US dollars in absolute value or by 4,85 times; by 93,03 p.p.; by 6,47 and
5,86 times, and compared to the years 2010, 2011, 2012, 2013 and 2014 they reduced respectively with 1342,6;
12663,2; 12666,9; 9885,7 and 26411,8 thousand US dollars in absolute value or by 13,13; 58,77; 58,77; 52,67
and 74,83 p.p. in relative size, the main cause of the decrease being the meat export restrictions imposed by
Russia and Belarus. Mutton and lamb export from the Republic of Moldova significantly reduced because of
the armed conflicts from Libya, Syria, Iraq and Yemen.
The export of milk and dairy products, birds’ eggs and natural honey in value expression increased in
2015 compared to the years 2006, 2007, 2008, 2009 and 2010 respectively with 7732,1; 11469,9; 10001,3;
13157,1 and 12823,4 thousand US dollars in absolute value or by 74,52 p.p.; by 2,73; 2,23; 3,66 and 3,43
times, and compared to 2011, 2012, 2013 and 2014 it increased respectively with 10068,9; 10863,9; 7161,1 and
214 thousand US dollars in absolute value or by 2,25; 2,5 times and by 65,42 and 1.2 p.p. in relative size.
The data that reflect the import of production of vegetable origin is shown in the following figure.
Figure 3. The import of production of vegetable origin, thousand US dollars Source: Elaborated by the author based [10].

ECONOMIE ŞI SOCIOLOGIE / ECONOMY AND SOCIOLOGY
121
No. 1-2 / 2017
From the data of the above graph we can note that the import of vegetables and edible roots and
tubers in value expression decreased in 2015 compared to 2008, 2010 and 2011 respectively with 1811,6;
4643,9 and 12964 thousand US dollars in absolute value or by 6,63; 15,39 and 33,68 p.p. in relative size,
and compared to the years 2012, 2013 and 2014 the value of imported products decreased respectively
with 8270,9; 6962,5 and 4492,5 thousand US dollars in absolute value or by 24,47; 21,43 and 14,96 p.p.
in relative size.
As our country imports citrus and other fruits that compete with local products such as apples
from Poland, the import of edible fruits and nuts, peel of citrus fruit or melons increased in 2015 compared
to 2006, 2007, 2008, 2009 and 2010 respectively with 54119,7; 45948,9; 45073,5; 34346,6 and 16580,8
thousand US dollars in absolute value or by 3,64; 2,6 and 2,53 times and by 85,32 and 28,58 p.p. in
relative size, and compared to the years 2011, 2012, 2013 and 2014 it increased resptectively with 6154,3;
5868,4; 7553,4 and 9064,1 thousand US dollars in absolute value or by 8,99; 8,54; 11,27 and 13,83 p.p.
in relative size.
In 2015 compared to 2008, 2010 and 2011 there were imported cereal products, flour products,
starch products, milk products, pastry products less with 2113,9; 839,1 and 8439,9 thousand US dollars in
absolute value or by 6,0; 2,47 and 20,31 p.p. in relative size, and compared to the years 2012, 2013
and 2014 – less with 9935; 14922,5 and 11681,7 thousand US dollars in absolute value or by 23,07; 31,06
and 26,07 p.p. in relative size.
The import of products of vegetables, fruit, nuts or other parts of plants in value expression was
reduced in 2015 compared to 2007, 2008, 2009 and 2010 respectively with 4027,6; 13307,3; 3186,3
and 5902 thousand US dollars in absolute value or by 19,32; 44,17; 15,92 and 25,97 p.p. in relative size,
and compared to the years 2011, 2012, 2013 and 2014 it decreased respectively with 8302; 7605,3; 9439,2
and 4969,6 thousand US dollars in absolute value or by 33,04; 31,13; 35,94 and 22,80 p.p. in relative size.
The import of miscellaneous edible products increased in 2015 compared to 2006, 2007, 2008,
2009 and 2010 respectively with 29827,9; 16944,1; 2694; 8818,5 and 2755,2 thousand US dollars in
absolute value or by 2,27 times and by 46,53; 5,32; 19,80 and 5,44 p.p. in relative size, and in comparison
with 2011, 2012, 2013 and 2014 it reduced respectively with 9425,9; 15375,5; 19245,4 and 18181,8
thousand US dollars in absolute value or by 15,01; 22,37; 26,51 and 25,41 p.p. in relative size.
In order to protect domestic producers from the competition of imported products, the responsible
authorities should apply a system of taxes and/or non-tariff barriers (low quality, genetic modification,
increased content of toxins, sharing etc.).
The import of production of animal origin is shown in the following figure.
Figure 4. The import of production of animal origin, thousand US dollars
Source: Elaborated by the author based [10].
From the data of the graph we can see that the import of meat and edible offals in value expression
decreased in 2015 compared to 2008, 2010 and 2011 respectively with 9455,9; 1419,5 and 4679,5
thousand US dollars in absolute value or by 26,56; 5,15 and 15,18 p.p. in relative size, and compared to

Revistă teoretico-ştiinţifică / Theoretical and scientifical journal
122
No. 1-2 / 2017
the years 2012, 2013 and 2014 it reduced respectively with 15624,7; 19424,7 and 28104,4 thousand US
dollars in absolute value or by 37,41; 42,63 and 51,81 p.p. in relative size.
Also the import of fish and crustaceans, molluscs and other aquatic invertebrates reduced in 2015
compared to 2008, 2009, 2010 and 2011 respectively with 7447,4; 130,1; 4150,1 and 8152,1 thousand US
dollars in absolute value or by 20,29; 0,44; 12,42 and 21,79 p.p. in relative size, and compared to the years
2012, 2013 and 2014 it reduced resptectively with 12511,6; 14280,1 and 11970,9 thousand US dollars in
absolute or by 29,96; 32,80 and 29,04 p.p. in relative size.
The import of milk and dairy products, birds’ eggs and natural honey in value expression
increased in 2015 compared to 2006, 2007, 2008, 2009, 2010 and 2011 respectively with 17323,7;
12672,2; 11021,7; 10771,1; 6899,2 and 727,7 thousand US dollars in absolute value or by 2,14 times and
by 64,01; 51,39; 49,64; 26,98 and 2,29 p.p. in relative size, and compared to the years 2012, 2013 and
2014 it reduced respectively with 4930,3; 13993,9 and 9358,4 thousand US dollars in absolute value or by
13,18; 30,12 and 22,37 p.p. in relative size. Import reduction is explained by the fact that the livestock
sector has suffered from droughts in recent years and many farmers have had to sacrifice a part of their
cattle and poultry livestock.
Conclusions. In the Republic of Moldova’s export of alimentary products of vegetable origin
fruits and nuts, cereals, oilseeds and oleaginous fruits predominate. The amount of receipts from export of
fruits and nuts grew in the analyzed period due to the increase of bearing surfaces of fruit plantations and
of the average yield per hectare. The export of mutton and lamb from the Republic of Moldova
reduced significantly because of the armed conflicts from Libya, Syria, Iraq and Yemen. The export of
milk and dairy products, birds' eggs and natural honey in value expression increased in 2015 compared to
2006-2014, which confirms the increase of the competitiveness level of these products.
The import of edible fruits and nuts, peel of citrus or melons increased in 2015 compared to 2006,
2007, 2008, 2009 and 2010 because our country imports citrus and other fruits that compete with domestic
products, such as apples from Poland. The reduction in import of milk and dairy products, birds' eggs and
natural honey is explained by the fact that the livestock sector has suffered from droughts in recent years
and many farmers have had to sacrifice a part of their cattle and poultry livestock.
In order to unblock and increase the exported products volume it is necessary to streamline the
negotiation process between the Republic of Moldova and the Russian Federation, to intensify the efforts
of economic diplomacy.
On the other hand, in order to intensify the goods export in the European Union, there are required
the measures related to the improvement of the quality infrastructure, to the modernization of local
production processes and to wider products promotion.
Proposals
1. Agriculture, unlike the other sectors, needs government incentives, financial support policies.
Also, it is recommended to the responsible authorities, as far as the WTO rules allow, to protect the domestic
market from cheap, but of poor quality, imports, through an import taxes system and/or non-tariff barriers
(low quality, genetic modifications, increased toxins content etc.).
2. The benefits of favorable climatic conditions (except the drought years) are not distributed
uniformly throughout the agricultural sector. Thus, due to the significant increase of various agricultural
products offer at local and regional level, the small producers have to face too low selling prices that
undermine their profitability. Therefore, a special emphasis will be placed on the consolidation of small
agricultural producers’s bargaining power against intermediaries.
3. Annual approval of new regulations on subsidies creates instability among producers
and decreases their interest to invest. Therefore, we recommend improving the legal framework
in order to adopt subsidizing regulations for a period of five years, which will give the possibility
to plan subsidies, to ensure the production process continuity and to recover investments promptly.
All sub-branches of agriculture should benefit subsidies annually and not just those that have achieved low
results in previous years.
4. Increasing the agricultural competitiveness is achieved by the elaboration and transfer of
innovation technologies, but also in the complex with the rural area development. Consequently, it is
recommended streamlining the organizational structure of the Agency for Interventions and Payments in
Agriculture by creating a Directorate responsible for financing rural development projects: sewerage,
aqueduct, bridges and roadways, small farms for agricultural raw materials processing (soy processing, fruit
juices production lines, frozen potato production line etc.), as well as financing the projects in the bio-energy

ECONOMIE ŞI SOCIOLOGIE / ECONOMY AND SOCIOLOGY
123
No. 1-2 / 2017
production field. This fact will contribute to the increase of the agricultural production added value.
5. In the conditions of EU Association Agreement, ensuring the agricultural producers success
consists in their association. Therefore, the Ministry of Agriculture and Food Industry should stimulate
and promote more insistently the producer groups creation policy, which will give them the possibility to
plan, to adjust their production according to the market requirements, to obtain subsidies from the
government or european funds, but also to sell their production at higher prices.
6. Having analyzed the impact of the policies and of the main factors that influence the
agrifood sector competitiveness, we recommend to the Ministry of Agriculture and Food Industry the use
of the block of general and secondary indicators in order to assess annually the agrifood sector
competitiveness progress.
REFERENCES
1. CHIVU, Luminiţa. Competitivitatea în agricultură: analize şi comparaţii europene. Academia
Română, Centrul Român de Economie comparată şi Consens. Bucureşti: Editura Expert, 2002. 272 p.
ISBN 973-8177-81-2.
2. DAVIDOVICI, Ioan, GAVRILESCU, Dinu. Economia creşterii agroalimentare. Bucureşti : Editura
Expert, 2002. 614 p. ISBN 973-8177-61-8.
3. NICOLESCU, Ovidiu, ZAIŢ, Dumitru. Managementul competitivităţii şi benchmarkingul.
Minidicţionar de management. Vol. I. Bucureşti: Editura Pro Universitaria, 2011. 86 p. ISBN
9789731298832.
4. PĂUN, Ion Otiman, TODEROIU, Filon, SIMA, Elena. Cercetări de Economie Agrară şi Dezvoltare
Rurală 1990-2010: realizări şi perspective: sesiunea ştiinţifică anuală, 2 decembrie 2010. Academia
Română, Institutul Naţional de Cercetări Economice "C. C. Kiritescu", Institutul de Economie
Agrară. Bucureşti: Editura Academiei Române, 2011. 692 p. ISBN 978-973-27-2067-7.
5. PELINESCU, Elena. Cursul de schimb şi competitivitatea: experienţe naţionale şi pespective
europene. Academia Română, Institutul Naţional de Cercetări Economice, Institutul de prognoză
economic. Bucureşti: Editura Expert, 2006. 368 p. ISBN 973-7885-62-7.
6. POP, Napoleon. Riscurile economice – o provocare la adresa securităţii naţionale. Academia
Română, Institutul Naţional de Cercetări Economice, Centrul de Cercetări financiare şi Monetare
"Victor Slavescu". Bucureşti: CIDE, 2006. 25 p. ISBN 973-7885-25-2.
7. КАМАЕВ, В. Д. и др. Экономическая теория: учебник для студентов высших учебных
заведений. 13-e изд., перераб. и доп. Москва: ВЛАДОС, 2007. 590 с. ISBN 978-5-691-01193-1.
8. ЧЕТЫРКИНА, Н. Ю. Управление конкурентоспособностью организаций сферы услуг: учебное
пособие. СПб.: Изд-во СПбГУЭФ, 2009. 128 c. ISBN 978-5-370-01233-4.
9. COŞER, Cornel. Economic essence of competitiveness of agrofood products and its management. In:
Economie şi Sociologie = Economy and Sociology. 2013, nr. 2, pp. 102-107.
10. BIROUL NAŢIONAL DE STATISTICĂ AL REPUBLICII MOLDOVA. Comerţul exterior pe
secţiuni şi capitole, conform nomenclatorului mărfurilor, (NM) 1997-2015 [accesat 16 februarie
2017]. Disponibil:
http://statbank.statistica.md/pxweb/pxweb/ro/40%20Statistica%20economica/40%20Statistica%20ec
onomica__21%20EXT__EXT010__serii%20anuale/EXT010400.px/table/tableViewLayout1/?rxid=b
2ff27d7-0b96-43c9-934b-42e1a2a9a774
Recommended for publication: 12.05.2017

Revistă teoretico-ştiinţifică / Theoretical and scientifical journal
124
No. 1-2 / 2017
ASSIMILATION OF INVESTMENT POTENTIAL
OF INSURANCE COMPANIES THROUGH GOVERNMENT SECURITIES
Angela TIMUS1, PhD, Associate Professor,
National Institute for Economic Research, Moldova
Cristina UNGUR2, Researcher
National Institute for Economic Research, Moldova
Irina RABOSAPCA3, PhD, Lecturer, Babes-Bolyai University,
Cluj-Napoca, Romania
Investments in fixed capital and human capital represent a reliable way to the economic
development of the Republic of Moldova. The acceleration of investments can be achieved through an
active and viable financial market. The stimulation of institutional investors and of the process of
securities issuing and trading is a strategic development tool for the country. The purpose of the study is
to analyze insurance companies as institutional investors and to present opportunities for investment in
state securities. Markowitz and Sharpe’s theories of efficient investment portfolios selection based on
profitability and risk formed the theoretical and methodological framework. The research is based on data
from the National Commission for Financial Markets, on the reports of Moldova’s Ministry of Finance
and on the statistics from National Bank a National Bureau of Statistics. For secondary analysis, data
reports from international organization such as OECD and Insurance Europe and International Monetary
Fund have been used. The study was conducted by classical methods of the economic and financial
analysis. The results of research have shown that government securities are the most profitable of all
securities issued on the primary financial market in the Republic of Moldova. In recent years, interest
rates at the state securities are extremely attractive, more attractive than returns on investment in other
areas. State securities are the safest investment because the guarantor of this investment is government.
That is why state securities are a very attractive investment area for insurance companies. The stimulation
of the investment activity in the state can be achieved by using the primary market of government
securities as an investment tool for capitalization of the investment potential of the insurance market.
Keywords: investments, insurance companies, government securities, financial market, public debt.
Investiţiile în capitalul fix şi capital uman reprezintă calea certă de dezvoltare economică a
Republicii Moldova. Impulsionarea investiţiilor poate fi realizată prin intermediul unei pieţe financiare
active şi viabile. Astfel, stimularea investitorilor instituţionali şi a procesului de emisie şi tranzacţionare a
titlurilor financiare reprezintă un mijloc strategic de dezvoltare a ţării. Scopul studiului: prezintă analiza
companiilor de asigurări ca investitori instituţionali şi prezentarea oportunităţilor de investire în hârtii de
valoare de stat. Cadrul teoretico-metodologic l-au constituit teoriile lui Markowitz şi ale lui Sharpe
referitoare la alegerile portofoliilor eficiente de investiţii în bază de rentabilitate şi risc. Cercetarea este
bazată pe datele CNPF, rapoartele Ministerului Finanţelor al RM, statisticile Băncii Naţionale şi ale
Biroului Naţional de Statistică. Pentru analiză secundară au fost folosite rapoartele organizaţiilor
internaţionale, precum: OECD, Insurance Europe şi FMI. Studiul a fost realizat prin utilizarea metodelor
clasice de analiză economico-financiară. Rezultatele cercetării au demonstrat că din toate titlurile de
valoare emise pe piaţa primară din Republica Moldova, cele mai profitabile sunt valorile mobiliare de
stat. În ultimii ani, ratele dobânzilor la VMS sunt extrem de atractive, depăşind rentabilitatea investiţiilor
în alte domenii. Titlurile de stat au cel mai mare grad de siguranţă, având ca garant guvernul, motiv
pentru care VMS reprezintă un domeniu foarte atractiv de investiţii pentru companiile de asigurare.
Impulsionarea activităţii investiţionale în stat poate fi realizată prin folosirea pieţei primare a VMS drept
instrument investiţional pentru valorificarea potenţialului investiţional al pieţei de asigurări.
Cuvinte-cheie: investiţii, companii de asigurări, valori mobiliare de stat, piaţă financiară, datorie public.
1© Angela TIMUS, [email protected] 2© Cristina UNGUR, [email protected] 3© Irina RABOSAPCA, [email protected]
ECONOMIE ŞI SOCIOLOGIE / ECONOMY AND SOCIOLOGY
125
No. 1-2 / 2017
Инвестиции в основной капитал и человеческий капитал являются путем к развитию
Республики Молдова. Повышение инвестиционной деятельности может быть достигнуто за
счет активного и жизнеспособного финансового рынка. Стимулирование институциональных
инвесторов и процесса выпуска и торговли ценными бумагами являются стратегическим
направлением развития страны. Цель исследования состоит в анализе страховых компаний как
институциональных инвесторов и в представлении возможностей инвестирования в
государственные ценные бумаги. Теории Марковица и Шарпа о выборе эффективных
инвестиционных портфелей на основе доходности и риска являются теоретической и
методологической основой данной работы. Исследование основано на данных НКФР, отчетах
Министерства финансов, статистике Национального банка и Национального бюро статистики.
Для вторичного анализа были использованы отчеты международных организаций, таких как
ОЭСР, Insurance Europe и МВФ. Исследование было проведено с использованием традиционных
методов финансового анализа. Результаты исследования показали, что из всех ценных
бумаг на первичном рынке в Молдове, наиболее прибыльными являются государственные
ценными бумагами. В последние года, процентные ставки по государственным ценным
бумагам весьма привлекательны и превышают доходность от инвестиций в других областях. Эти
бумаги имеют самую высокую степень безопасности, будучи гарантированными
правительством. Таким образом, государственные ценные бумаги являются очень
привлекательным инвестиционным инструментом для страховых компаний. Повышение
государственной инвестиционной деятельности страны может быть достигнуто за счет
использования государственных ценных бумаг в качестве инструмента для реализации
инвестиционного потенциала страхового рынка.
Ключевые слова: инвестиции, страховые компании, государственные ценные бумаги,
финансовый рынок, государственный долг.
JEL Classification: G22, G23, G18, H63. UDC: 336.5:368
Introduction. In developed countries, financial markets are the main generator of investments for
the economy. These markets mobilized important financial resources for economic agents and channelled
the cash resources of individuals and businesses to the most profitable areas.
The main actors in the financial market are institutional investors – institutions that manage and
invest the money of third parties. Besides banks, investment funds, pension funds etc., financial market
includes insurance companies. Institutional investors directly or indirectly hold most of the people’s
economies in developed countries. In addition, they are among the most important players in the world
economy because they finance countries and companies, directly contributing to the economic growth.
Therefore, in the Republic of Moldova there is an untapped potential in the field of financial
intermediation through the insurance companies. This statement is based on the dynamic growth rates of
insurance market and on the increasing profits. For this reason, the investment potential of the insurance
companies is an important part of the financial market.
In the Republic of Moldova, there is not a strong and mature financial market and institutional
investors invests in state securities, bank deposits or real estate projects. Investments in corporate
securities are very popular in developed countries due to the high profitability. In our country this type of
titles are not popular because there is no a developed secondary market.
The presented study is based on the analysis of the investment possibilities of the insurance
companies in the Republic of Moldova. Specific security requires for insurers investments makes state
securities the most recommended. In addition, there are opportunities to obtain significant profits here,
due to high interest rates on state securities in the last period. In addition, these titles are the safest because
the government guarantees them.
Currently, the Republic of Moldova needs investment to provide a reliable way to economic
development. Strengthening of the financial market by boosting the institutional investors’ activity is the
main force that can contribute to achieving this goal. By capital placing of the insurance companies in
government securities, the citizens of the Republic of Moldova, holders of a private insurance policy,
become state creditors and contribute not only to the insurance of their own well-being, but also to the
diminution of the public debt.

Revistă teoretico-ştiinţifică / Theoretical and scientifical journal
126
No. 1-2 / 2017
Theoretical and methodological framework. Financial theory knows various models in which
the investment potential is developed through the government securities segment. Harry Markowitz made
basics of a scientific approach to titles portfolio. In 1950, he introduced the financial market solutions and
developed a modern theory of efficient investment portfolio choice [8]. The theory helps to choose an
optimal combination of investment projects based on profitability and risk. Markowitz believed that
investor’s behaviour is based on the desire to achieve higher returns with lower risk. He provided the idea
that investors choose risky projects with high profitability to the detriment of safety project with low
future incomes [4].
W. Sharpe has studied investment portfolios involving the existence of risk-free assets, besides the
risky ones. He developed Markowitz's theory of effective portfolios selection, but only considered
risk-free securities, such as state securities. The model developed by Sharp is called CAPM (capital asset
pricing model) and provides calculation of the separate return of a risky asset based on return of the risk-
free asset and on the market portfolio [12]. The key to the model is the beta factor that estimates the
potential gain of an instrument, according to assumed risk and potential market profit. The mathematical
expression of CAPM is called SML – Securities Market Line and is a linear equation.
Another model related to risk-free assets is APT (Arbitrage Pricing Model) developed by Stephen
Ross (1976). The approach of this model is straightforward than CAMP because it requires fewer
assumptions. The main assumption of the APT model is that each investor tends to increase its portfolio's
profitability without increasing the risk. The mechanism to achieve this model is to build portfolios based
on arbitrage – arbitrage portfolio [16, p.316].
Later, Black, Derman & Toy (1990) describes a model of interest rates that can be used to
measure any interest-sensitive securities [1]. In explaining how they work, they focus on evaluation of
treasury bills option.
Financial markets have been the object of concern of many economists. In scientific literature,
investment process is presented as a way of choosing the direction, volumes and terms of investment.
William Sharpe, in his works, argues that according to the investment direction, the investment activity
can be divided in two types: real investments and financial investments. Real investments consist of
tangible assets such as land, buildings, equipment, etc. Financial investments are "paper contracts"
[16, p. 9] that certify the right to obtain future earnings under certain conditions and offer the possibility to
transform them at any time into liquidity on the secondary equity market. These contracts are securities
most often in the form of shares and bonds. One of the most important criteria in choosing the investment
portfolio is risk. The least risky are fixed income investments, including state securities that are safety and
liquidity. This type of investment is recommended for insurance companies that are required to maintain a
high level of caution.
According to the local scientists led by Rodica Hincu, the institutional structure of the financial
market implies the presence of a diversified number of institutions that participate in investment projects
[6, p. 47]. Capital transfers from the investor, i.e. the savers, to the one who needs funds, can take place in
two ways: direct transfers and indirect transfers [16, p. 9]. Direct transfers occur when a company sells
parts of its shares or bonds directly to those who have savings for investment. Indirect transfers involve
the existence of a financial intermediary such as banks, insurance companies, pensions, hedge funds,
REITs, investment advisors, endowments, and mutual funds etc. Those who were concerned about the
study of financial intermediaries activity was Halpern Paul, Weston Fred and Brigham Eugene. They
considered that these institutions obtained funds from savers by issuing their own securities, and then they
used these funds to buy corporate or government securities [4, p. 55-56].
Studies on the activity of institutional investors are found in the works of American economist
Frank J. Fabozzi. He analyzed investments opportunities and requirements for investment strategies of this
type of investors. Fabozzi considered insurers companies and pension funds the most important
investment component on the equity market.
The current study was focused on the data of the insurance market and on the public debt reports
provides by Moldovans authorities. The detailed information about the sources of indicators used and the
periods are presented in table 1.

ECONOMIE ŞI SOCIOLOGIE / ECONOMY AND SOCIOLOGY
127
No. 1-2 / 2017
Table 1
Informational base of research
Name of document Indicators used for analysis Analyzed
period Source
Annual reports of
National Commission for
Financial Markets of the
Republic of Moldova
(NCFM)
Gross written premiums
Number of participants in the non-banking
financial market
The aggregate structure of the insurance
portfolio (gross premiums by type of
insurance)
Investments volume (by domain)
2010- 2016 http://www.cnpf.md/md/ra
pa/
National Bureau of
Statistics of the Republic
of Moldova
GDP
Population
Stable Population by Age, Medium and
Gender at the Beginning of the Year,
1980-2016
2010-2016 http://statbank.statistica.md/
National Bank of
Moldova
Number of primary dealers
Number of commercial banks
Official exchange rates
2014-2016 http://bnm.md/
Ministry of Finance’s
report on the public debt,
state guarantees and state
re-crediting
Distribution of government debt by types
of instruments
2016
http://mf.gov.md/files/files
/Datoria%20de%20Stat/ra
port%20dat%20publ/Rapo
rt%202016.pdf
Fiscal Code of the
Republic of Moldova Title II. Article 20, u) 2017
http://demo.weblex.md/ite
m/view/iddbtype/1/id/LPL
P199704241163/specialvie
w/1#T2
European Insurance in
Figures
Investment volume
Dynamics of life insurance 2014-2016
https://www.insuranceeuro
pe.eu/european-insurance-
figures-2015-data
Statistics of
Organization for
Economic Co-operation
and Development
Insurance indicators:
Assets of insurance companies and
pension funds;
Penetration
Density
Total gross premiums
2014-2016 http://stats.oecd.org/Index.as
px?DatasetCode=INSIND
Data from “Grawe Carat
Asigurări SA.” Life insurance rates 2017
http://www.grawe.md/ro/a
sigurari_de_viata.htm
Source: Developed by authors.
Results. The financial market in the Republic of Moldova is on an early stage of development.
The legislative framework provides extensive operations on this segment but there are small number of
participants and lack of financial instruments on the capital market [6]. Low of stock market No. 171 of 11.07.2012 regulates the investment activity on the financial
market of the Republic of Moldova. The Law No. 419-XVI of 22 December 2006 on public debt, state guarantees and state re-crediting and other normative acts issued for its execution governs the issue, placement and circulation of state securities. The public authority that manages the state securities market in the Republic of Moldova is the National Bank of Moldova. National Bank is authorized to organize selling, accounting and compensation of state securities issued by the Ministry of Finance.
Two types of state securities are emitted in the domestic market of Moldova: 1) treasury bills –
securities with different circulation terms up to one year; 2) government bonds – securities with a maturity
of more than one year. The states security market in the Republic of Moldova is organized through banks
– primary dealers, who have concluded agreements with the National Bank of Moldova regarding the
functions of primary dealers on the state securities market. Primary dealers can buy state securities for themselves or for their clients (individuals and companies).
Currently, on the Moldova’s state securities market there are 9 primary dealers from the total number of 11 commercial banks. Because of major fluctuations in the base rate in period of 2015-2016, the state securities market in Moldova was strongly influenced. The base rate increased during 2015 from

Revistă teoretico-ştiinţifică / Theoretical and scientifical journal
128
No. 1-2 / 2017
8.5% to 19.5%, and then decreased by the end of 2016 to 9%. In these circumstances, the interest rate on government securities increased in 2015 by more than 2 times, and by the end of 2016 decreased by 4 times. These fluctuations are shown in figure 1.
Figure 1. Fluctuations of effective interest rates on state securities
in the Republic of Moldova during the years 2015-2017 Source: Developed by authors based on http://bnm.md/bdi/pages/reports/dop/DOP5.xhtml
The attractiveness of investments in state securities in the Republic of Moldova is very high because of effective interest rate for this type of securities that was over 20% during 9 months in the period of 2015-2016. From October 2015 to February 2016, the effective interest rate on the state securities was over 26%. It should be noted that, according to the Fiscal Code of the Republic of Moldova, the interest from the state securities is not taxed. In addition to high profitability and tax benefits, we can talk about high safeness of investment in state securities. In the Republic of Moldova, where the investment market is underdeveloped and unstable, the possibility to invest under state guarantee is very attractive to investors. Another advantage is the low maturity of investments in the state securities, which gives a high liquidity of this type of investment. In terms of necessity to develop the local market of state securities, the low maturity is a disadvantage. According to the Ministry of Finance, the public debt of the Republic of Moldova at December 31, 2016 was 59,371.9 million MDL, 37.2% more than in the similar period of 2015. About 85.5% of the total public debt is the state debt, which represents 37.8% of GDP, with 10.4 points more than in 2015. More than half of Moldova's debt (58%) is external debt in foreign currency, which indicates that there is currency risk.
The state debt structure of the Republic of Moldova, by type of instrument, is shown in Table 2.
Table 2
Distribution of government debt by types of instruments, %
Types of instruments 2014 2015 2016
External state loans 64,6 68,9 51,4
State securities issued for execution of payment obligations derived from state guarantees
- - 26,3
State securities issued on primary market 17,9 15,4 12
Special Drawing Rights (SDR) allocations 9,7 9,6 6,2
Converted state securities 7,5 6,2 4,1
State securities issued for financial stability 0,3 - -
Source: Report on the public debt, state guarantees and state re-crediting.
The largest share in the structure of the state debt is held by external loans (51.4%), and 42.4% are distributed as state securities, while 6.2% are SDR allocations. It is difficult to predict a decreasing of Moldova’s public debt. Only in 2016, it was signed 10 loan agreements amounting of 399.1 million dollars for medium and long term with international financial institutions. This helps us to predict the maintenance
11,8113,5
20,2 20,719,06
17,519,5
22,4124,52
25,83 25,74 26,2226,48 26,2625,22
23,75
16,15
11,7812,82
10,829,16
8,24 8,056,325,74 5,95
Jan. Feb. Mar. April May Jun. July Aug. Sep. Oct. Nov. Dec.
year 2015 year 2016 year 2017

ECONOMIE ŞI SOCIOLOGIE / ECONOMY AND SOCIOLOGY
129
No. 1-2 / 2017
of the high share of state securities and high interest for investment in this financial instrument. One of the problems in Moldova is underdevelopment of the financial market. Moody' Investors
Service assigned a B3 rating for Moldovan’s government bonds with negative trends. This rating was revised in 2016 and remains at the same level in 2017. The main reasons mentioned by Moody's to justifying the persistence of the Republic of Moldova in area B are: weak institutions and high levels of corruption; structural impediments to growth, including continued mass emigration and a still-fragile banking system; heavy reliance of economy on agriculture [17]. In the future, Ministry of Finance plans to reconfigure the primary dealers system and to issue securities with a maturity of 5 years.
In the Republic of Moldova, state securities are issued for short terms, maximum 3 years. It does not allow long-term forecasting and planning and thus confers uncertainty. Once issued, government bonds can no longer be sold on the secondary market because it does not exist practically. The share of stock market transactions in GDP for the 2015 is 0.16%, which shows a very low activity of this market sector. Expert from International Monetary Fund in country report 16/343 mentions these problems [2].
As we mentioned above, there is a legislative framework in the Republic of Moldova that governs the activity on the financial market including state securities’ sector. In addition, there is an already formed market infrastructure as: a system of primary dealers, a Bloomberg system, auction calendars, attractive tax regime. There are also institutions that could participate in the financial market, such as insurance companies. The largest investors in state securities are the local banks.
In the last 20 years, the authorities have been created conditions to diversify the investor base [6, p.287]. According to NCFM data, there are the following categories of local investors: 19 investment funds, 6 trust companies, 15 insurance companies, 297 savings and loan associations, 2 central microfinance associations, 119 microfinance organizations and 3 pension funds.
The low volume of financial operations and small participants characterizes the financial market of Moldova. The portfolio of savings and loan associations does not exceed 0.36% of GDP. Insurance companies has a written gross premium gross in proportion of 1.01% to GDP, microfinance organizations has a loan portfolio of 2.36% in relation to GDP. Unfortunately, pension funds are not functioning now on the financial market.
The interest of this research aims to insurance companies as investors. We believe that in the Republic of Moldova the insurance industry has a great investment potential, which is still untapped.
The insurance market, as part of the financial market, is an important element of the investment process. The role of this market is to act as a credit and investment institution. Insurance companies, after commercial banks, hold a leading position as assets volume and as capital provider. The resources accumulated by insurers offer the possibility to use funds for long-term investments through the securities market. This capacity is not available to banks because they have funds attracted for relatively short periods. From this point of view, insurance companies have a dominant position on the financial market. The volume of insurance premiums and income from operational activities (sponsorship, investment, mortgage, etc.) usually exceeds the payment obligations to policyholders. This allows insurers to increase their income from year to year and to invest them in profitable programs, securities (treasury bills, government bonds, etc.), bank deposits, mortgages and more [9].
An important factor for increasing the efficiency of insurance business as well as for the financial attractiveness of insurance products is the intensification of investment activity of insurance organizations in different areas of the financial market. Through investment operations, insurance companies largely depend on the financial markets’ situation and on the investment risks. This forces them to pursue a prudential investment policy. The main principles of the investment policy for insurance company have to be reliability, profitability, recoverability, diversification and high liquidity.
The importance of insurance companies as institutional investors is globally demonstrated. Pension funds, insurance companies and mutual funds hold more and more important position on financial markets. In OECD countries, these institutions have assets worth over 70 trillion euros [3]. Pension funds and insurers are major investors in a large number of developed economies, with assets representing over 60% of GDP in countries such as Canada, the Netherlands, the United Kingdom and the United States. In non-OECD countries, institutional investors tend to be less developed, but there are some important exceptions such as Brazil and South Africa, which have well-developed pension fund and mutual fund industries [3, p.9].
In Moldova, the insurance sector recorded dynamic growth rates in recent years. In the context of reforms carried out in the insurance sector, the premiums income has been increased. The growth rates since 2010 have been around 10% per year. At present, we have 15 insurance companies in the country, only one carries out the life insurance and one has composite activity, the other 13 companies provide general insurance.

Revistă teoretico-ştiinţifică / Theoretical and scientifical journal
130
No. 1-2 / 2017
Insurance density in Moldova is about 18 USD, in Luxemburg it is over 37000 USD, in Ireland – over 10000 USD, in USA – over 6000 USD. This indicator shows how much each citizen of the country invests in insurance services. That is why we think that there is untapped potential in insurance area. The aggregate structure of the insurance portfolio in Moldova denotes the preponderance of compulsory insurance. Third-party liability insurance holds a 51% share of the company's premiums. The share of personal insurances, which are voluntary and includes life insurance, health insurance or accident insurance, accounts for only 13.9% of the entire insurance portfolio. Therefore, the population buys an insurance policy only if it is forced by legislation. That means there is a major undeveloped potential in the voluntary insurance area. We believe that the largest development reserves are in life insurance sector, which currently only 12.5% of the voluntary premiums have earned.
The international studies show that in countries with developed insurance industry the insurance business is mostly based on life insurance. In Ireland, United Kingdom, China, even in Portugal or the Republic of South Africa life insurance shares are over 70%. The medium indicator for European Union (15) is 60.6% in 2014, while in the Republic of Moldova it reaches 7.2% (gross premiums/total premiums). In this sector of insurance is concentrated the most part of investment potential of companies [14]. A minimum life insurance policy in Moldova requires annual payment of 3000 MDL. In a modern society, the life insurance policy is an indispensable attribute of existence. If each citizen of the Republic of Moldova, aged 18-65, would have at least one minimum life insurance package, then the premiums received from this type of insurance would be 7.5 billion MDL (2523399 active population X 3000 MDL = 7570197000 MDL) or 362,3 billion Euro1. In Europe, the volume of life insurance premiums is 733 million Euros. Of course, our scenario is utopian, because not all of active citizens will make life insurance in the Republic of Moldova according to low financial culture of population [13] and low level of salary incomes.
The proportions and absolute value of Moldovan insurance companies’ investments are shown in
figure 2.
Figure 2. Insurance companies’ investment structure, billion MDL
Source: Author’s calculations, based on National Commission for Financial Markets.
1 Converted to the NBM average annual exchange rate for 2015.
48,2 34,3 68,4
203,2 152,8284,1
398,4
703,6
225,5 276,5 249
184,8 317,8
323
308,8
598,1
30,541,8 49
74,7
61
89,3
67,5
158,7
96,294,9 106,9
160
185,8
201,3
226,9
355,2
36,836,2 36,6
44,4
53,9
63,8
68,4
125,9
115,1
130,4
127,2
142
179,8
0
500
1000
1500
2000
2008 2009 2010 2011 2012 2013 2014 2015
Securities Bank deposits Cash and accounts Lands and buildings Client's debts Reinsurar`s share

ECONOMIE ŞI SOCIOLOGIE / ECONOMY AND SOCIOLOGY
131
No. 1-2 / 2017
From above results that in Moldova insurance companies place the financial resources in bank
deposits and securities. International companies keep the same directions of investment, but their main
orientation is to financial market especially to securities.
In Moldova 93.8% of total assets invested in securities by insurance companies are placed in state
securities and 6.2% in corporate securities. According to the regulations, the financial sources of the
Moldovan insurance companies can be placed in government securities in any quantum. For other types of
securities, there is a limit of 20% and the admissible limit for bank deposits is 50%. Even if there is no
limits for investment in state securities, insurers invest only 31% of the portfolio in this type of project.
In the last years, there is a tendency of increase the interest of Moldovan companies in state
securities (figure 3).
Figure 3. Dynamics of investments in securities made by insurance companies in Moldova,
billion MDL
Source: NCFM annual report for 2011-2015. Available at: http://cnpf.md/md/rapa/
The investments in the state securities made by Moldovan insurers raised in 2015 compared to
2014 by two times and compared to 2012 they increased by six times. This trend is due to the increasing
of the financial results of the companies, the maturity and the development of the insurance market, but
also to the attractive rates for state securities.
Taking into account the profitability, the safety and the permissiveness of investments in
government securities for the Moldovan insurance companies, this type of investment is the most definite
way to increase client’s funds.
Conclusions and recommendations
In the carried out study, we found that the Moldovan financial market is not yet mature. The
government securities sector is a very attractive segment for Moldovan investors due to high profitability
(high interest rates), tax facilities, low maturities (up to 3 years) and high safeness. Despite all
opportunities, the investors’ base is very low developed. We think it would be necessary to diversify this
base by including investment funds, pension funds and other institutions that currently exist only formally
in Moldova.
The main objective of Moldova’s stock market should be development of internal market of state
securities. This would help to boost investment activity, to stabilize public budget and to ensure economic
growth. To achieve this goal, is not enough to diversify the institutional investor’s base but is necessary to
widen the palette of government securities. Priority would be long-term securities (10-20 years).
A correct capitalization of the investment potential of the Moldovan insurance companies would
contribute to the development of the state securities’ internal market. It is necessary to carry out programs
of financial education of the population. Only citizens with a high financial culture understand the
importance of procuring insurance policy.
It is necessary to promote the policies of support for pension funds, investment companies and other
institutions that are able to participate in investment projects. In fact, investments remain the driving force
of a modern economic system.
142106,4
168
351,1
659,7
61,1 46,5
116,1
47,3 43,9
2011 2012 2013 2014 2015
Guvernment securities Corporate securities

Revistă teoretico-ştiinţifică / Theoretical and scientifical journal
132
No. 1-2 / 2017
REFERENCES 1. BLACK, Fischer, DERMAN, Emanuel, TOY, William. A one-factor model of interest rates and its application
to treasury bond options. In: Financial Analysts Journal. 1990, vol. 46, issue 1, pp. 33-39 [accesat 24 ianuarie 2017]. Disponibil: https://pdfs.semanticscholar.org/6ecb/f463899fdf6a71e272a13153899e3da7ff88.pdf
2. INTERNATIONAL MONETARY FUND. Republic of Moldova: Request for an Extended Arrangement Under the Extended Fund Facility and an Arrangement Under the Extended Credit Facility-Press Release; Staff Report; and Statement by the Executive Director for the Republic of Moldova. Country Report no. 16/343. 2016, november [accesat 12 ianuarie 2017]. Disponibil: http://www.imf.org/en/publications/cr/issues/2016/12/31/republic-of-moldova-request-for-an-extended-arrangement-under-the-extended-fund-facility-and-44379
3. DELLA CROCE, Rafaela, YERMO, Julian. Institutional Investors and Infrastructure Financing. OECD Working Papers on Finance, Insurance and Private Pensions no. 36. Paris: OECD Publishing, 2013 [accesat 16 februarie 2017]. Disponibil: http://dx.doi.org/10.1787/5k3wh99xgc33-en
4. HALPERN, Paul, WESTON, Fred, BRIGHAM, Eugene. Finanţe manageriale: modelul canadian. Bucureşti: Ed. Economică, 1998. 956 p. ISBN 973-590-043-2.
5. IORDACHI, Victoria, HÎNCU, Rodica. Aspects of the capital markets’ development from the CIS Member states and Republic of Moldova. In: Journal of Economics and Business Research. 2013, nr. 2, pp. 122-133. ISSN 2068-3537 Disponibil pe: http://www.uav.ro/jour/index.php/jebr/article/view/86
6. HÎNCU, Rodica, IORDACHI, Victoria et al. Bazele funcţionării pieţei de capital. Chişinău: ASEM, 2012. 340 p. ISBN 978-9975-75-526-9.
7. LINTNER, Jonh. Security Prices, Risk, and Maximal Gains from Diversification. In: Journal of Finance. 1965, vol. 20, no. 4, pp. 587-616 [accesat 15 ianuarie 2017]. Disponibil: http://efinance.org.cn/cn/fm/Security%20Prices,%20Risk,%20and%20Maximal%20Gains%20From%20Diversification.pdf
8. MARKOWITZ, Harry. Portfolio Selection. In: Journal of Finance. 1952, vol. 7, no. 1, pp. 77-91 [accesat 24 ianuarie 2017]. Disponibil: https://www.math.ust.hk/~maykwok/courses/ma362/07F/markowitz_JF.pdf
9. MINISTERUL FINANŢELOR AL REPUBLICII MOLDOVA. Piaţa internă a Valorilor Mobiliare de Stat – experienţă internaţională şi lecţii pentru Republica Moldova: atelier de lucru. Chişinău, 2017.
10. POPLAVSKYI, O. Activities of the Insurance Companies in the Financial Market: Analysis of International Experience. Zhytomyr State Technological University. В: Облiк i Фiнанси = Accounting & Finance. 2016, № 1 (71), pp. 117-123. ISSN 2307-9878 [accesat 11 martie 2017]. Disponibil: http://elibrary.ru/item.asp?id=25869130
11. ROSS, A. Stephen. The Arbitrage Theory of Capital Asset Pricing. In: Journal of Economic Theory. 1976, vol. 13, no. 3, pp. 341-360. ISSN 0022-0531 [accesat 5 ianuarie 2017]. Disponibil: http://www.top1000funds.com/wp-content/uploads/2014/05/The-Arbitrage-Theory-of-Capital-Asset-Pricing.pdf
12. SHARPE, William F. Simplified Model for Portfolio Analysis. In: Management Science. 1963, vol. 9, no. 2, pp. 277-293 [accesat 24 ianuarie 2017]. Disponibil: https://analisiseefffiecs.files.wordpress.com/2013/07/teoria-de-portafolio-sharpe-1.pdf
13. SHARPE, William F. Capital Asset Prices: A Theory of Market Equilibrium Under Conditions of Risk. In: Journal of Finance. 1964, vol. 19, no. 3, pp. 425-442 [accesat 11 martie 2017]. Disponibil: https://www.jstor.org/stable/2977928?seq=1#page_scan_tab_contents
14. TIMUŞ, Angela, UNGUR, Cristina. Impactul culturii asigurărilor asupra dimensiunilor pieţei de asigurări din Republica Moldova. In: Creşterea economică în condiţiile globalizării: conferinţa ştiinţifică internaţională, 18-19 octombrie 2012. Ediţia a VII-a. Chişinău, 2012, vol. 2, pp. 488-494. ISBN 978-9975-4185-2-2.
15. TIMUŞ, Angela, UNGUR, Cristina. The Insurance Market of the Republic of Moldova in Terms of Investment Potential. In: Revista Studii Financiare. 2013, vol. 17 (2), pp. 31-43. ISSN 2537-3714. [accesat 7 ianuarie 2017]. Disponibil: http://fs.icfm.ro/vol17i2p31-43.pdf
16. ФАБОЦЦИИ, Ф. Управление инвестициями. Москва: ИНФА-М, 2000. 932 с. ISBN 5-86225-864-7. 17. ШАРП, Уильям Ф., АЛЕКСАНДЕР, Гордон Дж., БЭЙЛИ, Джеффри В. Инвестиции. Москва: Инфра-
М, 2001. 1035 с. 18. ROŞCA, Petru. International conceptual reflection on the financing economic activity. In: Economie şi
Sociologie = Economy and Sociology. 2015, nr. 3, pp. 67-73. 19. Moody's changes Moldova's rating outlook to stable from negative; B3 rating affirmed. New York, 2017, 13
january [accesat 24 ianuarie 2017]. Disponibil: https://www.moodys.com/research/Moodys-changes-Moldovas-rating-outlook-to-stable-from-negative-B3--PR_360444
Recommended for publication: 05.05.2017
ECONOMIE ŞI SOCIOLOGIE / ECONOMY AND SOCIOLOGY
133
No. 1-2 / 2017
REAL ESTATE MARKET IN RURAL AREA OF THE REPUBLIC
OF MOLDOVA: ACTUAL CONDITION AND OPPORTUNITIES
OF DEVELOPMENT
Viorel TURETCHI1, PhD Student, Researcher,
National Institute for Economic Research, Moldova
Tatiana BORZDOVA2, PhD, Associate Professor,
State Institute of Management and Social Technologies
of the Belarusian State University,
Department of real estate management, Belarus
The market of real estate objects in rural areas is an essential gear of Moldovan economy.
The efficiency and effectiveness of this market has an impact on the agricultural sector development and
living standards of rural residents. Currently, this area is very little studied, the research being conducted
within the perimeter of land market activity. The purpose of this sudy is to determine the specific
of the activity of the real estate objects market in rural areas of the Republic of Moldova, analyse
the transactional business process of each group of real estate objects, as well as elucidate major issues
which stagnate a more active development of this economic sector. Extensive knowledge of real estate
objects market functioning as a whole in rural areas will enable the optimal solution to revive
the agrarian economy and socio-economic revitalization of rural areas. While preparing this study,
the following research methods have been used: analysis and synthesis, conceptual analysis of statistical
data; analysis of dinamic lines, methods of comparison.
Keywords: real estate market, agrarian sector, rural area, real estate.
Piaţa obiectelor imobiliare în spaţiul rural este un element esenţial în angrenajul economiei
Republicii Moldova. De eficienţa şi eficacitatea acestei pieţe depinde dezvoltarea sectorului
agrar, precum şi nivelul de trai al locuitorilor din mediul rural. Actualmente, acest domeniu este foarte
puţin studiat, cercetările fiind realizate doar în perimetrul activităţii pieţei funciare. Scopul acestui
studiu este determinarea specificului activităţii pieţei obiectelor imobiliare în spaţiul rural al Republicii
Moldova, analizarea procesului tranzacţional comercial al fiecărui grup de obiecte imobiliare, precum şi
elucidarea problemelor majore ce stagnează dezvoltarea mai activă a acestui domeniu economic.
Cunoaşterea amplă a funcţionării pieţei obiectelor imobiliare în ansamblu în spaţiul rural va
permite definirea soluţiilor optime de relansare a economiei agrare, precum şi revitalizarea socio-
economică a localităţilor rurale. La elaborarea acestui studiu au fost folosite astfel de metode de
cercetare, cum ar fi: analiza şi sinteza, analiza rândurilor dinamice, analiza conceptuală, metoda analizei
comparabile.
Cuvinte-cheie: piaţa obiectelor imobiliare, sectorul agrar, mediul rural, bunuri imobiliare.
Рынок недвижимости в сельской местности является одним из важнейших элементов в
экономике Республики Молдова. От эффективности и результативности этого рынка зависит
развитие сельскохозяйственного сектора и уровень жизни сельских жителей. В настоящее время
эта область очень мало изучена, в то время как проводимые исследования имеют, как правило, в
своем периметре преимущественно деятельности рынка земли. Целью исследования является
определение специфики деятельности рынка недвижимости в сельской местности Молдовы,
анализ транзакционного процесса для каждой группы объектов недвижимости и выявление
основных проблем которые являются причинами застойных явлении в этом секторе экономики.
Более детальное знание в области функционирования рынка объектов недвижимости в сельской
местности позволят определить оптимальные решения для возрождения аграрной экономики и
улучшения социально-экономического положения сельских районов.При подготовке данной
1 © Viorel TURETCHI, [email protected]
2 © Tatiana BORZDOVA, [email protected]

Revistă teoretico-ştiinţifică / Theoretical and scientifical journal
134
No. 1-2 / 2017
работы в качестве методов исследования были использованы методы как: анализ и синтез,
концептуальный анализ, анализ динамических рядов, метод сравнения.
Ключевые слова: рынок объектов недвижимости, сельскохозяйственный сектор, сельская
местность, недвижимость.
JEL Classification: L85, Q18, O18.
UDC: 332.72(478-22)
Introduction. The standard of living of man was, and is directly influenced by the quantity and
quality of the available real estate. In light of these objects, living conditions are being improved and new
opportunities for socio-economic activities to improve the living standard of the individual are created.
Regardless of the working environment of a person – rural or urban, the goal remains the same – to create
new real estate objects, to develop and manage them more effectively. Real estate objects from rural areas
represent a special segment of the national economy, exhibiting a direct impact on the social status. These
goods have the qualities and characteristics specific for rural areas and the value and condition of real
estate objects depends on both national economic development and welfare of every citizen.
Results and discussions. Nowadays, real estate objects in rural areas of our country are: private
homes, construction of social facilities and the production ones, lands for agricultural purposes, forest
lands, pastures, reservoirs, networks for communication and supply of potable water for the local
population.
The national land fund has an undeniable economic relevance. According to Catan P. [4, p.46],
land resources or the land fund “...represent the total area of land between border, including
that under water, construction and communications, representing the basic condition of existence of a
nation or state".
According to Article 2 of the Land Code of the Republic of Moldova, the land fund is classified
depending on the destination and is formed from the following categories of land: intended for agriculture,
for industry, transport, telecommunications, land for nature protection, health protection, historical and
cultural value land, suburban areas and green areas, water land funds and of the reserve fund [1, Article 2].
According to the National Bureau of Statistics [11], on January 1, 2016 land resources of the
Republic of Moldova amounted to 3 384.6 thousand hectares and had the following structure:
Figure 1. Land structure of the Republic of Moldova on January 1, 2016
Source: National Bureau of Statistics, 2016.
It is worth noting that according to the indicator of per capita area of arable land, which amounts
to 0.67 ha per capita, our country occupies one of the first places in Europe, ahead of such countries with
performance in agriculture as the Netherland and Switzerland. With regard to the implementation of
modern production technologies, more than half of the total area of agricultural land, and the largest part
Lands intended for
agriculture 2028,3
thousand ha
(59.92%)Land of localities
314,3 thousand ha
(9.29%)
Reserve fund 446,3
thousand ha
(13.18%)
Lands with special
destinations 58,8
thousand ha (1.74%)
Forest lands 451,7
thousand ha
(13.35%)
Water funds 85,2
thousand ha
(2.52%)

ECONOMIE ŞI SOCIOLOGIE / ECONOMY AND SOCIOLOGY
135
No. 1-2 / 2017
of the livestock of cattle, sheep and pigs, is cultivated and grown in the households practicing the
subsistence type of agriculture. A cause of stagnation in agriculture is the ineffective land consolidation
process and difficulties in creation of large farms with potential for implementation of high technologies.
One way to boost land consolidation process is the development of land market. Due to the nature
of this market, where the entire activity is concentrated only around a single object – the land, that has a
number of unique distinctions specific to plots of farmland.
The land market in the Republic of Moldova is very complex, with huge potential that has to be
valorized. It occurred in 1999 when territorial cadastral offices have made the first official records of
transactions involving agricultural areas. To a large extent occurrence of the land market is the result of an
ongoing process of allotment of peasants with agricultural land due to the implementation of the National
Program “Land” that was finished by the middle of 2000 year.
The complexity of this market can be observed by the large number of potential sellers – buyers.
The data presented in the Cadastral summary sheet [9] developed by the Land Cadastre Office, according
to the situation at January 1, 2016, about 1324.3 thousand of land holders were operating in the Republic
of Moldova, with a total area of arable land of 1700.7 thousand hectares.
Rural land market is a “live” body that is continuously developing. In 1999, according to SE
“Cadastru” were registered 1933 transactions for the sale of agricultural land, while in 2015 their number
reached 262 000 [7], accounting for 61% of the total transactions in the real estate market. In most cases,
they are manifested by: sales – purchase operations, inheritance, gift, lease, mortgage, inclusion in equity,
exchange and other types of transactions.
One of the main factors that hinder the development of land market, but also the entire real estate
market in rural areas is the very high risk of investment, fueled by uncertainty about events or undesirable
phenomena and socio-economic issues. These elements are able to reduce the expected economic results
in a short time. Preventing these risks requires additional investments, in some cases quite substantial, in
the development of protective, logistics and training measures. Such items are accessible for agricultural
enterprises that are technologically and financial ensured.
Rural land market is determined by two groups of real estate objects. The first group, with a
dominant share, due to the scale of size and importance, is the farmland. The second group is represented
by lots of land from home yards. The area of these real estate objects is considerably lower than that of
agricultural land, but the market value is clearly superior that in the first group. This is due to their
location in rural or urban / peri-urban areas, as well as the perspective for developing processes of
construction of various social or industrial property objects.
Besides the lots of land of auxiliary households, in the category of inner land are assigned: land
for construction, land for public use, land for road transport, railways, for telecommunication lines and
power transmission, for mines and for other industries, woodland, agricultural lands and other lands [3].
Lands for housing are also part of this group. All these real estate, in turn, is divided into real estate
property belonging to legal persons and property where owners are individuals (privatized housing, real
estate objects, garages). Most of this real estate is found in Moldovan rural area depending on the socio-
economic development stage of the locality.
A special category of a relevant importance is represented by the real estate objects for housing.
Their share in the structure of real estate objects in rural areas exceeds the urban area.
According to statistics provided by the National Bureau of Statistics [11] on January 1, 2016
Moldova's housing stock consisted of 1 323.3 thousand apartments (homes) of which: 560.2 thousand
units in urban areas, while in rural areas – 763.1 thousand units. The urban areas account for 32 485.3 m2
or 39.8% of the total housing, while rural areas 49 046.0 m2 or 60.2%. However, the level of provision of
the population with housing in rural areas does not significantly differ from that in urban areas,
representing respectively 24.0 m2 for villages and 21.5 m2 for cities. The larges number of houses in rural
areas can be found in Hancesti district – 30.5 thousand, with a total area of 2289.7 thousand m2.
The value of property and the land plots where can be placed real estate objects for housing is
higher in the inner space of urban areas, especially in Balti and Chisinau, where the price of 1 are of such
land can be up to 10 000 EUR or much more. The value of real estate in the rural area is influenced to a
large extent, by the distance from the centers of production, processing and marketing, cities, natural water
basins, durable coating roads [5].
With the regulation of legislation on ownership right and privatization process, the residential
property market has boosted. It is interesting that the real estate market was the single market with real

Revistă teoretico-ştiinţifică / Theoretical and scientifical journal
136
No. 1-2 / 2017
estate goods allowed by the Soviet regime, at a time when our country was part of the former USSR. The
condition was that this market had to take place in rural areas, being allowed transactions with land around
houses and buildings located on it.
Currently, the residential property market is quite active, the number of commercial transactions
in 2015 reached 48.9 thousand [7], being surpassed only by the frequency of transactions with agricultural
land. This shows the growing interest of the population in this market being more attractive in urban areas
due to social and economic opportunities that can be provided by housing.
Residential real estate market in rural areas, unfortunately, did not experience the same situation
as in urban areas, even being in an acute phase of recession. Stagnation of this market became more
evident finishing the privatization process of land. Following the reformation of former collective
agricultural farms, a large part of the population lost their jobs. Also, the prospect of working in
agriculture on their own, in the context of a profound economic crisis was not seen as a stable source of
income. All these factors determined a good part of the rural population to focus on other sectors of the
national economy, to migrate to urban areas or even abroad.
In many rural localities can be found many sectors of land plots and unpopulated construction, that
do not present an economic interest for potential investors. Due to the lack of the supervision these real
estate objects are constantly degrading and in order to prevent this phenomenon it is necessary to
implement a number of complex and longstanding measures with the direct involvement of the state.
A component of the real estate market is the commercial real estate market. This is a less active
market comparing to other mentioned markets and includes commercial transactions with real estate
objects as: real estate objects for commercial use, restaurants, hotels, businesses providing services,
offices and real estate objects used for retail or wholesale trade. Compared with the land market and
housing market, the significant part of the commercial objects is found in urban areas due to the high
population density, higher living standards, as well as considerable financial turnover what is observed in
this environment.
If for the cities large shopping centers, markets selling goods, hotels and restaurants are
characteristic, then in rural areas, commercial real estate objects are represented by small shops of selling
consumer goods, companies that provide a limited range of services for the local population (barber shops,
repair shops of clothes, shoes, electric household machine), a small number of pharmacies, banking
institutions and offices.
According to statistics [10], 8794 stores were operating in the country in 2015, of which 3332 units
in Municipality of Chisinau, 2226 units in the North region of the republic, in Center – 1932 and in South –
827 stores. Transactional operations were applied on 12.2 thousand of commercial real estate objects [7].
Having an important specific – to generate revenue and reduced payback period compared to other
real estate, the commercial value of these assets is quite high. But these conditions can be met only if there
is a fairly high and stable flow of customers. In the context of degradation of the rural infrastructure,
reduction of the number of rural inhabitants and precarious living standards, economic agents providing
commercial services cease their activities while buildings are offered in rent or sale. As a result,
commercial buildings in rural areas are less attractive to potential investors, in the best case being sold at a
price greatly underestimated or being unexploited for a long time become subject to self-destruction.
The next part of the real estate market is the industrial property market in the food industry. It
incorporates real production units, such as: production buildings, administrative buildings and other
auxiliary buildings.
Industrial real estate market is characterized by a number of commercial transactions. Due to the
low financial liquidity, transactional frequency of these assets is determined by the particularity of objects,
the economic and political situation and last but not least by the investment climate in the Republic of
Moldova. These objects have large areas with massive building, located on large areas of land. Their
maintenance is performed under the presence of all municipal facilities and the supply of the access to the
production process. As a result of negative influence of political and economic factors, such objects are
rarely taken as collateral by commercial banks.
However, the industry, especially manufacturing, is of vital importance for the agricultural sector
of our country. In the view of Hontus D. [6, p.12], the industry of processing agricultural raw materials,
in addition to the role of providing material elements of capital accumulation in agriculture, also promotes
an institutional and socio-economic climate favorable for the diffusion of innovations. It also provides
the modernization of the industry, creating conditions for a better use of agricultural production.
ECONOMIE ŞI SOCIOLOGIE / ECONOMY AND SOCIOLOGY
137
No. 1-2 / 2017
The agrifodd processing enterprises in the Republic of Moldova currently represent one
of the basic investors in the agricultural sector. Because of their dependency on agricultural raw
materials, they also have a vested interest in maintaining, upgrading and creation of favorable business
conditions for farms.
According to the data provided by the National Bureau of Statistics [10] 1439 enterprises and
production units in the field of manufacturing activated in our country in 2014, having a considerable
impact on farms, in terms of the volume of colected agricultural production.
Although real estate transactions with industrial objects are quite anemic, however there are
present some activities with such goods. Average offer prices in the developed regions, from the industrial
point of view, can vary from 57 EUR / m2 in Cahul district and ranges up to 142 EUR / m2 in Balti [8].
The value of industrial real estate is largely determined by the overall condition of the housing
market. However, together with the economic and political factors can be highlighted and other elements
with a narrower influence, such as investment policy and strategies in the industry.
Another category of real estate is the forest fund of the Republic of Moldova. It is characterized by
forested areas, forest protection strips, and green spaces for recreation and / or scientific research.
At present, the national forest fund amounts to 12.7% of the country’s territory, extended over an
area of 374.5 thousand ha. The significant woodland – 326.4 thousand ha (87.2%) is managed by the
state, 45.7 thousand ha (12.2%) is in the public property of the administrative-territorial units and
only 2.4 thousand ha (0.6%) are in private property [13].
According to before mentioned data, the surface of forest land in private property is insignificant,
but owners of these private forest lands have created and still generate a number of problems for the
national forest fund. The origins of these problems lie in the very controversial Government Decision
no. 187 [2] adopted by the Government of the Republic of Moldova on February 20, 2008, that provides
the possibility of leasing the forest land to natural or legal persons. Initially, the amount of lease payment
amounted to 315 MDL/ha for land leased for the purpose of hunting management and 19092.37 MDL/ha
for land leased for recreational purposes. Later, through amendments to the Regulation on lending the
forest fund, adopted on June 15, 2016, lease of forest land was prohibited and the price of existing
contracts was capped, regardless of exploitation aim, at the level of 19092.37 MDL/ha.
Administrative and ecological objections for the current owners of forest land are underlying these
government actions. As a result of the lease, a large number of small and dispersed areas were formed in
the neighborhood of rural areas and the main variety grown on these forest plots is acacia that is an
invasive variety. On such surfaces compliance with the forestry regime is unsatisfactory; the measures on
taking care of the land are insufficient or lacking entirely, being affected by grazing, illegal logging and
pollution with waste.
Currently, between the ”Moldsilva” Agency and people who have in lease forest areas, there are
still 650 existing lease agreements out of 842 that were concluded during 2008-2015, with a tendency to
increase the number of terminated contracts.
Another goal pursued by promoting this Government Decision is the express prohibition
of transmission the right to lease for recreational purposes to other natural or legal persons, irrespective of
legal form. By this provision is desired to avoid "selling" of forests through the concession of rights to use.
Separated water objects with a small area, with not hydraulic connection with another surface
water body are also part of the structure of real estate, mainly located in rural areas. Typically, these are
ponds or lakes that are formed by damming the water.
The main artificial lakes of the Republic of Moldova, according to data [10], are: the lake
Costesti-Stanca, with an area of 59.0 km2 from Rascani district; the lake Cuciurgan – 27.3 km2 from
Slobozia district; the lake Dubasari from Dubasari district – 67.5 km2; the lake Ghidighici – 6.8 km2; the
Ialoveni lake – 4.4 km2 from Ialoveni district and the lake Taraclia – 15.1 km2 from Taraclia district.
There are also about 3,000 registered ponds with the total area of the water surface of about 333 km2.
According to SE “Cadastru” data [9], 4241.5 hectares of land for lakes were recorded
on 1 January 2016, of which 357.9 ha are in private property or leased. Given that private households are
the main source of fish production for the local market, this property is of particular interest to the real
estate market.
In many villages there are ponds that were built at the expense of former collective farms
(kolkhoz). They were leased by local governments to individual as land and ground water resources
remained to be a good of society. This has led to multiple conflicts between tenants and the local
Revistă teoretico-ştiinţifică / Theoretical and scientifical journal
138
No. 1-2 / 2017
population. A number of issues such as: lack of possibility of farmers to use water from these sources for
irrigation, limited access of local population to these water resources and inadequate ecologically
exploitation of these objects will has to be solved as soon as possible.
Creating and maintaining a favorable climate for investment activity in the real estate market is
vital for the state economy. It can only be implemented by providing the legal framework, access to
information and application of an argued system of monitoring and evaluation of the market. Only by
promoting coherent policies and strategies from the state, the real estate market will be able to generate a
significant of the the national economy and first of all of the living standards for its citizens.
Conclusions:
1. Real estate objects in rural areas represent the material and technical basis through which the
rural population creates living conditions and economic activity.
2. Due to the significant importance for the national economy, the land fund is the crucial element
which carries most of the social and economic processes in rural areas.
3. The residential real estate ranks second by number of transactions, but is positioned at the first
place according to the value of the invested capital.
4. Agro-industrial real estate market requires a high investment capital, which consist of capital
borrowed from banks and financial resources obtained from foreign investors. The amount of capital
invested in these properties is directly proportional to their ability to generate profit.
5. A significant part of the private and public real estate property in rural areas is not included in
the State Register „Cadastru”. Therefore, these goods are not able to be traded, that tregiversate
significantly the development of the real estate market in rural areas.
6. In roder to streamline real estate market in rural areas is necessary to implement a set of
concrete actions, including:
a. operatively completion of the cadastral database of the State Register „Cadastru”;
b. facilitation of access of population to cadastral data and those reflecting developments of real
estate transactions in the field;
c. coperation between the public and private sectors.
REFERENCES
1. Codul funciar al Republicii Moldova: Nr. 828-XII din 25 decembrie 1991, Monitorul Oficial al
Republicii Moldova nr. 107/817 din 04.09.2001. Chişinău: PRAG-3, 2010. 48 p.
ISBN 978-9975-77-116-0.
2. Hotărîrea Guvernului Republicii Moldova privind activitatea Agenţiei Relaţii Funciare şi Cadastru în
anul 2007: nr. 215 din 26.02.2008. In: Monitorul Oficial al Republicii Moldova. 2008, nr. 42-44,
art. 271.
3. BUZU, Olga, MATCOV, Angela. Evaluarea bunurilor imobiliare: teorie şi practică = Oцenкa
Heдвижимости: тeopя и практикаtcov. Chişinău: Ed. F.E.P ,,Tipografia Centrală”, 2003. 258 p.
ISBN 9975-78-226-4.
4. CATAN, Petru, POPESCU, Silvia. Eficientizarea funcţionării pieţei funciare în Republica Moldova:
monografia. Institutul Nistrean de economie şi Drept. Chişinău: Ed. Complexul editorial al IEFS,
2011. 240 p. ISBN 978-9975-4176-3-1.
5. CHIVRIGA,Viorel. Evoluţia pieţei funciare agricole în Republica Moldova. Institutul pentru
Dezvoltare şi Iniţiative Sociale „ Viitorul”. Chişinău: Ed.„ MS Logo” SRL, 2009. 48 p. Seria Politici
Publice, nr. 4. ISBN 978-9975-4007-4-9 [accesat 09 septembrie 2016]. Disponibil:
https://ru.scribd.com/document/42339037/Evolutia-Pietei-Funciare
6. HONŢUŞ, Dumitru. Economie rurală. Universitatea Spiru Haret. Facultatea de Medicină Veterinară.
Bucureşti: Ed. Fundaţiei „România de mâine”, 2008. 92 p. ISBN 978-973-163-154-7.
7. ÎNTREPRINDEREA DE STAT „CADASTRU”. Raport de activitate 2015. 29 p.
[accesat 09 septembrie 2016]. Disponibil:
http://www.arfc.gov.md/files/IS_CADASTRU_RAPORT_2015_PUBLICAT(3).pdf
8. Barometrul de afaceri în Republica Moldova. 2015 [accesat 09 septembrie 2016]. Disponibil:
http://www.infotag.md/press_release-ro/202483/
9. Fişa Cadastrală Centralizatoare [accesat 09 septembrie 2016]. Disponibil:
lex.justice.md/UserFiles/File/2012/mo135-141md/fisa%20cad_468.doc
10. Anuarul Statistic al Republicii Moldova = Статистический ежегодник Республики Молдова =

ECONOMIE ŞI SOCIOLOGIE / ECONOMY AND SOCIOLOGY
139
No. 1-2 / 2017
Statistical yearbook of the Republic of Moldova. Biroul Naţional de Statistică al Republicii Moldova.
Chişinău, 2015. 566 p. [accesat 09 septembrie 2016]. Disponibil:
http://www.statistica.md/public/files/publicatii_electronice/Anuar_Statistic/2015/Anuar_statistic_201
5.pdf
11. Banca de date statistice Moldova [accesat 09 septembrie 2016]. Disponibil:
http://statbank.statistica.md/pxweb/pxweb/ro/10%20Mediul%20inconjurator/10%20Mediul%20incon
jurator_MED050/?rxid=b2ff27d7-0b96-43c9-934b-42e1a2a9a774
12. BUZU, Olga. Sistemul de principii privind estimarea valorii bunurilor imobiliare = The System of
Principles for Estimating the Value of Real Estate. In: Economie şi sociologie = Economy and
sociology. 2012, nr. 4, pp. 203-207. ISSN 1857-4130.
13. Resursele forestiere [accesat 09 septembrie 2016]. Disponibil:
http://www.moldsilva.gov.md/pageview.php?l=ro&idc=180&t=/Fondul-forestier- national/Resursele-
forestiere
Recommended for publication: 05.05.2017

Revistă teoretico-ştiinţifică / Theoretical and scientifical journal
140
No. 1-2 / 2017
THE EVALUATION MECHANISM OF THE TAX PRESSURE
ON THE ECONOMY IN THE REPUBLIC OF MOLDOVA
Corina BULGAC1, PhD Student, University Lecturer,
Academy of Economic Studies of Moldova
The relevance of the research topic to today’s realities lies in the fact that one of the indicators,
which makes it possible to evaluate the tax policy effectiveness at macroeconomic level, is the indicator of
the tax pressure. Nowadays, an important component of the effective financial management is considered
the efficient tax planning and the tax pressure management, which is one of the key factors for a
successful economic activity. It is important to understand that the state's purpose is to collect sufficient
taxes to ensure the good operation of all state functions, and along with this, to avoid an excessive tax
pressure and not to allow it to repress the economic activity of the economic agents. The purpose of this
study is based on the argument that the indicator of the tax pressure on the economy, unfortunately, does
not reveal the actual level of tax exemptions based on the country's GDP. The study is based on using
modified methods of calculating the indicator of the country’s tax pressure, which are proposed by the
author and can be used for regulatory purposes. The study reveals that, independently, this indicator
reflects the share of GDP redistributed through taxes. But only in combination with other important
indicators of the socio-economic development of the country we can estimate the level of taxation in the
country and the efficiency of the fiscal system operation. The analysis of some indicators in a number of
countries shows that in Moldova the high tax pressure is associated with the low level of GDP and the
GDP per capita compared to other countries.
Keywords: tax pressure, tax receipts, fiscal policy, fiscal administration, tax payments, tax
regulation.
Actualitatea temei de cercetare constă în faptul că unul dintre indicatorii, care permit evaluarea
eficacității realizării politicii fiscale la nivel macroeconomic, este indicele presiunii fiscale. În prezent, o
componentă importantă a managementului financiar eficient este desfășurarea eficientă a planificării
fiscale și gestionării presiunii fiscale, care reprezintă unul dintre factorii esențiali ai activității economice
de succes. Evident este acel lucru, că scopul statului rezidă în colectarea impozitelor într-o cantitate
suficientă pentru asigurarea executării tuturor funcțiilor statului și, în același timp, evitarea faptului ca
presiunea fiscală să fie excesivă și să suprime activitatea economică a agenților economici. Scopul
acestui studiu se bazează pe argumentarea faptului că indicatorul presiunii fiscale asupra economiei, cu
regret, nu reprezintă nivelul real al nivelului scutirilor fiscale în temeiul evaluării PIB-ului țării. Studiul
se bazează pe utilizarea metodelor modificate de calcul al indicatorului presiunii fiscale a țării, propuse
de autor, care pot fi utilizate cu scop de reglementare. Studiul relevă că, de sine stătător, acest indicator
caracterizează ponderea PIB-ului redistribuită prin intermediul impozitelor și taxelor. Dar numai în
asociere cu alți indicatori importanți ai dezvoltării socio-economice a țării se poate de estimat gravitatea
fiscalității în țară și eficiența de funcționare a sistemului fiscal. Analiza unor indicatori între țări arată că
în Republica Moldova presiunea fiscală înaltă se asociază cu nivelul scăzut al PIB-ului și al PIB-ului pe
cap de locuitor în comparație cu alte țări.
Cuvinte-cheie: presiune fiscală, încasări fiscale, politică fiscală, administrare fiscală, plăți fiscale,
reglementare fiscală.
Одним из показателей, позволяющих оценить эффективность реализации налоговой
политики на макро-уровне, является показатель налоговой нагрузки. В настоящее время одним из
важнейших компонентов эффективного финансового менеджмента в организациях является
эффективное осуществление налогового планирования и управления налоговой нагрузкой, которые
являются одним из существенных факторов их успешной экономической деятельности. Цель
1 © Corina BULGAC, [email protected]

ECONOMIE ŞI SOCIOLOGIE / ECONOMY AND SOCIOLOGY
141
No. 1-2 / 2017
государства – собрать налоги в сумме, достаточной для обеспечения исполнения всех функций
государства, и в то же время не допустить того, чтобы налоговая нагрузка была чрезмерной и
подавляла экономическую деятельность организации. Целью исследования является понимание
того, что показатель налоговой нагрузки на экономику страны, рассчитанный как соотношение
объема уплаченных налогов и сборов в бюджетную систему к произведенному ВВП, к сожалению,
не характеризует реальный уровень налоговых изъятий. Исследование основано на применение
модифицированных методов расчета показателя налоговой нагрузки страны, которые могут
быть использованы для целей ее регулирования. Исследование показывает, что этот показатель
отражает долю ВВП, который перераспределяется за счет налогов. Но только в сочетании с
другими важными показателями социально-экономического развития страны можно оценить
серьезность налогообложения в стране и операционной эффективности налоговой системы.
Анализ показателей между странами показывают, что в Молдове высокая налоговая нагрузка
связана с низким уровнем ВВП и ВВП на душу населения по сравнению с другими странами.
Ключевые слова: налоговая нагрузка, налоговые поступления, налоговая политика,
налоговое администрирование, налоговые платежи, налоговые правила.
JEL Classification: H25, H32.
UDC: 336.22:334.7
Introduction. Not every state possesses a rational fiscal policy and an efficient mechanism for its
implementation. The key issue of the tax pressure management, in my opinion, is to determine the
optimum value of tax payments. It is important to understand that the state's purpose is to collect enough
taxes to ensure the operation of all state functions and at the same time to avoid an excessive tax pressure
that suppresses the economic activity of the organization.
From the state’s point of view, the "tax pressure level" indicator is used to determine the optimal tax
levies in order to ensure economic growth and supplement the budget in the regions and the economy as a
whole. At the same time, the value of tax levies influences the financial and economic activity of
economic entities. In this regard, it is necessary to strike a balance between the state’s and institution’s
fiscal objectives concerning the optimization of tax payments and the creation of such a fiscal mechanism
that will allow for the principle of fair taxation, which takes into account the possibility for the taxpayer to
make mandatory payments and have the opportunity to develop production [6, p.58].
The scientific approach to the topic and its presentation in the scientific literature. According
to the majority of scientists in the fiscal field, the tax pressure is an indicator of the overall fiscal impact
on the economy as a whole, on individual economic entities or on other taxpayers, and is defined as the
share of their income paid to the state in taxes and other fiscal mandatory payments.
The tax pressure indicator is crucially important in carrying out a number of tasks, which are related
to the fiscal policy development, the comparative analysis conduct of the tax pressure in different
countries, the state social policy formation, as well as the economic behave our fore cast of the economic
entity.
In relation to the above mentioned tasks, the issue of defining, establishing and maintaining the
optimal tax pressure on the economy plays an important role in the creation and improvement of the tax
system of any state [3, p.89-90].
The basic contents. The tax pressure indicator on the economy, calculated as the ratio between the
amount of taxes and the taxes paid to the budget system as to the generated GDP, regretfully, it does not
represent the real level of the tax exemptions based on the country's GDP evaluation, which consists in the
adjustment of the official data of output to the GDP value from the informal sector of the economy.
Therefore, we suggest using the modified methods of calculating the country's tax pressure indicator,
which can be used for regulatory purposes [7, p.245].
There has also been developed a complex method for estimating the tax pressure on the economy of
the country (region, public and legal education) based on the calculation of indicators, whose structure
varies depending on the purpose of the proposed use: to perform transnational, interregional comparisons;
to choose the fiscal policy instruments [1, p.12]. This method includes the calculation of 2 indicators: the
tax capacity of the economy and fiscal regulation (Table 1).

Revistă teoretico-ştiinţifică / Theoretical and scientifical journal
142
No. 1-2 / 2017
Table 1
The evaluation mechanism of the tax pressure on the economy Indicator Purpose of use Calculation formula
Tax pressure type 1 (the tax
capacity of the economy)
TBE (tax pressure on the
economy)
Transnational, interregional
comparison
RTR
TBE = ________ х 100%
GDP
where, RTR - real tax receipts to the budget
Tax pressure type 2 (tax
regulation) - RTB Regulatory
tax pressure
The choice of the fiscal policy
regulation instruments, sector
comparisons
RTR
RTB = _______ х 100%
GAD
where, GAD – gross added value
Source: Created by РОГОЖИН А.Н. Налоговая нагрузка в системе налоговой политики государства
и организаций. Автореферат диссертации на соискание ученой степени кандидата экономических
наук. Саратов, 2012 [1, p.12].
Both indicators of the tax pressure are based on the calculation of the real tax receipts to the
budgetary system of the country. Tax pressure type 1 (the taxable capacity of the economy) is calculated
in relation to GDP and is suitable for conducting an international and inter-regional comparative analysis
of the tax pressure. The indicator of the tax pressure type 2 (tax regulation) is calculated in relation
to the added value and is effective in assessing the balance level of the state and business
interests, the opportunities of applying the fiscal policy regulation instruments. Thus, we will do the calculation according to the coefficients for the Republic of Moldova for the
last five years (table 2). Both coefficients show a clear upward trend in 2012 compared to 2011, followed
by a gradual decrease over 2012-2015. From the taxpayer’s point of view, anything, even a slight
reduction in the tax pressure, is a positive result.
Table 2
The tax pressure on the economy of the Republic of Moldova, calculated by different methods
Indicators 2011 2012 2013 2014 2015
GDP, m.lei 82348,703 88227,753 100510,471 112049,578 121850,947
Tax receipts in the national public budget, m. lei 25580,0 28863,2 32173,2 35630,8 38107,1
Gross added value, m. lei 68390 73686 83719 94504 103161
Coefficient 1. The ratio of the national public
budget tax revenue to GDP,% 31,06 32,71 32,01 31,80 31,27
Coefficient 2. The ratio of tax revenues tothe
gross value added,% 37,40 39,17 38,43 37,70 36,94
Source: Author's calculations based on data from the Ministry of Finance of the Republic of Moldova and
from the National Bureau of Statistics of the Republic of Moldova [9, 10].
For a better understanding, here are the coefficients calculated in a graph form figure 1.
Figure 1. The dynamics of the tax pressure type 1 and 2 in the Republic of Moldova for 2011-2015,%
Source: Developed by the author on the data from table 1.
31,06
32,7132,01 31,8
31,27
37,4
39,1738,43
37,7 36,94
30
2011 2012 2013 2014 2015
Coefficient 1. Tax revenue ratio of the budgetpublic național,%
Coefficient 2. The ratio of tax revenues to Gross Value, %
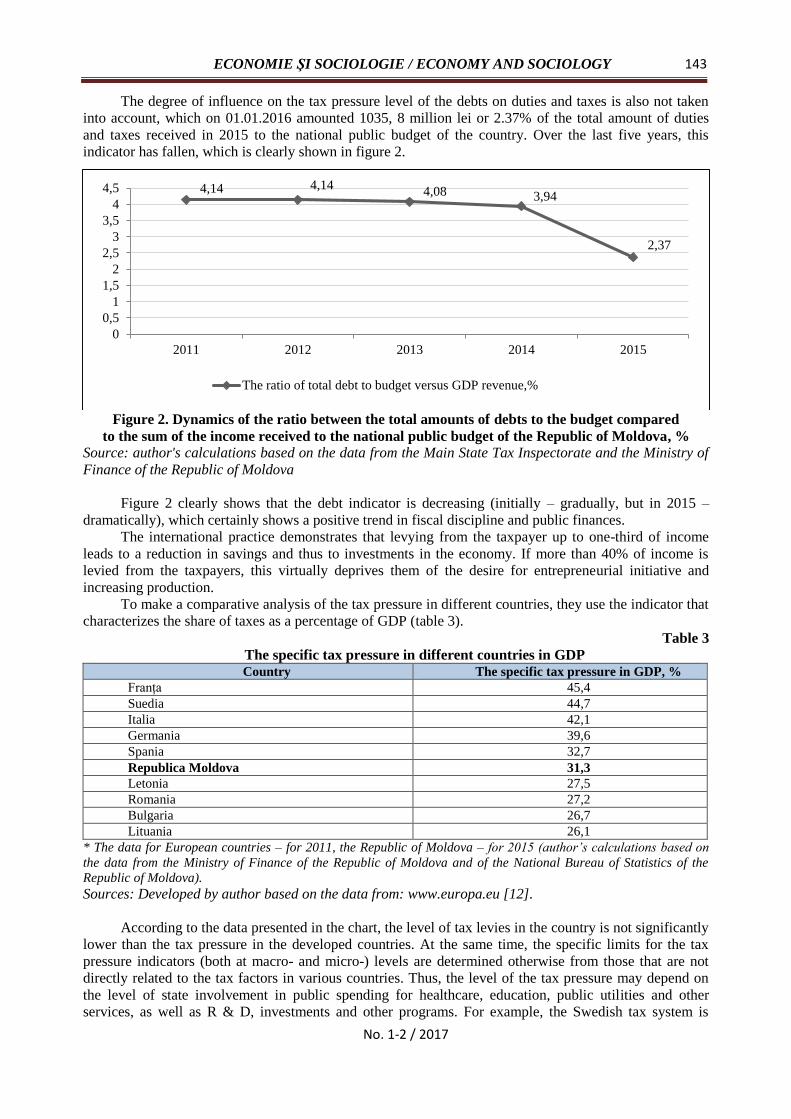
ECONOMIE ŞI SOCIOLOGIE / ECONOMY AND SOCIOLOGY
143
No. 1-2 / 2017
The degree of influence on the tax pressure level of the debts on duties and taxes is also not taken
into account, which on 01.01.2016 amounted 1035, 8 million lei or 2.37% of the total amount of duties
and taxes received in 2015 to the national public budget of the country. Over the last five years, this
indicator has fallen, which is clearly shown in figure 2.
Figure 2. Dynamics of the ratio between the total amounts of debts to the budget compared
to the sum of the income received to the national public budget of the Republic of Moldova, %
Source: author's calculations based on the data from the Main State Tax Inspectorate and the Ministry of
Finance of the Republic of Moldova
Figure 2 clearly shows that the debt indicator is decreasing (initially – gradually, but in 2015 –
dramatically), which certainly shows a positive trend in fiscal discipline and public finances.
The international practice demonstrates that levying from the taxpayer up to one-third of income
leads to a reduction in savings and thus to investments in the economy. If more than 40% of income is
levied from the taxpayers, this virtually deprives them of the desire for entrepreneurial initiative and
increasing production.
To make a comparative analysis of the tax pressure in different countries, they use the indicator that
characterizes the share of taxes as a percentage of GDP (table 3).
Table 3
The specific tax pressure in different countries in GDP Country The specific tax pressure in GDP, %
Franța 45,4
Suedia 44,7
Italia 42,1
Germania 39,6
Spania 32,7
Republica Moldova 31,3
Letonia 27,5
Romania 27,2
Bulgaria 26,7
Lituania 26,1
* The data for European countries – for 2011, the Republic of Moldova – for 2015 (author’s calculations based on
the data from the Ministry of Finance of the Republic of Moldova and of the National Bureau of Statistics of the
Republic of Moldova).
Sources: Developed by author based on the data from: www.europa.eu [12].
According to the data presented in the chart, the level of tax levies in the country is not significantly
lower than the tax pressure in the developed countries. At the same time, the specific limits for the tax
pressure indicators (both at macro- and micro-) levels are determined otherwise from those that are not
directly related to the tax factors in various countries. Thus, the level of the tax pressure may depend on
the level of state involvement in public spending for healthcare, education, public utilities and other
services, as well as R & D, investments and other programs. For example, the Swedish tax system is
4,14 4,144,08 3,94
2,37
0
0,5
1
1,5
2
2,5
3
3,5
4
4,5
2011 2012 2013 2014 2015
The ratio of total debt to budget versus GDP revenue,%

Revistă teoretico-ştiinţifică / Theoretical and scientifical journal
144
No. 1-2 / 2017
structured in such a way that taxpayers pay more than 44% of their income, and this does not lower their
incentives for entrepreneurial activity. This is not a paradox, because in a centralized way, the state solves
many of the economic and social problems from the tax receipts, which in other countries the tax payer
shave to solve by themselves, from their own income after tax [3, p. 89-90].
If we take into account the tax pressure (as a share of the tax revenues in the GDP of the Republic
of Moldova) increasingly (for 2000-2015) (figure 3), it is obvious that over 2000-2007 the tax pressure
was constantly increasing and reached a peak (in 2007 – 33.6%), then it was fluctuating over a few years,
but then it decreased insignificantly (in 2015 – 31.3%).
Figure 3. The dynamics of the tax pressure in the Republic of Moldova over 2000-2015, %
Source: Created by the author based on the data from the website of the Ministry of Finance of the
Republic of Moldova [9].
The share of taxes to GDP as a percentage does not reveal the real size of the current tax pressure
on a particular taxpayer, who conscientiously pays the taxes, and this can be explained by the facts as
follows. First of all, they ought to take into account those serious issues related to tax discipline. The
existence of this problem is confirmed by the indicators that describe the size of tax debts to the budget.
Practice shows that the calculated tax liabilities and their actual fulfilment is not the same thing, and the
tax pressure indicator is determined based on the real taxes paid to the budget or planned for the next
fiscal year. Therefore the level of tax collection is questionable in terms of the fairness of the
aforementioned indicator. Thus, the cumulative tax pressure indicator should be adjusted taking into
account the collection rate, and namely the amount of annual yield or the reduction in payment arrears to
all types of budgetary and extra-budgetary funds.
Another factor that influences the objectiveness of the tax pressure evaluation is the
misrepresentation of GDP due to significant measurement errors. This situation is explained by the fact
that statistical institutions add to the GDP indicator, which is calculated according to the statistical reports,
their official data to the amount of GDP produced in the so-called underground economy. Another
important factor in determining the tax pressure indicator is the socio-economic conditions in which
taxpayers are forced to carry out their financial and economic activity and have to pay taxes. There are
still a number of important factors that "make heavier" the fiscal pressure of the taxpayer, such as the
slender development of market relationships, the country's imperfect and constantly changing fiscal
system without affecting the size of the absolute indicator of the tax pressure.
The tax pressure on the country's economy can likewise be calculated by two methods (table 4).
Table 4
The tax pressure on the economy of the country (calculated by different methods), % Indicators
The ratio of the national public budget tax revenue to GDP
Tax ratio to GDP without calculating the adjustments for informal activities (based on 25% GDP)
Tax ratio to the GDP without taking into account social and health insurance
Source: Created by the author based on ЮРЧЕНКО, В.Р. Регулирование налоговой нагрузки как фактора развития производства. Автореферат диссертации на соискание ученой степени кандидата экономических наук. Москва, 2007, с. 13 [2, p. 13].
24,7 24,1 25,627,3 29,4
31,2
32,9 33,6 33,2 31,7
30,7 30,5
31,8 31,2
31,8
31,3
0
10
20
30
40
2000 2001 2002 2003 2004 2005 2006 2007 2008 2009 2010 2011 2012 2013 2014 2015
Tax burden,%

ECONOMIE ŞI SOCIOLOGIE / ECONOMY AND SOCIOLOGY
145
No. 1-2 / 2017
The indicator of the fiscal pressure on the country's economy alone characterizes the share
of GDP redistributed through taxes and duties, but only in conjunction with other important
indicators of the socio-economic development of the country they can evaluate the bad condition of
taxation within the country and the efficient functioning of the fiscal system. Therefore, the author makes
valuable theoretical conclusions that explain that the greatest tax capacity of a country exists in that
country where:
1) labour productivity is growing rapidly;
2) the GDP output is growing more rapidly than the number of the population in the country;
3) GDP is distributed more evenly;
4) the greatest part of taxes is spent in such a way as to serve the interests of the majority, especially
the poorer part of the population;
5) at the basis of the state policy lies the desire to find a balance in the development level of the
sectors, regions and living standards of the different social classes.
Whilst putting this approach into practice, there has been made an attempt to compare the degree of
the tax pressure in the Republic of Moldova and other countries using certain indicators that describe the
development level of the countries (table 5).
Having analysed the data, we can conclude that the tax pressure in the Republic of Moldova is not
much below the level of the tax pressure in the developed countries in the case of specific difficulties in
labour remuneration in GDP (41.2% in the Republic of Moldova, in other countries 46.6-57.8%). Along
this, the GDP per capita in our country is much lower than in other countries.
Table 5
The comparison of the tax pressure level and socio-economic
indicators in some countries
Countries
Tax
pressure
%
Specific share
of employees'
salaries in
GDP, %
GDP per
capita,
US
dollars
The indicator
of human
potential
development
Labour
productivity
level, %
The use of
GDP in
gross
receipts
Russian Federation 36,1 46,6 8087 0,795 23,3 20,3
Great Britain 37,3 56,3 28906 0,936 74,5 16,5
France 45,0 52,5 27701 0,932 72,3 20,6
Japan 28,6 53,3 27207 0,938 78,5 25,2
Republic of Moldova 31,8 41,2 2244 0,699 40,8 25,4
Source: Created by the author based on ЮРЧЕНКО, В.Р. Регулирование налоговой нагрузки
как фактора развития производства. Автореферат диссертации на соискание ученой
степени кандидата экономических наук. Москва, 2007, с. 12 [2, p.12]; BNS al Republicii Moldova –
pentru 2014 [10].
If to analyse a number of countries that are close to the Republic of Moldova in terms of GDP
volume, the following results come out (table 6).
Table 6
GDP and tax pressure in some countries Country GDP, trillion dollars Tax pressure, %
Kosovo 6,45 21,0
Republic of Moldova 6,44 31,3
Niger 5,68 15,8
Tajikistan 6,25 28,3
Haiti 7,46 12,2
Rwanda 7,14 13,9
Kyrgyzstan 6,68 20,8
Benin 8,27 16,3
Source: Created by the author based on the data from the website
https://tradingeconomics.com/gdp
The analysis of the data presented in table 6 allows us to conclude that the Republic of Moldova has
a very high tax pressure compared to the group of countries similar in terms of GDP volume.

Revistă teoretico-ştiinţifică / Theoretical and scientifical journal
146
No. 1-2 / 2017
Further, we will are going to make a comparative analysis between countries (the Republic of
Moldova and several other countries) according to other indicators. According to the calculations, the tax
pressure in the Republic of Moldova accounted for 31.5%. Having a number of countries with a similar
tax pressure indicator, we have received the following data (table 7).
Table 7
Several indicators from different countries
Country
Tax
pressure,
%
Income
tax rate
Corpor
ate tax
rate
GDP,
trillion
dollars
Economic
growth,
%
GDP per capita,
thousands US
dollars
Share of state
expenditures
in GDP, %
Israel 30,5 48 26,5 268,5 2,8 32691 41,3
Argentina 30,6 35 35 947,6 0,5 22582 40,3
Canada 30,6 29 15 1591,6 2,5 44342 40,7
Botswana 31,3 25 22 33,7 4,9 16036 32,4
Republic of Moldova 31,3 18 12 6,44 4,6 2244 38,5
Cyprus 31,8 35 12,5 27,4 -2,3 30769 41,9
Estonia 31,8 20 20 35,6 2,1 26999 38,8
New Zeeland 32,1 33 28 158,9 3,2 35152 42,4
Namibia 32,1 37 34 23,6 5,3 10765 41,3
Source: Developed by the author.
Thus, summarizing the data in tables 6 and 7, we can conclude that the high tax pressure in the
Republic of Moldova does not contribute to GDP growth, but it possibly hinders growth.
The data in the table clearly show that if to compare the Republic of Moldova with other countries
which have the same tax pressure level, we will observe that even having the lowest rates of income tax
(both for citizens and for companies), the Republic of Moldova has the smallest volume of GDP and GDP
per capita (at least 2 times lower compared to other countries in the sample).
Conclusions and recommendations: Making an overview of the contemporary scholars’ opinions
who have studied taxation and the tax pressure, we can conclude that the total amount of taxes and duties
paid to the budget, either at macro or micro level, is to be called a tax pressure in absolute terms, because
this information does not carry any other information or any other sense, other than information about the
amount of taxes and duties paid [2, p.21].
At the same time, taking into account the existing definitions for the „tax pressure” concept at
regulatory level in the fiscal regulation field, in order to assess the impact of taxation both on the economy
as a whole and on economic entities, it would be appropriate to define the concept of tax pressure as "the
tax pressure at micro-level which is the share of a levied part of the economic entity's income to the
budgetary system as taxes and duties, as well as other tax payments" [4, p.98].
The tax pressure indicator on the country's economy alone, however, still describes the share of
GDP redistributed through taxes and duties. However, only in conjunction with other important indicators
of the socio-economic development of the country it is possible to estimate the bad condition of taxation
in the country and the efficient functioning of the fiscal system [5, p.169].
The analysis of some indicators between countries has shown that in the Republic of Moldova the
high tax pressure is associated with the low GDP and GDP per capita compared to other countries.
REFERENCES
1. РОГОЖИН, А.Н. Налоговая нагрузка в системе налоговой политики государства и
организаций: автореферат диссертации на соискание ученой степени кандидата
экономических наук. Саратов, 2012. 19 с.
2. ЮРЧЕНКО, В.Р. Регулирование налоговой нагрузки как фактора развития производства:
автореферат диссертации на соискание ученой степени кандидата экономических наук.
Москва, 2007. 21 с.
3. МАРШАЛЛ, А. Основы экономической науки. Москва: Эксмо, 2007. 832 c. ISBN
5-699-19302-2.
4. БАРУЛИН, С.В. Теория и история налогообложения: учебное пособие. Москва: Экономист,
2006. 319 с. ISBN 5-98118-150-8.

ECONOMIE ŞI SOCIOLOGIE / ECONOMY AND SOCIOLOGY
147
No. 1-2 / 2017
5. РОМАНОВСКИЙ, М.В., ВРУБЛЕВСКАЯ, О.В. Налоги и налогообложение: учебник. 6-е изд.
2008. 528 с. ISBN 978-5-388-00532-8.
6. БРЫЗГАЛИН, А., ред. Налоги и налоговое право. Москва: «Аналитика-Пресс», 1998. 608 с.
ISBN 5-7916-0007-0.
7. МИЛЯКОВ, Н.Н. Налоги и налогообложение: курс лекций. Москва: ИНФРА-M, 2000. 347 с.
8. Обзор налогообложения в странах Таможенного Союза ЕврАзЭС [Accesat 21 ianuarie 2017].
Disponibil: https://www.iep.ru/files/text/taxation_CIS/1.2013.pdf
9. Ministerul Finanţelor al Republicii Moldova. [Accesat 21 ianuarie 2017]. Disponibil:
www.mf.gov.md
10. Biroul Naţional de Statistică. [Accesat 21 ianuarie 2017]. Disponibil: www.statistica.md]
11. CAPRIAN, I. Role of tax penalties in taxpayers education. In: Economie şi Sociologie = Economy
and Sociology. 2015, nr. 1, pp. 78-84. ISSN 1857-4130.
12. European Union. [Accesat 21 ianuarie 2017]. Disponibil: www.europa.eu
Recommended for publication: 11.04.2017
Revistă teoretico-ştiinţifică / Theoretical and scientifical journal
148
No. 1-2 / 2017
POPULATION AGEING DETERMINANTS
IN THE REPUBLIC OF MOLDOVA AND SELECTED EUROPEAN COUNTRIES
Elena HRUSCIOV1, Scientific Researcher, Centre for Demographic Research,
National Institute for Economic Research, Moldova
The article presents the results of the research on the determinant factors of demographic aging in the Republic of Moldova and some European countries (Italy, Germany, Czech Republic, Ukraine and Belarus). The results showed that in Italy, Germany and the Czech Republic the deepening of the aging process is associated with a significant increase of the life expectancy at advanced ages. Despite the fact that the decline in fertility contributes to the changing of the age structure and aging of population, migration flows reduce the negative effects of changes in the age structure and prevent the decline of the population. In Eastern European countries – Ukraine, Belarus and Moldova, the reduced tempo of decreasing mortality and increasing life expectancy at the advanced ages does not contribute to the demographic aging from "top". The decline in fertility, the peculiarities of age structure and emigration are the main factors of demographic aging and population decline.
Keywords: demographic aging, mortality, fertility, migration, age structure.
În articol sunt prezentate rezultatele cercetării factorilor determinanți ai îmbătrânirii demografice a populației din Republica Moldova și unele țări europene (Italia, Germania, Republica Cehă, Ucraina și Belarus). Rezultatele au arătat că, în Italia, Germania și Republica Cehă, aprofundarea procesului de îmbătrânire este asociată cu o creștere semnificativă a speranței de viață a vârstnicilor. În ciuda faptului că declinul fertilității contribuie la schimbarea structurii pe vârste și îmbătrânirii populației, imigrația atenuează efectele negative ale schimbărilor în structura pe vârste și previne reducerea populației. În țările din Europa de Est – Ucraina, Belarus și Moldova, tempoul redus de scădere a mortalității și de creștere a speranței de viață la vârstele înaintate nu contribuie la îmbătrânirea demografică „de sus”. Declinul fertilității, particularitățile structurii pe vârste și emigrarea sunt principalii factori ai îmbătrânirii demografice și reducerii numărului populației.
Cuvinte-cheie: îmbătrânire demografică, mortalitate, fertilitate, migrație.
В статье представлены результаты исследования определяющих факторов демографического старения населения в Республике Молдове и некоторых европейских странах (Италии, Германии, Чехии, Украины и Беларуси). Результаты исследования показали, что в Италии, Германии и Чехии углубление процесса старения связано со значительным ростом продолжительности жизни в пожилых возрастах. Несмотря на то, что снижение рождаемости также способствует изменению структуры и старению населения, миграционный приток уменьшает негативные эффекты изменения возрастной структуры и препятствует сокращению численности населения. В странах Восточной Европы – Украине, Беларуси и особенно в Республике Молдова низкие темпы сокращения смертности и увеличения продолжительности жизни в пожилых возрастах не способствуют демографическому старению «сверху». Сокращение рождаемости, особенности возрастной структуры и эмиграция являются основными движущими факторами демографического старения, а также сокращения численности населения.
Ключевые слова: старение населения, смертность, рождаемость, миграция.
JEL Classification: J11, J13, J19.
UDC: 316.346.32-053.9(478+4) Introduction. The ageing process is known to be the direct outcome of the demographic transition
when the age structure of a population becomes older by virtue of fertility and mortality declines. As a result of decreasing mortality, the cumulative time that a cohort lives through, by the same initial number increases. Every newborn survives on average to an old age, more often to an extreme
1 © Elena HRUȘCIOV, [email protected]

ECONOMIE ŞI SOCIOLOGIE / ECONOMY AND SOCIOLOGY
149
No. 1-2 / 2017
old age. Thus, the entire structure of the time spent by each cohort changes, or with the increase in the total number of years of life, the number of years lived in the working age and older ages, increases even more rapidly [17].
The importance of changing the age structure of the population and its consequences for social
and economic development was recognized in the Program of Action adopted by the International
Conference on Population and Development in 1994. Subsequently, the Madrid International Plan
of Action on Population Aging [14] was adopted to ensure dignity, social integration and the improvement
of living conditions for this large age group.
Developing social policies for older people has to be a central task of policy-making in aged
societies. Thus, the importance of developing of demographic aging plays a special role. Therefore, it is
important to see the main determinants that have led to the evolution of this process, in order to
understand the priorities of this phenomenon. It is necessary to make a comparison between countries
where the level of socio-economic development is much higher and faced demographic aging earlier
and successfully managed to cope with this phenomenon, positively addressing the growth of the
elderly population.
The aim of the research is to observe which are the peculiar factors, that led to demographic aging
in the Republic of Moldova and in the European selected countries, from the perspective of the main
drivers of aging. Given the fact that many of European countries are at the last phase of demographic
transition and others are at early stages, and demographic dynamics are different, the division of the
countries has been made. Among the Western European countries can be mentioned: Germany, Italy and
Czech Republic and from the Eastern European countries: Belarus, Bulgaria, Ukraine and the Republic
of Moldova. This division was made in order to understand better the evolution of the main determinants
of demographic aging.
Population ageing has an important interest among researchers. The most discussed works are of
Sanderson W. C. and Scherbov S. [9, 11, 10], who proposed to substitute traditional indicators for
measuring demographic aging with new indicators, based on a new forward-looking age measure.
Among Russian researchers the most known are the works of Scerbacova E., Vasin S., and
Vishnevskii A. [18, 15, 16], they are interested in the changes in the age structures of worldwide
populations, as a result of extremely low proportion of population at younger ages and a high proportion
of working and old age populations. The author approaches the topic of retirement taking into account the
dynamics of the life expectancy indicator, they discuss about the need to rise the retirement age, relying on
the experience of other countries [15].
The research of demographic ageing process has evolved in the Republic of Moldova, especially
in the last few decades. The latest report that includes information about population aging [1], describes
the demographic crisis from the Republic of Moldova, which is manifested through the process of
depopulation. According to the report, population aging in the Republic of Moldova takes place due to
fertility decline (1.6 children per woman in 2014) and the percentage redistribution of the three large age
groups (children, adults and elderly) in the total of population (18.5% – children, 64.4% – adults and
17.2% elderly for 2014). The forecasts on distribution show an increase of population aged 60 years
and over of 23.4% in the total of population.
A special interest has demographic aging from the perspective of new measuring indicators [2].
The author, by calculating prospective age for the Republic of Moldova, got to the conclusion that this
indicator decreased considerably for both sexes during the period 1970-2014 [2, p. 7]. Thus, the researcher
underlines the importance of monitoring the new prospective indicators for ensuring the mitigation of the
negative economic consequences of this phenomenon.
Methods and used data
For analysis of demographic ageing process, the countries were divided as it follows: Western European
countries (Germany, Italy and Czech Republic) and Eastern European countries (Belarus, Bulgaria, Ukraine and
the Republic of Moldova). Italy and Germany currently are at the highest level in European countries. Belarus,
Bulgaria and Ukraine were chosen because of their similarities of demographic trends with the Republic of
Moldova, as a result of demographic transition which occurred later than in Western European countries.
Research data is based on Human Mortality Database. For the Republic of Moldova data from the life
tables provided by the working paper "Producing reliable mortality estimates in the context of distorted
population statistics: the case of Moldova" by O. Penina, A. D. Jdanov and P. Grigoriev is used [6].

Revistă teoretico-ştiinţifică / Theoretical and scientifical journal
150
No. 1-2 / 2017
Data from Human Fertility Database was used for the analysis of the impact of fertility
on demographic ageing. For the Republic of Moldova, present population was used for the calculation
of TFR, which does not include migrants who have been absent from the country for more than
12 months [9].
To compare migration patterns of Western European countries and Eastern European countries
data from World Population Prospects, 2015 revision, were used. ISTAT database was used to analyze
which age groups mostly emigrate to EU.
As methods of research, classical approaches of demographic analysis of aging have been used.
The analysis was made for the period 1970-2014, 1980-2015 – due to lack of data on the numbers of births
provided by NBS of the Republic of Moldova.
The main results. Ageing results from the demographic transition, a process whereby reductions
in mortality are followed by reductions in fertility. Ageing is a dynamic process, determined by the
relative size of the younger and older cohorts in the population at different moments in time.
McCracken and Phillips [5] gave a description for the age structure of countries during each
demographic transition phase (table 1). It is an explanation for using the demographic transition theory for
explaining the spatial variations in population ageing.
Table 1
Age structure of countries during each demographic transition phases Demographic Transition
Phases
Age structure of countries during
each demographic transition phases
1. High stationary phase: Birth rates and death rates are
high. Population growth is kept at a low level by high death
rates largely caused by famines, diseases and/or wars.
During this phase, the population was young with
fewer than 4 per cent of the population aged 65+
2. Early expanding phase: Stable birth rate and rapidly
declining death rate. Population growth is stimulated due to
declining death rates as a result of improved nutrition,
sanitation and access to medicine.
During this phase, the population initially became
younger before shifting into a process of contraction
of the youth segment. When a country or region is in
this phase it is expected that between 4 per cent and
6.9 per cent of the population will be aged 65+
3. Late expanding phase: Declining birth rate and stable
death rate at a low level. Population growth slows and is
associated with urbanization of societies, shifts in attitudes
to birth control and family planning and changing patterns of
marriage.
During this phase, the youth segment of the
population contracted and the working age
population expanded. During this phase, the
proportion of the population aged 65+ will be
between 7 per cent and 19.9 per cent.
4. Low stationary phase: Stable low birth rate and stable low
death rate. Population growth is very slow and there is little
fluctuation in the death rate. The birth rate might fluctuate,
caused largely by the influence of social and/or economic
policy.
During this phase, ageing would exist in a
continuing pattern. During this phase, the
proportion of the population aged 65+ will be
between 20 per cent and 30 per cent.
Source: McCracken and Phillips [5].
Thus, according to McCracken and Phillips’s division, many European countries are in the fourth
phase of demographic transition. In 2015 Italy, had a population aged 65 years and over of 22%, meaning
that entered in the fourth phase of the demographic transition (table 2). In 2015, Germany had a
population aged 65 years and over of 21%, being in the fourth phase of demographic transition. Czech
Republic, in 2015, was in the third demographic transition phase, having a population aged 65 and over of
18%. It took 5 years for Italy and Germany to pass from a phase of demographic transition to another one.
Eastern European countries are still in the third phase of demographic transition, except
Bulgaria which entered in the fourth stage of demographic transition in 2015, having a population of 65
years and over of 20%. Ukraine and Belarus had almost the same share of population aged 65 and over in
2015. In the Republic of Moldova, the proportion of the population 65 and over constituted 11% in 2015,
meaning that the country is still in the third phase of demographic transition. The population of the
Republic of Moldova needed almost 40 years to pass from the second stage of demographic transition to
the third one (table 2).

ECONOMIE ŞI SOCIOLOGIE / ECONOMY AND SOCIOLOGY
151
No. 1-2 / 2017
Table 2
Proportion of population by broad age groups (%),
the Republic of Moldova and selected European countries, 1970-2015
Italy Germany Czechia Belarus Bulgaria Ukraine Moldova
0-1
4
15
-64
65
+
0-1
4
15
-64
65
+
0-1
4
15
-64
65
+
0-1
4
15
-64
65
+
0-1
4
15
-64
65
+
0-1
4
15
-64
65
+
0-1
4
15
-64
65
+
1970 25 64 11 23 63 14 21 67 12 29 62 9 23 68 10 24 66 9 32 61 6
1975 24 64 12 22 63 15 22 65 13 26 65 10 22 67 11 23 67 11 29 64 7
1980 22 65 13 19 66 16 23 63 14 23 66 11 22 66 12 22 67 12 27 65 8
1985 19 68 13 16 70 15 24 65 12 23 67 10 22 67 11 22 67 11 27 65 8
1990 17 69 15 16 69 15 22 66 13 23 66 11 20 67 13 21 67 12 28 64 8
1995 15 69 17 16 69 15 19 68 13 22 66 12 18 67 15 20 67 14 26 64 9
2000 14 68 18 15 68 16 16 70 14 19 68 14 16 68 17 17 69 14 24 66 10
2005 14 66 20 14 67 19 15 71 14 16 70 15 14 69 17 15 69 16 20 69 11
2010 14 66 20 14 66 21 14 70 15 15 71 14 14 68 18 14 70 16 19 70 11
2015 14 64 22 13 66 21 15 67 18 16 70 14 14 66 20 15 70 15 18 71 11
Source: World Population Prospects, the 2015 Revision, *calculated based on Penina O., Jdanov D.
A., Grigoriev P. [6].
Since 1980s it was observed a new demographic division among Western European countries and
Eastern Europe, presenting different trends of fertility and mortality rates. For Western European countries
are specific high levels of life expectancy, more and more people survive to older ages, thus, recording
low mortality rates. Another specific feature of West European countries are extremely low fertility rates.
For Eastern Europe, the slow growth of life expectancy and high level of mortality rates,
especially among ex-soviet countries are specific. Such development resulted in several European
countries having a natural decrease in population when total number of deaths started outnumbering the
total number of live births [7].
Mortality contribution to ageing. Economic development, improved lifestyles, advances in
healthcare and medicine, including reduced infant mortality rate, have resulted in a continuous increase
in life expectancy at birth across Europe during the last century. This process has been going on for longer
in Europe than in most other parts of the world, placing the European countries among the world leaders
for life expectancy.
The improvements in European countries were greater. Thus, Italy, as one of the most aged
countries from Europe, recorded an increase of life expectancy at birth. During the period 1970-2012, life
expectancy at birth for female population in Italy increased almost 10 years, male life expectancy at birth
increased by 11.02 years. An increase of female life expectancy at birth about 9 years is observed in the
Czech Republic, and almost 10 years for male population, during the period 1970-2014. Germany presents
also high levels of this indicator, thus, for the period 1990-2013, female life expectancy at birth increased
by 4.44 years and male life expectancy at birth increased by 6.08 years (figure 1).
The population of the Republic of Moldova has made gains in life expectancy, although life
expectancy at birth is still low. The gap in life expectancy between the Republic of Moldova and the rest
of Europe remains sizable. The countries from Eastern Europe face a low level of life expectancy at birth
comparing to the rest of Europe. Thus, Bulgaria records an increase of female life expectancy at birth of
3.74 years, during the period 1970-2010. Belarus had an increase of just 2.48 years for female population,
during the period 1970-2014, the same as in the Republic of Moldova. The lowest values for female life
expectancy are recorded by Ukraine, which had an increase of just 1.78 years.
If for female population life expectancy at birth had a small increase, than for male population
there is another situation. Thus, just in Bulgaria the values of this indicator grow up by 1.20 years. For
Ukraine, Belarus and the Republic of Moldova life expectancy at birth reduced by 0.19, 0.05 and
0.39 years (figure 1). The slow growth of life expectancy at birth in the Republic of Moldova is due to the
reduction of infant and child mortality, in a smaller measure at advanced ages, and the increase of
mortality of working age population, especially for men [7]. During 1965-2014, the infant mortality rate

Revistă teoretico-ştiinţifică / Theoretical and scientifical journal
152
No. 1-2 / 2017
decreased almost five times, while child mortality decreased three times. Currently, infant mortality
rate constitutes 9.7 deaths to 1000 live births (2014), which is close to the level recorded by Ukraine
(8,9 – in 2012), and it is still higher than EU (3.8 – in 2013) [1].
Figure 1. Life expectancy at birth, both sexes,
the Republic of Moldova and selected European countries, 1970-2014
Source: Human Mortality Database, *Penina O., Jdanov D. A., Grigoriev P. [6]
Demographic aging is a phenomenon that takes place due to a significant increase in the
proportion of elderly people aged 60 (65) and over and the increase in life expectancy, fertility decline and
migration of young people. In the last 40 years, the life expectancy of people aged 60 (65) years increased

ECONOMIE ŞI SOCIOLOGIE / ECONOMY AND SOCIOLOGY
153
No. 1-2 / 2017
by more than 20% in developed European countries, exceeding 20 years. During the period 1970-2012,
female life expectancy at 65 in Italy increased by 5.80 years, while for male population the increase was
about 5.14 years. Czech Republic recorded almost the same results for female life expectancy at 65 years
as Italy, during 1970-2014. For male population the increase was about 5 years during the same period.
Germany had an increase of life expectancy at 65 years for both male and female population about
3.39 years during the period 1990-2013 (figure 2).
Figure 2. Life expectancy at 65, both sexes,
the Republic of Moldova and selected European countries, 1970-2014
Source: Source: Human Mortality Database, *Penina O., Jdanov D. A., Grigoriev P. [6]

Revistă teoretico-ştiinţifică / Theoretical and scientifical journal
154
No. 1-2 / 2017
Demographic aging in Italy, Czech Republic and Germany takes place due to reduced mortality at
older ages and significant increase of life expectancy. Thus, in these countries takes place demographic
ageing from the 'top'.
Eastern Europe presents a different picture. The Republic of Moldova has the lowest values of life
expectancy at age 65 for both women and men. Thus, during the period 1970-2014, this indicator recorded
a decrease for females by 1.01 years and for males by 1.75 years (figure 2). Ukraine, Belarus and Bulgaria
present a life expectancy at 65, of 1.86, 2.90 and 2.07 years for female population. For male population,
Ukraine and Belarus has almost the same values of life expectancy as the Republic of Moldova. Bulgaria
has lower values for male population, by 1.85 years comparing to Moldova.
In the Republic of Moldova the high level of elderly mortality and low life expectancy are an
impediment for demographic ageing. The natural growth of population to the advanced and very advanced
ages does not take place [1]. The high mortality of working age population lead to the loss of human
potential, thus less population reaches old ages. Thus, the maintaining of a high level of population mortality
slows down the increase of the number of elderly people in the total of population.
Fertility decline. Another factor that influences the deepening of demographic aging is low
fertility. European countries have experienced a decrease in fertility below the level of 1.5 in 1982 in
Germany, in 1984 in Italy and ten years after, Czech Republic has passed the level of 1.5 children
per woman. For Germany and Italy, it took almost ten years to pass the level of lowest-low fertility
– 1.3 children per woman. For Czech Republic, the fertility decline below 1.3 children per woman took one
year. Currently, Germany and Italy are over the lowest low threshold of 1.3 children per woman,
while it took about 9 years to pass it. For Czech Republic, the passing over the lowest low fertility level took
about 11 years (figure 3).
The main vector in the evolution of fertility in European countries constitutes the transition from
the early to the late model and the restructuring of birth calendar. The phenomenon of low fertility and
lowest-low fertility in European countries was caused by fertility transition [12].
Figure 3. Total fertility rate,
the Republic of Moldova and European selected countries, 1980-2015
Source: Human Fertility Database, *calculated based on Penina O., Jdanov D. A., Grigoriev P.[6] and
NBS of Moldova.

ECONOMIE ŞI SOCIOLOGIE / ECONOMY AND SOCIOLOGY
155
No. 1-2 / 2017
While all European societies experienced lowest low fertility rates, Eastern European countries
are over very low (1.5) threshold of fertility rates. Thus, the period of maintaining under the threshold
of 1.5 and even 1.3 for these countries is very short. Ukraine, Belarus and Bulgaria were under 1.5 level
during a period of about 5 years. Currently, all these countries are over the threshold of 1.5 years children
per woman.
The Republic of Moldova passed the replacement level in 1993 and 6 years later, the fertility
decline was below 1.5. During the period 2000-2004, TFR remains with small fluctuations over the
threshold of 1.5 children per woman. Beginning with 2007, TFR for the Republic of Moldova did not
passed below 1.5 fertility threshold. During the period 2006-2015, the highest TFR for the Republic of
Moldova was in 2010 – 1.71 children per woman.
In perspective, even if TFR will have an increasing trend, the number of births will be very small
and will not be able to offset the population decline caused by the growth of deaths as a result of
demographic ageing [3].
In the Republic of Moldova, demographic ageing takes place due to fertility decline and
percentage redistribution of the three age groups (youth, working age people and elderly). The reduction
of mortality and the increase of life expectancy have an insignificant effect on this process. Thus, in the
Republic of Moldova demographic ageing takes place from the 'bottom'.
Migration contribution to aging. Migration is a process that contributes to the population aging
due to two factors: 1) the nature of migration (emigration or immigration) and 2) the age structure of
migrant population.
Positive net migration in Germany, Italy and Czech Republic, during the period 1970-2015, has
prevented these countries from experiencing the depopulation (figure 4), even if they face low fertility
rates, and decreased share of young population.
Eastern Europe countries face the problem of emigration. This demonstrates the negative
migration rates recorded by these countries. Belarus recorded negative migration rates during 1990-1995.
Currently, among Eastern selected European countries, the Republic of Moldova and Bulgaria face
massive population departures (figure 4), especially of working age adults, which accelerated
population ageing.
Figure 4. Net migration rate,
the Republic of Moldova and selected European countries, 1970-2015
Source: World Population Prospects, the 2015 Revision.
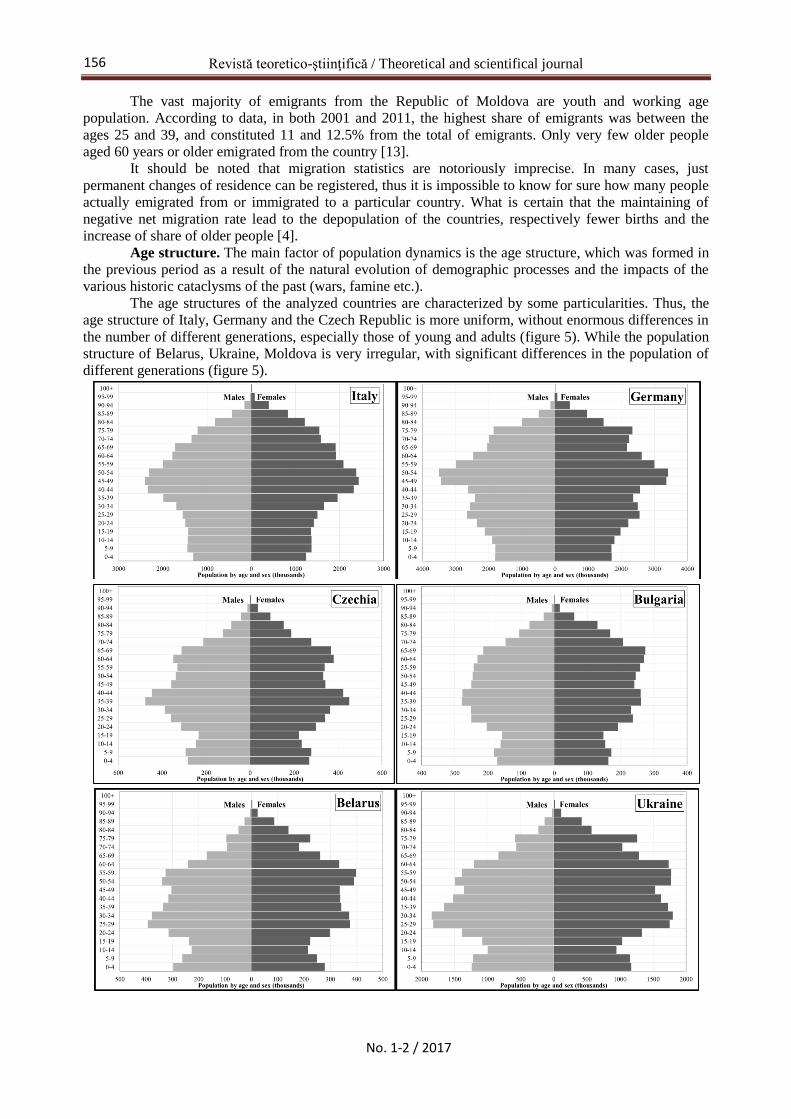
Revistă teoretico-ştiinţifică / Theoretical and scientifical journal
156
No. 1-2 / 2017
The vast majority of emigrants from the Republic of Moldova are youth and working age
population. According to data, in both 2001 and 2011, the highest share of emigrants was between the
ages 25 and 39, and constituted 11 and 12.5% from the total of emigrants. Only very few older people
aged 60 years or older emigrated from the country [13].
It should be noted that migration statistics are notoriously imprecise. In many cases, just
permanent changes of residence can be registered, thus it is impossible to know for sure how many people
actually emigrated from or immigrated to a particular country. What is certain that the maintaining of
negative net migration rate lead to the depopulation of the countries, respectively fewer births and the
increase of share of older people [4].
Age structure. The main factor of population dynamics is the age structure, which was formed in
the previous period as a result of the natural evolution of demographic processes and the impacts of the
various historic cataclysms of the past (wars, famine etc.).
The age structures of the analyzed countries are characterized by some particularities. Thus, the
age structure of Italy, Germany and the Czech Republic is more uniform, without enormous differences in
the number of different generations, especially those of young and adults (figure 5). While the population
structure of Belarus, Ukraine, Moldova is very irregular, with significant differences in the population of
different generations (figure 5).
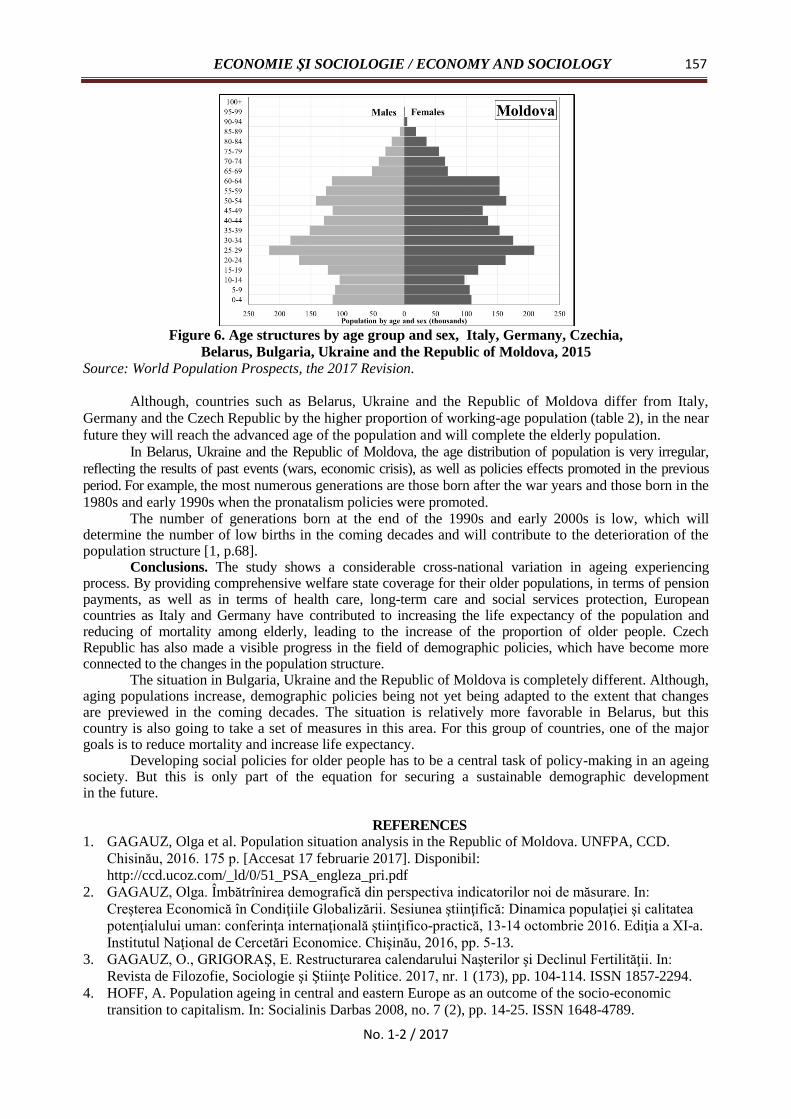
ECONOMIE ŞI SOCIOLOGIE / ECONOMY AND SOCIOLOGY
157
No. 1-2 / 2017
Figure 6. Age structures by age group and sex, Italy, Germany, Czechia,
Belarus, Bulgaria, Ukraine and the Republic of Moldova, 2015
Source: World Population Prospects, the 2017 Revision. Although, countries such as Belarus, Ukraine and the Republic of Moldova differ from Italy,
Germany and the Czech Republic by the higher proportion of working-age population (table 2), in the near
future they will reach the advanced age of the population and will complete the elderly population.
In Belarus, Ukraine and the Republic of Moldova, the age distribution of population is very irregular,
reflecting the results of past events (wars, economic crisis), as well as policies effects promoted in the previous
period. For example, the most numerous generations are those born after the war years and those born in the
1980s and early 1990s when the pronatalism policies were promoted. The number of generations born at the end of the 1990s and early 2000s is low, which will
determine the number of low births in the coming decades and will contribute to the deterioration of the population structure [1, p.68].
Conclusions. The study shows a considerable cross-national variation in ageing experiencing process. By providing comprehensive welfare state coverage for their older populations, in terms of pension payments, as well as in terms of health care, long-term care and social services protection, European countries as Italy and Germany have contributed to increasing the life expectancy of the population and reducing of mortality among elderly, leading to the increase of the proportion of older people. Czech Republic has also made a visible progress in the field of demographic policies, which have become more connected to the changes in the population structure.
The situation in Bulgaria, Ukraine and the Republic of Moldova is completely different. Although, aging populations increase, demographic policies being not yet being adapted to the extent that changes are previewed in the coming decades. The situation is relatively more favorable in Belarus, but this country is also going to take a set of measures in this area. For this group of countries, one of the major goals is to reduce mortality and increase life expectancy.
Developing social policies for older people has to be a central task of policy-making in an ageing society. But this is only part of the equation for securing a sustainable demographic development in the future.
REFERENCES
1. GAGAUZ, Olga et al. Population situation analysis in the Republic of Moldova. UNFPA, CCD.
Chisinău, 2016. 175 p. [Accesat 17 februarie 2017]. Disponibil:
http://ccd.ucoz.com/_ld/0/51_PSA_engleza_pri.pdf
2. GAGAUZ, Olga. Îmbătrînirea demografică din perspectiva indicatorilor noi de măsurare. In:
Creşterea Economică în Condiţiile Globalizării. Sesiunea ştiinţifică: Dinamica populaţiei şi calitatea
potenţialului uman: conferinţa internaţională ştiinţifico-practică, 13-14 octombrie 2016. Ediţia a XI-a.
Institutul Naţional de Cercetări Economice. Chişinău, 2016, pp. 5-13.
3. GAGAUZ, O., GRIGORAŞ, E. Restructurarea calendarului Naşterilor şi Declinul Fertilităţii. In:
Revista de Filozofie, Sociologie şi Ştiinţe Politice. 2017, nr. 1 (173), pp. 104-114. ISSN 1857-2294.
4. HOFF, A. Population ageing in central and eastern Europe as an outcome of the socio-economic
transition to capitalism. In: Socialinis Darbas 2008, no. 7 (2), pp. 14-25. ISSN 1648-4789.

Revistă teoretico-ştiinţifică / Theoretical and scientifical journal
158
No. 1-2 / 2017
5. MCCRACKEN, K., PHILLIPS, D.R. International demographic transitions. London: Routledge
Taylor and Francis Group, 2005. 60 p.
6. PENINA, O., JDANOV, D.A., GRIGORIEV, P. Producing reliable mortality estimates in the context
of distorted population statistics: the case of Moldova. 2015. 35 p. [Accesat 17 februarie 2017].
Disponibil: http://www.demogr.mpg.de/papers/working/wp-2015-011.pdf
7. GAGAUZ, Olga et al. Profilul sociodemografic al Republicii Moldova la 20 de ani după adoptarea
Programului de Acţiune de la Cairo. CCD INCE, AŞM. Chişinău, 2014. [Accesat 17 februarie 2017].
Disponibil: http://ccd.ucoz.com/_ld/0/3_CCD-culegeri-ca.pdf
8. RYCHTARIKOVA, J. Different risks of population ageing: EU old and new members [Accesat 21
februarie 2017]. Disponibil:
https://web.natur.cuni.cz/geografie/vzgr/monografie/evolution/evolution_rychtarikova.pdf
9. SANDERSON, W.C., SCHERBOV, S. Average remaining lifetimes can increase as human
populations age. In: Nature. 2005, vol. 435, pp. 811-813.
10. SANDERSON, W.C., SCHERBOV, S. Rethinking Age and Ageing. In: Population Bulletin. 2008,
vol. 63, no. 4. [Accesat 12 ianuarie 2017]. Disponibil: http://www.prb.org/pdf08/63.4aging.pdf
11. SANDERSON, W.C., SCHERBOV, S. A new perspective on population ageing. In: Demographic
research. 2007, vol. 16. [Accesat 12 ianuarie 2017]. Disponibil: https://www.demographic-
research.org/volumes/vol16/2/16-2.pdf
12. SOBOTKA, T. Is lowest-low fertility in Europe explained by the postponement of childbearing? In:
Population and Development Review. 2004, vol. 30, no. 2, pp. 195-220. ISSN 1728-4457.
13. TABAC, T. Structura pe vârste şi sexe a emigranţilor din Republica Moldova. In: Creşterea
Economică în Condiţiile Globalizării. Sesiunea ştiinţifică: Dinamica populaţiei şi calitatea
potenţialului uman: conferinţa internaţională ştiinţifico-practică, 13-14 octombrie 2016. Institutul
Naţional de Cercetări Economice. Chişinău, 2016, pp. 67-73. ISBN 978—9975-89-044-1.
14. Report of the Second Assembly on Ageing. United Nations. 2002, 8-12 april [Accesat 12 ianuarie
2017]. Disponibil: http://www.un.org/en/ga/search/view_doc.asp?symbol=A/CONF.197/9
15. ВАСИН, C. и др. Продолжительность жизни и возраст выхода на пенсию. Свидетельствует ли
опыт других стран о необходимости повышения возраста выхода на пенсию? Demoscope
weekly. 2012, N 511-512, 21 мая - 3 июня. [Accesat 12 ianuarie 2017]. Disponibil:
http://demoscope.ru/weekly/2012/0511/tema01.php
16. ВИШНЕВСКИЙ, A. Похвала старению. В: Демоскоп weekly. 2006, N 257-258, 18 сентября-1
октября. [Accesat 21 ianuarie 2017]. Disponibil: http://demoscope.ru/weekly/2006/0257/analit05.php
17. ВИШНЕВСКИЙ, А. Время демографических перемен. Высшая школа экономики. Институт
демографии. Москва, 2015. 850 с. ISBN 978-5-7598-1264-7.
18. ЩЕРБАКОВА, E. Доля пожилого населения будет расти в ближайшие десятилетия во всех
регионах мира. В: Демоскоп weekly. 2016, № 709-710, 12-11 декабря. [Accesat 7 ianuarie 2017].
Disponibil: http://demoscope.ru/weekly/2016/0709/barom01.php
19. GAGAUZ, Olga, BUCIUCEANU-VRABIE, Mariana. The socioeconomic status of the elderly. In:
Economie şi Sociologie = Economy and Sociology. 2015, nr. 3, pp. 21-25. ISSN 1857-4130.
Recommended for publication: 05.05.2017
ECONOMIE ŞI SOCIOLOGIE / ECONOMY AND SOCIOLOGY
159
No. 1-2 / 2017
RECENZIE
la monografia „Tratat despre pământ: importanța, starea, eficiența utilizării în agricultură”
Autori: Dumitru PARMACLI, doctor habilitat în științe economice, profesor,
doctor habilitat în științe economice, profesor, Universitatea de Stat din Comrat
Alexandru STRATAN, doctor habilitat în științe economice, profesor,
Institutul Naţional de Cercetări Economice, Republica Moldova
Agricultura, ca sector principal al economiei Republicii Moldova, este determinată de eficiența
utilizării terenurilor, deoarece ponderea culturilor de câmp ocupă peste 2/3 în volumul total al producției
agricole. Din această cauză, problemele, ce țin de atitudinea grijulie față de pământ și utilizarea lui
eficientă, sunt pentru țara noastră foarte actuale, deoarece au importanță nu doar științifică, ci și aplicativă.
Studierea multiaspectuală a componenței, structurii, calității resurselor funciare, identificarea nivelului
actual și potențial al capacității productive a principalului mijloc de producție în zonele rurale, permite
evaluarea realistă a eficienței gestionării terenurilor și identificarea rezervelor în creșterea producției.
După structură, monografia autorilor D.M.Parmacli și A.N.Stratan include 25 de capitole,
sistematizate într-o succesiune logică și cuprinde bazele teoriei și practicii, starea și eficiența utilizării
terenurilor în agricultură și importanța acestora pentru dezvoltarea localităților rurale, a mediului rural și
economiei țării.
Toate capitolele, după conțintul lor, sunt grupate în 4 părți: prima parte – pământul în sistemul
resurselor naturale ale Republicii Moldova – cuprinde primele 5 capitole; partea a doua – teoria utilizării
pământului – cuprinde capitolele 6-12; partea a treia – eficiența utilizării terenurilor: teorii, metode,
practici – cuprinde capitolele 13-18; partea a patra – statea actuală a utilizării terenurilor în Republica
Moldova – este expusă în capitolele 19-25.
În prima parte a monografiei autorii cercetării științifice examinează particularitățile resurselor
naturale ale Republicii Moldova ca factor important de producție, condițiile natural-climaterice,
problemele organizatorice, economice și ecologice în utilizarea acestora.
În partea a doua sunt reflectate realizările actuale ale științei economice în problemele teoriei
utilizării terenurilor. Autorii atrag atenția asupra importanței progresului tehnico-științific, ca factor
semnificativ în intensificarea utilizării potențialului productiv al pământului, precum și asupra principiilor,
formelor și metodelor reglemetării de stat a relațiilor funciare și abordării metodologice față de calcularea
potențialului funciar.
În partea a treia autorii pun accent pe cercetarea teoriei eficienței și evaluării economice a
terenurilor în agricultură, particularitățile acestora în contextul agriculturii nesustenabile a Republicii
Moldova. În această parte a monografiei este examinată, de asemenea, analiza marginală și argumentat
venitul marginal și particularitatea utilizării lui în agricultură, precum și stocul de putere financiară și
levierul operațional, ca indicator principal al eficienței producerii și comercializării produselor. Un loc
important în această parte a lucrării îl ocupă cercetarea eficienței utilizării pământului cu aplicarea metodei
mediei anuale mobile; tot aici autorii argumentează esența și problemele viabilității economice a
întreprinderilor și indicatorii activității operaționale, ca indici ai nivelului acestora.
A patra parte a lucrării este consacrată situației actuale în utiliarea pământului în Republica
Moldova. Aici sunt descrise particularitățile etapei actuale și evoluția nivelului de utilizare a pământului în
agricultură și a potențialului funciar în regiunile țării. Autorii monografiei au identificat cauzele
productivității scăzute a pământului, au efectuat o analiză comparativă a eficienței utilizării lui în
agricultura Republicii Moldova și a regiunilor învecinate ale Ucrainei: Odesa, Vinița, Hmelnițki, Cernăuți,
precum și în Româna. Au fost cercetate, de asemenea, eficiența utilizării pământului la producerea
culturilor cerealiere și a celor tehnice, plantațiilor multianuale, cartofului și legumelor în condițiile
relațiilor de piață și proprietății private asupra pământului. Au fost notate problemele economice ale
dezvoltării agriculturii și arătate căile de soluționare a acestora.
Autorii au acordat multă atenție argumentării potențialului productivității resurselor funciare și
asimilării lui (acest lucru este ilustrat în întreg capitolul opt), ceea ce, fără îndoială, este un lucru
binevenit. În acest scop a fost utilizat un volum mare de date statistice, care cuprinde evoluția recoltei la
hectar într-o perioadă de peste 50 de ani.
În capitolul 14 autorii au elaborat normativele obținerii profitului pe unitate de suprafață, care
asigură reproducerea simplă și extinsă în cadrul întreprinderilor și care au o valoare practică evidentă. Un

Revistă teoretico-ştiinţifică / Theoretical and scientifical journal
160
No. 1-2 / 2017
interes deosebit prezintă cercetarea, orientată spre evaluarea calității executării lucrărilor în agricultură și
impactul acestora asupra randamentului (subcapitolul 16.3), precum și metoda originală de evaluare a
efectului colateral de creștere a randamentului (subcapitolul 16.5). Este de menționat semnificația teoretică
și practică a metodei elaborate de gradare a nivelurilor de randament și rentabilitate a producției
(subcapitolul 15.2).
În toate capitolele monografiei este evidentă și poziția științific argumentată a autorilor, esența
căreia constă în utilizarea grijulie și eficientă a resurselor funciare, care constituie baza fundamentală
pentru succesul, revigorarea și dezvoltarea continuă a agriculturii și economiei Republicii Moldova în
ansamblu.
Valoarea lucrării constă, de asemenea, în faptul, că autorii au reușit să ilumineze întregul spectru
al cercetării în complexul problemelor economice, ecologice, tehnico-științifice și teoretice, care au un
impact serios asupra sustenabilității dezvoltării localităților rurale și a spațiului rural, asupra nivelului
social-economic și calității vieții populației.
Monografia profesorilor D.M.Parmacli și A.N.Stratan „Tratatul despre pământ: importanța, statea,
eficiența utilizării în agricultură”, cu volumul de 33 c.a., cuprinde un larg și multiaspectual spectru
complex al cercetărilor profunde în decursul multor ani, are o mare importanță științifică și practică,
prezintă interes pentru un cerc larg de savanți, specialiști și practicieni cu profil agrar, precum și pentru
toți cei interesați de studierea problemelor teoriei economice și utilizării eficiente, științific-argumentate a
pământului în agricultură.
Petru SABLUC, doctor în științe economice,
profesor, academician al ANȘA a Ucrainei
Valeriu DOGA, doctor habilitat în științe economice,
profesor, consultant ştiinţific,
Institutul Naţional de Cercetări Economice,
Republica Moldova

ECONOMIE ŞI SOCIOLOGIE / ECONOMY AND SOCIOLOGY
161
No. 1-2 / 2017
RECENZIE
la monografia „Tratat despre pământ: importanța, starea, eficiența utilizării în agricultură”
Autori: Dumitru PARMACLI, doctor habilitat în științe economice, profesor,
doctor habilitat în științe economice, profesor, Universitatea de Stat din Comrat
Alexandru STRATAN, doctor habilitat în științe economice, profesor,
Institutul Naţional de Cercetări Economice, Republica Moldova
Monografia „Tratat despre pământ: importanța, starea, eficiența utilizării în agricultură”
elaborată de Dl dr. hab., prof. Dmitrii Parmacli și Dl dr. hab., prof. Alexandru Stratan, reprezintă o analiză
comprehensivă a stării actuale a fondului funciar în Republica Moldova. Utilizarea eficientă a fondului
funciar constituie un factor important pentru dezvoltarea țării, în contextul existenței condițiilor favorabile
de calitate a solurilor. În pofida importanței critice a problemei pământului, până în prezent, nu au fost
abordate toate aspectele ce țin de evaluarea economică a terenurilor, metodele de calculare a potențialului
de productivitate a terenurilor etc. Astfel, monografia respectivă reflectă bazele metodologice și practice
de evaluare a potențialului funciar, ceea ce determină caracterul științifico-practic valoros al acesteia.
Prima parte a monografiei abordează aspectele economice, organizaționale, geografice,
climaterice, ecologice și de structură a fondului funciar din Republica Moldova. Autorii plasează un
accent deosebit pe aspectele agro-economice de utilizare a terenurilor, particularitățile activităților
agricole, precum și problemele existente de conservare a fertilității solurilor.
A doua parte implică abordarea unor aspecte teoretice de utilizare a terenurilor. Valoarea teoretică
constă în analiza potențialului de productivitate a terenurilor, evaluarea progresului științific și tehnologic
ca factor în intensificarea utilizării potențialului fondului funciar, precum și este prezentată teoria
intensificării utilizării terenurilor în agricultură.
A treia parte presupune combinarea aspectelor teoretice și practice de evaluare a eficienței
agriculturii, fiind scoase în evidență particularitățile analizei marginale, alte abordări metodologice cum ar
fi metoda grafică, metoda mediilor mobile, etc.
Ultima parte conține o analiză economică a situației generale a sectorului agricol din Republica
Moldova, având un caracter praxiologic evidențiat. Prin urmare, conţinutul lucrării corespunde scopului
propus înaintat de către autori, iar concluziile şi recomandările, formulate în monografie corespund
conţinutului cercetării, aceasta posedând elemente indubitabile de noutate ştiinţifică.
Se recomandă pentru publicare.
Dinu GAVRILESCU, profesor, doctor
Membru al Academiei de Științe Agricole și Silvice
„Gheorghe Ionescu-Șișești”, România

Revistă teoretico-ştiinţifică / Theoretical and scientifical journal
162
No. 1-2 / 2017
РЕЦЕНЗИЯ
на монографию докторов экономических наук, профессоров
Пармакли Д.М. и Стратан А.Н. на тему: «Трактат о земле: значение, состояние,
эффективность использования в сельском хозяйстве»
Сельское хозяйство, как ведущая отрасль экономики Молдовы, определяется
эффективностью использования земли, так как доля растениеводства занимает более 2/3 в общем
объеме сельскохозяйственной продукции. Вот почему проблемы бережного отношения к земле и
проблемы эффективного ее использования являются для Республики Молдова весьма актуальными
– они имеют важное не только научное, но и прикладное значение.
Без глубокого и всестороннего изучения состава, структуры и качества земельных
ресурсов, без выявления сложившегося и потенциально возможного уровня производительной
способности основного средства производства на селе, нельзя реально оценить эффективность
хозяйствования на земле и выявить резервы роста производства.
Рецензируемая монография включает 25 глав, которые сгруппированы в 4 частях:
«Земля в системе природных ресурсов Республики Молдова» (охватывает первые 5 глав),
«Теория землепользования» (6-12 главы), «Эффективность землепользования: вопросы теории,
методики, практики» (13-18 главы), «Современное состояние землепользования в Республике
Молдова» (19-25 главы).
В первой части исследования авторы изложили особенности земельных ресурсов
Республики Молдова, как фактора производства, природно-климатические условия, экологические
и организационно-экономические проблемы ее использования. Вторая часть отличается глубиной
исследования, в которой отражены вопросы теории интенсификации использования земли,
проблемы устойчивости производства продукции земледелия, место и роль научно-технического
прогресса в отрасли и другие. В третьей части представлены достаточно оригинальные подходы
оценки эффективности землепользования, такие как операционный леверидж, метод среднегодовой
скользящей, проблемы экономической жизнеспособности предприятий и другие. Особую
прикладную ценность имеет четвертая глава, в которой представлены экономические аспекты
использования земли при производстве зерновых, технических и овоще-бахчевых культур,
продукции многолетних насаждений.
В рецензируемой работе большое значение уделено теоретическим вопросам
землепользования. На основе большого статистического материала, отражающего показатели
использования земли за 50 и более лет во всех категориях хозяйств республики, авторам удалось
показать, что отрасль располагает большими резервами роста. В исследовании приводятся
методологические основы расчетов земельного потенциала и эффективности его использования в
сельском хозяйстве (глава 8). Особую ценность представляют методологические основы
обоснования нормативов определения объемов прибыли с единицы площади, обеспечивающие
простое и расширенное воспроизводство в с/х предприятиях (подраздел 14.2). Особый интерес
(прежде всего для специалистов-практиков) представляют исследования, направленные на оценку
качества выполнения работ в земледелии и их влияние на урожайность (подраздел 16.3), а также
оригинальная методика оценки сопутствующего эффекта прироста урожайности (подраздел 16.5).
Следует также отметить теоретическую и практическую значимость разработанной методики
градации уровней урожайности и рентабельности реализованной продукции (подраздел 15.2).
Важно, что в подтверждение наличия существенных резервов последовательного
наращивания уровня продуктивности земли в сельском хозяйстве, в главе 20 приводится
сравнительный анализ использования земли в Республике Молдова и в соседних регионах –
Одесской, Винницкой, Черновицкой и Хмельницкой областях Украины, а также в Румынии.
Не может оставить без внимания заинтересованного читателя значимость внедрения
разработанных авторами научно-обоснованных, насыщенных белковыми культурами
(многолетними травами и зернобобовыми культурами) высокоинтенсивных специализированных
севооборотов, включающих лишь несколько культур.
По всем разделам монографии проводится четкая авторская позиция, которая состоит в
том, что бережное и эффективное использование земельных ресурсов является ключом к успеху на
пути экономического возрождения сельского хозяйства страны.
ECONOMIE ŞI SOCIOLOGIE / ECONOMY AND SOCIOLOGY
163
No. 1-2 / 2017
Однако значимость работы была бы более весомой, если бы авторы более подробно
исследовали причины снижения плодородия почв и эффективности их использования.
В последние 20-25 лет тем не менее, это не снижает ценность обширных и глубоких
исследований авторов по одной из самых острых эколого-экономических проблем Молдовы,
связанных с рациональным использованием биологического потенциала молдавских черноземов.
В заключении следует отметить, что монография профессоров Пармакли Д.М. и Стратан
А.Н. на тему «Трактат о земле: значение, состояние, эффективность использования в
сельском хозяйстве» выполнена на высоком профессиональном уровне, отличается глубиной
исследований, имеет важное научное и практическое значение и рекомендуется к изданию. Она
окажется полезной, как ученым – аграрникам, так и специалистам – практикам и может быть
использована в учебных целях. Желательно параллельно осуществить перевод и издать также и на
румынском языке.
М.Д.Вронских,
доктор хабилитат биологических наук,
профессор, член-корр. АНМ

Revistă teoretico-ştiinţifică / Theoretical and scientifical journal
164
No. 1-2 / 2017
REGULATION
of the publication of scientific articles in the journal "Economy and Sociology" B category
The Journal "Economy and Sociology" of the National Institute for Economic Research of the
Academy of Sciences of Moldova is a high-level scientific platform which tackles the most actual issues
from the economic and social fields. The journal is addressed to researchers, professors, PhD students and
those interested in the topic of the journal.
Objectives of the Journal:
theory and methodology development in the economic and social fields;
elucidating the key issues of economic and social development of the Republic of Moldova and
other countries;
extending and integrating the scientific community from the economic and social fields;
international promotion of scientific results obtained by scientists from the Republic of
Moldova by publishing the Journal in English language.
The Journal is indexed in international databases. In order to ensure the quality and fair
evaluation of scientific publications, authors must respect the following criteria:
Manuscript submission
The papers must be original and not published in other journals / collections. Articles are written
in English and are presented at the editorial office two months before editing. Submission form: on paper
and electronic format (Word 2003). Text must be printed on one side.
Article’s structure
1. Title of article: in English, Romanian and Russian languages;
2. Author of the article (Surname, Name, scientific degree, scientific title, institution)
(no abbreviations) in English, Romanian and Russian languages, with a footnote on the first
page of the article © Surname, Name1 (author), e-mail;
3. The abstract will include: actuality, the aim of research, main research methods, the most
relevant results of the research in English, Romanian and Russian languages;
4. Key words: 6-8 key words, in English, Romanian and Russian languages;
5. JEL Classification (Journal of Economic Literature Classification System:
https://www.aeaweb.org/econlit/jelCodes.php);
6. Introduction (argumentation of the actuality of the study / addressed topic);
7. The degree of scientific approach of the topic and its presentation in scientific literature;
8. Data sources and used methods;
9. Obtained results and discussions;
10. Conclusions;
11. Bibliographic references: up to 20 sources;
12. Presentation date.
Technical requirements
Basic text format: A4 (margins: 20x20x20x20 mm); Times New Roman; 12pt; interval – 1.5,
left-right alignment, paragraph 10 mm;
Title of article (centered, in capital letters, 12pt.);
Author of the article (right alignment, bold, italic), the author's surname in capital letters, 12pt.;
Abstract (left-right alignment, italics, paragraph 10 mm, 12pt.) (1500-2000 signs with space);
Key words (left-right alignment, italics, paragraph 10 mm, 12pt.;
JEL Classification (right alignment, bold, italic, 12pt.);
1 © Surname, Name (author), e-mail
ECONOMIE ŞI SOCIOLOGIE / ECONOMY AND SOCIOLOGY
165
No. 1-2 / 2017
The paper will contain 10-12 pages (0.5-0.6 author’s sheets).
Graphical elements (tables and figures) should be of high quality, being placed, immediately
after that reference in the text. All the elements are mandatory accompanied by title and serial
number (above the table, below the figure), source and, if necessary, additional information:
note, legend (under the element).
The bibliographic references are placed at the end of the paper (Surname, initial of the first
name, title, publisher, year, pages). The text will include bibliographic references, according to
the order number of references (e.g., [1, p.10]).
Ethic statement
At the first presentation of the article, the author signs, indicates the date and confirms that he/she
has met the requirements for publication of the article and the declaration on assuming the responsibility
for the authenticity of the material, transmitting, at the same time, the copyright to the publisher.
Note: I declare on my honor that the presented paper is the result of my / our own research and is
based on information obtained from sources that were quoted and indicated, in compliance with ethical
norms in the notes and references. I certify that the work was not previously published in other journals /
publications or sent for publication to another publication in its current form and I transmit, at the same
time, the copyright to the publisher.
Presentation date: _______Signature:___________.
Review process. At the first stage, all the works are reviewed by the Editorial Board, which
verifies compliance with the requirements. At the second stage, the manuscripts are reviewed
anonymously by two reviewers. During the review process, the information about the author is not
reflected. Editorial college does not have discussions with the author of the paper and has the right to
reject articles that are not submitted according to the requirements. At the third stage, when necessary, the
article is returned to the author for revision. The manuscript of the article is not returned. The decision on
the publication or exclusion of the article in / from the Journal is taken at the Editorial Board’s meeting.
Only one article of the author or coauthor is published in an issue of the Journal.
Editorial college of the “Economy and Sociology” Journal

Revistă teoretico-ştiinţifică / Theoretical and scientifical journal
166
No. 1-2 / 2017
Bun de tipar: 03.07.2017. Tirajul 100 ex.
Coli editoriale: 17,20. Com. 6.
Complexul Editorial al INCE, 2016
Adresa redacţiei:
MD-2064, or. Chişinău, str. Ion Creangă, 45.
tel.: 022-50-11-30, fax: 022-74-37-94
web: www.ince.md/complexul-editorial/
e-mail: [email protected]
Related Documents