ECONOMICS OF SMALL RUMINANT MARKETING IN COASTAL KENYA BY LEONARD OTIENO ORUKO A THESIS SUBMITTED IN PARTIAL FULFILMENT FOR THE DEGREE OF MASTERS OF SCIENCE IN AGRICULTURAL ECONOMICS, COLLEGE OF AGRICULTURE AND VETERINARY SCIENCES, UNIVERSITY OF NAIROBI 1993

Welcome message from author
This document is posted to help you gain knowledge. Please leave a comment to let me know what you think about it! Share it to your friends and learn new things together.
Transcript
ECONOMICS OF SMALL RUMINANT MARKETING IN COASTAL KENYA
BY
LEONARD OTIENO ORUKO
A THESIS SUBMITTED IN PARTIAL FULFILMENT FOR THE DEGREE
OFMASTERS OF SCIENCE IN AGRICULTURAL ECONOMICS,
COLLEGE OF AGRICULTURE AND VETERINARY SCIENCES,
UNIVERSITY OF NAIROBI
1993

DECLARATION
This thesis is my original work and has not been presented
for examination in any»other university.
5/ i-ft
Leonard Otieno Oruko
This thesis has been submitted for examination with our
approval as university supervisors.
1 Agricultural Economist, ILCA BOX 80147 Mombasa, Kenya.

i
.....................
xi
l l t i l --- * Information •
l # Statement and Justification
I, O IJtctlvH o f Tha Study
«. ffypothaea* Tasted
10
of L i t a r a t u r a ...........................
>■> Product Ion objective and marketing strategy * J Karkatinq concepts .
*•*•1 Tha concept of marketing efficiency
TNfttt .
•^•wdoloqy »,* Description ofStudy Area .
10
10
20
23
28
28

3.1 The study a r e a .............................. 28
3.2 Method of data collection................... 32
3.2.1 Household survey ..................... 323.2.2 Marketing Survey ..................... 33
3.3 Analysis of d a t a ............................ 373.3.1 Producer production objective . . . . 37
3.3.1 The structure conduct and performance
of the marketing s y s t e m ............... 39
CHAPTER F O U R .......................................... 47
4. Results and Discussion............................ 47
4.1 The socio-economic role of small ruminants in
the h o u s e h o l d s .............................. 47
4.1.1 Size and structure of flocks........ 47
4.1.2 Reasons for ownership and mode ofacquisition............................ 48
4.1.3 Consumption of small ruminants in the
households.............................. 50
4.1.4 Stock sales in the household........ 51
4.3 Classification and operation of small ruminant
markets...................................... 55
4.3.1 Distributive markets ................. 55
4.3.2 Mode of transport to and from thedistributive markets ................... 56
4.3.3 Market participants and marketing
ii

channels................................ 574.3.4 Characteristics of small ruminant
b uyers.................................. 60
4.3.5 Trader specialization ............... 61
4.4 Market performance ......................... 644.4.1 Analysis of marketing costs and
marketing margins ..................... 64
4.4.2 Price analysis....................... 71
CHAPTER F I V E .......................................... 88
5.1 Conclusions.................................. 88
5.2 Recommendations.............................. 90
iii

LIST OF TABLES
Table PAGE
1.1 Distribution of sheep and goats
population in
sub-sahara African.................................1
1.2 Small ruminant population in
sub-sahara Africa byagro-ecological zone................................ 2
1.3 Numbers of livestock slaughtered
in licensed abattoirs in
Kenya (1986-1990).................................. 31.4 Number of small ruminant slaughtered
in 4 main slaughterhouses supplying
Mombasa urban market 1989...........................5
1.5 Movement of goats from other districts
to Kwale for slaughter.............................5
1.6 Number of goats and sheep by age/sex
classes kept on farms with cattle.................. 6
4.1 Distribution of small ruminants in
the households...................................... 47
4.2 Distribution of small ruminants in
households with and those without
cattle............................................... 47
4.3 Mean flock sizes by sex and age categories
of goats
iv
48

V4.4 Fanners reasons for owning
small ruminants......................................48
4.5 Producers' source of small ruminants
(mode of acquisition of initial stock)............ 49
4.6 Small ruminant consumption in the households
during festivities.................................. 50
4.7 Small ruminant sales in households in the
12 months preceding the Survey period.............. 51
4.8 Stock sales by sex age categories.................. 52
4.9 Distribution of small ruminant traders
by markets........................................... 604.10 Trading experience of small
ruminant buyers by markets
and type of livestock traded........................ 61
4.11 Trading experience of small ruminant
sellers by markets and type of
livestock traded.....................................61
4.12 Trader specialization by markets
and animal type......................................61
4.13 Analysis of marketing costs and
marketing margins per head of small
ruminant sold at Bamba.............................. 64
4.14 Analysis of marketing costs and
4 marketing margins per head of
small ruminant bought at Bamba
market and sold at Vipingo abattoir............... 65
vi
4.15 Analysis of marketing Costs and marketing
margins per head of small ruminant
bought at Tsangatsini and sold at
Mariakani abattoir................................. 664.16 Analysis of marketing costs and
marketing margins per head of small
ruminant bought at Tsangatsini and
sold at Mariakani abattoir......................... 664.17 Analysis of marketing costs and marketing margins
per head of small ruminant bought at Mariakani
market and sold at Mariakani abattoir.............67
4.18 Analysis of marketing costs and
marketing Margins per head of
small ruminant bought at Bamba market and slaughtered at Kasemeni
abattoir............................................ 674.19 Marketing cost per head of small
ruminant per kilometre of transfer
between different channels
for itinerant traders.............................. 68
4.20 Intra-annual trading activity for Small
ruminant traders at distribute markets............ 73
4.21 Correlation Matrix for prices per head
between the distribute markets.....................82
4.22 Correlation matrix of prices between
distributive markets and abattoirs................ 83

vii
4.23 Correlation Matrix of prices between the
abattoirs........................................... 834.24 Summary of bivariate regression
results between the distributive
markets and the abattoirs......................... 84
4.25 Summary of bivariate regression
results between the abattoirs..................... 85

viii
LIST OF FIGURES
Figure PAGE
3.1 The agro-ecological zones of Kilifi
and Kwale Districts............................... 30
3.2 Kaloleni Division,administrativelocations and agro-ecological zones.............. 31
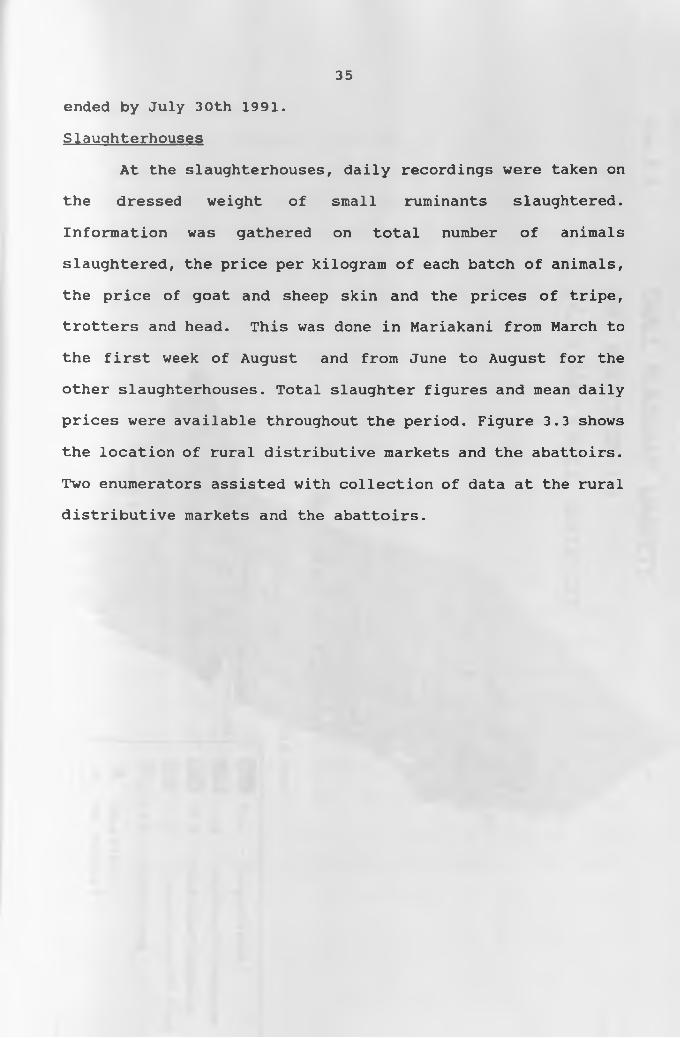
3.3 Small ruminant markets and abattoirsin Kilifi and Kwale Districts.................... 36
4.1 Small ruminant marketing channels................. 59
4.2 Nominal price movement at Mariakani
abattoir during March-July 1991.................. 74
4.3 Nominal price movement at Mariakani
Kasemeni and Miritini abattoirsduring June-July 1991..............................75
4.4 Relative price movement of small
ruminant meat to beef at Mariakani
and Kasemeni abattoirs
June-July 1991..................................... 76
4.5 Nominal price trend at Mariakani
abattoir in March-July 1991........................77
4.6 Relative price trend per kilogram
of small ruminant meat to beef
at Mariakani abattoir during
March-July 1991..................................... 78

4.7 Relative price trend per kilogram
of small ruminant meat to beef
at Mariakani and Kasemeni abattoirs
in March-July 1991.................
XAcknowledgment
Several individuals and institutions played a great role
in preparation of this thesis. I am particularly indebted to
Prof. Ackello-Ogutu for his professional guidance and patience
in reading all the drafts of this thesis. Special appreciation
also goes to Drs. G. Mullins, L. Reynolds and W. Thorpe of
International Livestock Centre for Africa (ILCA) Mombasa for
their time, insight and valuable contributions.I would also like to thank the Kenya Agricultural
Research Institute (KARI) who nominated me for the Canadian
International Development Agency (CIDA) scholarship. Their
funding in conjunction with that of ILCA enabled me to
undertake my thesis research in coastal Kenya.
Messrs. Aziz Abubakar and W.Malinga, former and current
director Regional Research Centre Mtwapa respectively, deserve
special thanks for their encouragement before and during the
study. Also worth mentioning are the entire staff of the
Department of Agricultural Economics , University of Nairobi;
ILCA Kenya; Regional Research Centre Mtwapa and Ministry of
Livestock Development, Coast Province, Kenya. They, to a large
extent, facilitated the completion of this task.
Last but not least are members of my family for their
moral and material support, Grace Maloba and Dorah Mwalikoh
for typing and my friend John Okechi for hosting me during my
field work in Mombasa.

xi
Dedication
This thesis is dedicated to my parents, Oruko
Anyango, for the firm foundation they gave me during
childhood .
and
my

xii
Abstract
The study was set to evaluate the marketing system of
small ruminants in coastal Kenya with the following
objectives: i) Identify factors related to commercial offtake
in the study area, ii) estimate the marketing costs and
margins accruing to various marketing agents in the small
ruminant marketing chain, iii) test for existence of spatial integration between different channel levels in the small
ruminant marketing chain.A farm household survey of 76 households in Kaloleni
division of Kilifi District found farmers to own small
ruminants for sale to meet household subsistence requirements. Seasonal cash need was identified as the main factor related
to sale of small ruminant in the household. In addition, a
survey of rural distributive markets and abattoirs serving the
study area identified five channel levels namely;(i)
producers (ii) assemblers (iii) itinerant traders (iv)
retailers, and (v) consumers in the marketing chain.
The analysis of marketing costs and margins indicated
rates of return on capital investment of about 15 percent per
head of small ruminant for assemblers. All itinerant traders
recorded less than 10 percent return per head save for Bamba-
Kasemeni channel that recorded about 20 percent. The
marketing cost varied between 9 and 15 percent of the
total cost per head in all the channels for itinerant traders.
Price correlation analysis showed the distributive

xiii
markets Bamba and Mariakani, Kinango and Mariakani, and Bamba
and Kinango to be integrated. All the abattoirs were
integrated in prices with respect to each other.
Bivariate regression results showed lack of integration
between Bamba distributive market and Mariakani abattoir.
Arbitrage cost was suggested between Bamba and Kasemeni
abattoir, Tsangatsini and Mariakani abattoir, as well as Mariakani and Mariakani abattoir. All the abattoirs showed
integration with respect to each other.In conclusion, the marketing system was both technically
and price efficient as shown by marketing margins and cost
analysis as well market integration evaluation. However,
further research on the marketing system of hides and skins
needs to be conducted. Bivariate regression analysis provided
results consistent with traders observations regarding
integration of distributive markets and the abattoirs. For
future studies, regression models such as the Ravallion model
that incorporates a vector of other significant market
determinants is suggested for more conclusive results.

1
CHAPTER ONE
1. Background Information
It is estimated that Small ruminant meat and beef
contribute about 80 percent of the total meat supply in
tropical Africa with the former contributing about 45 percent
of the total. A deficit of 2.8 million tonnes in meat supply is expected by the year 2000 in this region (ILCA 1986) ,
arising largely from increases in population as well as
affluence which are the two main structural variables
determining demand for meat. (Speeding and Solinam, 1986).
In Sub-Saharan Africa, East and West Africa are the main
producing and consuming areas. In 1986-1988, the two regions
had 90 percent of the small ruminant stocks and accounted for
92 percent of small ruminant meat consumption (Table 1.1).
Table 1.1 Distribution of sheep and goat populations in Sub- Saharan Africa 1988
Region Sheep 10J Goats 10J
West Africa 42,604 58,488Central Africa 5,020 10,279East Africa 69,140 68,900Southern Africa 3,305 7,020
TOTAL 120,069 144,687
Source: ILCA 1991
Although rangelands are the major source of small ruminant
meat (Table 1.2) high rainfall areas also have small ruminants
as integral part of their farming systems. In sub-humid West

2Africa, for example, dwarf sheep and goats are kept as
supplementary enterprise for financial gain (Upton 1985).
Table 1.2 Small ruminant population in Africa by Agro- ecological zone
Agro-ecological zone Sheep 10° Goats 10°
Arid 37.1 48.3Semi-arid 23.1 33.2Humid 14.2 20.3Highland 8.2 11.6Sub-humid 24.1 11.9
TOTAL 106.7 125.3
Source: ILCA 1986
From Table 1.2 above,it can be seen that the high rainfall
areas have 40 percent of the total sheep population and 32
percent of the total goat population in Africa. One
explanation for this is because small ruminants' production
systems are characterized by low input levels and they often
fit in the needs of resource limited producers better than
large ruminants. (Fitzhugh, 1985).
The current estimated demand for meat in Kenya is
300.000 tonnes per annum, while the supply is estimated at
172.000 tonnes (GoK 1990). By the year 2000 this demand is
expected to rise to 500,000 tonnes per annum. The beef herd
in Kenya is currently decreasing and since small ruminant
meat is the main substitute for beef, its demand is also
expected to increase (Chabari, 1986).
Table 1.3 below shows a steadily increasing slaughter figures
of small ruminants nationally since 1986.

3
Table 1.3 Numbers of livestock slaughtered in licensed abattoirs in Kenya (1986-1990)
1986 87 88 89 901(Numbers X 102 3)
Cattle+Calves 427 524 701 752 828Sheep+goats 818 875 942 998 1206PigsT , *2— ____
77 60 63 73 84
The figures exclude stock slaughtered at Kenya Meat Commission Abattoir.Source: Economic Survey, Republic of Kenya 1991.
The increasing offtake rates over the period 1986-90 from a decreasing national beef herd and unknown population of small
ruminants calls for higher offtake rates from the non-
traditional beef producing areas. With improved management
and a liberalized meat market, producers from high potential
areas could increase the share of their total household income
from sale of small ruminants as well as meeting the increasing
demand for meat in Kenya.
2. Problem Statement and Justification
In 1990, there was a significant decline of the
production of maize, beans and coffee in Kenya. This led to
sluggish growth in GDP contributed by the agricultural
sector. However, the value of output of livestock and dairy
produce increased. Livestock sales rose by 13 percent in
nominal terms above the 1989 value (GOK 1991). The same source
also reported an increase of 184 tonnes above the 1989 volume
in the export of meat and meat products. This demonstrates

4
the ability of the livestock sub-sector to offset sagging
agricultural sectoral growth due to failure of traditional
crops in Kenya.Traditionally, the majority of beef and small ruminant
meat was produced in the rangelands. Past studies on patterns
of offtake and the live animal marketing therefore have been
concentrated on the rangeland population. Yet even for the rangelands, there is general lack of useful time series data
for analysis of the existing marketing systems (Bekure et al,
1982) . The problem is even more acute for areas like sub-humid Kenya and its environs where stock rearing is not the main
enterprise. Yet sub-humid Kenya contains the country's second
largest population centre, Mombasa, and is a major source of
demand for the country's meat producers. Other urban and peri
urban centres such as Malindi, Kilifi, Mtwapa and Ukunda/Diani
also contribute substantially to this demand. These towns
receive a high percentage of their supply from the dry
hinterland (Table 1.5).
Tana River, Garissa and Kajiado Districts are some of the
major "exporters" of small ruminant meat to Mombasa urban
market (GoK 1989, Chabari 1986).
The distances involved in movement of the animals by road
suggest sufficiently high returns to capital, labour and time
investment to offset the relatively high transfer cost
incurred. This could be reflected in the price per head at
the terminal markets.

5
Table 1.4 Number of small ruminants slaughtered in four main slaughterhouses supplying Mombasa market (1989)
Slaughterhouse District Goats Sheep
Uwanja wa Ndege Kilifi 1437 444Miritini Kilifi 568 571Kasemeni Kwale 40338 16428Mariakani Kwale 14612 6447
TOTAL 56955 23890
Source: Ministry of Livestock Development:Coast ProvinceAnnual Report (1989) •
Table 1.5 Movement of goats from other districts to Kwafor slaughter 1989
District No. of goats
Garissa 17630Machakos 8453Kilifi 3310Kaj iado 2055Nairobi 800Tana River 570Taita Taveta 167
TOTAL 32925
Source: Ministry of Livestock Development:Coast Province Annual Report (1989).
These major movements of stock into Mombasa from outside the
Province demonstrate clearly that the Coastal sub-humid zone
and its environs is either unable to meet the current demand
or compete with other districts in supply of small ruminant
meat.A farm household survey carried out in Kilifi District's
Kaloleni Division showed 60 percent of the households (N=1800)
as owning small ruminants and 65 percent of the farm
households (N=1009) with cattle also kept small ruminants

6(ILCA 1991). There were 18330 goats and 4593 sheep; a total
of 22923 small ruminants (Table 1.6). Mature males appeared
to comprise over 10 percent of the flocks and their ratio to
mature females was 1:4.5 for goats and 1:3.5 for sheep.
Table 1.6 Number of goats and sheep by age/sex classes kept on farms with cattle in Kaloleni Division
Age/sex class GoatsNo. %
Sheep No. %
TotalNo. %
Mature males 2089 11 675 15 2764 12Mature females 9358 51 2425 53 11783 51Immature females 3964 22 829 18 4793 21Immature males 2672 15 617 13 3287 14Castrates 247 1 47 1 294 1
TOTAL 18330 100 4593 100 22923 100
Source: Small Ruminants in Farming Systems of Coastal Kenya (ILCA 1990).
The producers in this region do not seem to be responding to
the demand that apparently exists in the nearby markets. A
number of reasons could explain this phenomenon:
(i) farmers have a strong non-commercial production objective
(ii) small ruminants traditionally act as a store of wealth
and are therefore retained
(iii) animals are needed to meet social obligations. Indeed,
in Lamu District, the main reasons for keeping small ruminant
are; for sale when cash is needed, slaughter for meat and
payment of bridewealth. In Kwale District, farmers were
reported to be reluctant to sell in the harvest season
choosing to keep their animals until cash is needed (GoK
1991) . The same source reports lack of an adequate marketing

7
system as a major constraint to production in Kwale District
and suggests research on improved marketing system in the
District as well as methods of changing socio-cultural
attitudes as ways of overcoming these constraints. Further
contributing to the marketing problem, there appears to be
lack of communication with regard to prices paid to producers
at primary markets in Coast Province. Reynolds (1991)
observes the apparent uniform and high price across all Districts of Coast Province. Yet prices would be expected to
rise as the market location changes from rural net production
areas to urban net consumption areas like Mombasa.The Kenya Agricultural Research Institute (KARI)and the
International Livestock Centre for Africa (ILCA) are currently
conducting collaborative research on breeding and management
as well as nutrition and health aspects of small ruminant
production in Coastal Kenya. The long term aim is to improve
the productivity of small ruminants in the region. However,
as noted by Kebede (1990), "If investment and improvements in
the marketing system lag behind, then inadequate marketing
arrangements become a serious constraint on the development
of production and consumption." The above mentioned
deficiencies and lack of research on the small ruminant
marketing system in the coastal region can become a major
constraint to the adoption of recommended technology.

8
3. Objectives of The Study
The broad objective of this study was to assess the
marketing of small ruminants in coastal Kenya. This was done
by identifying the farmers production objectives, describing
the existing marketing channels and evaluating their
performance.
Specific objectives were;(a) identify factors related to commercial offtake in the
study area
(b) estimate the marketing costs and margins accruing to
various marketing agents in the small ruminant marketing
chain(c) test for existence of spatial integration between
different channel levels in the small ruminant marketing
chain.

9
4. Hypotheses Tested
The following hypotheses were put forth regarding small
ruminant production and marketing.1. That the sale of small ruminants from the
households is not correlated to cash needs.
2. That the returns to capital investment of traders
in the small ruminant marketing chain at different channel levels are greater than the prevailing interest rates.
3. That there is no spatial integration between the markets
serving the study area.

10CHAPTER TWO
2. Review of Literature
2.1 Production objective and marketing strategy
Different small ruminant production systems have
different producer objectives. In industrial countries, it is a specialized undertaking where large flocks are kept in commercial ranching conditions. In Africa, the holdings are
mainly geared towards subsistence food production with milk
and meat as the main products. For small scale farmers,
cattle usually act as equity investment whereas small
ruminants act as a form of current account or working capital.
In general, stock is kept as security or store of wealth
(Anteneh 1982, Low et al, 1980).On commercial farms, stock owners act as portfolio
managers whose decisions to slaughter their beef animals are
based on the prevailing price of beef, relative to the cost of
production inputs , and the opportunity cost of capital.
Capital value depends on the expected future price rather than
the prevailing market price. An increase in price normally
results in stock owners delaying their marketing since the
capital value of an animal in production is equated to their
market value at an older age. A negative price response is
therefore observed in the short run in such a production
system. In the long run, however, a positive price response

11is observed (Jarvis 1986).
Jarvis' concept of cattle as purely productive assets
whose value is determined in the market place was shown not to
be applicable in African production systems. Doran et al
(1979) came up with the store of wealth concept as the main
production motive for cattle owners in Swaziland. In their
study they define wealth as "accumulation of assets which
confer among other things, security, prestige and status"
while income is defined as "means of attaining wealth and
supporting current consumption". They therefore argue that
whereas the cash value of the animals is important in
supporting current consumption, their numbers are more
important in terms of security, prestige and status. To
demonstrate the concept further, they use a linear multiple
regression model with yearly offtake as the dependent variable
while real cattle prices and annual summer rainfall act as the
independent variables. A negative relationship is observed
between the dependent variable and both the independent
variables.
In their recommendations, they discourage the use of
productivity improvement based options and market incentives
as solutions to overgrazing problems in Swaziland as these
would not result in reduction of herd sizes. Instead, they
prescribe measures that make cattle less attractive as a store
of wealth while simultaneously instituting measures that force
cattle owners to sell more of their stock. They also

12recommend a legislative measure restricting stock sizes in
Swaziland communal grazing areas.Jarvis (1980) disagreed with these conclusions. In a
rejoinder to their paper, he puts forth the following four
main arguments challenging the findings of their study:
(a) beef production in Swaziland is reduced more by
technical inefficiency in the communal grazing system than by store of wealth motive(b) the negative price response is consistent with
commercial attitudes(c) the Swazi producers' decision to sell are based on
profit-maximizing motive rather than sale for specific
cash needs
(d) productivity-increase based technical packages and
market incentives will actually have a positive effect on
technical efficiency and help alleviate overgrazing problem in the long run.
Jarvis cites lack of precise theoretical definition of
the term store of wealth and the lack of framework within
which its impact on resource allocation can be rigorously
analyzed. The wide perception of cattle as productive assets
whose exchange value is determined mainly by their use as a
source of milk, beef, hides and draught power underlies the
store of wealth concept. This exchange value is established
in orderly markets. Security and prestige are therefore
derived from the exchange value of the animals as this is a

13
sign of economic wealth. Apart from the above, cattle have
the ability to convert forage into useful products. Wealth can
therefore be invested in cattle with the likelihood of
increase and not just preservation. Jarvis concludes his
store of wealth analysis by stating that producers will find
it profitable to prolong the life of an individual animal as
long as its daily production, including future beef production
capacity, exceeds its current value which is beef and hide.
The store of wealth benefits suggested by Doran et al are
therefore joint products with beef. Since producers have to substitute one benefit for another, the net result is zero
welfare loss.The negative price response explanation is criticized by
Jarvis on the basis of changing annual aggregate cattle
receipts from one year to another. The price variation used
by Doran et al has the long term price trend removed even though it is over a 27 year period. The changes observed in
their study are cyclical and cannot be used for long term
analysis of price on offtake. Jarvis' overall conclusion is
that store of wealth effect is consistent with market
orientation.
The debate on store of wealth concept does not, however,
end there. Low, Doran and Kemp (1980) reply to Jarvis using
price response of Swazi producers. In their reply, they argue
that price response provides weak support for the store of
wealth motivation.

14
"First, negative price response has been observed
in western societies where cattle producers, acting
as portfolio managers, delay their marketing in the
face of a cattle price increase because capital
value of cattle in production then equates their
market value at an older age. Secondly, it is not always easy to differentiate between the cause and
the effect of price and supply movements. It is
possible that an observed negative price supply
relationship is as much the other wayabout." (Low
et al 1980)."To avoid problems in the previous analysis, a cash-need
supply model is developed by Low et al (1980) . Total slaughter from the Swaziherd is the dependent variable while
basic cash needs, seasonal cash needs, and earnings from the
other sources are the independent variables. The model is
based on the assumption that "Cattle are a store of wealth or
savings account from which withdrawals are made only for a
special social or ceremonial occasions or for emergency needs
such as payments for education etc." (de Hilde, 1967, Vol.l,
p.55-56 in Low et al 1980). The results show a positive
relationship between offtake and basic as well as seasonal,
cash needs. There was, however, a negative relationship
between offtake and incomes from other sources. Using the
same results in their reply to Jarvis, they show that receipts
to cattle sales are not equivalent to annual consumption

15
expenditures but rather represent the balance of consumption
expenditures which cannot be met from alternative sources such
as wages or own food production. A cross-sectional marketing
survey further supports the sale for-specific-cash-need
contention.They also show that over the period of analysis, 70
percent of variation in the extraction rate is explained by calving and overall death rates which contributed to a
downward trend in extraction rates. They therefore
conclude:(i) cattle development programs be considered
alongside other income generating activities in the household
and (ii) production-oriented development programs will not
have a positive impact on technical efficiency and output.
They do, however, agree with Jarvis' assertion that advanced
slaughter age and constant herd composition do not provide
convincing evidence that Swazis keep cattle as a store of
wealth.
The debate between Doran, Low and Kemp on one hand and
Jarvis on the other brings out the conflicts that existed
between those who perceived producers as rational price
responsive economic men and those who regard traditional
livestock producers as investors in cattle as assets to be
liquidated only during periods of dire need. Two points of
argument emerge from the debate:
4m£lyprsce refponsprddtaemay bprodaatfcable fobjfebfeives;
cross-sectional survey designed to elicit specific

16
production goals may be more suitable.
(ii) presence of store of wealth motive does not
necessarily imply lack of commercial orientation.
In subsistence economies,producers only sell "forced
marketable surplus." (see concept of marketing pp 21)
In an attempt to achieve long term household survival, they balance between animals that command premium price in the market and those unlikely to survive drought. Market forces
will only have a partial influence in their decision to sell.
The value of an animal in such a case includes the cultural
attachment which is not directly determined in the market place. In this study, producer goals are investigated using
cross-sectional data from producers themselves. Although a
sale-for-cash-need model is used, an attempt is made to link
the production goals with the performance of the marketing
system serving the producing area.In Kenya, studies on producer production goals have
mainly concentrated on the rangelands. Evangelou (1984)
established a missing link between production and marketing as
the main reason for sub-optimal offtake from the Maasai
pastoral system. Producers, livestock traders and butchers
were sampled in Kajiado and Narok districts. A
non-commercially oriented production objective was found
amongst the Maasai producers. Immediate cash need for
household consumption was found to be the main factor
influencing rate and age of offtake. The Maasai rarely engaged

17
in the marketing of small ruminants, preferring cattle
marketing instead. Evangelou did not find evidence of
barriers to entry and exit . He also observed that the price
discovery method was one-to-one bargaining. Keen eye and
bargaining acumen were principal contributors to traders
profit. Credit was readily extended to fellow Maasai cattle
traders reflecting the personal friendship which permeate the trade. Evangelou interpreted this credit system as meaning
that default was not common.In his analysis of market performance, Evangelou
examined pricing and technical efficiency. Although he found
room for improvement in market performance by increasing the
volume of animals transported from the villages thereby
reducing unit transfer cost and improving the flow of
information about market prices. The effect of these
improvements would be weakened, however, by producers' lack of
commercial orientation. A possibility of expanded production
in the Maasai system could not be expected as long as the
store of wealth motive amongst Maasai producers persisted.
Evangelou's recommendation could be effective only when
production and marketing were linked by prices that accurately
reflect demand and producers respond to price changes.
Chabari (1986) extended Evangelou's analysis of sub-
optimal offtake from the Maasai production system. Using a
comparative study between Kajiado and Baringo districts, the
Baringo auction system was found to be relatively competitive

18
in structure with low seller and moderate buyer concentration.
There was lack of free flow of market information in Kajiado
due to the one-to-one bargaining method and domination of
small ruminants trade by non- Maasai traders. The Kajiado
marketing system was, however, more technically efficient than
the Baringo system based on marketing margins and costs
analysis. The study concluded that low offtake rates in Kajiado were caused by preference of relatively rich
households to sell cattle instead of small ruminants when they
needed cash for household consumption. The poorer households
were therefore the main source of small ruminants from the
Kajiado production system.In contrast to the present study, Chabari's work differs
in its classification of all livestock sellers as producers.
The present study adopts a different approach as it was found
that it is primarily assemblers rather than producers who actually sell small ruminants at the distributive markets.
This raises the possibility that the information collected by
Chabari on flock size and structure might not have been
accurate. In both Evangelou and Chabari's studies, store of
wealth motive is found to still exist in Kenya's rangelands.
The main factor influencing commercial offtake is cash-need
for household consumption. Chabari also supports Evangelou's
view that technical inefficiency in marketing is not the main
constraint to increased offtake rates from the Kajiado
system, rather it is still the store of wealth motive.

19
Evangelou's study resembles the present study in that it
covers both producers and the middlemen of marketing. The
only difference is that it was done in an extensive production
area where livestock play a dominant role in household income.
In contrast to the foregoing studies, the present
research is conducted in a zone where the land holdings are
on average less than 2 hectares. Crops still play an important role in the farming system and off-farm activities
are a major source of income for many households (ILCA
unpublished). In such a system most small holders tend to
regard sheep and goat production as secondary to crop
production and as a means of meeting immediate family
requirements (Anteneh, 1982). Producers will therefore not
keep large flocks of small ruminants for prestige. Rather,
they store their surplus incomes from other sources in small
ruminants for security and ease of liquidation when cash need
arises. As cited by Jarvis (1980), it is their exchange value
that provides the security, whereas their ease of liquidation
and relatively low input demand make them excellent stores of wealth.
Both Jarvis (1980) and Low et al.(1980) agree that the
store of wealth concept does not necessarily imply lack of
market orientation in production. To ascertain whether or not
this is the case, a study of the marketing system in the area
is conducted as well.
20
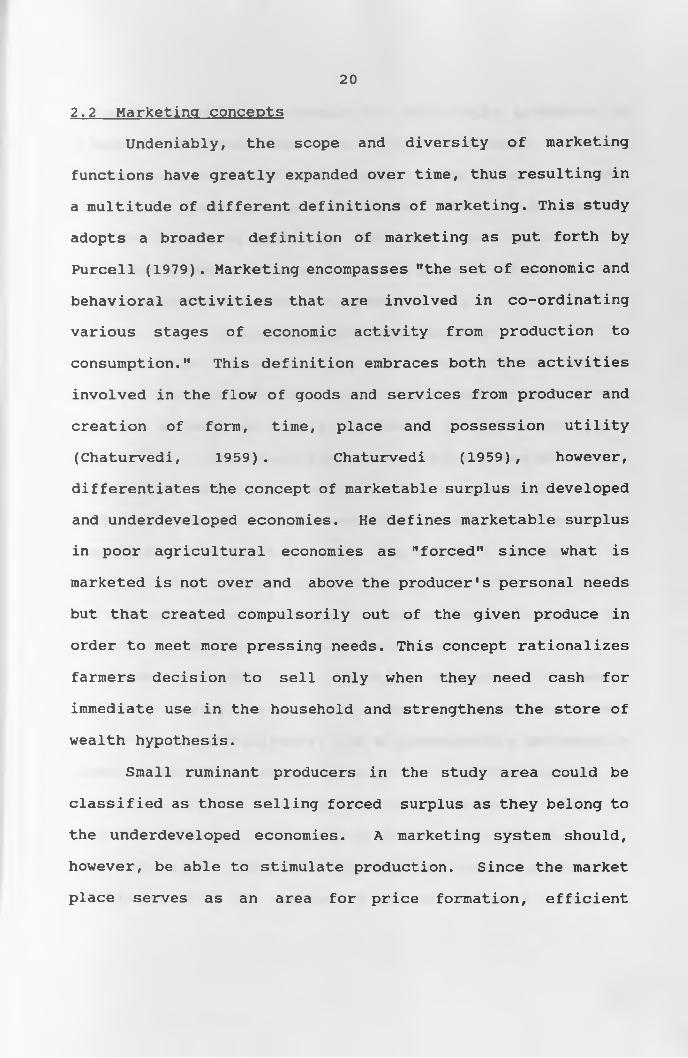
2.2 Marketing conceptsUndeniably, the scope and diversity of marketing
functions have greatly expanded over time, thus resulting in
a multitude of different definitions of marketing. This study
adopts a broader definition of marketing as put forth by
Purcell (1979). Marketing encompasses "the set of economic and
behavioral activities that are involved in co-ordinating various stages of economic activity from production to
consumption." This definition embraces both the activities
involved in the flow of goods and services from producer and
creation of form, time, place and possession utility
(Chaturvedi, 1959) . Chaturvedi (1959), however,
differentiates the concept of marketable surplus in developed
and underdeveloped economies. He defines marketable surplus
in poor agricultural economies as "forced" since what is
marketed is not over and above the producer's personal needs
but that created compulsorily out of the given produce in
order to meet more pressing needs. This concept rationalizes
farmers decision to sell only when they need cash for
immediate use in the household and strengthens the store of
wealth hypothesis.
Small ruminant producers in the study area could be
classified as those selling forced surplus as they belong to
the underdeveloped economies. A marketing system should,
however, be able to stimulate production. Since the market
place serves as an area for price formation, efficient

21
transmission of price signals not only helps producers to
allocate their resources more optimally amongst competing
enterprises but also to meet consumer needs in terms of type,
quality and quantity supplied (Kebede, 1990) . It is possible
that the marketing system in the study area is unable to
stimulate production. Consumer needs in terms of quality and
quantity are possibly not being met as well.
Structure-conduct-performanceStructure and conduct are the characteristics used to
appraise the internal and external conditions in which a firm
operates as well as a firm's behavior in the market place
respectively. Bain (quoted by Kebede,1990) defines structural
variables as "those characteristics of the organization of the
market which seem to influence strategically the nature of
competition and pricing within the market." Conditions to
entry into the market, degree of the product differentiation
and degree of seller and buyer concentration are some of the
variables used in market structure analysis.
Producer goals and marketing objectives, however,
influence greatly the structure of a marketing system as well
as the market participants. In a predominantly secondarily
market oriented economy, production is guided mainly by
immediate and long term subsistence requirements. This in
turn can influence the number of animals on offer for sale.
In the theory of industrial organization, market performance
is attributed to the conduct of sellers in their degree of
22
collusion as well as pricing. Conduct is in turn related to
structure in terms of number, size and spatial distribution of
buyers and sellers.
"Recognition of the underlying influence upon both market
structure and participant conduct of various basic
conditions affecting supply, from the availability of
substitute products to laws, regulations and dominant socio-economic values completes the structure, conduct
performance theoretical construct." Evangelou (1984).
Many studies in marketing deal with performance problem
descriptively (see Staatz 1979, Evangelou 1984, and
Chabari 1986).
In order to understand the behavior of producers in a
given production system, the economic influences under which they operate need to be studied. As pointed out earlier,
economic constraints to expanded production may stem from
producer production goals. Given that producers do not offer
their total production for sale, irrespective of the
prevailing market prices, the determinants of the market
forces amongst buyers and sellers are often more difficult to
separate. Under such circumstances, price increases could be
due to reduced supply from the producers or increased demand from the sellers.
Moreover, influences external to producer's immediate
environment often evoke different responses from buyers and
sellers. The state of the national economy as well as
23
deliberate government intervention, such as decontrol of meat
prices, usually have an indirect effect on producers and
similar, if not direct, effect on buyers.
2.2.1 The concept of marketing efficiency
The concept of efficiency is a complex one. French
(1967) noted that "economists have yet to develop an integrated set of theories, concepts, methods and data that
are necessary and sufficient for the construction of workable
frameworks for quantitative evaluation of the efficiency of
marketing systems." The absence of such a framework has led
to different approaches to the study of marketing efficiency.
Although markets perform pricing and exchange
functions, physical and facilitating functions performed
between the points of production and final consumption are
equally important. An efficient marketing system should
therefore provide physical and facilitating services at the
minimum cost per unit compatible with the kinds and qualities
of service required among others (ILCA 1991). "The performance
of a marketing system usually has two aspects, commonly
classified as technical efficiency and pricing efficiency"
(Purcell 1979 quoted by Evangelou 1984). Technical efficiency
is therefore attained when least-cost-combination of inputs
in marketing activities are employed. Price efficiency on the
other hand refers to the capacity of a marketing system to
adjust to changing supply and demand conditions. A smooth

24
flow of information along the marketing channels as well as
the ability of market participants to readily modify their
allocation of resources in response to price signals is a
sign of a relatively price efficient marketing system.The degree of price fluctuations is an important
indicator of marketing risks faced by the producer. "With a
good methodology, the degree of market integration can be used as a proxy for market efficiency measurement" (Dittoh 1992).
Past studies (Monke and Petzel 1984; Kebede 1990) have used
market integration as an indicator of marketing efficiency
since it is a performance variable. The justification for
this approach is that on the basis of structure and
performance, efficiency can be improved by manipulating the
structural variables of the market. Moreover, efficient
market will establish prices that are interrelated through
space by transportation costs and through time by storage costs as well as market information (Bressler and King, 1970 pp.413).
Kebede (1990) studied the traditional sheep marketing
systems in the Ethiopian highlands. He based his study on
lack of research on market performance of livestock marketing
system in the area and on the importance of sheep and goats in
the livelihood of large portion of Ethiopian people. His
objectives were (a) to describe the traditional sheep trading
system for some key central highland markets (b) analyze
factors affecting intra-annual price variations (c) diagnose

25
efficiency of the traditional marketing system and (d) make
recommendations on the basis of the findings. He identified
four marketing channel levels:
(i) Producer
(ii) farmer trader,itinerant trader,rural consumer
(iii) resident urban trader
(iv) urban consumerPrice discovery was again by the one-to-one bargaining
method. The main factors influencing intra-annual price were
found to be: market composition of male, females, andcastrates; seasonal factors such as religious festivals;
animal characteristics such as body condition score; and,
purpose of purchase.
Market performance analysis indicated low seller
concentration ratios. Market integration analysis revealed no
clear indication of market segmentation. However,there was
evidence of unfair trading practice resulting from the lack of
free flow of information inhibited by one-to-one bargaining
method.
Kebede recommended;
(a) preparation of sheep to meet buyer requirements,
seasonal demand variations and animal characteristics
such as good finishing during sales by producers
(b) further study on the effect of brokers (delalas) in
market performance
(c) provision of market information and infrastructure by
26
government
(d) provision of weighing facilities.
The livestock markets surveyed in the present study
operate on a one-to-one bargaining system like those in
Kebede's study. The present study does not, however, measure
live weights of animals in the markets and is limited to a
three month period in all markets.Ackello-Ogutu (1976) while studying marketing of poultry
meat in Nairobi found five channel levels in the marketing
chain. These were producers, assemblers both at rural and
urban centres, distributors, retailers and final consumers.
Oligopolistic tendencies was found to exist at retail and
wholesale level but was counterbalanced by lack of clear
product differentiation and demand for lower quality backyard
poultry meat. The wholesale price of poultry meat depended on
production costs. The wholesale price of poultry meat was
therefore based on production level rather than retail level
price expectations. This gave the highly concentrated
middlemen at wholesale level latitude to dictate farmgate
prices since they were responsible for transportation to urban
centers. At all channel levels, price setting mechanism was by
one-to-one bargaining.
The foregoing review focused on farmer production
objective and the linkage of this objective to the marketing
systems. The main factors that influence offtake from the
different production systems vary from lack of essential link

27
between production and marketing, household cash needs to
wealth status of different households.

28
CHAPTER THREE
3. Methodology and Description of Study Area
3.1 The study area
Kaloleni Division of Kilifi district was chosen as the
study area for household survey. This was because Kaloleni covers three of the four major agro-ecological zones of the
coastal lowlands and the existence of a sampling frame created
during a cattle census conducted by ILCA in 1989. Jaetzold (1983) defines an agro-ecological zone as "a zone defined by
its relevant agro-climatic factors mainly moisture supply in
case of the tropics." The agro-ecological zones are:
(a) Coastal lowland 2 (CL2)
This is the lowland sugarcane zone found mainly
in Kwale district. This zone has long to medium cropping
season with an annual rainfall up to 1400mm per annum. The
altitude ranges from 1-60 metres above sea level and main
crops grown are maize, sweet potatoes, sunflower variety 252,
cassava, bananas and coconut.
(b) Coastal lowland 3 (CL3)
This is the coconut-cassava zone with an annual
rainfall up to 1200mm and an altitude ranging from 1-450
metres above sea level. This zone is found both in Kwale and

29
Kilifi Districts. The main crops grown are coconut, maize,
cowpea and cassava.
(c) Coastal lowland 4 (CL4)
This refers to the cashewnut cassava zones also found in
Kwale and Kilifi Districts. This zone has an altitude of 1-
250 metres above sea level and annual rainfall of up to 1000mm. Main crops grown here are maize, cassava, cashewnut
and cowpea.
(d) Livestock Millet Zone (CL5)
This is a semi-arid zone with livestock rearing as the
dominant activity.
The mean annual rainfall is upto 900mm. Millet and maize are
the main crops grown(Jaetzold 1983).
The Coastal semi-humid zone comprises CL3 and CL4. Figures 3.1
and 3.2 show the agro-ecological zones of Kilifi and Kwale
Districts as well as Kaloleni Division respectively.
The region is mainly occupied by the Mijikenda Community with
the Giriama being the majority to the North Coast and the Digo predominating the south.

F IG . 3.1
T H E AG RO — E C O L O G I C A L Z O N E S O F
K I L I F I A N D K W A L E D I S T R I C T S
l l l u i a p c i RRC
A G R O - E C O L O G 1C A L Z O N E SIO M B A S A
CL 3 - C o c o n u l / C a s c a u a
[Z3 CL 4 - C a s h e u / C a s s a u n
EE C L 5 - L i v e s t o c l < / M i l l e 1
EE CL 6 - R a n c h i n g
«

Fi'G. S.L KALCLlNI DIVISION, ADMINISTRAiIVE LOCATIONS AND AGRO--COLGGICAL ZONES

32
3.2 Method of data collection
3.2.1 Household surveyA sampling frame of all households that owned cattle in
Kaloleni Division from ILCA's 1989 cattle census was used.
Forty households owning cattle and small ruminants were
randomly selected using a table of random numbers from this
sampling frame. Another 40 households that owned small
ruminants only were again randomly selected from the nearest homesteads to those with mixed flocks. A total of 80 farms
were thus selected. The survey was conducted over a period of
one month from early June to early July 1991. With the
assistance of 2 enumerators, data were collected using a
structured questionnaire (Appendix 1-2) on household size and
structure; on-farm income, seasonality of cash needs; flock
size, structure and value; reasons for small ruminants
ownership; offtake due to slaughter, sales and other forms of
exit of small ruminants from households. Information on
periods when small ruminant meat is consumed in the household and the source of the meat; value of sales, market outlet and
opinion on the existing marketing system was collected as
well.
A lot of difficulty was encountered in eliciting
information on off-farm income. There was also a tendency for
stock owners to overvalue their animals in comparison to the
prevailing market prices. It was therefore decided that the
prevailing market price for a given age-group be used in

33
valuation rather than that quoted by the fanner. Seasonality
of cash needs was divided into two broad categories: the pre
harvest period between January to July and the post harvest
period between August and December. These periods also
coincided with the school fees periods in a year as well as
periods of food deficit and surplus in the households,
respectively.Reasons for small ruminant ownership which were taken as
the production objectives were ranked in order of importance.
Slaughter periods, especially festivities, were also recorded
for each household. The sex and species slaughtered were
specified in each case.
Stock sales in the previous 12 month period were also
recorded by value, age, sex, species and period of sale. The place of sale, price setting mechanism, market visits before
sales or when not selling were all recorded in order to
determine the nature of market information system.
3.2.2 Marketing Survey
Distributive Markets
In the rural distributive markets, it was not possible
to statistically pre-determine the sample size. This was
because the population size, variance and hence the
probability of selection was unknown. All small ruminant
traders willing to be interviewed on any market day were
sampled. In the study area, there are four markets, each

34
operating once a week, Mariakani on Mondays, Bamba on
Wednesdays, Kinango on Thursdays and Tsangatsini on Fridays.
It was not possible to collect data on individual animal
characteristics since most traders bought animals in batches
rather than singly.Data collection at each of the four primary markets
commenced in mid-March 1991. In order to gain confidence of
sellers and buyers in each of the markets, the initial 3 weeks
were spent pre-testing the questionnaire. The number of
discarded questionnaires were high due to obvious
inconsistencies in answers. The greatest number of
disqualified data were from sellers who frequently gave
negative margins incurred per head of small ruminant sold.
Information was collected on business experience,
other occupations and whether the business was jointly owned
or not. Fluctuations in business cycle was determined by the
gross sales per trader. A high gross sales would thus
indicate good trading period or high business activity while
low gross sales would indicate low business activity.
Information on other markets visited and whether
the trader engaged in cattle trade was also sought. Source
and purchase price of animals, destination of animals in case
of buyers, form of resale, losses and costs incurred were all
recorded. Apart from Kinango auction market which was closed
in the month of April due to foot and mouth disease outbreak
in Kwale District, the rural distributive market survey
ended by July 30th 1991.
Slaughterhouses
At the slaughterhouses, daily recordings were taken on
the dressed weight of small ruminants slaughtered.
Information was gathered on total number of animals
slaughtered, the price per kilogram of each batch of animals,
the price of goat and sheep skin and the prices of tripe, trotters and head. This was done in Mariakani from March to
the first week of August and from June to August for the
other slaughterhouses. Total slaughter figures and mean daily prices were available throughout the period. Figure 3.3 shows
the location of rural distributive markets and the abattoirs.
Two enumerators assisted with collection of data at the rural
distributive markets and the abattoirs.
35
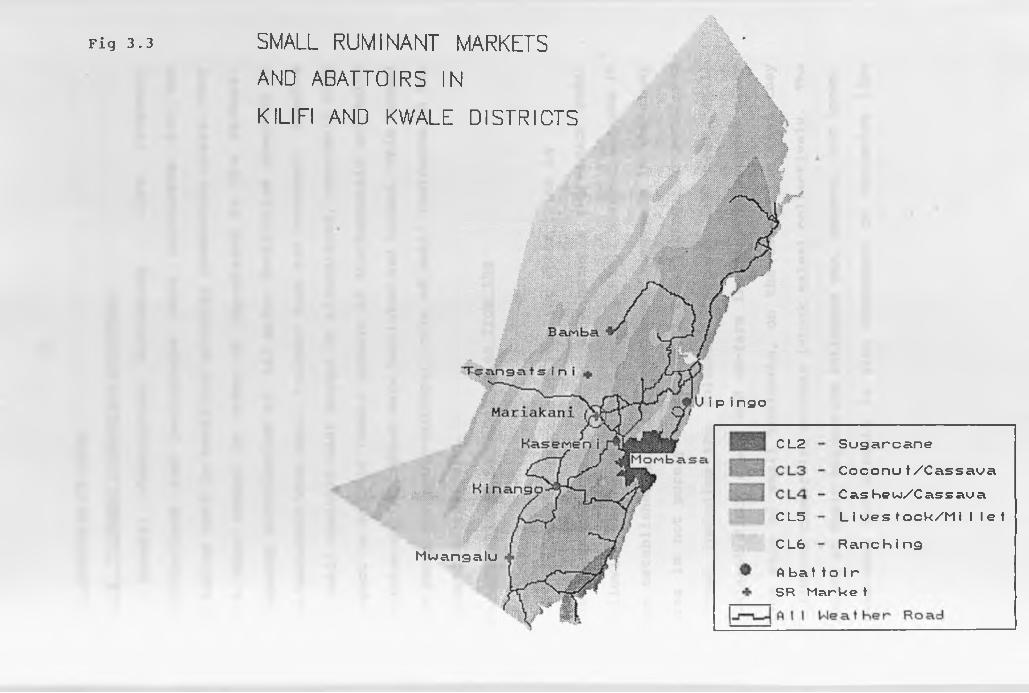
Fig 3.3 SMALL RUMINANT MARKETS
AND ABATTOIRS IN
KILIFI AND KWALE DISTRICTSJ | 1
i p i n g o
C L 2
W m ,
C L 5
C L 6M w a n g a l u
S u g a r c a n e
C o c o n u t / C a s s a u a
C a s he u / C as s au a
L i u e s t o c k / M i I l e t
R a n c h i n g
A b a t t o i r SR M a r k s t

37
3.3 Analysis of data
3.3.1 Producer production objective
General descriptive statistics like frequency
distributions and percentages were calculated for the
variables used in analyzing producer production goals. They
were then ranked in order of importance to the farmers.
Frequency distribution of all major festivities observed in the household when small ruminant meat was consumed, species
of small ruminant meat bought or slaughtered, ownership with
respect to male or female members of the household and sales
decision making method were tabulated and ranked. This formed
the basis for socio-cultural role of small ruminants in the
households analysis.
Factors related to stock sales from the
household
Analysis of factors influencing stock sales in
the household could best be done using a regression model
following the method of Low et al (1980). However,because it
was established a priori that stock ownership in the study
area is not purely a commercial undertaking, a model was
fitted including the following factors: cash-need, small
ruminant flock size and on-farm income from sources other
than sale of small ruminants, on the assumption that they
influence commercial offtake (stock sales) collectively. The
nature of their collective influence was, however, not known.
Cash-need for example is also dependent on variables like

38
level of off-farm income, crop yield in the preceding year,
number of children attending school as well as total household
size as was observed by Low (1980).
In circumstances where the nature of cause and effect
relationships is strictly not known, a correlation analysis
may be used instead of a regression analysis. On the basis
of the above, a correlation analysis was applied.Correlation analysis
Correlation analysis only shows the degree to
which variables are linearly related. A near zero correlation
value does not necessarily mean lack of relationship since
there could be a high non-linear relationship between the
variables (Spiegel 1981).
Simple correlation analysis assumes a bivariate
normal distribution of the underlying population variables.
The coefficient of correlation r is defined as:
r-± explained variation total variation
Inferences about the population correlation coefficient
P can be made from a sample correlation coefficient r by
setting confidence intervals using student (t) distribution.
Hypotheses can be tested about the nature of linear
relationship between any two variables at a specific level of
confidence . One important assumption about the population
from where the two variables are selected is that they must be
bivariate normally distributed. For a null hypothesis of P =

39
0 (correlation coefficient=0) for any two variables, the
distribution is symmetric and statistics involving t
distribution can be used. (Spiegel 1981 pp246).
The following equation can be used to calculate t statistic
for a null hypothesis P = 0
t-rj/EL.
Where r = sample correlation coefficient
N = sample size
t = student t distribution at N - 2 degrees of
freedom
A high correlation coefficient, however, does not
necessarily indicate a direct dependence of the variables.
There are times when cases of spurious correlations may occur
and a strong theoretical basis should be the guiding principle.
3.3.1 The structure conduct and performance of the marketing system
The description of the existing marketing channels
serving the producers in the study area was done using
absolute frequencies and percentages. The market features
analyzed in relation to buyers were their trading experiences,
purpose and destination of animals purchased, processing of
the purchased products before resale and buyer mobility across

40the markets. Time spent on tasks related to livestock trade
and degree of specialization on particular type of livestock
was also investigated. Price setting mechanism at all channel
levels was also investigated. The above formed the basis of
structure and conduct descriptive analysis.
Market performance evaluationTwo analytical methods have been used in the
analysis of market performance, namely,
(i) marketing costs and marketing margins analysis and
(ii) market integration between distributive markets and the
abattoirs, using price analysis.
(i) Marketing costs and marketing margins analysis
"Results of analysis of marketing costs and margins are
used to determine whether there are excess profits and serious
inefficiencies or whether wide margins were due to high real
costs"(Kebede 1990). There are different methods of
determining marketing costs and margins. Abbott (1961) gives
three methods:
(a) tracing the product as it moves through the
marketing system
(b) computing the volume handled and gross value of purchases of each type of marketing agency. The
gross margin is then obtained by dividing the
difference between the value of purchases and sales

41
by the volume handled
(c) comparing prices at different levels of marketing.
The prices used should cover products of comparable
description and quality and allowance be made for
physical loss, quality deterioration and time lag
between successive market operations.
Since price analysis is also used in market performance evaluation, the last method was adopted in this study with
slight variations. Analysis of marketing costs and margins
was therefore done per head of small ruminant in each
marketing channel. The different marketing channels were then
compared in terms of returns to traders as well as the
marketing costs as a percentage of total cost. As Chabari
(1986) noted, "from the welfare point of view, the most
desirable level of performance should be that which offers the
lowest possible average marketing costs per head of small
ruminant sold because this would enable small ruminant buyers
and sellers to offer lower prices to the consumer."
The following were identified as marketing costs
for traders in the study ( Cost of licensing is actually
omitted here because traders were unwilling to divulge information on it):
(a) transport of self to market (1 return trip)
(b) transport of assistants to market (1 return trip)
(c) food and drink expenses (1 return trip)
(d) lodging expenses (1 return trip)

42
(e) taxes (cess) paid per head
(f) dipping fees
( g ) meat inspection fees
(h) slaughter fees
(i) transportation cost of the
destination
animal to its final
(j) herding fees at the slaughter animals are slaughtered.
house before the
There was lack of data on losses resulting
from death or disappearance from the trader or his agents
during the trading operation. This aspect was therefore
omitted. Lag due to successive market operations was also
omitted. The assumption is that this storage cost is covered
in the returns to capital investment, apart from the
difficulty in assigning a value to it. Calculation of margins
accruing to middlemen was done according to the following
formula:
Marketing margin per head = Total value of animal at
sale - buying price.
(ii) Price analysis and market integration
In an integrated marketing system, price formation in an
individual market is influenced by prices in other markets.
The degree of spatial market integration is usually
determined by the variation in prices between places.
Correlation of prices between these markets is taken as an
43
indication of the extent to which two markets are integrated
(Kebede 1990). On the other hand, Monke and Petzel (1984)
define integrated markets as those in which prices of
differentiated products do not behave independently and can
therefore be analyzed in an aggregate manner.
Ruttan (1969) designed a linear regression model to test empirically for efficiency of transmission of information
amongst different market participants. He assumed a highly elastic supply function, a highly inelastic demand for
marketing services and a shift to the right of both curves with long term growth in marketable surplus. In Ruttan's
model, if the slope coefficient of the linear regression model
relating price at farm gate to price at retail level is not
significantly different from one, then the marketing margin is
independent of price, hence supply of marketing services
approaches perfect elasticity.
Price correlation coefficients have also been used to
test for market integration by Francis and Ingawa (1988). The
degree of price correlation is taken as an indication of
market integration. Jones (1968,1972) attempted to measure
marketing efficiencies in Nigeria and other African countries
using (i) the bivariate coefficient of correlation of prices
in different markets;(ii)price difference between markets in
relation to costs and (iii) seasonal price differences
relative to storage costs. Although the markets were weakly
integrated, they were quite efficient given the poor
44infrastructure and lack of market information characterizing
the system.
There are, however, weaknesses in the use of price
correlation as a diagnostic method for integration. Harris
(1979) cites monopoly procurement at fixed prices, similar
price response to temporarily synchronous local forces of
supply and demand as yielding high correlation coefficient.
She also noted the difficulty in identifying the causation effect amongst markets in the price formation process as well
as difficulties in making a structural analysis given the
potential autocorrelation in time and space. Timmer et. al.
( 1983 quoted in Kebede, 1990) also note the existence of
monopoly as well as effective government policy and little
price movement as possible causes of a high correlation
coefficients which could be mistaken for market integration.
He maintains, however, that high correlation coefficients
could indicate perfect competition and efficient arbitrage as
long as corroborative evidence exists to help understand the
actual price formation between markets ( See Holtzman,1986).
Hays and McCoy (1978 quoted in Dittoh 1992) analyzed
inter-market price differentials in relation to transport and
transfer costs and intertemporal price differentials in
relation to storage costs in order to assess the degree of
market integration in Northern Nigeria. The spatial price
differences as well as seasonal price increases were found to
exceed the transfer cost and the cost of storing grain,

45
respectively. This lack of integration provided opportunity
for those who stored grain to make more than normal profits.
Information on crop prospects, market supplies and prices in
order to improve the performance of grain marketing system was
therefore necessary. Other studies (see Delgaldo 1986) avoided
correlation coefficient method and used a variance component
approach to measure grain market integration in Northern Nigeria because of the observed weaknesses in price
correlation analysis.
Recent studies ( Monke and petzel 1984, Ravallion 1985,
Hayten 1986, Kebede 1990 and Benson 1990) have used various
regression models to test for market integration.
Bivariate (simple) regression model
Bivariate regression models have been used by Monke et al
1984 and Kebede 1990 to test for market integration.
This model is formally stated as:
P1=F(P2)
This can be specified to:
P, = a + 6P2 + e.
where: P ^ price per unit in market 1
P2= price per unit in market 2
a= constant
B= coefficient of p2
(a) If coefficient B is not significantly different from
zero, the two markets are independent (not integrated)

46
(b) If coefficient B is significantly different from zero,
the two markets are dependent (integrated)
(c) If coefficient B is not significantly different from 1
and zero and coefficient a is not significantly different
from zero, the two prices are statistically identical
(d) If coefficient B is significantly different from 1 and
zero and the coefficient a is not significantly different
from zero, arbitrage is suggested
(e) When coefficient 6 is not significantly different from 1
and coefficient a is significantly different from zero, this
suggests absolute arbitrage cost reflecting a fixed price
differential between the two markets. Both percentage and
absolute elements would be indicated if B is significantly
different from zero and 1 and a is also different from zero.
In this study, both price correlation coefficients and
bivariate regression analysis were used. Average weekly price
per head in each distributive market were used. In case of
prices between distributive markets and abattoirs, the final
value of the animal was used as price per head in the
abattoir. This was the sum of carcass, skin, head and
trotters, and tripe values. Among the abattoirs, per kilo
wholesale price was used for analysis.
47
CHAPTER FOUR
4. Results and Discussion
4.1 The socio-economic role of small ruminants in the
households
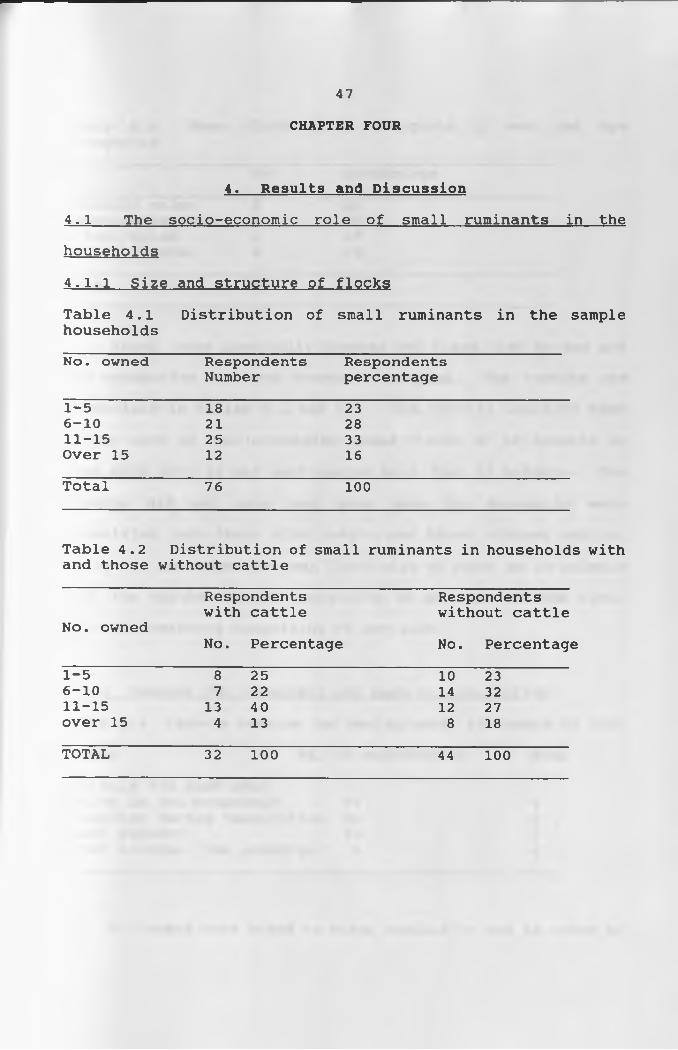
4.1.1 Size and structure of flocks
Table 4.1 Distribution of small ruminants in the sample householdsNo. owned Respondents
NumberRespondentspercentage
1-5 18 236-10 21 2811-15 25 33Over 15 12 16Total 76 100
Table 4.2 Distribution of small ruminants in households with and those without cattle
No. ownedRespondents with cattle
No. Percentage
Respondents without cattle
No. Percentage1-5 8 25 10 236-10 7 22 14 3211-15 13 40 12 27over 15 4 13 8 18TOTAL 32 100 44 100
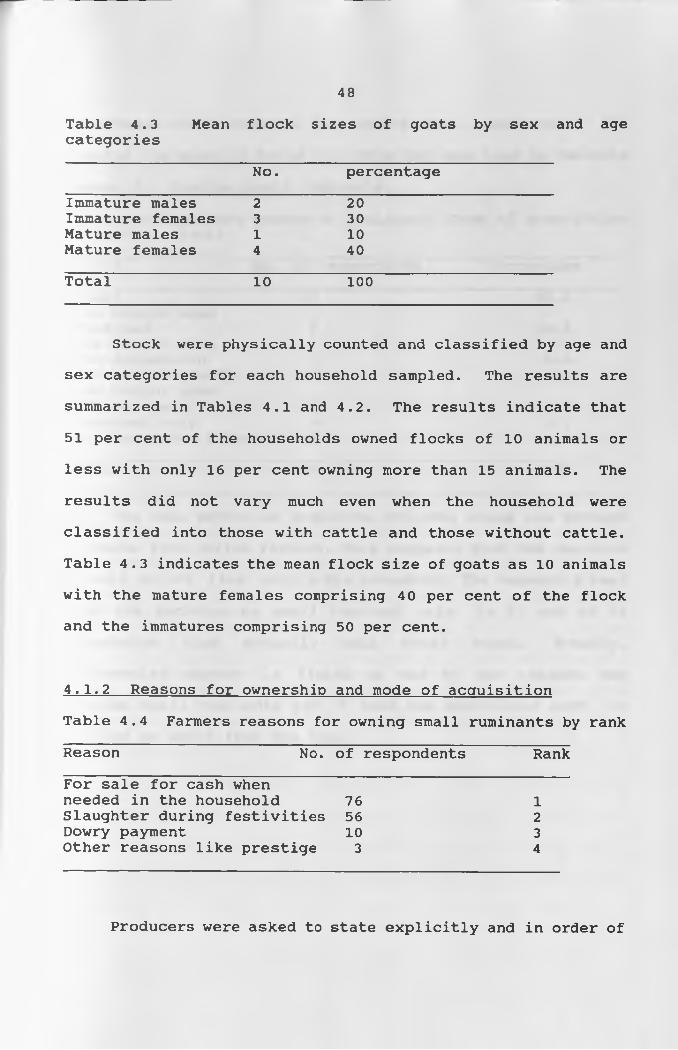
Table 4.3 Mean flock sizes of goats by sex and agecategories
48
No. percentage
Immature males 2 20Immature females 3 30Mature males 1 10Mature females 4 40
Total 10 100
Stock were physically counted and classified by age and
sex categories for each household sampled. The results are
summarized in Tables 4.1 and 4.2. The results indicate that
51 per cent of the households owned flocks of 10 animals or
less with only 16 per cent owning more than 15 animals. The
results did not vary much even when the household were
classified into those with cattle and those without cattle.
Table 4.3 indicates the mean flock size of goats as 10 animals
with the mature females comprising 40 per cent of the flock
and the immatures comprising 50 per cent.
4.1.2 Reasons for ownership and mode of acquisition
Table 4.4 Farmers reasons for owning small ruminants by rank
Reason No. of respondents RankFor sale for cash whenneeded in the household 76 1Slaughter during festivities 56 2Dowry payment 10 3Other reasons like prestige 3 4
Producers were asked to state explicitly and in order of

49
importance their reasons for owning small ruminants. The
results are shown in table 4.4. Sale for cash need is the main
reason for keeping small ruminants.
Table 4.5 Producers source of ruminants (Mode of acquisition of initial stock)
Source No. of respondents Percentage
Bought 47 61.8Some bought some inherited 8 10.5Some bought some from dispersion 5 6.6Paid as dowry only 5 6.6Some bought some paid as dowry 4 5.3Dispersed only 4 5.3Got from other sources 3 3.9TOTAL 76 100
The main method of acquiring original stock was through
purchase from fellow farmers. This suggests that the decision
to sell or not lies within the household. The household head
made the decision on small ruminant sale in 52 out of 76
households that actually sold their stock. Notably,
bridewealth payment is listed as one of the reasons for
keeping small ruminants yet it does not contribute much to
entries or exits from the farm.

50
4.1.3 Consumption of small ruminants in the households
Table 4.6 Small ruminant consumption in the household during festivities
Festivity Number of respondents
Christmas Christmas and end
of the mijikenda
22
yearEnd of the mijikenda
8
yearChristmas and Idd-ul-
7
Fitr 7Idd-ul-hajj 6Christmas and Easter 5
In the survey, producers were asked to state how often they purchase small ruminant meat. Forty out of seventy-six
indicated that they purchase small ruminant meat no more than
twice a year from the meat retailers.
Table 4.4 indicates slaughter for festivities as ranking
second to sale for cash need in producer production goals.
Survey results also showed 60 out of 76 households as having
slaughtered goats during the previous 12 months while only 2
out of 76 households slaughtered sheep. Goat meat therefore
preferred to sheep meat for household consumption by the
sample farmers.
Table 4.6 shows the consumption of small ruminant meat
during festivities from the household's stock. Christmas
appears to be the religious festivity during which most small
ruminant meat was consumed by households. The end of the
Mijikenda year, referred to as "vuri" in Kigiriama or 'vuli'
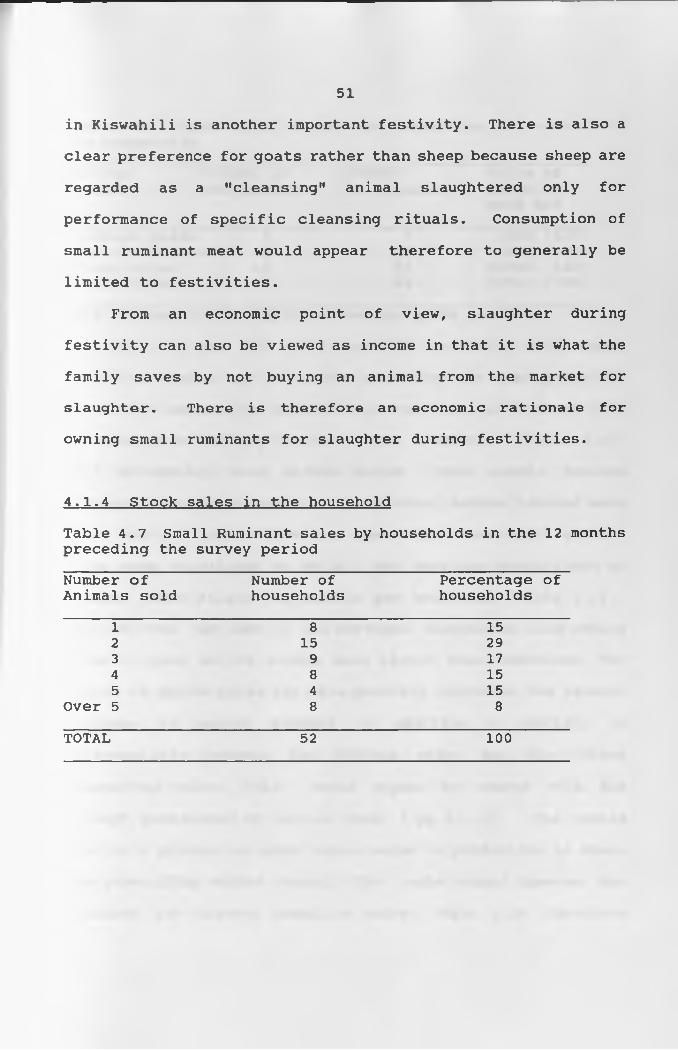
51in Kiswahili is another important festivity. There is also a
clear preference for goats rather than sheep because sheep are
regarded as a "cleansing" animal slaughtered only for
performance of specific cleansing rituals. Consumption of
small ruminant meat would appear therefore to generally be
limited to festivities.
From an economic point of view, slaughter during
festivity can also be viewed as income in that it is what the
family saves by not buying an animal from the market for slaughter. There is therefore an economic rationale for
owning small ruminants for slaughter during festivities.
4.1.4 Stock sales in the household
Table 4.7 Small Ruminant sales by households in the 12 months preceding the survey periodNumber of Animals sold
Number of households
Percentage of households
1 8 152 15 293 9 174 8 155 4 15
Over 5 8 8
TOTAL 52 100
52
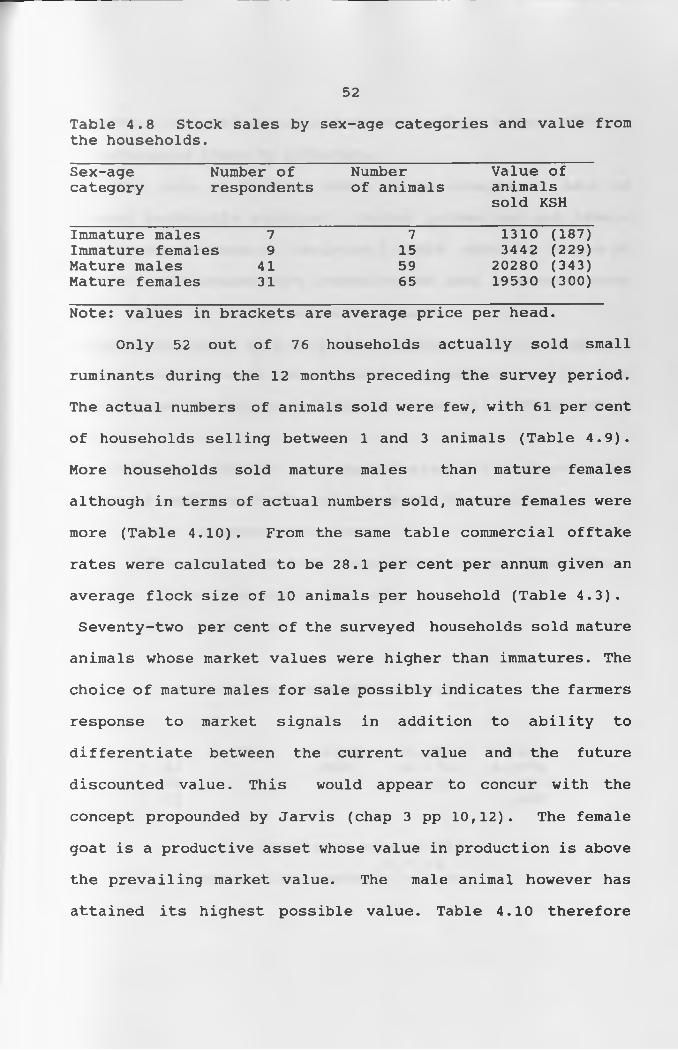
Table 4.8 Stock sales by sex-age categories and value from the households.
Sex-age Number of Number Value ofcategory respondents of animals animals
sold KSH
Immature males 7 7 1310 (187)Immature females 9 15 3442 (229)Mature males 41 59 20280 (343)Mature females 31 65 19530 (300)
Note: values in brackets are average price per head •
Only 52 out of 76 households actually sold small
ruminants during the 12 months preceding the survey period.
The actual numbers of animals sold were few, with 61 per cent
of households selling between 1 and 3 animals (Table 4.9).
More households sold mature males than mature females
although in terms of actual numbers sold, mature females were
more (Table 4.10). From the same table commercial offtake
rates were calculated to be 28.1 per cent per annum given an
average flock size of 10 animals per household (Table 4.3).
Seventy-two per cent of the surveyed households sold mature
animals whose market values were higher than immatures. The
choice of mature males for sale possibly indicates the farmers
response to market signals in addition to ability to
differentiate between the current value and the future
discounted value. This would appear to concur with the
concept propounded by Jarvis (chap 3 pp 10,12). The female
goat is a productive asset whose value in production is above
the prevailing market value. The male animal however has
attained its highest possible value. Table 4.10 therefore
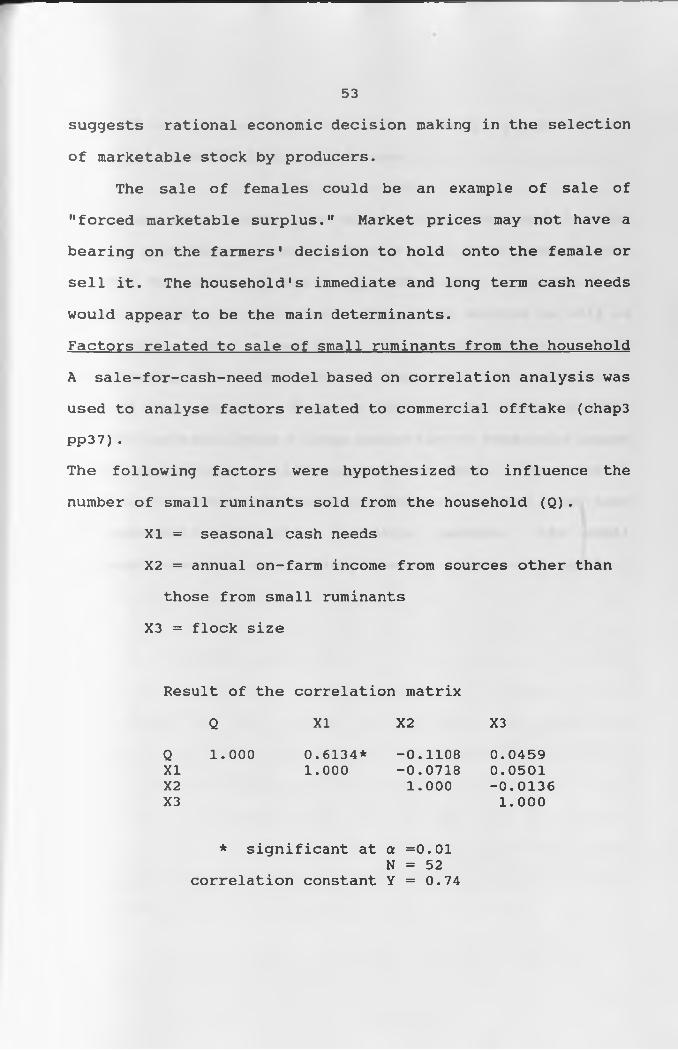
53
suggests rational economic decision making in the selection
of marketable stock by producers.
The sale of females could be an example of sale of
"forced marketable surplus." Market prices may not have a
bearing on the farmers' decision to hold onto the female or
sell it. The household's immediate and long term cash needs
would appear to be the main determinants.Factors related to sale of small ruminants from the household
A sale-for-cash-need model based on correlation analysis was
used to analyse factors related to commercial offtake (chap3PP37).
The following factors were hypothesized to influence the
number of small ruminants sold from the household (Q).
XI = seasonal cash needs
X2 = annual on-farm income from sources other than
those from small ruminants
X3 = flock size
Result of the correlation matrix
Q XI X2 X3
Q 1.000 0.6134* -0.1108 0.04591.000 -0.0718 0.0501XI
X2X3
1.000 -0.01361 . 0 0 0
* significant at a =0.01N = 52
correlation constant Y = 0.74
54
The 95% confidence interval for the underlying population
correlation coefficient is given as:
0.5 < p < 0.89Only cash need factor lies within this range and is also
highly significant. The hypothesis that cash need is not
related to number of small ruminants sold is rejected at
a=.01. Notably, on-farm income from other sources as well as
flock size have a positive but non-significant linear
relationship with stock sales as they both fall on the lower
tail of the interval. There is evidence to show that off- farm income contributes a large proportion of household income
in Kaloleni Division (ILCA unpublished 1990). The sale of
stock is therefore limited to periods of seasonal cash need
for household consumption possibly, because the small
ruminants are more easily liquidated as compared to cattle.

55
4.3 Classification and operation of small ruminant markets
In this study, homesteads served as primary markets for
the producers since 96 percent of the respondents who actually
sold their stock did so at the homesteads. The main buyer purpose at this level was production (breeding) and resale.
4.3.1 Distributive marketsThe major rural buying centres, Bamba, Mariakani,
Tsangatsini and Kinango are distributive markets as the main buyer purpose at them was for resale. In the festive seasons
like Idd-Ul-Fitr and Christmas, they serve the nearby urban
centres as terminal markets since many urban dwellers prefer
to purchase live animals for consumption. Apart from
Tsangatsini, the distributive markets are government
established auction rings for cattle.
Tsangatsini, however, is not an auction ring and the
only activity that legitimizes it is collection of cess by
County Council staff. Another market that operates in the
same manner is at Samburu in the dry ranching zone.
Collection of cess has however benefitted mainly cattle
traders especially in markets where there are auction rings.
The rings have sheds both for cattle and the market
participants. Cattle can therefore be kept in the sheds
overnight just before the auction day. The rings are also
properly enclosed with roofing both for the traders and for
56
the buyers.The slaughterhouses also served as distributive
markets. One important marketing serving occurring at the
abattoirs however was processing which added to the final
value. All the carcasses from the abattoirs ended up in
various retail outlets in Kilifi town, Mombasa town, Mariakani
urban centre and other nearby retail outlets.
4.3.2 Mode of transport to and from the distributive markets
Out of 109 cattle and small ruminant traders interviewed
in the study, 96 percent trek their animals both to and from the market. Apart from 4 regular traders whose business are
vertically integrated, all the buyers from Bamba auction ring
trekked their animals to the respective destinations. The
truckers own retail outlets both in Kilifi and Mombasa town
and slaughter the animals both at Vipingo and Kasemeni
abattoirs. They also own the trucks which they use for
transporting the animals. Transportation costs however varied
with flock size and destination in case of trekking by hired
assistants. Pooling of animals destined for same destination
was frequent among the traders. This helped them reduce the
costs. Buyers from Bamba transported their animals using
trucks as well as trekking. The truckers own retail outlets
both in Kilifi and Mombasa town and slaughter the animals both
at Vipingo and Kasemeni abattoirs. They also own the trucks
which they use for transporting the animals. Transportation
costs however varied with flock size and destination in case

57
of trekking by hired assistants.
4.3.3 Market participants and marketing channels
There are various participants in the marketing chain of
small ruminant meat from producers to consumers. The
participants involved in the exchange functions between the
produce and the final consumer are called market
intermediaries. Three main market intermediaries were identified in this study; collectors(assemblers), Itinerant
traders and retailers.
Collectors (Assemblers)These individuals normally reside in the rural areas and
are often known to producers within a given area. They are
usually not full-time traders and spend some time moving from
village to village collecting animals for the distributive.
They are the essential link between producers and the
distributive markets. A few also do buy small ruminants for
later re-sale after fattening. This was the group that was
identified as sellers in the distributive markets.
Itinerant traders (Wholesalers)
These are the most versatile group in terms of their
sources of stock. Apart from moving from market to market,
they also buy animals from homesteads. They then slaughter the
animals in slaughter houses and sell to retailers the
carcasses. Skin is sold separately to skin dealers while head
and trotters are sold separately to retailers.

58
The retailers
These are the owners of the main retail outlets in both
urban and rural areas. They normally purchase whole carcasses
on a dressed weight basis and truck them to their retail
outlets using both hired and own vehicles from the abattoirs.
Although there is preference for a given abattoir by the retailers, there is shuttling around to different abattoirs
depending on the prevailing wholesale prices.
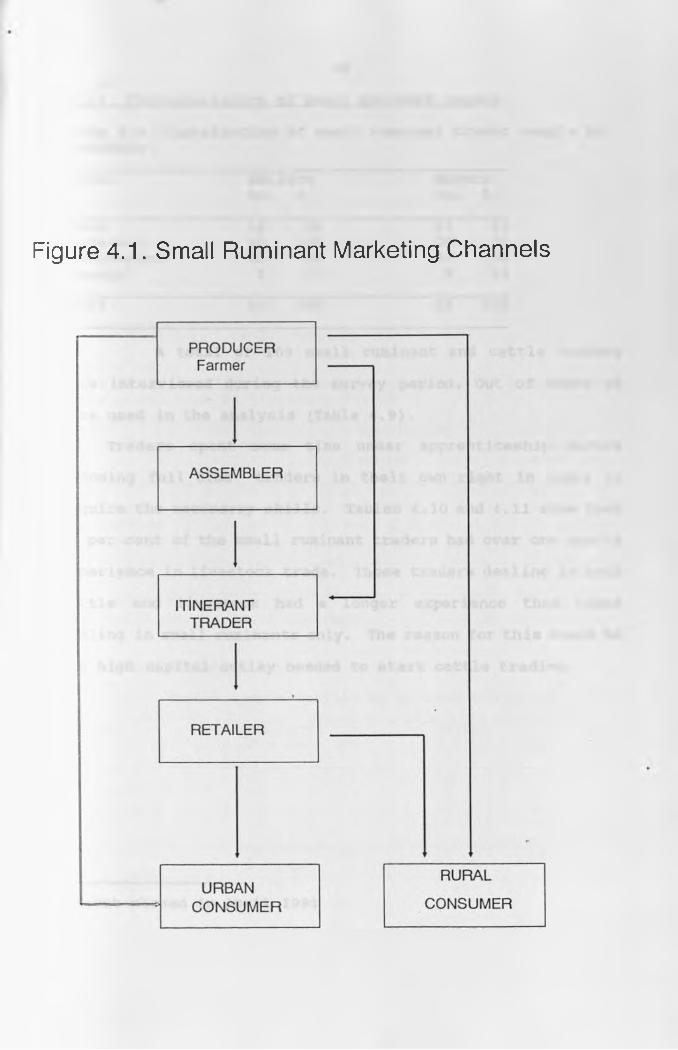
Figure 4.1. Small Ruminant Marketing Channels

60
4.3.4 Characteristics of small ruminant buyers
Table 4.9 Distribution of small ruminant trader sample by markets
Market Sellers BuyersNo. % No. %
Bamba 12 30 12 21Mariakani 12 30 20 34Tsangatsini 11 28 17 29Kinango1 5 12 9 16
Total 40 100 58 100
A total of 109 small ruminant and cattle traders
were interviewed during the survey period. Out of those 98
were used in the analysis (Table 4.9).Traders spent some time under apprenticeship before
becoming full time traders in their own right in order to
acguire the necessary skills. Tables 4.10 and 4.11 show that
68 per cent of the small ruminant traders had over one year's
experience in livestock trade. Those traders dealing in both
cattle and livestock had a longer experience than those
dealing in small ruminants only. The reason for this could be
the high capital outlay needed to start cattle trading.
’market closed in April 1991

61
Table 4.10 Trading experience of small ruminant buyers by markets and type of livestock traded
Market less than 6 months C+SR SR
6 months to 1 year C+SR SR
over 1 year
C+SR SR
Bamba 0 0 0 3 3 6Mariakani 1 6 0 3 4 6Tsangatsini 0 5 0 3 3 5Kinango 1 1 0 1 5 2
Total 2 12 0 10 15 19
SR = Small Ruminant only C + SR Cattle and Small ruminant
Table 4.11 markets and
Trading experience of small ruminant type of livestock traded
sellers b
Market less than 6 months C+SR SR
6 months too l year C+SR SR
OveryearC+SR
1SR
Bamba 0 0 0 0 11 1Mariakani 0 0 0 0 9 3Tsangatsini 0 4 0 2 3 2Kinango 0 0 1 0 4 0Total 0 4 1 2 27 6
SR = Small Ruminant only C + S R Cattle and Small ruminant
4.3.5 Trader specialization
Table 4.12 Trader specialization by markets and animal typeMarket Sellers
C + SR SRBuyersC + S R SR
Bamba 11 1 3 9Mariakani 9 3 5 15Tsangatsini 3 8 3 13Kinango 5 0 6 2Total 28 12 17 39SR = Small Ruminant only C + SR Cattle and Small ruminant

62
There was a high degree of diversification among the
small ruminant traders in the study area. Sellers in the
distributive markets who are actually assemblers collected
both cattle and small ruminants as they moved from village to
village (Table 4.12). They then trekked them to the
distributive markets for resale. Bamba market is, however,
unique. Although the auction ring exists, cattle sellers
prefer the one-to-one transaction method. The sellers act as
commission agents to the producers. They are paid a given
amount of commission after the sale of the animals by the
producers depending on the sale value of the animal. An open auction would make the market more transparent with a
possibility of producers demanding more or even doing away with the assemblers all together. More traders may have
ventured into cattle trading as a result since initial capital
is not a constraint as such.
In Tsangatsini, however, the sellers possibly lacked
initial capital to diversify hence the few number of
traders(Table 4.12) The buyers showed a greater tendency
towards specialization. These were mainly itinerant traders
between the distributive markets and the abattoirs. The
probable reason being a more developed marketing system at
this channel level. There is also a possibility of market
integration with the traders supplying particular retailers.
Traders dealing in small ruminants only cited lack of capital
as the main reason for trading in small ruminants only.

63
Those traders dealing in both cattle and small ruminants,
however, cited response to market demand conditions as well as
better returns as being the main reasons for diversification.
It is possible that small ruminant trade at assemblers
channel level is mainly undertaken by relatively resource poor
traders. As the capital base of a trader increases, they
diversify more into the more profitable but risky cattle
trade.

64
4.4 Market performance4.4.1 Analysis of marketing costs and marketing margins
Mean costs and returns per head of small ruminant were
calculated for each of the channels. Losses due to theft or
animals going astray were few.
Assemblers
Table 4.13 Analysis of marketing costs and marketing margins per head of small ruminant sold at Bamba market by assemblers
Cost AmountKshs
Revenue AmountKshs
Purchase price Taxes and cess Other costs
197.003.002.00
Selling price 232.00
Total costs 202.00 Total revenue 232.00Profit= 30.00. Marketing margin = 35.00Traders return to capital investment = 14.85%Marketing cost = 5.00. N=144
In all the channels assemblers incurred the lowest
marketing cost per head. This is because of the apparent low
service content in the performance of the marketing tasks.
The low service content is, however, only apparent since the
costs do not take account of the opportunity cost of the
assemblers. Even if the opportunity cost of assemblers is
zero, the physical distances covered in collecting animals on
foot as well as the time spent to assemble the animals to the
distributive markets embodies some service content. This
analysis was done for Bamba distributive only. The buyers
return to capital per head of small ruminants sold at Bamba
was 14.85 percent.

65
Itinerant tradersTable 4.14 Analysis of marketing costs and marketing margins per head of a small ruminant bought at Bamba market and sold at Vipingo abattoir
Cost to buyer Amount(Kshs)
Revenue to buyer Amount(Kshs)
Mean purchase Carcass value(heart 9
price 240.00 liver,lungs andkidney inclusive) 270.00
Transportation toabattoir 18.00Flaying and Tripes, head andabattoir fees 10.00 Trotters 15.00Meat inspectionfees 10.00 Skin 20.00Taxes, cess 3.00Total cost 281.00 Total revenue 305.00
Profit to trader = 24.00Buyers return to capital investment = 8.51% Marketing costs = 41 Marketing margin = 65 N=51
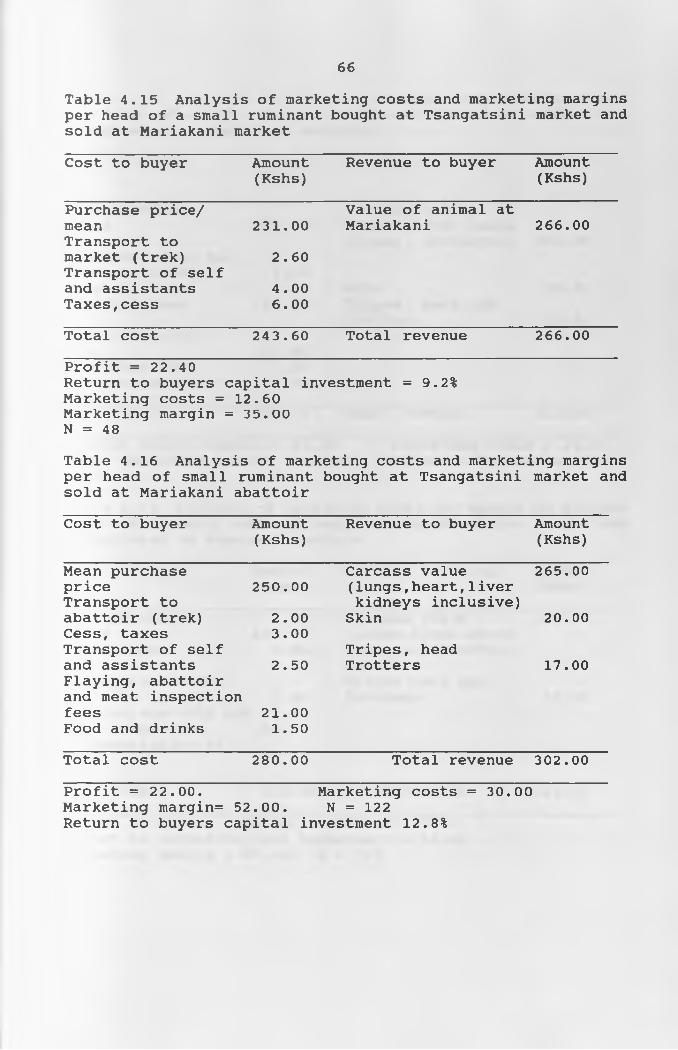
66
Table 4.15 Analysis of marketing costs and marketing margins per head of a small ruminant bought at Tsangatsini market and sold at Mariakani market
Cost to buyer Amount(Kshs)
Revenue to buyer Amount(Kshs)
Purchase price/ meanTransport to market (trek) Transport of self and assistants Taxes,cess
231.00
2.60
4.006.00
Value of animal at Mariakani 266.00
Total cost 243.60 Total revenue 266.00
Profit = 22.40Return to buyers capital investment = 9.2%Marketing costs = 12.60 Marketing margin = 35.00 N = 48
Table 4.16 Analysis of marketing costs and marketing marginsper head of small sold at Mariakani
ruminantabattoir
bought at Tsangatsini market and
Cost to buyer Amount Revenue to buyer Amount(Kshs) (Kshs)
Mean purchase Carcass value 265.00price 250.00 (lungs,heart,1iverTransport to kidneys inclusive)abattoir (trek) 2.00 Skin 20.00Cess, taxes 3.00Transport of self Tripes, headand assistants 2.50 Trotters 17.00Flaying, abattoirand meat inspectionfees 21.00Food and drinks 1.50
Total cost 280.00 Total revenue 302.00
Profit = 22.00. Marketing costs = 30.00Marketing margin= 52.00. N = 122Return to buyers capital investment 12.8%

67
Table 4.17 Analysis of marketing margins and marketing costs per head of small ruminant bought at Mariakani market and slaughtered at Mariakani abattoir
Cost to buyer Amount Revenue to buyer Amount(Kshs) (Kshs)
Mean purchase Carcass valueprice 266.00 (Heart,liver,lungs
Kidney, inclusive) 282.00Transportation to abattoir(trek) Flaying and
1.00Skin 20.00
abattoir fees 10.00 Tripes, head and trotters 15.00
Meat inspection fees 10.00Taxes and cess 3.00Fees at abattoir 4.00
Total cost 295.00 Total revenue 317.00
Buyer profit margin = 23.00 Marketing costs = 28.00N=80 Marketing margin = 51.00 Return to buyers capital =
7.46%
Table 4.18 Analysis of marketing costs and marketing margins per head of small ruminant bought at Bamba auction market and slaughtered at Kasemeni abattoir
Cost to buyer Amount Revenue to buyer Amount(Kshs) (Kshs)
Mean purchase Carcass value 297.40price 240.00 (lungs,liver,heartTaxes, cess 3.00 kidneys,inclusive)
Skin 13.00Transportation to Tripes head andabattoir (trek) 3.00 trotters 15.00Flaying,abattoir and meat inspection Transportation of
22.00self 5.00
Total cost 272.00 Total revenue 325.40
Profit = 52.40 Marketing costs = 33.00Return to buyers capital investment = 19.6% Marketing margin =85.40. N = 173

68
Table 4.19 Marketing cost per head of small ruminant per Km of transfer between different channels for the itinerant traders.
Channel Marketing cost per Kshs per Km per head
Tsangatsini to Mariakani market 0.36Bamba to Kasemeni 0.64Tsangatsini to Mariakani abattoir 0.76Bamba to Vipingo 1.64Mariakani to Mariakani abattoir 4.83
Note. Bamba-Vipingo=25Km, Bamba-Kasemeni=50Km, Tsangatsini- Mariakani market=35Km, Tsangatsini-Mariakani abattoir=41Km
Itinerant traders have a greater service content embodied
in marketing costs than the assemblers. Apart from the transfer cost of animals from the distributive markets to the
abattoirs, they also pay for the slaughter and abattoir fees.
The processing cost is therefore a significant component of
their total cost of marketing. In terms of rates of profits
which is reflected in buyers return to capital investment, the
itinerant traders recorded less than 10 percent save for Bamba
to Kasemeni channel which recorded 19.6 per cent.
This channel had only 2 traders who trucked their animals to
Kasemeni directly. Given that the total number of animals
trucked were 173, the cost per head was significantly reduced.
The mean carcass value of the animals were also highest among
the abattoirs at Kshs.297.00.
In terms of technical efficiency, the channel that
provides marketing services at least possible cost is
considered relatively more efficient than the rest of the
channels. From Table 4.19, small ruminants bought at

69
Tsangatsini and sold at Mariakani market follow the most
efficient marketing channel. Second in rank are those
originating from Bamba and destined for Kasemeni abattoir.
Notably, the least efficient channel is the Mariakani market
to Mariakani abattoir. This market recorded the highest mean
purchase price per head during the survey period (Table 4.17).
In addition to the above, the abattoir is privately owned
unlike Vipingo and Miritini that are owned by the county
council of Kilifi. It may therefore not benefit from any
government subsidy as a result .To conclude this section on marketing costs and marketing
margins analysis, some limitations of the analysis need to be
pointed out. The rates of profits for assemblers were all
found to be above 14 percent which was above the bank discount
rates. At the time of the survey, the discount rate on
savings for post office savings bank (postbank) which is most accessible to rural traders was 12.5 percent. Profit rates
for itinerant traders were all less than 10 percent. This was
less than the bank discount rates. At the channel levels
therefore, the itinerant traders approach a competitive market
structure than that of assemblers. All the traders, however,
reside in rural areas. The cost of getting to the nearest
post office especially for the assemblers, could be greater
than the discount rate offered at the postbank. The
apparently high profit rates accruing to the assemblers could
therefore be justified in real terms.

70The turnover rates which is the number of animals sold
per given period of time was not established per trader. The
apparently low returns per head of small ruminant compared to
30 percent in Chabari's study could be compensated by high
turnover rates.
Comparing profit rates with discount rates has another
limitation in terms of the magnitude of capital investment
being analyzed. The highest capital investment was Ksh.305.00
per head of small ruminant (Table 4.18). "If the capital
investment in marketing organization is very little, the profit level may be compared with return to labour income in similar branches of the economy" (Schubert 1973, quoted in
Kebede 1990). In this case a better comparison would be with
returns to labour in agricultural sector in the area of study.
This information is, however, not available. With the
limitations above taken into account, the marketing system in
the study area still appears to approach a competitive
structure.

71
4.4.2 Price analysis
Price discovery and mode of transaction
At all channel levels of the small ruminant marketing
chain, the mode of transaction was by one-to-one bargaining
This method has the disadvantage of stifling free flow of
market information. At farmgate, the level where assemblers
and producers meet, lack of market information was prevalent
amongst producers. Information from the on-farm survey showed
that none of the producers visited the market before selling
their stock. Whereas producers based their selling price
mainly on age and sex of the animal, the assemblers, in
addition had the advantage of knowing the prevailing price at
the distributive markets. The assembler could therefore
bargain and get returns to cover both direct and indirect
costs. At the distributive markets, the number of market
participants possibly increased the level of transparency.
Although the one-to-one bargain system was the mode of
transaction, availability of many buyers and sellers gave the
seller a wider bargaining latitude.
Supply level manifested by the number of animals on offer
as well as prevailing prices at the slaughterhouses were noted
to be the main factors determining the price. Animal
characteristic were also noted to determine price per head.
Traders cited animals that "stand tall" from the ground with
good finishing as commanding higher prices. The tall animals

72
were noted to give higher dressing out weights while a good
finish reflected a good body condition. The mode of payment
both at the farmgate and at the distributive markets was on a
cash on sale basis.
Intra annual price variation in the abattoirs
The duration of data collection may not give a clear picture
of price variation over the year. Response from livestock
traders however indicate low prices in the dry season with
prices picking up at the onset of rains, and dropping again at harvest period. Table 4.20 shows intra annual trading
activity for small ruminant traders over a period of one year.Trading activity here refers to total sales volumes per
trader in a given trading period. A high trading activity
therefore refers to high turnover rates while a low trading
activity refers to low turnover rates.
In the dry season, the itinerant traders and the
assemblers reported low trading activity. The trading
activity picks up at the onset of rains and is highest between
August to December.

73
Table 4.20 Intra annual trading activity for small ruminant traders at the distributive markets.
Period % of respondents % of respondentsreporting high reporting lowactivity activity
January-March 8 80April-July 60 20August-December 90 8
The period between January and March is the dry season in the study area. This is also the school fees paying period.
Most producers are compelled to sell their animals order to
meet both immediate and seasonal cash needs. The same trend follows until the harvest period sets in August. The market
price of small ruminants at the distributive markets is
therefore depressed by supply which surpasses demand during
this period.

Fig. 4.2 Nominal price movement at Mariakani abattoir during March-July
1991. Data from second week of March
1 2 3 4 5 6 7 8 9 10 11 12 13 14 15 16Week
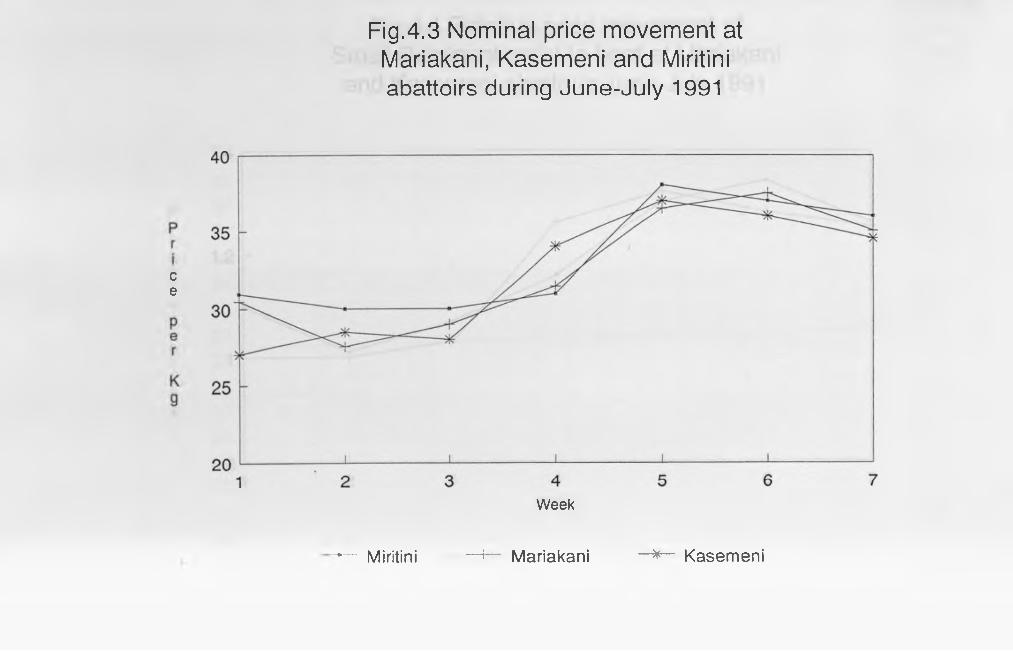
CD
O
F ig .4.3 Nominal price movement at Mariakani, Kasemeni and Miritini a b a tto irs d u rin g J u n e -J u ly 1991
Week
- — Miritini *— Mariakani * — Kasemeni

Fig.4.4 Relative price movement ofSmall Ruminant meat to beef at Mariakaniand Kasemeni abattoirs June-July 1991
Week
Mariakani Kasemeni
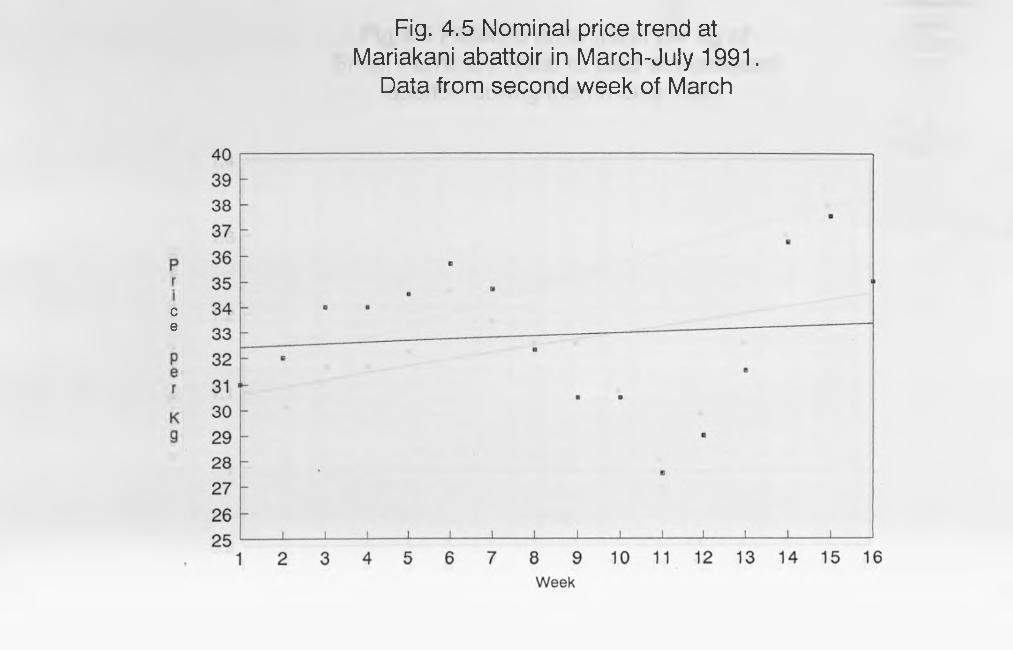
CD
O
Fig. 4.5 Nominal price trend at Mariakani abattoir in March-July 1991.
Data from second week of March

Fig.4.6 Relative price trend per kg ofSmall Ruminant meat to beef at Mariakani
abattoir during March-July 1991
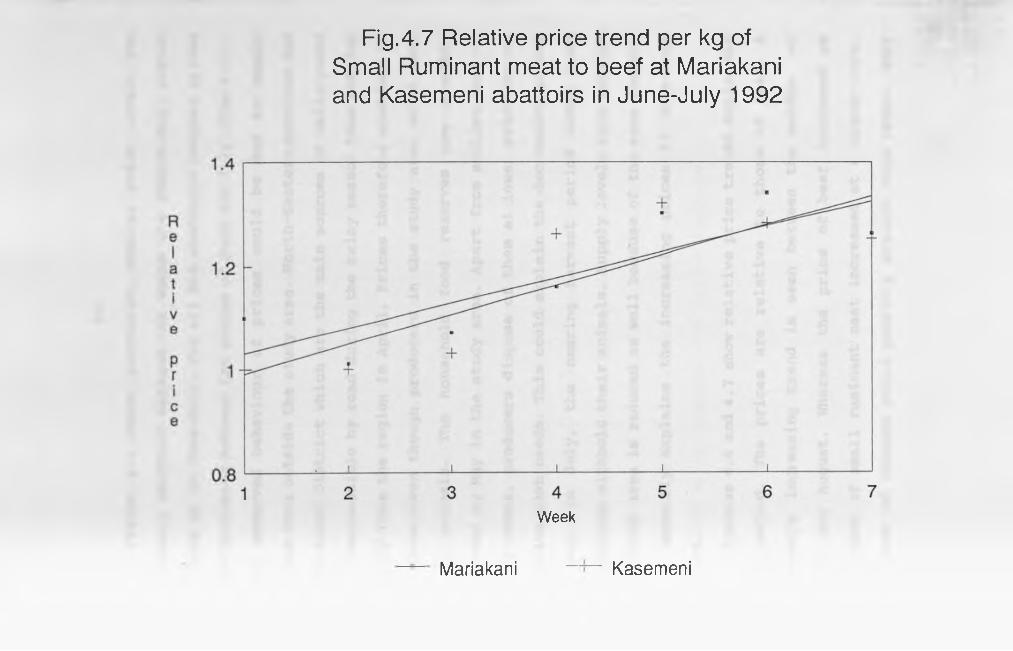
Fig.4.7 Relative price trend per kg ofSmall Ruminant meat to beef at Mariakaniand Kasemeni abattoirs in June-July 1992
Week
Mariakani Kasemeni

80Figure 4.2 shows increasing nominal price levels for
Mariakani abattoir between the weeks 1-6 (March-May) before
picking up in June-July. For all the abattoirs nominal prices
also increased between the months of June and July (fig.4.3) .
The observed behaviour of prices could be due to supply
levels from outside the study area. North-Eastern province and
Tana river District which are the main sources of Galla goats
are inaccessible by road during the rainy season thus cutting
supply from the region in April. Prices therefore continue to increase even though producers in the study area still sell their animals. The household food reserves are possibly
depleted by May in the study area. Apart from selling more of
their stock, producers dispose of them at lower price due to
pressing cash needs. This could explain the decreasing prices
in May. In July, the nearing harvest period makes most
households withhold their animals. Supply levels from outside
the study area is reduced as well because of the same reason.
This possibly explains the increasing prices in June-July
period.
Figures 4.6 and 4.7 show relative price trends during the
same period. The prices are relative to those of beef. A
generally increasing trend is seen between the months of
March and August. Whereas the price of beef increased as
well,that of small ruminant meat increased at a faster rate.
A number of reasons could possibly explain this trend. Beef

81prices are generally more stable reflecting a stable supply
level. It is also possible that demand for small ruminant meat
is stratified compared to that of beef even though they are
considered substitutes. This could also explain the generally
lower price of beef compared to small ruminant meat during the same period. The discussion above is consistent with the
results in Table 4.20 where traders response to periods of
high or low business activity also show similar patterns. A
high business activity in this study refers to high sales
volumes by the traders whereas low business activity refers to
low sales volumes by the traders. The period between August and December is the harvest and post harvest period when on-
farm income is highest. This is also the period when the end
of the Mijikenda year falls, apart from Christmas and New year
festivities. Many consumers are therefore more likely to
purchase small ruminants as compared to the earlier parts of
the year. The effect of festivities like Easter and Idd-ul-
fitr also influenced prices although this could not be
quantified as it requires time series analysis.

4.4.3 Market integration
Price correlation analysisThere is evidence of supply and demand interplay settling
price at the abattoirs. There is also evidence from traders
survey that supply levels at the abattoirs have an effect on
prices at the distributive markets whereas at the homesteads,
it is mainly market information which gives the buyer the
bargaining power to fix prices.
Table 4.21 Correlation matrix for prices per head between the distributive markets
Mariakani Tsangatsini Bamba KinangoMariakani 1.00Tsangatsini 0.0512 1.000Bamba 0.5185** 0.1290 1.000Kinango 0.6210** -0.0275 0.5297** 1.000** Significant at a =.05Note: only 12 cases were examined due to closure of Kinango auction yard before the survey period was over.
From the results of price correlation coefficients, all
the distributive markets have insignificant correlation
coefficients save for Mariakani/Bamba, Mariakani/Kinango and
Bamba/Kinango that are significant at a=.05 (Table 4.21).
Evidence from stock flow pattern indicates movement of
animals from Bamba to Mariakani and Kinango to Mariakani.
Bamba and Mariakani as well as Kinango and Mariakani are
integrated. There is, however, lack of supportive evidence
about Kinango and Bamba being integrated although the prices
show a high degree of positive and significant correlation
82

83
coefficient. A possible reason could be short term movement in
prices which may cause high correlation coefficient between
markets.
Table 4.22 Correlation markets and abattoirsAbattoirs
Mariakani Mariakani 0.1857 Kasemeni -0.1860 Vipingo
matrix of prices between distributive
Distributive markets
Bamba Tsangatsini0.2594 0.3425
-0.1420 -0.2529-0.0466
Kinango0.3137
-0.4804
The correlation coefficients between the distributive
markets and Mariakani abattoir are all positive. The rest are
negative and insignificant (Table 4.22). To ascertain these
results, bivariate regression analysis is applied.Table 4.23 shows positive and significant correlation
coefficients of prices between the abattoirs suggesting
integration.
Table 4.23
VipingoMiritiniKasemeniMariakani
Correlation matrix of prices between the abattoirs Vipingo Miritini Kasemeni Mariakani1. 0 000.5690**0.6661**0.6602**
1.00000.6764**0.70002**
** significant at a=.0011.00000.8777** 1.000
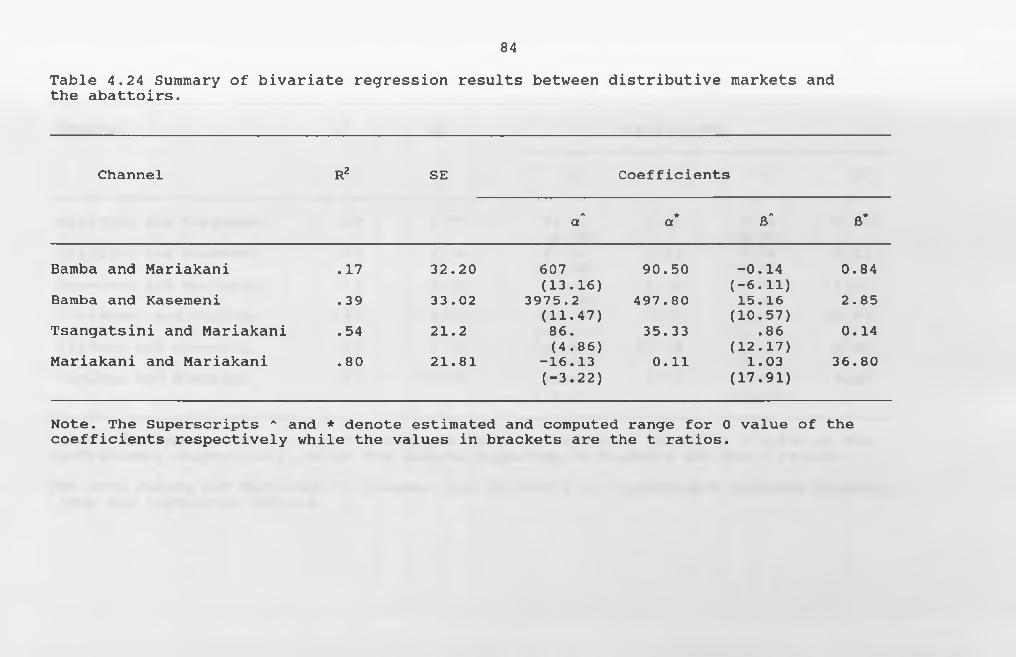
84
Table 4.24 Summary of the abattoirs.
bivariate regression results between distributive markets and
Channel R2 SE Coefficients
A * M A ~ * a a R 6
Bamba and Mariakani . 17 32.20 607(13.16)
90.50 -0.14(-6.11)
0.84Bamba and Kasemeni . 39 33.02 3975.2
(11.47)497.80 15.16
(10.57)2.85
Tsangatsini and Mariakani .54 21.2 86.(4.86)
35.33 .86(12.17)
0.14Mariakani and Mariakani .80 21.81 -16.13
(-3.22)0.11 1.03
(17.91)36.80
Note. The Superscripts A and * denote estimated and computed range for 0 value of the coefficients respectively while the values in brackets are the t ratios.
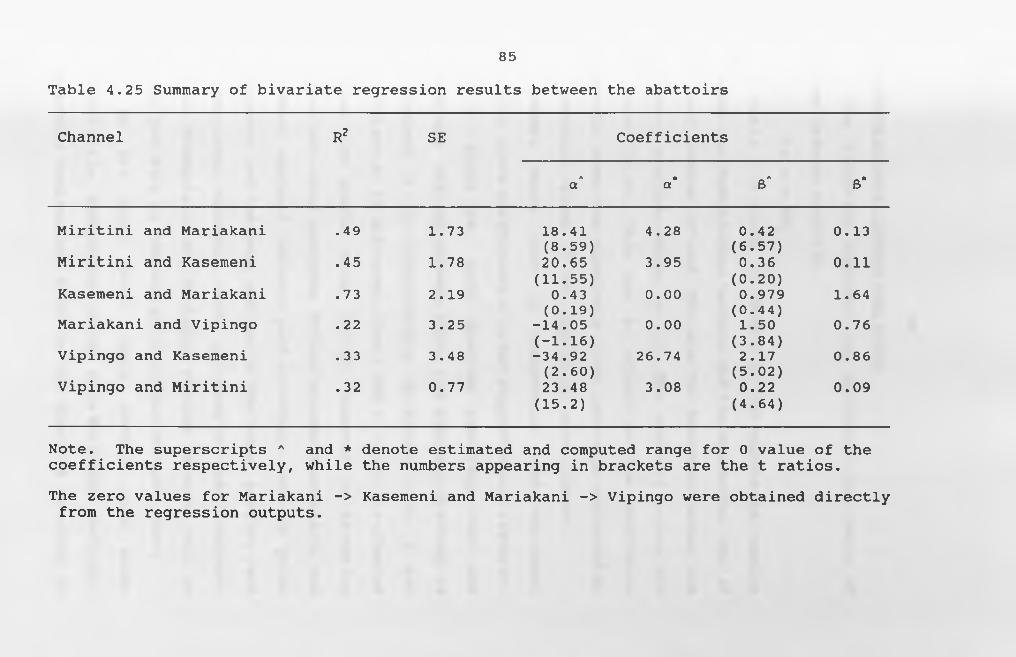
85
Table 4.25 Summary of bivariate regression results between the abattoirs
Channel R2 SE
Aa
Coefficients
*a b a B*
Miritini and Mariakani .49 1.73 18.41 4.28 0.42 0.13(8.59) (6.57)
Miritini and Kasemeni .45 1.78 20.65 3.95 0.36 0.11(11.55) (0.20)
Kasemeni and Mariakani .73 2.19 0.43 0.00 0.979 1.64(0.19) (0.44)
Mariakani and Vipingo .22 3.25 -14.05 0.00 1.50 0.76(-1.16) (3.84)
Vipingo and Kasemeni .33 3.48 -34.92 26.74 2.17 0.86(2.60) (5.02)
Vipingo and Miritini .32 0.77 23.48 3.08 0.22 0.09(15.2) (4.64)
Note. The superscripts A and * denote estimated and computed range for 0 value of the coefficients respectively, while the numbers appearing in brackets are the t ratios.The zero values for Mariakani -> Kasemeni and Mariakani -> Vipingo were obtained directly from the regression outputs.

86
Bivariate(simple) regression modelThe following function was estimated for pairs of
prices between markets:
P,= a + BP2.Table 4.24 shows a summary of the regression results
between the distributive markets and the abattoirs. The R2
are low( between .17 and .55) save for Mariakani market and
Mariakani abattoir which is .80. The standard errors are all over 20.00. This has an effect on the confidence intervals hence the relatively large intervals suggested by
the computed values of the regression coefficients.
Bamba shows lack of integration with Mariakani
abattoir since coefficient 6 is not significantly different
from 0. There is both absolute arbitrage cost and
percentage mark up between Bamba and Kasemeni abattoir as
coefficient a is significantly different from 1 and
coefficient /? is different from 0 and 1. This is reflected
in the high profit rates (19.6%) observed in marketing
margins and costs analysis. Prices between Tsangatsini and
Mariakani abattoir indicate pure arbitrage costs in price
difference and the same applies to Mariakani auction yard
and Mariakani abattoir. Price per head of small ruminant
both at Tsangatsini and Mariakani auction yards as well as
prices per kilo at the abattoirs influence each other.
On the other hand, Bamba auction yard shows
statistically independent prices with Mariakani abattoir.
A possible explanation could be the distance involved in

87
movement of animals from Bamba to Mariakani which is 50 km.
This may hinder free flow of market information since most
traders prefer trekking the animals.All the abattoirs are integrated as shown in Table
4.25. Prices between Mariakani, Kasemeni and Vipingo are
statistically identical. The rest of the abattoirs
indicate existence of arbitrage costs which is the cost of
buying from surplus areas and selling to areas of deficit
and percentage mark up. The location of the abattoirs surveyed in this study make flow of price information fast
since they are all located within a radius of 30km from
Mombasa town centre.The market integration analysis suggest an efficient
transmission of market information between the distributive
markets as well as the abattoirs. This could be a sign of
a well developed marketing system. Coupled with the low
marketing margins accruing to the itinerant traders in the
marketing costs and margins analysis, the overall picture
emerging is that of an efficient marketing system.
Marketing is not a constraint to expansion of small
ruminant production in the study area. Production
constraints could be more biological for example health,
nutrition and breeding.
88
CHAPTER FIVE
5. Conclusions and recommendations
5.1 Conclusions
Improvement of market performance of any marketing
system can only be achieved if production goals of the
producers make it feasible. In this study, two aspects of market performance have been diagnosed: technical
efficiency and pricing efficiency. Technical efficiency
is attained when least cost combination of marketing activities are employed thereby leading to provision of
goods and services at minimum average cost. Free flow of
price information along the marketing chain coupled with
market participants' ability to adjust to the changing
prices results in pricing efficiency.The analysis of marketing costs and margins shows
that the returns to traders' capital and labour investment
at all channel levels studied are less than the prevailing
bank interest rates. The low returns to middlemen of
marketing is an indicator of a relatively competitive
marketing system. Since the middlemen's objective is
profit maximization, it is possible that high turnover
rates allow them to remain in business.
It could be argued that improvement of supply
volumes from the study area is possible by substituting
trekking with trucking especially from the distributive
markets. But investment in trucks for transporting stock
from the production and distributive areas could as well be

89
unjustified on the basis of high capital outlays. Flock
sizes are small. Sales levels, apart from being low are also erratic. The average household sales in the previous
year was two animals. Assemblers therefore take a long time
to assemble a flock for the distributive markets.
Producers in the study area mainly keep small
ruminants for sale to meet seasonal cash needs. The sale for cash need motive to meet subsistence needs has
implications for market intervention by limiting
opportunities to improve offtake rates. However, the earlier assumption that the offtake rates in the study area
are low is not true since the commercial offtake rates are
close to 30 per cent. Although mature males comprise 10
per cent of the flocks, their offtake rates are the
highest among the different sex and age groups. They also
fetch the highest price in the market. The preference of
males to females for sale confirms Jarvis' contention that
sale for cash need does not imply lack of market
orientation. Producers respond to price signals but lack of
alternative investment opportunities make small ruminant
enterprise an insurance to the farm family. Other socio
cultural roles of small ruminants though important, are
secondary to the sale for cash need motive. Technical
inefficiency is not a constraint to expanded small ruminant
production and marketing in the study areas.
At the production level, lack of market information
has been shown to exist amongst farmers. Distributive
markets are situated outside agro-ecological zones cl3 and

90
cl4 as shown by the Geographical information systems (GIS)
maps in chapter 3. The situation improves, however, as
the animals move towards the terminal markets in as far as
number of buyers and sellers of small ruminants are
concerned.The price of small ruminant meat was decontrolled in
Kenya in order that market forces could play a greater
role in price determination. It was assumed that by
decontrolling the price of beef and small ruminant meat,
returns to livestock producers would automatically rise. An increasing price trend was observed for small ruminant
meat during the period of study. Apart from an indication
of the general inflationary pressure, the administered
prices before decontrol were possibly below the equilibrium
price. The decontrol is therefore having the desired
effects.
Results also showed existence of integration in price
between the abattoirs. The distributive markets were also
integrated with the abattoirs with the exception of
Kasemeni. This implies an efficient transmission of price
information at these channel levels.
The existing scenario suggests that the Arid and Semi-
arid hinterlands have a comparative advantage in meeting
market demand in terms of quality and quantity.
5.2 RecommendationsThe established auction rings in the study area serve
mainly cattle traders. The one-to-one bargaining system
observed in small ruminant transactions, however, still

91
stifles flow of information as compared to the auction
system. An auction system is therefore recommended at the
distributive markets. The government could improve the
system by setting up the auction rings. The animals could
be auctioned in flocks rather than singly to reduce any
increased cost of marketing that may arise. This would
also save time.
When small ruminants are slaughtered in the abattoirs,
there are tripe and the skin which are joint products with
meat. From the marketing margins and marketing costs
analysis, it appears that the profit for the middleman who slaughters his animals in the abattoirs comes from these
by-products. A study of the marketing system of skins for
example would reveal whether a constraint in skins
marketing results in reduced sales from the study area.
This is an area which is alleged to be dominated by few
traders and where the price setting mechanism is not
clearly understood. It is possible that with improved
prices of goat and sheep skins, returns to producers would
also increase.As a methodology, bivariate regression provided
results consistent with traders observations in all the
cases. Price correlation coefficients showed lack of
integration between the abattoirs and the distributive
markets. For future studies, a model incorporating a
vector of other significant market determinants is
suggested since it would give more conclusive results about
market integration. In addition price series covering a
92
longer period is desirable for a more detailed analysis of
market integration.
Finally, although it is not quantitativelydemonstrated that Gala goats are preferred to the Small
East African goat, other studies have indicated that animal
characteristics such as body condition, sex, and age
influence price per head (see Francis et al 1988 Chabari
1986, Kebede 1990). Being bigger, Gala goats are
therefore preferred by retailers of small ruminant meat. A breeding program for improvement of dressing out weights
of sheep and goats could result in higher returns to producers. Animal health and husbandry research on ways and
means of reducing mortality of the young goats and the Gala
should be conducted. This could increase the relative
competitiveness of small ruminant enterprise in the coastal
region. In addition, a comparative study on whether the
Gala goats are preferred to Small East African goats should
be conducted.

93
Bibliography
Abbott, J.C. (1958). Marketing problems andimprovement programs. FAO marketing guide No. 9 Rome.
Abbott, J.C. (1967). The role of marketing in the development of backward agricultural economies. In: Miller, C.J.(ed). marketing and economic development reading in agribusiness research. University of Nebraska press, Lincoln.
Ackello-Ogutu (1976). The marketing of poultry meat and eggs in Nairobi. An MSc. thesis, University of Nairobi.
Amir, P (1988) . Economics of goat meat production in small ruminant production systems in South and South-East Asia. Proceedings of a workshop held in Tando Jam Pakistan. 13-18th March, 1988. IDRC Proceedings Series.
Amir, P and Knipscheer, H.C. (1987). A conceptual framework for economic analysis of on-farm trials with small ruminants. In small ruminants production systems in South and South-East Asia. Proceeding of a workshop held in Bozor, Indonesia 6-10 October, 1986. IDRC Proceedings Series.
Anteneh, A (1982). Production objectives and marketforces. In: small ruminant breed productivity inAfrica, proceedings of a seminar held at ILCA, Addis Abeba, Ethiopia in October 1982.
Bekure, S., Evangelou P. and Chabari F. (1982). Livestock marketing in Eastern Kajiado, Kenya. ILCA Working Document No. 26,Nairobi, Kenya.
Bressler, R.G. and King, R.A.(1970). Market, prices and international trade. John Willey and Sons, New York.
Carles, A.B (1982). Sheep production in the tropics.English language Book society. Oxford University Press, pp 51.
Chabari, F (1986). The marketing of sheep and goats from two pastoral systems in Kenya. An MSc. thesis, University of Nairobi.
Chaturvedi, J.N. (1959), The theory of marketing in underdeveloped economies.

94
Devendra, C. (1986). Small ruminant production systems. In: Small ruminant production systems in South and South-East Asia. Proceedings of a workshop held in Bozor, Indonesia 6-10 October, 1986. IDRC Proceedings Series.
Devendra, C. (1988). Goat production in small farm systems. In: Research and development in the near east. Proceedings of a workshop held in Cairo, Egypt. 2-4th November, 1988
Delgaldo, C.L. (1986). A variance components approach to food grain market integration in Northern Nigeria. American Journal of Agricultural Economics. Vol 68 No 4 pp970-979.
Dittoh, S. (1992). The marketing of irrigated crops inNigeria. Intermediate research report covering the period November 1991-July 1992. An African RuralSocial Sciences Research Network (ARSSRN) Publication. August 1992.
Doran, M.H., A.R.C Low, R.L. Kemp.(1979) Cattle as a store of wealth in Swaziland. Implications for Livestock Development and Overgrazing in Eastern and Southern Africa. American Journal of Agricultural Economics.Vol 1 No 61 PP 42-47.
Evangelou, P. (1984), Cattle marketing efficiency inKenya's Maasailand. In: Simpson, J.R. and PhyloEvangelou (ed). Livestock development in Sab-Saharan Africa: Constraints, prospects, policy. Westviewpress, Boulder, Calorado.
Fitzhugh, H. (1985). Systems approach to small ruminant research and development. In: small ruminants in the near east. Vol 1. Selected papers prepared forexpert consultation group on small ruminants. 23-27 October, 1985. Tunis, Tunisia.
Francis, P.A., S.A. Ingawa (1988). Small ruminant marketing in south-west Nigeria. In: Proceedings of the workshop on improvement of Small Ruminants in West and Central Africa. IBADAN, Nigeria. 21-25 November, 1988. An OAU Publication.
French, B.S (1967), The food marketing commission andmarketing efficiency. Journal of Farm Economics Vol. 49 pp. 425-434.
Guituerez, N (1985). Economic constraints in goatand sheep production in developing countries in small ruminants in the near east. Vol. 1 Selected papers prepared for expert consultation group on small ruminants. > 23-27 October 1985, Tunis, Tunisia.
95
Guituerez N (1985). Economic constraints in goatand sheep production in developing countries in small ruminants in the near east. Vol. 1 Selected papers prepared for expert consultation group on small ruminants. 23-27 October 1985, Tunis, Tunisia.
Harris; B. (1979). There is method in my madness or is it vice versa measuring Agricultural market performance. Food Research Institute Studies 27 pp97-218.
Holtzman, J.S (1986), Rapid Reconnaissance Guidelines for Agricultural marketing and Food Systems Research in Developing Countries. Michigan State University International Development paper. Working paper No. 3Michigan.
International Livestock Centre for Africa (ILCA) (1985). Maasai livestock production systems. ILCA, Kenya Rangelands Programme, Nairobi, Kenya.
ILCA Small Ruminant Production in the Africa. ILCA Bulletin No. 7 Addis Ababa, Ethiopia.
ILCA (1986a). Economic trends, demand for meat and dairy products. ILCA Bulletin No. 10. Addis AbabaEthiopia.
ILCA (1986b). Small Ruminant Production in TropicalAfrica. ILCA Bulletin No. 25.
ILCA, Livestock policy Analysis Manual 1989 PP 157-177ILCA Annual Scientific report 1990 Economics of small
ruminant productions marketing and demand studies: patterns in Sub-saharan Africa Draft.
ILCA Annual programme review meeting 1991. Economics of small ruminant meet productions and Consumption in Sub-Saharan Africa.
1 BOB.Working paper 1 Livestock systems research manualJaetzold, R. and Schmidt H. (1983). Farm Management
Handbook of Kenya Vol. 11, 1983.
Jarvis, L.S.(1980). Cattle as a store of wealth inSwaziland: Comment. American Journal of Agricultural Economics Vol 62 No.3 1980.
jarvis, L.S. (1986). Supply response in the cattle industry: The Argentine Case.
Jones, W.0.(1968). The Structure of Stapl in Nigeria as Revealed by Price Research Institute Studies Vol 8 No.2
e Food Marketing Analysis. Food pp.95-123.
96
Kebede, A. (1990). Sheep Marketing in the central highland of Ethiopia. A thesis presented to the school of graduate studies Alemaya University of Agriculture in partial fulfilment of the requirements for a Msc. degree in Agricultural Economics.
Kenya, Government of*(1986). Sessional Paper No. 1. Economic Management for Renewed Growth.
Kenya, Government of (1989). Annual Report. Ministry of Livestock Development. Coast Province, Kenya.
Kenya, Government of (1989). Kilifi District Development Plan.
Kenya, Government of (1989). Kwale District Development Plan.
Kenya, Government of (1991). Economic Survey.
Monke, E., T. Petzel (1984). Market Integration. Anapproach to International trade in cotton American Journal of Agricultural Economics Vol 66 No.4 pp 481- 487.
Low, A.R.C., R.L. Kemp, M.H. Doran (1980). Cattle Wealth and Cash Needs in Swaziland: Price response and RuralDevelopment implications. Journal of Agricultural Economics. Vol. 31, 1980.
Low, A.R.C., R.L. Kemp, M.H. Doran (1980) Cattle as a store of wealth in Swaziland Reply. American Journal of Agricultural Economics Vol 61, 1980.
Nyikal,R.A. An evaluation of institutional credit and its role in agricultural production in Kisii District. MSc. thesis university of Nairobi 1990.
Qureshi, A.W. (1988). Goat meat marketing in the NearEast. In: Economics of goat meat production. Winrock International 1988.
Ravallion M. (1985). The Performance of Rice Markets in Bangladesh. The Economic Journal Vol 92 pp.15-29.
Reynolds, L. Otieno, L and Mbutiti M. (eds). Sheep andgoat production in Coast Province, proceedings of a seminar held at Whispering Palms Hotel Mombasa, Kenya (1991) .
Ruttan, V.W. (1969). Agricultural product and factor markets in south-east Asia. In: Anschel, K.R, Russel. H, Brannon and Eldon,d.(eds). Agricultural cooperatives and markets in developing countries. F.A. Praeger publishers, New York.

97
H, Brannon and Eldon,d.(eds). Agriculturalcooperatives and markets in developing countries. F.A. Praeger publishers, New York.
Speeding, C.R.W. and Solinam, I. (1988) . Some economic aspects of small ruminant production in the near east countries. In: Proceedings of workshop held in Cairo, Egypt 2-4 November, 1988. IDRC Proceeding Series.
Spiegel, R.M. (1970). Theory and problems ofstatistics. Schaum's outline series. pp241-282. McGraw-Hill book company.
Staatz, J. (1980) . The economics of cattle and meat marketing in Ivory Coast. Discussion paper No. 86. Centre for research on economic development, the university of Michigan.
Thorpe, Nyambaka, Rugema, Chabari, Ole Maki (1990) . Small Ruminants in the farming systems of the coastal Kenya. Kaloleni Cattle Census Results, 1990.
Upton, M., and C. Okali (1984). The market potential for increased small ruminant production in south-west Nigeria. In: Sheep and Goats in Humid West Africa. Proceedings of the workshop on small ruminant production systems in humid West African held in IBADAN, Nigeria 23-26 January, 1984. ILCA, Addis Ababa, Ethiopia.

APPENIX 1LIVESTOCK MARKETING
QUESTIONNAIRE FOR SMALL RUMINANT SALES IN RURAL, MARKETS AND URBANMARKETS
Enumerator ................................ Date....
Name of Respondent........................ Market..
Area of Residence......................... District(Village)
1. How long have you been a trader?
(a) Less than 6 months (b) 6 months to 1 year (c) Over 1 year
2. Do you have business associates and if so how many ...........
3. Do you have other occupations, kinds of work?.................
4. How many days in a week do you spend in livestock trade(buying, selling, butchering etc)?............................
5. Are there certain times/months of the year when your trading activity increases/decreases?
Jan Feb Mar Apr May Jun Jul Aug Sep Oct Nov Dec
High :(Increases)
Low :(Decreases)
6.What type of livestock (cattle/small stock) do you mainly tirade? ............... Cattle ................ small stock.
Why......................................................
7.what type of small stock do you buy at this market?
Sheep goats

8. At what other markets do you call livestock?Market Types of livestock
9. Any other places where you sell livestock?.....................
10. What is the maximum/minimum number sold in one day in 1990 at this market?
Maximum ...........................................
Minimum ...........................................
Average ...........................................
11. What type of livestock have you purchased today?
Type of • Breed . ' No. Sexlivestock
12. To where and how will you transport them?
Immediate Final Mode of own/hired Estimated costdestination destination transport per head(KShs.)
Price per head(KShs.)
i

13. Do particular breeds/sex/type of sheep/goats fetch higher prices? ...........
If so, which ones?
Breed Sex Colour Body condition
14. As a trader what characteristics do you look for when buying an animal?
15. How do you dispose of each type of livestock you buy?
16. Do you process them in any way before disposing of them?
If so, how?
17. If resold, to whom and in what form do you resell?
Market outlet Place No or Price/head/kg Frequency Form (name) Kg sold KSh.(F/V) D/W/M

18. What expenses do you incur in relation to marketing?Expense
la) Transportation of self(l return trip)
(b) Transportation of assistants(1 return trip)
(c) Food and drinks expenses (1 return trip)
(d) Lodging expenses 1 return trip
(e) Taxes (paid per head)
(f) Dipping fees
(g) Slaughter fees(h) Meat inspection fees
( i ) Others (specify)
19. What investments have livestock trade?
Item
Truck for live animals
Butchery
Holding yard
Abattoir
Meat delivery van
Distance travelled/day
Others (specify) ....
you made in connection
Year
make .... ......
location .............
location ...... ......
location ...... ......
make •••••• ••••••
Cost(KShs.)
with your
ValueKShs.
If van or truck

20. On average what losses do you incur in the course of marketing (deaths/thefts/injuries)
Type of livestock Avg lost Causes Estimate value
21. We have observed that although there are many households keeping small ruminants, few are actually selling them. In your opinion, why is this?
22. In your opinion is there any one person or group of people whodominate the buying and selling of small stock at this marketi.e. the small animals market is not operatingfreely?...................
If yes, who? ............................................
23. In your opinion, how might the marketing system be changed for the better i.e. to make the smallstock marketing more attractive for you as a trader?
24. What problems do you in particular face as a trader? e.g. (capital/low selling prices/high taxes/high losses/high buying prices)?
Problem Time of the year encountered

APPENDIX 2
PRODUCER PRODUCTION OBJECTIVE AND MARKETING STRATEGY
ENUMERATOR.....................................DATE...........
RESPONDENT................................. LOCATION..........
DIVISION................................... VILLAGE............
FORM NO............ DISTRICT..............HOUSEHOLD HEAD.....
Size of Farms (ACRES) (1)..... (2)...... (3)...... (4)...... (5)
1. Position in the household ( Husband/wif e/child )..........
2. No. of wives resident in the household (total)..........
belonging to head of household.......... others..........
3. No. of children resident in the household...............
4. Religious festivals observed in the household...........
(a) ...........................................................
( b ) ...................................................................................................................................................................................................................................................................
( c ) ...........................................................................................................................................................
( d ) ..................................................................................................................................................................................................
5. What are the main crops grown on your farm(s)?
Crop Hectarage total yield/ Valueseason •• (KShs . )
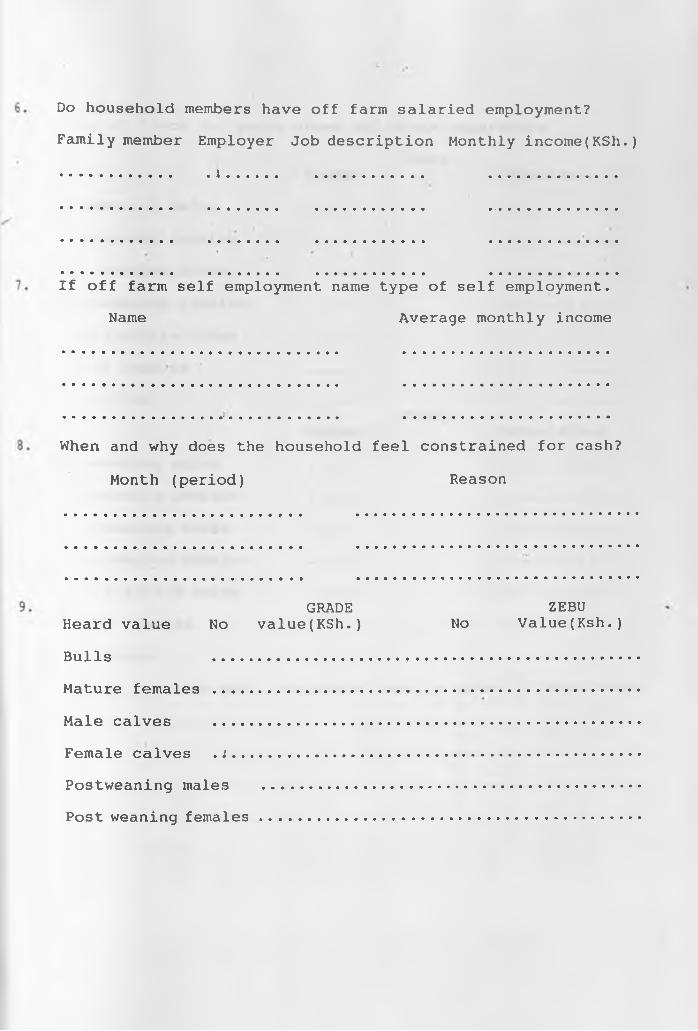
Do household members have off farm salaried employment?
Family member Employer Job description Monthly income(KSh.)
.................1....................... ..............
If off farm self employment name type of self employment.
Name Average monthly income
When and why does the household feel constrained for cash?
Month (period) Reason
GRADE ZEBUHeard value No value(KSh.) No Value(Ksh.)
Bulls ..............................................
Mature females ..............................................
Male calves ..............................................
Female calves . ..............................................
Postweaning males .........................................
Post weaning females .........................................
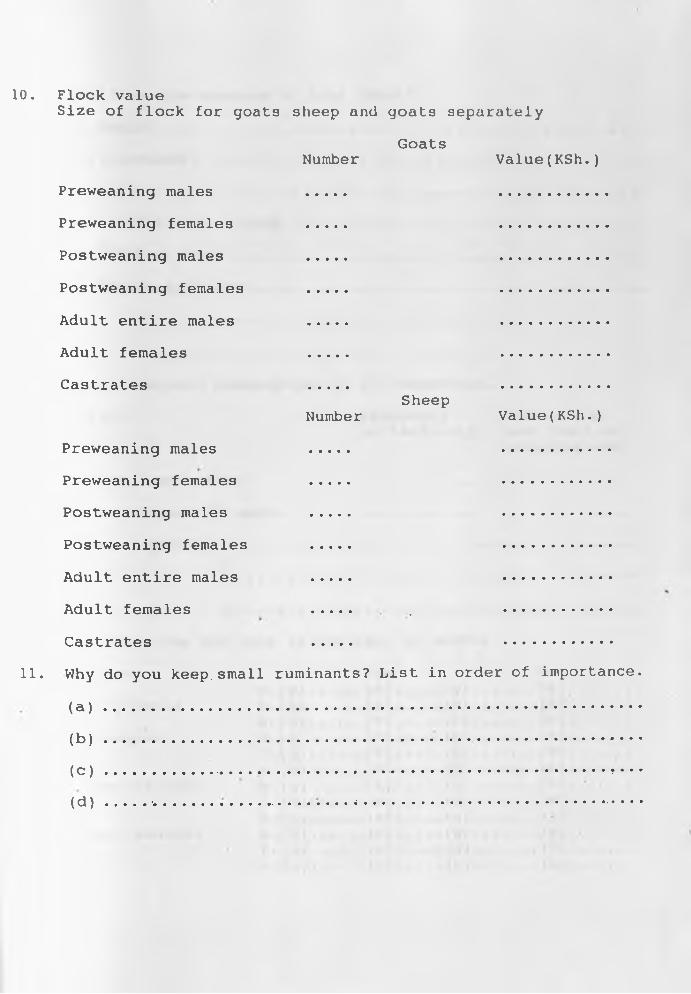
10. Flock valueSize of flock for goats sheep and goats separately
GoatsNumber Value(KSh.)
Preweaning males .... ............
Preweaning females .... ............
Postweaning males .... ............
Postweaning females .... ............
Adult entire males .... ............
Adult females .... ............
Castrates .... ............Sheep
Number Value(KSh.)
Preweaning males .... ............
Preweaning females .... ............
Postweaning males .... ............
Postweaning females .... ............
Adult entire males .... ............
Adult females .... . ............
Castrates .... ............11. Why do you keep.small ruminants? List in order of importance.
( a ) ..................................................................................... .......................................... ....................
( b ) ...............................................................
(c) ............................... ..................... .
( d ) ........ .................................. .. ....................................................... .......

12. What were the sources of this stock?(a) Bought............ .
(b) Inherited.........
(c) Gift ..............
(d) Loaned from outside
(e) Paid as dowry ....
(f) Others (specify)...
13. Small ruminant consumption in the household.
Period Frequency Source e.g.or festivity own flock or
retailer etc.
During festivities ..............................
Normal household meals ............ .............
Others specify ..............................................
14. Offtake from the farm in the past 12 months
Reason age Nom.(g)... ...(s)...,..(g)...,--- (s) .
Slaughtered f.(g)... . . . (s) . . .,..(g)------ (s) .c.(g)... . . . (s) . . ....(g)---. . . . (s).
Exchanges m.(g)... . . . (s) . . ....(g)------ (s ) .f.(g)... . . . (s) . . ....(g)------ (s) .c.(g)... . . . (s) . . ,...(g)------ (s) .
Given as gift m.(g)... ...(S).., ...(g)... --- (s ) .f.(g)... . . . (s) . ....(g)... --- (s) .c.(g)... . . . ( S ) . . ...(g)... --- (s) .
Other Reasons m.(g)•.• . . . (s) . ....(g)... --- (s) .f.(g)... . . . (s) . ....(g)... --- (s) .c.(g)... .. . (s) . ....(g)... --- (s) .
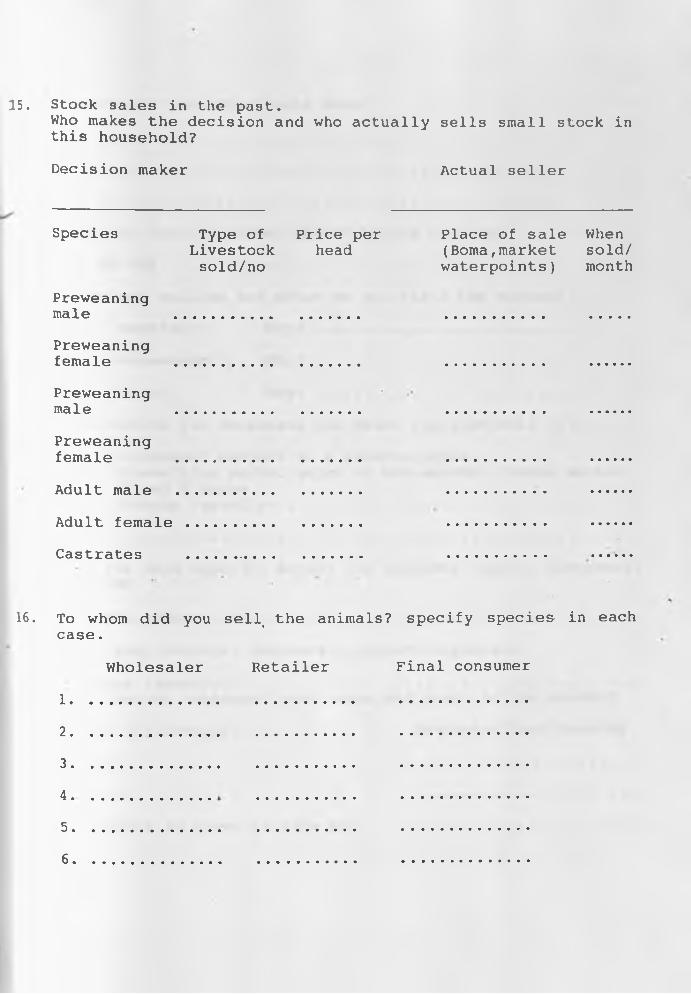
15. Stock sales in the past.Who makes the decision and who actually sells small stock in this household?
Decision maker Actual seller
Species Type of Price per Place of sale WhenLivestock head (Boma,market sold/sold/no waterpoints) month
Preweaningmale ..................... ........... ....
Preweaningfemale ..................... ........... ....
Preweaningmale ..................... ........... ....
Preweaningfemale ..................... ........... ....
Adult male ..................... ........... ....
Adult f e m a l e .................... ........... ....
Castrates .................... ........... ......
16. To whom did you sell_ the animals? specify species in each case.
Wholesaler Retailer Final consumer
1.
2.3.
4. -
5.
6.
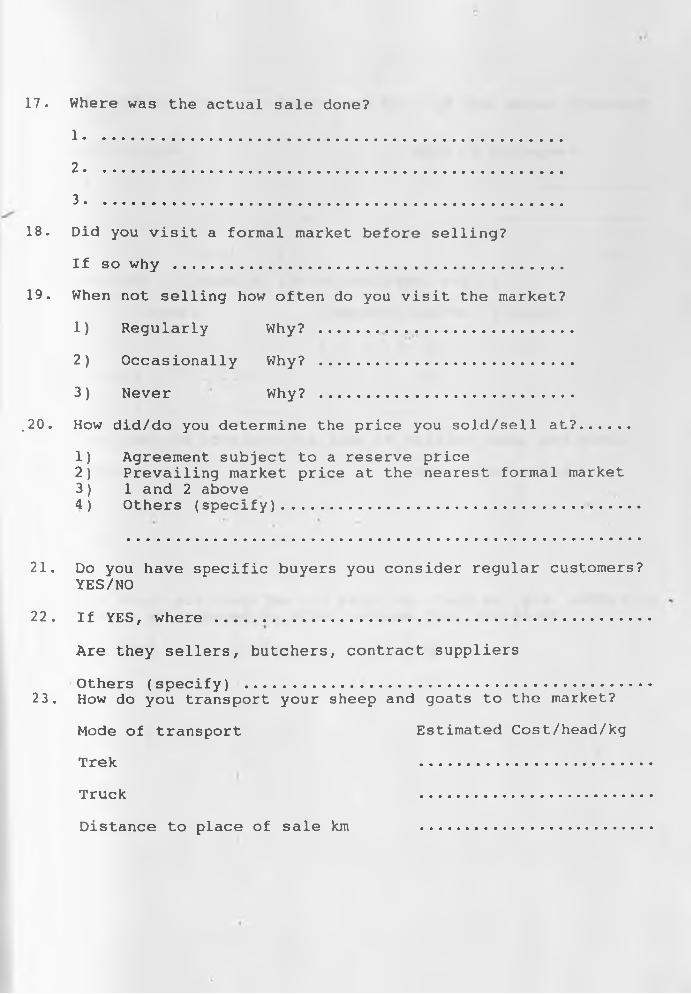
17. Where was the actual sale done?1......................................................
2 .....................................................................................................................................
3......................................................
18. Did you visit a formal market before selling?
If so why ............................................
19. When not selling how often do you visit the market?
1) Regularly Why? .
2) Occasionally Why? .
3) Never Why? .
,20. How did/do you determine the price you sold/sell at?....
1) Agreement subject to a reserve price2) Prevailing market price at the nearest formal market3) 1 and 2 above4) Others (specify).................................. .
21. Do you have specific buyers you consider regular customers? YES/NO
22. If YES, where .................................................
Are they sellers, butchers, contract suppliers
Others (specify) .............................................23. How do you transport your sheep and goats to the market?
Mode of transport Estimated Cost/head/kg
Trek .........................
Truck .........................
Distance to place of sale km .........................

24. If sold at home, to where and how did the buyer transport them?
Destination Mode of transport
25. How many and when do the buyers/buyer visit?
No. of buyers Frequency/season of visit
26. What are the problems you face in selling sheep and goats?
Problem When experienced
27. How would you describe the existing sheep and goat marketing . system as compared to other systems that you know?
(1) Good (2) Fair (3) Bad
28. -Why?
Related Documents