Economics of Migration Jan Fidrmuc Brunel University

Economics of Migration Jan Fidrmuc Brunel University.
Dec 22, 2015
Welcome message from author
This document is posted to help you gain knowledge. Please leave a comment to let me know what you think about it! Share it to your friends and learn new things together.
Transcript

Economics of Migration
Jan Fidrmuc
Brunel University
Introduction
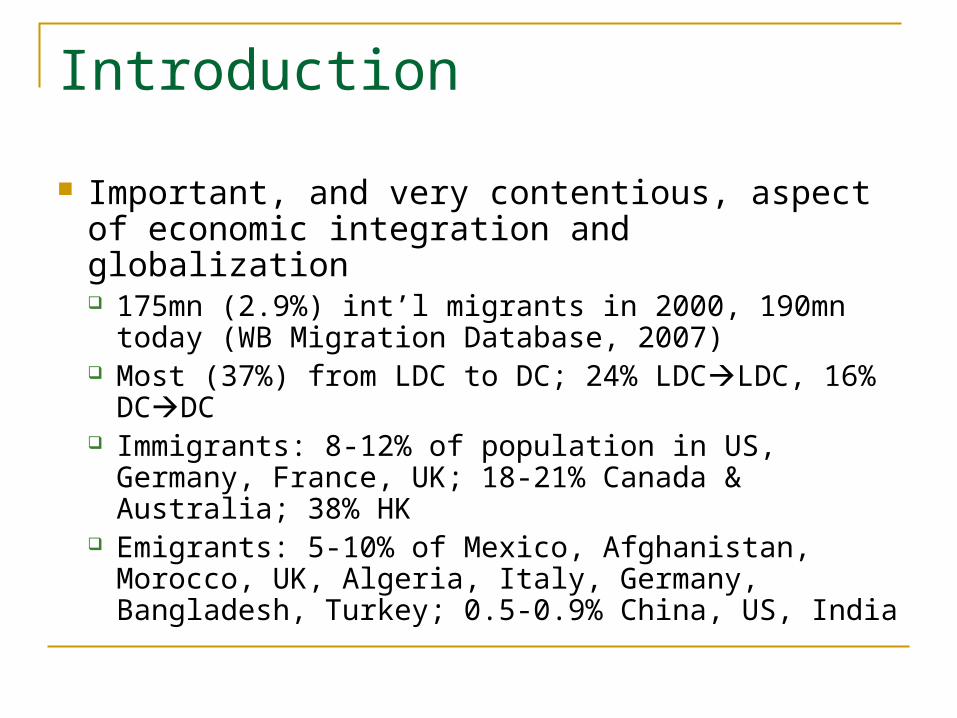
Important, and very contentious, aspect of economic integration and globalization 175mn (2.9%) int’l migrants in 2000, 190mn today
(WB Migration Database, 2007) Most (37%) from LDC to DC; 24% LDCLDC,
16% DCDC Immigrants: 8-12% of population in US, Germany,
France, UK; 18-21% Canada & Australia; 38% HK Emigrants: 5-10% of Mexico, Afghanistan,
Morocco, UK, Algeria, Italy, Germany, Bangladesh, Turkey; 0.5-0.9% China, US, India
Introduction
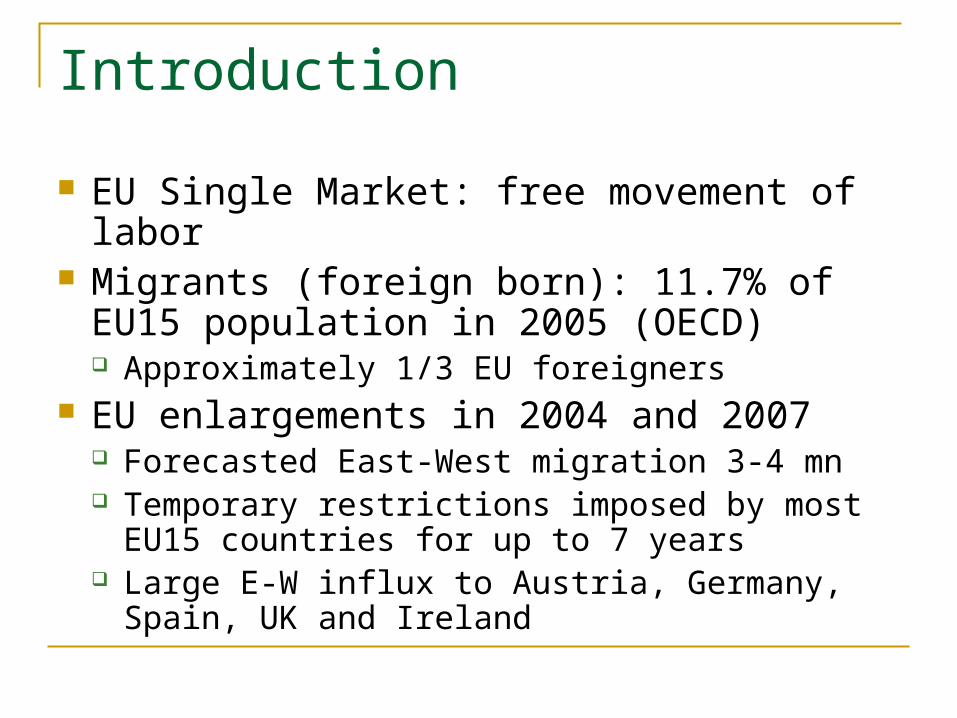
EU Single Market: free movement of labor Migrants (foreign born): 11.7% of EU15
population in 2005 (OECD) Approximately 1/3 EU foreigners
EU enlargements in 2004 and 2007 Forecasted East-West migration 3-4 mn Temporary restrictions imposed by most EU15
countries for up to 7 years Large E-W influx to Austria, Germany, Spain, UK
and Ireland

Outline
1. Introduction2. Models of migration3. Economic Impact of migration: Theory and
evidence4. Brain Drain; Remittances5. Labor-market Performance of Migrants6. Politics of Immigration7. EU Enlargement and East-West Migration 8. Conclusions

Economics of Migration
Most common type of migration: LDC to DC Revealed preference: migrants move iff they
expect to be better off at destination Yet, migrants often suffer occupational
downgrading, end up in poorly-paid informal jobs or remain unemployed
Ex-ante vs ex-post: Harris-Todaro Model Michael P. Todaro, AER 1969; and John R. Harris
and Michael P. Todaro, AER 1970.

Harris-Todaro Model
Original focus: rural-urban migration in LDC Rural residents move to urban regions
despite already high unemployment there Puzzle: migration continues although it
makes (some) rural migrants worse off HT model: migrants motivated by expected
returns Expected returns may be different from actually
realized returns
Harris-Todaro Model
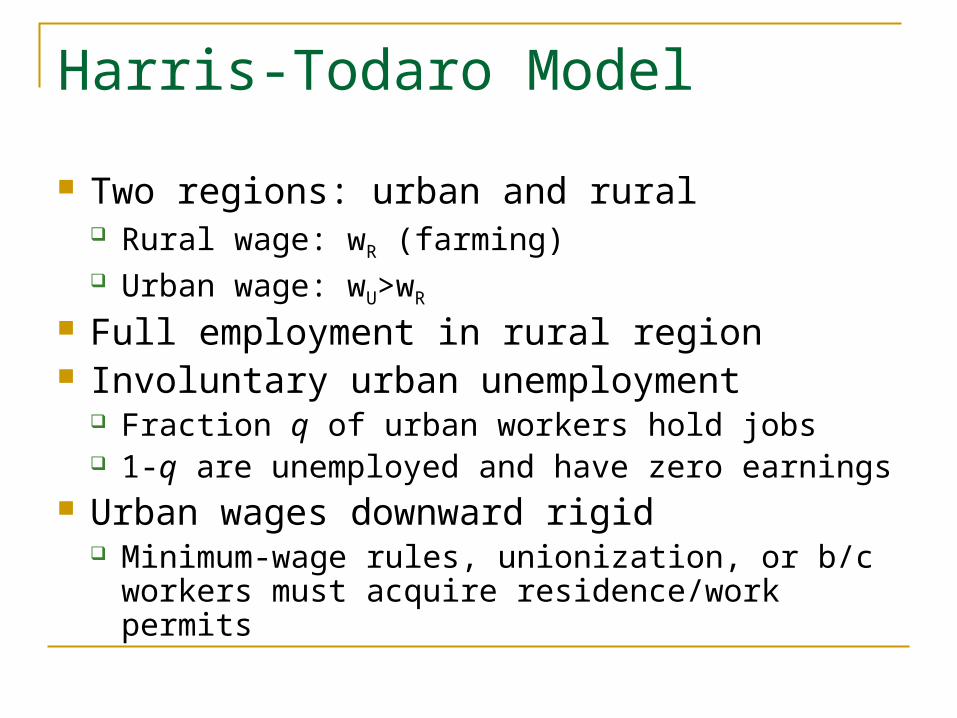
Two regions: urban and rural Rural wage: wR (farming) Urban wage: wU>wR
Full employment in rural region Involuntary urban unemployment
Fraction q of urban workers hold jobs 1-q are unemployed and have zero earnings
Urban wages downward rigid Minimum-wage rules, unionization, or b/c workers
must acquire residence/work permits
Harris-Todaro Model
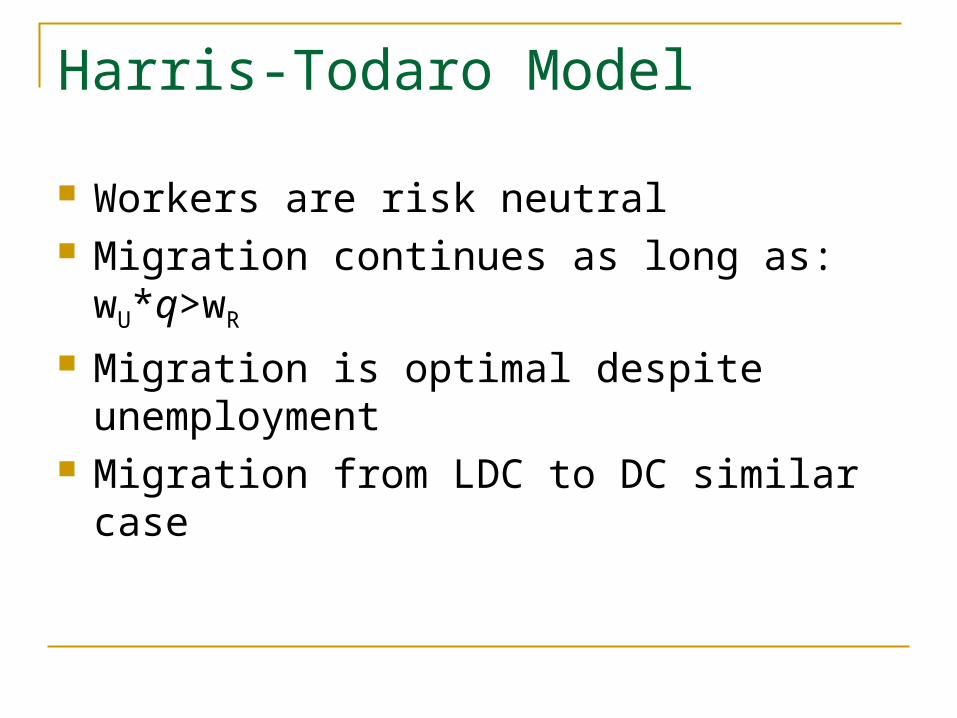
Workers are risk neutral Migration continues as long as: wU*q>wR
Migration is optimal despite unemployment Migration from LDC to DC similar case

Harris-Todaro Model: Implications1. Urban job creation (government spending)
raises q migration more attractive
2. Improving education in rural areas may increase migration if educated rural worker face higher q
3. Rising rural wages reduce incentive to migrate to urban region
However, if migration costly, rising rural incomes may relieve liquidity constraints on migration
Other Models of Migration: Beyond Income Differentials Stark (The Migration of Labor, 1991) Households vulnerable to idiosyncratic
shocks that are region or sector-specific Migration household members exposed to
different regional shocks Risk diversification through pooling of
household members’ income remittances Migration optimal even without income
differentials if individuals risk averse consumption smoothing through risk sharing

Other Models of Migration: Roy-Borjas Model Roy (OEP 1951); Borjas (AER 1987) Consider two countries, A and B
Identical mean earnings Different income distributions: returns to human
capital higher in A Individual returns to migration depend on
one’s skills Skilled workers fare better in A

Other Models of Migration: Roy-Borjas Model Migration patterns:
Skilled migration to A Unskilled migration to B
Returns to human capital important also when mean earnings not identical DC – LDC migrants often highly skilled
professionals and managers
Economics of Migration: Impact Trade theory: free trade, free capital mobility
and free labor mobility should have similar effects on the economy
Yet, migration more controversial than either free trade or capital mobility
Popular view: immigrants displace native workers and/or drive down wages
Is this consistent with theory and evidence?
Economic Impact of Migration: Theory Dustmann et al., EJ 2005; Dustmann et al.,
OxRevEcPol 2008) Two countries: Home and Foreign One output good, price set at world market Two types of labor: skilled and unskilled
Labor supplied inelastically Supply of capital perfectly elastic
Interest rate set at world markets
Economic Impact of Migration: Theory If skill composition of immigration the same
as that of natives No labor-market effect of migration This is because capital supply is elastic Economy adjusts to immigration by importing
capital no change in relative endowments Migrants in DC predominantly unskilled
compete with native unskilled workers only Consider case with only unskilled immigrants
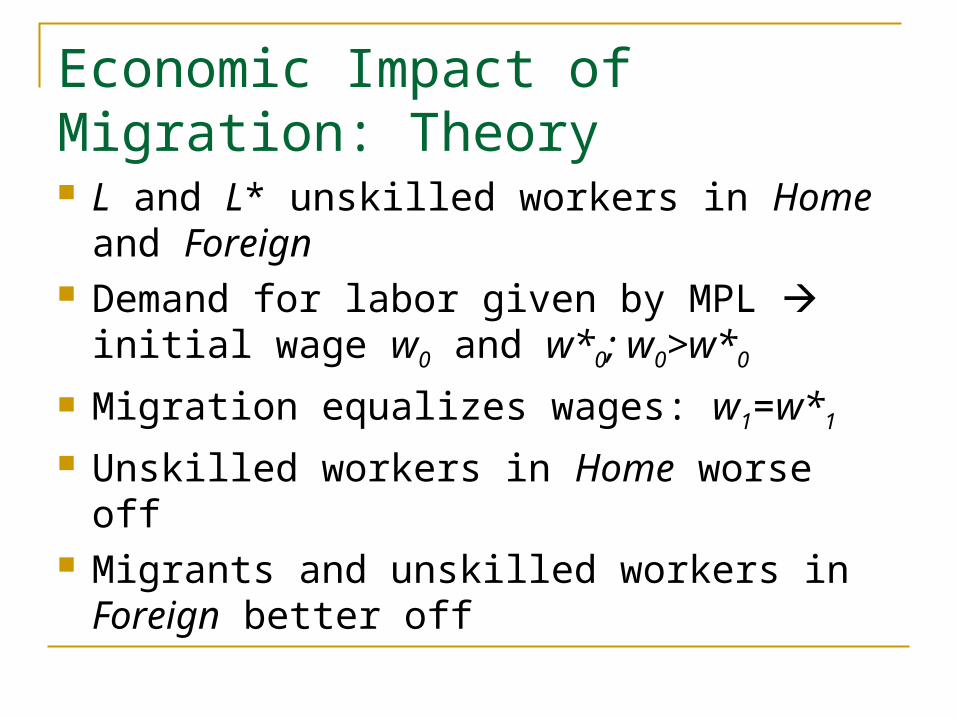
Economic Impact of Migration: Theory L and L* unskilled workers in Home and
Foreign Demand for labor given by MPL initial
wage w0 and w*0; w0>w*0
Migration equalizes wages: w1=w*1 Unskilled workers in Home worse off Migrants and unskilled workers in Foreign
better off

Economic Impact of Migration: Theory
o o*
MPL
MPL*
w0
w*0
w1
L L* L+MM
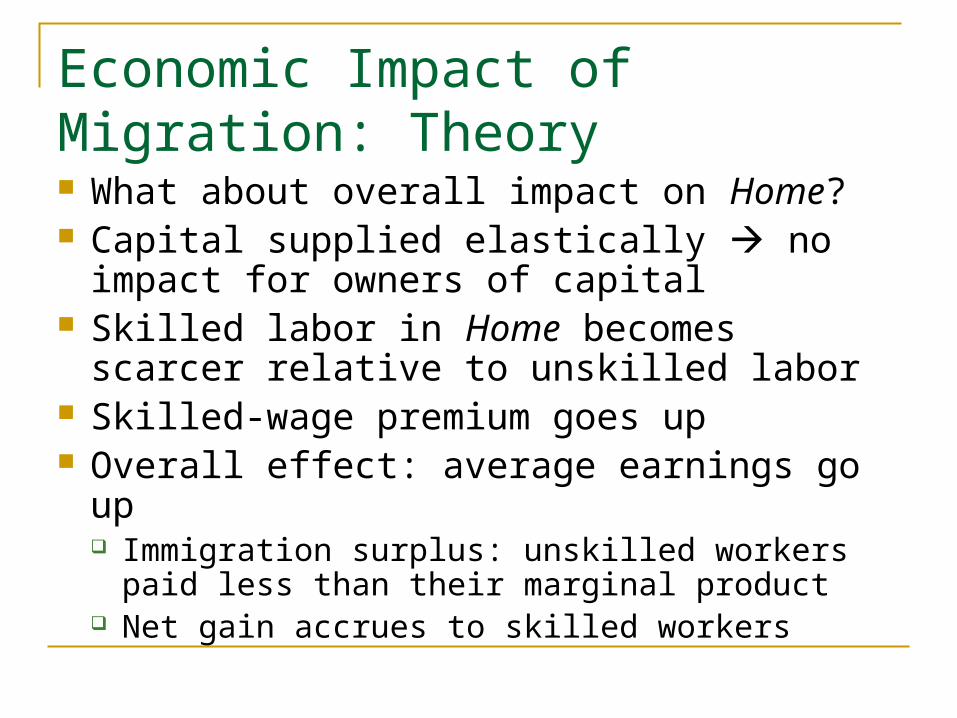
Economic Impact of Migration: Theory What about overall impact on Home? Capital supplied elastically no impact for
owners of capital Skilled labor in Home becomes scarcer
relative to unskilled labor Skilled-wage premium goes up Overall effect: average earnings go up
Immigration surplus: unskilled workers paid less than their marginal product
Net gain accrues to skilled workers

Economic Impact of Migration: Theory
o o*
MPL
MPL*
w0
w*0
w1
L L* L+MM
Immigration surplus
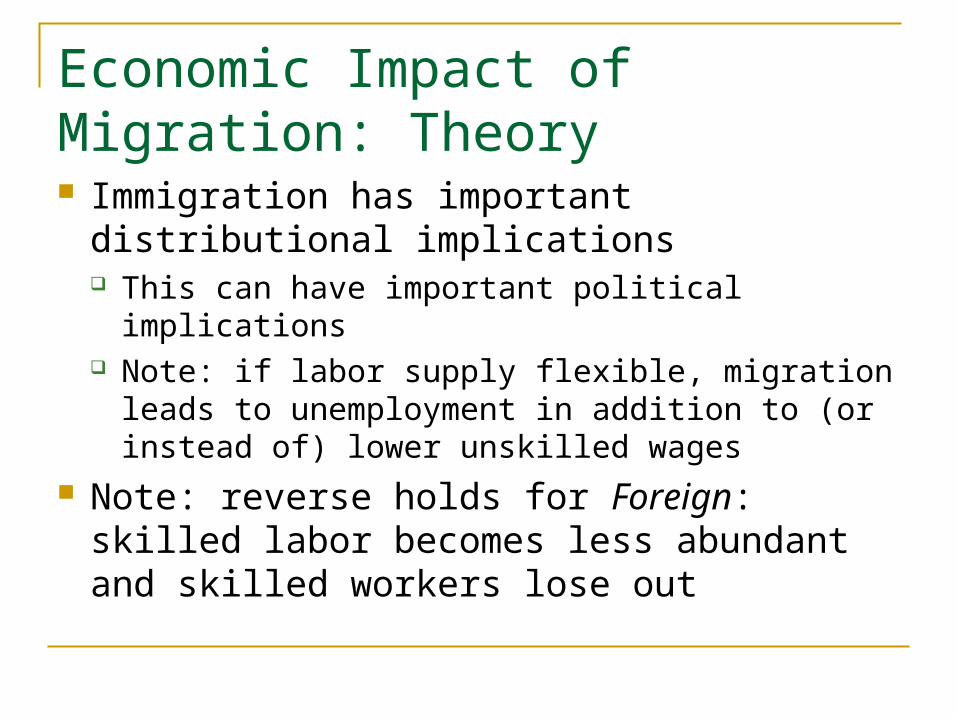
Economic Impact of Migration: Theory Immigration has important distributional
implications This can have important political implications Note: if labor supply flexible, migration leads to
unemployment in addition to (or instead of) lower unskilled wages
Note: reverse holds for Foreign: skilled labor becomes less abundant and skilled workers lose out
Economic Impact of Migration:
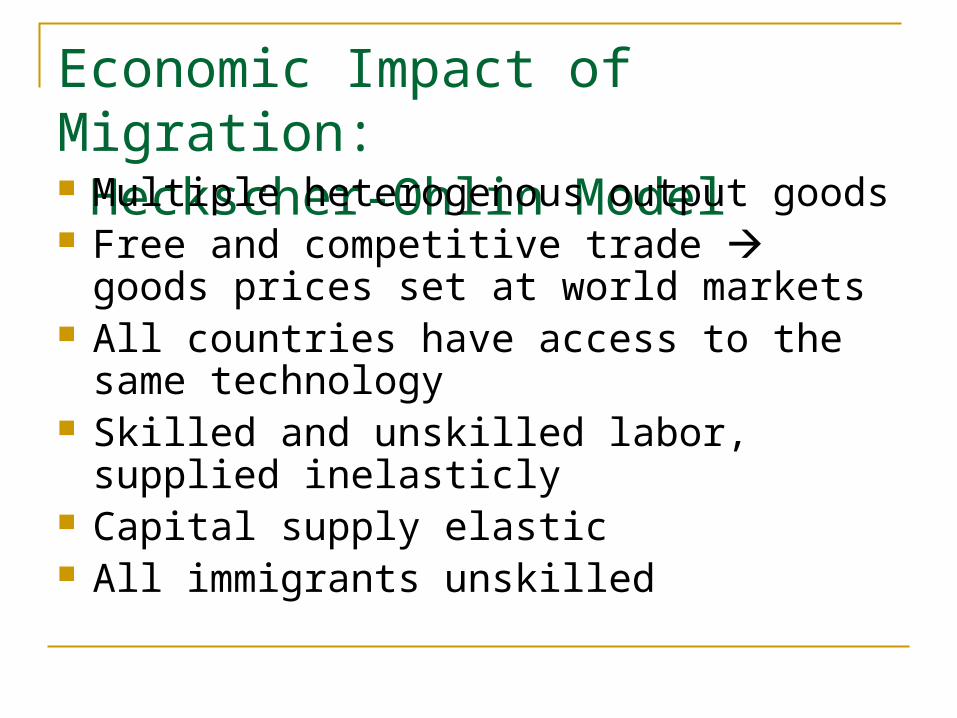
Heckscher-Ohlin Model Multiple heterogenous output goods Free and competitive trade goods prices
set at world markets All countries have access to the same
technology Skilled and unskilled labor, supplied
inelasticly Capital supply elastic All immigrants unskilled
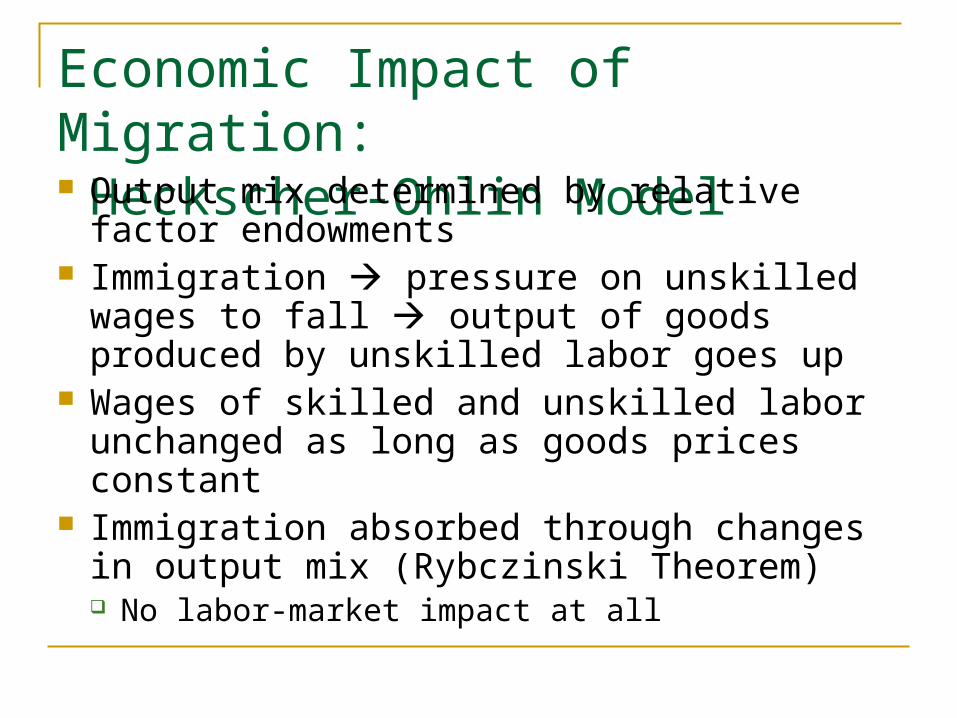
Economic Impact of Migration:
Heckscher-Ohlin Model Output mix determined by relative factor endowments
Immigration pressure on unskilled wages to fall output of goods produced by unskilled labor goes up
Wages of skilled and unskilled labor unchanged as long as goods prices constant
Immigration absorbed through changes in output mix (Rybczinski Theorem) No labor-market impact at all
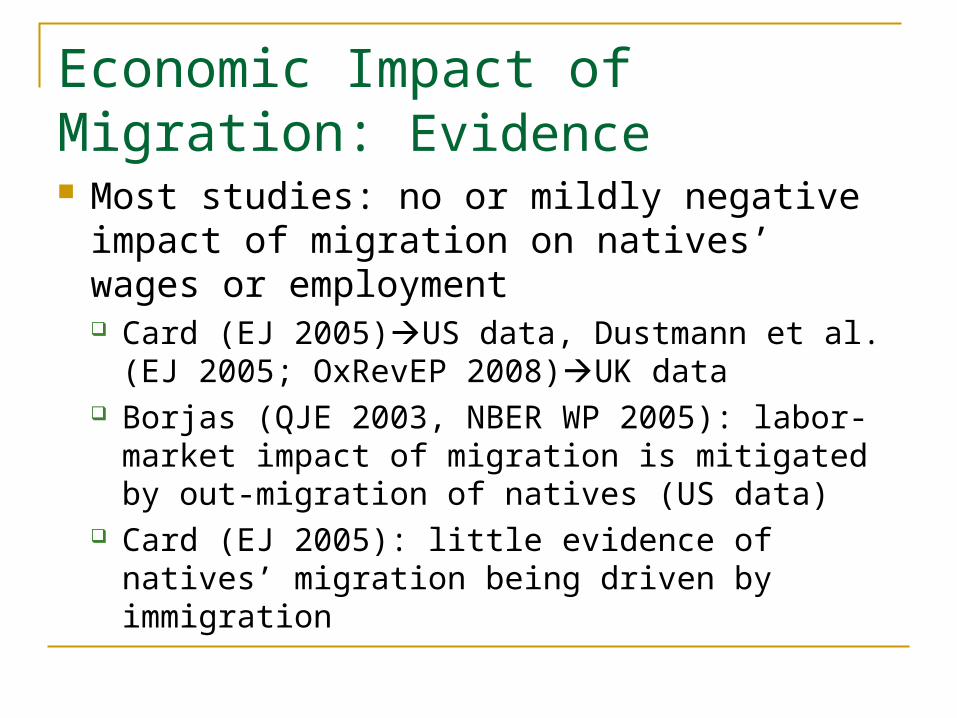
Economic Impact of Migration: Evidence Most studies: no or mildly negative impact of
migration on natives’ wages or employment Card (EJ 2005)US data, Dustmann et al. (EJ
2005; OxRevEP 2008)UK data Borjas (QJE 2003, NBER WP 2005): labor-market
impact of migration is mitigated by out-migration of natives (US data)
Card (EJ 2005): little evidence of natives’ migration being driven by immigration
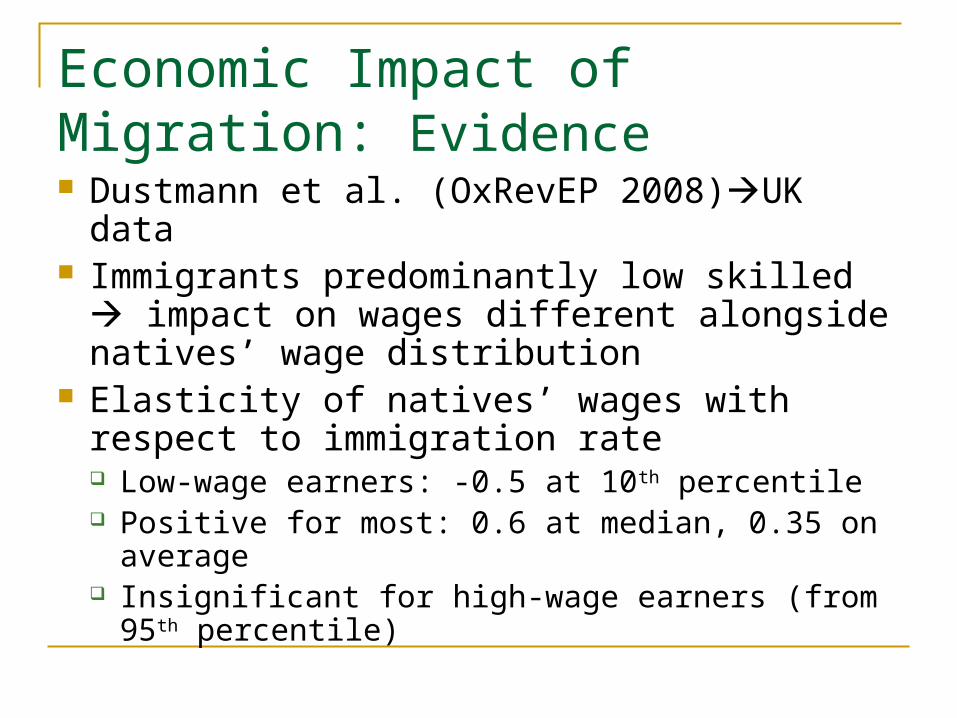
Economic Impact of Migration: Evidence Dustmann et al. (OxRevEP 2008)UK data Immigrants predominantly low skilled
impact on wages different alongside natives’ wage distribution
Elasticity of natives’ wages with respect to immigration rate Low-wage earners: -0.5 at 10th percentile Positive for most: 0.6 at median, 0.35 on average Insignificant for high-wage earners (from 95th
percentile)
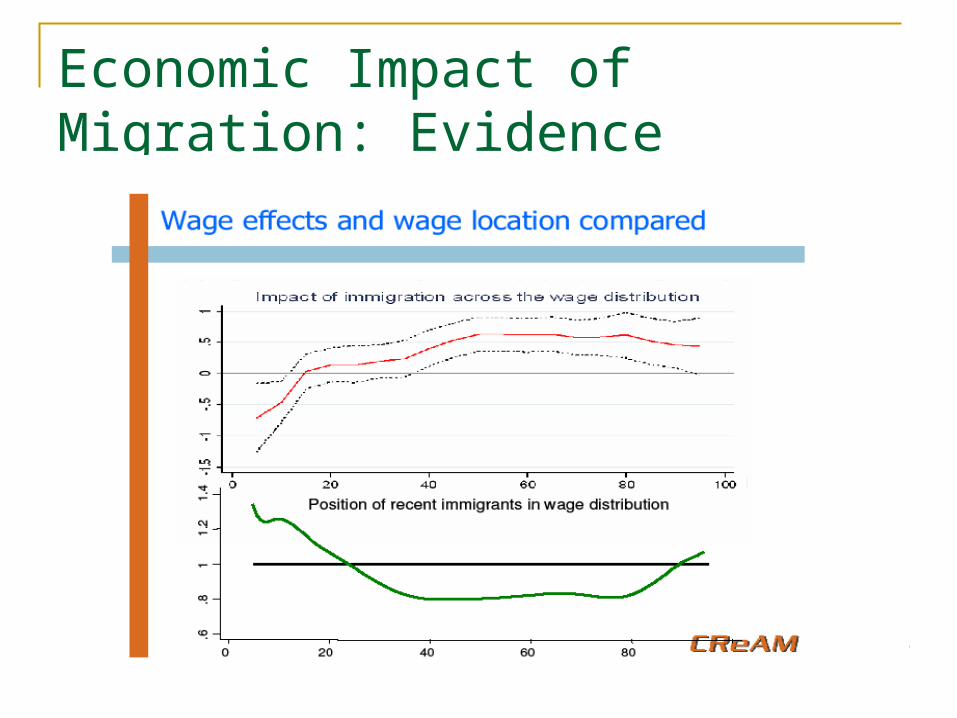
Economic Impact of Migration: Evidence (Dustmann et al., 2008)

Economic Impact of Migration: Evidence Impact on employment (Dustmann et al., EJ
2005) UK data: zero effect overall Positive effect for high-educated natives
(high-school diploma and higher) Negative effect for intermediate-educated,
negative but insignificant for unqualified Effects for high and intermediate educated
approximately cancel each other in aggregate
Economic Impact of Migration: Evidence from Natural Experiments Friedberg and Hunt (JEP 1995): Large-scale
immigration episodes little long-term impact on labor markets French and Portuguese decolonization Cuban immigration to the US during the
Mariel boatlift Russian-Jewish immigration to Israel in
1990s
Economic Impact of Migration: Israel 1990s: more than 1 million ethnic Jews
immigrated to Israel from the FSU Israeli population in 1989: 4.6 million Migration driven by economic hardship
and political unrest Approximately two-thirds of these
immigrants highly skilled
Economic Impact of Migration: Israel FSU immigration no long-term effect
on wages or employment of natives Friedberg (2001 QJE), Gandal, Hanson and
Slaughter (2004 EER), and Cohen and Paserman (2004 CEPR DP 4640):
Cohen and Paserman (2004): negative short-term effect (elasticity -0.1 to -0.3) on wages (but not on employment) Effect disappears in 4-7 years
Economic Impact of Migration: Israel Gandal et al.: global technology changes
increased demand for skilled labor This helped Israeli economy absorb
immigrant influx Cohen and Hsieh (2000 mimeo):
immigration followed by large influx of capital (borrowing) Consistent with standard neoclassical growth
model
Economic Impact of Migration: Israel Eckstein and Weiss (2003 IZA DP 710):
substantial initial occupational downgrading of FSU immigrants but wages increase rapidly
No return on their imported skills in short run Lower return to education, same return to
experience and higher return to unobserved skills, than native Israelis, in long run
Because of lower return to imported skills, immigrants’ wages never catch up with natives’ wages
Economic Impact of Migration: Germany Re-unification of Germany large
migration flow from East to West Frank (2007 mimeo): no overall effect on
wages or unemployment in West Germany But: important distributional effects Employment of less educated workers,
blue-collar workers and foreign nationals declined
Wages of workers in non-traded-goods and service sectors increased

Immigration and Crime
Immigrants often associated with high crime rates
Theory: ambiguous relationship Immigrants fare poorly in labor market, but: face higher detection probability (prejudice) and stricter punishment (sentence & deportation)
Immigration and Crime
Bianchi, Buonanno & Pinotti (2009 BI wp) Immigration & crime in IT provinces, 1990-2003
OLS: elasticity of crime to immigration: 0.1 Especially for property crime (theft and robbery)
Result may be driven by endogeneity Eg immigrants more to high-crime areas because
of low cost of housing IV: no significant effect on total crime or
property crime, significant effect on robberies Robberies 1.5% of total crime only
Brain Drain
Migration of skilled workers from LDC to DC Docquier et al. (IZA DP 2005): brain drain
estimates, 1990-2000 World weighted-average skilled migration rate
5.3% vs unskilled rate 1.1% LDC: 7% vs 0.3% Latin America 11%, Africa 10.4%, Asia 5.5%
Traditional view: brain drain reduces stock of human capital lower potential for growth
Brain Drain
Skilled immigrants often subject to occupational downgrading
But face better employment prospects than unskilled immigrants
Liquidity constraints Migration is costly Skilled migrants better able to afford the cost

Brain Drain: Reassessment
Mountford (1997 JDE), Fan and Stark Individuals under-invest in education
because they ignore social returns Education raises probability of emigration
Higher expected private return to education Greater incentive to invest in education
Emigration uncertain some skilled workers remain in LDC
Brain drain may raise LDC stock of human capital better prospects for growth
Remittances
Large inflows, esp. for developing countries: Remittances one third of exports and greater than
FDI (Barajas et al., 2009, IMF WP09/153) Top recipients in 2008: Mexico, China and
India: $25-27bn Mexico: remittances 1/3 of formal wage
income in 2006 (Vargas-Silva, RDE 2009) US: 18mn people of Mexican origin
Poland: 2mn Poles abroad $6bn in 2007 (NBP report)
Remittances
China: remittances of rural migrants large 15% of agricultural income of selected provinces
in 1992 (Wu & Zhou 2005) 1995 survey in Jinan and Shandong (Liu &
Reilley, Apllied Economics 2004) Rural migrants remit RMB 2110 p.a. 36% of
earnings 85% of rural migrants transfer remittances

Remittances: Impact
Remittances increase household disposable income
Rozelle, Taylor and deBrauw (AER P&P 1999): remittances increase agricultural productivity in rural China (Hebei and Liaoning)
Adams and Page (WB WPS3179): remittances reduce poverty in LDC Elasticity: -0.19 with respect to emigration rate
and -0.16 with respect to remittances-to-GDP ratio

Remittances: Impact
Barajas et al. (2009, IMF WP09/153): Remittances to 84 countries over 1970-2004 Effect on growth is insignificant or even negative Interpretation: remittances alleviate poverty and
increase consumption but not investment

Remittances and the Dutch Disease DD typically associated with revenue from
export of natural resources (origin: North-Sea natural gas exports in the Netherlands)
Large receipts of foreign currency XR appreciates loss of competitiveness manufacturing exports fall while imports rise
Vargas-Silva (RDE 2009): remittances cause appreciation of real exchange rate in Mexico
Politics of Immigration
Migration (and trade) winners and losers among natives
If immigrants predominantly unskilled, unskilled natives lose out and skilled workers gain
Losers may need to be compensated (redistribution of gains from winners)
Otherwise, economic integration may not be politically feasible
Politics of Immigration
Wages reflect relative abundance of each factor of production
Consider again skilled vs unskilled labor DC: skilled labor relatively abundant
Immigrants predominantly unskilled Skilled workers likely to emigrate
LDC: unskilled labor relatively abundant Immigrants predominantly skilled Unskilled labor likely to emigrate
Politics of Immigration
Attitudes depend on relative factor endowments and redistributional impact of immigration
DC: immigrants predominantly unskilled Skilled wage goes up Unskilled wage falls
Skilled workers should favor immigration Unskilled workers should oppose immigration

Politics of Immigration
LDC: immigrants predominantly skilled Skilled workers should oppose immigration Unskilled workers should be in favor Attitudes on free trade determined similarly
Politics of Immigration
O’Rourke and Sinnott (2005 EJPE), Mayda and Rodrik (2005 EER) and Mayda (2005) use large multi-country individual-level survey dataset to investigate individual attitudes on trade and migration
Skilled individuals more in favor of immigration (free trade) More so in rich countries
Politics of Emigration: Home Country Emigration experience may affect one’s
political opinion and attitudes Spilimbergo (CEPR DP 5934):
UNESCO database on international student flows: 1950-2003
Share of students studying abroad increases democracy in home country
But only if students study in democratic countries
Politics of Emigration: Home Country Fidrmuc and Doyle (CEPR DP 4619):Voting
behavior of Czech and Polish emigrants in home-country elections
Emigrant votes differ from home country votes and also across host countries
Votes for pro-reform and left-wing parties depend on host-country characteristics
Migrants adapt to institutional environment Level and tradition of democracy Extent of economic freedom
Political Impact of Immigration Living in economically liberal and democratic
countries should have a favourable impact on migrants from less developed countries Migrants espouse liberal attitudes while living
abroad Autocratic regimes often restrict their citizens’
freedom to travel North Korea, Turkmenistan, Zimbabwe
Autocracies that tolerate free travel often more liberal former Yugoslavia

Migrant’s Labor-market Performance Migrants typically subject to substantial
occupational downgrading Human capital poorly portable
Eastern European Jews in Israel: low return on imported education and experience (Friedberg JLE 2000; Eckstein and Weiss, 2003 IZA DP710)
Destination-country education raises return also to home-country education (Friedberg 2000)
Immigrants catch up slowly and imperfectly

Occupational Downgrading: UK (Dustmann et al., 2008)

Migrant’s Labor-market Performance US/UK: immigrants from Latin American and
Eastern Europe suffer more downgrading than immigrants from industrialized countries UK: Drinkwater et al. (2006 IZA DP2410) US: Mattoo et al. (JDE 2008)
Language skills important Immigrants who speak destination-country
language earn up to 20% more (Chiswick and Miller, 2002 JPopE; 2007 IZA DP 2664)
EU Enlargement and East-West Migration EU enlargements in May 2004 and Jan 2007 Pre-enlargement debate in academia, policy-
making and popular press: fear of mass migration, welfare shopping and displacement effects in labor market
Result: transitional restrictions on free movement of workers (2+3+2 formula) Exceptions in 2004: UK, Ireland and Sweden More countries removed restrictions later
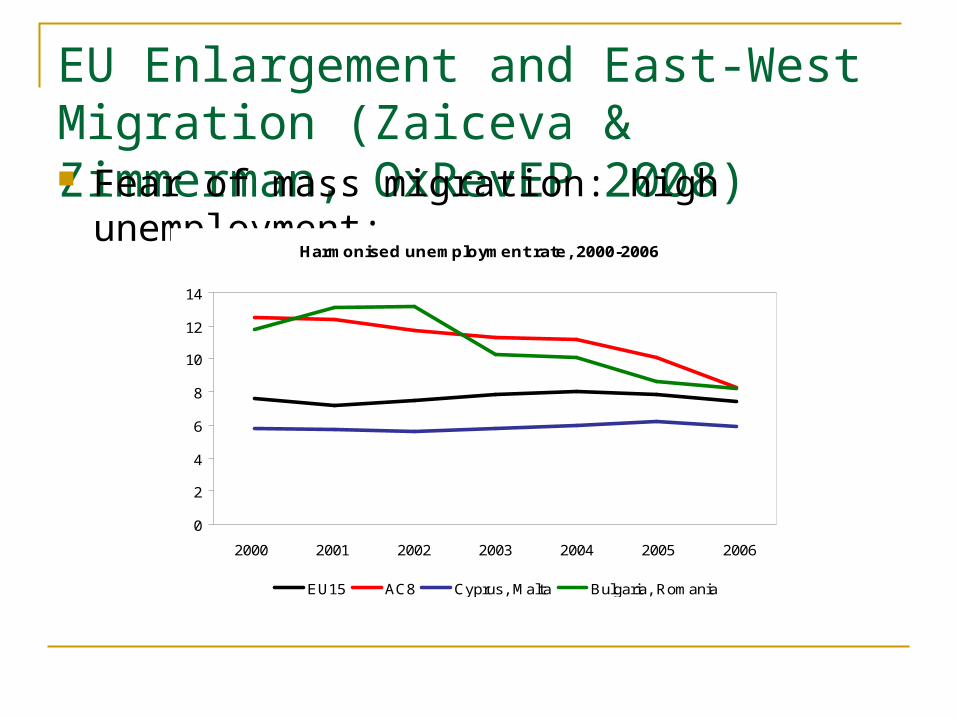
EU Enlargement and East-West Migration (Zaiceva & Zimmerman, OxRevEP 2008) Fear of mass migration: high unemployment:
Harmonised unemployment rate, 2000-2006
0
2
4
6
8
10
12
14
2000 2001 2002 2003 2004 2005 2006
EU15 AC8 Cyprus, Malta Bulgaria, Romania
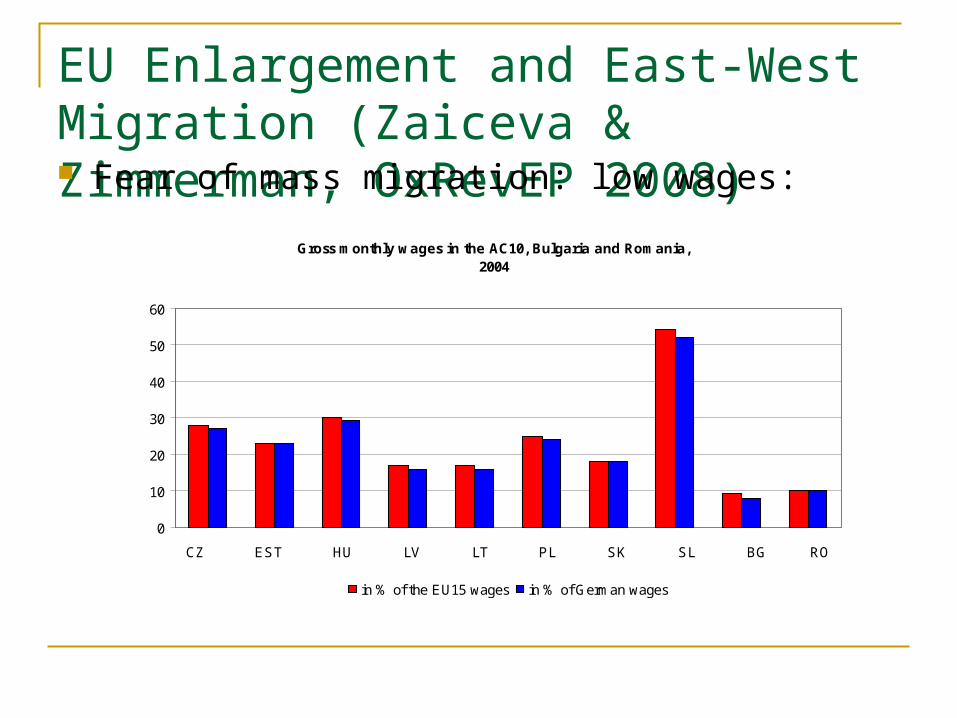
EU Enlargement and East-West Migration (Zaiceva & Zimmerman, OxRevEP 2008) Fear of mass migration: low wages:
Gross monthly wages in the AC10, Bulgaria and Romania, 2004
0
10
20
30
40
50
60
CZ EST HU LV LT PL SK SL BG RO
in % of the EU15 wages in % of German wages

East-West Migration: Predictions (Zaiceva & Zimmerman, OxRevEP 2008) Since early 1990s – more than 30 studies
forecasting East-West migration
1. Predictions based on intentions to move to the West using surveys
2. Econometric models using historical data for countries other than CEECs (“double out-of-sample extrapolations”) Migration experience after the Southern EU
enlargement or other countries (e.g. immigration to Germany from a broad sample of countries)

East-West Migration: Predictions
Boeri and Bruecker (2000) Estimate model of immigration to Germany over
1968-98 Use it to predict East-West migration to the EU
Total net immigration 335 ths to the EU15 Most predicted to go to Germany and Austria:
218 ths and 40.5 ths, respectively; UK to receive some 15 ths.
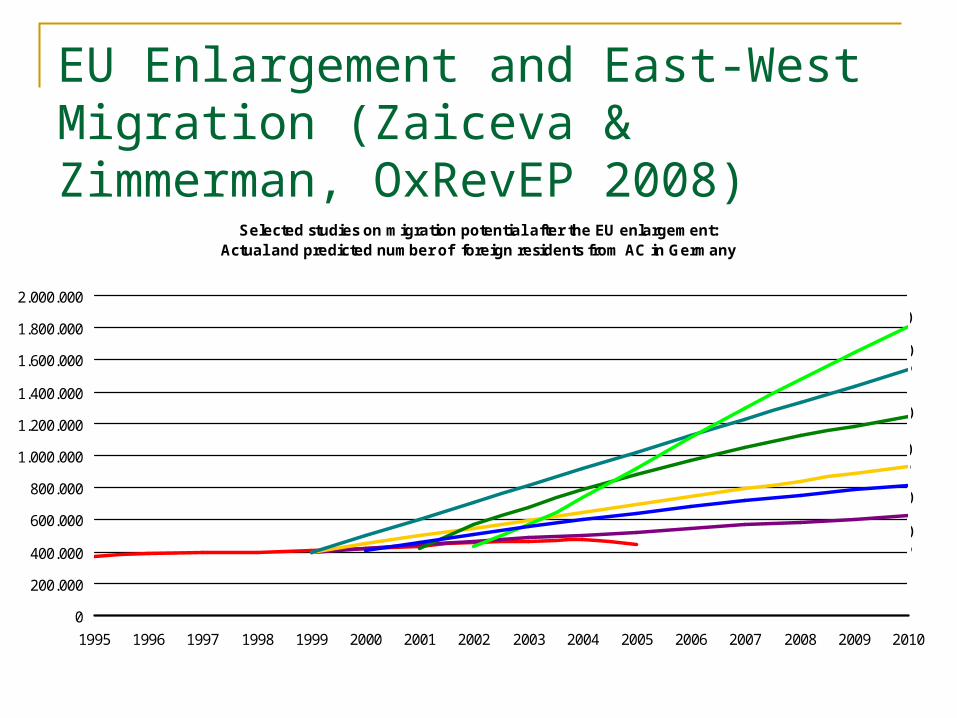
EU Enlargement and East-West Migration (Zaiceva & Zimmerman, OxRevEP 2008)
Selected studies on migration potential after the EU enlargement: Actual and predicted number of foreign residents from AC in Germany
0
200.000
400.000
600.000
800.000
1.000.000
1.200.000
1.400.000
1.600.000
1.800.000
2.000.000
1995 1996 1997 1998 1999 2000 2001 2002 2003 2004 2005 2006 2007 2008 2009 2010
Actual number of residents from AC8
Sinn et al. (2001)
Dustmann (2003)"Economic 04" scenario
Dustmann (2003)"Economic 01" scenario
Dustmann (2003)"Baseline 01" scenario
Boeri and Brücker (2000)
Zaiceva (2006)

East-West Migration: Predictions
Surveys of willingness to migrate (WTM) Drinkwater (2003): WTM to the EU highest
among the young and those with high skills and foreign-language skills
Expected impact: mainly positive impact for destination countries potentially adverse impact on source countries
(brain drain)

EU Enlargement and East-West Migration (Zaiceva & Zimmerman, OxRevEP 2008) Actual migration flows difficult to estimate
UK and Ireland: no restrictions, large influx (Gilpin et al., 2006, Blanchflower et al., 2007, UK Home Office Accession Monitoring Reports; Doyle et al., 2006)
Sweden: no restrictions, little immigration Austria, Germany: restrictions, large influx
Why? Push and pull factors: Economic factors, geographic proximity, language, networks, demand-driven (IE), re-directed from other countries…
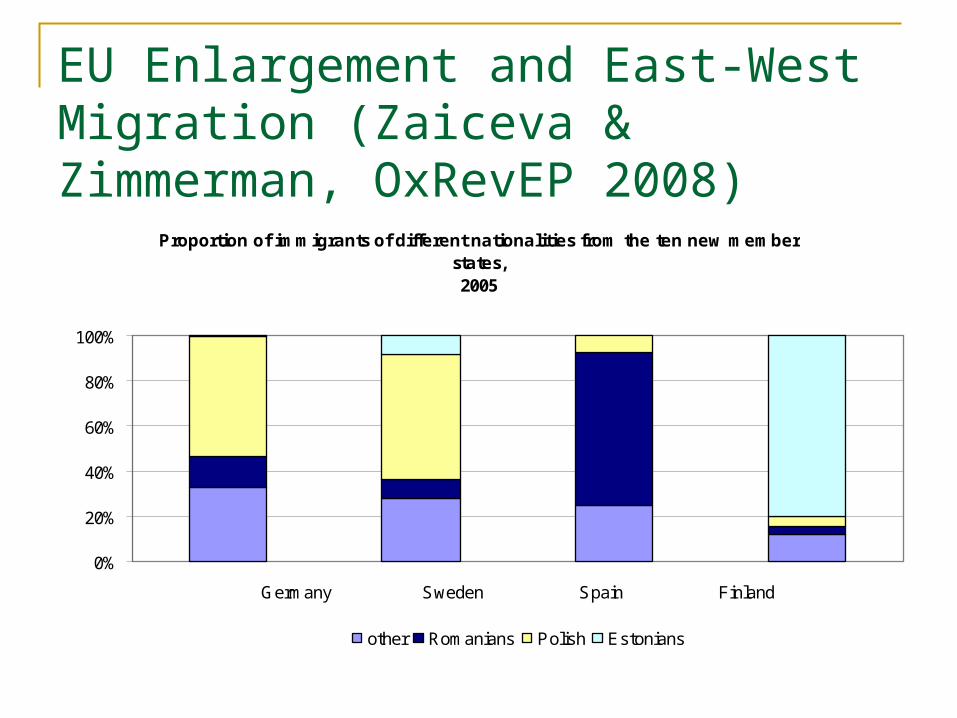
EU Enlargement and East-West Migration (Zaiceva & Zimmerman, OxRevEP 2008)
Proportion of immigrants of different nationalities from the ten new member states,2005
0%
20%
40%
60%
80%
100%
Germany Sweden Spain Finland
other Romanians Polish Estonians
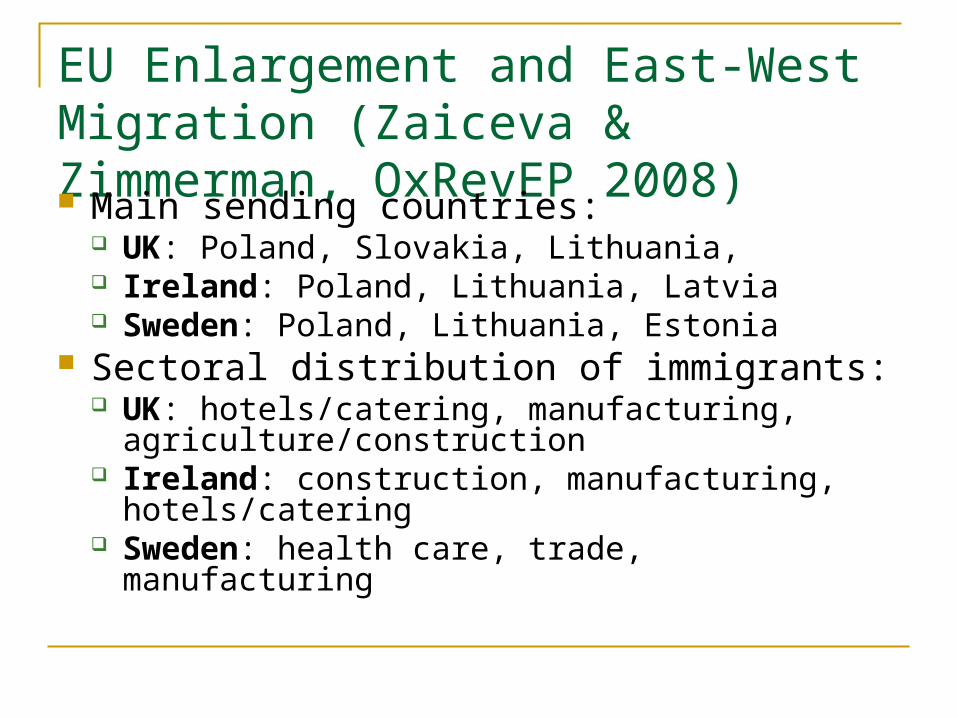
EU Enlargement and East-West Migration (Zaiceva & Zimmerman, OxRevEP 2008) Main sending countries:
UK: Poland, Slovakia, Lithuania, Ireland: Poland, Lithuania, Latvia Sweden: Poland, Lithuania, Estonia
Sectoral distribution of immigrants: UK: hotels/catering, manufacturing,
agriculture/construction Ireland: construction, manufacturing,
hotels/catering Sweden: health care, trade, manufacturing
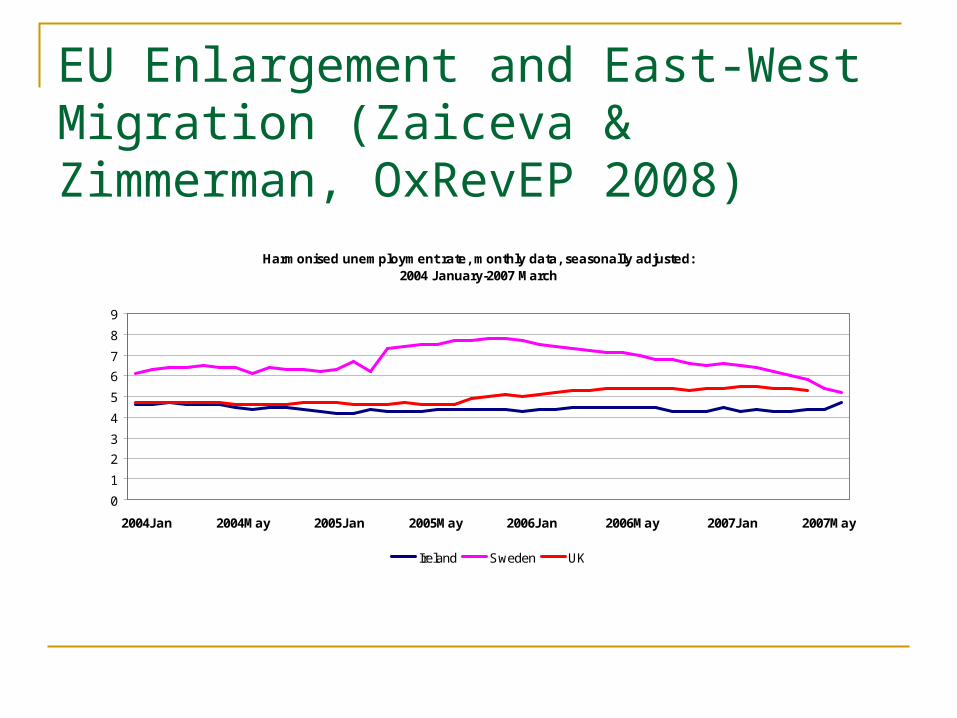
EU Enlargement and East-West Migration (Zaiceva & Zimmerman, OxRevEP 2008)
Harmonised unemployment rate, monthly data, seasonally adjusted: 2004 January-2007 March
0
1
2
3
4
5
6
7
8
9
2004Jan 2004May 2005Jan 2005May 2006Jan 2006May 2007Jan 2007May
Ireland Sweden UK

EU Enlargement and East-West Migration (Zaiceva & Zimmerman, OxRevEP 2008)
Wages and salaries: Labour Cost Index: 2000=100.Industry and services (excl. public administation)
95
100
105
110
115
120
125
2004Q1 2005Q1 2006Q1 2007Q1
Ireland Sweden UK

EU Enlargement and East-West Migration (Zaiceva & Zimmerman, OxRevEP 2008)
Wages and salaries: Labour Cost Index: 2000=100.Manufacturing
95
100
105
110
115
120
125
2004Q1 2005Q1 2006Q1 2007Q1
Ireland Sweden UK
East-West Migration: Impact (Zaiceva & Zimmerman, OxRevEP 2008) No negative impact on receiving countries’
economies Occupational downgrading common No evidence of an impact on unemployment If displacement of natives (Ireland) no rise
in aggregate unemployment but “upgrade” jobs for nationals
No wage pressure, not even in manufacturing sector highest share of new immigrants
East-West Migration: Impact (Zaiceva & Zimmerman, OxRevEP 2008) Reduced or falling wage growth rates mainly
follow pre-enlargement trends UK: immigration has increased supply by
more than it has increased demand Lower inflationary pressures and lower natural
rate of unemployment.
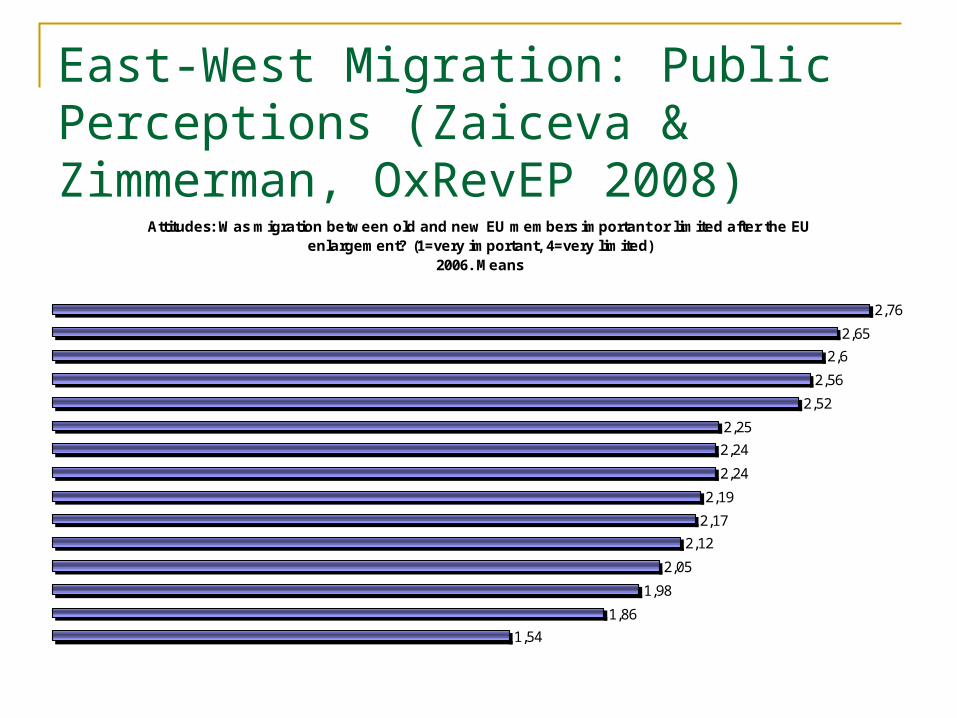
East-West Migration: Public Perceptions (Zaiceva & Zimmerman, OxRevEP 2008)
Attitudes: Was migration between old and new EU members important or limited after the EU enlargement? (1=very important, 4=very limited)
2006. Means
1,54
1,86
1,98
2,05
2,12
2,17
2,19
2,24
2,24
2,25
2,52
2,56
2,6
2,65
2,76
IE
GB
GR
ES
PT
IT
LU
FR
BE
DE
NL
AT
DK
FI
SE
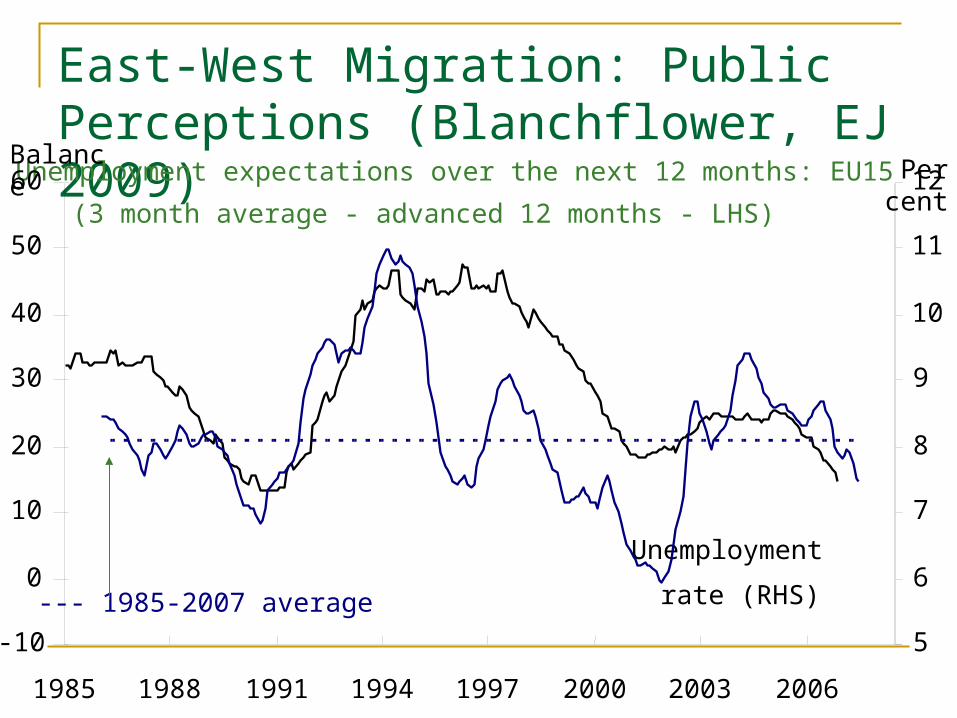
East-West Migration: Public Perceptions (Blanchflower, EJ 2009)
1985 1988 1991 1994 1997 2000 2003 2006
Unemployment expectations over the next 12 months: EU15
(3 month average - advanced 12 months - LHS)
Unemployment
rate (RHS)--- 1985-2007 average
BalancePer cent
-10
0
10
20
30
40
50
60
5
6
7
8
9
10
11
12
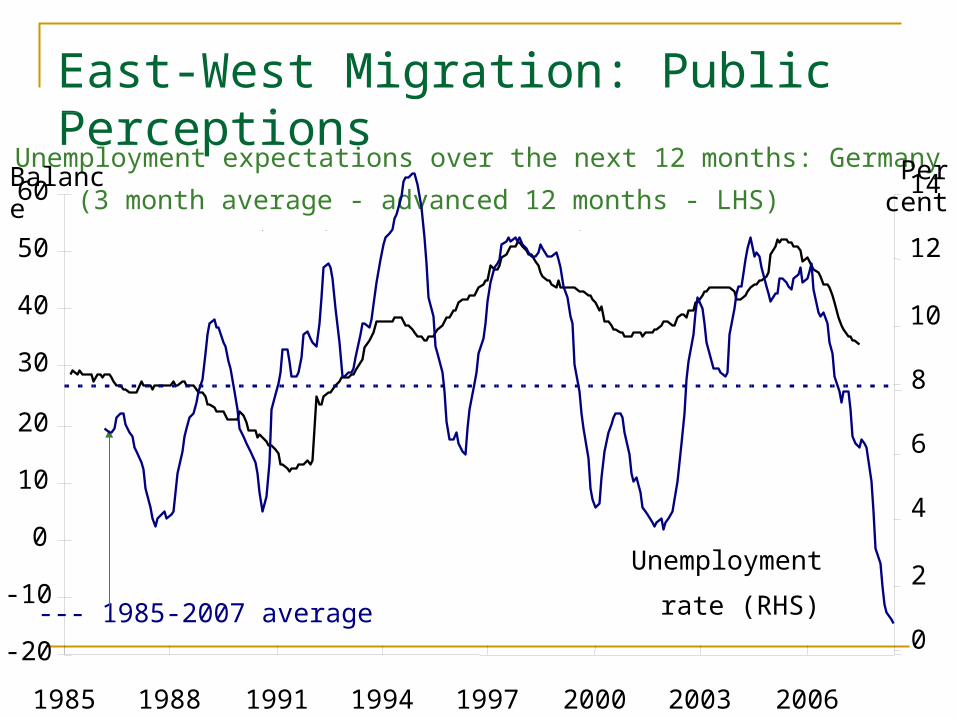
East-West Migration: Public Perceptions
1985 1988 1991 1994 1997 2000 2003 2006
-20
-10
0
10
20
30
40
50
60Unemployment expectations over the next 12 months: Germany
(3 month average - advanced 12 months - LHS)
Unemployment
rate (RHS)--- 1985-2007 average
Balance Per cent
0
2
4
6
8
10
12
14
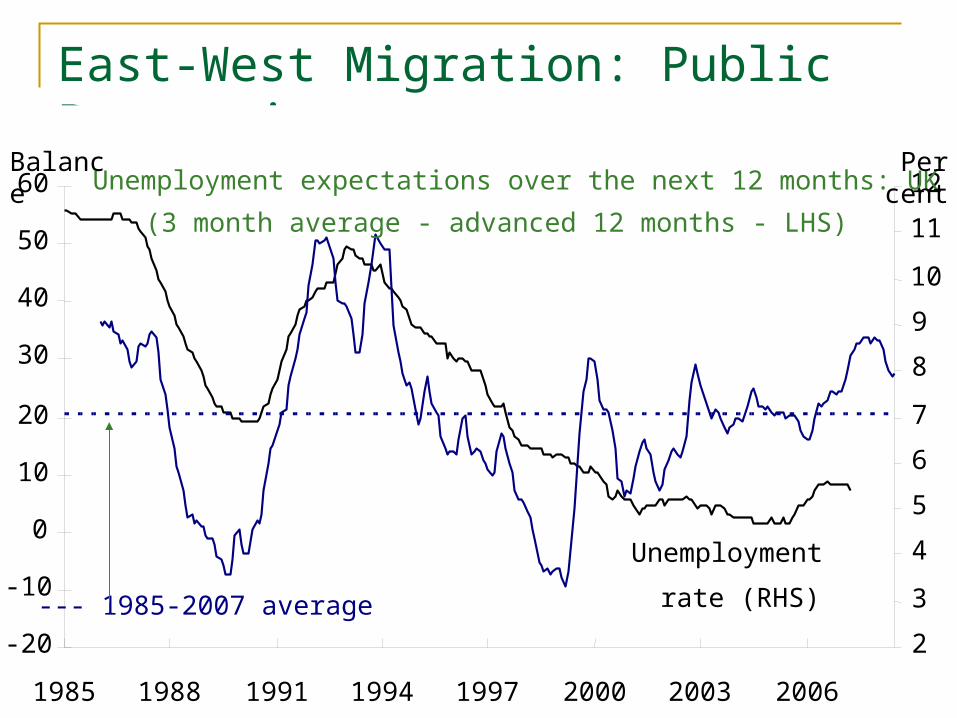
East-West Migration: Public Perceptions
2
3
4
5
6
7
8
9
10
11
12
1985 1988 1991 1994 1997 2000 2003 2006
-20
-10
0
10
20
30
40
50
60 Unemployment expectations over the next 12 months: UK
(3 month average - advanced 12 months - LHS)
Unemployment
rate (RHS)--- 1985-2007 average
Balance Per cent
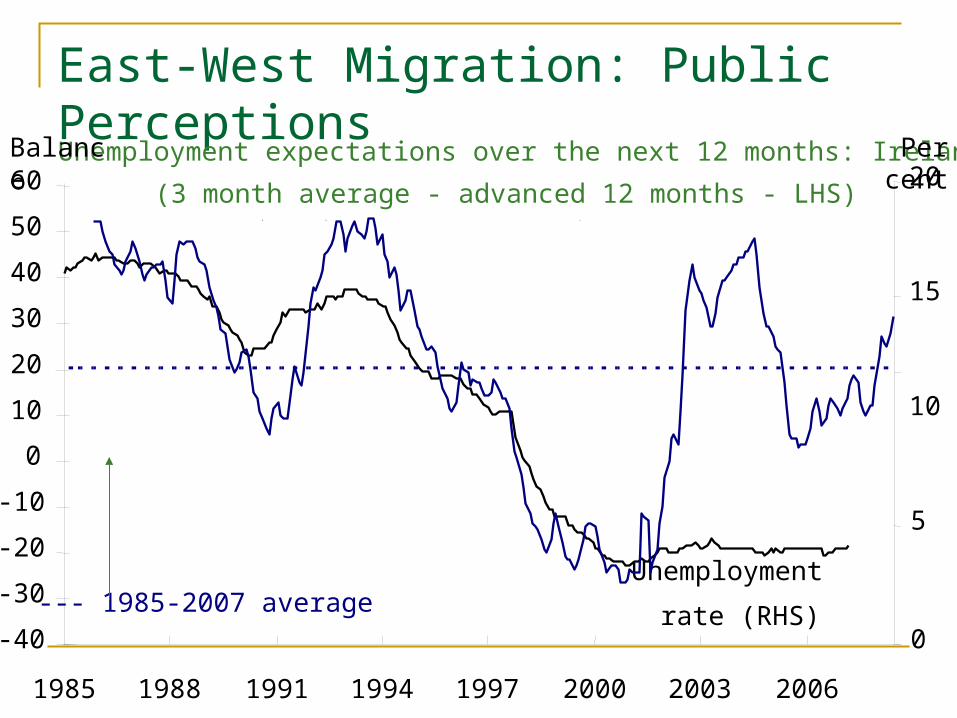
East-West Migration: Public Perceptions
Unemployment expectations over the next 12 months: Ireland
(3 month average - advanced 12 months - LHS)
Unemployment
rate (RHS)--- 1985-2007 average
Balance Per cent
-30
-20
-10
0
10
20
30
40
50
60
-40 0
5
10
15
20
1985 1988 1991 1994 1997 2000 2003 2006

East-West Migration: UK Experience Annual gross inflow of A8 nationals over 200
ths The stock of A8 migrants estimated to be
around 500 ths by the end of 2006 (Blanchflower, Saleheen and Shadforth, 2007)
65-70% of A8 immigrants are Polish Most work in low-skilled occupations and
earn low wages 80% are below 35; 60% are males

East-West Migration: UK Experience Unlike migrants from other countries,
relatively low share come to London (around 10%) Main destinations: Anglia, Midlands, London
Anecdotal evidence: some immigrants highly skilled
No welfare tourists: by 2007, less than 1,000 A8 nationals per quarter approved to receive income support and job-seekers allowance
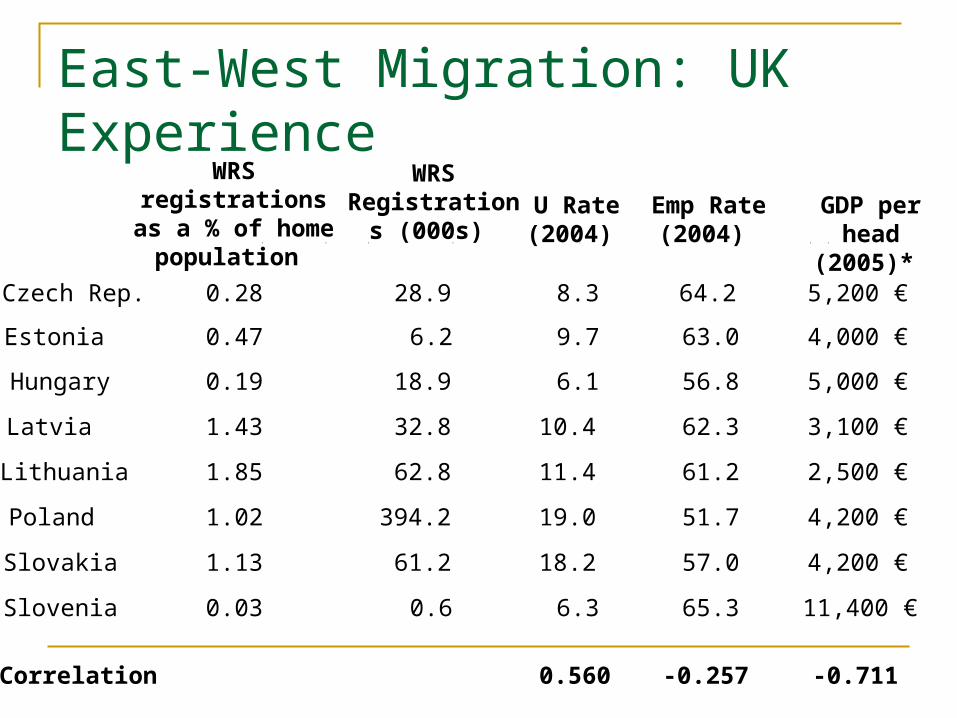
East-West Migration: UK Experience
WRS registrations as a % of home population
WRS Registrations
(000s) U Rate (2004)
Emp Rate (2004)
GDP per head (2005)*
Czech Rep. 0.28 28.9 8.3 64.2 5,200 €
Estonia 0.47 6.2 9.7 63.0 4,000 €
Hungary 0.19 18.9 6.1 56.8 5,000 €
Latvia 1.43 32.8 10.4 62.3 3,100 €
Lithuania 1.85 62.8 11.4 61.2 2,500 €
Poland 1.02 394.2 19.0 51.7 4,200 €
Slovakia 1.13 61.2 18.2 57.0 4,200 €
Slovenia 0.03 0.6 6.3 65.3 11,400 €
Correlation 0.560 -0.257 -0.711
East-West Migration: UK Experience
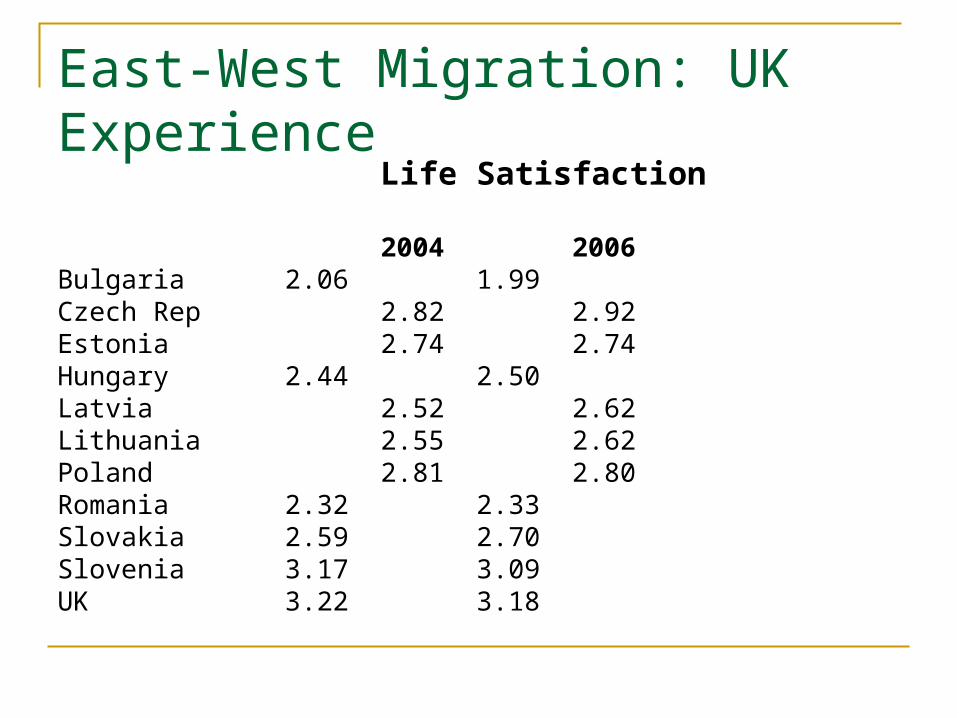
Life Satisfaction
2004 2006Bulgaria 2.06 1.99Czech Rep 2.82 2.92Estonia 2.74 2.74Hungary 2.44 2.50Latvia 2.52 2.62Lithuania 2.55 2.62Poland 2.81 2.80Romania 2.32 2.33Slovakia 2.59 2.70Slovenia 3.17 3.09UK 3.22 3.18
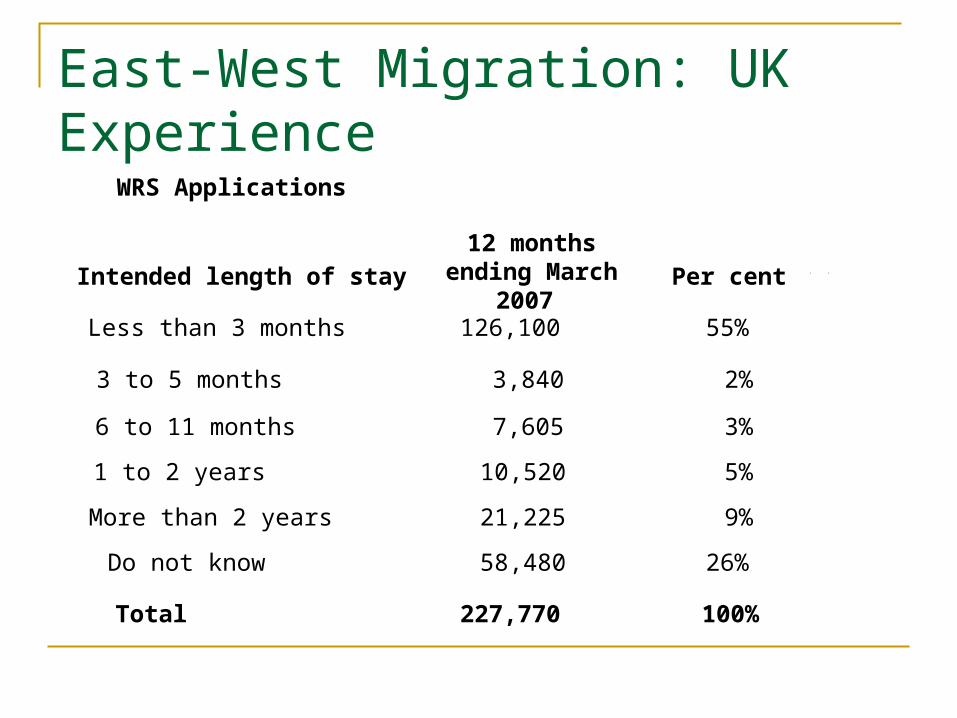
East-West Migration: UK Experience
Intended length of stay
12 months ending March 2007 Per cent
Less than 3 months 126,100 55%
3 to 5 months 3,840 2%
6 to 11 months 7,605 3%
1 to 2 years 10,520 5%
More than 2 years 21,225 9%
Do not know 58,480 26%
Total 227,770 100%
WRS Applications
East-West Migration: UK Experience 1-2% (at least) of Polish, Slovak, Latvian and
Lithuanian populations lived and worked in the UK at some time between 2004 and 2007 (WRS statistics only)
East-West migration helped lower unemployment in A8 countries Some caused labor shortages, especially in
agriculture and construction Gilpin et al. (2006, DWP WP 29): relationship
between change in share of A8 migrants and change in regional unemployment

East-West Migration: UK Experience Drinkwater, Eade and Garapich (2006 IZA
DP2410): A8 migrants highly skilled but have low
returns to skills and experience Wages increase with years since migration A8 migrants earn 30% less than migrants
from other European countries (those from English-speaking countries earn 30% more) when not controlling for occupation
No evidence as to whether the extent of occupational downgrading is falling over time
East-West Migration: UK Experience If occupational downgrading persists:
Destination countries do not realize the migrants’ full contribution to their GDPs
Migrants fail to receive wages corresponding to their human capital
Occupational downgrading may become permanent and persist even upon return to the home country (scarring)
Source countries suffer brain drain Overall, everyone loses Time will show if this will be the case.
Summary
Factors underlying patterns of migration flows: Differentials in (expected) earnings Returns to human capital Risk sharing at household level
Economic impact of migration Host country: little or none aggregate labor-market
impact but important distributional implications Home country: may be harmful because of brain
drain and/or Dutch disease
Summary
Political impact Host country: distributional implications winners
and losers political backlash against labor mobility and integration
Home country: spread of liberal norms and values EU enlargement
Large and unprecedented migration flows within Europe
Little or no negative labor-market impact on host countries (so far)
Related Documents