Electronic copy available at: http://ssrn.com/abstract=1520630 ab0cd Development based on commodity revenues Sergei Guriev, Alexander Plekhanov and Konstantin Sonin Summary Commodity resources offer vast opportunities for development. In the long run, however, the performance of commodity-rich countries tends to fall short of expectations, as commodity rents induce macroeconomic volatility and undermine incentives to improve institutions. The paper looks at the strategies that countries can adopt to avoid the “resource trap”. These strategies aim at diversifying the economy, promoting financial development, building up stabilisation buffers that lower macroeconomic volatility, and reducing inequality. The resource-rich EBRD countries of operations have embraced these strategies to varying degrees, and with varying success. Improving institutions remains the key challenge. Keywords: natural resources, economic boom, institutions, financial development JEL Classification Number: Q32, Q33, O10, O16 Contact details: Alexander Plekhanov, European Bank for Reconstruction and Development, One Exchange Square, London, EC2A 2JN, UK. Email: [email protected] Sergei Guriev and Konstantin Sonin are professors of economics at the New Economic School, Moscow, and Alexander Plekhanov is an economist at the European Bank for Reconstruction and Development. The authors are grateful to Boriss Ginzburgs for excellent research assistance and to Erik Berglöf, Jeromin Zettelmeyer, Toshiaki Sakatsume, Peter Sanfey and seminar participants at the EBRD Office of the Chief Economist for valuable comments and suggestions. The findings, interpretations and conclusions expressed in this paper are those of the authors and do not reflect the official position of the organisations the authors belong to. Working Paper No. 108 Prepared in November 2009 1

Welcome message from author
This document is posted to help you gain knowledge. Please leave a comment to let me know what you think about it! Share it to your friends and learn new things together.
Transcript

Electronic copy available at: http://ssrn.com/abstract=1520630
ab0cd Development
based on commodity revenues
Sergei Guriev, Alexander Plekhanov and Konstantin Sonin
Summary
Commodity resources offer vast opportunities for development. In the long run, however, the performance of commodity-rich countries tends to fall short of expectations, as commodity rents induce macroeconomic volatility and undermine incentives to improve institutions. The paper looks at the strategies that countries can adopt to avoid the “resource trap”. These strategies aim at diversifying the economy, promoting financial development, building up stabilisation buffers that lower macroeconomic volatility, and reducing inequality. The resource-rich EBRD countries of operations have embraced these strategies to varying degrees, and with varying success. Improving institutions remains the key challenge.
Keywords: natural resources, economic boom, institutions, financial development
JEL Classification Number: Q32, Q33, O10, O16
Contact details: Alexander Plekhanov, European Bank for Reconstruction and Development, One Exchange Square, London, EC2A 2JN, UK. Email: [email protected]
Sergei Guriev and Konstantin Sonin are professors of economics at the New Economic School, Moscow, and Alexander Plekhanov is an economist at the European Bank for Reconstruction and Development.
The authors are grateful to Boriss Ginzburgs for excellent research assistance and to Erik Berglöf, Jeromin Zettelmeyer, Toshiaki Sakatsume, Peter Sanfey and seminar participants at the EBRD Office of the Chief Economist for valuable comments and suggestions.
The findings, interpretations and conclusions expressed in this paper are those of the authors and do not reflect the official position of the organisations the authors belong to.
Working Paper No. 108 Prepared in November 2009
1

Electronic copy available at: http://ssrn.com/abstract=1520630
INTRODUCTION
Modern oil drilling started in Bibi-Aybat outside Baku – then part of the Russian Empire – in 1846, a decade before extraction began in Pennsylvania in the United States. More than a century and a half later, Baku has once again been at the centre of an oil boom underpinning Azerbaijan’s astonishing average economic growth rate of over 20 per cent annually in real terms in 2005–08. While most countries in emerging Europe and Central Asia experienced strong growth until 2008, the performance of major oil and gas producers – Azerbaijan, Kazakhstan, Russia and Turkmenistan – stands out (Chart 1). The performance differential is even more striking if growth is measured in US dollars rather than real terms (Chart 2). By this measure Russian GDP grew almost sixfold over the period 1999–2008, compared with the real GDP growth of 93 per cent, and Azerbaijan’s, Kazakhstan’s and Turkmenistan’s growth rates were higher still.
Chart 1. Cumulative real GDP growth, 1999-2008
Russia
Kazakhstan
Azerbaijan
Turkmenistan
0
50
100
150
200
250
300
350
100 1,000 10,000 100,000
Transition countries Fitted line
Growth in per cent
GDP per capita in 1998 at PPP
Sources: IMF, EBRD, and authors’ calculations. Note: Fitted line is based on the OLS regression of growth on logarithm of GDP per capita at purchasing power parity (PPP).
2
Chart 2. Cumulative nominal US$ GDP growth, 1999-2008
RussiaKazakhstan
Azerbaijan
Turkmenistan
0
200
400
600
800
1,000
1,200
100 1,000 10,000 100,000
Transition countries Fitted line
Growth in per cent
GDP per capita in 1998 at PPP
Sources: IMF, EBRD and authors’ calculations. Note: Data for Turkmenistan are from 2007. Fitted line is based on the OLS regression of growth on logarithm of GDP per capita at purchasing power parity (PPP).
Reaping the rewards and managing the problems of natural resource wealth have been the defining characteristics of the development experience of commodity-rich countries, particularly in the last decade. On the upside, commodity revenues have put enormous fiscal resources at the disposal of governments and fuelled an unparalleled economic boom. On the downside, commodity exports and commodity-related foreign direct investment (FDI) have led to large foreign exchange inflows that have complicated macroeconomic management, and made countries vulnerable to sudden swings in commodity prices. Partly as a consequence of the collapse of oil prices in the summer of 2008, growth in Azerbaijan declined dramatically from 16.5 per cent in the first half of 2008 to 3.6 per cent in the first half of 2009. In Russia the decline was even greater, from 8 per cent growth in the first half of 2008 to -10.4 per cent in the first half of 2009.
Even more challenging than managing short-run volatility is the problem of maintaining high growth rates in the long term. Past experiences of resource-rich economies worldwide tell a cautionary tale in this respect. Numerous studies found that over the long term, resource-rich countries tend to underperform compared to their resource-poor peers with the same initial level of per capita income (see, for instance, Sachs and Warner, 1997a,b, 2001, and Chart 3). This observation gave rise to the concept of a “resource curse”, meaning that resource abundance may undermine rather than foster economic development over a longer period (the term was first coined by Auty, 1993).
3

This paper looks at the policy problems faced by major commodity exporters in the EBRD region, focusing on Azerbaijan, Kazakhstan and Russia, which enjoy relatively high oil revenues (Chart 4), and Turkmenistan, the world’s sixth largest natural gas exporter. The analysis also applies to some degree to two other transition countries which exhibit a high share of non-fuel commodity exports – in Mongolia copper receipts accounted for over 50 per cent of merchandise exports in 2007, while in the Kyrgyz Republic gold, mercury and other metals accounted for approximately half of exports.
Chart 3. Average real GDP growth in selected oil-rich countries, 1981-2000
-4
-2
0
2
4
6
8
10
12
100 1,000 10,000 100,000
Other countries Major oil producers
Non-oil sample trend line Oil sample trend line
Growth, in per cent (annualised)
GDP per capita in 1980 at PPP, US$
Sources: IMF, Energy Information Administration (EIA) and EBRD calculations. Note: Major oil producers are defined as countries where oil production valued at international prices exceeded 10 per cent of GDP in 1980.
4

Chart 4. Value of produced oil, 2006
0
2,000
4,000
6,000
8,000
10,000
12,000
14,000
16,000
18,000
Ind
onesi
a
Bah
rain
Mex
ico
Mala
ysia
No
rway
Russi
a
Ecuad
or
Venezu
ela
Kaz
akh
stan
Nig
eri
a
UA
E
Iran
Alg
eri
a
Bru
nei
Yem
en
Om
an
Gab
on
Saud
i Ara
bia
Aze
rbaija
n
Lib
ya
An
go
la
0
10
20
30
40
50
60
70
80
90
100
Value of produced oil in US$ per capita (left axis) Value of produced oil in per cent of GDP (right axis)
Sources: EIA, IMF, and authors’ calculations. Oil is valued at international prices.
The paper interprets some of the key policies and reforms undertaken in commodity-exporting countries over the last decade – particularly Azerbaijan, Kazakhstan and Russia – in terms of a development strategy based on:
commodity exports and investment in further natural resource production
the creation of macroeconomic buffers in the form of sovereign wealth funds, to allow for countercyclical fiscal policy and mitigate upward pressures on the real exchange rate
diversification based in part on public investment and state-led industrial policy, and on financial development to direct natural resource income to productive uses outside the natural resource sector.
The question is to what extent this “model” has been successful in laying the basis for sustainable long-term growth and avoiding the short- and long-term problems associated with commodity exports. Empirical analysis finds that successful economic diversification policies rely on strong institutions, and improving institutions remains the key challenge in the resource-rich countries in the region.
The rest of the paper is structured as follows. Section I analyses development issues unique to commodity-based development, particularly the channels through which natural resource wealth can undermine long-term growth and the policies that can help avoid this outcome. Section II turns to policy goals and policy tools in resource-rich countries. Section III provides evidence on the actual policies of the resource-rich countries of the Commonwealth of Independent States (CIS) in recent years. Section IV assesses the success of such policies, particularly with regard to diversification and examines empirical relationship between economic diversification and the quality of institutions. Concluding remarks follow.
5
1. ECONOMIC GROWTH IN RESOURCE-RICH COUNTRIES How does natural resource abundance affect long-term economic growth and development? Economics has traditionally viewed growth as determined by the rate of capital accumulation, labour force growth and technological progress. Natural resource wealth can spur growth by financing capital accumulation and creating incentives for private investment, particularly in the natural resources sector. In addition, commodity resources can help developing countries escape from an “underdevelopment trap”. If there are fixed costs for investing in a new technology, and investment in one sector influences demand for another sector’s products, an economy may be stuck in a state of chronic low investment and low growth (Rosenstein-Rodan, 1943; Murphy, Shleifer and Vishny, 1989). Commodity resources could give the economy the impetus it needs to finance a coordinated investment effort and break out of the trap.
However, the presence of commodity resources may also create disincentives to investment in ways that could offset the beneficial effects on long-term growth. These disincentives create the potential resource curse. They fall into two categories: disincentives for physical and human capital accumulation (particularly in the non-resource sectors) and disincentives for improving political and economic institutions.
Macroeconomic volatility and the “Dutch Disease”
Commodity dependence is an obvious source of macroeconomic volatility, with explosive booms when commodity prices are high and excruciating busts when they collapse (see Chart 5 setting the volatile oil price against the very low terms of trade volatility of a large diversified country – the United States). This need not be a big problem if these risks can be insured via the financial system (for example, by making debt payments contingent on oil prices). When financial markets are not developed, however, investors may find it hard to fully hedge. As a result, terms of trade volatility could have a negative effect on growth, as economic agents may find it too risky to undertake irreversible investments in projects that may turn out to be unprofitable in an economic downturn (see Aghion et al., 2006, for empirical evidence).
6

Chart 5. Oil price in real terms
0
50
100
150
200
250
300
350
400M
ay-
83
Mar
-84
Jan
-85
No
v-8
5
Se
p-8
6
Ju
l-8
7
Ma
y-88
Mar
-89
Jan
-90
No
v-9
0
Se
p-9
1
Ju
l-9
2
Ma
y-93
Mar
-94
Jan
-95
No
v-9
5
Se
p-9
6
Ju
l-9
7
Ma
y-98
Mar
-99
Jan
-00
No
v-0
0
Se
p-0
1
Ju
l-0
2
Ma
y-03
Mar
-04
Jan
-05
No
v-0
5
Se
p-0
6
Ju
l-0
7
Ma
y-08
Mar
-09
Brent Crude oil price (period average = 100) US terms of trade (2008 = 100)
Oil price in real terms
Sources: Bloomberg, IMF and authors’ calculations. Note: Based on Brent Crude oil prices, adjusted using US CPI.
Human capital accumulation particularly can suffer as a result of this problem. Investments in education are long-term and irreversible, and will therefore be rationally scaled down in a volatile environment in which demand for qualified labour is more uncertain. There is evidence that this mechanism is indeed at work in resource-rich countries (Gylfason, 2001, Stijns, 2006, and Suslova and Volchkova, 2007). As education cycles stretch over years and sometimes decades, under-investment in this area may be even more difficult to reverse than under-investment in physical capital.
A related problem is the “Dutch Disease”, which refers to the idea that natural resource exports may come at the expense of the manufacturing sector.1 Investment and consumption related to commodity revenues raise the cost of labour and the relative prices of non-tradeable goods (services). Labour and capital inputs shift towards the booming resource sector, services and residential construction, while inhibiting the development of manufacturing (Corden and Neary, 1982). If manufacturing production is more responsive to “learning by doing”, product quality improvements and the discovery of new products, this could depress long-term growth. 2 Growth could also suffer because commodity rents are distributed less equally than manufacturing revenues, which may weaken constituencies for institutional reform (see next section).
1 The term was coined by The Economist magazine to refer to the Netherlands’ experience following the discovery of hydrocarbons in the North Sea in 1959. 2 There is evidence that the “sophistication” of export products predicts higher future growth. See Hausmann, Hwang and Rodrik (2007) and EBRD (2008).
7

In addition, the Dutch Disease may exacerbate the problem of macroeconomic volatility. If there are dynamic economies of scale in the manufacturing sector (from learning by doing), manufacturing will suffer when resource prices increase. However, when resource prices fall, there is no symmetric boost. This is because there has been a period of low manufacturing output and productivity in this sector has fallen behind that of its foreign peers, so manufacturing has become non-competitive. As a result, nominal exchange depreciation may depress the domestic economy to a much greater extent than would otherwise have happened (a prospect that will discourage investment). Countries that switch from manufacturing to oil exports during a resource boom may lose their technological edge and then struggle to recover after the boom ends (Krugman, 1987).
Institutions and inequality Political and economic institutions are vital to economic development. In a weak institutional environment, with a lack of protection for property rights, investors fear expropriation by the state and will under-invest. In an environment with strong institutions, where laws governing financial markets reflect best practice, courts are independent and the police enforce the law equitably, private returns on investment are higher. Institutions therefore provide incentives for investment and innovation, which are critical to long-term growth.
To understand the effect of resource rents (revenues net of extraction costs) on institutions, one needs to analyse the incentives of those individuals who may be in a position to shape institutional development. Politicians or other policymakers who are able to influence institutions may genuinely care about economic growth and development, but at the same time may also be concerned about their own rents. While strong institutions promote growth, they do so by constraining politicians’ ability to extract those rents. For example, if courts and regulatory bodies are independent from political authorities, this limits the ability of those authorities to use these institutions to further their private interests. Natural resources provide revenues that politicians can potentially extract – but only if institutions allow them to do so. Higher resource revenues will therefore increase the preference of politicians for weak institutions (Tornell and Lane, 1999, and Sonin, 2003).
Whether this preference can be realised may depend critically on the initial quality of political and economic institutions. In countries with strong institutions, politicians’ ability to extract rents will be low to begin with – hence they will prefer to promote economic growth, including through sustaining those institutions. In countries with weak initial institutions, attempts to extract rents are likely to be more successful. In such countries, resource abundance slows down or even reverses the development of institutions, which in turn slows economic growth. This results in an “institutional trap” in resource-rich countries, meaning a vicious circle of underdeveloped institutions and a lack of incentive to improve them.
8

This vicious circle may be exacerbated by high income inequality, which typically accompanies natural resource wealth (see Chart 6 for the Gini coefficients of selected commodity exporters).3 High inequality can be harmful for growth for several reasons. In an unequal society with imperfect capital markets, many talented people will have no access to capital or education, resulting in individual poverty traps. High inequality may also bias government policies towards redistribution policies that hurt growth, as the relatively poor median voter would prefer to have more redistribution (Persson and Tabellini, 2000, and Acemoglu, Robinson, and Verdier, 2004).
Inequality and resource wealth may interact in nefarious ways. When resource rents are large, it is easier to buy off the median voter without achieving real redistribution or implementing development-friendly policies. (This logic applies regardless of the presence of elections, as most modern dictators are arguably in an even greater need of popular consent.) Conversely, when total rents are appropriated by fewer individuals, rent-seeking (and weak institutions that make rent-seeking possible) become even more attractive to the members of the elite. In this way, weak institutions and high inequality can feed off each other in an economy with large natural resources.
Chart 6. Gini coefficients of selected commodity exporters
0
10
20
30
40
50
60
100 1,000 10,000 100,000
Commodity exporters Other countriesCommodity exporter sample trend line Other countries trend line
Per cent
GDP per capita in 2006 at PPP, US$, log-scale
Sources: UN WIDER, IMF, WTO, and authors’ calculations. Note: Gini coefficients are the latest observation available for 2002-06. Commodity exporters are defined as countries where mining and fuel accounted for more than half of merchandise exports. In a simple OLS regression of Gini coefficients on GDP per capita (log, PPP terms) in commodity exporters and other countries the difference in slope coefficients (0.36, robust s.e. 0.20) is statistically significant at the 10 per cent level.
3 This relationship is still under-researched compared to other dimensions of the resource curse. As correctly argued by Ross (2007), the quality of data on inequality is relatively low in general and is especially low in resource-rich countries.
9

Empirical evidence on resource curse or resource blessing
Is there a resource curse or a resource blessing? While the empirical debate is far from settled, there is an emerging consensus based on a number of cross-country growth studies that resource-rich countries perform less successfully than resource-poor ones (Sachs and Warner, 1997a,b and 2001; Auty, 1993, 2001; and Gylfason, Herbertsson and Zoega, 1999). Furthermore, the literature has found that the effect of resource abundance does indeed depend (as discussed above) on the initial quality of political and economic institutions (Mehlum, Moene and Torvik, 2006). If this is low, resource abundance slows down or even reverses the development of institutions, which in turn slows down economic growth. In contrast, in countries with developed institutions, resource abundance does not seem to have a consequent negative effect on growth. In particular, a number of studies found no evidence of Dutch Disease in Norway, the Netherlands, the United Kingdom, or in Russia until 2006 (Hutchison, 1994, Volchkova, 2005 and Ahrend, de Rosa and Tompson, 2007).
There is extensive literature on the interaction between resource rents and institutions. Oil revenues have been shown to have adverse effects on property rights (Guriev, Kolotilin and Sonin, 2009), corporate governance (Blanchard et al., 1994, Durnev and Guriev, 2007), media freedom (Egorov, Guriev and Sonin, 2009), institutions of democracy (Ross, 2001), and reforms that improve the operating environment for medium-sized businesses in non-resource sectors (Amin and Djankov, 2009). 4 In unstable societies resource revenues may substantially undermine social cohesion, increasing the likelihood of civil unrest and armed conflict (Ross, 2006). As those institutions listed above have a positive effect on long-term growth, the negative impact of resource wealth suggests an explanation of the resource curse phenomenon.
The empirical debate is far from complete. Many of the cross-country results are not robust in respect of the sample countries and time period. Moreover, cross-country growth regressions suffer from well-known methodological problems, primarily difficulties in establishing causality in light of possible reverse causality and omitted variables in the regression. In a cross-section of countries, it is impossible to control for all the factors that may influence growth; and there may be feedback effects from growth to its supposed determinants. Recent studies on the effect of resource abundance on institutions use techniques that avoid these problems, but do not focus on the causal effect of resource abundance on growth and development.
4See also Esanov, Raiser and Buiter (2001) for early evidence of the adverse impact of oil revenues on reform progress in Azerbaijan, Kazakhstan, Turkmenistan and Uzbekistan.
10
2. POLICY GOALS AND TOOLS Resource-rich economies face a number of difficult policy problems. These include problems with respect to the natural resource sector itself – in particular, how fast to develop the sector and whether to front-load extraction as much as possible or delay it over time (Box 1). Beyond this question, the main challenge is to develop policies that will allow the economy to benefit from resource revenues while mitigating the associated resource curse. The arguments made in the previous section suggest that such policies should include: economic diversification; reducing macroeconomic volatility; financial development; and reducing inequality.
Diversification addresses the root cause of the resource curse – the bias generated by resource rents. By doing so, it creates an environment that is more conducive to productive investment and to better institutions. In a sense, diversification acts like a commitment device; even if it is costly in the short term (by channelling public investment away from the resource sector, for example), it increases investment and growth in the long term. At the same time, it makes a resource-rich economy less vulnerable to external shocks and therefore less volatile.
Policies that reduce volatility lower risk in the economy and so weaken one of the links through which commodity dependence can depress investment and long-term growth. The reduction of risk is also desirable in itself.
Promoting financial development acts as a horizontal diversification policy, as it provides disproportionate support to financially dependent industries in non-resource sectors.
In addition to its direct benefits for growth (particularly by allowing a wider group to access investment and education opportunities) reducing inequality can weaken an important incentive that stands in the way of institutional development in resource-rich countries – namely rent-seeking that is relatively more attractive if its fruits do not have to be shared widely.
11

Box 1. The optimal rate of resource extraction Should countries front-load resource extraction as much as technically feasible or should they try to spread extraction over a long period? On the one hand, immediately extracting as much resource as possible could help avoid an underdevelopment trap by financing a “big push”. On the other hand, it might be rational to save non-renewable resources for future generations when they could be extracted using more efficient technologies. In addition, the rate of resource extraction could affect international commodity prices. Governments of oil-rich countries could seek to slow down oil extraction to raise the world oil price and maximise revenue. However, this may be risky if high oil prices encourage investment in alternative technologies that over time challenge the dominance of oil.
Assuming that no single producer enjoys enough market power to “play” the market and that resource demand is constant over time, the present value maximising extraction path is one that keeps the resource price (net of unit extraction costs) increasing at the rate of interest (and thus the present value of a unit extracted remains unchanged over time, Hotelling, 1931). This implies that output will decline monotonically. A critical assumption is obviously the profile of demand. If demand is assumed to rise – for example, because of world economic growth – it may well be optimal to have a rising extraction path. If demand is expected to fall – say, because of alternative technologies –more front-loading extraction could be the best option.
Models based on the level of proven reserves in the oil-rich countries and assumptions about future demand, future technologies and extraction costs suggest that, on balance, hydrocarbon-rich transition countries undertake too little – rather than too much –extraction at present, and should invest more in future extraction capacity.* These countries possess substantial oil and gas reserves (equivalent to more than 50 years of production) implying that the risk of unjustly expropriating the wealth of future generations is low. That said, the models typically do not take into account institutional development. If institutions are expected to improve over time, there could be a case for back-loading extraction, as future revenues would then be used with higher social returns and the negative effects of resource rents on institutions would be reduced.
In practice, increasing investment in long-term extraction capacity is difficult even during times of high oil prices because of high investor uncertainty. In addition, a project that is too risky for private investors should arguably also be considered as too risky for the state, although in some cases governments may use additional tax incentives to attract private investors to long-term projects.
__________________
* Based on the standard Hotelling analysis, Heal (2007) arrives at the opposite result. However, this analysis does not account for the market power of the major oil producers or for the risk of arrival of alternative technologies in the foreseeable future.
The remainder of this section briefly discusses the policy tools that can be employed to advance these objectives.
12
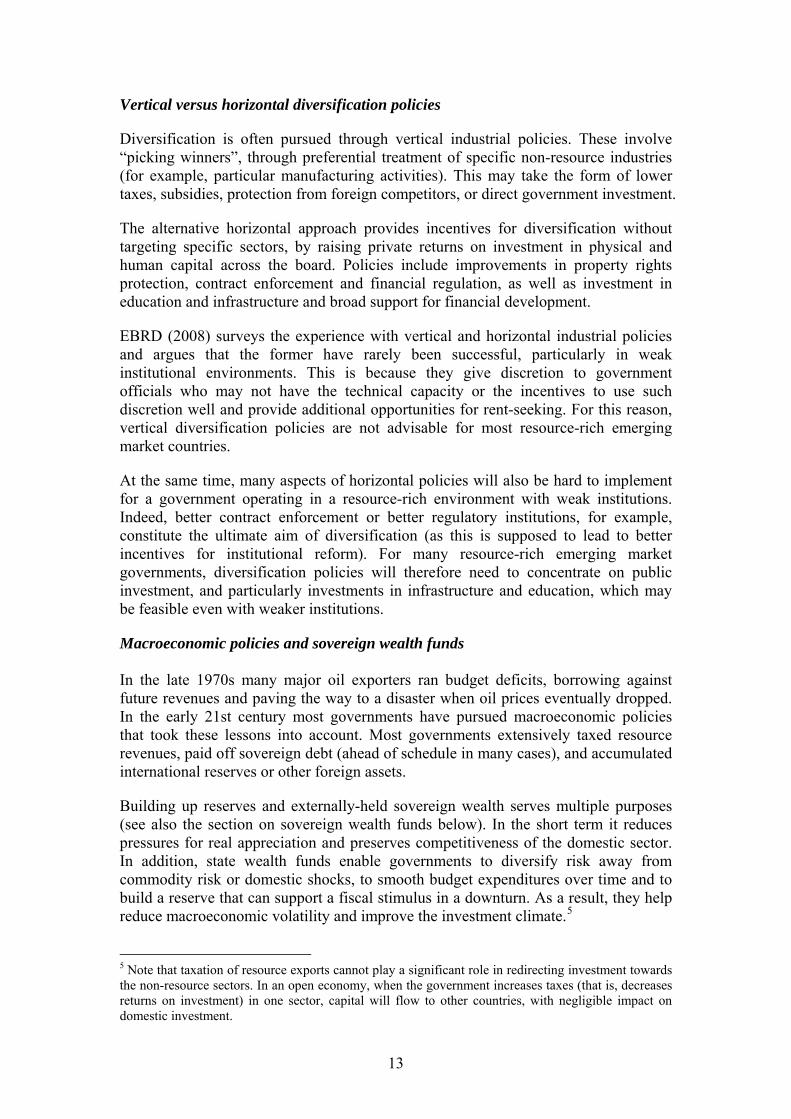
Vertical versus horizontal diversification policies
Diversification is often pursued through vertical industrial policies. These involve “picking winners”, through preferential treatment of specific non-resource industries (for example, particular manufacturing activities). This may take the form of lower taxes, subsidies, protection from foreign competitors, or direct government investment.
The alternative horizontal approach provides incentives for diversification without targeting specific sectors, by raising private returns on investment in physical and human capital across the board. Policies include improvements in property rights protection, contract enforcement and financial regulation, as well as investment in education and infrastructure and broad support for financial development.
EBRD (2008) surveys the experience with vertical and horizontal industrial policies and argues that the former have rarely been successful, particularly in weak institutional environments. This is because they give discretion to government officials who may not have the technical capacity or the incentives to use such discretion well and provide additional opportunities for rent-seeking. For this reason, vertical diversification policies are not advisable for most resource-rich emerging market countries.
At the same time, many aspects of horizontal policies will also be hard to implement for a government operating in a resource-rich environment with weak institutions. Indeed, better contract enforcement or better regulatory institutions, for example, constitute the ultimate aim of diversification (as this is supposed to lead to better incentives for institutional reform). For many resource-rich emerging market governments, diversification policies will therefore need to concentrate on public investment, and particularly investments in infrastructure and education, which may be feasible even with weaker institutions.
Macroeconomic policies and sovereign wealth funds In the late 1970s many major oil exporters ran budget deficits, borrowing against future revenues and paving the way to a disaster when oil prices eventually dropped. In the early 21st century most governments have pursued macroeconomic policies that took these lessons into account. Most governments extensively taxed resource revenues, paid off sovereign debt (ahead of schedule in many cases), and accumulated international reserves or other foreign assets.
Building up reserves and externally-held sovereign wealth serves multiple purposes (see also the section on sovereign wealth funds below). In the short term it reduces pressures for real appreciation and preserves competitiveness of the domestic sector. In addition, state wealth funds enable governments to diversify risk away from commodity risk or domestic shocks, to smooth budget expenditures over time and to build a reserve that can support a fiscal stimulus in a downturn. As a result, they help reduce macroeconomic volatility and improve the investment climate.5
5 Note that taxation of resource exports cannot play a significant role in redirecting investment towards the non-resource sectors. In an open economy, when the government increases taxes (that is, decreases returns on investment) in one sector, capital will flow to other countries, with negligible impact on domestic investment.
13

Aside from stabilising the economy, state wealth funds can also support diversification by limiting rent-seeking. By channelling resources to pre-defined and transparent uses – for example, spending in a downturn, specific forms of public investment or saving funds for future generations – sovereign wealth funds make it more difficult to divert resource rents for private gain. This, in turn, can begin to redirect the incentives of economic and political elites towards policies and institutions that support growth. The success of wealth funds in this respect will depend on whether they are strong enough to resist “raiding” for extraneous purposes, and on the transparency of the spending that they are meant to finance.
Another common long-term objective is to save wealth for future generations with the view to sustain the level of income when deposits become depleted or if the resource price permanently declines. In practice, to effectively counteract sharp falls in commodity prices and depletion of deposits, the reserves must add up to a high multiple of GDP, as demonstrated by the example of Kiribati, a small Pacific island which established one of the first stabilisation funds in 1956. Kiribati’s fund remains to date the largest sovereign wealth fund relative to GDP, yet it was insufficient to shield the economy from the phosphates depletion shock in 1979 (see Box 2).
Box 2. Sovereign wealth funds: the Kiribati experience
Kiribati is a small archipelago of islands in the South Pacific with a population of approximately 100,000. Mining of phosphates had been the main economic activity since the early 20th century, accounting for around 80 per cent of export receipts (the rest was contributed mainly by fishing). In 1956, the British colonial government established the Revenue Equalisation Reserve Fund (RERF), one of the first sovereign wealth funds in the world (Kuwait Investment Authority was established three years earlier). Fund revenues stemmed primarily from phosphate mining royalties until the mines were fully depleted in 1979, at the time of independence.
Back then the RERF was worth approximately 1.5 times GDP and the economy had developed little private economic activity outside the phosphates sector (in fact, most fishing has been done by foreign fishing fleets in exchange for fishing licences). Under these circumstances the accumulated sovereign wealth endowment was not sufficient to prevent a sharp economic contraction. Per capita GDP was cut in half over the next couple of years and the economy has been relying on foreign aid ever since.
The sovereign wealth fund continued to provide a major part of government revenue. In 1996 the parliament agreed in principle to hold the RERF’s expected real per capita value constant for future generations. The value of the fund peaked with the stock market in 2000, at eight times GDP, but has since declined to around three times GDP, negatively affected by large fiscal deficits and revaluation of assets. See Purfield (2005) for further discussion.
14

Financial development Financial development can support diversification in resource-rich economies through several channels. First, as already discussed, it mitigates the effect of resource price volatility and so increases incentives to invest. Second, functioning financial markets should, in principle, disproportionally benefit investors in non-resource industries as those industries are more dependent on external finance than the resource sector (Rajan and Zingales, 1998). Lastly, a developed financial system reduces inequality by giving more people access to credit and therefore opportunities to invest, including in their own education.
Financial development policies are well-known and include improved regulation of banks and security markets, the introduction of deposit insurance and credit history bureaux and the establishment of effective court systems. However, the fundamental problem is that it may be particularly difficult to undertake such reforms in weak institutional environments that need them the most. Nonetheless, most emerging market countries have taken initial steps in this regard.
Reducing inequality
Redistributing resource rents to the broader public reduces the ruling elite’s interest in rent-seeking and therefore promotes development of institutions. In developed countries, such redistribution can be carried out directly through progressive taxation. In developing countries with weak government, progressive taxation does not work as the rich can avoid paying taxes. Most redistribution policies in these circumstances take the form of public projects financed by the resource rents accumulated by governments or free provision of public goods, such as education and health care, which are relatively more valuable for the poor.
Ideally, policies aimed at combating inequality should include improving financial institutions, reforming education systems and facilitating labour mobility. In practice, resources are often channelled to existing inefficient structures rather to emerging or reforming ones.
15
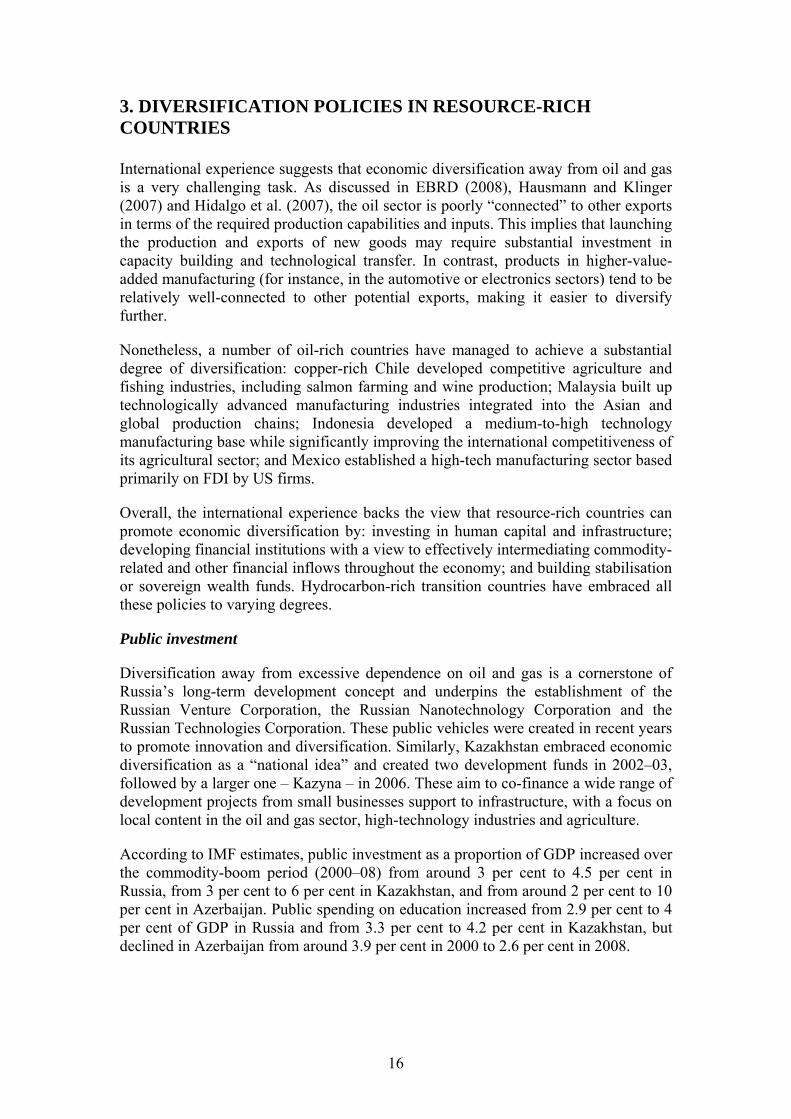
3. DIVERSIFICATION POLICIES IN RESOURCE-RICH COUNTRIES International experience suggests that economic diversification away from oil and gas is a very challenging task. As discussed in EBRD (2008), Hausmann and Klinger (2007) and Hidalgo et al. (2007), the oil sector is poorly “connected” to other exports in terms of the required production capabilities and inputs. This implies that launching the production and exports of new goods may require substantial investment in capacity building and technological transfer. In contrast, products in higher-value-added manufacturing (for instance, in the automotive or electronics sectors) tend to be relatively well-connected to other potential exports, making it easier to diversify further.
Nonetheless, a number of oil-rich countries have managed to achieve a substantial degree of diversification: copper-rich Chile developed competitive agriculture and fishing industries, including salmon farming and wine production; Malaysia built up technologically advanced manufacturing industries integrated into the Asian and global production chains; Indonesia developed a medium-to-high technology manufacturing base while significantly improving the international competitiveness of its agricultural sector; and Mexico established a high-tech manufacturing sector based primarily on FDI by US firms.
Overall, the international experience backs the view that resource-rich countries can promote economic diversification by: investing in human capital and infrastructure; developing financial institutions with a view to effectively intermediating commodity-related and other financial inflows throughout the economy; and building stabilisation or sovereign wealth funds. Hydrocarbon-rich transition countries have embraced all these policies to varying degrees.
Public investment
Diversification away from excessive dependence on oil and gas is a cornerstone of Russia’s long-term development concept and underpins the establishment of the Russian Venture Corporation, the Russian Nanotechnology Corporation and the Russian Technologies Corporation. These public vehicles were created in recent years to promote innovation and diversification. Similarly, Kazakhstan embraced economic diversification as a “national idea” and created two development funds in 2002–03, followed by a larger one – Kazyna – in 2006. These aim to co-finance a wide range of development projects from small businesses support to infrastructure, with a focus on local content in the oil and gas sector, high-technology industries and agriculture.
According to IMF estimates, public investment as a proportion of GDP increased over the commodity-boom period (2000–08) from around 3 per cent to 4.5 per cent in Russia, from 3 per cent to 6 per cent in Kazakhstan, and from around 2 per cent to 10 per cent in Azerbaijan. Public spending on education increased from 2.9 per cent to 4 per cent of GDP in Russia and from 3.3 per cent to 4.2 per cent in Kazakhstan, but declined in Azerbaijan from around 3.9 per cent in 2000 to 2.6 per cent in 2008.
16

Financial development An important development of the 2000s in hydrocarbon-rich transition economies (with the probable exception of Turkmenistan) has been very rapid financial development. Even though nominal GDP in Russia grew eight-fold between 1999 and 2008, bank credit to the private sector not only kept pace but increased from under 10 per cent of GDP in 1999 to over 40 per cent by the end of 2008 (Chart 7). Kazakhstan saw an even faster growth of its banking system, with the credit-to-GDP ratio peaking at 60 per cent in mid-2007 compared to 7 per cent at the end of 1999. In Azerbaijan the stock of bank sector credit increased from 10 per cent of GDP in mid-2005 to 19 per cent in mid-2009, with year-on-year growth of aggregate loan portfolio exceeding 100 per cent.
The rapid growth of bank loans was made possible through the abolition of capital controls, the active use of wholesale funding markets (particularly in the form of international syndicated loans), and the entry of foreign banks (except in Azerbaijan). As a result, the loan-to-deposit ratio in Kazakhstan peaked at almost 200 per cent and approached 160 per cent in Russia (Chart 8). In Azerbaijan the ratio exceeded 150 per cent by mid-2008, and increased to 200 per cent in 2009 as a result of a net deposit outflow coupled with liquidity support to the banking system. Although the speed of financial deepening (relative to GDP) was generally in line with recent experiences of other transition countries, the loan-to-deposit ratios in these three resource-rich countries stayed well above the regional average.
17

Chart 7. Credit to the private sector
0
10
20
30
40
50
60
70D
ec 9
9
Ap
r 0
0
Au
g 0
0
Dec
00
Ap
r 0
1
Au
g 0
1
Dec
01
Ap
r 0
2
Au
g 0
2
Dec
02
Ap
r 0
3
Au
g 0
3
Dec
03
Ap
r 0
4
Au
g 0
4
Dec
04
Ap
r 0
5
Au
g 0
5
Dec
05
Ap
r 0
6
Au
g 0
6
Dec
06
Ap
r 0
7
Au
g 0
7
Dec
07
Ap
r 0
8
Au
g 0
8
Dec
08
Ap
r 0
9
Russia Kazakhstan Azerbaijan Other transition countries
Per cent of GDP
Sources: Central banks, EBRD, authors’ calculations. Note: Unweighted average for other transition countries.
Chart 8. Loan-to-deposit ratios
80
90
100
110
120
130
140
150
160
170
180
190
200
De
c 9
9
Ap
r 00
Au
g 0
0
De
c 0
0
Ap
r 01
Au
g 0
1
De
c 0
1
Ap
r 02
Au
g 0
2
De
c 0
2
Ap
r 03
Au
g 0
3
De
c 0
3
Ap
r 04
Au
g 0
4
De
c 0
4
Ap
r 05
Au
g 0
5
De
c 0
5
Ap
r 06
Au
g 0
6
De
c 0
6
Ap
r 07
Au
g 0
7
De
c 0
7
Ap
r 08
Au
g 0
8
De
c 0
8
Ap
r 09
Russia Kazakhstan
Azerbaijan Other transition countries (average)
Per cent
Sources: Central banks, EBRD, authors’ calculations. Note: Unweighted average for other transition countries.
18

Financial sector growth was assisted by a number of structural reforms, including the introduction and expansion of deposit insurance (from November 1999 in Kazakhstan, 2004 in Russia and 2005 in Azerbaijan), improved disclosure of effective interest rates to customers, and revisions to collateral and bankruptcy legislation. All three countries upgraded their frameworks for credit history bureaux and score highly on the World Bank’s Doing Business Credit Information Index. However, credit bureau coverage remains limited (estimated at 25 per cent of the adult population in Kazakhstan, 10 per cent in Russia and nil in Azerbaijan). Furthermore, only in Russia did structural reforms in the financial sector outpace the average of non-oil-rich transition countries, as reflected in the EBRD’s financial sector transition indicators (Chart 9). The lower score in Azerbaijan in part reflects stringent restrictions on the entry of foreign banks.
Non-bank finance has also been growing, although at a slower pace. While stock markets in Russia experienced rapid growth before mid-2008, listings remained confined to a relatively small number of very large companies. (The Russian stock market had the largest average company capitalisation of all markets surveyed by Standard and Poor’s in 2008.) As part of a diversification agenda (and encouraged by the earlier successes of oil-rich Bahrain and Dubai), the Russian authorities launched an initiative in 2007–08 to develop Moscow into an international financial centre. Some important steps undertaken include changes in legislation that exempt derivatives and term contracts from restrictions on gambling. However, the implementation of the reform agenda remains in its early stages – for example, Russia has yet to pass a law on insider trading – and the ultimate success of the initiative will depend on the establishment of an effective and independent judiciary and on less corrupt law enforcement.
Chart 9. Number of financial sector transition indicator upgrades, 2000-08
0
1
2
3
4
5
6
7
8
Russia Other transitioncountries (average)
Kazakhstan Azerbaijan Turkmenistan
Banking NBFIs
Source: EBRD. Note: Based on indicators for banking sector and non-bank financial institutions (NBFIs).
19

Sovereign wealth funds
To accumulate “excess” government revenues stemming from oil and gas during the years of high oil prices, hydrocarbon-rich transition countries have established sovereign wealth funds. Azerbaijan set up the State Oil Fund in 1999, Kazakhstan followed suit with its National Fund in 2000, and Russia created the Stabilisation Fund in 2004 (later subdivided into the Reserve Fund and the National Wealth Fund in 2006 – see Box 3). Turkmenistan is in the process of setting up a similar fund. By the second half of 2008 these funds had accumulated substantial reserves. The largest of them in absolute terms (Russia’s) peaked at US$ 225 billion, and the largest in relative terms (Kazakhstan’s) reached almost 30 per cent of GDP. Despite their rapid growth, transition countries’ sovereign wealth funds remain much smaller as a percentage of GDP than those of some other major oil exporters, such as Kuwait, the United Arab Emirates (Abu Dhabi) and Norway, which established funds years earlier (Chart 10).
Chart 10. Sovereign wealth fund assets
0
50
100
150
200
250
300
350
Ven
ezu
ela
Ira
n
Au
str
alia
Nig
eri
a
Mal
ays
ia
Ru
ss
ia
Om
an
Aze
rbai
jan
Kaz
akh
sta
n
Alg
eri
a
Qa
tar
Lib
ya
Ba
hra
in
No
rway
Sa
ud
i A
rab
ia
Ku
wai
t
Sin
ga
po
re
Bru
nei
UA
E
Kir
iba
ti
Per cent of GDP
Sources: Sovereign Wealth Fund Institute, IMF, authors’ calculations.
20

Box 3. Russia’s reserves and national wealth funds The Russian Stabilisation Fund was established on 1 January 2004 and took its revenue from oil export duties and extraction taxes when the Urals brand oil price exceeded a certain threshold (initially set at US$ 27 per barrel). Export duties are, in turn, set by the government and reviewed regularly, depending on oil price movements. The Fund was set up to finance budget deficits when the oil price fell below that same threshold. The Fund could also be used for other purposes, provided that its total assets exceeded 500 billion roubles (US$ 17 billion at the time). When this target was first surpassed in 2005, some of the savings were used to prepay federal external debt and finance the deficit of the State Pension Fund. The Stabilisation Fund is managed by the Ministry of Finance and is invested in highly rated securities issued by foreign governments. Fund accounts are published monthly.
Then in 2006 the Fund’s framework underwent reform. Sources of revenue were augmented to include gas export duties (in addition to oil export duties), and the Fund was subdivided into the Reserve Fund and the National Welfare Fund. The former is capped at 10 per cent of forecast GDP, to be invested into highly rated liquid securities issued by foreign governments or international organisations. Its assets can be used to prepay federal debt or finance spending if oil and gas revenues fall short of a target predefined in the budget.
When the Reserve Fund reaches 10 per cent of GDP, oil and gas revenues in excess of the target are channelled to the National Welfare Fund, whose investment criteria for the latter are similar to those of the Reserve Fund, except that part of the National Welfare Fund assets can be invested in equity and bonds of domestic and foreign enterprises or placed with the state development bank, Vnesheconombank (including in rouble-denominated deposits, up to a certain limit). The uses of the National Welfare Fund are exclusively to co-finance voluntary pension contributions and finance State Pension Fund deficits, complementing or replacing federal budget transfers to the Pension Fund.
Overall, this framework has proved to be useful for accumulating fiscal reserves during the commodity boom and aiding macroeconomic management. It could also serve as a commitment device to ring-fence resource revenues and redistribute them broadly. That said, current rules leave room for substantial discretion regarding the proportion of oil rents deposited to the sovereign wealth funds and how they can be spent. The current commodity boom-bust cycle – the first since the establishment of the Stabilisation Fund –will be an important test of the strength and resilience of the Fund’s institutional
21

4. ASSESSMENT While it may be too early to assess the success of development policies in hydrocarbon-rich countries in the region, the course of the commodity price cycle can nonetheless provide a few early insights.
Diversification Measuring diversification away from oil and gas accurately is a challenging task because empirical measures of production or export shares tend to be affected by commodity prices. Higher commodity prices increase the nominal value of production and exports of primary natural resources. They may also induce temporary relocation of resources towards extraction and related sectors. Therefore, measures of economic diversification in oil-rich countries tend to decrease naturally with increases in the oil price, even in countries perceived to have relatively well-diversified economies such as Malaysia and Mexico. For instance, as commodity prices increased between 2000 and 2005, the share of medium and high-value-added manufacturing in total exports declined in commodity-exporting countries such as Australia, Chile and Norway (Chart 11).
Chart 11. Share of higher-value-added manufacturing in exports
0
10
20
30
40
50
60
70
80
Nig
eri
a
Ve
nez
ue
la
Ku
wa
it
Ch
ile
Qa
tar
Sa
ud
i Ara
bia
Alb
an
ia
Ru
ssia
No
rwa
y
Au
stra
lia
FY
R M
aced
on
ia
Ind
on
esia
Ro
ma
nia
Geo
rgia
Po
lan
d
Slo
vak
Re
p.
Cze
ch
Rep
.
Mex
ico
Ma
lay
sia
Ge
rma
ny
2000 2005
Per cent
Source: UNIDO. Note: For definition of higher-value-added manufacturing see UNIDO (2009).
To isolate commodity cycle effects as far as possible, one should analyse the export structures at similar points in the oil price cycle – that is, when oil prices were almost identical in real terms (using the US consumer price index as a deflator). Such an approach is particularly useful for detecting signs of persistent structural changes once oil price increases have been reversed – since most of the resource curse channels involve such changes.
22

By looking at production as well as merchandise exports, it is possible to track the degree of economic diversification. Exports provide more consistent data coverage and may be a better measure of competitiveness. This is because countries tend to export goods where they have comparative advantage, prices of exports are set in international markets and are less subject to distortions, and exports cannot be easily influenced by domestic protectionist policies. The downside of this approach is the potential exclusion of internationally competitive non-exporting industries (particularly in large economies such as Russia’s), as well as tradeable services such as finance and tourism. As a result, it is important to consider both export and production structures.
Chart 12a shows the structure of Russian merchandise exports in December 2004 to April 2005, when Urals brand oil price averaged US$ 42 per barrel (US$ 46 in 2008 prices), and in December 2008 to April 2009, when the oil price returned to the level of early 2005, averaging US$ 43 per barrel. For comparison, the period December 2007 to April 2008 is also shown (during which time Urals oil averaged US$ 95 a barrel). Chart 12b shows GDP structures based on national accounts for the first quarters of 2005, 2008 and 2009, respectively. Overall, headline figures suggesting an increase in Russia’s dependence on oil and gas revenues in recent years appear to largely reflect higher oil prices. The share of crude oil and gas in total merchandise exports in 2009 fell back to approximately the levels of early 2005 as price increases of previous years were undone. In fact, the demand for higher-value-added manufacturing exports seems to have held up slightly better during the global economic crisis than the demand for fuel exports, particularly gas.
Chart 12a. Russia: structure of merchandise exports
5.9 5.1 6.2
50.545.1
49.8
43.549.9
44.0
0
10
20
30
40
50
60
70
80
90
100
Dec 04 - Apr 05 Dec 07 - Apr 08 Dec 08 - Apr 09
Higher-value-added manufacturing Other Crude oil and gas
Per cent
Sources: Rosstat and EBRD calculations. Note: Higher-value-added manufacturing includes machinery, equipment, vehicles and electronics. Other goods include refined oil and petrochemicals.
23

Chart 12b. Russia: structure of GDP
3.0 2.4 2.5
18.5 17.9 14.2
68.3 69.0 75.4
10.3 10.7 7.9
0
10
20
30
40
50
60
70
80
90
100
2005 Q1 2008 Q1 2009 Q1
Agriculture Manufacturing Other Extraction
Per cent
Sources: Rosstat and EBRD calculations. Note: Based on quarterly data excluding net taxes. Agriculture includes fishing.
However, the share of manufacturing and agriculture in total output continued to shrink, mirrored by expansion of non-tradeables (services and construction). These data may partly reflect the temporary impact of the economic crisis, which induced contracting trade volumes and industrial production across the world (which may explain the observed drop in the share of extraction industries in the total value added in the first quarter of 2009). Nonetheless, the breakdowns of GDP and exports at comparable points in the oil price cycle suggest that the Russian economy has not made significant progress in diversification toward non-resource tradeable sectors in recent years.
Chart 13 shows the evolution of the structure of merchandise exports over a longer period for Azerbaijan, Kazakhstan, Russia and other transition countries, highlighting points in time when oil prices were comparable in real terms. In Russia the structure of exports was similar at corresponding points in the oil price cycle, but Azerbaijan and Kazakhstan saw a gradual yet sustained decline in the export shares of agricultural produce and manufacturing (both in the lower-value-added and higher-value-added segments). Growing dependence on oil and gas exports over time partly reflects the successful development of new oil and gas fields based on production sharing agreements with international oil companies. However, it also suggests very limited progress, if any, in diversification efforts to date.
24
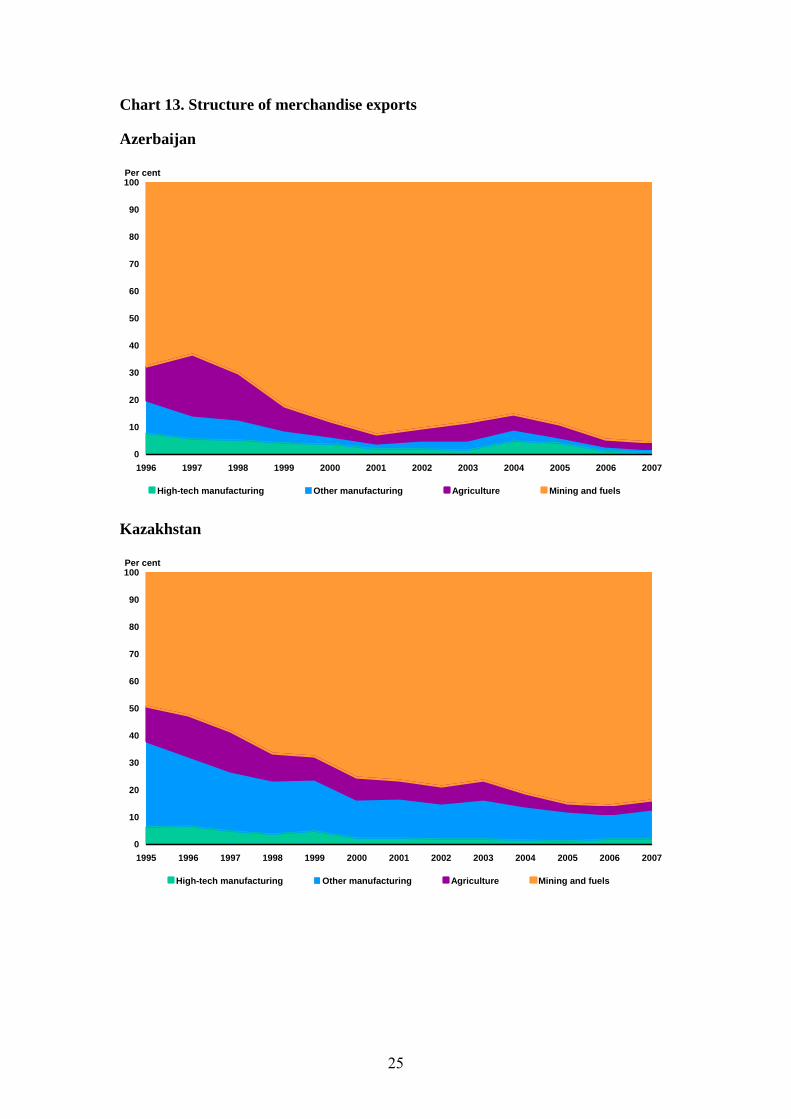
Chart 13. Structure of merchandise exports
Azerbaijan
0
10
20
30
40
50
60
70
80
90
100
1996 1997 1998 1999 2000 2001 2002 2003 2004 2005 2006 2007
High-tech manufacturing Other manufacturing Agriculture Mining and fuels
Per cent
Kazakhstan
0
10
20
30
40
50
60
70
80
90
100
1995 1996 1997 1998 1999 2000 2001 2002 2003 2004 2005 2006 2007
High-tech manufacturing Other manufacturing Agriculture Mining and fuels
Per cent
25

Russia
0
10
20
30
40
50
60
70
80
90
100
1994 1995 1996 1997 1998 1999 2000 2001 2002 2003 2004 2005 2006 2007
High-tech manufacturing Other manufacturing Agriculture Mining and fuels
Per cent
Other transition countries
0
10
20
30
40
50
60
70
80
90
100
1996 1997 1998 1999 2000 2001 2002 2003 2004 2005 2006 2007
High-tech manufacturing Other manufacturing Agriculture Mining and fuels
Per cent
Sources: WTO and authors’ calculations. Note: Authors' calculations based on export-weighted average of Armenia, Belarus, Bulgaria, Czech Republic, Estonia, FYR Macedonia, Georgia, Hungary, Kyrgyz Republic, Latvia, Lithuania, Moldova, Mongolia, Poland, Romania, Slovak Republic, Slovenia, Turkey and Ukraine. Comparable points: 1996 (oil at US$ 28 in 2008 prices) and 2002 (oil at US$ 30 in 2008 prices).
26

Macroeconomic policies
A steep drop in commodity prices in late 2008 was one of the key channels of transmission of the global economic and financial crisis, alongside a sharp reduction in financial flows and a fall in demand for manufactured goods and tradeable services. However, it is not obvious whether commodity exporters have been hit harder than other countries, as world prices for investment goods may have decreased more steeply than, for example, oil prices.
Indeed, if anything, commodity-rich countries seem to have been affected less severely than other countries. Chart 14 shows the relationship between the share of natural resources in countries’ total exports and the deviation of the 2009 output growth forecast from the 1999–2008 average. (The forecasts are from the October 2009 IMF World Economic Outlook for a broad sample of countries.) The correlation is positive, but weak. When differences in other key indicators, such as per capita GDP, are taken into account, commodity resources appear as a significant mitigating factor of the output decline in the broad sample (Berglöf et al., 2009).
The lack of a negative relationship may be because other countries, including those specialising in manufacturing, have been severely affected by capital flow reversals and lower global demand. Importantly, however, a number of commodity exporters have been able to soften the impact of the downturn by using accumulated sovereign reserves to deploy forceful fiscal and monetary stimuli.
Chart 14. Commodity dependence and crisis impact
Latvia
Qatar
Angola
-25
-20
-15
-10
-5
0
5
10
0 10 20 30 40 50 60 70 80 90 100
Fitted line Selected countries
Deviation of 2009 growth forecast from the 1999–2008 average growth (in percentage points)
Share of fuel and commodities in merchandise exports
Russia
Sources: WTO, IMF and authors’ calculations.
Indeed, fiscal and foreign currency reserves accumulated by major oil and gas producers have substantially widened the policy options available during the downturn. International reserves helped Azerbaijan to defend its currency and Russia and Kazakhstan to manage orderly currency depreciations in the face of lower oil
27
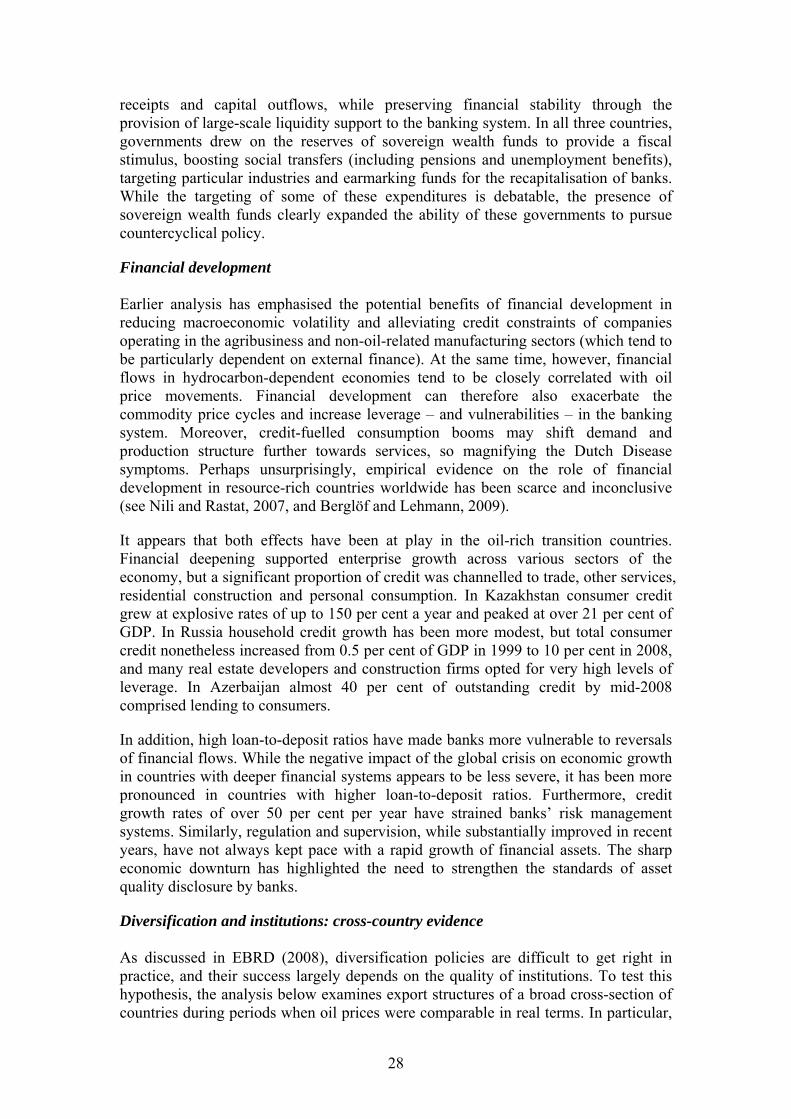
receipts and capital outflows, while preserving financial stability through the provision of large-scale liquidity support to the banking system. In all three countries, governments drew on the reserves of sovereign wealth funds to provide a fiscal stimulus, boosting social transfers (including pensions and unemployment benefits), targeting particular industries and earmarking funds for the recapitalisation of banks. While the targeting of some of these expenditures is debatable, the presence of sovereign wealth funds clearly expanded the ability of these governments to pursue countercyclical policy.
Financial development Earlier analysis has emphasised the potential benefits of financial development in reducing macroeconomic volatility and alleviating credit constraints of companies operating in the agribusiness and non-oil-related manufacturing sectors (which tend to be particularly dependent on external finance). At the same time, however, financial flows in hydrocarbon-dependent economies tend to be closely correlated with oil price movements. Financial development can therefore also exacerbate the commodity price cycles and increase leverage – and vulnerabilities – in the banking system. Moreover, credit-fuelled consumption booms may shift demand and production structure further towards services, so magnifying the Dutch Disease symptoms. Perhaps unsurprisingly, empirical evidence on the role of financial development in resource-rich countries worldwide has been scarce and inconclusive (see Nili and Rastat, 2007, and Berglöf and Lehmann, 2009).
It appears that both effects have been at play in the oil-rich transition countries. Financial deepening supported enterprise growth across various sectors of the economy, but a significant proportion of credit was channelled to trade, other services, residential construction and personal consumption. In Kazakhstan consumer credit grew at explosive rates of up to 150 per cent a year and peaked at over 21 per cent of GDP. In Russia household credit growth has been more modest, but total consumer credit nonetheless increased from 0.5 per cent of GDP in 1999 to 10 per cent in 2008, and many real estate developers and construction firms opted for very high levels of leverage. In Azerbaijan almost 40 per cent of outstanding credit by mid-2008 comprised lending to consumers.
In addition, high loan-to-deposit ratios have made banks more vulnerable to reversals of financial flows. While the negative impact of the global crisis on economic growth in countries with deeper financial systems appears to be less severe, it has been more pronounced in countries with higher loan-to-deposit ratios. Furthermore, credit growth rates of over 50 per cent per year have strained banks’ risk management systems. Similarly, regulation and supervision, while substantially improved in recent years, have not always kept pace with a rapid growth of financial assets. The sharp economic downturn has highlighted the need to strengthen the standards of asset quality disclosure by banks.
Diversification and institutions: cross-country evidence As discussed in EBRD (2008), diversification policies are difficult to get right in practice, and their success largely depends on the quality of institutions. To test this hypothesis, the analysis below examines export structures of a broad cross-section of countries during periods when oil prices were comparable in real terms. In particular,
28

average export structures of 96 countries (where data are available) are compared in 1991–92, when oil averaged US$ 30.3 per barrel in 2008 prices (adjusted using US consumer price index), and in 2001–03, when oil averaged US$ 31 per barrel in 2008 prices (for a list of countries see Annex 1).
The basic specification for the determinants of export structure can be written as:
ES0103i = + ES9192i + γGDPi + OILi + μZi + i (1)
The dependent variable ES0103, interpreted as a measure of diversification away from commodities, is the average share of higher-value-added manufacturing (transport, machinery, equipment and electronics) and food in merchandise exports in 2001–03, as reported by the World Trade Organization. These export items are technologically distanced from commodities – unlike, for example, petrochemicals or semi-finished steel. Furthermore, they constitute the bulk of advanced countries’ exports (around 70 per cent in the case of Germany and Japan, 60 per cent in the case of France and the United States, around half for Canada and the United Kingdom and around 30 per cent for Australia – compared with less than 10 per cent in Azerbaijan, Kazakhstan and Russia).
ES9192i is the average share of higher-value-added manufacturing and food in 1991–92, GDP is logarithm of the initial per capita GDP at purchasing power parity (PPP), OIL is oil rent (value of production at international prices) as a share of GDP at the start of the period, Z is a set of control variables, which include institutions and financial variable, and is the residual. The quality of institutions is measured by the World Bank’s Governance Index, which takes into account voter accountability, political stability, effectiveness of government, quality of regulations, rule of law and control of corruption. The first available observation is for 1996. Descriptive statistics for selected variables are presented in Table 1, for sources see Annex 2. Specification (1) is estimated by OLS.
29
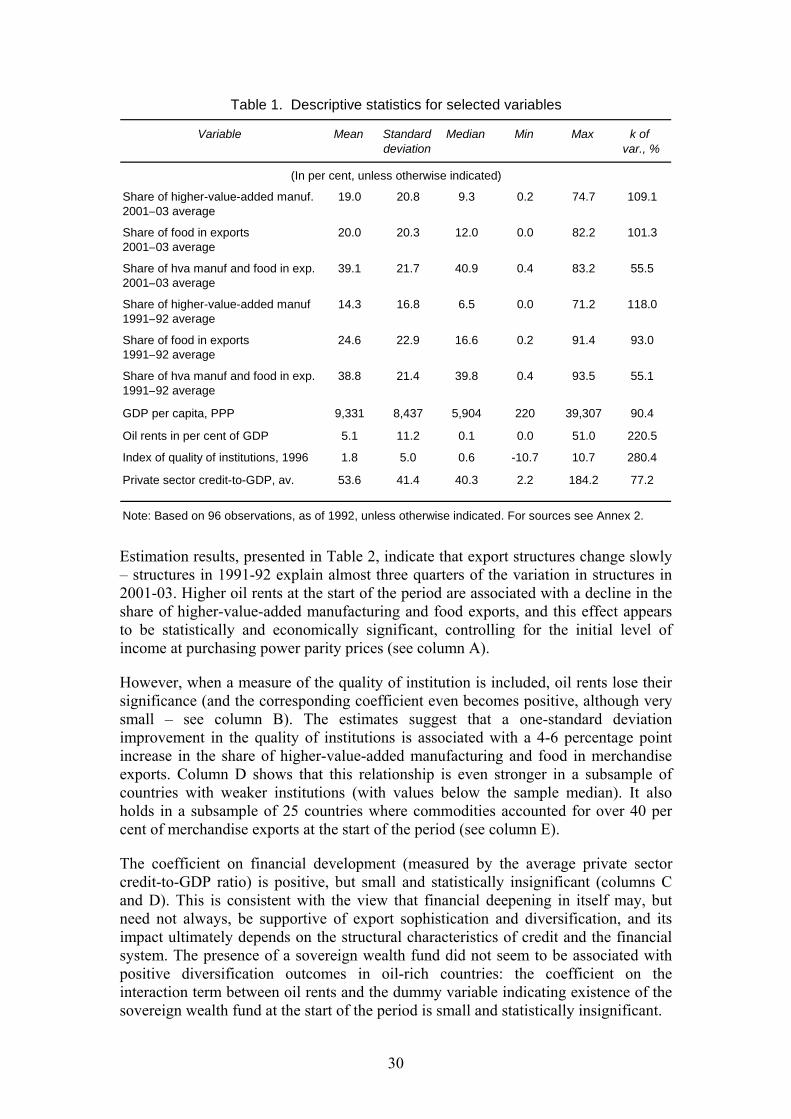
Table 1. Descriptive statistics for selected variables
Variable Mean Standard Median Min Max k of deviation var., %
(In per cent, unless otherwise indicated)
Share of higher-value-added manuf. 19.0 20.8 9.3 0.2 74.7 109.12001–03 average
Share of food in exports 20.0 20.3 12.0 0.0 82.2 101.32001–03 average
Share of hva manuf and food in exp. 39.1 21.7 40.9 0.4 83.2 55.52001–03 average
Share of higher-value-added manuf 14.3 16.8 6.5 0.0 71.2 118.01991–92 average
Share of food in exports 24.6 22.9 16.6 0.2 91.4 93.01991–92 average
Share of hva manuf and food in exp. 38.8 21.4 39.8 0.4 93.5 55.11991–92 average
GDP per capita, PPP 9,331 8,437 5,904 220 39,307 90.4
Oil rents in per cent of GDP 5.1 11.2 0.1 0.0 51.0 220.5
Index of quality of institutions, 1996 1.8 5.0 0.6 -10.7 10.7 280.4
Private sector credit-to-GDP, av. 53.6 41.4 40.3 2.2 184.2 77.2
Note: Based on 96 observations, as of 1992, unless otherwise indicated. For sources see Annex 2.
Estimation results, presented in Table 2, indicate that export structures change slowly – structures in 1991-92 explain almost three quarters of the variation in structures in 2001-03. Higher oil rents at the start of the period are associated with a decline in the share of higher-value-added manufacturing and food exports, and this effect appears to be statistically and economically significant, controlling for the initial level of income at purchasing power parity prices (see column A).
However, when a measure of the quality of institution is included, oil rents lose their significance (and the corresponding coefficient even becomes positive, although very small – see column B). The estimates suggest that a one-standard deviation improvement in the quality of institutions is associated with a 4-6 percentage point increase in the share of higher-value-added manufacturing and food in merchandise exports. Column D shows that this relationship is even stronger in a subsample of countries with weaker institutions (with values below the sample median). It also holds in a subsample of 25 countries where commodities accounted for over 40 per cent of merchandise exports at the start of the period (see column E).
The coefficient on financial development (measured by the average private sector credit-to-GDP ratio) is positive, but small and statistically insignificant (columns C and D). This is consistent with the view that financial deepening in itself may, but need not always, be supportive of export sophistication and diversification, and its impact ultimately depends on the structural characteristics of credit and the financial system. The presence of a sovereign wealth fund did not seem to be associated with positive diversification outcomes in oil-rich countries: the coefficient on the interaction term between oil rents and the dummy variable indicating existence of the sovereign wealth fund at the start of the period is small and statistically insignificant.
30

Table 2. Determinants of export structure
Model A B C D E
Method OLS
Dependent variable Share of hva manufacturing and food in exports, 2001 –03
Exports structure in 1991–92 0.784 0.806 0.803 0.815 0.756(0.061)*** (0.059)*** (0.058)*** (0.073)*** (0.067)***
GDP per capita 1.779 –2.874 –2.472 –3.664 –5.608Log, PPP (0.935)* (1.769) (1.818) (2.057) (2.094)**
Oil rents –0.230 0.013 –0.051 0.027 0.159(In per cent of GDP) (0.114)** (0.127) (0.150) (0.151) (0.144)
Oil rents * SWF dummy –0.045(0.103)
Quality of institutions, index 1.222 1.074 3.779 1.130(0.549)** (0.620)* (0.943)*** (0.484)**
Private sector credit-to-GDP 0.009 0.012(period average) (0.041) (0.093)
Constant –5.487 30.282 26.709 39.716 51.026(7.724) (14.615)** (14.824)* (16.101)** (18.151)**
R2 0.72 0.75 0.76 0.79 0.79
Number of observations 96 89 86 43 25
Source: Authors' calculations.
Note: Robust standard errors in parentheses. Values significant at the 10% level are marked with *; at the 5% level, with **; at the 1% level, with ***. In column D only countries withthe value of index of institutions below the median are included. In column E only countries where commodities accounted for more than 40 per cent of merchandise exports at the startof the period are included.
Overall, the results suggest that the quality of institutions is a powerful predictor of shifts towards export structures based on higher-value-added manufacturing and food exports. Oil rents per se are negatively associated with diversification outcomes, but this association disappears when the quality of institutions is controlled for, suggesting that oil rents influence diversification outcomes primarily through their impact on the institutional environment.
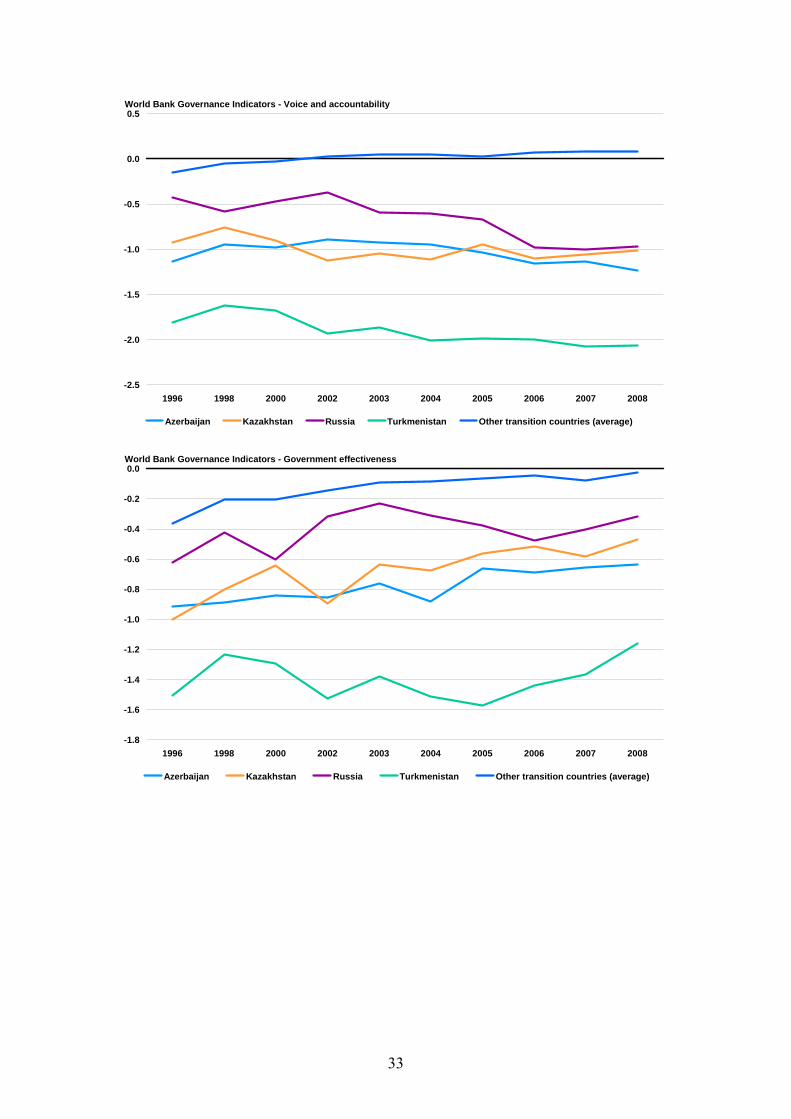
This leads to the question of how institutions have been affected by natural resource abundance and whether the oil-rich countries in the region have succeeded in improving the quality of institutions. Chart 15 plots the evolution of World Bank Governance Indicators since 1996 (when the first set of indicators was published) for hydrocarbon-rich transition countries, as well as for a simple average of other transition countries. The overall index takes into account the rule of law, voter accountability, effectiveness of government, regulatory quality, control of corruption, political stability and the absence of violence.
From the start, the perceived quality of institutions in the hydrocarbon-rich countries was substantially below the transition country average. Furthermore, while the transition average has been steadily improving over time, the perceived quality of institutions in most oil-rich countries “peaked” in 1998–2000, at the bottom of the oil
31

price cycle, and declined as oil prices started recovering. For Kazakhstan, even though in recent years this perceived quality improved and exceeded the peak of 1998, the gap in relation to the non-oil-rich transition country average remained greater than in 1996. For all hydrocarbon-rich countries the gap widened more significantly for the indicators tracking rule of law and voice and accountability, while the effectiveness of government is perceived to have improved.
Chart 15. World Bank Governance Indicators, 1996-2008
-10
-9
-8
-7
-6
-5
-4
-3
-2
-1
0
1
1996 1998 2000 2002 2003 2004 2005 2006 2007 2008
Azerbaijan Kazakhstan Russia Turkmenistan Other transition countries (average)
World Bank Governance Indicators - Overall
-1.6
-1.4
-1.2
-1.0
-0.8
-0.6
-0.4
-0.2
0.0
1996 1998 2000 2002 2003 2004 2005 2006 2007 2008
Azerbaijan Kazakhstan Russia Turkmenistan Other transition countries (average)
World Bank Governance Indicators - Rule of law
32
-2.5
-2.0
-1.5
-1.0
-0.5
0.0
0.5
1996 1998 2000 2002 2003 2004 2005 2006 2007 2008
Azerbaijan Kazakhstan Russia Turkmenistan Other transition countries (average)
World Bank Governance Indicators - Voice and accountability
-1.8
-1.6
-1.4
-1.2
-1.0
-0.8
-0.6
-0.4
-0.2
0.0
1996 1998 2000 2002 2003 2004 2005 2006 2007 2008
Azerbaijan Kazakhstan Russia Turkmenistan Other transition countries (average)
World Bank Governance Indicators - Government effectiveness
33

-1.6
-1.4
-1.2
-1.0
-0.8
-0.6
-0.4
-0.2
0.0
1996 1998 2000 2002 2003 2004 2005 2006 2007 2008
Azerbaijan Kazakhstan Russia Turkmenistan Other transition countries (average)
World Bank Governance Indicators - Control of corruption
Sources: World Bank and Kaufmann, Kraay and Mastruzzi (2009). Note: Higher values correspond to better institutions.
Case study: How Mongolia is fighting the resource curse
With mining accounting for roughly 25 per cent of GDP and 70 per cent of total exports, Mongolia fits well into the group of resource-rich transition countries studied in this paper. However, three features set it aside. First, it is much poorer and smaller, with per capita GDP at about 20 per cent of Russia’s, 30 per cent of Kazakhstan’s and 60 per cent of Turkmenistan’s. Second, its political institutions are ranked much higher, in line with advanced democracies (Table 3). Third, it is at an earlier stage of resource sector development, with a number of multi-billion investment projects under preparation, whose total exploration and investment costs are expected to exceed 200 per cent of 2008 GDP, and lead to annual revenue of about 100 per cent of 2008 GDP after they start production. Hence, Mongolia’s current resource streams are a small fraction of what is expected in the future. Together, these features create extraordinary challenges and opportunities. First, how can a small country that depends on foreign capital develop its resource sector in a way that makes it both attractive to foreign investment and allows it to keep most of its resource rents? Second, is there an opportunity to forestall the “resource curse” before the full brunt of revenue income materialises (particularly when political institutions are good)?
34

In the 1990s Mongolia’s resource regime was highly favourable to foreign investors, with licences often granted on a first-come, first-served basis and tax and royalty rates low by international standards. As a number of mining projects were successfully implemented and commodity prices rose sharply, the government – and public opinion – became increasingly concerned with capturing a larger share of resource rents. In 2006 the government introduced a 68 per cent surtax on corporate revenues once commodity prices exceeded pre-set thresholds, and announced its intention to obtain majority control over strategic mining assets (or at least 34 per cent if mines were developed privately).6 While Mongolia was not very different from other developing country resource exporters in this respect (particularly in Latin America, where several countries introduced similar windfall taxes at about the same time, or even nationalised their mining industries, see IMF, 2006, and Hogan and Sturzenegger, 2009), these decisions had costly repercussions. Mongolia’s attractiveness for minerals exploration, as published by the Fraser Institute, dropped from 3rd place out of 64 countries in 2005/06 to 57th out of 71 countries in 2008/09. Non-transparent gold sales have substantially increased in recent years. Most importantly, negotiations between the government and foreign mining companies relating to the large Oyu Tolgoi copper and gold mining project have been delayed. A number of foreign investors perceived policy uncertainty to be excessive and decided to leave the country. The Mongolian example therefore raises the question of whether it is possible to write international resource contracts that are more robust to large commodity price changes – a question that has attracted much recent interest (Aghion and Quesada, 2009). The second challenge is whether a country can forestall a resource curse by taking appropriate action before resource rents start arriving (or while they are comparatively modest). Based on the economic models surveyed in the paper, there is reason to be sceptical: it is expectations of future rents, together with pre-existing institutional constraints that determine institutional development. With regard to pre-existing institutions, Mongolia is something of a mix (Table 3). On the one hand it has a multi-party democracy, a free press and a vibrant network of non-governmental organisations, but on the other hand it tends to score worse than the transition economy average (but better than the average of resource-rich transition economies) on rule of law, regulatory quality and corruption perceptions. So Mongolia could be a test case on whether good political institutions can eventually lead to improvements in economic institutions, even in the presence of resource wealth, or whether the resource curse will begin to undermine political institutions as well. One channel through which Mongolia is attempting to forestall the resource curse is by using the international community as a commitment device. In 2007 Mongolia agreed with the Asian Development Bank, the EBRD and World Bank to establish a platform for sustainable mining sector development. The government joined the Extractive Industries Transparency Initiative (EITI) and developed a set of fiscal rules for the use of proceeds of the Development Fund – a ring-fenced fund generated by the windfall profit tax. Multilateral development banks (MDBs) have financed a number mining sector projects, in which companies were required to meet EITI accounting and publication standards, and undertake environmental and social action
6 A repeal of the windfall tax was announced in August 2009.
35

plans and public consultations in the project regions. More recently, the government has established a modern PPP framework to develop infrastructure for mining sector development, supported by MDBs. It remains to be seen whether the potential discipline that these initiatives provide can help offset incentives for rent-seeking, and contribute to the improvement of economic institutions more broadly.
Resource PPP GDP Democracy Rule Regul. Corruption exports per capita of law quality perception
(per cent) (US$) (–10 to 10) (0 to 10)
Mongolia 70.0 3,541 10.0 -0.5 -0.3 3.0Resource-rich CIS countries 76.0 8,770 -2.8 -1.0 -0.7 2.0All transition countries 28.5 11,937 4.9 -0.3 0.1 3.6Non-transition OECD countries 18.5 37,398 9.1 1.5 1.4 7.6
Sources: WTO, IMF, Polity IV database, World Bank, Transparency International, based on the latest data available (2007 or 2008).
Note: Resource-rich transition countries are Azerbaijan, Kazakhstan, Kyrgyz Rep., Russia and Turkmenistan. Resource export averages exclude Turkmenistan, Tajikistan and Uzbekistan.
(–2.5 to +2.5)
Table 3. Mongolia and comparator countries: key indicators
(unweighted averages across countries)
36
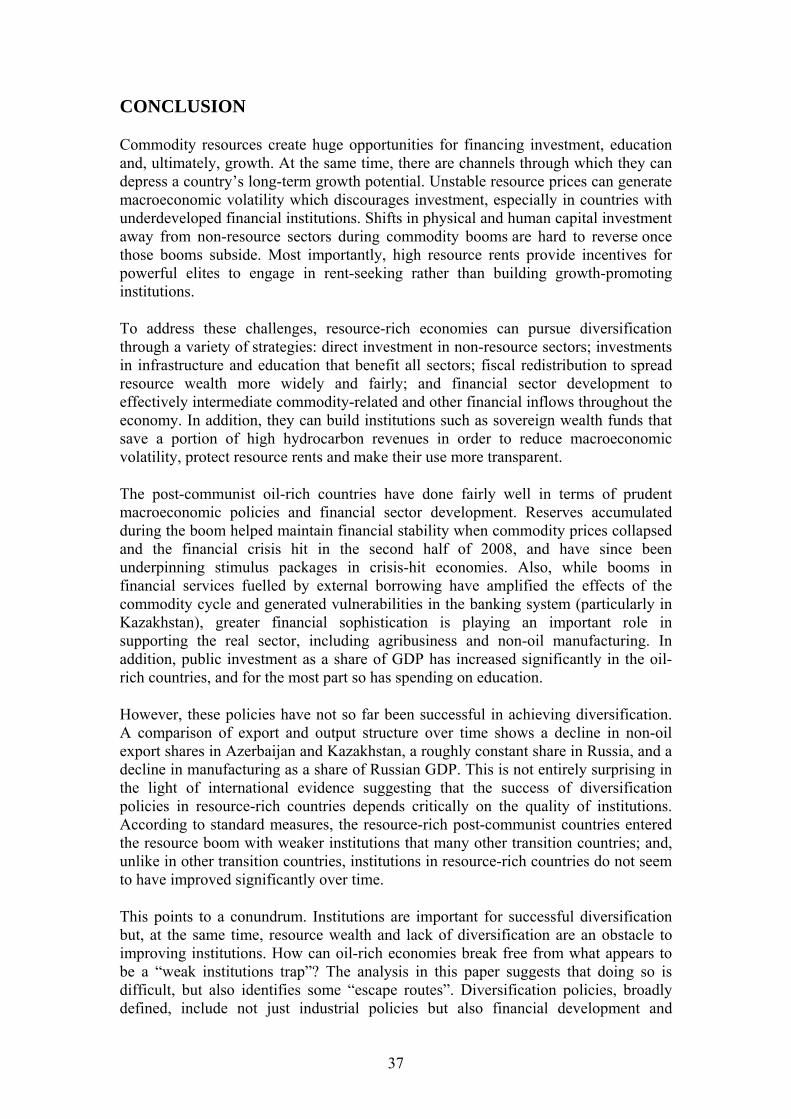
CONCLUSION
Commodity resources create huge opportunities for financing investment, education and, ultimately, growth. At the same time, there are channels through which they can depress a country’s long-term growth potential. Unstable resource prices can generate macroeconomic volatility which discourages investment, especially in countries with underdeveloped financial institutions. Shifts in physical and human capital investment away from non-resource sectors during commodity booms are hard to reverse once those booms subside. Most importantly, high resource rents provide incentives for powerful elites to engage in rent-seeking rather than building growth-promoting institutions.
To address these challenges, resource-rich economies can pursue diversification through a variety of strategies: direct investment in non-resource sectors; investments in infrastructure and education that benefit all sectors; fiscal redistribution to spread resource wealth more widely and fairly; and financial sector development to effectively intermediate commodity-related and other financial inflows throughout the economy. In addition, they can build institutions such as sovereign wealth funds that save a portion of high hydrocarbon revenues in order to reduce macroeconomic volatility, protect resource rents and make their use more transparent.
The post-communist oil-rich countries have done fairly well in terms of prudent macroeconomic policies and financial sector development. Reserves accumulated during the boom helped maintain financial stability when commodity prices collapsed and the financial crisis hit in the second half of 2008, and have since been underpinning stimulus packages in crisis-hit economies. Also, while booms in financial services fuelled by external borrowing have amplified the effects of the commodity cycle and generated vulnerabilities in the banking system (particularly in Kazakhstan), greater financial sophistication is playing an important role in supporting the real sector, including agribusiness and non-oil manufacturing. In addition, public investment as a share of GDP has increased significantly in the oil-rich countries, and for the most part so has spending on education.
However, these policies have not so far been successful in achieving diversification. A comparison of export and output structure over time shows a decline in non-oil export shares in Azerbaijan and Kazakhstan, a roughly constant share in Russia, and a decline in manufacturing as a share of Russian GDP. This is not entirely surprising in the light of international evidence suggesting that the success of diversification policies in resource-rich countries depends critically on the quality of institutions. According to standard measures, the resource-rich post-communist countries entered the resource boom with weaker institutions that many other transition countries; and, unlike in other transition countries, institutions in resource-rich countries do not seem to have improved significantly over time.
This points to a conundrum. Institutions are important for successful diversification but, at the same time, resource wealth and lack of diversification are an obstacle to improving institutions. How can oil-rich economies break free from what appears to be a “weak institutions trap”? The analysis in this paper suggests that doing so is difficult, but also identifies some “escape routes”. Diversification policies, broadly defined, include not just industrial policies but also financial development and
37

countercyclical macroeconomic policies. The latter have been broadly successful in oil-rich transition countries, but may not have gone far enough (or been in place for long enough) to have an impact on the production structure. Financial development, in particular, has a long way to go.
Finally, the experience with sovereign wealth funds demonstrates that even in environments with strong incentives for rent-seeking, it is possible to create new institutions that protect these rents and channel them toward more transparent uses. While rent-seeking is a powerful obstacle to better institutions, it is not the only incentive that matters. For example, as large business groups in Russia seek to attract international capital, they are becoming more interested in improving their corporate governance. Growing middle classes and global economic competition among large emerging markets may also trigger institutional reform. Meanwhile, pressure for improvement may come from exterior sources. These include, for example: the Extractive Industries Transparency Initiative (which classifies Azerbaijan as the only compliant transition country, and Kazakhstan, the Kyrgyz Republic and Mongolia – but not Russia – as candidates); and anti-corruption legislation in home countries of foreign firms, which has been shown to affect their behaviour in the FDI recipient countries (Javorcik and Wei, 2009). Institution building in resource-rich countries is likely to be difficult and protracted, but by no means hopeless.
38

References D. Acemoglu, J. Robinson and T. Verdier (2004), “The kleptocracy and divide-and-
rule: a model of personal rule”, Journal of the European Economic Association, Papers and Proceedings, Vol. 2, pp. 162-92.
P. Aghion, P. Bacchetta, R. Ranciere and K. Rogoff (2006), “Exchange rate volatility and productivity growth: the role of financial development”, CEPR Discussion Paper 5629.
P. Aghion and L. Quesada (2009), “Petroleum contracts: What does contract theory tell us?” in, “Populism and natural resources”, W. Hogan and F. Sturzenegger (eds), MIT Press, Cambridge, MA.
R. Ahrend, D. de Rosa and W. Tompson (2007), “Russian manufacturing and the threat of “Dutch Disease”– a comparison of competitiveness developments in Russian and Ukrainian industry”, OECD Working Paper 540.
M. Amin and S. Djankov (2009), “Natural resources and reforms”, World Bank Policy Research Working Paper 4882.
R. Auty (1993), “Sustaining development in mineral economies: the resource curse thesis”, Routledge, London.
R. Auty (2001), “Resource abundance and economic development”, Oxford University Press.
T. Beck, A. Demirguc-Kunt, and R. Levine (1999), “A new database on financial development and structure”, World Bank Policy Research Working Paper 2146.
E. Berglöf and A. Lehmann (2009), “Sustaining Russia’s growth: the role of financial reform”, Journal of Comparative Economics, Vol. 37, No. 2, pp. 198-206.
E. Berglöf, Y. Korniyenko, A. Plekhanov and J. Zettelmeyer (2009), “Understanding the crisis in emerging Europe”, EBRD Working Paper, forthcoming.
O. Blanchard, F. Lopez-de-Silanes and A. Shleifer (1994), “What do firms do with cash windfalls?”, Journal of Financial Economics, Vol. 36, No. 3, pp. 337-60.
M. Corden and J. Neary (1982), “Booming sector and de-industrialisation in a small open economy”, Economic Journal, Vol. 92, No. 368, pp. 825-48.
A. Durnev and S. Guriev (2007), “The resource curse: a corporate transparency channel”, CEPR Discussion Paper 6547.
G. Egorov, S. Guriev and K. Sonin (2009), “Why resource-poor dictators allow freer media", American Political Science Review, forthcoming.
A. Esanov, M. Raiser and W. Buiter (2001), “Nature’s blessing or nature’s curse: the political economy of transition in resource-based economies”, EBRD Working Paper 66.
39

EBRD (2008), Transition Report 2008.
S. Guriev, A. Kolotilin and K. Sonin (2009), “Determinants of expropriation in the oil sector: a theory and evidence from panel data”, Journal of Law, Economics, and Organization, forthcoming.
T. Gylfason (2001), “Natural resources, education, and economic development”, European Economic Review, Vol. 45, No. 4-6, pp. 847-59.
T. Gylfason, T. Herbertsson and G. Zoega (1999), “A mixed blessing: natural resources in an endogenous growth model”, Macroeconomic Dynamics, Vol. 3, pp. 204-25.
R. Hausmann, J. Hwang and D. Rodrik (2007), “What you export matters”, Journal of Economic Growth, Vol. 12, No. 1, pp. 1-25.
R. Hausmann and B. Klinger (2007), “The structure of the product space and comparative advantage”, Harvard University CID Working Paper 146.
G. Heal (2007), “Are oil producers rich?” in “Escaping the resource curse”, M. Humphreys, J. Sachs and J. Stiglitz (eds), Columbia University Press.
C. Hidalgo, B. Klinger, A. Barabasi and R. Hausmann (2007), “The product space conditions the development of nations”, Science, Vol. 317, No. 5837, pp. 482-7.
W. Hogan and F. Sturzenegger (2009), “Populism and natural resources”, MIT Press, Cambridge, MA.
H. Hotelling (1931), “The economics of exhaustible resources”, Journal of Political Economy, Vol. 39, No 2, pp. 137-75
M. Hutchison (1994), “Manufacturing sector resiliency to energy booms: empirical evidence from Norway, the Netherlands, and the United Kingdom”, Oxford Economic Papers, Vol. 46, No. 2, pp. 311-29.
IMF (2006), World Economic Outlook, October.
B. Javorcik and Shang-Jin Wei (2009), “Corruption and cross-border investment in emerging markets: firm-level evidence”, Hong Kong Institute for Monetary Research Working Paper No. 06/2009 (February).
D. Kaufmann, A. Kraay and M. Mastruzzi (2009), “Governance matters VIII: governance indicators for 1996-2008”, World Bank Policy Research Working Paper 4978.
P. Krugman (1987), “The narrow moving band, the Dutch Disease, and the competitive consequences of Mrs. Thatcher: notes on trade in the presence of dynamic scale economies”, Journal of Development Economics, Vol. 27, No. 1-2, pp. 41-55.
40

H. Mehlum, K. Moene and R. Torvik (2006), “Institutions and the resource curse”, Economic Journal, Vol. 116, No. 508, pp. 1-20.
K. Murphy, A. Shleifer and R. Vishny (1989), “Industrialization and the big push”, Journal of Political Economy, Vol. 97, No. 5, pp. 1003-26.
M. Nili and M. Rastad (2007), “Addressing the growth failure of the oil economies: the role of financial development”, The Quarterly Review of Economics and Finance, Vol. 46, No. 5, pp. 726-40.
T. Persson and G. Tabellini (2000), “Political economics”, MIT Press, Cambridge, MA.
C. Purfield (2005), “Managing revenue volatility in a small island economy: the case of Kiribati”, IMF Working Paper 05/154.
R. Rajan and L. Zingales (1998), “Financial dependence and growth”, American Economic Review, Vol. 88, No. 3, pp. 559-86.
P. Rosenstein-Rodan (1943), “Problems of industrialization of eastern and south-eastern Europe”, Economic Journal, Vol. 53, No. 3, pp. 202-11.
M. Ross (2001), “Does oil hinder democracy?” World Politics, Vol. 53, No. 3, pp. 325-61.
M. Ross (2006), “A closer look at oil, diamonds, and civil war,” Annual Review of Political Science, Vol. 9, pp. 265-300.
M. Ross (2007), “How mineral-rich states can reduce inequality”, in “Escaping the resource curse”, M. Humphreys, J. Sachs and J. Stiglitz (eds), Columbia University Press.
J. Sachs and A. Warner (1997a), “Fundamental sources of long-run growth”, American Economic Review, Vol. 87, No. 2, pp. 184-8.
J. Sachs and A. Warner (1997b), “Sources of slow growth in African economies”, Journal of African Economies, Vol. 6, No. 3, pp. 335-76.
J. Sachs and A. Warner (2001), “Natural resources and economic development: the curse of natural resources”, European Economic Review, Vol. 45, No. 4-6, pp. 827-38.
K. Sonin (2003), “Why the rich may favor poor protection of property rights”, Journal of Comparative Economics, Vol. 31, No. 4, pp. 715-31.
J. Stijns (2006), “Natural resource abundance and human capital accumulation”, World Development, Vol. 34, No. 6, pp. 1060-83.
E. Suslova and N. Volchkova (2007), “Human capital, industrial growth and resource curse”, New Economic School Working Paper 13.
41

A. Tornell and P. Lane (1999), “The voracity effect”, American Economic Review, Vol. 89, No. 1, pp. 22-46.
UNIDO (2009), Industrial Development Report 2009, New York.
N. Volchkova (2005), “Reasons for Russia’s energy dependent industrial structure: Dutch Disease vs. underdeveloped institutions”, in “Role of trade policy and WTO accession in Russia’s and CIS countries’ economic development”, World Bank (in Russian), Washington, D.C.
42

ANNEX 1. SAMPLE
Table A1. Countries in the sample: share of higher-value-added manufacturing and food in exports
Country 1991–92 2001–03 Country 1991–92 2001–03 Country 1991–92 2001–03
Algeria 1.3 0.4 Honduras 60.6 19.9 Peru 24.5 23.9Argentina 67.8 57.0 Hong Kong SAR 30.3 44.6 Philippines 50.4 80.2Australia 28.1 31.3 Hungary 45.7 66.4 Poland 33.1 45.0Austria 41.9 49.4 Iceland 84.5 68.5 Portugal 28.5 42.1Bahrain 3.4 2.3 India 24.5 20.7 Qatar 2.6 0.9Bangladesh 14.1 6.4 Indonesia 14.0 26.1 Romania 30.9 24.1Barbados 43.6 41.4 Ireland 51.7 41.9 Saudi Arabia 2.1 2.1Belize 72.8 54.8 Israel 32.7 33.8 Senegal 46.5 39.1Bolivia 18.3 36.4 Italy 44.2 44.0 Seychelles 38.8 65.7Brazil 45.0 52.8 Jamaica 24.2 23.9 Singapore 58.4 65.2Brunei 1.8 4.5 Japan 71.8 67.7 Slovenia 35.9 40.2Canada 46.5 44.8 Jordan 26.0 27.1 Spain 57.4 55.9Chile 28.2 28.7 Kenya 48.6 47.7 Sri Lanka 28.6 25.7China 29.2 44.1 Korea 45.1 62.0 St. Lucia 73.8 73.8Colombia 35.4 23.2 Kuwait 8.8 1.3 Sudan 53.6 13.5Costa Rica 64.4 58.0 Madagascar 58.8 52.5 Suriname 21.4 14.3Croatia 31.2 40.1 Malawi 93.5 83.2 Sweden 44.8 45.5Cyprus 49.2 20.7 Malaysia 53.1 66.6 Switzerland 33.9 30.1Denmark 49.8 48.1 Malta 61.0 70.9 Syria 13.5 11.4Dominica 71.0 38.6 Mauritius 32.9 28.2 Taipei, China 43.8 55.4Ecuador 53.3 43.8 Mexico 53.1 63.9 Thailand 51.7 57.5Egypt 10.9 8.8 Morocco 33.6 34.0 Togo 18.7 19.8El Salvador 36.0 15.8 Nepal 12.4 20.7 Trinidad 7.5 7.2Ethiopia 67.7 57.9 Netherlands 44.3 48.5 Tunisia 21.0 24.0Fiji 53.8 39.3 New Zealand 54.3 57.1 Turkey 32.5 35.2Finland 30.8 45.8 Nicaragua 72.3 76.8 UAE 0.4 19.9France 53.6 57.6 Norway 22.5 17.6 United Kingdom 49.2 50.3Germany 54.7 57.8 Oman 10.7 14.3 United States 58.1 57.9Ghana 30.1 40.4 Pakistan 11.0 12.9 Uruguay 41.3 52.9Greece 37.2 36.1 Panama 77.4 74.4 Venezuela 3.7 3.3Grenada 75.4 81.8 Papua NG 20.7 20.2 Yemen 2.6 4.9Guatemala 64.9 42.4 Paraguay 44.2 74.1 Zimbabwe 40.8 45.7
Sources: WTO and authors' calculations.
43

44
ANNEX 2. DATA SOURCES
Export structure: WTO.
GDP, PPP coefficients: IMF World Economic Outlook 2009.
Financial development: World Bank New Database on Financial Development, Beck et al. (1999).
Oil price: Bloomberg.
Oil production: Energy Information Administration.
Quality of institutions: World Bank Governance Indicators and Kaufmann, Kraay and Mastruzzi (2009).
Sovereign wealth funds: SWF Institute and national authorities.
Related Documents