Economics for Economics for Managers Managers by Dr. William Hua WANG Associate Professor, China Area Manager Euromed Management Ecole de Marseille [email protected] Office: 321a.

Economics for Managers
Dec 30, 2015
Economics for Managers. by Dr. William Hua WANG Associate Professor, China Area Manager Euromed Management Ecole de Marseille [email protected] Office: 321a. V. The Global Economy. V The Global Economy 5.1 International trade and comparative advantage - PowerPoint PPT Presentation
Welcome message from author
This document is posted to help you gain knowledge. Please leave a comment to let me know what you think about it! Share it to your friends and learn new things together.
Transcript

Economics for Economics for Managers Managers
by
Dr. William Hua WANG
Associate Professor, China Area Manager Euromed Management Ecole de Marseille
[email protected]: 321a.

V. The Global EconomyV. The Global Economy

SummarySummary
V The Global Economy
5.1 International trade and comparative advantage
5.2 MNCs and foreign direct investment – foreign firms in China vs. Chinese overseas investment

1. Why Trade?
2. International versus Intranational Trade
3. The Law of Comparative Advantage
4. Dynamic Comparative Advantage
5. Trade Restrictions
5.1 International Trade and Comparative Advantage


Absolute advantage • One country is said to have an absolute advantage over another in the
production of a particular good if it can produce that good using smaller quantities of resources than can the other country.
Comparative advantage is the force that generates international trade.
• One country is said to have a comparative advantage over another in the production of a particular good if it produces that good less inefficiently than the other country.
• The law of comparative advantage applies even if one country is at an absolute disadvantage relative to another country in the production of every good.
• Both countries gain from trade even if one of them is more efficient than the other in producing everything.
The Law of Comparative Advantage3
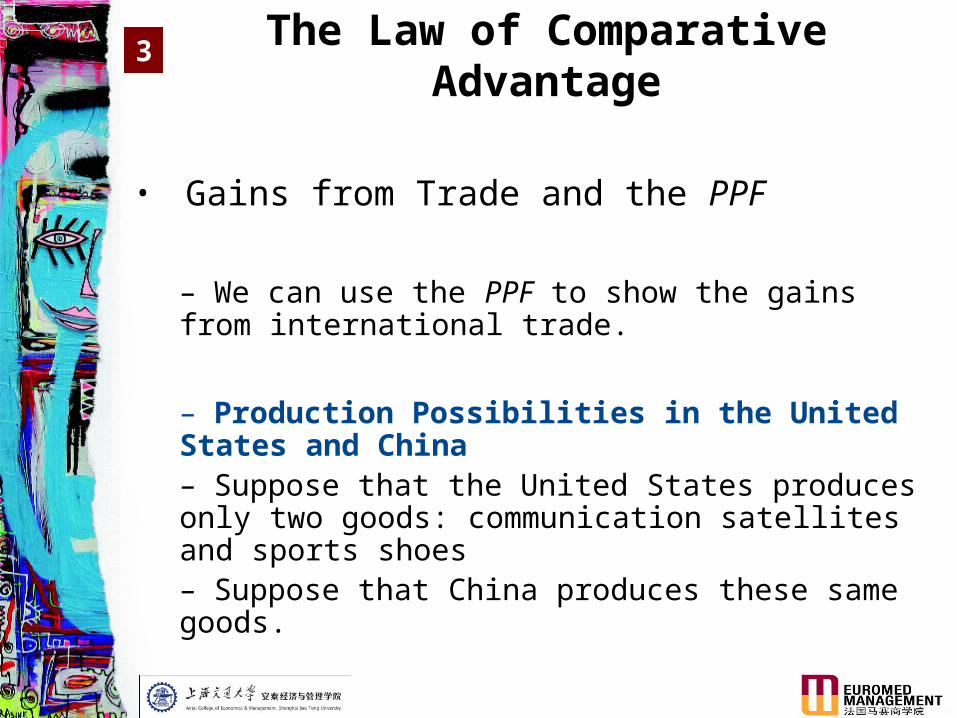
• Gains from Trade and the PPF
– We can use the PPF to show the gains from international trade.
– Production Possibilities in the United States and China– Suppose that the United States produces only two goods: communication satellites and sports shoes– Suppose that China produces these same goods.
The Law of Comparative Advantage3
15
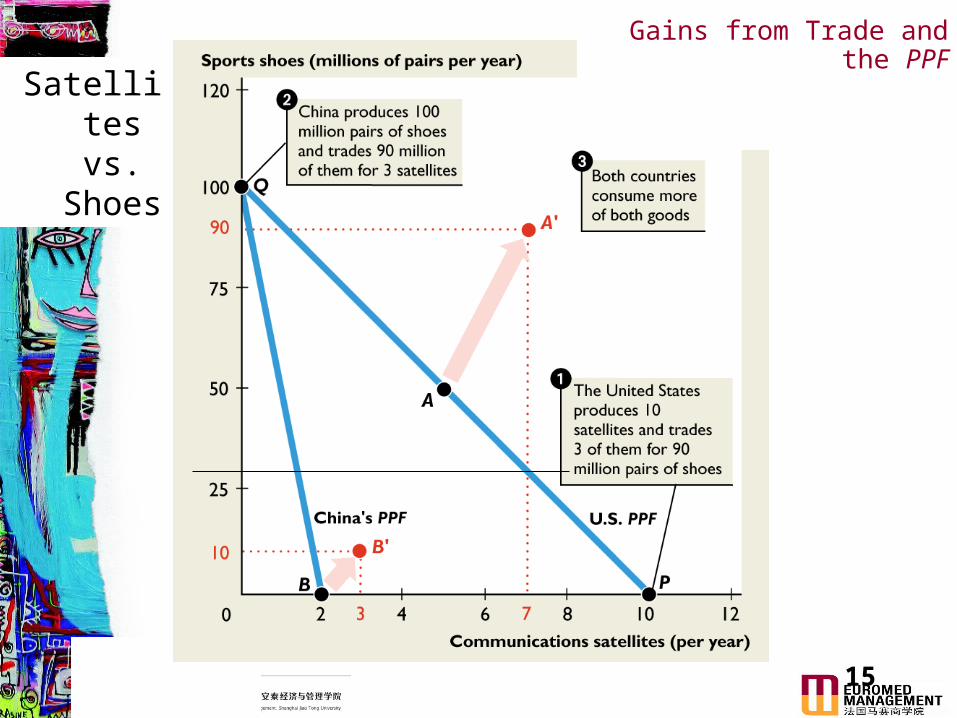
Gains from Trade and the PPF
Satellites vs.
Shoes

– With no trade, China produces 2 satellites and no shoes.
– By specializing in producing shoes (the good in which it has a comparative advantage) and trading with the United States, China has 10 million pairs of shoes and 3 satellites.
– China’s gains from trade are 10 million pairs of shoes and 1 satellite.
Gains from Trade - China
The Law of Comparative Advantage3

– With no trade, the United States produces 5 satellites and 50 million pairs of shoes.
– By specializing in producing satellites (the good in which it has a comparative advantage) and trading with China, the United States has 90 million pairs of shoes and 7 satellites.
– The U.S. gains from trade are 40 million pairs of shoes and 2 satellites.
Gains from Trade – the U.S.
The Law of Comparative Advantage3
Dynamic Comparative Advantage
…through Learning-by-doing.
Learning-by-doing occurs when people become more productive as a result of repeatedly performing the same task or producing a particular good or service.
Can China export something else than T-shirts?
4

EU’s comparative advantageEU’s comparative advantage
A certain degree of complementarity
+ Exception: textiles and clothing products
- Exception: the manufacture of transport equipment and machinery
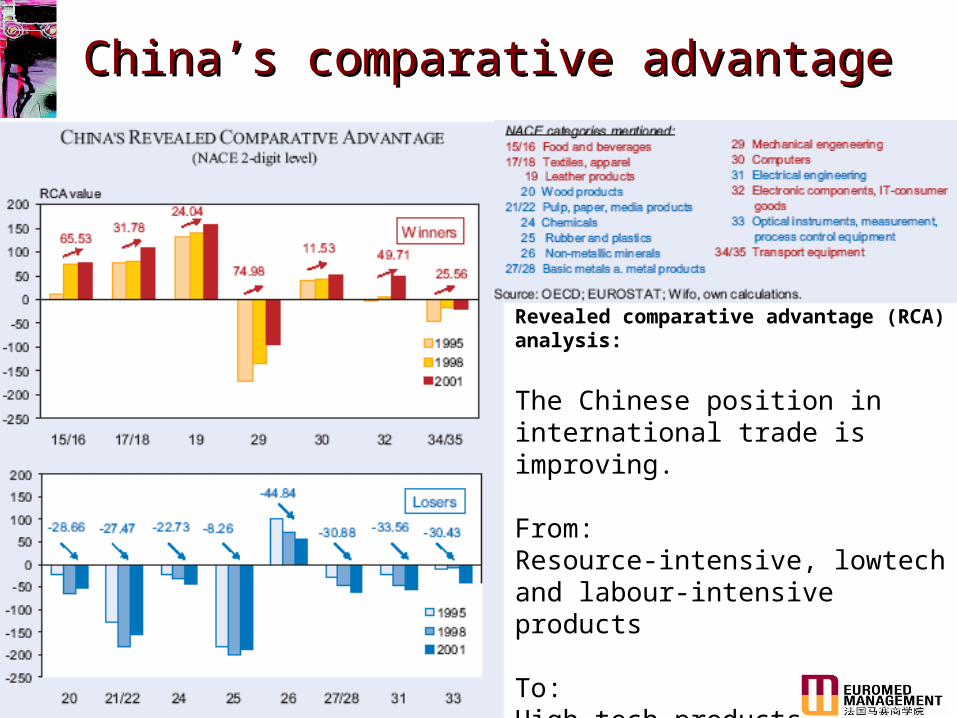
China’s comparative advantageChina’s comparative advantage
Revealed comparative advantage (RCA) analysis:
The Chinese position in international trade is improving.
From: Resource-intensive, lowtechand labour-intensive products
To: High-tech products (machinery and equipment)

China: Technology-driven exports to the EUare increasing their shares
From: Industrial goods manufactured with cheap and low- skilled labour.
To:Technology-driven high-tech products.
• China’s dynamic upgrading of its industrial structures.• The Chinese challenge has become much more complex than could be expected just a few years ago.
Technology driven business Labour Intensive Industries
– Governments restrict trade to protect industries from foreign competition by using two main tools:
• Tariffs• Nontariff barriers
– A tariff is a tax on a good that is imposed by the importing country when an imported good crosses its international border.
– A nontariff barrier is any action other than a tariff that restricts international trade. For example, a quota, export subsidy.
Trade Restrictions5
Nontariff Barriers
Quota– A specified maximum amount of a good that may be imported in a given period of time.
How a Quota Works– With free trade, Americans pay $5 a T-shirt and import 50 million T-shirts a year.– Suppose the U.S. government sets a quota on imported T-shirts at 15 million a year.
Trade Restrictions5

Health, Safety, and Other Nontariff Barriers
• Thousands of detailed health, safety, and other regulations restrict international trade.
• Some examples are:–Food imports into the United States must meet Food and Drug Administration’s standards.–The EU bans imports of genetically modified foods such as U.S. soybean and Canadian granola. –Australia bans imports of Californian grapes to protect its grapes from a virus in California.
Trade Restrictions5

• Three Arguments for Protection
The national security argument The infant-industry argument The dumping argument
Arguments for Protection6
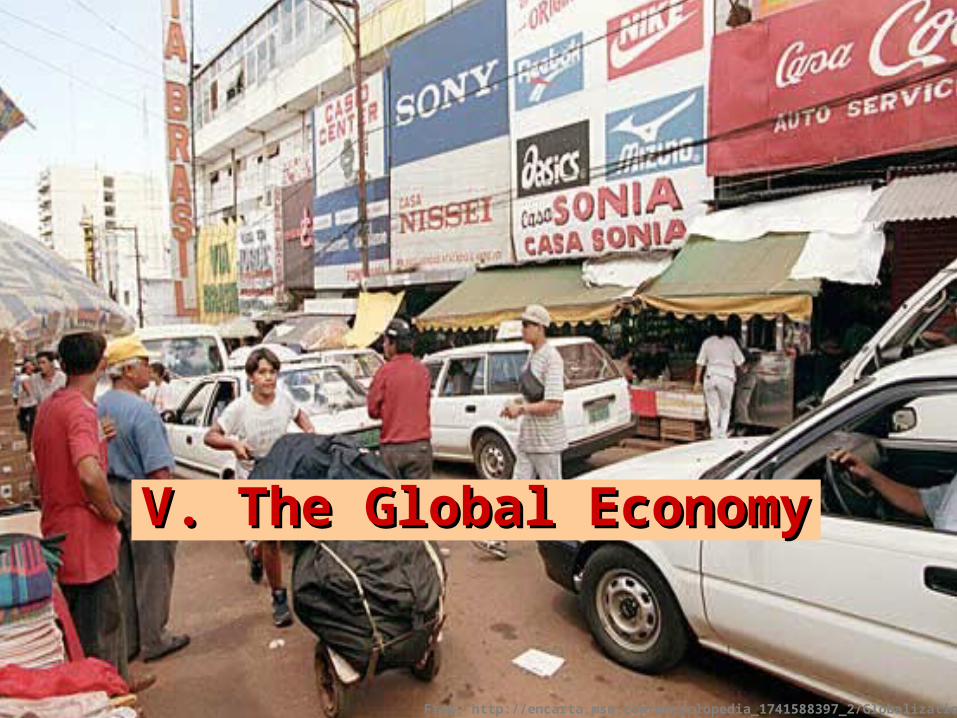
From: http://encarta.msn.com/encyclopedia_1741588397_2/Globalization.html
V. The Global EconomyV. The Global Economy

SummarySummary
V The Global Economy
5.1 International trade and comparative
advantage
5.2 MNCs and foreign direct investment – foreign firms in China vs. Chinese overseas investment

1. Theories of internationalization1.1 Multinational corporations
1.2 Why do firms internationalise?
1.3 What determines firm performance in a globalised economy?
1.4 MNCs and Developing Countries
2. FDI and MNCs in China
3. Globalisation of Chinese firms
5.2 MNCs and FDI – Foreign Firms in China vs. Chinese Overseas Investment

Growth and size of MNCs -1
• 45 000 MNCs in the world.
• 1/3 of the total world trade ($2trillion dollars)
• Also look at the share of manufacturing produced by foreign enterprises.
1.1 Multinational Corporations
Theories of Internationalisation1
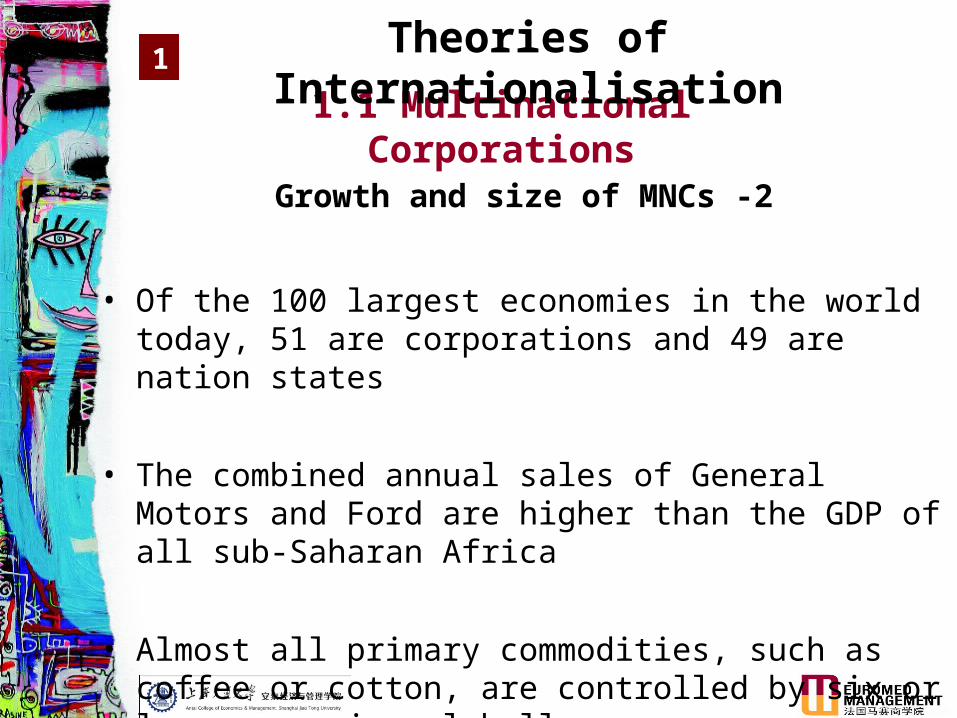
Growth and size of MNCs -2
• Of the 100 largest economies in the world today, 51 are corporations and 49 are nation states
• The combined annual sales of General Motors and Ford are higher than the GDP of all sub-Saharan Africa
• Almost all primary commodities, such as coffee or cotton, are controlled by six or less companies globally
1.1 Multinational Corporations
Theories of Internationalisation1

Comparison of the 10 largest multinational corporations(by gross revenue) and selected countries (by GDP): 2002Comparison of the 10 largest multinational corporations
(by gross revenue) and selected countries (by GDP): 2002

1. Product Level (Raymond Vernon) – Product Cycle Theory
2. Firm Level Reactive Motives
• Decline in domestic market • Intensity of competition at home
• Excess capacity • Business incentives
Proactive Motives
• Economies of scale • Economies of scope
• Management attitude • Growth motive
• Control intangible assets (Richard Caves)
1.2 Why do firms internationalise?
Theories of Internationalisation1

3. Home country level– Resource endowments
– Tax policy
– Transfer pricing: prices paid for goods exchanged between affiliates of an MNC. MNCs manipulate transfer prices to transfer profits out of high tax countries to low tax countries and thereby avoid taxes. Manipulation is possible because intangible assets don't have a market price.
4. Host country level– Tariffs and trade barriers
– Government investment policies
– Exchange rate policy
1.2 Why do firms internationalise?
Theories of Internationalisation1
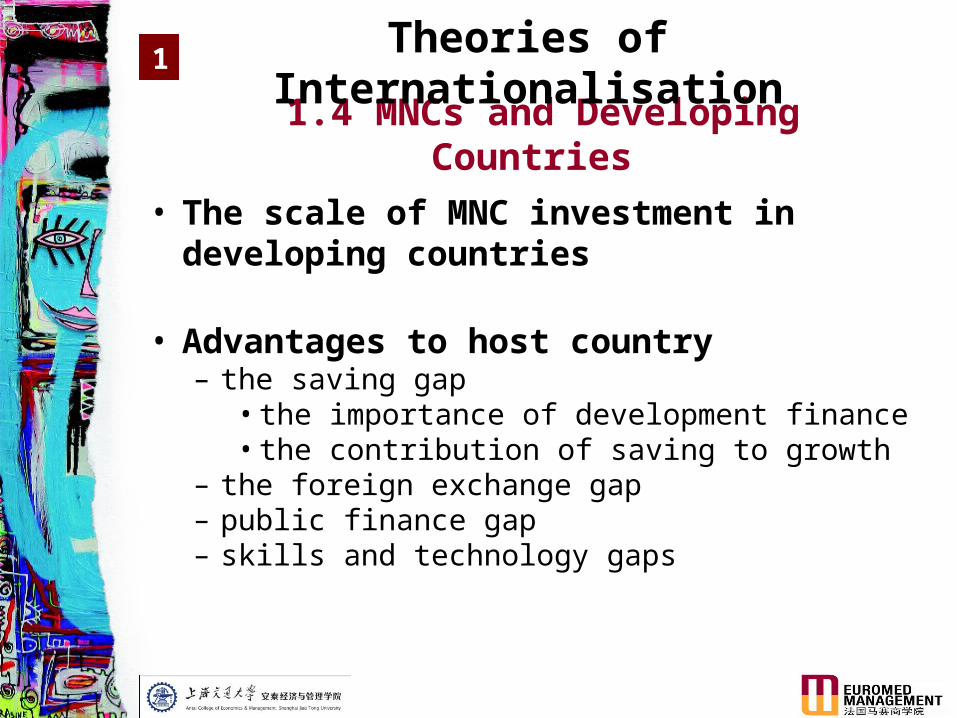
• The scale of MNC investment in developing countries
• Advantages to host country– the saving gap
• the importance of development finance• the contribution of saving to growth
– the foreign exchange gap– public finance gap– skills and technology gaps
1.4 MNCs and Developing Countries
Theories of Internationalisation1

• Disadvantages to host country– MNCs may drive local firms out of business– limited demand for local components– repatriation of profits– transfer pricing and effects on tax revenues
• competition between developing countries to attract MNCs
– distorting the whole pattern of development• increasing gap between rich and poor• introducing consumerist values
• What can developing countries do?
1.4 MNCs and Developing Countries
Theories of Internationalisation1

1. Theories of internationalization1.1 Multinational corporations1.2 Why do firms internationalise?1.3 What determines firm performance in a globalised economy1.4 MNCs and developing countries
2. FDI and MNCs in China
3. Globalisation of Chinese firms
5.2 MNCs and FDI – foreign firms in China vs. Chinese overseas investment

FDI inflows in the world ($ millions)
FDI and MNCs in China2

FDI and MNCs in China2
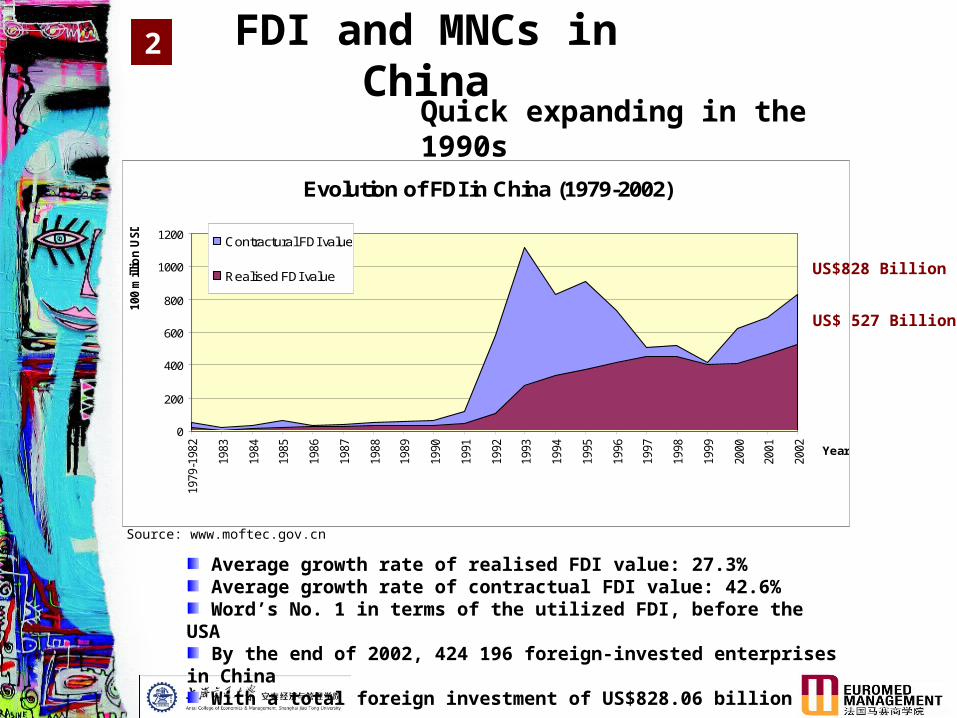
Quick expanding in the 1990s
Average growth rate of realised FDI value: 27.3% Average growth rate of contractual FDI value: 42.6% Word’s No. 1 in terms of the utilized FDI, before the USA By the end of 2002, 424 196 foreign-invested enterprises in China With a total foreign investment of US$828.06 billion
Source: www.moftec.gov.cn
Evolution of FDI in China (1979-2002)
0
200
400
600
800
1000
1200
1979
-198
2
1983
1984
1985
1986
1987
1988
1989
1990
1991
1992
1993
1994
1995
1996
1997
1998
1999
2000
2001
2002 Year
100
mill
ion
US
D
Contractural FDI value
Realised FDI value
US$ 527 Billion
US$828 Billion
FDI and MNCs in China2
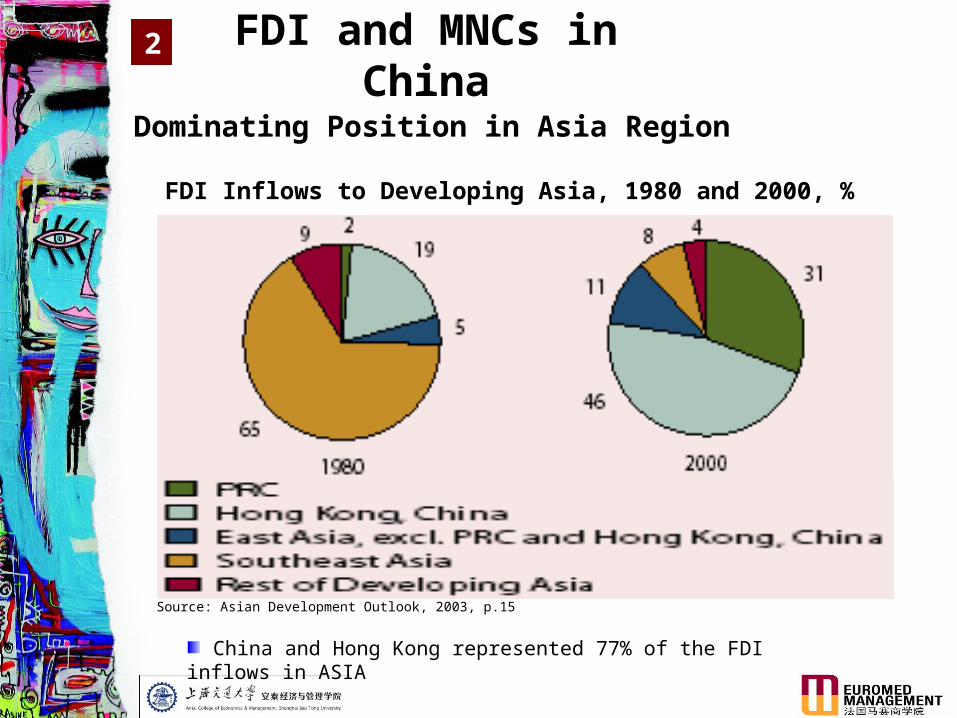
Dominating Position in Asia Region
FDI Inflows to Developing Asia, 1980 and 2000, %
Source: Asian Development Outlook, 2003, p.15
China and Hong Kong represented 77% of the FDI inflows in ASIA
FDI and MNCs in China2

Top 10 Foreign Investors in China for 2000 Unit:US$ 100 million
Country/Region No.Of Projects Share % Contractual Value Share% Realized
Value Share%
Total 22532 100.00% 626.57 100.00% 407.72 100.00%
Hongkong 7058 31.32% 174.38 27.83% 162.16 39.77%
USA 2553 11.33% 78.69 12.56% 43.72 10.72%
Virgin Islands 1154 5.12% 75.62 12.07% 35.72 8.76%
Japan 1602 7.11% 36.02 5.75% 32.46 7.96%
Taiwan Province 3082 13.68% 39.88 6.37% 23.78 5.83%
Singapore 613 2.72% 20.39 3.25% 20.91 5.13%
R.O.K 2570 11.41% 23.72 3.79% 15.07 3.70%
Germany 290 1.29% 29.78 4.75% 12.51 3.07%
U.K. 256 1.14% 8.02 1.28% 11.54 2.83%
France 136 0.60% 6.36 1.02% 8.95 2.20%
Source:MOFTEC FDI Statistics
FDI and MNCs in China2

About 20% directly from developed countries (USA, JP, UK, GE, FR) Explanation on the FDI from HK and Virgin Islands (Cayman Islands)
Top 10 Investors in China for 2002Top 1O investors by countries (till 2002)
0,00%
5,00%
10,00%
15,00%
20,00%
25,00%
30,00%
35,00%
40,00%
45,00%
50,00%
1. H
ong
Kon
g
2. U
nite
dSt
ates
3. J
apan
4. T
aiw
an
5. V
irgin
Isla
nds
6.Si
ngap
ore
7. K
orea
8. U
nite
dK
ingd
om
9. G
erm
an
10. F
ranc
e
Country (region)
Contractural FDI value
Realised FDI value
Source: www.moftec.gov.cn
FDI and MNCs in China2

Top 10 Investors in China for 2004
FDI and MNCs in China2

Why HK and Virgin Isles?
The top 5 countries/regions investing in China in 2002
1. Hong Kong (US$17.861 billion)
2. Virgin Islands (US$6.17 billion)
3. U.S. (US$5.424 billion)
4. Japan (US$4.19 billion)
5. Taiwan Province (US$3.971 billion)
FDI and MNCs in China2

(till 2002)Number of projects
Contractual FDI
Manufacturing Industry 73,15% 63,32%
Real Estate, Social Service * 10,72% 21,87%
Wholesale, Retailing and Catering 5,03% 3,20%
Construction 2,27% 2,73%
Transport, Warehousing, Post and Telecommunication * 1,11% 2,27%
Agriculture, Forestry, Animal, Husbandry & Fishery 2,88% 1,90%
Health care, sports and social welfare * 0,26% 0,62%
Scientific research and technical services 0,69% 0,40%
Education, culture, art, broadcasting and film industry 0,33% 0,28%
Other Sectors 3,54% 3,42%
Industrial Composition of FDI
Source: www.moftec.gov.cn
Dominating investment to the manufacturing industry
FDI and MNCs in China2
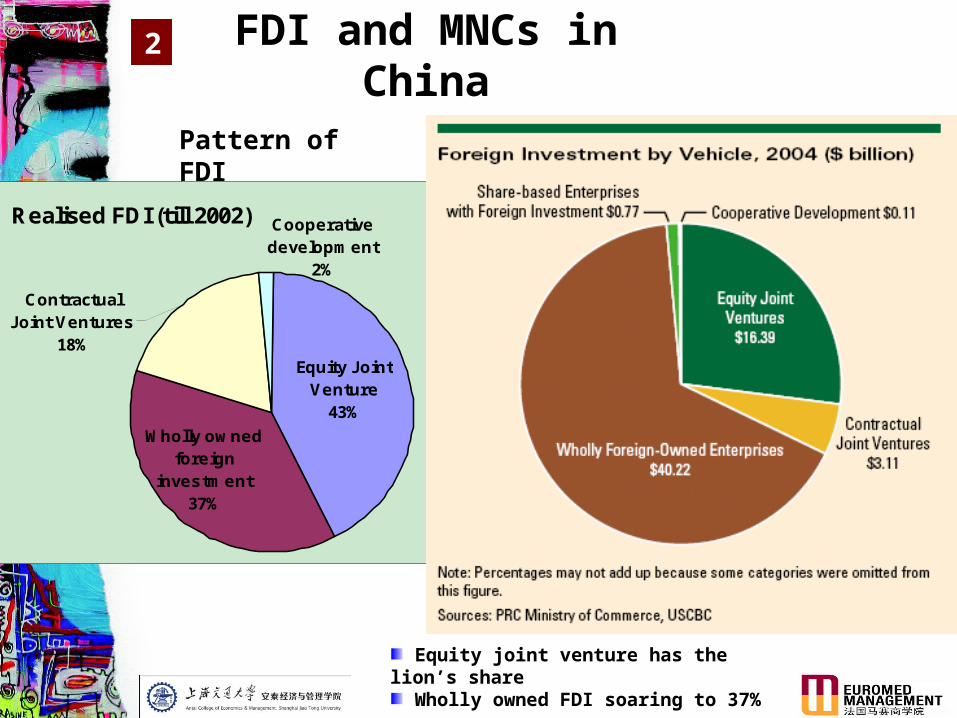
Pattern of FDI
Equity joint venture has the lion’s share Wholly owned FDI soaring to 37%
FDI and MNCs in China2
Realised FDI (till 2002)
Wholly ownedforeign
investment37%
Equity JointVenture
43%
Cooperativedevelopment
2%
ContractualJoint Ventures
18%

year 2002
%
Actual utilized FDI/GDP 4.3
Total fixed asset investment 10.1
National industrial value-added 25.7
National tax incoming 20.4
Export value 52.2
Labour force 11Source: www.mofcom.gov.cn
Contribution of FDI to the Chinese Economy
FDI and MNCs in China2

Top 10 MNCs in China, 2002
By sales revenue (2001-2002)
1. Tianjin Motorola Electronics Co. Ltd. 2. SAIC-Volkswagen Sales Co. Ltd. 3. Shanghai Volkswagen Car Co. Ltd. 4. Beijing Capital-Nokia Mobile Telecommunications Co. Ltd. 5. FAW-Volkswagen Car Co. Ltd. 6. FAW-Volkswagen Sales Co. Ltd. 7. Legend (Beijing) Co. Ltd. (HK listed company, strategic alliances with Intel and Microsoft)
8. Huaneng Power International Inc. (USA and HK listed company) 9. Shanghai Siemens Mobile Telecommunication Co. Ltd. 10. Nanjing Ericsson Mobile Telecommunication Co. Ltd.
Source: http://www.china.org.cn/
FDI and MNCs in China2

Top 10 MNCs in China, 2004
FDI and MNCs in China2
China’s Advantages as Export Platform
Low labour cost At $0.62 – compares well to most
Despite rising productivity, surplus labour and lack of independent trade unions will likely keep lid on wages
Good infrastructure Convenient logistics in Coastal Areas
Critical mass of factories, subcontractors, specialized vendors
Incentive policies
Source: Pierre Laliberté, 2005, China’s entry in the world economy, Prospects and Challenges. March, Canadian Labour Congress.
FDI and MNCs in China2

China’s Comparative Disadvantages
Legal system ineffective to enforce contracts (10% of judges have legal training…)
Lack of Patent Protection despite official commitment
“If it can be reversed engineered, it will…” - Thomas Boam, Minister-Counsellor, U.S. Embassy
Electric Power bottlenecks + Environmental costs rising
FDI and MNCs in China2

Threats & Opportunities for other countries Threats
1. Competition on attracting FDI: diverted to China 2. Asian counties: concerned about losing competitive position in some labour-intensive exports (e.g., textiles and apparel)
Realities 1. The world’s largest recipient of FDI, but not totally foreign investment 2. 70% of exports: labour-intensive goods (garments, toys, shoes, and furniture).
Manufacturing wages are about 5% of the US average, and 10% of those in some neighbouring Asian economies
Opportunities 1. Increasing export to China, other factors to attract FDI 2. Low wage vs. high productivity
FDI and MNCs in China2

1. Theories of internationalization1.1 Multinational corporations
1.2 Why do firms internationalise?
1.3 What determines firm performance in a globalised economy?
1.4 MNCs and Developing Countries
2. FDI and MNCs in China
3. Globalisation of Chinese firms
5.2 MNCs and FDI –foreign firms in China vs. Chinese overseas investment

The competitive strategies
• At least three categories of competitive strategies:
(1) Cost advantage strategy
(2) Niche advantage strategy
(3) "Global product" advantage strategy
Globalisation of Chinese firms3
Cost advantage strategy
• Description: Cost advantage through high volume production of standardised goods and/or lower labour costs in home countries
• Practice: OEM, depend on major customers for technology and expertise, Process innovation, Example: Footwear production, electronic products
• Critical Points: lack the financial strength, marketing expertise to move to original design and product development
Globalisation of Chinese firms3

Niche advantage strategy• Description: Niche advantage through flexible batch
production of goods and rapid response to market needs;
• Practice: lean (and mean?) production practices. By being highly adaptive and flexible, very responsive to market demands and fluctuations.
• Example: Taiwanese firms in PC and keyboard manufacturing, Other TNCs in Southeast Asia, in service industries (e.g. trading and distribution, finance, insurance, real estate, business services and telecommunications).
• Critical Points: Asian countries characterised by imperfect market conditions and host government regulations (especially for service industries).
Globalisation of Chinese firms3
"Global product" advantage strategy
• Description: "Global product" advantage through intensive technological innovations, extensive marketing and brand name development. Truly global players.
• Practice: strong brand names and technological innovations, immense financial assets and globally integrated networks of operations.
• Example: From Taiwan: Acer, Tatung, From Singapore: IPC, Creative Technology, CDL, from South Korea: Hyundai, Samsung, LG; from Hong Kong: Shangri-la.
• Critical Points: strong support from their developmental state at home.
Globalisation of Chinese firms3

The organization of TNC from emerging economies
• Jointventures with minority shares in equity have been the most preferred mode of market entry
• Vertical integration as the conventional forms of market entry
• Parent-subsidiary relationship: loose, fluid and informal after the initial supply of core technology and management from the parent company, the foreign subsidiaries of these TNCs may usually be given more autonomy over time.
Globalisation of Chinese firms3
Related Documents


![[Economics for managers] presentation natural monopoly](https://static.cupdf.com/doc/110x72/55cde1abbb61eb036c8b484d/economics-for-managers-presentation-natural-monopoly.jpg)