Economics 615 Managing Regulation Compliance: Notes David L. Kelly Department of Economics University of Miami Box 248126 Coral Gables, FL 33134 [email protected] Current Version: Spring 2020

Welcome message from author
This document is posted to help you gain knowledge. Please leave a comment to let me know what you think about it! Share it to your friends and learn new things together.
Transcript
Economics 615Managing Regulation Compliance:
Notes
David L. Kelly
Department of EconomicsUniversity of Miami
Box 248126Coral Gables, FL 33134
Current Version: Spring 2020


INTRODUCTION
I Managing Regulation Compliance
A What is this course about?
This course will look at regulation from the point of view of economic incentives and
within the lens of the firm’s sustainability initiatives.
1 Legal Framework
Many people think of regulation in a legal framework: students learn the legal require-
ments, constitutional issues, and the legislative process.
• The firm must maintain a minimum wage of $15 per hour.
• Under the Corporate Average Fuel Economy (CAFE) standards, the average fuel econ-
omy for all light trucks with footprint (wheelbase times track width) less than 41 square
feet sold by a manufacturer in the year must be at least 38.15 miles per gallon.
• Is carbon covered under the Clean Air Act?
2 Economic Framework
While the law says what must be done, how it is done is up to the firm. The “how” is the
economic framework and is the subject of most of this class. How the firm complies with
regulation is a strategic decision, as each regulation creates a set of economic
incentives that the firm responds to.
Definition 1 Managing Regulation Compliance: how regulation changes incentives at
the firm and how the firm responds.
Definition 2 Economics is the study of the allocation of scarce resources.
Economics is the study of the allocation of scarce resources. In this class, we study how
the firm allocates scarce resources in order to comply with regulation. Examples:
• The minimum wage raises the cost of hiring low skill workers. Should the firm reduce
the size of the low skill workforce (perhaps through automation) and/or pay existing
workers higher wages? Should the firm reduce health care benefits and use that money
to increase wages?
1
• Fuel economy improves by lowering weight. However, consumers prefer heavier vehicles.
Should the firm raise prices of heavier vehicles to deter purchase of low MPG cars?
Should the firm change the size of the wheel base to make the standard easier to attain?
Should the firm innovate? Should the firm merge with another firm that has a better
average?
Thinking about regulation in this way has an additional benefit: students will learn
how to design regulation that minimizes bad incentives and unintended conse-
quences and what regulation levels maximize the welfare of society. In the above
example, making the wheel base larger to get a lower MPG standard is a bad incentive. Car
companies incur costs to change the wheel base, consumers pay some of the higher costs but
do not get a better car, and fuel economy does not improve.
3 Sustainability Perspective
Regulation often increases the incentives for firms to be sustainable.
Definition 3 Sustainability: Meeting the needs of the present without compromising fu-
ture generations ability to meet their needs.
Definition 4 Sustainable Business: Voluntary actions taken by firms which create so-
cial/environmental benefits while at the same time benefiting the firm.
Since sustainability is voluntary and regulation is mandatory, the two might appear to be
unrelated. However, regulation not just a mandate, but is also a set of incentives which
affects voluntary decisions by the firm. Examples:
• Minimum wage: a firm focused on sustainability might pay higher than the minimum
wage. This (1) gets the firm a higher quality worker, and (2) makes the firm more
attractive to consumers and socially responsible investors, who value a company that
treats workers well. Now suppose the minimum wage rises.
– Since other firms must raise their wage, the firm has an incentive to raise it’s wage
as well, to maintain a reputation that it is doing more than the minimum.
– The cost of becoming sustainable rises, given the higher wage.
– Suppose the firm sustainability program focused on providing health insurance
to all workers. The higher minimum wage creates an incentive to reduce health
insurance contributions, to keep total compensation down.
2
• CAFE Standards:
– A company which exceeds the minimum fuel economy standard earns credits
which it can sell to firms that fail to exceed the minimum. This is a benefit to
being sustainable.
– Car sales are unpredictable. If gas prices are low, for example, the firm might
accidentally sell too many gas guzzlers and have to pay a penalty. Exceeding the
minimum reduces the likelihood of such an accident.
II How to Make Regulation Decisions
Now that we understand that regulation compliance is a decision, not just a legal require-
ment. How should the firm make regulation compliance decisions? The firm must
add up all of the costs and benefits of compliance and over-compliance. Thinking carefully
about these costs and benefits will also help us understand the costs and benefits of firm
sustainability strategies.
A Standard Economic Cost Trade-off
A general principle from economics is that the the additional cost of compliance in-
creases with the level of compliance. There is often “low hanging fruit” such that the
firm can achieve a low level of compliance fairly cheaply. Higher levels of compliance require
more expensive options.
• Minimum Wage:
– A few low skill workers could be replaced via automation or self service at rela-
tively low cost. For example, moving from full service to self service gas stations
reduces labor costs, but incurs a cost in that cars move though lines more slowly.
Workers in more complex jobs are more expensive to replace, requiring more so-
phisticated automation (e.g. artificial intelligence).
– In an accounting sense, the cost raising the wage of low skill workers by $1 is
$1. However, this dollar has to be obtained from some other alternative use in
the firm. At first, it is easy to find small amount of money which are not being
used efficiently at the firm. But as the wage rises, the firm must obtain more
dollars from valuable alternative uses, for example, investing in a new product or
3
market or investing in energy saving equipment. The costs in terms of forgone
investments increase with the wage level.
• CAFE Standards: The cost of achieving an average level of fuel economy increases
with the level of fuel economy.
– Small improvements in fuel economy can be obtained by, for example, using
smaller tires.
– Higher levels of fuel economy require more expensive additions, such as turbo
chargers and hybrid engines with regenerative brakes.
Definition 5 Accounting Cost Costs that appear on an accounting statement.
Definition 6 Opportunity Cost Accounting costs plus the value of using inputs in their
next best alternative.
Opportunity costs are higher than accounting costs. In the minimum wage example,
the accounting cost of increasing the wage by $1 is $1, since this is the cost that will appear
on the accounting statement. Suppose, however, that the $1 could be invested in insulation
which improves energy efficiency, ultimately reducing costs by $1.50. The opportunity cost
is $1.50: $1 of wage costs plus $0.50 of lost profits because the energy efficiency investment
was not made. If not otherwise specified, all costs in this class are opportunity
costs.
B Marginal Costs
Clearly opportunity costs matter for the regulation compliance decision. In addition, the
compliance decision uses marginal costs: the cost of one additional unit of compli-
ance (e.g. a higher wage or lower carbon emissions).
The idea behind marginal costs is to consider each unit of regulation compliance sepa-
rately. Should the firm increase its average miles per gallon from 26 to 27 MPG? Suppose to
get from 10-14 MPG required only smaller tires at minimal expense. This is not a relevant
cost because we are using smaller tires regardless of whether or not the firm achieves 26 or
27 MPG. What matters is only the additional cost of getting from 26 to 27 mpg. We will
see that marginal costs are in fact easy to calculate in practice.
4

C Sustainability Costs and Benefits
The point of sustainable business is to look beyond the simple cost of compliance de-
scribed above. In this course we will consider several additional benefits that regulation
over-compliance provides.
1. Achieving a higher compliance level results in direct marginal costs associated with
forgone opportunities, diverted labor, investment in new equipment, etc.
2. Achieving a higher compliance level creates marginal benefits by making
the firm more attractive to sustainability minded consumers.
• Greater product demand.
• Product differentiation.
• Market entry. Incumbent firms often find it difficult to compete with new entrants
that are focused on sustainability. Large incumbents must change hundreds of
products as consumers require the whole company to be sustainable, not just one
product. New entrants typically enter with a much smaller number of products
and can design supply chains and machines with sustainability in mind.
3. Achieving a higher compliance level generates marginal benefits in terms of
lowering the firm’s cost of capital by making the company more attractive
to socially responsible investors. The firm can use investment vehicles such as
green bonds, green private equity, and socially responsible mutual funds.
4. Achieving a higher compliance standard incurs marginal benefits in terms
of regulation incentives.
• Tradeable Permit Regulation. By over-complying, the firm saves the cost of pur-
chasing a permit required to pollute or emit carbon.
• Taxes. Carbon taxes and gasoline taxes have no fixed standard. Instead, the firm
earns tax savings for each unit of carbon emissions or gasoline reduced.
5. Achieving a higher compliance standard generates marginal benefits in
terms of lower risk.
• Over-complying reduces the risk of accidents, which hurts the firm’s reputation.
5
• Over-complying reduces the risk of accidental under-compliance. For example,
if the firm tries to achieve a MPG standard of 28 MPG, it reduces the risk of
missing the compliance standard of 26 MPG, which might occur if gas prices are
low and the firm sells too many SUVs.
6. Achieving a higher compliance standard incurs marginal benefits of inno-
vation and long term focus. Higher compliance levels eventually requires more
innovation.
• Innovations build off each other and sometimes spill over into areas other than
regulation compliance. One might invent a turbo-charger to save energy, but find
it conveys additional benefits in terms of faster acceleration.
• Sustainability minded firms keep a long term focus, anticipating trends that lead
to additional opportunities.
To compute the optimal compliance level, we will have to numerically consider
all of these benefits and costs.
III Welfare
The purpose of regulation is to improve the welfare of society. It is unlikely that all reg-
ulations result in the same welfare improvements. Which generates more carbon emissions
reductions per dollar of compliance costs, renewable fuel standards or CAFE standards?
A Importance Well-Designed Regulation
Even if one cares only about social goals and the environment and not compliance costs,
it still makes sense to support regulations which increase welfare at low compliance costs.
Unnecessarily costly regulation:
1. Generates political resistance, resulting in regulations which are not passed, or are
passed with loopholes, or which are held up in court due to lawsuits.
2. Results in more cheating and non-compliance. Regulated entities which are
saddled with unnecessary compliance costs have a strong incentive to cheat. Often the
alternative is going out of business.
6
3. Results in more decisions made solely to (legally) evade regulations. Firms
have a number of options for complying with regulations that achieve the standard
without actually achieving the regulation goals. With the CAFE standards, we saw
that auto manufacturers could comply with the regulation by changing the wheelbase,
rather than actually improving fuel economy. The costlier the regulation, the more
likely firms are to do actions like this which evade the spirit of the regulation.
B Market Failures
Many people ask why regulation is justified at all. Perhaps the market economy can maximize
welfare without regulation. Indeed the market seems very good at producing some goods.
No one talks about a shortage of Iphones. Yet, there are few if any subsidies for Iphone
production or minimum Iphone standards.
It turns out that two incredibly important theorems known as the welfare theorems (think
of E = mc2 but far more useful), discovered in the 1960s by Nobel Prize winners Kenneth
Arrow and Gerard Debreu establish precise conditions under which the decentralized market
maximizes welfare. We will study these theorems, mainly from the contraposi-
tive: when these conditions are violated (a market failure), as they often are,
regulation can improve welfare.
We will also see cases of government failure: the government sometimes fails to
impose regulation that maximizes welfare, even when a market failure exists.
Is there are solution when both markets and governments fail to maximize welfare? We
will learn that in fact consumers and investors, by creating incentives for firms, can improve
welfare in these situations. From this, we can see sustainable business through a new lens. If
markets or government worked, there would be no need for socially responsible
investing or sustainable consumers. But the recent paralysis of government, in
fact explains much of the new focus on sustainability. It is an alternative way to
improve welfare when governments fail to act.
C Welfare Criteria
When markets fail, government regulation can improve welfare. How can we determine which
types of regulation we should use? We will have 2 criteria:
1. Efficiency: the regulation should achieve social/environmental goals at the least pos-
sible cost. A corollary to efficiency is designing regulation that does not create perverse
7
incentives. When regulation creates an incentive to evade the regulation, no one wins.
Firms pay a cost to evade regulation, and society fails to get the benefits that the
regulation was designed to achieve.
2. Equity: the compliance costs should not be distributed in a way such that low income
households pay most of the cost.
D Balancing Stakeholders and the Business Roundtable Statement
Sometimes people present reductio ad absurdum arguments against sustainable business to
me. If the purpose of the firm is to improve the environment, why does the firm produce
any goods at all? If the purpose of the firm is to maintain a sustainable workforce, why not
reduce profits to zero and pay all business income as wages?
The recent Business Roundtable statement illustrates the confusion. The Business Roundtable
statement says the purpose of the firm is to serve five stakeholders: customers, employees,
suppliers, communities, and shareholders. Notice that shareholders are conspicuously listed
last. The statement was criticized on one hand for being toothless and on the other hand
for not clearly stating which stakeholders have a priority (a recipe for lawsuits). How can
the firm satisfy five stakeholders? What weight should we attach to each stakeholder, when
their interests conflict (wages versus stockholder income)?
Although the statement is confusing, sustainable business principles, provide much
clearer guidance.
• Socially responsible investors push companies to have a sustainable workforce. But so-
cially responsible investors also value profits and dividends. They will push companies
to maintain a balance.
• Consumers want products produced by responsible companies, but also value products
that are reasonably priced. They will pay more for a responsible product, but not
tremendously more. In turn, this guides the firm to strike a balance between the
interests of consumers and other stakeholders, such as communities.
IV Stylized Facts
Here we can look at a few stylized facts, both with respect to regulation and the ultimate
goals of society that regulation addresses.
8
A Environment
The US has made many tremendous strides in terms of improving environmental quality
since the 1970s. Much of these achievements resulted from regulations such as the Clean Air
Act. This is not to say the game is over. A surprising conclusion from the recent literature
is that even modest levels of pollution can cause serious adverse health effects. Further,
regulation has been less successful in certain geographic regions and certain pollutants.
1 Criteria Air Pollutants
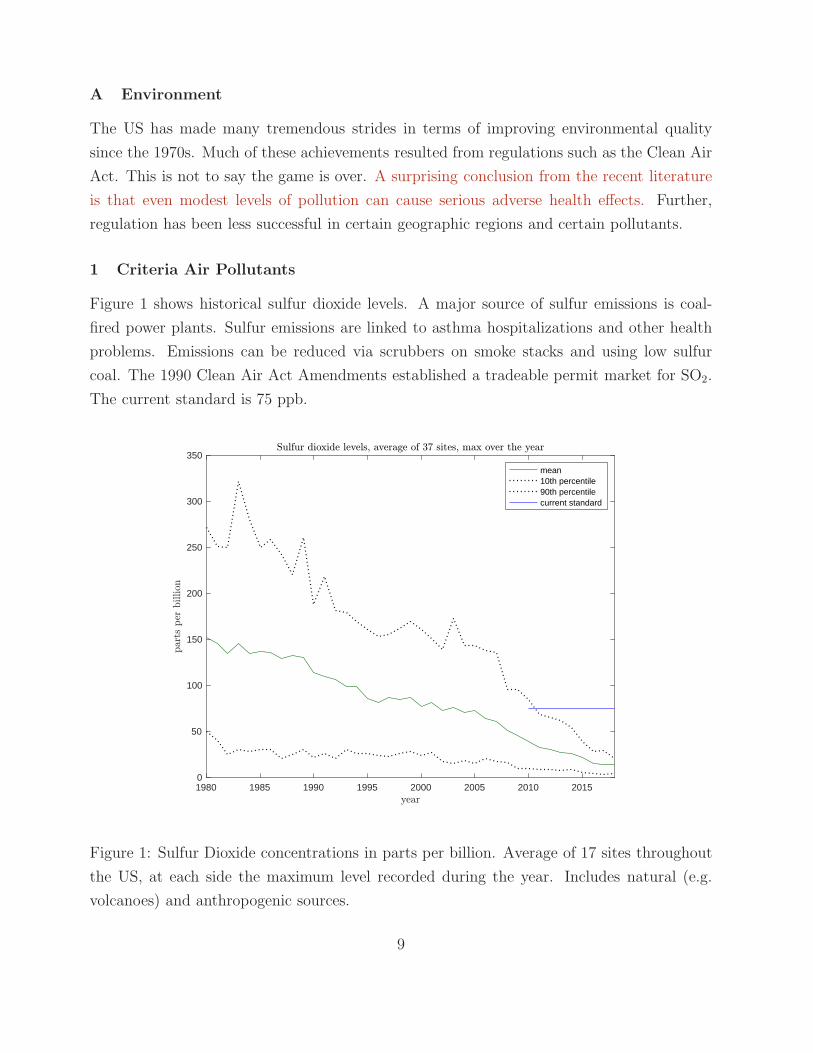
Figure 1 shows historical sulfur dioxide levels. A major source of sulfur emissions is coal-
fired power plants. Sulfur emissions are linked to asthma hospitalizations and other health
problems. Emissions can be reduced via scrubbers on smoke stacks and using low sulfur
coal. The 1990 Clean Air Act Amendments established a tradeable permit market for SO2.
The current standard is 75 ppb.
1980 1985 1990 1995 2000 2005 2010 20150
50
100
150
200
250
300
350
mean10th percentile90th percentilecurrent standard
Figure 1: Sulfur Dioxide concentrations in parts per billion. Average of 17 sites throughout
the US, at each side the maximum level recorded during the year. Includes natural (e.g.
volcanoes) and anthropogenic sources.
9
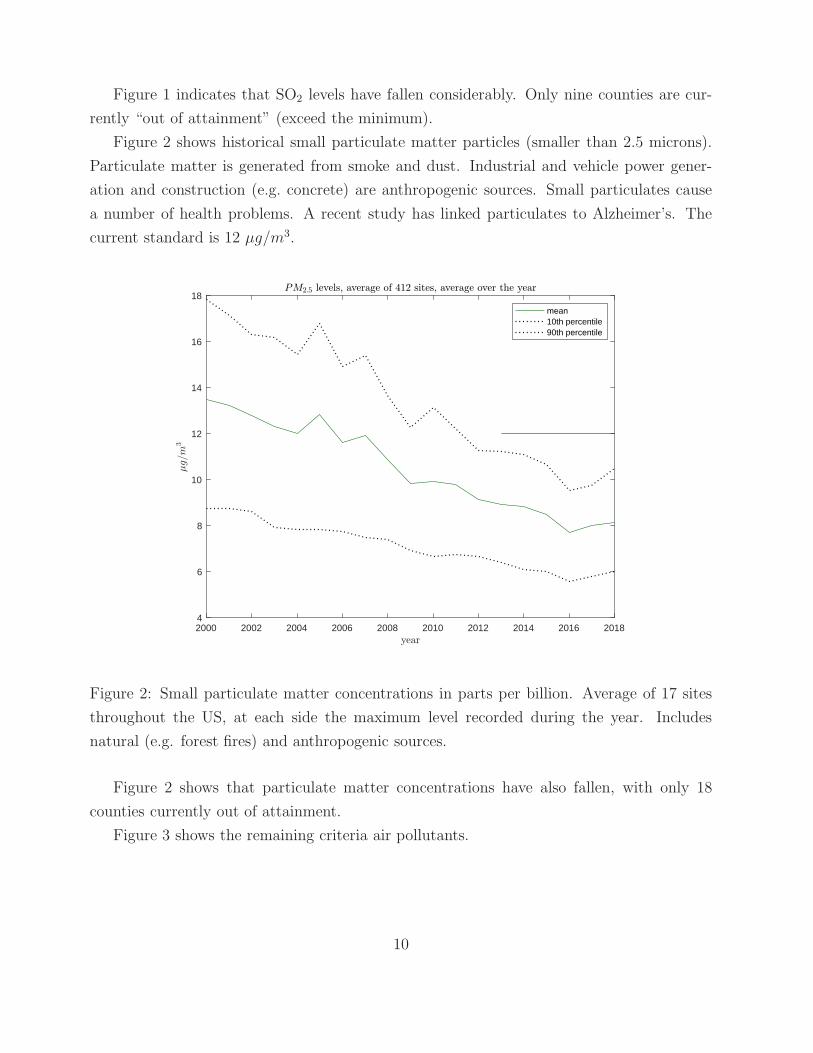
Figure 1 indicates that SO2 levels have fallen considerably. Only nine counties are cur-
rently “out of attainment” (exceed the minimum).
Figure 2 shows historical small particulate matter particles (smaller than 2.5 microns).
Particulate matter is generated from smoke and dust. Industrial and vehicle power gener-
ation and construction (e.g. concrete) are anthropogenic sources. Small particulates cause
a number of health problems. A recent study has linked particulates to Alzheimer’s. The
current standard is 12 µg/m3.
2000 2002 2004 2006 2008 2010 2012 2014 2016 20184
6
8
10
12
14
16
18
mean10th percentile90th percentile
Figure 2: Small particulate matter concentrations in parts per billion. Average of 17 sites
throughout the US, at each side the maximum level recorded during the year. Includes
natural (e.g. forest fires) and anthropogenic sources.
Figure 2 shows that particulate matter concentrations have also fallen, with only 18
counties currently out of attainment.
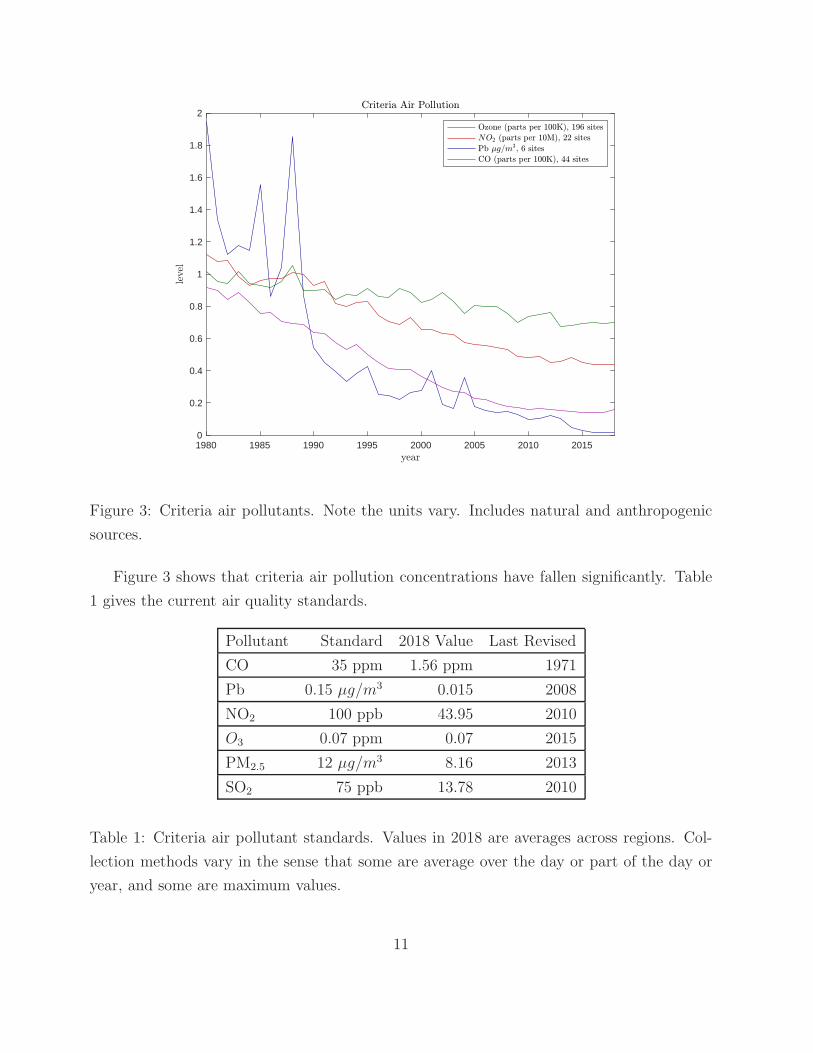
Figure 3 shows the remaining criteria air pollutants.
10
1980 1985 1990 1995 2000 2005 2010 20150
0.2
0.4
0.6
0.8
1
1.2
1.4
1.6
1.8
2
Figure 3: Criteria air pollutants. Note the units vary. Includes natural and anthropogenic
sources.
Figure 3 shows that criteria air pollution concentrations have fallen significantly. Table
1 gives the current air quality standards.
Pollutant Standard 2018 Value Last Revised
CO 35 ppm 1.56 ppm 1971
Pb 0.15 µg/m3 0.015 2008
NO2 100 ppb 43.95 2010
O3 0.07 ppm 0.07 2015
PM2.5 12 µg/m3 8.16 2013
SO2 75 ppb 13.78 2010
Table 1: Criteria air pollutant standards. Values in 2018 are averages across regions. Col-
lection methods vary in the sense that some are average over the day or part of the day or
year, and some are maximum values.
11
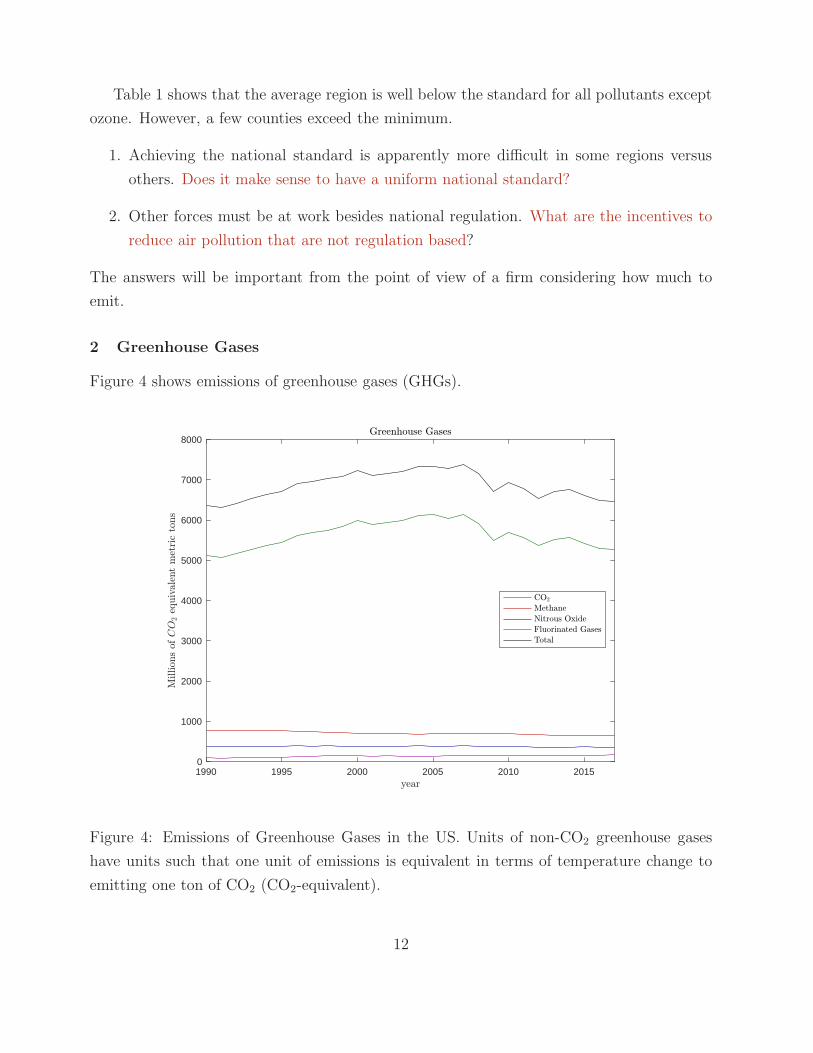
Table 1 shows that the average region is well below the standard for all pollutants except
ozone. However, a few counties exceed the minimum.
1. Achieving the national standard is apparently more difficult in some regions versus
others. Does it make sense to have a uniform national standard?
2. Other forces must be at work besides national regulation. What are the incentives to
reduce air pollution that are not regulation based?
The answers will be important from the point of view of a firm considering how much to
emit.
2 Greenhouse Gases
Figure 4 shows emissions of greenhouse gases (GHGs).
1990 1995 2000 2005 2010 20150
1000
2000
3000
4000
5000
6000
7000
8000
Figure 4: Emissions of Greenhouse Gases in the US. Units of non-CO2 greenhouse gases
have units such that one unit of emissions is equivalent in terms of temperature change to
emitting one ton of CO2 (CO2-equivalent).
12
Emissions of GHGs correlate with economic production. The peak in GHG emissions
in 2007 is due to the recession which began in 2008. Nonetheless, the economy has fully
recovered from the recession and total emissions are still falling (slowly!). GHG emissions
in 2017 are roughly the same as emissions in 1992-1993. Carbon Dioxide accounts for the
biggest part of the drop, but most other greenhouse gases have been falling as well.
We do not have a single Federal GHG regulation, such as the European Cap and Trade
System (ETS). But that should not be confused with saying no regulations exist on GHGs.
A host of Federal and State regulations exist, from taxes on gasoline, CAFE standards, state
renewable fuel standards, light bulb standards, and thousands of other regulations exist
which in part reduce GHGs.
3 Emissions Intensity/Efficiency
The long term decline in air pollution and recent decline in GHGs is all the more remarkable
given that economic production (GDP) has more than tripled since 1970 and has increased
19% since 2007. We can say that the economy is becoming less emissions intensive or more
emissions efficient.
Definition 7 Emissions Intensity or Emissions Efficiency: Emissions divided by real
GDP.
In finding emissions intensity, it is important to account for inflation. If prices rise, the
nominal value of production (GDP) rises, but the same amount of goods are produced, so
there is no real gain in efficiency.
Definition 8 Nominal: not adjusted for inflation. Units are current dollars.
Definition 9 Real: adjusted for inflation, so that each dollar over time has the same pur-
chasing power. Units are constant dollars.
Emissions intensity uses real GDP. When comparing values over time, it is important to use
real values, otherwise one is essentially comparing dollars with different units and purchasing
power.
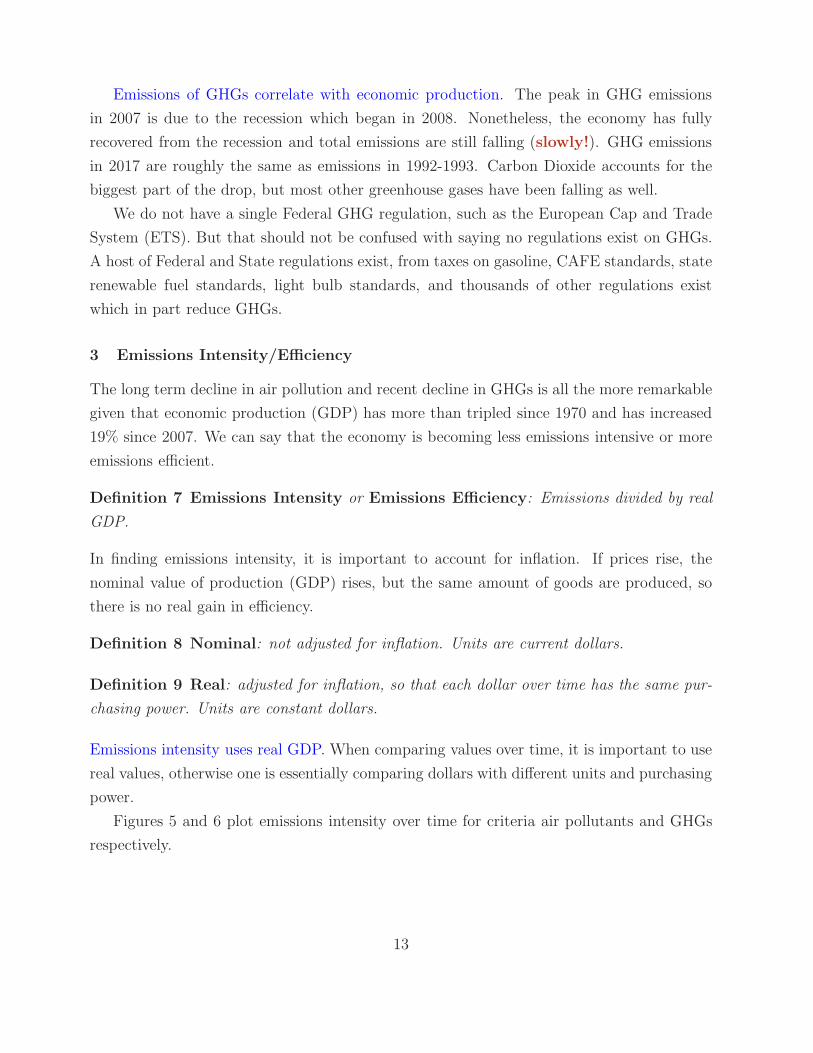
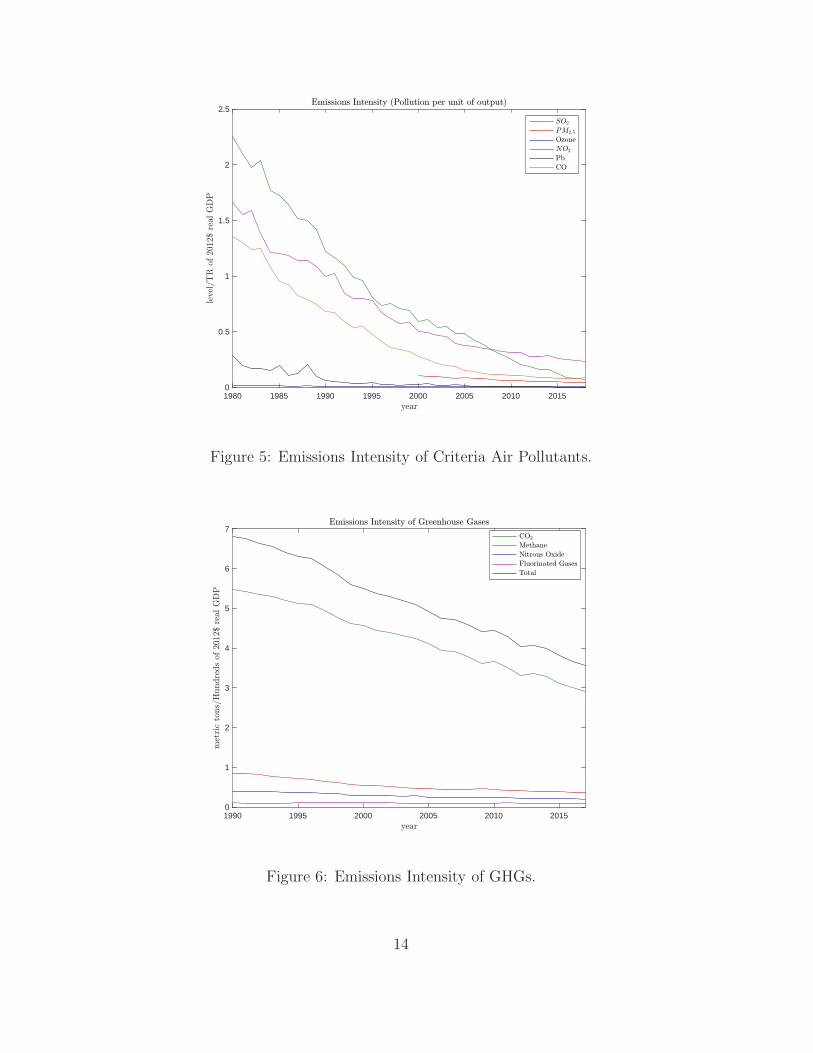
Figures 5 and 6 plot emissions intensity over time for criteria air pollutants and GHGs
respectively.
13
1980 1985 1990 1995 2000 2005 2010 20150
0.5
1
1.5
2
2.5
Figure 5: Emissions Intensity of Criteria Air Pollutants.
1990 1995 2000 2005 2010 20150
1
2
3
4
5
6
7
Figure 6: Emissions Intensity of GHGs.
14
Figures 5 and 6 show very large declines in emissions intensity over time in the US.
Some regulations actually focus on emissions intensity rather than total emis-
sions. CAFE standards are a kind of intensity regulation, focusing on the efficiency of the
car rather than the amount of gasoline consumed. We will study intensity regulations and
see welfare differences versus regulations on total emissions.
Emissions intensity can also be used to assess industries. For example, the fashion indus-
try accounts for 2% of world GDP but 8% of world carbon emissions. The fashion industry
is therefore not very emissions efficient, emitting a lot of carbon to produce goods that are
relatively low value.
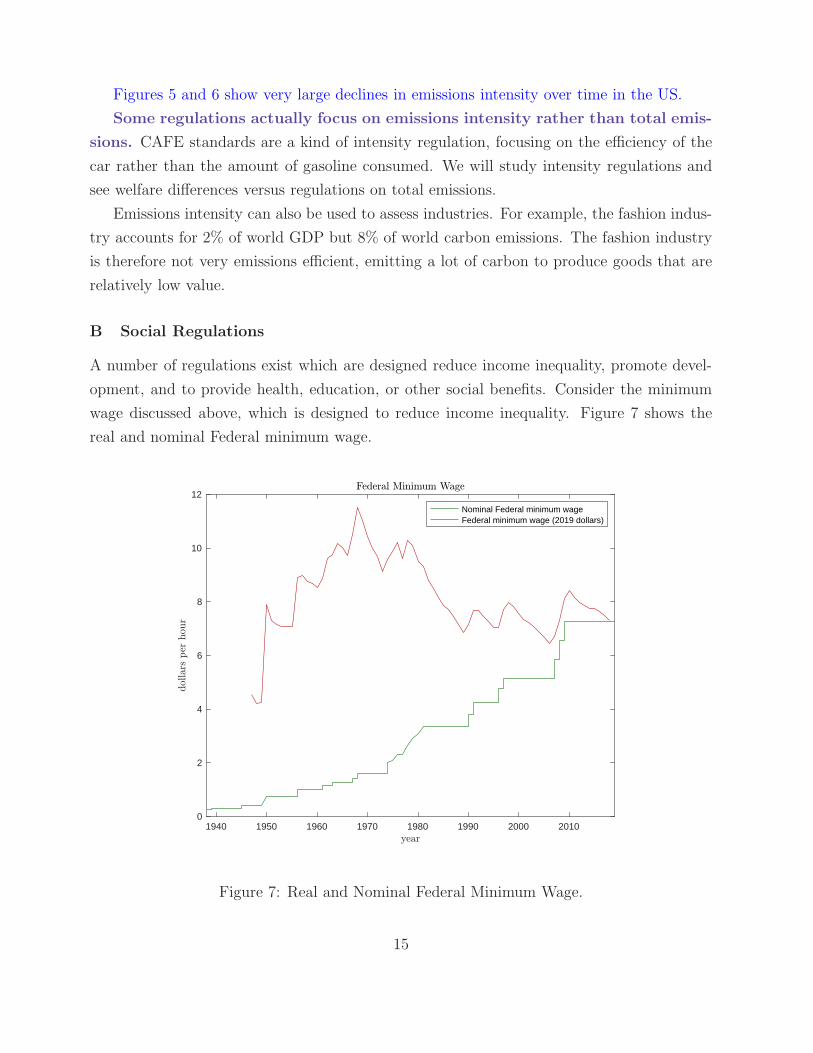
B Social Regulations
A number of regulations exist which are designed reduce income inequality, promote devel-
opment, and to provide health, education, or other social benefits. Consider the minimum
wage discussed above, which is designed to reduce income inequality. Figure 7 shows the
real and nominal Federal minimum wage.
1940 1950 1960 1970 1980 1990 2000 20100
2
4
6
8
10
12
Nominal Federal minimum wageFederal minimum wage (2019 dollars)
Figure 7: Real and Nominal Federal Minimum Wage.
15
The nominal Federal Minimum Wage has not changed since 2009. Nonetheless, the real
minimum wage falls over time as inflation reduces the purchasing power of the nominal
Federal minimum. The real minimum wage been roughly constant since 1990. In turn,
many states and municipalities have set their own higher minimum wages.
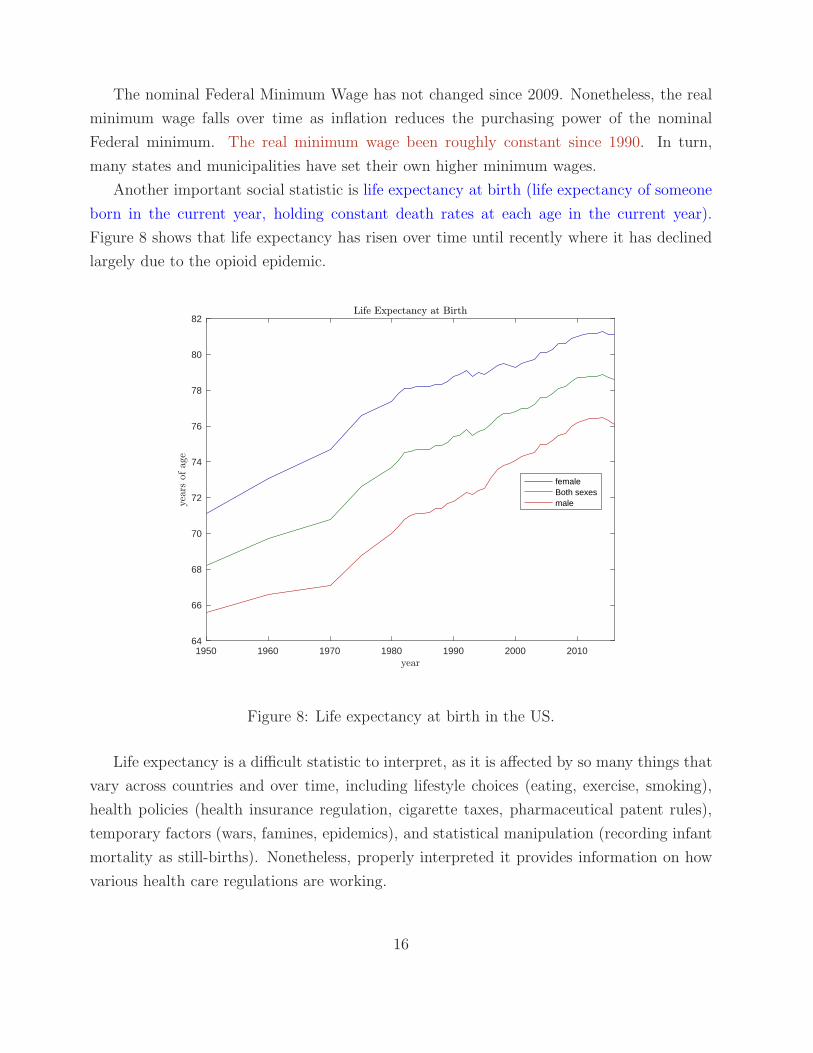
Another important social statistic is life expectancy at birth (life expectancy of someone
born in the current year, holding constant death rates at each age in the current year).
Figure 8 shows that life expectancy has risen over time until recently where it has declined
largely due to the opioid epidemic.
1950 1960 1970 1980 1990 2000 201064
66
68
70
72
74
76
78
80
82
femaleBoth sexesmale
Figure 8: Life expectancy at birth in the US.
Life expectancy is a difficult statistic to interpret, as it is affected by so many things that
vary across countries and over time, including lifestyle choices (eating, exercise, smoking),
health policies (health insurance regulation, cigarette taxes, pharmaceutical patent rules),
temporary factors (wars, famines, epidemics), and statistical manipulation (recording infant
mortality as still-births). Nonetheless, properly interpreted it provides information on how
various health care regulations are working.
16
V Regulation Facts
Regulations are difficult to measure. A regulation may have little effect (few make the
Federal minimum wage), or a very dramatic effect. Regulations also might impose large or
negligible costs. Costs and benefits might also be small, but significant on small groups of
people (e.g. agricultural price supports). These caveats aside, we can look at a few statistics.
The Federal government has several categories:
Definition 10 Economically Significant Rules: have an annual effect on the economy
of $100M or more or adversely affect in a material way the economy, a sector of the economy,
productivity, competition, jobs, the environment, public health or safety, or State, local, or
tribal governments or communities.
Definition 11 Significant Rules: create a serious inconsistency or otherwise interfere
with an action taken or planned by another agency; materially alter the budgetary impact of
entitlements, grans, user fees, or loan programs or the rights and obligations of the recipients
thereof; or raise novel legal or policy issues arising out of legal mandates, the President’s
priorities, or the principles set forth. Includes economically significant rules.
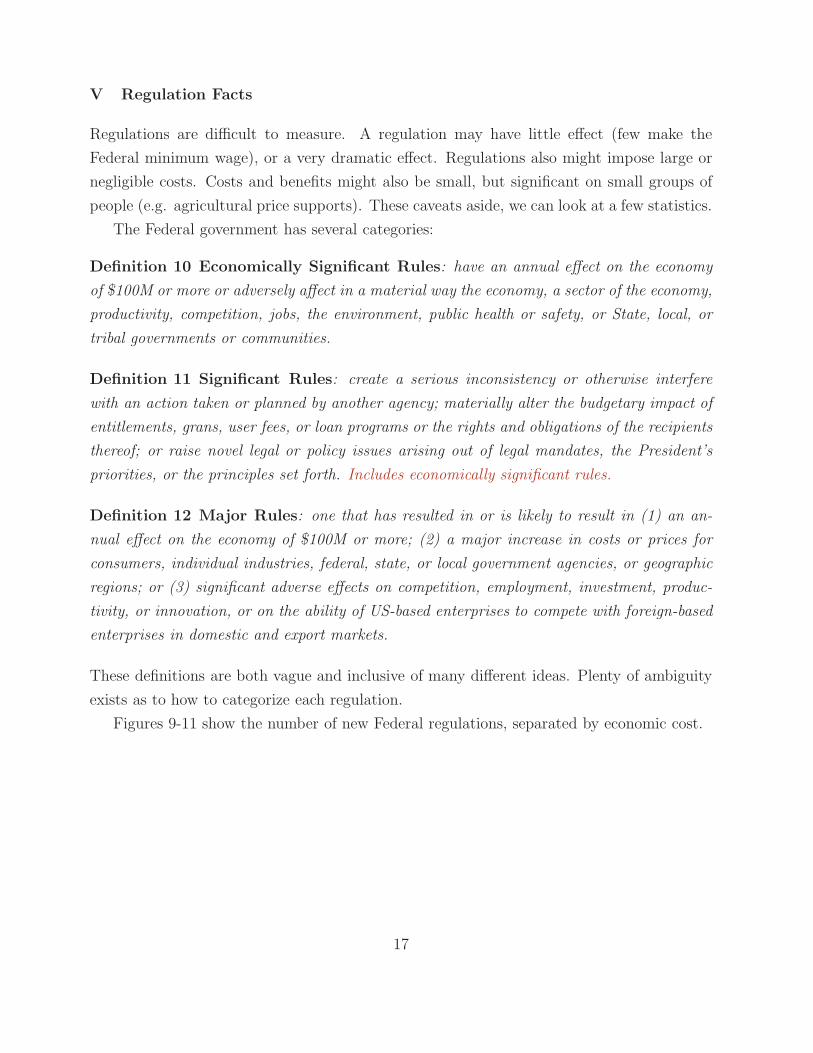
Definition 12 Major Rules: one that has resulted in or is likely to result in (1) an an-
nual effect on the economy of $100M or more; (2) a major increase in costs or prices for
consumers, individual industries, federal, state, or local government agencies, or geographic
regions; or (3) significant adverse effects on competition, employment, investment, produc-
tivity, or innovation, or on the ability of US-based enterprises to compete with foreign-based
enterprises in domestic and export markets.
These definitions are both vague and inclusive of many different ideas. Plenty of ambiguity
exists as to how to categorize each regulation.
Figures 9-11 show the number of new Federal regulations, separated by economic cost.
17

1985 1990 1995 2000 2005 2010 20150
10
20
30
40
50
60
70
80
90
100
Figure 9: Annual number of economically significant rules published. Year starts and ends in
late January (presidential year). Source: George Washington University Regulatory Studies
Center.
1995 2000 2005 2010 201550
100
150
200
250
300
350
400
Figure 10: Annual number of significant rules published.
18
1996 1998 2000 2002 2004 2006 2008 2010 2012 2014 2016 201830
40
50
60
70
80
90
100
110
120
130
Figure 11: Annual number of major rules published.
The number of new regulations rises or falls depending on which party controls the
presidency, and to some extent Congress. The total number rules increases over time as new
rules add up.
19

MARKETS AND MARKET FAILURES
I Markets and Market Failures
This section will build in part on Eco 613. You may want to review your notes from that
class.
Unregulated markets provide many goods and services quite efficiently. Few complain
about shortages of Iphones. But other valuable goods seem to be under-provided, for example
clean air, ecosystems, innovations, and income equality (people value societies where income
is relatively evenly distributed). If a valuable good is under-provided, a case exists for
government regulation.
The first step to determine what kinds of goods are under-provided (and even what
“under-provided” means) and how the unregulated market “decides” what/how much goods
to produce. Doing so is helpful because companies must decide what/how much goods to
produce, and this decision is affected both by regulation and by sustainability considera-
tions. Once we understand how the unregulated market produces, we can make the case for
regulation and see how different kinds of regulation affect firm production decisions. The
eventual goal is to design a type of regulation that provides an optimal amount of each good.
A Private Supply and Demand
Consider a firm supplying a good to an unregulated market. The firm must decide how many
goods to produce. We will also start by assuming the market is perfectly competitive.
Definition 13 Perfect Competition: firms have no ability to influence input or output
prices.
Examples:
• Commodity markets (for example, oil and agricultural products) are competitive. An
oil producer sells oil on the world market at the spot price of oil (currently about $60
per barrel). Suppose an oil firm in Texas charges $60.01. Then the company would
lose all customers, who would just buy from someone else at $60.
• Many Retail markets such as internet retail, Uber/Lyft, and gasoline stations are
competitive.
20
• The market for Iphones is not competitive. if Apple raises the price, some customers
will buy other phones, but many will pay the higher price.
Competitive markets are characterized by:
1. Non-differentiated products. The same product is produced by all companies.
2. A large number of producers exist.
3. Customers have full information about prices.
Sustainability note: Producing sustainable products helps companies differenti-
ate products, reducing competition.
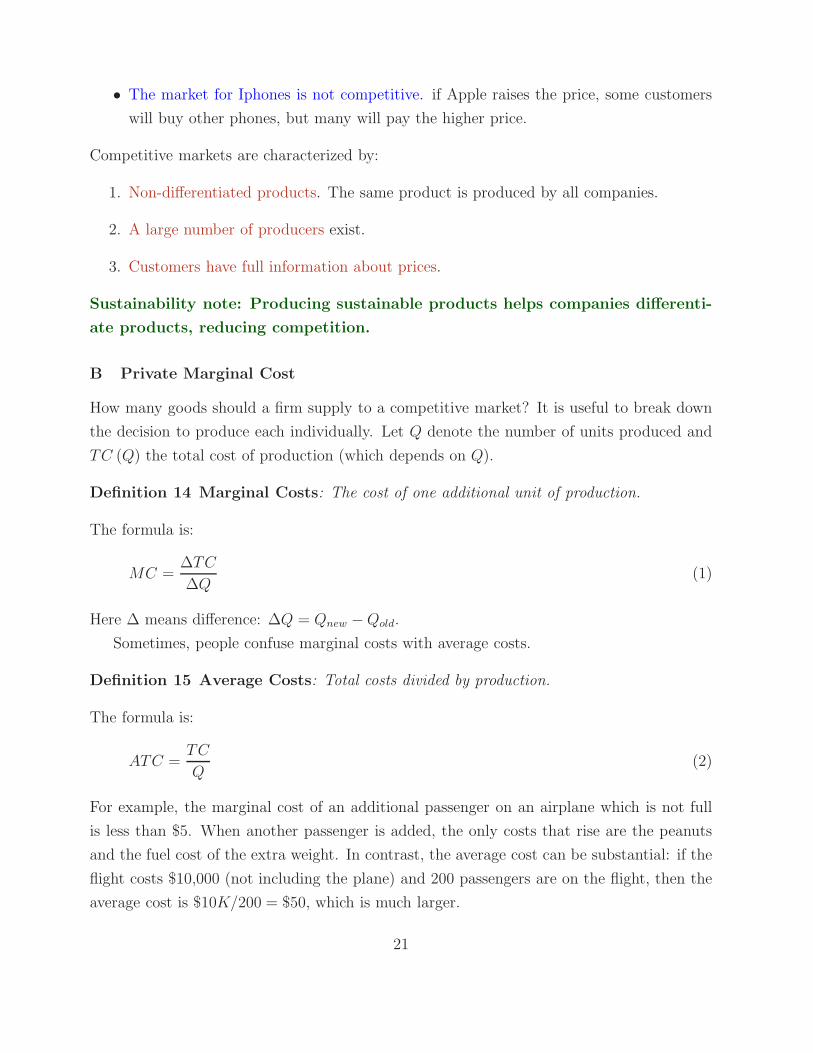
B Private Marginal Cost
How many goods should a firm supply to a competitive market? It is useful to break down
the decision to produce each individually. Let Q denote the number of units produced and
TC (Q) the total cost of production (which depends on Q).
Definition 14 Marginal Costs: The cost of one additional unit of production.
The formula is:
MC =∆TC
∆Q(1)
Here ∆ means difference: ∆Q = Qnew −Qold.
Sometimes, people confuse marginal costs with average costs.
Definition 15 Average Costs: Total costs divided by production.
The formula is:
ATC =TC
Q(2)
For example, the marginal cost of an additional passenger on an airplane which is not full
is less than $5. When another passenger is added, the only costs that rise are the peanuts
and the fuel cost of the extra weight. In contrast, the average cost can be substantial: if the
flight costs $10,000 (not including the plane) and 200 passengers are on the flight, then the
average cost is $10K/200 = $50, which is much larger.
21
Now suppose we can sell the product at price P . From perfect competition, the firm
cannot affect this price, it is a constant. Producing a particular unit costs MC and the unit
generates revenue of P , so the profit on a particular unit is P −MC. So the rule is:
• P ≥ MC: produce the unit. This unit will generate positive profits (P = MC is
actually zero profits, so the firm is actually indifferent, so assume the firm produces).
• P < MC: do not produce the unit. This unit will generate negative profits.
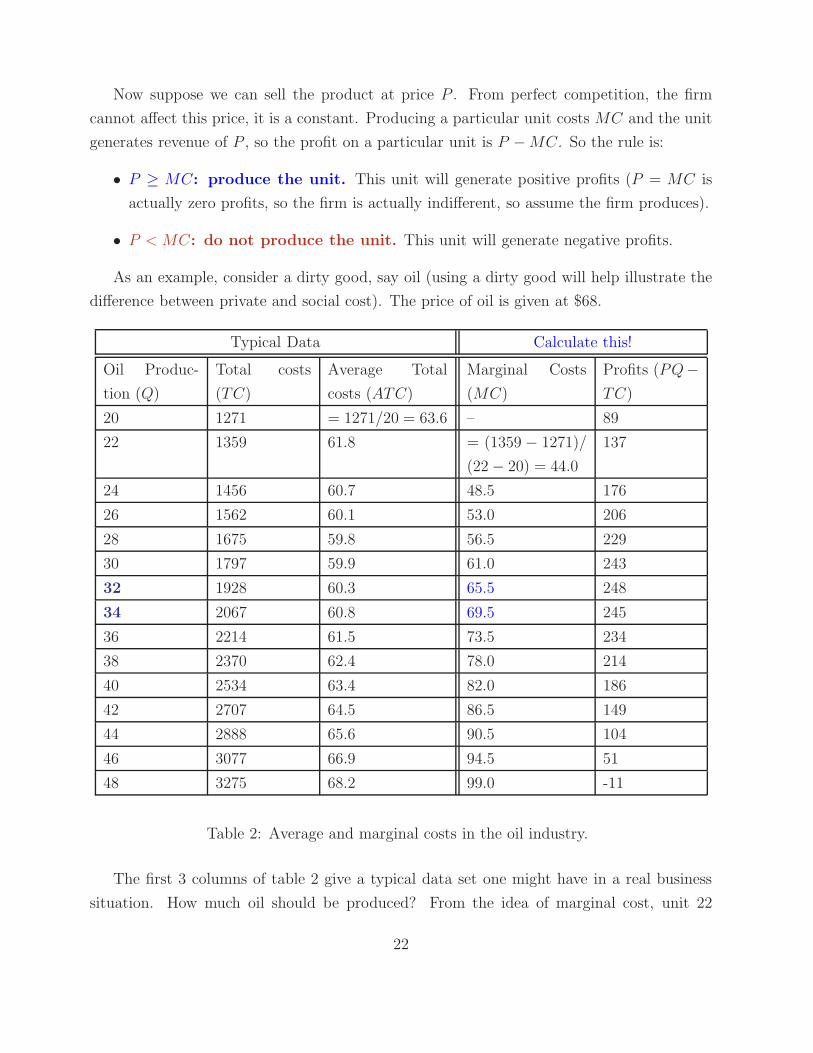
As an example, consider a dirty good, say oil (using a dirty good will help illustrate the
difference between private and social cost). The price of oil is given at $68.
Typical Data Calculate this!
Oil Produc-
tion (Q)
Total costs
(TC)
Average Total
costs (ATC)
Marginal Costs
(MC)
Profits (PQ−
TC)
20 1271 = 1271/20 = 63.6 – 89
22 1359 61.8 = (1359 − 1271)/
(22− 20) = 44.0
137
24 1456 60.7 48.5 176
26 1562 60.1 53.0 206
28 1675 59.8 56.5 229
30 1797 59.9 61.0 243
32 1928 60.3 65.5 248
34 2067 60.8 69.5 245
36 2214 61.5 73.5 234
38 2370 62.4 78.0 214
40 2534 63.4 82.0 186
42 2707 64.5 86.5 149
44 2888 65.6 90.5 104
46 3077 66.9 94.5 51
48 3275 68.2 99.0 -11
Table 2: Average and marginal costs in the oil industry.
The first 3 columns of table 2 give a typical data set one might have in a real business
situation. How much oil should be produced? From the idea of marginal cost, unit 22
22
generates $68− $44 = $24 of profit and should be produced. Unit 38 generates $68− $78 =
−$10 of profit and should not be produced. Overall, between 32 and 34 units should be
produced, as this is where P = MC.
Notice that MC increases with the quantity produced. Many marginal costs are con-
stant. For the oil driller, costs such as shipping and taxes are constant costs per unit. Any
constant per unit cost is a marginal cost. But other marginal costs increase. With
oil, it becomes more difficult to extract larger volumes as less efficient wells must be brought
online. Saudi wells operate at a marginal cost of $10 per barrel, US fracking is about $37
per barrel (for the Permian Basin in Texas), and North Sea oil is about $39 per barrel. Once
Saudi wells are at maximum production, the marginal cost rises from $10 to $37 since the
more costly fracking wells are brought online.
From Table 2, we can also use marginal cost to determine how the supply of goods to the
market varies with the price. For example, at a price of $48.50, 24 units are supplied and
the marginal cost is $48.50, at a price of $53, 26 units are supplied and the marginal cost is
$53, etc.
C Equilibrium
First, let us review what equilibrium means:
Definition 16 Equilibrium: A set of quantities and prices such that no one has an incen-
tive to change behavior.
Suppose demand was greater than supply at a price of $53. Consumers begin to bid up the
price in the world oil spot markets. Producers then have an incentive to increase production
and/or bring new wells online to satisfy that demand. As the price increases, some but not
all consumers drop out because oil is too expensive. The process stops when supply equals
demand. Conversely, when supply exceeds demand, an excess of oil is produced and sellers
begin to decrease prices on the world spot market. As the price falls, expensive producers
drop out, and additional buyers, motivated by the low prices, enter. Supply decreases and
demand increases until supply equals demand.
23
Demand
Oil Production
Supply =MC
Q
$
Q
$10
P
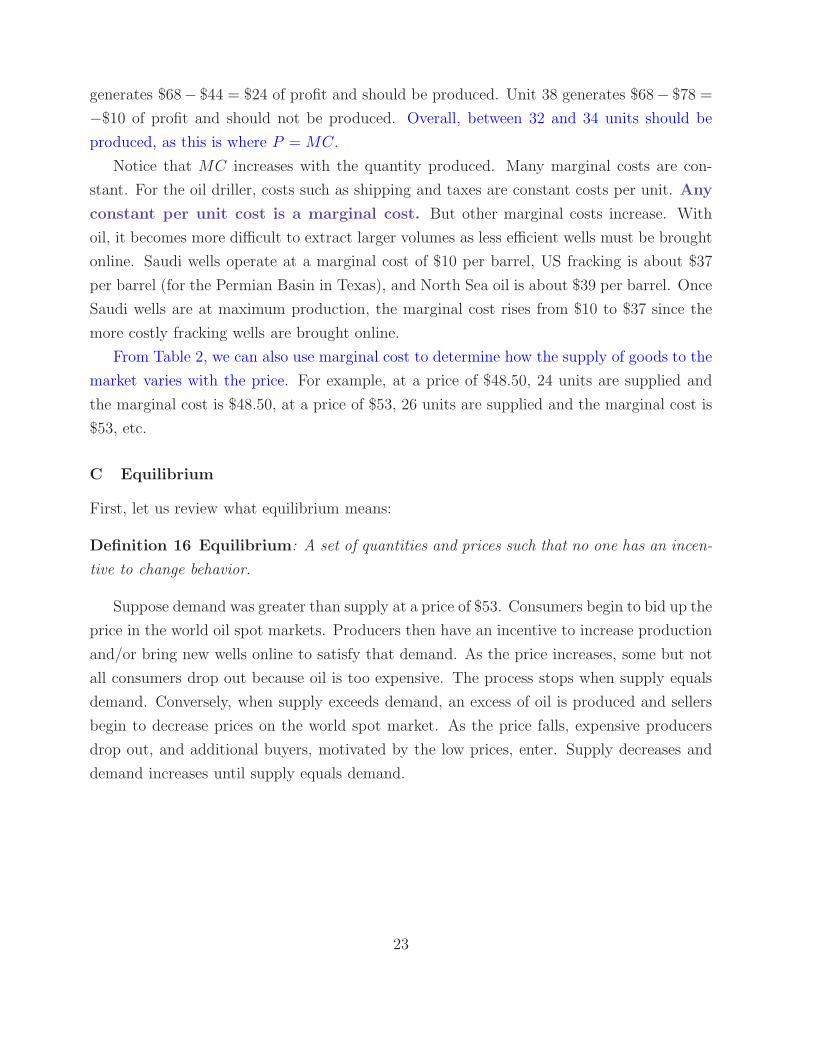
Figure 12: Equilibrium in the oil market. The supply curve reflects that initially only Saudi
oil is produced. When the slope of the supply curve changes, fracking production begins.
At the still greater slope, North Sea production begins. At the equilibrium, no North Sea
production occurs.
II Welfare
Is the equilibrium quantity of oil produced in the unregulated market optimal? First we
need to understand what is meant by optimal. We can describe the equilibrium quantity of
oil an allocation: the equilibrium specifies not only how much oil is produced, but by which
firms (Saudi and fracking) and which consumers get the oil (those that are willing to pay at
least the equilibrium price).
A Pareto Criterion and Surplus
Definition 17 An allocation a′ is Pareto Preferred to another allocation a if at least one
individual strictly prefers a′ and no individual strictly prefers a.
Definition 18 An allocation a is Efficient or Pareto Optimal if no Pareto preferred
allocation exists.
24
The Pareto criterion is a minimum standard for social choice. If we can come up
with an allocation a′ that makes at least one person better off without making anyone worse
off than another allocation a, then we should choose a′.
Does the unregulated market equilibrium satisfies this minimum criteria? To see, let us
compute how happy each consumer and producer is with this equilibrium and see if we can
do better.
The consumer surplus is the the difference between what consumers are willing to pay
and what consumers have to pay, for all goods sold.
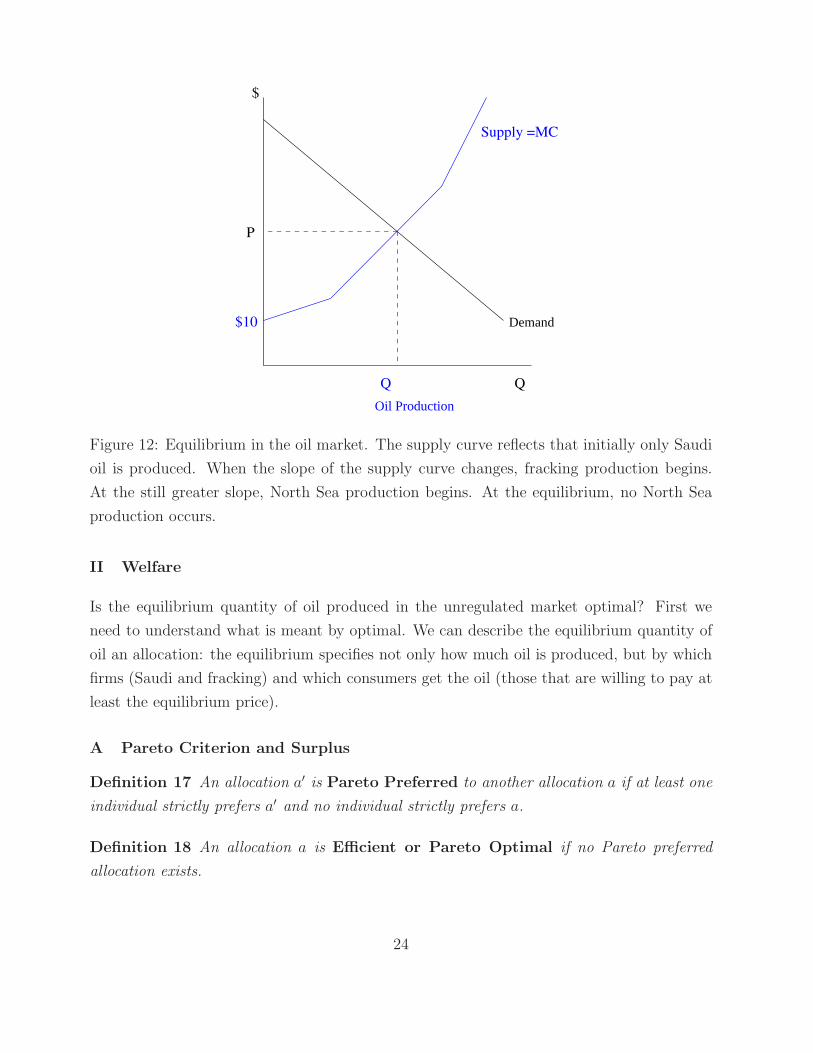
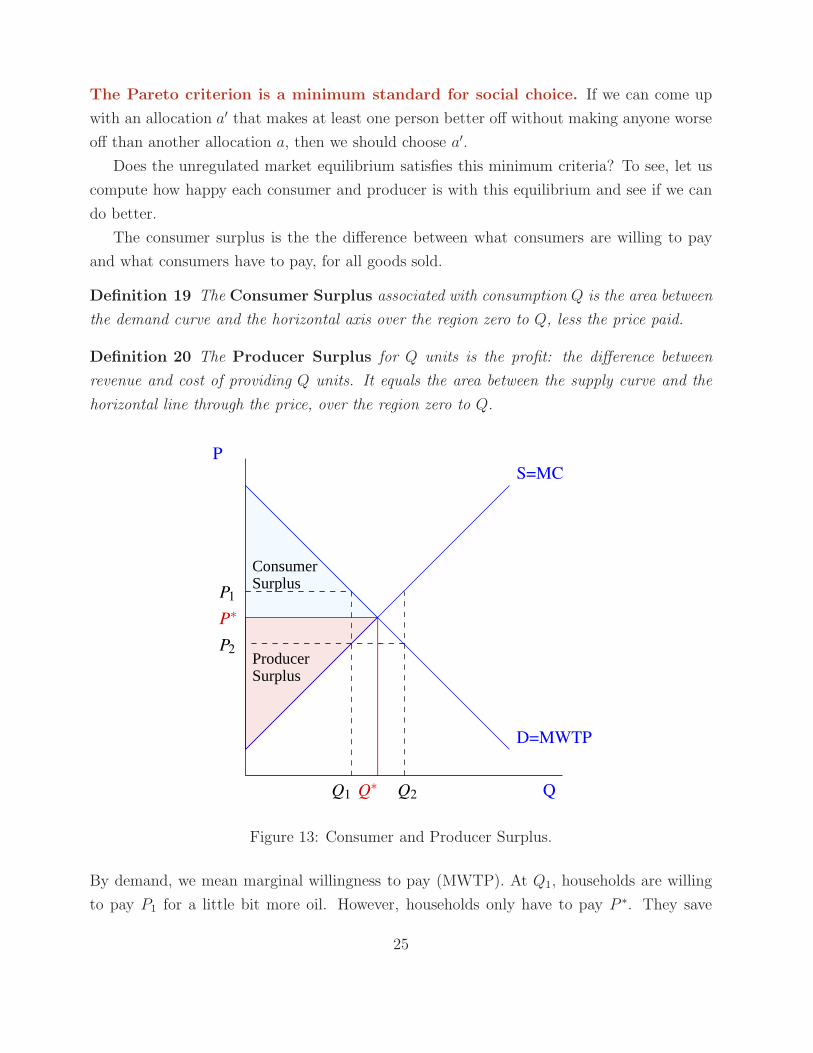
Definition 19 The Consumer Surplus associated with consumption Q is the area between
the demand curve and the horizontal axis over the region zero to Q, less the price paid.
Definition 20 The Producer Surplus for Q units is the profit: the difference between
revenue and cost of providing Q units. It equals the area between the supply curve and the
horizontal line through the price, over the region zero to Q.
SurplusProducer
ConsumerSurplus
Q∗
P∗
Q1 Q2
S=MC
D=MWTP
Q
P
P1
P2
Figure 13: Consumer and Producer Surplus.
By demand, we mean marginal willingness to pay (MWTP). At Q1, households are willing
to pay P1 for a little bit more oil. However, households only have to pay P ∗. They save
25
P −P ∗ which can be used to purchase something else. Similarly, on unit Q1, producers make
P ∗ −Q1 profits. So we can say three things about the market equilibrium:
1. Production takes place at the lowest cost producers.
2. The production goes to the consumers who value that production the most (measured
by their willingness to pay).
3. There is no Pareto preferred allocation to Q∗.
Consider any allocation Q2 > Q. Some producers (stockholder or entrepreneurs) are
worse off, they must produce oil at negative profits. Consider any allocation Q1 < Q. A few
consumers are worse off, they lose the opportunity to purchase a good they value at more
than P ∗ for a price P ∗ (consumer surplus decreases). A few producers are also worse off,
they lose the opportunity to profitably supply goods to the market.
Thus, there is no way to improve on the market equilibrium without making someone
worse off, so the market equilibrium is Pareto Optimal. Total surplus is maximized.
B Welfare Theorems
The optimality result for a single good can be extended to the entire economy, under certain
conditions.
THEOREM 1 First Fundamental Theorem of Welfare Economics: The competitive
equilibrium of a market economy is Pareto Optimal/Efficient.
THEOREM 2 Second Fundamental Theorem of Welfare Economics: Any efficient
allocation can be achieved by a market economy provided resources are appropriately dis-
tributed before the market operates.
Assumptions of welfare theorems:
1. Complete Markets and Property Rights. A well-defined, transferable, and secure
property right exists for each good. A market exists to trade the rights to each good.
The benefits of each good accrues to the owner of the property right. This is equivalent
to saying no public good or externalities exist.
2. Atomistic Participants. Producers and consumers are small relative to the market
and thus cannot influence prices (no monopolies/oligopolies).
26
3. Complete Information. Consumers and producers have equal knowledge of current
and future prices.
4. No Transaction Costs. It must be costless to price and trade each good.
That the market equilibrium is Pareto Optimal is a beautiful theoretical result. However,
the assumptions make clear that Markets may fail: one or more assumptions of the welfare
theorems is not satisfied, and thus the market does not provide the optimal quantity of a
good.
People often misinterpret the welfare theorems. They do not say that the market should
not be regulated. Instead they state when markets fail, and when government intervention
can lead to Pareto preferred allocations. Examples:
• Clean air: a firm could produce clean air by emitting less pollution. However, no
market exists to sell clean air. The firm cannot prevent households from consuming
clean air without paying. We should therefore expect markets to provide less clean air
than is optimal.
• Water: water is highly regulated, but is there an externality or public good? Companies
can and do sell water, and consumers cannot consume water made by firms for free.
Producing water does not generate any external benefits that the firm cannot capture
through higher prices.
• Safe working conditions: safe working conditions are demanded by workers and sup-
plied by firms. But there is no market in which a worker could buy safer working
conditions (less obvious markets may exist: workers may demand a wage premium for
working in unsafe environments). Further, information on safety conditions might be
hard to come by for workers.
• Gender pay equality. Similarly, no obvious market exists, but firms which practice
gender pay equality may attract more productive workers. However, the information
problem exists in that it is unclear to workers how much firms value their labor.
Definition 21 Externality: Production or consumption activity which affects a third party
without compensation.
• Negative Externality: Production or consumption which reduces a third party’s util-
ity or profits without compensation.
27
• Positive Externality: Production or consumption which increases a third party’s
utility or profits without compensation.
The second welfare theorem is about distribution or equality. It says that by allocating
wealth unevenly, we can generate many different competitive equilibria which are Pareto
Efficient. Think carefully: an allocation where one person receives all goods is a Pareto
efficient allocation: no way exists to make one person better off without making the wealthy
person worse off. By giving one person all resources at the beginning, the resulting compet-
itive equilibrium will generate an allocation in which one person continues to have all the
resources. From this we conclude:
• Efficiency and Equity are different.
• The market produces efficient allocations (subject to the conditions above), but does
not ensure equity.
III Social Marginal Cost
A Output Markets
To find the optimal allocation when markets fail, we need to consider all marginal costs,
not just those paid by the firm. Consider oil. One barrel of oil results in the emission of
0.43 metric tons of CO2 per barrel of oil. Carbon emissions results in climate change which
imposes a number of costs:
1. Health costs. Climate change causes increased heat related mortality (e.g. heat
stroke), increases in disease (e.g. West Nile virus), illnesses resulting from poor air
quality (e.g. ozone rises, causing more asthma).
2. Productivity costs. Climate change decreases labor productivity (workers are sick
more often and are less productive working outdoors in the heat) and agricultural
productivity (some crops do less well in the heat).
3. Sea level rise costs. Especially coastal property damage.
4. See the 4th National Climate Assessment for a complete listing (22 total).
None of these are paid by the oil company. They are social costs not private costs.
28
Definition 22 Social costs: All production costs including those paid by someone other
than the firm producing the good. Equals private costs plus externality costs.
How much is the marginal social cost of a ton of carbon?
Definition 23 Social Cost of Carbon (SCC): total marginal social costs of carbon
(equals the externality cost).
The EPA has estimated the social cost of carbon at about $36 per ton. There is some
controversy in this number, for example whether or not to include “co-benefits” as reducing
carbon also often reduces other air pollutants, and whether or not to include non-US citizens
in this number (the EPA SCC does both).
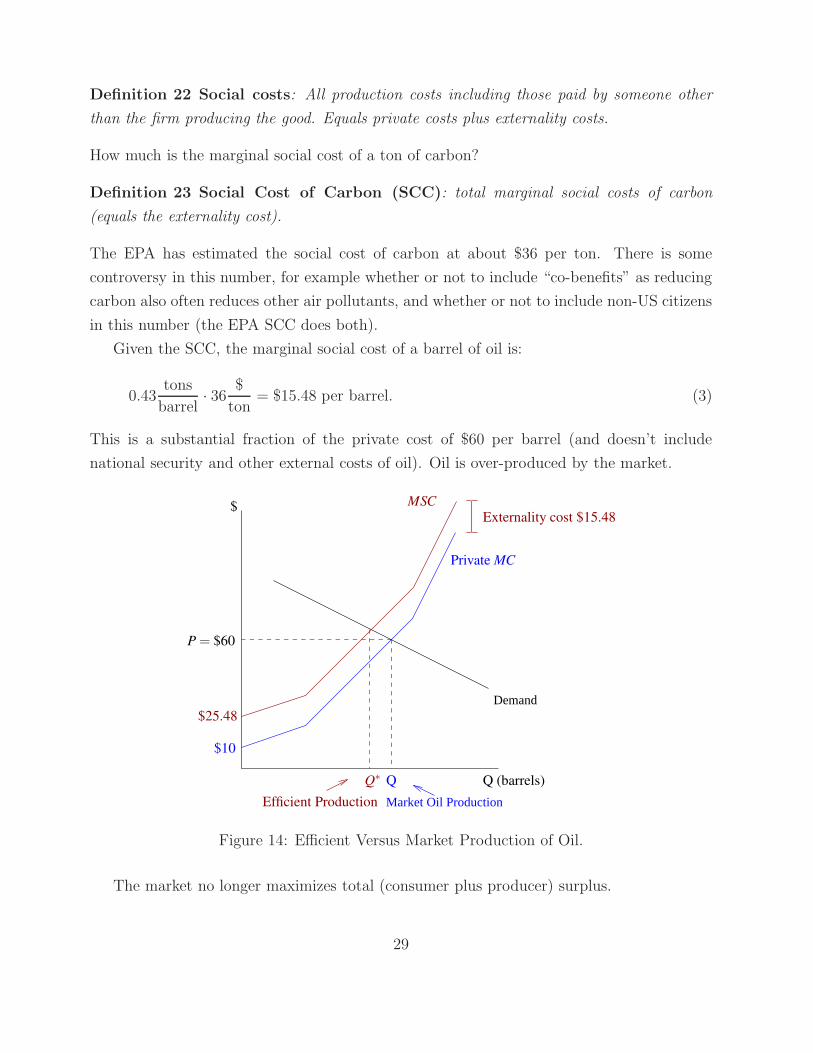
Given the SCC, the marginal social cost of a barrel of oil is:
0.43tons
barrel· 36
$
ton= $15.48 per barrel. (3)
This is a substantial fraction of the private cost of $60 per barrel (and doesn’t include
national security and other external costs of oil). Oil is over-produced by the market.
Demand
Market Oil Production
Q∗
Externality cost $15.48
Efficient Production
$25.48
Q (barrels)
Private MC
MSC
$10
Q
$
P = $60
Figure 14: Efficient Versus Market Production of Oil.
The market no longer maximizes total (consumer plus producer) surplus.
29
Surplus$60
Q
S=MC
Externality cost $15.48
MSC = MC+15.48
Q∗
P
D=MWTP
Q
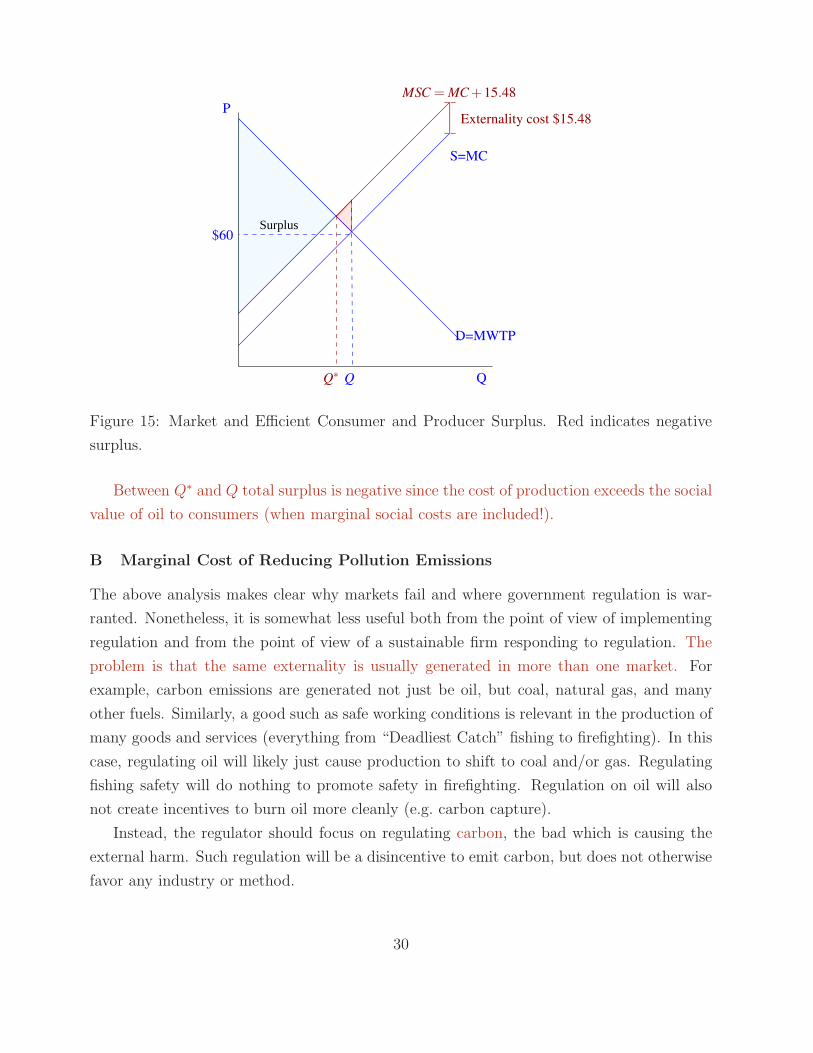
Figure 15: Market and Efficient Consumer and Producer Surplus. Red indicates negative
surplus.
Between Q∗ and Q total surplus is negative since the cost of production exceeds the social
value of oil to consumers (when marginal social costs are included!).
B Marginal Cost of Reducing Pollution Emissions
The above analysis makes clear why markets fail and where government regulation is war-
ranted. Nonetheless, it is somewhat less useful both from the point of view of implementing
regulation and from the point of view of a sustainable firm responding to regulation. The
problem is that the same externality is usually generated in more than one market. For
example, carbon emissions are generated not just be oil, but coal, natural gas, and many
other fuels. Similarly, a good such as safe working conditions is relevant in the production of
many goods and services (everything from “Deadliest Catch” fishing to firefighting). In this
case, regulating oil will likely just cause production to shift to coal and/or gas. Regulating
fishing safety will do nothing to promote safety in firefighting. Regulation on oil will also
not create incentives to burn oil more cleanly (e.g. carbon capture).
Instead, the regulator should focus on regulating carbon, the bad which is causing the
external harm. Such regulation will be a disincentive to emit carbon, but does not otherwise
favor any industry or method.
30
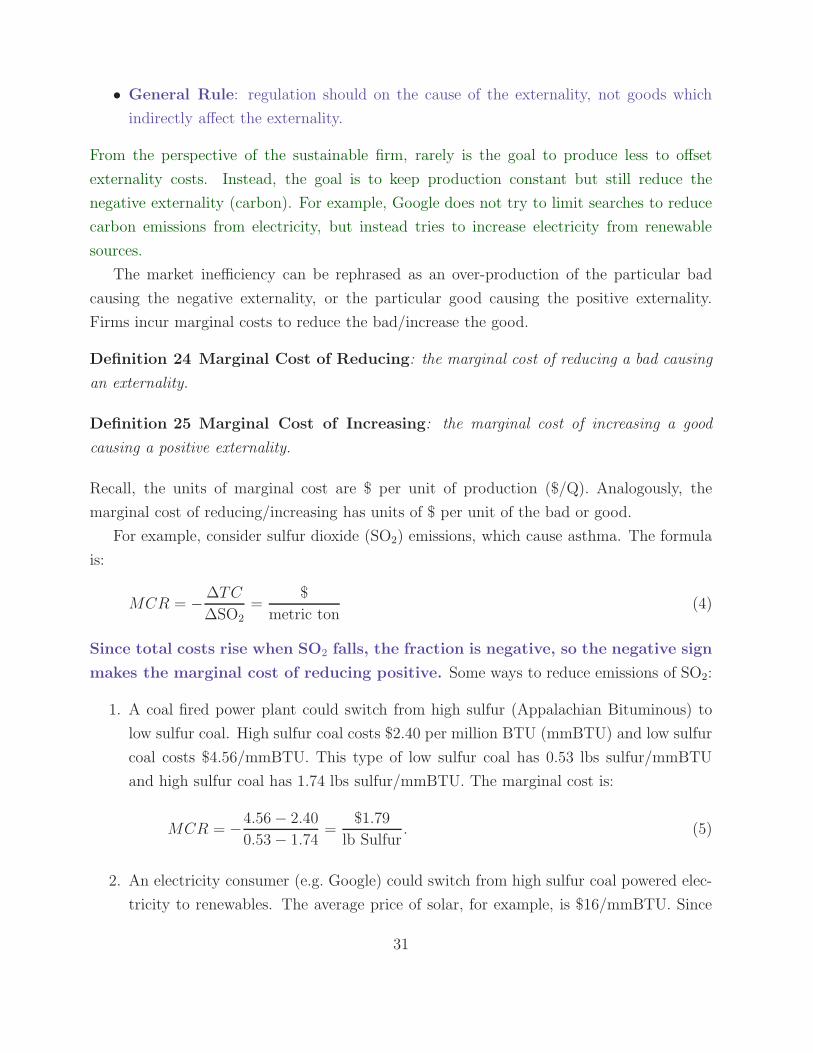
• General Rule: regulation should on the cause of the externality, not goods which
indirectly affect the externality.
From the perspective of the sustainable firm, rarely is the goal to produce less to offset
externality costs. Instead, the goal is to keep production constant but still reduce the
negative externality (carbon). For example, Google does not try to limit searches to reduce
carbon emissions from electricity, but instead tries to increase electricity from renewable
sources.
The market inefficiency can be rephrased as an over-production of the particular bad
causing the negative externality, or the particular good causing the positive externality.
Firms incur marginal costs to reduce the bad/increase the good.
Definition 24 Marginal Cost of Reducing: the marginal cost of reducing a bad causing
an externality.
Definition 25 Marginal Cost of Increasing: the marginal cost of increasing a good
causing a positive externality.
Recall, the units of marginal cost are $ per unit of production ($/Q). Analogously, the
marginal cost of reducing/increasing has units of $ per unit of the bad or good.
For example, consider sulfur dioxide (SO2) emissions, which cause asthma. The formula
is:
MCR = −∆TC
∆SO2
=$
metric ton(4)
Since total costs rise when SO2 falls, the fraction is negative, so the negative sign
makes the marginal cost of reducing positive. Some ways to reduce emissions of SO2:
1. A coal fired power plant could switch from high sulfur (Appalachian Bituminous) to
low sulfur coal. High sulfur coal costs $2.40 per million BTU (mmBTU) and low sulfur
coal costs $4.56/mmBTU. This type of low sulfur coal has 0.53 lbs sulfur/mmBTU
and high sulfur coal has 1.74 lbs sulfur/mmBTU. The marginal cost is:
MCR = −4.56− 2.40
0.53− 1.74=
$1.79
lb Sulfur. (5)
2. An electricity consumer (e.g. Google) could switch from high sulfur coal powered elec-
tricity to renewables. The average price of solar, for example, is $16/mmBTU. Since
31
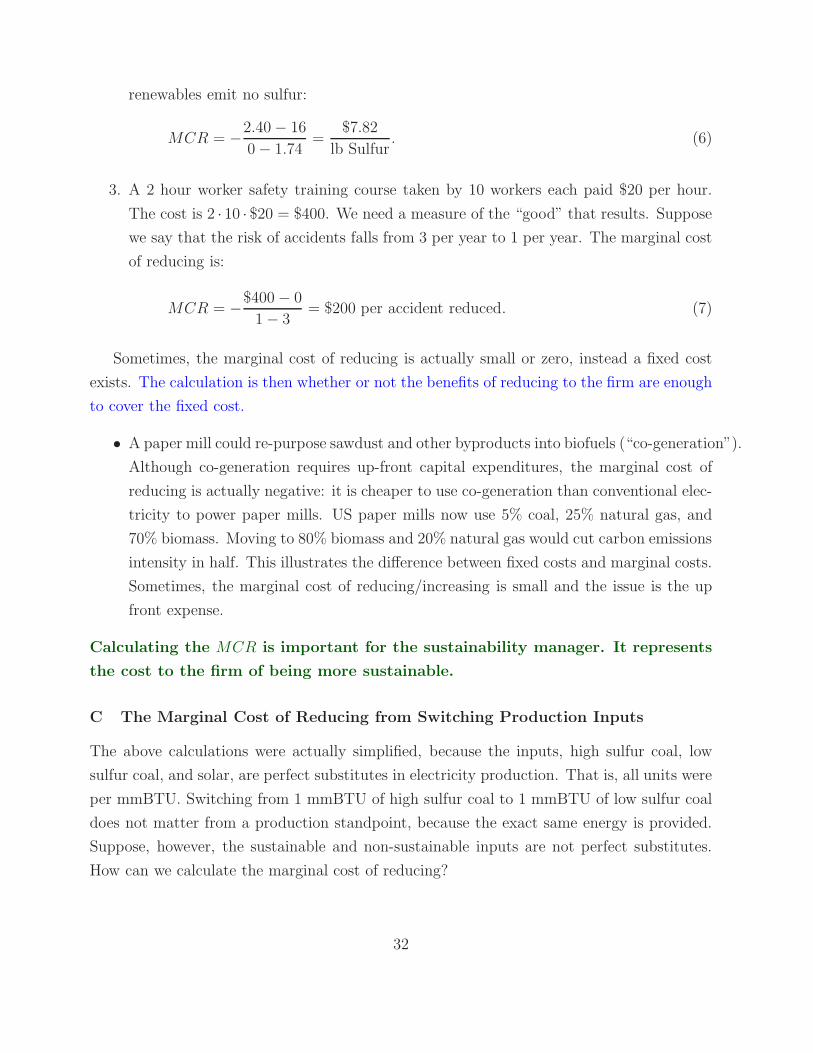
renewables emit no sulfur:
MCR = −2.40− 16
0− 1.74=
$7.82
lb Sulfur. (6)
3. A 2 hour worker safety training course taken by 10 workers each paid $20 per hour.
The cost is 2 · 10 · $20 = $400. We need a measure of the “good” that results. Suppose
we say that the risk of accidents falls from 3 per year to 1 per year. The marginal cost
of reducing is:
MCR = −$400− 0
1− 3= $200 per accident reduced. (7)
Sometimes, the marginal cost of reducing is actually small or zero, instead a fixed cost
exists. The calculation is then whether or not the benefits of reducing to the firm are enough
to cover the fixed cost.
• A paper mill could re-purpose sawdust and other byproducts into biofuels (“co-generation”).
Although co-generation requires up-front capital expenditures, the marginal cost of
reducing is actually negative: it is cheaper to use co-generation than conventional elec-
tricity to power paper mills. US paper mills now use 5% coal, 25% natural gas, and
70% biomass. Moving to 80% biomass and 20% natural gas would cut carbon emissions
intensity in half. This illustrates the difference between fixed costs and marginal costs.
Sometimes, the marginal cost of reducing/increasing is small and the issue is the up
front expense.
Calculating the MCR is important for the sustainability manager. It represents
the cost to the firm of being more sustainable.
C The Marginal Cost of Reducing from Switching Production Inputs
The above calculations were actually simplified, because the inputs, high sulfur coal, low
sulfur coal, and solar, are perfect substitutes in electricity production. That is, all units were
per mmBTU. Switching from 1 mmBTU of high sulfur coal to 1 mmBTU of low sulfur coal
does not matter from a production standpoint, because the exact same energy is provided.
Suppose, however, the sustainable and non-sustainable inputs are not perfect substitutes.
How can we calculate the marginal cost of reducing?
32
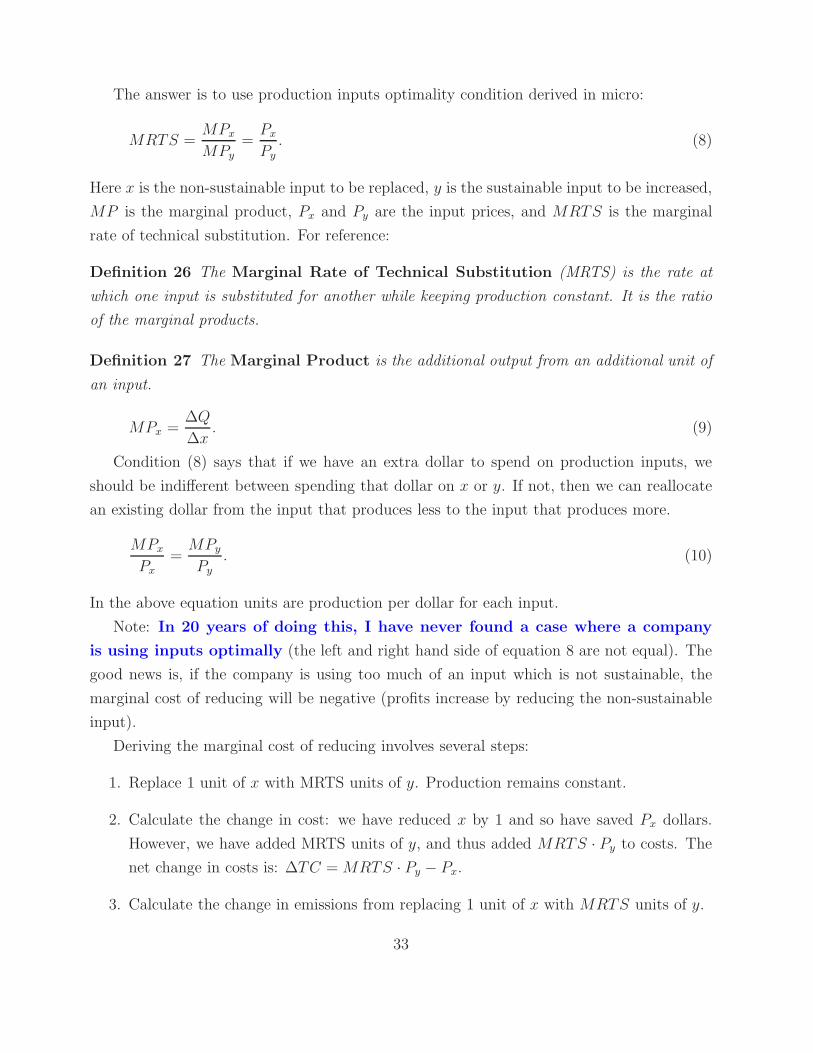
The answer is to use production inputs optimality condition derived in micro:
MRTS =MPx
MPy
=Px
Py
. (8)
Here x is the non-sustainable input to be replaced, y is the sustainable input to be increased,
MP is the marginal product, Px and Py are the input prices, and MRTS is the marginal
rate of technical substitution. For reference:
Definition 26 The Marginal Rate of Technical Substitution (MRTS) is the rate at
which one input is substituted for another while keeping production constant. It is the ratio
of the marginal products.
Definition 27 The Marginal Product is the additional output from an additional unit of
an input.
MPx =∆Q
∆x. (9)
Condition (8) says that if we have an extra dollar to spend on production inputs, we
should be indifferent between spending that dollar on x or y. If not, then we can reallocate
an existing dollar from the input that produces less to the input that produces more.
MPx
Px
=MPy
Py
. (10)
In the above equation units are production per dollar for each input.
Note: In 20 years of doing this, I have never found a case where a company
is using inputs optimally (the left and right hand side of equation 8 are not equal). The
good news is, if the company is using too much of an input which is not sustainable, the
marginal cost of reducing will be negative (profits increase by reducing the non-sustainable
input).
Deriving the marginal cost of reducing involves several steps:
1. Replace 1 unit of x with MRTS units of y. Production remains constant.
2. Calculate the change in cost: we have reduced x by 1 and so have saved Px dollars.
However, we have added MRTS units of y, and thus added MRTS · Py to costs. The
net change in costs is: ∆TC = MRTS · Py − Px.
3. Calculate the change in emissions from replacing 1 unit of x with MRTS units of y.
33
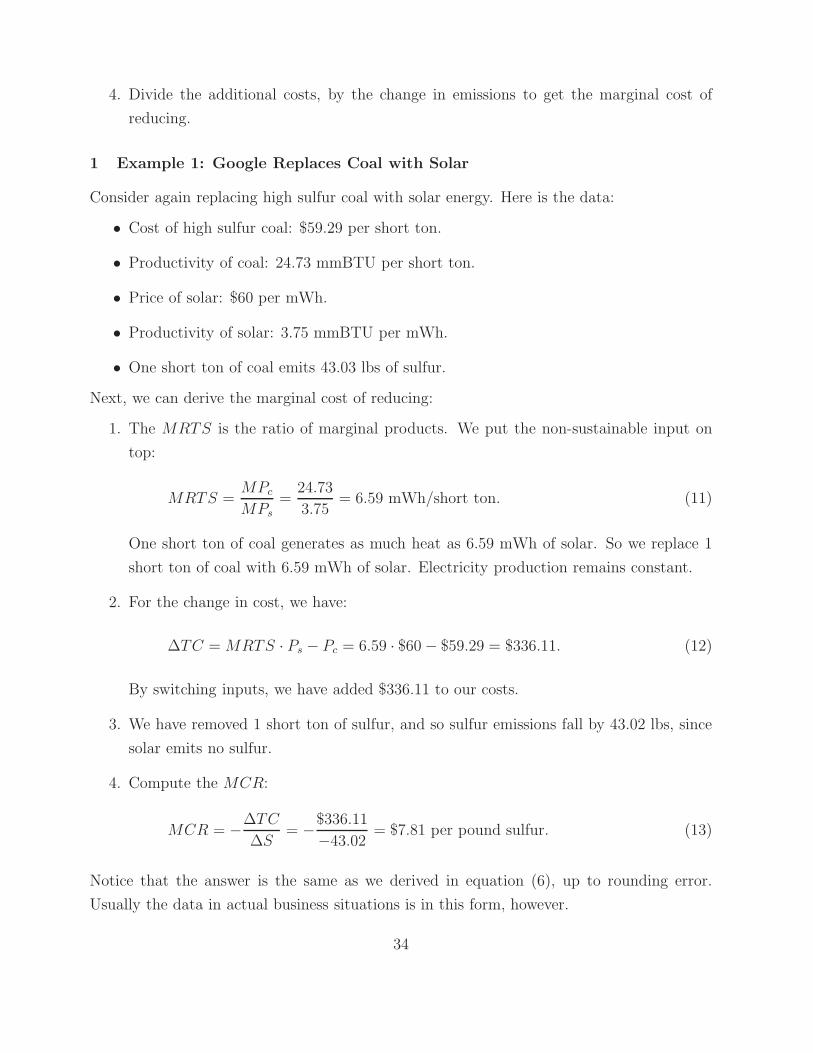
4. Divide the additional costs, by the change in emissions to get the marginal cost of
reducing.
1 Example 1: Google Replaces Coal with Solar
Consider again replacing high sulfur coal with solar energy. Here is the data:
• Cost of high sulfur coal: $59.29 per short ton.
• Productivity of coal: 24.73 mmBTU per short ton.
• Price of solar: $60 per mWh.
• Productivity of solar: 3.75 mmBTU per mWh.
• One short ton of coal emits 43.03 lbs of sulfur.
Next, we can derive the marginal cost of reducing:
1. The MRTS is the ratio of marginal products. We put the non-sustainable input on
top:
MRTS =MPc
MPs
=24.73
3.75= 6.59 mWh/short ton. (11)
One short ton of coal generates as much heat as 6.59 mWh of solar. So we replace 1
short ton of coal with 6.59 mWh of solar. Electricity production remains constant.
2. For the change in cost, we have:
∆TC = MRTS · Ps − Pc = 6.59 · $60− $59.29 = $336.11. (12)
By switching inputs, we have added $336.11 to our costs.
3. We have removed 1 short ton of sulfur, and so sulfur emissions fall by 43.02 lbs, since
solar emits no sulfur.
4. Compute the MCR:
MCR = −∆TC
∆S= −
$336.11
−43.02= $7.81 per pound sulfur. (13)
Notice that the answer is the same as we derived in equation (6), up to rounding error.
Usually the data in actual business situations is in this form, however.
34
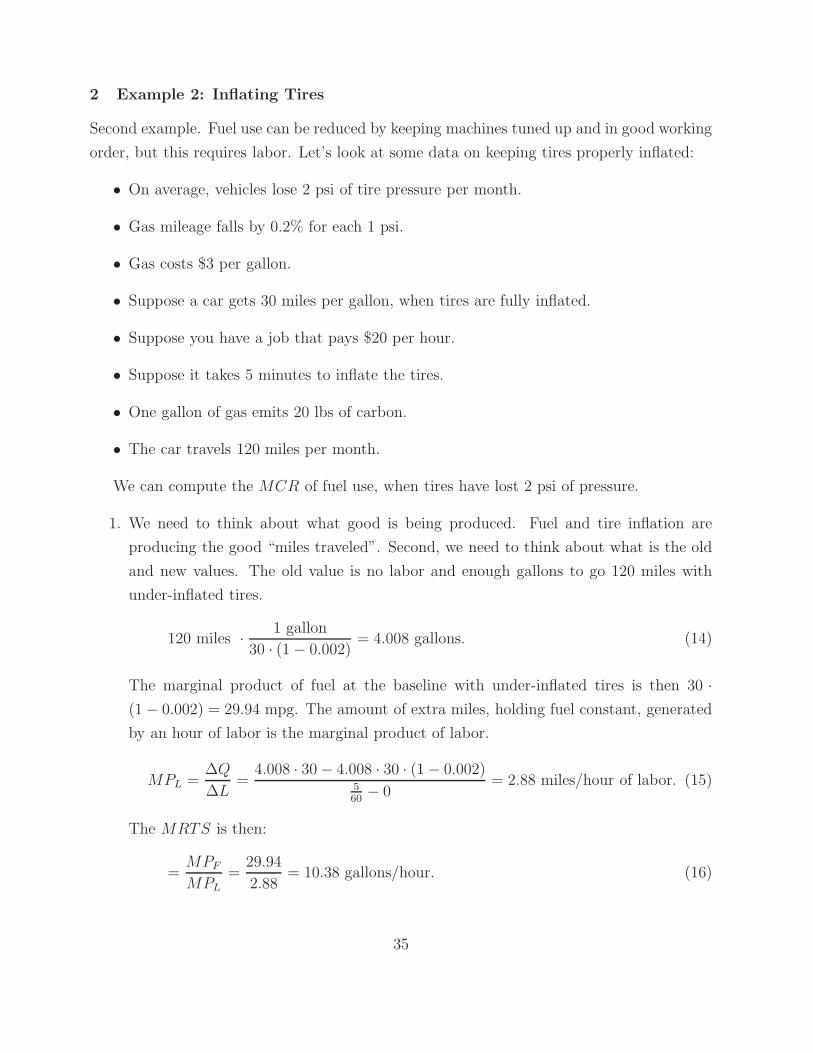
2 Example 2: Inflating Tires
Second example. Fuel use can be reduced by keeping machines tuned up and in good working
order, but this requires labor. Let’s look at some data on keeping tires properly inflated:
• On average, vehicles lose 2 psi of tire pressure per month.
• Gas mileage falls by 0.2% for each 1 psi.
• Gas costs $3 per gallon.
• Suppose a car gets 30 miles per gallon, when tires are fully inflated.
• Suppose you have a job that pays $20 per hour.
• Suppose it takes 5 minutes to inflate the tires.
• One gallon of gas emits 20 lbs of carbon.
• The car travels 120 miles per month.
We can compute the MCR of fuel use, when tires have lost 2 psi of pressure.
1. We need to think about what good is being produced. Fuel and tire inflation are
producing the good “miles traveled”. Second, we need to think about what is the old
and new values. The old value is no labor and enough gallons to go 120 miles with
under-inflated tires.
120 miles ·1 gallon
30 · (1− 0.002)= 4.008 gallons. (14)
The marginal product of fuel at the baseline with under-inflated tires is then 30 ·
(1− 0.002) = 29.94 mpg. The amount of extra miles, holding fuel constant, generated
by an hour of labor is the marginal product of labor.
MPL =∆Q
∆L=
4.008 · 30− 4.008 · 30 · (1− 0.002)5
60− 0
= 2.88 miles/hour of labor. (15)
The MRTS is then:
=MPF
MPL
=29.94
2.88= 10.38 gallons/hour. (16)
35

2. We consider replacing one gallon with an extra 10.38 hours of labor (think of a fleet
with many cars). The extra cost is:
∆TC = MRTS · PL − PF = 10.38 · $20− $3 = $204.57. (17)
3. Assume labor emits no carbon. One gallon of gas and thus 20 lbs of carbon is saved.
4. Compute:
MCR = −∆TC
∆C= −
$204.57
−20= $10.23 per pound carbon. (18)
This is an inexpensive way to reduce carbon (much less than $36 per ton), and that is with
only 120 miles traveled per month. The more miles that are traveled in a month, the more
productive is the labor.
IV Sustainability Considerations
The sustainability officer’s job is essentially to think broadly about the marginal cost of
reducing/increasing, recognizing hidden marginal costs that accrue from non-sustainable
production. For example, Google has a marginal energy cost per search. But too much
energy use makes Google less attractive to socially responsible investors. Google’s financing
cost (cost of capital) increases. The financing benefit of reducing offsets some of the marginal
cost of reducing.
Recall that we have six categories.
1. Direct costs: labor, machines, or raw materials (including energy) used to produce
the good. This is the cost of the sustainable inputs replacing the non-sustainable
inputs.
2. Cost of capital: savings (negative marginal cost) incurred because the firm becomes
more attractive to socially responsible investors.
3. Regulatory costs: savings imposed by regulation, including reduced taxes and fines.
4. Risk costs: savings corresponding to decreases in reputation risk and environmental
accidents caused by non-sustainable production.
36
5. Customer loss: savings in terms of additional customer demand from producing
products in a more sustainable way.
6. Innovation/long term focus.
The changes in marginal costs due to sustainability considerations are calculated in
an identical manner to the change in direct costs above. For example, suppose Google
is able to get a lower interest rate on a loan, by reducing sulfur dioxide emissions. Sup-
pose the present value of the interest savings is $200M, and to obtain the loan Google
had to sulfur emissions by 100 million pounds. The marginal savings is $200M/100M =
$2/lb.Thenetmarginalcostis : $7.81−$2 = $5.81 per lb sulfur. The goal is to reduce the
marginal cost to zero or even negative, so that the firm benefits from reducing.
V Public Goods
A Definitions
Definition 28 A good (bad) is Excludable if it is practical to selectively allow consumers
to consume (avoid consuming) the good.
1. Electricity is excludable: FPL allows only those consumers who pay for electricity to
use it.
2. A park is somewhat excludable: the city can pay for fences and a gate, and a booth
to charge those who enter. But people can still appreciate it from a distance.
3. Beaches are less excludable: Even for private beaches, it is difficult to prevent others
from using it, especially if they are simply checking out the view from the street.
4. Clean air is non-excludable: there is no way to charge for clean air.
Definition 29 A good (bad) is Rival if consumption of a unit of the good (bad) by one
person diminishes the amount of the good (bad) available to others to consume.
1. Electricity is Rival: the juice powering my computer cannot be used again to power
something else.
2. A park is somewhat rival: one person using the park does not mean others cannot use
it, until the park is filled to capacity.
37
3. Beaches are less rival: a beach can hold a large number of people before being filled to
capacity.
4. Clean air is non-rival: for all practical purposes, everyone can breathe the air at the
same time.
So rival and excludable should be viewed on a continuum. The degree of non-excludability
depends on the cost of exclusion. The degree of non-rivalry depends on the number of people
who can use the good before capacity is reached.
Definition 30 A Pure Public Good is non-rival and non-excludable
Non-rival goods violate assumption 1 of the welfare theorems: the benefits of the good do
not accrue solely to the owner. Excludable goods also violate assumption 1: the property
right is not secure. Public goods will be under-provided in a market economy, since people
besides the owner can use the good without paying for it. Therefore, the price does not
reflect what people are willing to pay.
B Optimal Provision of Public Goods
Supply of a public good is the same as supply of any other good. As in the previous section,
companies may want to provide public goods as part of their sustainability programs. Con-
sider a company which donates to help save endangered species. The benefits of biodiversity
are non-rival and non-excludable. The goal of the sustainability manager is to find
benefits to the firm for public goods provision, so that a business case can be
made.
Demand for a non-rival good is different. If Jack is willing to pay $2.50 for the beach
and April is willing to pay $3, then we should provide the beach as long as it costs less than
$5.50 to produce, because both Jack and April can consume the beach together.
If the beach were rival, we would need to provide two beaches. Thus if beaches are rival
we should provide one beach if the first beach costs less than $3, and a second beach if the
second costs less than $2.50.
With non-rival goods, we sum the price each consumer is willing to pay (we
sum the demand curves vertically).
• Jack: is willing to pay PJ = −0.75Q+ 4.
• April: is willing to pay PA = −1.5Q + 6.
38
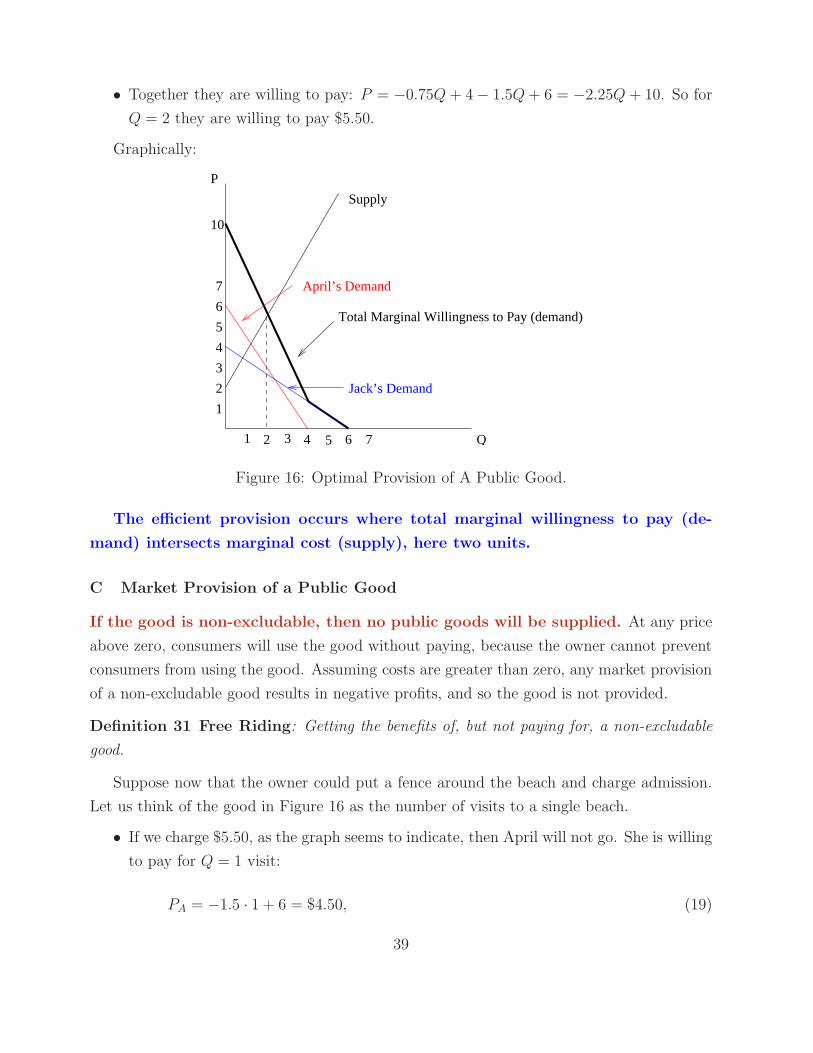
• Together they are willing to pay: P = −0.75Q + 4− 1.5Q+ 6 = −2.25Q + 10. So for
Q = 2 they are willing to pay $5.50.
Graphically:
P
Q
1
2
3
4
5
6
7
Total Marginal Willingness to Pay (demand)
Jack’s Demand
10
Supply
April’s Demand
21 3 4 5 6 7
Figure 16: Optimal Provision of A Public Good.
The efficient provision occurs where total marginal willingness to pay (de-
mand) intersects marginal cost (supply), here two units.
C Market Provision of a Public Good
If the good is non-excludable, then no public goods will be supplied. At any price
above zero, consumers will use the good without paying, because the owner cannot prevent
consumers from using the good. Assuming costs are greater than zero, any market provision
of a non-excludable good results in negative profits, and so the good is not provided.
Definition 31 Free Riding: Getting the benefits of, but not paying for, a non-excludable
good.
Suppose now that the owner could put a fence around the beach and charge admission.
Let us think of the good in Figure 16 as the number of visits to a single beach.
• If we charge $5.50, as the graph seems to indicate, then April will not go. She is willing
to pay for Q = 1 visit:
PA = −1.5 · 1 + 6 = $4.50, (19)
39
but the cost is $5.50.
• If If we charge $5.50, then Jack will not go. He is willing to pay for Q = 1 visit:
PJ = −0.75 · 1 + 4 = $3.25, (20)
but the cost is $5.50.
Similarly, if we charge $2.50, Jack will go twice but April will go more than twice, which
is not efficient either. Further, the company would make $5.00 on the second unit, but the
marginal cost is $5.50, so the company would lose money on this unit and not provide it.
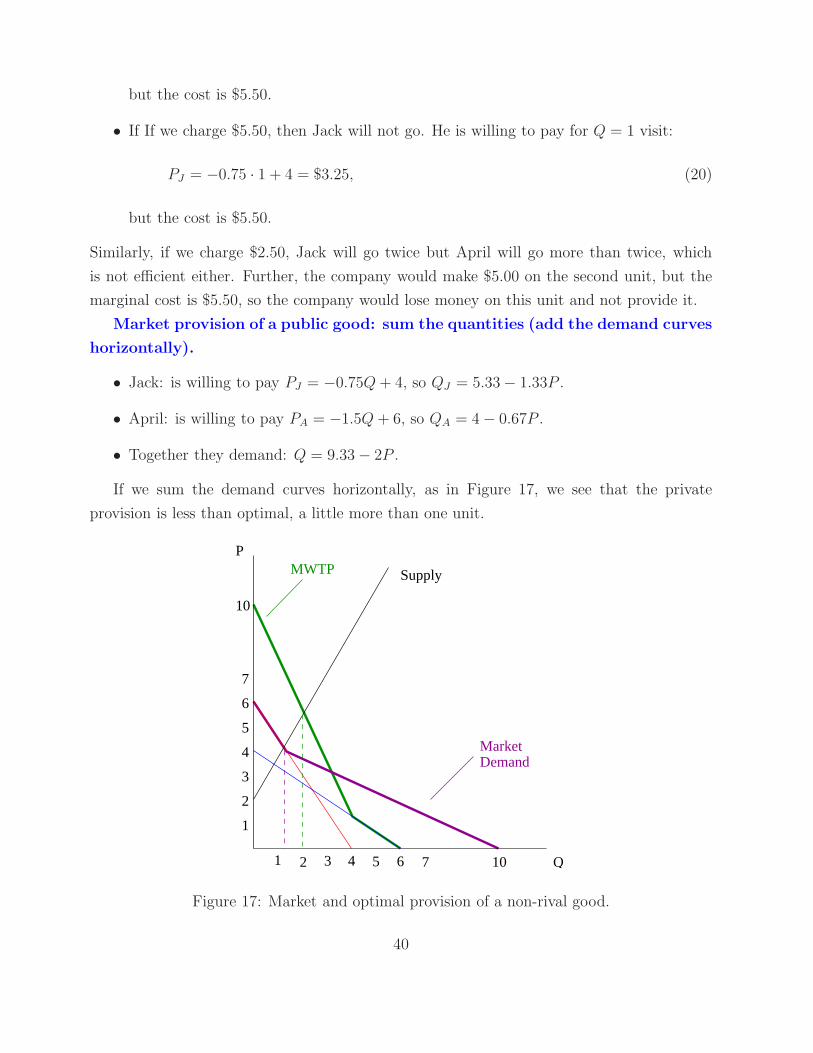
Market provision of a public good: sum the quantities (add the demand curves
horizontally).
• Jack: is willing to pay PJ = −0.75Q+ 4, so QJ = 5.33− 1.33P .
• April: is willing to pay PA = −1.5Q + 6, so QA = 4− 0.67P .
• Together they demand: Q = 9.33− 2P .
If we sum the demand curves horizontally, as in Figure 17, we see that the private
provision is less than optimal, a little more than one unit.
10
P
Q
1
2
Market4
5
6
7
10
SupplyMWTP
4 6 752 31
3Demand
Figure 17: Market and optimal provision of a non-rival good.
40

The key is that the producer must charge the same price to both Jack and April. If Jack
and April pooled their money and offered a total of $5.50 for their second trips, the producer
would accept. But then Jack and April cannot easily bargain with each other. April may
claim she is not willing to pay $3, to try to get Jack to pay more, for example.
41
Related Documents