1 Economics 101 Fall 2017 Answers to Homework #2 Due Tuesday, October 10, 2017 Directions: • The homework will be collected in a box before the lecture. • Please place your name, TA name, and section number on top of the homework (legibly). Make sure you write your name as it appears on your ID so that you can receive the correct grade. • Late homework will not be accepted so make plans ahead of time. • Show your work. Good luck! Please realize that you are essentially creating “your brand” when you submit this homework. Do you want your homework to convey that you are competent, careful, and professional? Or, do you want to convey the image that you are careless, sloppy, and less than professional? For the rest of your life you will be creating your brand: please think about what you are saying about yourself when you submit any work for someone else. Part I: PPF, Opportunity Cost, Trading prices, Comparative and Absolute Advantage 1) In the land of Ruritania there are two tribes growing wheat and corn. Tribe A has 100 workers and Tribe B has 200 workers. Assume that both tribes have linear production possibility frontiers. The workers in Tribe A can grow 1,000 tons of wheat or 600 tons of corn annually. The workers in Tribe B can grow 800 tons of wheat or 400 tons of corn annually. a. Plot the production possibility frontier (PPF) of each tribe in separate graphs, with wheat on the horizontal axis and corn on the vertical axis (restrict your attention to the first quadrant: that is, consider only values equal to or greater than zero for wheat and corn). Write each tribe’s PPF as an equation. Solution: Tribe A: = 600 − 3 5 ℎ Tribe B: = 400 − 1 2 ℎ Plotting the PPFs:

Welcome message from author
This document is posted to help you gain knowledge. Please leave a comment to let me know what you think about it! Share it to your friends and learn new things together.
Transcript
1
Economics 101
Fall 2017
Answers to Homework #2
Due Tuesday, October 10, 2017
Directions:
• The homework will be collected in a box before the lecture.
• Please place your name, TA name, and section number on top of the homework
(legibly). Make sure you write your name as it appears on your ID so that you can receive
the correct grade.
• Late homework will not be accepted so make plans ahead of time.
• Show your work. Good luck!
Please realize that you are essentially creating “your brand” when you submit this
homework. Do you want your homework to convey that you are competent, careful, and
professional? Or, do you want to convey the image that you are careless, sloppy, and less
than professional? For the rest of your life you will be creating your brand: please think
about what you are saying about yourself when you submit any work for someone else.
Part I: PPF, Opportunity Cost, Trading prices, Comparative and Absolute Advantage
1) In the land of Ruritania there are two tribes growing wheat and corn. Tribe A has 100 workers
and Tribe B has 200 workers. Assume that both tribes have linear production possibility
frontiers. The workers in Tribe A can grow 1,000 tons of wheat or 600 tons of corn annually.
The workers in Tribe B can grow 800 tons of wheat or 400 tons of corn annually.
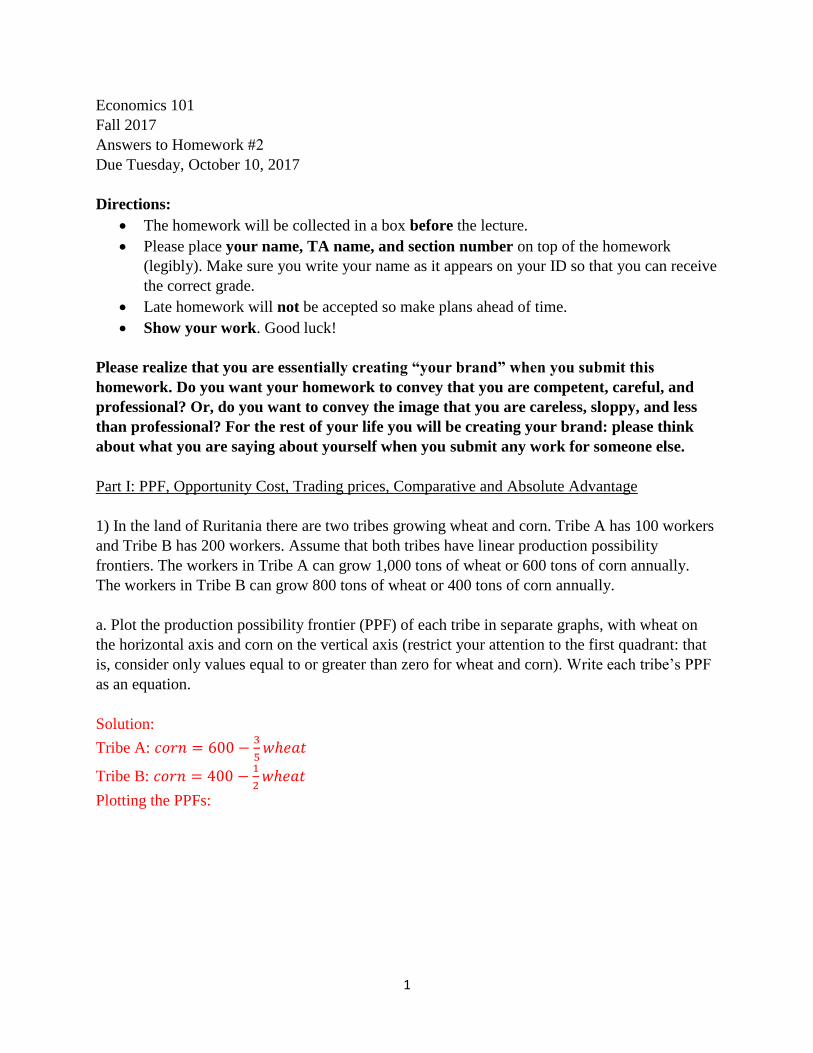
a. Plot the production possibility frontier (PPF) of each tribe in separate graphs, with wheat on
the horizontal axis and corn on the vertical axis (restrict your attention to the first quadrant: that
is, consider only values equal to or greater than zero for wheat and corn). Write each tribe’s PPF
as an equation.
Solution:
Tribe A: 𝑐𝑜𝑟𝑛 = 600 −3
5𝑤ℎ𝑒𝑎𝑡
Tribe B: 𝑐𝑜𝑟𝑛 = 400 −1
2𝑤ℎ𝑒𝑎𝑡
Plotting the PPFs:
2
b. Which tribe has the absolute advantage in the production of corn and in the production of
wheat? Which tribe has the comparative advantage in the production of corn and in the
production of wheat? State each tribe’s opportunity costs for the production of one ton of wheat
and for the production of one ton of corn.
Solution:
Tribe A has absolute advantage in the production of both goods since it can grow 1000 tons (10
tons per worker) and 600 tons (6 tons per worker) of wheat and corn respectively. In contrast,
Tribe B can produce 4 tons of wheat per worker or 2 tons of corn per worker. Tribe A can
absolutely produce more than the 800 tons (4 tons per worker) of wheat and the 400 tons (2 tons
per worker) of corn that Tribe B can grow. Tribe A has the comparative advantage in the
production of corn and Tribe B has the comparative advantage in the production of wheat. This
is apparent from the opportunity costs of each tribe:
Tribe / Crop OC of one ton of Wheat OC of one ton of Corn
A 3/5 ton of corn 5/3 ton of wheat
B 1/2 ton of corn 2 ton of wheat
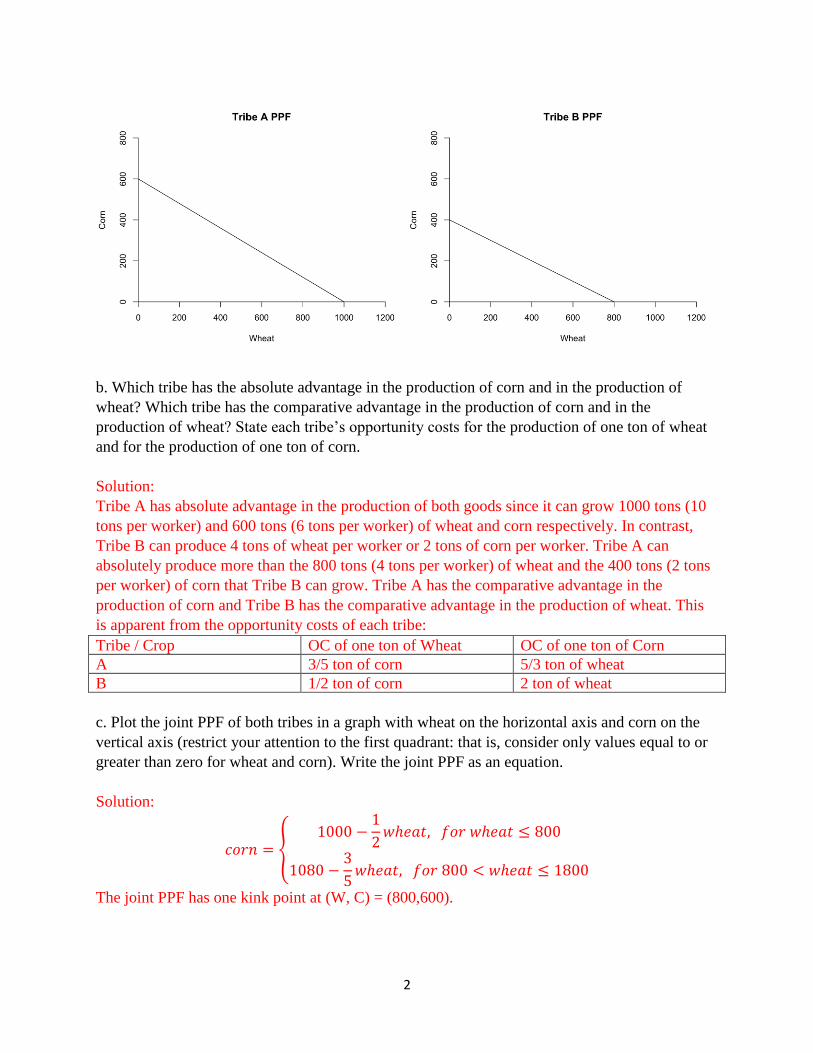
c. Plot the joint PPF of both tribes in a graph with wheat on the horizontal axis and corn on the
vertical axis (restrict your attention to the first quadrant: that is, consider only values equal to or
greater than zero for wheat and corn). Write the joint PPF as an equation.
Solution:
𝑐𝑜𝑟𝑛 = {1000 −
1
2𝑤ℎ𝑒𝑎𝑡, 𝑓𝑜𝑟 𝑤ℎ𝑒𝑎𝑡 ≤ 800
1080 −3
5𝑤ℎ𝑒𝑎𝑡, 𝑓𝑜𝑟 800 < 𝑤ℎ𝑒𝑎𝑡 ≤ 1800
The joint PPF has one kink point at (W, C) = (800,600).
3
Note: that although the PPF in this joint PPF looks linear, it is actually composed of two different
segments that have different slopes and therefore these two segments are described by two
different equations.
d. What is the range of acceptable trading prices for one unit of wheat and one unit of corn
between the two tribes? Explain your answer.
Solution: Tribe A has the comparative advantage in the production of corn, therefore it would be
willing to sell one ton of corn to Tribe B for a price equal to or higher than 5/3 tons of wheat. For
any lower price, Tribe A would be better off growing its own wheat. Tribe B would be willing to
buy one ton of corn at a price equal to or lower than 2 tons of wheat. For any higher price, Tribe
B would be better off growing its own corn. Hence, the acceptable range of trading prices for one
ton of corn would be 5
3 𝑡𝑜𝑛𝑠 𝑜𝑓 𝑤ℎ𝑒𝑎𝑡 ≤ 𝑃𝑐𝑜𝑟𝑛 ≤ 2 𝑡𝑜𝑛𝑠 𝑜𝑓 𝑤ℎ𝑒𝑎𝑡.
The trading price for one ton of wheat is determined using the same logic. Tribe A would be
willing to buy one ton of wheat if the trading price is equal to or lower than 3/5 tons of corn.
Tribe B would be willing to sell one ton of wheat if the trading price is higher than ½ ton of corn.
Therefore, the acceptable range of trading prices for one ton of corn would be 1
2 𝑡𝑜𝑛𝑠 𝑜𝑓 𝑐𝑜𝑟𝑛 ≤
𝑃𝑤ℎ𝑒𝑎𝑡 ≤3
5 𝑡𝑜𝑛𝑠 𝑜𝑓 𝑐𝑜𝑟𝑛.
e. Suppose Tribe B makes a major breakthrough in agricultural technology and develops a faster
growing type of corn. All other attributes of the corn are exactly the same. Tribe B can now grow
with the same number of workers 800 tons of wheat or 800 tons of corn annually or any
combination of corn and wheat that are on the straight line including these two production points.
Describe the changes to the opportunity cost of producing one ton of each good, absolute
advantage, and comparative advantage that arise from this technological breakthrough.
4
Solution: after the technological change, the opportunity costs would be:
Tribe / Crop OC of one ton of Wheat OC of one unit of Corn
A 3/5 tons of corn 5/3 tons of wheat
B 1 tons of corn 1 ton of wheat
Tribe A still has the absolute advantage in the production of both goods since it can grow 10 tons
per worker and 6 tons per worker of wheat and corn, respectively, while Tribe B can only
produce 4 tons of wheat per worker or 4 tons of corn per worker.
The comparative advantage has changed, however. Now Tribe A has the comparative advantage
in the production of wheat and Tribe B has the comparative advantage in the production of corn.
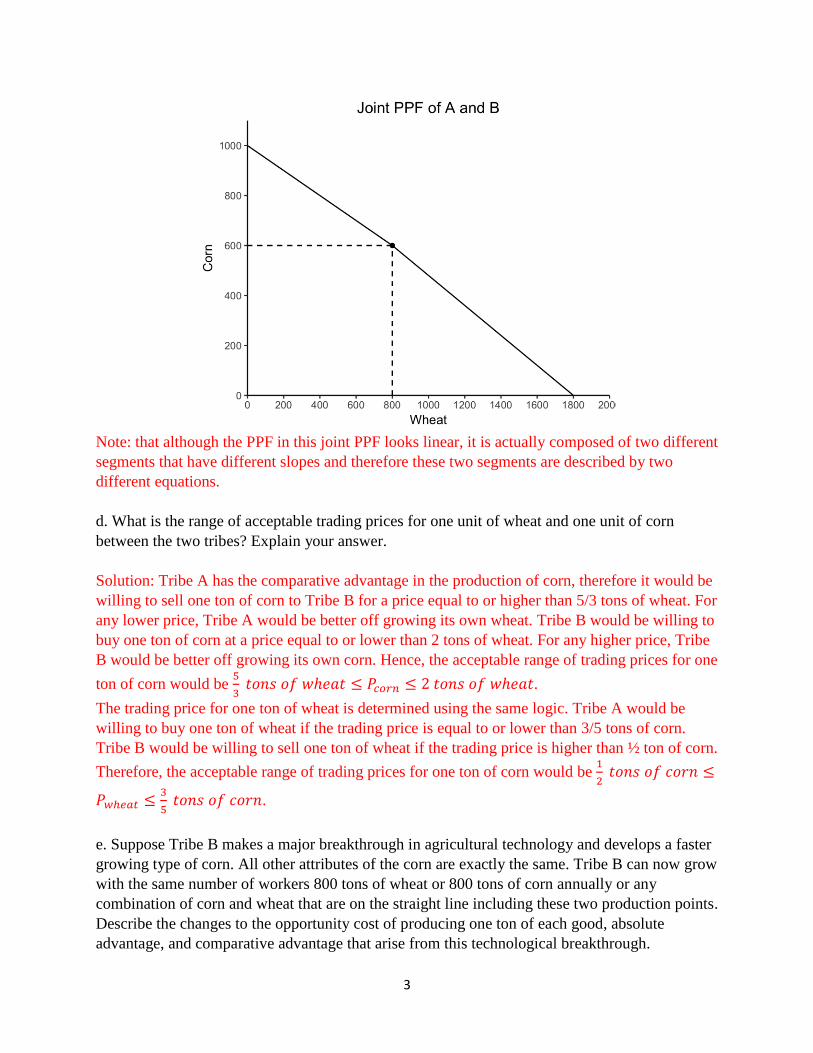
f. Plot the new joint PPF after the change to corn production in tribe B. Write the new equation
for the joint PPF.
Solution:
𝑐𝑜𝑟𝑛 = {1400 −
3
5𝑤ℎ𝑒𝑎𝑡, 𝑓𝑜𝑟 𝑤ℎ𝑒𝑎𝑡 ≤ 1000
1800 − 𝑤ℎ𝑒𝑎𝑡, 𝑓𝑜𝑟 1000 < 𝑤ℎ𝑒𝑎𝑡 ≤ 1800
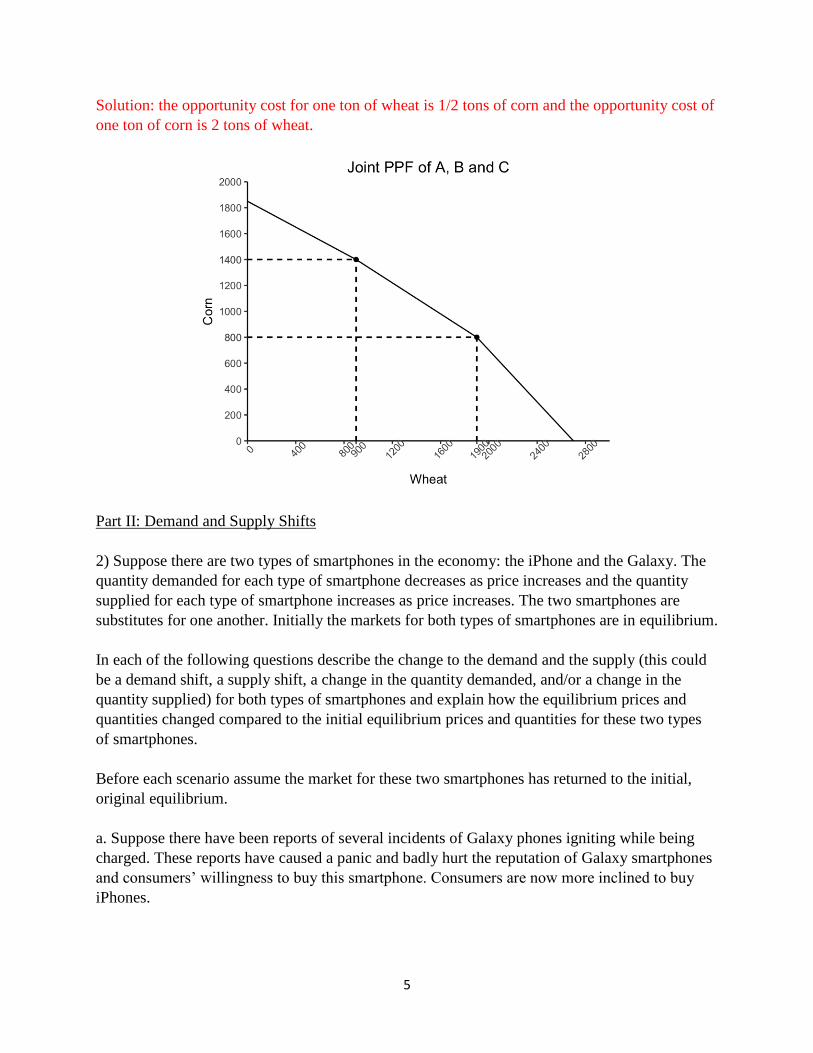
g. A new Tribe, C, is discovered in a distant part of Ruritania. Tribe C has 150 workers and it can
grow 900 tons of wheat or 450 tons of corn annually or any combination of corn and wheat that
lie on the line including these two provided points. What are Tribe C’s opportunity costs for the
production of one ton of wheat and one ton of corn? Plot the new joint PPF of all the tribes in
Ruritania (assuming tribe B can grow more corn as in (d)-(f)).
5
Solution: the opportunity cost for one ton of wheat is 1/2 tons of corn and the opportunity cost of
one ton of corn is 2 tons of wheat.
Part II: Demand and Supply Shifts
2) Suppose there are two types of smartphones in the economy: the iPhone and the Galaxy. The
quantity demanded for each type of smartphone decreases as price increases and the quantity
supplied for each type of smartphone increases as price increases. The two smartphones are
substitutes for one another. Initially the markets for both types of smartphones are in equilibrium.
In each of the following questions describe the change to the demand and the supply (this could
be a demand shift, a supply shift, a change in the quantity demanded, and/or a change in the
quantity supplied) for both types of smartphones and explain how the equilibrium prices and
quantities changed compared to the initial equilibrium prices and quantities for these two types
of smartphones.
Before each scenario assume the market for these two smartphones has returned to the initial,
original equilibrium.
a. Suppose there have been reports of several incidents of Galaxy phones igniting while being
charged. These reports have caused a panic and badly hurt the reputation of Galaxy smartphones
and consumers’ willingness to buy this smartphone. Consumers are now more inclined to buy
iPhones.
6
Solution: the demand curve for Galaxy smartphones shifts leftward since consumer’s tastes and
preferences make them less inclined to buy this phone. The demand curve for iPhones shifts
rightward for the same reason. The equilibrium price and quantity of Galaxy smartphones is now
lower than their initial levels, and the equilibrium price and quantity of iPhones is now higher
than their initial levels.
b. A critical component of the iPhone is a chip produced by Apple. Suppose that Apple recently
closed a major factory due to financial difficulties, causing a halt in the production of this chip.
This event negatively affects the number of iPhones in the market. Furthermore, many
consumers were employed in the Apple factory and are now facing a lower income due to their
loss of employment.
Solution: Let’s start with what is happening in the market for iPhones. There has a been a
disruption in a major component of the iPhone and this tells us we should expect the supply
curve for iPhones to shift to the left. This one change would lead us to expect that the price for
the iPhone will increase and that the quantity traded will decrease relative to their initial levels.
But we also have a change in income: as income falls we can expect the demand for the product
to shift to the left if the good is a normal good and to the right if the good is an inferior good.
iPhones are likely to be normal goods: so that implies that we also have a leftward shift of the
market demand curve for iPhones. With certainty, we can predict that the new equilibrium
quantity of iPhones traded in the market will be lower than the initial equilibrium quantity. But,
we cannot know with certainty what happens to the new equilibrium price of the iPhone: it may
increase, decrease, or remain the same as the initial equilibrium price (this is an example of
indeterminacy).
So what’s happening over in the market for Galaxy smartphones? No matter what is happening
to the price of the iPhone we see that fewer iPhones are being purchased. This suggests that the
demand for the Galaxy smartphones is increasing at every price. So, the demand curve for the
Galaxy smartphone is shifting to the right, pushing price and quantity upward. However, the
change in the income of consumers shifts the demand curve leftwards, as consumers now have
overall lower income and we assume that Galaxy smartphones are a normal good. This change
will result in a decrease in price and quantity. Therefore, with the combined effects of the two
changes, it cannot be determined whether the new equilibrium price of the Galaxy smartphone
will be higher or lower and the new equilibrium quantity of Galaxy smartphones will be greater
or smaller than their initial equilibrium levels.
c. Suppose a new federal regulation regarding ionizing radiation in smartphones is implemented
and this implementation increase consumers’ confidence in this product and they are now more
inclined to buy a smartphone. However, this regulation also resulted in additional compliance
costs for the producers, raising their production costs.
Solution: for both types of smartphones, the supply curves will shift leftward reflecting the
higher costs of production. The demand curves for both types of smartphones will shift rightward
7
reflecting the change in consumers’ preferences. The overall effect will be an increase in the
equilibrium price for both types of smartphones, while the change in the equilibrium quantity of
both types of smartphones will be ambiguous.
d. Suppose a new technology becomes available, reducing the production costs for both types of
smartphones. At the same time the new technology reduces the price of tablets. Tablets are
produced by Apple and they are substitutes to the Galaxy smartphone, but complements to the
iPhone.
Solution: Both types of smartphones will experience a rightward shift in their supply curves due
to the impact of the new technology and its reduction in production costs. The demand curve for
iPhones will also shift to the right reflecting the impact of the decrease in the price of the tablets
(as the price of a complementary good decreases, the demand for its complement increases –
there is a rightward shift in the demand curve for the complementary good). The equilibrium
quantity of iPhones will increase, but the effect on the equilibrium price is ambiguous. The
demand curve for Galaxy smartphones will decrease and the curve will shift leftward, reflecting
the decrease in price of tablets which are substitutes for the Galaxy phone. The equilibrium price
of the Galaxy smartphone will decrease, but the effect on the equilibrium quantity is ambiguous.
e. Not yet recovered from the effect of the igniting Galaxy phones, consumers decide to replace
their Galaxy phones with a different model if their income will allow it. Fortunately, Apple just
opened a new factory producing the necessary iPhone chip, so many consumers also got rehired
at this factory. Furthermore, the number of iPhones in the market has risen thanks to the increase
in the production of the chips.
Solution: Galaxy smartphones are now an inferior good (reread the first sentence in the prompt
to see this). Therefore, an increase in income will shift the demand curve for Galaxy
smartphones leftward. The equilibrium quantity and price of Galaxy smartphones will decrease.
iPhone is still a normal good, therefore the increase in income will cause the demand curve for
iPhones to shift rightward. Additionally, the increase in one of iPhone’s production factors will
shift the supply curve to the right. The overall effect is an increase in the equilibrium quantity of
iPhones. The effect on the equilibrium price of iPhone is ambiguous.
Part III: Price Ceiling and Price Floor
3) In 2011 the government of Israel decided to abandon price supervision of cottage cheese. As a
result, the price of cottage cheese jumped, causing public protests and widespread riots against
the government. After public pressure, the government reinstated a price ceiling on cottage
cheese.
a) Assume the demand for cottage cheese is a downward sloping line (that is, as price increases
the quantity demanded of cottage cheese decreases holding everything else constant), and the
supply of cottage cheese is an upward sloping line (that is, as price increases the quantity
8
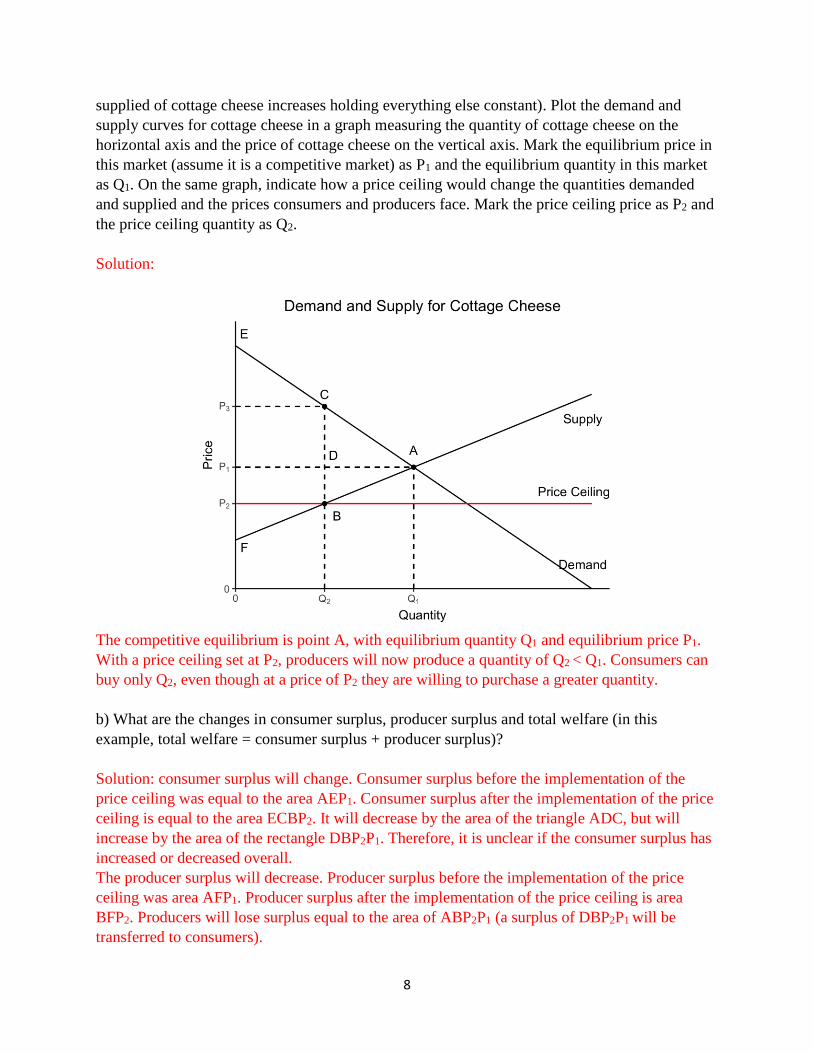
supplied of cottage cheese increases holding everything else constant). Plot the demand and
supply curves for cottage cheese in a graph measuring the quantity of cottage cheese on the
horizontal axis and the price of cottage cheese on the vertical axis. Mark the equilibrium price in
this market (assume it is a competitive market) as P1 and the equilibrium quantity in this market
as Q1. On the same graph, indicate how a price ceiling would change the quantities demanded
and supplied and the prices consumers and producers face. Mark the price ceiling price as P2 and
the price ceiling quantity as Q2.
Solution:
The competitive equilibrium is point A, with equilibrium quantity Q1 and equilibrium price P1.
With a price ceiling set at P2, producers will now produce a quantity of Q2 < Q1. Consumers can
buy only Q2, even though at a price of P2 they are willing to purchase a greater quantity.
b) What are the changes in consumer surplus, producer surplus and total welfare (in this
example, total welfare = consumer surplus + producer surplus)?
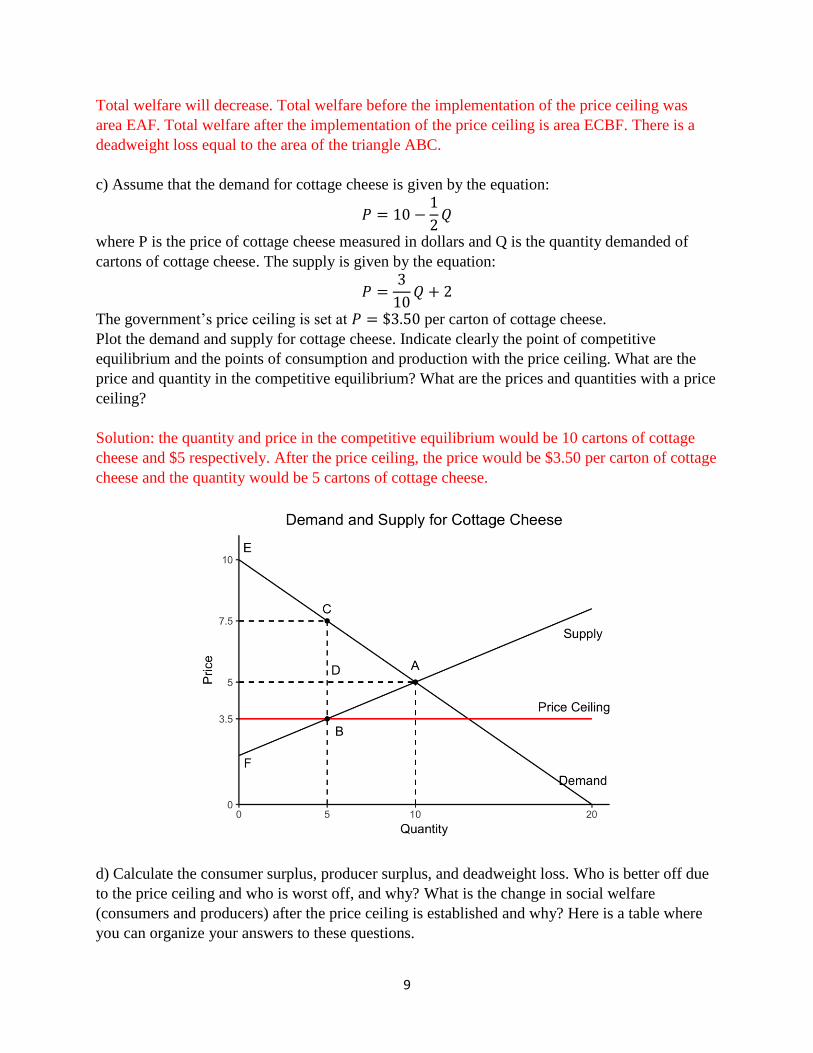
Solution: consumer surplus will change. Consumer surplus before the implementation of the
price ceiling was equal to the area AEP1. Consumer surplus after the implementation of the price
ceiling is equal to the area ECBP2. It will decrease by the area of the triangle ADC, but will
increase by the area of the rectangle DBP2P1. Therefore, it is unclear if the consumer surplus has
increased or decreased overall.
The producer surplus will decrease. Producer surplus before the implementation of the price
ceiling was area AFP1. Producer surplus after the implementation of the price ceiling is area
BFP2. Producers will lose surplus equal to the area of ABP2P1 (a surplus of DBP2P1 will be
transferred to consumers).
9
Total welfare will decrease. Total welfare before the implementation of the price ceiling was
area EAF. Total welfare after the implementation of the price ceiling is area ECBF. There is a
deadweight loss equal to the area of the triangle ABC.
c) Assume that the demand for cottage cheese is given by the equation:
𝑃 = 10 −1
2𝑄
where P is the price of cottage cheese measured in dollars and Q is the quantity demanded of
cartons of cottage cheese. The supply is given by the equation:
𝑃 =3
10𝑄 + 2
The government’s price ceiling is set at 𝑃 = $3.50 per carton of cottage cheese.
Plot the demand and supply for cottage cheese. Indicate clearly the point of competitive
equilibrium and the points of consumption and production with the price ceiling. What are the
price and quantity in the competitive equilibrium? What are the prices and quantities with a price
ceiling?
Solution: the quantity and price in the competitive equilibrium would be 10 cartons of cottage
cheese and $5 respectively. After the price ceiling, the price would be $3.50 per carton of cottage
cheese and the quantity would be 5 cartons of cottage cheese.
d) Calculate the consumer surplus, producer surplus, and deadweight loss. Who is better off due
to the price ceiling and who is worst off, and why? What is the change in social welfare
(consumers and producers) after the price ceiling is established and why? Here is a table where
you can organize your answers to these questions.
10
Before price ceiling After price ceiling Change
Consumer Surplus
Producer Surplus
Deadweight Loss
Social Welfare
Solution: the change is surplus will be as follows:
Before price ceiling After price ceiling Change
Consumer Surplus 10 ∗ 5
2= $25
2.5 ∗ 5
2+ 4 ∗ 5
= $26.25
$1.25
Producer Surplus 10 ∗ 3
2= $15
1.5 ∗ 5
2= $3.75
-$11.25
Deadweight Loss $0 4 ∗ 5
2= $10
$10
Social Welfare $40 $30 -$10
e) In an attempt to increase competition in the dairy market, the government lifts restrictions on
the import of dairy goods. However, this hurts local farmers, who have a strong lobby. In order
to help farmers, the government decides to set a price floor at 𝑃 = $7 per carton of cottage
cheese. Disregarding any changes described in the previous questions, repeat parts (c) and (d)
with the price floor instead of price ceiling. Assume the demand and supply curves are given by
the above equations. Here is a table where you can put some of the required answers for this
question. Note that there are more questions to answer then are summarized in this table!
Before price floor After price floor Change
Consumer Surplus
Producer Surplus
Deadweight Loss
Social Welfare
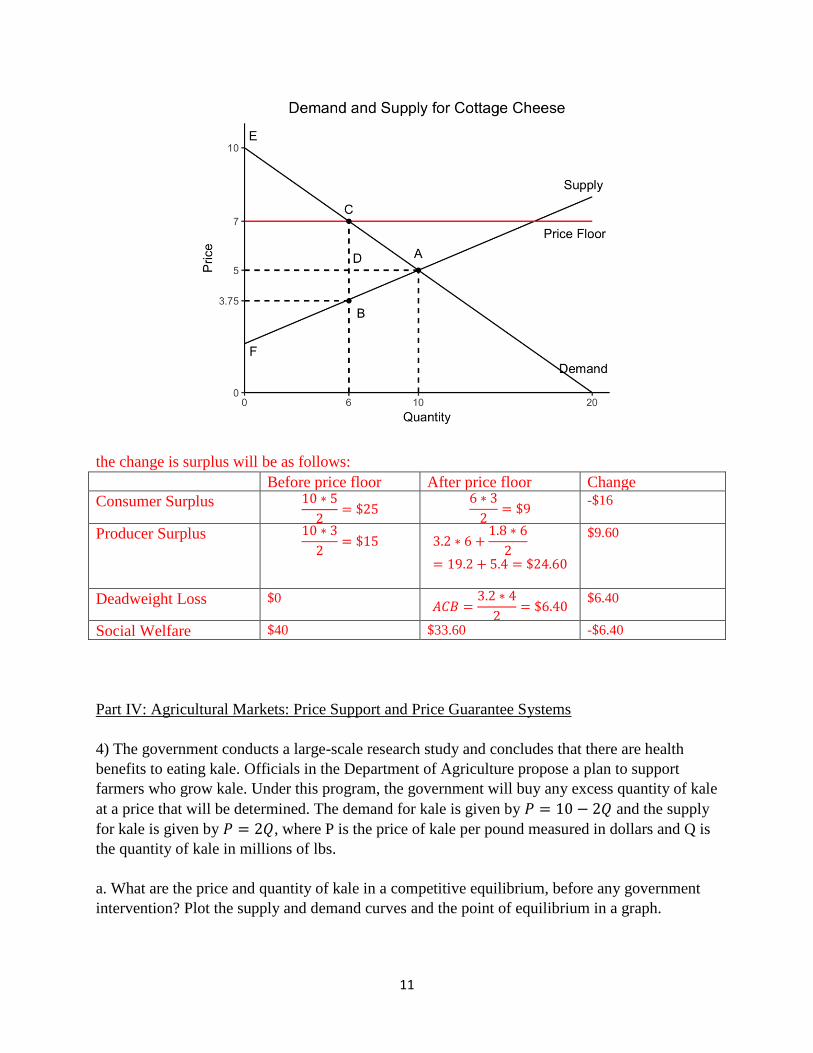
Solution: the quantity and price in the competitive equilibrium would be 10 cartons of cottage
cheese and $5 per carton of cottage cheese, respectively. After the price floor, the price would be
$7 per carton of cottage cheese and the quantity would be 6 cartons of cottage cheese.
11
the change is surplus will be as follows:
Before price floor After price floor Change
Consumer Surplus 10 ∗ 5
2= $25
6 ∗ 3
2= $9
-$16
Producer Surplus 10 ∗ 3
2= $15 3.2 ∗ 6 +
1.8 ∗ 6
2= 19.2 + 5.4 = $24.60
$9.60
Deadweight Loss $0 𝐴𝐶𝐵 =
3.2 ∗ 4
2= $6.40
$6.40
Social Welfare $40 $33.60 -$6.40
Part IV: Agricultural Markets: Price Support and Price Guarantee Systems
4) The government conducts a large-scale research study and concludes that there are health
benefits to eating kale. Officials in the Department of Agriculture propose a plan to support
farmers who grow kale. Under this program, the government will buy any excess quantity of kale
at a price that will be determined. The demand for kale is given by 𝑃 = 10 − 2𝑄 and the supply
for kale is given by 𝑃 = 2𝑄, where P is the price of kale per pound measured in dollars and Q is
the quantity of kale in millions of lbs.
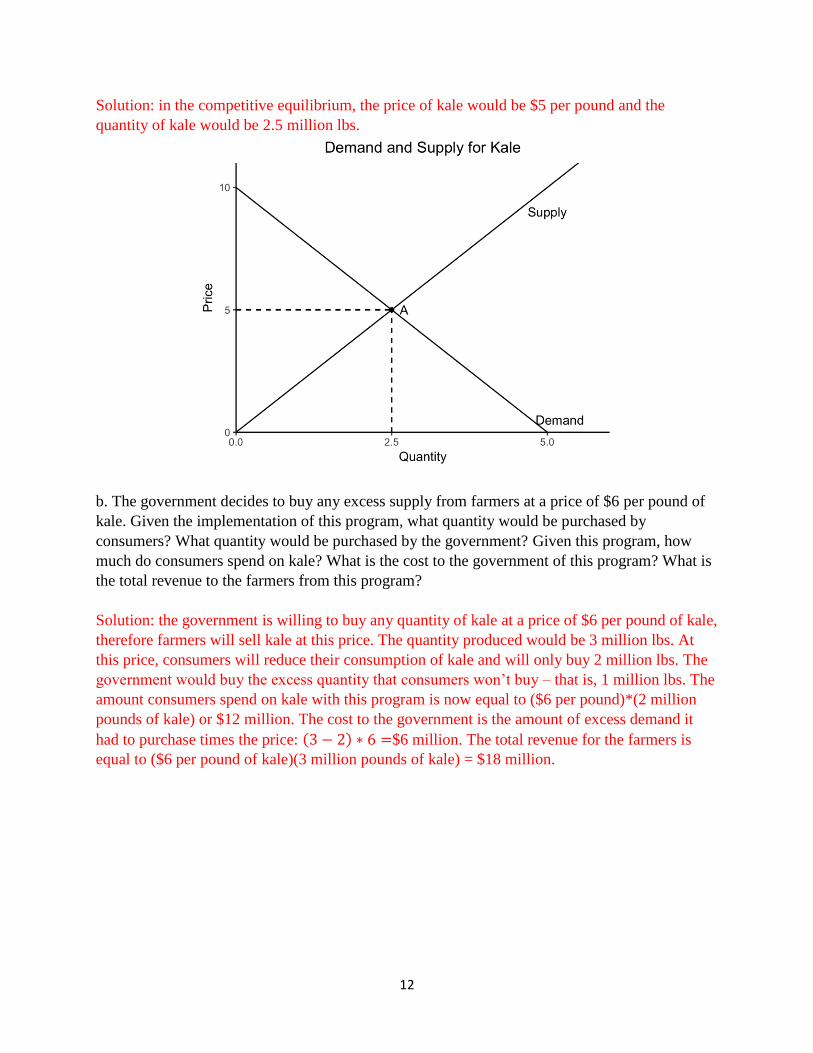
a. What are the price and quantity of kale in a competitive equilibrium, before any government
intervention? Plot the supply and demand curves and the point of equilibrium in a graph.
12
Solution: in the competitive equilibrium, the price of kale would be $5 per pound and the
quantity of kale would be 2.5 million lbs.
b. The government decides to buy any excess supply from farmers at a price of $6 per pound of
kale. Given the implementation of this program, what quantity would be purchased by
consumers? What quantity would be purchased by the government? Given this program, how
much do consumers spend on kale? What is the cost to the government of this program? What is
the total revenue to the farmers from this program?
Solution: the government is willing to buy any quantity of kale at a price of $6 per pound of kale,
therefore farmers will sell kale at this price. The quantity produced would be 3 million lbs. At
this price, consumers will reduce their consumption of kale and will only buy 2 million lbs. The
government would buy the excess quantity that consumers won’t buy – that is, 1 million lbs. The
amount consumers spend on kale with this program is now equal to ($6 per pound)*(2 million
pounds of kale) or $12 million. The cost to the government is the amount of excess demand it
had to purchase times the price: (3 − 2) ∗ 6 =$6 million. The total revenue for the farmers is
equal to ($6 per pound of kale)(3 million pounds of kale) = $18 million.
13
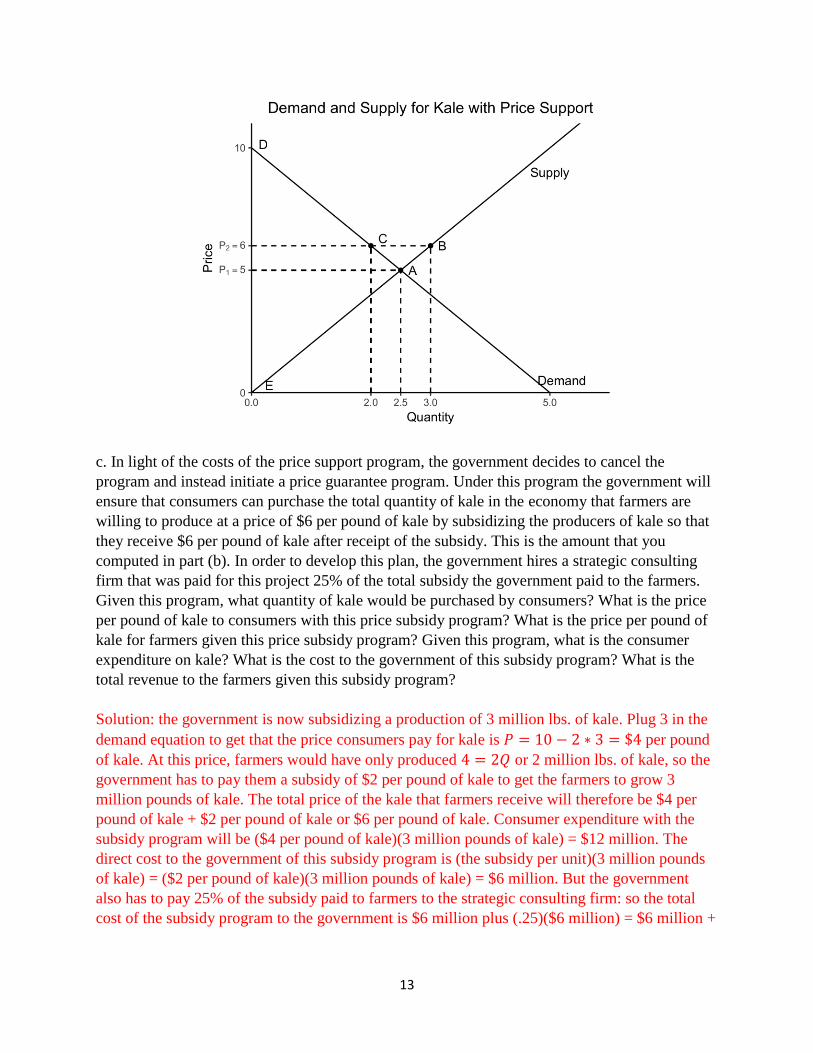
c. In light of the costs of the price support program, the government decides to cancel the
program and instead initiate a price guarantee program. Under this program the government will
ensure that consumers can purchase the total quantity of kale in the economy that farmers are
willing to produce at a price of $6 per pound of kale by subsidizing the producers of kale so that
they receive $6 per pound of kale after receipt of the subsidy. This is the amount that you
computed in part (b). In order to develop this plan, the government hires a strategic consulting
firm that was paid for this project 25% of the total subsidy the government paid to the farmers.
Given this program, what quantity of kale would be purchased by consumers? What is the price
per pound of kale to consumers with this price subsidy program? What is the price per pound of
kale for farmers given this price subsidy program? Given this program, what is the consumer
expenditure on kale? What is the cost to the government of this subsidy program? What is the
total revenue to the farmers given this subsidy program?
Solution: the government is now subsidizing a production of 3 million lbs. of kale. Plug 3 in the
demand equation to get that the price consumers pay for kale is 𝑃 = 10 − 2 ∗ 3 = $4 per pound
of kale. At this price, farmers would have only produced 4 = 2𝑄 or 2 million lbs. of kale, so the
government has to pay them a subsidy of $2 per pound of kale to get the farmers to grow 3
million pounds of kale. The total price of the kale that farmers receive will therefore be $4 per
pound of kale + $2 per pound of kale or $6 per pound of kale. Consumer expenditure with the
subsidy program will be ($4 per pound of kale)(3 million pounds of kale) = $12 million. The
direct cost to the government of this subsidy program is (the subsidy per unit)(3 million pounds
of kale) = ($2 per pound of kale)(3 million pounds of kale) = $6 million. But the government
also has to pay 25% of the subsidy paid to farmers to the strategic consulting firm: so the total
cost of the subsidy program to the government is $6 million plus (.25)($6 million) = $6 million +
14
$1.5 million = $7.5 million. Farmer total revenue from this subsidy program is ($6 per pound of
kale)(3 million pounds of kale) = $18 million.
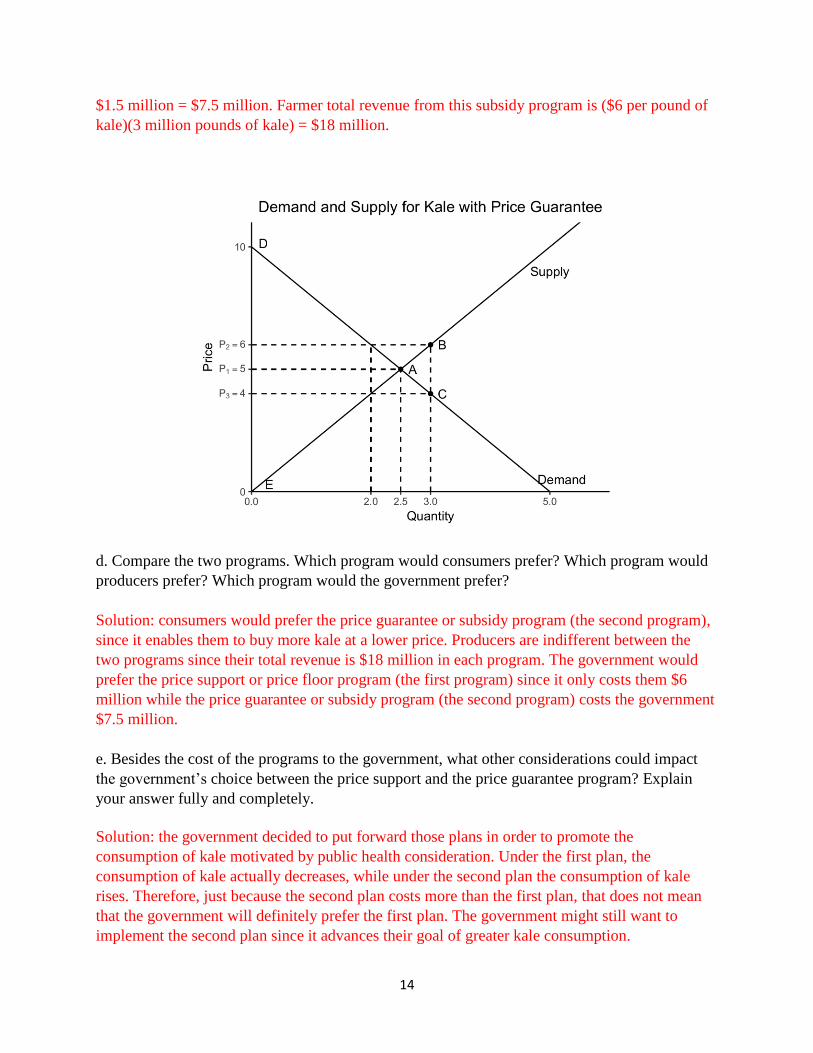
d. Compare the two programs. Which program would consumers prefer? Which program would
producers prefer? Which program would the government prefer?
Solution: consumers would prefer the price guarantee or subsidy program (the second program),
since it enables them to buy more kale at a lower price. Producers are indifferent between the
two programs since their total revenue is $18 million in each program. The government would
prefer the price support or price floor program (the first program) since it only costs them $6
million while the price guarantee or subsidy program (the second program) costs the government
$7.5 million.
e. Besides the cost of the programs to the government, what other considerations could impact
the government’s choice between the price support and the price guarantee program? Explain
your answer fully and completely.
Solution: the government decided to put forward those plans in order to promote the
consumption of kale motivated by public health consideration. Under the first plan, the
consumption of kale actually decreases, while under the second plan the consumption of kale
rises. Therefore, just because the second plan costs more than the first plan, that does not mean
that the government will definitely prefer the first plan. The government might still want to
implement the second plan since it advances their goal of greater kale consumption.

15
Related Documents


![Unit 8 Homework Answers[1]](https://static.cupdf.com/doc/110x72/56d6bfda1a28ab301697f4cf/unit-8-homework-answers1.jpg)