Name: Daniel Phiri Supervisor: Prof. Ranjula Bali Swain Date: 29 th May 2020 ECONOMIC VALUE OF WATER FOR AGRICULTURE, HYDROPOWER AND DOMESTIC USE A CASE STUDY OF THE LUNSEMFWA CATCHMENT, ZAMBIA Submitted in partial fulfilment of a Master of Science Degree in Economics at Södertörn University, Stockholm, Sweden.

Welcome message from author
This document is posted to help you gain knowledge. Please leave a comment to let me know what you think about it! Share it to your friends and learn new things together.
Transcript

Name: Daniel Phiri
Supervisor: Prof. Ranjula Bali Swain Date: 29th May 2020
ECONOMIC VALUE OF WATER FOR AGRICULTURE, HYDROPOWER AND
DOMESTIC USE
A CASE STUDY OF THE LUNSEMFWA CATCHMENT, ZAMBIA
Submitted in partial fulfilment of a Master of Science Degree in Economics at Södertörn University, Stockholm, Sweden.
ii
DECLARATION
I Daniel Phiri, herewith declare that I am the sole author of this master thesis: Economic value
of water for agriculture, hydropower and domestic use: A case study of the Lunsemfwa
catchment, Zambia, and that I have conducted all works connected with the master thesis on
my own. This thesis is being submitted for the degree of Master of Science in Economics at
Södertorn University in Stockholm, Sweden. This master thesis has not been presented to any
other examination authority.
Date: ___________________________
Signature: ________________________

iii
ABSTRACT
The Lunsemfwa river catchment is of paramount importance to the Zambian economy,
particularly with regards to energy, agricultural and water for domestic, as well as wildlife.
Water shortages during dry spells in the area present a huge problem for the various
stakeholders in the basin. As the impact of climate variability increases in the basin, water
resources managers in the basin are increasing challenged to efficiently allocate decreasing
reserves of water resources against increasing levels of demand. This paper attempts to
highlight the value of water resources to the earlier mentioned sectors; hydropower, agriculture
and households, in order to inform allocation decisions in the Lunsemfwa catchment area of
Zambia. The paper uses the SDDP method to investigate the average cost of electricity
production, coupled with market electricity prices to ascertain the value of a unit of electricity
given reservoir outflow levels. The PF method was used to evaluate the marginal value of water
is agriculture, while the value of water for domestic consumers was evaluated using the
Contingent Valuation method, particularly the willingness to pay, which essentially uses
market prices to represent the consumers’ willingness to pay. A value of US$93/MWh is
attached to hydropower produced here, while the marginal value of water in agriculture is
estimated to be US$0.068/m3. The willingness to pay for connection to piped water is
approximately US$34.13, while the monthly value is US$6.9. The Gross Financial Value
(GFV) generated from hydropower, agriculture and domestic water supply is US$24,174,000,
US$ 262,083,045.91 and $7,140,000.00 respectively.
Keywords: Economic value, hydropower, agriculture, domestic water use, contingent valuation
iv
ACKNOWLEDGEMENTS
I am immensely grateful to the Almighty God for giving life and the strength to work through
this master’s programme. My sincere gratitude goes to the Swedish Institute for supporting me
financially and professionally throughout my studies.
This research would have been very challenging without the support of Prof. Ranjula Bali
Swain who diligently guided me during this process. Special thanks to Dr. Kawawa Banda, Mr.
Chisha Chanda, Ms. Agness Sililo Musutu, Mr. Kasenga Hara and Mr. Oscar Silembo for the
assistance rendered during the data collection process. I would also like to extend my sincere
gratitute to the Ministry of Energy, particularly the Acting Director Mr.Arnold Milner Simwaba
and Mr. Allan Chivunda for providing data pertaining to the energy sector.
God bless you all!
v
ABBREVIATIONS
CV Contingent Valuation
IPP Independent Power Producer
LHPC Lunsemfwa Hydropower Company
LgWSC Lukanga Water and Sewerage Company
MPM Market Price Method
MVU Maximum Use Value
NRW Non-Revenue Water
NSO National Statistics Office
NUV Non-Use Value
NWASCO National Water Supply and Sanitation Council
PF (M) Production Function Method
SDDP Stochastic Dual Dynamic Programming
TCM Travel Cost Method
TEV Total Economical Value
UN United Nations
UNEP United Nation Environmental Programme
UNESCO United Nations Educational, Scientific and Cultural Organization
US$ United States Dollar
UV Use Value
WWF World Wide Fund for Nature (WWF)
WTP Willingness to Pay
ZESCO Zambia Electricity Supply Corporation
ZMW Zambian Kwacha

vi
Table of Contents
DECLARATION .......................................................................................................................................... ii
ABSTRACT ................................................................................................................................................ iii
ACKNOWLEDGEMENTS ........................................................................................................................... iv
ABBREVIATIONS ....................................................................................................................................... v
Table of Contents .................................................................................................................................... vi
Dedication ............................................................................................................................................... ix
CHAPTER ONE: INTRODUCTION ................................................................................................. - 1 -
STUDY AREA ................................................................................................................................ - 4 -
1.1 Zambia ................................................................................................................................. - 4 -
1.2 Central Province of Zambia ............................................................................................... - 5 -
1.3 Socioeconomic status........................................................................................................... - 5 -
1.4 Lunsemfwa catchment Area .............................................................................................. - 6 -
1.5 Problem statement .............................................................................................................. - 8 -
1.6 Main Objective .................................................................................................................... - 9 -
1.7 Specific Objectives .............................................................................................................. - 9 -
1.8 Research Questions ........................................................................................................... - 10 -
Justification of Study .............................................................................................................. - 10 -
CHAPTER TWO: LITERATURE REVIEW ................................................................................... - 11 -
2.1 Review of literature in Hydropower Ecosystem services valuation ............................. - 13 -
2.2 Experiences in the valuation of Agriculture and Livestock .......................................... - 16 -
2.3 A Review of Domestic & Industrial water supply valuation studies ............................ - 17 -
CHAPTER THREE: THEORY AND METHODS .......................................................................... - 19 -
3.1 Valuing water for hydropower - Method .......................................................................... - 20 -
3.2 Water for Agriculture Production ...................................................................................... - 21 -
Crop water production function ............................................................................................ - 22 -
Translog Production Function ............................................................................................... - 23 -
3.3 The value of Domestic Water ............................................................................................ - 24 -
3.4 Data Sources ...................................................................................................................... - 25 -
3.5 Study Limitations .............................................................................................................. - 26 -
CHAPTER FOUR: STUDY RESULTS ........................................................................................... - 27 -
4.1 Description of Value ........................................................................................................... - 27 -
4.1.1 Water & Hydropower................................................................................................... - 27 -
4.1.2 Water and Agriculture .................................................................................................. - 30 -
4.1.3 Domestic use ................................................................................................................ - 33 -
4.2 Average and Marginal Economic values ............................................................................ - 33 -
vii
4.2.1 The value of water in hydropower production ............................................................. - 33 -
4.2.2 The marginal value of water ........................................................................................ - 34 -
4.2.3 The value of domestic water ........................................................................................ - 35 -
4.3 The Gross Financial Value of Hydropower, Agriculture and Domestic water use ............. - 35 -
CHAPTER FIVE: DISCUSSION ..................................................................................................... - 37 -
CHAPTER SIX: CONCLUSION AND RECOMMENDATIONS .................................................. - 41 -
References ........................................................................................................................................ - 45 -

viii
Figures
Figure 1: Map of Lunsemfwa catchment………..…………………………………….……..8
Figure 2: Crop water productivity function graph………………………………….………..22
Figure 3: Proportions of hydropower plants in Zambia…………………………….………..28
Figure 4: Independent hydropower producers in Zambia……………………….…………...29
Figure 5: Average monthly electricity generation…………………………………………..30
Figure 6: Zambia agriculture contribution to GDP…………………………….…...………..30
Figure 7: Maize Production by province. Ministry of Agriculture data………….………….31
Figure 8: Selected crops produced by province in 2016/17 farming season……….………..32
Figure 9: Eight-year crop production fluctuations for selected crops (excluding maize)…...32
Figure 10: Revenue generated by sector in Lunsemfwa……………………………………..36
Tables
Table 1: Production function estimation (PRODEST) results………………………………34
Table 2: Average electricity generation and revenue estimates……………………………..39

ix
Dedication
To my lovely daughter Takondwa Belitha Phiri
- 1 -
CHAPTER ONE: INTRODUCTION
The value paradox, most commonly known as the diamond-water paradox attempts to answer
a very important question around value, particularly why does an economy put a much lower
value on something vital to sustaining life (water), compared to something that simply looks
shiny and sparkles (diamond)? This question is the diamond-water paradox, also known as
paradox of value, and it was first presented by the economist Adam Smith in the 1700s. Smith
argued that many things that we use every day often have little or no value in exchange. Things
like cups, cutlery, socks, and water are a few examples. On the other hand, a lot of things that
have a high market value have very little or no practical use. An example may be an old
painting. Other than looking at it, there isn't much else we can do with the art or baseball card
(Smith, 1776).
In order to understand why the paradox exists, we need to understand the economic terms
known as marginal utility and scarcity. Croitoru & Xie, (2016) defines scarcity as how readily
available a resource, commodity, or service is in relation to its demand. On the other hand,
marginal utility is the additional satisfaction or gain someone gets from consuming and
additional unit of a good or service. People are willing to pay a higher price for goods with
greater marginal utility. In relation to water, there is a common notion that there is plenty of it
in most parts of the world (not scarce), which means that, as consumers, we usually have a low
marginal utility for water. In a typical situation, people aren't willing to pay a lot of money for
one extra unit of water. Diamonds, however, are scarce. Because they are relatively hard to
obtain, the marginal utility of an additional unit of diamond is much higher than that of water.
In light of climate change, high population and economic growth rates around the world, and
other variables, the world has seen a sharp decline in the availability of water resources, which
has caused a change in this narrative (Croitoru & Xie, 2016).
The period between 1950 and 2019 has seen the world’s population increase at a fairly high
rate and is expected to continue increasing at a similar rate until 2100 (United Nations,
Department of Economic and Social Affairs, Population Division, 2015). This population
increase, coupled with technological progress and other variables has led to a rapid increase in
the demand for ecosystem goods and services, but also necessitated that this demand is met
from increasingly degraded ecosystems. According to Skudev (2008), more than 75 percent of

- 2 -
Earth’s land areas are substantially degraded, threatening the sustenance of more than 3.2
billion people.
Freshwater is an important resource in many economic activities, such as agriculture. It is
estimated that 70 percent of the world’s freshwater abstraction is used for agriculture
(Irrigation). The agricultural industry around the world employs more than 1 billion people and
generating more $2.4 trillion in economic value per annum. Extrapolations of the future
estimated demand for agricultural freshwater show substantially increases, accounting for a
huge proportion of the expected 50 percent increase in the demand for freshwater by 2050. This
increase in water use will put more stress on Earth’s limited freshwater supplies and make
access to fresh water even more difficult (FAO, 2018).
Freshwater, which is a rare resource on Earth is increasingly becoming scarce. Less than 3
percent of the water found on Earth is fresh water, and the remaining 97 percent is saltwater,
such as what is found in the ocean. Further to that, approximately 69 percent of
Earth’s freshwater is not easily accessible by humans, mainly because it is in the form of ice in
glaciers and polar ice caps, with about 30 percent of the same fresh water being under the
surface in the form of groundwater. This implies that only 1 percent of Earth’s fresh water as
readily available for human use (Shiklomanov, 1993).
The World Economic Forum's annual survey of leaders in business, academia, government and
civil society (2020) postulates that water stress will be among the biggest threats to social and
political stability in the next 10 years. This is the first time in the history of the Global Risks
Report that respondents ranked environmental factors, including extreme weather and failure
to respond to climate change (manifested through water and high temperatures), among the top
five risks that are most likely to occur (World Economic Forum, 2020).
The World Economic Forum (2020), further asserts that the ability to mitigate the impacts of
extreme climate conditions related to water highly depends on credibility of science. Scientific
methods used to support water allocation decisions should be credible and supported by review
from the scientific community. Science must be based on appropriate socioeconomic,
hydrological and ecological data, including adequate baseline ecosystem records. It is
important to employ the best available knowledge and science, which should be updated as
better knowledge becomes available from research and monitoring. They further advise, that

- 3 -
lack of perfect knowledge should not be used as an excuse for inaction, but precautionary
approaches should be applied.
Economic valuation of ecosystem services is an evolving body of science that provides traction
in the decision-making process, particularly with policy agents and scientists. For example,
economic analyses coupled with scenario-based planning could provide a method relevant to
stakeholders in determining the advantages and consequences (cost-benefit analysis) of
potential land use changes or development options. Prior to the concept of environmental
valuation or in many cases where valuation has not occurred, environmental systems are
deemed unimportant to policy and decision makers which results in degradation and destruction
of these ecosystem goods and services (National Research Council, 2005).
Information on the value of ecosystem goods and services is crucial in strengthening the weak
institutional structures of many African institutions and the polarised social identities puts
important sectors and regions at risk of localised conflicts. This is the case for water
management in Southern Africa. (Swain et al 2011). Water management in the basin is
especially difficult because there are multiple and competing interests; competing issues other
than water that demand time, attention, and money; inadequate basin level institutional
structures; institutional, legal, economic, and human resources constraints within each country;
and poor data collection, poor communication, and inadequate training’ (Kirchhoff and Bulkley
2008)
According to Ward & Michelson (2002), economic values of water can be defined by its price
in a market system, and this serves as a guide to allocate water among alternative uses,
potentially directing water and its complementary resources into uses in which they yield the
greatest total economic return. If it were true that economic value is measured by market price,
this would imply that only marketed commodities can have an economic value. Items that are
not sold in a market, which include the natural environment and public goods would generally
have no economic value. If this were so, economic value would indeed be a narrow concept
and at variance with many people's intuitive sense of what is valuable. In fact, however,
economic value is different from price. Price does not in essence measure economic value, and
items with no market price can still have a positive economic value (Ward & Michelson, 2002).
- 4 -
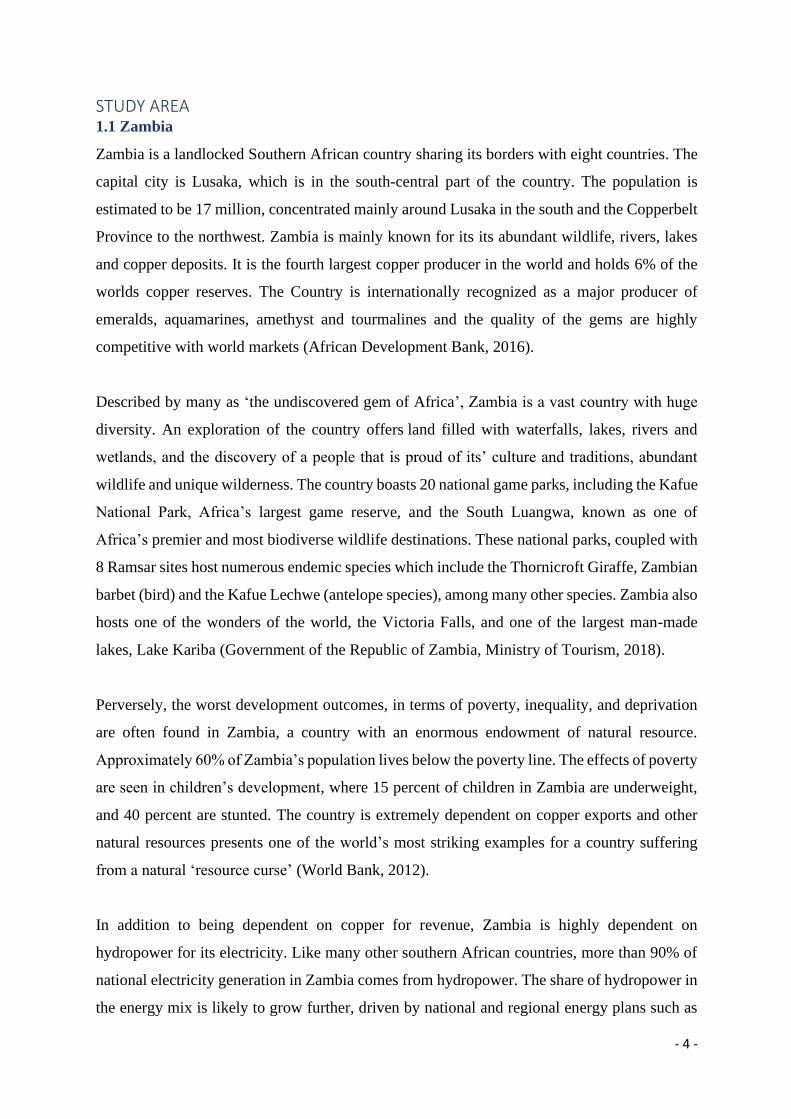
STUDY AREA 1.1 Zambia
Zambia is a landlocked Southern African country sharing its borders with eight countries. The
capital city is Lusaka, which is in the south-central part of the country. The population is
estimated to be 17 million, concentrated mainly around Lusaka in the south and the Copperbelt
Province to the northwest. Zambia is mainly known for its its abundant wildlife, rivers, lakes
and copper deposits. It is the fourth largest copper producer in the world and holds 6% of the
worlds copper reserves. The Country is internationally recognized as a major producer of
emeralds, aquamarines, amethyst and tourmalines and the quality of the gems are highly
competitive with world markets (African Development Bank, 2016).
Described by many as ‘the undiscovered gem of Africa’, Zambia is a vast country with huge
diversity. An exploration of the country offers land filled with waterfalls, lakes, rivers and
wetlands, and the discovery of a people that is proud of its’ culture and traditions, abundant
wildlife and unique wilderness. The country boasts 20 national game parks, including the Kafue
National Park, Africa’s largest game reserve, and the South Luangwa, known as one of
Africa’s premier and most biodiverse wildlife destinations. These national parks, coupled with
8 Ramsar sites host numerous endemic species which include the Thornicroft Giraffe, Zambian
barbet (bird) and the Kafue Lechwe (antelope species), among many other species. Zambia also
hosts one of the wonders of the world, the Victoria Falls, and one of the largest man-made
lakes, Lake Kariba (Government of the Republic of Zambia, Ministry of Tourism, 2018).
Perversely, the worst development outcomes, in terms of poverty, inequality, and deprivation
are often found in Zambia, a country with an enormous endowment of natural resource.
Approximately 60% of Zambia’s population lives below the poverty line. The effects of poverty
are seen in children’s development, where 15 percent of children in Zambia are underweight,
and 40 percent are stunted. The country is extremely dependent on copper exports and other
natural resources presents one of the world’s most striking examples for a country suffering
from a natural ‘resource curse’ (World Bank, 2012).
In addition to being dependent on copper for revenue, Zambia is highly dependent on
hydropower for its electricity. Like many other southern African countries, more than 90% of
national electricity generation in Zambia comes from hydropower. The share of hydropower in
the energy mix is likely to grow further, driven by national and regional energy plans such as
- 5 -
the Programme for Infrastructure Development in Africa (PIDA). PIDA estimates that
generating capacity in Southern Africa needs to increase by 6% per year to 2040 from a current
total of 125 GW to keep pace with rising electricity demand, which in Zambia is partly driven
by a high population growth rate of 3.3 percent each year, one of the fastest rates in the world
(IRENA, 2015). This growth in hydropower development poses many risks, especially to other
sectors in competition for the same water resources. The Luangwa catchment, which partly
covers the Central province of Zambia is one of the most at risk of these developments
(Conway, Dalin , Landman, & Osborn, 2017).
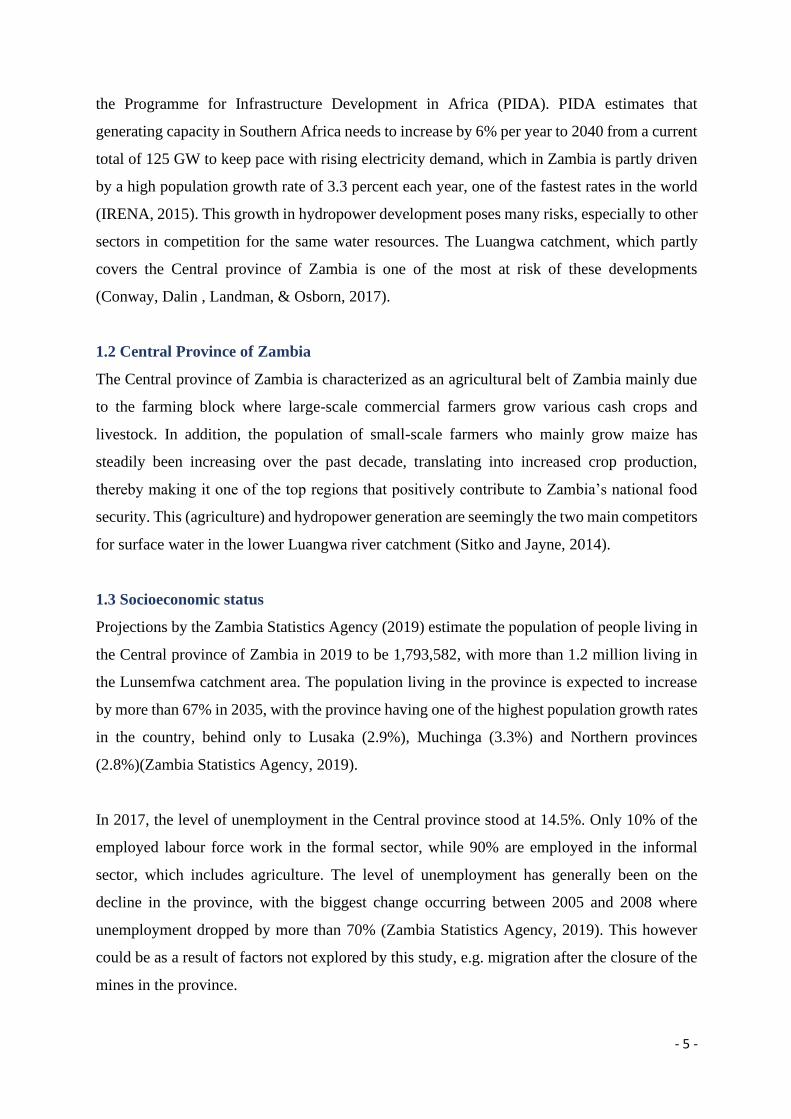
1.2 Central Province of Zambia
The Central province of Zambia is characterized as an agricultural belt of Zambia mainly due
to the farming block where large-scale commercial farmers grow various cash crops and
livestock. In addition, the population of small-scale farmers who mainly grow maize has
steadily been increasing over the past decade, translating into increased crop production,
thereby making it one of the top regions that positively contribute to Zambia’s national food
security. This (agriculture) and hydropower generation are seemingly the two main competitors
for surface water in the lower Luangwa river catchment (Sitko and Jayne, 2014).
1.3 Socioeconomic status
Projections by the Zambia Statistics Agency (2019) estimate the population of people living in
the Central province of Zambia in 2019 to be 1,793,582, with more than 1.2 million living in
the Lunsemfwa catchment area. The population living in the province is expected to increase
by more than 67% in 2035, with the province having one of the highest population growth rates
in the country, behind only to Lusaka (2.9%), Muchinga (3.3%) and Northern provinces
(2.8%)(Zambia Statistics Agency, 2019).
In 2017, the level of unemployment in the Central province stood at 14.5%. Only 10% of the
employed labour force work in the formal sector, while 90% are employed in the informal
sector, which includes agriculture. The level of unemployment has generally been on the
decline in the province, with the biggest change occurring between 2005 and 2008 where
unemployment dropped by more than 70% (Zambia Statistics Agency, 2019). This however
could be as a result of factors not explored by this study, e.g. migration after the closure of the
mines in the province.
- 6 -
1.4 Lunsemfwa catchment Area
The Luangwa river catchment is the third largest in Zambia after the Zambezi and Kafue (also
a sub-basin of the Zambezi) rivers, and the least disturbed of the main rivers. The river is
Zambia’s third longest, contributing 24% of the surface water potential of the Zambezi (based
on 30 years average), and its drainage basin covers about 20% of Zambia’s land area (WWF,
2018). The main stem is unregulated and close to pristine, while hydropower and other
developments are located mainly on the Lusiwasi River and the Lunsemfwa tributary in the
Central province. The Central province provides a good example of a region already
experiencing severe water stress and competition, mostly as a result of large-scale agriculture
and hydropower generation (Conway et al, 2017).
The Lunsemfwa sub-basin is one of the most under pressure catchments from commercial
agriculture and hydropower in Zambia. The Lunsemfwa river basin is the most developed sub-
basin of the Luangwa, signaled by the tripling in the size of the irrigated area between 2007
and 2013, from 6,634 hectares to 16,288 hectares, which translates into significant water
withdrawals (WWF, 2018).
Forecasts of future scenarios predict conflict over the water resource, particularly between the
commercial farmers upstream and the hydropower producers downstream. Currently a total of
226 dams and weirs exist, with another 165 planned in the Lunsemfwa catchment area. There
are two hydropower projects; the Lusemfwa Hydropower Scheme, operating two plants with a
total installed capacity of 56MW, with plans to increase the installed capacity in the same
region by 500MW by 2020. The second scheme is run by ZESCO, with an installed capacity
of 12MW, with plans of developing two run-of-the-rivers schemes. The environmental unit of
ZESCO has been conducting a mapping exercise to evaluate potential sites (WWF, 2018).
The main challenge Lunsemfwa Hydropower Company is currently facing is the reduction in
flow and availability of surface (tributary) water due to the numerous dams upstream which
have been built by commercial farmers. The Mkushi farming block houses about 70
commercial farmers who moved into Mkushi area around the year 2000, and have since built
approximately 100 dams for irrigation purposes (WWF, 2018). As a result, tributaries in the
area are beginning to dry up shortly after the wet season.
- 7 -
In September 2014, it was reported by the Lusaka Times Newspaper that Lunsemfwa Hydro
Power Company Limited LHPC announced that it had shut down its Lunsemfwa power plant,
creating a loss of Nine Million United States dollars (US$ 9 million) in the process. The plant
had been closed due to poor rainfall which had resulted in inadequate water accumulation in
the river catchment areas, and the reservoir. This was occurrence was expected to be more
frequent, especially due an increase in the intensity of farming in the area, which competes for
the same water, and exacerbated by climate variability (Sitko and Jayne, 2014).
In addition, forest reserves have been chopped down as farmers continue to expand their
farming areas. Communities around the farming blocks have contributed to deforestation by
cutting down trees for charcoal production, whose demand has increase over the last few years
due to excessive power outages in the country. This has resulted in a perceivable change in the
microclimate, and a significant reduction in the amount of rainfall in the area has been observed.
An increase in the amount of sediment load has also been observed, as a result (WWF, 2018).
In the past, farmers acted independently and fought over water allocations. The situation has
changed since they established three commercial farmers’ groups to ensure that farmers have
access to water. The conflict has now shifted to the hydro-power producers. With the drying up
of some of the tributaries, the farmers are beginning to draw water from the headwaters of the
Lunsemfwa River (WWF, 2018).
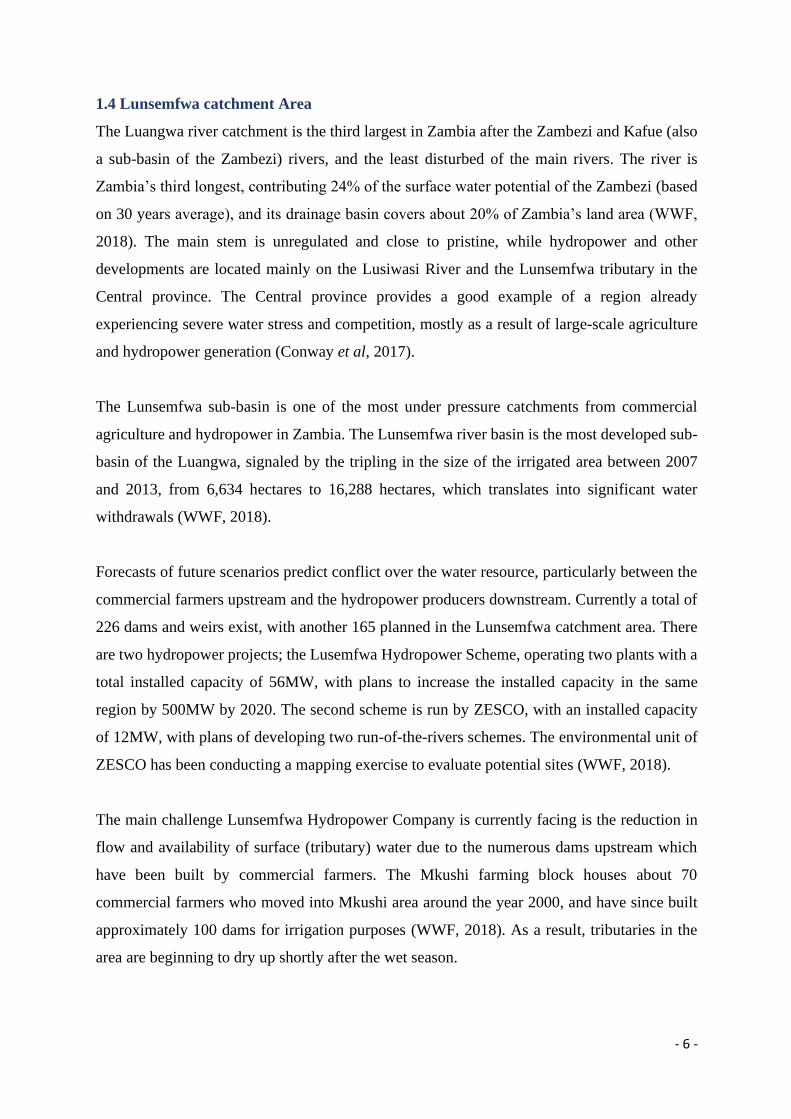
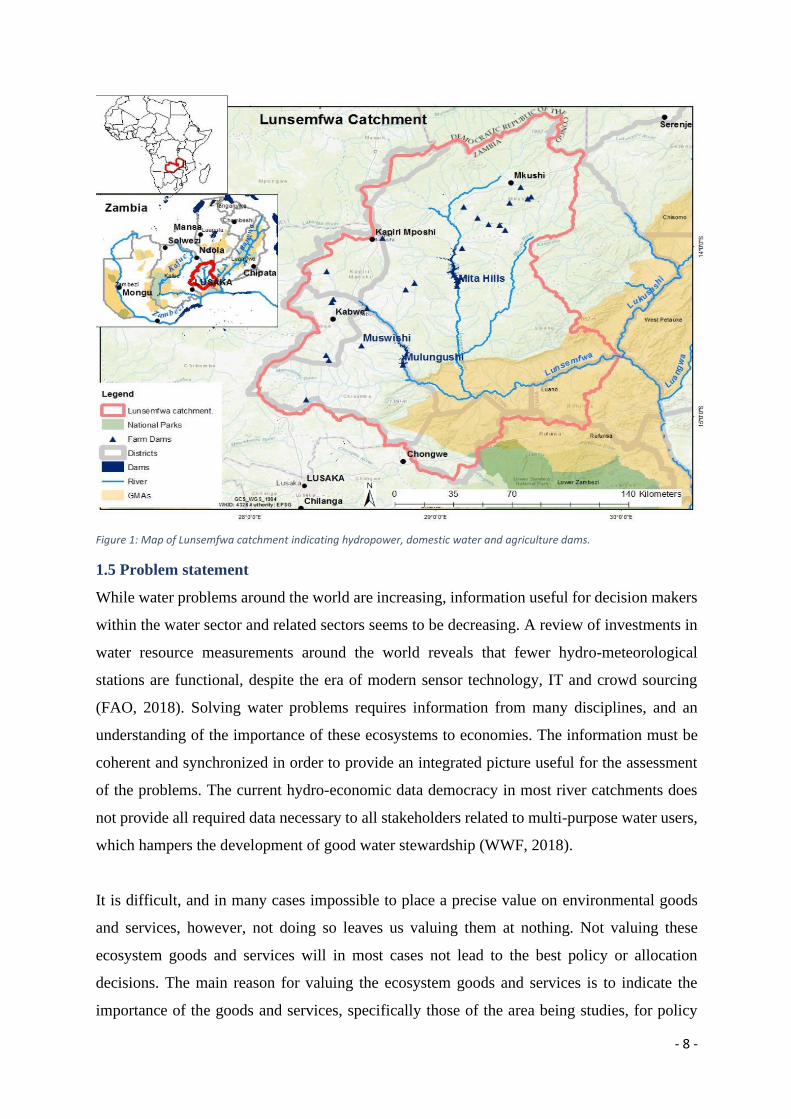
The area to be studied includes the Lunsemfwa catchment as delineated by the Ministry of
Water Development, Sanitation and Environmental Protection – indicated in the map below.
The region covering an area of 21 944 km2. The Lunsemfwa catchment area falls within the
Luangwa, which in turn is a sub-catchment of the Zambezi river catchment. The Lunsemfwa
encompasses 19 sub-catchments which will be included in this study.
- 8 -
Figure 1: Map of Lunsemfwa catchment indicating hydropower, domestic water and agriculture dams.
1.5 Problem statement
While water problems around the world are increasing, information useful for decision makers
within the water sector and related sectors seems to be decreasing. A review of investments in
water resource measurements around the world reveals that fewer hydro-meteorological
stations are functional, despite the era of modern sensor technology, IT and crowd sourcing
(FAO, 2018). Solving water problems requires information from many disciplines, and an
understanding of the importance of these ecosystems to economies. The information must be
coherent and synchronized in order to provide an integrated picture useful for the assessment
of the problems. The current hydro-economic data democracy in most river catchments does
not provide all required data necessary to all stakeholders related to multi-purpose water users,
which hampers the development of good water stewardship (WWF, 2018).
It is difficult, and in many cases impossible to place a precise value on environmental goods
and services, however, not doing so leaves us valuing them at nothing. Not valuing these
ecosystem goods and services will in most cases not lead to the best policy or allocation
decisions. The main reason for valuing the ecosystem goods and services is to indicate the
importance of the goods and services, specifically those of the area being studies, for policy
- 9 -
and other decision purposes. In order to protect an ecosystem, which are under increasing threat
due to population growth, climate change and other anthropogenic factors, it is important to
understand its value that an ecosystem contributes to an economy (Tietenberg & Lewis, 2018)
Comprehending the value of the goods and services provided by an environ will lead to
improved environmental management and planning that can inform urban design, strengthen
neighborhoods, and contribute to community vitality, economic health and livability. I would
like to understand the value of an ecosystem (to be chosen later) to a particular economy it
support, with a specific focus on a wetland ecosystem, which are one of the most important
environs to economies, but do not receive much attention mainly because their worth aren’t
mostly tabulated (Skudev, Bishop, Ten Brink, & Gundimeda, 2008).
Considering the above arguments, it is therefore important to quantify the value of freshwater
resources for the communities living around freshwater ecosystem as well as the nation, to
realize the valuable benefits freshwater ecosystems provides in order to improve the use and
management of these resources. This is the first time a study of this nature is being done in the
Lunsemfwa catchment area.
1.6 Main Objective
The aim of this study is to investigate the range and magnitude of ecosystem goods and services
contributing to the welfare of communities in the Lunsemfwa catchment and the Zambian
economy. This study applies environmental economics methodologies, the overall goal being
to promote efficient and sustainable use of Lunsemfwa catchment natural resources through
provision of information to relevant stakeholders and decision-makers.
1.7 Specific Objectives
The specific objectives of this study include;
I. Highlight the economic value of the freshwater resources to hydropower, agriculture and
domestic use in the Lunsemfwa catchment area
II. To evaluate the Gross Financial Value (GFV) of hydropower, agriculture and domestic
use water use in the Lunsemfwa catchment.

- 10 -
1.8 Research Questions
In consideration of the objectives and rationale of this study, the following questions are
addressed in this report;
I. What is the economic value of the freshwater resources to hydropower, agriculture and
domestic use in the Lunsemfwa catchment area?
II. How significant is the Lunsemfwa catchment area to the Zambian economy in terms of
its Gross Financial Value (GFV)?
Justification of Study
The study of economics is mainly concerned with the allocation of scarce resources in society
as a means of satisfying human wants and needs. In this vein, economics takes cognisance of
the availability of resources, methods to produce goods and services, their exchange, and the
distribution of income within society. Economics is anthropocentric, implying that it regards
mankind as the most important element, and as such provides useful tools that can support
decision-making for optimising utility. However, decisions concerning water allocations are
informed not only by concerns of economic efficiency but also considerations of equity,
environmental protection and socio-political factors, among many others (FAO, 2018).
Although water resources perform many functions and have important socio-economic benefits
or uses, water is in many respects considered a classic non-marketed resource. Even when used
as a tradeable commodity, market prices are not generally available. The reasons why water
has no common value or price are often related to the historical, socio-cultural and institutional
context in which water is used and managed e.g. the return of water use rights for groundwater
or surface water on farmers’ land. In addition, its form and use present a challenge in handling
it e.g. although water can be captured and shared, water flows can also be recycled. This often
makes it difficult to break water down into marketable proportions (FAO, 2018).
An important cause of this economically inefficient water use (where costs outweigh benefits)
and many other environmental problems is the failure of institutions involvement with the
allocation and management of water (Government failure). Failure refers here to institutions
where 'they induce or favour decisions that lead society away or prevent society from achieving
socially optimal resource allocations. Sources of institutional failure include markets, policies,
political and administrative factors, as well as rent seeking, which is not uncommon in many
landscapes around the world. These emanate from a fundamental failure of information or lack

- 11 -
of understanding of the multitude of values that may be associated with water resources (FAO,
2011). This research analyses the wide array of benefits derived from freshwater resources,
with a focus on highlighting the value of the main goods and services provided by the
Lunsemfwa catchment – employing appropriate methods to highlight the full value of the
benefits derived.
The core principle underlying a move towards establishing a price-based allocation mechanism
for water lies on the simple premise that appreciation of true value of water encourages wise
and responsible use and stimulates innovation. Appropriately designed water tariffs will
discourage or prevent waste and stimulate water saving (Imulama, Droogers, & Makin, 2002).
Recognition of water as an economic good means water has value in competing uses. Managing
it as an economic good means that water will be allocated across competing uses in a way that
maximizes net benefits from that amount of water. An economic approach to water allocation
does not necessarily mean management of water as a commodity in all aspects (Imulama,
Droogers, & Makin, 2002).
Generally, the scope of discussion on payment for water services was mostly dominated by the
need to recover costs for domestic or irrigation water supplies. In this context, much of the
debate is on various options for cost recovery, depending on many factors e.g. socio-economic
factors i.e. the need for full recovery of capital and operational and management costs at
realistic interest rates, balanced with partial recovery at subsidized rates in some unavoidable
cases (e.g. domestic water supply to poor communities). The main ethos of this debate extends
well beyond the problem of cost recovery into the aspect of using water prices to encourage
efficient use and the level of charges required to achieve it (Atapattu, 2002).
CHAPTER TWO: LITERATURE REVIEW The valuation of ecosystem goods and services is a rapidly evolving and adapting area of
research. The last three decades has seen an information explosion on this subject around the
world, and it is now an established approach to consider environmental systems as economic
assets. Ecosystem valuation is a form of economic analysis that’s aims to enable decision
makers to make informed and economically efficient decisions and policies. It is different from
financial analysis which focuses on the flow of money. Economic efficiency, or Pareto
- 12 -
optimality is when all goods and factors of production in an economy are distributed or
allocated to their most valuable uses and waste is eliminated or minimized (Braat & de Groot,
2012).
It is almost impossible to achieve Pareto efficiency, so an outcome is often considered
economically efficient if those made better off could, in theory, compensate those made worse
off, a so-called potential Pareto improvement (Braat & de Groot, 2012). Despite this
overarching to attain efficiency, valuation studies conducted are normally contextual and are
tailored to meet specific needs or objectives. Ecosystem valuations have been divided into four
distinct areas by the World Bank; 1. The value of the total flow of benefits; (2) The net benefits
of interventions; (3) The distribution of costs and benefits; (4) Identifying financing sources for
conservation (Pagiola, von Ritter, & Bishop, 2004).
It is widely agreed that the environment has ‘value’, and hence provides numerous benefits.
Determining the total flow of benefits from ecosystems allows us to propound the magnitude
of this ‘value’, or the contribution of ecosystem goods and services to human welfare (natures
contribution to people). This type of investigation also allows for inclusion of this economic
analysis in a country’s System of environmental Economic Accounting (SEEA), promoted in
the quest to operationalise the concept of sustainable and also sustainable resource extraction
(United Nations, 2012). This approach is more widely applicable in initiatives at the
knowledge-policy interface, which require a pluralistic approach in embracing and analysing
the diversity of values. By quantifying the value of ecosystem goods and services, the
magnitude and depth of environmental concerns can be raised in both public and political
spheres (United Nations, 2012).
Ecosystem values do not always have to be aggregated to be useful. Despite the importance of
economic efficiency of interventions instructed by environmental valuation, other socio-
economic and ecological factors have to be considered i.e. the distribution of benefits and costs
does not always have to be symmetrically distributed among stakeholders (Atkinson & Mourato
, 2015). Assessing the equity over socio-demographic variables can aid the understanding of
incentives soliciting resource use and can avoid imposing negative impacts on less represented
variables or vulnerable groups of society (Pagiola et al., 2005).
- 13 -
Ecosystem valuations can also be focussed on assessing the net benefits that resulting from a
project, policy or management change, to justify spending on ecosystem conservation. This
analysis can be of an intervention introduced at a particular point in time or a existing scenario.
Both Scenarios allow for a comparison of increases in utility or wellbeing of a group of people,
against reductions in social welfare (costs), in a common metric, usually money or units
(Atkinson & Mourato, 2015). This cost benefit analysis (CBA) is a crucial tool, justifying and
facilitating more transparent decision-making.
In situations where ecosystem valuation can demonstrate a significant contribution of
ecosystem goods and services to an economy, there is a huge potential for sustainable financing
of environmental protection interventions. This can be achieved by securing public resources
after raising awareness of the scale of benefits in the first place, and then through the
establishment of efficient markets for environmental services (MES) whereby the benefits are
revealed and captured and their values realized in markets (International Institute for
Sustainable Development, 2007).
These distinct contexts are very important in in framing ecosystem valuation studies and
ensuring appropriate policy questions are effectively addressed. In relation to the above
indicated objectives, it is not always relevant to undertake a full valuation of ecosystem
services. (Neugarten, et al., 2018). In this regard, the valuation literature included in this study
will be focused on valuing a subset of the ecosystem goods and services in discrete scenarios,
particularly the direct benefits derived from freshwater ecosystem services. A review of
ecosystem valuation literature relevant to the current study is presented below (Neugarten, et
al., 2018).
2.1 Review of literature in Hydropower Ecosystem services valuation
Major water infrastructure projects such as hydropower dams can provide substantial benefits
such as food and drinking water security, hydropower generation, and flood control. But these
benefits may come at a high cost of large-scale ecological alterations or adverse social impacts
such as involuntary resettlements. If these costs are neglected, an investment decision will
hardly be efficient. Harpman (2006) stresses the importance of including all these costs in the
valuation process in order to make these “neglected values” visible and demonstrate how this
can be achieved through economic valuation.

- 14 -
In many previous studies, water has been considered as a “fuel” used by hydropower plants to
produce electricity. Establishing the marginal value of water used in hydropower production is
a relatively complicated undertaking. Wood and Wollenberg (1996) propounded the marginal
value of water in the production of hydropower (Harpman, 2006). The marginal value of water
is determined by the increment in generation produced by an additional unit of water and the
marginal value of that generation. The marginal value of water can take on positive, negative
or zero values. All other factors the same, the marginal value of water is higher during on-peak
hours and lower during off-peak periods. The marginal value of water declines to zero at
powerplant capacity (Harpman, 2006). Many studies attempting to undertake an economic
valuation of water as an ecosystem services for hydropower have mainly assessed the footprint
of water in hydropower production, and subsequently using the information to analyse the
economic value of water. This is a less prevalent method compared to the ecological cost
implications of hydropower production to freshwater resources. Ponce, et al (2011) carried out
a contingent valuation study concerning landscape impacts generated by the construction of
one dam of the Hidroaysen hydropower project located in the Chilean Patagonia. A survey was
used to collect information about citizens’ opinions towards the hydropower project in four
major cities in Chile. This was aimed at eliciting peoples Willingness To Pay (WTP). The study
found the economic loss associated with the landscape impacts for people living in urban areas
of the country to be approximately US$ 205 million, which was roughly 28% of the total
investment (Ponce et al, 2011).
Monetary asset values will be calculated by discounting the resource rent of the environmental
asset using the net present value approach. Resource rents reflect the surplus value accruing to
the user of an environmental asset calculated after all costs and normal returns are considered
(United Nations, 2012). It is the current market value after accounting for both supply and
demand factors and reflects the immediate impacts of resource use on the economy.
The asset value represents the discounted future income stream of water resources used for
hydroelectric generation, and the benefits to accrue to future, as well as current, generations.
Note that under the net present value approach, renewable monetary estimates for water
resources are estimates of the net discounted income stream from the resource. The estimate is
not a measure, for example, of the value of the stock of water in dams at that particular point
in time. In fact, a hydro dam may be dry at the time of the balance date used, but is still valued
on the basis of the expected future availability of water (Stats NewZealand, 2017).

- 15 -
A study by Lăcrămioara & Bondread, (2019) surveyed all the hydropower plants in the Zagunao
River Basin, Southwest China in order to investigate the on ecological compensation to
livelihoods as a result of hydropower developments. They assessed the hydropower service by
using the InVEST (The Integrated Value and Tradeoff of Ecosystem Service Tools) model. In
their discussion of the impact on ecological compensation of the hydropower dams, results
showed that hydropower service value of ecosystems in the Zagunao River Basin is
approximately 216.29 Euro/hm2 on average, of which the high-value area with more than
475.65 Euro/hm2 is about 750.37 km2, which accounted for 16.12% of the whole basin, but it
provides 53.47% of the whole watershed service value. Secondly, the ecosystem is an
ecological reservoir with a great regulation capacity. The study further revealed that dams
cannot completely replace the reservoir water conservation function of ecosystems and has high
economic and environmental costs that must be compensated as well. The study recommended
that compensation for water conservation services should become an important basis for
ecological compensation of hydropower development.
Tilmant, Pinte, & Goor (2008) undertook a, economic valuation of benefits and costs associated
with the coordinated development and management of the Zambezi river basin, essentially
focussing on hydropower development. The study assessed basin-wide allocation policies as
derived from a hydro-economic model called Stochastic Dual Dynamic Programing (SDDP),
which applies to multiple reservoir simulations. This model considers the largest existing and
planned hydraulic infrastructure schemes in the basin. The study results illustrate that the
economic value of water varies from one region to another, essentially influenced by large
changes in elevation and other variables associated with the location of existing or proposed
infrastructure. This observation has implications for possible decisions about the siting of
expansions in irrigated agriculture as well as other developments. The model assessed planned
water demand schemes, such as irrigation in upstream region for economically viability, given
existing establishments. This study also revealed that the economic value of the three largest
water storage dams on the Zambezi is approximately US$443 million per year.
Water-energy nexus is significantly studied and debated. Some scientists argue that
hydroelectric generation is a significant water consumer, some disagree with this notion. There
are many studies regarding water consumption from hydropower that use different
methodological approaches (Phelps, Jones, Pendergrass, & Gómez-Baggethun, 2015). The

- 16 -
water footprint of a hydropower plant is based on the phenomenon of evaporation in the
reservoir. As was highlighted by the data and the results presented the paper written by (Phelps,
Jones, Pendergrass, & Gómez-Baggethun, 2015), the amount of water which evaporated of the
lake for one year was very significant. Nevertheless, there isn’t a worldwide standard for
estimating the evaporation in a reservoir and applying different methodologies leads to various
results. On the other hand, since the reservoir has multiple purposes, water footprint of the
reservoir should be allocated to all its purposes. This is a real challenge, especially because of
the lack of data. There is a need of correlating researches in this field to elaborate a standardized
method to assess water footprint (Lăcrămioara & Bondread, 2019).
2.2 Experiences in the valuation of Agriculture and Livestock
Crop production in many developed countries is mostly conducted at a subsistence level.
Thereby complicating any valuation assessments that may be conducted. Most studies
conducted in this filed have attempted to assess the value of crop productivity largely conducted
in the context of rural livelihood analysis (Al-Najar, 2011). A monetary value can be assigned
to crop production by analysing the value of factors inputs and outputs. In most cases, this
information has been compiled by using survey questionnaires, though some other methods
have also proved effective in situations where survey questionnaires have been difficult to
administer. One good example is the Food and Agricultural Organisations’ CropWat GIS
software, a form of hedonic model which has been used to map farming blocks and
investigating factor inputs based on the soil fertility and size of field, among other variables.
Valuation studies focused on subsistence crop production have assessed mixed crop production,
as opposed to large scale crop valuation that has focused on specific crop products (Al-Najar,
2011).
Ghezelbash et al (2018) undertook a study in Gharehghom and Namakzar basins in Iran which
used the production functions to determine the economic value of and ultimately selecting the
most appropriate for sugar beet crop. This study used econometric methods to select the best
form of production function among the common production functions in the classic method.
The generated results proved that the that Translog production function was the best in
estimating the economic value of water in the agricultural sector of Khorasan Razavi province.
To come up with the final economic value of water, the coefficient values obtained from the
estimation were substituted in derivative of Translog function with respect to water and finally
the result was multiplied by the ratio of output to water consumption in agricultural sector of
- 17 -
Khorasan Razavi province in 2018. The study results valued water at 850 Iranian Rials per
cubic meter of water for Gharehghom basin in sugar beet crop in 2018 while water in Namakzar
basin was valued at 580 Rials per cubic meter of water (Ghezelbash, Murshed, Salari, &
Hosseini, 2018).
Undertaking valuation of water in crop production has been used as a very important tool by
water sector actors in some most parts of the world, especially in the USA. Key players in water
transactions find it useful for negotiation to estimate the current value of water used to grow
crops by calculating the Net Return to Water (NRTW), and and analysing the Net Return to
Water over a period. In addition, consideration of managing risk in farm net income may assist
in water negotiations (Schuster, 2012).
Croitoru & Xie, (2016) undertook a study to estimate the economic value of water in the
Beyşehir sub-catchment in Turkey using the residual method. Water from Beyşehir sub-
catchment is largely used for irrigated agriculture. In 2015, about 347 million m3 of water has
been used to irrigate 64,490 ha of agricultural land. Around 56% of the irrigated area is located
in Beyşehir sub-catchment, and the rest in Çumra region. To begin the study, they came up with
estimates for each region the costs of production unrelated to water (e.g. fertilizers, soil
preparation, planting, pesticides, maintenance, rent, etc.); then subtracted these costs from the
agricultural revenue and attribute the difference to the value of water. These data, obtained
from simple farm budgets, were summarized in a table. Accordingly, the economic value of
water is estimated at US$27.4 million (Croitoru & Xie, 2016).
2.3 A Review of Domestic & Industrial water supply valuation studies
Water resource management is critical to Turkey’s economy and environment. The country has
about 112 billion m3 per year of economically exploitable water. However, population growth,
climate change and pollution of water bodies are putting increasing pressure on these resources.
In this context, understanding the contribution of water to the economy and environment is
crucial for its conservation. To meet this need, the World Bank launched a program aiming at
improving valuation and accounting systems of natural resources in Turkey. As part of this
program, Croitoru & Xie (2016) undertook a study to estimate in monetary terms the economic
value of water in Beyşehir Lake, the largest freshwater lake in Turkey. Valuation was based on
the Total Economic Value concept, which includes use and non-use values. The results show
that the economic value of water is about seven times higher than its financial value. In addition,

- 18 -
the economic value of water allocated for municipal use US$0.74/m3 is substantially greater
than that supplied for irrigation US$0.074/m3. The analysis suggested that allocation of water
from Beyşehir Lake among different uses was inefficient. To validate this conclusion and
improve allocation, a more comprehensive assessment of the economic benefits of water
resources is needed, particularly of water supply for irrigation, municipal use, recreation and
biodiversity. The analysis also indicated that economic valuation can be a powerful tool to
improve water management at the river basin level (Croitoru & Xie, 2016).
Croitoru & Xie, (2016) used the Contingent Valuation method to assess the quantities and value
of water consumed by household and industries from Beyşehir Lake. Questionnaires where
used to elicit people’s willingness to pay for water. The lake was found to provides more than
11 million m3 of water for municipal use, supporting more than 71,400 people. These include
34,100 households and 8600 commercial establishments. The households consume an average
about 18 m3 per month. Consequently, water consumption is estimated at 7.4 million m3 for
households and 3.6 million m3 for commercial establishments. The tariff for municipal water
was US$0.34/m3 for households and US$0.51/m3 for commercial establishments. However,
since these are nominal values, they did not represent the society’s willingness to pay (WTP)
for tap water. The WTP for municipal water was estimated to be 85% higher than the actual
water tariff in Greater Baku, Azerbaijan and about twice as much as in Bursa, Turkey (US$4.71
vs. US$2.35/m3). If the economic value for municipal water in Beyşehir was only 85% higher
than its nominal value (as in Baku), it was estimated at US$0.63/m3 for households and
US$0.96 /m3 for commercial households. These estimates are in the same range with the WTP
for potable water found in Southeastern Turkey, of US$0.94/m3. Applying these values to the
total consumption of municipal water in Beyşehir sub-catchment, the economic value of
municipal water was estimated to be US$8.09 million (Croitoru & Xie, 2016).
To estimate the economic value of water supply for industrial use, Croitoru & Xie (2016)
analyzed the several small- and medium-scale industries that exist in Beyşehir sub-catchment
related to food and fish processing, weapons and ammunition production, textile and chrome
processing. The towns Huğlu and Üzümlü are well known for their rifle factories, which export
80% of Turkey’s shotgun products to more than 50 countries around the world (interview with
local experts). However, no data was available on the use of water for these industries, therefore
no estimate were provided by the study.
- 19 -
Markantonis, et al., (2018) investigated household’s willingness to pay for domestic water in
the transboundary Mékrou River Basin in West Africa (Burkina Faso, Benin and Niger) and
explored the payment for domestic water provision to poverty. This study used the results of a
household survey which included a representative sample from all three bordering countries.
Using the survey results, the paper presented basic socio-economic characteristics of the local
population as well as qualitative water provision and management attributes. In the core of the
econometric analysis the paper presents the results of the survey’s Contingent Valuation (CV)
scenario estimating the households’ willingness to pay (WTP) for a domestic water
consumption. The willingness to pay was estimated to be 2.81 euro per month on average for
domestic water consumption, with a strong correlation established between this figure and
wealth of households.
CHAPTER THREE: THEORY AND METHODS People have since time in memorial valued nature in crisply different and in many cases
conflicting ways. It is therefore worth noting that the diversity of values and their contribution
to people’s livelihoods are in almost all cases contextual i.e. dependent on the setup or
institutional framework (Tadaki, Sinner, & Chan, 2017). This master thesis will employ the
three different water resources valuation approaches which focusses on valuing natures
contribution to people (or production of consumable or utility goods), depending on the service
or good. This approach allows for an inclusive valuation of nature’s contribution to people
using an array of methods depending on the diversity of values being observed (Pascual, et al,
2017).
Three main ‘benefits derived’ from water are assessed in this study, including hydropower,
domestic water consumption and agriculture production in the Lunsemfwa catchment area of
Zambia. This study will use both market and no-market values, including both direct and
indirect to estimate the economic value of water in the Lunsemfwa catchment. This is mainly
due to the time constraint as well as the unavailability of resources to extensively evaluate many
other non-market benefits being derived, which can be valuated using mainly using stated
preferences. However, to enhance the arguments of the study, secondary information will be
compiled from other assessments or literature that has been generated on the Lunsemfwa
catchment to highlight the value of different ecosystem services being derived in this landscape
(Skudev, 2008).

- 20 -
Due to the limited amount of time, resources and other challenges (Mobility restrictions), as
well as the purpose of the research, some processes normally conducted in an integrated and
multi-stakeholder valuation activity will not be undertaken here. Nevertheless, this research
will consider all types of values in the valuation process, which include;
a) Direct use values: this category refers to all direct uses of water, and it includes
water-based or water-dependent raw materials or physical products that are used
directly for production, consumption and sale. Water supply, water as an input to
agriculture and industrial production are thus part of this category. Benefits from non-
consumptive uses of water, such as for example recreation, are also included;
b) Indirect use values: This category includes all values associated with regulating and
supporting services provided by water ecosystems.
c) Option value: This entails the value people place on the future ability to potentially
use the environment, directly or indirectly.
d) Non-use values: it includes all values intrinsic to water, regardless of its potential use,
such as cultural, aesthetic or heritage values. These values are associated to the fact that
an individual might want to preserve water ecosystems without ever using it. This
includes bequest and existence values.
Three main valuation methods are employed in this study, as earlier highlighted. These are
dependent on the type of water resource use or demand being analysed. These include;
1. Valuing water for hydropower;
2. Water for Agriculture Production;
3. The value of Domestic Water.
The theoretical reasoning and methods employed in valuing water resources in the above
sectors are discussed in detail below.
3.1 Valuing water for hydropower - Method
In order to measure the value of water resources used for electricity generation, this thesis will
employ the Stochastic Dual Dynamic Programming (SDDP) model in order to come up with
asset value of water. A consulting firm called PRS based in Norway developed a software
package called SDDP, which has been used for various similar studies around the world. SDDP
is a hydrothermal dispatch model with representation of the transmission network and used for
short, medium- and long-term operation studies. The model calculates the least-cost stochastic
- 21 -
operating policy of a hydrothermal system. In addition to the least-cost operating policy, the
model calculates several economical indexes such as the spot price (per submarket and per bus),
wheeling rates and transmission congestion costs, water values for each hydro plant, marginal
costs of fuel supply constraints and others (PSR, 2020).
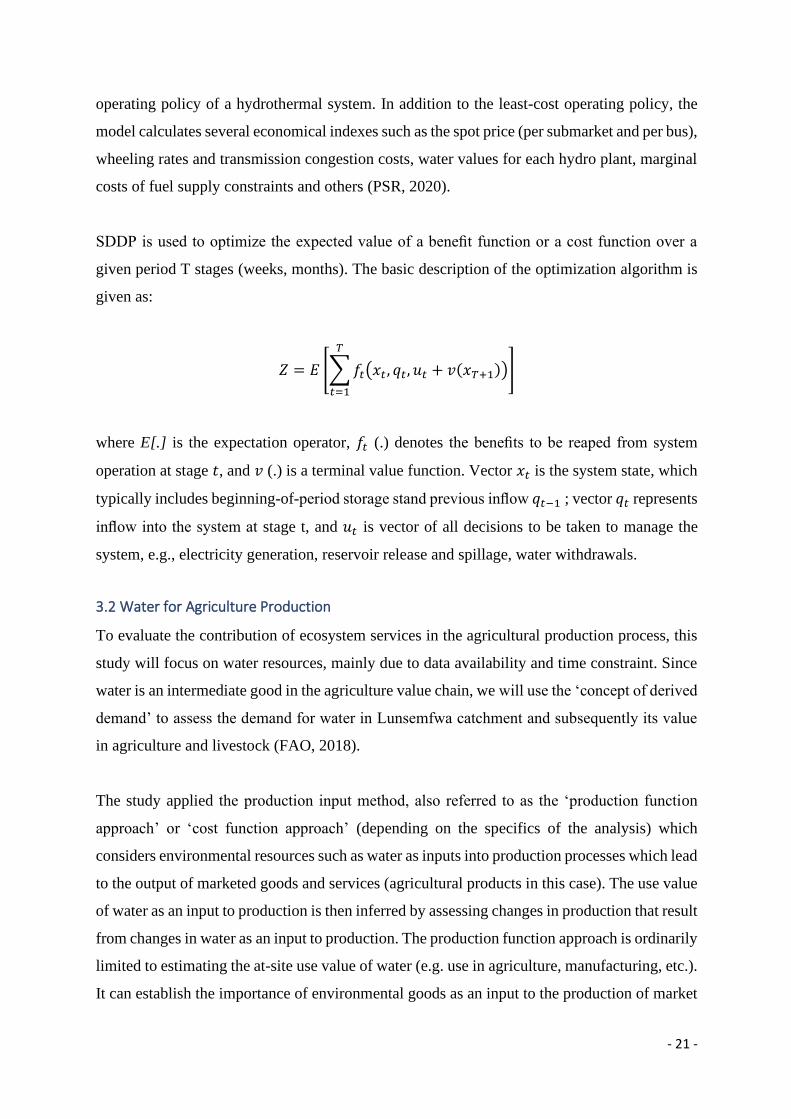
SDDP is used to optimize the expected value of a benefit function or a cost function over a
given period T stages (weeks, months). The basic description of the optimization algorithm is
given as:
𝑍 = 𝐸 [∑ 𝑓𝑡(𝑥𝑡 , 𝑞𝑡, 𝑢𝑡 + 𝑣(𝑥𝑇+1))
𝑇
𝑡=1
]
where E[.] is the expectation operator, 𝑓𝑡 (.) denotes the benefits to be reaped from system
operation at stage 𝑡, and 𝑣 (.) is a terminal value function. Vector 𝑥𝑡 is the system state, which
typically includes beginning-of-period storage stand previous inflow 𝑞𝑡−1 ; vector 𝑞𝑡 represents
inflow into the system at stage t, and 𝑢𝑡 is vector of all decisions to be taken to manage the
system, e.g., electricity generation, reservoir release and spillage, water withdrawals.
3.2 Water for Agriculture Production
To evaluate the contribution of ecosystem services in the agricultural production process, this
study will focus on water resources, mainly due to data availability and time constraint. Since
water is an intermediate good in the agriculture value chain, we will use the ‘concept of derived
demand’ to assess the demand for water in Lunsemfwa catchment and subsequently its value
in agriculture and livestock (FAO, 2018).
The study applied the production input method, also referred to as the ‘production function
approach’ or ‘cost function approach’ (depending on the specifics of the analysis) which
considers environmental resources such as water as inputs into production processes which lead
to the output of marketed goods and services (agricultural products in this case). The use value
of water as an input to production is then inferred by assessing changes in production that result
from changes in water as an input to production. The production function approach is ordinarily
limited to estimating the at-site use value of water (e.g. use in agriculture, manufacturing, etc.).
It can establish the importance of environmental goods as an input to the production of market

- 22 -
goods and services, or alternatively the significance of the impact that pollution of the
environment can have in production processes (Ghezelbash, Murshed, Salari, & Hosseini,
2018).
To assess the services that cannot be observed in the agricultural process, we will use the
“replacement cost techniques”. This method essentially estimates the costs that would be
incurred by replacing ecosystem services with artificial technologies (Garrod and Willis, 1999).
For example the value of the soil fertility as an ecosystem service could be estimated based on
the cost of replacing the service with fertilizer, as is the case here. Another cost-based approach
is the mitigation or restoration cost method, which refers to the cost of mitigating the effects
caused by to the loss of ecosystem services or the cost of having those services restored (Unai
Pascual, 2017).
Crop water production function
The crop-water production function (From figure 2 below) expresses the relationship between
yield (Y) and the applied water (W). We notice that the marginal value of water is a reducing
function of the its value to production.
𝑃𝑉 = 𝑓 (𝑊 , 𝑋 𝑗 )
Figure 2: Crop water productivity function graph - Derivation of marginal water value from the water production function (PV: production value (in US$/ha); MWP: marginal water productivity (US$/m3); V: water volume applied)

- 23 -
Figure 2 illustrates the decreasing marginal productivity derived from the production function.
The economic optimum volume of water applied should be, according to the neoclassical
economic theory, equal to the market price of water. In Figure 2, the economic optimum
corresponds to the volume V*. A farmer applying a volume V2 of water may increase his
production from PV2 to PV* if he makes supplementary irrigation of (V* - V 2). This means that
the farmer will have extra income from supplementary irrigation as far as the value of this extra
income per unit of water (MWP2) is higher than the price of acquisition of this production factor
(MWP*). Using the same reasoning, if farmers increase water use to V1 volume of water (higher
than V*), they would be generating less benefit (MWP2) from their supplementary irrigations
than the price they are paying for the acquisition of water.
Translog Production Function
To estimate the marginal productivity of water, this study uses the Translog production
function, which is basically an approximation of the CES production function that takes on the
general form;
𝑙𝑜𝑔𝑦𝑌 = β0 + ∑ 𝛽𝑖𝑙𝑜𝑔𝑥𝑖
𝑛
𝑖=1
+1
2∑ ∑ 𝛾𝑖𝑙𝑜𝑔𝑥𝑖𝑙𝑜𝑔𝑥𝑗
𝑛
𝑗=1
𝑛
𝑖=1
Where β0 is our efficiency parameter, 𝛽𝑖 is our output elasticity of the factor input (water in
this case), and 𝛾𝑖 is a measure of complementariness between 𝑥𝑖 and 𝑥𝑗.
The unique feature of a Translog production function, is that the marginal product ( 𝜕𝑌
𝜕𝑋𝑖) is
determined by the levels of input 𝑥𝑗;
𝑀𝑃𝑥𝑖 =𝜕𝑙𝑜𝑔𝑦
𝜕𝑙𝑜𝑔𝑥𝑖= 𝛽𝑖 + ∑ 𝛾𝑖𝑗 . 𝑙𝑜𝑔𝑋𝑗
𝑛
𝑗=1
Where y is wheat yield, and xi is water productivity in wheat farming.
It is to be noted that the marginal product of a Translog production function is formally a Cobb-
Douglas production function. To calculate the marginal value (𝑀𝑉𝑡) of water in wheat
production, we use the formula;
𝑀𝑉𝑡 = 𝛽𝑖 ∗�̅�𝑡
�̅�𝑡
Where �̅�𝑡 is the average value of water, and �̅̅̅̅�𝑡 is the average quantity of water used per hectare
of production. 𝛽𝑖 is the output elasticity of water, estimated using the Translog production
function above.

- 24 -
The specific logarithmic form of the production function used in this study can be presented
as;
ln(𝑌) = 𝛽0 + ln (𝐿𝑡) + ln (𝐾𝑡) + ln (𝑊𝑡) + ln (𝐹𝑒𝑟𝑡𝑡) + 𝑢𝑡
Where is the natural logarithm of yield ln(𝑌), 𝛽0 is a constant, ln (𝐿𝑡) measures the natural log
of labor, in form of labor hours, ln (𝐾𝑡) is the natural log of capital, ln (𝑊𝑡) is the natural log
of water in cubic meters and 𝑢𝑡 is the error term. ln (𝐹𝑒𝑟𝑡𝑡) is the amount of fertilizer applied,
which enters our equation as a proxy for soil fertility.
To estimate the results of the captioned model, I used the production function estimation
(PRODEST) method in STATA, particularly the OP method in order to get the marginal value
of water in wheat production. To minimize the impact of multicollinearity, only two factors of
production are included as state variables in the estimation, while the other enter as proxy
variable.
3.3 The value of Domestic Water
To ascertain the value of water for domestic consumption, this paper will apply the Willingness
to Pay method (WTP), a form of Contingent Valuation. Contingent valuation is a method that
uses survey questions to investigate peoples' Willingness to Pay for non-market goods and
services by creating a hypothetical market and a means of payment. Contingent valuation
studies have become more and more acceptable as a useful tool to estimate Willingness to Pay
for desirable quality of water (Tietenberg & Lewis, 2018).
According to the National Research Council (2005), market prices can be used to observe the
value of ecosystem goods and services are directly traded on markets. In such cases, market
prices are usually the best estimate of the willingness to pay (WTP) as they reflect decision-
making reality i.e. costs of production and other key variables are taken into consideration in
determining the price of a market traded commodity or service (International Institute for
Sustainable Development, 2007).
- 25 -
To highlight the value of water for domestic use, this study uses secondary information from
previous studies and market values (which as indicated above reveal WTP), as prescribe by
Lukanga Water and Sewerage Company (LgWSC), the sole utility company in the Central
province of Zambia, which includes the urban segment of Lunsemfwa catchment area.
Estimates for the willingness to pay were also draw from a study done by in Gebremeskel et al
(2017) Makululu compound of Kabwe. The study was aimed at understanding the factors that
determine the willingness to pay for pipe water (from the utility company) connection in low
income peri-urban settlements in Zambia. The willingness to pay for access to water was
derived from a study done by Gebremeskel et al (2017) using a functional form;
𝑊𝑇𝑃𝑖(𝑧𝑖, 𝑢𝑖) = 𝑧𝑖β + 𝑢𝑖
Where; 𝑧𝑖 , is a vector of explanatory variables, β vector of parameters to be estimated and 𝑢𝑖 is
the error term.
This study compounded the results generated by Gebremeskel et al (2017), in order to estimate the
current value of the willingness to pay for access to water services. The study used the standard
compounding formula which takes the general form;
𝑆 = 𝑃𝑒𝑟𝑡 100⁄
Where;
S is the future value, P is the principle, compounded continuously for t years at an annual rate of r %.
3.4 Data Sources
Data for running of SDDP algorithms was requested for and duly granted by Lunsemfwa
Hydropower company, a subsidiary of SN Power, Norway. The data collected included both
hydrological (infrastructure data) and economic, as per model requirements (Dead storage
(capacity), Dam Location, Full Supply Volume, Installed capacity, Maximum Release,
Minimum Release for environmental flows, System topology, Energy price (monthly,
(US$/MWh), Drainage area, Spillage capacity, Maximum storage for flood control and Head
– Lake Area Storage relation). Since the SDDP model is a multiple reservoir model, data was
collected for Mita hills and Mulungushi Hydropower plants, both falling within the Lunsemfwa
catchment under SN Power. This study will used economic data from the central statistical
office and energy production data from hydro-electric dam operators (as indicated above), to
derive the value of water per unit of electricity produced.

- 26 -
To run the Translog production function model, cross section data was compiled from different
sources. Data on crop yield was extracted from the Ministry of Agriculture database upon
request, which also included data on fertilizer use. Data on labor and capital requirements per
hectare of wheat where estimated as per indicated on FAO’s website. Water use data was
extracted from a study done by Tshenyego, Mulonda, & Simate (2019) to estimate dry season
irrigation in the Lunsemfwa region. Time series data from 1980 to 2018 on yield and quantities
produced for all major crops grown in Zambia was collected from the Ministry of Agriculture.
For the relevance of the research, only the major corps were assessed and included in this
research, including maize, wheat, sorghum, sunflower, soya beans, beans and Irish potatoes.
To measure the marginal value of water in agriculture production, only wheat was used i.e.
marginal productivity of water in wheat farming. This is because irrigation information was
only available for wheat farms.
Data on water consumption by sector was provided by the National Water Supply and
Sanitation Council (NWASCO). The data also included estimates on water produced per year
by the utility company in the Central province (which includes Lunsemfwa), as well as
production cost estimates. Information on the source of water was also provided by the report.
More data was provided by Lukganga water and sewerage company, which included mean
values for water produced in the Lunsemfwa (and sources – ground or surface) as well as costs
associated with the production of the same. Other secondary sources of data included the
African Development Fund (2006) which had information on investments that have been made
in the Central province water supply and sanitation sector.
3.5 Study Limitations
Several challenges were encountered during this study. The biggest cause of some of the major
obstacles was the spread of the Corona Virus (COVID-19) which resulted in travel bans around
the world, thereby limiting my ability to travel to the study area for data collection. One variable
in particular was the calculation of the willingness to pay, which required survey questionnaires
be issued to respondents in the river basin area. To navigate this problem, I had to use secondary
data, which included market prices and previous studies in the catchment area to reveal people’s
willingness to pay for domestic water.

- 27 -
Most of the data used in this study could only be sources from government institutions, which
required letter of requests be sent to Directors of various line ministries, who were not in the
offices. Some required datasets could not be obtained as a result, prompting major changes to
study objectives/focus.
Obtaining data on some key variables was a challenge in this study. One example is data for
water use in wheat production. The best data for this variable could only be sources from a
study conducted for a period of five years (2013 to 2018). This limited my choice of model to
use in estimating the marginal productivity of water (Production function estimation). Most
production function estimation (PRODEST) models do not run when data is incomplete or
below a certain number of variables, which was exactly the case when estimating the marginal
productivity. This limitation can be noticed from the production function estimation results
where only 12 observations where included.
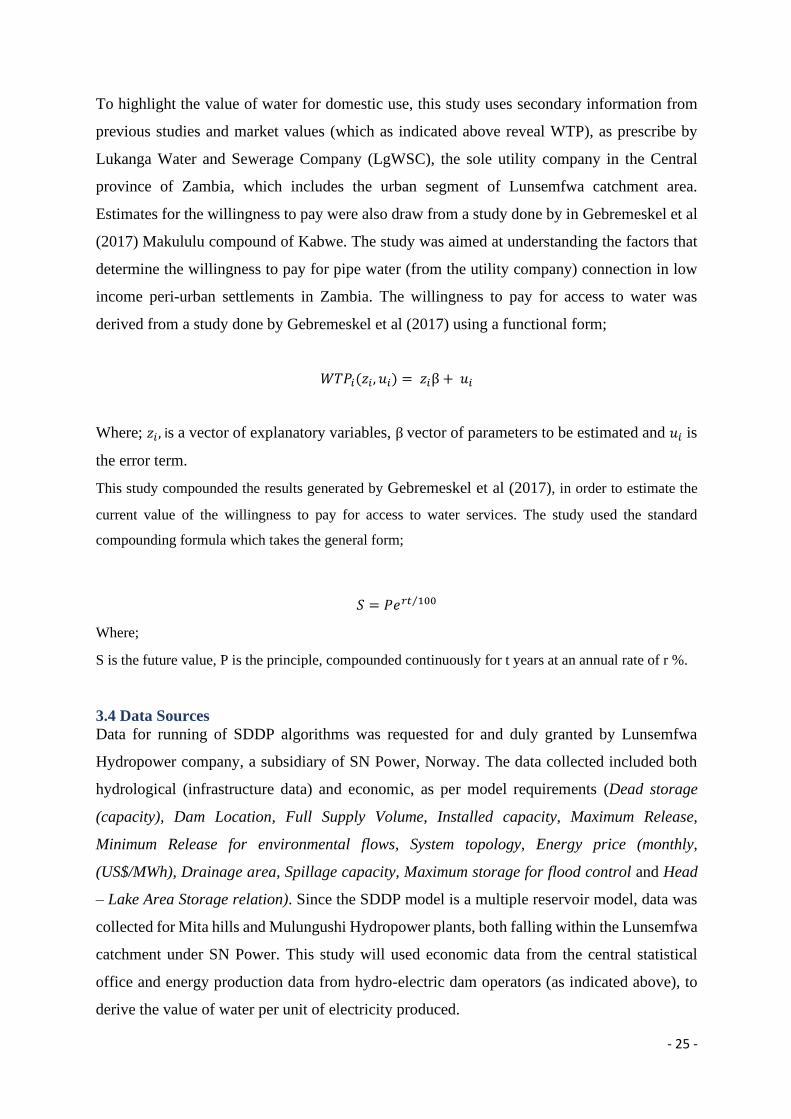
CHAPTER FOUR: STUDY RESULTS The major findings and discussion or the results of the study are presented in this chapter. The
results are linked to the objectives and research questions of the study which are presented in
chapter one. Two main sections are presented in this chapter. The first section discusses the
economic value of the three sectors being considered for valuation (hydropower, agriculture
and domestic water use). Some tables are presented to highlight the magnitude of the
aforementioned sectors, before presenting the economic values in each case. The second section
presets estimates of the Gross Financial Revenue (GFR) being generated from these sectors,
which essentially is a contribution to the country’s Gross Domestic Product (GDP).
4.1 Description of Value
4.1.1 Water & Hydropower
Lunsemfwa catchment generates approximately 56MW of energy, which amounts to roughly
to a total proportion of 2.58% of the national hydropower production, the third largest by region
from the Zambezi main and Kafue systems, as can be seen from figure 3 below. The power
stations are operated by Lunsemfwa Hydro Power Company Limited LHPC, a subsidiary of
Agua Imara, an SN Power Group company. The company operates Mulungushi (32 MW) and
Lunsemfwa (24 MW) power plants in Central Province.
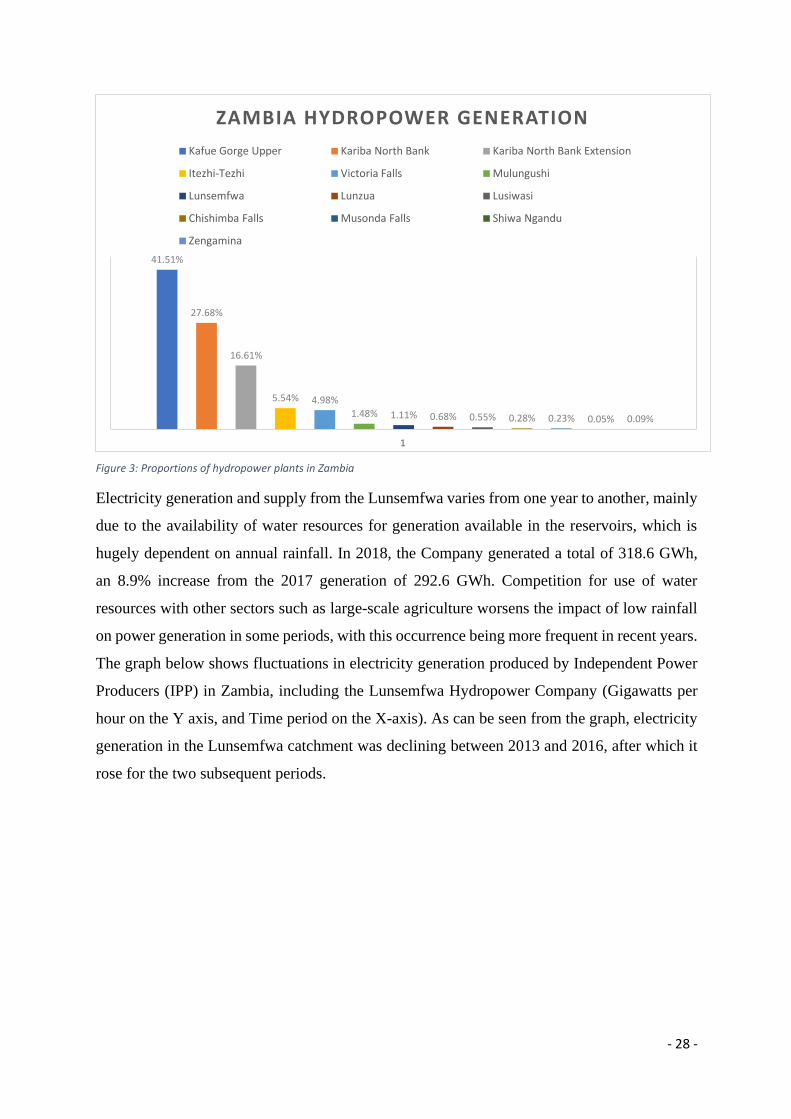
- 28 -
Figure 3: Proportions of hydropower plants in Zambia
Electricity generation and supply from the Lunsemfwa varies from one year to another, mainly
due to the availability of water resources for generation available in the reservoirs, which is
hugely dependent on annual rainfall. In 2018, the Company generated a total of 318.6 GWh,
an 8.9% increase from the 2017 generation of 292.6 GWh. Competition for use of water
resources with other sectors such as large-scale agriculture worsens the impact of low rainfall
on power generation in some periods, with this occurrence being more frequent in recent years.
The graph below shows fluctuations in electricity generation produced by Independent Power
Producers (IPP) in Zambia, including the Lunsemfwa Hydropower Company (Gigawatts per
hour on the Y axis, and Time period on the X-axis). As can be seen from the graph, electricity
generation in the Lunsemfwa catchment was declining between 2013 and 2016, after which it
rose for the two subsequent periods.
41.51%
27.68%
16.61%
5.54% 4.98%
1.48% 1.11% 0.68% 0.55% 0.28% 0.23% 0.05% 0.09%
1
ZAMBIA HYDROPOWER GENERATION
Kafue Gorge Upper Kariba North Bank Kariba North Bank Extension
Itezhi-Tezhi Victoria Falls Mulungushi
Lunsemfwa Lunzua Lusiwasi
Chishimba Falls Musonda Falls Shiwa Ngandu
Zengamina
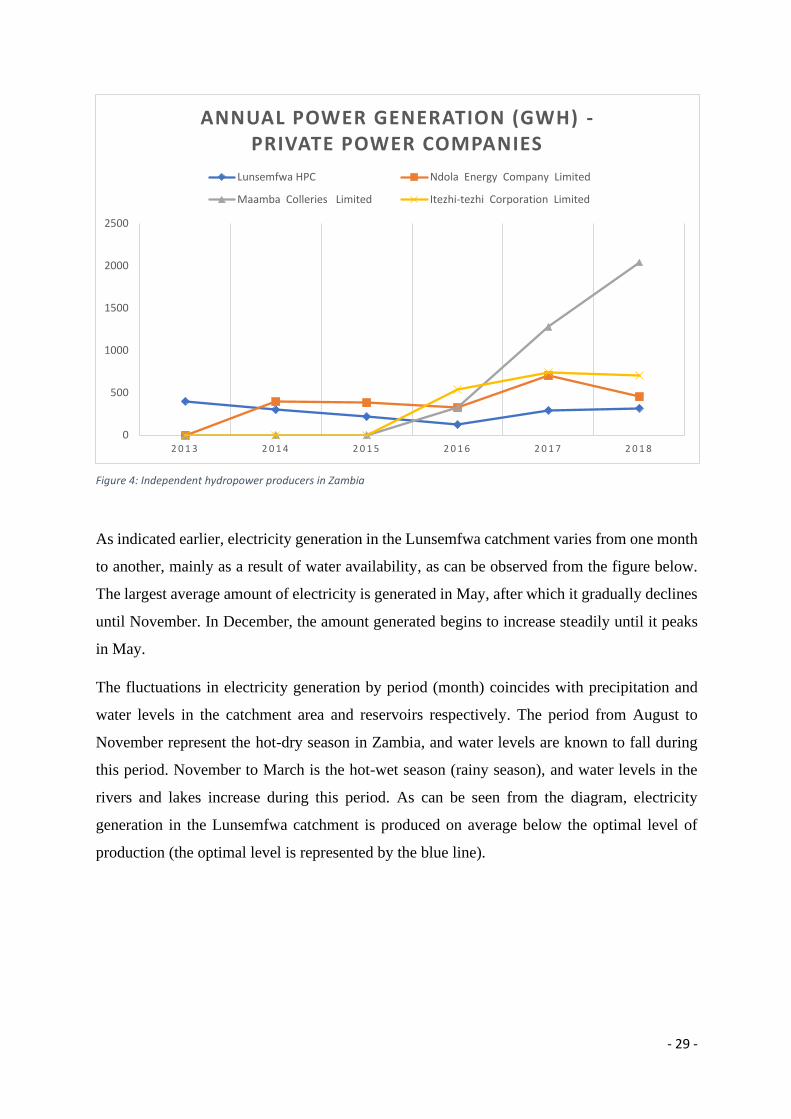
- 29 -
Figure 4: Independent hydropower producers in Zambia
As indicated earlier, electricity generation in the Lunsemfwa catchment varies from one month
to another, mainly as a result of water availability, as can be observed from the figure below.
The largest average amount of electricity is generated in May, after which it gradually declines
until November. In December, the amount generated begins to increase steadily until it peaks
in May.
The fluctuations in electricity generation by period (month) coincides with precipitation and
water levels in the catchment area and reservoirs respectively. The period from August to
November represent the hot-dry season in Zambia, and water levels are known to fall during
this period. November to March is the hot-wet season (rainy season), and water levels in the
rivers and lakes increase during this period. As can be seen from the diagram, electricity
generation in the Lunsemfwa catchment is produced on average below the optimal level of
production (the optimal level is represented by the blue line).
2 0 1 3 2 0 1 4 2 0 1 5 2 0 1 6 2 0 1 7 2 0 1 8
0
500
1000
1500
2000
2500
ANNUAL POWER GENERATION (GWH) -PRIVATE POWER COMPANIES
Lunsemfwa HPC Ndola Energy Company Limited
Maamba Colleries Limited Itezhi-tezhi Corporation Limited
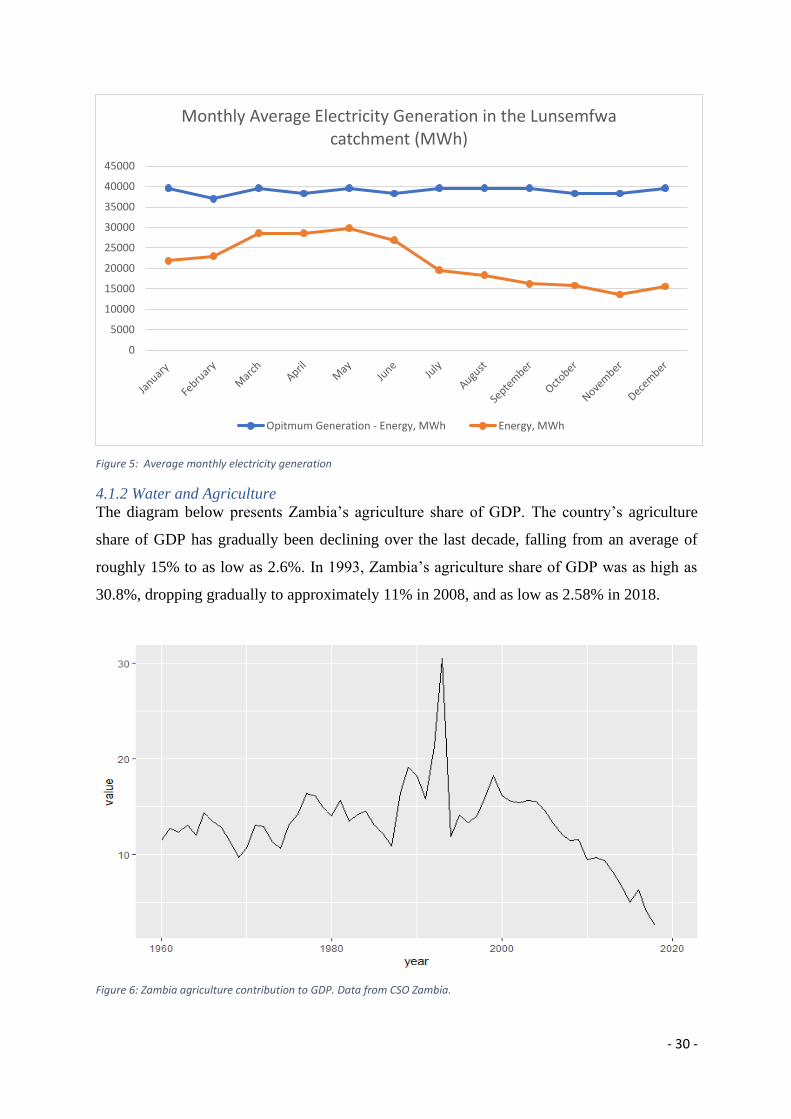
- 30 -
Figure 5: Average monthly electricity generation
4.1.2 Water and Agriculture
The diagram below presents Zambia’s agriculture share of GDP. The country’s agriculture
share of GDP has gradually been declining over the last decade, falling from an average of
roughly 15% to as low as 2.6%. In 1993, Zambia’s agriculture share of GDP was as high as
30.8%, dropping gradually to approximately 11% in 2008, and as low as 2.58% in 2018.
Figure 6: Zambia agriculture contribution to GDP. Data from CSO Zambia.
0
5000
10000
15000
20000
25000
30000
35000
40000
45000
Monthly Average Electricity Generation in the Lunsemfwa catchment (MWh)
Opitmum Generation - Energy, MWh Energy, MWh
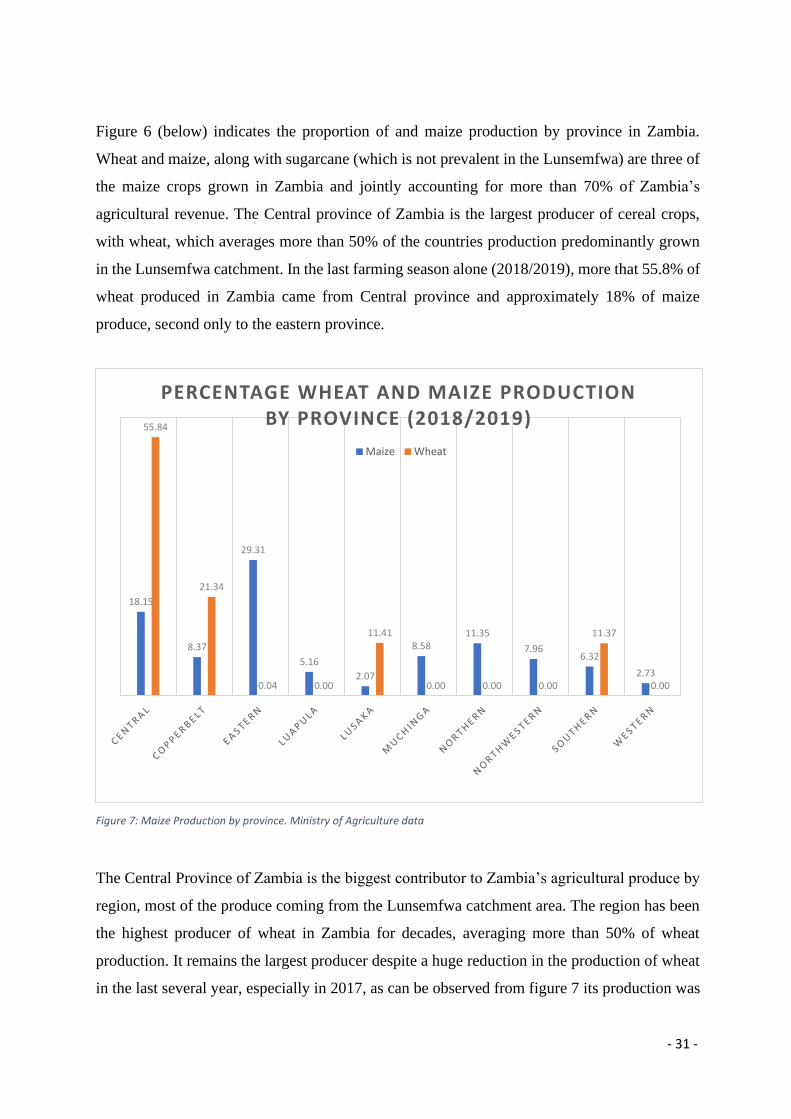
- 31 -
Figure 6 (below) indicates the proportion of and maize production by province in Zambia.
Wheat and maize, along with sugarcane (which is not prevalent in the Lunsemfwa) are three of
the maize crops grown in Zambia and jointly accounting for more than 70% of Zambia’s
agricultural revenue. The Central province of Zambia is the largest producer of cereal crops,
with wheat, which averages more than 50% of the countries production predominantly grown
in the Lunsemfwa catchment. In the last farming season alone (2018/2019), more that 55.8% of
wheat produced in Zambia came from Central province and approximately 18% of maize
produce, second only to the eastern province.
Figure 7: Maize Production by province. Ministry of Agriculture data
The Central Province of Zambia is the biggest contributor to Zambia’s agricultural produce by
region, most of the produce coming from the Lunsemfwa catchment area. The region has been
the highest producer of wheat in Zambia for decades, averaging more than 50% of wheat
production. It remains the largest producer despite a huge reduction in the production of wheat
in the last several year, especially in 2017, as can be observed from figure 7 its production was
18.15
8.37
29.31
5.16
2.07
8.5811.35
7.966.32
2.73
55.84
21.34
0.04 0.00
11.41
0.00 0.00 0.00
11.37
0.00
PERCENTAGE WHEAT AND MAIZE PRODUCTION BY PROVINCE (2018/2019)
Maize Wheat
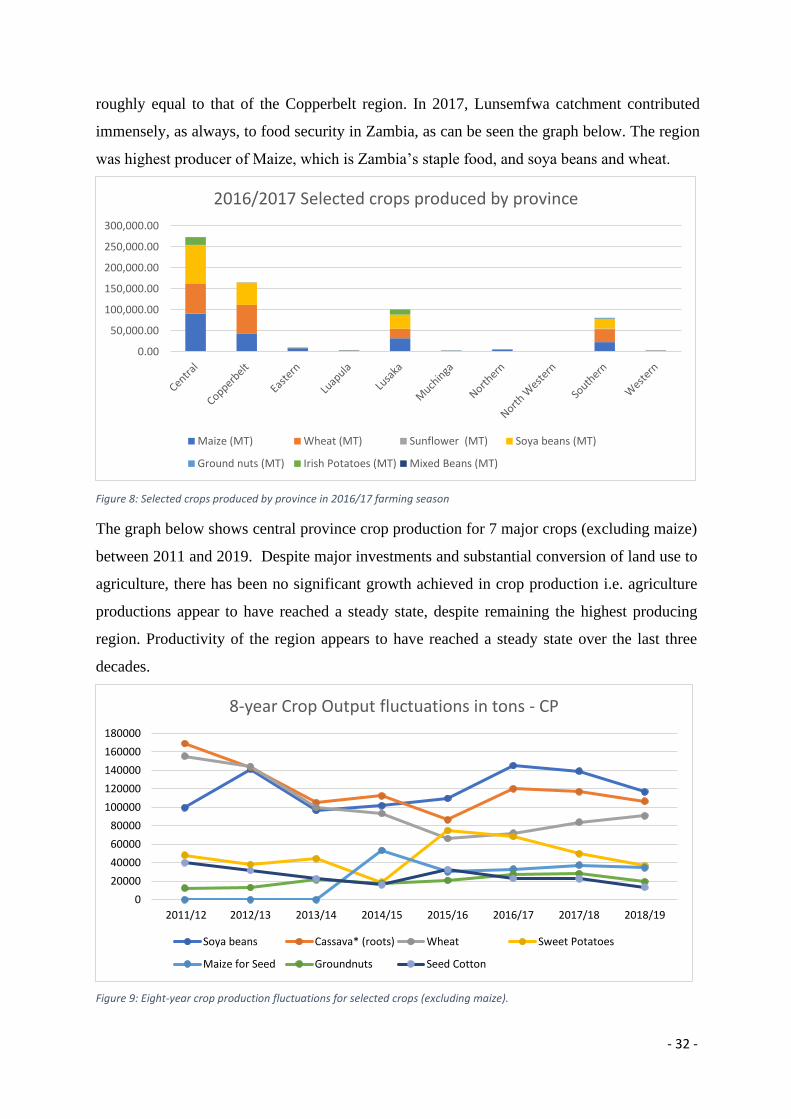
- 32 -
roughly equal to that of the Copperbelt region. In 2017, Lunsemfwa catchment contributed
immensely, as always, to food security in Zambia, as can be seen the graph below. The region
was highest producer of Maize, which is Zambia’s staple food, and soya beans and wheat.
Figure 8: Selected crops produced by province in 2016/17 farming season
The graph below shows central province crop production for 7 major crops (excluding maize)
between 2011 and 2019. Despite major investments and substantial conversion of land use to
agriculture, there has been no significant growth achieved in crop production i.e. agriculture
productions appear to have reached a steady state, despite remaining the highest producing
region. Productivity of the region appears to have reached a steady state over the last three
decades.
Figure 9: Eight-year crop production fluctuations for selected crops (excluding maize).
0.00
50,000.00
100,000.00
150,000.00
200,000.00
250,000.00
300,000.00
2016/2017 Selected crops produced by province
Maize (MT) Wheat (MT) Sunflower (MT) Soya beans (MT)
Ground nuts (MT) Irish Potatoes (MT) Mixed Beans (MT)
2011/12 2012/13 2013/14 2014/15 2015/16 2016/17 2017/18 2018/19
0
20000
40000
60000
80000
100000
120000
140000
160000
180000
8-year Crop Output fluctuations in tons - CP
Soya beans Cassava* (roots) Wheat Sweet Potatoes
Maize for Seed Groundnuts Seed Cotton

- 33 -
4.1.3 Domestic use
Compared to other regions in the country, consumers in the Lunsemfwa catchment are highly
dependent on surface water sources for domestic needs. Due to high costs of water production,
coupled with other variables such us low income levels, many communities in Zambia,
including Lunsemfwa do not have access to water from utility companies. In Lunsemfwa
catchment area, approximately 12,600 households only, are connected to piped water. The
provincial capital, Kabwe accounts for more than 50% of the connections. The district
consumes water from both surface and underground sources, with the Mulungushi Dam
contributing 30% of total water use. Kapiri-Mposhi is 100% supplied with surface water
generated from Lunchu and Mushimbili Dam. Like Kapiri-Mposhi, Mkushi, the agriculture
hotspot predominantly consumes surface water, with the Chibefwe River providing 100% of
the water supplied by the utility. Serenje consumes water from both surface and underground
sources, with Ibolelo river contributing approximately 70% of the water supplied by LgWSC.
In 2019, Lukanga water and sewerage company produced roughly 13.4 million m3 of water, a
6% decline from the 2018 production. Approximately 36% was from surface water sources and
the rest (Roughly 64%) from ground water sources. More than 90% of the water produced by
LgWSC was withdrawn from the Lunsemfwa catchment area, with surface water accounting
for nearly 37%, and ground water providing the remaining 6% (NWASCO, 2018).
Lukanga Water and Sewerage Company, which supplies the Central province, including the
Lunsemfwa catchment is among some of the utility companies losing more than half of the
water they produce, specifically more that 51% of the water produced is non-revenue water.
According to the (OECD, 2012), these challenges are due to infrastructure funding to the sector
has been a major concern despite the sector policies in place to facilitate infrastructure
development. They further postulate that the legal and institutional frameworks are weak or
inadequate and do not encourage private investment, especially as the Government, which is
the single largest consumer of water and sanitation services, can default in settling bills at will
4.2 Average and Marginal Economic values
4.2.1 The value of water in hydropower production
In valuing water for hydropower, a value is normally assigned to to the energy (MWh) produced
by the hydropower plants. In this case, a value of US$93/MWh is attached to the energy
generated from the Lunsemfwa catchment area. Furthermore, the Stochastic Dual Dynamic
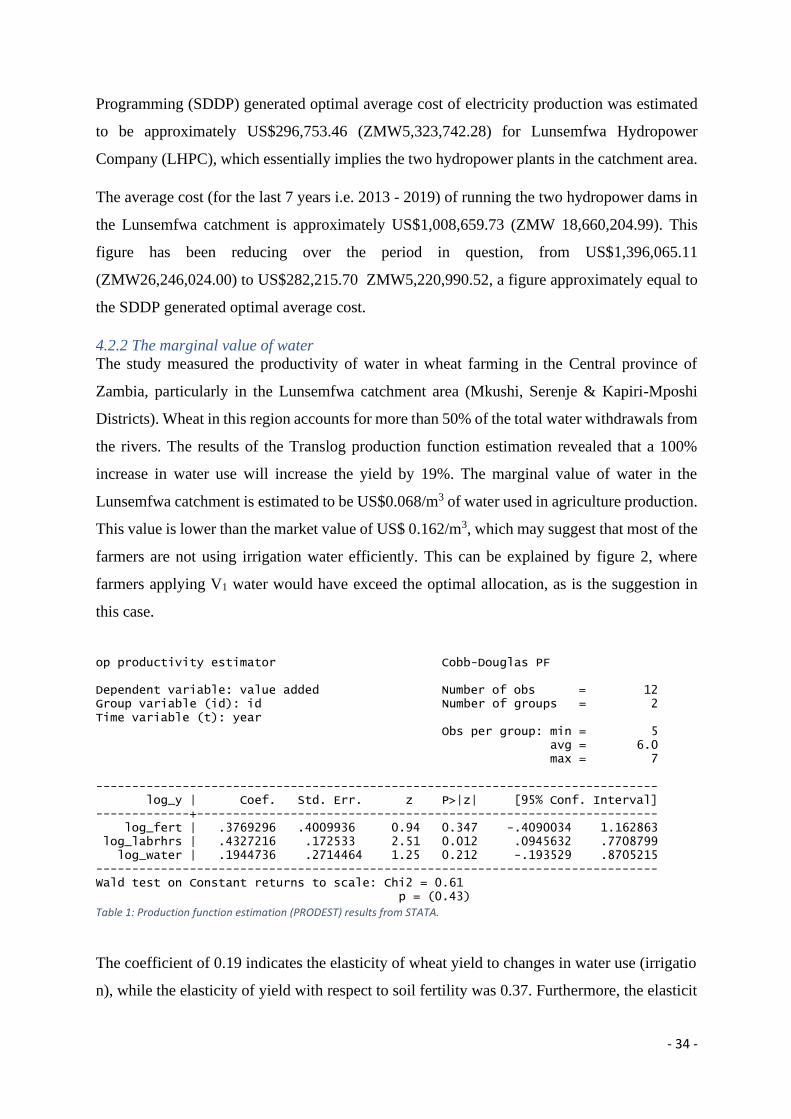
- 34 -
Programming (SDDP) generated optimal average cost of electricity production was estimated
to be approximately US$296,753.46 (ZMW5,323,742.28) for Lunsemfwa Hydropower
Company (LHPC), which essentially implies the two hydropower plants in the catchment area.
The average cost (for the last 7 years i.e. 2013 - 2019) of running the two hydropower dams in
the Lunsemfwa catchment is approximately US$1,008,659.73 (ZMW 18,660,204.99). This
figure has been reducing over the period in question, from US$1,396,065.11
(ZMW26,246,024.00) to US$282,215.70 ZMW5,220,990.52, a figure approximately equal to
the SDDP generated optimal average cost.
4.2.2 The marginal value of water
The study measured the productivity of water in wheat farming in the Central province of
Zambia, particularly in the Lunsemfwa catchment area (Mkushi, Serenje & Kapiri-Mposhi
Districts). Wheat in this region accounts for more than 50% of the total water withdrawals from
the rivers. The results of the Translog production function estimation revealed that a 100%
increase in water use will increase the yield by 19%. The marginal value of water in the
Lunsemfwa catchment is estimated to be US$0.068/m3 of water used in agriculture production.
This value is lower than the market value of US$ 0.162/m3, which may suggest that most of the
farmers are not using irrigation water efficiently. This can be explained by figure 2, where
farmers applying V1 water would have exceed the optimal allocation, as is the suggestion in
this case.
op productivity estimator Cobb-Douglas PF Dependent variable: value added Number of obs = 12 Group variable (id): id Number of groups = 2 Time variable (t): year Obs per group: min = 5 avg = 6.0 max = 7 ------------------------------------------------------------------------------ log_y | Coef. Std. Err. z P>|z| [95% Conf. Interval] -------------+---------------------------------------------------------------- log_fert | .3769296 .4009936 0.94 0.347 -.4090034 1.162863 log_labrhrs | .4327216 .172533 2.51 0.012 .0945632 .7708799 log_water | .1944736 .2714464 1.25 0.212 -.193529 .8705215 ------------------------------------------------------------------------------ Wald test on Constant returns to scale: Chi2 = 0.61 p = (0.43) Table 1: Production function estimation (PRODEST) results from STATA.
The coefficient of 0.19 indicates the elasticity of wheat yield to changes in water use (irrigatio
n), while the elasticity of yield with respect to soil fertility was 0.37. Furthermore, the elasticit
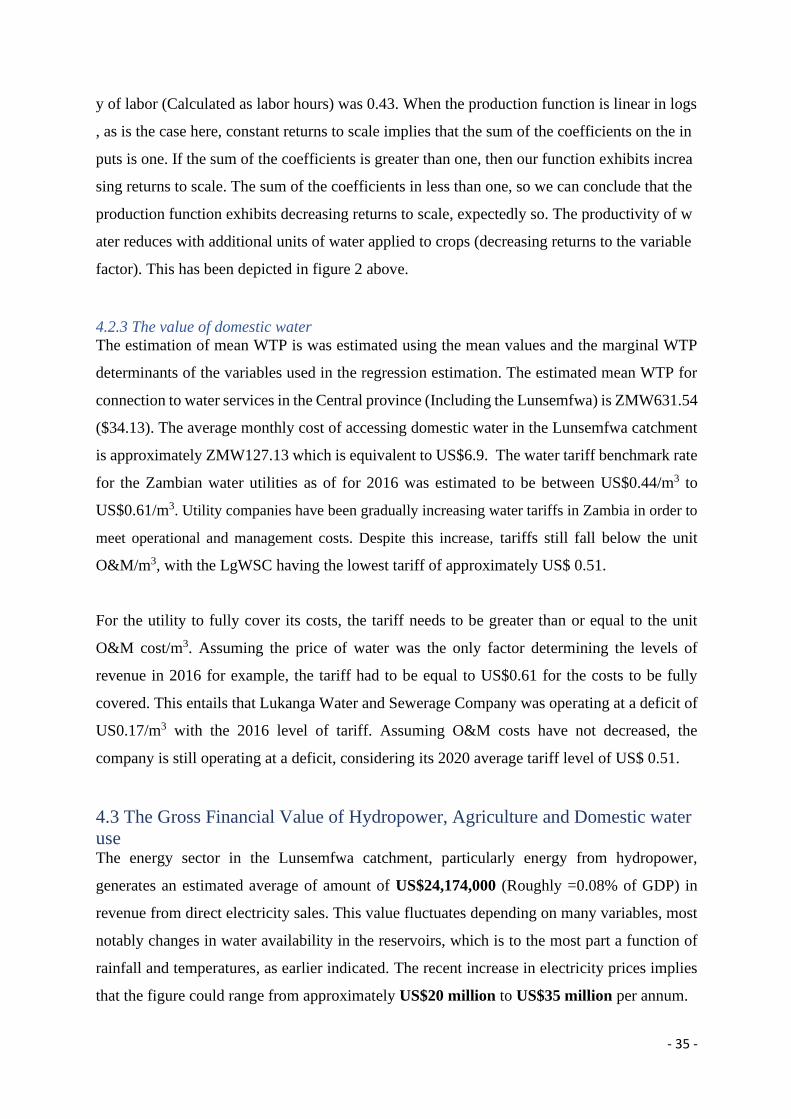
- 35 -
y of labor (Calculated as labor hours) was 0.43. When the production function is linear in logs
, as is the case here, constant returns to scale implies that the sum of the coefficients on the in
puts is one. If the sum of the coefficients is greater than one, then our function exhibits increa
sing returns to scale. The sum of the coefficients in less than one, so we can conclude that the
production function exhibits decreasing returns to scale, expectedly so. The productivity of w
ater reduces with additional units of water applied to crops (decreasing returns to the variable
factor). This has been depicted in figure 2 above.
4.2.3 The value of domestic water
The estimation of mean WTP is was estimated using the mean values and the marginal WTP
determinants of the variables used in the regression estimation. The estimated mean WTP for
connection to water services in the Central province (Including the Lunsemfwa) is ZMW631.54
($34.13). The average monthly cost of accessing domestic water in the Lunsemfwa catchment
is approximately ZMW127.13 which is equivalent to US$6.9. The water tariff benchmark rate
for the Zambian water utilities as of for 2016 was estimated to be between US$0.44/m3 to
US$0.61/m3. Utility companies have been gradually increasing water tariffs in Zambia in order to
meet operational and management costs. Despite this increase, tariffs still fall below the unit
O&M/m3, with the LgWSC having the lowest tariff of approximately US$ 0.51.
For the utility to fully cover its costs, the tariff needs to be greater than or equal to the unit
O&M cost/m3. Assuming the price of water was the only factor determining the levels of
revenue in 2016 for example, the tariff had to be equal to US$0.61 for the costs to be fully
covered. This entails that Lukanga Water and Sewerage Company was operating at a deficit of
US0.17/m3 with the 2016 level of tariff. Assuming O&M costs have not decreased, the
company is still operating at a deficit, considering its 2020 average tariff level of US$ 0.51.
4.3 The Gross Financial Value of Hydropower, Agriculture and Domestic water
use The energy sector in the Lunsemfwa catchment, particularly energy from hydropower,
generates an estimated average of amount of US$24,174,000 (Roughly =0.08% of GDP) in
revenue from direct electricity sales. This value fluctuates depending on many variables, most
notably changes in water availability in the reservoirs, which is to the most part a function of
rainfall and temperatures, as earlier indicated. The recent increase in electricity prices implies
that the figure could range from approximately US$20 million to US$35 million per annum.

- 36 -
Plant Name
Installed capacity (MW)
Commis-sion (year)
Average annual generation (GW)
Surface area when full (km3)
Cost of elec-tricity (per /kWh)
Gross Financial Revenue
Mulun-gushi 24 1955 149 31 0.06
8940000
Lun-semfwa 32 1944 253.9 45 0.06
15234000
Total $24,174,000.00
Table 2: Average electricity generation and estimates of revenue generated in Lunsemfwa
Agriculture production in the central province generates an average amount of more than US$
262,083,045.91 (Nearly 1% of GDP) in revenue for the farmers. Mazie production accounts for
roughly 43% of this revenue, contributing an amount of approximately $ 112,049,981.5 in
revenue for the farmers. (Implications of elasticity on output and revenue).
Figure 10: Revenue generated by sector in Lunsemfwa
Lukanga Water and Sewerage Company (LgWSC) produces approximately 14 million m3 of
water, which could generate approximately $7,140,000.00 (Approximately 0.03% of the
country’s GDP) at the market price of US$0.51/m3, assuming no exchange rate gains or losses.
The company has on average been losing more than US$ 1,244,771.22 due to non-revenue
water, and this figure could vary widely from one year to another, exceeding 50% of potential
revenues in some periods. At the end of 2018, the cost or production stood at approximately at
approximately US$270,000, a 10% increase from the previous year.
Hydropower 8%
Agriculture 89%
Domestic Use3%
Revenue Generated from the 3 Sectors
Hydropower Agriculture Domestic Use
- 37 -
CHAPTER FIVE: DISCUSSION Lunsemfwa catchment area houses two hydropower plants, which are operated by Lunsemfwa
Hydropower Company (LHPC). LHPC is the only private power generating company
connected to the Southern African Power Pool (SAPP) in Zambia, which provides the company
with a possibility of exporting power at higher prices than those obtaining in Zambia. However,
the company currently has a 15-year power supply agreement with the Zambia Electricity
Supply Company (ZESCO) which was signed in 2015. The means that all the electricity
generated from the catchment area is consumed within Zambia (Energy Regulation Board,
2017).
The operations of LHPC were severely affected by drought for three consecutive years between
2014 and 2016, which substantially lowered water levels to unprecedented amounts (SN Power,
2016). In 2014, Lunsemfwa Hydro Power Company (LHPC) announced that it had stopped
electricity generation at Mita Hills dam due to a drop-in water level. The drought affected both
reservoirs, impacting annual production for subsequent periods (Ventures Africa, 2014).
Figure 5 shows variations in monthly electricity generation in the Lunsemfwa catchment. As
can be seen from the diagram, electricity generation declines substantially in the hot dry season,
and begins to increase in the first month of the rainy season (wet hot season). These monthly
fluctuations vary from one year to another, as can be noticed from figure 3 where electricity
generation declined from 2013 to 2016 for all power producers. During that period, electricity
generation at LHPC’s hydro-power station had dropped to below 20 megawatts (MW) from
56MW. This creating a loss of Nine Million United States dollars (US$ 9 million) (Ventures
Africa, 2014).
A value of US$93/MWh is attached to the energy generated from the Lunsemfwa catchment
area. This value reflects the recent increase in power generated in Zambia. The optimal average
cost of electricity production was estimated to be approximately US$296,753.46 for the LHPC
using Stochastic Dual Dynamic Programming (SDDP). The difference between this figure and
the varied levels of revenue generated from one year to another reflect the marginal importance
of water, which biggest asset in hydropower production. Consequently, the gross total revenue
generated from hydropower in the catchment area in the last five years averages an approximate
amount of US$24,174,000. The value is expected to rise and vary between US$20 million to
US$35 million per annum following the hike in electricity prices. This makes the energy sector
the second most lucrative after agriculture in the Lunsemfwa and indeed the Central Province
following the closure of the Mines.

- 38 -
The value of electricity highlighted in this study can be compared to a study by Tilmant et al
(2012) which estimated the economic valuation of benefits from hydropower on the Zambezi
to be between US$40/MWh and US$60/MWh. This is implying that the cost of electricity has
nearly doubled in the last 7 years. As expected, this increase in the cost of electricity has been
influenced by demand and supply side factors. The demand for electricity in Zambia has been
increasing at approximately 5% per annum, but has not been met with the same level of increase
in electricity generation (Zambia Development Agency (ZDA), 2014). One factor affecting the
supply of electricity in the Zambezi is water availability, as has been explained above.
With more dams planned in the upper part of the Lunsemfwa catchment area, water flow to the
two existing hydropower reservoirs could potentially be greatly affected, thereby reducing the
amount of electricity, as well as revenues from hydropower generated from the Lunsemfwa
catchment area (WWF, 2016).
Kling, Fuchs, & Stanzel (2015) undertook a study to investigate the future of hydropower
production in the Zambezi given IPCC climate projections. The report indicates that for the
near future (2021-2050), annual discharge could decrease by about 25 per cent for the Upper
Zambezi and the Kafue rivers, whereas for the Luangwa, which includes Lunsemfwa, the
decrease is smaller than 10 per cent, which is equally significant. Kling, Fuchs, & Stanzel
(2015) further recommend that hydro plant design (installed capacity, reservoir size, and so on)
as well as operating rules, should be adapted to reflect future inflow conditions better, thus
fostering climate resilience of the projects. To ensure stewardship among different users across
the basin, an efficient pricing system will have to be established by regulators, which can be
greatly aided by a continued understanding of the value of water to different sectors in the
catchment area.
According to the Zambia Statistics Agency (2015), the agriculture sector accounts for more
than 78% of the employment in the Central province. The province is composed of more than
290,000 households, with the average household income level of ZMW1,530.80 (US$82.75).
More than 67% of the population earn less than ZMW1000 (US$ 54.05).
Zambia’s agriculture share of GDP has gradually been reducing in the last decade. In 1993,
country’s agriculture share of GDP was as high as 30.8%, dropping gradually to approximately
11% in 2008, and as low as 2.58% in 2018. Various agricultural reforms have been
implemented in Zambia to boost the agriculture sector, most notably in President Levy

- 39 -
Mwanawasa’s tenure as head the state (2001 – 2008), which were continued by his successor.
Despite all these changes, there has been no real growth in the agricultural sector, partly due to
water scarcity. As can be seen from figure 6, we can deduce that the agriculture sector in
Zambia has been on the decline or has not seen any meaningful growth relative to other sectors
(Zambia Statistics Agency (Central Statistical Office), 2015 ).
The marginal value of water for agriculture in the Lunsemfwa catchment is estimated to be
US$0.068/m3. This value is lower than the market value of US$ 0.162/m3, which may suggest
that most of the farmers are not using irrigation water efficiently. This can be explained by
figure 2, where farmers applying V1 water would have exceed the optimal allocation, as is the
suggestion in this case. According to the economic theory, farmers will use water until the
marginal value of water will be equal to the market price of this factor.
Another possible explanation of reason the value presented here is also lower than the one
found in a number of studies, including those found in Mesa-Jurado, Berbel, & Orgaz, (2010)
(US$0.6–US$0.9/ m3) is because this thesis focuses on marginal uses and thus marginal
productivity, which is said to produce lower values. In addition, this study deals with mid-term
(seasonal) allocation problems, implying that only a short-run estimate of marginal water value
was considered (Using 2013 – 2017 dry season irrigation estimates). In many cases, short term
estimates tend to be lower than long-run values (Tilmant, et al., 2012). This simply implies that
the results of this study could vary with the period being studied and the length of the period.
Furthermore, the values can vary from one crop to another. It is therefore important for water
managers to analyse the marginal values for all crops and apply appropriate prices for water
permits. I this case, welfare losses due to inefficient allocation (underutilization or
overutilization) of water would largely be borne by the farmers (Frija, et al., 2014).
The estimated mean WTP for domestic water in the Lunsemfwa is approximately ZMW631.54
($34.13). This amount is consistent with the levels of income in the region, where 67% earn
under ZMW1000. This estimate of the mean WTP for the pipe water connection can further
be used to estimate the total benefits in the specific locality. The willingness to pay for water
is affected by many factors, with two main variables being significant in the study; education
and income (Gebremeskel, Mulenga, Nyambe, & Simuchimba, 2017). Education enlightens
people about the importance of clean water while income provides the households with ability
to pay for the the clean water.
- 40 -
In Zambia, water is treated both as an economic good, and a social good, and this highly
influences the value of water for domestic users, as is the case in many other places. To
understand the characteristics and treatment of water by authorities and end users, it is key to
get a historical perspective of the supply for the commodity.
Prior to the mid-1990s, water supply and sanitation services in Zambia were mainly provided
directly by central government through the Ministry of Works and Supply and local authorities
(i.e. City and local Councils). The Water Supply and Sanitation Act mandates NWASCO to
regulate water and sanitation providers for efficiency, reliability and cost effectiveness of their
services (African Development Fund, 2006).
Among many other things, NWASCO is concerned with the strategies applied by service
providers in addressing the issue of non-revenue water, resulting from vandalism and poor
maintenance as this is lowering supply whilst increasing production costs. On average, utilities
lose a combined amount of 45% of total water supply, while only 65% of total costs are
recovered. Total water sector losses stand at 236% of all current revenues. These inefficiencies
are a major drawback and indeed undercut the financial resources of utilities, consequently
making efficient use of water resources impossible (NWASCO, 2018).
Water utility companies are mandated under the Water Supply and Sanitation Act to provide
water and sanitation services in their respective areas. There are mainly two types of Water
providers in Zambia, which are Commercial Utilities (Which are joint ventures with Local
Authorities) and Private Schemes (companies supplying water and sewerage services as a
fringe benefit to employees). Supply and sanitation services for urban centres has since been
fully transferred from local authorities to commercial utilities with the aim of increasing
efficiency and sustainability in operations. Rural districts are in many cases not served by
commercial utilities; in this case the government has continued to provide this service.
However, huge populations remain without access to sufficient amounts of water in the Central
province and the problem has been worsening with changes in climatic condition, mostly
resulting from draughts becoming more prominent in the Zambezi (African Development Fund,
2006).
- 41 -
According to the World Health Organization (2003), between 50 and 100 litres of water per
person per day are needed to ensure that most basic needs are met, and few health concerns
arise. However, this is a bare minimum and poses health. In the Central province,
approximately 42% of population serviced by household connections, while 58.7% of
population serviced by public stand posts & Kiosks. Despite a fairly large amount of the
population having access to water from the utility companies, only 37 litres on average is
provided daily in Central province, falling below the prescribed WHO requirements
(NWASCO, 2018).
There has been a growing imbalance between investments in the development and management
of water resources in urban areas, compared to the rural areas, largely because urban areas have
larger numbers of private consumers that are able to pay for the services. By contrast,
connection to water utilities in rural areas are dominated by public institutions, and the
economic returns of expanding supply infrastructure into these areas are generally negative
(OECD, 2012). This is the case for the Lunsemfwa catchment area which is mainly composed
of rural/poor households, where more than 67% earn less than ZMW 1000 (US$ 55).
The differences in income levels, coupled with regional water shortages, among other variables
(highlighted by the low willingness to pay for connection to piped water by poor communities)
in the Lunsemfwa catchment hint at the possibility or the need for different values of water for
different regions. This will not only forester efficient use of water resources, but at the same
time striking a balance between equity and equality in the access to water resources between
different consumers. It will also allow minimization of NRW resulting from leakages, as well
as allow appropriate investments in ensuring universal access to water. Furthermore, efficient
use of water will allow more optimal allocation to other important users of water, especially
surface water.
CHAPTER SIX: CONCLUSION AND RECOMMENDATIONS Optimal allocation of water resources requires well informed dynamic policies in order to
respond to changes in demand for water, as well as waster availability which could be impacted
by many factors, most notably climate variability. An important river system like the
Lunsemfwa catchment requires dynamism in the allocation of water resources. Under such a
scenario, water should also be regarded as a dynamic asset. If water were considered as a

- 42 -
dynamic asset, it would be allocated to maximize its productivity and use; this would also
correspond to an economically efficient allocation mechanism. Although economic efficiency
is not the single criterion to be considered when designing allocation mechanisms
The earlier alluded to dynamic efficiency in water allocation entails maximizing the present
value coming from water resource use. In hydropower production, this entails optimising the
existing hydropower dams. The volume of water flow maintained in our river systems, includ-
ing the Lunsemfwa catchment is highly dependent on anthropogenic factors, as opposed to
other renewable sources such as solar energy, where the flow is independent of human activi-
ties. A balance then must be established between current and subsequent use of the resource.
Optimization of water use implies maximization of the value of water. Optimal pricing of water
as an asset (asset valuation of water) in hydropower production is crucial for water allocation
in the Lunsemfwa catchment. There is need for decision makers to observe the changes in water
accounts, and water values in hydropower production in order to attain efficiency in allocation
of resources.
As highlighted in the description of value section, the contribution of the Lunsemfwa catchment
to food security in Zambia can never be overstated. Understanding the marginal value of water
in agriculture production is critical, as it gives us insights into the impacts of water allocation
decisions on the agricultural sector. Reduction in allocation of water resources for agriculture
can give can lead to reduction in agricultural productivity, which can be observed by analyzing
the marginal values of water in agricultural production, as has been done in this paper.
Therefore, water sector decision makers ought to understand the consequences of the decisions
they make and how they affect food security.
Price efficiency in the Lunsemfwa domestic water market has the potential to reduce misuse of
water resources but also enable the responsible utility company to generate enough resources
to improve and maintain high standards in service delivery. Determining the value of water
resources for domestic supply is important for optimal pricing and enhancing responsible use
of water resources. This further enhances the capacity of the utility company to undertake
appropriate maintenance activities to reduce wastage or loss of water.
Understanding the value of freshwater ecosystem services, and efficient allocation of water
resources requires information from various bodies of knowledge. On important piece of

- 43 -
information crucial for water allocation is water accounting – so it is important for management
authorities to invest in water accounting research, which could form a backbone for many other
relevant studies. Water valuation alone cannot yield optimality in water resource allocation
decisions, but it has the potential to be very effective if coupled with an understanding of the
status and future trends in water supply, demand, accessibility and use in the Lunsemfwa.
Knowledge of the current status of water resources, the capacity and condition of water supply
infrastructure and fluctuations in water demand and use is a precondition for successful water
management.
Management measures aimed at improving the water allocation framework and information
management need to be implemented in parallel with infrastructure investments to maximize
and sustain economic returns. I am of the view that data sources can never be complete or made
readily accessible, especially when competition on water resources increases, as is exactly the
case for the Lunsemfwa catchment which is yet to fully establish the necessary water
governance structures, as well as complete hydrological data and information to allow the
relevant authorities, WARMA, to make necessary decisions. In this case, indirect observation,
especially of water related markets can aid water decision makers in making necessary
decisions to mitigate the impacts of water scarcity in the Lunsemfwa.
As the demand for water and climate variability increases, water resources in the Lunsemfwa
will become scarcer. Scarcity, as indicated in the text, creates an opportunity for introducing a
market structure, which could potentially yield efficient results in water allocation. In this
regard, there is need for authorities to be more forward looking and progressive in
implementing effective solutions for water allocation.
In order to investigate if farmers are using water efficiently, more data on water use for
respective farmer clusters will have to be collected. The marginal value of water can be
calculated for the respective clusters in order to understand what value is attached to water by
the respective farmers. This can aid water resource regulators to attached appropriate values in
their pricing mechanisms in order to attain efficient allocations.
It is worth stating that authorities in the Lunsemfwa catchment should strive for an efficient
pricing system of water. When under pressure to raise resources, it is possible for water
authorities to over-allocate water resources in an area. In situations where the value of water is

- 44 -
low, efficient prices will incentivize water management authorities to not over allocate by
provide more resources at higher water rates. This in effect will ensure appropriate crops are
grown, as well as reduce resource misuse by farmers.
- 45 -
References Tilmant, A., Pinte, D., & Goor, Q. (2008, December 20). Assessing marginal water values in
multipurpose multireservoir systems via stochastic programming. American Geophysical Union, Advanced Earth and Space Sience, Water Resources Reserach Volume44, Issue12. Retrieved from https://doi.org/10.1029/2008WR007024
African Development Bank. (2016). Republic of Zambia - Country Profile. Lusaka: African Development Bank.
African Development Fund. (2006). NATIONAL RURAL WATER SUPPLY AND SANITATION PROGRAM APPRAISAL REPORT. Tunis: AFRICAN DEVELOPMENT FUND.
Al-Najar, H. (2011). The integration of FAO-CropWat Model and GIS Techniques for Estimating Irrigation Water Requirement and Its Application in the Gaza Strip. Gaza: Islamic University of Gaza.
Atapattu, N. K. (2002). Economic valuing of water: Part A - Principles of Valuing Water. International Water Management Institute (IMWI).
Atkinson , G., & Mourato , S. (2015). Cost-Benefit Analysis and The Environment - Environment Working Paper No.97. OECD Working Papers. Retrieved from http://www.oecd.org/officialdocuments/publicdisplaydocumentpdf/?cote=ENV/WKP(2015)18&docLanguage=En
Bastiaansen, W., & Chandrapala, L. (2003). Water balance variability across Sri Lanka for assessing agricultural and environmental water use, Agric. In Water Management (pp. 171–192).
Bockstael, N. E., Freeman, M. A., Kopp, R. J., Portney, P. R., & Smith, K. V. (2000). On Measuring Economic Values for Nature. Environmental Science Technology, 1384-1389.
Braat, C. L., & de Groot, R. (2012). The ecosystem services agenda:bridging the worlds of natural science and economics, conservation and development, and public and private policy. Wageningen, The Netherlands: Wageningen University.
Conway, D., Dalin , C., Landman, W., & Osborn, T. (2017). Hydropower plans in eastern and southern Africa increase risk of concurrent climate-related electricity supply disruption. Nat Energy. Retrieved from https://doi.org/10.1038/s41560-017-0037-4
Croitoru, L. D., & Xie, J. (2016). Valuing Water Resources in Turkey: A Case Study of Beysehir Lake. Journal of Environmental Protetion. pp. 1204-1922. Retrieved from http://dx.doi.org/10.4236/jep.2016.712150
Disse , M., & Viaggi , D. (2015). Water Information as a Tool to Enhance Sustainable Water Management—The Australian Experience. Canberra ACT, 2600, Australia: The Australian National University.
Energy Regulation Board. (2017). Energy Sector Report. Lusaka: ERB.
FAO. (2011). State of the world's land and water resources for food and agriculture (SOLAW).Managing systems at risk. London: FAO.
FAO. (2018). Coping with water scarcity. Water accounting: getting the water budget right. Marseille.
Forum, W. E. (2020). Global Risks Report. Insight report. Geneva, Switzerland. Retrieved March 20, 2020, from https://www.weforum.org/reports/the-global-risks-report-2020

- 46 -
Freeman, A. M. (1991). Valuing environmental resources under alternative management. Ecological Economics 3, 247-256.
Gebremeskel, Y., Mulenga, J., Nyambe, M., & Simuchimba, B. (2017). Willingness to Pay (WTP) for pipe-water connection in Makululu compound of Kabwe, Zambia. African Journal of Environmental Economics and Management ISSN 2375-0707 Vol. 5 , 341-347.
Ghezelbash, A., Murshed, M., Salari, E., & Hosseini, S. M. (2018). Determining the economic value of water using production functions and selecting the optimal model for sugar beet crop: case study of the Gharehghom and Namakzar basins in Iran. Rotterdam: Erasmus University.
Government of the Republic of Zambia, Ministry of Tourism. (2018). Zambia Tourism Master Plan, 2018 - 2038. Lusaka: GRZ.
Harpman, A. D. (2006). Exploring the Economic Value of Hydropower in the Interconnected Electricity System. Denvar: United States Department of the Interior.
Hiedanpää, u., & Bromley, D. (2014). Payments for ecosystem services: durable habits, dubious, nudges, and doubtful efficacy. Journal of Institutional Economics 10, 175-195.
Higdon, J., Sheehan, B., & Eskew, R. (2020). The Politics of Water: Egypt, the Nile River, and the GERD. esri.
Holm-Müller, A. B. (2016). The Zambian Resource Curse and its influence on Genuine Savings as an indicator for “weak” sustainable development. Springer Netherlands. Retrieved from https://doi.org/10.1007/s10668-015-9667-5
Holm-Muller, A. B. (2016, February 13). The Zambian Resources Curse and its influence on Genuine Savings as an indicator for "weak" sustainable development. . Netherlands: Springer.
Imulama, K. U., Droogers, P., & Makin, I. W. (2002). World Water Assesment Programme, Sri Lanka Case Study, Ruhuna Basin. Colombo, Sri Lanka: International Water Management Institutte.
Institute, N. R. (2014). The Resource Curse. The Political and Economic Challenges of Natural Resource Wealth. NRGI.
International Institute for Sustainable Development. (2007). Markets for Ecosystem. A Potential Tool for Multilateral Environmental. Winnipeg, Manitoba: United Nations.
IRENA. (2015). Africa 2030: Roadmap for a Renewable Energy Future. Abu Dhabi: IRENA. Retrieved from www.irena.org/remap
Karimi, P., Bastiaanssen, W., Molden , D., & Cheema, M. (2013). Basin-wide water accounting based on remote sensing data: an application for the Indus Basin, Hydrol. Earth Syst. Sci.
Karimi, P., Molden, D., Bastiaanssen, W., & Cai, X. (2012). Water accounting to assess use and productivity of water – evolution of the concept and new frontiers. In Water accounting: International approaches to policy and decision-making. Cheltenham.
Kirchhoff, C., & Bulkley, J. (2008). Sustainable Water Management in the Zambezi River Basin. Journal of International Institute, 15, 10.
Kling, H., Fuchs, M., & Stanzel, P. (2015). Future hydro generation in the Zambezi basin under the latest IPCC climate change projections. International Journal on Hydropower and Dams Water Storage and Hydropower Development for Africa.
Kowuor, C. O. (2005). An Application of Travel Cost Method in the Valuation of Recreational Properties: A Case Study of Nairobi Arboretum. Nairobi: University of Nairobi.

- 47 -
Lăcrămioara, D. R., & Bondread, D. A. (2019). The water footprint from hydroelectricity: a case study for a hydropower plant in Romania. Bucharest: University POLITEHNICA of Bucharest.
Lusaka-times. (2014, September 09). “Lunsemfwa power plant shut down, creating a US$ 9 million loss”. Lusaka Times Newspaper. Retrieved from https://www.lusakatimes.com/2014/09/30/lunsemfwa-power-plant-shut-creating-us-9-million-loss/
Markantonis, V., Dondeynaz, C., Latinopoulos, D., Bithas, K., Trichakis, I., N’Tcha M’Po, Y., & Moreno, C. C. (2018). Values and Preferences for Domestic Water Use: A Study from the Transboundary River Basin of Mékrou (West Africa). MDPI.
Maurice, D. (1973). Theories of Value and Distribution Since Adam Smith: Ideology and Economic Theory. Cambridge: Cambridge University Press.
McKibben, B. (2007). Deep Economy: The Wealth of Communities and the Durable Future. New York: Times Books.
Mendelsohn, R., & Olmstead, S. (2009). The Economic Valuation of Environmental Amenities and Disamenities: Methods and Applications. Annual Review of Environment and Resources 34(1), 325-47.
Mesa-Jurado, M. A., Berbel, J., & Orgaz, F. (2010). Estimating marginal value of water for irrigated olive grove with the production function method. Córdoba. Spain: Instituto Nacional de Investigación y Tecnología Agraria y Alimentaria (INIA).
Mesa-Jurado, M., Berbel, J., & Orgaz , R. F. (2010). Estimating marginal value of water for irrigated olive grove with the production function method. Spanish Journal of Agriculture Research, 197-206.
National Research Council. (2005). Valuing Ecosystem Services: Toward Better Environmental Decision-Making. Washington, DC: The National Academies Press. Retrieved from https://doi.org/10.17226/11139.
Neugarten, R. A., Langhammer, P. F., Osipova, E., Bagstad, K. J., Bhagabati, N., Butchart, N., . . . Willcock, S. (2018). Tools for measuring, modelling, and valuing ecosystem services: Guidance for Key Biodiversity Areas, natural World Heritage Sites, and protected areas. Gland, Switzerland: IUCN. Retrieved from https://portals.iucn.org/library/sites/library/files/documents/PAG-028-En.pdf
Ng’andu, N. (2017). The influence of operational efficiency and water tariffs on cost recovery in the water sector: A case of Lukanga Water and Sewerage Company - Zambia. Rotterdam, The Netherlands: Erasmus University Rotterdam.
NWASCO. (2018). Unrban and Peri-Urban Water Supply and Sanitation Sector Report. Lusaka: NWASCO.
OECD. (2012). OECD Investment Policy Reviews of Zambia. Advancing investment policy reform. OECD Publishing. Retrieved from https://read.oecd-ilibrary.org/finance-and-investment/oecd-investment-policy-reviews-zambia-2012_9789264169050
Pagiola, S., von Ritter, K., & Bishop, J. (2004). Assessing the Economic Value of Ecosystem Conservation. Environment Department Papers. Environmental Economics. Washington, DC: World Bank. Retrieved from http://hdl.handle.net/10986/18391
Phelps, J., Jones, C. A., Pendergrass, J. A., & Gómez-Baggethun, E. (2015). Environmental liability: A missing use for ecosystem services valuation. PNAS.
- 48 -
Ponce, R. D., VásqueZ, F., Stehr, A., Debels, P., & Orihuela , C. (2011). Estimating the Economic Value of Landscape Losses Due to Flooding by Hydropower Plants in the Chilean Patagonia. Water Resources Management volume 25, , p. Article number: 2449 .
PSR. (2020, 02 2). SDDP – Stochastic hydrothermal dispatch with network restrictions. Retrieved from PSR: https://www.psr-inc.com/softwares-en/
Schuster, E. (2012). Understanding the Value of Water in Agriculture:. Arizona: University of Arizona.
Shiklomanov, I. (1993). World fresh water resources. Water in Crisis: A Guide to the World's Fresh Water Resources.
Sitko, N., & Jayne, T. (2014). Structural transformation or elite land capture? The growth of “emergent” farmers in Zambia. (E. Lansing, Ed.) Michigan: Michigan State University, Department of Agricultural, Food and Resource Economics. Retrieved from USA. https://doi.org/10.1016/j.foodpol.2014.05.006
Skudev, P., Bishop, J., Ten Brink, P., & Gundimeda, H. (2008). The Economics of Ecosystems and Biodiversity – An Interim Report. European Communities.
Smith, A. (1776). "Book I, Chapter V Of the Real and Nominal Price of Commodities, or of their Price in Labour, and their Price in Money". An Inquiry into the Nature and Causes of the Wealth of Nations.
Smith, M. (2001). Optimizing crop production and crop water management under reduced water supply. FAO.
SN Power. (2016). Annual Report. Oslo, Norway: SN Power.
Stats NewZealand. (2017). Asset value of water and other renewables for electricity generation: 2007–15. New Zealand: Ministry of Business, Innovation and Employment. Retrieved from www.stats.nz
Swain, A., Swain, R. B., Themner, A., & Krampe, F. (2011). CLimate Change and the Risk of Violent Conflicts in Southern Africa. Pretoria: GLoble Crisis Solutions.
Tadaki, M., Sinner, J., & Chan, K. M. (2017). Making sense of environmental values: a typology of concepts. Ecology and Society, 22(1):7. Retrieved from https://doi.org/10.5751/ES-08999-220107
Tietenberg, T., & Lewis, L. (2018). Environmental and Natural Resource Economics. Abingdon, New York: Routledge.
Tilmant, A., Juízo, D., Kinzelbach, W., & Beevers, L. (2012). Economic Valuation of Benefits and Costs Associated with the Coordinated Development and Management of the Zambezi Basin. Water Policy. Retrieved from https://www.researchgate.net/publication/233952080
Tilmant, A., Kinzelbach, W., Juízo, D., Beevers, L., Senn, D., & Casarotto, C. (2012). Economic Valuation of Benefits and Costs Associated with the Coordinated. IWA Publishing. Retrieved from https://www.researchgate.net/publication/233952080
Trust, G. I. (2008). Green Accounting for Indian States Project (GAISP). Delhi. Retrieved from www.gistindia.org
Tshenyego, L. D., Mulonda, K., & Simate, I. N. (2019). Estimation of Dry Season Irrigation Water Abstraction in Lunsemfwa, Mulungushi, Mwomboshi, and Mkushi Subbasins from 2013 to 2017 in Zambia. Hindawi, 9.

- 49 -
U.S. Department of the Interior. (2012). Colorado River Basin: Water Supply and Demand Study. Colorado: U.S. Department of the Interior.
Unai Pascual, P. B. (2017). Current Opinion in Environmental Sustainability: Valuing nature’s contributions to people: the IPBES approach.
United Nations. (2012). System of Environmental-Economic Accounting for Water. Department of Economic and Social Affairs, Statistics Division. New York: United Nations. Retrieved from https://unstats.un.org/unsd/statcom/doc07/SEEAW_SC2007.pdf
United Nations Children’s Fund (UNICEF) and World Health Organization. (2019). Progress on household drinking water, sanitation and hygiene 2000-2017: Special focus on inequalities . New York: United Nations.
United Nations, Department of Economic and Social Affairs, Population Division. (2015). World Population Ageing. Newyork: United Nations.
Ventures Africa. (2014, August 4). DROP IN WATER LEVEL FORCES ZAMBIAN POWER FIRM TO HALT ENERGY GENERATION. Retrieved from http://vnt.rs/1ywm9
Ward, F. A., & Michelson, A. (2002). The economic value of water in Agriculture: concepts and policy applications. Water Policy, 4: 423-446.
World Bank. (2012). Zambia Poverty Assessment : Stagnant Poverty and Inequality in a Natural Resource-Based Economy. Washington, DC: World Bank. Retrieved from https://openknowledge.worldbank.org/handle/10986/16792 License: CC BY 3.0 IGO.
World Economic Forum. (2020). Globle Risks Report: An Unsettled world. Geneva, Switzerland : World Economic Forum.
World Health Organisation. (2003). Domestic Water Quantity, Service, Level and Health . Geneva, Switzerland: WHO.
WWF. (2016). Integrated Flows Assessments for the Luangwa, RiverPhase I: Water Resources. Lusaka, Zambia: WWF.
Zambia Development Agency (ZDA). (2014). Energy Sector Profile. Lusaka: Zambia Development Agency.
Zambia Statistics Agency (Central Statistical Office). (2015 ). Living Conditions Monitoring Survey. Lusaka: GRZ.
Related Documents


