HAL Id: halshs-01293686 https://halshs.archives-ouvertes.fr/halshs-01293686 Submitted on 25 Mar 2016 HAL is a multi-disciplinary open access archive for the deposit and dissemination of sci- entific research documents, whether they are pub- lished or not. The documents may come from teaching and research institutions in France or abroad, or from public or private research centers. L’archive ouverte pluridisciplinaire HAL, est destinée au dépôt et à la diffusion de documents scientifiques de niveau recherche, publiés ou non, émanant des établissements d’enseignement et de recherche français ou étrangers, des laboratoires publics ou privés. Economic valuation of the vulnerability of world agriculture confronted with pollinator decline Nicola Gallai, Jean-Michel Salles, Josef Settele, Bernard E. Vaissière To cite this version: Nicola Gallai, Jean-Michel Salles, Josef Settele, Bernard E. Vaissière. Economic valuation of the vulnerability of world agriculture confronted with pollinator decline. Ecological Economics, Elsevier, 2009, 68 (3), pp.810-821. 10.1016/j.ecolecon.2008.06.014. halshs-01293686

Welcome message from author
This document is posted to help you gain knowledge. Please leave a comment to let me know what you think about it! Share it to your friends and learn new things together.
Transcript
HAL Id: halshs-01293686https://halshs.archives-ouvertes.fr/halshs-01293686
Submitted on 25 Mar 2016
HAL is a multi-disciplinary open accessarchive for the deposit and dissemination of sci-entific research documents, whether they are pub-lished or not. The documents may come fromteaching and research institutions in France orabroad, or from public or private research centers.
L’archive ouverte pluridisciplinaire HAL, estdestinée au dépôt et à la diffusion de documentsscientifiques de niveau recherche, publiés ou non,émanant des établissements d’enseignement et derecherche français ou étrangers, des laboratoirespublics ou privés.
Economic valuation of the vulnerability of worldagriculture confronted with pollinator decline
Nicola Gallai, Jean-Michel Salles, Josef Settele, Bernard E. Vaissière
To cite this version:Nicola Gallai, Jean-Michel Salles, Josef Settele, Bernard E. Vaissière. Economic valuation of thevulnerability of world agriculture confronted with pollinator decline. Ecological Economics, Elsevier,2009, 68 (3), pp.810-821. �10.1016/j.ecolecon.2008.06.014�. �halshs-01293686�
Economic valuation of the vulnerability of world agriculture 1
confronted to pollinator decline 2
Nicola Gallai*1,2, Jean-Michel Salles3, Josef Settele4 & Bernard E. Vaissière1 3
1 INRA, Laboratoire Pollinisation & Ecologie des Abeilles, UMR406 Abeilles & 4
Environnement, 84914 Avignon Cedex 9, France 5
2 INRA, UMR LAMETA, 2 place Viala, 34060 Montpellier Cedex 1, France 6
3 CNRS, UMR LAMETA, 2 place Viala, 34060 Montpellier Cedex 1, France 7
4 UFZ, Helmholtz-Centre for Environmental Research, Dept. of Community Ecology, 8
Theodor-Lieser-Str. 4, 06120 Halle, Germany 9
10
*Corresponding author: Nicola Gallai, INRA, UMR LAMETA, 2 place Viala, 34060 11
Montpellier Cedex 1, France, Tel. (33) [0]4.99.61.29.67, Fax (33) [0]4.67.54.58.05, e-mail: 12
14
15
Economic valuation of pollinators 2
Abstract 1
There is mounting evidence of pollinator decline all over the world and consequences in many 2
agricultural areas could be significant. We assessed these consequences by measuring 1) the 3
contribution of insect pollination to the world agricultural output economic value, and 2) the 4
vulnerability of world agriculture in the face of pollinator decline. We used a bioeconomic 5
approach, which integrated the production dependence ratio on pollinators, for the 100 crops 6
used directly for human food worldwide as listed by FAO. The total economic value of 7
pollination worldwide amounted to €153 billion, which represented 9.5% of the value of the 8
world agricultural production used for human food in 2005. In terms of welfare, the consumer 9
surplus loss was estimated between €190 and €310 billion based upon average price 10
elasticities of –1.5 to –0.8, respectively. Vegetables and fruits were the leading crop 11
categories in value of insect pollination with about €50 billion each, followed by edible oil 12
crops, stimulants, nuts and spices. The production value of a ton of the crop categories that do 13
not depend on insect pollination averaged €151 while that of those that are pollinator-14
dependent averaged €761. The vulnerability ratio was calculated for each crop category at the 15
regional and world scales as the ratio between the economic value of pollination and the 16
current total crop value. This ratio varied considerably among crop categories and there was a 17
positive correlation between the rate of vulnerability to pollinators decline of a crop category 18
and its value per production unit. Looking at the capacity to nourish the world population 19
after pollinator loss, the production of 3 crop categories – namely fruits, vegetables, and 20
stimulants– will clearly be below the current consumption level at the world scale and even 21
more so for certain regions like Europe. Yet, although our valuation clearly demonstrates the 22
economic importance of insect pollinators, it cannot be considered as a scenario since it does 23
not take into account the strategic responses of the markets. 24
Keywords: pollination, valuation, vulnerability, agriculture, ecosystem service, crop25
Economic valuation of pollinators 3
Introduction 1
The production of 84% of crop species cultivated in Europe depends directly on insect 2
pollinators, especially bees (Williams, 1994). And Klein et al. (2007) found that 87 crops, that 3
is 70% of the 124 main crops used directly for human consumption in the world, are 4
dependent on pollinators. Insect pollination is both an ecosystem service and a production 5
practice used extensively by farmers all over the world for crop production. It is an ecosystem 6
service in that wild pollinators, in particular wild bees, contribute significantly to the 7
pollination of a large array of crops (Kremen et al., 2002; Morandin & Winston, 2005; 8
Greenleaf & Kremen, 2006; Winfree et al., 2007 & 2008). And it is also a management tool in 9
that honeybees, bumblebees and a few other bee species are purchased or rented by farmers in 10
many countries to supplement the local pollinator fauna (McGregor, 1976; Olmstead & 11
Wooten, 1987; Robinson et al., 1989; Free, 1993; Dag et al., 2006). Thus the economic 12
benefit of insect pollination is clear for farmers and the market of colony rental is now well 13
developed and organized for honey bees in the United States of America (Sumner 2006) and 14
Europe (Carreck et al., 1997) as well as for bumble bees all over the world (Velthuis & Van 15
Doorn, 2006). This practice also suggests that there is already not enough wild pollinators to 16
insure adequate pollination of all crops throughout the year in these countries. Yet the 17
abundance and diversity of wild bees as well as the abundance of honeybees are now 18
declining and some species are clearly at risk (Biesmeijer et al., 2006; National Research 19
Council, 2007; Oldroyd, 2007; Stokstad 2007). The current decline of insect pollinator 20
populations emphasizes the need to better assess the potential loss in terms of economic value 21
that may result from this trend and the possible ultimate disappearance of pollinators, and to 22
estimate the level of vulnerability of the world agriculture to insect pollinators. 23
Two main ways have been used to date to assess the monetary value of pollinators. 24
The first one consists in simply assessing the total value of insect-pollinated crops. This 25
Economic valuation of pollinators 4
approach has been used at a national scale in the USA (Martin, 1975; Levin, 1984; Metcalf, 1
1992) as well as on a world scale (Costanza et al., 1997; Pimentel et al. 1997). Since the 2
production of most crops is only partially reduced in the absence of insect pollinators, a 3
second more refined approach to improve the previous estimate has been to introduce a 4
dependence ratio that takes into account the real impact of insect pollinators on crop 5
production. This dependence ratio enables the calculation of the production loss in case of a 6
complete disappearance of pollinators, and the economic value of insect pollination service is 7
assimilated with the corresponding loss of crop value. Thus the monetary assessment is 8
directly related to reported values of the dependence of crop production on the level of insect 9
pollination and, in this paper, it will be called a bioeconomic approach. This type of 10
assessment has also been done at national and larger scales (France - Borneck & Bricout, 11
1984; Hungary – Benedek, 1983; Switzerland - Fluri & Frick, 2005; United Kingdom - 12
Carreck & Williams, 1998; USA - Robinson et al., 1989, Morse & Calderone, 2000, Losey & 13
Vaughan, 2006; 12-member-states European Community - Borneck & Merle, 1989). 14
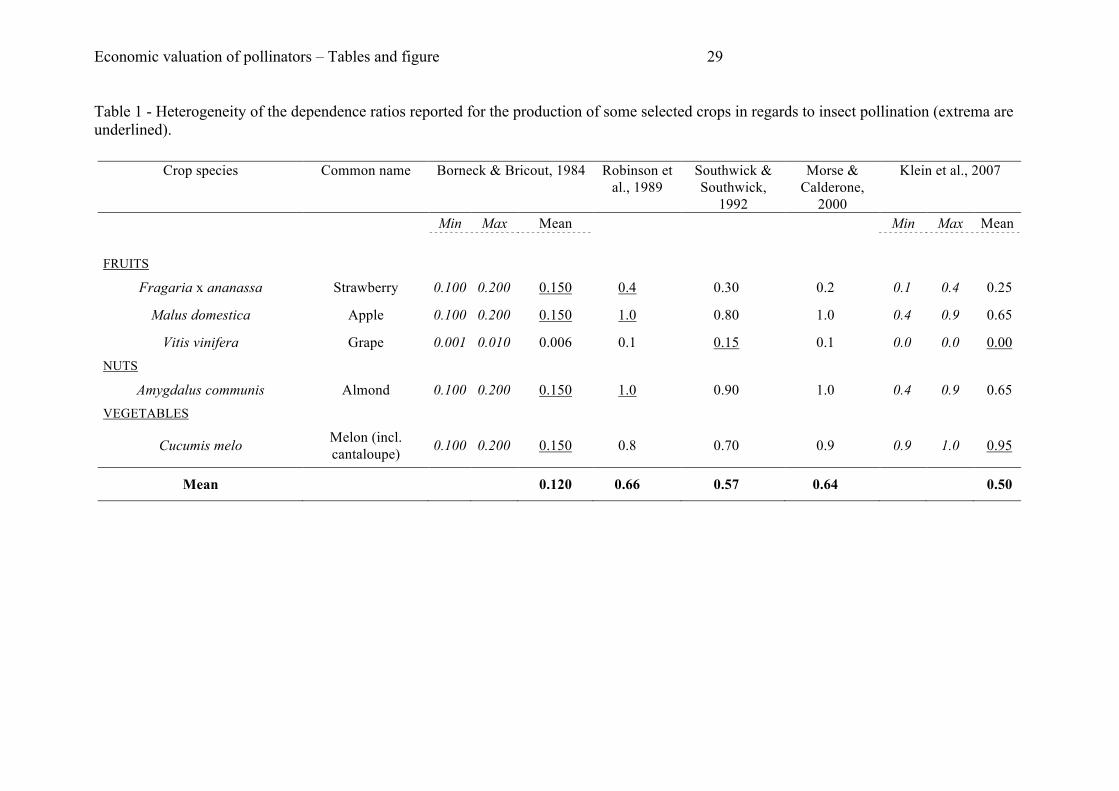
Unfortunately, these studies have used a wide range of dependence ratios for the same crops 15
(Table 1). Indeed, these ratios were estimated based largely on personal communications and 16
interpretation of review material, such as McGregor (1976) and Free (1993), which do not 17
provide dependence ratios. None of the bioeconomic studies to date have evaluated the impact 18
of insect pollinators at the world scale, nor did they make a geographical analysis of the 19
impact of pollinators in terms of the possible vulnerability of agriculture or examined the 20
potential impact of pollinator loss on production compared with the consumption structure. 21
Our first objective was to quantify the economic loss that could result from the total 22
disappearance of insect pollinators on world agricultural output and we based our calculations 23
on the dependence ratios recently published for the crops used directly for human food (Klein 24
et al., 2007). Due to the many crop species and the heterogeneity of the structure of the 25

Economic valuation of pollinators 5
agricultural production, the vulnerability to pollinator decline is likely to vary widely among 1
the different continents and regions. Our second objective was therefore to provide a measure 2
of the vulnerability of the regional and world agriculture when confronted to the decline, or 3
even the total disappearance, of insect pollinators. Finally our third objective was to compare 4
the production and consumption of insect-pollinated crop categories at the regional and world 5
scale in the face of pollinator loss in order to draw some insight on potential local shortages 6
and impacts on trade. Our calculations were based on the assumption of a total pollinator loss, 7
but our results can be extended to any level of pollinator decline as there is empirical evidence 8
that the yield of entomophilous crops – that is crops that are pollinated by insects solely or in 9
a dominant way – responds linearly to pollinator density (Dedej & Delaplane, 2003; Steffan-10
Dewenter, 2003; Clement et al., 2007). 11
1 Methods 12
1.1 Principles 13
Among the main crops that contribute to human food, some, such as most cereals, do not 14
depend on insects for their pollination, while others can be highly or totally dependent on 15
insect pollination, such as many fruits, vegetables and stimulant crops (Klein et al., 2007). 16
Our study is based on the hypothesis that the economic impact of pollinators on agricultural 17
output is measurable through the use of dependence ratios quantifying the impact of a lack of 18
insect pollinators on crop production value. This decrease in the production value could result 19
from a reduction in yield as well as in quality (Free, 1993). Unfortunately, this impact on 20
production value is unknown for most crops as what is usually reported is solely the degree of 21
dependence of the production on insect pollinators (Borneck & Bricout, 1984; Robinson et 22
al., 1989; Southwick & Southwick, 1992; Morse & Calderone, 2000; Klein et al., 2007). It is 23
this dependence ratio that we used again in our study to calculate the economic impact of 24
pollinators and the vulnerability of the agricultural output at various scales. 25

Economic valuation of pollinators 6
Because of the lack of substitution among agricultural produce, the economic impact 1
and the vulnerability of the agricultural output is not enough to assess the full value of insect 2
pollinators as, indeed, one ton of rice is not an appropriate substitute for one ton of coffee or 3
of cantaloupe. Thus, in addition to looking at individual crops, we examined the vulnerability 4
to pollinator decline of the FAO crop categories to which each crop belonged based upon the 5
assumption that crops within a category could be considered as potential appropriate 6
substitute for one another while this would not be the case for crops in different categories. 7
We used the following 10 categories based on FAO: cereals, edible oilseed crops, fruits, nuts, 8
pulses, roots and tubers, spices, stimulant crops, sugar crops, vegetables. 9
1.2 Indicators and formulae 10
We used a bioeconomic approach to calculate the economic value of the impact of pollinator 11
loss as well as the overall vulnerability of the agricultural output to such a loss. The variables 12
used for each crop i, where i ∈ [1;I], in each world region x, where x ∈ [1;X], were the 13
quantity produced (Qix), the quantity consumed (Cix), the dependence ratio of the crop i on 14
insect pollinators (Di) and the price of crop i per unit produced in region x (Pix). We used the 15
price of each crop in each of the 5 regions of the world (sensu FAO; see supplementary 16
material – Appendix 1) because, despite the growing interdependence of agricultural markets, 17
producer prices for the same crop may vary widely from one region to another and therefore 18
cannot be appropriately summarized by a single average world price. Indeed, we found that 19
neither the FAO database nor that of any other world organization provided these prices on a 20
worldwide basis for all our study crops. The total economic value of insect pollination (IPEV) 21
was then calculated as follows: 22
IPEV =
€
Pix ×Qix ×Di( )x=1
X
∑i=1
I
∑ [1] 23
Economic valuation of pollinators 7
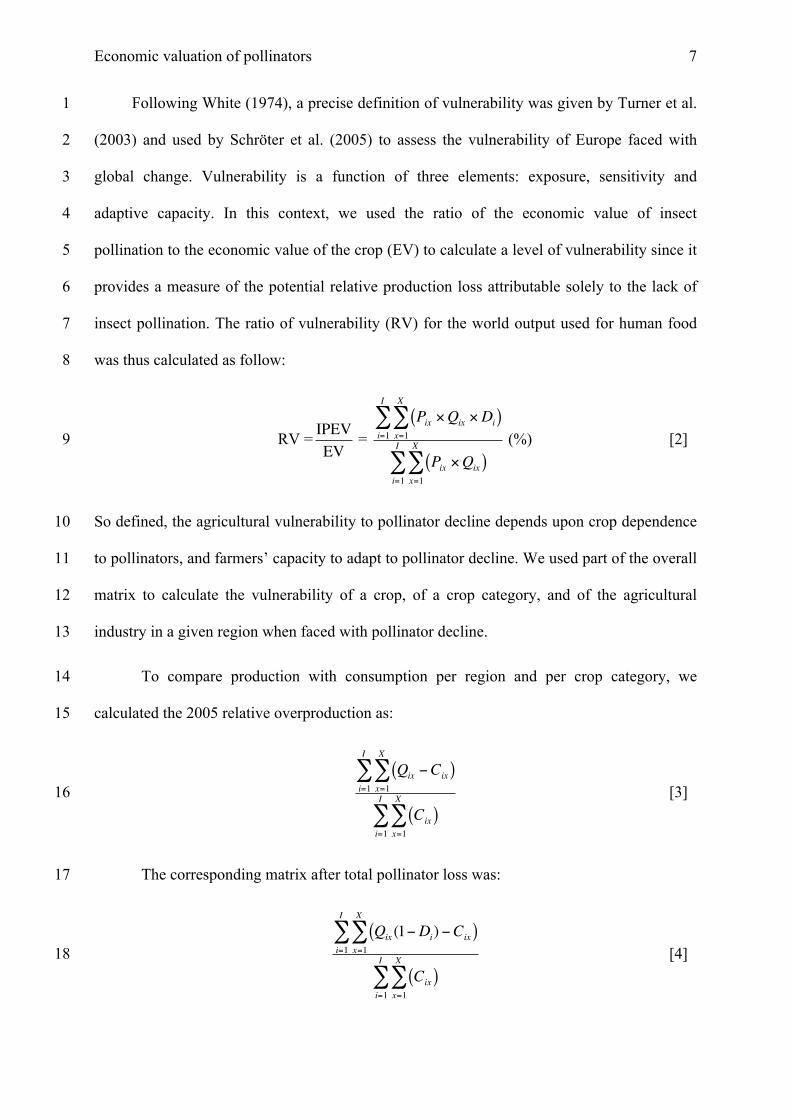
Following White (1974), a precise definition of vulnerability was given by Turner et al. 1
(2003) and used by Schröter et al. (2005) to assess the vulnerability of Europe faced with 2
global change. Vulnerability is a function of three elements: exposure, sensitivity and 3
adaptive capacity. In this context, we used the ratio of the economic value of insect 4
pollination to the economic value of the crop (EV) to calculate a level of vulnerability since it 5
provides a measure of the potential relative production loss attributable solely to the lack of 6
insect pollination. The ratio of vulnerability (RV) for the world output used for human food 7
was thus calculated as follow: 8
RV =
€
IPEVEV
=
€
Pix ×Qix ×Di( )x=1
X
∑i=1
I
∑
Pix ×Qix( )x=1
X
∑i=1
I
∑ (%) [2] 9
So defined, the agricultural vulnerability to pollinator decline depends upon crop dependence 10
to pollinators, and farmers’ capacity to adapt to pollinator decline. We used part of the overall 11
matrix to calculate the vulnerability of a crop, of a crop category, and of the agricultural 12
industry in a given region when faced with pollinator decline. 13
To compare production with consumption per region and per crop category, we 14
calculated the 2005 relative overproduction as: 15
€
Qix −Cix( )x=1
X
∑i=1
I
∑
Cix( )x=1
X
∑i=1
I
∑ [3] 16
The corresponding matrix after total pollinator loss was: 17
€
Qix (1−Di) −Cix( )x=1
X
∑i=1
I
∑
Cix( )x=1
X
∑i=1
I
∑ [4] 18

Economic valuation of pollinators 8
Data collection 1
The geographical scale of our study was the world based upon the 2005 data from the FAO 2
database (http://www.fao.org) and thus restricted to the 162 countries that are members of this 3
international organization. Following FAO definitions, we gathered these countries into 5 4
main regions (Africa, Asia & Oceania, Europe, North America and Caribbean, South and 5
Central America), and, within each region, into sub-regions (see supplementary data – 6
Appendix 1). 7
We limited the scope of our study to the direct crops and commodity crops used 8
directly for human food as reported by FAO (see supplementary data – Appendix 2). Direct 9
crops are those listed individually with their production by the FAO while a commodity is an 10
aggregation of different crops for which the production figures are pooled together and most 11
are reported as Not Elsewhere Classified. Commodity production figures are based on a 12
questionnaire that countries fill out to include important crops for the world market that are 13
not listed individually by the FAO. We included the commodity crops in the study because 14
they represent a significant part of the agricultural world output. 15
For Qix and Cix, we used the 2005 FAO production and consumption data, respectively 16
(http://www.fao.org). For Pix, we needed the mean 2005 producer price per unit weight for 17
each crop or commodity and each region as we opted to take into account regional 18
specialization, geographical context, and socio-economic factors. We chose this approach 19
because producer prices vary with many factors such as crop management, climate, varieties 20
and market in such a way that a regional approach should provide more accurate price 21
estimates than a worldwide approach. To fit complex geographical patterns as well as to be 22
able to concentrate on large producing regions without having to go to the level of individual 23
countries for which many price data are not available either, we used the five main world 24
regions defined previously (see supplementary data - Appendix 1). Major world field crops, 25
Economic valuation of pollinators 9
like most cereals and sugar crops, are produced on a large scale and have a large-enough 1
commercial value to be traded on financial markets. For these crops, we used the “free on 2
board” (FOB) prices, which are future contracts for 2005. These prices are available on the 3
websites of financial market places specialized in commodities such as the Chicago Board of 4
Trade (CBOT) and the New York Board of Trade (NYBOT). For most other crops, prices are 5
not available on the financial market place because of lower interest in their international 6
trading on a large scale. For these crops, we used the 2005 producer prices for each world 7
region that were provided by the European database Eurostat 8
(http://epp.eurostat.ec.europa.eu) and by the United States Department of Agriculture 9
(http://www.fas.usda.gov). For minor crops, defined as those for which the 2005 producer 10
price was not available in either of these two large databases, as well as for all the 11
commodities, we used the average producer price listed on the FAOSTAT website for the 12
period 1991-2002 for the most important producing country of each world region. We used 13
this method to reduce the effect of year-to-year price variation as well as the biases on prices 14
that might take place in small producing countries. Furthermore, when a country or a world 15
region largely exceeded its expected share of world production for a given crop based on its 16
sole size, we considered it to be specialized in this crop. For example, Asia produced 90% of 17
the rice, so we assumed that the world demand for rice, and thus its world price, would be 18
influenced by the Asian supply. In this example, we took the producer price of Asia rice and 19
applied it on a worldwide basis. In all cases, we used the local currency and the exchange rate 20
of the years of the data collected to calculate the prices and production values in 2005 euros. 21
We calculated the dependence ratios Di based upon the five levels of the extensive 22
recent review of Klein et al. (2007; see supplementary data - Appendix 2). Starting with the 23
complete set of direct and commodity crops used for human food, we selected the ones for 24
which we had production and price data. For the individual crops among the 11 commodities, 25
Economic valuation of pollinators 10
neither the production nor the producer price was available and the crops that composed each 1
of these commodities were not all dependent on insect pollination at a similar level for their 2
production. Consequently we could not calculate the economic value of pollinators for these 3
commodity crops and they were not considered further. For the direct crops, we focused on 4
those reviewed in Appendices 1 and 2 of Klein et al. (2007) for which we calculated the 5
average dependence ratio based on the reported range of dependence to animal-mediated 6
pollination in this work (See supplementary data - Appendix 2). 7
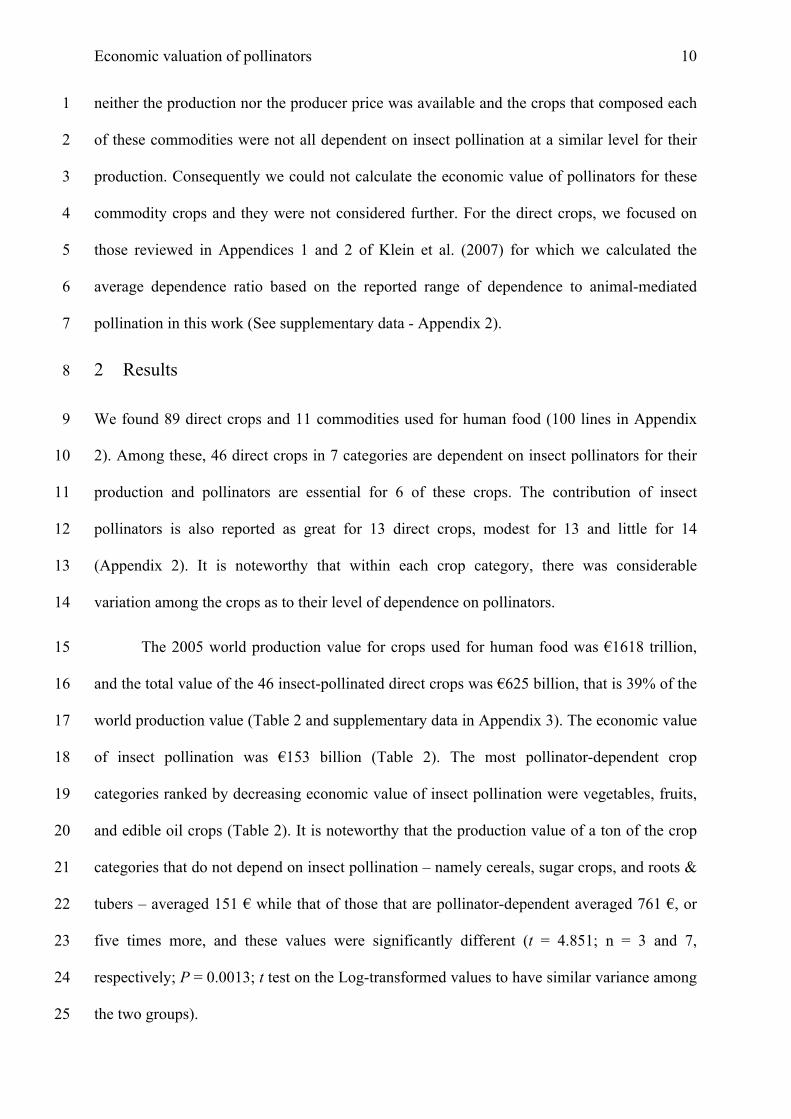
2 Results 8
We found 89 direct crops and 11 commodities used for human food (100 lines in Appendix 9
2). Among these, 46 direct crops in 7 categories are dependent on insect pollinators for their 10
production and pollinators are essential for 6 of these crops. The contribution of insect 11
pollinators is also reported as great for 13 direct crops, modest for 13 and little for 14 12
(Appendix 2). It is noteworthy that within each crop category, there was considerable 13
variation among the crops as to their level of dependence on pollinators. 14
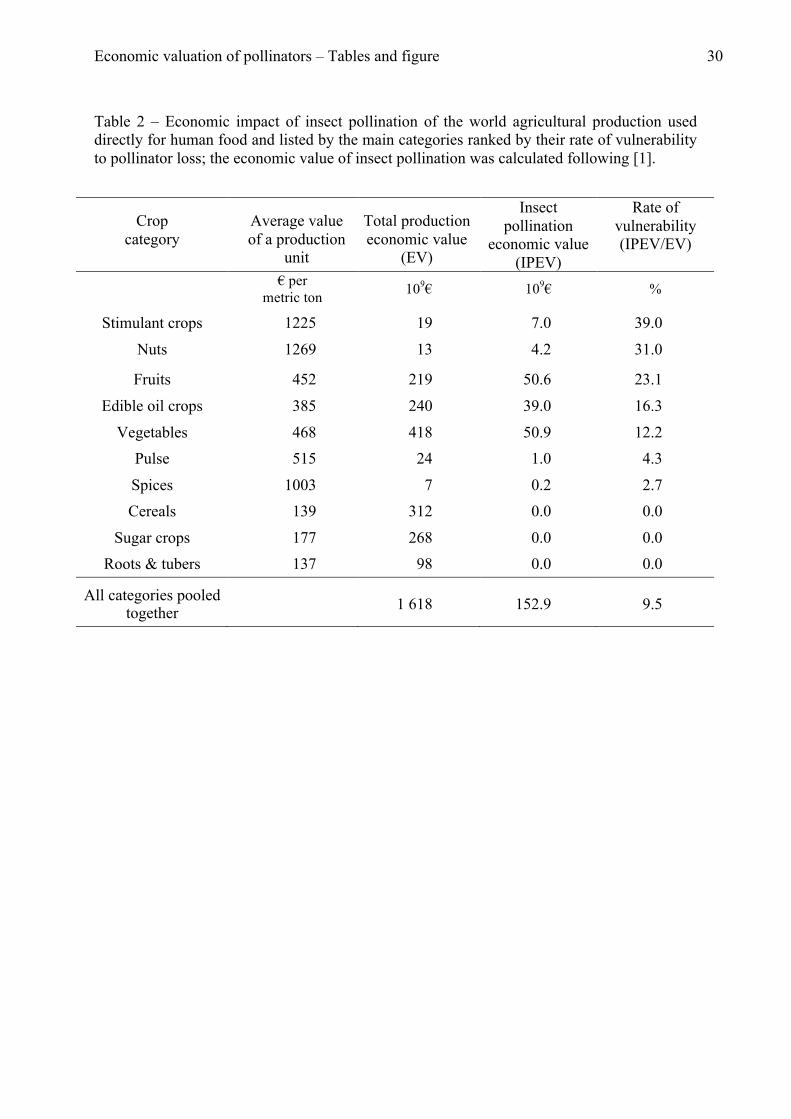
The 2005 world production value for crops used for human food was €1618 trillion, 15
and the total value of the 46 insect-pollinated direct crops was €625 billion, that is 39% of the 16
world production value (Table 2 and supplementary data in Appendix 3). The economic value 17
of insect pollination was €153 billion (Table 2). The most pollinator-dependent crop 18
categories ranked by decreasing economic value of insect pollination were vegetables, fruits, 19
and edible oil crops (Table 2). It is noteworthy that the production value of a ton of the crop 20
categories that do not depend on insect pollination – namely cereals, sugar crops, and roots & 21
tubers – averaged 151 € while that of those that are pollinator-dependent averaged 761 €, or 22
five times more, and these values were significantly different (t = 4.851; n = 3 and 7, 23
respectively; P = 0.0013; t test on the Log-transformed values to have similar variance among 24
the two groups). 25

Economic valuation of pollinators 11
The rate of vulnerability of the world agricultural production used for human food in 1
the face of total pollinator loss was 9.5% (Table 2). This overall value may seem small, but it 2
does not reveal the large range of values among the different crop categories. The stimulant 3
crops with a total production value of only €19 billion had the highest vulnerability ratio 4
(39%). And vegetables, the category with the highest crop production value (€418 billion) 5
still had a vulnerability ratio of 12%. Interestingly, there was a positive correlation between 6
the rate of vulnerability of a crop category to pollinators and its value per production unit (r = 7
0.729, n = 10, P = 0.017). 8
Looking at the economic vulnerability ratios of the different crop categories among 9
the regions of the world indicates that, in each region, there is a category that is highly 10
vulnerable to pollinator loss with vulnerability ratios ranging from 22% to 94% (Table 4). 11
Interestingly, nuts were the most vulnerable crop category over the largest area (7 sub-12
regions), followed by fruits and stimulant crops (5 sub-regions each). Furthermore, because 13
some regions are specialized in the production of some pollinator-dependent crop category, 14
the vulnerability of the world production for these categories is much higher than the overall 15
worldwide value indicated on Table 3. For example, East Asia produced nearly 52% of the 16
world vegetables with a vulnerability ratio of 15% while the worldwide value was 12% 17
(Tables 2 and 4). Also North and South Americas produced 36% of the edible oil crops with a 18
vulnerability ratio greater than 22%, while the worldwide value was 16% (Tables 2 and 4). 19
And West Africa, South East Asia and North America together produced 36% of the nuts in 20
the world with a vulnerability ratio ≥ 44% in all three regions. The situation appeared 21
particularly critical for stimulant crops as West Africa produced 56% of the world production 22
with a vulnerability ratio of 90% (Table 4). This region produced a lot of coffee and/or cocoa, 23
both of which are dependent of insect pollinators for their production, and the consequences 24
of a total pollinator loss on these crops could be considerable not only for the revenues that 25
Economic valuation of pollinators 12
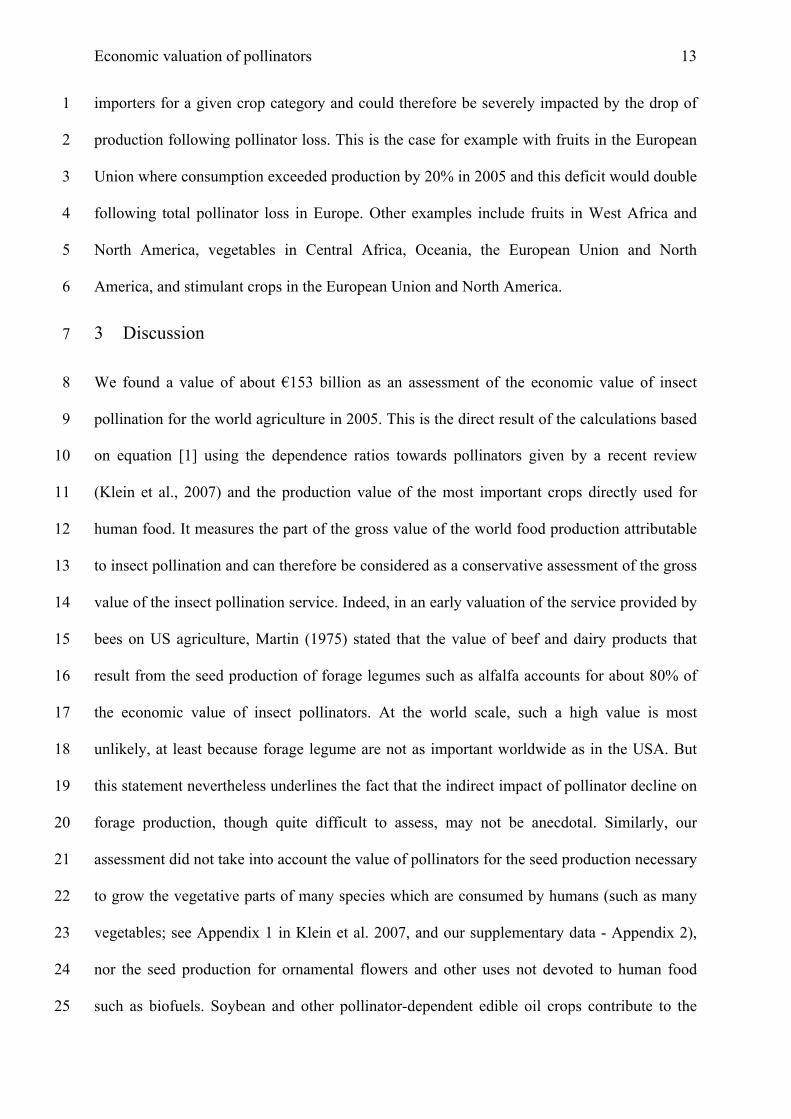
West Africa derives from these crops, but also on a global scale for the world production and 1
resulting price structure of these stimulants. 2
On a global scale, the difference between production and consumption in 2005 was 3
positive for all crop categories that are pollinator-dependent1. Looking at these same 4
differences after total pollinator loss, the overall world food supply would not be in jeopardy, 5
but the production drop would create a deficit in three crop categories including fruits and 6
vegetables, two pollinator-dependent categories with a high economic value and low ability 7
for storage from one year to the next (Table 5). Looking at these three categories for which 8
the overall production would no longer meet consumption patterns after total pollinator loss, 9
we examined their change in availability in each geographical region. The deficit resulting 10
from the loss of pollinators appears important in many region and crop category 11
combinations, and it could have some serious consequences in two types of situations. First, 12
in some regions where production was clearly exceeding consumption, the loss of pollinators 13
would result in a deficit such that production would no longer be able to meet consumption. 14
This is the case for fruits in North Africa as well as in Central, East and South Asia (Table 6). 15
A case in point is East Asia where fruit production exceeded consumption by 19% in 2005 16
and where total pollinator loss would result in a deficit with consumption exceeding 17
production by 26%, which is considerable since this region produces nearly 20% of the world 18
fruit output. Other examples of a similar situation of consumption exceeding production as a 19
consequence of pollinator loss are found (i) for vegetables in North and South Africa, East 20
and Middle East Asia, and South America, and (ii) for stimulant crops in South Africa. A 21
second type of situation where pollinator loss could have serious consequences arises for 22
regions which are already barely meeting their consumption patterns or which are net 23
23 1 This global statement is not in contradiction with the fact that, according with the World Health Organization (WHO) some 3.7 billion people were malnourished in 2005 or, following the Food and Agricultural Organization (FAO) estimates, 850 million, as FAO recorded only the people that are protein/calories malnourished, rather than nutrient deficient.
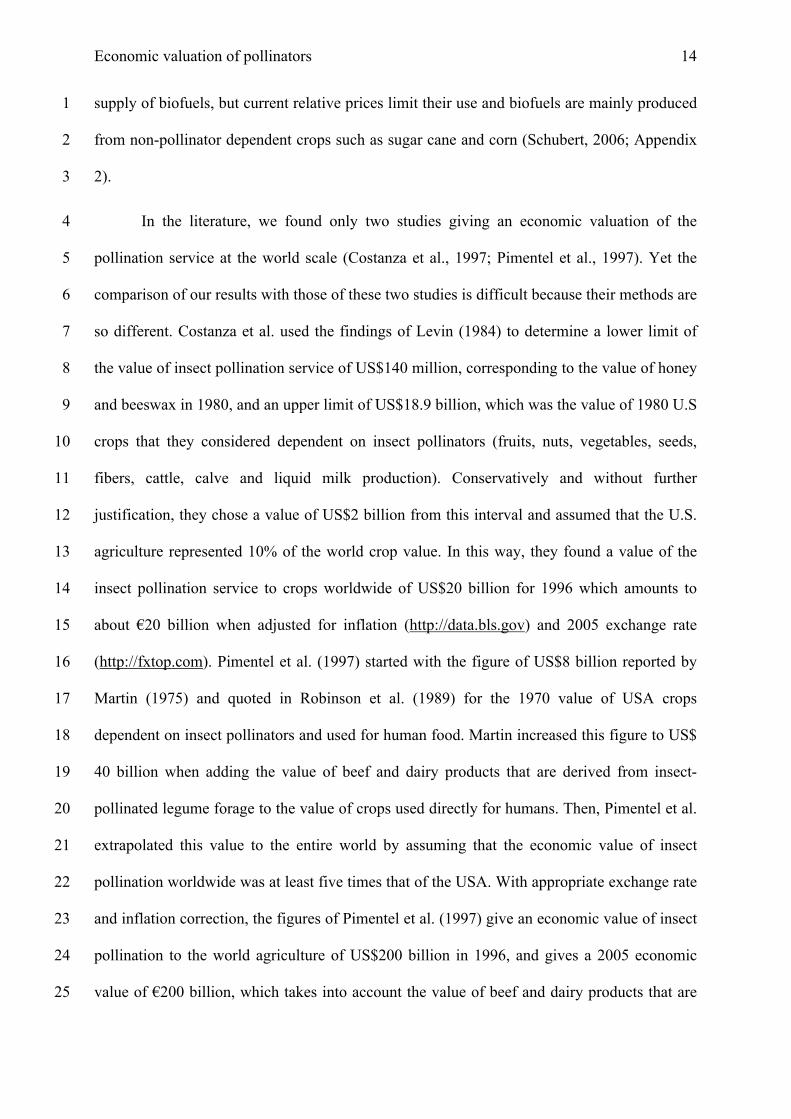
Economic valuation of pollinators 13
importers for a given crop category and could therefore be severely impacted by the drop of 1
production following pollinator loss. This is the case for example with fruits in the European 2
Union where consumption exceeded production by 20% in 2005 and this deficit would double 3
following total pollinator loss in Europe. Other examples include fruits in West Africa and 4
North America, vegetables in Central Africa, Oceania, the European Union and North 5
America, and stimulant crops in the European Union and North America. 6
3 Discussion 7
We found a value of about €153 billion as an assessment of the economic value of insect 8
pollination for the world agriculture in 2005. This is the direct result of the calculations based 9
on equation [1] using the dependence ratios towards pollinators given by a recent review 10
(Klein et al., 2007) and the production value of the most important crops directly used for 11
human food. It measures the part of the gross value of the world food production attributable 12
to insect pollination and can therefore be considered as a conservative assessment of the gross 13
value of the insect pollination service. Indeed, in an early valuation of the service provided by 14
bees on US agriculture, Martin (1975) stated that the value of beef and dairy products that 15
result from the seed production of forage legumes such as alfalfa accounts for about 80% of 16
the economic value of insect pollinators. At the world scale, such a high value is most 17
unlikely, at least because forage legume are not as important worldwide as in the USA. But 18
this statement nevertheless underlines the fact that the indirect impact of pollinator decline on 19
forage production, though quite difficult to assess, may not be anecdotal. Similarly, our 20
assessment did not take into account the value of pollinators for the seed production necessary 21
to grow the vegetative parts of many species which are consumed by humans (such as many 22
vegetables; see Appendix 1 in Klein et al. 2007, and our supplementary data - Appendix 2), 23
nor the seed production for ornamental flowers and other uses not devoted to human food 24
such as biofuels. Soybean and other pollinator-dependent edible oil crops contribute to the 25
Economic valuation of pollinators 14
supply of biofuels, but current relative prices limit their use and biofuels are mainly produced 1
from non-pollinator dependent crops such as sugar cane and corn (Schubert, 2006; Appendix 2
2). 3
In the literature, we found only two studies giving an economic valuation of the 4
pollination service at the world scale (Costanza et al., 1997; Pimentel et al., 1997). Yet the 5
comparison of our results with those of these two studies is difficult because their methods are 6
so different. Costanza et al. used the findings of Levin (1984) to determine a lower limit of 7
the value of insect pollination service of US$140 million, corresponding to the value of honey 8
and beeswax in 1980, and an upper limit of US$18.9 billion, which was the value of 1980 U.S 9
crops that they considered dependent on insect pollinators (fruits, nuts, vegetables, seeds, 10
fibers, cattle, calve and liquid milk production). Conservatively and without further 11
justification, they chose a value of US$2 billion from this interval and assumed that the U.S. 12
agriculture represented 10% of the world crop value. In this way, they found a value of the 13
insect pollination service to crops worldwide of US$20 billion for 1996 which amounts to 14
about €20 billion when adjusted for inflation (http://data.bls.gov) and 2005 exchange rate 15
(http://fxtop.com). Pimentel et al. (1997) started with the figure of US$8 billion reported by 16
Martin (1975) and quoted in Robinson et al. (1989) for the 1970 value of USA crops 17
dependent on insect pollinators and used for human food. Martin increased this figure to US$ 18
40 billion when adding the value of beef and dairy products that are derived from insect-19
pollinated legume forage to the value of crops used directly for humans. Then, Pimentel et al. 20
extrapolated this value to the entire world by assuming that the economic value of insect 21
pollination worldwide was at least five times that of the USA. With appropriate exchange rate 22
and inflation correction, the figures of Pimentel et al. (1997) give an economic value of insect 23
pollination to the world agriculture of US$200 billion in 1996, and gives a 2005 economic 24
value of €200 billion, which takes into account the value of beef and dairy products that are 25
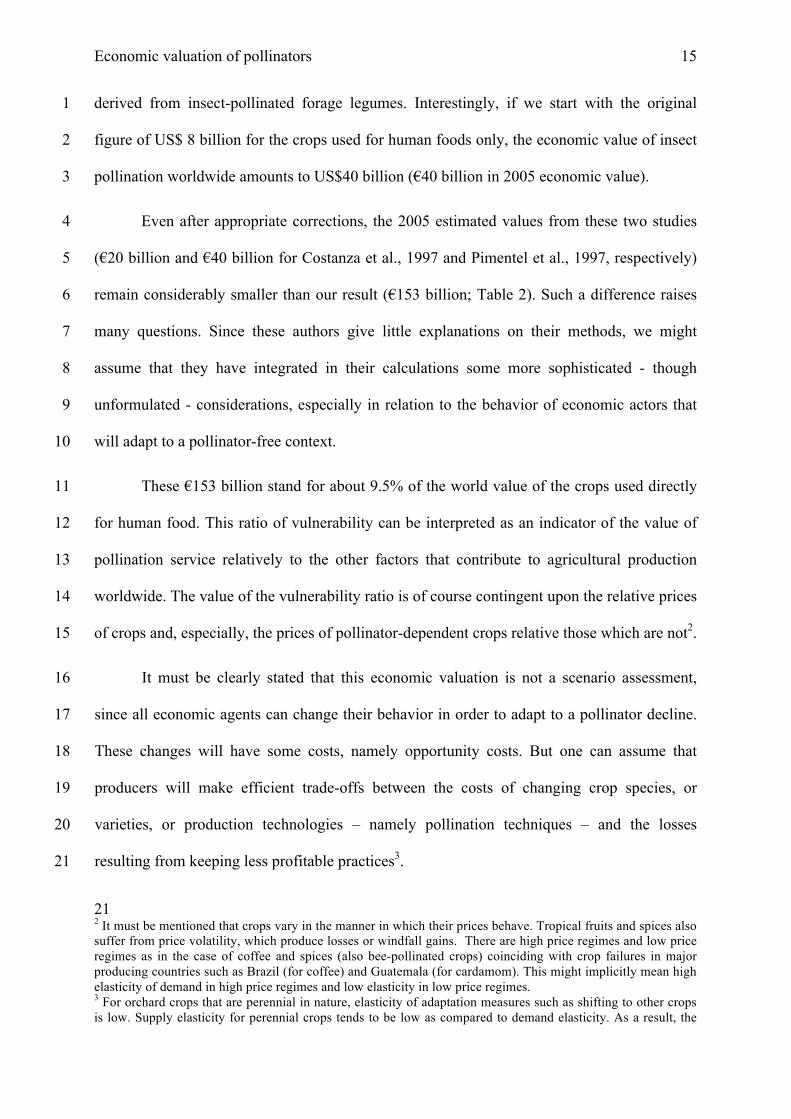
Economic valuation of pollinators 15
derived from insect-pollinated forage legumes. Interestingly, if we start with the original 1
figure of US$ 8 billion for the crops used for human foods only, the economic value of insect 2
pollination worldwide amounts to US$40 billion (€40 billion in 2005 economic value). 3
Even after appropriate corrections, the 2005 estimated values from these two studies 4
(€20 billion and €40 billion for Costanza et al., 1997 and Pimentel et al., 1997, respectively) 5
remain considerably smaller than our result (€153 billion; Table 2). Such a difference raises 6
many questions. Since these authors give little explanations on their methods, we might 7
assume that they have integrated in their calculations some more sophisticated - though 8
unformulated - considerations, especially in relation to the behavior of economic actors that 9
will adapt to a pollinator-free context. 10
These €153 billion stand for about 9.5% of the world value of the crops used directly 11
for human food. This ratio of vulnerability can be interpreted as an indicator of the value of 12
pollination service relatively to the other factors that contribute to agricultural production 13
worldwide. The value of the vulnerability ratio is of course contingent upon the relative prices 14
of crops and, especially, the prices of pollinator-dependent crops relative those which are not2. 15
It must be clearly stated that this economic valuation is not a scenario assessment, 16
since all economic agents can change their behavior in order to adapt to a pollinator decline. 17
These changes will have some costs, namely opportunity costs. But one can assume that 18
producers will make efficient trade-offs between the costs of changing crop species, or 19
varieties, or production technologies – namely pollination techniques – and the losses 20
resulting from keeping less profitable practices3. 21
21 2 It must be mentioned that crops vary in the manner in which their prices behave. Tropical fruits and spices also suffer from price volatility, which produce losses or windfall gains. There are high price regimes and low price regimes as in the case of coffee and spices (also bee-pollinated crops) coinciding with crop failures in major producing countries such as Brazil (for coffee) and Guatemala (for cardamom). This might implicitly mean high elasticity of demand in high price regimes and low elasticity in low price regimes. 3 For orchard crops that are perennial in nature, elasticity of adaptation measures such as shifting to other crops is low. Supply elasticity for perennial crops tends to be low as compared to demand elasticity. As a result, the

Economic valuation of pollinators 16
It appears difficult to gauge the real significance of a vulnerability of about 10% on 1
the agricultural industry. In some cases, a small variation may induce large consequences, 2
especially through the impact it might have on the financial equilibrium of farms. The 3
transmission of the price change can have variable effects within the food supply chain (Wu, 4
2004; Tang, 2005) and the capacity of the food supply chain operators to adapt to new 5
situations and limit the consequences, either through technical change or because of the 6
existence of market power, is poorly known (Hassan and Simioni, 2001). 7
Furthermore, the decline of pollinators will certainly be heterogeneous among 8
different regions of the world due to differences in land and crop management as well as the 9
abundance and diversity of wild and managed bees. For example, in a reverse scenario 10
Roubik & Wolda (2001) found that the arrival of Africanized honey bees in South and Central 11
America resulted in much higher population densities of bees, and this translated into 12
increased coffee production (Roubik, 2002). On a smaller scale, landscape management is 13
also likely to affect pollinator density (Kremen et al., 2002; Klein et al., 2007). 14
A first step towards a better understanding of the meaning of a 10% vulnerability ratio 15
could consist in introducing an economic measure of this vulnerability in terms of consumer 16
surplus. Southwick and Southwick (1992) estimated the economic value of honeybees as 17
agricultural pollinators in the USA based upon a measure of the surplus gain resulting from 18
their pollination service. They considered a price reaction to quantity limitation related to the 19
dependence ratio that leads to the following expression of the consumer monetary surplus 20
gain for each crop: 21
Gain =
€
Q1(P1 − P0) + P(Q)− P0[ ]Q1
Q0∫ dQ [5] 22
22 opportunity costs of taking up new crops would likely be very high.
Economic valuation of pollinators 17
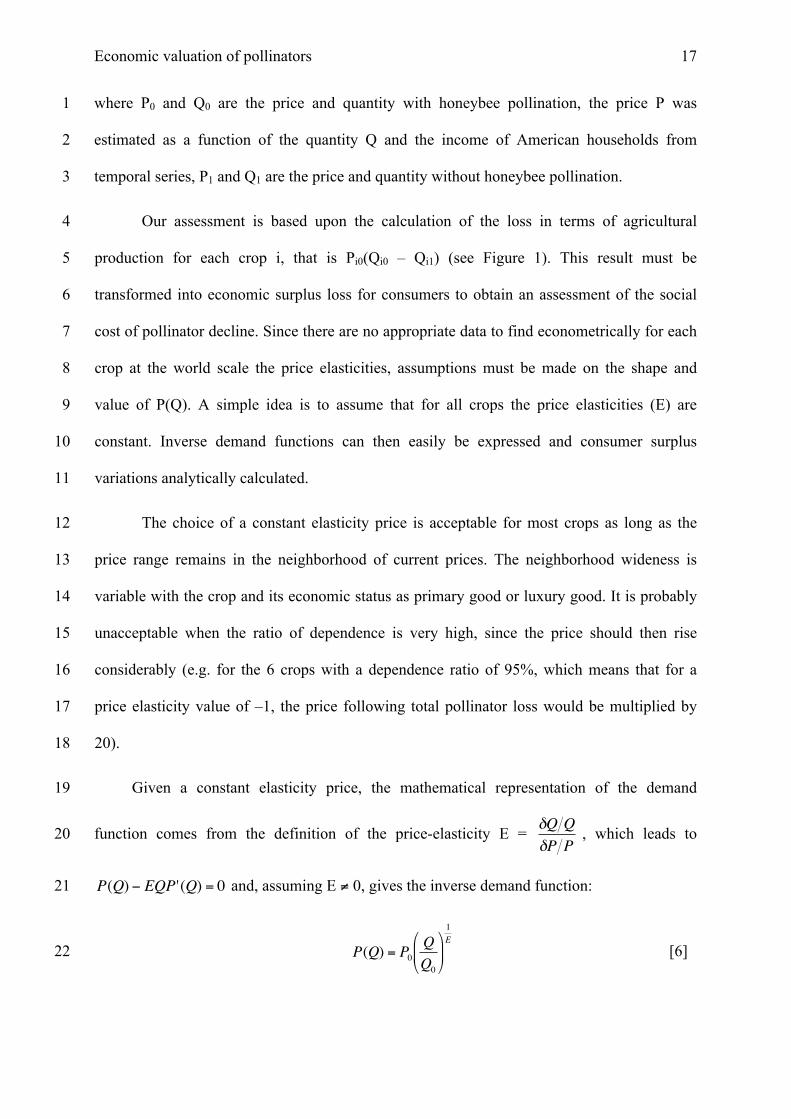
where P0 and Q0 are the price and quantity with honeybee pollination, the price P was 1
estimated as a function of the quantity Q and the income of American households from 2
temporal series, P1 and Q1 are the price and quantity without honeybee pollination. 3
Our assessment is based upon the calculation of the loss in terms of agricultural 4
production for each crop i, that is Pi0(Qi0 – Qi1) (see Figure 1). This result must be 5
transformed into economic surplus loss for consumers to obtain an assessment of the social 6
cost of pollinator decline. Since there are no appropriate data to find econometrically for each 7
crop at the world scale the price elasticities, assumptions must be made on the shape and 8
value of P(Q). A simple idea is to assume that for all crops the price elasticities (E) are 9
constant. Inverse demand functions can then easily be expressed and consumer surplus 10
variations analytically calculated. 11
The choice of a constant elasticity price is acceptable for most crops as long as the 12
price range remains in the neighborhood of current prices. The neighborhood wideness is 13
variable with the crop and its economic status as primary good or luxury good. It is probably 14
unacceptable when the ratio of dependence is very high, since the price should then rise 15
considerably (e.g. for the 6 crops with a dependence ratio of 95%, which means that for a 16
price elasticity value of –1, the price following total pollinator loss would be multiplied by 17
20). 18
Given a constant elasticity price, the mathematical representation of the demand 19
function comes from the definition of the price-elasticity E =
€
δQ QδP P
, which leads to 20
€
P(Q) − EQP'(Q) = 0 and, assuming E ≠ 0, gives the inverse demand function: 21
€
P(Q) = P0QQ0
1E
[6] 22
Economic valuation of pollinators 18
We will also assume, following Southwick and Southwick (1992), that the long-term 1
supply curve is perfectly elastic, which means that farmers can switch from one crop to 2
another without increasing production cost and without constraint of arable land availability. 3
It means that there is no producer surplus variation and then the consumer surplus variation is 4
actually the social surplus variation. 5
We used the large matrix that was built to measure the economic value of insect 6
pollination (Appendices 2 and 3) to calculate what would be the consumer surplus loss 7
according to several price elasticity values. For each value, we applied our hypotheses to each 8
crop with its specific dependence ratio to pollinators. 9
The choice of a unique value for E may seem like an oversimplification. But choosing 10
different values of E for each crop in each region would be equally arbitrary since these 11
values could not be determined from appropriate econometric data. Some crops, like cereals, 12
are generally associated with low price elasticities, usually estimated to be |E| < 0.5 in the 13
literature. Other crops, such as fruits, appear to have higher price-elasticities, |E| > 1 and 14
possibly much more in some cases (Southwick and Southwick, 1992). 15
The choice of the unique value of E for all crops must take into account the relative 16
importance of crops with high and low elasticities, which are used to calculate the total 17
consumer surplus loss. Fruits, vegetables, nuts, edible oil crops, stimulant crops, and spices 18
are the most pollinator-dependent crop categories and they are also those that will make the 19
largest part of the total loss. Yet they are also those that appear most likely to have the highest 20
elasticities. So the overall appropriate figure for E is likely to be in the neighborhood of -1. 21
Furthermore, a distinction must be made between short-term and long-term elasticities, the 22
latter being traditionally higher (|E| > 1). Since we consider a hypothetical situation of total 23
pollinator loss, long-term elasticities appear more appropriate. 24

Economic valuation of pollinators 19
We have to assess now what will happen to the food production and markets after 1
insect pollinators decline to a complete loss. The first consequence is a loss in production 2
from Q0 to Q0(1–D) for a similar production effort (i.e. without change in the total production 3
costs). If a smaller production is obtained for the same total cost, we can assume that the 4
unitary production cost will grow from P0 to P0/(1-D) = P1. We will then consider that Pi1 is 5
the new price of the crop i on the market of our pollinator-free economy. At this price, the 6
effective demand will be Qi(Pi1) = Qi1. This assumption allowed us to calculate the 7
consequent surplus loss (CSloss ; Figure 1) according to the value of E. 8
€
CSlossi = Qi1 Pi1−Pi0( ) + Pi(Qi) − Pi0[ ]Qi1
Qi 0∫ dQ [7] 9
For the value E = -1, it comes from [6] that P(Q) = P0.Q0/Q, and Q1(P1-P0) = P0(Q0-10
Q1). The consumer surplus loss is then: 11
€
CSloss = P(Q)[ ]Q1
Q0∫ dQ =P0Q0
QQ0
Q1∫ δQ = P0Q0 .LogQ1Q0
[8] 12
where P1 and Q1 are the price and quantity without insect pollination, P0 and Q0 are the price 13
and quantity with insect pollination. If we apply this expression to a quantity reduction related 14
to a total pollinator loss for a crop with a ratio of dependence D, Q1 = Q0(1-D) and it comes: 15
€
CSloss =P0.Q0.Log(1−D) . This value is easy to calculate using the matrix of prices and 16
quantities in Appendices 2 and 3. Applying this formula to all crops used directly for human 17
food on a worldwide basis gives a total loss of consumer surplus of about €260 billion for 18
2005. 19
For any price-elasticity E ≠ –1, it comes: 20
€
CSloss =P0Q0
1+ E1
1−D
1+E
−1
. [9] 21
This value can be calculated for any value of E using the database of all crops in each world 22
Economic valuation of pollinators 20
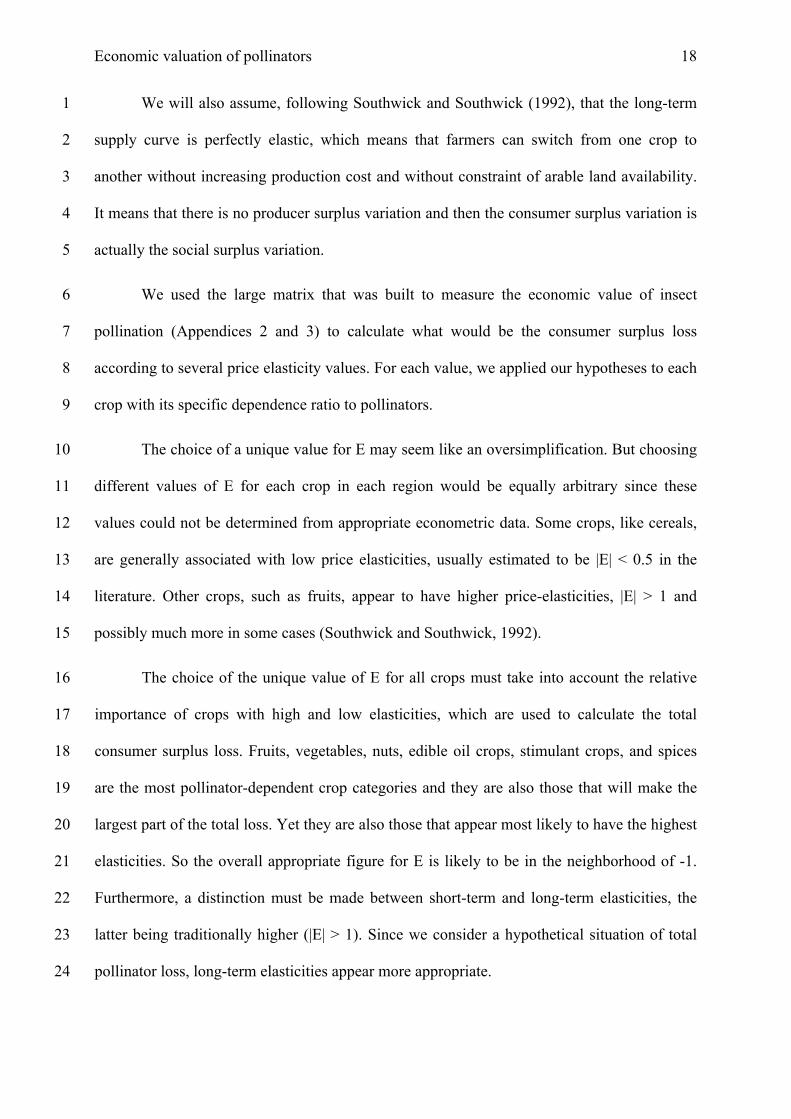
region (Appendices 2 and 3): 1
€
Pix0Qix0
1+ E1
1−Di
1+E
−1
x=1
X
∑i=1
I
∑ . [10] 2
For E = -0.8, we find €310 billions; and for E = -1.5, about €191 billion (see Table 7). 3
Though a more refined analysis remains to be done, it is possible to suggest some 4
changes that are likely to take place in the behavior of producers, agro food supply chains, 5
and consumers, if the decline in insect pollination services is further confirmed. Farmers 6
would at least to some extent switch from pollinator-dependent crops to less dependent 7
species or, when available, varieties. But a first reaction would probably be in many cases, as 8
it is widely done for fruit production in the USA, to try to improve insect pollination through 9
the management of selected species and the development of artificial pollination techniques. 10
For the rare pollinator-dependent crops with low price elasticity (|E| < 1; i.e. apples 11
with E = -0.59, (Southwick & Southwick, 1992) the farmers’ income will increase when 12
yields decrease since prices will rise faster (‘King effect’). This effect should nevertheless be 13
limited by competition among farmers and resulting production enhancing investment. 14
Following the agro food supply chains, it can be assumed that optimization tuning will 15
aim at reducing the impact of pollinator decline onto consumers, through substitution both in 16
the nature of the good and the processing formula. Finally, consumers would modify their 17
choices according to the relative prices of food items and, in the case of strong change; the 18
food budget might compete with other parts of the consumption patterns4. 19
The potential loss in some food production may not have measurable consequences in 20
economic terms only, as it might also have serious consequences on human health. In 21
21 4 The emergence of organic foods and widespread concerns about GM foods has reduced elasticity of substitution for health foods (organic and non GM traditional foods) despite health foods carrying higher prices. Finally, the loss in output of conventional pollinated crops due to inadequate pollination forms a deadweight loss, net loss to producer and consumers and hence to society.
Economic valuation of pollinators 21
particular, the decrease of fruit and vegetable availability could impact the health of 1
consumers worldwide. The World Health Organisation (WHO) has set a lower limit of 400 2
grams per capita and per day for fruit and vegetable consumption (WHO Report, 1990). 3
Naska et al. (2000) studied fruit and vegetable consumption among ten European countries 4
and found that more than 50% of the households were below this recommendation. In the 5
case of a total disappearance of pollinators, this situation is very likely to worsen. 6
4 Conclusions 7
The aim of our work was to assess the vulnerability of the food production worldwide faced 8
to the decline of insect pollinators. Non-food agricultural production, cattle raising, and 9
natural vegetation will also be impacted but are not studied in this paper. Using a 10
bioeconomic approach, we calculated a world value for the contribution of pollinators to the 11
production of crops used directly for human food of €153 billion, which is about 9.5% of the 12
total value of the production of human food worldwide. 13
Since this first result was obtained through multiples sums, we extracted partial results 14
such as the most vulnerable crop categories (stimulant crops, nuts and fruits) or the categories 15
that stood for the largest part of the economic vulnerability (fruits, edible oil crops, 16
vegetables). Related to their agricultural orientations, some regions appeared more vulnerable 17
like Middle East Asia (15%), Central Asia (14%), East Asia (12%) and non European Union 18
countries (12%). At the global scale, the vulnerability of the Northern countries appeared 19
higher than the southern ones, which suggests that the decline of insect pollinators might have 20
heavy consequences for the North-South agro-food trade. To complete these data, we 21
calculated the capacity to nourrish world population after pollinator loss and found that the 22
production of 3 crop categories will be clearly below the current consumption at the world 23
scale and even more so for certain regions like Europe. 24

Economic valuation of pollinators 22
Although we created a complete database of prices and production quantities for each 1
crop in each region of the world and we used a very recent review to get the dependence ratio 2
of each crop on insect pollination, the uncertainties are probably large but difficult to assess, 3
especially since ecological responses to pollinator decline on large scales remain poorly 4
known (National Research Council, 2007). More specifically, there is an ongoing debate on 5
the existence of a “pollinator paradox” meaning that though crops depend on pollinators, the 6
overall crop yield may not necessarily be as dependent because farmers will take into account 7
pollinator decline in their production management and strategies (Ghazoul, 2007). 8
Despite these uncertainties, we discussed these results in terms of consumer surplus 9
loss, which is a more appropriate indicator of the economic valuation of these vulnerabilities. 10
Since it was not possible to rely on econometrically estimated price elasticities for each crop 11
in each region, our calculations relied on the assumption of an average sensitivity of prices to 12
quantity shortage. Stating that the most vulnerable crops appear to be more sensitive to price 13
variation, the more realistic elasticity parameter is likely to be |E| > 1. Furthermore, since we 14
considered the evolution over the long term, we can make the optimistic assumption that 15
farmers would adapt without significant cost, and the social surplus losses would be in the 16
range of €310-191 billions for elasticity parameters ranging from –0.8 down to –1.5. 17
Although our results demonstrate the economic importance of insect pollinators, it 18
cannot be considered as a scenario since it does not take into account the strategic response of 19
the market. Producers might have several levels of response strategies in interaction with the 20
intermediate demands of the food supply chain. Moreover, the response of consumers faced to 21
dramatic changes of relative prices would probably be more elaborate than the simple price-22
elasticity can summarize. Short and long term reaction for each crop and in each region would 23
probably be quite different and should be studied specifically in further work. 24
25

Economic valuation of pollinators 23
Acknowledgements 1
This research was funded by the EC within the FP6 Integrated Project “ALARM” (Assessing 2
LArge scale environmental Risks for biodiversity with tested Methods; GOCE-CT-2003-3
506675; http://www.alarmproject.net; Settele et al., 2005). The authors thank Joshua Bishop, 4
Jean-Marie Boisson, Gabriel Carré, Charles Figuières, Ghislain Géniaux, Mabel Tidball and 5
three anonymous referees for valuable comments on an early version of this text. 6
References 7
Biesmeijer, J. C., Roberts, S. P. M., Reemer, M., Ohlemüller, R., Edwards, M., Peeters, T., 8
Schaffers, A. P., Potts, S. G., Kleukers, R., Thomas, C. D., Settele, J., Kunin, W.E., 2006. 9
Parallel declines in pollinators and insect-pollinated plants in Britain and the Netherlands. 10
Science 313, 251-353. 11
Benedek, P. 1983. Economic importance of honey bee pollination of props at the national 12
level of Hungary. 29th International Apiculture Congress: Apimondia, 286-289. 13
Borneck, R., Bricout, J.P. 1984. Evaluation de l'incidence économique de l'entomofaune 14
pollinisatrice en agriculture. Bulletin Technique Apicole 11(2), 117-124. 15
Borneck, R., Merle B. 1989. Essai d'une évaluation de l'incidence économique de l'abeille 16
pollinisatrice dans l'agriculture européenne. Apiacta 24, 33-38. 17
Carreck, N., Williams, I. 1998. The economic value of bees in the UK. Bee World 79, 115-18
123. 19
Carreck, N.L., Williams, I.H., Little, D.J. 1997. The movement of honey bee colonies for crop 20
pollination and honey production by beekeepers in Great Britain. Bee World 78, 67-77. 21
Clement SL, Hellier BC, Elberson LR, Staska RT, Evans MA. 2007. Flies (Diptera: 22
Muscidae: Calliphoridae) are efficient pollinators of Allium ampeloprasum L. (Alliaceae) 23
in field cages. Journal of Economic Entomology 100, 131-135. 24
Costanza, R., D'Arge, R., De Groot, R., Farber, S., Grasso, M., Hannon, B., Limburg, K., 25
Naeem, S., O'Neill, R. V., Paruelo, J., Raskin, P., van den Belt, M., 1997. The Value of 26
the world's ecosystem services. Nature 387, 253-260. 27
Dag, A., Zipori, I., Pleser, Y., 2006. Using bumblebees to improve almond pollination by the 28
honeybee. Journal of Apicultural Research 45, 215-216. 29

Economic valuation of pollinators 24
Dedej S, Delaplane KS. 2003. Honey bee (Hymenoptera: Apidae) pollination of rabbiteye 1
blueberry Vaccinium ashei var. 'Climax' is pollinator density-dependent. Journal of 2
Economic Entomology 96, 1215-1220. 3
Eurostat. Statistical Database. Available at http://epp.eurostat.ec.europa.eu ; Agriculture, 4
forestry and fisheries themes/Agriculture/Agricultural prices and price indices. Last 5
accessed in October 2006. 6
Food and Agriculture Organization. Statistical Database. Available at http://faostat.fao.org ; 7
Agricultural data/Agricultural production/Crops primary. Last accessed in July 2007. 8
Fluri, P., Frick, R. 2005. L’apiculture en Suisse: état et perspectives.. Revue Suisse 9
d'Agriculture 37(2), 81-86. 10
Free, J. B., 1993. Insect pollination of crops. London, UK: Academic Press. 544 pp. 11
Ghazoul, J., 2007. Recognizing the complexities of ecosystem management and the 12
ecosystem service concept. GAIA 16, 215-221. 13
Greenleaf, S. S., Kremen, C., 2006. Wild bees enhance honey bees’ pollination of hybrid 14
sunflower. Proceedings of the National Academy of Sciences USA 103, 13890-13895. 15
Hassan, D., Simioni, M., 2001. Price Linkage and Transmission between Shippers and 16
Retailers in the French Fresh Vegetable Channel. Working paper, INRA-ESR, Toulouse. 17
Klein, A.-M., Vaissière, B. E., Cane, J.H., Steffan-Dewenter, I., Cunnigham, S. A., Kremen, 18
C., Tscharntke, T., 2007. Importance of pollinators in changing landscapes for world 19
crops. Proceedings of the Royal Society 274, 303–313. 20
Kremen, C., Williams, N. M., Thorp, R. W., 2002. Crop pollination from native bees at risk 21
from agricultural intensification. Proceedings of the National Academy of Sciences USA 22
99, 16812-16816. 23
Levin, M. D., 1984. Value of bee pollination to United State agriculture. American Bee 24
Journal 124, 184-186. 25
Losey, J. E., Vaughan, M., 2006. The economic value of ecological services provided by 26
insects. BioScience 56, 311-323. 27
Martin E. C., 1975. The use of bees for crop pollination. In: Dadant & Sons (Editors), The 28
hive and the honey bee. Hamilton, Illinois, pp. 579-614. 29
McGregor, S. E., 1976 Insect pollination of cultivated crop plants. Agriculture Handbook, 30
United States Department of Agriculture, Washington DC. (available at 31
http://gears.tucson.ars.ag.gov/book/). 32
Economic valuation of pollinators 25
Metcalf R.L., Metcalf R.A., 1992. The Value of insects to humans, In : Destructive and 1
Useful Insects: Their Habits and Control. McGraw-Hill Book Company, Inc. New York. 2
Frank J. Kotowski, Jr., ed. 3
Morandin, L.A., Winston, M.L., 2005. Wild bee abundance and seed production in 4
conventional, organic, and genetically modified canola. Ecological Applications 15, 871-5
881. 6
Morse, R. A., Calderone, N. W. 2000. The value of honey bees as pollinators of U.S. crops in 7
2000. Bee Culture, 1-15. 8
Naska, A., Vasdekis, V. G. S., Trichopoulou, A., Friel, S., Leonhäuser, I. U., Moreiras, O., 9
Nelson, M., Remault, A. M., Schmitt, A., Sekula, W., Trygg, K. U., Zajkas, G. 2000. 10
Fruit and vegetable availability among ten European countries: how does it compare with 11
the 'five-a-day' recommendation? British Journal of Nutrition 84, 549-556. 12
National Research Council of the National Academies, 2006. Status of Pollinators in North 13
America. National Academy of Science, Washington, D.C., 303 pp. 14
Olmstead, A.L., Wooten, D.W., 1987. Bee pollination and productivity growth: the case of 15
alfalfa. American Journal of Agricultural Economics, 69, 56-63. 16
Olroyd, B. P., 2007. What’s killing American honey bee ? PLoS Biology 5(6), e168. 17
Pimentel, D., Wilson, C., McCullum, C., Huang, R., Dwen, P., Flack, J., Tran, Q., Saltman, 18
T., Cliff, B., 1997. Economic and environmental benefits of biodiversity. BioScience 47, 19
747-757. 20
Robinson, W. S., Nowogrodzki, R., Morse, R. A., 1989. The value of honey bees as 21
pollinators of U.S. crops: Part II. American Bee Journal 129, 477-87. 22
Roubik, D. W., 2002. Tropical agriculture: The value of bees to the coffee harvest. Nature 23
417, 708. 24
Roubik DW, Wolda H. 2001. Do competing honey bees matter? Dynamics and abundance of 25
native bees before and after honey bee invasion. Population Ecology 43 :53-62. 26
Schubert, C., 2006. Can biofuels finally take center stage ? Nature Biotechnology 24, 777-27
784. 28
Schröter, D., Polsky, C., Patt, A. G., 2005. Assessing vulnerabilities to the effects of global 29
change: An eight step approach. Mitigation and Adaptation Strategies for Global Change 30
10, 573-596. 31
Settele, J., Hammen, V., Hulme, P., Karlson, U., Klotz, S., Kotarac, M., Kunin, W., Marion, 32
G., O'Connor, M., Petanidou, T., Peterson, K., Potts, S., Pritchard, H., Pysek, P., 33
Rounsevell, M., Spangenberg, J., Steffan-Dewenter, I., Sykes, M., Vighi, M., Zobel, M., 34
Economic valuation of pollinators 26
Kühn, I., 2005. ALARM: Assessing large-scale environmental risks for biodiversity with 1
tested methods. GAIA 14, 69-72. 2
Southwick, E. E., Southwick, L., 1992. Estimating the economic value of honey-bees 3
(Hymenoptera, Apidae) as agricultural pollinators in the United-States. Journal of 4
Economic Entomology 85, 621-633. 5
Steffan-Dewenter, 2003. Seed set of male-sterile an male-fertile oilseed rape (Brassica napus) 6
in relation to pollinator density. Apidologie, 34, 227-235. 7
Stokstad, E., 2007. The case of the empty hives. Science 316, 970-972. 8
Sumner, D.A. and Boriss, H. 2006. Bee-conomics and the leap in pollination fees. ARE 9
update, Univ. California, Giannini Foundation 9(3) Jan/Feb. 2006. 10
http://www.agecon.ucdavis.edu/uploads/update_articles/v9n3_3.pdf 11
Tang K., 2005. Multi-agent and market based dynamic optimisation and its extensions to 12
distributed supply chain procurement planning problems. PhD thesis, Pennsylvania State 13
University, May 2005, 197 pp. 14
Turner, B.L., Kasperson, R.E., Matson, P., McCarthy, J.J., Corell, R.W., Christensen, L., 15
Eckley, N., Kasperson, J.X., Luers, A., Martello, M.L., Mathiesen, S., Polsky, C., 16
Pulsipher, A., Schiller, A. and Tyler, N., 2003. A framework for vulnerability analysis in 17
sustainability science. Proceedings of the National Academy of Sciences USA 100, 8074-18
8079. 19
United States Department of Agriculture. Statistical Database. Available at 20
http://www.fas.usda.gov, Commodities and Products. Last accessed in October 2006. 21
Velthuis, H. H. W., van Doorn, A., 2006. A century of advances in bumblebee domestication 22
and the economic and environmental aspects of its commercialization for pollination. 23
Apidologie 37, 421-451. 24
White, G.F. 1974. Natural Hazards: Local, National and Global. Oxford University Press, 25
New York. 304 pp. 26
Williams, I. H. 1994. The dependence of crop production within the European Union on 27
pollination by honey bees. Agricultural Zoology Reviews 6, 229-257. 28
Winfree R., Williams N.M., Dushoff J., Kremen C., 2007. Native bees provide insurance 29
against ongoing honey bee losses. Ecology Letters 10, 1105-1113. 30
Winfree R., Williams N.M., Gaines H., Ascher J.S., Kremen C., 2008. Wild bee pollinators 31
provide the majority of crop visitation across land-use gradients in New Jersey and 32
Pennsylvania, USA. Journal of Applied Ecology 45:793-802. 33
Economic valuation of pollinators 27
World Health Organization, 1990. Diet, Nutrition and the Prevention of Chronic diseases. 1
Technical Report Series no. 797. Geneva: WHO. 2
Wu S.D., 2004. Supply chain intermediation: A bargaining theoretical framework. In D. 3
Simchi-Levi, S.D. Wu and Z.M. Shen (Eds.), Handbook of Quantitative Supply Chain 4
Analysis. Kluwer Academic Publishers, 67-115. 5
6
Tables and figures Table 1 - Heterogeneity of the production dependence ratios reported for some selected crops
in regards to insect pollination (extrema are underlined). Table 2 – Economic impact of insect pollination on the main categories of the world
agricultural production used directly for human food and ranked by their rate of vulnerability to pollinator loss.
Table 3 – Geographical distribution of crop production value, economic impact of pollinators
and vulnerability ratio among the 16 regions of the world defined following FAO (http://faostat.fao.org).
Table 4 – Economic vulnerability ratio (in bold) and 2005 production figures in 106 metric
tons (in italics) for the pollinator-dependent crop categories among the 16 regions of the world defined following FAO (http://faostat.fao.org). X% highest value of the economic vulnerability ratio for the sub-region.
Table 5 – Effect of pollinator loss on the capacity to provide food at the world scale for the
pollinator-dependent crop categories. Table 6 – Regional effect of pollinator loss on the capacity to meet consumption before and
after (in bold) total pollinator loss for the three crop categories for which the overall 2005 balance was negative following pollinator loss.
Table 7 – Consumer surplus loss at the world scale for 2005 in relation with price elasticity Figure 1 – Estimates of the consumer surplus loss for different values of price elasticity
Economic valuation of pollinators – Tables and figure 29
Table 1 - Heterogeneity of the dependence ratios reported for the production of some selected crops in regards to insect pollination (extrema are underlined).
Crop species Common name Borneck & Bricout, 1984 Robinson et al., 1989
Southwick & Southwick,
1992
Morse & Calderone,
2000
Klein et al., 2007
Min Max Mean Min Max Mean
FRUITS
Fragaria x ananassa Strawberry 0.100 0.200 0.150 0.4 0.30 0.2 0.1 0.4 0.25
Malus domestica Apple 0.100 0.200 0.150 1.0 0.80 1.0 0.4 0.9 0.65
Vitis vinifera Grape 0.001 0.010 0.006 0.1 0.15 0.1 0.0 0.0 0.00 NUTS
Amygdalus communis Almond 0.100 0.200 0.150 1.0 0.90 1.0 0.4 0.9 0.65 VEGETABLES
Cucumis melo Melon (incl. cantaloupe) 0.100 0.200 0.150 0.8 0.70 0.9 0.9 1.0 0.95
Mean 0.120 0.66 0.57 0.64 0.50
Economic valuation of pollinators – Tables and figure 30
Table 2 – Economic impact of insect pollination of the world agricultural production used directly for human food and listed by the main categories ranked by their rate of vulnerability to pollinator loss; the economic value of insect pollination was calculated following [1].
Crop category
Average value of a production
unit
Total production economic value
(EV)
Insect pollination
economic value (IPEV)
Rate of vulnerability (IPEV/EV)
€ per metric ton 109€ 109€ %
Stimulant crops 1225 19 7.0 39.0
Nuts 1269 13 4.2 31.0
Fruits 452 219 50.6 23.1
Edible oil crops 385 240 39.0 16.3
Vegetables 468 418 50.9 12.2 Pulse 515 24 1.0 4.3
Spices 1003 7 0.2 2.7 Cereals 139 312 0.0 0.0
Sugar crops 177 268 0.0 0.0 Roots & tubers 137 98 0.0 0.0
All categories pooled together
1 618 152.9 9.5
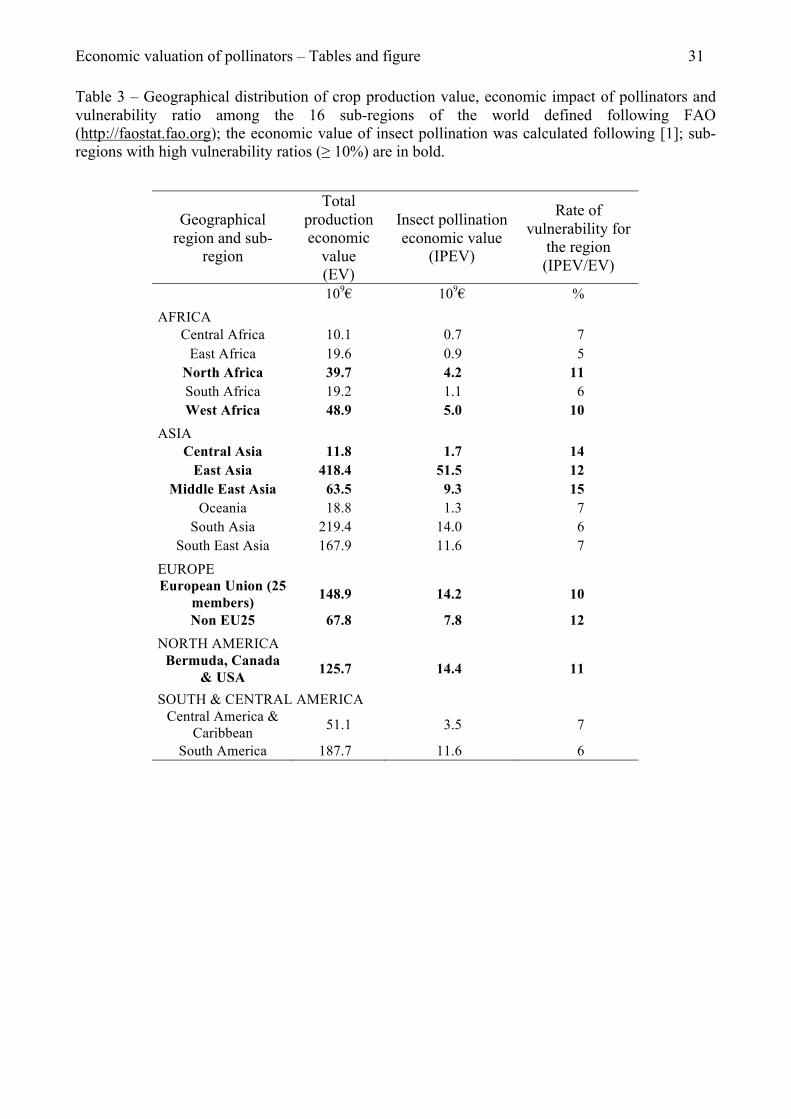
Economic valuation of pollinators – Tables and figure 31 Table 3 – Geographical distribution of crop production value, economic impact of pollinators and vulnerability ratio among the 16 sub-regions of the world defined following FAO (http://faostat.fao.org); the economic value of insect pollination was calculated following [1]; sub-regions with high vulnerability ratios (≥ 10%) are in bold.
Geographical region and sub-
region
Total production economic
value (EV)
Insect pollination economic value
(IPEV)
Rate of vulnerability for
the region (IPEV/EV)
109€ 109€ % AFRICA
Central Africa 10.1 0.7 7 East Africa 19.6 0.9 5
North Africa 39.7 4.2 11 South Africa 19.2 1.1 6 West Africa 48.9 5.0 10
ASIA Central Asia 11.8 1.7 14
East Asia 418.4 51.5 12 Middle East Asia 63.5 9.3 15
Oceania 18.8 1.3 7 South Asia 219.4 14.0 6
South East Asia 167.9 11.6 7
EUROPE European Union (25
members) 148.9 14.2 10
Non EU25 67.8 7.8 12 NORTH AMERICA
Bermuda, Canada & USA 125.7 14.4 11
SOUTH & CENTRAL AMERICA Central America &
Caribbean 51.1 3.5 7
South America 187.7 11.6 6

Economic valuation of pollinators – Tables and figure 32 Table 4 – Economic vulnerability ratio (in bold) and 2005 production figures in 106 metric tons (in italics) for the pollinator-dependent crop categories among the 16 sub-regions of the world defined following FAO (http://faostat.fao.org). X% highest value of the economic vulnerability ratio for the sub-region.
Geographical region and sub-region
Edible oil crops Fruits Nuts Pulse Spices Stimulant
crops Vegetables
AFRICA 8% 4% 0% 1% 5% 69% 10% Central Africa 4.37 5.71 0.04 0.12 0.05 0.28 2.58
18% 4% 22% 10% 3% 17% 4% East Africa 2.08 6.39 0.18 1.70 0.18 1.05 6.85 13% 16% 58% 15% 4% - 13% North Africa 3.86 15.73 0.24 1.04 0.14 0 30.45 17% 15% 45% 0% 25% 16% 8% South Africa 2.74 7.95 0.08 0.41 0.06 0.16 4.11 9% 11% 46% 2% 3% 90% 5% West Africa 23.81 10.88 1.03 0.00 0.25 2.53 17.47
ASIA 25% 41% 35% 4% 4% - 14%
Central Asia 4.00 2.16 0.03 0.06 0.00 0 8.59 17% 36% 16% 10% 3% 2% 15% East Asia 62.76 94.71 1.70 5.64 0.76 1.08 462.56 18% 24% 18% 3% 1% 3% 18% Middle East Asia 5.27 32.97 1.55 2.98 0.23 0.28 49.57 24% 28% 33% 6% 1% 94% 8% Oceania 3.69 5.08 0.05 2.14 0.01 0.01 2.86 19% 23% 23% 0% 2% 11% 7% South Asia 44.41 56.09 1.00 13.24 3.79 1.51 92.93 11% 13% 44% 3% 2% 38% 7% South East Asia 186.07 44.32 1.39 2.22 0.87 2.74 30.90
EUROPE 8% 30% 48% 5% 1% - 7%
European Union (25 members) 31.94 60.05 0.82 5.49 0.13 0 65.35 24% 51% 4% 1% 3% 0% 12% Non EU25 17.81 13.31 0.28 2.83 0.12 0.02 35.08
NORTH AMERICA
23% 24% 46% 3% 0% - 8% Bermuda, Canada & USA 110.74 27.62 1.31 6.56 0.04 0 39.74
SOUTH & CENTRAL AMERICA 14% 10% 1% 5% 2% 29% 12%
Central America & Caribbean 5.73 29.86 0.21 1.12 0.16 1.21 19.49 22% 9% 25% 9% 3% 30% 8% South America
113.38 71.44 0.30 0.45 0.28 4.55 25.17
TOTAL 622.66 484.27 10.21 46.00 7.07 15.42 893.70
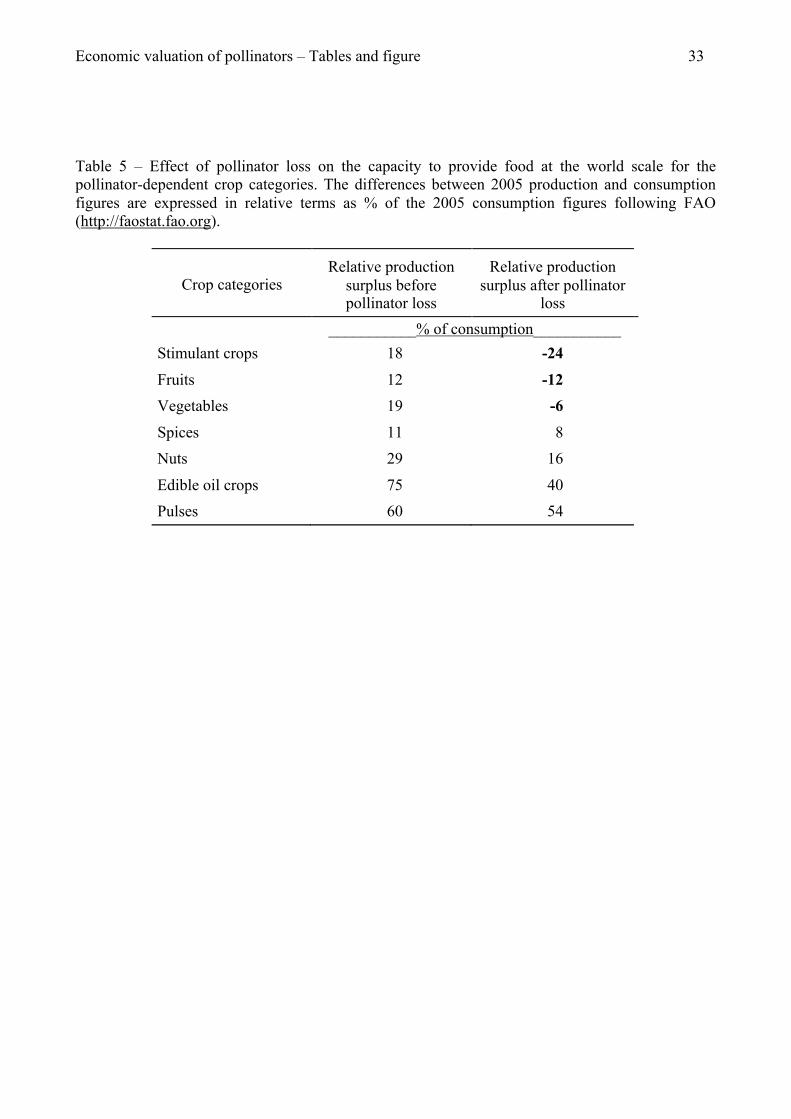
Economic valuation of pollinators – Tables and figure 33 Table 5 – Effect of pollinator loss on the capacity to provide food at the world scale for the pollinator-dependent crop categories. The differences between 2005 production and consumption figures are expressed in relative terms as % of the 2005 consumption figures following FAO (http://faostat.fao.org).
Crop categories Relative production
surplus before pollinator loss
Relative production surplus after pollinator
loss ___________% of consumption___________
Stimulant crops 18 -24 Fruits 12 -12 Vegetables 19 -6 Spices 11 8 Nuts 29 16
Edible oil crops 75 40 Pulses 60 54
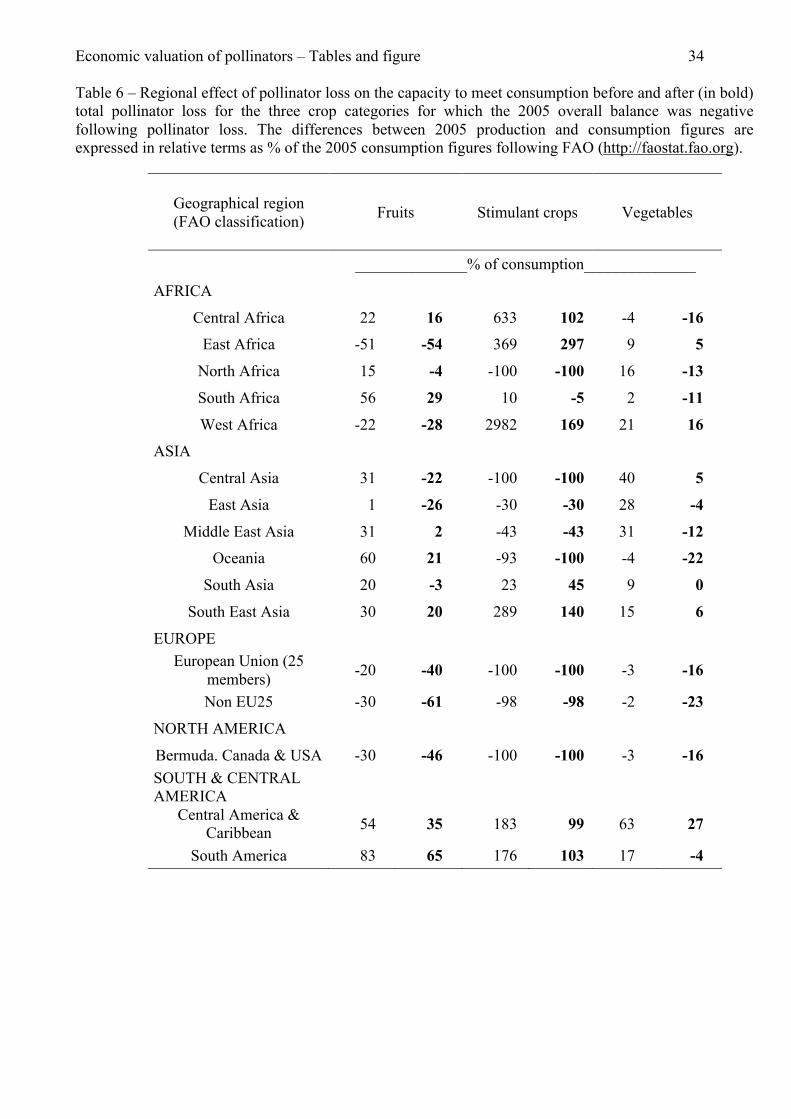
Economic valuation of pollinators – Tables and figure 34 Table 6 – Regional effect of pollinator loss on the capacity to meet consumption before and after (in bold) total pollinator loss for the three crop categories for which the 2005 overall balance was negative following pollinator loss. The differences between 2005 production and consumption figures are expressed in relative terms as % of the 2005 consumption figures following FAO (http://faostat.fao.org).
Geographical region (FAO classification) Fruits Stimulant crops Vegetables
______________% of consumption______________
AFRICA
Central Africa 22 16 633 102 -4 -16 East Africa -51 -54 369 297 9 5
North Africa 15 -4 -100 -100 16 -13
South Africa 56 29 10 -5 2 -11
West Africa -22 -28 2982 169 21 16 ASIA
Central Asia 31 -22 -100 -100 40 5
East Asia 1 -26 -30 -30 28 -4
Middle East Asia 31 2 -43 -43 31 -12 Oceania 60 21 -93 -100 -4 -22
South Asia 20 -3 23 45 9 0
South East Asia 30 20 289 140 15 6
EUROPE European Union (25
members) -20 -40 -100 -100 -3 -16
Non EU25 -30 -61 -98 -98 -2 -23
NORTH AMERICA
Bermuda. Canada & USA -30 -46 -100 -100 -3 -16 SOUTH & CENTRAL AMERICA
Central America & Caribbean 54 35 183 99 63 27
South America 83 65 176 103 17 -4
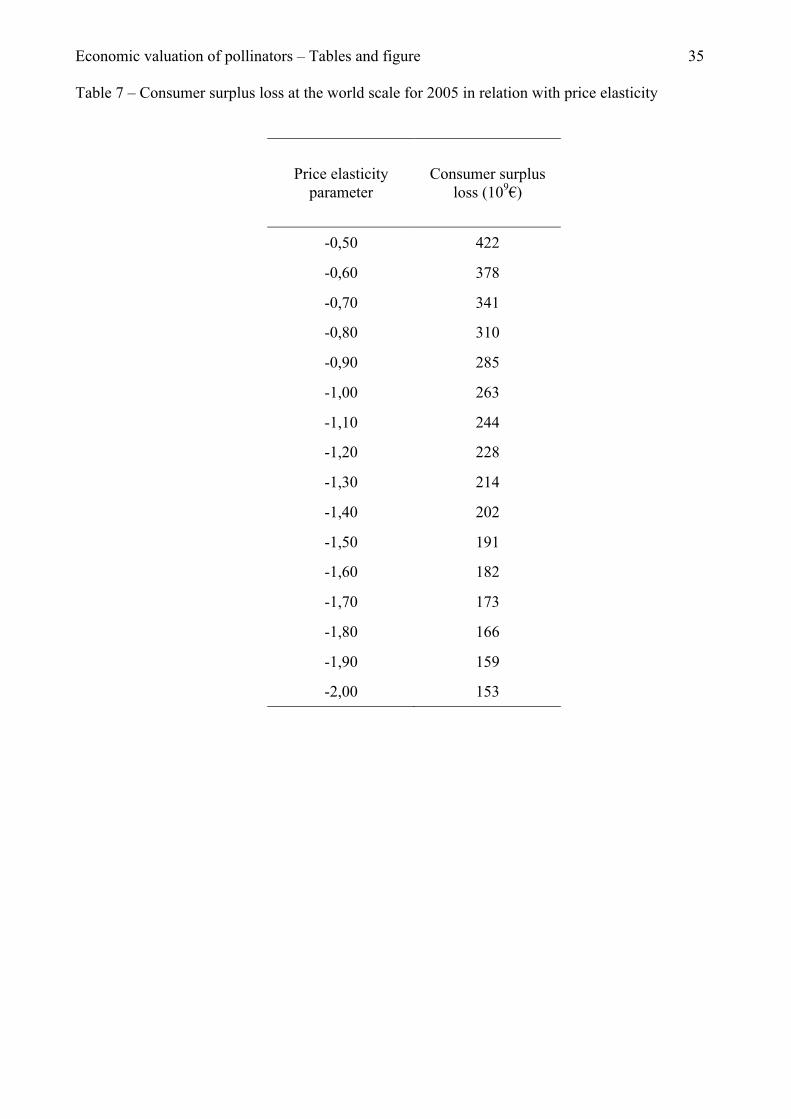
Economic valuation of pollinators – Tables and figure 35 Table 7 – Consumer surplus loss at the world scale for 2005 in relation with price elasticity
Price elasticity parameter
Consumer surplus loss (109€)
-0,50 422
-0,60 378
-0,70 341
-0,80 310
-0,90 285
-1,00 263
-1,10 244
-1,20 228
-1,30 214
-1,40 202
-1,50 191
-1,60 182
-1,70 173
-1,80 166
-1,90 159
-2,00 153
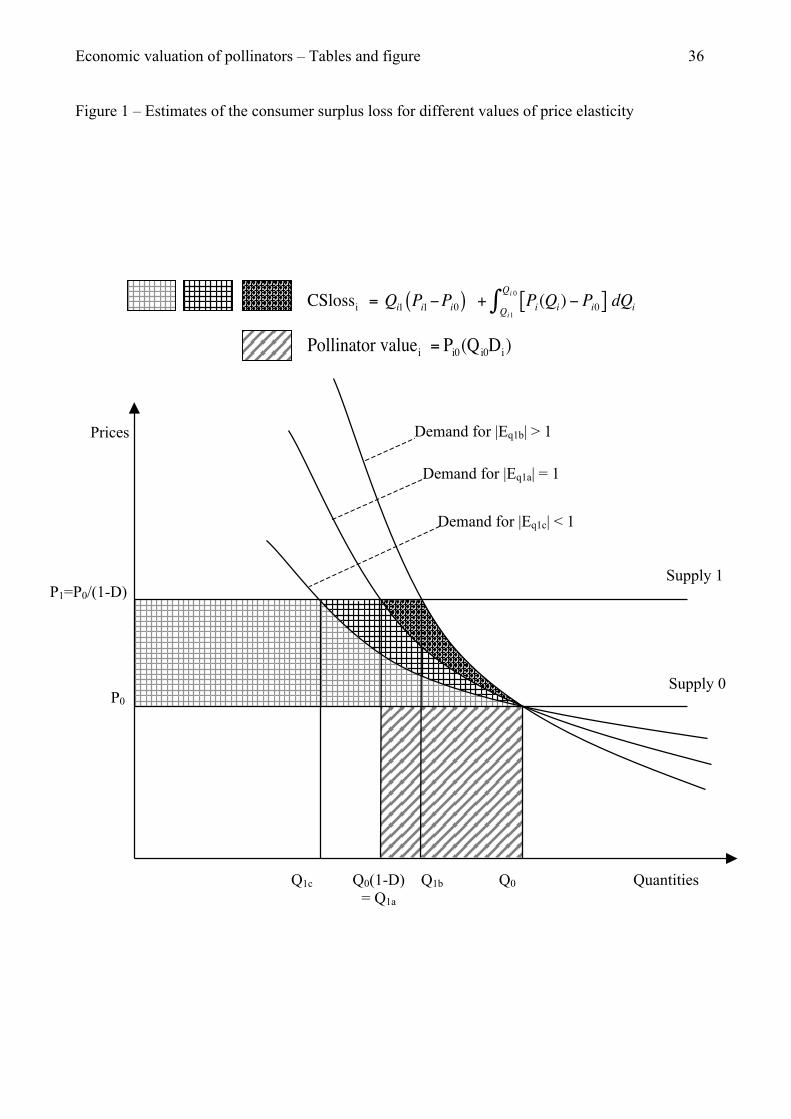
Economic valuation of pollinators – Tables and figure 36 Figure 1 – Estimates of the consumer surplus loss for different values of price elasticity
P1=P0/(1-D)
Prices
Supply 0
Demand for |Eq1c| < 1
P0
Quantities
Supply 1
Demand for |Eq1a| = 1
Demand for |Eq1b| > 1
Q0 Q0(1-D) = Q1a
€
CSlossi = Qi1 Pi1−Pi0( ) + Pi(Qi) − Pi0[ ]Qi1
Qi 0∫ dQi
€
Pollinator valuei = Pi0(Qi0Di)
Q1b Q1c
Related Documents