________________________________________________________________________ ________________________________________________________________________ Economic valuation of ecotourism development of a recreational site in the natural forests of southern Western Ghats V. Anitha PK Muraleedharan Kerala Forest Research Institute, An institution of Kerala Sate Council for Science, Technology and Environment Peechi – 680 653, Thrissur, Kerala.

Welcome message from author
This document is posted to help you gain knowledge. Please leave a comment to let me know what you think about it! Share it to your friends and learn new things together.
Transcript

________________________________________________________________________
________________________________________________________________________
Economic valuation of ecotourism development of a recreational site in
the natural forests of southern Western Ghats
V. Anitha PK Muraleedharan
Kerala Forest Research Institute,
An institution of Kerala Sate Council for Science, Technology and Environment Peechi – 680 653, Thrissur, Kerala.
________________________________________________________________________
________________________________________________________________________
KFRI Research Report No.
Economic valuation of ecotourism development of a recreational site in the natural
forests of southern Western Ghats
(Final Report of the Project KFRI/387/03, April 2003-March 2006)
Investigators V. Anitha
PK Muraleedharan
Research Fellow KV Santheep
Kerala Forest Research Institute, Peechi – 680 653, Kerala
2006

________________________________________________________________________
________________________________________________________________________
Abstract of the Project Proposal
1. Project Number KFRI/387/03 2. Title Economic valuation of ecotourism development of a
recreational site in the natural forests of southern Western Ghats
3. Objectives 1.Examine policies and strategies on eco-tourism with special reference to the development of recreational sites located in natural forests.
2.Estimate the economic value of eco-tourism in Athirappily forests in Kerala
3. Study the scope for and limitations of involvement of private sector in developing ecotourism in Athirappily recreational area
4.To understand the perceptions of different stakeholders on utilization of the Athirappily recreational area.
5.To analyse the effect of ecotourism development on the socio economic conditions of the local communities
To suggest suitable strategies and action plans for eco-tourism development in Athirappily recreational area.
4. Practical utility The results of the study would be useful for the policy makers to develop suitable strategies and action plan for ecotourism and to prepare a perspective plan for the region. They can suggest ways of budget support or private sector participation to modernize and regulate ecotourism in the state with peoples’ participation.
5. Date of commencement
April 2003
6. Scheduled date of completion
March 2006
7. Funding agency Western Ghats Development Programme Planning and Economic Affairs Government of Kerala
8. Investigators V. Anitha and PK Muraleedharan 9. Research Fellow KV Santheep 10 Study area Athirappily-Vazhachal recreation sites in Charpa Range
of Vazhachal Forest Division

________________________________________________________________________
________________________________________________________________________
C O N T E N T S Acknowledgments Project summary 1. INTRODUCTION
1.1. Objectives
1.2. General description of the study area
1.3. A backdrop of the study area
1.4. Tourism development in Athirappily-Vazhachal
1.5. Present management of tourism
2. MATERIALS AND METHODS
2.1. Economic Value of Ecotourism
2.2. Forecasting the lifespan of recreation
2.3. The Recreation Price
2.4. Employment elasticity
2.5. Socioeconomic Assessment
2.6. Income-product flow
2.7. Tourism sustainability assessment
3. RESULTS AND DISCUSSION
3.1. The sector and the policy framework
3.2 The Recreation potential of Athirappily-Vazhachal
3.3. The recreation value (RV) of ecotourism
3.3.1. Travel cost method of estimating RV
3.3.1.1. Recreation surplus of visitors from Kerala
3.3.1.2. Factors determining recreational Recreation surplus
3.3.1.3. Factors determining Willingness to pay for having
recreation benefits
3.3.2. Contingent Valuation method for estimating the recreation value
3.3.2.1. Demographic, social and economic factors determining the
Willingness to pay
________________________________________________________________________
________________________________________________________________________
3.3.3. Contingent Activity method of estimating the Recreation surplus
3.3.4. Recreation Surplus and Total Recreation Value
3.3.5. Total Economic Value of the Affected Forest Area.
3.4. Forecasting ecotourism in Vazhachal recreation site
3.5. A rational recreation price
3.6. Resident perception of tourism development
3.6.1. Ranking and marking of social and environmental
priorities
3.6.2. Distribution of recreation benefits
3.6.3. Community perceptions of opportunities, threats and
benefits from tourism
3.7. The economic impact of tourism and societal welfare
3.7.1. Potential impact of tourism in communities
3.7.2. Income –product flow in Athirappily-Vazhachal
recreation economy
3.7.3. Tourism employment and income multipliers
3.8. Tourism sustainability assessment – a conceptual approach
4. STRATEGIES AND ACTION PLAN FOR SUSTAINABLE TOURISM IN
ATHIRAPPILY-VAZHACHAL
5. CONCLUSIONS
References
Appendices
________________________________________________________________________
________________________________________________________________________
ACKNOWLEDGEMENTS
The Project was sponsored by Western Ghats Development Programme Planning and
Economic Affairs, Government of Kerala. We wish to place on record our sincere thanks
to Dr. J.K. Sharma, Director KFRI and Dr. R. Gnanaharan Research Coordinator, KFRI
for their kind support and encouragement throughout the study period. We are extremely
thankful to Mr. Muraleedharan, Divisional Forest Officer, Vazhachal Divisional Forest
Office, Kerala Forest Department, Dr. N.C. Induchoodan, former Vazhachal Divisional
Forest Officer, Mr. Agasthi, Range Officer Charpa Range, Mr. Ramesh, Vazhachal VSS
Secretary and Mr. Nandakumar, Athirappily VSS secretary, Mr. Rajesh VSS office staff,
who have provided all necessary help and support in the field during the progress of the
project. Special thanks are extended to the VSS members for their constant help and
support in the field. The investigators would like to thank the Athirappily Grama
Panchayth President Mr. Puspangandan, the ward members and above all the resident
population for extending full cooperation in the field, especially during the primary
investigation. We are also placing on record our sincere gratitude to Mr. AS Binilkumar,
who supported the project in the initial phase of the research work and Dr. C. Sunanda for
statistical advice and support throughout the study. Thanks are also due to Mr. Arun
Kumar, Ms. Reshmi Keshav and Ms. C. Remya who rendered all necessary help during
the survey period of the project.
We also express our sincere thanks to Mr. Subhash Kuriakose, KFRI, for designing the
coverpage.

________________________________________________________________________
________________________________________________________________________
ABSTRACT
Ecotourism is a direct consumptive benefit, which is highly under priced. This tourism
sector has certain crucial environmental implications because it depends upon natural
endowments for its existence. As deforestation accelerates, there has been a surge of
interest in high profile uses such as plantation forestry and tourism. With increasing
urbanization and media focus on wildlife and natural ecosystems, ecotourism could be a
viable alternative for sustainable management of the forests.
The study attempts to estimate the economic potential of ecotourism in
Athirappily-Vazhachal, southern Western Ghats and suggest suitable strategies and action
plan. The Central Government with the introduction of ecotourism policy and guidelines
as part of new tourism policy (2002) paid special attention on traditional picnic spots of
natural forests. Ecotourism is one of the key sectors for India in the service sector
negotiations under General Agreement on Trade in Services (GATS) in the WTO. The
Government of Kerala is committed to develop strategies for utilizing ecotourism
potential in the State. The proposed study gains further importance in the wake of the
recent development of a public hearing becoming the peoples' verdict against the
proposed Athirappily Hydro Electric project. As is the case in many developed countries,
there is a need to justify resource commitments, which are perceived to have a high
opportunity cost.
Tourism at Athirappily and Vazhachal is nature based, with high potential
features for tourism development in the natural ecosystem. Athirappily-Vazhachal has a
very high concentration of tourists. The visitor flow on an average is 2.3 lakh and 5.3
lakh visitors/ year at Vazhachal and Athirappily respectively. The revenue generating

________________________________________________________________________
________________________________________________________________________
potential of the sites indicates a positive relationship between the revenue, number of
visitors and number of vehicles. The total Affected Forest Area (AFA) is approximately
1.33 sq km. Total estimated value of the AFA is equal to Rs 509.124 lakhs. The
projected lifespan of Athirappily-Vazhachal is 38 years from 2005 given the present
scenario with all things remaining constant, although, there is immense potential for
service sector development and private sector involvement. With an average visitor flow
of 5,30,000 per year, the rational fee price arrived at is Rs. 12 /-.
The support of the local communities is indispensable for the successful
development of tourism in Athirappily-Vazhachal. The resident perception in this regard
based on social and environmental priorities among different choices indicates tourism
(93 %) and conservation of biodiversity (72.86 %) as occupying the largest support.
The positive impacts of tourism in Athirappily-Vazhachal measured through
employment and income multipliers highlighted that labour intensive investment in
tourism will ensure employment security. The study results highlighted that a 1 per cent
change in the visitor flow will lead to 4.7 per cent change in the level of employment.
The income multiplier reveals that one unit increase in income by the recreation sector
will result 2.27 unit increases in the aggregate income of the economy in the area. The
economic linkages in the economy indicate higher linkages between the business and
recreation sector and lower linkages between agriculture and recreation sector in the
study area. The tourism sustainability assessment highlights that Athirappily-Vazhchal is
fast emerging as a potentially sustainable region for ecotourism development and viable
alternative to the conservation of forest and enhancing the standard of living of the
dependent communities.

________________________________________________________________________
________________________________________________________________________
The strategies for sustainable tourism in Athirappily-Vazhachal recreation sites
focuses on the Pro-Poor Tourism strategy as laid down in World summit on sustainable
tourism (2002) giving due weightage the to economic benefits, non-economic benefits
and policy reform in the area with special reference to the poor. The study further
recommends a site-specific programme “One Tourist One Rupee Ten trees Program”
towards action plan for ensuring environmental and economic security in the ecotourism
based economy.

Appendix 1.1.Tribal population in the panchayat Appendix.3.1. Socio – Economic Profile of Visitors
Socio – Economic Profile of Visitors Item Number Per cent
Sex composition of respondents Male 455 57 Female 343 43
Religion wise classification Hindu 440 55 Christian 254 32 Muslim 104 13 Education High School 136 17 Higher Secondary 75 9.4 Degree 498 62.4 Post Graduate and above 89 11.2
Age wise classification Less than 15 0 0 15 - 60 778 97.5 60 and above 20 2.5 Average house hold income 29703 --- Average family size 5 Schooling in years 15.8 Average Age 34.5 Average size of visitor group
15
Total sample size 798 100

Appendix 3.2. Region wise classification of tourists
Region wise classification of Tourists (National)
State Total
Number
Adult
Male
Adult
Female
Child Male Child
Female
Anthra Pradesh 123 64 57 1 1
Delhi 19 17 2 0 0
Gujaradh 8 4 3 0 1
Karnataka 236 153 45 26 2
Kerala 10253 3750 2833 1967 1703
Maharashta 20 20 0 0 0
Manipur 20 20 0 0 0
Pondichery 20 13 7 0 0
Rajasthan 11 7 4 0 0
Tamilnadu 1152 616 357 62 117
Uttar Pradesh 11 11 0 0 0
West Bengal 4 2 1 0 1
Total 11867 4677 3309 2056 1825
International Tourists
Country Total
Number
Adult
Male
Adult
Female
Child Male Child
Female
Germany 1 0 1 0 0
Holland 3 1 2 0 0
UK 27 8 9 8 2
USA 11 4 7 0 0
Canada 5 3 2 0 0
Italy 6 2 2 1 1
Total 53 18 23 9 3
Grand Total 11920 4695 3332 2065 1828

Appendix 3.3. Estimating Recreation Surplus by TCM
Recreation Surplus per tourist ( Individual Travel Cost Method )
Region Recreation demand
curve
)(TCfV =
R2 Mean
Visitors
( )nV∑
Mean Travel
cost
( )nTC∑
Consumer’s
Surplus per
Tourist
Kerala V = 1363-1.63 TC 0.22 196
Allapuzha V = 1363-1.63 TC 0.22 814 572 11.6
Ernakulam V = 1363-1.63 TC 0.22 1648 306 12
Idduki V = 1363-1.63 TC 0.22 92 299 505
Kannur V = 1363-1.63 TC 0.22 960 650 0
Kasaragod V = 1363-1.63 TC 0.22 119 478 317
Kollam V = 1363-1.63 TC 0.22 154 548 237
Kottayam V = 1363-1.63 TC 0.22 1136 262 223
Kozhikode V = 1363-1.63 TC 0.22 394 449 262
Malapuram V = 1363-1.63 TC 0.22 426 200 501
Palakkad V = 1363-1.63 TC 0.22 603 301 163
Pathanamthitta V = 1363-1.63 TC 0.22 105 341 458
Trivandrum V = 1363-1.63 TC 0.22 260 733 20
Thrissur V = 1363-1.63 TC 0.22 2415 116 0
Wayanad V = 1363-1.63 TC 0.22 153 748 37
Tamil Nadu V =1837- 0.92 TC 0.41 42 1856 123.44
Karnataka V = 873 - 0.57 TC 0.4 18 1396 116
Andhra Pradesh V =2146 - 0.99 TC 0.39 17 2050 108.88
Other State V =2771 – 1.85 TC 0.33 8 5016 103
V = Number of Visitors, n = Number of Observation, TC = Travel Cost

Appendix 3.4. Estimating Total Recreation Value by CVM

Appendix 3.5. Estimating Recreation Surplus by CAM
Appendix 3.6. Socio-Economic profile of local community
Socio-Economic profile of local community Education wise distribution of the sample
Level of Education Number In Per cent Child 16 2.6 No formal school Education 26 4.25 < Upper Primary 241 39.4 High School 219 35.8 Higher Secondary 59 9.6 Diploma 14 2.3 Nursing 5 0.82 Degree 30 4.9 Post Graduate 2 0.33 Total 612 100 % of sample having school education = 95.75
Occupational Structure of the sample Occupation Number Per cent Agriculture 49 10.8 Business 7 1.52 Coolie 154 34 Govt. Service 9 2 Gulf 4 0.88 House wife 112 24.72 Self Employed 18 4 Service 26 5.74 Students 53 11.7 Unemployed 21 4.64 Total 453 100 Unskilled Coolie work dominate the occupational structure
Age wise distribution of sample Age Group Number In Per cent <15 122 20 15-60 453 74 >60 37 6 Total 612 100
Sex wise distribution of sample Sex Number Per cent Male 316 51.6 Female 296 48.4 Sex Ratio is equal to 937 female per 1000 male. Total Sample Size = 152 Average family size = 4

Economic valuation of ecotourism Final report ______________________________________________________________________________________
Kerala Forest Research Institute
References Brandon, K. 1996. Ecotourism and conservation - A review of key issues. World Bank
Envronment Department. Paper No. 033, Washington D.C, World Bank.
Bramwell, B., and Lane, B (1993). Sustainable tourism: An evolving global approach.
Journal of sustainable /tourism, 1(1), 6-16.
Butler, J.R. 1991. Ecotourism: Its changing face and evolving Philosophy. Department of
Forest Science, University of Alberta, Edmonton
(Butler, R. James, Glen T. Hvenegaard and Doug K. Krystopfiak. (1994) Economic
Values of bird watching at Point Pelee National Park, Canada. In Mohan
Munasinghe and Jeffrey McNeely (Eds), Protected Area Economics and Policy –
Linking Conservation and sustainable Development (P 234) the World Bank,
Washington D.C.
Christine Lim and Michael McAleer, 2001. Forecasting Tourist Arrivals, Annals of
Tourism Research, Vol.28, No. 4, pp 965-977.
Diley Roe and Penny Urquhart, 2001. Pro-Poor Tourism: Harnessing the World’s largest
Industry for the World’s Poor, World Summit on sustainable Development,
International Institute for Environment and Development (IIED) and Regional and
International Networking Group (RING) .
Fern, L. Filion, James P.Foley, and Andre J.Jacquemot. 1994. The Economics of Global
Ecotourism, In Mohan Munasinghe and Jeffrey McNeely (Eds), Protected Area
Economics and Policy –Linking Conservation and sustainable Development (P 234)
the World Bank, Washington D.C.
Economic valuation of ecotourism Final report ______________________________________________________________________________________
Kerala Forest Research Institute
Green, H. (1995). Planning for sustainable tourism development. In C. Hunter, & H.
Green (Eds.), Tourism and the Environment (pp. 93-121). London: Routledge.
Gupta. S.C and V.K.Kapoor. 2001, Fundamentals of Applied Statistics, pp. 2.11
Hunter, C. (1995). On the need to re-conceptualise sustainable tourism development.
Journal of suatianble Tourism, 3(3), 155-165.
ITAR, Indian Tourism Annual Report, Government of India , New Delhi, 2001-2002.
India Tourism, Annual Report, Government of India, New Delhi, 1986-2001.
Indian Tourism, annual Report, Government of India, New Delhi, 2001-2002.
Kerala Tourism Policy Statement, Govt of Kerala, Thiruvananthapuram, 2002
Kerala Tourism Policy Statement, Govt of Kerala, Thiruvananthapuram, 2002.
Ko. T.G.(2001). Assessing progress of tourism sustainability. Annals of tourism research,
28(3), 817-820
Ko.T.G, (2005) Development of a tourism sustainability assessment procedure: a
conceptual approach, Tourism management, pp 431– 445.
Myers N. (1996) Tropical deforestation and a mega extinction spasm. In Soule M (ed) :
Conservation Biology - the science of scarcity & diversity, Sinauer Associates
Massachusetts.
Pearce, D.W and Moran, D (1994), The Economic Value of Bio-diversity, Earthscan,
London and Island Press, Washington D.C: in association with the International
Union for the Conservation of Nature (IUCN).
Pearce, D.W. (1998). Global Environmental Value and the tropical forests:
demonstration and capture (Chapter 11, p 173-209) in Ecological Economics and

Economic valuation of ecotourism Final report ______________________________________________________________________________________
Kerala Forest Research Institute
Environment: Essays on Ecological Economics and Sustainable Development,
Edward Elgar, U.K.
Repetto, R and Gillis, M (1988), Public policies and the Misuse of Forest Resources,
Cambridge University Press, Cambridge.
Sunny George, 1998. Preliminary assessment of the impact of man-made modifications
on Chalakudy river system. Research Report, Kerala Research Programme on Local
Level development (KRPLLD), Center for Development Studies,
Thiruvananthapuram.
Tourist statistics, Ministry of Tourism, Government of India, New Delhi ,2001.
Tourist statistics, Department of Tourism, Government of India, New Delhi, 2001.
Tourist Statistics, Govt of Kerala, Thiruvananthapuram, 2004 - 06.
Wells, P. Michael (1994). Parks Tourism in Nepal: Rconciling the social and economic
opportunities with the ecological and cultural threats. In Mohan Munasinghe and
Jeffrey McNeely (Eds), Protected Area Economics and Policy –Linking
Conservation and sustainable Development (P 234) the World Bank, Washington
D.C.

Economic valuation of ecotourism Final report ______________________________________________________________________________________
Kerala Forest Research Institute

Economic Valuation of Ecotourism Final Report
Kerala Forest Research Institute
1. INTRODUCTION
Human interactions have eroded and modified extensive forest tracks during the
last century. Deforestation is partly due to the scientific ignorance of the contribution of
forests to ones welfare, both actually and potentially, partly to ones meager economic
understanding of what is at stake and partly to ones lack of institutional capacity to
manage forests for everyone's benefit, now and forever (Myers, 1996). Many researchers
have sought to provide an economic rationale for the preservation of forest ecosystem,
reasoning that the failure to internalize the values of the ecosystem in decision making
leads to no economic incentives to protect and conserve biological resources.
As is well known, forests provide a wide range of economic, environmental,
social and cultural benefits at the local, national and global levels. In other words, a
natural resource has a total economic value (TEV), which is sum of direct and indirect
use values, option value and existence value (Pearce and Moran, 1994). Now a natural
question that arises is, given these economic values of forest, why is it being eroded?
This question is relevant particularly when the degradation of forest leads to global
environmental issues such as climate change and loss of biodiversity. Many of the
functions of tropical forests are not marketed and are ignored in decision making. This is
due to their unpriced nature, local market failure, intervention or government failure and
global market failure (Pearce, 1998; Repetto and Gillis, 1988).
The ecotourism phenomenon is promising for developing countries that are rich in
biodiversity but which may not always have the means of preserving it from alternative
forms of eco development that are not sustainable. The term ecotourism was originally

Economic Valuation of ecotourism Final report ______________________________________________________________________________________
Kerala Forest Research Institute
2
coined in 1987 by Hector Ceballos- Lascurain of Mexico and because of its appeal, and
has gained wide usage since its introduction. Hector originally defined “ecotourism” as
“traveling to relatively undisturbed or uncontaminated natural areas with the specific
objective of studying, admiring, and enjoying the scenery and its wild plants and animals,
as well as any existing cultural manifestations” (Butler, 1991). Related terms in literature
include terms as “nature-oriented tourists”, “green tourists”, “alternate tourists”,
“adventure tourists”, “rural tourists”, and even “anti-tourists”. However, the most
popular of all is “ecotourism” and “eco-tourists”. Some recent definitions of ecotourism,
have expanded the concept to include the actual environmental and socio-cultural
consequences of the activity. For example, the ecotourism society (1991) defines the term
as “responsible travel that conserves natural environments and sustains the well being of
local people”. The World Tourism Organization (WTO) defines ecotourism as “travel to
enjoy and appreciate nature”. This concept has a wider connotation i.e., developed into a
scientific approach to plan, manage and develop sustainable tourism products and
activities.
Tourism is clearly a highly significant economic use of natural resource. Many
examples are cited in literature. Filion, Foley, and Jacquemot (1994) estimated that in
1988, some 235 million people participated in international tourism to enjoy and
appreciate nature, generating economic benefits (or contributions so the NI of the
countries involved) amounting to as much as $ 233 billion. Visitations in Point Pelee
National Park in Canada, a prime location for observing the spring migration of passerine
birds, brings in at least $ 6 million / year in net economic value (Butler, Hvenegaard and
Krystopfiak, 1994). Tourist expenditures in Nepal are directly attributable to the

Economic Valuation of ecotourism Final report ______________________________________________________________________________________
Kerala Forest Research Institute
3
existence of the Protected Areas. It is estimated to have been about $ 9 million in 1998,
while the annual PA management budget was only about $3 million (Wells, 1994).
Income from tourism could contribute significantly to the better management of the site
and outweigh the negative impact of tourism which can be significantly reduced by
ecologically and sustainable practices (Fern et al, 1994).
Many academicians, government, Non-Governmental Organizations (NGOs) and
international organization have been attempting to put sustainable development into
practice. Since the beginning of the 1990s, a number of arguments and debates
concerning sustainable tourism development (STD) have been presented, mostly at a
theoretical rather than practical level (Bramwell & Lane,1993; Green.1995; Hunter,
1995, Ko, 2001). All these highlighted the failure of the approach to recognize the link
between poverty, environment and development. The second Earth Summit at
Johannesburg (2002) on Sustainable Development of ecotourism emphasizes on the
potential for tourism to deliver Pro-Poor growth in the least developed and developing
countries by offering benefits to the rural areas by reducing the disparities. In other
words, the essence is Pro-Poor Tourism (PPT) is to focus on Sustainable Tourism –
Eliminating Poverty (STEP).
The proposed study focuses on the ecotourism benefits of natural forests,
especially those from traditional picnic spots. Ecotourism is emerging as a viable
alternative to solve the dual problem of forest conservation and livelihood improvement
of dependent communities simultaneously. Ecotourism management should give utmost
importance to the adverse impact of the increasing pressure of the tourist on the
biodiversity and its income generating and income dispersing capacity into the local

Economic Valuation of ecotourism Final report ______________________________________________________________________________________
Kerala Forest Research Institute
4
economy. Increasing income addition into the local economy help the rural people to shift
their income dependence from the forest to other employment opportunities opening up
in the local economy. Various studies pointed out that increasing income reduce the
forest dependence. Thus, the study broadly covers two aspects, one is the valuation of the
natural tourism and the other is identifying the income generating capacity of the nature
tourism.
The study attempts to estimate the economic value of ecotourism and suggest
suitable strategies and action plans. Although several attempts have been made, most of
the valuation studies are in the context of developed countries where situations and the
stakeholders are very different from that of a developing country. The study conducted at
Athirappily Vazhachal recreation sites, has immense ecotourism potential, considering
the number of visitors who visit this area in different seasons and the income generated
by way of entry fee. Keeping ecotourism in view, the study attempts to develop a site-
specific conceptual model for sustainable natural resource management.
1.1. Objectives
1. Examine policies on ecotourism with special reference to the development of
recreational sites located in natural forests.
2. Estimate the economic value of ecotourism in Athirappily forests in Kerala
3. Study the scope for and limitations of involvement of private sector in developing
ecotourism in Athirappily recreational area
4. To understand the perceptions of different stakeholders on utilization of the
Athirappily recreational area.

Economic Valuation of ecotourism Final report ______________________________________________________________________________________
Kerala Forest Research Institute
5
5. To analyse the effect of ecotourism development on the socioeconomic conditions
of the local communities
6. To suggest suitable strategies and action plans for ecotourism development in
Athirappilly recreational area.
1.2 General description of the study area
The Western Ghat Region of Kerala covers nearly 21856 sqkm (42.7 %) of the entire
Western Ghats region. The study conducted in the Athirappily – Vazhachal forests areas
falls within the Vazhachal Forest Division of the State. Vazhachal Forest Division
located in the Mukundapuram taluk of Thrissur revenue district has five territorial ranges
viz., Athirappily, Charpa Vazhachal, Kollathirumadu and Sholayar. The Division is
located between 10o 5.5’ and 10o23’ of north latitude and 76o 9’ and 76o 52.5’ east
longitude. Temperature varies from 20 to 30 degree Celsius with an annual rainfall of
3441mm. The total area of the Vazhachal Forest Division is 413.93 sq km. The study area
(Athirappily and Vazhachal recreational sites) is located within the Charpa range (Map 1)
of Vazhachal Forest Division. Athirappily is the entrance to Vazhachal Forest Division
that was formed in 1981. With an average rainfall of above 2750 mm the area is
synonymous with environmental soundness assuring high biodiversity. This Division has
evergreen, semi-evergreen and moist deciduous forests (Plate 1), with vast variety of
flora and fauna. The forests here are home to the Elephants, the Tiger, the Great Indian
Hornbill, the Lion Tailed Macaque, the Nilgiri Langur, the Malabar Giant Squirrel, the
Cochin Forest Cane Turtle among others.

Economic Valuation of ecotourism Final report ______________________________________________________________________________________
Kerala Forest Research Institute
6
Map 1.1. Study area

Economic Valuation of ecotourism Final report ______________________________________________________________________________________
Kerala Forest Research Institute
7
The vegetation of the area covers tropical moist deciduous forest type with reed brakes
along the river and stream courses. There are also teak and medicinal plantations. The
Charpa range with a total area of 5997.450 sqkms is head quartered at Vazhachal. The
ecological importance of the area is due to the emergence of Chalakudy river out of the
forests of Vazhachal Forest Division at Athirappilly, after traversing 65 km through
natural forests from its source of origin at Sheikalmudi, the upper reaches of the Western
Ghats without passing through any habitation area or other polluting segments. With
varied forest types ranging from tropical forest types to moist deciduous type this tract is
also an abundant store of bamboo and rattan.
1.3. A backdrop of the study area
Historical significance highlights the process of land use changes that took place over a
period of time resulting in large scale clear felling and destruction dating to the 1800s
along the Chalakudy river basin. Earliest large scale destruction was in 1830s when
forests were clear felled by the British to try coffee. At present too the area contains large
area under cash crops plantation. 1894 saw the construction of the Cochin tramway and
1914 during the War period saw heavy demand for timber further led to indiscriminate
felling of trees. In 1942 the road from Chalaludy to Poringalkuthu was constructed for the
convenience of the Poringalkuthu Hydro Electric Project work. The road upto

Economic Valuation of ecotourism Final report ______________________________________________________________________________________
Kerala Forest Research Institute
8
Malakkapara was completed by 1950. The Poringalkuthu HEP was completed by 1957
and in 1958 group of three dams were constructed across the river as per the
Parambikulam-Aliyar Project signed between Kerala and Tamil Nadu. In 1966 came the
Sholayar HEP in Ambalapara in Mukundapuram taluk of Thrissur district.
Athirappily is one of the rural panchayaths in Kerala with 10 wards and a total
population of 9797. The tribes constitute 13.3 per cent of the total population
(Appendix 1.1), with a sex ratio of 1083. Kadar tribes constituting 52.5 per cent of the
total tribal population, followed by Malaya with 20 per cent and Muthuva with 19.8 per
cent. The Mannar and Ulladar constitute 6.14 and 1.54 of the total tribal population
respectively. The Kadar community, a primitive group found only in the Chalakudy river
depend exclusively on the non-timber forest product collection for their livelihood. They
are thus not trained or well equipped for any other alternate employment. Malayars are
basically agriculturists. Only the Kadars and Malayars come within the study area. The
local community is basically engaged in the primary sector. There is a gradual process of
acculturisation as far as the tribal communities are concerned in the area and are facing a
lot of difficulties as result of various developmental activities (Sunny, 1998).
1.4. Tourism development in Athirappily-Vazhachal and present management:
The Vazhachal Forest Division is a forest tract well known for its natural sceneries.
Besides the waterfalls there are two hydel projects namely Sholayar and Poringalkuthu on
the upstream side of Athirappily falls. Athirappily and Vazhachal water falls are the two

Economic Valuation of ecotourism Final report ______________________________________________________________________________________
Kerala Forest Research Institute
9
major recreational sites in the Chalakudy River. The magnificent Athirappily waterfall in
a forest background attracts thousands of nature admirers and tourists. The area is having
immense ecotourism potential considering the number of visitors who come to this area
in different seasons.
The tourist flow to these sites started since 1980 but after 1990s the tourist flow
has increased at an alarming rate, which is a potential threat to the conservation of
biodiversity. The continuous presence of tourists and their vehicle pose great threat to the
wild life and to the serenity of the forest area. Due to this increasing number of tourists
visiting the waterfall and nearby area, the Kerala Forest Department developed a picnic
spot at Vazhachal during 1990's. Some trek paths and nature trails were developed in the
natural forest to give the visitors a feeling of being amidst nature. A nominal fee was
established since 21-12-1993 onwards (Rs 2/- for adults and Re. 1/- for children) at
Vazhachal and at Athirappily no entry fee was collected during that period.
The forests in and around the above mentioned tourist spots are highly
fragmented. Therefore, unplanned tourism will only aggregate the process of degradation.
Moreover unplanned tourism germinates special socioeconomic problems not
encountered in any kind of economic activity With little care for the environment, the
tourist extract maximum for meeting their recreational needs/satisfaction. Many
unauthorised shops mushrooming on government lands are creating new sets of issues
often creating socioeconomic frictions. Large number of entry paths as a result of very
frequent penetration of hundreds of tourists into the nearby reserve forest areas
Economic Valuation of ecotourism Final report ______________________________________________________________________________________
Kerala Forest Research Institute
10
accelerates degradation and soon will make this an open-access area. There existed no
specific tourism management strategy until 2000 to manage this tourist influx.
As part of the present management of Tourism zone, Participatory Forest Management
was implemented in 2001 with the objective of conserving and protecting the existing
forests from various types of biotic interferences, creating awareness among the people
about the needs to conserve the forests and involving the tribes in the management of
forests aiming at enhancing their standard of living. With this end an area of 788 Ha. has
been covered by the Vana Samrakshana Samithi (VSS) registered as Tribal VSS No.
331-1/2001 with the Conservator of Forests , Central Circle Thrissur, under the
provisions of G.O(RT) No. 40/2001/Forests dt. 2-2-2001. Financial resources are
generated through the levy of service charges @ Rs.3/- per adult, Re.1/- per Child
(between 12-15 years of age) and parking fee for maintenance of parking place and
protection of the vehicle, @ Rs.5/-, Rs.3/- and Rs.2/- for heavy, light and medium and
two & three wheelers respectively for Vazhachal Picnic Spot with effect from 15-02-
2001. This entry fee has been revised to Rs. 15 /-- vide letter No.PFM GL-4/2003 dated
22.12.2004in reference to GO (MS) No. 18/02/F&WLD,dated 02.04.02 and the ticket to
both the sites are taken together at Athirappily itself. Of this Rs. 4/- is taken as
government revenue and the remaining as the service tax for tourism related activities.
The Kerala Forest Department provides a range of opportunities for recreation pursuits
that complement those available on other public lands, such as arranging adventurous
trekking on the prescribed routes with the help of trained tribal guides, camping, walking
Economic Valuation of ecotourism Final report ______________________________________________________________________________________
Kerala Forest Research Institute
11
and sightseeing. The resources so generated is being utilized for developing minimum
basic infrastructure facilities for tourists, maintaining environmental hygiene (Plate 2),
drinking water, garbage disposal, toilets, maintenance of existing trek paths, maintenance
and cleanliness of the walking path to the falls (Plate 3), engaging trained tribal men for
safety of the tourists (Plate 4), creating awareness among public through classes,
distribution of pamphlets etc.
Under the current management system, the VSS members continue to augment their
income by providing services to the tourists while the overall management and
coordination rests with the Kerala Forest Department. Certain new rules and regulations
are created and imposed after achieving a general consensus between the local people and

Economic Valuation of ecotourism Final report ______________________________________________________________________________________
Kerala Forest Research Institute
12
the government agencies. The authorities undertook a number of measures to encourage
local communities to participate in the decision making process of conservation and
management of the area along with saving their interests. In spite of the efforts of the
government authorities the indigenous communities are not actively participating in the
tourism oriented activities due to certain inherent socioeconomic and cultural
impediments, many problems continued to be unresolved, and the major one being the
continued influx of tourists.
It is in this background that the study attempted to ascertain the economic value of
ecotourism potential and look into the various aspects pertaining to tourism development
in Athirappily-Vazhachal within the natural ecosystem.
Economic valuation of Ecotourism Final Report
Kerala Forest Research Institute
14
2. MATERIALS AND METHODS
2.1. Economic Value of Ecotourism
The valuation of the ecotourism potential of the Athirappily-Vazhachal recreation
sites has been undertaken using the standard methods adopted in the valuation of direct
non-market use value of natural resources.
Sample selection: Stratified random sampling method is adopted for the collection of
the data. The population of the visitors’ survey is equal to the average visitor flow in
the last ten years and it consists of the first stratum. In the second stratum we take 0.1
per cent of the average visitor flow in each month as the respective sample with the unit
of study being the visitor.
Data collection: Data is collected from respective sample size from both Athirappily
and Vazhachal recreation site separately. Questionnaire method is adopted for the
collection of primary data of the sample and the questionnaire contain questions related
to economic and social variables of the visitors, and those pertaining to travel cost and
contingent valuation method, Contingent Activity method, social and environmental
priorities related to tourism.
Tools and Technique
Difference between Recreation Value (RV) and Recreation Surplus (RS): In order to
understand the recreation potential of Athirappily and Vazhachal recreation sites, we
estimate the RV and RS by adopting the Travel Cost Method (TCM), Contingent
Valuation Method (TCM) and Contingent Activity Method (CAM). Figure 2.1 depicts
the difference between recreation value and recreation surplus. Here, y-axis represents

Economic valuation of Ecotourism Final Report
Kerala Forest Research Institute
15
the travel cost or the amount the tourist is willing to pay for the conservation of the
recreation area. The x-axis represents the number of visitors. In the figure, curve ‘cf’
represents the recreation demand curve, ‘∆ cbd’ represents the recreation surplus and
the area ‘aedc’ the total recreation value. The area ‘aedb’ represents the total travel and
other cost around the trip.
2.1.1. Travel Cost Method of Valuation
Individual travel cost method is adopted for estimating the recreation surplus of
the tourists. The travel cost paid by the tourists is considered as the price paid for
having the benefit of the recreation site. Data pertaining to the travel cost and other
expenditures such as food and accommodation is collected from the tourists. The visitor
flow is considered as a function of the travel cost. The recreation demand curve,
showing the inverse relationship between number of visitors and travel cost is derived
by the Ordinary Least Square (OLS) method. The recreation surplus of the sample is
estimated by using integration method. In the mathematical representation of the
methodology (Box 2.1 ) V, f and TC represents number of visitors, functional relation
and travel cost respectively while α1 and α2 represent intercept term and slope
coefficients. In the methodology for estimating the recreation surplus AV and ATC
represents total number of visitors in the respective groups and their corresponding
average travel cost respectively.
2.1.2. Contingent Valuation Method

Economic valuation of Ecotourism Final Report
Kerala Forest Research Institute
16
The contingent valuation method (CVM) is used to estimate the economic value
of non-market goods and services in monetary term. CVM is a direct approach, it asks
people what they are willing to pay (WTP) for a benefit, or what they are willing to
accept (WTA) by way of compensation to tolerate a cost or both. The three major
biases of CVM are the strategic bias, information bias and instrument bias. The
strategic bias occurs when the respondents of CVM deliberately understate or overstate
the monetary value of the non-market commodities in order to manipulate policy
decisions in their favour. Information bias occurs when the questionnaire fails to
provide adequate information disclosure to the respondents about the hypothetical
market. Finally, the instrument bias is associated with the method of payment described
in the CVM schedule. There are four common methods for applying CVM, viz., 1)
Contingent referendum method, 2) Payment card method, 3) Open ended question
method and 4) Bidding game method. Here in this case, the Bidding game method of
CVM is adopted for estimating the recreation value of Athirappily-Vazhachal.
This consist of two steps, first the respondents are asked whether they are willing to
pay for a given non-market commodity benefit after providing proper information about
the commodity. If the answer is no, the process ends there with the particular
respondent. If the answer is yes, the second step is to determine the maximum amount
he is willing to pay. The maximum willingness to pay will be determined by the
bidding process. The recreation demand curve, representing the relationship between
amount that the people are willing to pay for having the benefit and number of tourist is
represented as ( )VfY = Where Y, f and V represent the willingness to pay, functional
relationship and number of tourists respectively. The respective functional relationship
Economic valuation of Ecotourism Final Report
Kerala Forest Research Institute
17
is estimated by using the OLS method ( VY 21 ββ += ) where β1and β2 represents the
intercept and slope coefficients respectively. The total recreation value (TRV),
equivalent to aggregate willingness to pay of the sample is estimated by using the
integration method (Box 2.2 ) in which AV represent total number of sample visitors.
2.1.3. Contingent Activity Method
Here, a hypothetical activity, i.e., willingness to travel additional distance (WTT) is
used to indirectly measure the recreation surplus. WTT will be expressed in monetary
terms by taking the product of additional distance a tourist is willing to travel and his
travel cost per kilometer. Functionally )(DfV = , where V, f and D represent f number
of visitors, functional relationship and the additional distance the tourists are willing to
travel respectively. The linear observation of the functional relationship is in the form,
DV 21 ββ −= where β1 and β2 are intercept and slope coefficient respectively. The
recreation surplus, which is equivalent to gain in net utility and represented by the
willingness to travel additional distance by the tourists is estimated by the integration
method (Box 2.3 ), in which RS,V,P and k represent recreation surplus, number of
visitors willing to travel additional distance, average travel cost
per kilometers and total number of visitors willing to travel additional distance
respectively.
2.2. Forecasting the lifespan of the recreation site
Economic valuation of Ecotourism Final Report
Kerala Forest Research Institute
18
Forecasting the lifespan and estimating the expected number of visitors to a recreational
site is important for estimating the recreational value of a tourist spot. It is very helpful
for the cost-benefit analysis of the visitors flow to the site, i.e., the expected benefit is
dependent on the expected visitor flow. The cost is in terms of affected forest region,
fixed cost and variable cost, thus, forecasting the lifespan provides a basis for
calculating the profitability at the recreational site. For forecasting the lifespan we use
the ordinary least-square method,
Principles of least squares consists in minimizing the sum of squares of the deviation
between the given values of Yt and their estimates given by equation (1), in other
words we have to find a and b such that for given values of Yt, corresponding to n
different values of t, ( )∑=
−−=n
tt btaYZ
1
2 is minimum. For a minimum of Z, variations
in a and b we should have ( )∑ −−−==∂∂ btaYaZ t20 ,
( )∑ −−−==∂∂ btaYtbZ t20 , thus the normal equations for estimating a and b are
equal to ∑∑ −−−+= )2(tbnaYt and )3(2 −−−+= ∑ ∑∑ tbtatYt . The values of
∑ ∑∑∑ 2,,, tttYY tt are obtained from the secondary data of the tourist flow in
Vazhachal recreation site. The equation (2) and (3) can now be solved for a and b
which are the intercept term and slope coefficient respectively.
Forecast error: Forecast error is defined as the actual value minus the forecast value of
the variable for the time period t, namely ttt YAe −= where et is equal to forecast
error at time t, At is equal to actual arrival at time t and Yt is equal to forecast arrival at
time t. For a given data process and forecasting method, the forecast error is assumed to
be an independent random variable with zero mean, ( ) 0=Ε te and constant variance

Economic valuation of Ecotourism Final Report
Kerala Forest Research Institute
19
( ) 2σ=teVar Numerous measures of accuracy are available, including the popular root
mean squared error (RMSE). In the analysis we use the RMSE for estimating the
forecasting accuracy. ∑=
=n
tte
nRMSE
1
2* 1 . (Christine and Michael, 2001)
2.3. The Recreation Price
Conservation Margin Pricing (CMP) is a method of pricing based on the conservation
margin (CM). The CM is the marginal amount charged from the visitor for conserving
the biodiversity. It should be equal to the value of biodiversity which is adversely
affected by his visits. Since, it is very difficult to measure the value of biodiversity
which is adversely affected by the visit of each visitor we are charging a fixed marginal
amount from each visitor. The fixed marginal amount is calculated on the basis of the
total value of affected biodiversity and the expected number of visitors to the site in its
life time period. Here, maximum importance is given to the supply side than the
demand side because the supply is relatively scarce than demand. Thus, the supply
price (P) is equal to
( ) ( ) CMVn
YXN
P +++= ∑∑ 11
Where, N = Expected visitor flow in the life span of the tourist area, X = Total Fixed
Value Of Affected Natural Resource, Y = Total Fixed Cost, n = Number of visitors in
the just preceding year, V = Total variable cost in the preceding year, CM =
Conservation margin.
2.4 Employment Elasticity

Economic valuation of Ecotourism Final Report
Kerala Forest Research Institute
20
Employment elasticity with respect to visitor flow is estimated by using the Arc
employment elasticity method. It is estimated over a period of 2002-03 based on the
secondary data pertaining to the visitor flow and employment generation in the area and
2002 is taken as the base year.
( )( )21
21
EEVVVEeE +Δ
+Δ=
In this equation, eE represents employment elasticity, ∆E, E1 and E2 the change in
employment, employment in 2002 and employment in 2003 respectively, and ∆V,V1
and V2 represents change in visitor flow, visitor flow in 2002 and visitor flow in 2003
respectively.
2.5. Socioeconomic Assessment
Sample selection : The reconnaissance survey highlighted that, in the Athirappily
Grama Panchayath, wards 1 to 6 are directly or indirectly being benefited by the
increasing tourism (by way of employment, local businesses among others), which has
been identified as the ‘benefit zone’. Total number of household (1 to 10 ward) is 2414
out of this only 1465 households comes under benefit zone. The sample size represents
12 per cent of the households (176 households). Tribal households consist of 15 per
cent of the total households, thus 15 per cent of the sample are the tribal households.
Data Collection : A direct household survey is conducted for primary data collection
of the relevant data in which a questionnaire method is followed covering questions
related to family details, history of land occupation, social and environmental priorities,
agriculture production and its distribution, live stock, fodder source, health care, land
use and cropping pattern, cultivation details, availability of water, forest dependence,

Economic valuation of Ecotourism Final Report
Kerala Forest Research Institute
21
and problems related to forest conservation and management . The tools and technique
are used mainly for estimating the standard of living of the people, their forest
dependence and for identifying the income product flow in the local economy.
2.5.1. Forest Dependency Index (FDI)
Forest dependence index is the average index value of fodder, fuel, housing,
medicinal and income dependencies.
Fodder Dependency Index (FoDI), 10011
×⎟⎟⎠
⎞⎜⎜⎝
⎛+
= ∑=
n
i iXXFoDI
X = 1, If forest is a fodder source. X = 0, If forest is not a fodder source. Xi = Number
of other fodder sources except forest.
Fuel Dependency Index (FuDI) of individual household 10011
×⎟⎟⎠
⎞⎜⎜⎝
⎛
+= ∑
=
n
j jFFFuDI
F = 1, If forest is a fuel source. F = 0, If forest is not a fuel source.
Fj = Number of other fuel sources except fuel from the forest.
Housing Dependency Index (HDI) of individual household
∑=
×⎟⎠⎞
⎜⎝⎛=
n
i
i
Hh
HDI1
100
hi = number of parts of the ith house constructed by using forest products
H = Total number of parts that can be constructed by using forest products

Economic valuation of Ecotourism Final Report
Kerala Forest Research Institute
22
Medicinal dependency Index (MDI) of individual household
10011
×⎟⎟⎠
⎞⎜⎜⎝
⎛+
= ∑=
n
i iMMMDI
M = 1, If the household is using medicine from the forest, and M = 0 otherwise
Mi = Number of other alternative medicinal options used by the household.
Income Dependency Index (IDI) of individual household
yi = income from forest acquired by ith family
Yi = Total income of ith family
Thus, the Forest Dependence Index (FDI) of individual household
∑ ⎟⎠⎞
⎜⎝⎛ ++++
=5
)IDIMDIHDIFuDIFoDIFDI
2.6. Income–Product Flow: Input – output analysis is a method of analyzing how an
industry undertakes production by using the output of other industries in the economy
and how the output of the given industry is used up in other industries or sectors
(Table 2.1).
Table. 2.1 Transaction Matrix of a Recreation Economy User of outputs Producers of inputs
Agriculture, Household (X1)
Business(X2)
Recreation(X3)
Agriculture, Households (X1) X11 X12 X13
Business (X2) X21 X22 X23 Recreation (X3) X31 X32 X33

Economic valuation of Ecotourism Final Report
Kerala Forest Research Institute
23
Since the total output of an industry is fully used up either by industries as input or in
meeting the final demand of households and tourists, we can set this in the form of
following equations:
X1 = X11 +X12 + X13 X2 = X21 +X22 + X23 X3= X31 +X32 + X33
These are the balance equations which show the output of each industry flows into
various industries as input and in meeting final demand for consumption or capital
formation. Looking at the equations vertically we can know the requirements of inputs
for the output of an industry.
X1 = ƒ (X11,X21,X31)
X2 = ƒ (X12,X22,X32)
X3 = ƒ (X13,X23,X33)
These are the structural equations show the structure of the economy. The Input
Coefficient (a1n) is the relative values of input used for producing various output (Table
2.2).
n
nn X
Xa 11 = .

Economic valuation of Ecotourism Final Report
Kerala Forest Research Institute
24
Total Value of X1 = a11X1 + a12X2 + a13X3
Total value of X2 = a21X1 + a22X2 + a23X3
Total value of X3 = a31X1 + a32X2 + a33X3
Where X1 = Agriculture sector, X2 = Business sector and X3 = Recreation Sector
2.7. Tourism sustainability assessment
The output from a tourism sustainability assessment exercise, using scales of
sustainability levels, has been adopted following sustainability assessment procedure
developed by Ko (2005). Ko has developed a practical approach of assessing
sustainability of the tourism development in the area, following eight steps of
sustainability assessment procedure (Box 2.3). Here, in the present context, this has
been followed, adopted adapted to make it site specific in assessing the tourism
sustainability in Athirappily-Vazhachal based on the above conceptual approach.
2.6.1. Delphi Method: The recreation system has two dimensions, (1) economic
dimensions and (2) ecological dimensions. Various indicators of ecological dimensions
is estimated by using the Delphi method. Here, data pertaining to sustainability is
collected from three groups of people in the area. The sample size is arbitrarily fixed at
Table.2.2. Input Coefficients User of output Producer of input
X1 X2 X3
X1 a11 a12 A13X2 a21 a22 A23X3 a31 a32 A33

Economic valuation of Ecotourism Final Report
Kerala Forest Research Institute
25
30. The environmentalist in the sample consists of the people working for the
environment or the people arguing for the environment. The Officials and
Academicians include officials of forest department, local administrative bodies,
teachers and researchers working in the area. People’s representatives include those
elected to local level administrative bodies, representative of VSS, Clubs, etc. The
survey is conducted in two steps.
In the initial stage, data is collected from these groups through informal
discussions and then the general observation of different groups is assimilated. In the
second stage, we convey the general observation of one group or people to others
without revealing their identity and request them to reconsider their observation by
considering the opinions of other group. In the second step we collect the final
observation of the group by interview method.
Economic valuation of ecotourism Final report ______________________________________________________________________________________
__________________________________________________________________________________ Kerala Forest Research Institute
26
3. RESULTS AND DISCUSSION
3.1. The sector and policy framework
3.1.1. The Tourism Sector
Tourism is one of the world’s largest industries, generating an estimated 11 per cent of
global Gross Domestic Product (GDP), employing 200 million people and transporting
nearly 700 million international travelers per year- a figure that is expected to double by
2020 (Diley and Penny, 2001). The tourism sector makes important contributions to the
economies of developing countries, particularly to foreign exchange earnings;
employment and GDP
(Box 3.1). Developing countries have only a minority share of the international tourism
market (approx. 30 per cent) although this is fast growing.
The global scenario reveals that Travel and Tourism (T&T) industry contributes about
4.2 per cent of GDP whereas T&T economy contributes about 10.7 per cent of GDP.
Also T&T economy generate 8.2 per cent of total employment and 12.8 per cent of
exports worldwide. In India, T&T industry generate 12.3 million job (2.9 per cent of
employment) and 2.5 per cent of GDP whereas the contribution of T&T economy in
India to GDP is 5.3 per cent generating 25 million job (6 per cent of overall
employment), ranking second in the world (ITAR,2001-2002). The T&T industry refers
to products and services for visitor’s consumption whereas T&T economy include along
with it the production and services for industry demand.

Economic valuation of ecotourism Final report ______________________________________________________________________________________
__________________________________________________________________________________ Kerala Forest Research Institute
27
In the past few years, there has been a tremendous increase in the number of tourists
visiting India (Figure 3.1) . The international tourist arrivals, which stood at a mere 1.2
lakhs in 1960, rose to 12.5 lakhs in 1980 and further increased to 26 lakhs in 2000
(Tourist statistics, 2001).
Fig 3.1. Foreign Tourist Arrivals / Foreign Exchange Earnings (India)
0
0.5
1
1.5
2
2.5
3
1951
1956
1961
1966
1971
1976
1981
1986
1991
1996
1997
1998
1999
Year
Fore
ign
Tour
ist A
rriv
als
(mill
ions
)
0
2
4
6
8
10
12
14 Foreign Exchange Earnings(Rs. '000 crores)
Foreign tourist arrivals Foreign Exchange Earnings
The varied nature of destinations provides comparative advantages for tourism in
India. Most of these destinations, such as hill stations, archaeological monuments, and
pilgrim centers had been developed historically. Among the world’s 60 most important
tourism countries India, s position was 46th. Several tourism-related studies are being
undertaken in India in order to collect baseline data to support management plans. In
recent times, especially in the last two decades, keen interest is being taken to conduct
environmental impact assessments for all new tourism development projects.
Economic valuation of ecotourism Final report ______________________________________________________________________________________
__________________________________________________________________________________ Kerala Forest Research Institute
28
3.1.2. The policy framework
During the first few decades of independence, tourism was not viewed as a priority sector
for development. The focus of the government was only on wildlife conservation, putting
little emphasis on actual utilization and promotion. Though planning for tourism
promotion was taken up in the second and third five year plans for the development of
tourist facilities in India, it was only after sixth plan that tourism began to be considered
as a potential instrument for economic development and social integration. Until 1982
India did not have a definitive tourism policy. The Government of India (GOI) took
significant steps towards the development and promotion of tourism in the country
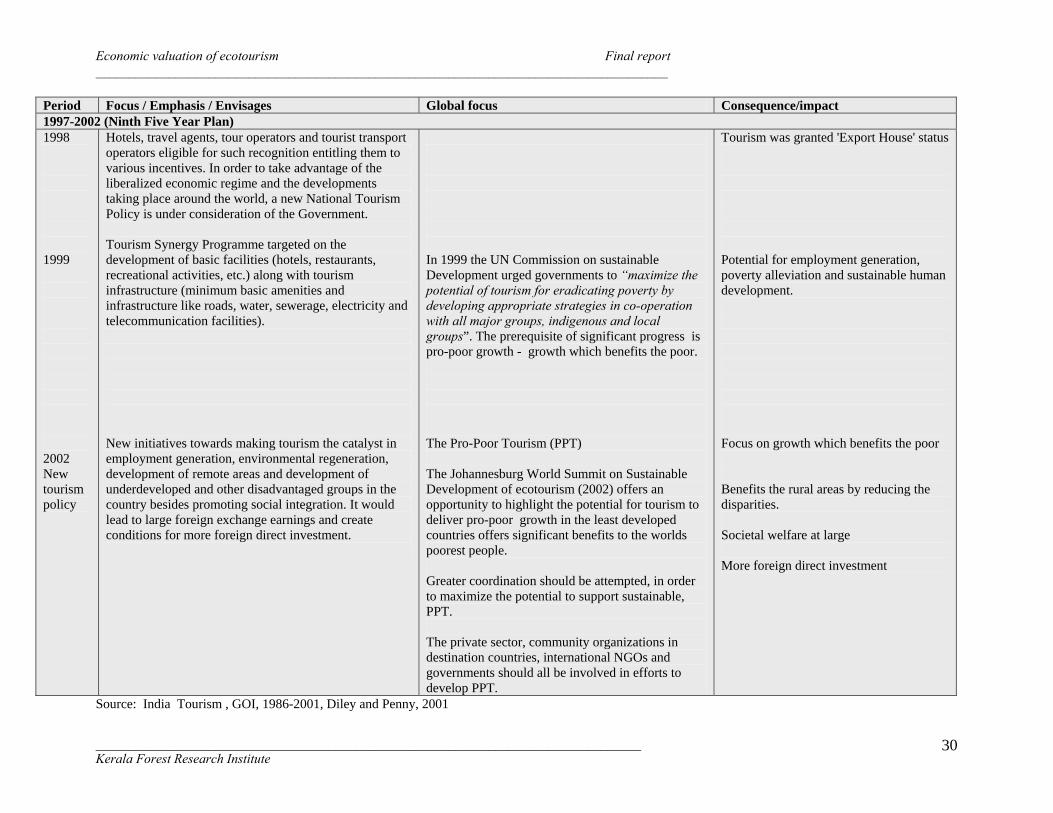
through various stages and periods (Table 3.1).
The plan outlay on tourism has been on an increase, accounting to Rs. 793.75
crores for the Ministry of tourism, as approved by the Planning commission, in the ninth
five year plan (1997-2002). This comprises of internal and external resources of Rs.
308.00 crores and an direct budgetary support of Rs. 485.75 crores (Indian tourism, 1999-
2000).

Economic valuation of ecotourism Final report ______________________________________________________________________________________
__________________________________________________________________________________ Kerala Forest Research Institute
29
Table 3.1. Policy for Tourism Promotion in India – an overview
Period Focus / Emphasis / Envisages Global focus Consequence/impact 1982 National Policy on Tourism
Development of travel circuits and assigned the responsibility of promoting international tourism to the Central Government and domestic tourism to the State Governments
Responsibility lacks complete co-ordination and fails to bring on integration at different levels
1986 The sector became eligible for several incentives and facilities including tax incentives, subsidies, priorities in the sanctioning of loans by the State financial institutions and preferences in providing electricity and water connections.
tourism given the status of industry
1988 A comprehensive plan for achieving sustainable growth in tourism was formulated by the National Commission on Tourism
WTO- The World Tourism Organisation defined sustainable tourism as early as 1988 as “leading to the management of all resources in such a way that economic, social and aesthetic needs can be fulfilled while maintaining cultural integrity, essential ecological process, biological diversity and life support systems”.
This approach has failed to recognize the link between poverty environment and development.
1991 Tourism sector opened up, making it eligible for automatic approvals up to 51% of the equity.
tourism was declared to be a priority sector for foreign investment
1992 A National Action Plan was initiated 1996 A National Strategy for Tourism Development was evolved, which
advocated the strengthening of an institutional set-up in human resource development, setting up of an Advisory Board of Tourism Industry and Trade (which has since been set up), the integrated development of tourist destinations and the promotion of private sector in tourism development.
Advocates better linkages between concerned sectors and promotes private sector involvement.
Economic valuation of ecotourism Final report ______________________________________________________________________________________
__________________________________________________________________________________ Kerala Forest Research Institute
30
Period Focus / Emphasis / Envisages Global focus Consequence/impact 1997-2002 (Ninth Five Year Plan) 1998 1999 2002 New tourism policy
Hotels, travel agents, tour operators and tourist transport operators eligible for such recognition entitling them to various incentives. In order to take advantage of the liberalized economic regime and the developments taking place around the world, a new National Tourism Policy is under consideration of the Government. Tourism Synergy Programme targeted on the development of basic facilities (hotels, restaurants, recreational activities, etc.) along with tourism infrastructure (minimum basic amenities and infrastructure like roads, water, sewerage, electricity and telecommunication facilities). New initiatives towards making tourism the catalyst in employment generation, environmental regeneration, development of remote areas and development of underdeveloped and other disadvantaged groups in the country besides promoting social integration. It would lead to large foreign exchange earnings and create conditions for more foreign direct investment.
In 1999 the UN Commission on sustainable Development urged governments to “maximize the potential of tourism for eradicating poverty by developing appropriate strategies in co-operation with all major groups, indigenous and local groups”. The prerequisite of significant progress is pro-poor growth - growth which benefits the poor. The Pro-Poor Tourism (PPT) The Johannesburg World Summit on Sustainable Development of ecotourism (2002) offers an opportunity to highlight the potential for tourism to deliver pro-poor growth in the least developed countries offers significant benefits to the worlds poorest people. Greater coordination should be attempted, in order to maximize the potential to support sustainable, PPT. The private sector, community organizations in destination countries, international NGOs and governments should all be involved in efforts to develop PPT.
Tourism was granted 'Export House' status Potential for employment generation, poverty alleviation and sustainable human development. Focus on growth which benefits the poor Benefits the rural areas by reducing the disparities. Societal welfare at large More foreign direct investment
Source: India Tourism , GOI, 1986-2001, Diley and Penny, 2001

Economic valuation of ecotourism final report ______________________________________________________________________________________
_____________________________________________________________________ Kerala Forest Research Institute
31
Policy for Tourism Promotion: The Mission of the policy for tourism promotion is to
promote sustainable tourism as a means of economic growth and social integration. The
Objectives of tourism development are to fasten understanding between people, to create
employment opportunities and bring about socioeconomic benefit to the community,
particularly in the interior and undeveloped areas. One of the major objectives is the
preservation and protection of natural resources and environment to achieve sustainable
development. The new tourism policy endows significant importance to tourism being a
multi-dimensional activity
(Box 3.2) in which different stakeholders come together and thereby the community at
large is benefited besides the immediate tourists.
3.1.3. Tourism Sector of Kerala : The State of Kerala provides maximum potential for
the development of ecotourism, highlighting various ecotourism destinations like, the
Wildlife Sanctuaries / National Park, Beaches, Backwaters, Plantations, Hill Stations and
Eco Resorts. The past few years, has noted an increase in the number of tourists visiting
Kerala (Figure 3.2). The international tourist arrival, which stood at 202173 in 1999, rose
to 294621 in 2003. The total number of domestic tourists visiting Kerala is 4888287 in
1999, which rose to 5871228 in 2003 (Tourist Statistics, 2004- 06).

Economic valuation of ecotourism final report ______________________________________________________________________________________
_____________________________________________________________________ Kerala Forest Research Institute
32
Fig. 3.2. Foreign Tourist Arrivals / Foreign Exchange Earnings (Kerala)
050
100150200250300350
1999 2000 2001 2002 2003
Year
Fore
ign
Tour
ist
Arr
ival
s (in
000
)
0
200
400
600
800
1000
1200
Foreign Exchange Earnings (Rs. in crores)
Foreign tourist arrivals Foreign Exchange Earninigs
Tourism Policy of Kerala: The tourism policy of the State government published in
August, 2002 envisages Kerala as an up market high quality tourist destination through
optimal use of resources with focus on conserving and preserving heritage and
environment. The policy lists an action plan to achieve a 10 per cent increase in earnings
from tourism with 7 per cent growth in foreign and 10 per cent growth in domestic
tourists arrivals. This way the policy hopes to create 10,000 jobs opportunities every year.
It proposes that the existing legislation, such as the Kerala Land Utilization Order, Rent
Control Act, Labour Act, Building Tax Act and Excise Law would be rationalized in
order to facilitate the growth of tourism (KTPS, 2002).
The policy proposes to create awareness and tourism consciousness among the
people particularly among the taxi drivers, bus conductors, ports and customs and
emigration officers and others with whom tourists encounter. The promotion of tourism
will be based on the carrying capacity of the destination. Preservation of art, culture and
heritage of the state will be part of the policy objectives. Special tourism zone will be

Economic valuation of ecotourism final report ______________________________________________________________________________________
_____________________________________________________________________ Kerala Forest Research Institute
33
identified and measures taken to preserve and conserve them. The institution of human
resource development in the field will be developed into institutions par excellence.
Panchayath Raj institutions and non governmental institutions will be involved in the
development of tourism infrastructure and tourism awareness. The action plan envisages
the tourism department as the nodal agency for coordinating all activities related to
tourism. Area development plan will be prepared for all tourism destinations and plans
and implementations will be reviewed periodically. The approval of the tourism unit by
the tourism department will be made mandatory to guarantee quality services.
A single window system is proposed for clearing tourism projects, and a special
campaign planned to attract Non–Resident Indian investment. Tourism greatly benefits
the rural areas by reducing the disparities. For example, the highlights of socioeconomic
impact of tourism on folk artists and artisans of Kerala and Rajasthan reveal that more
than 90 per cent of the artisans income comes from tourists activities, and this has led to
higher education and better standards of living (Tourist Information, 2001).
The policy on the whole does focus on the overall societal welfare following the Pro-
poor tourism (PPT) concept (Box 3.3) as has been emphasized in the 2002 Johannesburg
World Summit on Sustainable Development. The net benefits to the society may be
economic, but they may also be social, environmental or cultural. Pro-poor tourism is not
a specific product or sector of tourism, but an approach to the industry. Strategies for
making tourism pro-poor focuses specifically on unlocking opportunities for the poor
within tourism, rather than expanding the overall size of the sector. It identifies three core
areas of focus include: (i) increased economic benefits, (ii) enhancing non-economic

Economic valuation of ecotourism final report ______________________________________________________________________________________
_____________________________________________________________________ Kerala Forest Research Institute
34
impacts, and (iii) policy / process reform. In other words poverty is the core focus of the
PPT.
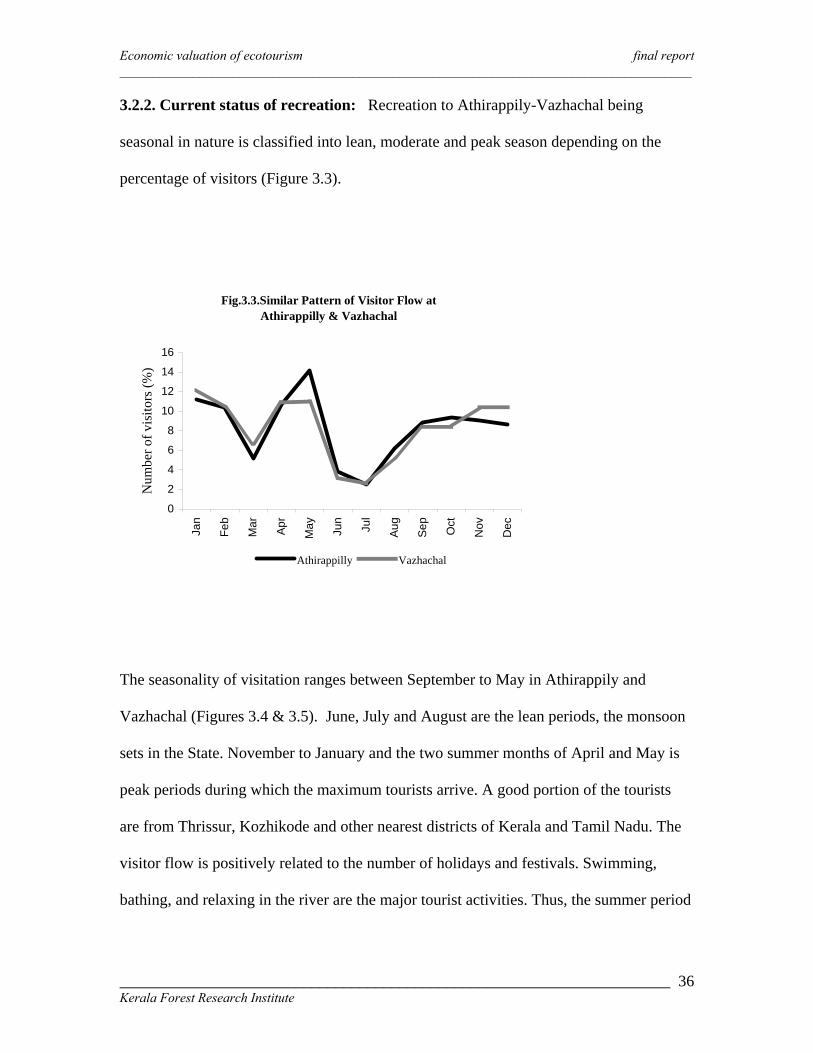
3.2. The recreation potential of tourism
3.2.1. Tourism in Athirappily-Vazhachal recreation sites
As has already been mentioned earlier Vazhachal Forest Division is a forest tract known
for its natural resources. Athirappily and Vazhachal water falls are the two major
recreational sites here along the Chalakudy river basin. In between these two falls is the
Charpa falls. The magnificent Athirappily waterfall (Plate 5) in a forest background
attracts thousands of nature admirers and tourists. The area is having immense
ecotourism potential considering the number of visitors who come to this area in different
seasons. Almost 3.5 lakhs visitors visit these sites annually. In Athirappily the main

Economic valuation of ecotourism final report ______________________________________________________________________________________
_____________________________________________________________________ Kerala Forest Research Institute
35
natural attractions are the magnificent waterfall (42 meters high and 220 meters wide),
the dense forest as the background of the fall ever flowing clean water of the Chalakudy
river. In Vazhachal (Plate 6) the main attractions are the small waterfalls, a garden, an
interpretation center (yet to be opened up to the public), natural scenic beauty of the
forest and wild life. The Charpa falls (Plate 7) is a comparatively small but magnificent
water falls which lies on the left side of the road, 3 km from Athirappily Water falls on
the way to Vazhachal. During rainy season this water fall has a slanting height of 63 m
and width of 28.3 m, presenting a magnificent sight. The Vazhachal recreation spot is 5
km away from the Athirappily recreation site. Chalakudy is the nearest township from
Athirappily which is 30 km away connecting with the National Highway 47. Athirappily
–Vazhachal thus is naturally and socially endowed with high potential features for
tourism development in natural areas.
Economic valuation of ecotourism final report ______________________________________________________________________________________
_____________________________________________________________________ Kerala Forest Research Institute
36
3.2.2. Current status of recreation: Recreation to Athirappily-Vazhachal being
seasonal in nature is classified into lean, moderate and peak season depending on the
percentage of visitors (Figure 3.3).
Fig.3.3.Similar Pattern of Visitor Flow at Athirappilly & Vazhachal
0
2
4
6
8
10
12
14
16
Jan
Feb
Mar Ap
r
May Jun
Jul
Aug
Sep
Oct
Nov
Dec
Num
ber o
f vis
itors
(%)
Athirappilly Vazhachal
The seasonality of visitation ranges between September to May in Athirappily and
Vazhachal (Figures 3.4 & 3.5). June, July and August are the lean periods, the monsoon
sets in the State. November to January and the two summer months of April and May is
peak periods during which the maximum tourists arrive. A good portion of the tourists
are from Thrissur, Kozhikode and other nearest districts of Kerala and Tamil Nadu. The
visitor flow is positively related to the number of holidays and festivals. Swimming,
bathing, and relaxing in the river are the major tourist activities. Thus, the summer period

Economic valuation of ecotourism final report ______________________________________________________________________________________
_____________________________________________________________________ Kerala Forest Research Institute
37
attracts more tourists to the clean flowing water here at Athirappily. Seeing wildlife is
another attraction in the site, during the summer period wildlife like elephant, deer,
among others come out for drinking water. Thus, these recreational sites have great
potential to provide seasonal employment to the local community.
3.2.3. Revenue generation potential of sites: The visitor flow on an average is 2.3 lakh
and 5.3 lakh visitors/ year at Vazhachal and Athirappily respectively. The average fee
collection is about Rs. 10 lakh /year at Vazhachal and Rs.23.5 lakh / year at Athirappily.
Parking fee for vehicles comes to around Rs1.39 lakh / year and Rs. 2.7 lakh / year at
Vazhachal and Athirappily respectively.
The revenue generating capacity of the Vazhachal recreational site (Table 3.2) indicates
that on an average Rs 5.6 lakhs is earned from visitors entrance fee and parking charges.
Revenue generated from entrance fee is 3.5 times higher than that generated from the
parking fees, i.e., by way of 2.3 lakhs visitors visiting this site and 22 thousand tourist
vehicles coming in per year. Year 2001 registered the highest revenue generation (Rs.
6,12,490 ) during the period 1994-2003.
Table 3.2. Revenue generating potential of Vazhachal recreation site.
Visitor Vehicle
Total Revenue generated (in Rs. )
Year
Number Revenue (Fee)
Number Revenue (Fee)
1994 251762 468042 21122 124121 592163
1995 276107 512284 23905 139612 651896
1996 252512 474714 23306 131966 606680
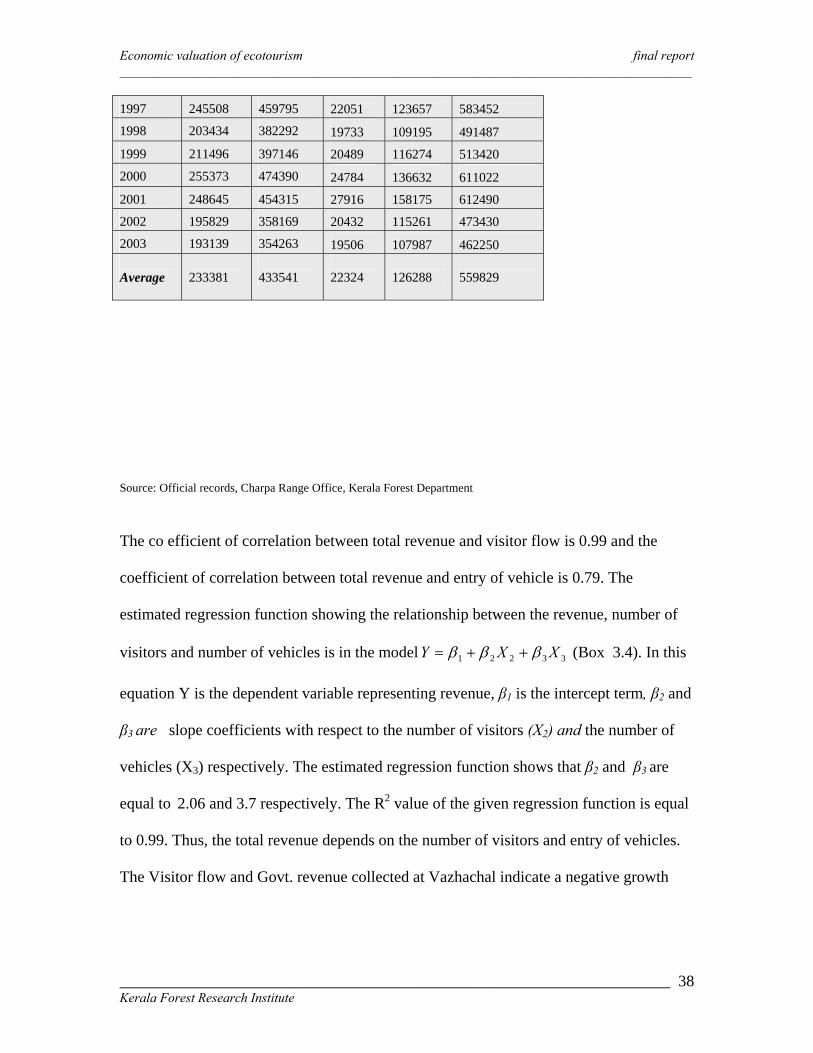
Economic valuation of ecotourism final report ______________________________________________________________________________________
_____________________________________________________________________ Kerala Forest Research Institute
38
Source: Official records, Charpa Range Office, Kerala Forest Department
The co efficient of correlation between total revenue and visitor flow is 0.99 and the
coefficient of correlation between total revenue and entry of vehicle is 0.79. The
estimated regression function showing the relationship between the revenue, number of
visitors and number of vehicles is in the model 33221 XXY βββ ++= (Box 3.4). In this
equation Y is the dependent variable representing revenue, β1 is the intercept term, β2 and
β3 are slope coefficients with respect to the number of visitors (X2) and the number of
vehicles (X3) respectively. The estimated regression function shows that β2 and β3 are
equal to 2.06 and 3.7 respectively. The R2 value of the given regression function is equal
to 0.99. Thus, the total revenue depends on the number of visitors and entry of vehicles.
The Visitor flow and Govt. revenue collected at Vazhachal indicate a negative growth
1997 245508 459795 22051 123657 583452
1998 203434 382292 19733 109195 491487
1999 211496 397146 20489 116274 513420
2000 255373 474390 24784 136632 611022
2001 248645 454315 27916 158175 612490
2002 195829 358169 20432 115261 473430
2003 193139 354263 19506 107987 462250 Average
233381
433541
22324
126288
559829

Economic valuation of ecotourism final report ______________________________________________________________________________________
_____________________________________________________________________ Kerala Forest Research Institute
39
(Figure 3.6) due to the lack of adequate facilities and service sector development in the
sites.
3.2.4. Demographic characteristics of visitors: The visitor profile is presented in
Appendix 3.1. The sex composition of the visitors is such that 57 per cent of the
respondents are male; 43 per cent are female. The sex composition of tourists in the area
is dominated by the males for both national and international tourists. In the case of
national tourist it is 764 for 1000 males while that of international tourists is 788 per 1000
international male tourist. The estimated child visitation rate is equal to 486 for national
tourists and 292 for international tourists per 1000 tourists. Even though foreign tourists
visit the site every year, it is relatively low compared to the numbers of national tourists.
The estimated international visitor ratio to national visitor to Athirappily-Vazhachal is
only 5 per 1000 national tourists. Among the national tourists a good share of visitors are
from Kerala itself compared to other states in the country. The estimated ratio of visitors
from other states is equal to 158 per 1000 tourists from Kerala. The average number of
years of formal education of visitors in the sample is 15.8 years, almost equivalent of a
bachelor’s degree. The visitors at Athirappily-Vazhachal are generally educated, with
62.4 per cent possessing bachelors’ degree, 11.2 per cent Masters and higher degree.
Visitors reported an average per capita household income of Rs. 29703, considerably
more than the state average of Rs 18,262 (1999-2000). In fact, more than 97.8 per cent of
the respondents had household incomes greater than the state average. This is reflected,
in part, by the large proportion of visitors (98 %) employed in professional occupations.

Economic valuation of ecotourism final report ______________________________________________________________________________________
_____________________________________________________________________ Kerala Forest Research Institute
40
A majority of the visitors originated from nearby districts and states, mainly from Tamil
Nadu (9.66 %) and Karnataka (2%) (Appendix 3.2). With smaller percentages
originating from Andhra Pradesh, Gujarat, Maharashtra, Manipur, Pondicherry,
Rajasthan, Uttar Pradesh and West Bengal. The most common metropolitan centers of
origin are, Kochi, Thiruvananthapuram, Chennai and Bangalore. Of the total 29 per cent
of the respondents came from urban residential setting.
It is estimated that 37.4 per cent of the visitors coming to the recreational sites is from in
and around Thrissur district itself. Local residents constitute 12 per cent and foreign
visitors account for only a meager 0.45 per cent. The tourists are mostly independent
visitors who are groups of young people, students, families among others, coming mostly
during weekends and holidays. Purposes of visit stated by them are categorized as
follows:
• To enjoy the natural serene atmosphere,
• To understand and study the nature (plants and animals),
• Accessibility wise closer from city and short travel time,
• Low travel cost,
• To be far from the hustle-bustle of city life
Visitors coming from other states are mostly government officers, pilgrims visiting
various other religious spots in the State, college and school students who come on
conducted tours. Foreign visitors coming to the site are from various developed countries
Economic valuation of ecotourism final report ______________________________________________________________________________________
_____________________________________________________________________ Kerala Forest Research Institute
41
like the USA, UK, Germany, Canada, Italy, among others although their per cent is
meager in comparison to the national and regional tourists.
3.2.5. Recreational characteristics: The visitors participate, on an average, 12 days per
year in nature tourism. 51.2 per cent were first time visitors to the site. 27 per cent had
visited the park at least two times, and 21.8 per cent of the respondents had visited the
site more than two times.
Photography is an important aspect of their experience at Athirappily-Vazhachal.
Visitors spend an average of 7 hours/day at Athirappily-Vazhachal. The overall trip
length averaged 12 hours/days, of which 58 per cent was spent in Athirappily-Vazhachal
recreational site.
3.2.6. Trip expenditures: Major expenditures included travel (42.6 %), food (32 %),
and accommodation (25.4 %). Of the sample 42.2 per cent used personal vehicles to
travel to the site, while others traveled by rental vehicles (46 %), or other forms of
transport (11.8 %), such as guided tourist buses or vans. With the primary attraction
being the natural falls, Chalakudy is the major beneficiary in providing facilities and
services to this user group.
3.2.7. The current tourist activity zone and the Affected Forest Area
Tourism here at Athirappily and Vazhachal is nature based which include both mass
tourism and simple ecotourism. But for an interpretation centre of the Kerala Forest

Economic valuation of ecotourism final report ______________________________________________________________________________________
_____________________________________________________________________ Kerala Forest Research Institute
42
Department, educational activities are very limited in this area. Being an area rich in
biodiversity it has attracted large number of nature lovers and students. The tourist
activities now include, walking along the natural trails, i.e. trek paths constituted by the
Forest Department (Box. 3.5) and conducted by trained guides of the Department,
enjoying the scenic beauty of the natural falls and forests in the background. The current
visitor activity zone is spread 100 m to both sides of the road from the Athirappily check
post to Irumbapalam (Map 3.1). This is

Economic valuation of ecotourism final report ______________________________________________________________________________________
_____________________________________________________________________ Kerala Forest Research Institute
43
Map 3.1 Tourist activity zone – 1.33 sq. km (shown as the white patch parallel to the Chalakudy River in the map)

Economic valuation of ecotourism final report ______________________________________________________________________________________
_____________________________________________________________________ Kerala Forest Research Institute
44
arrived at considering the different visitor activities, such as taking a walk alongside or
relaxing in the wilderness. Thus, the total affected forest area is worked out based on the
current visitor activity zone is approximately 1.33 sq km.
3.3. The recreation value (RV) of ecotourism
As has been explained earlier recreation is a non-marketed use value and its valuation in
monetary terms is difficult. It includes recreation uses of the natural areas which do not
require exclusive associated development, but at the same time, provides economic gains
to local communities. Athirappily-Vazhchal is fast emerging as a potential ecotourism
site and viable alternative to the conservation of forest and enhancing the standard of
living of the depending communities. The recreation value or the recreation potential of
Athirappily-Vazhachal has been ascertained by applying the travel cost, contingent
valuation technique, and the contingent activity method.
3.3.1 Travel cost method for estimating the RV
As the recreation service offered by the forest is an intangible benefit which cannot be
estimated by using the usual market terminology, here we use an indirect method of
valuation based on the travel cost of the tourists. Here, the travel cost of the tourist is
considered as their sacrifice to have the recreation benefit. The surplus satisfaction
obtained by the tourists is an indication of the future development potential of the
recreation economy. The individual travel cost method was applied to estimate the

Economic valuation of ecotourism final report ______________________________________________________________________________________
_____________________________________________________________________ Kerala Forest Research Institute
45
recreation surplus. It is assumed here, that the visitor flow is a function of travel cost
while all other factors remain constant. The recreation demand curve is estimated by
using the OLS method. It is assumed that V = f (TC), where V, TC, and f represents
number of visitors, travel cost and functional relationship respectively. In this recreation
demand curve 3566 is the intercept term and -1.02 is the slope coefficient of visitor flow
with respect to travel cost (Box 3.6). The estimated aggregate recreation surplus of the
sample is equal to Rs 20,69,214 with an average recreation surplus per visitor of 2,593
(Table 3.3). The estimated recreation surplus is very high due to the high variation in the
travel cost of the people from different regions of the world. In order to mitigate the
Economic valuation of ecotourism final report ______________________________________________________________________________________
_____________________________________________________________________ Kerala Forest Research Institute
46
effect of high variation in the travel cost of the people on the calculation of the recreation
surplus, we estimate the recreation surplus of different regions separately.
3.3.1.1. Recreation surplus of visitors from Kerala (Individual Travel cost method)
The recreation surplus derived by the tourists is estimated by using the individual travel
cost method. Travel cost is a function of the distance covered and mode of travel, that is
TC = f (Distance, Mode of Travel). In the sample, total number of visitors from Kerala
numbered 10253 of which 9,279 responded to the questions and their average travel cost
equaled Rs. 429. In the estimated recreation demand curve (Box 3.7) 1,363 represents the
constant and 1.63 represents the slope coefficient of the recreation demand curve with
respect to travel cost. The estimated R2 value is 0.22 which explains that 22 per cent of
the visitation can be explained by the travel cost. The aggregate recreation surplus of the
people from Kerala amounts to Rs. 8,77,074 with an average recreation surplus of Rs 196
(Table 3.4). The recreation surplus of people from Thrissur and Kannur is zero while
those from other districts are positive.
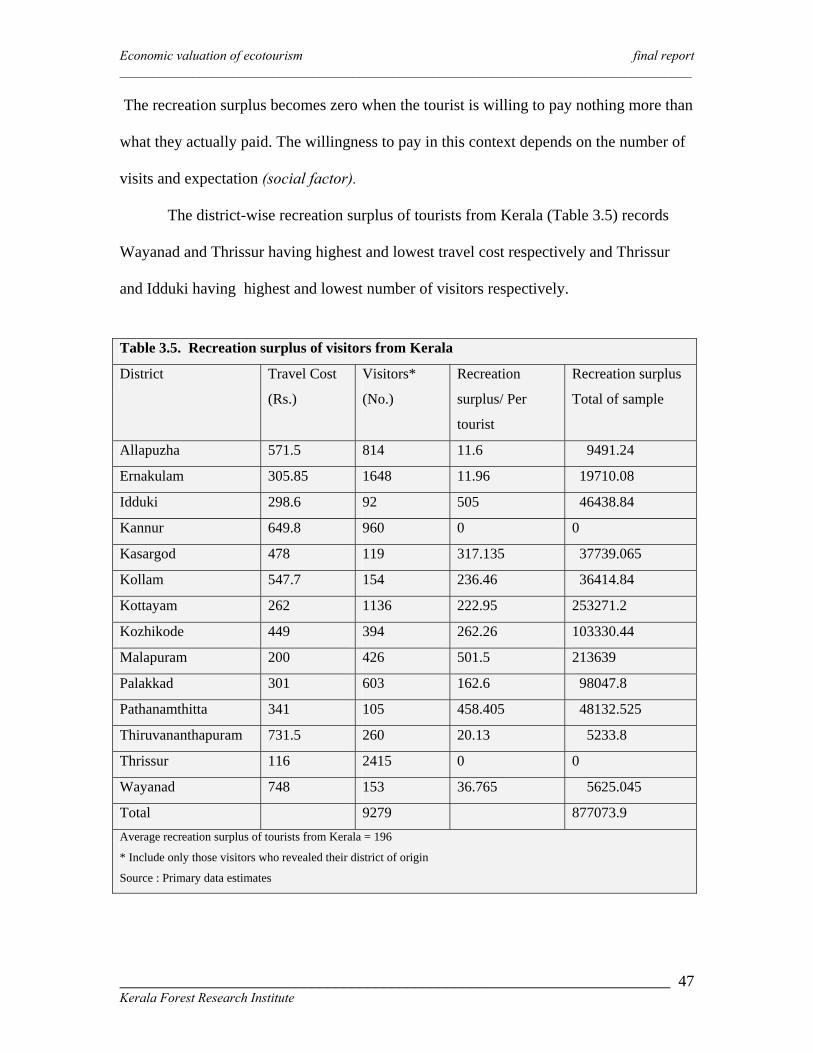
Economic valuation of ecotourism final report ______________________________________________________________________________________
_____________________________________________________________________ Kerala Forest Research Institute
47
The recreation surplus becomes zero when the tourist is willing to pay nothing more than
what they actually paid. The willingness to pay in this context depends on the number of
visits and expectation (social factor).
The district-wise recreation surplus of tourists from Kerala (Table 3.5) records
Wayanad and Thrissur having highest and lowest travel cost respectively and Thrissur
and Idduki having highest and lowest number of visitors respectively.
Table 3.5. Recreation surplus of visitors from Kerala
District Travel Cost
(Rs.)
Visitors*
(No.)
Recreation
surplus/ Per
tourist
Recreation surplus
Total of sample
Allapuzha 571.5 814 11.6 9491.24
Ernakulam 305.85 1648 11.96 19710.08
Idduki 298.6 92 505 46438.84
Kannur 649.8 960 0 0
Kasargod 478 119 317.135 37739.065
Kollam 547.7 154 236.46 36414.84
Kottayam 262 1136 222.95 253271.2
Kozhikode 449 394 262.26 103330.44
Malapuram 200 426 501.5 213639
Palakkad 301 603 162.6 98047.8
Pathanamthitta 341 105 458.405 48132.525
Thiruvananthapuram 731.5 260 20.13 5233.8
Thrissur 116 2415 0 0
Wayanad 748 153 36.765 5625.045
Total 9279 877073.9 Average recreation surplus of tourists from Kerala = 196
* Include only those visitors who revealed their district of origin
Source : Primary data estimates

Economic valuation of ecotourism final report ______________________________________________________________________________________
_____________________________________________________________________ Kerala Forest Research Institute
48
The recreation surplus of people from Thrissur and Kannur is equal to zero and they are
not willing to pay anything more than the travel cost and entrance fee. In case of the
tourists from Thrissur, recreation surplus become zero because of the persistent visits and
diminishing marginal utility, while in case of the tourists from Kannur, recreation surplus
became zero because of the high travel cost and other socio-economic factors.
Estimating Recreation surplus : The total number of visitors from Kerala numbered
10253 and the average recreation surplus per visitor worked out to Rs. 196 with an
average cost of Rs. 429 (Appendix 3.3). As is seen maximum visitors besides home state
are from Tamil Nadu followed by Karnataka and Andhra Pradesh (Table 3.6). The total
number of visitors coming from Tamil Nadu is 1152 and their average recreation surplus
is 123 and the average travel cost per tourists is Rs 1856. The average recreation surplus
of 236 tourists coming from Karnataka is Rs 116 with Rs 1396 as an average travel cost
per tourists. The people from Andhra Pradesh earn a recreation surplus of Rs 109 and
their average travel cost is equivalent to Rs 2050. People from other state together earn a
recreation surplus of Rs 103 with an average travel cost of Rs 5016. In short, the
recreation surplus per tourists of the total sample is equal to Rs. 185. The estimated
aggregate recreation surplus of the sample is equal Rs. 2202676.
3.3.1.2. Factors Determining Recreation surplus
a ) Travel Cost and Recreation Surplus
The relationship between recreation surplus and travel cost of the tourists of different
districts of Kerala reveals that recreation surplus has an inverse relationship with the
Economic valuation of ecotourism final report ______________________________________________________________________________________
_____________________________________________________________________ Kerala Forest Research Institute
49
travel cost (Figure 3.7). The estimated OLS equation (Box 3.8) shows the relationship, in
which RS and TC represent recreation surplus and travel cost respectively. The negative
slope coefficient (-0.63) points out that one unit increase in the travel cost leads to 0.63
unit reduction in the recreation surplus.
b). Number of Visits and Recreation surplus : As the number of trips to a particular
tourist destination increases, the marginal utility from the site will fall thereby the visitor
will be willing to pay only less. The average number of visitors from Thrissur is the
highest with 5 times followed by Ernakulam (3 times) and Palakkad (2 times). The
average number of visits of the people from Kasaragod, Kollam and Kottayam is one as it
is their first visit. Thus, the data projects an inverse relationship between the number of
visits and Recreation surplus (Figure 3.8). The increase in the number of visits reduces
the marginal recreational utility and willingness to pay for reaching the recreation centre.
If the expectation is high, the probability of becoming unsatisfied is high and it will
adversely affect the willingness to pay of the people. As the willingness to pay falls and
the travel costs remain the same or increases, the recreation surplus of an additional trip
will be lower than the earlier one.

Economic valuation of ecotourism final report ______________________________________________________________________________________
_____________________________________________________________________ Kerala Forest Research Institute
50
c ). Recreation surplus, Travel cost and Number of visits : As has been explained the
recreation surplus is a function of travel cost and number of visits, i.e., Recreation surplus
= f (Travel cost, Number of visits). The estimated functional form of recreation surplus
(Box 3.9) shows that recreation surplus is inversely related to travel cost and number of
visits. The slope coefficient of recreation surplus with respect to travel cost is -0.12 which
implies that one unit increase in the travel cost leads to 0.12 unit reduction in the
recreation surplus and vice versa. The slope coefficient of recreation surplus with respect
to the number of visits is -1.82 which indicates that one unit increase in the number of
visits will result in 1.82 unit reduction in the recreation surplus.
3.3.1.3. Factors Determining Willingness To Pay for having Recreational Benefits
a) Willingness to Pay and Recreation surplus : WTP = f (Recreation surplus)
The WTP and recreation surplus are positively related. The data highlighted that if the
tourist is satisfied with the natural beauty and the surrounding recreational facilities they
are willing to pay more. This relation also indirectly reveals the indirect relationship
between willingness to pay and degradation of the forest area. If the degradation of the
affected forest area is high, it will generate less recreation surplus which leads to lower
willingness to pay. The estimated slope coefficient of WTP with respect to recreation
surplus is 0.44 (Box 3.10) which reveals that one unit increase in the recreation surplus
leads to 0.44 unit increase in the WTP.
In general, it is observed that WTP = f (Recreation surplus) and Recreation surplus = f
(Travel cost , Number of visits), thus WTP = f (Travel cost , Number of visits).

Economic valuation of ecotourism final report ______________________________________________________________________________________
_____________________________________________________________________ Kerala Forest Research Institute
51
b) Indirect influence of Travel cost on the WTP
Change in WTP (Y) due to a change in the travel cost [dY/ dT] is equal to the product of
change in the willingness to pay due to a small change in recreation surplus (dY/dX) and
change in the consumers surplus due to a small change in the travel cost (dX/dT)
(Equation 1) (Box 3.11).
The data projects one unit increase in the travel cost leads to 0.05 unit reduction in the
willingness to pay.
c ) Indirect influence of number of visits on the WTP
Change in the WTP (Y) due to a change in the number of visits [dY/dV] is equal to the
product of change in the willingness to pay due to a change in the recreation surplus
(dY/dX) and change in the recreation surplus due to a change in the number of visits
(dX/dV), equation 2 (Box 3.12). It is projected that one unit increase in the visitation rate
leads to 0.8 unit reduction in the willingness to pay of the sample collected.
d ). Income and WTP
The relationship between monthly income and the amount that the people are willing to
pay in their life time for the conservation of the natural resources in Athirappily-
Vazhachal is worked out for four income groups (Table 3.7).
Table 3.7. Relationship between income and WTP Income Group
(Range)
WTP Group
(Range)
Mean
Income
Mean
WTP
WTP
Per cent
Number of
observation
Coefficient
correlation
0 - 10000 0 - 10000 5780 220 3.8 544 0.00
11000 - 20000 0 – 1000 15917 284 1.8 78 0.08

Economic valuation of ecotourism final report ______________________________________________________________________________________
_____________________________________________________________________ Kerala Forest Research Institute
52
20000 - 30000 0 – 1000 27444 290 1.1 36 -0.1
30000 - 100000 0 - 10000 57105 1211 2 19 0.15
The correlation coefficient of the income group 0 – 10000 is equal to zero, which revels
that there is no relationship between income and WTP in this income group, while it is
slightly increased to 0.08 for the income group 11000 – 20000. But it is -0.1 in the case
of the income group 20000 – 30000 and 0.15 for the income group 30000 – 100000. In
brief, of the four groups of classification, one group represents no correlation, two groups
represent slight positive correlation near to no correlation and another one group
represents negative correlation which is also near to zero. Thus, it is conclusive
/understood that there is no direct or indirect positive or negative correlation between
income and WTP. A theoretical representation of the relationship between Material
Resources (MR) and Natural Resources (NR) (Figure 3.9) indicates the existence of a
paradox scenario where “People are willing to pay relatively less as income increase”.
As is seen in the figure the indifference curve (indifference curve in this context is the
locus of different combinations of material resources and natural resources giving equal
amount of utility to the people) represents the U0 amount of utility. There are three areas
of consumption
• The area before the point e. The area of perfectly inelastic portion
• The area between e and f. That is the area of no correlation portion
• The area after point f, that is the area of perfectly elastic portion
In the first area of consumption that is before point e the marginal utility of additional
material resource is zero. In this stage the individual has large amount of material
resource and the marginal utility of additional material resource is zero. At this stage
people look for satisfaction from other sources such as spirituality, going into the nature
Economic valuation of ecotourism final report ______________________________________________________________________________________
_____________________________________________________________________ Kerala Forest Research Institute
53
among others. At this stage the size of natural resource is relatively lower compared to
the material resource. Since the natural resource is relatively lower and marginal utility of
material resources is zero, people are willing to pay more for the conservation of natural
resources as their income increases. In short, the societies highly developed in
materialistic term; exhibit a positive relationship between increase in material resources
and the amount of material resources that the people are willing to sacrifice for having
the benefit of the natural resources. But, this is an extreme scenario in the real world
where there is poverty and low standard of living. In developing countries like India
people prefer more material resources for their wellbeing and improved standard of
living.
In the third stage of consumption, which is after the point f, the perfectly elastic
portion implies that the marginal utility of additional natural resources is zero. For
example the case of tribal living within the forest the marginal utility of additional natural
resource is zero to them but the marginal utility of material resources is positive. Thus
they will prefer material resources to the natural resources. This is the reason for tribes
expressing less desire in participating wholeheartedly in the conservation without any
incentives.
Normally a person is in the second stage of consumption, which is in the no
correlation portion (ef in the figure). They are basically neutral to both material resources
and natural resources. The normal person is always trying to maximize their utility and
moving to higher indifference curve. The economic development offers a conducive
externality factors for increasing utility by increasing material resources. As the
economic development is going on the one side and the natural resources is falling on the
Economic valuation of ecotourism final report ______________________________________________________________________________________
_____________________________________________________________________ Kerala Forest Research Institute
54
other, resulting in the lower utility from natural resources. Thus, for increasing their
utility they have to increase the materialistic gain. The normal person continues trying to
increase the material resources thus they are willing to pay only a minimum amount
irrespective of their increase in income. The highlights of the relationship between WTP
and income are summarized below.
• Falling natural resources is not due to the action of a single individual. But the
increasing material resources of the individual is due to his own action thus he
will pay for the conservation of natural resources irrespective of the increase in
his personal income level. That is there does not exist any proportional
relationship between WTP and increase in income.
• People try to maximize utility which is a combination of utility from material
resources and natural resources, but the utility from natural resources is falling
thus they give more preference to the gain in material resources
• Material resources and natural resources are not perfect substitutes, but both of
these are two component of the utility function. Since, it is not perfect substitute
income and WTP are not directly related.
• WTP of an individual depends upon his level of awareness, environmental
consciousness and other socioeconomic factors.
• The shaded area in the circle shows the existence of no correlation between
increase in material resources and WTP.
Thus, at this stage WTP is not directly or inversely proportional to the increase in the
income but it depends upon various socio-cultural, economic, awareness level and
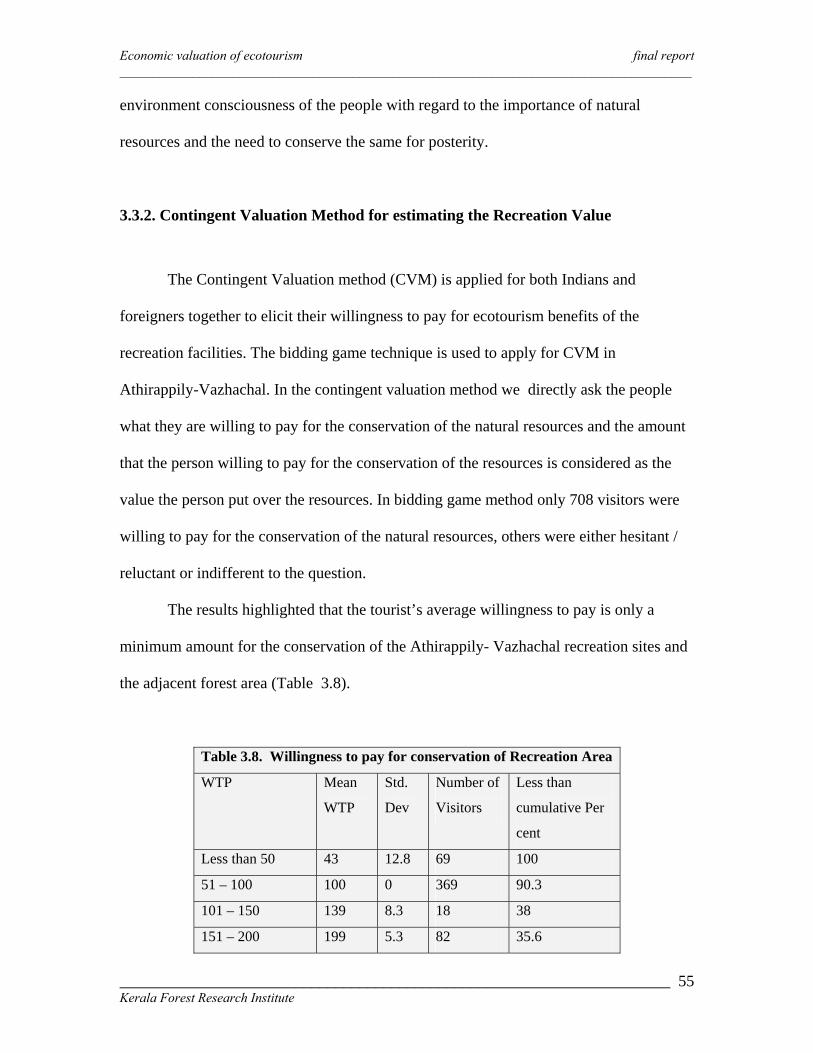
Economic valuation of ecotourism final report ______________________________________________________________________________________
_____________________________________________________________________ Kerala Forest Research Institute
55
environment consciousness of the people with regard to the importance of natural
resources and the need to conserve the same for posterity.
3.3.2. Contingent Valuation Method for estimating the Recreation Value
The Contingent Valuation method (CVM) is applied for both Indians and
foreigners together to elicit their willingness to pay for ecotourism benefits of the
recreation facilities. The bidding game technique is used to apply for CVM in
Athirappily-Vazhachal. In the contingent valuation method we directly ask the people
what they are willing to pay for the conservation of the natural resources and the amount
that the person willing to pay for the conservation of the resources is considered as the
value the person put over the resources. In bidding game method only 708 visitors were
willing to pay for the conservation of the natural resources, others were either hesitant /
reluctant or indifferent to the question.
The results highlighted that the tourist’s average willingness to pay is only a
minimum amount for the conservation of the Athirappily- Vazhachal recreation sites and
the adjacent forest area (Table 3.8).
Table 3.8. Willingness to pay for conservation of Recreation Area
WTP Mean
WTP
Std.
Dev
Number of
Visitors
Less than
cumulative Per
cent
Less than 50 43 12.8 69 100
51 – 100 100 0 369 90.3
101 – 150 139 8.3 18 38
151 – 200 199 5.3 82 35.6

Economic valuation of ecotourism final report ______________________________________________________________________________________
_____________________________________________________________________ Kerala Forest Research Institute
56
201 – 250 250 0 26 24
251 – 300 300 0 9 20
301 – 400 400 0 2 19
401 – 500 500 0 84 19
501- 1000 1000 0 39 7
1001-2000 2000 0 4 1.4
2001 -5000 5000 0 4 0.8
5001 - 10000 10000 0 2 0.3
Total 708
The feasibility of the conservation of the forest by collecting funds from the public
depends on various socioeconomic and demographic determinants of the willingness to
pay. In order to identify the feasibility we estimate the logistic regression.
3.3.2.1. Demographical, social and economic factors determining the WTP for the
conservation of Athirappily-Vazhachal recreation site
In the logistic regression model people’s willingness to pay for the conservation of
Athirappily-Vazhachal recreation sites and the adjacent forest area is considered as the
dependent variable. The independent variable is classified into three categories such as
demographic (age, family size, and schooling), social (religion) and economical (income)
(Table 3.9). In the sample, the maximum and minimum family size is 18 and 2
respectively with an average family size of 5. The average monthly income of the family
is 29703.

Economic valuation of ecotourism final report ______________________________________________________________________________________
_____________________________________________________________________ Kerala Forest Research Institute
57
The odds ratio of willingness to pay is higher among the age group 20 to 60 than that of
60 and above which reveals the probability of willingness to pay for the conservation is
higher among the present generation than the older generation. The probability of
willingness to pay is high among the educated one, in this analysis years of schooling is
taken as a measure of education. The calculated odd ratio (2.5) is higher among the group
of people who have 15 to 22 years of schooling experience while the odd ratio of those
who have only less than 15 years of experience is only 1.16. The analysis revealed a
small positive relationship between the willingness to pay and the family size. With a
family size of 2 to 3 taken as a reference category we get an odd ratio of willingness to
pay for family size 2 to 5 as 0.2 and that of family size above 6 members as 0.6 which is
higher than that of a lower family size. The probability of willingness to pay to a Non-
Governmental Organisation to conserve biodiversity is lower among the higher income
group due to their lower dependence on the forests (Table 3.10). The estimated odd ratio
of willingness to pay in favour of the income group above 10000 is -7.56 while that of
lower income group (5000 to 10000) is -2.2. Moreover the calculated odd ratio shows an
inverse relationship between income and the probability of willingness to pay for the
conservation of forest and other natural resources. It is identified that almost 89 per cent
of the different groups are willing to pay for the conservation of the Athirappily forest at
varying amount. The survey result highlight that an average recreation value put by a
tourist over the natural resources is Rs 775 (Appendix 3.4). The total recreation value
(TRV) of the Athirappily for the sample of 708 visitors is Rs 548417.
3.3.3. Contingent Activity Method of estimating the RV

Economic valuation of ecotourism final report ______________________________________________________________________________________
_____________________________________________________________________ Kerala Forest Research Institute
58
In the contingent Activity Method we use a hypothetical activity to identify the
recreational surplus derived by a tourist. In this study, we directly ask the respondents
that suppose this site was away, what is the additional distance (in Kms) you are willing
to travel to visit this site? In the sample, 761 visitors are willing to travel additional
distances, while others were either hesitant or indifferent to the question. The aggregate
additional distance willing to travel by the 761 visitors is 7200.58 Km. The average
additional distance willing to travel by tourists is 9.46. The average travel cost of the
sample is Rs. 18 per kilometer. Thus, in rupee terms, the additional amount that the
person willing to sacrifice is Rs. 170 which is considered as the recreational surplus
(Appendix 3.5).
3.3.4. The Recreational Surplus and Total Recreation Value
The estimated recreation surplus per person is equal to Rs 185 as per the travel cost
method (Table 3.11). The total recreation surplus of the sample and the visitor flow in
2003 is equal to Rs 21,72,487 and Rs. 10,64,41,970. As per the Contingent Activity
methodology, estimated consumers surplus per tourists is equal to Rs. 170 while that of
the sample and total visitors in the year 2003 are equal to Rs. 1,29,370 and 9,78,11,540
respectively. Instead of recreation surplus total recreation value is estimated by using the
Contingent Valuation Method (CVM). The estimated total recreation value of per person,
total sample, and that of the total visitors of the 2003 are equal to Rs. 775, 5,48,417 and
44,59,05,550 respectively.
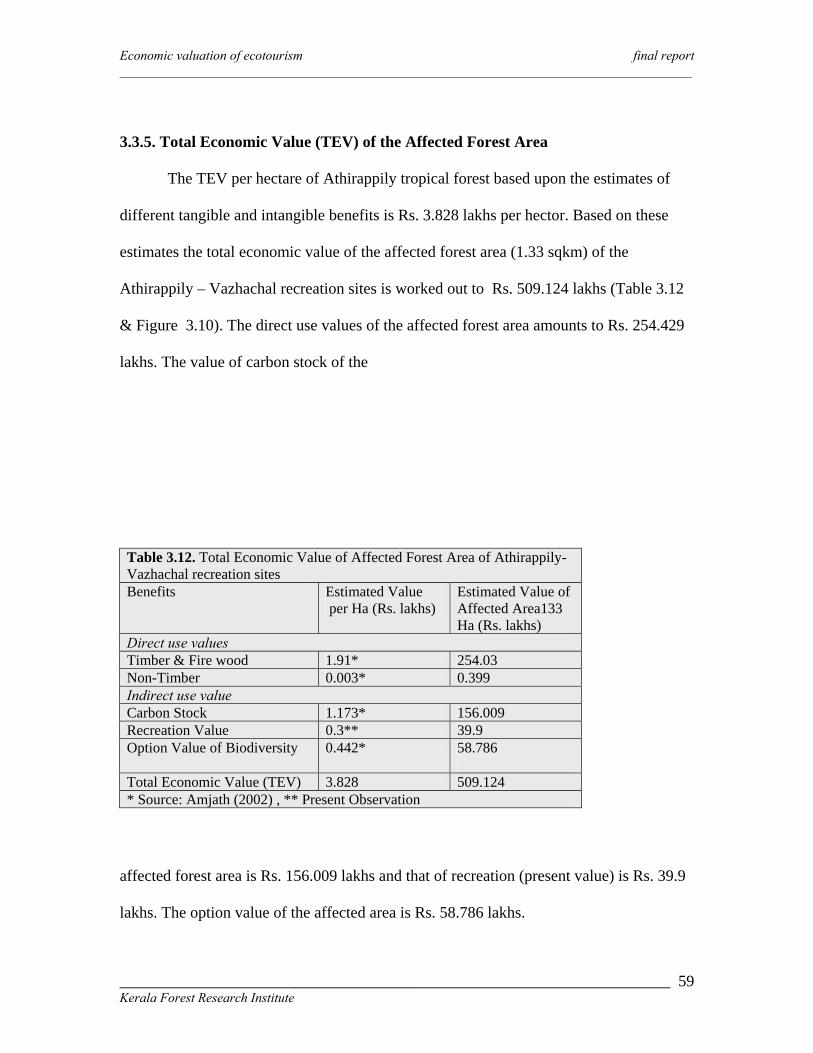
Economic valuation of ecotourism final report ______________________________________________________________________________________
_____________________________________________________________________ Kerala Forest Research Institute
59
3.3.5. Total Economic Value (TEV) of the Affected Forest Area
The TEV per hectare of Athirappily tropical forest based upon the estimates of
different tangible and intangible benefits is Rs. 3.828 lakhs per hector. Based on these
estimates the total economic value of the affected forest area (1.33 sqkm) of the
Athirappily – Vazhachal recreation sites is worked out to Rs. 509.124 lakhs (Table 3.12
& Figure 3.10). The direct use values of the affected forest area amounts to Rs. 254.429
lakhs. The value of carbon stock of the
affected forest area is Rs. 156.009 lakhs and that of recreation (present value) is Rs. 39.9
lakhs. The option value of the affected area is Rs. 58.786 lakhs.
Table 3.12. Total Economic Value of Affected Forest Area of Athirappily-Vazhachal recreation sites Benefits Estimated Value
per Ha (Rs. lakhs) Estimated Value of Affected Area133 Ha (Rs. lakhs)
Direct use values Timber & Fire wood 1.91* 254.03 Non-Timber 0.003* 0.399 Indirect use value Carbon Stock 1.173* 156.009 Recreation Value 0.3** 39.9 Option Value of Biodiversity 0.442* 58.786
Total Economic Value (TEV) 3.828 509.124 * Source: Amjath (2002) , ** Present Observation

Economic valuation of ecotourism final report ______________________________________________________________________________________
_____________________________________________________________________ Kerala Forest Research Institute
60
3.4. Forecasting ecotourism in Vazhachal recreational site
Applying the least-square method for forecasting, this takes the form of,
Yt = a + bt, where, Yt = expected number of visitors in each year
a = intercept term, or it is the expected visitors (trend value) in the base year 1998
b = slope coefficient or marginal decrease of visitors in each year
t = is the variable, it is the difference between year and base year. The estimated trend
line is Vt = 233100-5203 t in which Vt is the estimated visitor flow at time t.
The expected visitor flow becomes Zero when t is equal to 45 (Figure 3.11 & Table
3.13). The visitor flow to the site become zero when the difference between the year and
Fig. 3.11.Actual & Estimated Flow of Visitors (Vazhachal)
0
50000
100000
150000
200000
250000
300000
1 2 3 4 5 6 7 8 9 10 11
Actual Flow Estimated flow RMSE
the base year is equal to 45.We take the year as A, then A- 1998 = 45 and A = 2043.
It is thus be concluded that if the falling trend is continuing persistently the visitor flow
towards the site become around zero or economically negligible around the year 2043.
Economic valuation of ecotourism final report ______________________________________________________________________________________
_____________________________________________________________________ Kerala Forest Research Institute
61
The projected life span of Athirappily-Vazhachal is 38 years from 2005 given the present
scenario with all things remaining constant.
3.5. A Rational Recreation Price
“A rational recreation price would be one which encourage tourism, increase income
and reduce forest dependence of the depending community and also ensure the
conservation and expansion of the forest area.” Recreation is a social necessity of the
wellbeing of a community and ecotourism provides a nature friendly recreation facility.
Fixing a higher or a price which is equal to or higher than the recreation surplus of
tourists is not a wise decision as it has various adverse social implications since the net
satisfaction of the community will become zero or negative. The nature can rejuvenate
the productive and positive aspects of an individual thus the recreation facility should be
offered to all and not only to those who have the high willingness and ability to pay. We
cannot leave our people in despair in the name of the conservation of forest on the one
hand and on the other the forest cannot be opened up for unnecessary degradation for
ecotourism but we must ensure a balanced development. A rational price (Box 3.13)
should be equal to the average cost of value created in the site plus an average cost of
conserving the forest area intact. Estimating Recreation Price by conservation Margin
Pricing method the rational price arrived at is Rs. 12 per tourist.
3.6. Residents’ perception of tourism development
3.6.1. Respondent profile: The descriptive statistics of the residents in Athirappily-
Vazhachal is provided in Appendix 3.6. With an average family size of 4, the sex ratio of

Economic valuation of ecotourism final report ______________________________________________________________________________________
_____________________________________________________________________ Kerala Forest Research Institute
62
the sample is only 937 female population per 1000 male population, with 73.5 per cent of
the respondents married in the age group below 40 years. High level of literacy was noted
with 95.75 per cent of the total sample population has school level education. Primary
sector dominance is observed in the economy with 34 per cent unskilled labourers,
followed by 10.8 per cent agriculturalists, 7.26 per cent business and services together
and a meager 0.88 per cent who have migrated to gulf regions. The government sector
occupies only 2 per cent of the total sample size.
In the sample 28.3 per cent of the residents are indebted, with an average debt
burden of Rs.47,686 per indebted family. Co-operative bank is the major credit provider
(74.4 %) whereas the money lender contributes to only 0.2 per cent. All the respondents
were born and raised here in Athirappily.
With an average land holding size of 1.3 acre, mixed crops dominate the cropping
pattern with 78 per cent of the cultivated area followed by rubber (11 %), coconut (8 %),
plantain (2 %) and pepper (1 %) of the total cultivated area. The mixed crops include
coconut, plantain, pepper, tapioca, jack and vegetables. The per capita land availability of
the agriculture depending population is only 0.95 acre, thus it is very evident that there
exists a high degree of subsistence pressure over the landholding which will have adverse
impact on the natural forest in the surrounding area. Total land area is 192.8 acres out of
this 86.8 acre is wet land which accounts for 45 per cent.

Economic valuation of ecotourism final report ______________________________________________________________________________________
_____________________________________________________________________ Kerala Forest Research Institute
63
Developing livestock in the fringe areas of the forest land without adequate
development of the alternative fodder sources leads to deforestation. Only 22.4 per cent
of the sample possesses livestock and approximately 5.9 per cent of families have
reported the experience of wild life attack on their cattle. The people pointed out that
deforestation and wild fire are the major cause of increased wild life attack in the area.
The major fodder source is the natural forest (50 %) and the remaining breeding livestock
provide for from the homeland and stall feed.
Dependence on the natural resources (Table 3.14) is determined by the socioeconomic
conditions of the residents. The estimated fodder dependence of community over the
forest is equal to 38.24. Fire wood, another major requirement of the local community is
often met from the forest which is an open source for the people living in the fringe areas
but excessive collection of firewood accelerates the process of deforestation. Of the
sample 52.6 per cent depend on forest for firewood at varying degrees of intensity. The
estimated fuel dependence index of the sample households is 50.55. The residents also
collect various raw materials (bamboo, bamboo leaves, poles, among others) from the
forest for construction purposes. Here, it is observed that mainly three parts of the house
can be constructed by using the forest products, which are roof, wall and doors. The
estimated housing dependence index of the sample in the study area is only 1.54. The
Estimated Income Dependency of the sample household is 0.06 which mean that 0.06 per
cent of the aggregate income of the sample household is contributed by the forest. In this
area only the tribes depend on the forest for income. Forests offer various type of
medicine to the residents, due to the development of modern alternative medicinal

Economic valuation of ecotourism final report ______________________________________________________________________________________
_____________________________________________________________________ Kerala Forest Research Institute
64
facilities, the medicinal dependency of the people over the forest is falling. The medicinal
dependency of the residents is 3.51 as they also use allopathic and ayurvedic medicine. It
implies that on an average 3.51 per cent of the total medicinal requirement of the people
is met by the forest.
Forest dependence of the residents in Athirappily-Vazhachal is the sum total of
the income, housing, fuel, fodder, and medicinal dependencies. The over all forest
dependence of the sample is 18.78, which is comparatively low. Here, the major
dependency is by the tribal community. The dependency index for fuel is very high
when compared to other factors. The government priority when assessed indicated first
priority for fuel itself. In other words, it indicates that keeping conservation and
sustainable management in mind alternate solutions must be worked out in order to
reduce the pressure/dependency on forest
3.6.2. Ranking and marking of Social and Environmental Priorities
The respective priorities of the local community has been ascertained subjectively by
ranking and scaling techniques by introducing four alternative scenarios/choices, viz.,
enhancing tourism, hydro-electric project, conserving biodiversity and others against
which the people have stated their respective ranks.
Of the sample (Figure 3.12), 77.5 per cent gave first priority to the projects enhancing

Economic valuation of ecotourism final report ______________________________________________________________________________________
_____________________________________________________________________ Kerala Forest Research Institute
65
Fig.3.12. Social and environmental priorities [%]
0
10
20
30
40
50
60
70
80
90
First Second Third Fourth
Tourism
Hydro-ElectricProject
Bio-Diversity
Others
tourism, 17.6 per cent gave priority to the conservation of biodiversity in the area and 7.7
per cent to the proposed Athirappily hydroelectric project. No priority was accorded to
any other alternative projects in the area. The second priority among different choices is
such that 63.8 per cent of the households support conserving biodiversity and hydro
electric projects (19.7 %) got followed by tourism projects (19.2 %) and other projects
(4.1 %).
In case of the third priorities 53 per cent favored the proposed hydroelectric projects
followed by other projects such as improving agriculture sector, manufacturing sector etc
(29.7 %) and conserving biodiversity (17.5 %) and only a meager 3.3 per cent gave third
priority to the enhancement of tourism in the area.
In case of fourth priorities Other projects occupies the highest percentage support
with 66.2 per cent 19.6 per cent give fourth priorities to the hydro-electric projects and
1.2 per cent to bio-diversity conservation. Nobody consider eco-tourism as their fourth
priorities. In general, the social and environmental priorities of the community are
distributed among different choices in such a way that Tourism and Conservation of
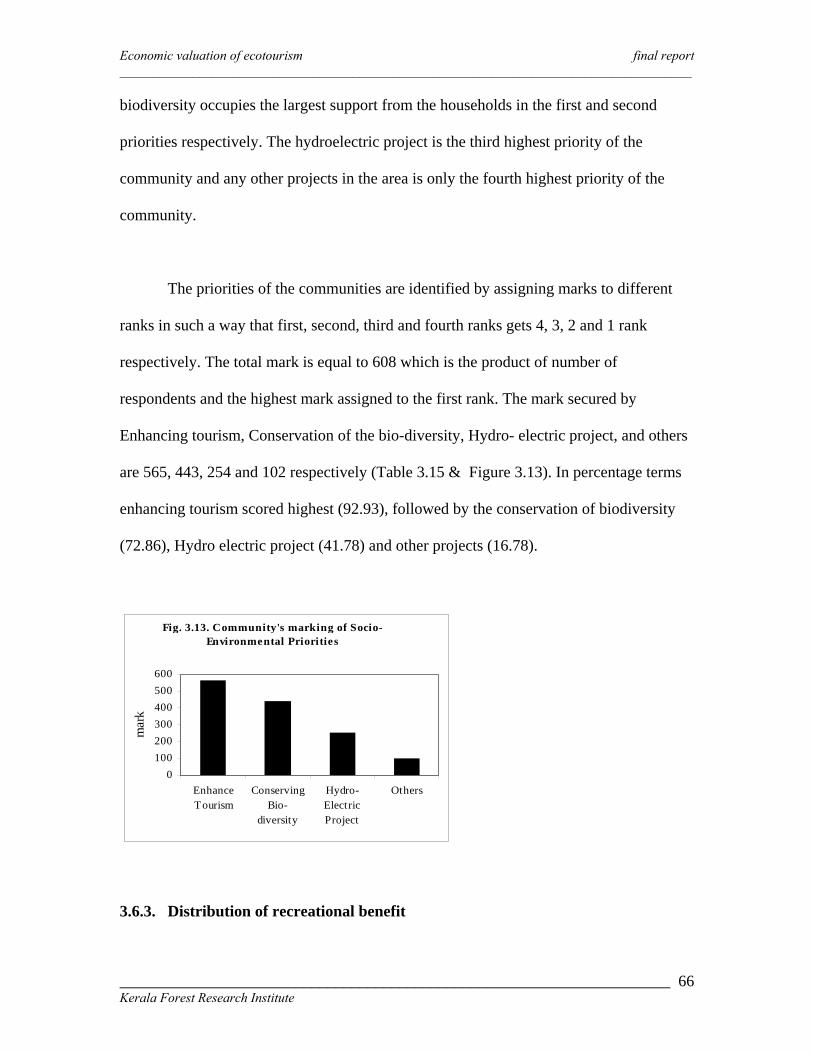
Economic valuation of ecotourism final report ______________________________________________________________________________________
_____________________________________________________________________ Kerala Forest Research Institute
66
biodiversity occupies the largest support from the households in the first and second
priorities respectively. The hydroelectric project is the third highest priority of the
community and any other projects in the area is only the fourth highest priority of the
community.
The priorities of the communities are identified by assigning marks to different
ranks in such a way that first, second, third and fourth ranks gets 4, 3, 2 and 1 rank
respectively. The total mark is equal to 608 which is the product of number of
respondents and the highest mark assigned to the first rank. The mark secured by
Enhancing tourism, Conservation of the bio-diversity, Hydro- electric project, and others
are 565, 443, 254 and 102 respectively (Table 3.15 & Figure 3.13). In percentage terms
enhancing tourism scored highest (92.93), followed by the conservation of biodiversity
(72.86), Hydro electric project (41.78) and other projects (16.78).
Fig. 3.13. Community's marking of Socio- Environmental Priorities
0100200300400500600
EnhanceTourism
ConservingBio-
diversity
Hydro-ElectricProject
Others
mar
k
3.6.3. Distribution of recreational benefit

Economic valuation of ecotourism final report ______________________________________________________________________________________
_____________________________________________________________________ Kerala Forest Research Institute
67
The recreation benefits to the local community are numerous and the most important of
all is the employment it generates. Of the sample only 30.9 per cent agreed that they are
benefited as a result of tourism development in Athirappily –Vazhachal, while 53.3 per
cent of families pointed out that they do not get any direct benefit and 69.1 per cent did
not respond to the question (Figure 3.14). The distribution of the benefit among the
community is highly unequal in nature. Even though the distribution of benefit is unequal
82.9 per cent of the households want to conserve the recreation site while only 0.7 per
cent is against the conservation and promotion of the recreation facility due to the
increasing social and economic adverse implications.
Types of benefit and earning: The local community, especially those residing in the
immediate vicinity of the recreational sites has been earning an income out of the
employment provided by the VSS, self employment, contract labour, unskilled labour
among others. Majority of families failed to reap any benefit due to the lack of
managerial skills, entrepreneurship, initiatives and capital. The immediate visible benefit
to the community is by way of employment (21 %) and local business undertakings (9.2
%) (Figure 3.15). Since the local community is basically poor, they are getting only small
benefits like the daily wage unskilled labour work, but their day to day subsistence is
substantially dependent on it. The average monthly benefit from employment generated is
Rs. 976 and that from business in the area Rs. 8214.
3.6.4. Community perception of opportunities threats and benefit from tourism

Economic valuation of ecotourism final report ______________________________________________________________________________________
_____________________________________________________________________ Kerala Forest Research Institute
68
The major economic benefit from tourism is the emerging employment and business
opportunities in the recreation area (Table 3.16). Of the sample 32 families are benefited
by way of employment and 14 with business opportunities and 3 families pointed out that
developing recreational site leads to the overall development of the economy as it brings
infrastructure and generates demand in the local economy. The expanding recreation
facility increases the land price which is the primary assets of the people in the area.
Developing ecotourism in the region is changing the social and economic attitudes of the
people. The local community is becoming more environmental conscious, their social and
economic status is fast improving. The ecotourism in the area is reducing the subsistence
pressure of the population over land and other natural resources. Increasing avenues of
service sector development is reducing the dependence of the population over the
agriculture sector and helps to reduce the disguised unemployment in the local economy.
Table 3.16. Perceived opportunities, Threats and Benefit from the communities point of view Opportunities Threats Benefit Families Families Families Employment 32 Accidents
increased 1 Economic Development 21
Business and Employment
14 Atmospheric pollution. 2
Business increased. 3
Development of the area
3 Pollution 5
Increasing land price 11
Not Responding
103
Plastic & other waste pollution 4
Changing social & economic attitudes 4
Social tensions 3
Income to the people and Govt 8
Not Responding
137 Not Responding 105
Total 152 Total 152 Total 152 Source. Primary data estimate

Economic valuation of ecotourism final report ______________________________________________________________________________________
_____________________________________________________________________ Kerala Forest Research Institute
69
Despite the socioeconomic benefit of the tourism, it also posses several threats to
the peaceful existence of the community. These threats vary from increased accidents to
increased social tension in the area. Increased alcohol consumption of the tourists creates
various social tensions in the area. Increased pollution due to solid waste, water and
atmosphere pollutants also reduce the quality of life of the community. In other words,
the increasing tourist flow exerts recreation pressure over the forest. In order to tackle
this recreation pressure more workers need to be employed in the recreation sector, i.e.,
the employment opportunity will increase, it will lead to increasing local income and
reducing subsistence pressure. Thus, the economic use of recreation potential will reduce
recreation as well as subsistence pressure on the forest thereby leading to the
development as well as the conservation of the area.
3.7. The economic impact of tourism and societal benefit
Nature tourism has multiple social and economic benefits. The outdoor recreation system
with its economic parallels identifies certain comparisons between the recreation
economy and market economy (Table 3.17).
Economic valuation of ecotourism final report ______________________________________________________________________________________
_____________________________________________________________________ Kerala Forest Research Institute
70
The recreation activities supported by government represent a significant source of
employment and regional economic activity. It brings in expenditures from outside a
region and creates employment opportunities for local residents within their region. A
theoretical comparison of costs in the recreation and market economy is given in the
Table 3.18. To the extent that such areas contribute to a positive quality of life and
provide opportunities for recreation, the availability of quality service system may
influence business relocation and
expansion decisions in communities. Athirappily- Vazhachal is also a basis to the
growing economic sectors such as adventure and eco tourism.
3.7.1. Potential impacts of tourism in communities
As has already been understood working with communities is fundamental to achieving
conservation goals and strategies including tourism (Table 3.19). Without community
participation there will be resource degradation, increasing economic inequity,

Economic valuation of ecotourism final report ______________________________________________________________________________________
_____________________________________________________________________ Kerala Forest Research Institute
71
incompatible economic development, increased commercial threats, and alienation from
traditional sustainable use. With the Forest Department opening up trek paths for
the nature admirers it is all the more necessary to involve the local people who know the
forest well and thereby opportunities are made available to them to earn income and share
knowledge which could be a two way process.
3.7.2. Income – Product Flow in Athirappily and Vazhachal Recreation Economy.
Economic linkages have been identified amongst three operational sectors in Athirappily-
Vazhachal economy, viz., the agriculture and households, business and VSS and the
Table 3.19. Potential impacts of tourism in communities in Athirappily-Vazhachal Positive
(with community participation) For communities For the recreation sites
(Athirappily-Vazhachal) 1. Sustainable income Potential opportunities 2. Improved socioeconomic conditions People’s participation in the conservation
activities 3. Social and economic security Increasing market price of recreation site 4. Improved services Developing all sectors of the economy related
to tourism 5. Cultural empowerment Demand driven growth of the sites 6. Increase in demand for the products Reduced commercial threats 7 Increased business and employment
opportunities. Compatible economic development
8 Environmental awareness Maintaining the recreation site clean and tidy, 9 Developing basic infrastructures Reducing accident rate due to the community
participation in tourism 10 Reducing subsistence dependence
on forest Controlling high recreation pressure and ensuring efficient use of productive resources

Economic valuation of ecotourism final report ______________________________________________________________________________________
_____________________________________________________________________ Kerala Forest Research Institute
72
recreation sectors (Figure 3.16). As the households buy products from the business
sector for which they pay their income as price, it establishes a flow between the two
sectors. The flow is such that income flows from agriculture & household sector to
business sector on the other hand products flow the business sector to agriculture sector.
The household rendering their services as employment to business sector earns a wage.
The recreation sector injects income into the local economy by paying entrance fee and
price of the product and services offered by business sector. Government imposes tax,
which is an outflow of income from the economy and the government investment is an
inflow into the economy. The forest conservation and development of the local
community depends upon the outflow of income from the economy and inflow of income
into the economy. There must be a balance between the inflow and outflow whereby both
subsistence and recreation pressure can be reduced simultaneously.
In Athirappily-Vazhachal recreation economy income flows from the recreation sector to
other sectors such as agriculture and business sector. Here, the industry sector is not well
developed. The recreation sector is not producing anything but generating large demand
for the goods and services produced by other sectors in the economy. The income
generated by the sector is flowing among the different sectors i.e., agriculture, household,
business and recreation sectors. In this analysis income generated by the recreation sector
is considered as its output.
Agriculture sector: Various agriculture products produced by the sector include rubber,
coconut, pineapple, tapioca, pepper, cashew nut, areca nut, among others (Table 3.20).

Economic valuation of ecotourism final report ______________________________________________________________________________________
_____________________________________________________________________ Kerala Forest Research Institute
73
Production here is basically for self consumption with very less commercialization.
Hence, the linkages between agriculture and the recreation sector is very poor resulting in
low income flow (injection) from recreation sector to the agriculture sector. Here, in
Athirappily-Vazhachal the farmers are not producing for the recreation sector and so the
income flow from recreation sector to the agriculture sector is low. Instead of selling their
products directly to the visitors, they depend on the business people and middlemen. A
moderate amount of income flows from the agriculture sector to the business sector.
Table 3.20. Agriculture Products flow to Business Sector. Agriculture Products
Price (local market)
Quantity/ Number
Monetary Value
Rubber 35.25** 24225.277 853941 Coconut 4.50 * 138010.67*** 621048 Plantain 3.8** 40858.421 155262 Pepper 76.85** 5050.8003 388154 Pineapple 8.50** 9133.0588 77631 Tapioca 2.90** 160615.86 465786 Cashew nut 28.65** 4064.4677 116447 Areca nut 0.35* 221802.86*** 77631 Total 2755900 * Price per number, ** Price per Kg,*** In number, Others in Kg Source : Primary data
Business sector: The business communities are directly benefited from the increasing
visitor flow. There are various types of business in this area which includes hotels,
amusement parks, and street vendors among others (Table 3.21). They sell various
products and render different services to the visitors. By providing employment to the
local people in their firms, the income flows from the recreation sector to the business
sector and from the business sector to the household sector. The business community
Table 3.21. The Recreation Sector in Athirappily-Vazhachal Type of Business Sales Items Number
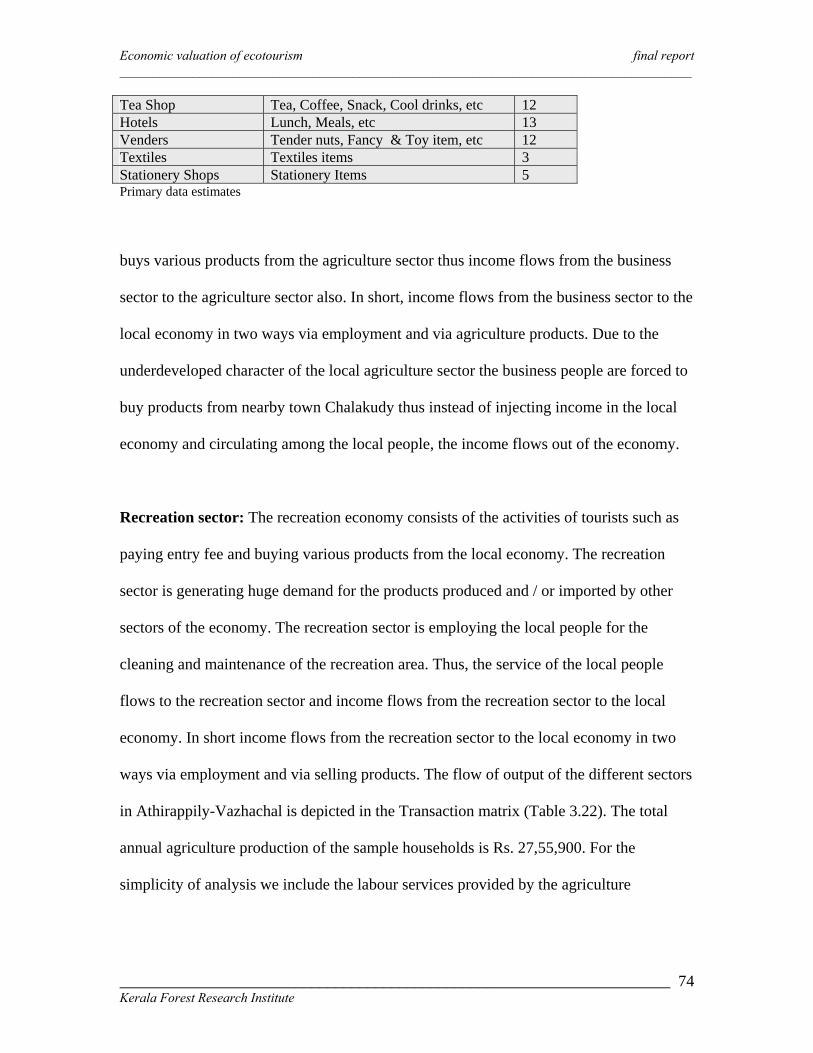
Economic valuation of ecotourism final report ______________________________________________________________________________________
_____________________________________________________________________ Kerala Forest Research Institute
74
Tea Shop Tea, Coffee, Snack, Cool drinks, etc 12 Hotels Lunch, Meals, etc 13 Venders Tender nuts, Fancy & Toy item, etc 12 Textiles Textiles items 3 Stationery Shops Stationery Items 5 Primary data estimates
buys various products from the agriculture sector thus income flows from the business
sector to the agriculture sector also. In short, income flows from the business sector to the
local economy in two ways via employment and via agriculture products. Due to the
underdeveloped character of the local agriculture sector the business people are forced to
buy products from nearby town Chalakudy thus instead of injecting income in the local
economy and circulating among the local people, the income flows out of the economy.
Recreation sector: The recreation economy consists of the activities of tourists such as
paying entry fee and buying various products from the local economy. The recreation
sector is generating huge demand for the products produced and / or imported by other
sectors of the economy. The recreation sector is employing the local people for the
cleaning and maintenance of the recreation area. Thus, the service of the local people
flows to the recreation sector and income flows from the recreation sector to the local
economy. In short income flows from the recreation sector to the local economy in two
ways via employment and via selling products. The flow of output of the different sectors
in Athirappily-Vazhachal is depicted in the Transaction matrix (Table 3.22). The total
annual agriculture production of the sample households is Rs. 27,55,900. For the
simplicity of analysis we include the labour services provided by the agriculture

Economic valuation of ecotourism final report ______________________________________________________________________________________
_____________________________________________________________________ Kerala Forest Research Institute
75
households into the agriculture production thus, Rs 27,55,900 is the sum total of the value
of agriculture output produced and the value of labour services supplied by the household
sector. The input output matrix (horizontally) highlights that out of the total production of
the household sector, 50 per cent (13,78,250), 46 per cent (12,69,070), and 4 per cent
(1,08,580), are used by the household, business and recreation sectors respectively. The
total output of the business class is Rs. 1,37,34,400, Out of this total output, 3 per cent
(4,42,000), 39 per cent (53,03,400), 58 per cent (79,89,000) are used by the household,
business, and recreation sectors respectively. In addition, to the demand created for the
agriculture and the business sectors in the economy the recreation sector paid fee
equivalent to Rs. 24,11,116 (Table 3.23) which is considered as its output.
The input requirement of different sectors is depicted vertically in the transaction matrix.
The agriculture and business sector use Rs. 18,20,250 and Rs. 65,72,470 as inputs
respectively. While, recreation sector generates an income equivalent to Rs. 1,05,08,696.
Out of the total income generated by the recreation sector 1 per cent Rs.1,08,580, and 76
per cent Rs.79,89,000 flow to agriculture and business sectors respectively. The
recreation sector paid a fee equivalent to Rs. 24,11,116 (23 %) a part of this go to the
local economy as wages and the other half as welfare spending by the VSS and
government investments in the area.
The Structural coefficient matrix (Table 3.24) projects the relative values of various
inputs and outputs. From this the relative values of output distributed in different sectors

Economic valuation of ecotourism final report ______________________________________________________________________________________
_____________________________________________________________________ Kerala Forest Research Institute
76
can be determined. These relative values of outputs are also called structural coefficients,
which is determined using the following formula a1n = X1n / Xn ,
Where a1n = structural coefficient of sector with respect to product n
X1n is the output of sector X1 used in the production of Xn
Xn is the total output of the sector n. The structural coefficient matrix (Table 3.24) shows
the higher linkages between business and recreation sector and lower linkages between
agriculture and recreation sector in the area in the area. Even though the linkages between
agriculture and business are high, the reverse linkage is poor in the recreation economy.
Because of the poor linkages between agriculture and recreation sector in the area, it
necessitates high rate of import of agriculture products from nearby town such as
Chalakudy, Palakkad, and Coimbatore, which leads to an outflow of income from the
local economy.
The strategies (Table 3.25) for better linkages in the economy will , (i) ensure more
benefit to the agriculture sector from tourism, with enhanced linkages between
agriculture sector and recreation sector, (ii) reduce the outflow of income from the local
Economic valuation of ecotourism final report ______________________________________________________________________________________
_____________________________________________________________________ Kerala Forest Research Institute
77
economy by increasing the linkages between business sector and the local economy, (iii)
generate more income into the local economy, by providing more spending avenues to
the tourists at Athirappily- Vazhachal.
3.7.3. Tourism employment and income multipliers
The positive impacts of tourism in an area can also be measured through employment and
income multipliers. Tourism employment multipliers summarize either the direct, indirect
and induced employment generated by an additional sum of tourism expenditure in the
economy. One of the most tangible links between the recreation sector and the local
communities is through the employment opportunities generated in the recreation
economy. Local people in Athirappily-Vazhachal have received income and employment
benefits from tourism development in the area. The employment elasticity helps us to
identify the responsiveness of the labour sector to the tourist flow. It helps to identify the
labour intensive character of the recreation sector. In other words, it shows the
responsiveness or the ability of the labour class to acquire benefit out of the tourism
sector. The arc employment elasticity of visitor flow during the period 2002-03 is
equivalent to 4.7 (Figure 3.17 & Table 3.26 ). The arc employment elasticity reveals the
responsiveness of employment opportunities to the changes in the visitor flow during
2002 to 2003. The estimate of the employment elasticity highlight that 1 per cent change

Economic valuation of ecotourism final report ______________________________________________________________________________________
_____________________________________________________________________ Kerala Forest Research Institute
78
in the visitor flow leads to 4.7 per cent change in the level of employment, during the
period 2002-2003.
Fig.3.17.Labour share & Fee Collected 2002-03
020000400006000080000
100000120000140000
1 3 5 7 9 11 13 15 17 19 21 23 25 27 29 31
Months
Labour share Total Fee collected
The Vazhachal VSS is a tribal VSS, thus the employment is given to only tribal people
that is the calculated employment elasticity shows the employment elasticity of the tribal
people. Thus, labour intensive investment in tourism will ensure employment security.
The recreation sector in an economy creates huge amount of demand and income in the
economy. This added income is multiplied in the economy based on the income
multiplier. The Keynesian multiplier adopted for identifying the income multiplier effects
in the economy is equal to 1/1-mpc, where ‘mpc’ is the marginal propensity to consume.
Consumption Function and income multiplier of people : Consumption is a function
of income. Symbolically C = f (Y) where, C is the consumption, Y is the income and f is

Economic valuation of ecotourism final report ______________________________________________________________________________________
_____________________________________________________________________ Kerala Forest Research Institute
79
the functional relationship. As per the Keynesian theory as income increase consumption
also increases but not as much as the increase in income. Thus, it is assumed that there is
a linear relationship between consumption and income. The estimated consumption
function (Box 3.14) is equal to C = 1253.86 + 0.56 Y with 0.78 as an adjusted R2 value.
The marginal propensity to consume is equal to change in consumption due to a small
change in income. The estimated marginal propensity to consume is equal to 0.56. The
estimated income multiplier is equal to 2.27. The income multiplier reveals that one unit
increase in income by the recreation sector will result 2.27 unit increase in the aggregate
income of the economy in the area. The income multiplier point out that the net effect of
one unit spending either by the tourists or by the government will result in 2.27 unit
increase in the net income of the local economy.
3.8. Tourism sustainability assessment: a conceptual approach
The recreation system in Athirappily –Vazhachal economy has two dimensions, i.e., the
human and eco-dimension. Sustainable economic development based on ecotourism is
possible only if there is sustainable addition to the ecology and economy and the
sustainable use of the productive resources of the systems. The two dimensions have
different indicators (Table 3.15).
3.8.1. Scale of sustainability: Scaling of sustainability is based on the ordinal
perception statement of the primary stakeholders in the study area. In order to make a
scale of sustainability cardinal values are allotted to different statements of the people.

Economic valuation of ecotourism final report ______________________________________________________________________________________
_____________________________________________________________________ Kerala Forest Research Institute
80
The scale of sustainability consists of four categories. Here, the four point scale has been
adopted of 25 points each totaling 100 (Table 3.16).
The scale of sustainability is developed based on the ordinal perceptions of the people
about various parameters of different indicators. Different ordinal perceptions about
various indicators are assigned cardinal marks (Table 3.17). There are two types of
parameters pertaining to sustainability, positive and negative parameters. In case of the
positive parameters, higher the level of parameter, higher will be the sustainability of the
development of recreation economy and vice versa. In case of negative parameters,
higher the level of parameter, lower will be the sustainability of the development of
recreation economy and vice versa.
3.8.2. Human Dimension: Human dimension consists of the local people, business
people, government and tourists to the area. The human dimension has three indicators,
political, socio-cultural and economic indicators. An indicator has various sites specific
parameters pertaining to the sustainable development of recreation economy in the area.
3.8.2.1. Political parameters of sustainability: Political indicators of human dimension
are one of the sustainability determining factors. The site-specific different parameters of
the political indicators include:
1. Tourism promoting political activities (+)
2. Cooperation of different departments in tourism promotion activities (+)
3. Participation of the people in the tourism promotion activities (+)

Economic valuation of ecotourism final report ______________________________________________________________________________________
_____________________________________________________________________ Kerala Forest Research Institute
81
4. Participation of Non Governmental Organizations in the tourism promotion
activities (+)
The political indictor of the human dimensions consists of positive related to sustainable
development of recreation economy in the area. Various political parameters related to
sustainable
development of
recreation
economy is
estimated using
the questionnaire
method. The
average mark obtained by different parameters of political indicator is equal to 64.18.
This indicates that the political indicator of human dimension ensures potentially
sustainable level of ecotourism development in the Athirappily-Vazhachal. (Table 3.18).
3.8.2.2. Socio-cultural parameter of sustainability: The sustainable development of
the recreation economy is also dependent on the socio-cultural factors of the local
community. The socio-cultural parameters determining the sustainability includes -
1. Social tensions with the tourists (-)
2. Cultural impacts (-)
3. Increase in education status (+)
4. Caste wise discrimination in the tourists area (-)
5. Willingness of the people to participate in the tourism promotion activities (+)
Table 3.18. Number of households and ordinal perceptions about political parameters [mark ] Parameters Excellent/
Very low [100]
Good / Low [75]
Medium/ Average [50]
Bad / High [25]
1 41 [4100] 42 [3150] 17 [850] 52 [1300] 2 0 [0] 32 [2400] 37 [1850] 83 [2075] 3 67 [6700] 49 [3675] 19 [950] 17 [425] 4 64 [6400] 53 [3975] 12 [600] 23 [572] Average mark obtained = 64.18 n=152 Figures in parenthesis is equal to Number of respondent × Mark assigned

Economic valuation of ecotourism final report ______________________________________________________________________________________
_____________________________________________________________________ Kerala Forest Research Institute
82
The socio-cultural indicators of human dimension consist of two positive and three
negative parameters related to sustainable development of recreation economy in the
area. The social tension, cultural impact and caste wise discrimination in the tourist area
are considered as negative parameters of sustainability as the sustainable development of
recreation economy is inversely related to the level of these parameters. The willingness
of the people to participate in tourism promotion activities and the increase in education
status are positive parameters. The average mark obtained by the socio-cultural
parameters of sustainability is equal to 74.17 (Table 3.19). This reflects that the socio-
cultural parameters ensure potentially sustainable development of recreation economy in
the area.
3.8.2.3. Economic parameters of sustainability: The production structure of a
recreation economy is satisfying the wants of both tourists and the tourism depending
local communities. The primary wants of the tourists is a congenial atmosphere of
recreation while the local communities want income and the sustainable existence of the
natural resources. Thus, Sustainable Tourism Development depends on the expanding
recreation facilities, well developed service sector, high quality food, and accommodation
and transportation facilities. The people in the area can afford tourism only if increased
Table 3.19. Number of households and ordinal perceptions about socio-cultural parameters [mark ] Parameters
Excellent/ Very low [100]
Good / Low [75]
Medium/ Average [50]
Bad / High [25]
1 97 [9700] 43 [3225] 9 [ 450] 3 [ 75] 2 7 [ 700] 34 [2550] 56 [2800] 55 [1375] 3 83 [8300] 48 [3600] 17 [ 850] 4 [ 100] 4 69 [6900] 57 [4275] 19 [ 950] 7 [ 175] 5 47 [4700] 39 [2925] 43 [2150] 23 [ 575] Average mark obtained = 74.17 n = 152 Figures in parenthesis is equal to Number of respondent × Mark assigned
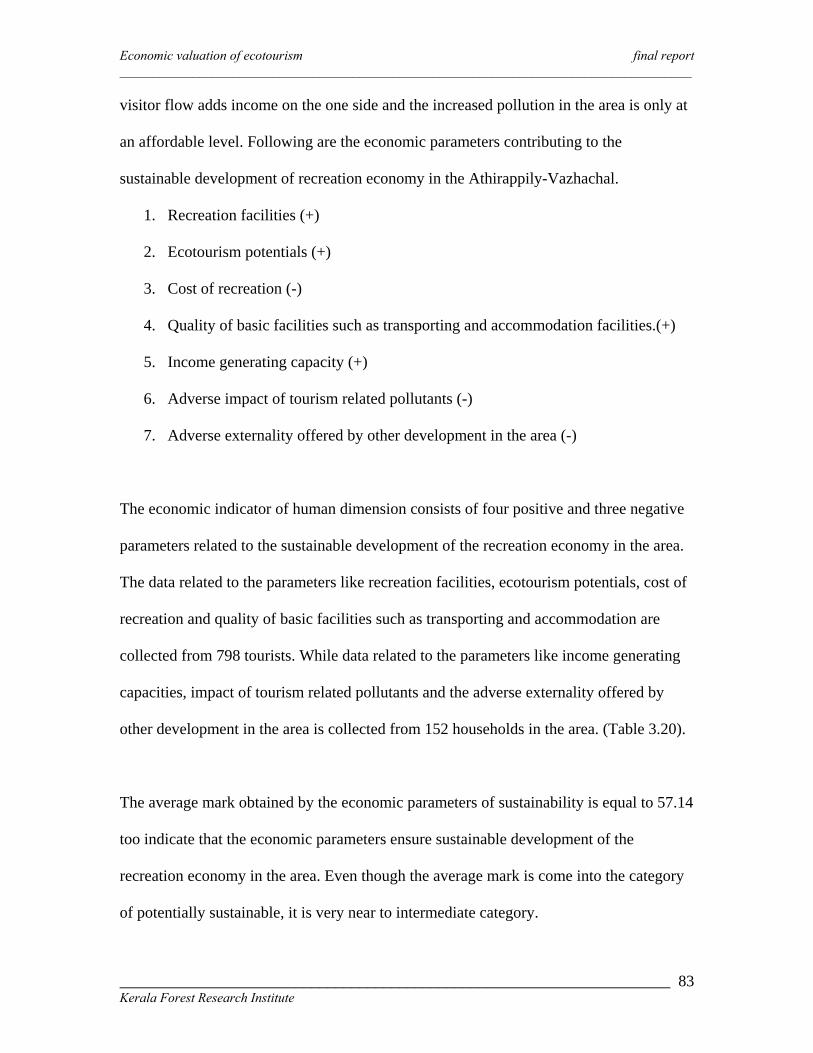
Economic valuation of ecotourism final report ______________________________________________________________________________________
_____________________________________________________________________ Kerala Forest Research Institute
83
visitor flow adds income on the one side and the increased pollution in the area is only at
an affordable level. Following are the economic parameters contributing to the
sustainable development of recreation economy in the Athirappily-Vazhachal.
1. Recreation facilities (+)
2. Ecotourism potentials (+)
3. Cost of recreation (-)
4. Quality of basic facilities such as transporting and accommodation facilities.(+)
5. Income generating capacity (+)
6. Adverse impact of tourism related pollutants (-)
7. Adverse externality offered by other development in the area (-)
The economic indicator of human dimension consists of four positive and three negative
parameters related to the sustainable development of the recreation economy in the area.
The data related to the parameters like recreation facilities, ecotourism potentials, cost of
recreation and quality of basic facilities such as transporting and accommodation are
collected from 798 tourists. While data related to the parameters like income generating
capacities, impact of tourism related pollutants and the adverse externality offered by
other development in the area is collected from 152 households in the area. (Table 3.20).
The average mark obtained by the economic parameters of sustainability is equal to 57.14
too indicate that the economic parameters ensure sustainable development of the
recreation economy in the area. Even though the average mark is come into the category
of potentially sustainable, it is very near to intermediate category.

Economic valuation of ecotourism final report ______________________________________________________________________________________
_____________________________________________________________________ Kerala Forest Research Institute
84
3.8.3. The Eco-dimension: Another important dimension of the recreation system is
ecological dimension. Athirappily-Vazhachal attracts thousands of tourists per year with
its natural forests, beautiful river, wildlife and the waterfalls. The indicators of eco-
dimension on which the sustainable development of the recreation economy depend are
1. general environmental impacts (-)
2. environmental policy and management (+)
Delphi method is adopted to identify and scale various indicators of the eco-dimension.
(Tables 3.21 & 3.22 ). Data has been collected from three groups of people working in
the area such as 1) Environmentalists, 2) Officials and academician 3) People
representatives.
3.8.3.1. Environmental impact of sustainability: Increased tourist flow adversely
affects the natural resources in the area. The natural forest is becoming more and more
degradable due to the continuous presence of tourists in the forest and developing more

Economic valuation of ecotourism final report ______________________________________________________________________________________
_____________________________________________________________________ Kerala Forest Research Institute
85
recreational facilities in the forest areas. The adverse environmental impacts adversely
affect the sustainable development of recreation economy.
Table 3.21. Ordinal perceptions of different groups pertaining to the general environmental impacts [ mark] Groups Very low Low Average High Environmentalists 3 [300] 10 [750] 7 [350] 10 [250] Officials and Academicians 5 [500] 7 [525] 12 [600] 6 [150] Peoples Representatives 12 [1200] 9 [675] 6 [300] 3 [75] Average mark obtained = 63, n=30 Figures in parenthesis is equal to Number of respondent × Mark assigned
The average mark assigned by different groups to environmental impact indicator of
sustainability is equal to 63. This indicates, that the environmental impact is not too high
to adversely affects the sustainable development of recreation economy in the area.
3.8.3.2. Environmental policy and Management. There are various site specific
environmental policy and management practices for the conservation of forest and the
sustainable development of recreation economy in the area. For instance, there is the
Vana Samrakshana Samithies formulated under the Participatory Forest Management
programme for the conservation f the forests. Delphi method is used judge, how far these
policies and management practices ensure the sustainable development of eco-tourism in
the area.
Table 3.22. Ordinal perceptions of different groups pertaining to the environmental policy and management [ mark] Groups Excellent Good Medium Bad Environmentalists 0 8 [600] 12 [600] 10
[250] Officials and Academicians 0 9 [675] 15 [750] 6 [150]

Economic valuation of ecotourism final report ______________________________________________________________________________________
_____________________________________________________________________ Kerala Forest Research Institute
86
Peoples Representatives 0 11 [825] 10 [500] 9 [225] Average mark obtained = 50.8, n=30 Figures in parenthesis is equal to Number of respondent × Mark assigned
The average mark given by different groups to environmental policy and management
practices with respect to the sustainable development of recreation economy in the area is
50.8. It is understood that the environmental policy and management practices ensure
only an intermediate level of sustainable development of the recreation economy in the
area.
3.8.4. Sustainability of the recreation system in Athirappily – Vazhachal
The ordinal perceptions can be plotted either on a graph or chart to arrive at a
sustainability level. The sustainability chart (Figure 3.17) is divided into two [1800 each]
representing human dimension and ecological dimension. The scale of the chart ranges
between 0 and 100 representing different categories of sustainability. The area between 0
to 25 represents the unsustainable region, 26 to 50 intermediate, 51 to 75 potentially
sustainable and 76 to 100 sustainable. The human dimension part is divided into three,
political, socio- cultural and economical similarly the ecological dimension is divided
into two, general environmental impact and Environmental policy and management.
The estimates of sustainability (Table 3.23) as per the valuation of the people in the area
and tourists coming to the site highlights that the different indicators of dimensions
comes in the categories of potentially sustainable regions except those of the ecological
dimension. This indicates that extreme caution is to be borne in the mind while framing

Economic valuation of ecotourism final report ______________________________________________________________________________________
_____________________________________________________________________ Kerala Forest Research Institute
87
recreation development schemes and programmes in Athirappily-Vazhachal a natural
recreation site, such that the ecosystem is not adversely affected. On the other hand, it
must also mitigate the environmental impact of tourism on the poor.
Economic valuation of ecotourism Final report __________________________________________________________________________________________
Kerala Forest Research Institute
95
4. STRATEGIES AND ACTION PLAN FOR SUSTAINABLE TOURISM IN
ATHIRAPPILY-VAZHACHAL
Tourism is a steadily growing sector in Athirappily-Vazhchal, moreover these sites are
endowed with greater potential for tourism especially nature tourism. At present the
government and the development agencies are focusing mainly in the alleviation of
poverty, ensuring good standard of living to the people and the environmental stability.
Lack of adequate technologies, unscientific method of agriculture farming, illiteracy and
increasing population is culminating into the increasing subsistence pressure over the
existing natural resources. Thus, it is necessary to make the conservation activities
economically sustainable. Raising the funds from the efficient use of direct non-
consumptive use values of forest is a rational way to make the conservation activities
economically sustainable. Forest and related natural resources in Athirappily and
Vazhachal have great potential to generate income and also alleviate poverty through the
expansion of ecotourism. For ensuring environmental stability, ecotourism ventures must
be followed by the adequate forest expansion activities, if it is not the case, the
degradation of the forest and the economy will be the net result in the long run.
The recreation sector in Athirappily-Vazhachal provides immense scope for
development in a rural area in the larger perspective as well as provides for societal
welfare. The strategies must be focused on immediate economic benefits, whereby the
income earning capacity of the people is enhanced as well as their standards of living;
non-economic benefits, whereby capacity building and empowerment takes place and
finally on a more supportive policy, as the recreation activities supported by government
represent a significant source of employment and regional economic activity (Table 4.1).

Economic valuation of ecotourism Final report __________________________________________________________________________________________
Kerala Forest Research Institute
96
Table 4.1. Strategies for sustainable tourism in Athirappily-Vazhachal Recreation sites
Economic benefits Non-economic benefits Policy reform/ research
Increasing business
opportunities for the poor
Human Resource development
improve community infrastructure
(eg. roads, markets, etc.) and human
development Index (eg. literacy,
health
and nutrition, housing potable water,
women empowerment, etc.)
Building a more supportive policy -
The recreation activities supported by government represent a
significant source of economic security and regional economic
activity. Special emphasis must be placed both on methods of
economic analysis and on practical policy instruments that will
simultaneously protect natural habitats and alleviate poverty.
Providing employment
opportunities for the poor
Capacity building, Training and
empowerment
– Creating necessary human
resources
– of the resident population through
– training (in confidence building,
– leadership, managerial skills,
– accounting, costing, etc.)
An integrated planning framework which encourages
ecotourism partnerships where the Forest Department plays the
role of a facilitator. Successful ecotourism is with building
strong partnerships such that multiple goals of conservation and
equitable development can be met. The key participants must
include the managing authority, the government agencies, the
local community, the NGOs, private sector, community
organizations and individuals, among others.
Enhancing collective
benefits
Mitigating the environmental impact
of tourism on the poor
Promoting participation of the primary stakeholders ,
especially the already functional VSS -
devolve control to the local communities, as is being
Economic benefits Non-economic benefits Policy reform/ research
Economic valuation of ecotourism Final report __________________________________________________________________________________________
Kerala Forest Research Institute
97
done under the participatory management approach through the
Vana Samrakshana Samithies backed by a legal and policy
framework empowering local communities to assume
responsibility and authority for natural resource management
and land management contracts with representatives of the
government.
Revenue generation –
tourism offers opportunities
to generate revenue in
diverse ways, such a s
entrance fees, user fees,
concessions
Addressing social impacts of tourism Promote private sector to provide services that benefits the
tourists and local community as well.
Increasing avenues of service sector development is reducing
the dependence of the population over the agriculture sector and
helps to reduce the disguised unemployment in the local
economy.
Private sector concessions include snack shops,
restaurants, lodges, gifts shops, tour guides, all these can be
privately owned or managed with a portion of the profits
returned to the sites.
Addressing cultural impacts of tourism Putting in place an institutional arrangement which supports
sustainable development and management which supports
sustainable development of tourism in Athirappily-Vazhachal.
Economic valuation of ecotourism Final report __________________________________________________________________________________________
Kerala Forest Research Institute
98
4.1. Short term Strategies for tourism development in Athirappily-Vazhachal
1. Compulsorily construct a barricade in the dangerous areas (edges) of the waterfall
where the tourists tend to venture.
2. Visitor / tourist zones need to be earmarked and dangerous / restricted areas set
out of bounds.
3. Provide clean toilets, bathing facilities for tourists, and mark out a bathing zone to
avert any kind of danger.
4. Provide clean drinking water.
5. Construct small eco friendly rest houses for tourists in the recreation site in
Athirappily.
6. Abolish plastic and alcohol / aerated drinks in the tourist spot and promote local
products such as tender coconut etc.
7. Sufficient attractive sign boards by the authorities may be put up stating the `do’s
and don’ts’ of a natural recreation site, a layout of the recreation spots to visit
with pictures (the trek paths, among others), and how they may benefit by visiting
these places may be placed at the entry point i.e., the check post at Athirappily
and Vazhachal for tourist information as well as in areas which catch tourists
attraction.
8. Address the various actual commercial threats the sites face (large number of
entry paths, unauthorised collection, unauthorised fishing among others).
9. The upland or upstream of Charpa falls need be afforested in order to maintain the
perennial flow, which dries up in the summer months and is currently a tourist
attraction being enroute from Athirappily to Vazhachal,.
Economic valuation of ecotourism Final report __________________________________________________________________________________________
Kerala Forest Research Institute
99
10. Open up the interpretation center for the common public and have documentary
projections too on a payment basis, which will enable tourists to get a glimpse of
the Athirappily-Vazhachal forests at close quarters
11. Encourage the private sector to provide necessary services to the tourists
4.2. Long term Strategies for tourism development in Athirappily-Vazhachal
1. The strategies for sustainable tourism in Athirappily-Vazhachal recreation sites
ought to focus on the Pro-Poor Tourism giving weightage to economic benefits,
non-economic benefits, and policy reform in the area.
2. Research and guidelines on mechanisms to minimize the potential problems of
economic leakage, on negative environment and social impacts, inter-generational
effects and inadequate income distribution.
3. The carrying capacity of the recreation sites need to be worked out. Carrying
capacity information is extremely useful in zoning tourism areas and in setting
visitation limits by the authorities.
4. Access to tourism opportunities should be widely available, including access for
local people and for the handicapped.
5. Enhance the linkages between recreation and other sectors of the economy.
6. Implementation of the site-specific “One Tourist, One Rupee, Ten trees
programme” to ensure environmental and economic security in the ecotourism
based economy with peoples participation.

Economic valuation of ecotourism Final report __________________________________________________________________________________________
Kerala Forest Research Institute
100
7. Improve mutual understanding among different government department working
in the area. In other words, bring about integrated approach to the management of
tourism in these sites.
4.3. Towards Action Plan
In order to ensure the conservation of the forest area in and around Athirappily-
Vazhachal recreational site as well as the benefit to the economy at large, here, a site-
specific program called “One Tourist One Rupee Ten trees Program” (Figure 5.1) is
proposed towards action plan. This program aims at the conservation and expansion of
the forest area in Athirappily-Vazhachal recreation area with peoples’ participation. In
this program one rupee from each tourist (be included in the entrance fee) is collected and
set up a common fund called Conservation fund. When the fund increases to Rs.500 one
person is employed for planting ten trees in the recreation area, to start with the visitor
activity zone or the affected forest area. In the program preference should be given to
women in the local area who are engaged in labour work. The employed person is
directed to plant a tree which is given by the authority and conserve it for a period of six
months. This six month period is called conservation period and during the period the
person employed is directed to irrigate the plant at least twice in a week and provide all
required protection.
After the conservation period of six month if the tree is sustaining and healthy, the
employed person must be paid Rs 500 from the conservation fund as an incentive. This
program also envisages to give the ownership of the tree to the person who planted it.

Economic valuation of ecotourism Final report __________________________________________________________________________________________
Kerala Forest Research Institute
101
The ownership should be conditional in nature such that the person is the primary owner
of the tree and his right is restricted to the conservation only. The main features of the
program (Box 4.1) should be such that people are environmentally conscious and feel
responsible for conservation.
How to implement
• The VSS secretary (a Forest Department official) should supervise the program
• VSS secretary should provide a plant and direct the employed person to plant the
tree in a particular place. The species to be planted may also be identified and
listed by the community.
• The site for planting should be initially concentrated on the Affected Forest Area
and then move on to degraded forest areas, roadside, school compound or any
other public place as identified by the community as a whole.
• There should be a memorandum of understanding between the VSS secretary, the
person employed and some (at least two) VSS members as witnesses.
• All the VSS member should be give a chance to plant tree and also act as
witnesses in this program.
• A person from outside the VSS can also participate in the program and VSS
member should be the witnesses
• VSS secretary should document, explain and report the progress of the program
to the VSS members.
• All the VSS members are responsible to monitor and independently evaluate the
program.
Economic valuation of ecotourism Final report __________________________________________________________________________________________
Kerala Forest Research Institute
102
This program once implemented will ensure economic as well as environmental security
in Athirappily-Vazhachal recreation area. This maybe started as a site-specific program
and subsequently be extended to the district/State level (rural as well as urban areas)
including road sides.

Economic valuation of ecotourism Final report __________________________________________________________________________________________
Kerala Forest Research Institute
103
5. CONCLUSIONS
Tourism as a sector in Athirappily-Vazhachal can be linked to economic development by
identifying and assessing its advantages in the development of local economies. It is an
important opportunity to diversify the local economies. Tourism here offers labour
intensive and small scale opportunities compared to other non-agricultural activities, it
employs a high proportion of women and values natural resources and culture. The
present study attempted to estimate the economic potential of ecotourism in Athirappily-
Vazhachal, the resident perception on tourism development in the area and suggests
suitable strategies and a site-specific programme for sustainable tourism that promotes
conservation of the natural resources as well as benefits the society at large. The main
findings of the study are enumerated here.
• Athirappily –Vazhachal is naturally and socially endowed with high potential
features for tourism development in natural areas. Tourism here is nature based
with very high concentration of visitors/tourists. The revenue generating potential
of the sites indicates a positive relationship between the revenue, number of
visitors and number of vehicles, which is steadily increasing over a period of
time. Approximately on an average 3.5 lakh tourists visit these sites annually of
which the international tourists form only a meager percentage.
• The Willingness to pay (WTP) and recreation surplus are positively related, i.e.,
one unit increase in the recreation surplus leads to 0.44 unit increase in the WTP.
The probability of willingness to pay for the forest conservation is higher among
the educated group. The probability of willingness to pay for the conservation of
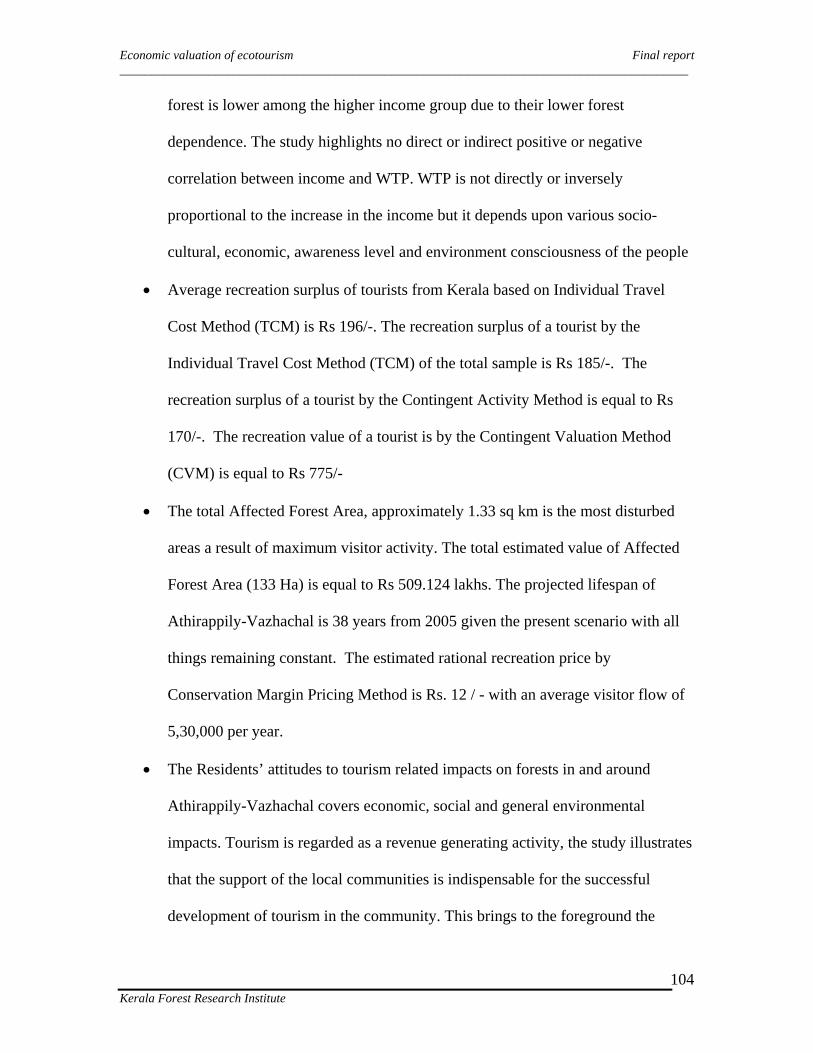
Economic valuation of ecotourism Final report __________________________________________________________________________________________
Kerala Forest Research Institute
104
forest is lower among the higher income group due to their lower forest
dependence. The study highlights no direct or indirect positive or negative
correlation between income and WTP. WTP is not directly or inversely
proportional to the increase in the income but it depends upon various socio-
cultural, economic, awareness level and environment consciousness of the people
• Average recreation surplus of tourists from Kerala based on Individual Travel
Cost Method (TCM) is Rs 196/-. The recreation surplus of a tourist by the
Individual Travel Cost Method (TCM) of the total sample is Rs 185/-. The
recreation surplus of a tourist by the Contingent Activity Method is equal to Rs
170/-. The recreation value of a tourist is by the Contingent Valuation Method
(CVM) is equal to Rs 775/-
• The total Affected Forest Area, approximately 1.33 sq km is the most disturbed
areas a result of maximum visitor activity. The total estimated value of Affected
Forest Area (133 Ha) is equal to Rs 509.124 lakhs. The projected lifespan of
Athirappily-Vazhachal is 38 years from 2005 given the present scenario with all
things remaining constant. The estimated rational recreation price by
Conservation Margin Pricing Method is Rs. 12 / - with an average visitor flow of
5,30,000 per year.
• The Residents’ attitudes to tourism related impacts on forests in and around
Athirappily-Vazhachal covers economic, social and general environmental
impacts. Tourism is regarded as a revenue generating activity, the study illustrates
that the support of the local communities is indispensable for the successful
development of tourism in the community. This brings to the foreground the
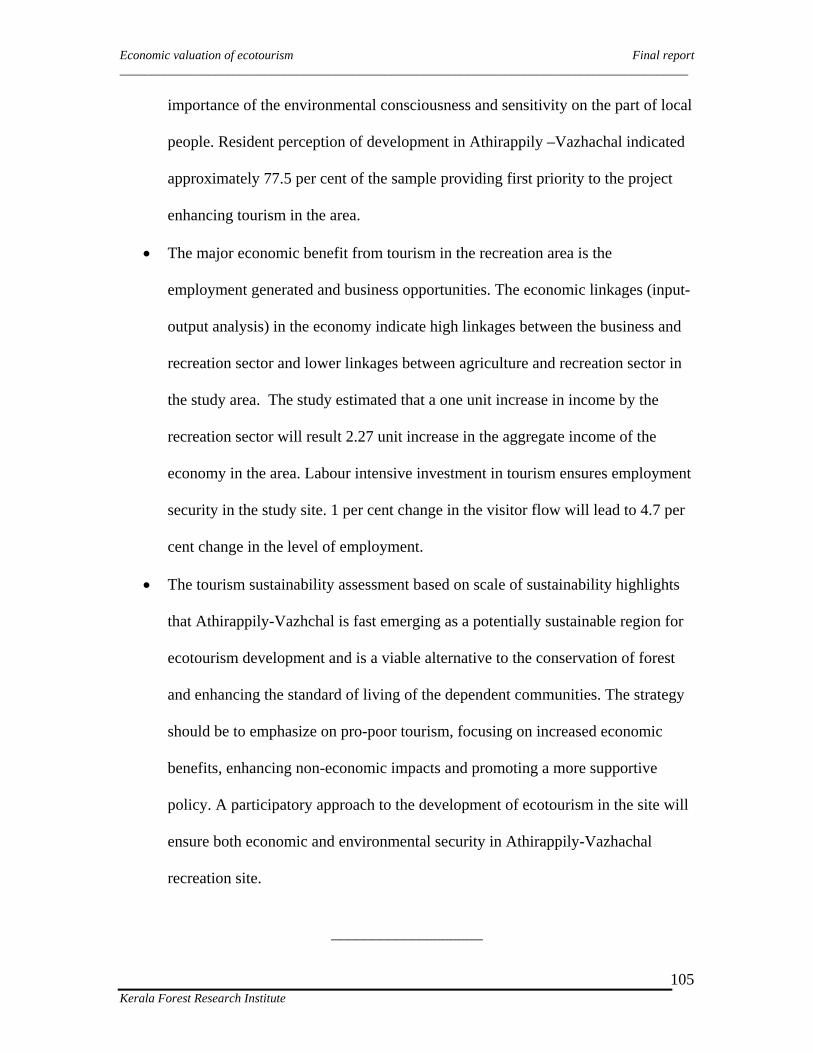
Economic valuation of ecotourism Final report __________________________________________________________________________________________
Kerala Forest Research Institute
105
importance of the environmental consciousness and sensitivity on the part of local
people. Resident perception of development in Athirappily –Vazhachal indicated
approximately 77.5 per cent of the sample providing first priority to the project
enhancing tourism in the area.
• The major economic benefit from tourism in the recreation area is the
employment generated and business opportunities. The economic linkages (input-
output analysis) in the economy indicate high linkages between the business and
recreation sector and lower linkages between agriculture and recreation sector in
the study area. The study estimated that a one unit increase in income by the
recreation sector will result 2.27 unit increase in the aggregate income of the
economy in the area. Labour intensive investment in tourism ensures employment
security in the study site. 1 per cent change in the visitor flow will lead to 4.7 per
cent change in the level of employment.
• The tourism sustainability assessment based on scale of sustainability highlights
that Athirappily-Vazhchal is fast emerging as a potentially sustainable region for
ecotourism development and is a viable alternative to the conservation of forest
and enhancing the standard of living of the dependent communities. The strategy
should be to emphasize on pro-poor tourism, focusing on increased economic
benefits, enhancing non-economic impacts and promoting a more supportive
policy. A participatory approach to the development of ecotourism in the site will
ensure both economic and environmental security in Athirappily-Vazhachal
recreation site.
___________________
Related Documents