Economic Trends and Florida’s Competitive Position presented by John Kaliski Cambridge Systematics, Inc. presented to Florida Department of Economic Opportunity Strategic Plan Regional Stakeholder Forum March 5, 2012

Welcome message from author
This document is posted to help you gain knowledge. Please leave a comment to let me know what you think about it! Share it to your friends and learn new things together.
Transcript

Economic Trends and Florida’s Competitive Position
presented by
John KaliskiCambridge Systematics, Inc.
presented to
Florida Department of Economic OpportunityStrategic Plan Regional Stakeholder Forum
March 5, 2012

Presentation Outline
• Current realities
• Future trends
• How do we compete?
• Where do we stand?
2
Source: Florida Trend.
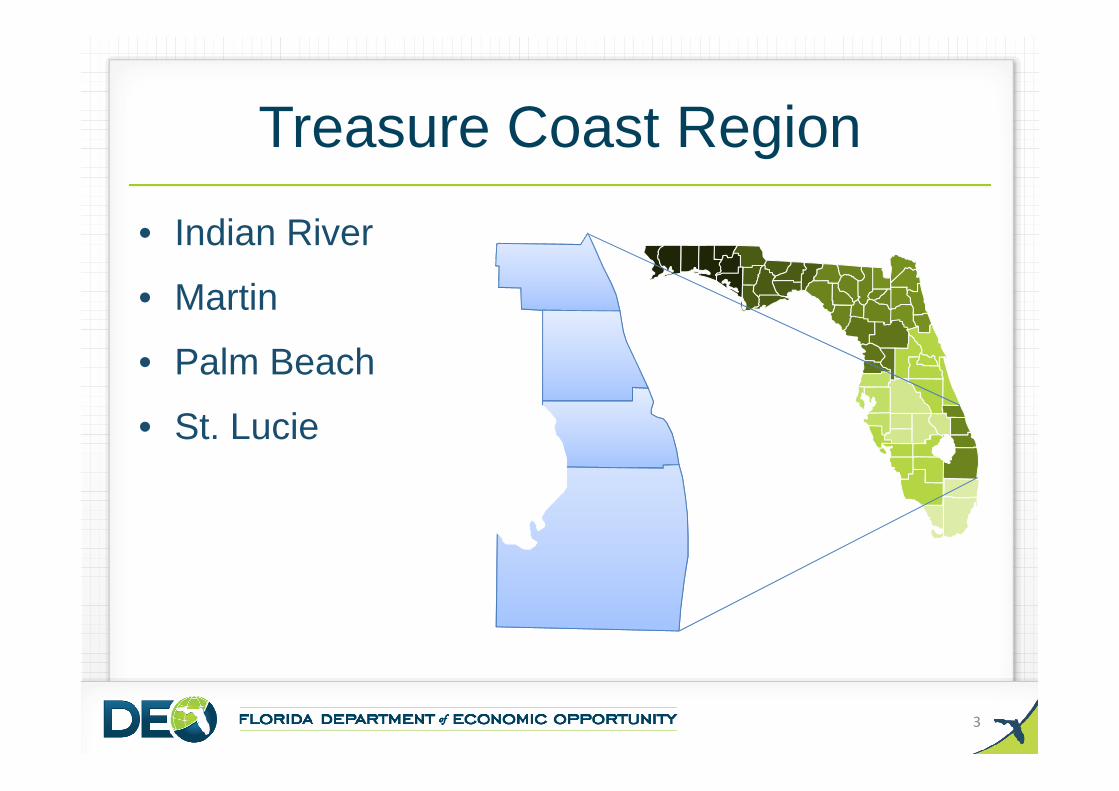
Treasure Coast Region
• Indian River
• Martin
• Palm Beach
• St. Lucie
3
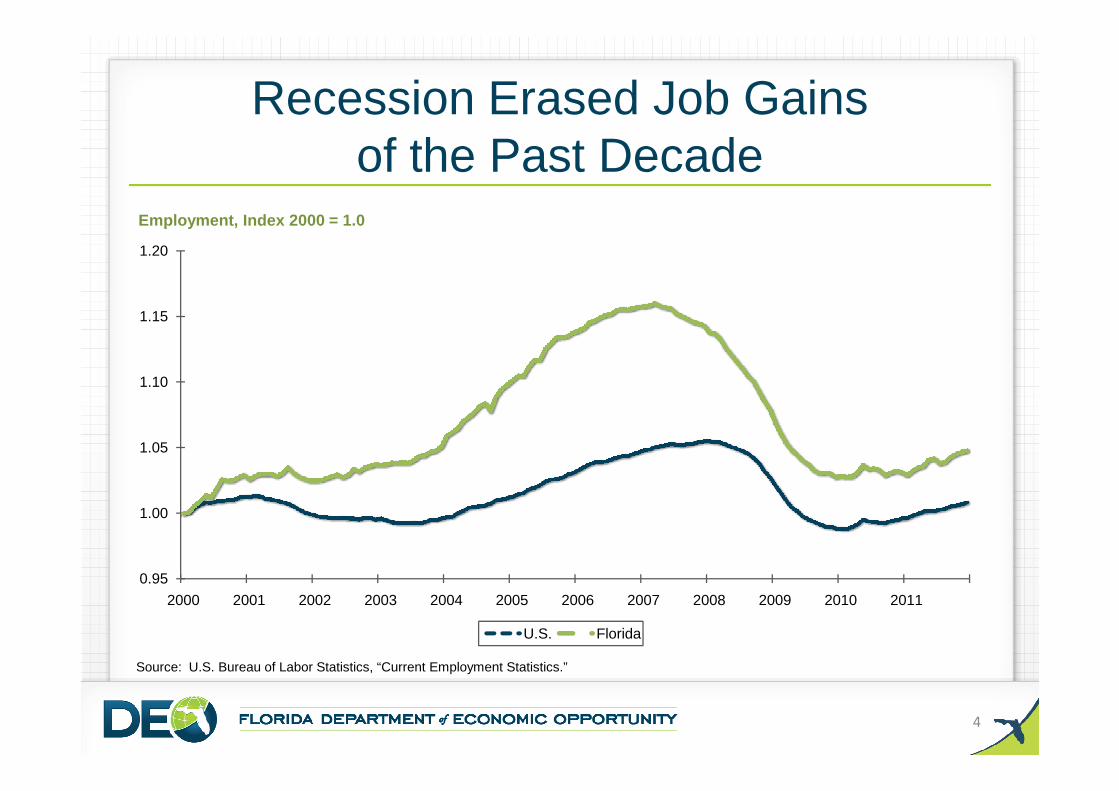
Recession Erased Job Gainsof the Past Decade
Employment, Index 2000 = 1.0
1.10
1.15
1.20
0.95
1.00
1.05
2000 2001 2002 2003 2004 2005 2006 2007 2008 2009 2010 2011
U.S. Florida
Source: U.S. Bureau of Labor Statistics, “Current Employment Statistics.”
4

Unemployment Rate Easing Downward
8.0
10.0
12.0
14.0
Unemployment Rate (in Percent)
Source: U.S. Bureau of Labor Statistics, “Local Area Unemployment Statistics.”
5
0.0
2.0
4.0
6.0
2000 2001 2002 2003 2004 2005 2006 2007 2008 2009 2010 2011 2012
US FLORIDAU.S. FLORIDA

Employment Growth in Treasure Coast
Year-Over-Year Percent Change
2%
4%
6%
8%
6
Source: U.S. Bureau of Labor Statistics, “Current Employment Statistics.”
-8%
-6%
-4%
-2%
0%
2002 2003 2004 2005 2006 2007 2008 2009 2010 2011
Treasure Coast Florida United States

Per Capita Income Much Higher than U.S. but Eroding
Per Capita Income (in Thousands of $2010)
$50
$55
$60
7
Source: U.S. Bureau of Economic Analysis.
$35
$40
$45
2000 2001 2002 2003 2004 2005 2006 2007 2008 2009 2010
Treasure Coast Florida United States

Net Domestic Migration Has Resumed
50
100
150
200
Source: U.S. Census Bureau, American Community Survey (for the 2005-2010 data) and Population Estimates Program (for the 2011 data).
-100
-50
0
2005 2006 2007 2008 2009 2010 2011
8

A New EconomyGlobal Markets
2010
9
2010
Source: Goldman Sachs, 2008.
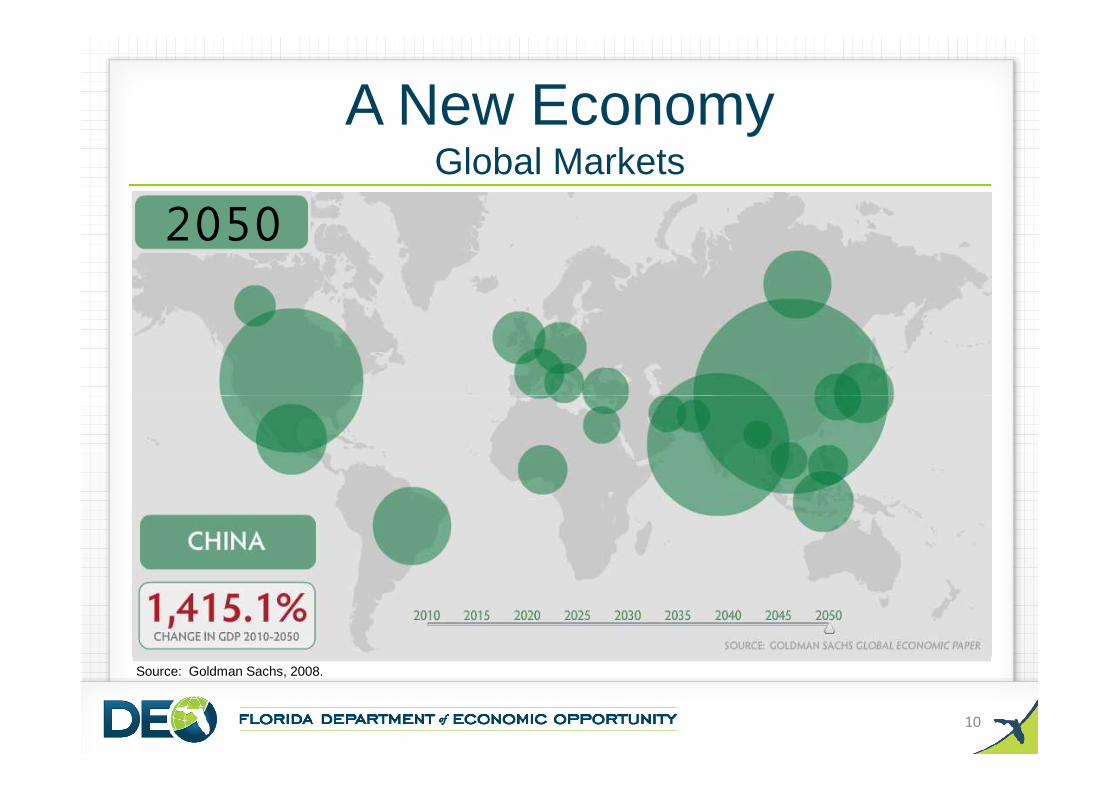
A New EconomyGlobal Markets
20102020203020402050
10
2010
Source: Goldman Sachs, 2008.

A New EconomyGlobal Activity Centers
Global Population Centers
11
Global Population Centers
Global Economic CentersSource: WhosYourCity.com.

A New EconomyCompeting as Regions… and Megaregions
12
Source: America 2050.
12
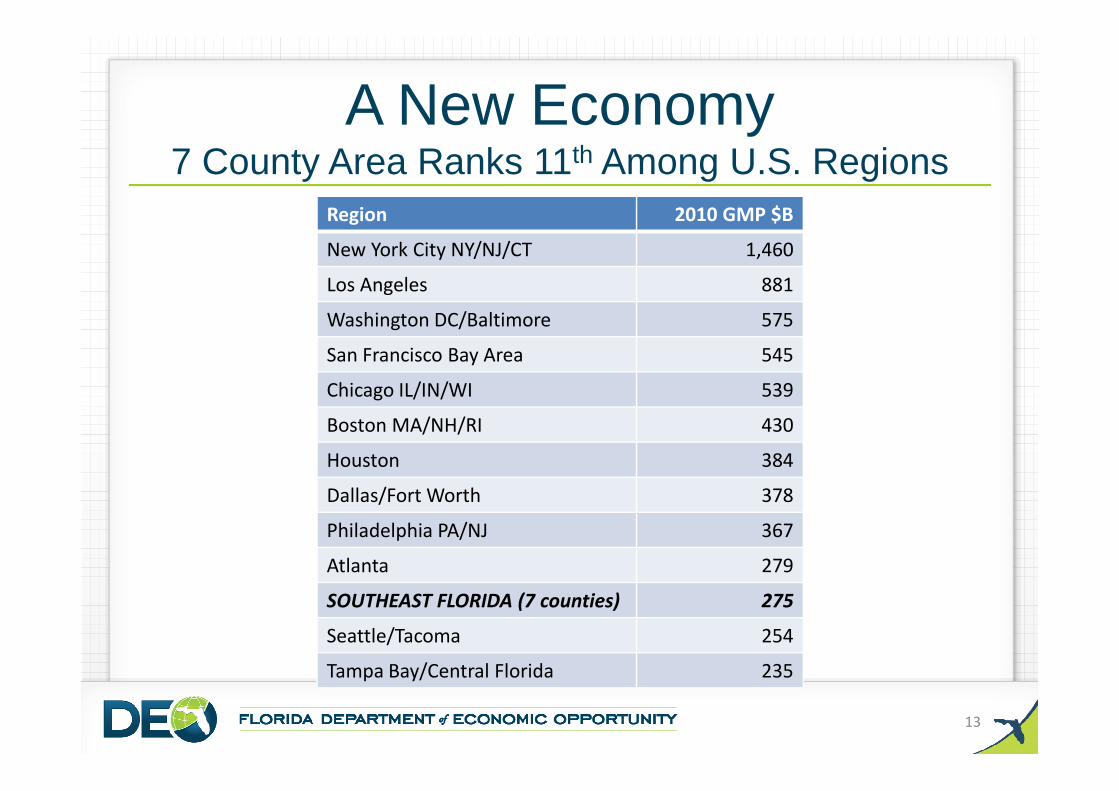
A New Economy7 County Area Ranks 11th Among U.S. Regions
Region 2010 GMP $B
New York City NY/NJ/CT 1,460
Los Angeles 881
Washington DC/Baltimore 575
San Francisco Bay Area 545
Chicago IL/IN/WI 539
13
Chicago IL/IN/WI 539
Boston MA/NH/RI 430
Houston 384
Dallas/Fort Worth 378
Philadelphia PA/NJ 367
Atlanta 279
SOUTHEAST FLORIDA (7 counties) 275
Seattle/Tacoma 254
Tampa Bay/Central Florida 235

How Do We Compete?Florida then… Florida Now…
• Talent
• Innovation
• Infrastructure
• Low costs
• Climate
• Land and natural
14 14
• Infrastructure
• Business climate
• Civic and governance systems
• Quality of life and quality places
• Land and natural resources
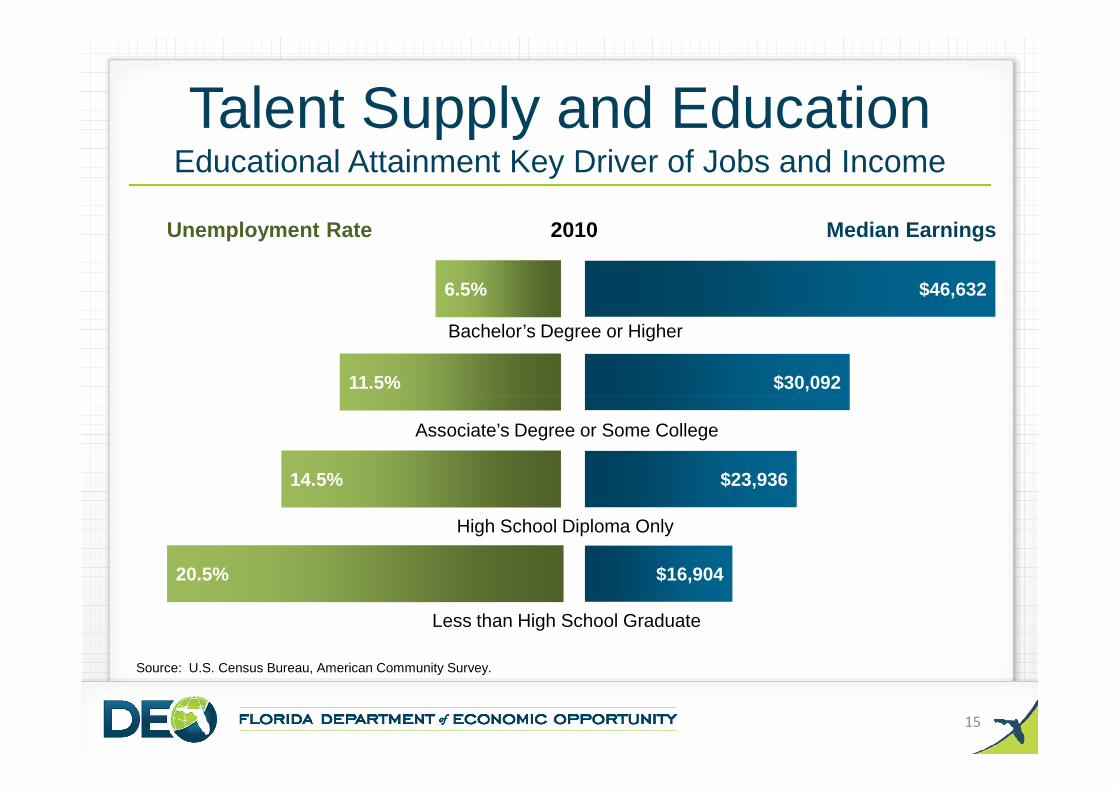
Talent Supply and EducationEducational Attainment Key Driver of Jobs and Income
11.5%
6.5%
$30,092
$46,632
Bachelor’s Degree or Higher
Unemployment Rate Median Earnings2010
20.5%
14.5%
$16,904
$23,936
Less than High School Graduate
High School Diploma Only
Associate’s Degree or Some College
Source: U.S. Census Bureau, American Community Survey.
15

Talent Supply and EducationCan We Provide the Workforce for the Future?
10…10… 6…6… 3…3… 2…2…
16
…students in a 9th grade class
2002
Source: Florida Board of Education 2011.
…graduate from high school
2005
…continue to college within two years
2007
…earn college credit within two years
2009

Talent Supply and EducationEducational Attainment 2006-2010
14%14%
Population over 25...
57%57% 29%29%
Treasure Coast
…with less than a High School degree …with a Bachelor’s Degree, or higher…with HS, Associate’s Degree, or some college
17
Source: U.S. Census Bureau, American Community Survey 2006-2010 five-year estimates.
15%15% 59%59% 26%26%
15%15% 57%57% 28%28%
Florida
United States
19%19% 54%54% 28%28%
South Florida

Emerging
Technologies
Innovation and Economic Development Changing Industry Composition
ConstructionAgriculture
Manufacturing
Global Trade
& Logistics
18
ConstructionAgriculture
Tourism
Past
Future?
Agriculture
TourismHealth Care
Construction
Finance &
Professional
Services

Innovation and Economic DevelopmentCan We Strengthen Our Innovation Pipeline?
2% of total U.S. R&D spending (2007)Discoveries
Start-Ups
Licenses
Patents
19
1% of total U.S. venture capital deals (2010)
2% of total U.S. university licensing activity (2008)
Success
3% of total U.S. patents issued (2010)

Innovation and Economic Development Florida’s Innovation Hubs
20
Source: InfoUSA; Florida Division of Colleges and Universities; Foundationffor Independent Higher Education.

Innovation and Economic DevelopmentCan We Expand Our Global Role?
$60
$70
$80
$90
$100 Florida Share of Total U.S. Export Value
3.4%
4.4%
$65 B
$94 B
21
Source: U.S. Census Bureau, Foreign Trade Division.
$-
$10
$20
$30
$40
$50
2000 2001 2002 2003 2004 2005 2006 2007 2008 2009 2010 2015
Florida Origin Export Value
$27 B
2011

Infrastructure and Growth LeadershipAre We Globally Connected?
22

19601960 20092009
Opportunity: Community of ChoiceInfrastructure and Growth LeadershipCan We Meet the Needs of a Growing Region?
23

Infrastructure and Growth LeadershipCan We Provide for Future Demand?
24
Source: Florida Department of Transportation.

Infrastructure and Growth LeadershipCan We Provide for Future Demand?
25
Source: Florida Department of Transportation.

Business Climate and CompetitivenessIs Florida Competitive?
Fourth ranked in net new business relocations, 2010
26
Source: Dun & Bradstreet.

Business Climate and CompetitivenessNo Longer a Low-Cost State
41st • Highest cost of doing business (CNBC, 2011)11th
• Growth in average health insurance
27
97%
6.3%• Effective business tax rate as percent
of GDP in 2010, up from 4.9% in 2007 (Council on State Taxation)
• Growth in average health insurance premium per enrolled employee, 2000-2010(Kaiser Family Foundation)

Civic and Governance SystemsAre We Able to Invest in the Future?
41st• Lowest per capita state and local
government employment per capita (U.S. Census, 2010)
5th
• Tax supported debt as percentage of
28
8%
53%• Increase in number of nonprofit
organizations, 2000-2010 (National Center for Charitable Statistics)
• Tax supported debt as percentage of revenues in 2009, up from 5% in 2006 (Florida Division of Bond Finance)

Civic and Governance SystemsCan the Public Sector Match the Scale of Business?
• 411 Municipalities• 67 Counties• ~ 112 Economic development organizations • ~ 52 Convention and visitors bureaus• 28 Fixed route transit systems• 28 Fixed route transit systems• 26 Metropolitan planning organizations• 24 Regional workforce boards• 11 Regional planning councils• 8 Economic regions• 5 Water management districts• 781 Community development special districts
29

Quality of Life and Quality PlacesIs Florida a Destination?
30
Third ranked in net domestic migration, 2010Source: U.S. Census Bureau, American Community Survey.

Quality of Life and Quality PlacesIs Florida Attractive?
41st• Floridians who say the State
is worse off than 5 years ago (Leadership Florida, 2011)
45%
• Floridians spending more than 30% of
31
38%
21%• Percentage of residents
without health insurance (U.S. Census, 2010)
• Floridians spending more than 30% of income on home ownership costs (U.S. Census, 2011)

Quality of Life and Quality Places Monthly Foreclosures in Treasure Coast, 2006-2011
40,000
50,000
60,000
70,000
80,000
5,000
6,000
7,000
8,000
9,000
10,000
11,000
Source: Florida Dept of Economic Opportunity, compiled from RealtyTrac, Inc. Total housing units receiving a filing notice, per month.
32
0
10,000
20,000
30,000
0
1,000
2,000
3,000
4,000
5,000
TREASURE COAST Florida - Right Scale
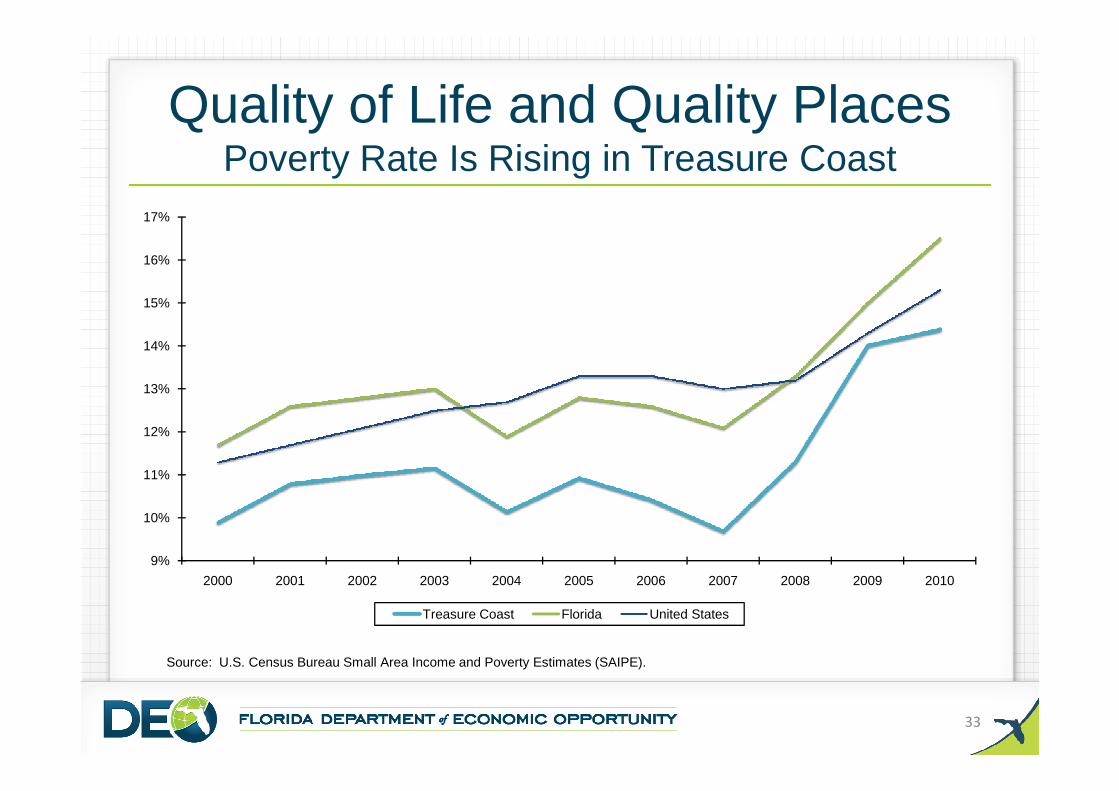
Quality of Life and Quality PlacesPoverty Rate Is Rising in Treasure Coast
13%
14%
15%
16%
17%
33
Source: U.S. Census Bureau Small Area Income and Poverty Estimates (SAIPE).
9%
10%
11%
12%
13%
2000 2001 2002 2003 2004 2005 2006 2007 2008 2009 2010
Treasure Coast Florida United States

Quality of Life and Quality PlacesCan We Preserve What Makes Florida Special?
34

How Do We Get Started?
• Adopt common framework
• Create 5 year action plans – 2 integrated Comprehensive
Economic Development StrategiesEconomic Development Strategies– DEO Strategic Plan
• Move toward a 50-year vision– Regional Vision and Blueprint
for Economic Prosperity– Statewide vision
35
Questions?
Barbara FosterFlorida Department of Economic Opportunity
850-717-8966 | [email protected]
36
John KaliskiCambridge Systematics, Inc.
617-354-0167 | [email protected]
Related Documents