ECONOMIC TOOLS FOR RURAL HEALTH PLANNING By Gerald A. Doeksen Regents Professor Oklahoma State University Paper presented at 51 st Annual Conference of the Australian Agricultural and Resource Economics Society Queenstown, New Zealand February 13-16, 2007

Welcome message from author
This document is posted to help you gain knowledge. Please leave a comment to let me know what you think about it! Share it to your friends and learn new things together.
Transcript

ECONOMIC TOOLS FOR RURAL HEALTH PLANNING
By
Gerald A. Doeksen Regents Professor
Oklahoma State University
Paper presented at
51st Annual Conference of the Australian Agricultural and Resource Economics Society
Queenstown, New Zealand
February 13-16, 2007

1
ECONOMIC TOOLS FOR RURAL HEALTH PLANNING
Everyone knows that hospitals provide access to vital health care services 24 hours a day,
seven days a week, and 365 days a year. Other health care providers, such as physicians, are also
available throughout the year to provide quality health care services. But the role hospitals and
other health care providers play as a major contributor to economic development is often
overlooked. The overall purpose of this paper is to demonstrate how important the health care
sector is to a local economy and to provide tools which local residents can employ to enhance
their health services. More specifically, the paper will:
1. Present an economic impact tool of the health care sector on the local economy;
2. Provide a community engagement tool which will enable leaders to evaluate their health
services; and,
3. Discuss budget tools that can be used to evaluate economic feasibility of a given health
service.
The Economic Impact Tool
The economic impact of health services, as measured by employment and payroll, is
significant. However, this does not tell the complete story, as secondary economic impacts are
created when the health facilities and their employees spend money. These secondary benefits
are measured by multipliers using an input-output model and data from IMPLAN, a model that is
widely used by economists and other academics across the U.S. (Appendix A).
The Multiplier Effect
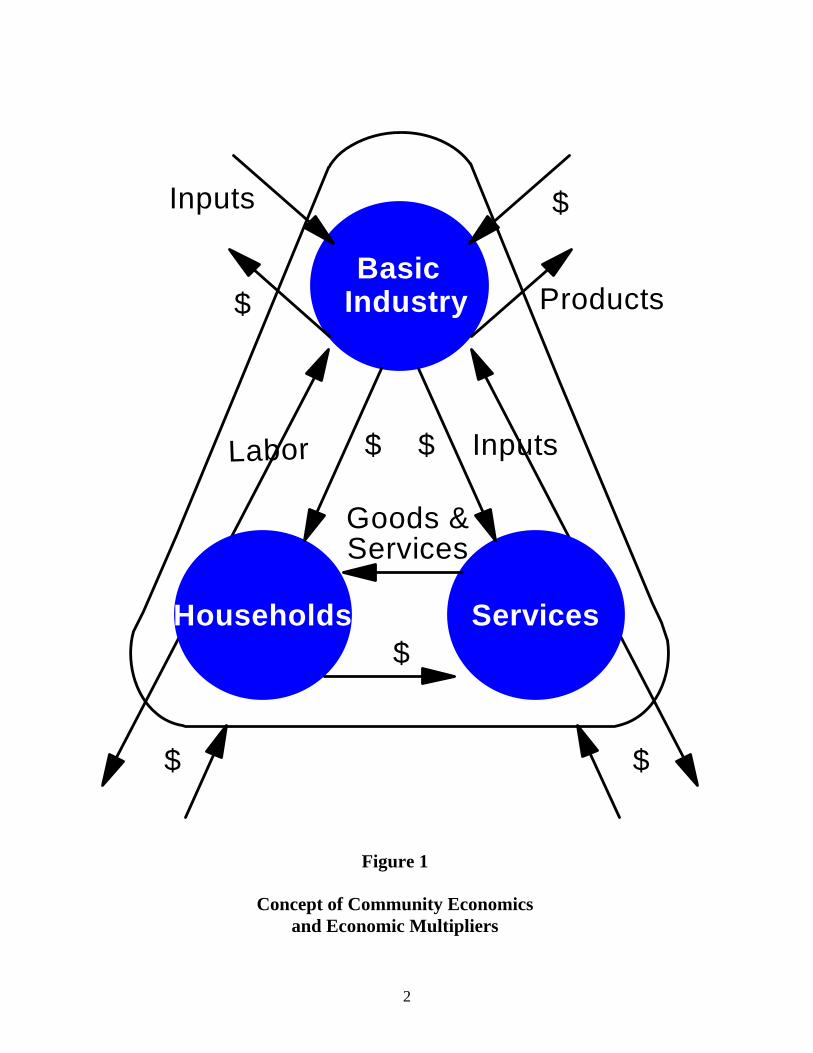
The concept of community economics and multipliers is illustrated in Figure 1. The
triangle depicts a community’s economy with basic industry, services, and households. Basic
2
Households
IndustryBasic
ServicesGoods &
$
Labor Inputs
Products
Inputs
$ $
$
$
Services
$ $
Figure 1
Concept of Community Economics and Economic Multipliers

3
Industry buys labor from households and inputs from service providers. The arrows indicate the
flow of dollars in exchange for labor and services. Households need to purchase services, such
as groceries, clothes, etc., and again dollars flow for the purchase of these services. As soon as
businesses and households purchase labor or services outside the community, the impact on the
community’s economy will decrease. A model is available which can measure the secondary
effect on other businesses due to health care expenditures. The model generates employment
and income multipliers, which measure all secondary impacts that occur in a community’s
economy. For example, a hospital employment multiplier of 1.5 would indicate that for each job
in the hospital, another 0.5 job is created in other businesses due to the hospital and its
employees purchasing goods and services within the community.
The multipliers measure the total impact of the health sector, but can also measure the
increase or decrease in business activity. Consider, for instance, the closing of a hospital. The
hospital will no longer pay employees, and dollars going to households will stop. Likewise, the
hospital will not purchase goods from other businesses, and dollars flowing to other businesses
will stop. This decreases income in the household segment of the economy. Since earnings
would decrease, households decrease their purchases of goods and services from businesses
within the services segment of the economy. This, in turn, decreases these businesses’ purchases
of labor and input. Thus, the change in the economic base works its way throughout the entire
local economy as reflected by the multipliers.
Application of the Impact Tool
To illustrate the tool, the impact of Hamilton Memorial Hospital District activities is
presented. The hospital and health services are located in Hamilton County, Illinois, and its
market area is a county with approximately 8,300 residents.

4
The economic impact of Hamilton Memorial Hospital District is presented in Table 1.
Hamilton Memorial Hospital District creates jobs from their operations. Employment (jobs) and
income (payroll including wages, salaries, and benefits) from operations were obtained from
Hamilton Memorial Hospital District. The Hospital component employs 119 employees. The
hospital sector employment multiplier is 1.46; this means for every job in the hospital sector,
another 0.46 job is created in other sectors (businesses) in the local economy. The secondary
employment generated in the local economy from the hospital sector is estimated to be 55 jobs.
The Hospital component has a total impact of 174 jobs on the local economy. The Nursing
Home, Home Health Care, and Clinic components employ 65 employees. With the employment
multiplier of 1.19, the secondary employment resulting from these services is 12, and the total
impact of this component is 77 jobs.
Table 1
Employment Impact
Of Hamilton Memorial Hospital District from Operations
Health Care Component
Number of Employees
Employment Multiplier
Secondary Impact
Total Impact
Hospital 119 1.46 55 174 Nursing Home, Home Health Care, and Clinic
65 1.19 12 77
Total Operations Income 184 67 251 SOURCE: Local data from Hamilton Memorial Hospital District, 2006; IMPLAN Multipliers, 2003.
Hamilton Memorial Hospital District has a total employment impact of 251 employees,
including 184 employees working directly for the Hamilton Memorial Hospital District, and
secondary employment of 67 jobs. The secondary employment is generated in other industry

5
sectors in Hamilton County due to the spending of Hamilton Memorial Hospital District and the
spending of the District’s employees.
Data on the economic impact of Hamilton Memorial Hospital District on income are
presented in Table 2. Data obtained from the District indicate that total income (wages, salaries,
and benefits) from the Hospital component is $4,241,000. Using the hospital sector income
multiplier of 1.31, Hamilton Memorial Hospital generates a secondary income of $1,315,000 and
a total income of $5,556,000. The Nursing Home, Home Health Care, and Clinic component
have a direct income of $1,972,000. Applying the income multiplier of 1.24, the secondary
income generated from these services is $470,000, for a total income impact of $2,442,000.
Table 2
Income Impact
of Hamilton Memorial Hospital District from Operating Activities
Health Care Component
Income ($1,000)
Income
Multiplier
Secondary Impact
($1,000)
Total Impact
($1,000)
Retail Sales
($1,000)
1% Sales Tax
($1,000) Hospital 4,241 1.31 1,315 5,556 1,117 11.17 Nursing Home, Home Health Care, and Clinic 1,972 1.24 470 2,442 491 4.91 Total Operations Income 6,123 1,785 7,998 1,608 16.08 SOURCE: Local data from Hamilton Memorial Hospital District, 2006; IMPLAN Multipliers, 2003.
In summary, the total direct income impact of Hamilton Memorial Hospital District is
$6,123,000 and the total secondary income impact resulting from the Hamilton Memorial
Hospital District is $1,785,000. Finally, the total income impact from Hamilton Memorial
Hospital District operations is $7,998,000 annually.

6
Income also has an impact on retail sales. If the ratio between retail sales and income
continues as in the past several years, then direct and secondary retail sales generated by the
health sector components and their employees equals $1,608,000 (Table 2). It must be
remembered that these are sales taxes paid by District employees and secondary employees, as
the hospital does not pay sales taxes. Each of the health sector components’ income impacts is
utilized to determine the retail sales and a 1-cent sales tax collection for each component. A 1-
cent sales tax is used as an example due to the varying sales tax rates used in different counties.
The components are totaled to determine the direct and secondary retail sales generated by the
health sector. A 1-cent sales tax collection is estimated to generate $16,080 annually in the
Hamilton Memorial Hospital District as a result of the total health sector impact. This estimate
is probably low, as many healthcare employees will spend a larger proportion of their income in
local establishments that collect sales tax. The bottom line is that the health sector not only
contributes greatly to the medical health of the community, but also to the economic health of the
community.
Hamilton Memorial Hospital District is considering and evaluating a major capital
improvement project. The capital project has not been finalized at this time, yet the construction
activities of a large capital project will be significant and will have a huge impact on the local
economy. The impact of construction activities is often overlooked. Since capital expenditures
vary by year, data were collected for the proposed capital improvement projects over the next
three years. The District is considering plans for a new medical office building, emergency
room, and operating room in Year 1 for $8.4 million; hospital renovations in Year 2 of $2.6
million; and, further hospital renovations of $1.9 million in Year 3.

7
Data from the IMPLAN model were utilized in estimating employment and wages and
salaries. The data were checked against industry standard and appear to be very accurate
estimates. The construction or capital impacts only occur during the year the expenditures are
incurred, but they are very large. The $8.4 million capital investment in Year 1 is expected to
create 120 full and part time jobs and generate $3.2 million in wages and salaries (Tables 3 and
4). This is the direct employment impact from the construction activities and not the total
construction impact which is again estimated with multipliers.
Table 3
Employment Impact
of Hamilton Memorial Hospital District from Construction Activities
Direct Employment Construction Secondary Total Year from Construction Multiplier Impact Impact
1 120 1.28 34 154 2 37 1.28 10 47 3 27 1.28 7 34
SOURCE: Local data from Hamilton Memorial Hospital District, 2006; IMPLAN Multipliers, 2003.
The total impact on employment from Hamilton Memorial Hospital District’s proposed
capital expenditures is presented in Table 3. The construction employment multiplier of 1.28
indicates that a 0.28 job is created in other businesses in the local economy due to each job
associated with the construction activities. These jobs in other businesses are referred to as
secondary jobs. The estimated secondary employment impact is 34 jobs in Year 1, making a
total employment impact during Year 1 of 154 jobs. The employment impact of Years 2 and 3
are also presented in Table 3.
8
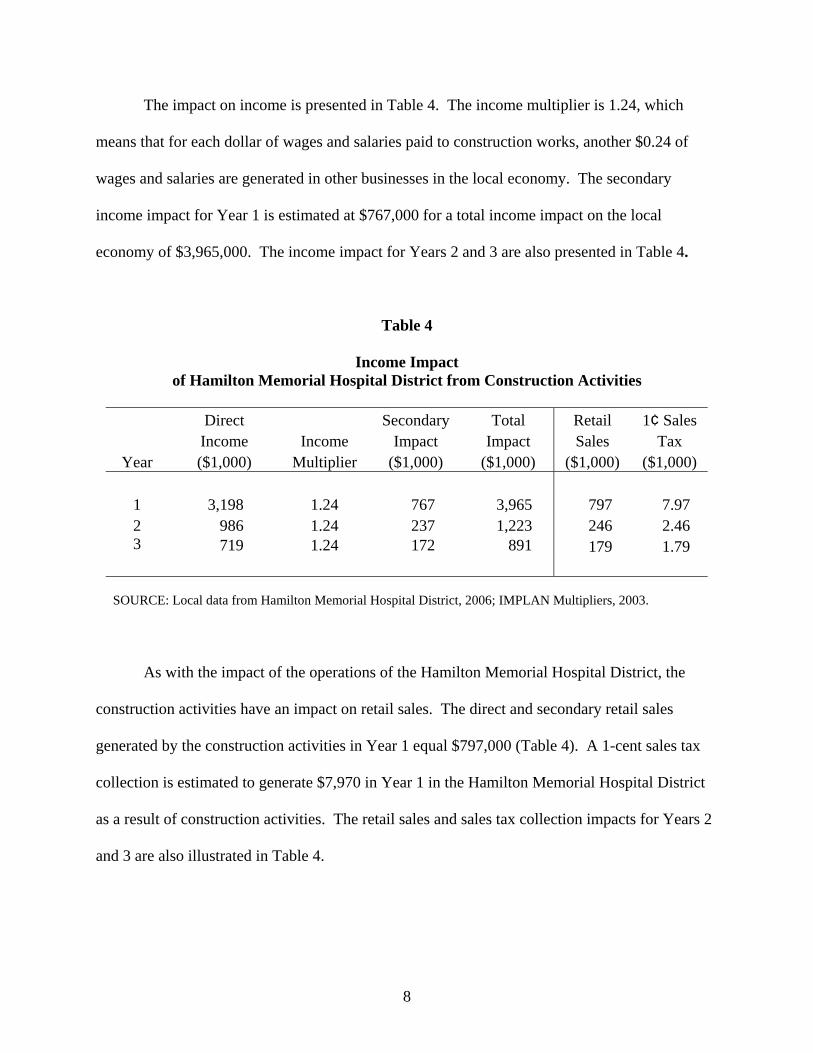
The impact on income is presented in Table 4. The income multiplier is 1.24, which
means that for each dollar of wages and salaries paid to construction works, another $0.24 of
wages and salaries are generated in other businesses in the local economy. The secondary
income impact for Year 1 is estimated at $767,000 for a total income impact on the local
economy of $3,965,000. The income impact for Years 2 and 3 are also presented in Table 4.
Table 4
Income Impact of Hamilton Memorial Hospital District from Construction Activities
Direct Secondary Total Retail 1¢ Sales Income Income Impact Impact Sales Tax
Year ($1,000) Multiplier ($1,000) ($1,000) ($1,000) ($1,000)
1 3,198 1.24 767 3,965 797 7.97 2 986 1.24 237 1,223 246 2.46 3 719 1.24 172 891 179 1.79
SOURCE: Local data from Hamilton Memorial Hospital District, 2006; IMPLAN Multipliers, 2003.
As with the impact of the operations of the Hamilton Memorial Hospital District, the
construction activities have an impact on retail sales. The direct and secondary retail sales
generated by the construction activities in Year 1 equal $797,000 (Table 4). A 1-cent sales tax
collection is estimated to generate $7,970 in Year 1 in the Hamilton Memorial Hospital District
as a result of construction activities. The retail sales and sales tax collection impacts for Years 2
and 3 are also illustrated in Table 4.
9
The Community Engagement Tool
The community health engagement process is a strategic planning process and assists
local communities to (1) identify their health care needs; (2) examine the social, economic, and
political realities affecting the local delivery of health care; (3) determine what they want and
realistically can achieve in a health care system to meet the community’s needs; and, (4) develop
and mobilize an action plan based on their analysis and planning.
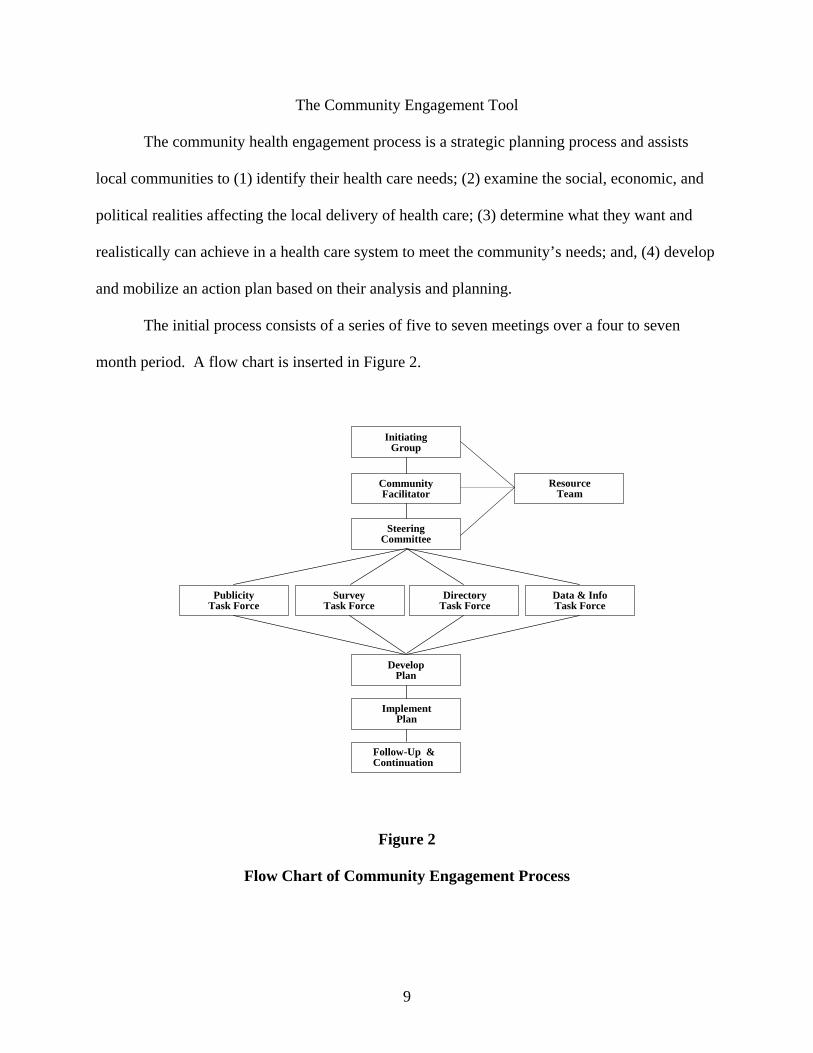
The initial process consists of a series of five to seven meetings over a four to seven
month period. A flow chart is inserted in Figure 2.
Figure 2
Flow Chart of Community Engagement Process
Resource Team
Follow-Up &Continuation
DevelopPlan
ImplementPlan
Publicity Task Force
SurveyTask Force
DirectoryTask Force
Data & Info Task Force
InitiatingGroup
SteeringCommittee
CommunityFacilitator

10
First, a small initiating group of individuals from the community meets to review the
community health engagement process, discuss the membership of the steering committee,
gather the primary data for the economic impact study, and set the date for the first health
planning meeting. A broad-based community steering committee is organized, and the first
meeting is held to present the economic impact of the health sector on the community. The
steering committee is then divided into four task forces: 1) Publicity; 2) Survey; 3) Directory;
and, 4) Data and Information.
The next two to three health planning meetings involve the steering committee reviewing
information from the task force area. The publicity task force publicizes the process, as well as
provides a publicity “blitz” a week or two before the community survey is taken. The directory
task force organizes and finalizes a community health service directory. The survey task force
develops a survey instrument that will deal with access to health care and health care utilization
patterns. The data and information task force presents secondary data in the areas of economics,
health and behavior, education, traffic, and crime. This task force reviews the information and
looks for strengths and/or weaknesses in the community data. The process results in four
products: 1) Economic Impact of the Health Sector; 2) Health Services Directory; 3) Survey
Results; and, 4) Data and Information (Figure 3).
After the task forces complete their meetings, the next community health engagement
meeting will be to summarize the information received from the task forces. The directory task
force will look for duplication of services, possible integration of services, or for services lacking
in the community. The survey task force reviews and summarizes the survey results, looking for
any areas of need in the community. The data and information task force summarizes the needs
as indicated from the data review.

11
Grand County Colorado
Grand County, Colorado
Grand County, Colorado
Grand County, Colorado
Figure 3
Products from Community Engagement Process
The results of the task forces are reviewed by the entire steering committee and then
prioritized by the group to determine the top three to five issues within the community. From
these top issues, the group develops an action plan to deal with an issue or with several issues.
The steering committee then shares their proposed action plan with the community at-large for
their review and input.
The community resource team, consisting of representatives from the Oklahoma
Cooperative Extension Service and the Oklahoma Office of Rural Health, provides facilitation of
these five to seven meetings. The community health engagement process assists with the
development of the action plan and continues to help the community in the implementation of

12
the plan. The resource team is continuously available for updating products and for providing
follow-up services that might include a variety of budget studies. Budget studies available
include emergency medical services, adult day services, assisted living facilities, and primary
care physicians. Check the following websites for a list of available budget studies and more
details of the community engagement process:
Oklahoma Rural Health Works Website: www.okruralhealthworks.org
National Rural Health Works Website: www.ruralhealthworks.org
The Budget Tool
As the community engagement process is implemented and completed, priorities will be
identified. The engagement process generally surfaces two types of priorities. These include
behavior type actions and service type actions. The behavior actions include such items as
reducing teenage pregnancy or reducing drunk driving. Service type actions include adding or
evaluating a specific service such as hiring an additional pediatrician or starting a kidney dialysis
unit.
The resource team needs to be ready to assist in evaluating proposed services. It is
crucial that the decision makers know whether the service is economically feasible. If not,
decision makers need to know how much they will have to subsidize the service in order for it to
break even. This portion of the paper will present basic budget analysis methodology and
summarize a budget study for a kidney dialysis unit.
Basic Budget Analysis Methodology
Before a health service can be initiated, it is imperative that the service be economically
analyzed. Some health services identified and ranked extremely high by the community
engagement process are not economically feasible or will require additional resources. If this is

13
the case, all data and facts must be known before action is initiated. Analyzing the issue may be
quite simple or may be very difficult. Some issues will require technical assistance from experts
outside the committee and community. Knowledge of where to obtain assistance and willingness
to ask is important. The methodology involved in analyzing an issue is quite basic and is
outlined in Table 5. To illustrate this methodology, a kidney dialysis center will be presented.
Table 5
Basic Methodology for Analyzing an Issue
I. Estimate Needs II. Project Costs A. Capital or Start-Up Costs B. Annual Operating Costs III. Estimate Revenue IV. If Doesn’t Break-Even, Other Sources of Funds
Budget for Kidney Dialysis Center
After completing the community engagement process in Lincoln County, Oklahoma (a
county in central Oklahoma with approximately 32,000 residents), the community engagement
committee identified a need for a kidney dialysis unit. The resource team utilized research1 to
conduct a budget study. Kidney dialysis demand coefficients presented in Table 6 were used to
estimate the need for services in Lincoln County. Each demand coefficient estimates the number
of kidney dialysis patients expected in that age group per 100,000 population. Applying these
coefficients with the population of Lincoln County yields an estimated need of 22 patients. To
serve these patients, a facility operating Monday, Wednesday, and Friday was designed (Table
7).
1 For the complete study, see Lawler, Mary and Gerald A. Doeksen. A Guidebook for Estimating the Economic Viability of a Hemodialysis Center, (www.ruralhealthworks.org), 2003.

14
Table 6
Kidney Dialysis Demand Coefficients
Age
Coefficient
0-19 1.6
20-44 35.6 45-64 134.4 65-74 272.2
75+ 230.0
Table 7
Sample Dialysis Facility For Lincoln County, Oklahoma
Treatment Schedule
Patients Stations Mon Tues Wed Thur Fri
22 8 3 0 3 0 3
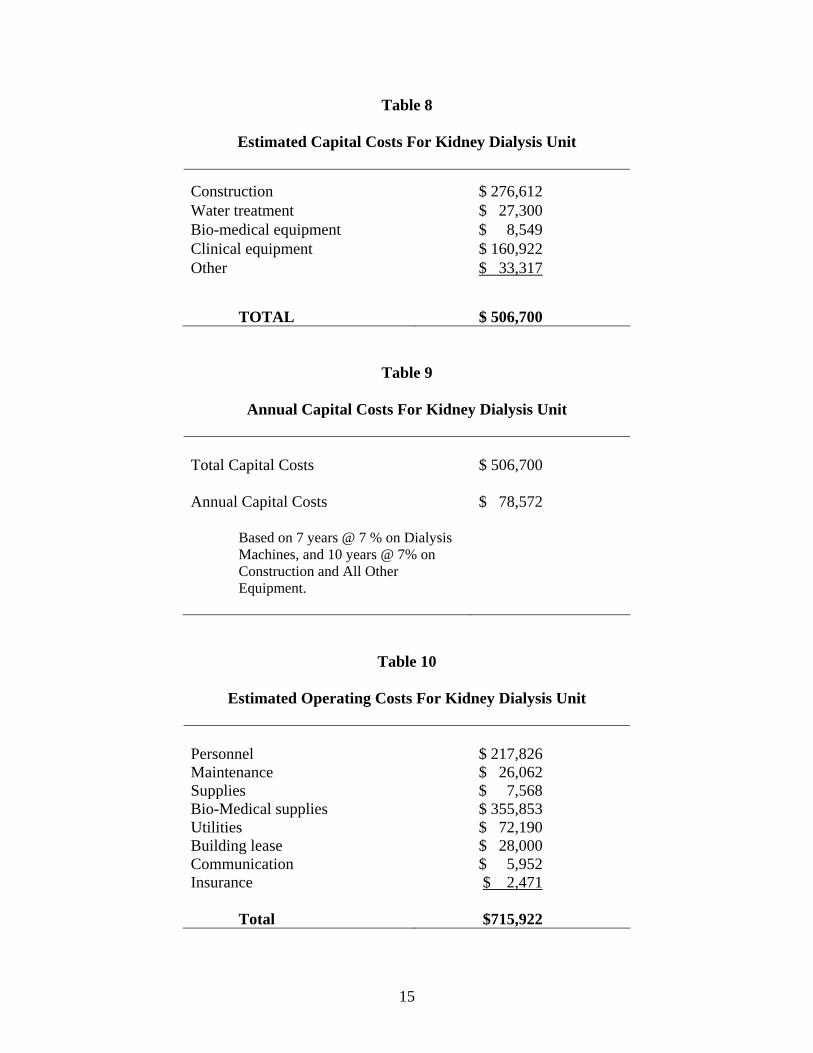
Once the need was estimated, then capital and operating costs were estimated. The
results of the costs analysis are presented on Tables 8-10. Capital costs were estimated at
$506,700 (Table 8). The annual capital costs were estimated assuming a seven percent loan and
seven year life for the machine. The construction and other equipment were assumed financed
with a seven percent loan for ten years. Annual capital expenses were estimated at $78,572
(Table 9). Operating costs were estimated at $715,922 (Table 10).
15
Table 8
Estimated Capital Costs For Kidney Dialysis Unit
Construction $ 276,612 Water treatment $ 27,300 Bio-medical equipment $ 8,549 Clinical equipment $ 160,922 Other $ 33,317 TOTAL $ 506,700
Table 9
Annual Capital Costs For Kidney Dialysis Unit
Total Capital Costs $ 506,700 Annual Capital Costs $ 78,572 Based on 7 years @ 7 % on Dialysis
Machines, and 10 years @ 7% on Construction and All Other Equipment.
Table 10
Estimated Operating Costs For Kidney Dialysis Unit
Personnel $ 217,826 Maintenance $ 26,062 Supplies $ 7,568 Bio-Medical supplies $ 355,853 Utilities $ 72,190 Building lease $ 28,000 Communication $ 5,952 Insurance $ 2,471 Total $715,922

16
Projected revenue for this proposed system is $813,980 (Table 11). This assumes the
regional Medicare rate of $233 per treatment and private insurance rate of $1,023 per treatment.
These data were obtained from operating kidney dialysis units. The feasibility of the kidney
dialysis unit is summarized in Table 12. The annual revenue is $813,980 and costs are $794,494.
This leaves a small profit of $19,494.
Table 11
Estimated Revenue For Kidney Dialysis Unit
2,949 treatments @ $233 $687,117 140 treatments at $1,023 $143,220 Adjustment for Non-Reimbursed ($16,357) Total Revenue
$813,980
Table 12
Determining Feasibility For Kidney Dialysis Unit
Total Revenue $813,980
Total Annual Capital Costs $ 78,572
Total Annual Operating Costs $715,922
Total Annual Capital & Operating Costs $794,494
Total Revenues less Total Costs $ 19,494
The resource team completes the budget study but makes no recommendations. The
decision on a project is left up to the community leaders. The resource team’s job is to provide
the best data and information such that community leaders can make an informed decision.

17
Budget studies have been completed for a number of health services. These are
summarized in Table 13. The reports and example budget applications are available on the
website for the National Center for Rural Health Works (www.ruralhealthworks.org).
Table 13
Available Budget Studies from Oklahoma Cooperative Extension Service
Types of Studies
Primary Care Physician Obstetrics/Gynecology Physician Pediatrician Emergency Medical Services (Basic and Advanced) First Responder Systems Outpatient Rehabilitation Adult Day Services Kidney Dialysis Assisted Living Facilities Federal Qualified Health Center Rural Health Clinics Specialty Physicians
Summary
Quality health services are indeed needed for medical reasons. This paper also
documents the fact that quality medical services are tremendously beneficial for economic
reasons. The health care sector is growing and employs a large number of residents. In fact, the
health care sector often employs 15-20 percent of the employment base of rural communities.
This paper presents tools that measure the economic impact of the health sector and that assist
community leaders in evaluating and enhancing their health services. Tools presented are:

18
1. A tool that measures the economic impact of the health sector;
2. A tool (community engagement tool) that allows community leaders to evaluate their
health services; and,
3. Tools (budget) that allow community leaders to evaluate the feasibility of specific health
services.
The tools are applied to rural communities and presented in this paper. The tools are
easily transferable to other countries, such that quality rural health services can be enhanced and
available for rural residents.

19
References
Alward, G., Sivertz, E., Olson, Dl, Wagnor, J., Serf, D., and Lindall, S. Micro IMPLAN Software Manual. Stillwater, MN. University of Minnesota Press. 1989.
Doeksen, Gerald A., Johnson, Tom, and Willoughby, Chuck. Measuring the Economic
Importance of the Health Sector on a Local Economy: A Brief Literature Review and Procedures to Measure Local Impacts. Southern Rural Development Center. SRDC Pub. No. 202. 1997.
Miernyk, W.H. The Element of Input-Output Analysis. New York, NY; Random House. 1965. Minnesota IMPLAN Group, Inc. User’s Guide, Analysis Guide, Data Guide: IMPLAN
Professional Version 2.0 Social Accounting & Impact Analysis Software, 2nd Edition, June 2000.

A-1
Appendix A Model and Data Used to Estimate
Employment and Income Multipliers
A computer spreadsheet that uses state IMPLAN multipliers was developed to enable
community development specialists to easily measure the secondary benefits of the health sector
on a state, regional or county economy. The complete methodology, which includes an
aggregate version, a disaggregate version, and a dynamic version, is presented in Measuring the
Economic Importance of the Health Sector on a Local Economy: A Brief Literature Review and
Procedures to Measure Local Impacts (Doeksen, et al., 1997). A brief review of input-output
analysis and IMPLAN are presented here.
A Review of Input-Output Analysis
Input-output (I/O) (Miernyk, 1965) was designed to analyze the transactions among the
industries in an economy. These models are largely based on the work of Wassily Leontief
(1936). Detailed I/O analysis captures the indirect and induced interrelated circular behavior of
the economy. For example, an increase in the demand for health services requires more
equipment, more labor, and more supplies, which, in turn, requires more labor to produce the
supplies, etc. By simultaneously accounting for structural interaction between sectors and
industries, I/O analysis gives expression to the general economic equilibrium system. The
analysis utilizes assumptions based on linear and fixed coefficients and limited substitutions
among inputs and outputs. The analysis also assumes that average and marginal I/O coefficients
are equal.
Nonetheless, the framework has been widely accepted and used. I/O analysis is useful
when carefully executed and interpreted in defining the structure of a region, the
interdependencies among industries, and forecasting economic outcomes.

A-2
The I/O model coefficients describe the structural interdependence of an economy. From
the coefficients, various predictive devices can be computed, which can be useful in analyzing
economic changes in a state, a region or a county. Multipliers indicate the relationship between
some observed change in the economy and the total change in economic activity created
throughout the economy.
MicroIMPLAN
MicroIMPLAN is a computer program developed by the United States Forest Service
(Alward, et al., 1989) to construct I/O accounts and models. Typically, the complexity of I/O
modeling has hindered practitioners from constructing models specific to a community
requesting an analysis. Too often, inappropriate U.S. multipliers have been used to estimate
local economic impacts. In contrast, IMPLAN can construct a model for any county, region,
state, or zip code area in the United States by using available state, county, and zip code level
data. Impact analysis can be performed once a regional I/O model is constructed.
Five different sets of multipliers are estimated by IMPLAN, corresponding to five
measures of regional economic activity. These are: total industry output, personal income, total
income, value added, and employment. Two types of multipliers are generated. Type I
multipliers measure the impact in terms of direct and indirect effects. Direct impacts are the
changes in the activities of the focus industry or firm, such as the closing of a hospital. The
focus business changes its purchases of inputs as a result of the direct impacts. This produces
indirect impacts in other business sectors. However, the total impact of a change in the economy
consists of direct, indirect, and induced changes. Both the direct and indirect impacts change the
flow of dollars to the state, region, or county’s households. Subsequently, the households alter
their consumption accordingly. The effect of the changes in household consumption on

A-3
businesses in a community is referred to as an induced effect. To measure the total impact, a
Type II multiplier is used. The Type II multiplier compares direct, indirect, and induced effects
with the direct effects generated by a change in final demand (the sum of direct, indirect, and
induced divided by direct). IMPLAN also estimates a modified Type II multiplier, called a Type
III multiplier that also includes the direct, indirect, and induced effects. The Type III multiplier
further modifies the induced effect to include spending patterns of households based on a
breakdown of households by nine different income groups.
Minnesota IMPLAN Group, Inc. (MIG)
Dr. Wilbur Maki at the University of Minnesota utilized the input/output model and
database work from the U. S. Forest Service’s Land Management Planning Unit in Fort Collins
to further develop the methodology and to expand the data sources. Scott Lindall and Doug
Olson joined the University of Minnesota in 1984 and worked with Maki and the model.
As an outgrowth of their work with the University of Minnesota, Lindall and Olson
entered into a technology transfer agreement with the University of Minnesota that allowed them
to form MIG. At first, MIG focused on database development and provided data that could be
used in the Forest Service version of the software. In 1995, MIG took on the task of writing a
new version of the IMPLAN software from scratch. This new version extended the previous
Forest Service version by creating an entirely new modeling system that included creating Social
Accounting Matrices (SAMs) – an extension of input-output accounts, and resulting SAM
multipliers. Version 2 of the new IMPLAN software became available in May of 1999. For
more information about Minnesota IMPLAN Group, Inc., please contact Scott Lindall or Doug
Olson by phone at 651-439-4421 or by email at [email protected] or review their website at
www.implan.com.
Related Documents