Welcome message from author
This document is posted to help you gain knowledge. Please leave a comment to let me know what you think about it! Share it to your friends and learn new things together.
Transcript

Economic Survey (2017-2018)Volume - 1
INDEX1. State of the Economy: An Analytical Overview and Outlook for Policy
2. A New, Exciting Bird's Eye View of the Indian Economy Through the GST
3. Investment and Saving Slowdowns and Recoveries: Cross-Country Insights for India
4. Reconciling Fiscal Federalismand Accountability: Is there a Low Equilibrium Trap?
5. Is there a "Late Converger Stall" in Economic Development? Can India Escape it?
6. Climate, Climate Change, and Agriculture
7. Gender and Son Meta-Preference: Is Development Itself an Antidote?
8. Transforming Science and Technology in India
9. Ease of Doing Business' Next Frontier: Timely Justice

www.iasscore.inNotes
1Economic Survey (2017-18)
GS S
CO
RE
1. There has been a large increase in registered indirect and direct taxpayers
• A 50 percent increase in unique indirect taxpayers under the GST compared with the pre-GSTsystem.
• Similarly, there has been an addition (over and above trend growth) of about 1.8 million inindividual income tax filers since November 2016.
2. Formal non-agricultural payroll is much greater than believed
• More than 30 percent when formality is defined in terms of social security (EPFO/ESIC)provision.
• More than 50 percent when defined in terms of being in the GST net.
3. States’ prosperity is correlated with their international and inter-state trade
• States that export more internationally, and trade more with other states, tend to be richer. Butthe correlation is stronger between prosperity and international trade.
4. India’s firm export structure is substantially more egalitarian than in other large countries
• Top 1 percent of Indian firms account for 38 percent of exports; in all other countries, theyaccount for a substantially greater share (72, 68, 67, and 55 percent of exports in Brazil,Germany, Mexico, and USA respectively). And this is true for the top 5 percent, 10 percent,and so on.
5. The clothing incentive package boosted exports of readymade garments
• The relief from embedded state taxes (ROSL) announced in 2016 boosted exports of ready-made garments (but not others) by about 16 percent.
6. Indian society exhibits strong son “Meta” Preference
• Parents continue to have children until they get the desired number of sons. This kind offertility-stopping rule leads to skewed sex ratios but in different directions: skewed in favor ofmales if it is the last child, but in favor of females if it is not the last. Where there are no suchfertility-stopping rules, ratios remain balanced regardless of whether the child is the last or not.
7. There is substantial avoidable litigation in the tax arena which government action could reduce
• The tax department’s petition rate is high, even though its success rate in litigation is low anddeclining (well below 30 percent).
– Only 0.2 percent of cases accounted for 56 percent of the value at stake; whereas
– About 66 percent of pending cases (each less than Rs. 10 lakhs) accounted for only 1.8percent of the value at stake.
Economic Survey (2017-18)
TEN NEW FACTS ON THE INDIANECONOMY
www.iasscore.in
Notes
2 Economic Survey (2017-18)
GS S
CO
RE
8. To re-ignite growth, raising investment is more important than raising saving
• Cross-country experience shows that growth slowdowns are preceded by investment slowdownsbut not necessarily by savings slowdowns may not.
9. Own direct tax collections by Indian states and local governments are significantly lower thanthose of their counterparts in other federal countries
• This share is low relative to the direct taxation powers they actually have.
10. The footprint of climate change is evident and extreme weather adversely impacts agriculturalyields
• The impact of weather is felt only with extreme temperature increases and rainfall deficiencies.
• This impact is twice as large in un-irrigated areas as in irrigated ones.

www.iasscore.inNotes
3Economic Survey (2017-18)
GS S
CO
RE
Terminologies
Economic Trough: A trough is the stage of the economy’s business cycle that marks the end of a periodof declining business activity and the transition to expansion. In general, the business cycle is said to gothrough expansion, then a peak, followed by contraction and then finally bottoming out with the trough.
Foreign Exchange Reserves: Foreign exchange reserves consist of any foreign currency held by a centralizedmonetary authority. Foreign exchange reserves include foreign banknotes, gold reserves or IMF funds.Foreign reserve assets serve a variety of purposes, but are primarily used to give the central governmentflexibility and resilience; should one or more currencies crash or become rapidly devalued, the centralbanking apparatus has holdings in other currencies to help them withstand such markets shocks.
Price-Earnings Ratio: (P/E ratio) is the ratio for valuing a company that measures its current share pricerelative to its per-share earnings. The price-earnings ratio is also sometimes known as the price multipleor the earnings multiple. The P/E ratio can be calculated as: Market Value per Share / Earnings per Share.
Twin Balance sheet Problem: The balance sheets of both public sector banks (PSBs) and some corporatehouses are in terrible shape and it has been seen as a major obstacle to investment and reviving growth.
Sovereign Ratings Upgrade: Moody’s Investors Services upgraded India’s sovereign ratings to Baa2 fromits lowest investment grade (Baa3). It would bring down the costs of overseas borrowing for Indiancompanies.
Index of Industrial production: Index of Industrial Production (IIP) measures the quantum of changesin the industrial production in an economy and captures the general level of industrial activity in thecountry. It is a composite indicator expressed in terms of an index number which measures the short termchanges in the volume of production of a basket of industrial products during a given period with respectto the base period. IIP is a short term indicator of industrial growth till the results from Annual Surveyof Industries and National Accounts Statistics are available. The base year is always given a value of 100.The current base year for the IIP series in India is 20011-12. So, if the current IIP reads as 116 it meansthat there has been 16% growth compared to the base year. Index of Industrial Production is compiledand published every month by Central Statistics Office (CSO) of the Ministry of Statistics and ProgrammeImplementation with a time lag of six weeks from the reference month.
STATE OF THE ECONOMY: AN ANALYTICALOVERVIEW AND OUTLOOK FOR POLICY
The chapter highlights developments in Indian economy in the recent past andidentifies priorities within macro-economic framework for short and medium term.The short term overview highlights key reforms undertaken in past year andidentifies action point going forward. The medium term overview provides sixpriorities to be addressed in medium term to return to 8 per cent growth rate.Chapter also tries to answer reasons for opposite behaviour of Indian economyvis-a-vis world economy and provides outlook for 2017-18 and 2018-19.
Context
Economic Survey (2017-18)
1

www.iasscore.in
Notes
4 Economic Survey (2017-18)
GS S
CO
RE
Gist of Chapter
Overview: Short Term
The past year has been marked by some major reforms. The transformational Goods and Services Tax
(GST) was launched in July 2017. At the same time, decisive action was taken to grasp the nettle of the
Twin Balance Sheet (TBS) challenge, arguably the festering, binding constraint on Indian growth prospects.
On the 4 R’s of the TBS—Recognition, Resolution, Recapitalization, and reforms—recognition was
advanced further, while major measures were taken to address two other R’s. The new Indian Bankruptcy
Code (IBC) has provided a resolution framework that will help corporates clean up their balance sheets
and reduce their debts. And in another critical move, the government announced a large recapitalization
package (about 1.2 percent of GDP) to strengthen the balance sheets of the public sector banks (PSBs).
As these twin reforms take hold, firms should finally be able to resume spending and banks to lend
especially to the critical, and currently-stressed sectors of infrastructure and manufacturing.
Macroeconomic developments this year have been marked by swings. In the first half, India’s economy
temporarily “decoupled,” decelerating as the rest of the world accelerated. The reason lay in the series
of actions and developments that buffeted the economy: demonetization, teething difficulties in the new
GST, high and rising real interest rates, an intensifying overhang from the TBS challenge, and sharp falls
in certain food prices that impacted agricultural incomes.
In the second half of the year, the economy witnessed robust signs of revival. Economic growth improved
as the shocks began to fade, corrective actions were taken, and the synchronous global economic recovery
boosted exports. Further, policy action improve the business climate and India jumped 30 spots on the
World Bank’s Ease of Doing Business rankings, while similar actions to liberalize the foreign direct
investment (FDI) regime helped in increasing flows by 20 percent. And the cumulative policy record
combined with brightening medium-term growth prospects led to a sovereign ratings upgrade, the first in
14 years. Over the coming year, the government will need to focus on:
• The 4 R’s, ensuring that the process of resolving the major indebted cases and recapitalizing the PSBs
is carried to a successful conclusion, while initiating reforms of the PSBs that will credibly shrink the
unviable ones and signal greater private sector participation in the future.
• The government will also need to stabilize GST implementation to remove uncertainty for exporters,
facilitate easier compliance, and expand the tax base;
• Privatize Air India; and
• Manage threats to macroeconomic stability, notably from persistently high oil prices, and sharp,
disruptive corrections to elevated asset prices.
Overview: The Medium Term
In the medium term, the following issues need to be addressed:
• First, India has created one of the most effective institutional mechanisms for cooperative federalism,
the GST Council. The “cooperative federalism technology” of the GST Council could be used to
create a common agricultural market, integrate fragmented and inefficient electricity markets, solve
inter-state water disputes, implement direct benefit transfers (DBT), make access to social benefits
portable across states, and combat air pollution.
www.iasscore.inNotes
5Economic Survey (2017-18)
GS S
CO
RE
• A major plank of government policy has been to rationalize government resources, redirecting themaway from subsidies towards public provision of essential private goods and services at low prices,especially to the poor. Government data suggests that progress has been made in providing bankaccounts, cooking gas, housing, power, and toilets (amongst others). The pace and magnitude of this
improvement will depend upon the extent to which increased physical availability/provision is convertedinto greater actual use: toilet building into toilet use, bank accounts into financial inclusion, cooking
gas connections into consistent gas offtake, and village electrification into extensive householdconnections.
• India has two underlying macro-economic vulnerabilities, its fiscal and current accounts, both ofwhich tend to deteriorate when oil prices rise.
• Overcoming the fiscal vulnerability requires breaking the inertia of the tax-GDP ratio. It is strikingthat the center’s tax-GDP ratio is no higher than it was in the 1980s, despite average economicgrowth of 6.5 percent, the most rapid in India’s history. The GST could help break this fiscal stasis,with positive spillovers for macro-economic stability. Also, there is evidence of a noteworthy increasein the number of Income tax filers in the demonetization-GST period. Overcoming the fiscalvulnerability also requires halting the steady conversion of contingent liabilities into actual ones(typically through the assumption of state discom debts and public sector bank recapitalization),which has impeded progress in debt reduction even in the face of solid growth.
• Addressing the current account vulnerability requires raising the trajectory of export growth. Here,an important lesson is the need for macro-economic policy to support the development strategy.Reviving manufacturing and making the sector internationally competitive have been the twin goalsof the Make in India program, underpinned by a strategy of reducing the costs of doing business.As a result, the share of manufacturing in GDP has improved slightly. However, the internationalcompetitiveness of manufacturing has not made great strides, reflected in the declining manufacturingexport-GDP ratio and manufacturing trade balance. Changes in price competitiveness through policyaction can make a major difference to export performance as highlighted in the government’s exportpackage for clothing. A policy implication is that the GST Council should conduct a comprehensivereview of embedded taxes arising from products left outside the GST (petroleum and electricity) andthose that arise from the GST itself (for example, input tax credits that get blocked because of “taxinversion,” whereby taxes further back in the chain are greater than those up the chain). This reviewshould lead to an expeditious elimination of these embedded export taxes, which could provide animportant boost to India’s manufacturing exports.
Box 1: The Increase in Income Taxpayers Post-Demonetization
One of the aims of demonetization and the Goods and Services Tax (GST) was to increase theformalization of the economy and bring more Indians into the income tax net, which includes onlyabout 59.3 million individual taxpayers (filers and those whose tax is deducted at source in 2015-16),equivalent to 24.7 percent of the estimated non-agricultural workforce. Has this happened and to whatextent?
At first blush, there does seem to have been a substantial increase in the number of new taxpayers.Between November 2016 – November 2017, 10.1 million filers were added compared with an averageof 6.2 million in the preceding six years. A rigorous assessment of the impact of demonetization,however, must account for the pre-existing trend growth in new tax filers. This translates roughly intoabout 1.8 million additional tax payers due to demonetization-cum-GST, representing 3 percent ofexisting taxpayers.

www.iasscore.in
Notes
6 Economic Survey (2017-18)
GS S
CO
RE
Box 2: Do Export Incentives Work? The Clothing Package of 2016
The apparel sector has immense potential to drive economic growth, increase employment, and empower
women in India. This is especially true as China’s share of global apparel exports has come down in
recent years. However, India has not, or not yet, capitalized on this opening. Instead, countries like
Vietnam and Bangladesh are quickly filling the space left by China.
Thus, in June 2016, the Cabinet announced a Rs. 6,000 crore package for the apparel sector. The largest
component of this package were rebates on state levies (ROSL) to offset indirect taxes levied by the
states (the VAT) that were embedded in exports. This ROSL was over and above the duty drawbacks
and other incentives (e.g., Merchandise Exports from India Scheme (MEIS)) that were given to offset
indirect taxes embedded in exports.
A key question is: did the package succeed? The analysis shows that:
• The package increased exports of readymade garments (RMG) made of man-made fibres (MMFs).
• The package did not have a statistically positive impact on RMG made of other fibres (silk,
cotton, etc.).
Finally, last year’s Survey (Volume 1, Chapter 2) identified the unfinished agenda in terms of three meta-
challenges: addressing inefficient redistribution; accelerating the limited progress in delivery of essential
public services, especially health and education; and correcting the ambivalence toward property rights,
the private sector, and price incentives. In the light of new analysis done for this Survey and of a broader
retrospective evaluation it is worth re-emphasizing one and adding two others.
• The issue that needs re-emphasizing is education; the education challenge cannot be addressed soon
enough given India’s weak learning outcomes from education system.
• The first new issue—yet in some ways the oldest issue—is agriculture. Successful economic and
social transformation has always happened against the background of rising agricultural productivity.
The government’s laudable objective of addressing agricultural stress and doubling farmers’ incomes
consequently requires radical follow-up action, including decisive efforts to bring science and technology
to farmers, replacing untargeted subsidies (power and fertiliser) by direct income support, and
dramatically extending irrigation via efficient drip and sprinkler technologies.
• The other issue is the challenge of employment. The lack of consistent, comprehensive, and current
data impedes a serious assessment. Even so, it is clear that providing India’s young and burgeoning
labour force with good, high productivity jobs will remain a pressing medium-term challenge. An
effective response will encompass multiple levers and strategies, above all creating a climate for rapid
economic growth on the strength of the only two truly sustainable engines—private investment and
exports.
Recent Developments
Understanding India’s (Temporary) “Decoupling”
Projecting India’s growth for 2018-19 requires understanding of what happened in 2017-18. The latter was
unusual, especially when set against the international context.

www.iasscore.inNotes
7Economic Survey (2017-18)
GS S
CO
RE
Until early 2016, India’s growth had been accelerating when growth in other countries was decelerating.But then the converse happened. The world economy embarked on a synchronous recovery, but India’sGDP growth—and indeed a number of other indicators such as industrial production, credit, andinvestment—decelerated. There are five reasons for this:
• First, India’s monetary conditions decoupled from the rest of the world. Until the middle of 2016,real policy interest rates were following the global trend downwards. Since then, the downward drifthas continued in most other countries, with rates falling. But in India, for the same period, averagereal interest rates increased. This tightening of monetary conditions contributed to the divergence ineconomic activity in two ways. First, it depressed consumption and investment compared to that inother countries. Second, it attracted capital inflows especially into debt instruments, which causedthe increase in demand for rupee and consequently rupee appreciates which causes dampening ofexports.
• The second and third factors were one-off policy actions: Demonetization and GST. Demonetizationtemporarily reduced demand and hampered production, especially in the informal sector, whichtransacts mainly in cash. On the other hand, GST was introduced, affecting supply chains.
• The fourth factor exerting a drag on the Indian economy was the TBS challenge. This has been a dragfor some time and its effects have cumulated as the non-performing assets have increased, thefinancial situation of stressed firms and banks have steadily worsened. This has reduced investmentand consequently economic activity and, hence growth.
• The final factor was oil prices increase since 2017. It is estimated that a $10 per barrel increase inthe price of oil reduces growth by 0.2-0.3 percentage points, increases WPI inflation by about 1.7percentage points and worsens the CAD by about $9-10 billion dollars.
Outlook For 2017-18
Economic Activity
The key question going forward is whether the economy has troughed, and if so at what pace it willrecover toward its medium term trend. High frequency indicators do suggest that a robust recovery istaking hold as reflected in a variety of indicators, including overall GVA, manufacturing GVA, the IIP,gross capital formation and exports.

www.iasscore.in
Notes
8 Economic Survey (2017-18)
GS S
CO
RE
Similarly, real non-food credit growth has rebounded to 4 percent in November 2017 on a year-on-yearbasis, while the squeeze on real credit to industry is abating. Moreover, the flow of non-bank resourcesto the corporate sector, such as bond market borrowing and lending by NBFCs, has increased, substitutingin part for weak bank credit. Rural demand, proxied by motor cycle sales, and auto sales, are recovering.
Perhaps most significantly, the behavior of manufacturing exports and imports in the second and thirdquarters of this fiscal year has started to reverse.
The re-acceleration of export growth to 13.6 percent in the third quarter of FY2018 and deceleration ofimport growth to 13.1 percent, in line with global trends, suggest that the demonetization and GST effectsare receding.
Services export and private remittances are also rebounding. On demonetization specifically, the cash-to-GDP ratio has stabilized. The stabilization also permits estimation of the impact of demonetization:about Rs. 2.8 lakh crores less cash (1.8 percent of GDP) and about Rs. 3.8 lakh crores less, highdenomination notes (2.5 percent of GDP).
All this said, while the direction of the indicators is positive, their level remains below potential. IIPgrowth (April-November 2017 over same period in the previous year) is 3.2 percent, real credit growthto industry is still in negative territory, and the growth in world trade remains less than half its level ofa decade ago. Moreover, even though the cost of equity has fallen to low levels, corporates have not raisedcommensurate amounts of capital, suggesting that their investment plans remain modest. In other words,the twin engines that propelled the economy’s take-off in the mid-2000s – exports and investment – arecontinuing to run below take-off speed.
Macro-economic Indicators
Headline inflation for the first time crossed the RBI’s 4 percent target in November, posting a rate of 5.2percent in December 2017. The recent upswing in inflation stems from rising global oil prices, unseasonalincrease in the prices of fruits and vegetables, and the 7th Pay Commission housing rent allowances,which mechanically increase inflation. Stripped of all these factors, underlying inflation has been increasingat a more modest pace, reaching 4.3 percent at end-December.
The current account deficit has also widened in 2017-18 and is expected to average about 1.5-2 percentof GDP for the year as a whole. Despite these developments, the overall external position remains solid.The current account deficit is well below the 3 percent of GDP threshold beyond which vulnerabilityemerges. Meanwhile, foreign exchange reserves have reached a record level of about $432 billion at end-December 2017, well above prudent norms.
Fiscal Developments
The fiscal deficit for the first eight months of 2017-18 reached 112 percent of the total for the year, farabove the 89 percent norm (average of last 5 years), largely because of a shortfall in non-tax revenue,reflecting reduced dividends from government agencies and enterprises. Expenditure also progressed at afast pace, reflecting the advancing of the budget cycle by a month which gave considerable leeway to thespending agencies to plan in advance and start implementation early in the financial year. Partiallyoffsetting these trends will be disinvestment receipts which are likely to exceed budget targets.
Reflecting largely fiscal developments at the center, a pause in general government fiscal consolidationrelative to 2016-17 cannot be ruled out. In addition, the measured deficit for 2017-18 will include Rs.80,000 crore (0.5 percent of GDP) in capital provided to public sector banks.
GST revenue collections are surprisingly robust given that these are early days of such a disruptivechange. Thus far, collections are running at a rate of Rs. 10.5 lakh crore (five-month average, annualized),this against the collection of Rs 9.7 lakh crores in 2016-17 of taxes subsumed by GST.

www.iasscore.inNotes
9Economic Survey (2017-18)
GS S
CO
RE
Government measures to curb black money and encourage tax formalization, including demonetizationand the GST, have increased personal income tax collections substantially (excluding the securitiestransactions tax). From about 2 percent of GDP between 2013-14 and 2015-16, they are likely to riseto 2.3 percent of GDP in 2017-18, a historic high.
Outlook for 2018-19
If macro-economic stability is kept under control, the ongoing reforms are stabilized, and the worldeconomy remains buoyant as today, growth could start recovering towards its medium term economicpotential of at least 8 percent.
• The acceleration of global growth should in principle provide a solid boost to export demand.Certainly, it has done so in the past, particularly in the mid-2000s when the booming global economyallowed India to increase its exports by more than 26 percent per annum. This time, the exportresponse to world growth has been in line with the long-term average, but below the response in themid-2000s. Perhaps it is only a matter of time until exports start to grow at a healthy rate.
• Private investment seems poised to rebound, as many of the factors exerting a drag on growth overthe past year finally ease off. Translating this potential into an actual investment rebound will dependon the resolution and recapitalization process. If this process moves ahead expeditiously, stressedfirms will be put in the hands of stronger ownership, allowing them to resume spending.
• Consumption demand, meanwhile, will encounter different tugs. On the positive side, it will behelped by the likely reduction in real interest rates in 2018-19 compared to the 2017-18 average. Atthe same time, average oil prices are forecast by the IMF to be about 12 percent higher in 2018-19,which will crimp real incomes and spending. And if higher oil prices requires tighter monetary policyto meet the inflation target, real interest rates could exert a drag on consumption.
Putting all these factors together, a pick-up in growth to between 7 and 7.5 percent in 2018-19 can beforecasted, re-instating India as the world’s fastest growing major economy. This forecast is subject toupside potential and downside risks.
• The biggest source of upside potential will be exports. If the relationship between India’s exports andworld growth returns to that in the boom phase, then that could add another ½ percentage point togrowth.
• Another key determinant of growth will be the implementation of the IBC process. Here timelinesin resolution and acceptance of the IBC solutions must be a priority to kick-start private investment.
• Persistently high oil prices (at current levels) remain a key risk. They would affect inflation, thecurrent account, the fiscal position and growth, and force macro-economic policies to be tighter thanotherwise.

www.iasscore.in
Not
es
10 Economic Survey (2017-18)
GS S
CO
RETerminologies
• Composite Scheme under GST: Taxpayers under this scheme pay a small tax (1 percent, 2 percent
or 5 percent) on their turnover and are not eligible for input tax credits. This set up minimizes their
administrative burden, but also makes it difficult for them to sell to larger firms, which would not
be able to secure input tax credits on such purchases. The turnover limit for the composition scheme
was changed from Rs.1 crore to Rs. 1.2 crore (in the October 2017 GST Council meeting) to Rs.
1.5 crore (in the November 2017 GST Council meeting).
• Revenue Neutral Rate: It is the tax rate that allows the government to receive the same amount of
money despite of changes in tax laws.
• Gross State Domestic Product: Gross State Domestic Product (GSDP) is defined as a measure, in
monetary terms, of the volume of all goods and services produced within the boundaries of the
State during a given period of time, accounted without duplication.
• Employees’ Provident Fund Organisation: The Employees’ Provident Fund Organisation is an
organization tasked to assist the Central Board of Trustees, a statutory body formed by the Employees’
Provident Fund and Miscellaneous Provisions Act, 1952 and is under the administrative control of
the Ministry of Labour and Employment, Government of India.
• National Sample Survey Office: The National Sample Survey Office (NSSO) headed by a Director
General is responsible for conducting large scale sample surveys in diverse fields on All India basis.
Primarily data are collected through nation-wide household surveys on various socio-economic subjects,
Annual Survey of Industries (ASI), etc. Besides these surveys, NSSO collects data on rural and urban
prices and plays a significant role in the improvement of crop statistics through supervision of the
area enumeration and crop estimation surveys of the State agencies. It also maintains a frame of
urban area units for use in sample surveys in urban areas.
Gist of Chapter
The chapter provides new insights; the topic wise list of new findings is given below:
Taxpayers
A NEW, EXCITING BIRD'S EYE VIEW OF THEINDIAN ECONOMY THROUGH THE GST
As an information repository, the Goods and Services Tax (GST) embodies andheralds a radical alteration and enlargement in the understanding of the Indianeconomy. The GST is filed online, and data collected from it give new insightsabout Indian economy. These insights shall help government to form policiesmore appropriately. This chapter is a mere sampler, giving a hint of the insightsthat analysis of the GST will be able to provide in the future.
Context
Economic Survey (2017-18)
2
www.iasscore.inN
otes
11Economic Survey (2017-18)
GS S
CO
RE
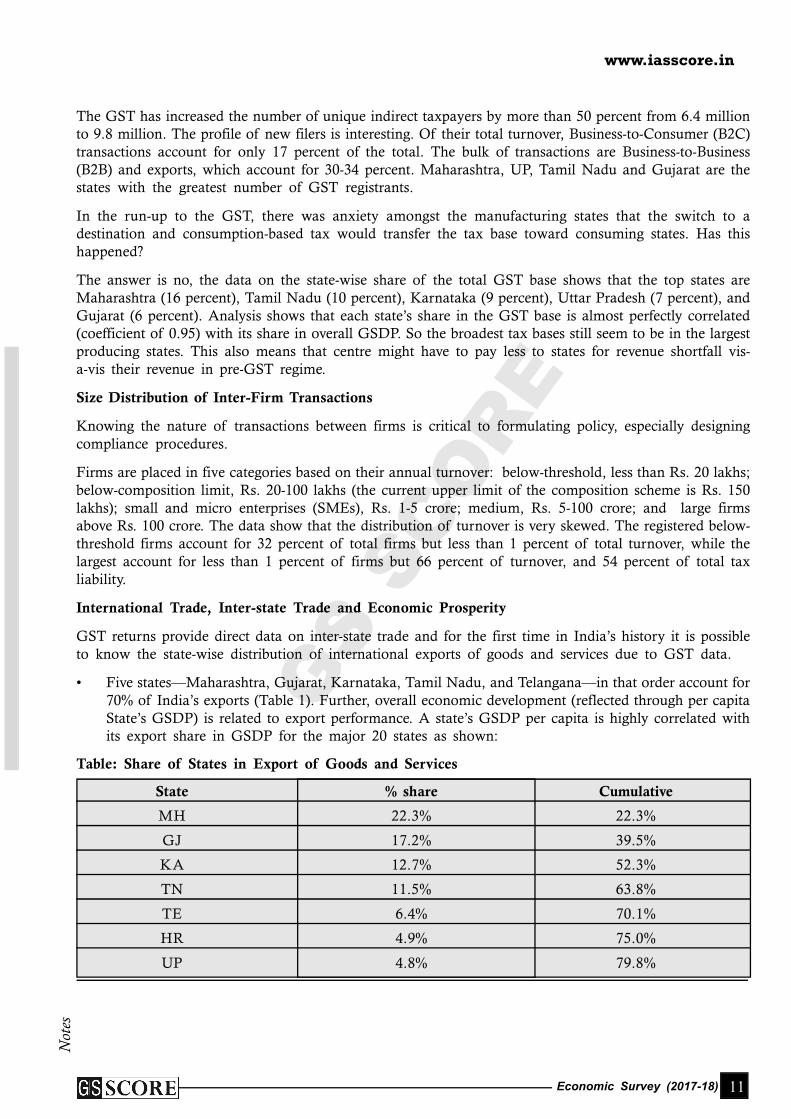
The GST has increased the number of unique indirect taxpayers by more than 50 percent from 6.4 millionto 9.8 million. The profile of new filers is interesting. Of their total turnover, Business-to-Consumer (B2C)transactions account for only 17 percent of the total. The bulk of transactions are Business-to-Business(B2B) and exports, which account for 30-34 percent. Maharashtra, UP, Tamil Nadu and Gujarat are thestates with the greatest number of GST registrants.
In the run-up to the GST, there was anxiety amongst the manufacturing states that the switch to adestination and consumption-based tax would transfer the tax base toward consuming states. Has thishappened?
The answer is no, the data on the state-wise share of the total GST base shows that the top states areMaharashtra (16 percent), Tamil Nadu (10 percent), Karnataka (9 percent), Uttar Pradesh (7 percent), andGujarat (6 percent). Analysis shows that each state’s share in the GST base is almost perfectly correlated(coefficient of 0.95) with its share in overall GSDP. So the broadest tax bases still seem to be in the largestproducing states. This also means that centre might have to pay less to states for revenue shortfall vis-a-vis their revenue in pre-GST regime.
Size Distribution of Inter-Firm Transactions
Knowing the nature of transactions between firms is critical to formulating policy, especially designingcompliance procedures.
Firms are placed in five categories based on their annual turnover: below-threshold, less than Rs. 20 lakhs;below-composition limit, Rs. 20-100 lakhs (the current upper limit of the composition scheme is Rs. 150lakhs); small and micro enterprises (SMEs), Rs. 1-5 crore; medium, Rs. 5-100 crore; and large firmsabove Rs. 100 crore. The data show that the distribution of turnover is very skewed. The registered below-threshold firms account for 32 percent of total firms but less than 1 percent of total turnover, while thelargest account for less than 1 percent of firms but 66 percent of turnover, and 54 percent of total taxliability.
International Trade, Inter-state Trade and Economic Prosperity
GST returns provide direct data on inter-state trade and for the first time in India’s history it is possibleto know the state-wise distribution of international exports of goods and services due to GST data.
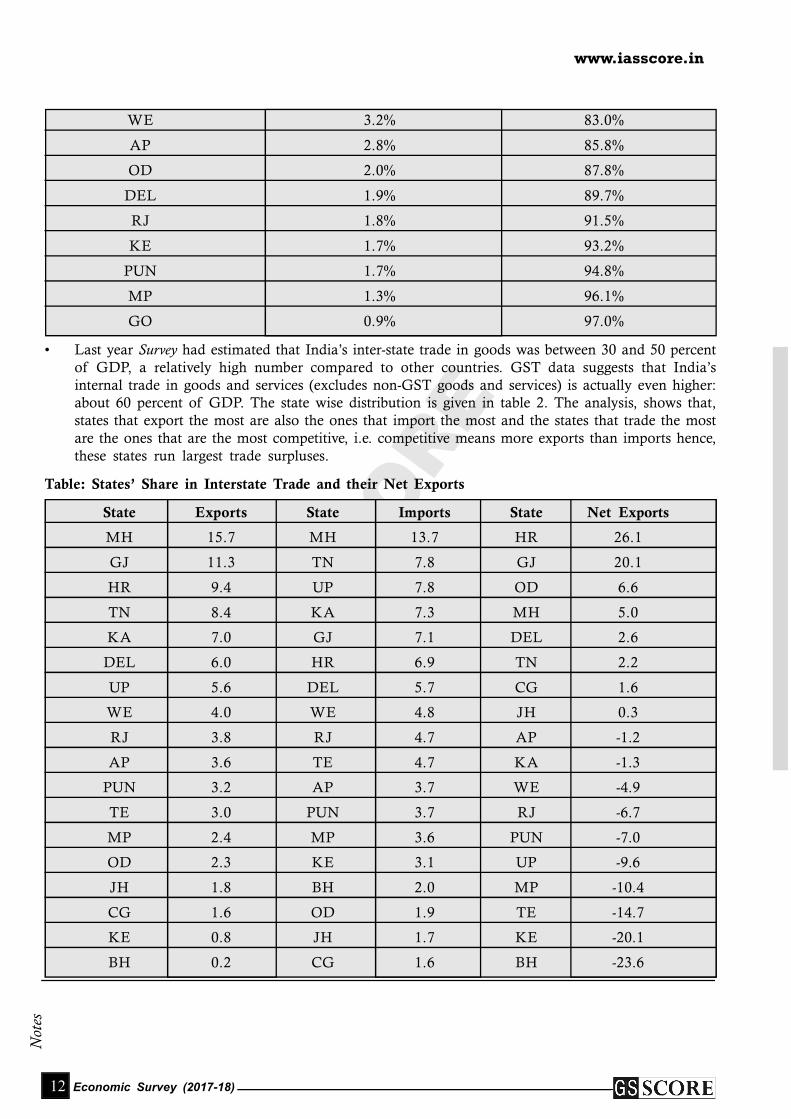
• Five states—Maharashtra, Gujarat, Karnataka, Tamil Nadu, and Telangana—in that order account for70% of India’s exports (Table 1). Further, overall economic development (reflected through per capitaState’s GSDP) is related to export performance. A state’s GSDP per capita is highly correlated withits export share in GSDP for the major 20 states as shown:
Table: Share of States in Export of Goods and Services
State % share Cumulative
MH 22.3% 22.3%
GJ 17.2% 39.5%
KA 12.7% 52.3%
TN 11.5% 63.8%
TE 6.4% 70.1%
HR 4.9% 75.0%
UP 4.8% 79.8%
www.iasscore.in
Not
es
12 Economic Survey (2017-18)
GS S
CO
RE
WE 3.2% 83.0%
AP 2.8% 85.8%
OD 2.0% 87.8%
DEL 1.9% 89.7%
RJ 1.8% 91.5%
KE 1.7% 93.2%
PUN 1.7% 94.8%
MP 1.3% 96.1%
GO 0.9% 97.0%
• Last year Survey had estimated that India’s inter-state trade in goods was between 30 and 50 percentof GDP, a relatively high number compared to other countries. GST data suggests that India’sinternal trade in goods and services (excludes non-GST goods and services) is actually even higher:about 60 percent of GDP. The state wise distribution is given in table 2. The analysis, shows that,states that export the most are also the ones that import the most and the states that trade the mostare the ones that are the most competitive, i.e. competitive means more exports than imports hence,these states run largest trade surpluses.
Table: States’ Share in Interstate Trade and their Net Exports
State Exports State Imports State Net Exports
MH 15.7 MH 13.7 HR 26.1
GJ 11.3 TN 7.8 GJ 20.1
HR 9.4 UP 7.8 OD 6.6
TN 8.4 KA 7.3 MH 5.0
KA 7.0 GJ 7.1 DEL 2.6
DEL 6.0 HR 6.9 TN 2.2
UP 5.6 DEL 5.7 CG 1.6
WE 4.0 WE 4.8 JH 0.3
RJ 3.8 RJ 4.7 AP -1.2
AP 3.6 TE 4.7 KA -1.3
PUN 3.2 AP 3.7 WE -4.9
TE 3.0 PUN 3.7 RJ -6.7
MP 2.4 MP 3.6 PUN -7.0
OD 2.3 KE 3.1 UP -9.6
JH 1.8 BH 2.0 MP -10.4
CG 1.6 OD 1.9 TE -14.7
KE 0.8 JH 1.7 KE -20.1
BH 0.2 CG 1.6 BH -23.6
www.iasscore.inN
otes
13Economic Survey (2017-18)
GS S
CO
RE
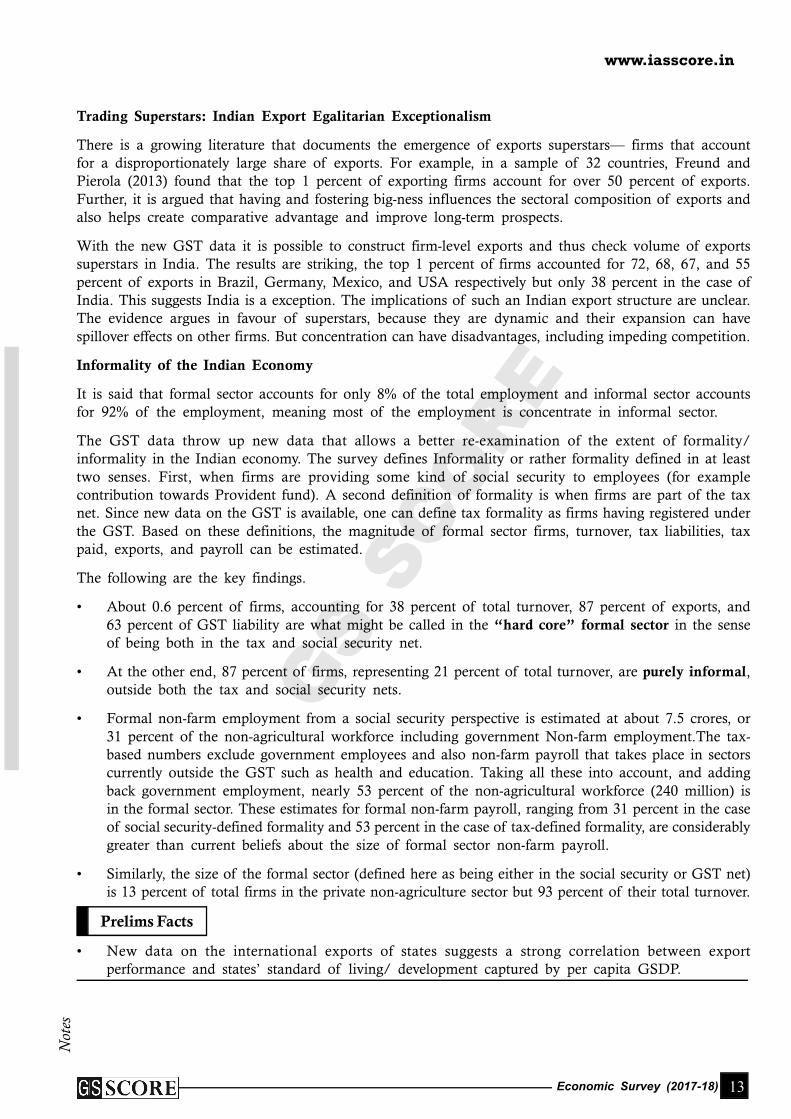
Trading Superstars: Indian Export Egalitarian Exceptionalism
There is a growing literature that documents the emergence of exports superstars— firms that accountfor a disproportionately large share of exports. For example, in a sample of 32 countries, Freund andPierola (2013) found that the top 1 percent of exporting firms account for over 50 percent of exports.Further, it is argued that having and fostering big-ness influences the sectoral composition of exports andalso helps create comparative advantage and improve long-term prospects.
With the new GST data it is possible to construct firm-level exports and thus check volume of exportssuperstars in India. The results are striking, the top 1 percent of firms accounted for 72, 68, 67, and 55percent of exports in Brazil, Germany, Mexico, and USA respectively but only 38 percent in the case ofIndia. This suggests India is a exception. The implications of such an Indian export structure are unclear.The evidence argues in favour of superstars, because they are dynamic and their expansion can havespillover effects on other firms. But concentration can have disadvantages, including impeding competition.
Informality of the Indian Economy
It is said that formal sector accounts for only 8% of the total employment and informal sector accountsfor 92% of the employment, meaning most of the employment is concentrate in informal sector.
The GST data throw up new data that allows a better re-examination of the extent of formality/informality in the Indian economy. The survey defines Informality or rather formality defined in at leasttwo senses. First, when firms are providing some kind of social security to employees (for examplecontribution towards Provident fund). A second definition of formality is when firms are part of the taxnet. Since new data on the GST is available, one can define tax formality as firms having registered underthe GST. Based on these definitions, the magnitude of formal sector firms, turnover, tax liabilities, taxpaid, exports, and payroll can be estimated.
The following are the key findings.
• About 0.6 percent of firms, accounting for 38 percent of total turnover, 87 percent of exports, and63 percent of GST liability are what might be called in the “hard core” formal sector in the senseof being both in the tax and social security net.
• At the other end, 87 percent of firms, representing 21 percent of total turnover, are purely informal,outside both the tax and social security nets.
• Formal non-farm employment from a social security perspective is estimated at about 7.5 crores, or31 percent of the non-agricultural workforce including government Non-farm employment.The tax-based numbers exclude government employees and also non-farm payroll that takes place in sectorscurrently outside the GST such as health and education. Taking all these into account, and addingback government employment, nearly 53 percent of the non-agricultural workforce (240 million) isin the formal sector. These estimates for formal non-farm payroll, ranging from 31 percent in the caseof social security-defined formality and 53 percent in the case of tax-defined formality, are considerablygreater than current beliefs about the size of formal sector non-farm payroll.
• Similarly, the size of the formal sector (defined here as being either in the social security or GST net)is 13 percent of total firms in the private non-agriculture sector but 93 percent of their total turnover.
Prelims Facts
• New data on the international exports of states suggests a strong correlation between exportperformance and states’ standard of living/ development captured by per capita GSDP.
www.iasscore.in
Not
es
14 Economic Survey (2017-18)
GS S
CO
RE
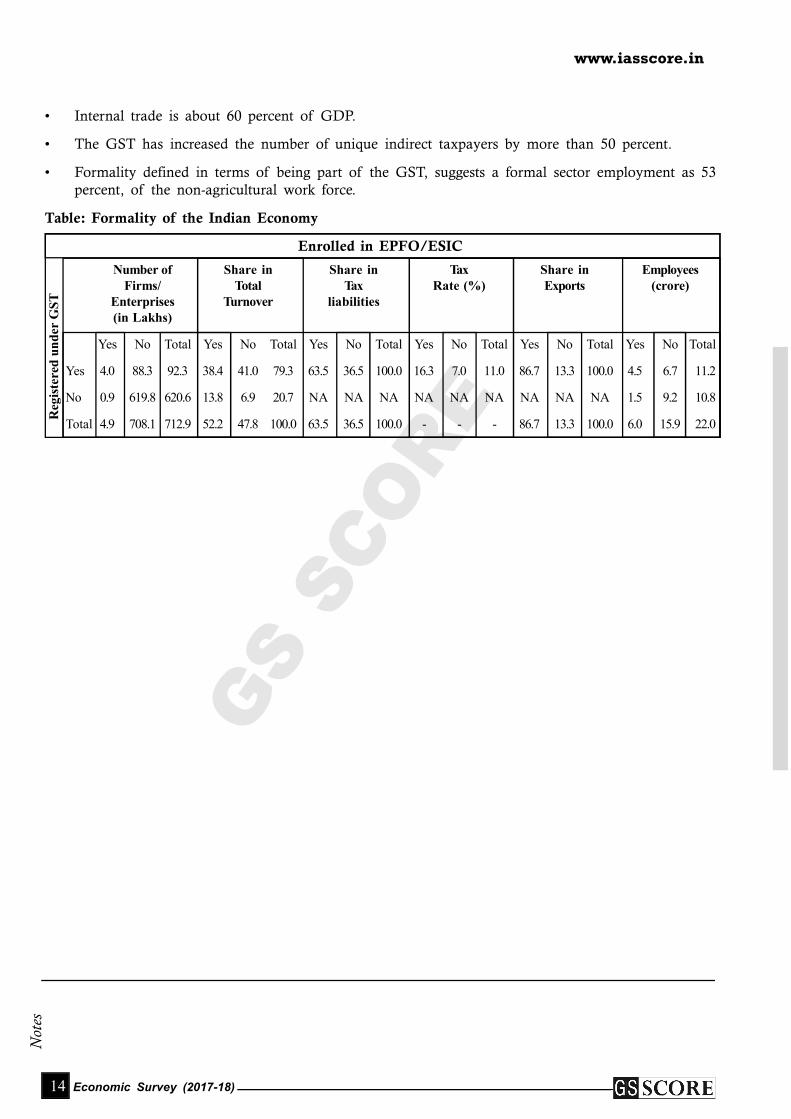
• Internal trade is about 60 percent of GDP.
• The GST has increased the number of unique indirect taxpayers by more than 50 percent.
• Formality defined in terms of being part of the GST, suggests a formal sector employment as 53percent, of the non-agricultural work force.
Table: Formality of the Indian Economy
Enrolled in EPFO/ESIC
Number of Share in Share in Tax Share in EmployeesFirms/ Total Tax Rate (%) Exports (crore)
Enterprises Turnover liabilities(in Lakhs)
Yes No Total Yes No Total Yes No Total Yes No Total Yes No Total Yes No Total
Yes 4.0 88.3 92.3 38.4 41.0 79.3 63.5 36.5 100.0 16.3 7.0 11.0 86.7 13.3 100.0 4.5 6.7 11.2
No 0.9 619.8 620.6 13.8 6.9 20.7 NA NA NA NA NA NA NA NA NA 1.5 9.2 10.8
Total 4.9 708.1 712.9 52.2 47.8 100.0 63.5 36.5 100.0 - - - 86.7 13.3 100.0 6.0 15.9 22.0
Reg
iste
red
un
der
GS
T

www.iasscore.inN
otes
15Economic Survey (2017-18)
GS S
CO
RE
Terminologies
• Gross fixed capital formation: Gross fixed capital formation (GFCF) refers to the net increase in
physical assets (investment minus disposals) within the measurement period. Gross fixed capital
formation includes purchases of plant, machinery, and equipment; the construction of infrastructure
(roads and railways, schools and hospitals, private residential dwellings, industrial buildings, etc.) and
land improvement.
• Growth: Growth in economic terms corresponds to the increase in GDP (gross domestic production).
• Gross domestic saving: Gross Domestic Saving is GDP minus final consumption expenditure. It is
expressed as a percentage of GDP.
• Shortfall: Difference between the average of investment (saving) in the slowdown year and subsequent
two years; and the average of the previous five years shows shortfall.
• Slowdown episode: If there are two or more consecutive slowdown years.
• Balance-sheet: A statement of the assets, liabilities, and capital of a business or other organization
at a particular point in time, detailing the balance of income and expenditure over the preceding
period.
INVESTMENT AND SAVING SLOWDOWNS ANDRECOVERIES:CROSS-COUNTRY INSIGHTS
FOR INDIA
India has witnessed historic high of investment and savings in year 2000s. Butit is now followed by gradual decline. Slowdown of investment and saving isstill going on. In this chapter we will be able to see cross-country experienceto study the pattern of investment and saving slowdowns as well as recoveries,in order to obtain Policy lessons for India.
In this regards some findings are made. One finding is that investmentslowdowns have an impact on growth. But it had been also observed thatsavings slowdown has not affected substantially on growth.
Another is that recoveries from investment slowdowns, especially thoseassociated with balance sheet difficulties tend to be slow. Notably, some degreeof automatic bounce-back is absent so that the deeper the slowdown, theslower and shallower the recovery.
The policy conclusion is urgent prioritization of investment revival to arrestmore lasting growth impacts, as the government has done with plans forresolution of bad debts and recapitalization of public sector banks.
Context
Economic Survey (2017-18)
3

www.iasscore.in
Not
es
16 Economic Survey (2017-18)
GS S
CO
RE
Gist of Chapter
Introduction
This chapter looks in to the analysis of investment and savings slowdowns in India. It also looks forproblem associated with recoveries.
Since 2010, discussions of India’s growth have centered on one simple question: how to achieve 8-10percent growth? To solve this problem government has implemented many structural reforms in recent years.The government has taken various steps for boosting growth, controlling inflation and curbing corruption.
With some reforms, it was believed that domestic saving and investment will soon start to accelerate. Butneither saving nor investment has shown accelerated growth. The ratio of gross fixed capital formationto GDP climbed from 26.5 percent in 2003, reached a peak of 35.6 percent in 2007, and then slid backto 26.4 percent in 2017.
The ratio of domestic saving to GDP has registered a similar evolution, rising from 29.2 percent in 2003to a peak of 38.3 percent in 2007, 29 percent in 2016.
Such sharp swings in investment and saving rates have never occurred in India’s; nor does other countryseem to have gone through such a large investment boom and bust.
Which sectors are responsible for the saving/investment decline in India?
Answer to this question is- Essentially, private investment and household/government saving. Private investmentaccounts for 5 percentage points out of the 6.3 percentage point overallinvestment decline over 2007-08 and2015-16. The fall in saving, by about 8 percentage points over the same period, has been driven almostequally by a fall in household and public saving. The fall in household saving has in turn been driven by a fallin physical saving, partly offset by an increase in the holding of financial assets. Within the latter, there hasbeen a shift from currency and bank deposits towards market instruments (shares and debentures).
Identifying Investment and Saving Slowdowns
Before going in to details;Investment and saving slowdowns are defined using a specific set of conditions.These conditions are-
1. Shortfall, shortfall is difference between (a) the average of investment (saving) in the slowdown yearand subsequent two years; and (b) the average of the previous five years. (“Slowdown year” is definedas one where the shortfall in that year exceeds a certain threshold).
Slowdownepisode = If there are two or more consecutive slowdown years.
2. The average investment rate for the 5 years prior to the slowdown year is at least 15 percent of GDP.
Until recently, India had not experienced either type of slowdown (investment and saving slowdowns).Currentslowdown – in which both investment and saving have slumped – is the first in India’s history. The investmentslowdown started in 2012 , subsequently intensified , that for 2016. With the slowdown now having lastedat least five years, it has already surpassed the typical duration of slowdown episodes; it was continuedthrough 2017, reached the six-year duration recorded in the exceptionally severe cases. Yet because theinvestment decline has been so gradual, the magnitude of the shortfall so far is relatively less severe – it remainsa moderate 21 percentage points, well under the average magnitude.
Saving Versus Investment
From above discussion it has been clear that saving and investment had slumped simultaneously. Thisprompt us to ask question should policies that boost investment be given greater priority over those thatsaving? Answer to this question often prescribed is that both problems need to be tackled simultaneously.
www.iasscore.inN
otes
17Economic Survey (2017-18)
GS S
CO
RE
In deeper analysis about savings it has been found that countries experiencing positive savings do notnecessarily experience sustained growth increases. Rather, countries that experience growth transitionseventually see sustained higher rates of saving.
While studying investment it has been noted that, a one percentage point fall in investment rate is expected todent growth by 0.4-0.7 percentage points. These results are robust to different time periods and specifications.The relationship of saving with growth not only remains insignificant but turns mildly negative. Thus fallin savings does not affect very harshly as fall in investment do. So let us now go deep in to investmentanalysis.
Not only are investment episodes followed by slower growth (unlike saving episodes), this is also true of‘pure’episodes of investment slowdowns, i.e. those not accompanied by slowdown in saving. Afurtherclassification of the investment slowdowns can be attempted: those that are driven primarily by a fall inprivate investment and those that are not. Data on the private investment component of aggregate gross fixedcapital formation is available from the WDI database. It is clear that three-fifths(60%) of the episodes arecaused by a fall in private investment.
Understanding ‘India-Type’ Investment Slowdowns
India’s investment slowdown is relatively moderate in magnitude. Furthermore, it has a specific nature,in that it is a balance sheet related slowdown. In other words, many companies have had to curtail theirinvestments because their finances are stressed, as the investments they undertook during the boom havenot generated enough revenues to allow them to service the debts that they have incurred.
Conclusion
As discussed in context sole motto of undergoing these studies is to find out policy lessons for India. Thenotion that growth is constrained by saving has a long and illustrious pedigree. As we concluded it is clearthat investment slowdowns are more detrimental to growth than saving slowdowns. So, policy priorities overthe shortrun must focus on reviving investment. Mobilizing saving, for example via attempts to unearthblackmoney and encouraging the conversion of gold into financial saving or even courting foreign savingare, important but perhaps not as urgent as reviving investment. Any way Share of financial saving is alreadyrising in aggregate household savings so we do not have to worry about savings as we must in case ofinvestment.
Important question one must ask is: how will the investment slowdown reverse, so that India can regain 8-10percent growth?
India’s investment decline seems particularly difficult to reverse, partly because it stems from balance sheetstressand partly because it has been usually large. Cross-country evidence indicates a notable absence ofautomatic bounce-backs from investment slowdowns. The deeper the slowdown, the slower and shallowerthe recovery. At the same time, it remains true that some countries in similar circumstances have hadfairly strong recoveries, suggesting that policy action can decisively improve the outlook. So there is clearand urgent policy agenda which the government has launched;
1) With the step-up in public investment since 2015-16; and now, given the constraints on public investmentwith policies to decisively resolve the Twin balance sheet challenge.
2) These steps will have to be followed up, along with complementary measures: easing the costs ofdoing business further, and creating a clear, transparent, and stable tax and regulatory environment.
3) In addition, creating a conducive environment for small and medium industries to prosper and invest willhelp revive private investment.
www.iasscore.in
Not
es
18 Economic Survey (2017-18)
GS S
CO
RE
The focus of investment-incentivizing policies has to be on the big and small alike. The‘animal spirits’need to be conjured back.
Prelims Facts
1. Gross fixed capital formation includes purchases of plant, machinery, and equipment; the constructionof infrastructure (roads and railways, schools and hospitals, private residential dwellings, industrialbuildings, etc.) and land improvement.
2. GDP = Market value all final goods & services produced within country for a given time period.GDP @ Market Price GDP @ Factor cost + Taxes – Subsidies.
3. Gross domestic saving is the Gross Domestic Product minus final consumption.The saved money iseither kept with the public or is invested back. When the money is invested back, we come to thefigures known as Capital Formation.
4. Various investment models:
• Public Private Partnership Model: PPP means combining the best benefit from both public andprivate investments.
• Domestic Investment Model – It can be from Public, Private or PPP.Foreign Investment Model– It can be 100% FDI or Foreign-Domestic Mix. Sector Specific Investment Models (In SEZ orMIZ etc). Cluster Investment Model (Eg: Food Processing Industries).
5. Animal spirits: Animal Spirits is a term used by John Maynard Keynes to explain why decisions aremade even in times of uncertainty. This is a term that refers to the emotions and instincts that guidethe behaviour of investors and consumers in a market economy.
6. Ratio of gross fixed capital formation to GDP was 26.4 percent in 2017.
7. The ratio of domestic saving to GDP was 29 percent in 2016.
www.iasscore.inN
otes
19Economic Survey (2017-18)
GS S
CO
RE
Terminologies
• Fiscal Federalism: Fiscal federalism is defined as financial relations between units of governments ina federal government system. Fiscal federalism is part of broader public finance discipline. The termwas introduced by the German-born American economist Richard Musgrave in 1959. Fiscal federalismdeals with the division of governmental functions and financial relations among levels of government.
• Fiscal decentralization: Fiscal decentralization (FD) means devolution of power and responsibilities ofnational (central), government towards sub-national (local), governments. Attaining economic efficiency,equality and macroeconomic stability can be considered among the main issues of concern for FD.
• Low Level Equilibrium Trap: The theory of Low Level Equilibrium Trap has been developed by R.R.Nelson for underdeveloped countries. It states that when per capita income increases above theminimum specific level, population tends to increase. But when the growth rate reaches an upperphysical limit as the per capita income increases, the growth starts declining.
• Disposable Personal Income: Disposable personal income (DPI) is the amount of money that householdshave available for spending and saving after income taxes have been accounted for. Disposable personalincome is often monitored as one of the many key economic indicators used to gauge the overallstate of the economy.
Gist of Chapter
Introduction
Taxation is not just a vehicle for raising state revenue. It can also be critically important for economicand political development. There is a social contract between citizens and the state. “The state’s role is tocreate the conditions for prosperity for all by providing essential services and protecting the less well-off via redistribution.The citizen’s part of the contract is to hold the state accountable when it fails to honor that contract.”
RECONCILING FISCAL FEDERALISMANDACCOUNTABILITY: IS THERE A LOW
EQUILIBRIUM TRAP?
Today we need fiscal accountability which will ensures, a low and decliningdependence of states (2nd tier) and Panchayat (3rd tier) on devolved resourcesand a high and rising share of direct taxes in total taxes.
India's second and third tiers of government tend to under-perform relative tothese standards. The extent of tax and functional devolution to these tiers isone possible explanation. However, one key finding is that these tiers under-collect direct taxes. (Even though they have related powers).
Whether this could lead to a LOW EQUILIBRIUM TRAP of weak direct taxcollection leading to inadequate service delivery provision, and accountability?In this chapter we will try to find out answers to such questions.
Context
Economic Survey (2017-18)
4

www.iasscore.in
Not
es
20 Economic Survey (2017-18)
GS S
CO
RE
But when citizens fail to pay taxes they lose their interest to hold state accountable. If a citizen does notpay, he becomes a free rider (using the service without paying), and cannot complain if the state providesa poor quality service. Only, if he pays and uses the service then he will try to hold the state accountable.Taxation is the economic glue that binds citizens to the state in a necessary two-way relationship.
But does this glue rely on taxation (direct taxation in particular)?
Direct taxes are felt more by the taxpayers. Direct taxes feel more like expropriation (Taking out of anowner’s hands, especially taking property by public authority)because they reduces citizens’ disposableincome. With indirect taxes, citizens are burdened but that sense is leavened to the extent that citizensfeel they are exercising choice. Thus, those who pay direct taxes take direct responsibility to hold stateresponsible to provide necessary services. This is the glue we were talking about in preceding para, thatbinds citizens to the state in a necessary two-way relationship.
Direct Taxation at Various Levels
1. At Centre Level: (i) Economic and political development has been associated with a rising share ofdirect taxes in total taxes. (ii) Advanced countries collect a substantially higher proportion of theirtaxes as direct taxes in comparision to emerging markets. (iii) India has the lowest share of direct taxesin total taxes.
2. At State Level: (i) Important legal argument is that resources received by the states as part ofsuccessive Finance Commission verdicts are not “devolved” resources but shared resources. (ii)Center is merely collecting the taxes in the divisible pool on behalf of the states, and sharing it withthem. (iii) Resources from the divisible pool to the states have the strong whiff of devolution.
3. At the Local Level:
a) Rural Local Governments (RLGs), reliance on own resources are just 6 per cent (40 percent forthird-tier governments in Brazil and Germany). And Panchayats raise about 4 percent of theiroverall resource envelope in the form of direct taxes. (19 and 26 percent in Brazil and Germanyrespectively).
b) India’s Urban Local Governments (ULGs) are much closer to international norms. Their ownrevenues as a share of total revenues are actually higher than Brazil and Germany, while theirdirect tax share (about 18 percent of total revenues) is only marginally lower than Brazil (19percent) and somewhat lower than Germany (26 percent).
This is evidence that ULGs have emerged more fiscally empowered than RLGs so far in India.(Considered only selected large cities, for which data are available, and which may have largerown resource bases than smaller ones.)
About local governments
The famous 73rd amendment to the Constitution (1992) recognized Panchayats as institutions of self-government. The simultaneous 74th amendment bestowed the same status on urban local governments.RLGs or Panchayats were mandated to have three tiers (at the district, intermediate and village levels)in states with population of over 20 lakh. States were mandated to devolve such functions and authoritiesto RLGs which would enable them to function as institutions of self-governance. Illustratively, theConstitution listed 29 matters which could be the focus of their governance, such as agriculture and landreforms, minor irrigation, small scale industries, rural communication, drinking water, poverty alleviationprogrammes. States are mandate to constitute a State Finance Commission (SFC) to determine the shareof their financial resources going to the local tiers, analogous to the Finance Commissions at the unionlevel.

www.iasscore.inN
otes
21Economic Survey (2017-18)
GS S
CO
RE
Expenditure patterns of different tiers of government
(i) The central and state governments spend on an average 15-20 times more per capita than do RLGs.ULGs spend about 3 times more. More importantly, this gap has persisted over time despite percapita spending by RLGs increasing almost four-fold since 2010-11.
(ii) ULGs generate about 44 per cent of their total revenue from own sources.
(iii) RLGs, in contrast, rely overwhelmingly (about 95 percent) on devolution.
(iv) Given the overwhelming reliance on devolved funds which, to a large extent, are tied to sectors andschemes, it is not surprising that gram Panchayats (GP) spend the bulk of such funds on earmarkedareas, such as roads, other basic services, sanitation and community assets. The spending on purelylocal public goods like irrigation is not a priority out of such funds.
Some issues related with local governance
(i) In many states, RLGs and ULGs have not been devolved enough taxation powers. SuccessiveDevolution Reports of the Ministry of Panchayati Raj (MoPR) show that the share of revenuesassigned to local governments in many states are much less vis-à-vis expenditure assignments.
(ii) Even though most states have constituted State Finance Commission SFCs, very few seem to haveaccepted their recommendations. As per the latest MoPR Devolution Report (2015-16) the percentageof acceptance of such recommendations varies from as low as 11 percent in Karnataka, to above50 percent in West Bengal, Andhra Pradesh and Rajasthan, to full acceptance in Kerala.
Why is revenue collection, especially from direct taxes, so poor?
RLGs collect less than 10 percent of their total resources from own revenues and ULGs around 45percent. States have not devolved enough taxation powers to the Panchayats. For example, the permissibletaxes for Panchayats include property and entertainment taxes but not land taxes or tolls on roads (except
www.iasscore.in
Not
es
22 Economic Survey (2017-18)
GS S
CO
RE
local Panchayat roads). The property taxes collected at the second and third tiers of government are (a)land tax assessed and collected at the state level; and (b) building tax, including property/house tax,collected at the municipality (ULG) and Gram Panchayat (RLG) levels. So the revenue collection remainslow at RLG level. Even though local governance has some power to collect taxes, they do not haveenough infrastructures to collect it, which is main reason why direct revenue collection is so poor.
Conclusion: A Low Equilibrium Trap?
The status quo can be an equilibrium desired by all actors with higher tiers (both Centre and states) usingtheir devolution powers to control and influence lower levels; and the latter, unable and unwilling to taxtheir proximate citizens, need outside resources even if they are not always untied. But this is a low-equilibrium, perhaps even a trap.
Fiscal model of the states and third tier institutions could forever be based on outside resources which—like foreign aid and natural resources or other forms of ‘redistributive resource transfers’ — come withweak accountability mechanisms and weak own resource generation capacity.
Redistributive Resource Transfers’ (RRT) to a state is defined as gross devolution to the state adjustedfor the respective state’s share in aggregate gross domestic product.
RRT can be defined as the gross devolution net of the amount the state would have received as per itscontribution in the country-wide fiscal effort measured by the state’s share in aggregate own tax revenue.According to the Survey, the top 10 recipients are: Sikkim, Arunachal Pradesh, Mizoram, Nagaland,Manipur, Meghalaya, Tripura, Jammu and Kashmir, Himachal Pradesh and Assam (all ‘Special Category’states).
Annual per capita RRT flows for all the north-eastern states (except Assam) and Jammu and Kashmirhave exceeded the annual per-capita consumption expenditure that defines the all-India poverty lines,especially the rural.
States and third tier fiscal institutions are not the only ones unable or unwilling to collect direct taxes butCentre too. At the end it is concluded that self-reinforcing cycle of inadequate delivery, low direct taxes,weak accountability, and inadequate delivery is perhaps the heart of the governance challenge in India.
Prelims Facts
1. Like India, even Germany and Brazil also has three tire system of governance.
2. 73rd amendment to the Constitution (1992) recognized Panchayats as institutions of self-government.The 74th provided same status on urban local governments.
3. RLGs or Panchayats were mandated to have three tiers (at the district, intermediate and villagelevels) in states with population of over 20 lakh. This amendment is not applicable in some specialareas and in the states like Nagaland, Mizoram.
4. 15th Finance Commission will make recommendations for the five years commencing 1 April 2020till 31 March 2025; the commission will recommend devolution of shareable central taxes to States.It will also review several important aspects of federal fiscal finance. It will make its report availableby 30th October 2019. N.K. Singh, former bureaucrat and ex-Member of Parliament will be Chairmanof 15th Finance Commission.

www.iasscore.inNotes
23Economic Survey (2017-18)
GS S
CO
RE
Terminologies
a) Economic Convergence: It is the process of poorer countries “catching-up” with richer countries and
closing gaps in standards of living, has been a big driver of some of these developments.
b) Divergence Big Time: Many poor countries fall in low-income trap for a long time and were not
catching up at all. So they were growing more slowly than richer countries.
c) Convergence with a Vengeance: Means since the mid-1980s the number of poor countries growing
faster than advanced economies has substantially increased and rate of catch-up also accelerated.
d) Premature De-industrialization: It is the tendency for manufacturing in late converger to peak at
lower levels of activity and earlier in the development process.
e) Good Growth: It comprises growth accounted for by labor share shifts into good (Productive)
sectors and their productivity growth.
f) Lewisian Transformation in Labour: Is related to the labour shift from the farm to the non-farm
sector involving a transition from low-productivity jobs to high productivity ones.
g) Learning Poverty Headcount (LPC): It measures the number of children who do not meet the basic
learning benchmark.
h) Learning Poverty Gap (LPG): It measures the gap between the basic learning benchmark and the
average scores of those students who did not meet the benchmark.
IS THERE A "LATE CONVERGER STALL" INECONOMIC DEVELOPMENT? CAN INDIA
ESCAPE IT?
The present era is of unprecedented prosperity for developing countries. AndIndia is also witnessing high growth rate. We can see that the poorer countriesare growing faster than richer countries leading to "economic convergence".The convergence process is accelerating for the last 20-30 years.
There is a fear that there can be a slowdown in this process of convergencefor countries like India. There could be 4 reasons for this, backlash againstglobalization, difficulties of transferring resources from low productivity tohigher productivity sectors, challenge of upgrading human capital to thedemands of a technology-intensive workplace, and coping with climate change-induced agricultural stress.
So far, India defied these challenges but in future these challenges need to bedecisively addressed. This chapter analyse on this point.
Context
Economic Survey (2017-18)
5

www.iasscore.in
Notes
24 Economic Survey (2017-18)
GS S
CO
RE
Introduction
• This is best of economic times for humanity and poorer countries (including India), because theglobal bads (war, violence, deprivation and poverty) are at unprecedentedly low levels and globalgoods (standards of living, access to essential services, and material well-being more generally) haveimproved at a historically unprecedented pace.
• Since the mid-1980s, the process of catch-up has broadened, as the number of poor countries growingfaster than advanced economies has substantially increased.
• In 1960, India was a low-income country. In 2008 we attained lower middle-income status and if percapita income grows at 6.5% per year, we would reach upper-middle income status by 2020.
• Reasons for middle income trap:
i) Country would be squeezed out of manufacturing and other dynamic sectors by poorer, lower-cost competitors.
ii) Lack the institutional, human, and technological capital to carve out niches higher up the value-added chain.
Four Headwinds:
• Late convergence in the process of economic development means post global financial crisis (GFC)convergence. Even without succumbing to apocalyptic pessimism, the risk of a Late ConvergenceStall needs to be taken seriously because of four headwinds:
a) Hyper (rapid) Globalization Repudiation: Early convergers (Japan, South Korea and China)benefited from the process of rapid/hyper globalization as all able to post average exportgrowth rates of over 15% for the 30 years of their convergence periods.
– In late convergence it reduces exporting opportunities of developing countries because theycame late to convergence and now face a very different global trading environment fromtheir predecessors.
– Means trading opportunities available to the early convergers specifically the ability toexport may no longer be available.
– As a consequence of convergence, over time, the world is becoming more equal in thedistribution of the underlying output.
– And the gravity model suggests there will also be increased trade. But this will benefit moreto the countries those accounts higher portion in world output.
b) The Difficulties of Structural Transformation: Means difficulties of transferring resources fromlow productivity to higher productivity sectors. Successful development requires 2 kinds ofstructural transformations:
i) A shift of resources from low productivity to high productivity sectors and
ii) A larger share of resources devoted to sectors that have the potential for rapid productivitygrowth.
– Thwarted Structural Transformation wherein resources shift instead from informal,low productivity sectors to ones that are marginally less informal/more productive.
www.iasscore.inNotes
25Economic Survey (2017-18)
GS S
CO
RE
– Manufacturing is critically important sector for ensuring successful transformations.This sector exhibits unconditional convergence toward the world frontier, so that it canbecome an escalator for rapid growth.
– In India the sectors like manufacturing, finance, telecommunications, and professionalservices have high levels of productivity and potential for unconditional convergence.
c) Human Capital Regression: It poses the challenge of upgrading human capital to the demandsof a technology-intensive workplace. Human capital is one key difference between earlyconvergence based on manufacturing and late convergence against the strong headwinds ofautomation and the globalization backlash.
– In early convergence Lewisian transformation, i.e. shifts in labor from farm to factory werepossible because of alignment of human capital endowment (educated but relatively unskilledlabour) with the sector associated with structural transformation.
– But in late convergence players failed to provide even the basic education necessary forsome structural transformation. In this the technology will increasingly favor skilled humancapital, where the requisite skills will include adaptability and the ability to learn continually.
– So growth will be based less on comparative advantage and more on some absolute humancapital attainment.
– The data on learning outcomes for a group of advanced and emerging economies showsduring the 1980s and 1990s, educational attainment of the middle income countries wasbelow that of advanced economies. If this gap persists or widens the kind of transformationenjoyed by the late convergers might prove more difficult for the late convergers, includingIndia.
d) Climate Change-induced Agricultural Stress: There is need to produce enough food to a growingpopulation and this is only possible if agricultural labor productivity grew rapidly enough.
– Unlike GDP, agricultural productivity levels across countries are increasingly diverging, notconverging. So, growth rates for richer countries have been consistently greater than fordeveloping countries and for poorest, and these growth rates have even declined post-GFC.
– Indian agricultural productivity growth has been stagnant, averaging roughly 3 percent overthe last 30 years because Indian agriculture is vulnerable to temperature increase and stillheavily dependent on precipitation. And if this situation continues then farmer revenuescould decline by up to 20-25% in non-irrigated areas.
– Therefore for the late convergers (like India), agricultural productivity is critical not just forfeeding people but for ensuring human capital accumulation in those who move fromagriculture to the modern sectors.
– Agriculture could yet come back to haunt the structural transformation fortunes of the lateconvergers.
Lessons for India:
• Since 1980, India has been rapidly catching up, posting an average per capita GDP growth rate of4.5% which is substantially greater than registered previously. But this fast growth has occurred withlimited transfer of labour resources from low productivity to high productivity and dynamic sectors,and despite relatively modest agricultural growth.
www.iasscore.in
Notes
26 Economic Survey (2017-18)
GS S
CO
RE
• The risk for India and for the other late convergers is that resources (especially labour) will movefrom low productivity, informal sectors to other sectors that are marginally less formal and onlymarginally more productive. That is the “late converger stall” that India must avoid.
• Keys to sustaining India’s dynamic growth trajectory:
– Rapidly improving human capital, i.e. healthy individuals, including all women, with the basiceducation to continually learn and adapt.
– Rapidly improving agricultural productivity against the headwinds of climate change and waterscarcity.
– The hyper-globalization backlash in advanced countries, over which India has little control, mustrecede to create a favorable external climate to sustain rapid growth.
The Learning Poverty Count (LPC) and Learning Poverty Gap (LPG) in Rural Primary Education:
India’s primary school enrollment is now nearly universal for both boys and girls at elementary level.Yet, both cross-country evidence and evidence from India suggests that educational outcomes are incommensurate with years of schooling: learning lags attending, as per Annual Survey of EducationReports (ASER) that have over time tested a sample of children between the ages of 5 and 16 in ruralIndia. Students are tested in terms of a set of tasks in reading and arithmetic: On math and reading,India’s roughly 40-50 % of children in rural India in grades 3 to 8 cannot meet the fairly basic learningstandard. It is clear that learning levels of children in rural India are far below where they should be.
Current trends suggest that if technology goes forward with the same pace even more human capitalintensive. So the wedge between the opportunities offered to the future labour force and the capabilitiesto take advantage of them will widen even further. That is the true magnitude of India’s human capitalchallenge.
Conclusion
• There is no Late Converger Stall, as yet, but it would be wise to act to head it off. India has so fardefied these headwinds but will continue to do so only if the challenges are decisively addressed.
Prelims Facts
• Global Financial Crisis: The crisis became manifested with the failure, merger or crash of severalfinancial institutions, mainly in the USA in 2008. The banks and the other financial institutions facedan insolvency threat. Across the globe, millions lost their jobs.
• Early and Late convergence happens before and after GCC respectively and not before or post LPG.
• 1980-1997: Era of divergence in which low-income countries fell further behind.
· 1998-2007: An early period of convergence running from the East Asian Financial Crisis until theGlobal Financial Crisis.
• 2008-2017: The most recent period of “late convergence.”
• Currently India is middle income country and heading towards upper-middle income status.
• Gross Domestic Product: The total value of everything produced by all the people and companiesin the country. GDP is best way to measure a country’s economy.
www.iasscore.inNotes
27Economic Survey (2017-18)
GS S
CO
RE
Terminologies
• Minimum Support Price (MSP): Minimum Support Price (MSP) is a form of market intervention
by the Government of India to insure agricultural producers against any sharp fall in farm prices.
• Malthusian Theory of Population Growth: According to Thomas Malthus, the English economist
and demographer, the population tends to increase faster than the means of subsistence.
• Un-irrigated areas: Defined as districts where less than 50% of cropped area is irrigated bear the
brunt of the vagaries of weather.
• Dry-land Area: Areas, which receive rainfall less than 750 mm. The farming in such areas called as
Dry-land farming.
• Rain-fed Area: The rain-fed areas, which receive more than 750 mm.The farming in such areas called
as Rain-fed farming.
• Drip Irrigation: Drip irrigation, also known as trickle irrigation,functions as its name suggests.
Water is delivered at or near the rootzone of plants, drop by drop.
• Weather: It is refer to annual realizations of temperature and precipitation. Pertains to the condition
of atmosphere at any place at a specific time or for a short period of time (Generally for hours or
days).
• Climate: It refers to long-term patterns in temperature and precipitation variables.Average weather
conditions of a specified area for a considerable time i.e. 30-35 years.
• IMD: It the principal agency responsible for meteorological observations, weather forecasting and
seismology. IMD is headquartered in Delhi.
CLIMATE, CLIMATE CHANGE, ANDAGRICULTURE
Using district-level data on temperature, rainfall and crop production, thischapter documents a long-term trend of rising temperatures, declining averageprecipitation, and increase in extreme precipitation events.
Rise in temperatures lower the rainfall significantly and the number of "drydays" are greater, than normal. These become more adverse in unirrigatedareas (and hence rainfed crops) compared to irrigated areas (and hence cereals).
The chapter states that minimizing susceptibility to climate change requiresdrastically extending irrigation via efficient drip and sprinkler technologies(realizing "more crop for every drop"), and replacing untargeted subsidies inpower and fertilizer by direct income support.
Context
Economic Survey (2017-18)
6

www.iasscore.in
Notes
28 Economic Survey (2017-18)
GS S
CO
RE
• IPCC: The Intergovernmental Panel on Climate Change (IPCC) is the leading international body forthe assessment of climate change. It was established by the United Nations Environment Programme(UNEP) and the World Meteorological Organization (WMO) in 1988 to provide the world with aclear scientific view on the current state of knowledge in climate change and its potential environmentaland socio-economic impacts. It does not conduct any research nor does it monitor climate relateddata or parameters.
• Pradhan Mantri Fasal Bima Yojana: It is a crop insurance scheme in India.
Objectives: To provide insurance coverage and financial support to the farmers in the event of failureof any of the notified crop as a result of natural calamities, pests & diseases; to stabilise the incomeof farmers to ensure their continuance in farming; to encourage farmers to adopt innovative andmodern agricultural practices and to ensure flow of credit to the agriculture sector.
Implementing Agency (IA): The Scheme shall be implemented through a multi-agency frameworkby selected insurance companies under the overall guidance & control of the Department of Agriculture,Cooperation & Farmers Welfare (DAC&FW), Ministry of Agriculture & Farmers Welfare (MoA&FW),Government of India (GOI) and the concerned State in co-ordination with various other agencies; vizFinancial Institutions like Commercial Banks, Co-operative Banks, Regional Rural Banks and theirregulatory bodies, Government Departments viz. Agriculture, Co-operation, Horticulture, Statistics,Revenue, Information/Science & Technology, Panchayati Raj, etc.
• Sir Arthur Lewis Theory: The Nobel Prize winner, Sir Arthur Lewis (among others), argued thateconomic development is always and everywhere about getting people out of agriculture and ofagriculture becoming over time a less important part of the economy (not in absolute terms but asa share of GDP and employment). But this must happen along with, and in the context of, rapidproductivity growth in agriculture, to produce greater food supplies for the people, provide rising farmincomes, and permit the accumulation of human capital.
Gist of Chapter
Indian agriculture is witnessing the harsher prospects of its vulnerability to long-term climate change.
The last few seasons have witnessed a problem of plenty: farm revenues declining for a number of cropsdespite increasing production and market prices falling below the Minimum Support Price (MSP). But inthe medium to long term, the ghost of Malthus looms over Indian agriculture. Productivity will have tobe increased, and price and income volatility reduced, against the backdrop of increasing resource constraints.
Shortages of water and land, deterioration in soil quality, and of course climate change-induced temperatureincreases and rainfall variability, are all going to impact agriculture. Thus analysing the impact of climatechange on agriculture is must.
Agriculture matters for economic reasons because it still accounts for a substantial part of GDP (16percent) and employment (49 percent). Poor agricultural performance can lead to inflation, farmer distressand unrest, and larger political and social disaffection—all of which can hold back the economy. Thuseconomic and social development is about facilitating this transition in the context of a prosperousagriculture and of rising productivity in agriculture because that will also facilitate good urbanization andrising productivity in other sectors of the economy.
But Indian agriculture sector is more vulnerable than China due to the vagaries of weather because closeto 52 percent (73.2 million hectares area of 141.4 million hectares net sown area) of it is still un-irrigatedand rainfed.
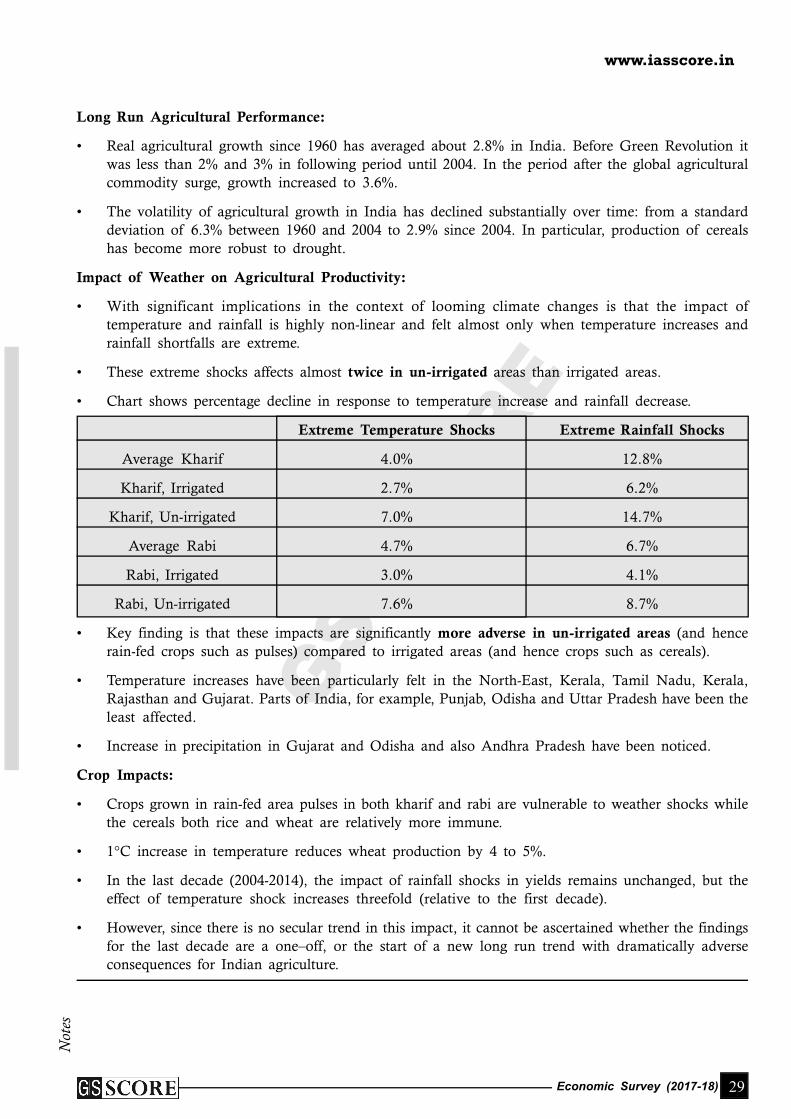
www.iasscore.inNotes
29Economic Survey (2017-18)
GS S
CO
RE
Long Run Agricultural Performance:
• Real agricultural growth since 1960 has averaged about 2.8% in India. Before Green Revolution itwas less than 2% and 3% in following period until 2004. In the period after the global agriculturalcommodity surge, growth increased to 3.6%.
• The volatility of agricultural growth in India has declined substantially over time: from a standarddeviation of 6.3% between 1960 and 2004 to 2.9% since 2004. In particular, production of cerealshas become more robust to drought.
Impact of Weather on Agricultural Productivity:
• With significant implications in the context of looming climate changes is that the impact oftemperature and rainfall is highly non-linear and felt almost only when temperature increases andrainfall shortfalls are extreme.
• These extreme shocks affects almost twice in un-irrigated areas than irrigated areas.
• Chart shows percentage decline in response to temperature increase and rainfall decrease.
Extreme Temperature Shocks Extreme Rainfall Shocks
Average Kharif 4.0% 12.8%
Kharif, Irrigated 2.7% 6.2%
Kharif, Un-irrigated 7.0% 14.7%
Average Rabi 4.7% 6.7%
Rabi, Irrigated 3.0% 4.1%
Rabi, Un-irrigated 7.6% 8.7%
• Key finding is that these impacts are significantly more adverse in un-irrigated areas (and hence
rain-fed crops such as pulses) compared to irrigated areas (and hence crops such as cereals).
• Temperature increases have been particularly felt in the North-East, Kerala, Tamil Nadu, Kerala,Rajasthan and Gujarat. Parts of India, for example, Punjab, Odisha and Uttar Pradesh have been the
least affected.
• Increase in precipitation in Gujarat and Odisha and also Andhra Pradesh have been noticed.
Crop Impacts:
• Crops grown in rain-fed area pulses in both kharif and rabi are vulnerable to weather shocks whilethe cereals both rice and wheat are relatively more immune.
• 1°C increase in temperature reduces wheat production by 4 to 5%.
• In the last decade (2004-2014), the impact of rainfall shocks in yields remains unchanged, but theeffect of temperature shock increases threefold (relative to the first decade).
• However, since there is no secular trend in this impact, it cannot be ascertained whether the findingsfor the last decade are a one–off, or the start of a new long run trend with dramatically adverseconsequences for Indian agriculture.

www.iasscore.in
Notes
30 Economic Survey (2017-18)
GS S
CO
RE
Impact on Farm Revenue:
• Extreme temperature shocks reduce farmer incomes by 4.3% and 4.1% whereas extreme rainfallshocks reduce incomes by 13.7% and 5.5% during kharif and rabi respectively.
• In a year where temperatures are 1°C higher farmer incomes would fall by 6.2% during the kharifseason and 6% during rabi in un-irrigated districts.
• Similarly, in a year when rainfall levels were 100 mm less than average, farmer incomes would fallby 15% during kharif and by 7% during the rabi season.
• A study by the IMF, finds that for emerging market economies a 1°C increase in temperature wouldreduce agricultural growth by 1.7%, and a 100 mm reduction in rain would reduce growth by 0.35%.
• Inter-governmental Panel on Climate Change (IPCC), predict that temperatures in India are likely torise by 3-4° C by the end of the 21st century.
• Models of climate change also predict an increase in the variability of rainfall in the long-run, witha simultaneous increase in both the number of dry-days as well as days of very high rainfall.
• Farmer income losses from climate change could be between 15 % and 18 % on average, rising toanywhere between 20 % and 25 % in un-irrigated areas.
In the long-run, we may be able to change technologies or alter the crops they grow in response tosustained increases in temperature and changes in precipitation. Further it is possible that irrigationnetworks might expand, mitigating to some extent the adverse impacts of climate change. However inthe present scenario, the impact is severe.
Conclusions and Policy Implications:
• Impact of temperature and rainfall is felt only in the extreme; that is, when temperatures are muchhigher, rainfall significantly lower, and the number of “dry days” greater, than normal.
• In the 1960s, less than 20% of agriculture was irrigated; today this number is in the mid-40s.
• The challenge is that the spread of irrigation will have to occur against a backdrop of extremegroundwater depletion, especially in North India. India pumps more than twice as much groundwateras China or United States.
• Fully irrigating Indian agriculture, that too against the backdrop of water scarcity and limited efficiencyin existing irrigation schemes, will be a defining challenge for the future.
• Technologies of drip irrigation, sprinklers, and water management captured in the “more crop forevery drop” campaign hold the key future to Indian agriculture.
• The power subsidy needs to be replaced by direct benefit transfers so that power use can be fullycosted and water conservation furthered.
• Weather-based models and technology (drones for example) need to be used to determine losses andcompensate farmers within weeks.
• According to Subramanian it is vital to make a clear distinction between two agricultures in India:
1. The well-irrigated, input-addled, and price & procurement supported cereals grown in NorthernIndia, were the challenge is for policy to change the form of the very generous support fromprices and subsidies to less damaging support in the form of direct benefit transfers.
2. Another agriculture (broadly, non-cereals in central, western and southern India) where the problemsare very different: inadequate irrigation, continued rain dependence, ineffective procurement, and
www.iasscore.inNotes
31Economic Survey (2017-18)
GS S
CO
RE
insufficient investments in research and technology (non-cereals such as pulses, soyabeans, andcotton), high market barriers and weak post-harvest infrastructure (fruits and vegetables), andchallenging non-economic policy (livestock).
• The cooperative federalism “technology” of the GST Council that brings together the Center andStates could be promisingly deployed to further agricultural reforms and durably raise farmers’incomes.
Facts for Prelims
• Kharif crops:
– From July to October
– Harvest in September to October
– Known as Monsoon Crops
– In Arabic, Kharif means autumn
– Kharif crops need a lot of water.
– The Kharif crops include rice, maize, sorghum, Tea, Coffee, Rubber, Sesame, Guar, cereals likepearl millet, Arhar Dhal, soybeans, oilseeds, cotton etc.
• Rabi crops:
– Sown in October – November
– Harvest in February – April
– Known as Winter Season Crops
– Require cold weather for growth
– Consumes less water
– The rabi crops include wheat, barley, oats, cereals, pulses, linseed, oilseeds, Chickpea, Rape andMustard Seed.
• Zaid crops:
– Sown in March to June (between Kharif and Rabi)
– Needs warm dry weather for growth and longer day length for flowering
– Vegetables and Seasonal fruits
• The minimum support prices are announced by GoI at the beginning of the sowing season for certaincrops on the basis of the recommendations of the Commission for Agricultural Costs and Prices(CACP).
• Un-irrigated areas: Districts where less than 50%of cropped area is irrigated bear the brunt of thevagaries of weather.
• Value of production is measured as the product of yields per hectare and prices.
• India pumps more than twice as much groundwater as China or United States. Indeed globaldepletion is most alarming in North India.
www.iasscore.in
Notes
32 Economic Survey (2017-18)
GS S
CO
RE
• The Indo-Gangetic plain, and parts of Gujarat and Madhya Pradesh are well irrigated. But parts ofKarnataka, Maharashtra, Madhya Pradesh, Rajasthan, Chattisgarh and Jharkhand are still extremelyvulnerable to climate change on account of not being well irrigated.

www.iasscore.inN
otes
33Economic Survey (2017-18)
GS S
CO
RE
Terminologies
• “Beti Bachao, Beti Padhao”: Beti Bachao, Beti Padhao is a social campaign of the Governmentof India that aims to generate awareness and improve the efficiency of welfare services intended for
girls. The scheme was launched with an initial funding of Rs.100 crore (US$16 million).
• Child Sex Ratio: In India, the Child Sex Ratio is defined as the number of females per thousand
males in the age group 0–6 years in a human population. Thus it is equal to 1000 x the reciprocalof the sex ratio (ratio of males to females in a population) in the same age group, i.e. under age
seven. Some of the reasons for neglect of girl child and low child sex ratio are son preference and
the belief that it is only the son who can perform the last rites, that lineage and inheritance runs
through the male line, sons will look after parents in old age, men are the bread winners etc.
Exorbitant dowry demand is another reason for female foeticide/infanticide. Small family norm
coupled with easy availability of sex determination tests may be a catalyst in the declining child sexratio, further facilitated by easy availability of Pre-conception sex selection facilities.
GENDER AND SON META-PREFERENCE: ISDEVELOPMENT ITSELF AN ANTIDOTE?
Over the last 10-15 years, India's performance on the indicators of women'sagency, attitudes, and outcomes has improved. The improvement has been suchthat India's situation is comparable to that of a cohort of countries after accountingfor levels of development. However, on several other indicators, notablyemployment, use of reversible contraception, and son preference, India has somedistance to traverse because development has not proved to be an antidote.
Within India, there is significant heterogeneity, with the North-Eastern states (amodel for the rest of the country) consistently out-performing others and notbecause they are richer; hinterland states are lagging behind but the surprise isthat some southern states do less well than their development levels wouldsuggest.
The challenge of gender is long-standing, probably going back millennia, so allstakeholders are collectively responsible for its resolution. India must confrontthe societal preference, even meta-preference for a son, which appearsinoculated to development.
The skewed sex ratio in favor of males led to the identification of "missing"women. But there may be a meta-preference manifesting itself in fertility stoppingrules contingent on the sex of the last child, which notionally creates "unwanted"girls, estimated at about 21 million. Consigning these odious categories to historysoon should be society's objective. This chapter analyses the situation of Indiaon parameters related to women.
Context
Economic Survey (2017-18)
7
www.iasscore.in
Not
es
34 Economic Survey (2017-18)
GS S
CO
RE
• Global Gender Gap Index: The Global Gender Gap Report is published by the World EconomicForum. The report examines four overall areas of inequality between men and women in 130 economiesaround the globe, over 93% of the world’s population:
a) Economic participation and opportunity – outcomes on salaries, participation levels and access tohigh-skilled employment
b) Educational attainment – outcomes on access to basic and higher level education
c) Political empowerment – outcomes on representation in decision-making structures
d) Health and survival – outcomes on life expectancy and sex ratio. In this case parity is notassumed, there are assumed to be fewer female births than male (944 female for every 1,000males), and men are assumed to die younger. Provided that women live at least six percentlonger than men, parity is assumed. But if it is less than six percent it counts as a gender gap.
• Gender Inequality Index (GII): The Gender Inequality Index (GII) is an index for measurement ofgender disparity that was introduced by the United Nations Development Programme(UNDP).According to the UNDP, this index is a composite measure to quantify the loss of achievementwithin a country due to gender inequality. It uses three dimensions to measure opportunitycost: reproductive health, empowerment, and labor market participation.
• Demographic and Health Survey: The Demographic and Health Surveys (DHS) Program isresponsible for collecting and disseminating accurate, nationally representative data on health andpopulation in developing countries. The project is implemented by ICF International and is funded bythe United States Agency for International Development (USAID) with contributions from otherdonors such as UNICEF, UNFPA, WHO, and UNAIDS.
• National Family Health Survey: The National Family Health Survey (NFHS) is a large-scale, multi-round survey conducted in a representative sample of households throughout. India The surveyprovides state and national information for India on fertility, infant and child mortality, the practiceof family planning, maternal and child health, reproductive health, nutrition, anaemia, utilization andquality of health and family planning services.
Gist of Chapter
Introduction
As the advanced world grapples with the fallout from the endemic harassment of women, and as theevidence grows about the intrinsic and instrumental value in raising the role and status of women insociety, it is time to ask: how is India faring and how much progress has been made? Is India the landof the empowered woman imagined by Subramania Bharati or the helpless, oppressed woman describedby Maithlisharan Gupt?
Thus recognizing the long-run objective of elevating the role and status of women while also respondingto prominent incidents of violence against women, the government in January 2015 launched “BetiBachao, Beti Padhao”, it targeted the worsening Child Sex Ratio (CSR) in India through a mass campaignaimed at creating awareness and changing social norms.
Findings of the Economic Survey
• On 14 out of 17 indicators relating to agency, attitude, and outcomes, India’s score has improved overtime. On seven of them, the improvement is such that in the most recent period India’s performanceis better than or at par with that of other countries, accounting for the level of development.
www.iasscore.inN
otes
35Economic Survey (2017-18)
GS S
CO
RE
• The progress is most notable in the agency women have in decision-making regarding, householdpurchases and visiting family and relatives. There has been a decline in the experience of physicaland sexual violence. Education levels of women have improved dramatically but incommensuratewith development.
• On 10 of 17 indicators, India has some distance to traverse to catch up with its cohort of countries.For example, women’s employment has declined over chronological time, and to a much greaterextent, in development time. Another such area is in the use of female contraception: nearly 47percent of women do not use any contraception, and of those who do, less than a third use femalecontrolled reversible contraception. These outcomes can be disempowering, especially if they are theconsequence of restrictions on reproductive agency.
• While there is considerable variation within the Indian states and across dimensions, the broadpattern is one of the North-Eastern states doing substantially better than the hinterland states evenin development time; hinterland states are lagging, some associated with their level of developmentand some even beyond that; surprisingly, some southern states such as Andhra Pradesh and TamilNadu fare worse than expected given their level of development.
• Perhaps the area where Indian society—and this goes beyond governments to civil society, communities,and households—needs to reflect on the most is what might be called “son preference” wheredevelopment is not proving to be an antidote. Son preference giving rise to sex selective abortion anddifferential survival has led to skewed sex ratios at birth and beyond, leading to estimates of 63million “missing” women.
• But there is another phenomenon of son meta-preference which involves parents adopting fertility“stopping rules” – having children until the desired number of sons are born. This meta-preferenceleads naturally to the notional category of “unwanted” girls which is estimated at over 21 million.In some sense, once born, the lives of women are improving but society still appears to want fewerof them to be born.
• Collective self-reflection by Indian society on son preference and son meta-preference is necessary.Initiatives such as Beti Bachao Beti Padhao and Sukanya Samridhi Yojana and the mandatorymaternity leave rules inaugurated by this government are important steps focused on addressing theunderlying challenge.
Performance of the Indian States
To shed some light on this, the scores of the Indian states across all the dimensions are averaged. Thevariables are calibrated such that the maximum score is 100 percent.
Findings:
a) Most North-Eastern states (with the exception of Tripura and Arunachal Pradesh) and Goa are thebest performer.
b) Kerala is the next best performer.
c) The lagging performers are Bihar, Rajasthan, Madhya Pradesh, Uttar Pradesh, Jharkhand and,surprisingly, Andhra Pradesh.
d) Delhi’s performance actually worsens in a decade.
e) The worst Indian score is 57.6 (Bihar) and the best is 81 (Sikkim) with most of India scoring between55 and 65 (about 40 per cent away from the frontier). Indian states have some distance to traverseto reach the theoretical frontier.
www.iasscore.in
Not
es
36 Economic Survey (2017-18)
GS S
CO
RE
f) The North-Eastern states have much better gender scores given their levels of income (they are wellabove their line of best ft). On the other hand, accounting for their levels of income, Andhra Pradesh,Haryana, Bihar and Tamil Nadu perform less well.
g) Since not many women use methods of reversible contraception, they have little control over when
they start having children, but only seem to have control over when they stop having children. This
could affect other milestones early on in a woman’s life; for example, women may not get the same
access to employment that men do.
h) Increased incomes of men allows Indian women to withdraw from the labor force, thereby avoiding
the stigma of working; higher education levels of women also allow them to pursue leisure and other
non-work activities all of which reduce female labor force participation.
i) The structural transformation of Indian agriculture due to farm mechanization results in a lower
demand for female agricultural laborers.
Son Preference: Skewed Sex Ratio at Birth (SRB)
• Issues relating to son preference are a matter for Indian society as a whole to reflect upon. Because
it is a long-standing historical challenge, all stakeholders are collectively responsible for its existence
and for its resolution.
• The biologically determined natural sex ratio at birth is 1.05 males for every female. Any significant
deviation from this is on account of human intervention – specifically, sex-selective abortion. In the
case of China, the one-child policy interacted with the underlying son-preference to worsen the sex
ratio from 1070 in 1970 to 1156 in 2014. India’s sex ratio during this period also increased substantially
even without the one-child policy from 1060 to 1108 whereas if development acted as an antidote,
it should have led to improvements in the sex ratio.
• Most striking is the performance of Punjab and Haryana where the sex ratio (0-6 years) is approaching
1200 males per 1000 females, even though they are amongst the richest states.
• The stock of missing women as of 2014 was nearly 63 million and more than 2 million women go
missing across age groups every year (either due to sex selective abortion, disease, neglect, or inadequate
nutrition).
Son “Meta” Preference: Sex Ratio of Last Child (SRLC) and “Unwanted” Girls
• While active sex selection via fetal abortions is widely prevalent, son preference can also manifest
itself in a subtler form. Parents may choose to keep having children until they get the desired number
of sons. This is called son “meta” preference. A son “meta” preference – even though it does not
lead to sex-selective abortion – may nevertheless be detrimental to female children because it may
lead to fewer resources devoted to them.
• The important thing to note is that this form of sex selection alone will not skew the sex ratio –
either at birth or overall. Therefore, a different measure is required to detect such a “meta” preference
for a son. One indicator that potentially gets at this is the sex ratio of the last child (SRLC). A
preference for sons will manifest itself in the SRLC being heavily skewed in favor of boys. On the
other hand, an SRLC of close to 1.05:1 would child for households that have strictly more than 1
child is 1.07. Similarly, 0.86 is the sex ratio of the second child among families that had strictly more
than 2 children.

www.iasscore.inN
otes
37Economic Survey (2017-18)
GS S
CO
RE
• For India, the sex ratio of the last child for first-borns is 1.82, heavily skewed in favor of boys
compared with the ideal sex ratio of 1.05. This ratio drops to 1.55 for the second child for families
that have exactly two children and so on.
What does data implies?
Families where a son is born are more likely to stop having children than families where a girl is born.This is suggestive of parents employing “stopping rules” – having children till a son is born and stoppingthereafter. The only exception to this pattern is with regards to the first child. Even parents who have afirst-born son are likely to continue having children, which reflects a pure family size preference – Indianparents, on average, want to have at least two children.
Reasons for preference
The reasons for such a son preference, including patrilocality (women having to move to husbands’ housesafter marriage), patrilineality (property passing on to sons rather than daughters), dowry (which leads toextra costs of having girls), oldage support from sons and rituals performed by sons.
Such meta preference gives rise to “unwanted” girls–girls whose parents wanted a boy, but instead hada girl.
Conclusion
Encouragingly, gender outcomes exhibit a convergence pattern, improving with wealth to a greater extentin India than in similar countries so that even where it is lagging it can expect to catch up over time.
Because the challenge is historical and longstanding, no one stakeholder is responsible for creating it orsolving it. On gender, society as a whole—civil society, communities, households— and not just anygovernment must reflect on a societal preference, even meta-preference for a son, which appears inoculatedto development. The adverse sex ratio of females to males led to 63 million “missing” women. But themetapreference manifests itself in fertility-stopping rules contingent on the sex of the last child, whichnotionally creates “unwanted” girls, estimated at about 21 million. Tellingly, for example, skewed sexratios characterize families of Indian origin, even in Canada.
The state and all stakeholders have an important role to play in increasing opportunities available forwomen in education and employment. Understanding the importance of its role, the government haslaunched the Beti Bachao Beti Padhao and Sukanya Samridhi Yojana schemes. It has also made 26 weeksmaternity leave mandatory for women employed in the public and private sectors. Further, everyestablishment that has more than 50 employees is now required to offer creche facilities. These steps willoffer support to women in the workforce. In this somewhat unequal contest between the irresistible forcesof development and the immovable objects that are cultural norms, the former will need all the supportit can get – and then some.
www.iasscore.in
Notes
38 Economic Survey (2017-18)
GS S
CO
RE
Terminologies
• Dark matter: Dark matter is a hypothetical type of matter distinct from ordinary matter suchas protons, neutrons, electrons, and neutrinos. It does not emit or interact withobservable electromagnetic radiation, such as light, and is thus invisible to the entire electromagneticspectrum. It influences the universe’s large-scale structure, the formation of galaxies, and affectsthe cosmic microwave background.
• Genomics: Genomics is an interdisciplinary field of science focusing on the structure, function,evolution, mapping, and editing of genomes.
• Cyber Physical Systems: Cyber-Physical Systems (CPS) are integrations of computation, networking,and physical processes. Embedded computers and networks monitor and control the physical processes,with feedback loops where physical processes affect computations and vice versa.
• STEM research: STEM is a curriculum based on the idea of educating students in four specificdisciplines — science, technology, engineering and mathematics — in an interdisciplinary and appliedapproach. Rather than teach the four disciplines as separate and discrete subjects, STEM integratesthem into a cohesive learning paradigm based on real-world applications.
• Patents: A patent is an exclusive right granted for an invention, which is a product or a process thatprovides, in general, a new way of doing something, or offers a new technical solution to a problem.To get a patent, technical information about the invention must be disclosed to the public in a patent
TRANSFORMING SCIENCE ANDTECHNOLOGY IN INDIA
Innovations in science and technology are integral to the long-term growthand dynamism of any nation. The pursuit of science also creates a spirit ofenquiry and discourse which are critical to modern, open, democratic societies.
However, India under-spends on research and development (R&D), evenrelative to its level of development. A doubling of R&D spending is necessaryand much of the increase should come from the private sector and universities.To recapture the spirit of innovation that can propel it to a global science andtechnology leader from net consumer to net producer of knowledge India shouldinvest in educating its youth in science and mathematics, reform the way R&Dis conducted, engage the private sector and the Indian diaspora, and take amore mission-driven approach in areas such as dark matter, genomics, energystorage, agriculture, and mathematics and cyber physical systems. Vigorousefforts to improve the "ease of doing business" need to be matched by similarones to boost the "ease of doing science."
This chapter discusses about the status of R&D in India and steps needed toboost the "ease of doing science."
Context
Economic Survey (2017-18)
8
www.iasscore.inNotes
39Economic Survey (2017-18)
GS S
CO
RE
application. Patent protection means that the invention cannot be commercially made, used, distributed,imported or sold by others without the patent owner’s consent.
• WIPO: WIPO was created in 1967 “to encourage creative activity, to promote the protectionof intellectual property throughout the world”. WIPO undertakes activities in three main areas, namely(i) the progressive development of international intellectual property law; (ii) assistance to developingcountries to build intellectual property capacity at national and regional levels and encourage moreeffective use of IP as tool for economic development; and (iii) services to industry and the privatesector to facilitate the process of obtaining intellectual property protection in multiple countries.
• Science and Engineering Research Board: Science and Engineering Research Board is an autonomousbody chaired by the Secretary to the Government of India in the Department of Science andTechnology. The Board was set up for promoting basic research in science and engineering and toprovide financial assistance to scientists, academic institutions, R&D laboratories, industrial concernsand other agencies for such research.
• Ucchatar Avishkar Yojana: UAY promotes industry sponsored, outcome-oriented research projectswith an outlay of Rs.475.00 crore for a period of two years beginning 2016-17. The project cost ismet to the extent of 50% by the Ministry of Human Resource Development (MHRD) and 25% eachby the Industry and the participating Ministry/Department. As regards funds released to NGOs,Department of Science & Technology has informed that Rs.455.512 lakh during 2015-16 andRs.453.676 lakh during 2016-17 have been released to the NGOs, who are engaged in adaptiveresearch and development (R&D) primarily in rural and difficult areas.
• INSPIRE: Innovation in Science Pursuit for Inspired Research (INSPIRE)” is an innovative programmesponsored and managed by the Department of Science & Technology for attraction of talent toScience. The basic objective of INSPIRE is to communicate to the youth of the country theexcitements of creative pursuit of science, attract talent to the study of science at an early age andthus build the required critical human resource pool for strengthening and expanding the Science &Technology system and R&D base.
• Ramalingaswami Re-entry Fellowship: The scheme is conceptualized with the aim of attractinghighly skilled researchers (Indian nationals) working overseas in various cutting edge disciplines ofbiotechnology (agriculture, health sciences, bio-engineering, energy, environment, bioinformatics andother related areas), by providing them an attractive avenue to pursue their R&D interests in Indianinstitutions.
• Visiting Advanced Joint Research Faculty Scheme: It enables NRIs and overseas scientific communityto participate and contribute to research and development in India. The Science and EngineeringResearch Board (SERB), a Statutory body of the Department will implement the Scheme. TheVAJRA Faculty is provided a lump-sum amount of US$ 15000 in the first month of residency ina year and US$ 10000 p.m. in the other two months to cover their travel and honorarium. While noseparate support is provided for e.g. accommodation, medical / personal insurance etc. the hostinstitute may consider providing additional support. The Indian collaborator and the overseas facultywill jointly frame a research plan and the application duly endorsed by the Head of the Institutionwill be submitted online by the Indian collaborator.
• Ramanujan Fellowship Scheme: The fellowship is meant for brilliant scientists and engineers fromall over the world to take up scientific research positions in India, i.e. for those scientists who wantto return to India from abroad. The fellowships are scientist-specific and very selective. The RamanujanFellows could work in any of the scientific institutions and universities in the country and they wouldbe eligible for receiving regular research grants through the extramural funding schemes of variousS&T agencies of the Government of India.

www.iasscore.in
Notes
40 Economic Survey (2017-18)
GS S
CO
RE
Gist of Chapter
Introduction
Science, technology, and innovation have instrumental and intrinsic value for society. They are key driversof economic performance and social well-being. But they are also important for deeper reasons: a scientifictemper, with its spirit of enquiry, the primacy accorded to facts and evidence, the ability to challenge thestatus quo, the adherence to norms of discourse and the elevation of doubt and openness. The open spiritof inquiry that is fundamental to science can provide a bulwark against the darker forces of dogma,religious obscurantism, and nativism that are threateningly resurfacing around the world.
Contribution of India
Its historical contributions to science have been many, ranging from one of the most important innovationsin the history of mathematics – the first use of zero – as revealed in the Bakhshali manuscript (carbondated to AD 200–400), to important contributions made (amongst others) by Aryabhata, Brahmagupta,Bhaskara, Madhava of Sangamagrama, and to the stellar contributions made by names such as CVRaman, S. N. Bose, Srinivasa Ramanujan in the last century.
Independent India has chalked up many accomplishments: from the nuclear energy program, the hybridseeds program that underpinned the Green Revolution to the space program, including the Mangalyaanmission which highlighted India’s niche of doing cost-effective, high-technology research.
Most recently, India’s important participation (involving three major Indian research institutions) in theLaser Interferometer Gravitational-wave Observatory (LIGO) experiment successfully detected the existenceof gravitational waves. And India’s vaccines and generic-drugs have saved millions of lives the world over.
Why scientific development needed?
It will help in addressing India’s most pressing development challenges in addition to maintaining adecent, open society. Investing in science is also fundamental to India’s security: the human security ofits populations; the resilience needed to address the multiple uncertainties stemming from climate change;and the national security challenges stemming from new emerging threats, ranging from cyber-warfare toautonomous military systems such as drones.
Given the dizzying pace and expansion of scientific research and knowledge on the one hand, and agenerally higher importance given to careers in engineering, medicine, management and government jobsamongst India’s youth on the other, India needs to rekindle the excitement and purpose that would attractmore young people to the scientific enterprise.
Status in India
• Investments in Indian science, measured in terms of Gross Expenditure on R&D (GERD), haveshown a consistently increasing trend over the years. GERD has tripled in the last decade in nominalterms – from Rs. 24,117 crores in 2004-05 to Rs. 85,326 crores in 2014-15 and an estimatedRs.1,04,864 crores in 2016-17 – and double in real terms. However, as a fraction of GDP, publicexpenditures on research have been stagnant – between 0.6-0.7 percent of GDP – over the past twodecades.
• About three-fifths of the public investment is spread over the key government science fundingagencies like Atomic Energy, Space, Earth Sciences, Science and Technology and Biotechnology,
• India’s spending on R&D (about 0.6 percent of GDP) is well below that in major nations such asthe US (2.8), China (2.1), Israel (4.3) and Korea (4.2).
www.iasscore.inNotes
41Economic Survey (2017-18)
GS S
CO
RE
• In most countries, the private sector carries out the bulk of research and development even ifgovernment must play an import funding role. However, in India, the government is not just theprimary source of R&D funding but also it’s the primary user of these funds.
• Government expenditure on R&D is undertaken almost entirely by the central government. Thereis a need for greater State Government spending, especially application oriented R&D aimed atproblems specific to their economies and populations.
• Private investments in research have severely lagged public investments in India. India has no firmsin five of the top ten R&D sectors as opposed to China that has a presence in each of them.
• In India universities play a relatively small role in the research activities of the country. Universitiesin many countries play a critical role in both creating the talent pool for research as well generatinghigh quality research output. However, publicly funded research in India concentrates in specializedresearch institutes under different government departments. This leaves universities to largely play ateaching role – a decision that goes back to the 1950s. It is now widely acknowledged that whateverthe merits of the decision at the time, this disconnection has severely impaired both teaching as wellas the research enterprise in the country.
• East Asian countries like China, Japan, and Korea, have seen dramatic increases in R&D as apercentage of GDP as they have become richer. India, on the other hand, has only seen a slightincrease. In fact, in 2015, there was a sizeable decline in R&D spending even as GDP per capitacontinued to rise. At its current rate, India would just barely reach GERD of 1 percent of GDP bythe time it was as rich as the USA.
• Indian Ph.D. students obtain their degrees either within India or abroad, especially in the US.
• In 2013, India ranked 6th in the world in scientific publications. Its ranking has been increasing aswell. Between 2009-2014, annual publication growth was almost 14 percent. This increased India’sshare in global publications from 3.1 percent in 2009 to 4.4 percent in 2014 as per the ScopusDatabase. However, there is a downside to the increase in publications.
• The Nature Index (which publishes tables based on counts of high-quality research outputs in theprevious calendar year covering the natural sciences) – ranked India at 13 in 2017. But there is stilla considerable lag in levels between India and the other two large countries, and the rate of improvementin China between 2001 and 2011 is dramatically better than India’s.
• According to the WIPO, India is the 7th largest Patent Filing Office in the World. However, Indiaproduces fewer patents per capita. Unless there is a greater focus on R&D, rising income alone willnot allow India to catch up in the near future.
• India’s patent applications and grants have grown rapidly in foreign jurisdictions, the same is not trueat home. Residential applications have increased substantially since India joined the internationalpatent regime in 2005. However, the number of patents granted fell sharply post 2008 and hasremained low. While Indian residents were granted over 5000 patents in foreign offices in 2015, thenumber for resident flings in India was little over 800.
Reasons for decrement in grants
• The decrease in grants could have been due to a stricter examination process. But evidencesuggests that there is a severe backlog and high rate of pendency for domestic patent applications.
• Due to manpower shortages there is a backlog of almost 2 lakh patents pending examination. In2016-2017, there were only 132 examiners for all patent applications in India. This has meant thatpatent examination and granting can take 5 or more years.
www.iasscore.in
Notes
42 Economic Survey (2017-18)
GS S
CO
RE
• Given the rapid rate of technological obsolescence, the inordinate delay in processing patentspenalizes innovation and innovators within the country.
• Addressing patent litigation issues will also be crucial to ensuring that the patent system effectivelyrewards innovation.
Expanding R&D in India: The Way Forward
Clearly, India needs to redouble its efforts to improve science and R&D in the country first and foremostby doubling national expenditures on R&D with most of the increase coming from the private sector anduniversities. But the metrics also need to go beyond papers and patents to a broader contribution toproviding value for society. Thus steps needed are:
• No country can create a vibrant superstructure of R&D with weak foundations of primary andsecondary education for so many of its young. Thus there is a need to improve math and cognitiveskills at the school level.
• India needs to gradually move to have a greater share of an investigator-driven model for fundingscience research. A step in this direction occurred in 2008, with the establishment of the Science andEngineering Research Board (SERB), a statutory body of DST. This body has sanctioned about threeand half thousand new R&D projects to individual scientists. It is a promising start that needs toexpand with more resources and creative governance structures.
• The private sector should be incentivized to both undertake more R&D but to also support STEMresearch through CSR funds. Efforts like the 50:50 partnership with SERB for industry relevantresearch under the Ucchatar Avishkar Yojana (UAY) is a good example of what could help makesuch partnerships fruitful.
• State governments too need to recognize the need to invest in application oriented research aimedat problems specific to their economies and populations. This would both strengthen state universitiesas well as provide much needed knowledge in areas such as crops, ecology and species specific toa state.
• Universities have students but need additional faculty support, while research institutes have qualifiedfaculty but are starved of bright young students brimming with energy and ideas. A closer relationshipbetween the two in specific geographic and spatial settings would help nurture research in areasreflecting the fields of science in which the national research centers have strengths.
• Take a mission driven approach to R&D
a) India needs at least one mission that is directed towards the basic sciences. India is one of theleading countries in high energy physics and relevant mathematics.
b) Genomic research lies at the heart of the future of the life sciences. Currently several countrieshave launched ambitious national genomic research projects e.g. UK Biobank Study; FinnishBirth Cohort Study; Partners HealthCare Bioban; China Kadoori Biobank. These studies arecollecting detailed phenotype information, as well as blood and tissue samples, to study thedeterminants and life-course of biological pathways and disease. India already has a strongfoundation of life science research institutes which together can make significant contributionsin this area.
c) Renewable energy is the future and India has made a major commitment to investment inrenewable energy. India has lagged in manufacturing renewal energy generation systems.Substantial investments in energy storage systems will ensure that India can be a leader inmanufacturing energy storage systems.
www.iasscore.inNotes
43Economic Survey (2017-18)
GS S
CO
RE
d) A National Mission of Mathematics will improve mathematics teaching at all levels of highereducation, seek to establish five institutes of mathematical sciences within existing institutions,conduct annual district, state and national math Olympiad competitions with sizeable scholarshipsfor all winners, with the overall goal of rapidly increasing India’s human capital and researchprofile in mathematics within a decade.
e) Improving Indian agricultural productivity, which still lags other countries such as China, as wellas creating resilience to the looming challenges in terms of rising temperatures, variableprecipitation, water scarcity, increase in pests and crop diseases requires a major thrust inagricultural science and technology. A national mission could help overcome the weaknesses inexisting institutions of agricultural research and technology.
• There are today more than 100,000 people with PhDs, who were born in India but are now livingand working outside India (more than 91,000 in the U.S. alone). However, with the strength ofIndia’s economy and growing anti-immigrant atmosphere in some Western countries, India has anopportunity to attract back more scientists. There has been an increase in the number of Indianscientists returning to work in India during the last five years, but the numbers are still modest.There are a number of government programs such as the Ramanujan Fellowship Scheme, theInnovation in Science Pursuit for Inspired Research (INSPIRE) Faculty Scheme and theRamalingaswami Re-entry Fellowship, that provide avenues to qualified Indian researchers residingin foreign countries, to work in Indian institutes/universities, and the Visiting Advanced Joint ResearchFaculty Scheme (VAJRA). These schemes could be enhanced to take advantage of opportunities torecruit in a way to build whole research groups; the inducements should be such as to allow themto do good research (laboratory resources, ability to hire post-docs, housing etc.) rather than financial,to ensure that home grown talent has a level playing field.
• Indian science and research institutes need to inculcate less hierarchical governance systems, that areless beholden to science administrators and encourage risk-taking and curiosity in the pursuit ofexcellence. Hence it is imperative that there be greater representation of younger scientists indecision making bodies in their areas of expertise.
• If science is to garner greater support from society, it will require scientists to engage more vigorouslywith society. Much of science is – and should be – a public good, and hence that will always requiresubstantial public funding. This will require much greater efforts at science communication whetherthrough the media or through regular tours and lectures for school and college students as well thegeneral public. Scientists need to create broad public support for their work and not treat it as anentitlement, given the many claims on the public purse.
Prelims Facts
• Innovations in the history of mathematics – the first use of zero – as revealed in the Bakhshalimanuscript (carbon dated to AD 200–400)
• India’s important participation (involving three major Indian research institutions) in the LaserInterferometer Gravitational-wave Observatory (LIGO) experiment successfully detected the existenceof gravitational waves. And India’s vaccines and generic-drugs have saved millions of lives the worldover.
• As a fraction of GDP, public expenditures on research have been stagnant – between 0.6-0.7 percentof GDP – over the past two decades.
• About three-fifths of the public investment is spread over the key government science fundingagencies like Atomic Energy, Space, Earth Sciences, Science and Technology and Biotechnology.

www.iasscore.in
Notes
44 Economic Survey (2017-18)
GS S
CO
RE
• India’s spending on R&D (about 0.6 percent of GDP) is well below that in major nations such asthe US (2.8), China (2.1), Israel (4.3) and Korea (4.2).
• India’s spending on R&D lags upper-middle income and high-income countries such as China, Israel,and the U.S.
• According to the WIPO, India is the 7th largest Patent Filing Office in the World.
• Laser Interferometer Gravitational-wave Observatory: The goal of the Laser InterferometricGravitational-Wave Observatory (LIGO) is to detect and study gravitational waves (GWs) ofastrophysical origin. Direct detection of GWs holds the promise of testing general relativity in thestrong-field regime, of providing a new probe of exotic objects such as black holes and neutron starsand of uncovering unanticipated new astrophysics. LIGO, a joint Caltech–MIT project supported bythe National Science Foundation, operates three multi-kilometer interferometers at two widely separatedsites in the United States.
• Mangalyaan mission: Mangalyaan is the Mars Orbiter Mission successfully Launched by IndianSpace Research Organization (ISRO).
The main objectives are to develop the technologies required for designing, planning, management and operationsof an interplanetary mission comprising the following major task:
• Orbit manoeuvres to transfer the spacecraft from Earth-centred orbit to heliocentric trajectory andfinally, capture into Martian orbit.
• Development of force models and algorithms for orbit and attitude computations and analysis.
• Navigation in all phases.
• Maintain the spacecraft in all phases of the mission.
• Meeting power, communications, thermal and payload operation requirements.
• Incorporate autonomous features to handle contingency situations.
The scientific objectives deal with the following major aspect:
• Exploration of Mars surface features by studying the morphology, topography and mineralogy.
• Study the constituents of Martian atmosphere including methane and CO2 using remote sensingtechniques.
• Study the dynamics of the upper atmosphere of Mars, effects of solar wind and radiation and theescape of volatiles to outer space.
• The mission would also provide multiple opportunities to observe the Martian moon Phobos andalso offer an opportunity to identify and re-estimate the orbits of asteroids seen during the MartianTransfer Trajectory.

www.iasscore.inNotes
45Economic Survey (2017-18)
GS S
CO
RE
Terminologies
• National Judicial Data Grid: The National Judicial Data Grid (NJDG) is a part of the on-going e-
Courts Integrated Mission Mode Project. NJDG will work as a monitoring tool to identify, manage& reduce pendency of cases. It will also help to provide timely inputs for making policy decisionsto reduce delay and arrears in the system, facilitate better monitoring of court performance and
systemic bottlenecks, and, thus, facilitate better resource management. The NJDG will cover allcategories of cases, including those relating to juvenile justice system.
• Writs in India: A writ is a formal written order issued by a Court. Any warrant, orders, directions,and so on, issued by the Supreme Court or the High court are called writs. A writ petition can be
filed in the High Court (Article 226) or the Supreme Court (Article 32) of India when any of yourfundamental rights are violated. The jurisdiction with the High Courts (Article 226) with regards toa writ petition is wider and extends to constitutional rights too.
• Injunctions: An injunction commands an act that the court regards as essential to justice, or itprohibits an act that is deemed to becontrary to good conscience. It is an extraordinary remedy,
reserved for special circumstances in which the temporarypreservation of the status quo is necessary.
• Code of Civil Procedure: The Code of Civil Procedure, 1908 is a procedural law related to the
administration of civil proceedings in India. The Code is divided into two parts: the first partcontains 158 sections and the second part contains the First Schedule, which has 51 Orders andRules. The sections provide provisions related to general principles of jurisdiction whereas the Orders
and Rules prescribe procedures and method that govern civil proceedings in India.
• Cooperative Federalism: Cooperative federalism implies the Centre and states share a horizontalrelationship, where they “cooperate” in the larger public interest. It’s visualized as an important toolto enable states’ participation in the formulation and implementation of national policies.
• Ease of Doing Business Report: The ease of doing business index is an index created by SimeonDjankov at the World Bank Group. It is an aggregate figure that includes different parameters whichdefine the ease of doing business in a country. India makes it to Top 100 in ‘ease of doing business’
EASE OF DOING BUSINESS' NEXT FRONTIER:TIMELY JUSTICE
The government's efforts to make business and commerce easy have beenwidely acknowledged. Alongwith that next frontier to be gained on the ease ofdoing business is addressing pendency, delays and backlogs in the appellateand judicial arenas. These are hampering dispute resolution and contractenforcement, discouraging investment, stalling projects, hampering taxcollections but also stressing tax payers, and escalating legal costs. This chapterrecommends how to handle the issue of pendency of cases.
Context
Economic Survey (2017-18)
9
www.iasscore.in
Notes
46 Economic Survey (2017-18)
GS S
CO
RE
• Insolvency and Bankruptcy Code (IBC), 2016: The Code highlights insolvency processes forindividuals, companies and partnership firms. It may be noted that, under IBC debtor and creditorboth can start ‘recovery’ proceedings against each other. The code will be able to protect the interestsof small investors and make the process of doing business a cumbersome-less process.
Gist of Chapter
Introduction
India jumped thirty places to break into the top 100 for the first time in the World Bank’s Ease of DoingBusiness Report (EODB), 2018. The rankings reflect the government’s reform measures on a wide rangeof indicators. India leaped 53 and 33 spots in the taxation and insolvency indices, respectively, on theback of administrative reforms in taxation and passage of the Insolvency and Bankruptcy Code (IBC),2016. It also made strides on protecting minority investors and obtaining credit, and retained a high rankon getting electricity, after a 70 spot rise in EODB, 2017 due to the government’s electricity reforms.
This striking progress notwithstanding, India continues to lag on the indicator on enforcing contracts,marginally improving its position from 172 to 164 in the latest report, behind Pakistan, Congo and Sudan.
The importance of an effective, efficient and expeditious contract enforcement regime to economicgrowth and development cannot be overstated. A clear and certain legislative and executive regimebacked by an efficient judiciary that fairly and punctually protects property rights, preserves sanctity ofcontracts, and enforces the rights and liabilities of parties is a prerequisite for business and commerce.
Steps taken by government to improve the contract enforcement regime:
• The Government: scrapped Over 1000 Redundant Legislation
• Rationalized Tribunals
• Amended The Arbitration And Conciliation Act, 2015
• Passed The Commercial Courts, Commercial Division And Commercial Appellate Division Of HighCourts Act, 2015
• Reduced Intra-Government Litigation
• Expanded the Lok Adalat Programme to reduce the burden on the judiciary.
• The government has also advanced a prospective legislative regime to ensure legal consistency,reducing chaos due to unpredictable changes in regulations.
• The judiciary has simultaneously expanded the seminal National Judicial Data Grid (NJDG) and isclose to ensuring that every High Court of the country is digitized, an endeavor recognized in EODB,2018.
Status in India
• Delays and pendency of economic cases are high and mounting in the Supreme Court, High Courts,Economic Tribunals, and Tax Department, which is taking a severe toll on the economy in terms ofstalled projects, mounting legal costs, contested tax revenues, and reduced investment more broadly.
• The average age of pending cases across these tribunals is 3.8 years.
• The creation of tribunals at different points in time did not alter pendency at the High Courts of thecountry nor their ability to deal with other economic cases.

www.iasscore.inNotes
47Economic Survey (2017-18)
GS S
CO
RE
• Delays and pendency stem from the increase in the overall workload of the judiciary, in turn dueto expanding jurisdictions and the use of injunctions and stays; in the case of tax litigation, thisstems from government persisting with litigation despite high rates of failure at every stage of theappellate process.
• Actions by the Courts and government acting together can considerably improve the situation.
• The volume of economic cases is smaller than other case categories, their average duration ofpendency is arguably the worst of most cases, nearly 4.3 years for 5 major High Courts.
• The average pendency of tax cases is particularly acute at nearly 6 years per case.
Reasons for Pendency
• One reason for the rising pendency of economic cases at the High Courts could simply be thegeneralized overload of cases. Further, economic and commercial cases are usually complex, requireeconomic expertise in their handling and disposal, and hence, require more judicial time. In someinstances, however, this increased overload is due to the expansion of discretionary jurisdictions byCourts, without any countervailing measures that either balance the scope of other jurisdictions orimprove overall administration and efficiency. For example, Articles 226 and 227 of the Constitutionof India empower High Courts with carefully circumscribed writ jurisdiction. In practice, however,High Courts have permissively and expansively interpreted this provision over a period of time,which has resulted in a substantial increase in Article 226 cases.
• Some High Courts of the country retain a unique original jurisdiction, under which the High Court,and not the relevant lower court, transforms into the Court of first instance for some civil cases.These cases occupy a significant share of the Court’s docket. The Delhi and Bombay High Courtshave original jurisdictions that occupy nearly 10-15% of their workload.
• The Supreme Court, like the High Courts, has less capacity to deal with mounting economic casesbecause of rising overall pendency. In the case of the SC, the burden derives in part from SpecialLeave Petitions under Article 136 of the Constitution of India, which empowers any party toapproach the Supreme Court directly from any court or tribunal. Initially invoked only in “exceptionalcircumstances”, SLPs are now an overwhelming feature of practice at the Supreme Court.
• Rising pendency also results from the injunction of cases by Courts. Lengthy interim orders, ex partead interim stays, increasing rate of pendency of cases at final arguments, and few final judgmentsin IPR cases are common traits of IPR practice across different High Courts. Nearly 50% of thesecases are pending at the stage of pleadings, which is the stage at which parties are required tocomplete formal requirements before hearing.
Costs of delay
• For example: The project costs (stocks) of stayed projects—at the time they were originally stayed—amounted close to 52,000 crores in six infrastructure ministries that are currently stayed by courtinjunctions, as well as the average duration of their stays.
• The overall impact of rising pendency at Appellate Tribunals, High Courts and the Supreme Court,coupled with the rising use of injunctions and other blunt instruments has led to spiraling legalexpenses of Corporate India.
Total spending on Administration of Justice by States and the Centre constitutes approximately 0.08-0.09% of GDP which is low when compared to other countries, especially common law countries.

www.iasscore.in
Notes
48 Economic Survey (2017-18)
GS S
CO
RE
The Government may consider including efforts and progress made in alleviating pendency in the lowerjudiciary as a performance-based incentive for States. Further, expenditure may be prioritized for fling,service and other delivery related issues that tend to cause the maximum delays. However, buildingadditional judicial capacity may not be effective unless existing capacity is fully utilized. The higherjudiciary is currently operating at 63.6% of existing capacity.
Policy Implications (Steps needed)
Pendency, delays and injunctions are overburdening courts and severely impacting the progress of cases,especially economic cases, through the different tiers of the appellate and judicial arenas. The Governmentand the Courts need to both work together for largescale reforms and incremental improvements tocombat a problem that is exacting a large toll from the economy. Some of the following steps may beconsidered:
1. Expanding judicial capacity in the lower courts and reducing the existing burden on the High Courtsand Supreme Court;
• For a smooth contract enforcement regime, it may be imperative to build capacity in the lowerjudiciary to particularly deal with economic and commercial cases, and allow the High Courtsto focus on streamlining and clarifying questions of law. For the same, amendments to the Codeof Civil Procedure, Commercial Courts Act and other related commercial legislations should beconsidered. These measures must be buttressed by efforts to train judges, particularly in commercialand economic cases by judicial academies.
• Downsizing or removing original and commercial jurisdiction of High Courts, and enabling thelower judiciary to deal with such cases. Early results from the Delhi High Court suggest thatreducing the size of original side jurisdiction in 2016 allowed the court more time to reduce itsoverall pendency.
• Courts may revisit the size and scale of their discretionary jurisdictions and avoid resorting tothem unless necessary, to reclaim the envisaged constitutional and writ stature of the higherjudiciary.
• Existing judicial capacity ought to be fully utilized.
2. The tax department exercising greater self restraint by limiting appeals, given its low success rate.This could either take the form of ex ante rules limiting appeals, for example, to no more than onein four High Court verdicts or no more than one in three arbitration cases; or, given the long shadowof the 3 Cs (CBI, CVC, and CAG) in inducing bureaucratic risk-aversion, perhaps an independentPanel could be created to decide on further appeals of tax verdicts against the Department. Further,the number of tiers of scrutiny may be limited to three forums for taxation cases.
3. Substantially increasing state expenditure on the judiciary, particularly on their modernization. TheGovernment may consider incentivizing expenditure on court modernization and digitization. Thisneeds to be supported with greater provision of resources for both tribunals and courts. Moreover,legislations (and perhaps even judicial decisions that expand or introduce new jurisdictions) shouldbe accompanied by judicial capacity and public expenditure memorandums, which adequately lay outthe necessary provisions required to address increasing judicial requirements, and ensure their adequatefunding. The amounts required may be negligible but the returns enormous.
4. Building on the success of the Supreme Court in disposing tax cases, creating more subject-matterand stage-specific benches that allow the Court to build internal specializations and efficiencies incombating pendency and delay.

www.iasscore.inNotes
49Economic Survey (2017-18)
GS S
CO
RE
5. Reducing reliance on injunctions and stays. Courts may consider prioritizing stayed cases, and imposestricter timelines within which cases with temporary injunctions may be decided, especially whenthey involve government infrastructure projects.
6. Improving the Courts Case Management and Court Automation Systems. To free up judicial time,initiatives like the Crown Court Management Services of the UK that are dedicated to the managementand handling of administrative duties, may be considered.
Format of special-sized benches in Supreme Court
The Supreme Court is the highest court of the land that deals with a wide array of cases. When notdealing with substantial questions of law or constitutional issues requiring the constitution of special-sized benches, the Court sits in benches comprising of two judges to decide cases from High Courtsand other forums of the country. The benches are expected to hear and decide cases from a wide rangeof subject matters inter alia constitutional law, criminal law, civil law, commercial law, and taxation.However, the Court’s recent experiment with constituting an exclusive bench for taxation producedimpressive results, which may be replicated for other subject matters, and emulated by other HighCourts that do not have special rosters for daily hearings.
Besides reducing pendency and backlog, this phase of the Supreme Court saw a large number of judgmentson law, and permitted the Court to discharge its envisaged role of clarifying and settling legal questions.
There are other profound benefits of dedicated subject-matter benches. Such benches ensure that theSupreme Court speaks in one voice, and there is continuity and consistency of legal jurisprudence.Further, they create efficiencies by allowing the judge to focus on the specialized branch of law placedbefore her. The model may be replicated for other commercial and economic areas of law as and whennecessary at the Supreme Court, and should be replicated by every High Court of the country.
Conclusion
Recent experience with the GST has shown that vertical cooperation between the center and states—Cooperative Federalism—has brought transformational economic policy changes. Perhaps there is ahorizontal variant of that— one might call it the Cooperative Separation of Powers—that could beapplied to the relationship between the judiciary on the one hand, and the executive/legislature on theother. There are, of course, clear lines of demarcation and separation of powers between the two topreserve independence and legitimacy. Even while respecting these lines, it should be possible and desirablefor these branches to come together to ensure speedier justice to help overall economic activity.
Prelims Facts
• India jumped thirty places to break into the top 100 for the first time in the World Bank’s Ease ofDoing Business Report (EODB), 2018. The rankings reflect the government’s reform measures ona wide range of indicators.
• Articles 226 and 227 of the Constitution of India empower High Courts with carefully circumscribedwrit jurisdiction.
• In the case of the SC, the burden derives in part from Special Leave Petitions under Article 136 ofthe Constitution of India, which empowers any party to approach the Supreme Court directly fromany court or tribunal. Initially invoked only in “exceptional circumstances”, SLPs are now anoverwhelming feature of practice at the Supreme Court.
• Total spending on Administration of Justice by States and the Centre constitutes approximately0.08-0.09% of GDP which is low when compared to other countries, especially common law countries.
• The higher judiciary is currently operating at 63.6% of existing capacity.
Related Documents