1 Center or American Progress | Economic Snapshot or June 2011 Economic Snapshot for June 2011 Christian E. Weller on the State of the Economy Christian E. Weller, associate professor , Department of Public Policy and Public Affairs, University of Massa chusetts Boston, and Seni or Fellow, Center for American Progress June 27, 2011 Investment growth, year over year, 2001 to 2011 f i g u r e 1 -25% -20% -15% -10% -5% 0% 5% 10% 15% M a r - 0 2 M a r - 0 1 M a r - 0 3 M a r - 0 4 M a r - 0 5 M a r - 0 6 M a r - 0 7 M a r - 0 8 M a r - 0 9 M a r - 1 1 M a r - 1 0 Te debae over ederal axes and spending has moved ron and cener as Republicans are hreaening no o raise he ederal deb ceiling unless programs are aggressively cu back. Keeping he deb ceiling in place could lower growh, slow job creaion, and damage already depressed housing wealh levels, par icularly home equiy. Recen daa on he labor and housing marke show how ragile he recovery remains. I is crucial ha policymakers secure he gains o he recovery insead o gambling wih he economic securiy o America’ s middle class. Tis means mainaining con- sumpion and invesmen growh in he shor run and addressing rade and budge decis in he medium erm. Te curren negoiaions over uure budges and he deb ceiling hus need o nd a growh-enhancing balance beween spending and revenue changes ha does no unduly burden middle-class amilies, who have already suered rom he economic allou o he Grea Recession. 1. The U.S. economy continues a moderate recovery. Gross domesic produc, or GDP, grew a an annual rae o 1.9 percen in he rs quarer o 2011, he sevenh quar er o posiive growh in a row. Consumpion grew a an annual rae o 2.2 percen, and year- over-year business invesmen growh was 9.1 percen in he rs quarer o 2011. Boh consumpion and invesmen slowed rom heir growh raes a he end o 2010 as he economy sruggled wih higher oil prices. See figure 1

Welcome message from author
This document is posted to help you gain knowledge. Please leave a comment to let me know what you think about it! Share it to your friends and learn new things together.
Transcript
8/6/2019 Economic Snapshot for June 2011
http://slidepdf.com/reader/full/economic-snapshot-for-june-2011 1/4
1 Center or American Progress | Economic Snapshot or June 2011
Economic Snapshot for June 2011Christian E. Weller on the State of the Economy
Christian E. Weller, associate professor, Department of Public Policy and Public Affairs,
University of Massachusetts Boston, and Senior Fellow, Center for American Progress
June 27, 2011
Investment growth, year over year, 2001 to 2011
-25%
-20%
-15%
-10%
-5%
0%
5%
10%
15%
M a r - 0 2
M a r - 0 1
M a r - 0 3
M a r - 0 4
M a r - 0 5
M a r - 0 6
M a r - 0 7
M a r - 0 8
M a r - 0 9
M a r - 1 0
Te debae over ederal axes and spending has moved ron and cener as Republicans
are hreaening no o raise he ederal deb ceiling unless programs are aggressively
cu back. Keeping he deb ceiling in place could lower growh, slow job creaion, and
damage already depressed housing wealh levels, paricularly home equiy.
Recen daa on he labor and housing marke show how ragile he recovery remains.
I is crucial ha policymakers secure he gains o he recovery insead o gambling
wih he economic securiy o America’s middle class. Tis means mainaining con-
sumpion and invesmen growh in he shor run and addressing rade and budge
decis in he medium erm.
Te curren negoiaions over uure budges and he deb ceiling hus need o
nd a growh-enhancing balance beween spending and revenue changes ha
does no unduly burden middle-class amilies, who have already suered rom he
economic allou o he Grea Recession.
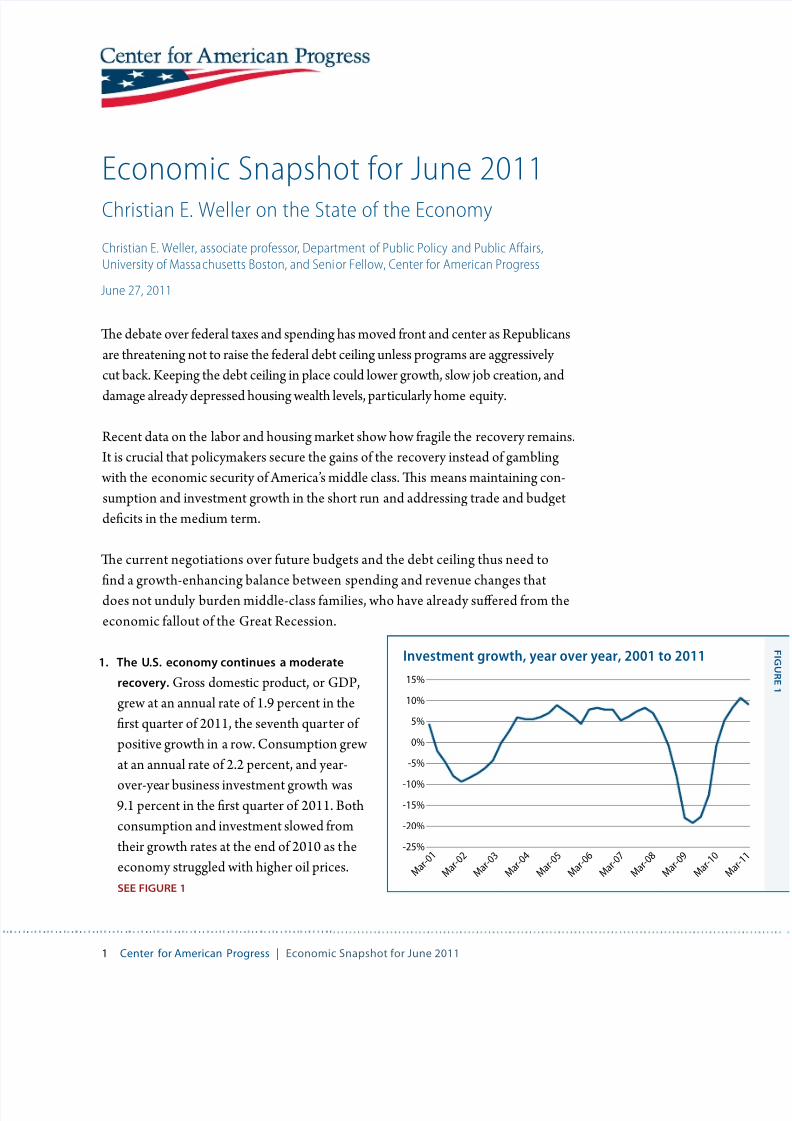
1. The U.S. economy continues a moderate
recovery. Gross domesic produc, or GDP,
grew a an annual rae o 1.9 percen in he
rs quarer o 2011, he sevenh quarer o
posiive growh in a row. Consumpion grew
a an annual rae o 2.2 percen, and year-
over-year business invesmen growh was9.1 percen in he rs quarer o 2011. Boh
consumpion and invesmen slowed rom
heir growh raes a he end o 2010 as he
economy sruggled wih higher oil prices.
See figure 1

8/6/2019 Economic Snapshot for June 2011
http://slidepdf.com/reader/full/economic-snapshot-for-june-2011 2/4
2 Center or American Progress | Economic Snapshot or June 2011
Inflation-adjusted gasoline prices for a gallon o
regulargasoline, 1976 to 2011
Calculations based on Board of Governors, Federal Reserve, 2009, Flow of Funds Accounts of theWashington, D.C.: BOG
$1.0
$1.5
$2.0
$2.5
$3.0
$3.5
$4.0
$4.5
J a n - 7 6
J a n - 8 0
J a n - 8 4
J a n - 8 8
J a n - 9 2
J a n - 9 6
J a n - 0 0
J a n - 0 4
J a n
Dollars per gallon (in 2011 dollars)
2. The trade deficit stays high. Te U.S. rade deci sood a 3.7 percen o GDP
in he rs quarer o 2011, up rom 3.3 percen o GDP in he ourh quarer o
2010. U.S. expor growh sayed srong in he rs quarer o 2011, increasing
7.6 percen, compared o an increase o 8.6 percen a he end o 2010. Bu U.S.
impor growh acceleraed o 5.1 percen in he rs quarer o 2011, up rom
-12.6 percen in he ourh quarer o 2010.2
3. The labor market recovery slowly adds jobs in the private sector. Te U.S.
economy coninuously added privae-secor jobs rom February 2010 o May
2011 or a oal o 2.1 million jobs. Tis included 83,000 new jobs in April 2011. 3
4. Unemployment stays high because of a massive jobs hole. Tere were
sill 6.9 million ewer jobs in May 2011 han a he sar o he recession in
December 2007, and he populaion has also grown since hen, puting he
labor marke deeper ino he hole han he raw number suggess. Te unem-
ploymen rae has hence remained subbornly high a 9.1 percen in May 2011.4
5. Unemployment stays high among the most vulnerable. Te Arican American
unemploymen rae in April 2011 rose o 16.2 percen, he Hispanic
unemploymen rae o 11.9 percen, and he unemploymen rae or whies
remained seady a 8.0 percen. Youh unemploymen sood a a high
24.2 percen. And he unemploymen rae or
people wihou a high school diploma climbed
o 14.7 percen, compared o 9.5 percen or
hose wih a high school diploma and 4.5
percen or hose wih a college degree.5
6. Rapidly rising oil prices threaten a fledgling
recovery. A gallon o regular gasoline cos
abou $3.80 or more hroughou May 2011.
Tis is he highes gasoline price since Augus
2008.6 See figure 2
7. Employer-provided health insurance benefits
continue to disappear. Te share o people wih employer-provided healh insurance
dropped rom 64.2 percen in 2000 o 55.8 per-
cen in 2009. Tis is he lowes share since 1987
when he Census sared o rack hese daa.7
8/6/2019 Economic Snapshot for June 2011
http://slidepdf.com/reader/full/economic-snapshot-for-june-2011 3/4
3 Center or American Progress | Economic Snapshot or June 2011
8. Family incomes drop sharply in the recession. Median inaion-adjused
household income ell 3.6 percen in 2008 and by anoher 0.7 percen in 2009.
I sood a $49,777 in 2009, is lowes level in inaion-adjused dollars since
1997. Whie amily income sood a $54,461, compared o Arican American
amily income, which was $32,584, or 59.8 percen o whie income. Hispanic
amily income was $38,039 in 2009, or 69.8 percen o whie income.8
9. Poverty continues to rise. Te povery rae sood a 14.3 percen in 2009—is
highes rae since 1994. Te Arican American povery rae was 25.8 percen,
he Hispanic rae was 25.3 percen, and he whie rae was 9.4 percen in 2009.
Te povery rae or children under he age o 18 sood a 20.7 percen. More
han one-hird o Arican American children (35.7 percen) lived in povery
in 2009, compared o 11.9 percen o whie children and 33.1 percen o
Hispanic children.9
10. Family wealth losses linger. oal amily wealh was down $12.4 rillion (in2011 dollars) rom June 2007—is las peak—o March 2011, despie srong
gains in he sock marke since early 2009. Home equiy says low, such ha
homeowners on average sill own only 38.1 percen o heir homes, wih he
res owed o banks.10 Tis is he lowes share on record going back o 1952.
11. Debt levels are still high. oal household deb equaled 114.1 percen o afer-
ax income in March 2011. Tis is down rom a record high o 130.2 percen
in Sepember 2007 bu sill higher han a any poin beore Sepember 2004.11
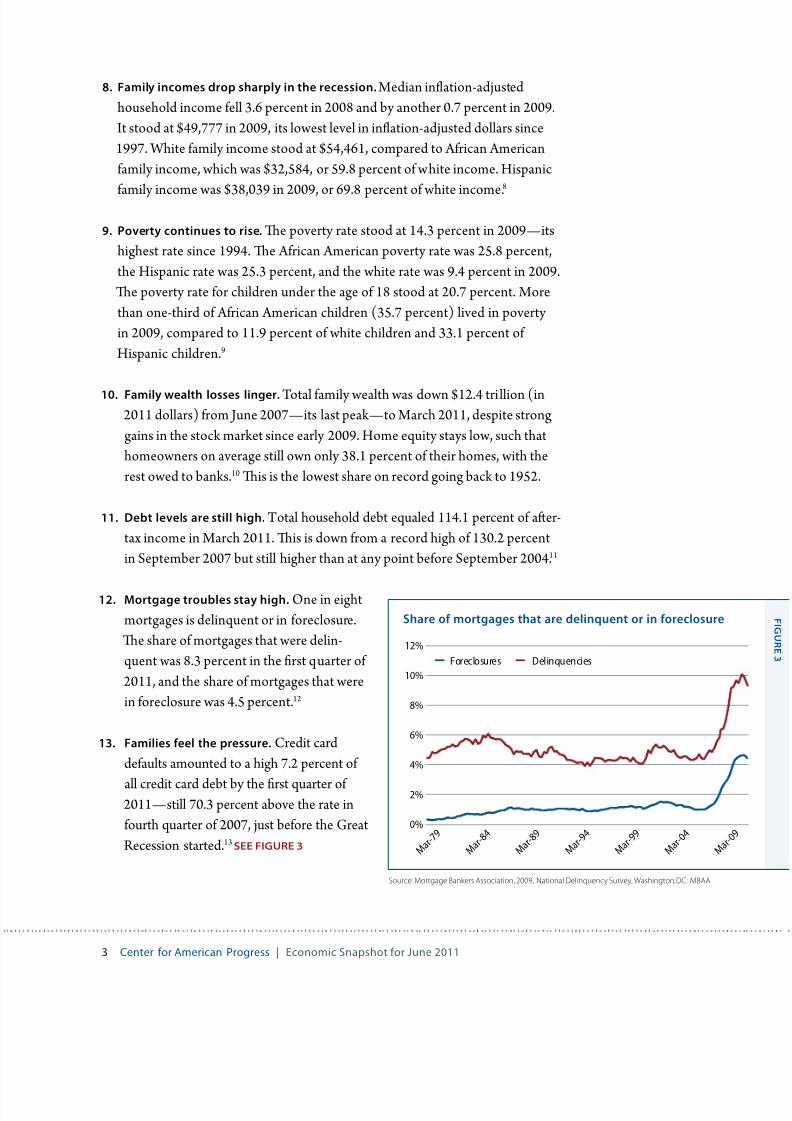
12. Mortgage troubles stay high. One in eigh
morgages is delinquen or in oreclosure.
Te share o morgages ha were delin-
quen was 8.3 percen in he rs quarer o
2011, and he share o morgages ha were
in oreclosure was 4.5 percen.12
13. Families feel the pressure. Credi card
deauls amouned o a high 7.2 percen o
all credi card deb by he rs quarer o 2011—sill 70.3 percen above he rae in
ourh quarer o 2007, jus beore he Grea
Recession sared.13See figure 3
Share of mortgages that are delinquent or in foreclosur
Foreclosures Delinquencies
0%
2%
4%
6%
8%
10%
12%
M a r - 7 9
M a r - 8 4
M a r - 8 9
M a r - 9 4
M a r - 9 9
M a r - 0 4
M
Source: Mortgage Bankers Association, 2009, National Delinquency Survey, Washington, DC: MBAA.

8/6/2019 Economic Snapshot for June 2011
http://slidepdf.com/reader/full/economic-snapshot-for-june-2011 4/4
4 Center or American Progress | Economic Snapshot or June 2011
Endnotes
1 All GDP data are rom: Bureau o Economic Analysis, National Income and Product Accounts, (Department o Commerce,2011). Investment growth is expressed as year-over-year change, rather than the most recent quarterly change by itsel,as quarterly investment data can be more volatile than consumption data.
2 Trade decit as share o GDP are calculated as share o net exports out o nominal GDP, based on: Bureau o EconomicAnalysis, National Income and Product Accounts.
3 Employment growth data are calculated based on: Bureau o Labor Statistics, Current Employment Statistics (Department
o Labor, 2011). The Current Employment Statistics are also known as the payroll survey.
4 Unemployment numbers are taken rom: Bureau o Labor Statistics, Current Population Survey (Department o Labor,2011). The Current Population Survey is also k nown as the household survey.
5 Unemployment rates by demographic characteristics are taken rom: Bureau o Labor Statistics, Current Population Survey .
6 Gasoline prices are taken rom: Energy Inormation Administration, Petroleum Prices (Department o Energy, 2010). Pricesreer to the average or regular gasoline since it oers the longest period or time comparisons.
7 Data or health insurance are rom: Bureau o the Census, Income, Poverty, and Health Insurance Coverage in the United States: 2009 (Department o Commerce, 2010). This report is occasionally reerred to as the poverty report.
8 Data or amily incomes are rom: Bureau o the Census, Income, Poverty, and Health Insurance Coverage in the United States: 2009.
9 Data or poverty rates are rom: Bureau o the Census, Income, Poverty, and Health Insurance Coverage in the United States: 2009.
10 Wealth calculations are based on: “Federal Reserve Statistical Release Z.1 - Flow o Funds Accounts o the United States,”available at http://www.ederalreserve.gov/releases/z1/. Real wealth is the nominal wealth defated by the price indexor the Personal Consumption Expenditure index. The Personal Consumption Expenditure index is rom: Bureau o Economic Analysis, National Income and Product Accounts.
11 Debt calculations are based on: “Federal Reserve Statistical Release Z.1.” Debt levels are the ratio o the nominal debtlevels divided by the nominal disposable personal income. Debt reers to total credit instruments.
12 Data are taken rom: Mortgage Bankers Association, “National Delinquency Survey” (2011).
13 Data are taken rom: “Charge-O and Delinquency R ates on Loans and Leases at Commercial Banks,” available athttp://www.ederalreserve.gov/releases/chargeo/. The charge-o rates reported here are the seasonally adjustedrates or all banks.
Related Documents