Economic Revitalization in Bedford-Stuyvesant overview process vision conclusion

Welcome message from author
This document is posted to help you gain knowledge. Please leave a comment to let me know what you think about it! Share it to your friends and learn new things together.
Transcript

Economic Revitalization in Bedford-Stuyvesant
overview process vision conclusion

The Client
overview methodology proposal conclusion
CNEDMayor’s Office of Comprehensive Neighborhood
Economic Development
CIBSCoalition for the Improvement of Bedford
Stuyvesant
City of New York
EDCEconomic
Development Corporation
Bridge Street Development Corporation
Bedford Stuyvesant Restoration Corporation
City Council Representative, CBOs, Merchant Associations, and Community Leaders,
Neighborhood Advisory Board, Religious Organizations, NYCHA Resident Council
SBSSmall
BusinessServices
HPDHousing
PreservationDevelopment

Site Selection Process
34.5% of Bedford-Stuyvesant residents lived in poverty
18% were unemployed
Median income was $25,000
Median income was 27% below Brooklyn average
Strong institutional partners: Bed-Stuy is the site of the first CDC, Bedford-Stuyvesant Restoration Corporation (a CIBS member)
Availability of city-owned land
Source: CNED City Council Hearing, CNED Site Selection Presentation, CNED Saratoga Site Development Presentation
overview methodology proposal conclusion
Bedford-Stuyvesant in 2005

CNED’s Objectives
overview methodology proposal conclusion
Photo of Franklin Thomas, president and CEO of Bedford Stuyvesant Restoration Corporation from 1967-1977
Workforce development
Commercial revitalization
Personal asset development

Recommend highest and best uses for undeveloped parcels on Saratoga Square to be used in RFP
Studio Mandate
overview methodology proposal conclusion
Recommend highest and best uses for undeveloped parcels on Saratoga Square to be used in RFP
Studio Mandate
overview methodology proposal conclusion

Studio Mandate
overview methodology proposal conclusion
Develop a strategy for expanding the retail potential of Fulton Street and the North-South Corridors
Link commercial corridors

Client Requests
overview methodology proposal conclusion
Mixed-use
Incubator
Sustainable development
Specialty food store
Art space
Restaurant
Retail uses for small spaces
Affordable housing
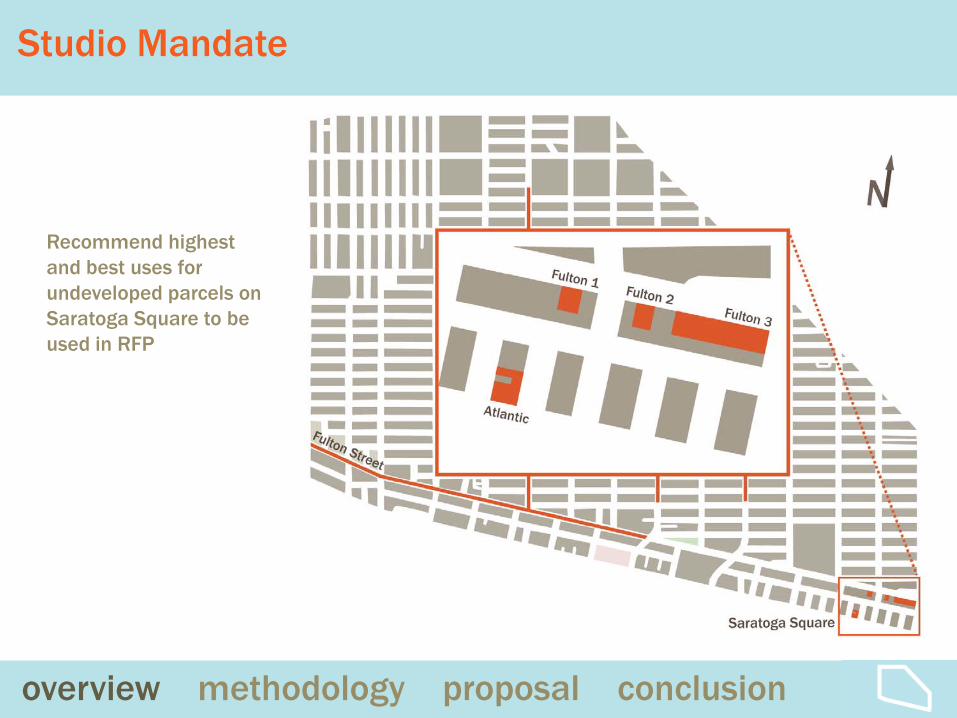
Studio Mission Statement
Find appropriate uses for the city owned parcels in order to achieve comprehensive
community revitalization and strengthen retail corridors and existing retail clusters
overview methodology proposal conclusion

Critical Perspective
Complexity of the initiative and organizational structure of CNED
Community representation
Location of parcels in southeastern corner of Bedford-Stuyvesant
overview methodology proposal conclusion

Community Input
Plan informed by input of community members that attended Town Hall meetings and participated in workshops and intercept studies
“The plan was formally endorsed by Community Board #3”
2002 study makes retail recommendations
overview methodology proposal conclusion

overview methodology proposal conclusion
2002 Fulton Street Retail Inventory
2002 inventory of mix of ground level spaces and type of use

2009 Studio Inventory
overview methodology proposal conclusion
overview methodology proposal conclusion
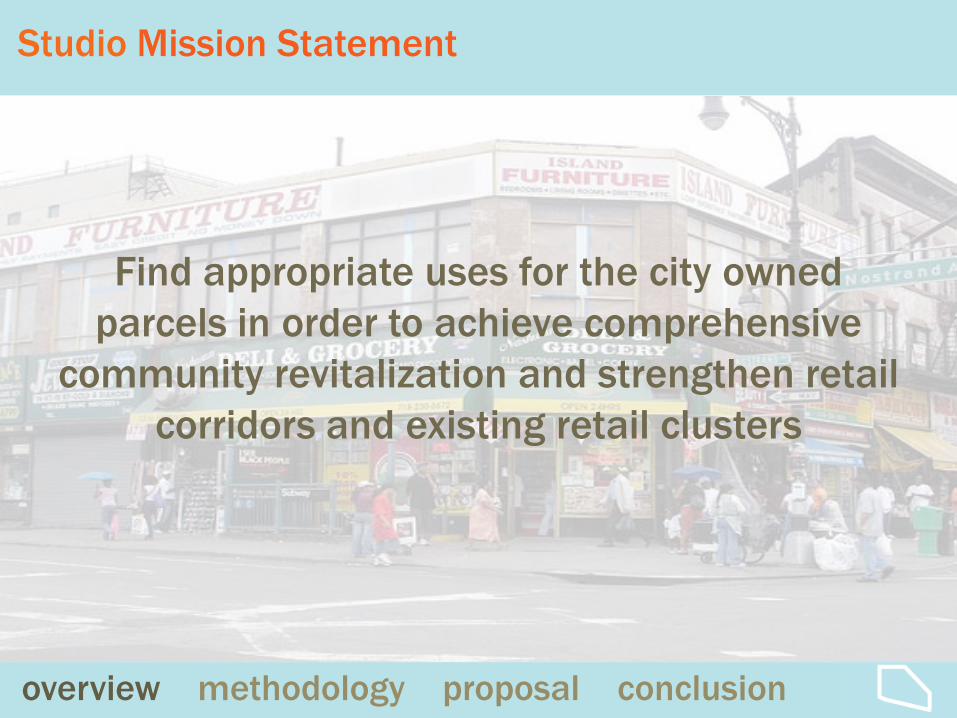
Primary Retail Study Areas
Sales: $590 MillionLeakage: $817 Million
Sales: $531 MillionLeakage: $361 Million
Nostrand-Fulton Saratoga Square

$0.6M
$23.1M
$31.1M
$60.5M
$22.6M
$9.2M
$2.6M
$11.6M
$23.4M
$29.0M
$15.6M
$6.9M
0 20 40 60 80 100
Beer, Wine, and Liquor Stores
Specialty Food Stores
Full-Service Restaurants
Limited-Service Eating Places
Special Food Services
Drinking Places - Alcoholic Beverages
Leakage Factor
Esta
blis
hmen
ts in
Cul
inar
y In
dust
ry
Saratoga Square
Nostrand/Fulton
overview methodology proposal conclusion
Retail Analysis
Retail Analysis of Food-Related Industries

$-
$50
$100
$150
$200
$250
$300
$350
$400
$450
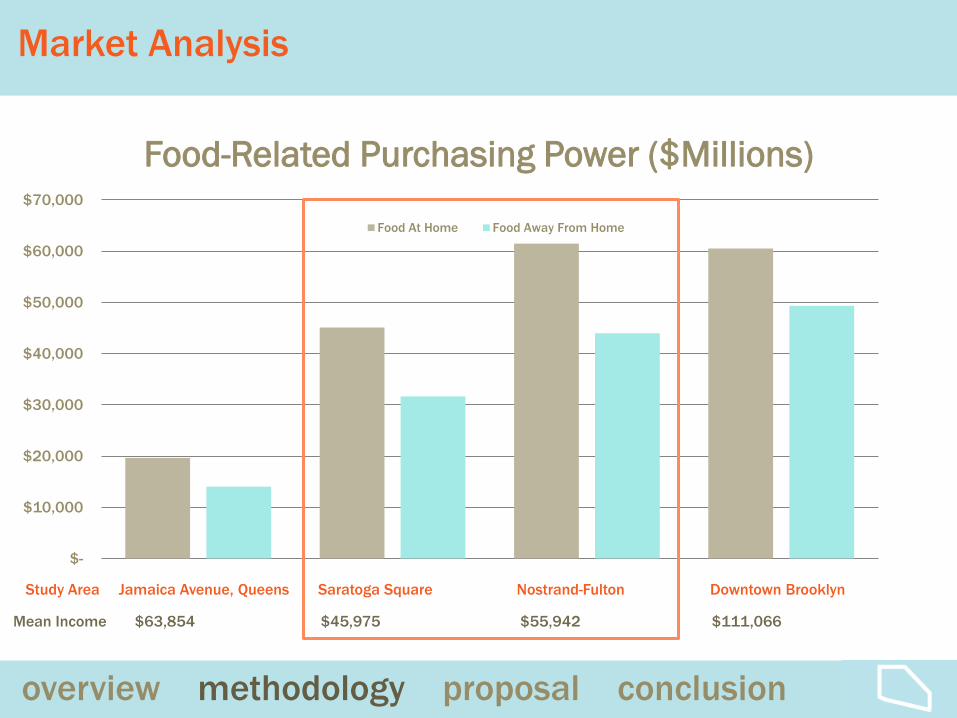
Market Analysis
Retail Purchasing Power
overview methodology proposal conclusion
($M
illio
ns)
Jamaica Avenue, Queens Saratoga Square Nostrand-Fulton Downtown Brooklyn
$63,854 $45,975 $55,942 $111,066Mean Income
Study Area
$-
$10,000
$20,000
$30,000
$40,000
$50,000
$60,000
$70,000
Food At Home Food Away From Home
Jamaica Avenue, Queens Saratoga Square Nostrand-Fulton Downtown Brooklyn
$63,854 $45,975 $55,942 $111,066Mean Income
Study Area
Market Analysis
Food-Related Purchasing Power ($Millions)
overview methodology proposal conclusion

Retail Clusters
overview methodology proposal conclusion
Restaurants

Retail Clusters
overview methodology proposal conclusion
Specialty Food Stores

Retail Clusters
overview methodology proposal conclusion
Art Galleries

Retail Clusters
overview methodology proposal conclusion

Retail Linkage Strategy
overview methodology proposal conclusion

Saratoga Square Overview
Atlantic SiteCulinary UseHousingM1-1/R7D Fulton Site 3
Retail SpaceHousingC2-4
Fulton Site 2Retail/Gallery SpaceHousingC2-4
Fulton Site 1Vendor MarketArtist Live/Work SpaceC2-4
overview methodology proposal conclusion

Transportation
overview methodology proposal conclusion

Live⌂Work Artist Space
Fulton Site 1Up to 116,000 Square Feet ofArtist Live/Work Space13,000 Square Feet of ParkingC2-4
overview methodology proposal conclusion

Workspace and housingCost-savingCommunity/shared spaceMixed use developmentNon-profit/CDC driven
overview methodology proposal conclusion
Live⌂Work Artist Space

“Community Board #3 is currently home to many artists and the former home to many others. It is also the home of a significant number of art and cultural organizations … However, many, if not all
of them, exist at the edge of financial peril--undercapitalized, under-funded
and under-staffed.”Brooklyn Community Board 3 District Needs Assessment, 2007-2008
overview methodology proposal conclusion
Live⌂Work Artist Space

Live⌂Work Artist Space
overview methodology proposal conclusion 2005-2007 American Community Survey
Employment in the Arts by Public Use Microdata Area

overview methodology proposal conclusion
Pratt InstituteBeSAASONYA35 Claver Pl.House of ArtSkylight GallerZion GalleryAfroArt DesignsBrooklynite Gallery123 Community Space Magnolia Earth Tree CenterCentral Brooklyn Jazz Consortium IronworkNY178 Walworth StreetSputnikLab 24/720/20 ArtFish GalleryLewis GalleryRed Creative Art Concept StudioWelancora Gallery
Live⌂Work Artist Space

Live⌂Work Artist Space
overview methodology proposal conclusion
Retail
Cond-Op
Residential Limited equity Co-op
Long term affordabilityCB3 residential requirement
Not-for-profit public/private partnership

Live⌂Work Artist Space
Site Fulton
Total Floor Space 116,000
Cost/Square Foot $151*
Construction Cost $17,495,615
Size of Artist Unit 1,000*
Number of Units 88
60% Market Rate Units at $360,000 52*
40% Below Market Rate at $80,000 36*
Loan at 75% of Construction Cost $13,121,711
Equity at 25% $4,373,903
Total Revenue from Sales $21,600,000
Net Income $8,478,289
Return on Equity (Before developer fees) $4,104,386
overview methodology proposal conclusion
*average development cost for artist live/work space *minimum studio size *Average home sale for 1 bedroom apartment in Bedford-Stuyvesant (hotpads.com)*(30% of 80% of AMI taken from the U.S. Census 2007*/0.1) is feasible loan
Financial Projections
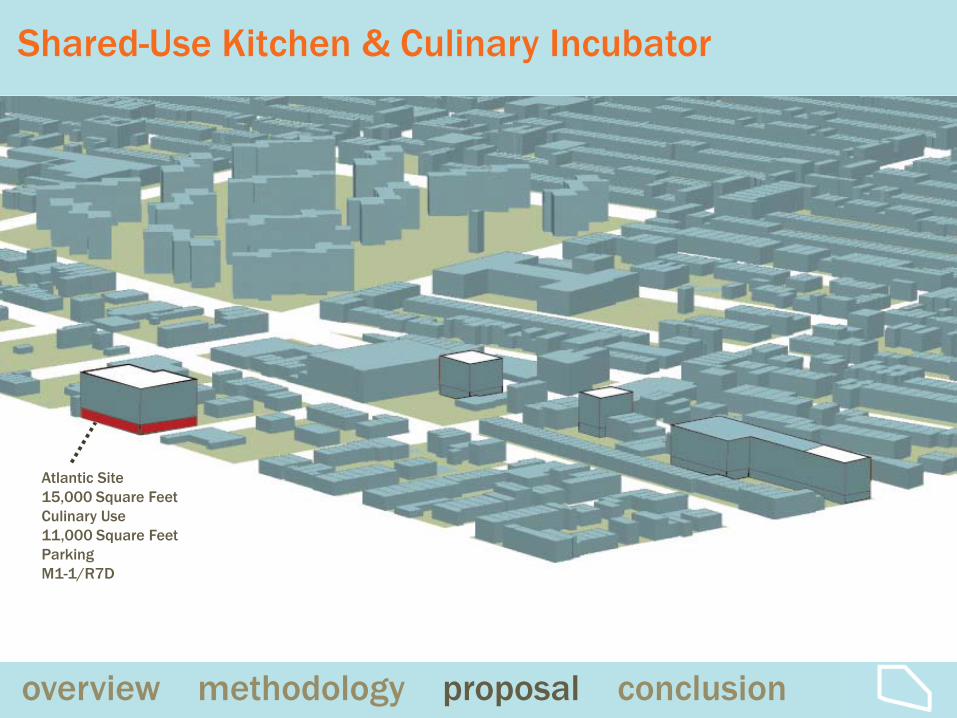
Shared-Use Kitchen & Culinary Incubator
Atlantic Site15,000 Square FeetCulinary Use11,000 Square FeetParkingM1-1/R7D
overview methodology proposal conclusion

Shared-Use Kitchen & Culinary Incubator
Shared-Use Kitchen
CulinaryIncubator
Services kitchen rental educational focus & skills training
equipment rental job referrals
storage rental business and finance training & services
Purpose reduce individual expenses
support beginners as well as professionals
support new businesses & entrepreneurs
support new businesses& entrepreneurs
support struggling businesses
link job seekers with businesses
recreational uses identify markets
overview methodology proposal conclusion
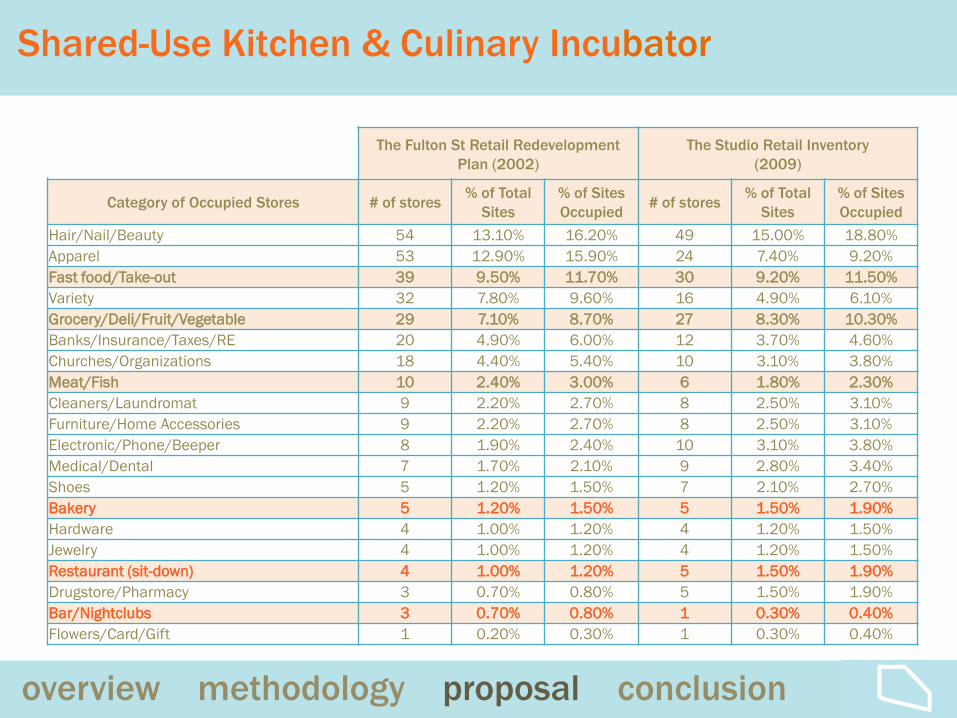
Shared-Use Kitchen & Culinary Incubator
The Fulton St Retail Redevelopment Plan (2002)
The Studio Retail Inventory (2009)
Category of Occupied Stores # of stores % of Total Sites
% of Sites Occupied # of stores % of Total
Sites% of Sites Occupied
Hair/Nail/Beauty 54 13.10% 16.20% 49 15.00% 18.80%Apparel 53 12.90% 15.90% 24 7.40% 9.20%Fast food/Take-out 39 9.50% 11.70% 30 9.20% 11.50%Variety 32 7.80% 9.60% 16 4.90% 6.10%Grocery/Deli/Fruit/Vegetable 29 7.10% 8.70% 27 8.30% 10.30%Banks/Insurance/Taxes/RE 20 4.90% 6.00% 12 3.70% 4.60%Churches/Organizations 18 4.40% 5.40% 10 3.10% 3.80%Meat/Fish 10 2.40% 3.00% 6 1.80% 2.30%Cleaners/Laundromat 9 2.20% 2.70% 8 2.50% 3.10%Furniture/Home Accessories 9 2.20% 2.70% 8 2.50% 3.10%Electronic/Phone/Beeper 8 1.90% 2.40% 10 3.10% 3.80%Medical/Dental 7 1.70% 2.10% 9 2.80% 3.40%Shoes 5 1.20% 1.50% 7 2.10% 2.70%Bakery 5 1.20% 1.50% 5 1.50% 1.90%Hardware 4 1.00% 1.20% 4 1.20% 1.50%Jewelry 4 1.00% 1.20% 4 1.20% 1.50%Restaurant (sit-down) 4 1.00% 1.20% 5 1.50% 1.90%Drugstore/Pharmacy 3 0.70% 0.80% 5 1.50% 1.90%Bar/Nightclubs 3 0.70% 0.80% 1 0.30% 0.40%Flowers/Card/Gift 1 0.20% 0.30% 1 0.30% 0.40%
overview methodology proposal conclusion

Shared-Use Kitchen & Culinary Incubator
Artisan Baking CenterLong Island City, NY
Partners:LaGuardia Community College Small Business CenterWorkforce 1 Career CenterConsortium for Worker EducationFood From New YorkLocal Unions
New York City Culinary Incubators, Shared Use Kitchens, and Institutional Partners
overview methodology proposal conclusion
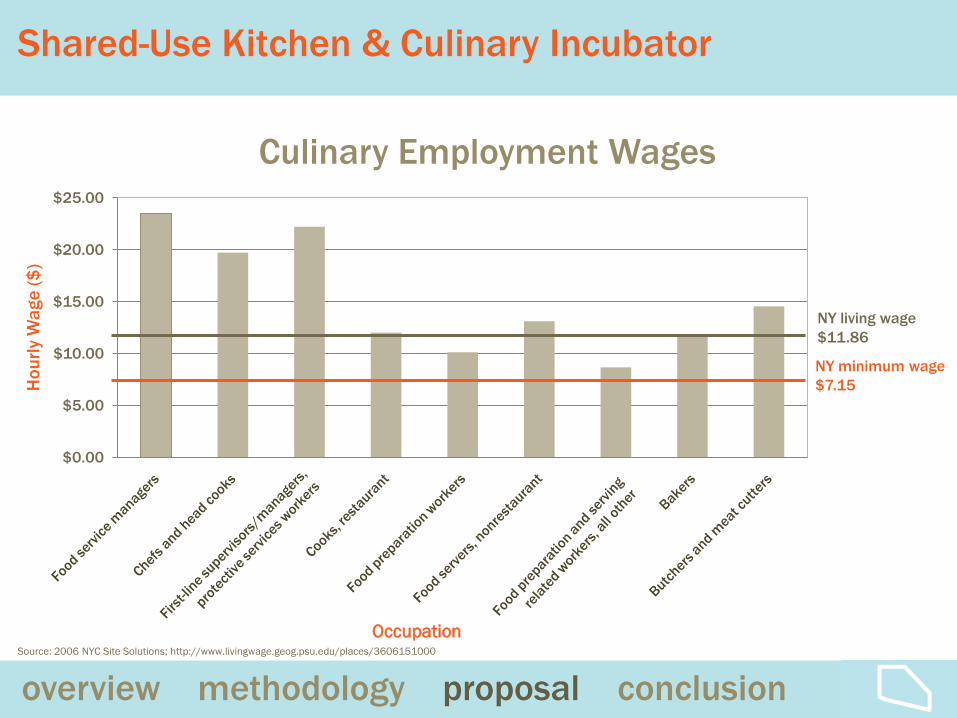
Shared-Use Kitchen & Culinary Incubator
$0.00
$5.00
$10.00
$15.00
$20.00
$25.00
Hou
rly W
age
($)
Occupation
Culinary Employment Wages
Source: 2006 NYC Site Solutions; http://www.livingwage.geog.psu.edu/places/3606151000
NY minimum wage $7.15
NY living wage $11.86
overview methodology proposal conclusion

Shared-Use Kitchen & Culinary Incubator
Financial Assistance Programs
Tax Incentives Financial Incentive Loan Assistance
Corporation for Enterprise Development & National Fund for
Enterprise Development: The Self-Employment Tax Incentive
New York State Department of Labor: On-the-Job Training Program
New York Business Development Corporation:
Small Business Loan Program
IRS: Making Workers Pay Tax Credit
New York State Department of Labor: ADVANCE Grants
New York City: Capital Access Loan Program
New York State & Local Sales and Use Tax Exemption
NYC Small Business Services: Business Solutions Training Funds
Brooklyn Cooperative: Business Loan Program
overview methodology proposal conclusion

Shared-Use Kitchen & Culinary Incubator
Startup Equipment BudgetShared-Use Kitchen Equipment (#) Cost ($)
Commercial Stove/Oven (3) 3,135 Dishwashing Machine (3) 27,000 Hood System (3) 6,057 Flat Top (3) 3,816 Salamander (3) 4,581 Low Boy (6) 6,927 Freezer (6) 20,514 Prep Table (6) 2,145 Steam Table (6) 1,434 Food Warmer (3) 327 Coffee/Tea Machine (3) 624 Pots, Pans, etc. 30,000 Walk-in Storage 30,000 TOTAL 136,560
Source: Harden, Neal – Executive Chef of Pure Food & Wine, NYC.
overview methodology proposal conclusion

Shared-Use Kitchen & Culinary Incubator
Source: Boise State University / Idaho Business and Economic Development Center (2005), “Feasibility Study: Establishing a shared-use commercial kitchen incubator.”Harden, Neal – Executive Chef of Pure Food & Wine, NYC.
Financial Projection
1st Year ($) 2nd Year ($) 3rd Year ($)
PROJECTED REVENUE
Kitchen Rental 264,600 291,060 320,166
Dining Space Rental 20,160 22,176 24,394
Storage Rental 6,000 12,000 15,000
Educational & Consulting Programs 2,000 4,000 6,000
Total Revenue 292,760 329,236 365,560
PROJECTED EXPENSES
Personnel Salaries 210,000 210,000 225,000
Utilities (electricity, water, gas) 72,000 79,200 87,120
Equipment Rental, Maintenance & Repair 5,000 17,000 19,000
Marketing 5,000 8,400 8,700
Supplies 3,000 3,500 4,000
Insurance 8,000 8,800 9,680
Total Expenses 303,000 326,900 353,500
NET OPERATING COST (10,240) 2,336 12,060
overview methodology proposal conclusion

Shared-Use Kitchen & Culinary Incubator
BenefitsCreates new business and jobs
Supports existing culinary businesses
Maintains light industrial as-of-right use of Atlantic Avenue site
Works with food recycling program, local CSAs and meal distribution centers
LimitationsRaising sufficient start-up and maintenance capital
Generating sustainable revenue to meet operating costs
overview methodology proposal conclusion

Indoor Vendor Market
Fulton Site 123,000 Square FeetVendor Market13,000 Square Feet ParkingC2-4
overview methodology proposal conclusion

Indoor Vendor Market
overview methodology proposal conclusion
Access to local healthy food options
Business opportunity for users of live/work and culinary spaces
Personal asset management and self-employment opportunities
Employment opportunities for local residents and entrepreneurs
Support for local farmer’s markets and CSAs

Indoor Vendor Market
overview methodology proposal conclusion
Source: NYS Department of Agriculture and Markets
Supermarkets to People by Community District
Grocery Stores & Supermarkets
Less than City Average Ratio
Between City Average Ratio and City Planning Std RatioParks
Community District Boundary
Bedford-Stuyvesant
Source: NYS Department of Agriculture and Markets

Indoor Vendor Market
overview methodology proposal conclusion
Name of Bodega Canned Fruit?
2 Fruits, Vegetables?
Low-Fat Milk?
Low-Sodium Soup or Vegetables?
Whole Grain
Bread?
Healthy Meal
Options?
Bottled Water Displayed at Eye
Level?
Peace Deli x x x x xGame Stars Deli x x x x x x xLeonardo Meat Market x x x xFulton Super Deli x x x x
Atlantic Deli & Grocery x x x xStephie’s Deli & Grocery x xOakland Food Corporation x x x
Farmer John's x x x x x
EZ Pass x x x x x
Honey Dew x x x
Bodega Assessment

Indoor Vendor Market
overview methodology proposal conclusion
Bed-Stuy Farm Share
Local Farmer’s Markets
New Amsterdam Market

Indoor Vendor Market
overview methodology proposal conclusion

Indoor Vendor Market
overview methodology proposal conclusion
Green roof tax credit equal to approximately 25% of overall costs
Provide a shorter supply chain for fresh produce
Potential use by market or shared-use kitchen
Green Roof Garden

Indoor Vendor Market
overview methodology proposal conclusion
1st year ($) 2nd year ($) 3rd year ($) PROJECTED REVENUE Vendor Rent ($19/SF)* 2,600,000 2,600,000 2,600,000
Government Grants** 58,000 58,000 58,000
Total Revenue 2,660,000 2,660,000 2,660,000PROJECTED EXPENSES Vendor Market Buildout* 3,000,000 - -
Facility Maintenance*** 555,000 555,000 555,000
Variable Costs**** 250,000 - -
Exhaust System ($25,000/Stall) 250,000 - -
Total Expenses 3,800,000 555,000 555,000
*Essex Market, ** Green Roof Tax Credit, *** Mart 125, **** Lexington Market
Financial Projections

Indoor Vendor Market
overview methodology proposal conclusion
Challenges:
Funding
Few high level positions
Providing adequate support to entrepreneurs
Potential Funding Sources:
Project for Public Spaces (PPS) Grants
USDA Community Food Projects Grants
Robert Wood Johnson Foundation
Green Roof Tax Credit
New York City

Saratoga Square Summary
Atlantic SiteCulinary UseHousingM1-1/R7D Fulton Site 3
Retail SpaceHousingC2-4
Fulton Site 2Retail/Gallery SpaceHousingC2-4
Fulton Site 1Vendor MarketArtist Live/Work SpaceC2-4
overview methodology proposal conclusion

Retail Linkage Strategy
overview methodology proposal conclusion

Streetscaping
overview methodology proposal conclusion

Streetscaping
overview methodology proposal conclusion

Streetscaping Improvements
overview methodology proposal conclusion

Streetscaping Improvements
overview methodology proposal conclusion

Streetscaping Improvements
overview methodology proposal conclusion

Streetscaping Improvements
overview methodology proposal conclusion

Streetscaping Improvements
overview methodology proposal conclusion

Streetscaping Improvements
overview methodology proposal conclusion

Conclusion
Mixed-use
Incubator
Sustainable development
Access to healthy food
Art space
Affordable housing
overview methodology proposal conclusion

Economic Development Bedford-Stuyvesant
overview process vision conclusion
CASEY WANG BRENDAN SHERA KEVIN THURMAN JAMES SIMMONS TORU ONARI DAVID ZYCK GITA SUBRAMONY MEGGY HUDSON SIMONE GREENBAUM LINDSAY CASPER ALISON MAYER
PROFESSOR: STACEY SUTTON TA: CATHERINE KIM
Related Documents