Economic Review June 2016

Welcome message from author
This document is posted to help you gain knowledge. Please leave a comment to let me know what you think about it! Share it to your friends and learn new things together.
Transcript

Economic ReviewJune 2016

© National Bank of Belgium
All rights reserved. Reproduction of all or part of this publication for educational and non‑commercial purposes is permitted provided that the source is acknowledged.
ISSN 1780 ‑ 664X
5June 2016 ❙ CoNtENtS ❙
Contents
ECONOMIC PROJECTIONS FOR BELGIUM – SPRING 2016 7
THE ABC OF QUANTITATIVE EASING OR THE BASICS OF CENTRAL BANK ASSET PURCHASES 29
THE ECONOMIC CONSEQUENCES OF THE FLOW OF REFUGEES INTO BELGIUM 43
INTERNAL RESOURCES, BANK CREDIT AND OTHER FUNDING SOURCES : WHAT ARE THE ALTERNATIVES FOR BUSINESSES IN BELGIUM ? 63
THE 2014 SOCIAL BALANCE SHEET 85
SUMMARIES OF ARTICLES 117
ABSTRACTS FROM THE WORKING PAPERS SERIES 121
CONVENTIONAL SIGNS 125
LIST OF ABBREVIATIONS 127
June 2016 ❙ Economic proJEctions for BElgium – spring 2016 ❙ 7
Economic projections for Belgium – spring 2016
introduction
for some time now, the world economy has regularly experienced phases of intense economic and financial turbulence which frequently originate from the situation in emerging countries. that was the case, for instance, in the summer of 2015, but also after the closure of the Bank’s latest autumn projections, when the global economy again appeared to falter, reproducing a now familiar sce-nario. there was mounting concern over the scale of the growth slowdown and the level of debt in a number of emerging economies, headed by china. that situation trig-gered a renewed fall in commodity prices, particularly the prices of petroleum products. the growing fears about the world economy subsequently spread to the financial markets, where a more marked risk aversion, particularly at the beginning of the year, again resulted in relatively high volatility. While the emerging countries’ currencies continued to depreciate, stock markets plunged world-wide, following a partial recovery in the autumn of 2015. Moreover, investors’ search for secure assets reinforced the downward trend in interest rates on government bonds in the advanced economies. In the euro area, that financial volatility was further heightened by renewed concern over the resilience of certain financial institutions.
fears of a further appreciation of the us dollar following the start of the process of normalising interest rate policy in the United States in December 2015 also cast a shadow over this picture : as emerging countries’ debts are often denominated in dollars, some observers feared that a higher dollar would render that debt even more untenable, unleashing a severe debt crisis which could develop into another deep global recession. At the start of the year, confidence indicators therefore fell and growth estimates were revised downwards, as is evident for instance from
the update of the Eurosystem’s December forecasts for the euro area, published by the EcB in march.
furthermore, the trade intensity of world growth remained surprisingly low. following a limited recovery in the third quarter, the growth of world trade – and hence the growth of foreign demand for European exporters – slowed sharply again at the end of 2015. Over 2015 as a whole, the euro area’s foreign markets ultimately expanded by barely 0.6 %, well short of the figure for world growth excluding the euro area. One reason being the marked decline in demand for imports from china, russia, Brazil and other emerging countries. in the advanced countries, too, growth seemed to stall at the end of the year. According to the statistics for the first quarter of 2016, the US economy hardly expanded at all, while growth in Japan was particularly feeble and fragile, with a further contraction in the final quarter of last year.
However, the concern over global growth gradually sub-sided, and the financial markets and oil prices began to pick up from mid-February. In the euro area, the first monthly data, including those relating to industrial output and retail sales at the start of the year, suggested that the underlying economic situation was better than the finan-cial markets and confidence indicators implied. That was borne out by the quarterly statistics published by Eurostat at the end of April : after losing ground during 2015, the growth of activity in the euro area strengthened in the first quarter of 2016 compared to the previous quarter, to reach 0.5 %. For the first time in a long while, the euro area recorded stronger growth than most other developed economies, including the united states and the united Kingdom. According to initial indications, the strength of domestic demand was the main factor underpinning the European economies, compensating for the weak net ex-ports. moreover, there was a surge in consumption by both
8 ❙ Economic proJEctions for BElgium – spring 2016 ❙ nBB Economic review
households and governments, while in some countries, investment also recorded relatively vigorous growth.
Although the projections concerning foreign demand are relatively comparable, the Eurosystem’s new spring fore-casts comprise a significant upgrading of the interim esti-mates produced by the ECB in March 2016, partly on ac-count of the good start to the year. the present projections are very similar to the latest Eurosystem autumn forecasts, certainly for 2016.
in Belgium, there has been little change in the policy environment since the autumn projections. the measures adopted at the time of the spring budget reviews were incorporated in these new projections, but generally have a relatively minor effect on the economy. the index jump ended as expected in the early spring, bringing the return of wage indexation in accordance with the system specific to each branch of activity. For the year 2018, included in the projection period for the first time, a further expansion of the tax shift measures was taken into account, and in particular the additional reduction in personal income tax and employers’ social security contributions.
However, one of the main exogenous factors affecting activity in the short term concerns the threat of terrorism looming since the Paris attacks in November 2015 and culminating in the attacks on Belgium’s national airport and the Brussels metro system on 22 March 2016. While it is not easy to quantify the precise impact of such factors on the economy, isolated terrorist attacks do not usu-ally have any significant macroeconomic repercussions in the advanced countries. All the same, the terrorist threat which has been present for several months does seem to be affecting the Belgian economy in this instance. that is due mainly to the sharp decline in the number of foreign tourists and business travellers coming to Belgium since the Paris attacks, and the significant security measures implemented subsequently in the Brussels-capital region. that implies a substantial fall in revenue from tourism, particularly for firms in the hotel and restaurant sector. That diminished growth in the first quarter by an estimated 0.1 percentage point – putting Belgium’s growth 0.2 % be-low the euro area average – and could continue to depress activity in the second quarter.
nonetheless, the present projections concluded on 19 May 2016 indicate annual growth of 1.3 % in 2016, the same figure as in the latest autumn projections. That is because the negative impact of the terrorist threat and the slightly less favourable technical and external assumptions underlying the Eurosystem’s estimates – the main ones being described in box 1 in this article – are offset by a favourable level effect due to the stronger growth in the final quarter
of 2015. Indeed, the NAI recently upgraded that figure in view of a marked expansion of activity in the energy sector which was not taken into account in the autumn projec-tions or in previous editions of the NAI’s quarterly accounts. In 2016, the Belgian economy should therefore expand at a rate very similar to that recorded in the two preceding years. According to the present projections, growth is set to remain modest in the current quarter, owing to the depleted flow of tourists, but is expected to pick up in the second half of the year partly thanks to the combined effect of rising global demand and better cost competitiveness resulting from the wage moderation policy. Annual growth is therefore esti-mated at 1.5 % in 2017, much the same as in the autumn projections, and is put at a slightly higher figure in 2018. In that connection, attention should be drawn to the wide mar-gin of uncertainty inherent in estimates for later years. Apart from the stronger export growth, increased investment and higher household consumption driven by rising incomes are likely to contribute to the acceleration of activity in the two subsequent years.
The labour market recovery remains robust, and is clearly due to the labour cost moderation policy and the structural reforms on the labour market. According to the latest sta-tistics, the expansion of domestic employment will even exceed the estimates in the autumn projections, although that is offset by the average working time remaining somewhat below the figure in the projections. Over the three-year period from 2016 to 2018, the stronger growth should help to create almost 140 000 additional jobs. Although the participation rate is still rising and the popula-tion of working age continues to grow faster than expected owing to the relatively large number of asylum seekers, that job creation is still well in excess of the growth of the labour force. the unemployment rate should therefore de-cline gradually to around 7.8 % in 2018, comparable to the rate prevailing just before the great recession.
Inflation continued to rise in the initial months of the year. The annual average inflation in 2016 will be much higher than last year’s figure. Although that is due primarily to the upturn in oil prices, core inflation also remains surprisingly strong, despite the steady reduction in unit labour costs since 2013. While that increase partly represents a normal restoration of corporate profit margins, it also tempers the positive impact on growth of the improvement in cost competitiveness and employment. moreover, given that the wage indexation mechanisms are now back in operation, the fact that Belgium has an inflation rate considerably higher than that of other euro area countries is liable to trigger a relatively steeper rise in labour costs in Belgium, and cause a renewed deterioration in competitiveness. According to the projections, inflation should continue ris-ing to just below 2 % in 2018, mainly as a result of higher
June 2016 ❙ Economic proJEctions for BElgium – spring 2016 ❙ 9
labour costs. As regards negotiated wages, in the absence of a central wage norm for the next two years, it was assumed that real growth would come to 1 % in 2018, against the backdrop of strengthening growth and an in-creasingly tight labour market.
Turning to public finances, the budget deficit is unlikely to diminish before 2017. At the end of the projection period, the deficit is estimated at 2.4 %, a long way from the tar-gets set in the stability programme for the absorption of the nominal and structural deficits. In 2018, the public debt is expected to be almost as large as in the previous year. in this connection, it should be remembered that, in accord-ance with the rules appliable to the Eurosystem projection exercises, the forecasts only take account of measures which have been formally adopted by the government – or wich are very likely to be approved – and are specified in sufficient detail on the cut-off date for the exercises. moreover, the estimates of the budgetary impact of certain measures, such as those relating to fraud prevention, may deviate from the amounts included in the budget.
1. international environment and assumptions
1.1 World economy
During 2015, the world economy continued to recover, al-beit in an uncertain environment ; growth remained uneven and fragile, dropping to 3.0 %, after 3.3 % in 2014. In the advanced countries, activity continued to strengthen, yet it remained more vigorous in the Anglo-saxon countries than in the euro area, and especially Japan. At the end of 2015, however, signs of weakening emerged : while the accom-modative monetary policies and the fall in oil prices contin-ued to support domestic demand, the increasing weakness of foreign demand ultimately had a greater impact on the ongoing recovery. in contrast, in the emerging countries, especially China, the economic slowdown was confirmed in 2015.
the loss of momentum in the chinese economy con-strained activity in the other emerging countries. in ad-dition, the lower commodity prices and tighter financing conditions – due partly to the normalisation of American monetary policy – also hampered their activity. However, the situation was very heterogenous. russia and Brazil were in a deep recession, and several other commodity-exporting countries also encountered mounting difficul-ties. conversely, growth remained more robust in other countries such as India. Throughout 2015, the financial markets suffered regular episodes of volatility, reflecting
concerns over the sluggish activity in the emerging econo-mies, especially China. During the summer of 2015, there was a sudden surge in market jitters following the meas-ures taken by the Chinese authorities to curb the risky investment behaviour in the shadow banking sector, and the announcement by the People’s Bank of China of an adjustment to its exchange rate policy. those fears trig-gered increasing volatility on the international financial markets, with falling share prices, declining capital flows to the emerging economies, a tightening of their financial conditions (against the decline in yields on government bonds in some advanced countries, considered as relatively safe investments) and a depreciation of the currencies of certain emerging countries. From the end of 2015 to mid-February 2016, a new period of intense volatility was sparked once again by growing fears of a disorderly and unexpectedly sharp slowdown in the chinese economy, but also by the gloomier outlook for other economies and the persistently weak oil prices and their ensuing implica-tions for the exporting countries, interpreted as a sign of a more anaemic world economy.
fears of a further deterioration in the economic situation in the emerging countries continued to oppress the financial markets in the initial weeks of 2016, but those fears as yet appear to be unfounded. In the first quarter of 2016, China’s growth likely remained more or less stable. That soft land-ing scenario is underpinned by the adoption of fiscal and monetary support policies. In Russia, thanks to the rise in commodity prices this year, the initial data indicate a dimin-ishing contraction, whereas in Brazil the political uncertainty continues to erode confidence. Although vulnerabilities and persistent adverse winds are still hindering the emerging economies – China’s high debt level remains a risk factor – it seems that the heightened fears at the beginning of 2016 were exaggerated ; positive signs were therefore seen on the financial markets from mid-February 2016. Risk aversion di-minished, the financial markets recovered and made up part of the earlier losses, and yields on government bonds of the advanced countries edged slightly upwards. oil prices rose and the exchange rates of some emerging countries recov-ered. in china, the renminbi stabilised and the capital out-flows eased, partly on account of the new macroeconomic data which reinforced the soft landing scenario.
Over 2015 as a whole, international trade in goods and services slackened pace, held back by declining imports on the part of several emerging countries. in china, the excess capacity in industrial production and in the property sector, and the beginnings of a shift in activity towards the services sector led to a slowdown in investment, which is relatively import-intensive. in other emerging countries, imports were curtailed by the currency depreciation and by weak-ening or even declining domestic demand, attributable
10 ❙ Economic proJEctions for BElgium – spring 2016 ❙ nBB Economic review
in particular to meagre investment. in the initial months of 2016, the growth of world trade seems to have stabi-lised at a relatively low level.
in contrast to the picture in the emerging economies, growth in the advanced countries strengthened somewhat in 2015. in the united states, growth remained vigorous, driven by domestic demand, particularly private consumption which remains anchored by sound fundamentals such as job crea-tion, the rise in real wages and the increase in households’ net assets. conversely, the loss of price competitiveness due to the dollar’s appreciation depressed exports. Moreover, investment in the energy sector declined. since the end of 2015, growth has slowed sharply and, according to the latest quarterly statistics, it dropped to 0.8 % year-on-year in the first quarter of 2016. Apart from the increase in the negative contribution of foreign trade, the loss of momen-tum is essentially attributable to domestic demand : while household expenditure – particularly investment in housing – has proved relatively resilient, investment excluding housing, relating to commodity extraction and productive investment in other sectors, depressed the growth pace.
In Japan, although the recovery seemed to be making pro-gress from the beginning of 2015, activity ultimately con-tracted at the end of the year. the slowdown in china and in other Asian economies to which Japan has a substantial exposure had an adverse effect on the country’s exports and hence on its manufacturing industry. moreover, de-spite an extremely tight labour market, private consump-tion declined. But in the first quarter of 2016, growth surprisingly returned to slightly positive territory, thanks to a rebound in private consumption and exports.
During 2015, growth in the euro area showed signs of weakening as a result of the worsening external envi-ronment. growth was again underpinned by domestic demand. the strengthening in private consumption was driven by the increased purchasing power of households, following the decline in energy prices and the improvement on the labour market. Conversely, the investment revival was rather hesitant overall. While highly favourable financ-ing conditions were a supporting factor, the uncertainty and – in some member states – the need for further debt reduction hindered investment decisions. following a grad-ual slackening of the pace of economic growth in 2015, the initial data indicate an acceleration in the first quarter of 2016 (0.5 % quarter-on-quarter). On the labour market, the situation continued to improve up to the beginning of 2016. Job creation increased in parallel with the growth recovery and was supported – in some countries – by fiscal and structural measures and wage moderation. the unem-ployment rate gradually subsided though it remained at a high level, comparable to the 2011 figure.
The recovery in the euro area in 2015 was geographically more broad-based. With the exception of greece, which went back into recession in the middle of the year, it was mainly some of the peripheral countries that produced the strongest growth, bolstered by the improvement in the labour market and the recovery in other advanced econo-mies outside the euro area, but also by the impact of the structural reforms and adjustment programmes which had been implemented. in the core euro area countries, growth in both germany and france was driven by dynamic private consumption, while foreign trade did little to provide sound support for growth. in germany, public consumption was also robust, partly thanks to the expenditure associated with the inflow of migrants, and investment spending as well. conversely, in france the contraction in the construc-tion industry offset the positive contribution from other investment.
Inflation in the euro area, which has been falling since 2011, reached a trough in January 2015, subsequently hov-ering erratically around slightly positive levels. Over 2015 as a whole, inflation thus stood at zero. From February 2016, inflation became negative again as a result of the persistent decline in oil prices and new negative base effects plus the recent appreciation of the euro.
In 2015 and up to the beginning of 2016, while the cur-rencies of the advanced countries appreciated overall, those of various emerging countries and commodity exporters tended to depreciate. the currency movements in the advanced countries also reflected expectations re-garding various new monetary policy measures. the euro depreciated further against the us dollar in the period preceding the monetary policy decisions taken on either side of the Atlantic in December 2015, with the first increase in the policy interest rate by the federal reserve and the six-month extension of asset purchases by the ECB. In March 2016, the ECB announced the adoption of new monetary easing measures. All key interest rates were cut again. the governing council also decided to increase the monthly purchases of assets under the Asset Purchase Programme (APP), raising them to € 80 billion (compared to the previous figure of € 60 billion) and to include in the eligible assets, from the end of the second quarter of 2016, certain bonds issued by non-financial corporations. finally, a new series of four targeted long-er-term refinancing operations (TLTRO II) will be launched between June 2016 and March 2017. In view of the troubled market climate, the uncertainty relating to the emerging countries, and the mixed macroeconomic data in the united states, the American monetary authorities urged a cautious approach to future interest rate rises, and opted to normalise their policy more slowly than expected. At its meeting on 27 April 2016, the Federal
June 2016 ❙ Economic proJEctions for BElgium – spring 2016 ❙ 11
reserve therefore left its monetary policy unchanged, although it did not rule out an interest rate rise later in the year.
A reappraisal of the divergence between American and European monetary policies following the decisions taken since December 2015 seems to have contributed to the recent appreciation of the euro against the us dollar. the euro has besides clearly appreciated in effective terms since December 2015.
the Brent price, which had maintained a downward trend since mid-2014, reached a trough in January 2016 at just under $ 30 per barrel and had subsequently climbed to almost $ 48 at the end of May. While the oil supply is still in surplus, a number of factors have
tended to moderate it recently. output has fallen as a result of the disrupted production in iraq, nigeria and the united Arab Emirates. in february, four of the lead-ing opEc countries – saudi Arabia, Qatar, russia and Venezuela – announced that they were freezing their production at January 2016 levels. In countries outside opEc, such as the united states, Brazil and china, the provisional figures for January and February 2016 also indicate a decline in their output ; moreover, in canada, the forest fires in the Alberta region in May 2016 would also have affected almost half of its production capacity. nevertheless, oil prices are still very jittery in view of the great uncertainty over future developments, such as the additional supply expected to come from iran, the level of which is unknown. The prices of other non-oil com-modities followed suit and likewise increased.
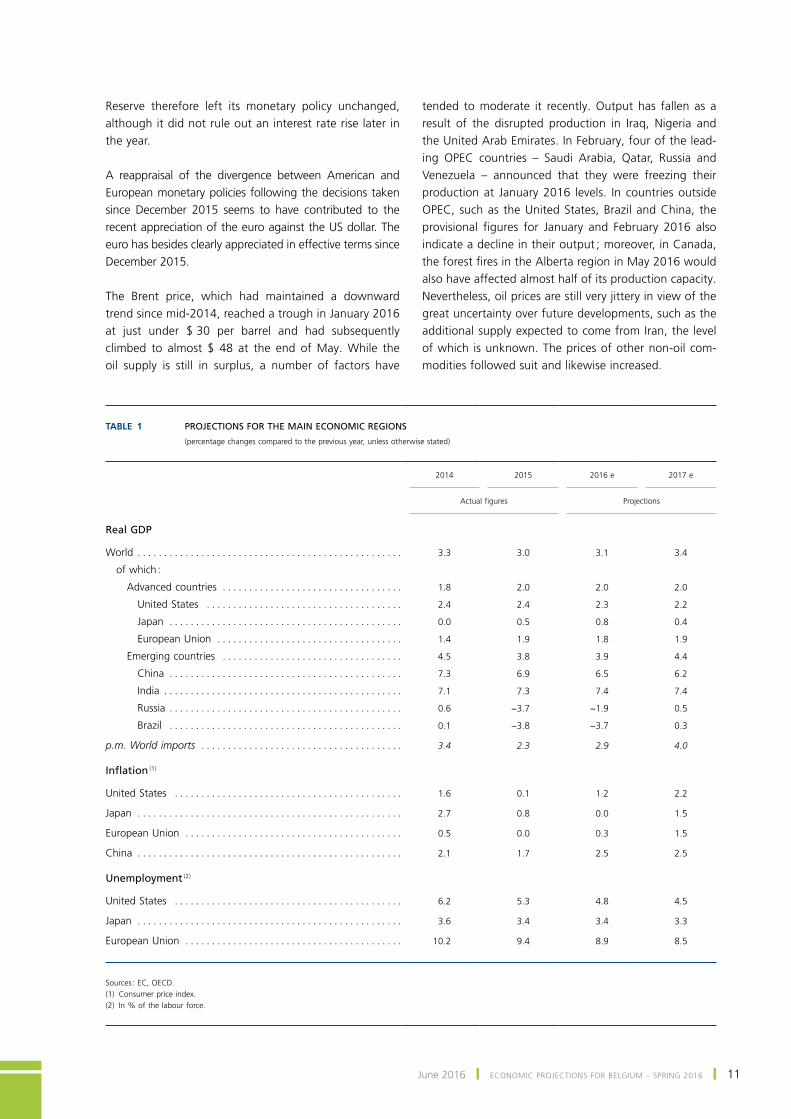
Table 1 PROJECTIONS FOR THE MAIN ECONOMIC REGIONS
(percentage changes compared to the previous year, unless otherwise stated)
2014
2015
2016 e
2017 e
Actual figures
Projections
Real GDP
World . . . . . . . . . . . . . . . . . . . . . . . . . . . . . . . . . . . . . . . . . . . . . . . . . . 3.3 3.0 3.1 3.4
of which :
Advanced countries . . . . . . . . . . . . . . . . . . . . . . . . . . . . . . . . . . 1.8 2.0 2.0 2.0
United States . . . . . . . . . . . . . . . . . . . . . . . . . . . . . . . . . . . . . 2.4 2.4 2.3 2.2
Japan . . . . . . . . . . . . . . . . . . . . . . . . . . . . . . . . . . . . . . . . . . . . 0.0 0.5 0.8 0.4
European Union . . . . . . . . . . . . . . . . . . . . . . . . . . . . . . . . . . . 1.4 1.9 1.8 1.9
Emerging countries . . . . . . . . . . . . . . . . . . . . . . . . . . . . . . . . . . 4.5 3.8 3.9 4.4
China . . . . . . . . . . . . . . . . . . . . . . . . . . . . . . . . . . . . . . . . . . . . 7.3 6.9 6.5 6.2
India . . . . . . . . . . . . . . . . . . . . . . . . . . . . . . . . . . . . . . . . . . . . . 7.1 7.3 7.4 7.4
Russia . . . . . . . . . . . . . . . . . . . . . . . . . . . . . . . . . . . . . . . . . . . . 0.6 −3.7 −1.9 0.5
Brazil . . . . . . . . . . . . . . . . . . . . . . . . . . . . . . . . . . . . . . . . . . . . 0.1 −3.8 −3.7 0.3
p.m. World imports . . . . . . . . . . . . . . . . . . . . . . . . . . . . . . . . . . . . . . 3.4 2.3 2.9 4.0
Inflation (1)
United States . . . . . . . . . . . . . . . . . . . . . . . . . . . . . . . . . . . . . . . . . . . 1.6 0.1 1.2 2.2
Japan . . . . . . . . . . . . . . . . . . . . . . . . . . . . . . . . . . . . . . . . . . . . . . . . . . 2.7 0.8 0.0 1.5
European Union . . . . . . . . . . . . . . . . . . . . . . . . . . . . . . . . . . . . . . . . . 0.5 0.0 0.3 1.5
China . . . . . . . . . . . . . . . . . . . . . . . . . . . . . . . . . . . . . . . . . . . . . . . . . . 2.1 1.7 2.5 2.5
Unemployment (2)
United States . . . . . . . . . . . . . . . . . . . . . . . . . . . . . . . . . . . . . . . . . . . 6.2 5.3 4.8 4.5
Japan . . . . . . . . . . . . . . . . . . . . . . . . . . . . . . . . . . . . . . . . . . . . . . . . . . 3.6 3.4 3.4 3.3
European Union . . . . . . . . . . . . . . . . . . . . . . . . . . . . . . . . . . . . . . . . . 10.2 9.4 8.9 8.5
Sources : EC, OECD.(1) Consumer price index.(2) In % of the labour force.
12 ❙ Economic proJEctions for BElgium – spring 2016 ❙ nBB Economic review
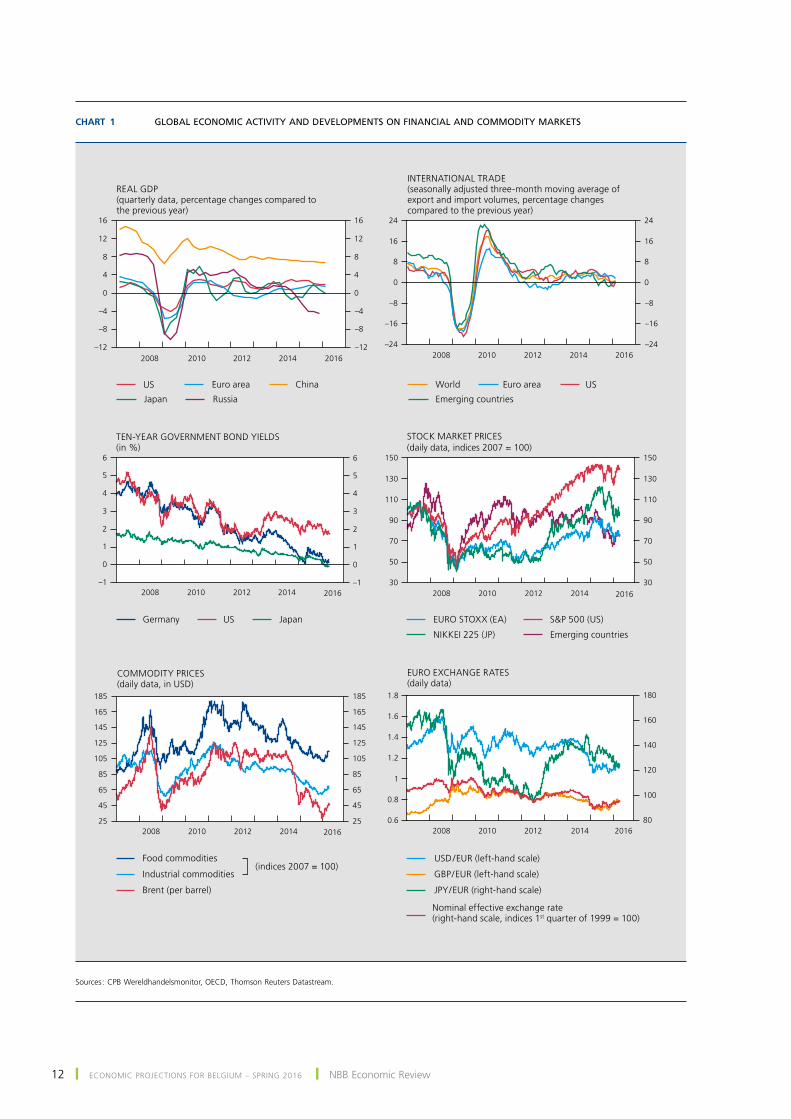
Chart 1 GLOBAL ECONOMIC ACTIVITY AND DEVELOPMENTS ON FINANCIAL AND COMMODITY MARKETS
25
45
65
85
105
125
145
165
185
25
45
65
85
105
125
145
165
185
2008 2010 2012 2014 2016–24
–16
–8
0
8
16
24
–24
–16
–8
0
8
16
24
–1
0
1
2
3
4
5
6
–1
0
1
2
3
4
5
6
2008 2010 2012 2014 2016–12
–8
–4
0
4
8
12
16
–12
–8
–4
0
4
8
12
16
80
100
120
140
160
180
30
50
70
90
110
130
150
30
50
70
90
110
130
150
2008 2010 2012 2014 2016 2008 2010 2012 2014 2016
2008 2010 2012 2014 2016 2008 2010 2012 2014 2016
TEN-YEAR GOVERNMENT BOND YIELDS(in %)
China
Japan
USD / EUR (left-hand scale)
JPY / EUR (right-hand scale)
Nominal effective exchange rate(right-hand scale, indices 1st quarter of 1999 = 100)
EURO STOXX (EA) S&P 500 (US)
NIKKEI 225 (JP)
Food commodities
Brent (per barrel)
COMMODITY PRICES(daily data, in USD)
INTERNATIONAL TRADE(seasonally adjusted three-month moving average of export and import volumes, percentage changes compared to the previous year)
Emerging countries
World Euro area
REAL GDP(quarterly data, percentage changes compared to the previous year)
US
(indices 2007 = 100)
EURO EXCHANGE RATES(daily data)
STOCK MARKET PRICES(daily data, indices 2007 = 100)
Euro area US
Russia
JapanUSGermany
Emerging countries
GBP / EUR (left-hand scale)
0.6
0.8
1
1.2
1.4
1.6
1.8
Industrial commodities
sources : cpB Wereldhandelsmonitor, oEcD, thomson reuters Datastream.
June 2016 ❙ Economic proJEctions for BElgium – spring 2016 ❙ 13
Box 1 – Assumptions adopted for the projections
the macroeconomic projections for Belgium described in this article form part of the joint Eurosystem projections for the euro area. that projection exercise is based on a set of technical assumptions and forecasts for the international environment drawn up jointly by the participating institutions, namely the EcB and the national central banks of the euro area.
in the projections, it is assumed that future exchange rates will remain constant throughout the projection period at the average levels recorded in the last ten working days before the cut-off date of the assumptions, i.e. 11 May 2016. In the case of the US dollar, the exchange rate then stood at $ 1.14 to the euro.
As usual, the assumptions concerning oil prices take account of market expectations as reflected in forward contracts on the international markets. In mid-May 2016, following the almost continuous decline which had begun in the autumn of 2014, the markets expected to see the price per barrel of Brent begin rising gradually over the projection horizon, from an average of $ 35 in the first quarter of 2016 to around $ 52 in the last quarter of 2018. Once again, this implies a substantial downward revision compared to the assumptions for the autumn 2015 projections.
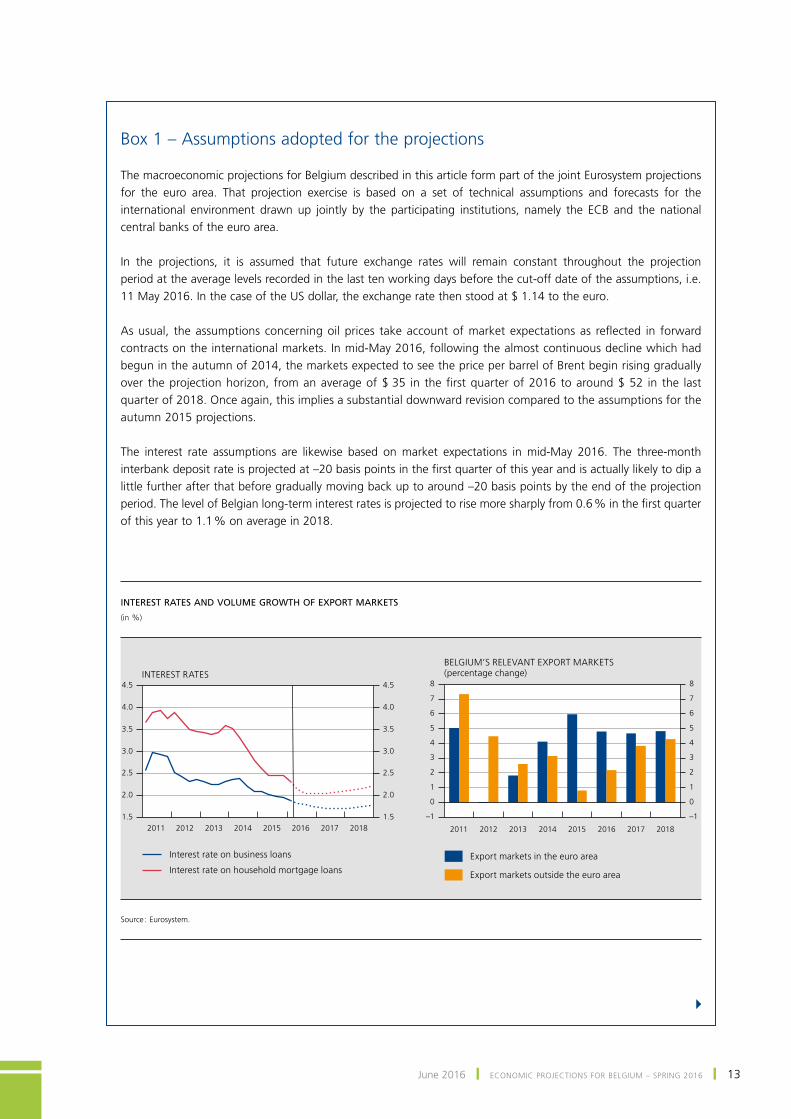
The interest rate assumptions are likewise based on market expectations in mid-May 2016. The three-month interbank deposit rate is projected at –20 basis points in the first quarter of this year and is actually likely to dip a little further after that before gradually moving back up to around –20 basis points by the end of the projection period. The level of Belgian long-term interest rates is projected to rise more sharply from 0.6 % in the first quarter of this year to 1.1 % on average in 2018.
4
INTEREST RATES AND VOLUME GROWTH OF EXPORT MARKETS
(in %)
2011 2012 2013 2014 2015 2016 2017 2018 2011 2012 2013 2014 2015 2016 2017 2018
–1
0
1
2
3
4
5
6
7
8
–1
0
1
2
3
4
5
6
7
8
Interest rate on business loans
Interest rate on household mortgage loans
INTEREST RATES
Export markets in the euro area
Export markets outside the euro area
BELGIUM’S RELEVANT EXPORT MARKETS(percentage change)
1.5
2.0
2.5
3.0
3.5
4.0
4.5
1.5
2.0
2.5
3.0
3.5
4.0
4.5
source : Eurosystem.
14 ❙ Economic proJEctions for BElgium – spring 2016 ❙ nBB Economic review
However, the predicted movement in bank interest rates on business investment loans and household mortgage loans may diverge somewhat from the movement in market rates. For instance, the average mortgage interest rate is historically low, on account of the particularly accommodative monetary policy of the EcB and the resulting abundant liquidity and is unlikely to track the upward movement in long-term market rates and will probably remain fairly steady over the whole of the projection period. the average interest rate on business loans, which is closer to the short-term segment, is also expected to remain relatively constant over the projection period : at the end of 2018, it is forecast at below 1.8 %, which is actually lower than the current rate.
The outlook for global economic growth excluding the euro area has clearly worsened since the autumn projections published in December 2015, in both the advanced and the emerging economies. Moreover, the recent sluggishness of international trade mentioned above has led to a new downward revision of the trade intensity of world growth for 2016. That has a particularly adverse effect on the growth of foreign markets outside the euro area, which is therefore predicted to remain very weak in 2016, following the record low level in 2015. Overall, the growth of the foreign markets relevant for Belgian exports should continue to strengthen steadily over the projection period, to reach 4.6 % in 2018.
The trend in Belgian exports is determined not only by the growth of those markets but also by the movement in market shares, and consequently by Belgium’s competitiveness. The prices that competitors charge on the export markets are a key factor in the cost aspects of that competitiveness. Partly as a result of the euro’s recent appreciation, competitors’ euro-denominated prices on the export markets are expected to fall by 2.9 % in 2016, whereas they had risen further in 2015 as the euro became cheaper. Assuming that the exchange rate remains constant, rising inflation in the euro area – but also elsewhere – will gradually lead to renewed upward pressure on the prices of Belgian exporters’ competitors in the years ahead.
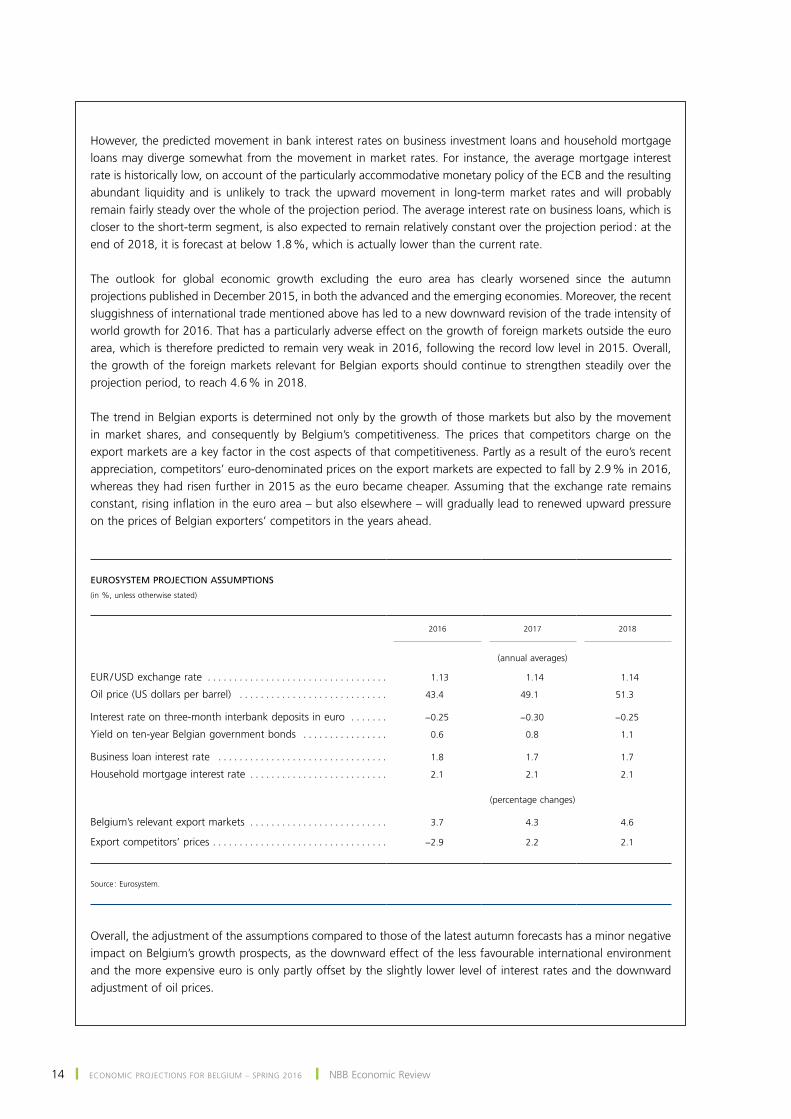
overall, the adjustment of the assumptions compared to those of the latest autumn forecasts has a minor negative impact on Belgium’s growth prospects, as the downward effect of the less favourable international environment and the more expensive euro is only partly offset by the slightly lower level of interest rates and the downward adjustment of oil prices.
EUROSYSTEM PROJECTION ASSUMPTIONS
(in %, unless otherwise stated)
2016
2017
2018
(annual averages)
EUR / USD exchange rate . . . . . . . . . . . . . . . . . . . . . . . . . . . . . . . . . . 1.13 1.14 1.14
Oil price (US dollars per barrel) . . . . . . . . . . . . . . . . . . . . . . . . . . . . 43.4 49.1 51.3
Interest rate on three‑month interbank deposits in euro . . . . . . . −0.25 −0.30 −0.25
Yield on ten‑year Belgian government bonds . . . . . . . . . . . . . . . . 0.6 0.8 1.1
Business loan interest rate . . . . . . . . . . . . . . . . . . . . . . . . . . . . . . . . 1.8 1.7 1.7
Household mortgage interest rate . . . . . . . . . . . . . . . . . . . . . . . . . . 2.1 2.1 2.1
(percentage changes)
Belgium’s relevant export markets . . . . . . . . . . . . . . . . . . . . . . . . . . 3.7 4.3 4.6
Export competitors’ prices . . . . . . . . . . . . . . . . . . . . . . . . . . . . . . . . . −2.9 2.2 2.1
Source : Eurosystem.
June 2016 ❙ Economic proJEctions for BElgium – spring 2016 ❙ 15
1.2 Estimates for the euro area
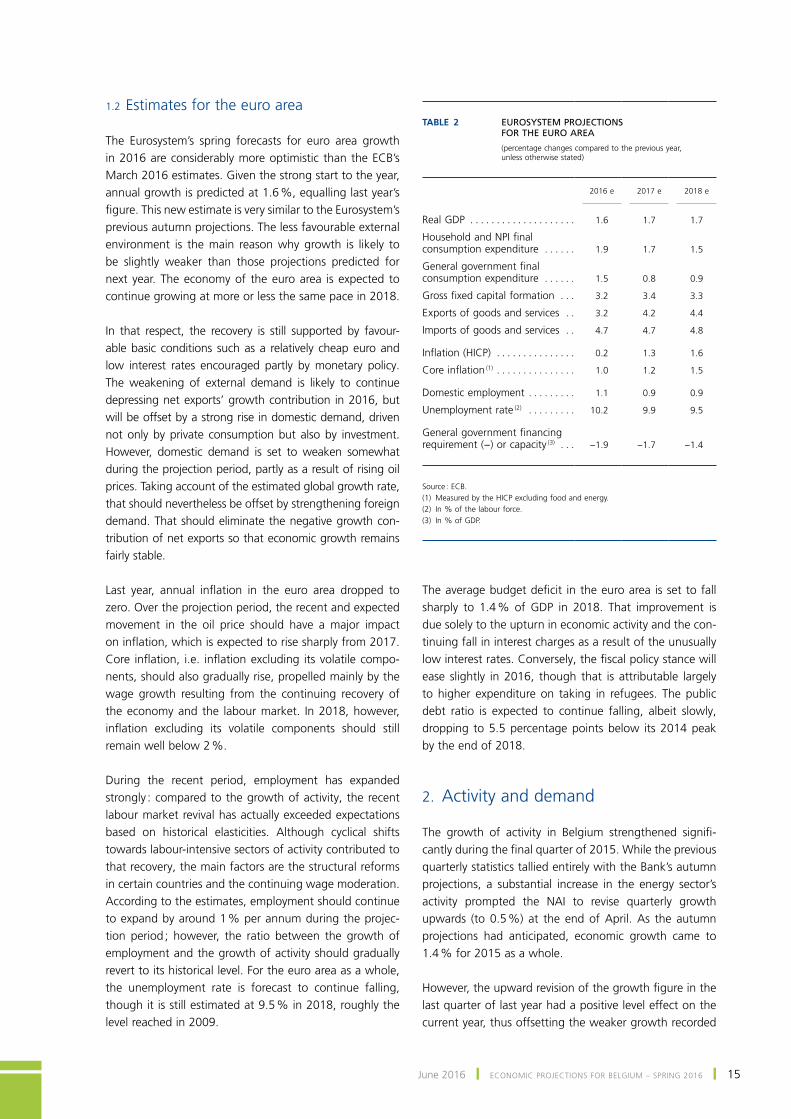
The Eurosystem’s spring forecasts for euro area growth in 2016 are considerably more optimistic than the ECB’s March 2016 estimates. Given the strong start to the year, annual growth is predicted at 1.6 %, equalling last year’s figure. This new estimate is very similar to the Eurosystem’s previous autumn projections. the less favourable external environment is the main reason why growth is likely to be slightly weaker than those projections predicted for next year. the economy of the euro area is expected to continue growing at more or less the same pace in 2018.
in that respect, the recovery is still supported by favour-able basic conditions such as a relatively cheap euro and low interest rates encouraged partly by monetary policy. The weakening of external demand is likely to continue depressing net exports’ growth contribution in 2016, but will be offset by a strong rise in domestic demand, driven not only by private consumption but also by investment. However, domestic demand is set to weaken somewhat during the projection period, partly as a result of rising oil prices. Taking account of the estimated global growth rate, that should nevertheless be offset by strengthening foreign demand. that should eliminate the negative growth con-tribution of net exports so that economic growth remains fairly stable.
Last year, annual inflation in the euro area dropped to zero. over the projection period, the recent and expected movement in the oil price should have a major impact on inflation, which is expected to rise sharply from 2017. Core inflation, i.e. inflation excluding its volatile compo-nents, should also gradually rise, propelled mainly by the wage growth resulting from the continuing recovery of the economy and the labour market. In 2018, however, inflation excluding its volatile components should still remain well below 2 %.
During the recent period, employment has expanded strongly : compared to the growth of activity, the recent labour market revival has actually exceeded expectations based on historical elasticities. Although cyclical shifts towards labour-intensive sectors of activity contributed to that recovery, the main factors are the structural reforms in certain countries and the continuing wage moderation. According to the estimates, employment should continue to expand by around 1 % per annum during the projec-tion period ; however, the ratio between the growth of employment and the growth of activity should gradually revert to its historical level. for the euro area as a whole, the unemployment rate is forecast to continue falling, though it is still estimated at 9.5 % in 2018, roughly the level reached in 2009.
The average budget deficit in the euro area is set to fall sharply to 1.4 % of GDP in 2018. That improvement is due solely to the upturn in economic activity and the con-tinuing fall in interest charges as a result of the unusually low interest rates. Conversely, the fiscal policy stance will ease slightly in 2016, though that is attributable largely to higher expenditure on taking in refugees. The public debt ratio is expected to continue falling, albeit slowly, dropping to 5.5 percentage points below its 2014 peak by the end of 2018.
2. Activity and demand
The growth of activity in Belgium strengthened signifi-cantly during the final quarter of 2015. While the previous quarterly statistics tallied entirely with the Bank’s autumn projections, a substantial increase in the energy sector’s activity prompted the nAi to revise quarterly growth upwards (to 0.5 %) at the end of April. As the autumn projections had anticipated, economic growth came to 1.4 % for 2015 as a whole.
However, the upward revision of the growth figure in the last quarter of last year had a positive level effect on the current year, thus offsetting the weaker growth recorded
Table 2 EUROSYSTEM PROJECTIONS FOR THE EURO AREA
(percentage changes compared to the previous year, unless otherwise stated)
2016 e
2017 e
2018 e
Real GDP . . . . . . . . . . . . . . . . . . . . 1.6 1.7 1.7
Household and NPI final consumption expenditure . . . . . . 1.9 1.7 1.5
General government final consumption expenditure . . . . . . 1.5 0.8 0.9
Gross fixed capital formation . . . 3.2 3.4 3.3
Exports of goods and services . . 3.2 4.2 4.4
Imports of goods and services . . 4.7 4.7 4.8
Inflation (HICP) . . . . . . . . . . . . . . . 0.2 1.3 1.6
Core inflation (1) . . . . . . . . . . . . . . . 1.0 1.2 1.5
Domestic employment . . . . . . . . . 1.1 0.9 0.9
Unemployment rate (2) . . . . . . . . . 10.2 9.9 9.5
General government financing requirement (−) or capacity (3) . . . −1.9 −1.7 −1.4
Source : ECB.(1) Measured by the HICP excluding food and energy.(2) In % of the labour force.(3) In % of GDP.
16 ❙ Economic proJEctions for BElgium – spring 2016 ❙ nBB Economic review
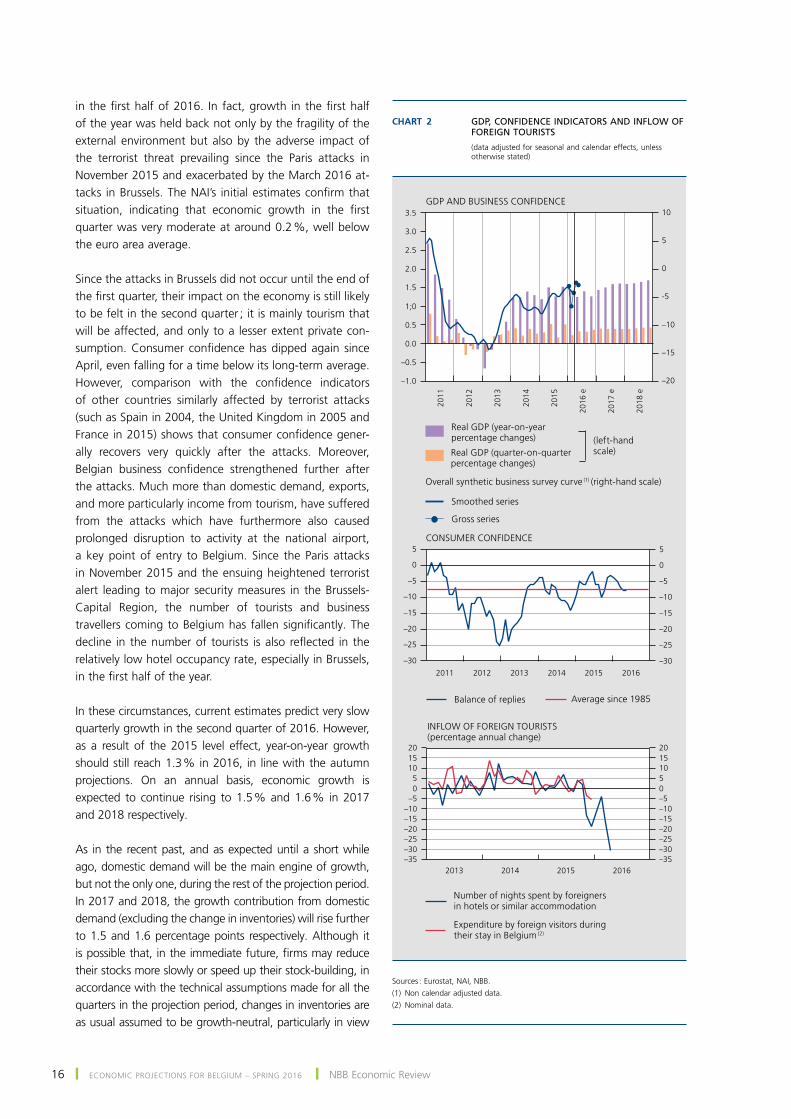
in the first half of 2016. In fact, growth in the first half of the year was held back not only by the fragility of the external environment but also by the adverse impact of the terrorist threat prevailing since the Paris attacks in November 2015 and exacerbated by the March 2016 at-tacks in Brussels. The NAI’s initial estimates confirm that situation, indicating that economic growth in the first quarter was very moderate at around 0.2 %, well below the euro area average.
Since the attacks in Brussels did not occur until the end of the first quarter, their impact on the economy is still likely to be felt in the second quarter ; it is mainly tourism that will be affected, and only to a lesser extent private con-sumption. Consumer confidence has dipped again since April, even falling for a time below its long-term average. However, comparison with the confidence indicators of other countries similarly affected by terrorist attacks (such as Spain in 2004, the United Kingdom in 2005 and France in 2015) shows that consumer confidence gener-ally recovers very quickly after the attacks. Moreover, Belgian business confidence strengthened further after the attacks. Much more than domestic demand, exports, and more particularly income from tourism, have suffered from the attacks which have furthermore also caused prolonged disruption to activity at the national airport, a key point of entry to Belgium. Since the Paris attacks in November 2015 and the ensuing heightened terrorist alert leading to major security measures in the Brussels-capital region, the number of tourists and business travellers coming to Belgium has fallen significantly. The decline in the number of tourists is also reflected in the relatively low hotel occupancy rate, especially in Brussels, in the first half of the year.
in these circumstances, current estimates predict very slow quarterly growth in the second quarter of 2016. However, as a result of the 2015 level effect, year-on-year growth should still reach 1.3 % in 2016, in line with the autumn projections. on an annual basis, economic growth is expected to continue rising to 1.5 % and 1.6 % in 2017 and 2018 respectively.
As in the recent past, and as expected until a short while ago, domestic demand will be the main engine of growth, but not the only one, during the rest of the projection period. In 2017 and 2018, the growth contribution from domestic demand (excluding the change in inventories) will rise further to 1.5 and 1.6 percentage points respectively. Although it is possible that, in the immediate future, firms may reduce their stocks more slowly or speed up their stock-building, in accordance with the technical assumptions made for all the quarters in the projection period, changes in inventories are as usual assumed to be growth-neutral, particularly in view
Chart 2 GDP, CONFIDENCE INDICATORS AND INFLOW OF FOREIGN TOURISTS
(data adjusted for seasonal and calendar effects, unless otherwise stated)
Real GDP (year-on-yearpercentage changes)
Gross series
Smoothed series
Overall synthetic business survey curve (1) (right-hand scale)
Real GDP (quarter-on-quarterpercentage changes)
(left-hand scale)
CONSUMER CONFIDENCE
GDP AND BUSINESS CONFIDENCE
Balance of replies Average since 1985
INFLOW OF FOREIGN TOURISTS(percentage annual change)
Number of nights spent by foreigners in hotels or similar accommodation
Expenditure by foreign visitors during their stay in Belgium
(2)
2013 2014 2015 2016–35–30–25–20–15–10
–505
101520
–35–30–25–20–15–10–505101520
2016
e
2017
e
2018
e
–1.0
–0.5
0.0
0.5
1;0
1.5
2.0
2.5
3.0
3.5
2011 2012 2013 2014 2015 2016
–30
–25
–20
–15
–10
–5
0
5
–30
–25
–20
–15
–10
–5
0
5
2011
2012
2013
2014
2015
J
J
J
JJ
–20
–15
–10
-5
0
5
10
sources : Eurostat, nAi, nBB.(1) non calendar adjusted data.(2) nominal data.
June 2016 ❙ Economic proJEctions for BElgium – spring 2016 ❙ 17
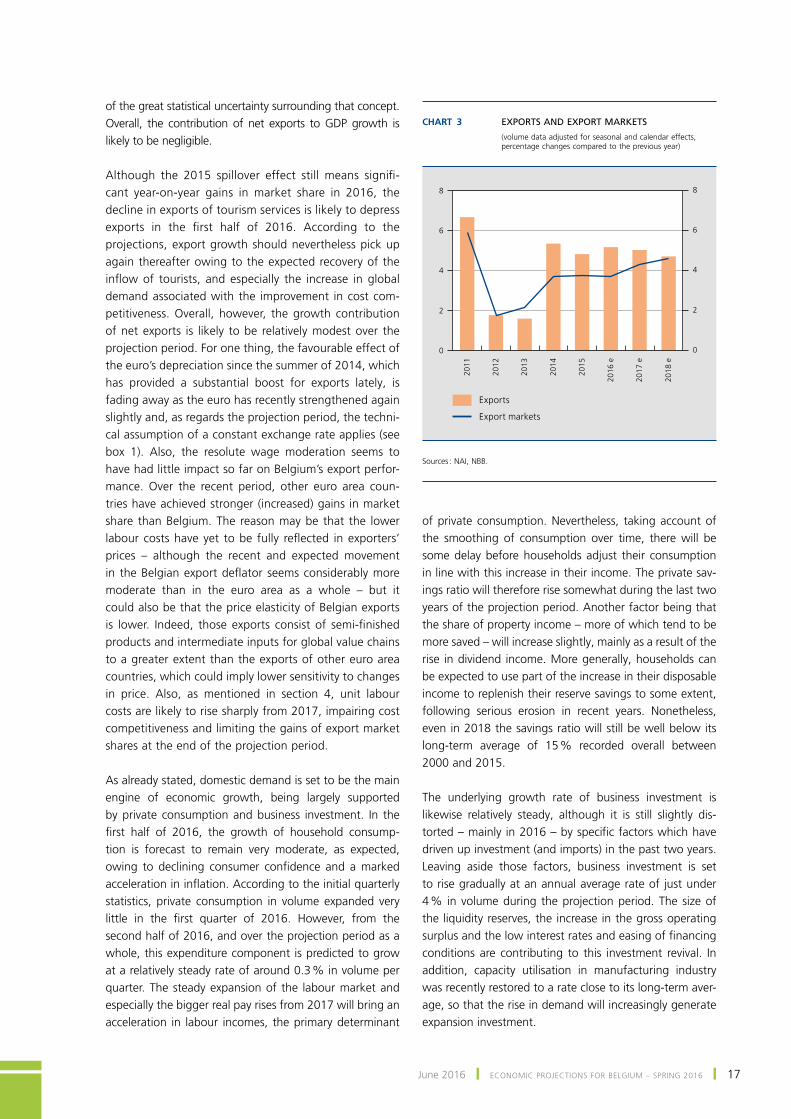
of the great statistical uncertainty surrounding that concept. overall, the contribution of net exports to gDp growth is likely to be negligible.
Although the 2015 spillover effect still means signifi-cant year-on-year gains in market share in 2016, the decline in exports of tourism services is likely to depress exports in the first half of 2016. According to the projections, export growth should nevertheless pick up again thereafter owing to the expected recovery of the inflow of tourists, and especially the increase in global demand associated with the improvement in cost com-petitiveness. overall, however, the growth contribution of net exports is likely to be relatively modest over the projection period. for one thing, the favourable effect of the euro’s depreciation since the summer of 2014, which has provided a substantial boost for exports lately, is fading away as the euro has recently strengthened again slightly and, as regards the projection period, the techni-cal assumption of a constant exchange rate applies (see box 1). Also, the resolute wage moderation seems to have had little impact so far on Belgium’s export perfor-mance. over the recent period, other euro area coun-tries have achieved stronger (increased) gains in market share than Belgium. the reason may be that the lower labour costs have yet to be fully reflected in exporters’ prices – although the recent and expected movement in the Belgian export deflator seems considerably more moderate than in the euro area as a whole – but it could also be that the price elasticity of Belgian exports is lower. Indeed, those exports consist of semi-finished products and intermediate inputs for global value chains to a greater extent than the exports of other euro area countries, which could imply lower sensitivity to changes in price. Also, as mentioned in section 4, unit labour costs are likely to rise sharply from 2017, impairing cost competitiveness and limiting the gains of export market shares at the end of the projection period.
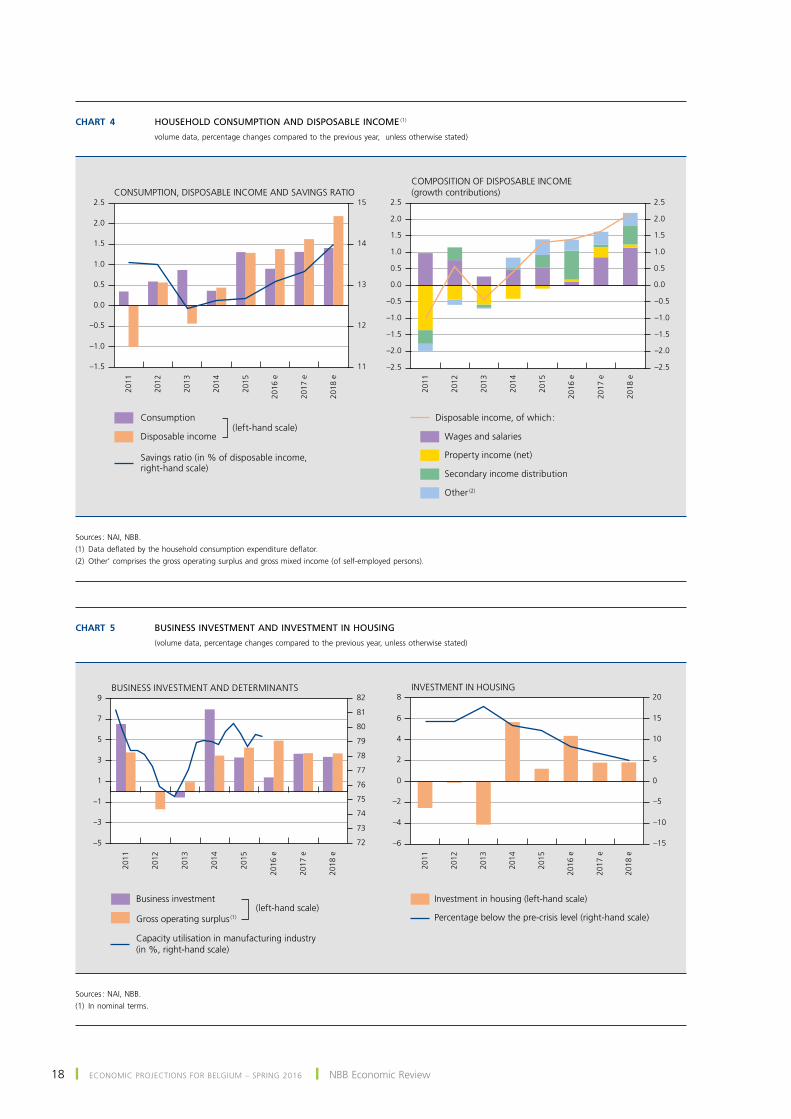
As already stated, domestic demand is set to be the main engine of economic growth, being largely supported by private consumption and business investment. in the first half of 2016, the growth of household consump-tion is forecast to remain very moderate, as expected, owing to declining consumer confidence and a marked acceleration in inflation. According to the initial quarterly statistics, private consumption in volume expanded very little in the first quarter of 2016. However, from the second half of 2016, and over the projection period as a whole, this expenditure component is predicted to grow at a relatively steady rate of around 0.3 % in volume per quarter. The steady expansion of the labour market and especially the bigger real pay rises from 2017 will bring an acceleration in labour incomes, the primary determinant
of private consumption. Nevertheless, taking account of the smoothing of consumption over time, there will be some delay before households adjust their consumption in line with this increase in their income. the private sav-ings ratio will therefore rise somewhat during the last two years of the projection period. Another factor being that the share of property income – more of which tend to be more saved – will increase slightly, mainly as a result of the rise in dividend income. more generally, households can be expected to use part of the increase in their disposable income to replenish their reserve savings to some extent, following serious erosion in recent years. nonetheless, even in 2018 the savings ratio will still be well below its long-term average of 15 % recorded overall between 2000 and 2015.
the underlying growth rate of business investment is likewise relatively steady, although it is still slightly dis-torted – mainly in 2016 – by specific factors which have driven up investment (and imports) in the past two years. leaving aside those factors, business investment is set to rise gradually at an annual average rate of just under 4 % in volume during the projection period. The size of the liquidity reserves, the increase in the gross operating surplus and the low interest rates and easing of financing conditions are contributing to this investment revival. in addition, capacity utilisation in manufacturing industry was recently restored to a rate close to its long-term aver-age, so that the rise in demand will increasingly generate expansion investment.
Chart 3 EXPORTS AND EXPORT MARKETS
(volume data adjusted for seasonal and calendar effects, percentage changes compared to the previous year)
2011
2012
2013
2014
2015
0
2
4
6
8
0
2
4
6
8
Exports
Export markets
2016
e
2017
e
2018
e
sources : nAi, nBB.
18 ❙ Economic proJEctions for BElgium – spring 2016 ❙ nBB Economic review
Chart 4 HOUSEHOLD CONSUMPTION AND DISPOSABLE INCOME (1)
volume data, percentage changes compared to the previous year, unless otherwise stated)20
11
2012
2013
2014
2015
11
12
13
14
15
2011
2012
2013
2014
2015
CONSUMPTION, DISPOSABLE INCOME AND SAVINGS RATIO
Consumption
Disposable income
Savings ratio (in % of disposable income,right-hand scale)
Wages and salaries
Property income (net)
Secondary income distribution
Other (2)
COMPOSITION OF DISPOSABLE INCOME(growth contributions)
(left-hand scale)Disposable income, of which :
2016
e
2017
e
2018
e
2016
e
2017
e
2018
e
–1.5
–1.0
–0.5
0.0
0.5
1.0
1.5
2.0
2.5
–2.5
–2.0
–1.5
–1.0
–0.5
0.0
0.5
1.0
1.5
2.0
2.5
–2.5
–2.0
–1.5
–1.0
–0.5
0.0
0.5
1.0
1.5
2.0
2.5
sources : nAi, nBB.(1) Data deflated by the household consumption expenditure deflator.(2) Other’ comprises the gross operating surplus and gross mixed income (of self-employed persons).
Chart 5 BUSINESS INVESTMENT AND INVESTMENT IN HOUSING
(volume data, percentage changes compared to the previous year, unless otherwise stated)
2011
2012
2013
2014
2015
–5
–3
–1
1
3
5
7
9
72
73
74
75
76
77
78
79
80
81
82
2011
2012
2013
2014
2015
–6
–4
–2
0
2
4
6
8
–15
–10
–5
0
5
10
15
20
Capacity utilisation in manufacturing industry (in %, right-hand scale)
BUSINESS INVESTMENT AND DETERMINANTS
Business investment
Gross operating surplus (1)
(left-hand scale)
INVESTMENT IN HOUSING
Investment in housing (left-hand scale)
Percentage below the pre-crisis level (right-hand scale)
2016
e
2017
e
2018
e
2016
e
2017
e
2018
e
sources : nAi, nBB.(1) in nominal terms.
June 2016 ❙ Economic proJEctions for BElgium – spring 2016 ❙ 19
While business investment exceeded its pre-crisis level some time ago, investment in housing is still well below that level. During the projection period, that shortfall is unlikely to be made up, despite strengthening growth. the strong annual rise in investment in housing in 2016 is due mainly to a spillover effect of the sharp rise in 2015. Although mortgage interest rates also remain low in real terms, while household incomes are rising and unemployment is falling steadily, the recovery of investment in housing is expected to continue being restrained somewhat by the supply shortage. the rise in demand for housing will therefore continue to focus largely on the secondary market where prices are forecast to maintain their marked upward trend.
regarding government expenditure, the growth of public in-vestment should receive a further substantial boost in 2016 from expenditure relating to the “Scholen van Morgen” pro-ject. The decline in these specific investments explains why the volume of government investment will remain practically unchanged in 2017. After that, investment is expected to begin rising again in the run-up to the forthcoming local elections. finally, the growth of public consumption will be slightly inflated this year, notably by the exceptional expendi-ture incurred in addressing the terrorist threat.
3. Labour market
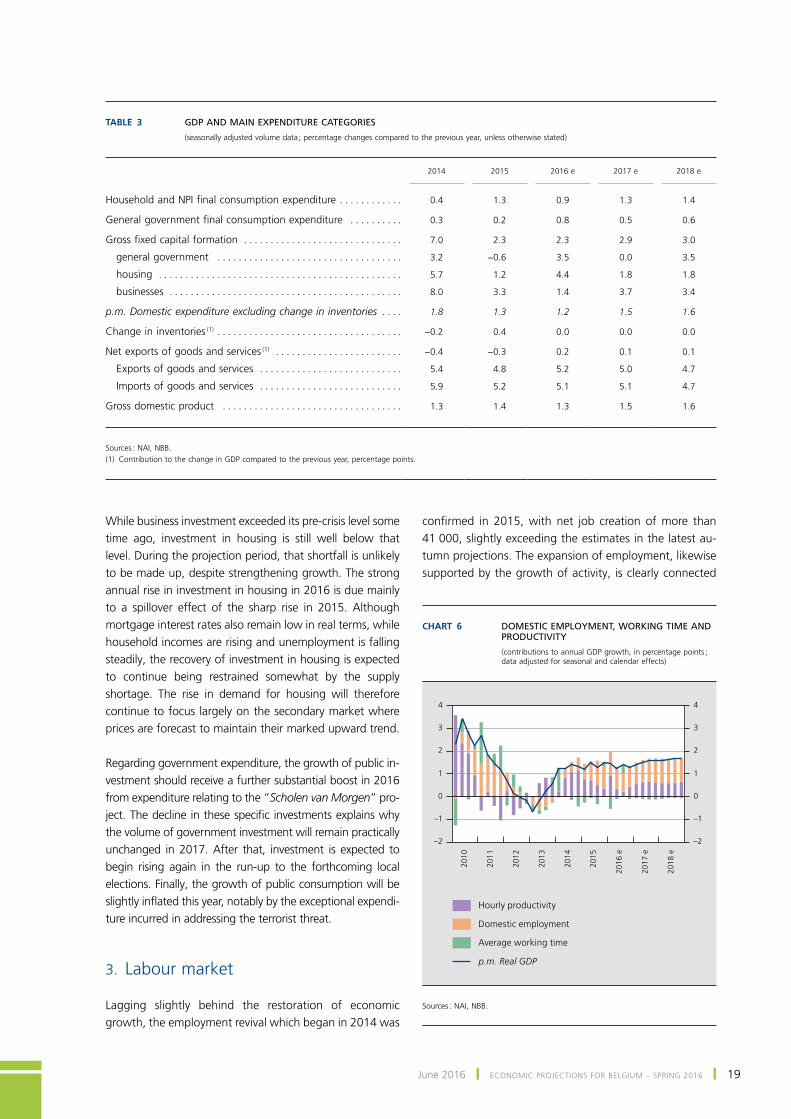
lagging slightly behind the restoration of economic growth, the employment revival which began in 2014 was
confirmed in 2015, with net job creation of more than 41 000, slightly exceeding the estimates in the latest au-tumn projections. The expansion of employment, likewise supported by the growth of activity, is clearly connected
Table 3 GDP AND MAIN EXPENDITURE CATEGORIES
(seasonally adjusted volume data ; percentage changes compared to the previous year, unless otherwise stated)
2014
2015
2016 e
2017 e
2018 e
Household and NPI final consumption expenditure . . . . . . . . . . . . 0.4 1.3 0.9 1.3 1.4
General government final consumption expenditure . . . . . . . . . . 0.3 0.2 0.8 0.5 0.6
Gross fixed capital formation . . . . . . . . . . . . . . . . . . . . . . . . . . . . . . 7.0 2.3 2.3 2.9 3.0
general government . . . . . . . . . . . . . . . . . . . . . . . . . . . . . . . . . . . 3.2 −0.6 3.5 0.0 3.5
housing . . . . . . . . . . . . . . . . . . . . . . . . . . . . . . . . . . . . . . . . . . . . . . 5.7 1.2 4.4 1.8 1.8
businesses . . . . . . . . . . . . . . . . . . . . . . . . . . . . . . . . . . . . . . . . . . . . 8.0 3.3 1.4 3.7 3.4
p.m. Domestic expenditure excluding change in inventories . . . . 1.8 1.3 1.2 1.5 1.6
Change in inventories (1) . . . . . . . . . . . . . . . . . . . . . . . . . . . . . . . . . . . −0.2 0.4 0.0 0.0 0.0
Net exports of goods and services (1) . . . . . . . . . . . . . . . . . . . . . . . . −0.4 −0.3 0.2 0.1 0.1
Exports of goods and services . . . . . . . . . . . . . . . . . . . . . . . . . . . 5.4 4.8 5.2 5.0 4.7
Imports of goods and services . . . . . . . . . . . . . . . . . . . . . . . . . . . 5.9 5.2 5.1 5.1 4.7
Gross domestic product . . . . . . . . . . . . . . . . . . . . . . . . . . . . . . . . . . 1.3 1.4 1.3 1.5 1.6
Sources : NAI, NBB.(1) Contribution to the change in GDP compared to the previous year, percentage points.
Chart 6 DOMESTIC EMPLOYMENT, WORKING TIME AND PRODUCTIVITY
(contributions to annual gDp growth, in percentage points ; data adjusted for seasonal and calendar effects)
2010
2011
2012
2013
2014
2015
–2
–1
0
1
2
3
4
–2
–1
0
1
2
3
4
Hourly productivity
p.m. Real GDP
Domestic employment
Average working time
2016
e
2017
e
2018
e
sources : nAi, nBB.
20 ❙ Economic proJEctions for BElgium – spring 2016 ❙ nBB Economic review
with the wage moderation policy which is making the production factor labour relatively cheaper and stimulat-ing recruitment, but it is also due to the recent labour market reforms, including unemployment insurance.
the strong employment growth is accompanied by the recent decline in average working time, which is due to both temporary and structural factors. As regards tem-porary factors, the abolition in 2015 of allowances for time credit without a specific reason undeniably played a role, as anticipation effects probably led to an increase in this form of time credit in the first half of 2015. the number of persons receiving a time credit, with or without an allowance, thus rose by 7.3 % in 2015. Most of that rise concerned 20 % reductions in working time. the security measures in response to the terror-ist threat, and especially the lock-down following the November 2015 attacks in Paris, also depressed output, primarily via a reduction in productivity and average working time. However, the reduction in working time is also due to structural factors, such as increased flexibility on the labour market, with an ever growing proportion of part-time work and short-term contracts. Changes in the employment structure have also played a part. While employment is declining in industry, it is expanding in
both market and non-market services. These last two sectors employ a higher proportion of part-timers, exert-ing a downward influence on the general trend in aver-age working time. Another factor concerns the growing proportion of workers aged 55 and over who scale down their activity at the end of their career.
these developments are expected to persist through-out the projection period against the backdrop of steady growth following the slight dip at the beginning of 2016. Average working time will continue to decline gradually while the rise in employment should accelerate a little further.
The expansion of employment – namely 140 000 ad-ditional jobs between 2016 and 2018 – is due mainly to market activities. Nonetheless, a contrasting picture is evident within the branches sensitive to the business cycle, where job creation is driven by market services, and especially by business services. self-employment continues to gain ground, with 31 000 more self-employed workers during the projection period. Conversely, owing to fiscal consolidation, the public sector is no longer driving em-ployment growth, even though the expected job losses are relatively limited.
Table 4 LABOUR SUPPLY AND DEMAND
(calendar adjusted data; change in thousands of persons compared to the previous year, unless otherwise stated)
2014
2015
2016 e
2017 e
2018 e
Total population . . . . . . . . . . . . . . . . . . . . . . . . . . . . . . . . . . . . . . . . . 55 55 71 85 61
Population of working age . . . . . . . . . . . . . . . . . . . . . . . . . . . . . . . . 9 12 27 33 9
Labour force . . . . . . . . . . . . . . . . . . . . . . . . . . . . . . . . . . . . . . . . . . . 29 22 24 38 24
Frontier workers . . . . . . . . . . . . . . . . . . . . . . . . . . . . . . . . . . . . . . . −1 0 0 0 0
Domestic employment . . . . . . . . . . . . . . . . . . . . . . . . . . . . . . . . . . . . 16 41 43 47 50
Employees . . . . . . . . . . . . . . . . . . . . . . . . . . . . . . . . . . . . . . . . . . 9 31 32 37 40
Branches sensitive to the business cycle (1) . . . . . . . . . . . . . −4 15 17 25 29
Public administration and education . . . . . . . . . . . . . . . . . . 5 1 1 −1 −3
Other services (2) . . . . . . . . . . . . . . . . . . . . . . . . . . . . . . . . . . . 7 15 14 14 14
Self‑employed . . . . . . . . . . . . . . . . . . . . . . . . . . . . . . . . . . . . . . . . . . . 7 10 10 10 11
Unemployed job‑seekers . . . . . . . . . . . . . . . . . . . . . . . . . . . . . . . . 14 −19 −19 −9 −26
p.m. Harmonised unemployment rate (3) (4) . . . . . . . . . . . . . . . . . . . 8.6 8.6 8.6 8.3 7.8
Harmonised employment rate (3) (5) . . . . . . . . . . . . . . . . . . . . . . 67.3 67.2 67.2 67.5 68.2
Sources : DGS, FPB, NAI, NEO, NBB.(1) Agriculture, industry, energy and water, construction, trade, hotels and restaurants, transport and communications, financial activities, property services and business services.(2) Health, welfare, community, public social services, personal services and domestic services.(3) On the basis of data from the labour force survey.(4) Job‑seekers in % of the labour force aged 15‑64 years.(5) Persons in work in % of the total population of working age (20‑64 years).
June 2016 ❙ Economic proJEctions for BElgium – spring 2016 ❙ 21
Population ageing is reflected in a fairly small increase in the population of working age. However, in 2016 and 2017, that factor is partly offset by the influx of refugees, who are very young compared to the Belgian population. This influx will have only a gradual, minor impact on the labour force, in view of the time involved in accessing the labour market and the barriers hamper-ing integration.
since labour demand is growing faster than the labour force, the number of unemployed job-seekers should continue to fall throughout the projection period. At the end of 2018, the number unemployed should be down by 54 000 compared to 2015. The harmonised unem-ployment rate should reflect this trend, falling from 8.6 % in 2015 to 7.8 % in 2018.
4. prices and costs
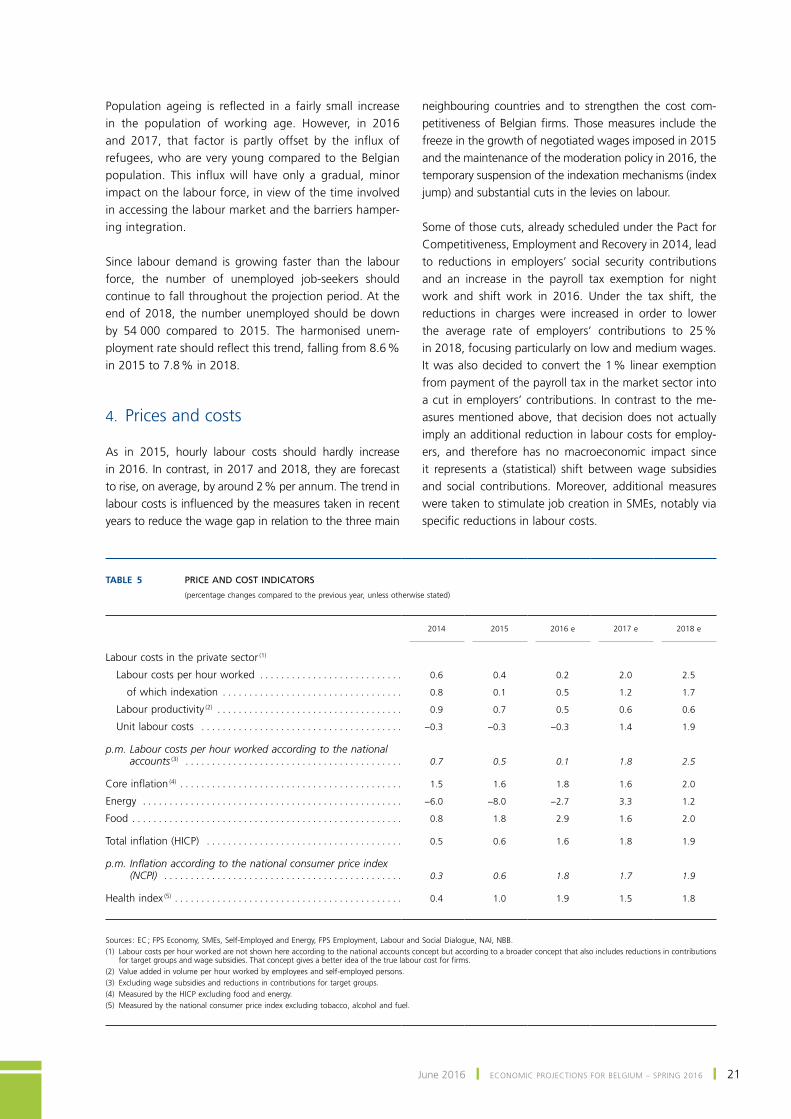
As in 2015, hourly labour costs should hardly increase in 2016. In contrast, in 2017 and 2018, they are forecast to rise, on average, by around 2 % per annum. The trend in labour costs is influenced by the measures taken in recent years to reduce the wage gap in relation to the three main
neighbouring countries and to strengthen the cost com-petitiveness of Belgian firms. Those measures include the freeze in the growth of negotiated wages imposed in 2015 and the maintenance of the moderation policy in 2016, the temporary suspension of the indexation mechanisms (index jump) and substantial cuts in the levies on labour.
some of those cuts, already scheduled under the pact for Competitiveness, Employment and Recovery in 2014, lead to reductions in employers’ social security contributions and an increase in the payroll tax exemption for night work and shift work in 2016. Under the tax shift, the reductions in charges were increased in order to lower the average rate of employers’ contributions to 25 % in 2018, focusing particularly on low and medium wages. It was also decided to convert the 1 % linear exemption from payment of the payroll tax in the market sector into a cut in employers’ contributions. In contrast to the me-asures mentioned above, that decision does not actually imply an additional reduction in labour costs for employ-ers, and therefore has no macroeconomic impact since it represents a (statistical) shift between wage subsidies and social contributions. moreover, additional measures were taken to stimulate job creation in SMEs, notably via specific reductions in labour costs.
Table 5 PRICE AND COST INDICATORS
(percentage changes compared to the previous year, unless otherwise stated)
2014
2015
2016 e
2017 e
2018 e
Labour costs in the private sector (1)
Labour costs per hour worked . . . . . . . . . . . . . . . . . . . . . . . . . . . 0.6 0.4 0.2 2.0 2.5
of which indexation . . . . . . . . . . . . . . . . . . . . . . . . . . . . . . . . . . 0.8 0.1 0.5 1.2 1.7
Labour productivity (2) . . . . . . . . . . . . . . . . . . . . . . . . . . . . . . . . . . . 0.9 0.7 0.5 0.6 0.6
Unit labour costs . . . . . . . . . . . . . . . . . . . . . . . . . . . . . . . . . . . . . . −0.3 −0.3 −0.3 1.4 1.9
p.m. Labour costs per hour worked according to the national accounts (3) . . . . . . . . . . . . . . . . . . . . . . . . . . . . . . . . . . . . . . . . . 0.7 0.5 0.1 1.8 2.5
Core inflation (4) . . . . . . . . . . . . . . . . . . . . . . . . . . . . . . . . . . . . . . . . . . 1.5 1.6 1.8 1.6 2.0
Energy . . . . . . . . . . . . . . . . . . . . . . . . . . . . . . . . . . . . . . . . . . . . . . . . . −6.0 −8.0 −2.7 3.3 1.2
Food . . . . . . . . . . . . . . . . . . . . . . . . . . . . . . . . . . . . . . . . . . . . . . . . . . . 0.8 1.8 2.9 1.6 2.0
Total inflation (HICP) . . . . . . . . . . . . . . . . . . . . . . . . . . . . . . . . . . . . . 0.5 0.6 1.6 1.8 1.9
p.m. Inflation according to the national consumer price index (NCPI) . . . . . . . . . . . . . . . . . . . . . . . . . . . . . . . . . . . . . . . . . . . . . 0.3 0.6 1.8 1.7 1.9
Health index (5) . . . . . . . . . . . . . . . . . . . . . . . . . . . . . . . . . . . . . . . . . . . 0.4 1.0 1.9 1.5 1.8
Sources : EC ; FPS Economy, SMEs, Self‑Employed and Energy, FPS Employment, Labour and Social Dialogue, NAI, NBB.(1) Labour costs per hour worked are not shown here according to the national accounts concept but according to a broader concept that also includes reductions in contributions
for target groups and wage subsidies. That concept gives a better idea of the true labour cost for firms.(2) Value added in volume per hour worked by employees and self‑employed persons.(3) Excluding wage subsidies and reductions in contributions for target groups.(4) Measured by the HICP excluding food and energy.(5) Measured by the national consumer price index excluding tobacco, alcohol and fuel.
22 ❙ Economic proJEctions for BElgium – spring 2016 ❙ nBB Economic review
Altogether, these reductions in charges on labour should cut labour costs per hour worked by around 1.3 % over the projection period, most of the impact occurring in 2016, and to a lesser extent in 2018. That assessment is the same as in the autumn projections – except, of course, for the account taken of the measures planned for 2018.
the temporary suspension of indexation ended in April – a month later than expected last December – but core infla-tion and the health index were revised upwards for the rest of the year so that, as the two factors offset one another, the impact of indexation in 2016 remained the same as in the autumn forecasts. Taking account of the specific phasing of the many mechanisms, indexation will make a growing, but gradual, contribution to wage increases from 2016, but primarily in 2017 and 2018.
on the subject of real negotiated wages (excluding indexation) in 2016, the available statistics for the first quarter seem to indicate that the rise will be less than the maximum 0.67 % margin resulting from the wage norm that the government imposed at the beginning of 2015 in the absence of agreement between the social partners. Consequently, an average 0.5 % increase is now expect-ed. For 2017 and 2018, the margins for negotiated ad-justments will only be known once the central agreement negotiations have ended ; those negotiations are due to start at the end of the year. for those two years, the effect of indexation is forecast at 1.2 % and 1.7 % respectively, owing to the rise in core inflation. Taking account of both the continuing labour market improvements and the ex-pected movement in wages in neighbouring countries, a technical assumption was made whereby real negotiated wages will rise by 0.8 % and 1 % respectively in 2017 and 2018.
Overall, unit labour costs should decline further in 2016, for the third consecutive year. Conversely, they are likely to rise again from 2017, mainly on account of the increase in hourly labour costs but also because of the projected weak productivity gains.
Although unit labour costs have been falling since 2014, core inflation in Belgium has remained relatively high and persistent, with monthly rates rarely below 1.5 %. Core inflation has actually risen year-on-year since 2014, and in the period 2014-2015 it came to between 1.5 % and 1.6 %, or about twice the average for the euro area, where la-bour costs have increased significantly. Moreover, in recent months, core inflation appears to have continued rising, once again in contrast to the euro area average, to reach an average of almost 1.9 % in the first quarter of 2016. The very moderate cost pressure should therefore lead to only a minor dip in core inflation during the coming months.
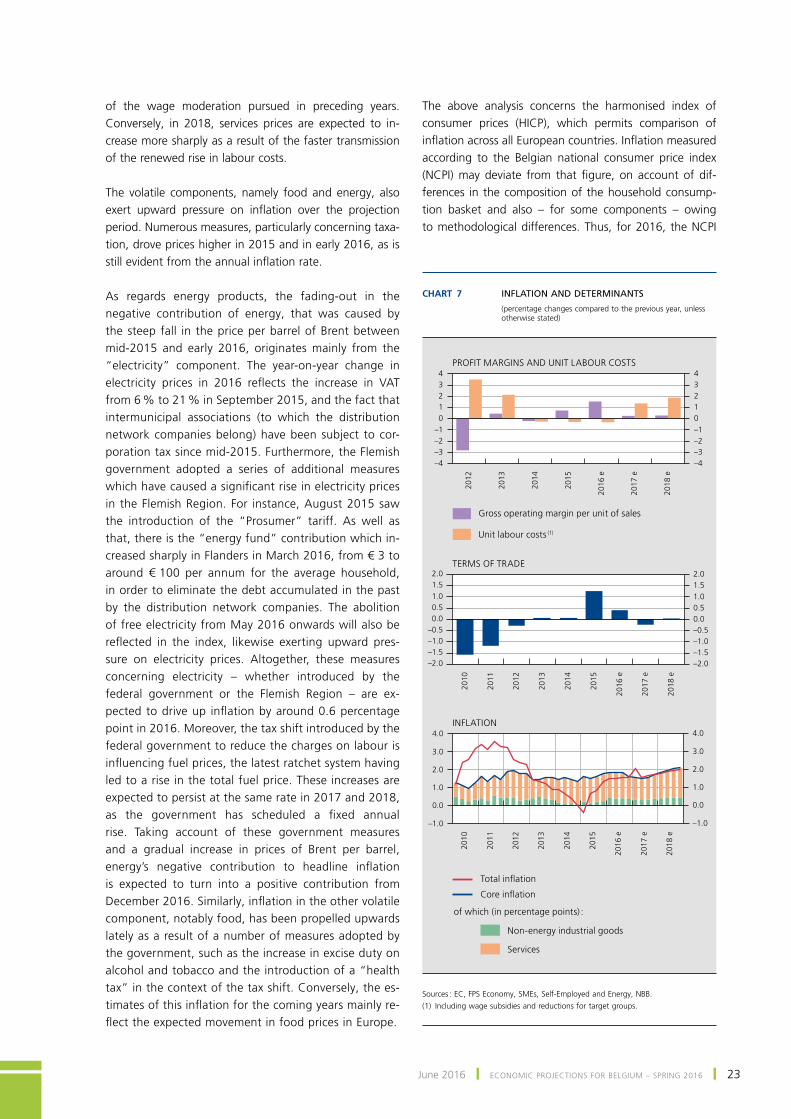
The movement in profit margins also shows that the lower costs have not been fully reflected in selling prices : profit margins clearly recovered last year, and taking account of downward price rigidities and the persistent decline in labour costs, that trend is likely to continue in 2016. For the following two years, the projections take account of a much more modest increase in profit margins. However, the more marked rise in labour costs from 2017 should gradually increase the pressure on prices, and core infla-tion is expected to resume an upward trend in the course of 2017.
The terms of trade are another factor influencing prices : the fall in oil prices led to a marked improvement in the terms of trade in 2015, contributing to low inflation that year despite the relative persistence of core inflation. For the projection period, the terms of trade are expected to display a more neutral picture, notably on the basis of the assumptions de-scribed in box 1 for oil prices and exchange rates.
Overall, headline inflation measured by the harmonised index of consumer prices (Hicp) is estimated at an aver-age of 1.6 % in 2016. That is therefore much higher than the euro area’s inflation rate (0.2 % pour 2016), but it is only partly influenced by the basic components of price-setting. In 2016, the price rises triggered by government decisions are likely to represent more than half of total inflation. In Belgium, inflation is projected to reach 1.8 % in 2017 and 1.9 % in 2018.
Regarding the components of core inflation, the growth of prices of non-energy industrial goods remains rela-tively stable, rising by around 1 % per annum. The euro’s tendency to appreciate in 2016 will exert downward pressure on external costs (imported goods and goods involving foreign intermediate inputs). on the other hand, the gradual rise in oil prices will put up energy costs for Belgian firms. These movements will help to stabilise the rise in prices of non-energy industrial goods. However, the recovery of unit labour costs apparent from the end of 2016 will also drive up prices of these goods, albeit after a certain time lag.
service prices prove somewhat more volatile over the projection period. prices of certain services have surged recently, continuing to exert an influence on inflation. that applies, for example, to higher education, where reg-istration fees were increased in Flanders in October 2015, and in telecommunications where operators’ tariffs were raised at the beginning of 2016. Finally, the hotel and restaurant sector is still seeing exceptional increases, as prices there went up by more than 3 % in the first quar-ter of 2016. Over 2017 as a whole, however, inflation in services should ease slightly, owing to the delayed effect
June 2016 ❙ Economic proJEctions for BElgium – spring 2016 ❙ 23
of the wage moderation pursued in preceding years. Conversely, in 2018, services prices are expected to in-crease more sharply as a result of the faster transmission of the renewed rise in labour costs.
the volatile components, namely food and energy, also exert upward pressure on inflation over the projection period. numerous measures, particularly concerning taxa-tion, drove prices higher in 2015 and in early 2016, as is still evident from the annual inflation rate.
As regards energy products, the fading-out in the negative contribution of energy, that was caused by the steep fall in the price per barrel of Brent between mid-2015 and early 2016, originates mainly from the “electricity” component. the year-on-year change in electricity prices in 2016 reflects the increase in VAT from 6 % to 21 % in September 2015, and the fact that intermunicipal associations (to which the distribution network companies belong) have been subject to cor-poration tax since mid-2015. Furthermore, the Flemish government adopted a series of additional measures which have caused a significant rise in electricity prices in the Flemish Region. For instance, August 2015 saw the introduction of the “prosumer” tariff. As well as that, there is the “energy fund” contribution which in-creased sharply in Flanders in March 2016, from € 3 to around € 100 per annum for the average household, in order to eliminate the debt accumulated in the past by the distribution network companies. The abolition of free electricity from May 2016 onwards will also be reflected in the index, likewise exerting upward pres-sure on electricity prices. Altogether, these measures concerning electricity – whether introduced by the federal government or the flemish region – are ex-pected to drive up inflation by around 0.6 percentage point in 2016. Moreover, the tax shift introduced by the federal government to reduce the charges on labour is influencing fuel prices, the latest ratchet system having led to a rise in the total fuel price. these increases are expected to persist at the same rate in 2017 and 2018, as the government has scheduled a fixed annual rise. Taking account of these government measures and a gradual increase in prices of Brent per barrel, energy’s negative contribution to headline inflation is expected to turn into a positive contribution from December 2016. Similarly, inflation in the other volatile component, notably food, has been propelled upwards lately as a result of a number of measures adopted by the government, such as the increase in excise duty on alcohol and tobacco and the introduction of a “health tax” in the context of the tax shift. conversely, the es-timates of this inflation for the coming years mainly re-flect the expected movement in food prices in Europe.
the above analysis concerns the harmonised index of consumer prices (Hicp), which permits comparison of inflation across all European countries. Inflation measured according to the Belgian national consumer price index (NCPI) may deviate from that figure, on account of dif-ferences in the composition of the household consump-tion basket and also – for some components – owing to methodological differences. Thus, for 2016, the NCPI
Chart 7 INFLATION AND DETERMINANTS
(percentage changes compared to the previous year, unless otherwise stated)
–4–3–2–101234
–4–3–2–101234
TERMS OF TRADE
PROFIT MARGINS AND UNIT LABOUR COSTS
INFLATION
Services
Non‑energy industrial goods
Core inflation
Unit labour costs (1)
Gross operating margin per unit of sales
Total inflation
2010
2011
2012
2013
2014
2015
2016
e
2017
e
2018
e
2010
2011
2012
2013
2014
2015
2016
e
2017
e
2018
e
2012
2013
2014
2015
2016
e
2017
e
2018
e
of which (in percentage points) :
–2.0–1.5–1.0–0.50.00.51.01.52.0
–2.0–1.5–1.0–0.50.00.51.01.52.0
–1.0
0.0
1.0
2.0
3.0
4.0
–1.0
0.0
1.0
2.0
3.0
4.0
sources : Ec, fps Economy, smEs, self-Employed and Energy, nBB.(1) including wage subsidies and reductions for target groups.
24 ❙ Economic proJEctions for BElgium – spring 2016 ❙ nBB Economic review
figures diverge from those of the HICP mainly because the ncpi attributes a much bigger weight to the “electricity” component, which increased sharply in price. the ncpi is used to calculate the health index, i.e. the national index excluding tobacco, alcoholic beverages and fuel. that health index, which forms the basis of wage indexation, is forecast to rise by an average of 1.9 % in 2016, 1.5 % in 2017 and 1.8 % in 2018.
5. Public finances
5.1 general government balance
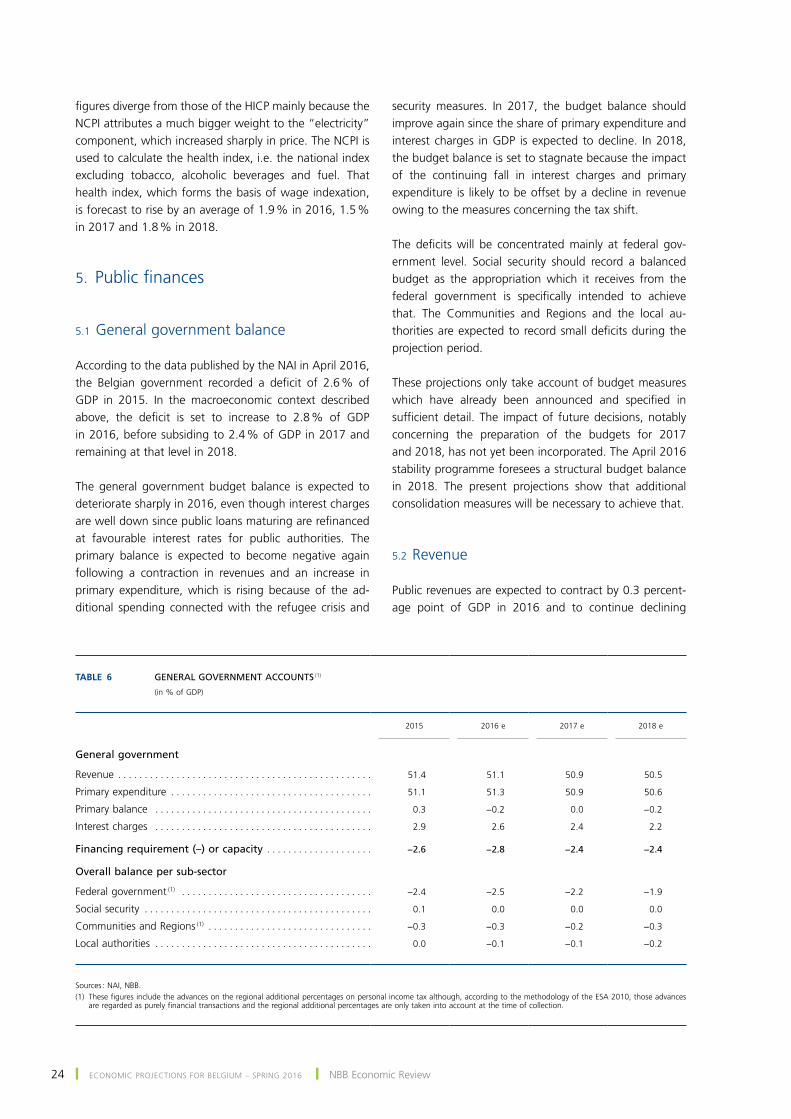
According to the data published by the NAI in April 2016, the Belgian government recorded a deficit of 2.6 % of GDP in 2015. In the macroeconomic context described above, the deficit is set to increase to 2.8 % of GDP in 2016, before subsiding to 2.4 % of GDP in 2017 and remaining at that level in 2018.
the general government budget balance is expected to deteriorate sharply in 2016, even though interest charges are well down since public loans maturing are refinanced at favourable interest rates for public authorities. the primary balance is expected to become negative again following a contraction in revenues and an increase in primary expenditure, which is rising because of the ad-ditional spending connected with the refugee crisis and
security measures. In 2017, the budget balance should improve again since the share of primary expenditure and interest charges in GDP is expected to decline. In 2018, the budget balance is set to stagnate because the impact of the continuing fall in interest charges and primary expenditure is likely to be offset by a decline in revenue owing to the measures concerning the tax shift.
The deficits will be concentrated mainly at federal gov-ernment level. social security should record a balanced budget as the appropriation which it receives from the federal government is specifically intended to achieve that. the communities and regions and the local au-thorities are expected to record small deficits during the projection period.
These projections only take account of budget measures which have already been announced and specified in sufficient detail. The impact of future decisions, notably concerning the preparation of the budgets for 2017 and 2018, has not yet been incorporated. The April 2016 stability programme foresees a structural budget balance in 2018. The present projections show that additional consolidation measures will be necessary to achieve that.
5.2 revenue
Public revenues are expected to contract by 0.3 percent-age point of GDP in 2016 and to continue declining
Table 6 GENERAL GOVERNMENT ACCOUNTS (1)
(in % of GDP)
2015
2016 e
2017 e
2018 e
General government
Revenue . . . . . . . . . . . . . . . . . . . . . . . . . . . . . . . . . . . . . . . . . . . . . . . . 51.4 51.1 50.9 50.5
Primary expenditure . . . . . . . . . . . . . . . . . . . . . . . . . . . . . . . . . . . . . . 51.1 51.3 50.9 50.6
Primary balance . . . . . . . . . . . . . . . . . . . . . . . . . . . . . . . . . . . . . . . . . 0.3 −0.2 0.0 −0.2
Interest charges . . . . . . . . . . . . . . . . . . . . . . . . . . . . . . . . . . . . . . . . . 2.9 2.6 2.4 2.2
Financing requirement (–) or capacity . . . . . . . . . . . . . . . . . . . . −2.6 −2.8 −2.4 −2.4
Overall balance per sub‑sector
Federal government (1) . . . . . . . . . . . . . . . . . . . . . . . . . . . . . . . . . . . . −2.4 −2.5 −2.2 −1.9
Social security . . . . . . . . . . . . . . . . . . . . . . . . . . . . . . . . . . . . . . . . . . . 0.1 0.0 0.0 0.0
Communities and Regions (1) . . . . . . . . . . . . . . . . . . . . . . . . . . . . . . . −0.3 −0.3 −0.2 −0.3
Local authorities . . . . . . . . . . . . . . . . . . . . . . . . . . . . . . . . . . . . . . . . . 0.0 −0.1 −0.1 −0.2
Sources : NAI, NBB.(1) These figures include the advances on the regional additional percentages on personal income tax although, according to the methodology of the ESA 2010, those advances
are regarded as purely financial transactions and the regional additional percentages are only taken into account at the time of collection.
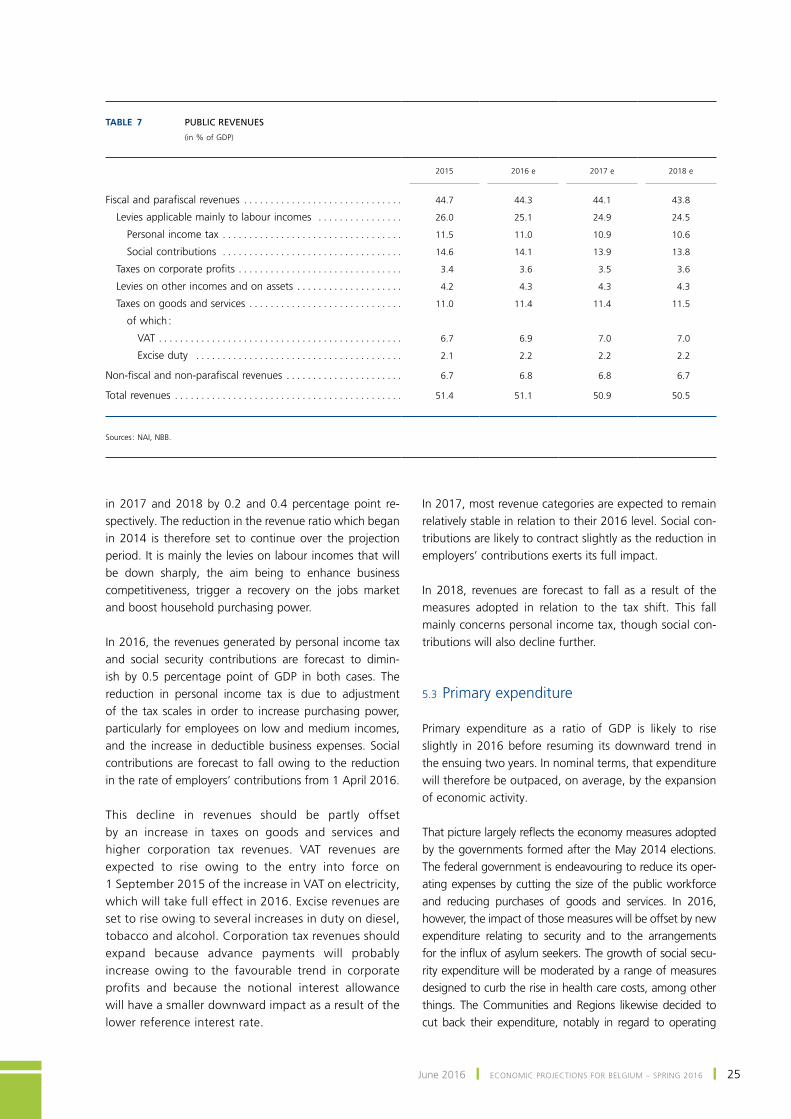
June 2016 ❙ Economic proJEctions for BElgium – spring 2016 ❙ 25
in 2017 and 2018 by 0.2 and 0.4 percentage point re-spectively. the reduction in the revenue ratio which began in 2014 is therefore set to continue over the projection period. it is mainly the levies on labour incomes that will be down sharply, the aim being to enhance business competitiveness, trigger a recovery on the jobs market and boost household purchasing power.
In 2016, the revenues generated by personal income tax and social security contributions are forecast to dimin-ish by 0.5 percentage point of GDP in both cases. The reduction in personal income tax is due to adjustment of the tax scales in order to increase purchasing power, particularly for employees on low and medium incomes, and the increase in deductible business expenses. social contributions are forecast to fall owing to the reduction in the rate of employers’ contributions from 1 April 2016.
this decline in revenues should be partly offset by an increase in taxes on goods and services and higher corporation tax revenues. VAt revenues are expected to rise owing to the entry into force on 1 September 2015 of the increase in VAT on electricity, which will take full effect in 2016. Excise revenues are set to rise owing to several increases in duty on diesel, tobacco and alcohol. corporation tax revenues should expand because advance payments will probably increase owing to the favourable trend in corporate profits and because the notional interest allowance will have a smaller downward impact as a result of the lower reference interest rate.
In 2017, most revenue categories are expected to remain relatively stable in relation to their 2016 level. Social con-tributions are likely to contract slightly as the reduction in employers’ contributions exerts its full impact.
In 2018, revenues are forecast to fall as a result of the measures adopted in relation to the tax shift. this fall mainly concerns personal income tax, though social con-tributions will also decline further.
5.3 primary expenditure
Primary expenditure as a ratio of GDP is likely to rise slightly in 2016 before resuming its downward trend in the ensuing two years. in nominal terms, that expenditure will therefore be outpaced, on average, by the expansion of economic activity.
That picture largely reflects the economy measures adopted by the governments formed after the May 2014 elections. the federal government is endeavouring to reduce its oper-ating expenses by cutting the size of the public workforce and reducing purchases of goods and services. In 2016, however, the impact of those measures will be offset by new expenditure relating to security and to the arrangements for the influx of asylum seekers. The growth of social secu-rity expenditure will be moderated by a range of measures designed to curb the rise in health care costs, among other things. The Communities and Regions likewise decided to cut back their expenditure, notably in regard to operating
Table 7 PUBLIC REVENUES
(in % of GDP)
2015
2016 e
2017 e
2018 e
Fiscal and parafiscal revenues . . . . . . . . . . . . . . . . . . . . . . . . . . . . . . 44.7 44.3 44.1 43.8
Levies applicable mainly to labour incomes . . . . . . . . . . . . . . . . 26.0 25.1 24.9 24.5
Personal income tax . . . . . . . . . . . . . . . . . . . . . . . . . . . . . . . . . . 11.5 11.0 10.9 10.6
Social contributions . . . . . . . . . . . . . . . . . . . . . . . . . . . . . . . . . . 14.6 14.1 13.9 13.8
Taxes on corporate profits . . . . . . . . . . . . . . . . . . . . . . . . . . . . . . . 3.4 3.6 3.5 3.6
Levies on other incomes and on assets . . . . . . . . . . . . . . . . . . . . 4.2 4.3 4.3 4.3
Taxes on goods and services . . . . . . . . . . . . . . . . . . . . . . . . . . . . . 11.0 11.4 11.4 11.5
of which :
VAT . . . . . . . . . . . . . . . . . . . . . . . . . . . . . . . . . . . . . . . . . . . . . . 6.7 6.9 7.0 7.0
Excise duty . . . . . . . . . . . . . . . . . . . . . . . . . . . . . . . . . . . . . . . 2.1 2.2 2.2 2.2
Non‑fiscal and non‑parafiscal revenues . . . . . . . . . . . . . . . . . . . . . . 6.7 6.8 6.8 6.7
Total revenues . . . . . . . . . . . . . . . . . . . . . . . . . . . . . . . . . . . . . . . . . . . 51.4 51.1 50.9 50.5
Sources : NAI, NBB.
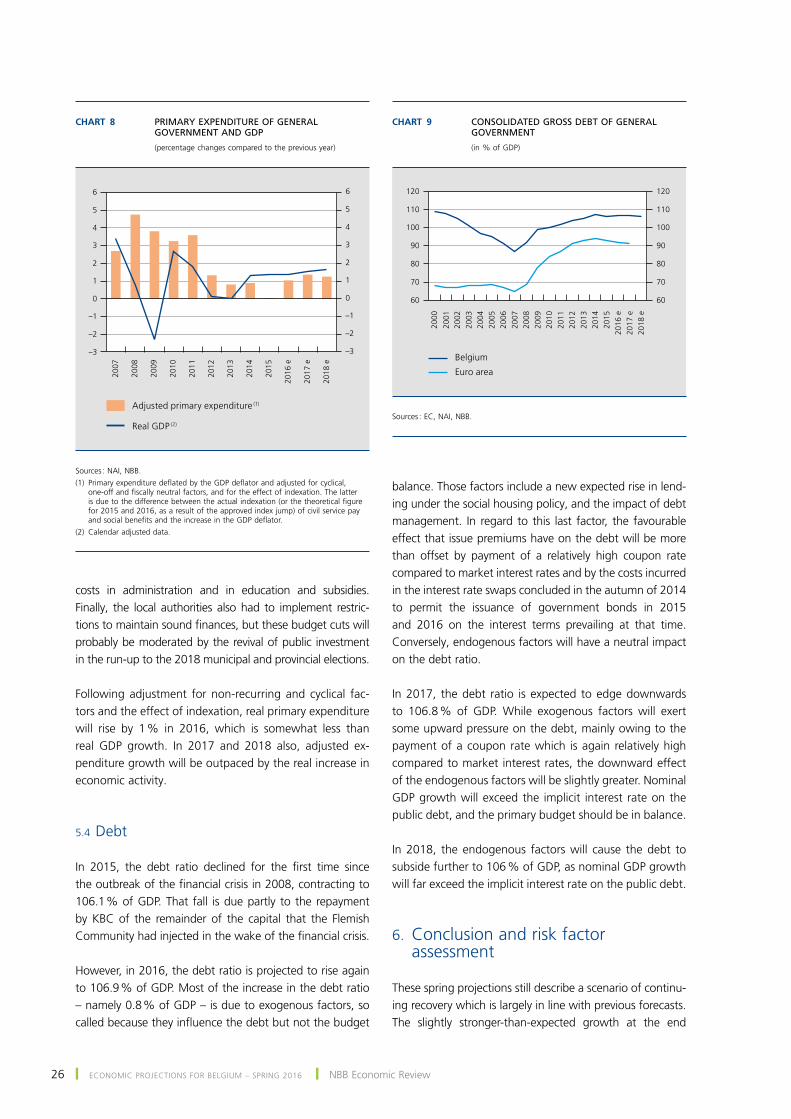
26 ❙ Economic proJEctions for BElgium – spring 2016 ❙ nBB Economic review
costs in administration and in education and subsidies. finally, the local authorities also had to implement restric-tions to maintain sound finances, but these budget cuts will probably be moderated by the revival of public investment in the run-up to the 2018 municipal and provincial elections.
following adjustment for non-recurring and cyclical fac-tors and the effect of indexation, real primary expenditure will rise by 1 % in 2016, which is somewhat less than real GDP growth. In 2017 and 2018 also, adjusted ex-penditure growth will be outpaced by the real increase in economic activity.
5.4 Debt
In 2015, the debt ratio declined for the first time since the outbreak of the financial crisis in 2008, contracting to 106.1 % of GDP. That fall is due partly to the repayment by KBc of the remainder of the capital that the flemish Community had injected in the wake of the financial crisis.
However, in 2016, the debt ratio is projected to rise again to 106.9 % of GDP. Most of the increase in the debt ratio – namely 0.8 % of GDP – is due to exogenous factors, so called because they influence the debt but not the budget
balance. those factors include a new expected rise in lend-ing under the social housing policy, and the impact of debt management. in regard to this last factor, the favourable effect that issue premiums have on the debt will be more than offset by payment of a relatively high coupon rate compared to market interest rates and by the costs incurred in the interest rate swaps concluded in the autumn of 2014 to permit the issuance of government bonds in 2015 and 2016 on the interest terms prevailing at that time. conversely, endogenous factors will have a neutral impact on the debt ratio.
In 2017, the debt ratio is expected to edge downwards to 106.8 % of GDP. While exogenous factors will exert some upward pressure on the debt, mainly owing to the payment of a coupon rate which is again relatively high compared to market interest rates, the downward effect of the endogenous factors will be slightly greater. nominal gDp growth will exceed the implicit interest rate on the public debt, and the primary budget should be in balance.
In 2018, the endogenous factors will cause the debt to subside further to 106 % of GDP, as nominal GDP growth will far exceed the implicit interest rate on the public debt.
6. Conclusion and risk factor assessment
these spring projections still describe a scenario of continu-ing recovery which is largely in line with previous forecasts. the slightly stronger-than-expected growth at the end
Chart 8 PRIMARY EXPENDITURE OF GENERAL GOVERNMENT AND GDP
(percentage changes compared to the previous year)
2007
2008
2009
2010
2011
2012
2013
2014
2015
–3
–2
–1
0
1
2
3
4
5
6
–3
–2
–1
0
1
2
3
4
5
6
Adjusted primary expenditure (1)
Real GDP (2)
2016
e
2017
e
2018
e
sources : nAi, nBB.(1) Primary expenditure deflated by the GDP deflator and adjusted for cyclical,
one-off and fiscally neutral factors, and for the effect of indexation. The latter is due to the difference between the actual indexation (or the theoretical figure for 2015 and 2016, as a result of the approved index jump) of civil service pay and social benefits and the increase in the GDP deflator.
(2) calendar adjusted data.
Chart 9 CONSOLIDATED GROSS DEBT OF GENERAL GOVERNMENT
(in % of GDP)
2000
2001
2002
2003
2004
2005
2006
2007
2008
2009
2010
2011
2012
2013
2014
2015
60
70
80
90
100
110
120
60
70
80
90
100
110
120
Euro area
Belgium
2016
e20
17 e
2018
e
sources : Ec, nAi, nBB.
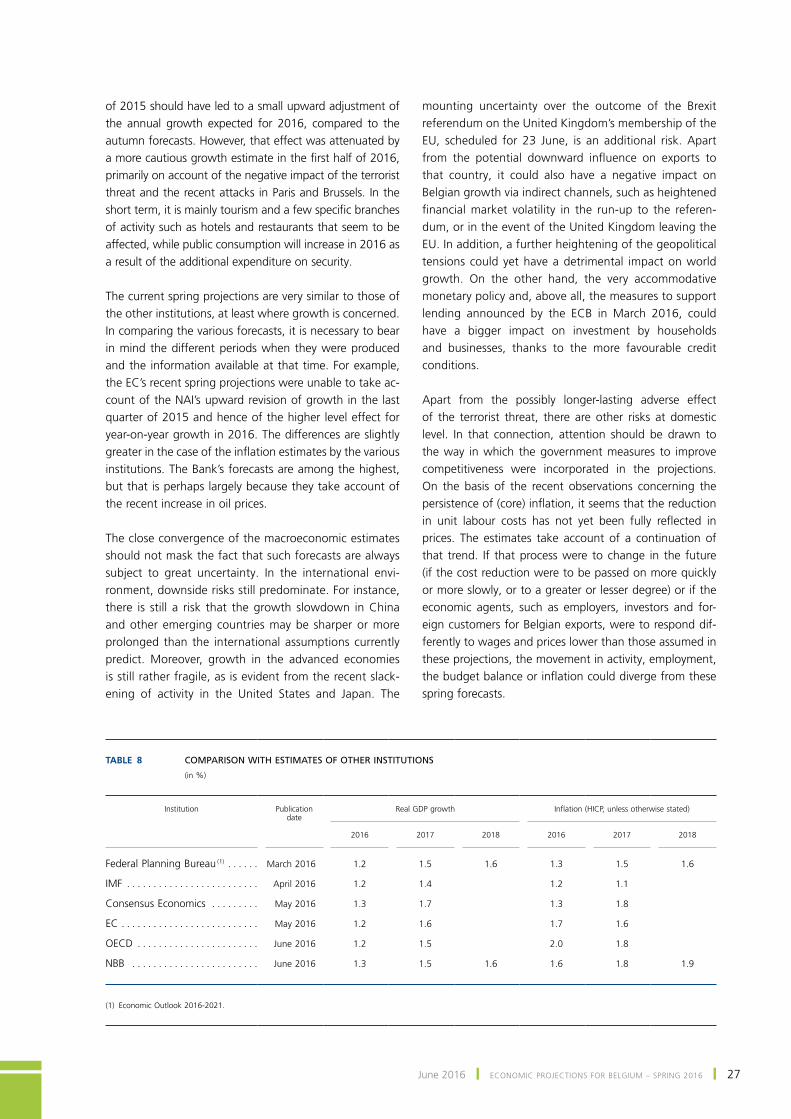
June 2016 ❙ Economic proJEctions for BElgium – spring 2016 ❙ 27
of 2015 should have led to a small upward adjustment of the annual growth expected for 2016, compared to the autumn forecasts. However, that effect was attenuated by a more cautious growth estimate in the first half of 2016, primarily on account of the negative impact of the terrorist threat and the recent attacks in Paris and Brussels. In the short term, it is mainly tourism and a few specific branches of activity such as hotels and restaurants that seem to be affected, while public consumption will increase in 2016 as a result of the additional expenditure on security.
the current spring projections are very similar to those of the other institutions, at least where growth is concerned. in comparing the various forecasts, it is necessary to bear in mind the different periods when they were produced and the information available at that time. for example, the EC’s recent spring projections were unable to take ac-count of the NAI’s upward revision of growth in the last quarter of 2015 and hence of the higher level effect for year-on-year growth in 2016. The differences are slightly greater in the case of the inflation estimates by the various institutions. The Bank’s forecasts are among the highest, but that is perhaps largely because they take account of the recent increase in oil prices.
the close convergence of the macroeconomic estimates should not mask the fact that such forecasts are always subject to great uncertainty. in the international envi-ronment, downside risks still predominate. For instance, there is still a risk that the growth slowdown in China and other emerging countries may be sharper or more prolonged than the international assumptions currently predict. moreover, growth in the advanced economies is still rather fragile, as is evident from the recent slack-ening of activity in the united states and Japan. the
mounting uncertainty over the outcome of the Brexit referendum on the United Kingdom’s membership of the EU, scheduled for 23 June, is an additional risk. Apart from the potential downward influence on exports to that country, it could also have a negative impact on Belgian growth via indirect channels, such as heightened financial market volatility in the run-up to the referen-dum, or in the event of the united Kingdom leaving the Eu. in addition, a further heightening of the geopolitical tensions could yet have a detrimental impact on world growth. on the other hand, the very accommodative monetary policy and, above all, the measures to support lending announced by the ECB in March 2016, could have a bigger impact on investment by households and businesses, thanks to the more favourable credit conditions.
Apart from the possibly longer-lasting adverse effect of the terrorist threat, there are other risks at domestic level. in that connection, attention should be drawn to the way in which the government measures to improve competitiveness were incorporated in the projections. on the basis of the recent observations concerning the persistence of (core) inflation, it seems that the reduction in unit labour costs has not yet been fully reflected in prices. The estimates take account of a continuation of that trend. if that process were to change in the future (if the cost reduction were to be passed on more quickly or more slowly, or to a greater or lesser degree) or if the economic agents, such as employers, investors and for-eign customers for Belgian exports, were to respond dif-ferently to wages and prices lower than those assumed in these projections, the movement in activity, employment, the budget balance or inflation could diverge from these spring forecasts.
Table 8 COMPARISON WITH ESTIMATES OF OTHER INSTITUTIONS
(in %)
Institution
Publication date
Real GDP growth
Inflation (HICP, unless otherwise stated)
2016
2017
2018
2016
2017
2018
Federal Planning Bureau (1) . . . . . . March 2016 1.2 1.5 1.6 1.3 1.5 1.6
IMF . . . . . . . . . . . . . . . . . . . . . . . . . April 2016 1.2 1.4 1.2 1.1
Consensus Economics . . . . . . . . . May 2016 1.3 1.7 1.3 1.8
EC . . . . . . . . . . . . . . . . . . . . . . . . . . May 2016 1.2 1.6 1.7 1.6
OECD . . . . . . . . . . . . . . . . . . . . . . . June 2016 1.2 1.5 2.0 1.8
NBB . . . . . . . . . . . . . . . . . . . . . . . . June 2016 1.3 1.5 1.6 1.6 1.8 1.9
(1) Economic Outlook 2016‑2021.
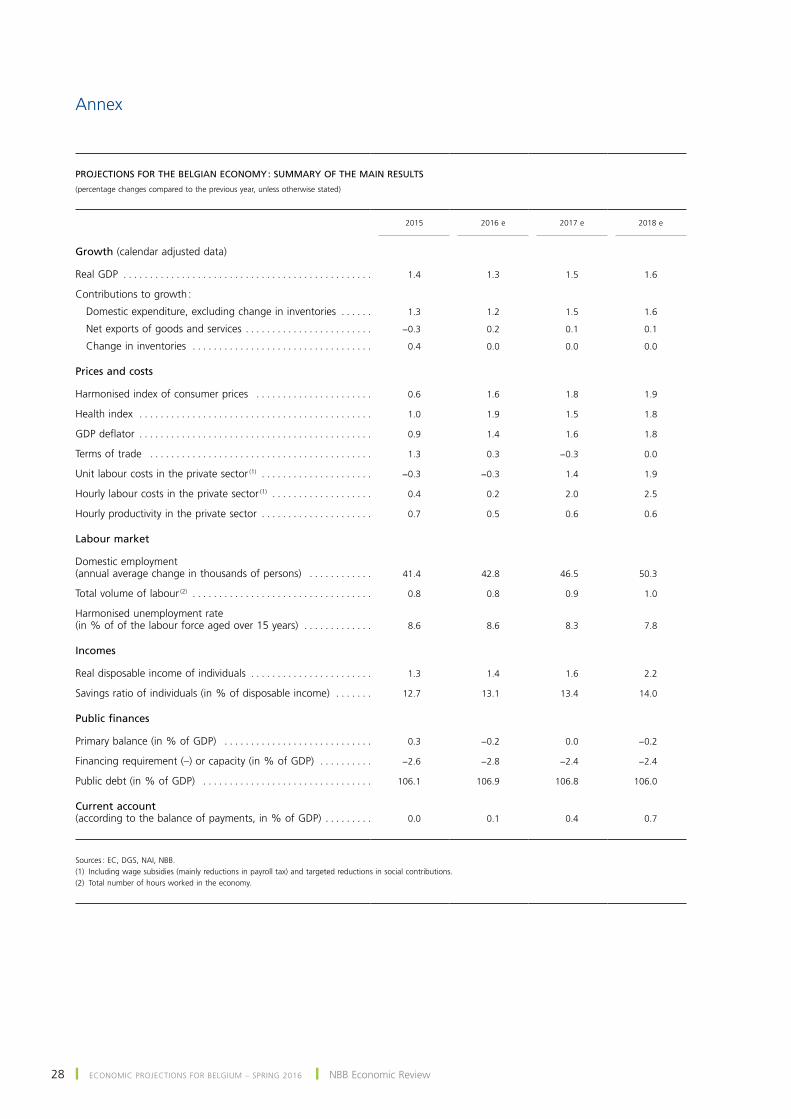
28 ❙ Economic proJEctions for BElgium – spring 2016 ❙ nBB Economic review
Annex
PROJECTIONS FOR THE BELGIAN ECONOMY : SUMMARY OF THE MAIN RESULTS
(percentage changes compared to the previous year, unless otherwise stated)
2015
2016 e
2017 e
2018 e
Growth (calendar adjusted data)
Real GDP . . . . . . . . . . . . . . . . . . . . . . . . . . . . . . . . . . . . . . . . . . . . . . . 1.4 1.3 1.5 1.6
Contributions to growth :
Domestic expenditure, excluding change in inventories . . . . . . 1.3 1.2 1.5 1.6
Net exports of goods and services . . . . . . . . . . . . . . . . . . . . . . . . −0.3 0.2 0.1 0.1
Change in inventories . . . . . . . . . . . . . . . . . . . . . . . . . . . . . . . . . . 0.4 0.0 0.0 0.0
Prices and costs
Harmonised index of consumer prices . . . . . . . . . . . . . . . . . . . . . . 0.6 1.6 1.8 1.9
Health index . . . . . . . . . . . . . . . . . . . . . . . . . . . . . . . . . . . . . . . . . . . . 1.0 1.9 1.5 1.8
GDP deflator . . . . . . . . . . . . . . . . . . . . . . . . . . . . . . . . . . . . . . . . . . . . 0.9 1.4 1.6 1.8
Terms of trade . . . . . . . . . . . . . . . . . . . . . . . . . . . . . . . . . . . . . . . . . . 1.3 0.3 −0.3 0.0
Unit labour costs in the private sector (1) . . . . . . . . . . . . . . . . . . . . . −0.3 −0.3 1.4 1.9
Hourly labour costs in the private sector (1) . . . . . . . . . . . . . . . . . . . 0.4 0.2 2.0 2.5
Hourly productivity in the private sector . . . . . . . . . . . . . . . . . . . . . 0.7 0.5 0.6 0.6
Labour market
Domestic employment (annual average change in thousands of persons) . . . . . . . . . . . . 41.4 42.8 46.5 50.3
Total volume of labour (2) . . . . . . . . . . . . . . . . . . . . . . . . . . . . . . . . . . 0.8 0.8 0.9 1.0
Harmonised unemployment rate (in % of of the labour force aged over 15 years) . . . . . . . . . . . . . 8.6 8.6 8.3 7.8
Incomes
Real disposable income of individuals . . . . . . . . . . . . . . . . . . . . . . . 1.3 1.4 1.6 2.2
Savings ratio of individuals (in % of disposable income) . . . . . . . 12.7 13.1 13.4 14.0
Public finances
Primary balance (in % of GDP) . . . . . . . . . . . . . . . . . . . . . . . . . . . . 0.3 −0.2 0.0 −0.2
Financing requirement (–) or capacity (in % of GDP) . . . . . . . . . . −2.6 −2.8 −2.4 −2.4
Public debt (in % of GDP) . . . . . . . . . . . . . . . . . . . . . . . . . . . . . . . . 106.1 106.9 106.8 106.0
Current account (according to the balance of payments, in % of GDP) . . . . . . . . . 0.0 0.1 0.4 0.7
Sources : EC, DGS, NAI, NBB.(1) Including wage subsidies (mainly reductions in payroll tax) and targeted reductions in social contributions.(2) Total number of hours worked in the economy.
June 2016 ❙ tHE ABc of QuAntitAtiVE EAsing or tHE BAsics of cEntrAl BAnK AssEt purcHAsEs ❙ 29
the ABc of quantitative easing or the basics of central bank asset purchases
N. CordemansM. DerooseM. KasongoA. Stevens (*)
introduction
On 22 January 2015, the Governing Council of the European Central Bank (ECB) (1) announced it was about to embark on an expanded asset purchase programme, buy-ing euro area government and private sector securities to the tune of € 60 billion every month. On 10 March 2016, it raised the monthly figure to € 80 billion and announced it would expand the programme to include corporate bonds from the non-financial sector.
such asset purchases fall into the category of ‘unconven-tional’ or ‘non-conventional’ monetary policy, since they are distinct from changes in policy rates. they are de-scribed as ‘quantitative easing’, as they lead to an increase in the quantity of money available in the economy. Asset purchases have proven highly suited to low interest rate environments, when policy rates are approaching their lower bound and traditional monetary policy thus reaches its limits. that said, their purpose is the same : to reduce the real cost of financing in order to boost economic activity and ensure price stability, the primary objective of monetary policy in the euro area.
This article aims precisely to explain why a central bank would introduce an asset purchase programme and
how this can contribute to its price stability mandate. The article breaks down into two sections : the first reviews traditional monetary policy, its aims and the way it operates, while also covering its potential dis-ruptions and its limitations. section two describes the quantitative easing policy that explicitly enables central banks to move beyond such limitations. While not claiming to be exhaustive, the section aims to explain the key mechanisms of asset purchase programmes, chiefly investigating how such programmes affect real financing conditions in the economy and money crea-tion. the article ends on a review of the consequences of asset purchases for public finances and for liquidity in the banking system.
1. ‘Traditional’ vs ‘unconventional’ monetary policy
in the euro area, price stability is the primary objective of monetary policy. The ECB’s Governing Council has defined price stability as an inflation rate of below, but close to, 2 % in the medium term. This level of inflation is considered appropriate to encourage sustainable eco-nomic growth and to ward off deflation risk, i.e. a general fall in prices. The ECB’s monetary policy measures aim to achieve this target, taking into account the euro area’s macroeconomic and financial prospects.
Depending on the circumstances, the EcB will attempt to support or slow down economic activity by modulat-ing financing conditions for households, corporations
(*) The authors would like to thank Jef Boeckx for his valuable comments and suggestions.
(1) For simplicity’s sake, this article uses the terms European Central Bank (ECB) and Eurosystem interchangeably, while noting that the Eurosystem comprises the ECB and all national central banks of the euro area countries. Monetary policy decisions are taken by the ECB’s Governing Council and implemented at the level of the Eurosystem.
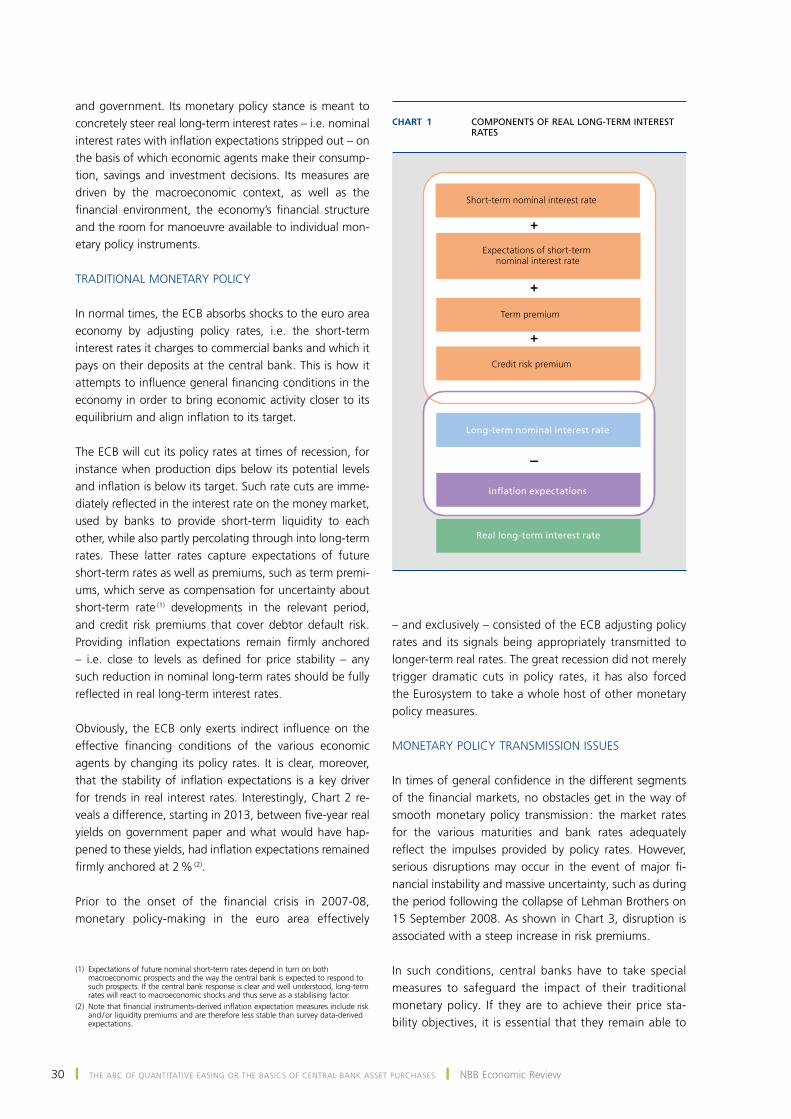
30 ❙ tHE ABc of QuAntitAtiVE EAsing or tHE BAsics of cEntrAl BAnK AssEt purcHAsEs ❙ nBB Economic review
and government. its monetary policy stance is meant to concretely steer real long-term interest rates – i.e. nominal interest rates with inflation expectations stripped out – on the basis of which economic agents make their consump-tion, savings and investment decisions. its measures are driven by the macroeconomic context, as well as the financial environment, the economy’s financial structure and the room for manoeuvre available to individual mon-etary policy instruments.
trADitionAl monEtArY policY
In normal times, the ECB absorbs shocks to the euro area economy by adjusting policy rates, i.e. the short-term interest rates it charges to commercial banks and which it pays on their deposits at the central bank. This is how it attempts to influence general financing conditions in the economy in order to bring economic activity closer to its equilibrium and align inflation to its target.
the EcB will cut its policy rates at times of recession, for instance when production dips below its potential levels and inflation is below its target. Such rate cuts are imme-diately reflected in the interest rate on the money market, used by banks to provide short-term liquidity to each other, while also partly percolating through into long-term rates. these latter rates capture expectations of future short-term rates as well as premiums, such as term premi-ums, which serve as compensation for uncertainty about short-term rate (1) developments in the relevant period, and credit risk premiums that cover debtor default risk. Providing inflation expectations remain firmly anchored – i.e. close to levels as defined for price stability – any such reduction in nominal long-term rates should be fully reflected in real long-term interest rates.
Obviously, the ECB only exerts indirect influence on the effective financing conditions of the various economic agents by changing its policy rates. it is clear, moreover, that the stability of inflation expectations is a key driver for trends in real interest rates. Interestingly, Chart 2 re-veals a difference, starting in 2013, between five-year real yields on government paper and what would have hap-pened to these yields, had inflation expectations remained firmly anchored at 2 % (2).
Prior to the onset of the financial crisis in 2007-08, monetary policy-making in the euro area effectively
– and exclusively – consisted of the EcB adjusting policy rates and its signals being appropriately transmitted to longer-term real rates. the great recession did not merely trigger dramatic cuts in policy rates, it has also forced the Eurosystem to take a whole host of other monetary policy measures.
monEtArY policY trAnsmission issuEs
In times of general confidence in the different segments of the financial markets, no obstacles get in the way of smooth monetary policy transmission : the market rates for the various maturities and bank rates adequately reflect the impulses provided by policy rates. However, serious disruptions may occur in the event of major fi-nancial instability and massive uncertainty, such as during the period following the collapse of lehman Brothers on 15 September 2008. As shown in Chart 3, disruption is associated with a steep increase in risk premiums.
In such conditions, central banks have to take special measures to safeguard the impact of their traditional monetary policy. if they are to achieve their price sta-bility objectives, it is essential that they remain able to
(1) Expectations of future nominal short-term rates depend in turn on both macroeconomic prospects and the way the central bank is expected to respond to such prospects. If the central bank response is clear and well understood, long-term rates will react to macroeconomic shocks and thus serve as a stabilising factor.
(2) Note that financial instruments-derived inflation expectation measures include risk and / or liquidity premiums and are therefore less stable than survey data-derived expectations.
Chart 1 COMPONENTS OF REAL LONG-TERM INTEREST RATES
+
+
+
–
Short-term nominal interest rate
Expectations of short-term nominal interest rate
Term premium
Credit risk premium
Long-term nominal interest rate
Inflation expectations
Real long-term interest rate
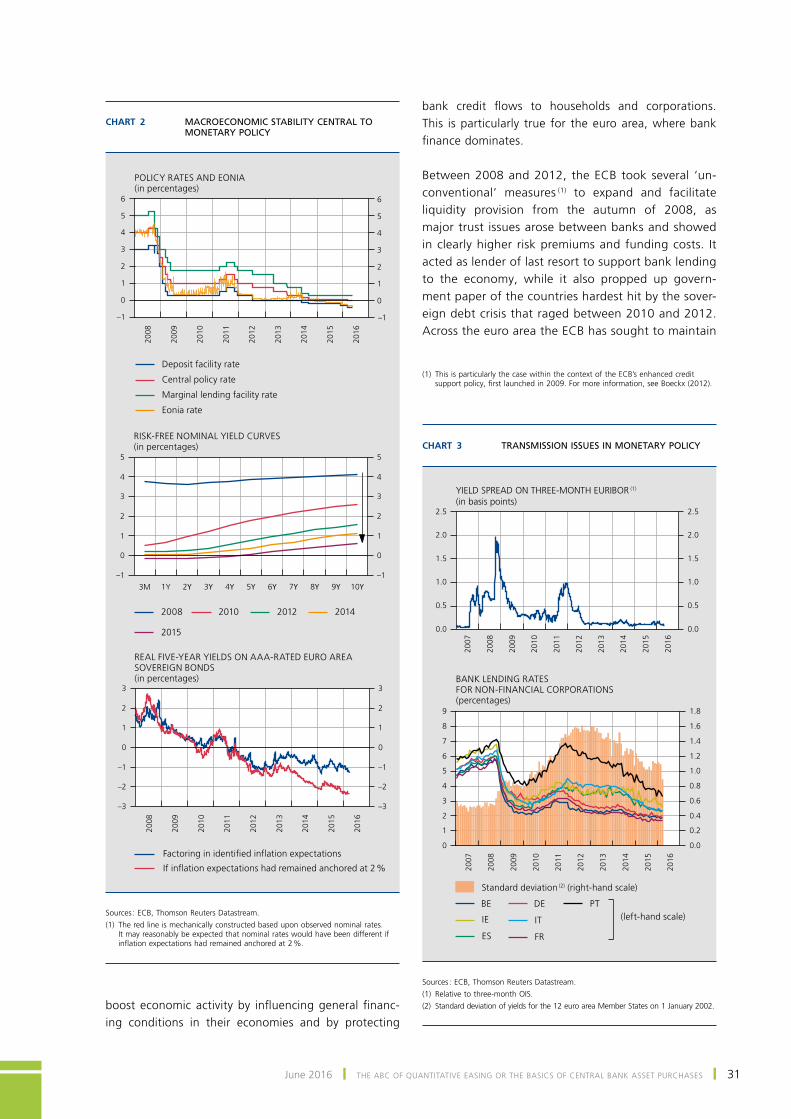
June 2016 ❙ tHE ABc of QuAntitAtiVE EAsing or tHE BAsics of cEntrAl BAnK AssEt purcHAsEs ❙ 31
bank credit flows to households and corporations. This is particularly true for the euro area, where bank finance dominates.
Between 2008 and 2012, the ECB took several ‘un-conventional’ measures (1) to expand and facilitate liquidity provision from the autumn of 2008, as major trust issues arose between banks and showed in clearly higher risk premiums and funding costs. It acted as lender of last resort to support bank lending to the economy, while it also propped up govern-ment paper of the countries hardest hit by the sover-eign debt crisis that raged between 2010 and 2012. Across the euro area the EcB has sought to maintain
Chart 2 MACROECONOMIC STABILITY CENTRAL TO MONETARY POLICY
2008
2009
2010
2011
2012
2013
2014
2015
2016
–1
0
1
2
3
4
5
6
–1
0
1
2
3
4
5
6
–1
0
1
2
3
4
5
–1
0
1
2
3
4
5
2010 20122008 2014
2015
2008
2009
2010
2011
2012
2013
2014
2015
2016
–3
–2
–1
0
1
2
3
–3
–2
–1
0
1
2
3
POLICY RATES AND EONIA(in percentages)
Central policy rate
Marginal lending facility rate
Deposit facility rate
Eonia rate
RISK-FREE NOMINAL YIELD CURVES(in percentages)
3M 1Y 2Y 3Y 4Y 5Y 6Y 7Y 8Y 9Y 10Y
REAL FIVE-YEAR YIELDS ON AAA-RATED EURO AREA SOVEREIGN BONDS (in percentages)
If inflation expectations had remained anchored at 2 %
Factoring in identified inflation expectations
sources : EcB, thomson reuters Datastream.(1) the red line is mechanically constructed based upon observed nominal rates.
it may reasonably be expected that nominal rates would have been different if inflation expectations had remained anchored at 2 %.
Chart 3 TRANSMISSION ISSUES IN MONETARY POLICY
2007
2008
2009
2010
2011
2012
2013
2014
2015
2016
2007
2008
2009
2010
2011
2012
2013
2014
2015
2016
0
1
2
3
4
5
6
7
8
9
YIELD SPREAD ON THREE-MONTH EURIBOR (1)
(in basis points)
0.0
0.5
1.0
1.5
2.0
2.5
0.0
0.5
1.0
1.5
2.0
2.5
0.0
0.2
0.4
0.6
0.8
1.0
1.2
1.4
1.6
1.8
BANK LENDING RATES FOR NON-FINANCIAL CORPORATIONS(percentages)
Standard deviation (2) (right-hand scale)
BE DE
ES FR
IE IT
PT(left-hand scale)
sources : EcB, thomson reuters Datastream.(1) relative to three-month ois.(2) Standard deviation of yields for the 12 euro area Member States on 1 January 2002.
(1) This is particularly the case within the context of the ECB’s enhanced credit support policy, first launched in 2009. For more information, see Boeckx (2012).
boost economic activity by influencing general financ-ing conditions in their economies and by protecting
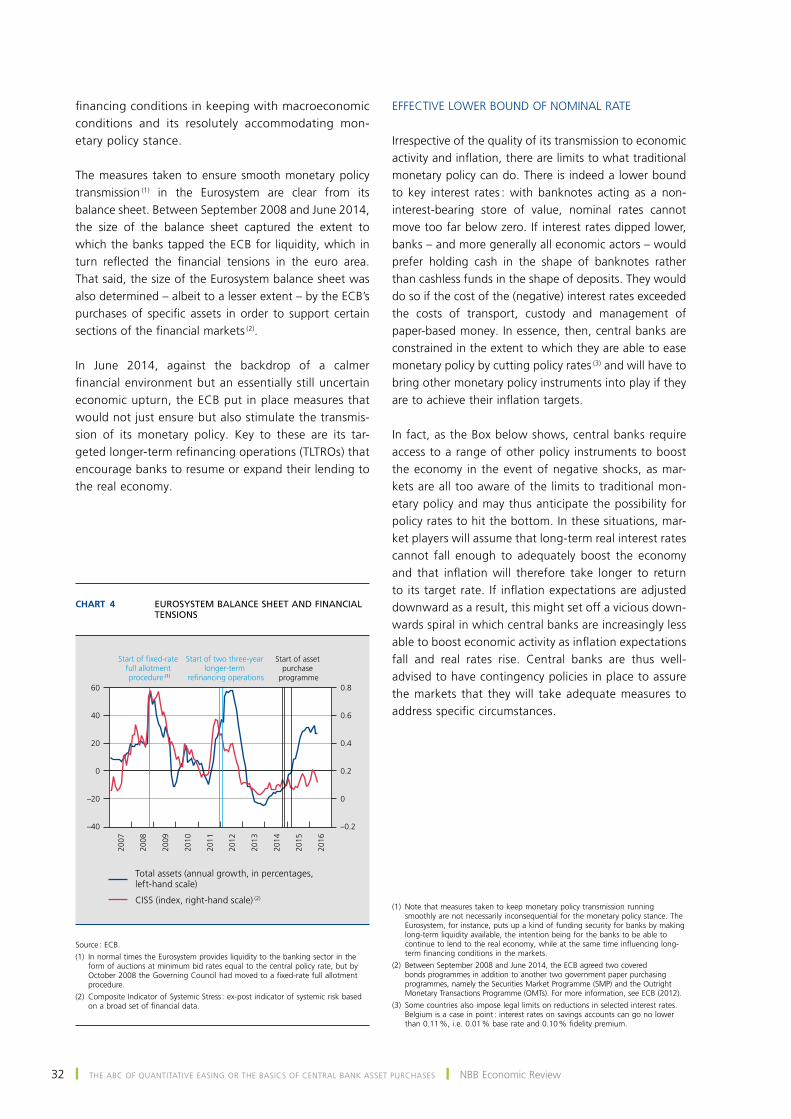
32 ❙ tHE ABc of QuAntitAtiVE EAsing or tHE BAsics of cEntrAl BAnK AssEt purcHAsEs ❙ nBB Economic review
financing conditions in keeping with macroeconomic conditions and its resolutely accommodating mon-etary policy stance.
The measures taken to ensure smooth monetary policy transmission (1) in the Eurosystem are clear from its balance sheet. Between September 2008 and June 2014, the size of the balance sheet captured the extent to which the banks tapped the ECB for liquidity, which in turn reflected the financial tensions in the euro area. that said, the size of the Eurosystem balance sheet was also determined – albeit to a lesser extent – by the ECB’s purchases of specific assets in order to support certain sections of the financial markets (2).
In June 2014, against the backdrop of a calmer financial environment but an essentially still uncertain economic upturn, the EcB put in place measures that would not just ensure but also stimulate the transmis-sion of its monetary policy. Key to these are its tar-geted longer-term refinancing operations (TLTROs) that encourage banks to resume or expand their lending to the real economy.
EffEctiVE loWEr BounD of nominAl rAtE
irrespective of the quality of its transmission to economic activity and inflation, there are limits to what traditional monetary policy can do. there is indeed a lower bound to key interest rates : with banknotes acting as a non-interest-bearing store of value, nominal rates cannot move too far below zero. if interest rates dipped lower, banks – and more generally all economic actors – would prefer holding cash in the shape of banknotes rather than cashless funds in the shape of deposits. they would do so if the cost of the (negative) interest rates exceeded the costs of transport, custody and management of paper-based money. In essence, then, central banks are constrained in the extent to which they are able to ease monetary policy by cutting policy rates (3) and will have to bring other monetary policy instruments into play if they are to achieve their inflation targets.
In fact, as the Box below shows, central banks require access to a range of other policy instruments to boost the economy in the event of negative shocks, as mar-kets are all too aware of the limits to traditional mon-etary policy and may thus anticipate the possibility for policy rates to hit the bottom. in these situations, mar-ket players will assume that long-term real interest rates cannot fall enough to adequately boost the economy and that inflation will therefore take longer to return to its target rate. If inflation expectations are adjusted downward as a result, this might set off a vicious down-wards spiral in which central banks are increasingly less able to boost economic activity as inflation expectations fall and real rates rise. Central banks are thus well-advised to have contingency policies in place to assure the markets that they will take adequate measures to address specific circumstances.
(1) Note that measures taken to keep monetary policy transmission running smoothly are not necessarily inconsequential for the monetary policy stance. the Eurosystem, for instance, puts up a kind of funding security for banks by making long-term liquidity available, the intention being for the banks to be able to continue to lend to the real economy, while at the same time influencing long-term financing conditions in the markets.
(2) Between September 2008 and June 2014, the ECB agreed two covered bonds programmes in addition to another two government paper purchasing programmes, namely the Securities Market Programme (SMP) and the Outright monetary transactions programme (omts). for more information, see EcB (2012).
(3) some countries also impose legal limits on reductions in selected interest rates. Belgium is a case in point : interest rates on savings accounts can go no lower than 0.11 %, i.e. 0.01 % base rate and 0.10 % fidelity premium.
Chart 4 EUROSYSTEM BALANCE SHEET AND FINANCIAL TENSIONS
2007
2008
2009
2010
2011
2012
2013
2014
2015
2016
–40
–20
0
20
40
60
–0.2
0
0.2
0.4
0.6
0.8
CISS (index, right-hand scale) (2)
Total assets (annual growth, in percentages,left-hand scale)
Start of fixed-rate full allotment procedure (1)
Start of two three-year longer-term
refinancing operations
Start of asset purchase
programme
source : EcB.(1) In normal times the Eurosystem provides liquidity to the banking sector in the
form of auctions at minimum bid rates equal to the central policy rate, but by October 2008 the Governing Council had moved to a fixed-rate full allotment procedure.
(2) Composite Indicator of Systemic Stress : ex-post indicator of systemic risk based on a broad set of financial data.
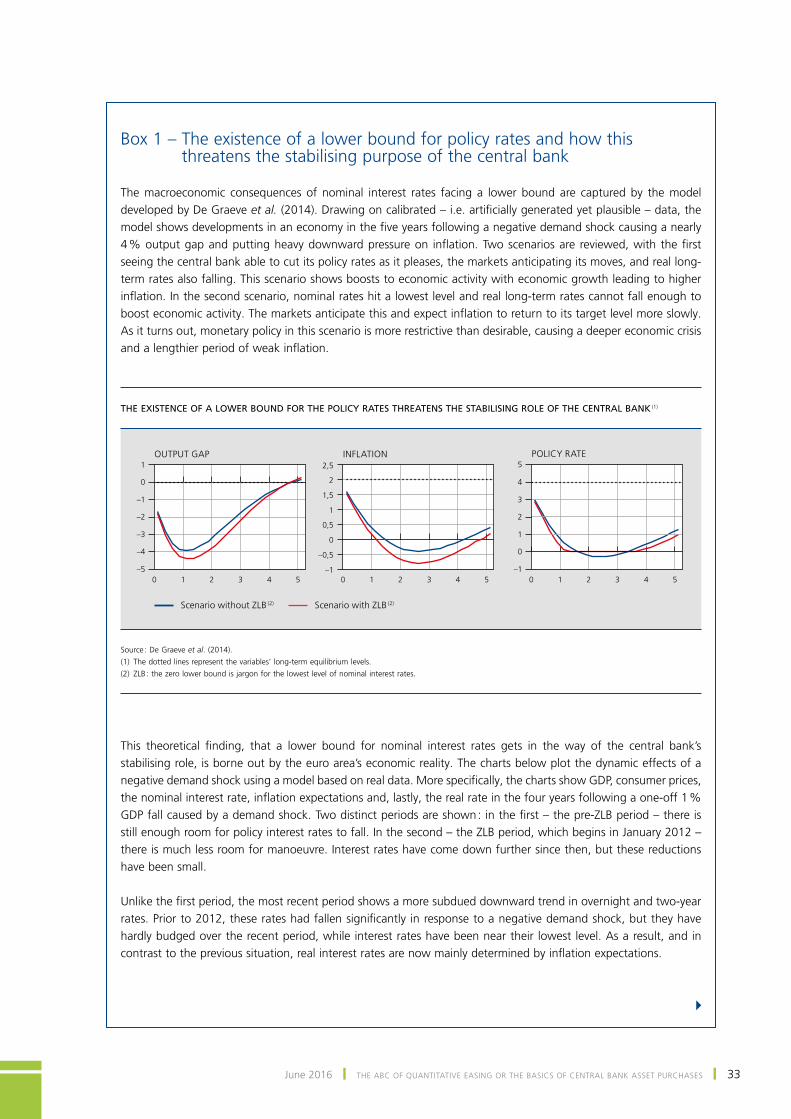
June 2016 ❙ tHE ABc of QuAntitAtiVE EAsing or tHE BAsics of cEntrAl BAnK AssEt purcHAsEs ❙ 33
Box 1 – The existence of a lower bound for policy rates and how this threatens the stabilising purpose of the central bank
the macroeconomic consequences of nominal interest rates facing a lower bound are captured by the model developed by De graeve et al. (2014). Drawing on calibrated – i.e. artificially generated yet plausible – data, the model shows developments in an economy in the five years following a negative demand shock causing a nearly 4 % output gap and putting heavy downward pressure on inflation. Two scenarios are reviewed, with the first seeing the central bank able to cut its policy rates as it pleases, the markets anticipating its moves, and real long-term rates also falling. this scenario shows boosts to economic activity with economic growth leading to higher inflation. In the second scenario, nominal rates hit a lowest level and real long-term rates cannot fall enough to boost economic activity. The markets anticipate this and expect inflation to return to its target level more slowly. As it turns out, monetary policy in this scenario is more restrictive than desirable, causing a deeper economic crisis and a lengthier period of weak inflation.
This theoretical finding, that a lower bound for nominal interest rates gets in the way of the central bank’s stabilising role, is borne out by the euro area’s economic reality. The charts below plot the dynamic effects of a negative demand shock using a model based on real data. More specifically, the charts show GDP, consumer prices, the nominal interest rate, inflation expectations and, lastly, the real rate in the four years following a one-off 1 % GDP fall caused by a demand shock. Two distinct periods are shown : in the first – the pre-ZLB period – there is still enough room for policy interest rates to fall. In the second – the ZLB period, which begins in January 2012 – there is much less room for manoeuvre. interest rates have come down further since then, but these reductions have been small.
Unlike the first period, the most recent period shows a more subdued downward trend in overnight and two-year rates. Prior to 2012, these rates had fallen significantly in response to a negative demand shock, but they have hardly budged over the recent period, while interest rates have been near their lowest level. As a result, and in contrast to the previous situation, real interest rates are now mainly determined by inflation expectations.
4
THE EXISTENCE OF A LOWER BOUND FOR THE POLICY RATES THREATENS THE STABILISING ROLE OF THE CENTRAL BANK (1)
–5
–4
–3
–2
–1
0
1
–1
–0,5
0
0,5
1
1,5
2
2,5
–1
0
1
2
3
4
5
0 1 2 3 4 5 0 1 2 3 4 5 0 1 2 3 4 5
OUTPUT GAP INFLATION POLICY RATE
Scenario without ZLB (2) Scenario with ZLB
(2)
source : De graeve et al. (2014).(1) The dotted lines represent the variables’ long-term equilibrium levels.(2) ZLB : the zero lower bound is jargon for the lowest level of nominal interest rates.
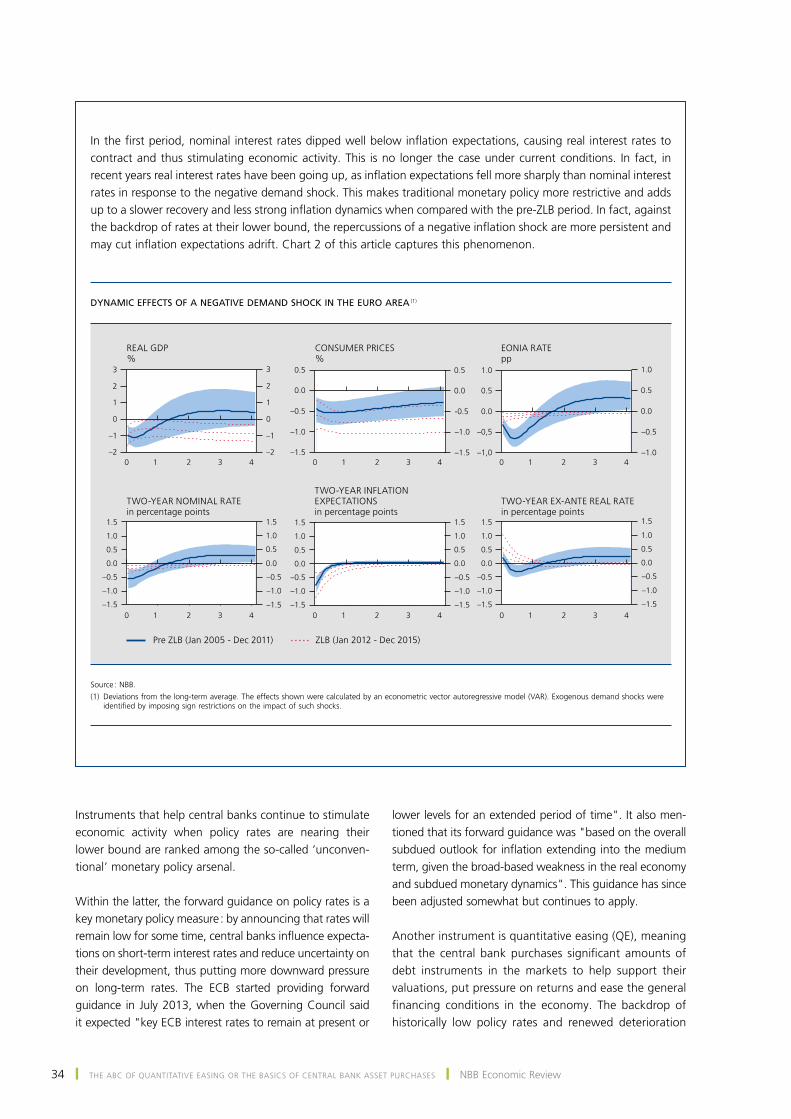
34 ❙ tHE ABc of QuAntitAtiVE EAsing or tHE BAsics of cEntrAl BAnK AssEt purcHAsEs ❙ nBB Economic review
In the first period, nominal interest rates dipped well below inflation expectations, causing real interest rates to contract and thus stimulating economic activity. this is no longer the case under current conditions. in fact, in recent years real interest rates have been going up, as inflation expectations fell more sharply than nominal interest rates in response to the negative demand shock. This makes traditional monetary policy more restrictive and adds up to a slower recovery and less strong inflation dynamics when compared with the pre-ZLB period. In fact, against the backdrop of rates at their lower bound, the repercussions of a negative inflation shock are more persistent and may cut inflation expectations adrift. Chart 2 of this article captures this phenomenon.
DYNAMIC EFFECTS OF A NEGATIVE DEMAND SHOCK IN THE EURO AREA (1)
–2
–1
–2
–1
0
1
2
3
0 1 2 3 4
0 1 2 3 4 0 1 2 3 4 0 1 2 3 4
0 1 2 3 4 0 1 2 3 4
REAL GDP%
CONSUMER PRICES%
EONIA RATEpp
TWO-YEAR NOMINAL RATEin percentage points
TWO-YEAR INFLATION EXPECTATIONSin percentage points
TWO-YEAR EX-ANTE REAL RATEin percentage points
Pre ZLB (Jan 2005 - Dec 2011) ZLB (Jan 2012 - Dec 2015)
–1.5
–1.0
–1.5
–1.0
–1.0
–0.5
–1,0
–0,5
–1.5
–1.0
–0.5
–1.5
–1.0
–0.5
–1.5
–1.0
–0.5
–1.5
–1.0
–0.5
–1.5
–1.0
–0.5
–1.5
–1.0
–0.5
0
1
2
3
-0.5
0.0
0.5
–0.5
0.0
0.5
0.0
0.5
1.0
0.0
0.5
1.0
0.0
0.5
1.0
1.5
0.0
0.5
1.0
1.5
0.0
0.5
1.0
1.5
0.0
0.5
1.0
1.5
0.0
0.5
1.0
1.5
0.0
0.5
1.0
1.5
source : nBB.(1) Deviations from the long-term average. The effects shown were calculated by an econometric vector autoregressive model (VAR). Exogenous demand shocks were
identified by imposing sign restrictions on the impact of such shocks.
Instruments that help central banks continue to stimulate economic activity when policy rates are nearing their lower bound are ranked among the so-called ‘unconven-tional’ monetary policy arsenal.
Within the latter, the forward guidance on policy rates is a key monetary policy measure : by announcing that rates will remain low for some time, central banks influence expecta-tions on short-term interest rates and reduce uncertainty on their development, thus putting more downward pressure on long-term rates. the EcB started providing forward guidance in July 2013, when the Governing Council said it expected "key ECB interest rates to remain at present or
lower levels for an extended period of time". it also men-tioned that its forward guidance was "based on the overall subdued outlook for inflation extending into the medium term, given the broad-based weakness in the real economy and subdued monetary dynamics". this guidance has since been adjusted somewhat but continues to apply.
Another instrument is quantitative easing (QE), meaning that the central bank purchases significant amounts of debt instruments in the markets to help support their valuations, put pressure on returns and ease the general financing conditions in the economy. The backdrop of historically low policy rates and renewed deterioration
June 2016 ❙ tHE ABc of QuAntitAtiVE EAsing or tHE BAsics of cEntrAl BAnK AssEt purcHAsEs ❙ 35
of inflation prospects triggered such ECB policy on 22 January 2015, when the Governing Council revealed it was about to embark on a programme for the pur-chase of private and government debt securities up to an amount of € 60 billion a month (1). to accelerate the return of inflation to its target, it stepped up its monthly purchases to € 80 billion in March 2016 and expanded the programme to include non-financial corporate bonds (2). the intention is to continue these purchases up until the end of March 2017 or longer if need be, and at least until the governing council sees a sustained adjust-ment in the path of inflation that is consistent with its price stability objective.
The asset purchases – and, more specifically, the public sector purchases that got underway in March 2015 – constitute a major change in Eurosystem monetary policy. They marked the transition from a ‘relatively passive’ to a ‘clearly active’ balance sheet management. By the end of may, the EcB had purchased securities to the tune of around € 1 000 billion, while the total increase of its balance sheet should exceed € 1 800 bil-lion by March 2017.
2. Asset purchases as monetary policy instrument
this second section covers the mechanisms of quantitative easing and the way in which it is expected to contribute to the central bank’s price stability objective. Drawing on the general philosophy underpinning asset purchases, this section reviews a range of key questions on the way such programmes work and what their impact is.
2.1 What general philosophy underpins asset purchases ?
Like lower policy rates, asset purchases aim to push down real yields and add extra easing to the financing conditions in the economy. these purchases are also supposed to be supportive of aggregate demand and
bring inflation into line with price stability as defined by the central bank. They represent a conscious focus on encouraging consumption and investment over sav-ing in order to support economic activity. the spillover effects of these measures protect the economy against the risk of secular stagnation, meaning a situation of no or lacklustre economic growth because traditional mon-etary policy is not working (3).
2.2 What types of assets do central banks focus on ?
When conducting a policy of quantitative easing, central banks typically target high-quality – i.e. low-risk – long-term assets whose markets are both broad and liquid. The primary aim, after all, is not to depress credit risk premiums but to influence the various components of real long-term rates in general. longer-term securities are key here, as consumption and capital spending decisions have longer horizons. lastly, by targeting large and liquid markets, they can buy enough assets to influence financ-ing conditions in the economy at large without disrupting the functioning of the markets.
the majority of debt securities purchased under the Eurosystem’s asset purchase programme are public sec-tor securities issued by euro area governments or by European supranational institutions. On 27 May 2016, the total public sector amount purchased stood at nearly € 800 billion, on an overall figure of around € 1 000 bil-lion, with terms to maturity of these public sector securi-ties averaging around eight years.
2.3 How do asset purchase programmes influence financing conditions ?
Through asset purchases, central banks push down both risk-free nominal yield curves and credit risk premiums, and also depress real long-term yields by supporting inflation expectations. Drawing on Chart 1, what follows is an attempt to break down the influence on the specific components (4).
EXpEctAtions on nominAl sHort-tErm intErEst rAtEs
By buying long-term assets, the central bank expresses a willingness to keep policy rates low for an extended period.
A quantitative easing policy implies the accumulation on the asset side of the balance sheet of significant amounts of long-term securities at fixed and typically low yields, as these securities carry relatively little risk and were acquired
(1) The expanded asset purchase prorgramme (APP) launched in January 2015 by the Eurosystem includes the third programme for the purchase of euro-denominated covered bonds (CBPP3), the asset-backed securities purchase programme (ABSPP) that started in November 2014 and a significant public sector purchase programme (pspp).
(2) As part of a corporate sector purchase programme (cspp).(3) For more information about secular stagnation, see Boeckx et al. (2015).(4) this section mainly draws on the outcomes of the event study by Altavilla et al.
(2015) investigating the impact of the ECB’s APP on a wide range of assets. The study also factors in expectation effects : in addition to the actual announcement on 22 January 2015 it takes on board statements about a possible APP between 1 September 2014 and 22 January 2015. However, it does not incorporate the announcements of recent extensions (in December 2015 and in March 2016). The outcomes plotted in the charts reflect controlled event studies for an event window of one single day. By stripping out any other macroeconomic data releases, it is able to isolate the App effect.
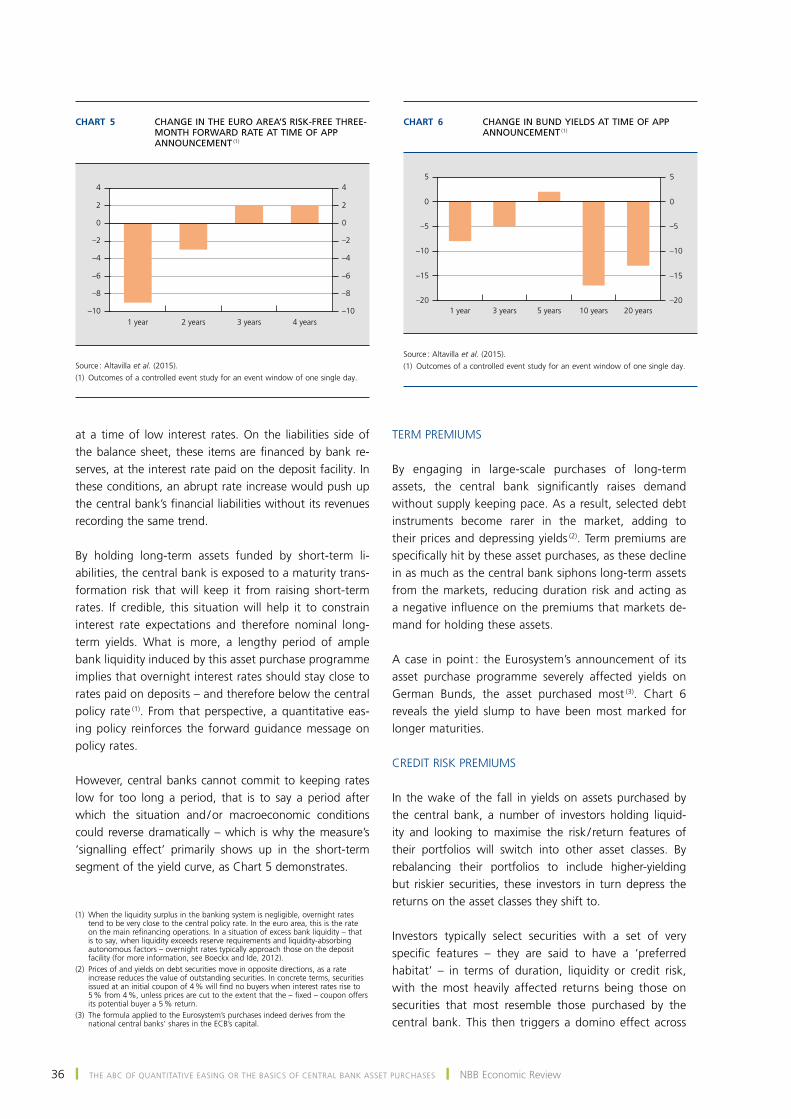
36 ❙ tHE ABc of QuAntitAtiVE EAsing or tHE BAsics of cEntrAl BAnK AssEt purcHAsEs ❙ nBB Economic review
at a time of low interest rates. on the liabilities side of the balance sheet, these items are financed by bank re-serves, at the interest rate paid on the deposit facility. in these conditions, an abrupt rate increase would push up the central bank’s financial liabilities without its revenues recording the same trend.
By holding long-term assets funded by short-term li-abilities, the central bank is exposed to a maturity trans-formation risk that will keep it from raising short-term rates. if credible, this situation will help it to constrain interest rate expectations and therefore nominal long-term yields. What is more, a lengthy period of ample bank liquidity induced by this asset purchase programme implies that overnight interest rates should stay close to rates paid on deposits – and therefore below the central policy rate (1). from that perspective, a quantitative eas-ing policy reinforces the forward guidance message on policy rates.
However, central banks cannot commit to keeping rates low for too long a period, that is to say a period after which the situation and / or macroeconomic conditions could reverse dramatically – which is why the measure’s ‘signalling effect’ primarily shows up in the short-term segment of the yield curve, as Chart 5 demonstrates.
tErm prEmiums
By engaging in large-scale purchases of long-term assets, the central bank significantly raises demand without supply keeping pace. As a result, selected debt instruments become rarer in the market, adding to their prices and depressing yields (2). term premiums are specifically hit by these asset purchases, as these decline in as much as the central bank siphons long-term assets from the markets, reducing duration risk and acting as a negative influence on the premiums that markets de-mand for holding these assets.
A case in point : the Eurosystem’s announcement of its asset purchase programme severely affected yields on german Bunds, the asset purchased most (3). Chart 6 reveals the yield slump to have been most marked for longer maturities.
crEDit risK prEmiums
In the wake of the fall in yields on assets purchased by the central bank, a number of investors holding liquid-ity and looking to maximise the risk / return features of their portfolios will switch into other asset classes. By rebalancing their portfolios to include higher-yielding but riskier securities, these investors in turn depress the returns on the asset classes they shift to.
investors typically select securities with a set of very specific features – they are said to have a ‘preferred habitat’ – in terms of duration, liquidity or credit risk, with the most heavily affected returns being those on securities that most resemble those purchased by the central bank. This then triggers a domino effect across
(1) When the liquidity surplus in the banking system is negligible, overnight rates tend to be very close to the central policy rate. in the euro area, this is the rate on the main refinancing operations. In a situation of excess bank liquidity – that is to say, when liquidity exceeds reserve requirements and liquidity-absorbing autonomous factors – overnight rates typically approach those on the deposit facility (for more information, see Boeckx and Ide, 2012).
(2) prices of and yields on debt securities move in opposite directions, as a rate increase reduces the value of outstanding securities. in concrete terms, securities issued at an initial coupon of 4 % will find no buyers when interest rates rise to 5 % from 4 %, unless prices are cut to the extent that the – fixed – coupon offers its potential buyer a 5 % return.
(3) The formula applied to the Eurosystem’s purchases indeed derives from the national central banks’ shares in the ECB’s capital.
Chart 5 CHANGE IN THE EURO AREA’S RISK-FREE THREE-MONTH FORWARD RATE AT TIME OF APP ANNOUNCEMENT (1)
–10
–8
–6
–4
–2
0
2
4
–10
–8
–6
–4
–2
0
2
4
1 year 2 years 3 years 4 years
source : Altavilla et al. (2015).(1) outcomes of a controlled event study for an event window of one single day.
Chart 6 CHANGE IN BUND YIELDS AT TIME OF APP ANNOUNCEMENT (1)
–20
–15
–10
–5
0
5
–20
–15
–10
–5
0
5
1 year 3 years 5 years 10 years 20 years
source : Altavilla et al. (2015).(1) outcomes of a controlled event study for an event window of one single day.
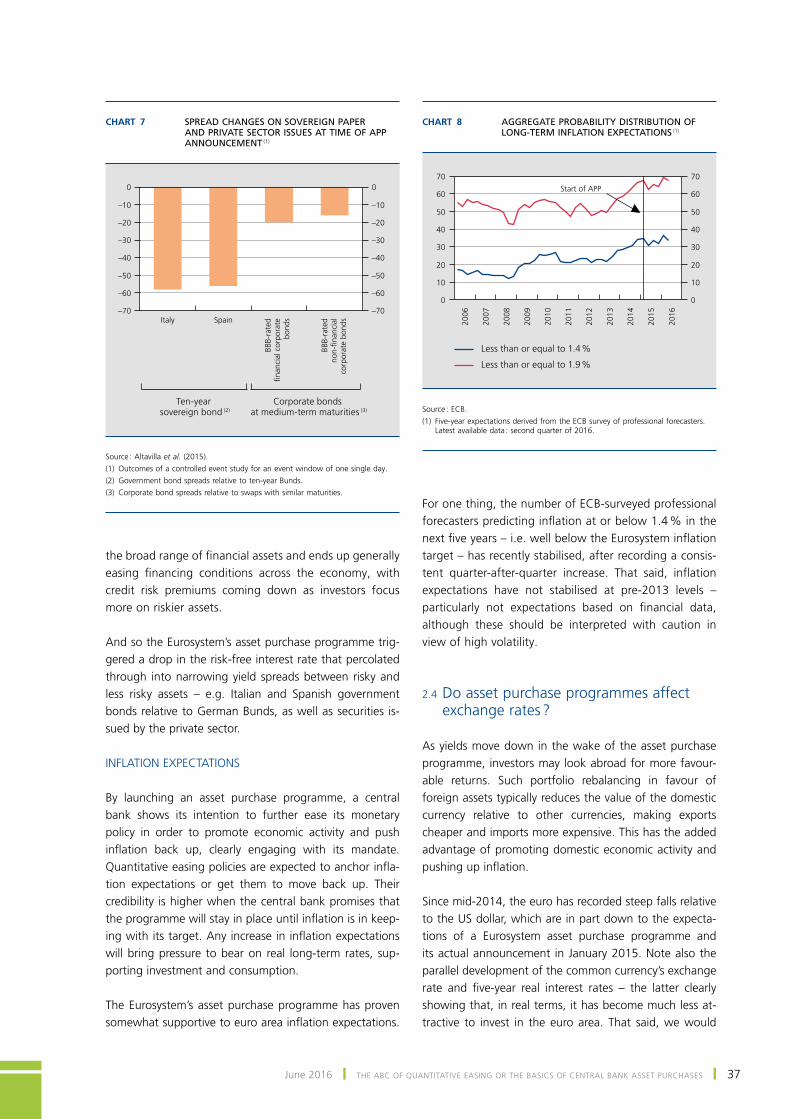
June 2016 ❙ tHE ABc of QuAntitAtiVE EAsing or tHE BAsics of cEntrAl BAnK AssEt purcHAsEs ❙ 37
the broad range of financial assets and ends up generally easing financing conditions across the economy, with credit risk premiums coming down as investors focus more on riskier assets.
And so the Eurosystem’s asset purchase programme trig-gered a drop in the risk-free interest rate that percolated through into narrowing yield spreads between risky and less risky assets – e.g. Italian and Spanish government bonds relative to german Bunds, as well as securities is-sued by the private sector.
inflAtion EXpEctAtions
By launching an asset purchase programme, a central bank shows its intention to further ease its monetary policy in order to promote economic activity and push inflation back up, clearly engaging with its mandate. Quantitative easing policies are expected to anchor infla-tion expectations or get them to move back up. Their credibility is higher when the central bank promises that the programme will stay in place until inflation is in keep-ing with its target. Any increase in inflation expectations will bring pressure to bear on real long-term rates, sup-porting investment and consumption.
The Eurosystem’s asset purchase programme has proven somewhat supportive to euro area inflation expectations.
for one thing, the number of EcB-surveyed professional forecasters predicting inflation at or below 1.4 % in the next five years – i.e. well below the Eurosystem inflation target – has recently stabilised, after recording a consis-tent quarter-after-quarter increase. That said, inflation expectations have not stabilised at pre-2013 levels – particularly not expectations based on financial data, although these should be interpreted with caution in view of high volatility.
2.4 Do asset purchase programmes affect exchange rates ?
As yields move down in the wake of the asset purchase programme, investors may look abroad for more favour-able returns. such portfolio rebalancing in favour of foreign assets typically reduces the value of the domestic currency relative to other currencies, making exports cheaper and imports more expensive. this has the added advantage of promoting domestic economic activity and pushing up inflation.
since mid-2014, the euro has recorded steep falls relative to the us dollar, which are in part down to the expecta-tions of a Eurosystem asset purchase programme and its actual announcement in January 2015. Note also the parallel development of the common currency’s exchange rate and five-year real interest rates – the latter clearly showing that, in real terms, it has become much less at-tractive to invest in the euro area. that said, we would
Chart 7 SPREAD CHANGES ON SOVEREIGN PAPER AND PRIVATE SECTOR ISSUES AT TIME OF APP ANNOUNCEMENT (1)
–70
–60
–50
–40
–30
–20
–10
0
–70
–60
–50
–40
–30
–20
–10
0
Italy Spain
BBB-
rate
dfin
anci
al c
orpo
rate
bond
s
BBB-
rate
dno
n-fin
anci
alco
rpor
ate
bond
s
Corporate bonds at medium-term maturities (3)
Ten-year sovereign bond (2)
source : Altavilla et al. (2015).(1) outcomes of a controlled event study for an event window of one single day.(2) government bond spreads relative to ten-year Bunds.(3) corporate bond spreads relative to swaps with similar maturities.
Chart 8 AGGREGATE PROBABILITY DISTRIBUTION OF LONG-TERM INFLATION EXPECTATIONS (1)
2006
2007
2008
2009
2010
2011
2012
2013
2014
2015
2016
0
10
20
30
40
50
60
70
0
10
20
30
40
50
60
70
Less than or equal to 1.9 %
Less than or equal to 1.4 %
Start of APP
source : EcB.(1) five-year expectations derived from the EcB survey of professional forecasters.
Latest available data : second quarter of 2016.
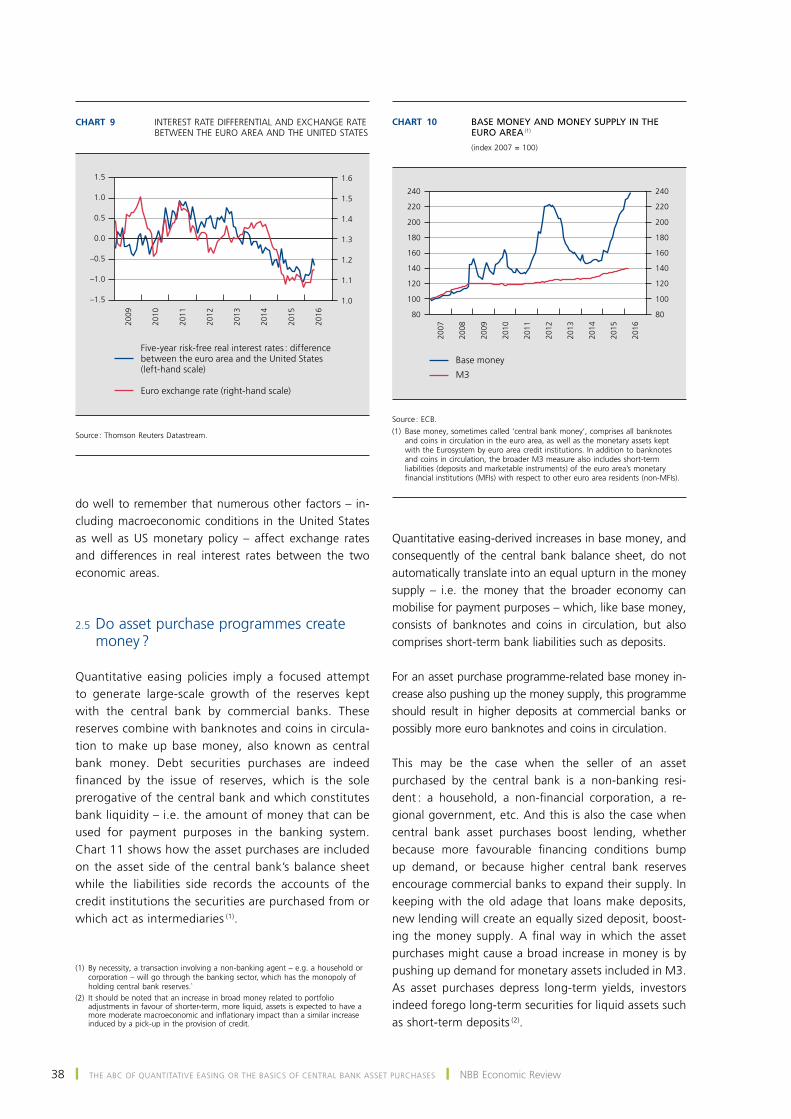
38 ❙ tHE ABc of QuAntitAtiVE EAsing or tHE BAsics of cEntrAl BAnK AssEt purcHAsEs ❙ nBB Economic review
do well to remember that numerous other factors – in-cluding macroeconomic conditions in the united states as well as us monetary policy – affect exchange rates and differences in real interest rates between the two economic areas.
2.5 Do asset purchase programmes create money ?
Quantitative easing policies imply a focused attempt to generate large-scale growth of the reserves kept with the central bank by commercial banks. These reserves combine with banknotes and coins in circula-tion to make up base money, also known as central bank money. Debt securities purchases are indeed financed by the issue of reserves, which is the sole prerogative of the central bank and which constitutes bank liquidity – i.e. the amount of money that can be used for payment purposes in the banking system. Chart 11 shows how the asset purchases are included on the asset side of the central bank’s balance sheet while the liabilities side records the accounts of the credit institutions the securities are purchased from or which act as intermediaries (1).
Quantitative easing-derived increases in base money, and consequently of the central bank balance sheet, do not automatically translate into an equal upturn in the money supply – i.e. the money that the broader economy can mobilise for payment purposes – which, like base money, consists of banknotes and coins in circulation, but also comprises short-term bank liabilities such as deposits.
for an asset purchase programme-related base money in-crease also pushing up the money supply, this programme should result in higher deposits at commercial banks or possibly more euro banknotes and coins in circulation.
this may be the case when the seller of an asset purchased by the central bank is a non-banking resi-dent : a household, a non-financial corporation, a re-gional government, etc. And this is also the case when central bank asset purchases boost lending, whether because more favourable financing conditions bump up demand, or because higher central bank reserves encourage commercial banks to expand their supply. In keeping with the old adage that loans make deposits, new lending will create an equally sized deposit, boost-ing the money supply. A final way in which the asset purchases might cause a broad increase in money is by pushing up demand for monetary assets included in M3. As asset purchases depress long-term yields, investors indeed forego long-term securities for liquid assets such as short-term deposits (2).
(1) By necessity, a transaction involving a non-banking agent – e.g. a household or corporation – will go through the banking sector, which has the monopoly of holding central bank reserves.`
(2) it should be noted that an increase in broad money related to portfolio adjustments in favour of shorter-term, more liquid, assets is expected to have a more moderate macroeconomic and inflationary impact than a similar increase induced by a pick-up in the provision of credit.
Chart 10 BASE MONEY AND MONEY SUPPLY IN THE EURO AREA (1)
(index 2007 = 100)
2007
2008
2009
2010
2011
2012
2013
2014
2015
2016
80
100
120
140
160
180
200
220
240
80
100
120
140
160
180
200
220
240
M3
Base money
source : EcB.(1) Base money, sometimes called ‘central bank money’, comprises all banknotes
and coins in circulation in the euro area, as well as the monetary assets kept with the Eurosystem by euro area credit institutions. In addition to banknotes and coins in circulation, the broader M3 measure also includes short-term liabilities (deposits and marketable instruments) of the euro area’s monetary financial institutions (MFIs) with respect to other euro area residents (non-MFIs).
Chart 9 intErEst rAtE DiffErEntiAl AnD EXcHAngE rAtE BEtWEEn tHE Euro ArEA AnD tHE unitED stAtEs
2009
2010
2011
2012
2013
2014
2015
2016
–1.5
–1.0
–0.5
0.0
0.5
1.0
1.5
1.0
1.1
1.2
1.3
1.4
1.5
1.6
Euro exchange rate (right-hand scale)
Five-year risk-free real interest rates : difference between the euro area and the United States (left-hand scale)
source : thomson reuters Datastream.
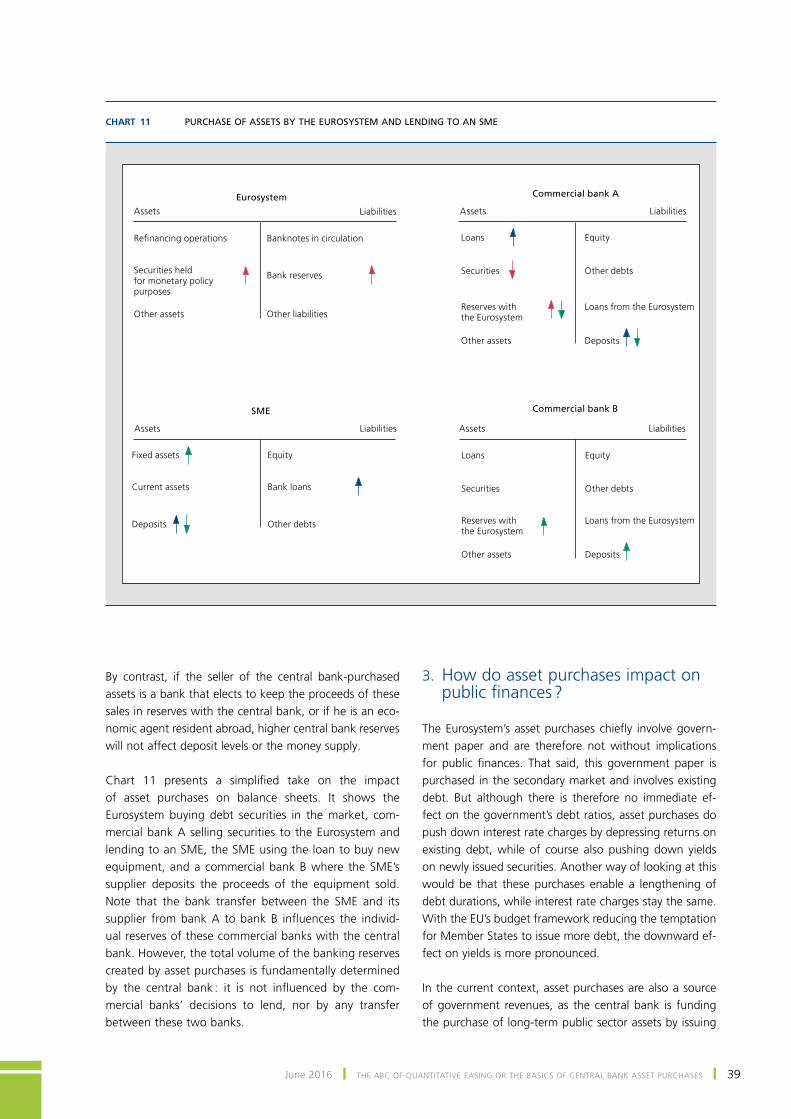
June 2016 ❙ tHE ABc of QuAntitAtiVE EAsing or tHE BAsics of cEntrAl BAnK AssEt purcHAsEs ❙ 39
By contrast, if the seller of the central bank-purchased assets is a bank that elects to keep the proceeds of these sales in reserves with the central bank, or if he is an eco-nomic agent resident abroad, higher central bank reserves will not affect deposit levels or the money supply.
Chart 11 presents a simplified take on the impact of asset purchases on balance sheets. it shows the Eurosystem buying debt securities in the market, com-mercial bank A selling securities to the Eurosystem and lending to an smE, the smE using the loan to buy new equipment, and a commercial bank B where the SME’s supplier deposits the proceeds of the equipment sold. Note that the bank transfer between the SME and its supplier from bank A to bank B influences the individ-ual reserves of these commercial banks with the central bank. However, the total volume of the banking reserves created by asset purchases is fundamentally determined by the central bank : it is not influenced by the com-mercial banks’ decisions to lend, nor by any transfer between these two banks.
3. How do asset purchases impact on public finances ?
The Eurosystem’s asset purchases chiefly involve govern-ment paper and are therefore not without implications for public finances. That said, this government paper is purchased in the secondary market and involves existing debt. But although there is therefore no immediate ef-fect on the government’s debt ratios, asset purchases do push down interest rate charges by depressing returns on existing debt, while of course also pushing down yields on newly issued securities. Another way of looking at this would be that these purchases enable a lengthening of debt durations, while interest rate charges stay the same. With the EU’s budget framework reducing the temptation for member states to issue more debt, the downward ef-fect on yields is more pronounced.
in the current context, asset purchases are also a source of government revenues, as the central bank is funding the purchase of long-term public sector assets by issuing
Chart 11 PURCHASE OF ASSETS BY THE EUROSYSTEM AND LENDING TO AN SME
Refinancing operations
AssetsEurosystem Commercial bank A
SME
Assets
Assets
Liabilities Liabilities
Liabilities
Securities held for monetary policy purposes
Other assets
Banknotes in circulation
Bank reserves
Other liabilities
Loans
Securities
Reserves with the Eurosystem
Equity
Other debts
Loans from the Eurosystem
Other assets Deposits
Fixed assets
Current assets
Deposits
Equity
Bank loans
Other debts
Commercial bank B
Assets Liabilities
Loans
Securities
Reserves with the Eurosystem
Equity
Other debts
Loans from the Eurosystem
Other assets Deposits
40 ❙ tHE ABc of QuAntitAtiVE EAsing or tHE BAsics of cEntrAl BAnK AssEt purcHAsEs ❙ nBB Economic review
central bank reserves. With reserves paid at the deposit facility rate – currently negative and below the returns on the securities purchased – the central bank is making a profit, a proportion of which is returned to the Member states-shareholders. However, at some point in the future the deposit facility rate might well exceed yields on the se-curities now in the central bank’s possession. If that hap-pens, the central bank may see its profits contract or even incur losses, depressing central bank-derived revenues for governments. With this in mind, the central bank might move to change its reserves policy and constrain profits paid out to governments.
4. How to exit from a system of ample liquidity created by an asset purchase programme ?
An asset purchase programme funded by the issuance of reserves inevitably creates a significant and last-ing increase in the banking sector’s liquidity surplus. However, excess liquidity can be absorbed through a range of channels.
obviously, excess reserves will simply melt away, if nominal economic growth revives, that is to say when more robust economic activity dynamics due to the asset purchases trigger a greater demand for cash. more cash withdrawals by economic agents reduce their deposits with banks and cause concomitantly lower bank reserves with the central bank. This is also the case if growth encourages lending : more lending typically coincides with more deposits, and leads to greater reserve requirements – excess reserves making way for required reserves, in fact.
Ignoring, for the moment, the possibility of a ‘natural’ reduction fuelled by greater demand for cash and bank loans thanks to reviving economic activity, it is central bank policies that primarily determine the development of excess reserve levels. If, as the Eurosystem did in December 2015, a central bank chooses to reinvest amounts repaid, excess reserves will not decline as the volume of securities held does not shrink. If no reinvestment policy is pursued, excess reserves will shrink as debt securities are repaid. To repay
them, governments will typically use the deposits held with commercial banks and, like those deposits, reserves held with the central bank will also contract.
conclusion
Being able to pursue a policy of quantitative easing provides a central bank with a vital edge whenever it needs to move beyond the limits of traditional monetary policy. large-scale purchases of long-term debt securities enable it to manage long-term real interest rates and to continue to stimulate eco-nomic activity when policy rates approach their lower bound.
Asset purchases by central banks influence the various components of long-term real interest rates in highly di-rect and more subtle ways. By depressing real long-term rates, they encourage consumption and investment at the expense of savings, while depreciating the domestic currency and promoting exports. By supporting aggregate demand, asset purchase programmes fuel inflation and thus contribute to central banks’ price stability objectives.
Inevitably, asset purchases push up base money, chiefly in the shape of higher central bank reserves in the bank-ing system, but they do not necessarily translate into an equally large increase in broad money. At this point in time, the purchase of mostly government assets has a fa-vourable impact on public finances, but these benefits are not guaranteed to last. Any discontinuation of quantitative easing and the concomitant system of abundant liquidity fundamentally hinges on specific central bank policies. Not only does it depend on the central bank’s asset purchases, but also on any reinvestment of amounts repaid.
To date, the Eurosystem’s decision to embark on an ex-panded asset purchase programme on 22 January 2015 has reduced nominal yields across different sectors of the financial markets and has brought a measure of stabilisa-tion to euro area inflation expectations. In turn, the APP-derived fall in real yields has sparked a depreciation of the euro relative to the dollar. All in all, the Eurosystem’s asset purchase programme has definitely contributed to a further easing of its monetary policy.

June 2016 ❙ tHE ABc of QuAntitAtiVE EAsing or tHE BAsics of cEntrAl BAnK AssEt purcHAsEs ❙ 41
Bibliography
Altavilla C, G. Carboni and R. Motto (2015), Asset purchase programmes and financial markets : lessons from the euro area, Working Paper Series 1864, November.
EcB (2012), Annual Report.
Boeckx J. and S. Ide (2012), ‘What can we and what can’t we infer from the recourse to the deposit facility ?’, NBB, Economic Review, June, 31-38.
Boeckx J. (2012), ‘What is the role played by the Eurosystem during the financial crisis ?’, NBB, Economic Review, september, 7-29.
Boeckx J., P. Butzen, N. Cordemans and S. Ide (2015), ‘Deflation in Japan, Abenomics and lessons for the euro area’, nBB, Economic Review, June, 101-125.
De graeve f., p. ilbas and r. Wouters (2014), Forward Guidance and Long Term Interest Rates : Inspecting the Mechanism, Sveriges Riksbank, Working Paper series 292, December.
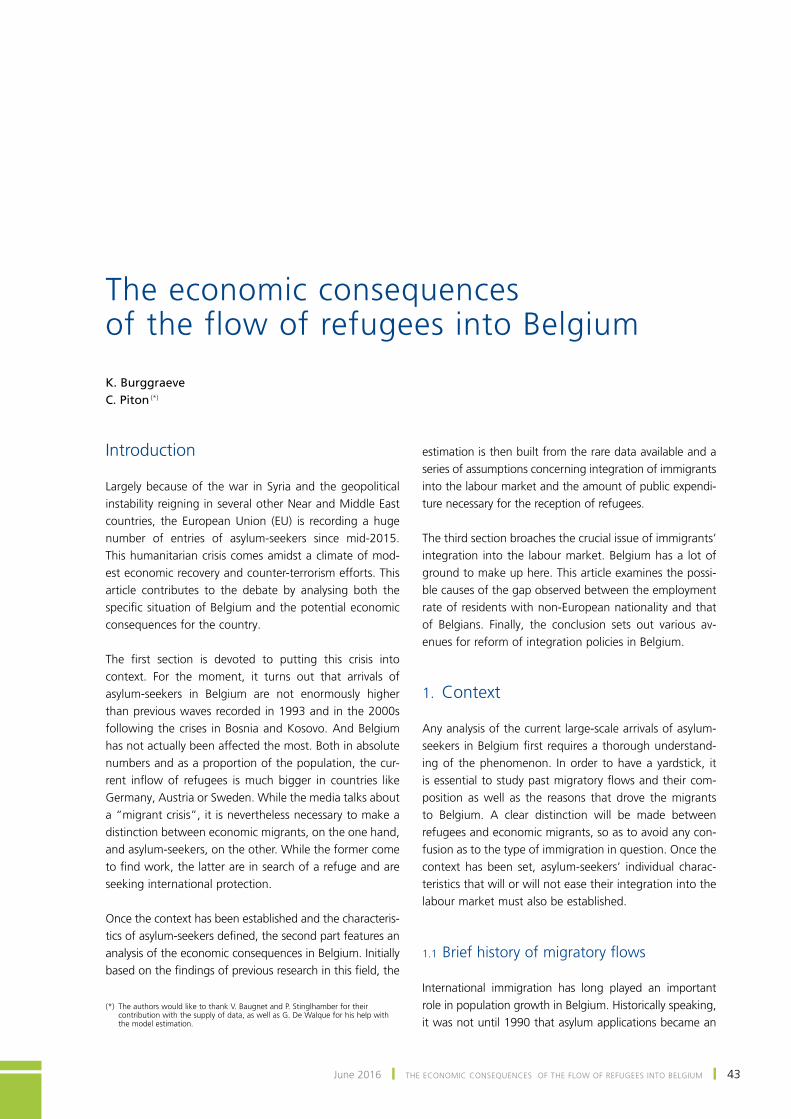
June 2016 ❙ tHE Economic consEQuEncEs of tHE floW of rEfugEEs into BElgium ❙ 43
the economic consequences of the flow of refugees into Belgium
K. BurggraeveC. Piton (*)
introduction
largely because of the war in syria and the geopolitical instability reigning in several other near and middle East countries, the European union (Eu) is recording a huge number of entries of asylum-seekers since mid-2015. this humanitarian crisis comes amidst a climate of mod-est economic recovery and counter-terrorism efforts. this article contributes to the debate by analysing both the specific situation of Belgium and the potential economic consequences for the country.
The first section is devoted to putting this crisis into context. for the moment, it turns out that arrivals of asylum-seekers in Belgium are not enormously higher than previous waves recorded in 1993 and in the 2000s following the crises in Bosnia and Kosovo. And Belgium has not actually been affected the most. Both in absolute numbers and as a proportion of the population, the cur-rent inflow of refugees is much bigger in countries like Germany, Austria or Sweden. While the media talks about a “migrant crisis”, it is nevertheless necessary to make a distinction between economic migrants, on the one hand, and asylum-seekers, on the other. While the former come to find work, the latter are in search of a refuge and are seeking international protection.
once the context has been established and the characteris-tics of asylum-seekers defined, the second part features an analysis of the economic consequences in Belgium. initially based on the findings of previous research in this field, the
estimation is then built from the rare data available and a series of assumptions concerning integration of immigrants into the labour market and the amount of public expendi-ture necessary for the reception of refugees.
The third section broaches the crucial issue of immigrants’ integration into the labour market. Belgium has a lot of ground to make up here. This article examines the possi-ble causes of the gap observed between the employment rate of residents with non-European nationality and that of Belgians. finally, the conclusion sets out various av-enues for reform of integration policies in Belgium.
1. context
Any analysis of the current large-scale arrivals of asylum-seekers in Belgium first requires a thorough understand-ing of the phenomenon. In order to have a yardstick, it is essential to study past migratory flows and their com-position as well as the reasons that drove the migrants to Belgium. A clear distinction will be made between refugees and economic migrants, so as to avoid any con-fusion as to the type of immigration in question. once the context has been set, asylum-seekers’ individual charac-teristics that will or will not ease their integration into the labour market must also be established.
1.1 Brief history of migratory flows
international immigration has long played an important role in population growth in Belgium. Historically speaking, it was not until 1990 that asylum applications became an
(*) The authors would like to thank V. Baugnet and P. Stinglhamber for their contribution with the supply of data, as well as g. De Walque for his help with the model estimation.
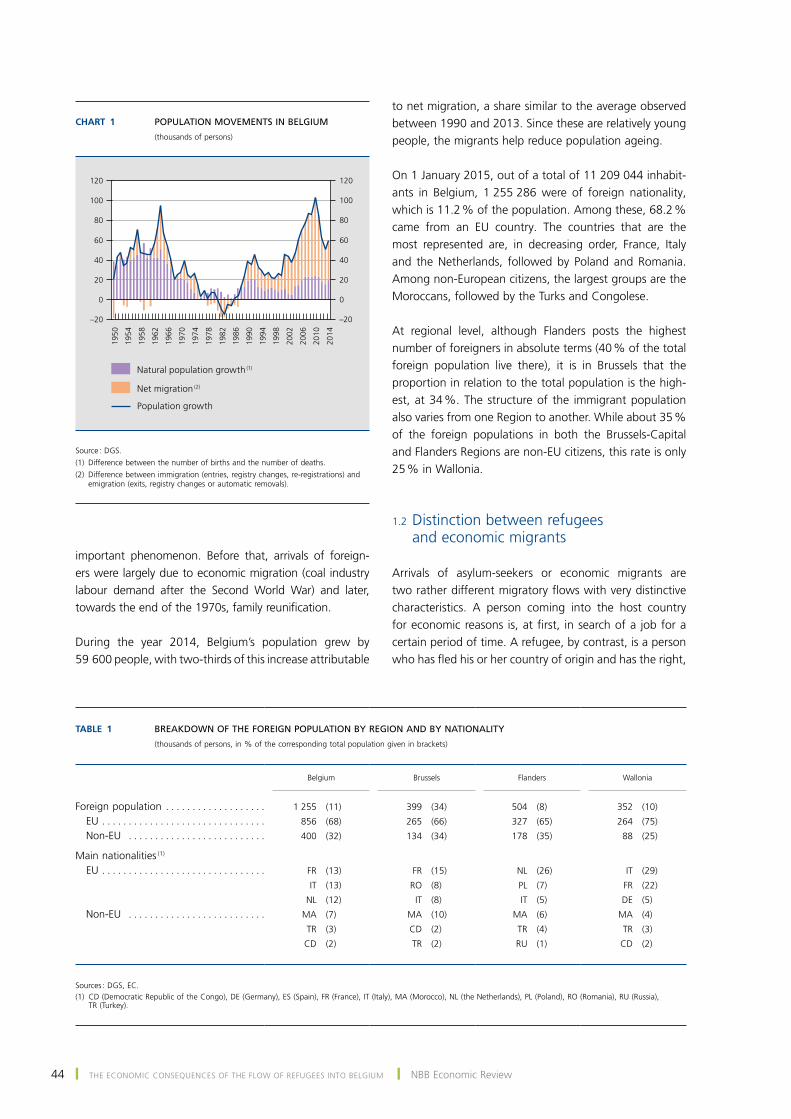
44 ❙ tHE Economic consEQuEncEs of tHE floW of rEfugEEs into BElgium ❙ nBB Economic review
important phenomenon. Before that, arrivals of foreign-ers were largely due to economic migration (coal industry labour demand after the second World War) and later, towards the end of the 1970s, family reunification.
During the year 2014, Belgium’s population grew by 59 600 people, with two-thirds of this increase attributable
to net migration, a share similar to the average observed between 1990 and 2013. Since these are relatively young people, the migrants help reduce population ageing.
On 1 January 2015, out of a total of 11 209 044 inhabit-ants in Belgium, 1 255 286 were of foreign nationality, which is 11.2 % of the population. Among these, 68.2 % came from an Eu country. the countries that are the most represented are, in decreasing order, france, italy and the netherlands, followed by poland and romania. Among non-European citizens, the largest groups are the Moroccans, followed by the Turks and Congolese.
At regional level, although flanders posts the highest number of foreigners in absolute terms (40 % of the total foreign population live there), it is in Brussels that the proportion in relation to the total population is the high-est, at 34 %. The structure of the immigrant population also varies from one Region to another. While about 35 % of the foreign populations in both the Brussels-capital and flanders regions are non-Eu citizens, this rate is only 25 % in Wallonia.
1.2 Distinction between refugees and economic migrants
Arrivals of asylum-seekers or economic migrants are two rather different migratory flows with very distinctive characteristics. A person coming into the host country for economic reasons is, at first, in search of a job for a certain period of time. A refugee, by contrast, is a person who has fled his or her country of origin and has the right,
Table 1 BREAKDOWN OF THE FOREIGN POPULATION BY REGION AND BY NATIONALITY
(thousands of persons, in % of the corresponding total population given in brackets)
Belgium
Brussels
Flanders
Wallonia
Foreign population . . . . . . . . . . . . . . . . . . . 1 255 (11) 399 (34) 504 (8) 352 (10)
EU . . . . . . . . . . . . . . . . . . . . . . . . . . . . . . . 856 (68) 265 (66) 327 (65) 264 (75)
Non‑EU . . . . . . . . . . . . . . . . . . . . . . . . . . 400 (32) 134 (34) 178 (35) 88 (25)
Main nationalities (1)
EU . . . . . . . . . . . . . . . . . . . . . . . . . . . . . . . FR (13) FR (15) NL (26) IT (29)
IT (13) RO (8) PL (7) FR (22)
NL (12) IT (8) IT (5) DE (5)
Non‑EU . . . . . . . . . . . . . . . . . . . . . . . . . . MA (7) MA (10) MA (6) MA (4)
TR (3) CD (2) TR (4) TR (3)
CD (2) TR (2) RU (1) CD (2)
Sources : DGS, EC.(1) CD (Democratic Republic of the Congo), DE (Germany), ES (Spain), FR (France), IT (Italy), MA (Morocco), NL (the Netherlands), PL (Poland), RO (Romania), RU (Russia),
TR (Turkey).
Chart 1 POPULATION MOVEMENTS IN BELGIUM
(thousands of persons)
1950
1954
1958
1962
1966
1970
1974
1978
1982
1986
1990
1994
1998
2002
2006
2010
2014
–20
0
20
40
60
80
100
120
–20
0
20
40
60
80
100
120
Natural population growth (1)
Net migration (2)
Population growth
source : Dgs.(1) Difference between the number of births and the number of deaths.(2) Difference between immigration (entries, registry changes, re-registrations) and
emigration (exits, registry changes or automatic removals).
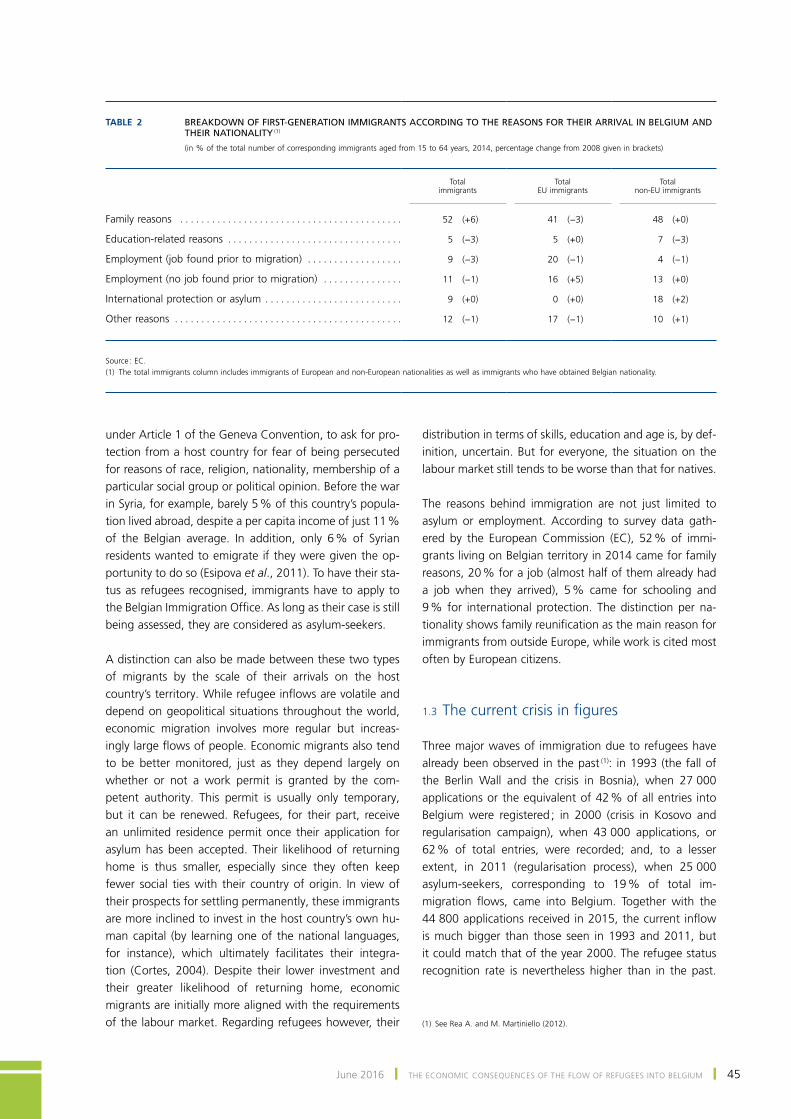
June 2016 ❙ tHE Economic consEQuEncEs of tHE floW of rEfugEEs into BElgium ❙ 45
under Article 1 of the Geneva Convention, to ask for pro-tection from a host country for fear of being persecuted for reasons of race, religion, nationality, membership of a particular social group or political opinion. Before the war in Syria, for example, barely 5 % of this country’s popula-tion lived abroad, despite a per capita income of just 11 % of the Belgian average. In addition, only 6 % of Syrian residents wanted to emigrate if they were given the op-portunity to do so (Esipova et al., 2011). to have their sta-tus as refugees recognised, immigrants have to apply to the Belgian Immigration Office. As long as their case is still being assessed, they are considered as asylum-seekers.
A distinction can also be made between these two types of migrants by the scale of their arrivals on the host country’s territory. While refugee inflows are volatile and depend on geopolitical situations throughout the world, economic migration involves more regular but increas-ingly large flows of people. Economic migrants also tend to be better monitored, just as they depend largely on whether or not a work permit is granted by the com-petent authority. this permit is usually only temporary, but it can be renewed. refugees, for their part, receive an unlimited residence permit once their application for asylum has been accepted. Their likelihood of returning home is thus smaller, especially since they often keep fewer social ties with their country of origin. in view of their prospects for settling permanently, these immigrants are more inclined to invest in the host country’s own hu-man capital (by learning one of the national languages, for instance), which ultimately facilitates their integra-tion (Cortes, 2004). Despite their lower investment and their greater likelihood of returning home, economic migrants are initially more aligned with the requirements of the labour market. Regarding refugees however, their
distribution in terms of skills, education and age is, by def-inition, uncertain. But for everyone, the situation on the labour market still tends to be worse than that for natives.
the reasons behind immigration are not just limited to asylum or employment. According to survey data gath-ered by the European Commission (EC), 52 % of immi-grants living on Belgian territory in 2014 came for family reasons, 20 % for a job (almost half of them already had a job when they arrived), 5 % came for schooling and 9 % for international protection. The distinction per na-tionality shows family reunification as the main reason for immigrants from outside Europe, while work is cited most often by European citizens.
1.3 The current crisis in figures
three major waves of immigration due to refugees have already been observed in the past (1): in 1993 (the fall of the Berlin Wall and the crisis in Bosnia), when 27 000 applications or the equivalent of 42 % of all entries into Belgium were registered ; in 2000 (crisis in Kosovo and regularisation campaign), when 43 000 applications, or 62 % of total entries, were recorded; and, to a lesser extent, in 2011 (regularisation process), when 25 000 asylum-seekers, corresponding to 19 % of total im-migration flows, came into Belgium. Together with the 44 800 applications received in 2015, the current inflow is much bigger than those seen in 1993 and 2011, but it could match that of the year 2000. The refugee status recognition rate is nevertheless higher than in the past.
(1) see rea A. and m. martiniello (2012).
Table 2 BREAKDOWN OF FIRST‑GENERATION IMMIGRANTS ACCORDING TO THE REASONS FOR THEIR ARRIVAL IN BELGIUM AND THEIR NATIONALITY (1)
(in % of the total number of corresponding immigrants aged from 15 to 64 years, 2014, percentage change from 2008 given in brackets)
Total immigrants
Total EU immigrants
Total non‑EU immigrants
Family reasons . . . . . . . . . . . . . . . . . . . . . . . . . . . . . . . . . . . . . . . . . . 52 (+6) 41 (−3) 48 (+0)
Education‑related reasons . . . . . . . . . . . . . . . . . . . . . . . . . . . . . . . . . 5 (−3) 5 (+0) 7 (−3)
Employment (job found prior to migration) . . . . . . . . . . . . . . . . . . 9 (−3) 20 (−1) 4 (−1)
Employment (no job found prior to migration) . . . . . . . . . . . . . . . 11 (−1) 16 (+5) 13 (+0)
International protection or asylum . . . . . . . . . . . . . . . . . . . . . . . . . . 9 (+0) 0 (+0) 18 (+2)
Other reasons . . . . . . . . . . . . . . . . . . . . . . . . . . . . . . . . . . . . . . . . . . . 12 (−1) 17 (−1) 10 (+1)
Source : EC.(1) The total immigrants column includes immigrants of European and non‑European nationalities as well as immigrants who have obtained Belgian nationality.
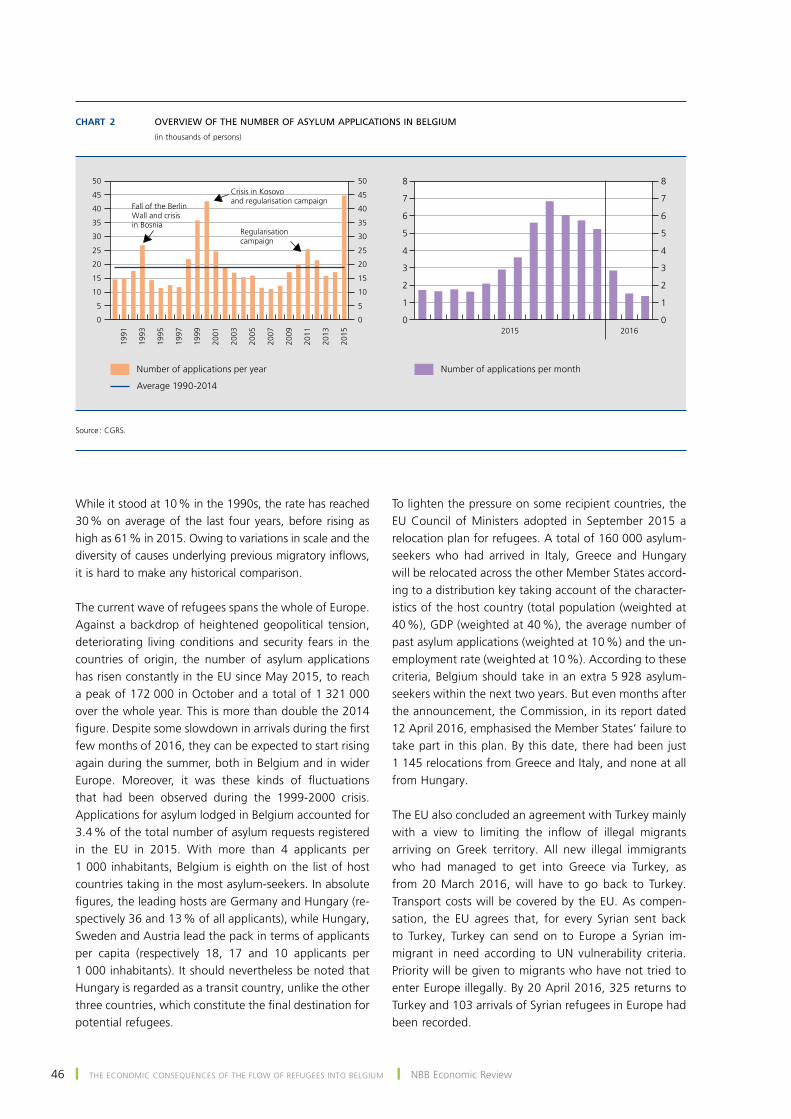
46 ❙ tHE Economic consEQuEncEs of tHE floW of rEfugEEs into BElgium ❙ nBB Economic review
While it stood at 10 % in the 1990s, the rate has reached 30 % on average of the last four years, before rising as high as 61 % in 2015. Owing to variations in scale and the diversity of causes underlying previous migratory inflows, it is hard to make any historical comparison.
the current wave of refugees spans the whole of Europe. Against a backdrop of heightened geopolitical tension, deteriorating living conditions and security fears in the countries of origin, the number of asylum applications has risen constantly in the EU since May 2015, to reach a peak of 172 000 in October and a total of 1 321 000 over the whole year. This is more than double the 2014 figure. Despite some slowdown in arrivals during the first few months of 2016, they can be expected to start rising again during the summer, both in Belgium and in wider Europe. Moreover, it was these kinds of fluctuations that had been observed during the 1999-2000 crisis. Applications for asylum lodged in Belgium accounted for 3.4 % of the total number of asylum requests registered in the EU in 2015. With more than 4 applicants per 1 000 inhabitants, Belgium is eighth on the list of host countries taking in the most asylum-seekers. In absolute figures, the leading hosts are Germany and Hungary (re-spectively 36 and 13 % of all applicants), while Hungary, Sweden and Austria lead the pack in terms of applicants per capita (respectively 18, 17 and 10 applicants per 1 000 inhabitants). it should nevertheless be noted that Hungary is regarded as a transit country, unlike the other three countries, which constitute the final destination for potential refugees.
to lighten the pressure on some recipient countries, the EU Council of Ministers adopted in September 2015 a relocation plan for refugees. A total of 160 000 asylum-seekers who had arrived in Italy, Greece and Hungary will be relocated across the other member states accord-ing to a distribution key taking account of the character-istics of the host country (total population (weighted at 40 %), GDP (weighted at 40 %), the average number of past asylum applications (weighted at 10 %) and the un-employment rate (weighted at 10 %). According to these criteria, Belgium should take in an extra 5 928 asylum-seekers within the next two years. But even months after the announcement, the commission, in its report dated 12 April 2016, emphasised the Member States’ failure to take part in this plan. By this date, there had been just 1 145 relocations from Greece and Italy, and none at all from Hungary.
The EU also concluded an agreement with Turkey mainly with a view to limiting the inflow of illegal migrants arriving on Greek territory. All new illegal immigrants who had managed to get into Greece via Turkey, as from 20 March 2016, will have to go back to Turkey. transport costs will be covered by the Eu. As compen-sation, the EU agrees that, for every Syrian sent back to Turkey, Turkey can send on to Europe a Syrian im-migrant in need according to un vulnerability criteria. priority will be given to migrants who have not tried to enter Europe illegally. By 20 April 2016, 325 returns to Turkey and 103 arrivals of Syrian refugees in Europe had been recorded.
Chart 2 OVERVIEW OF THE NUMBER OF ASYLUM APPLICATIONS IN BELGIUM
(in thousands of persons)
1991
1993
1995
1997
1999
2001
2003
2005
2007
2009
2011
2013
2015
0
5
10
15
20
25
30
35
40
45
50
0
5
10
15
20
25
30
35
40
45
50
2015 20160
1
2
3
4
5
6
7
8
0
1
2
3
4
5
6
7
8
Number of applications per year
Average 1990‑2014
Number of applications per month
Fall of the Berlin Wall and crisis in Bosnia
Crisis in Kosovo and regularisation campaign
Regularisation campaign
source : cgrs.
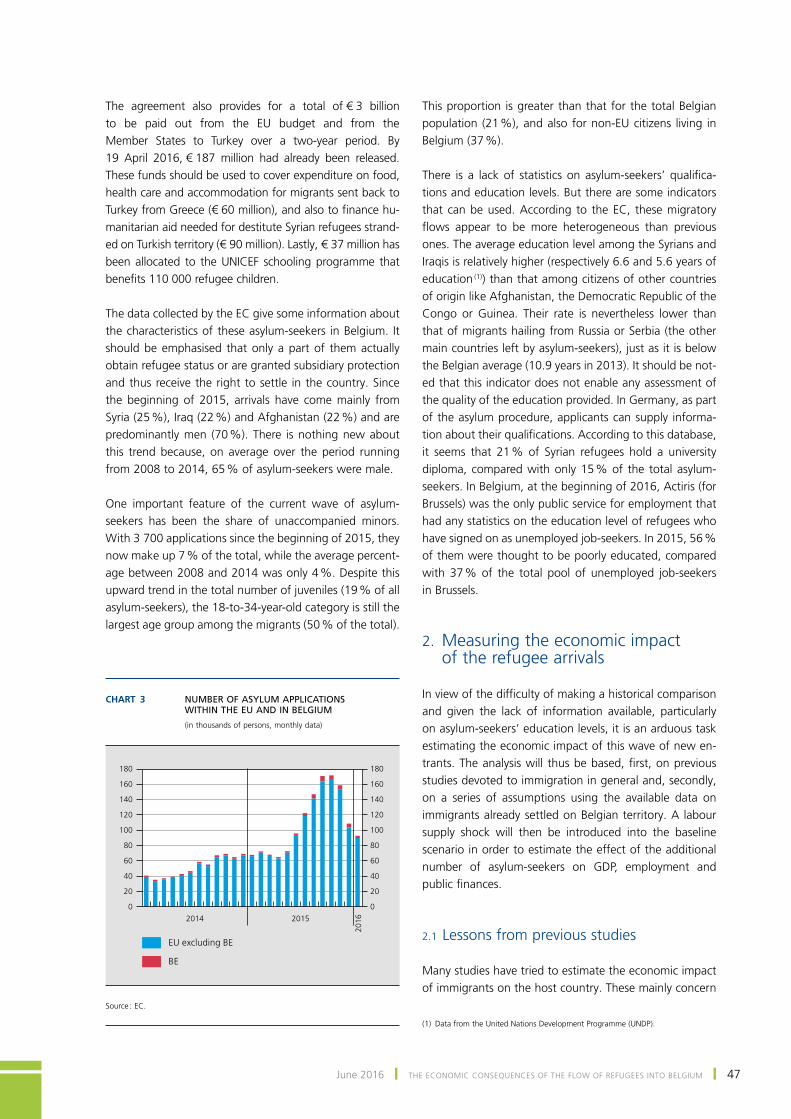
June 2016 ❙ tHE Economic consEQuEncEs of tHE floW of rEfugEEs into BElgium ❙ 47
The agreement also provides for a total of € 3 billion to be paid out from the Eu budget and from the Member States to Turkey over a two-year period. By 19 April 2016, € 187 million had already been released. these funds should be used to cover expenditure on food, health care and accommodation for migrants sent back to Turkey from Greece (€ 60 million), and also to finance hu-manitarian aid needed for destitute syrian refugees strand-ed on Turkish territory (€ 90 million). Lastly, € 37 million has been allocated to the unicEf schooling programme that benefits 110 000 refugee children.
the data collected by the Ec give some information about the characteristics of these asylum-seekers in Belgium. It should be emphasised that only a part of them actually obtain refugee status or are granted subsidiary protection and thus receive the right to settle in the country. since the beginning of 2015, arrivals have come mainly from Syria (25 %), Iraq (22 %) and Afghanistan (22 %) and are predominantly men (70 %). There is nothing new about this trend because, on average over the period running from 2008 to 2014, 65 % of asylum-seekers were male.
one important feature of the current wave of asylum-seekers has been the share of unaccompanied minors. With 3 700 applications since the beginning of 2015, they now make up 7 % of the total, while the average percent-age between 2008 and 2014 was only 4 %. Despite this upward trend in the total number of juveniles (19 % of all asylum-seekers), the 18-to-34-year-old category is still the largest age group among the migrants (50 % of the total).
this proportion is greater than that for the total Belgian population (21 %), and also for non-EU citizens living in Belgium (37 %).
There is a lack of statistics on asylum-seekers’ qualifica-tions and education levels. But there are some indicators that can be used. According to the Ec, these migratory flows appear to be more heterogeneous than previous ones. the average education level among the syrians and Iraqis is relatively higher (respectively 6.6 and 5.6 years of education (1)) than that among citizens of other countries of origin like Afghanistan, the Democratic Republic of the congo or guinea. their rate is nevertheless lower than that of migrants hailing from russia or serbia (the other main countries left by asylum-seekers), just as it is below the Belgian average (10.9 years in 2013). It should be not-ed that this indicator does not enable any assessment of the quality of the education provided. in germany, as part of the asylum procedure, applicants can supply informa-tion about their qualifications. According to this database, it seems that 21 % of Syrian refugees hold a university diploma, compared with only 15 % of the total asylum-seekers. In Belgium, at the beginning of 2016, Actiris (for Brussels) was the only public service for employment that had any statistics on the education level of refugees who have signed on as unemployed job-seekers. In 2015, 56 % of them were thought to be poorly educated, compared with 37 % of the total pool of unemployed job-seekers in Brussels.
2. measuring the economic impact of the refugee arrivals
In view of the difficulty of making a historical comparison and given the lack of information available, particularly on asylum-seekers’ education levels, it is an arduous task estimating the economic impact of this wave of new en-trants. The analysis will thus be based, first, on previous studies devoted to immigration in general and, secondly, on a series of assumptions using the available data on immigrants already settled on Belgian territory. A labour supply shock will then be introduced into the baseline scenario in order to estimate the effect of the additional number of asylum-seekers on GDP, employment and public finances.
2.1 lessons from previous studies
many studies have tried to estimate the economic impact of immigrants on the host country. these mainly concern
(1) Data from the united nations Development programme (unDp).
Chart 3 NUMBER OF ASYLUM APPLICATIONS WITHIN THE EU AND IN BELGIUM
(in thousands of persons, monthly data)
2014 2015
2016
0
20
40
60
80
100
120
140
160
180
0
20
40
60
80
100
120
140
160
180
EU excluding BE
BE
source : Ec.
48 ❙ tHE Economic consEQuEncEs of tHE floW of rEfugEEs into BElgium ❙ nBB Economic review
the labour market, and notably the impact on employ-ment and wages, but also cover public finances, as well as the use of social protection systems. However, very few authors make any distinction between refugees and economic migrants in their analysis. The following find-ings are therefore valid for analysing overall rather than specific immigrant inflows.
Impact of immigration on the labour market
one of the main issues broached in the existing literature is the effect that immigration has on natives in terms of employment and wages. corresponding in principle to an increase in the labour supply, immigration could have a negative impact on natives in cases of perfect substitu-tion between them and immigrant workers. Yet, several research papers show that imperfect substitution occurs, mainly because of their different skills levels, their sectoral preferences (Ottaviano and Peri, 2005), or even because of their lack of knowledge of the local language (Kerr and Kerr, 2011). However, immigrants should gradually become more and more substitutable for native workers the longer they stay in the host country (Zavodny and orrenius, 2006).
Given this complementarity between those workers, current research findings point to a neutral impact on aggregate employment of natives. this is particularly so for the wave of immigration caused by the enlargement of the EU (Kahanec and Zimmermann, 2008 ; Lemos and Portes, 2008), but also for the arrival of Syrians in Turkey (Akgunduz et al., 2015). Analysis of all types of immi-grants taken together also points up a positive or zero impact on employment of natives (Docquier et al., 2014, in their study on Belgium ; izquierdo et al., 2010, for spain ; friedberg, 2001, for israel) and a neutral effect on unemployment (Bruker and Jahn, 2011, and Bauer et al., 2011, for germany).
Adverse effects may nevertheless arise on certain seg-ments of the labour market. For instance, a big increase in the number of low-skilled immigrants could have a nega-tive impact on native youth employment (smith, 2012), but also on that of immigrants who have already settled in the country (Okkerse, 2008 ; Blau and Kahn, 2012). These immigrants are effectively more like the newcomers and thus opt for similar jobs. In the case of young workers, their labour supply is influenced more rapidly by wage changes driven by the arrival of new migrants.
in general, the impact will depend on the distribution of existing skills levels in the region where the immigrants settle, as well as their own level of education. A fair share-out of immigrants across the territory therefore does not
necessarily imply a fair distribution of the impact on the labour market (Glitz, 2012). As immigrants tend to react more quickly to changes in labour demand, there will be market equilibrium only if a certain degree of worker mobility exists (Cadena and Kovak, 2013). So, in the long run, immigration can actually improve flexibility on the labour market and the skills match. It should be noted that when they are turned down for legal work, migrants may potentially inflate the black market’s share. This is notably what has been observed in Turkey following the arrival of Syrians with no work permit (Del Carpio and Wagner, 2015).
in terms of wages, an unexpected and large wave of immigrants composed of low-skilled workers could, in theory, lead to downward pressure (De la rica et al., 2013). This theoretical impact does not take account of the existence of a minimum wage or collective labour agreements that could prevent any nominal reduction in wages. However, it can be assumed that there would be some impact on the growth rate of these wages, which would be lower than if there were no migrants coming in.
As in the employment analysis, if the immigrants are complementary to native workers, a rise in wages could even be observed for non-immigrants (Zavodny and orrenius, 2006 ; shapiro and Velluci, 2010). Empirical studies, focusing mainly on the united states (ottaviano and peri, 2012 ; Dustmann et al., 2008) or on the enlarge-ment of the Eu (lemos and portes, 2008 ; Kahanec and Zimmermann, 2008), show that while there is generally no negative impact on aggregate wages of natives, the breakdown by education level produces different results. salaries earned by highly educated natives tend to be higher after immigration, whereas the effect on wages paid to low-educated workers is ambiguous (Zavodny and Orrenius, 2006 ; Ottaviano and Peri, 2005). Beerli and Peri (2015) conclude that the higher wages of highly educated natives are partly justified by the fact that they are prompted to take up managerial posts, as the increase in the immigrant population boosts demand for this type of job.
As they are more substitutable for the newcomers, it would once again be the immigrants already settled in the country that would be hit by falling wages. ottaviano and Peri (2012) have quantified this effect for the United States. While natives’ average wage rises by roughly 0.6 %, that of previous generations of immigrants con-tracts by almost 6.7 %. In the long term, the impact on wages should nevertheless always be positive, because of the increase in capital investment needed to cope with larger numbers of workers and consumers (Shapiro and Velluci, 2010 ; Bruker and Jahn, 2011).
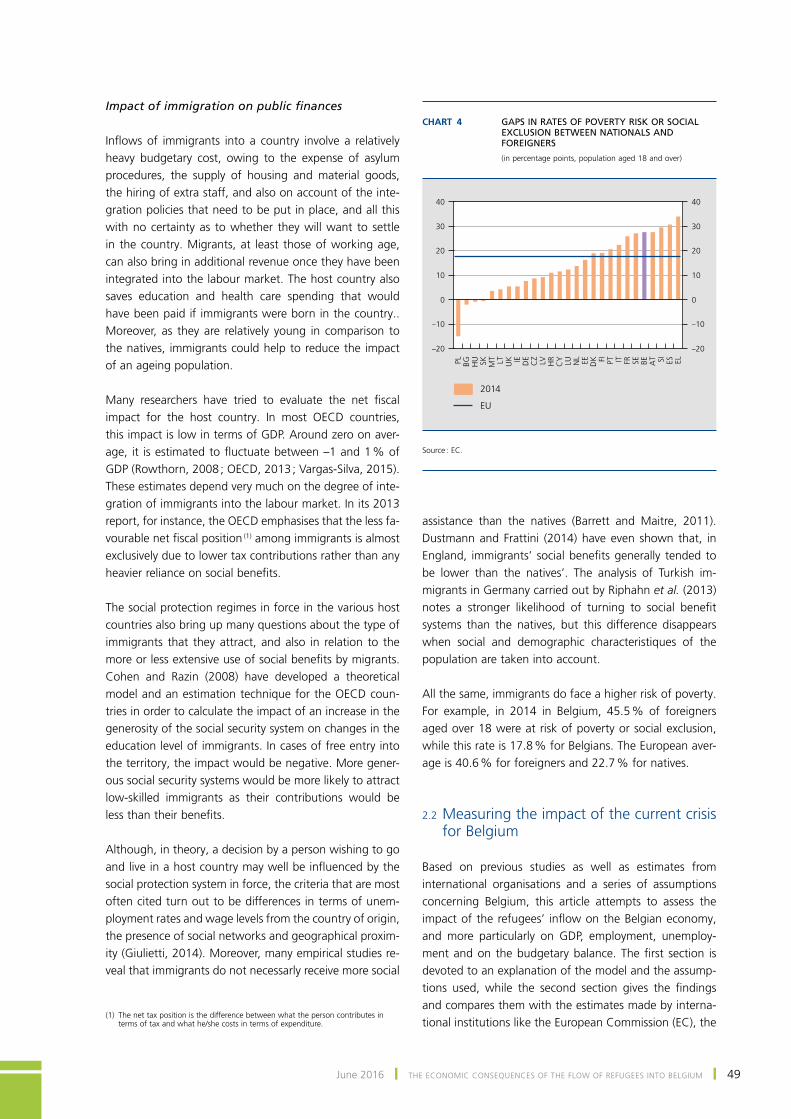
June 2016 ❙ tHE Economic consEQuEncEs of tHE floW of rEfugEEs into BElgium ❙ 49
Impact of immigration on public finances
Inflows of immigrants into a country involve a relatively heavy budgetary cost, owing to the expense of asylum procedures, the supply of housing and material goods, the hiring of extra staff, and also on account of the inte-gration policies that need to be put in place, and all this with no certainty as to whether they will want to settle in the country. Migrants, at least those of working age, can also bring in additional revenue once they have been integrated into the labour market. The host country also saves education and health care spending that would have been paid if immigrants were born in the country.. moreover, as they are relatively young in comparison to the natives, immigrants could help to reduce the impact of an ageing population.
Many researchers have tried to evaluate the net fiscal impact for the host country. in most oEcD countries, this impact is low in terms of gDp. Around zero on aver-age, it is estimated to fluctuate between –1 and 1 % of GDP (Rowthorn, 2008 ; OECD, 2013 ; Vargas-Silva, 2015). these estimates depend very much on the degree of inte-gration of immigrants into the labour market. In its 2013 report, for instance, the oEcD emphasises that the less fa-vourable net fiscal position (1) among immigrants is almost exclusively due to lower tax contributions rather than any heavier reliance on social benefits.
the social protection regimes in force in the various host countries also bring up many questions about the type of immigrants that they attract, and also in relation to the more or less extensive use of social benefits by migrants. cohen and razin (2008) have developed a theoretical model and an estimation technique for the oEcD coun-tries in order to calculate the impact of an increase in the generosity of the social security system on changes in the education level of immigrants. in cases of free entry into the territory, the impact would be negative. more gener-ous social security systems would be more likely to attract low-skilled immigrants as their contributions would be less than their benefits.
Although, in theory, a decision by a person wishing to go and live in a host country may well be influenced by the social protection system in force, the criteria that are most often cited turn out to be differences in terms of unem-ployment rates and wage levels from the country of origin, the presence of social networks and geographical proxim-ity (giulietti, 2014). moreover, many empirical studies re-veal that immigrants do not necessarly receive more social
assistance than the natives (Barrett and maitre, 2011). Dustmann and frattini (2014) have even shown that, in England, immigrants’ social benefits generally tended to be lower than the natives’. The analysis of Turkish im-migrants in Germany carried out by Riphahn et al. (2013) notes a stronger likelihood of turning to social benefit systems than the natives, but this difference disappears when social and demographic characteristiques of the population are taken into account.
All the same, immigrants do face a higher risk of poverty. For example, in 2014 in Belgium, 45.5 % of foreigners aged over 18 were at risk of poverty or social exclusion, while this rate is 17.8 % for Belgians. The European aver-age is 40.6 % for foreigners and 22.7 % for natives.
2.2 measuring the impact of the current crisis for Belgium
Based on previous studies as well as estimates from international organisations and a series of assumptions concerning Belgium, this article attempts to assess the impact of the refugees’ inflow on the Belgian economy, and more particularly on gDp, employment, unemploy-ment and on the budgetary balance. The first section is devoted to an explanation of the model and the assump-tions used, while the second section gives the findings and compares them with the estimates made by interna-tional institutions like the European Commission (EC), the
(1) the net tax position is the difference between what the person contributes in terms of tax and what he/she costs in terms of expenditure.
Chart 4 GAPS IN RATES OF POVERTY RISK OR SOCIAL EXCLUSION BETWEEN NATIONALS AND FOREIGNERS
(in percentage points, population aged 18 and over)
PL BG HU SK MT LT UK IE DE
CZ LV HR
CY LU NL EE DK FI PT IT FR SE BE AT SI ES EL
–20
–10
0
10
20
30
40
–20
–10
0
10
20
30
40
2014
EU
source : Ec.
50 ❙ tHE Economic consEQuEncEs of tHE floW of rEfugEEs into BElgium ❙ nBB Economic review
international monetary fund (imf) and the organisation for Economic cooperation and Development (oEcD).
Assumptions and methodology
given the instability in the main countries of origin of the refugees and in view of the growing numbers from countries like Turkey, the Lebanon and Jordan, but also Hungary, italy and greece, the number of asylum ap-plications lodged in Belgium is still expected to be high in 2016, even though there have been signs of a marked slowdown since January 2016. The numbers are there-fore estimated to be more or less the same in 2015 and in 2016, respectively 44 800 and 45 400, and a return to normal is anticipated by 2017, i.e.18 500 entries. The model only takes into account the extra number of asylum-seekers compared with a normal situation and so the shock recorded only concerns those asylum ap-plications over and above the average observed between 2008 and 2014, which was roughly 1 500 per month.
To define the labour supply shock, only the refugee population aged between 15 and 64 years is taken into consideration. only part of this group will actually obtain refugee status and thus be able to stay permanently in Belgium. The average recognition rate in 2015 and 2016 is 61 %, whereas it was only 47 % in 2014. Assuming that, without this latest wave of migrants, this rate would have remained constant at its 2014 level, there is on av-erage a 75 % acceptance rate for the additional asylum applications. this percentage does not seem unrealistic since there are large numbers of syrians and iraqis ar-riving in Belgium with recognition rates of respectively, 98 and 72 %.
once these refugees have been recorded as part of the working age population, it is important to know their em-ployment and unemployment rates in order to define the labour force. According to labour force survey (lfs) data, employment and unemployment rates among immigrants are respectively around 40 and 16 % of the working age population after five years of residence. While the em-ployment rate goes up gradually, the unemployment rate remains relatively constant throughout this period. these two rates are only applied after four months, which cor-responds to the waiting period necessary to get a work permit.
Family reunification is also taken into account in the esti-mates. This can only take place once the status of refugee is granted. only direct family members (ascendants and/or descendants) have the right to submit a request for family reunification. It then takes about 17 months to process the case file. According to data from Fedasil, 50 % of the
refugees are currently single people and are likely to bring their family into the country. moreover, according to fps Interior, 63 % of the members of reuniting families are less than 14 years old. the model therefore includes an additional arrival, after about two years, of three people per single refugee, two of whom are considered to be minors and one as part of the working age population. The same assumptions of entry onto the labour market as for refugees are applied to these people. the law govern-ing family reunification of non-European immigrants has recently been amended. While they could previously get an unlimited residence permit after living in the coun-try for three years, this was extended by two years on 14 April 2016 to bring it into line with rules in force for European immigrants. Each person involved in the family reunification, regardless of their nationality, now has to wait five years before being able to claim a permanent residence permit.
on the basis of assumptions calibrated beforehand and with the use of the Bank’s quarterly econometric model “noname”, the macroeconomic impact of the refugee crisis on the Belgian economy has been estimated in the short and medium term. this model describes the main sectors of the Belgian economy at a relatively highly aggre-gate level, based on the behaviour of an average economic agent (consumer, worker, company manager, saver, inves-tor, etc.). the model brings out the typical effects of the different shocks on the Belgian economy and will there-fore, besides the aggregation of all the direct effects also take account of the second-round effects. As the way in which the total Belgian economy functions is greatly sim-plified in the model, the results can at best be considered “indicative”. they are expressed in terms of the deviation from a baseline scenario that disregards the impact of the refugee crisis. more particularly, this also means that these calculations do not include all new asylum-seekers, but only those above the average number of asylum-seekers registered each year between 2008 and 2014. The normal stream of asylum-seekers is actually included in the base-line scenario.
these calculations are based on the assumption that this labour supply shock has no macroeconomic influence on the wage-formation process, hence the absence of any new price and competitiveness effects in this scenario. this assumption is not only consistent with the conclu-sions of recent publications, but also with downward wage rigidity and the fact that Belgium has a minimum wage set by collective bargaining.
As concerns emergency shelter for refugees, public authorities are having to temporarily call on the private sector to supply them with extra goods and services. the
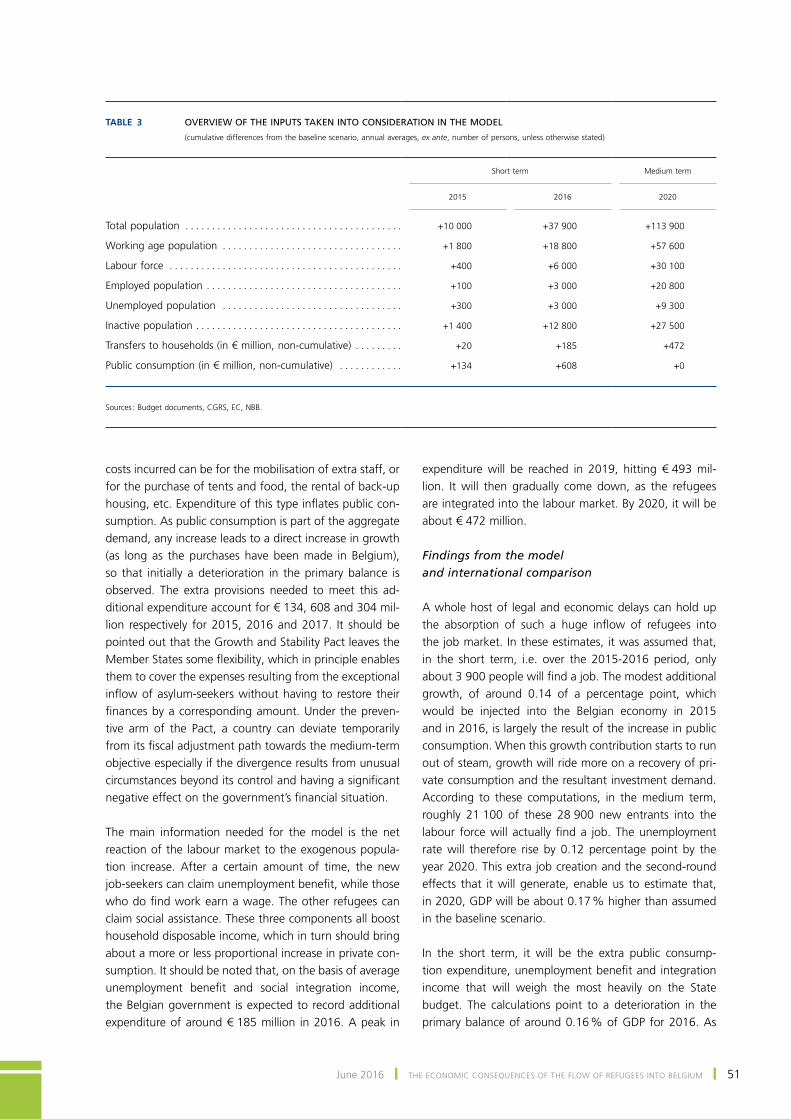
June 2016 ❙ tHE Economic consEQuEncEs of tHE floW of rEfugEEs into BElgium ❙ 51
costs incurred can be for the mobilisation of extra staff, or for the purchase of tents and food, the rental of back-up housing, etc. Expenditure of this type inflates public con-sumption. As public consumption is part of the aggregate demand, any increase leads to a direct increase in growth (as long as the purchases have been made in Belgium), so that initially a deterioration in the primary balance is observed. the extra provisions needed to meet this ad-ditional expenditure account for € 134, 608 and 304 mil-lion respectively for 2015, 2016 and 2017. It should be pointed out that the growth and stability pact leaves the Member States some flexibility, which in principle enables them to cover the expenses resulting from the exceptional inflow of asylum-seekers without having to restore their finances by a corresponding amount. Under the preven-tive arm of the pact, a country can deviate temporarily from its fiscal adjustment path towards the medium-term objective especially if the divergence results from unusual circumstances beyond its control and having a significant negative effect on the government’s financial situation.
the main information needed for the model is the net reaction of the labour market to the exogenous popula-tion increase. After a certain amount of time, the new job-seekers can claim unemployment benefit, while those who do find work earn a wage. The other refugees can claim social assistance. these three components all boost household disposable income, which in turn should bring about a more or less proportional increase in private con-sumption. it should be noted that, on the basis of average unemployment benefit and social integration income, the Belgian government is expected to record additional expenditure of around € 185 million in 2016. A peak in
expenditure will be reached in 2019, hitting € 493 mil-lion. it will then gradually come down, as the refugees are integrated into the labour market. By 2020, it will be about € 472 million.
Findings from the model and international comparison
A whole host of legal and economic delays can hold up the absorption of such a huge inflow of refugees into the job market. In these estimates, it was assumed that, in the short term, i.e. over the 2015-2016 period, only about 3 900 people will find a job. The modest additional growth, of around 0.14 of a percentage point, which would be injected into the Belgian economy in 2015 and in 2016, is largely the result of the increase in public consumption. When this growth contribution starts to run out of steam, growth will ride more on a recovery of pri-vate consumption and the resultant investment demand. According to these computations, in the medium term, roughly 21 100 of these 28 900 new entrants into the labour force will actually find a job. The unemployment rate will therefore rise by 0.12 percentage point by the year 2020. this extra job creation and the second-round effects that it will generate, enable us to estimate that, in 2020, GDP will be about 0.17 % higher than assumed in the baseline scenario.
in the short term, it will be the extra public consump-tion expenditure, unemployment benefit and integration income that will weigh the most heavily on the state budget. the calculations point to a deterioration in the primary balance of around 0.16 % of GDP for 2016. As
Table 3 OVERVIEW OF THE INPUTS TAKEN INTO CONSIDERATION IN THE MODEL
(cumulative differences from the baseline scenario, annual averages, ex ante, number of persons, unless otherwise stated)
Short term
Medium term
2015
2016
2020
Total population . . . . . . . . . . . . . . . . . . . . . . . . . . . . . . . . . . . . . . . . . +10 000 +37 900 +113 900
Working age population . . . . . . . . . . . . . . . . . . . . . . . . . . . . . . . . . . +1 800 +18 800 +57 600
Labour force . . . . . . . . . . . . . . . . . . . . . . . . . . . . . . . . . . . . . . . . . . . . +400 +6 000 +30 100
Employed population . . . . . . . . . . . . . . . . . . . . . . . . . . . . . . . . . . . . . +100 +3 000 +20 800
Unemployed population . . . . . . . . . . . . . . . . . . . . . . . . . . . . . . . . . . +300 +3 000 +9 300
Inactive population . . . . . . . . . . . . . . . . . . . . . . . . . . . . . . . . . . . . . . . +1 400 +12 800 +27 500
Transfers to households (in € million, non‑cumulative) . . . . . . . . . +20 +185 +472
Public consumption (in € million, non‑cumulative) . . . . . . . . . . . . +134 +608 +0
Sources : Budget documents, CGRS, EC, NBB.
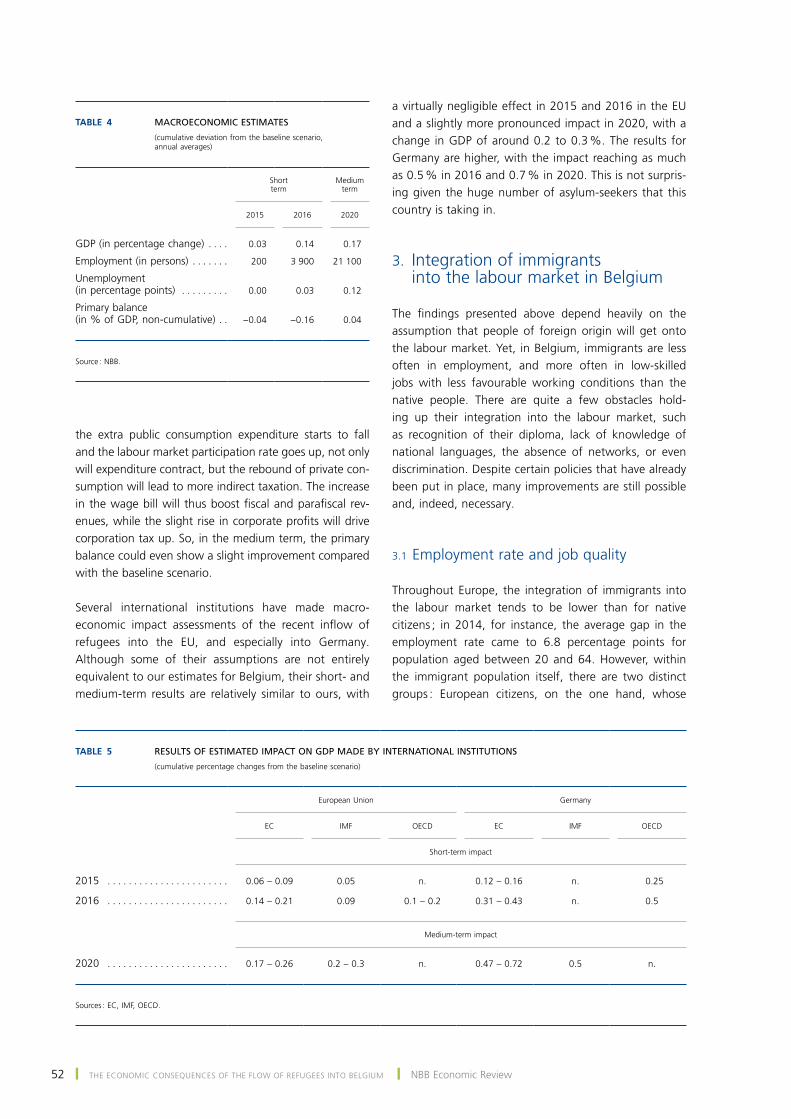
52 ❙ tHE Economic consEQuEncEs of tHE floW of rEfugEEs into BElgium ❙ nBB Economic review
the extra public consumption expenditure starts to fall and the labour market participation rate goes up, not only will expenditure contract, but the rebound of private con-sumption will lead to more indirect taxation. the increase in the wage bill will thus boost fiscal and parafiscal rev-enues, while the slight rise in corporate profits will drive corporation tax up. so, in the medium term, the primary balance could even show a slight improvement compared with the baseline scenario.
several international institutions have made macro-economic impact assessments of the recent inflow of refugees into the Eu, and especially into germany. Although some of their assumptions are not entirely equivalent to our estimates for Belgium, their short- and medium-term results are relatively similar to ours, with
a virtually negligible effect in 2015 and 2016 in the EU and a slightly more pronounced impact in 2020, with a change in GDP of around 0.2 to 0.3 %. The results for germany are higher, with the impact reaching as much as 0.5 % in 2016 and 0.7 % in 2020. This is not surpris-ing given the huge number of asylum-seekers that this country is taking in.
3. integration of immigrants into the labour market in Belgium
The findings presented above depend heavily on the assumption that people of foreign origin will get onto the labour market. Yet, in Belgium, immigrants are less often in employment, and more often in low-skilled jobs with less favourable working conditions than the native people. there are quite a few obstacles hold-ing up their integration into the labour market, such as recognition of their diploma, lack of knowledge of national languages, the absence of networks, or even discrimination. Despite certain policies that have already been put in place, many improvements are still possible and, indeed, necessary.
3.1 Employment rate and job quality
throughout Europe, the integration of immigrants into the labour market tends to be lower than for native citizens ; in 2014, for instance, the average gap in the employment rate came to 6.8 percentage points for population aged between 20 and 64. However, within the immigrant population itself, there are two distinct groups : European citizens, on the one hand, whose
Table 4 MACROECONOMIC ESTIMATES
(cumulative deviation from the baseline scenario, annual averages)
Short term
Medium term
2015
2016
2020
GDP (in percentage change) . . . . 0.03 0.14 0.17
Employment (in persons) . . . . . . . 200 3 900 21 100
Unemployment (in percentage points) . . . . . . . . . 0.00 0.03 0.12
Primary balance (in % of GDP, non‑cumulative) . . −0.04 −0.16 0.04
Source : NBB.
Table 5 RESULTS OF ESTIMATED IMPACT ON GDP MADE BY INTERNATIONAL INSTITUTIONS
(cumulative percentage changes from the baseline scenario)
European Union
Germany
EC
IMF
OECD
EC
IMF
OECD
Short‑term impact
2015 . . . . . . . . . . . . . . . . . . . . . . . 0.06 – 0.09 0.05 n. 0.12 – 0.16 n. 0.25
2016 . . . . . . . . . . . . . . . . . . . . . . . 0.14 – 0.21 0.09 0.1 – 0.2 0.31 – 0.43 n. 0.5
Medium‑term impact
2020 . . . . . . . . . . . . . . . . . . . . . . . 0.17 – 0.26 0.2 – 0.3 n. 0.47 – 0.72 0.5 n.
Sources : EC, IMF, OECD.
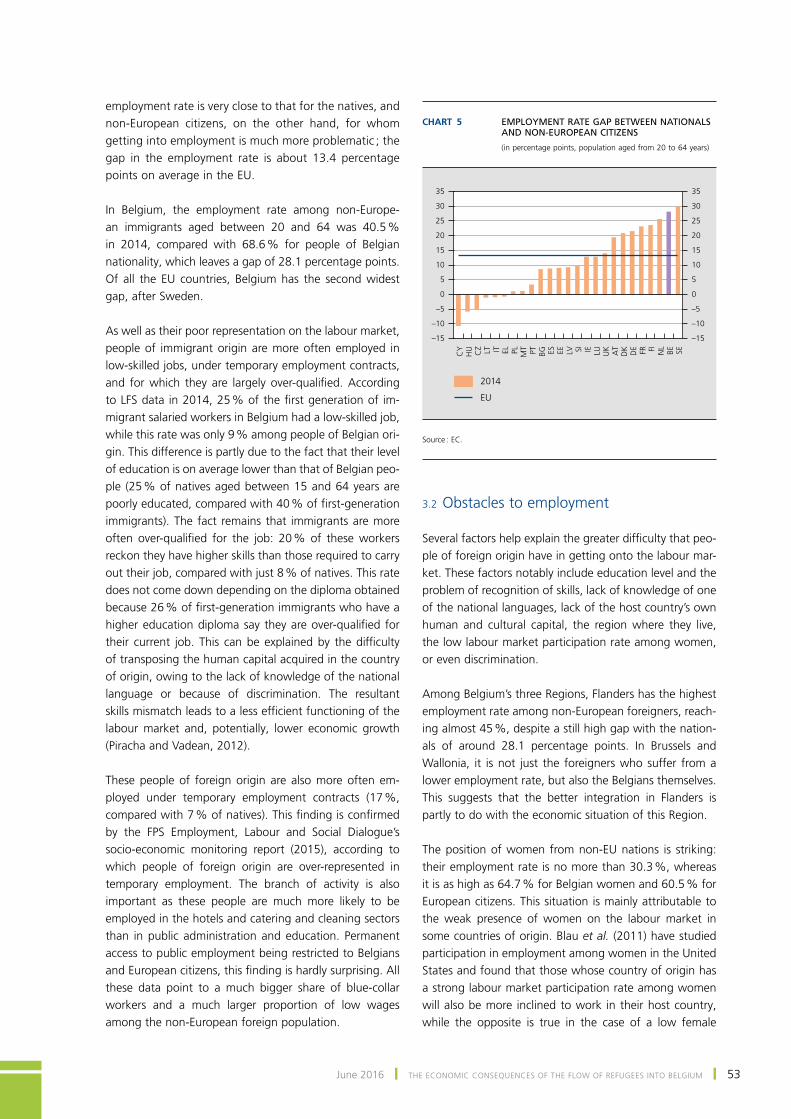
June 2016 ❙ tHE Economic consEQuEncEs of tHE floW of rEfugEEs into BElgium ❙ 53
employment rate is very close to that for the natives, and non-European citizens, on the other hand, for whom getting into employment is much more problematic ; the gap in the employment rate is about 13.4 percentage points on average in the Eu.
in Belgium, the employment rate among non-Europe-an immigrants aged between 20 and 64 was 40.5 % in 2014, compared with 68.6 % for people of Belgian nationality, which leaves a gap of 28.1 percentage points. of all the Eu countries, Belgium has the second widest gap, after sweden.
As well as their poor representation on the labour market, people of immigrant origin are more often employed in low-skilled jobs, under temporary employment contracts, and for which they are largely over-qualified. According to LFS data in 2014, 25 % of the first generation of im-migrant salaried workers in Belgium had a low-skilled job, while this rate was only 9 % among people of Belgian ori-gin. this difference is partly due to the fact that their level of education is on average lower than that of Belgian peo-ple (25 % of natives aged between 15 and 64 years are poorly educated, compared with 40 % of first-generation immigrants). the fact remains that immigrants are more often over-qualified for the job: 20 % of these workers reckon they have higher skills than those required to carry out their job, compared with just 8 % of natives. This rate does not come down depending on the diploma obtained because 26 % of first-generation immigrants who have a higher education diploma say they are over-qualified for their current job. This can be explained by the difficulty of transposing the human capital acquired in the country of origin, owing to the lack of knowledge of the national language or because of discrimination. the resultant skills mismatch leads to a less efficient functioning of the labour market and, potentially, lower economic growth (piracha and Vadean, 2012).
these people of foreign origin are also more often em-ployed under temporary employment contracts (17 %, compared with 7 % of natives). This finding is confirmed by the FPS Employment, Labour and Social Dialogue’s socio-economic monitoring report (2015), according to which people of foreign origin are over-represented in temporary employment. the branch of activity is also important as these people are much more likely to be employed in the hotels and catering and cleaning sectors than in public administration and education. permanent access to public employment being restricted to Belgians and European citizens, this finding is hardly surprising. All these data point to a much bigger share of blue-collar workers and a much larger proportion of low wages among the non-European foreign population.
3.2 obstacles to employment
Several factors help explain the greater difficulty that peo-ple of foreign origin have in getting onto the labour mar-ket. These factors notably include education level and the problem of recognition of skills, lack of knowledge of one of the national languages, lack of the host country’s own human and cultural capital, the region where they live, the low labour market participation rate among women, or even discrimination.
Among Belgium’s three Regions, Flanders has the highest employment rate among non-European foreigners, reach-ing almost 45 %, despite a still high gap with the nation-als of around 28.1 percentage points. in Brussels and Wallonia, it is not just the foreigners who suffer from a lower employment rate, but also the Belgians themselves. this suggests that the better integration in flanders is partly to do with the economic situation of this region.
The position of women from non-EU nations is striking: their employment rate is no more than 30.3 %, whereas it is as high as 64.7 % for Belgian women and 60.5 % for European citizens. this situation is mainly attributable to the weak presence of women on the labour market in some countries of origin. Blau et al. (2011) have studied participation in employment among women in the united states and found that those whose country of origin has a strong labour market participation rate among women will also be more inclined to work in their host country, while the opposite is true in the case of a low female
Chart 5 EMPLOYMENT RATE GAP BETWEEN NATIONALS AND NON-EUROPEAN CITIZENS
(in percentage points, population aged from 20 to 64 years)
CY
HU CZ LT IT EL PL MT PT BG ES EE LV SI IE LU UK AT
DK DE FR FI NL
BE SE
–15
–10
–5
0
5
10
15
20
25
30
35
–15
–10
–5
0
5
10
15
20
25
30
35
2014
EU
source : Ec.
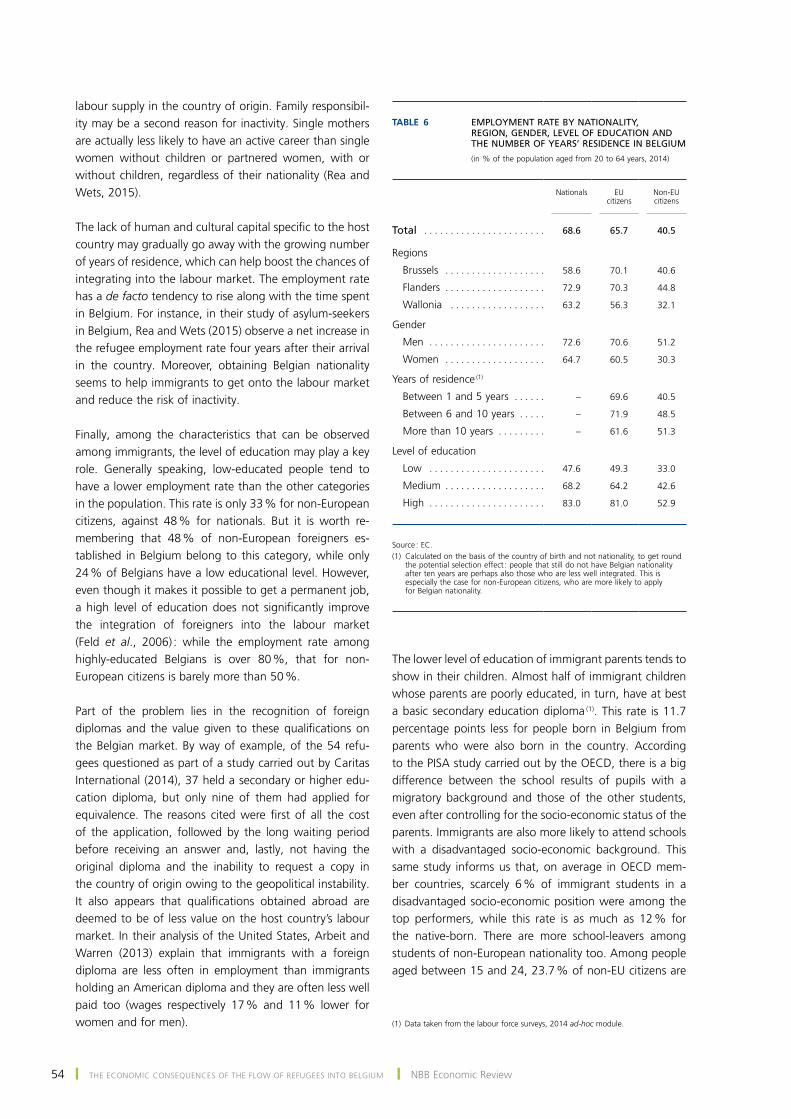
54 ❙ tHE Economic consEQuEncEs of tHE floW of rEfugEEs into BElgium ❙ nBB Economic review
labour supply in the country of origin. family responsibil-ity may be a second reason for inactivity. single mothers are actually less likely to have an active career than single women without children or partnered women, with or without children, regardless of their nationality (rea and Wets, 2015).
The lack of human and cultural capital specific to the host country may gradually go away with the growing number of years of residence, which can help boost the chances of integrating into the labour market. The employment rate has a de facto tendency to rise along with the time spent in Belgium. For instance, in their study of asylum-seekers in Belgium, Rea and Wets (2015) observe a net increase in the refugee employment rate four years after their arrival in the country. moreover, obtaining Belgian nationality seems to help immigrants to get onto the labour market and reduce the risk of inactivity.
finally, among the characteristics that can be observed among immigrants, the level of education may play a key role. Generally speaking, low-educated people tend to have a lower employment rate than the other categories in the population. This rate is only 33 % for non-European citizens, against 48 % for nationals. But it is worth re-membering that 48 % of non-European foreigners es-tablished in Belgium belong to this category, while only 24 % of Belgians have a low educational level. However, even though it makes it possible to get a permanent job, a high level of education does not significantly improve the integration of foreigners into the labour market (Feld et al., 2006) : while the employment rate among highly-educated Belgians is over 80 %, that for non-European citizens is barely more than 50 %.
part of the problem lies in the recognition of foreign diplomas and the value given to these qualifications on the Belgian market. By way of example, of the 54 refu-gees questioned as part of a study carried out by caritas International (2014), 37 held a secondary or higher edu-cation diploma, but only nine of them had applied for equivalence. The reasons cited were first of all the cost of the application, followed by the long waiting period before receiving an answer and, lastly, not having the original diploma and the inability to request a copy in the country of origin owing to the geopolitical instability. It also appears that qualifications obtained abroad are deemed to be of less value on the host country’s labour market. In their analysis of the United States, Arbeit and Warren (2013) explain that immigrants with a foreign diploma are less often in employment than immigrants holding an American diploma and they are often less well paid too (wages respectively 17 % and 11 % lower for women and for men).
the lower level of education of immigrant parents tends to show in their children. Almost half of immigrant children whose parents are poorly educated, in turn, have at best a basic secondary education diploma (1). this rate is 11.7 percentage points less for people born in Belgium from parents who were also born in the country. According to the pisA study carried out by the oEcD, there is a big difference between the school results of pupils with a migratory background and those of the other students, even after controlling for the socio-economic status of the parents. Immigrants are also more likely to attend schools with a disadvantaged socio-economic background. This same study informs us that, on average in oEcD mem-ber countries, scarcely 6 % of immigrant students in a disadvantaged socio-economic position were among the top performers, while this rate is as much as 12 % for the native-born. there are more school-leavers among students of non-European nationality too. Among people aged between 15 and 24, 23.7 % of non-EU citizens are
Table 6 EMPLOYMENT RATE BY NATIONALITY, REGION, GENDER, LEVEL OF EDUCATION AND THE NUMBER OF YEARS’ RESIDENCE IN BELGIUM
(in % of the population aged from 20 to 64 years, 2014)
Nationals
EU citizens
Non‑EU citizens
Total . . . . . . . . . . . . . . . . . . . . . . . 68.6 65.7 40.5
Regions
Brussels . . . . . . . . . . . . . . . . . . . 58.6 70.1 40.6
Flanders . . . . . . . . . . . . . . . . . . . 72.9 70.3 44.8
Wallonia . . . . . . . . . . . . . . . . . . 63.2 56.3 32.1
Gender
Men . . . . . . . . . . . . . . . . . . . . . . 72.6 70.6 51.2
Women . . . . . . . . . . . . . . . . . . . 64.7 60.5 30.3
Years of residence (1)
Between 1 and 5 years . . . . . . – 69.6 40.5
Between 6 and 10 years . . . . . – 71.9 48.5
More than 10 years . . . . . . . . . – 61.6 51.3
Level of education
Low . . . . . . . . . . . . . . . . . . . . . . 47.6 49.3 33.0
Medium . . . . . . . . . . . . . . . . . . . 68.2 64.2 42.6
High . . . . . . . . . . . . . . . . . . . . . . 83.0 81.0 52.9
Source : EC.(1) Calculated on the basis of the country of birth and not nationality, to get round
the potential selection effect : people that still do not have Belgian nationality after ten years are perhaps also those who are less well integrated. This is especially the case for non‑European citizens, who are more likely to apply for Belgian nationality.
(1) Data taken from the labour force surveys, 2014 ad-hoc module.
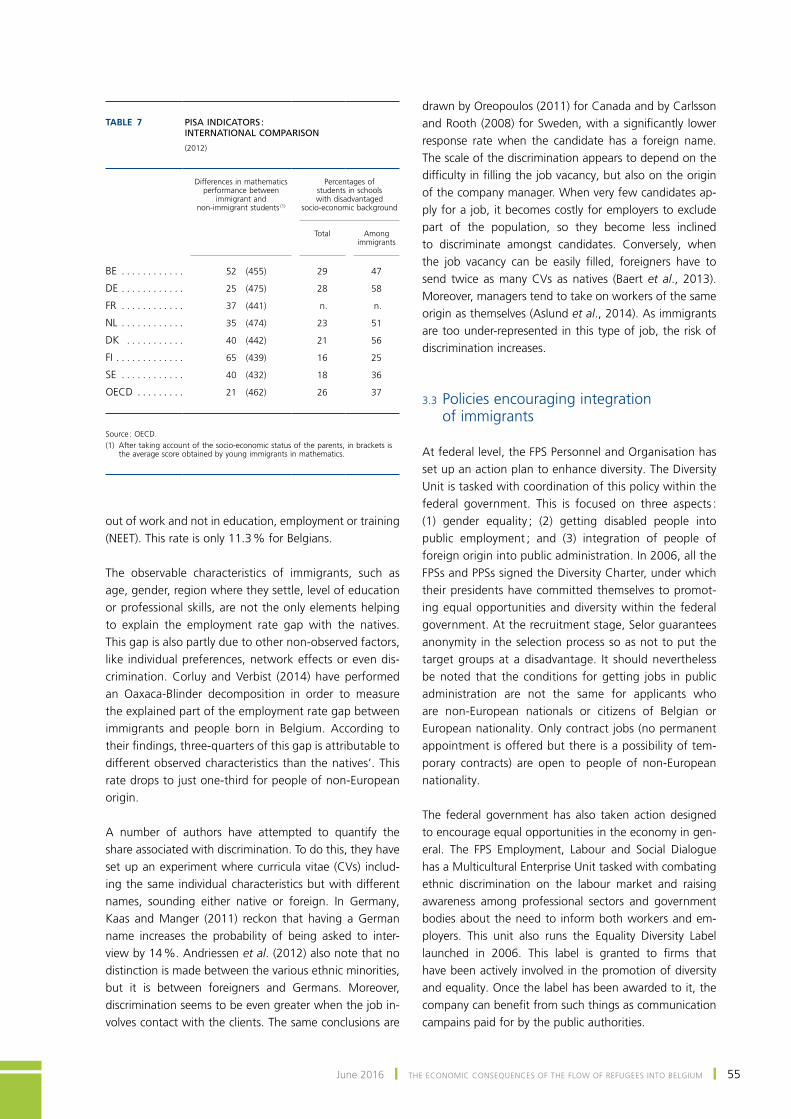
June 2016 ❙ tHE Economic consEQuEncEs of tHE floW of rEfugEEs into BElgium ❙ 55
out of work and not in education, employment or training (NEET). This rate is only 11.3 % for Belgians.
the observable characteristics of immigrants, such as age, gender, region where they settle, level of education or professional skills, are not the only elements helping to explain the employment rate gap with the natives. this gap is also partly due to other non-observed factors, like individual preferences, network effects or even dis-crimination. corluy and Verbist (2014) have performed an oaxaca-Blinder decomposition in order to measure the explained part of the employment rate gap between immigrants and people born in Belgium. According to their findings, three-quarters of this gap is attributable to different observed characteristics than the natives’. This rate drops to just one-third for people of non-European origin.
A number of authors have attempted to quantify the share associated with discrimination. to do this, they have set up an experiment where curricula vitae (cVs) includ-ing the same individual characteristics but with different names, sounding either native or foreign. in germany, Kaas and Manger (2011) reckon that having a German name increases the probability of being asked to inter-view by 14 %. Andriessen et al. (2012) also note that no distinction is made between the various ethnic minorities, but it is between foreigners and germans. moreover, discrimination seems to be even greater when the job in-volves contact with the clients. the same conclusions are
Table 7 PISA INDICATORS : INTERNATIONAL COMPARISON
(2012)
Differences in mathematics performance between
immigrant and non‑immigrant students (1)
Percentages of students in schools with disadvantaged
socio‑economic background
Total
Among immigrants
BE . . . . . . . . . . . . 52 (455) 29 47
DE . . . . . . . . . . . . 25 (475) 28 58
FR . . . . . . . . . . . . 37 (441) n. n.
NL . . . . . . . . . . . . 35 (474) 23 51
DK . . . . . . . . . . . 40 (442) 21 56
FI . . . . . . . . . . . . . 65 (439) 16 25
SE . . . . . . . . . . . . 40 (432) 18 36
OECD . . . . . . . . . 21 (462) 26 37
Source : OECD.(1) After taking account of the socio‑economic status of the parents, in brackets is
the average score obtained by young immigrants in mathematics.
drawn by oreopoulos (2011) for canada and by carlsson and Rooth (2008) for Sweden, with a significantly lower response rate when the candidate has a foreign name. the scale of the discrimination appears to depend on the difficulty in filling the job vacancy, but also on the origin of the company manager. When very few candidates ap-ply for a job, it becomes costly for employers to exclude part of the population, so they become less inclined to discriminate amongst candidates. conversely, when the job vacancy can be easily filled, foreigners have to send twice as many cVs as natives (Baert et al., 2013). Moreover, managers tend to take on workers of the same origin as themselves (Aslund et al., 2014). As immigrants are too under-represented in this type of job, the risk of discrimination increases.
3.3 policies encouraging integration of immigrants
At federal level, the fps personnel and organisation has set up an action plan to enhance diversity. the Diversity Unit is tasked with coordination of this policy within the federal government. this is focused on three aspects : (1) gender equality ; (2) getting disabled people into public employment ; and (3) integration of people of foreign origin into public administration. in 2006, all the fpss and ppss signed the Diversity charter, under which their presidents have committed themselves to promot-ing equal opportunities and diversity within the federal government. At the recruitment stage, selor guarantees anonymity in the selection process so as not to put the target groups at a disadvantage. it should nevertheless be noted that the conditions for getting jobs in public administration are not the same for applicants who are non-European nationals or citizens of Belgian or European nationality. only contract jobs (no permanent appointment is offered but there is a possibility of tem-porary contracts) are open to people of non-European nationality.
The federal government has also taken action designed to encourage equal opportunities in the economy in gen-eral. the fps Employment, labour and social Dialogue has a Multicultural Enterprise Unit tasked with combating ethnic discrimination on the labour market and raising awareness among professional sectors and government bodies about the need to inform both workers and em-ployers. this unit also runs the Equality Diversity label launched in 2006. This label is granted to firms that have been actively involved in the promotion of diversity and equality. once the label has been awarded to it, the company can benefit from such things as communication campains paid for by the public authorities.
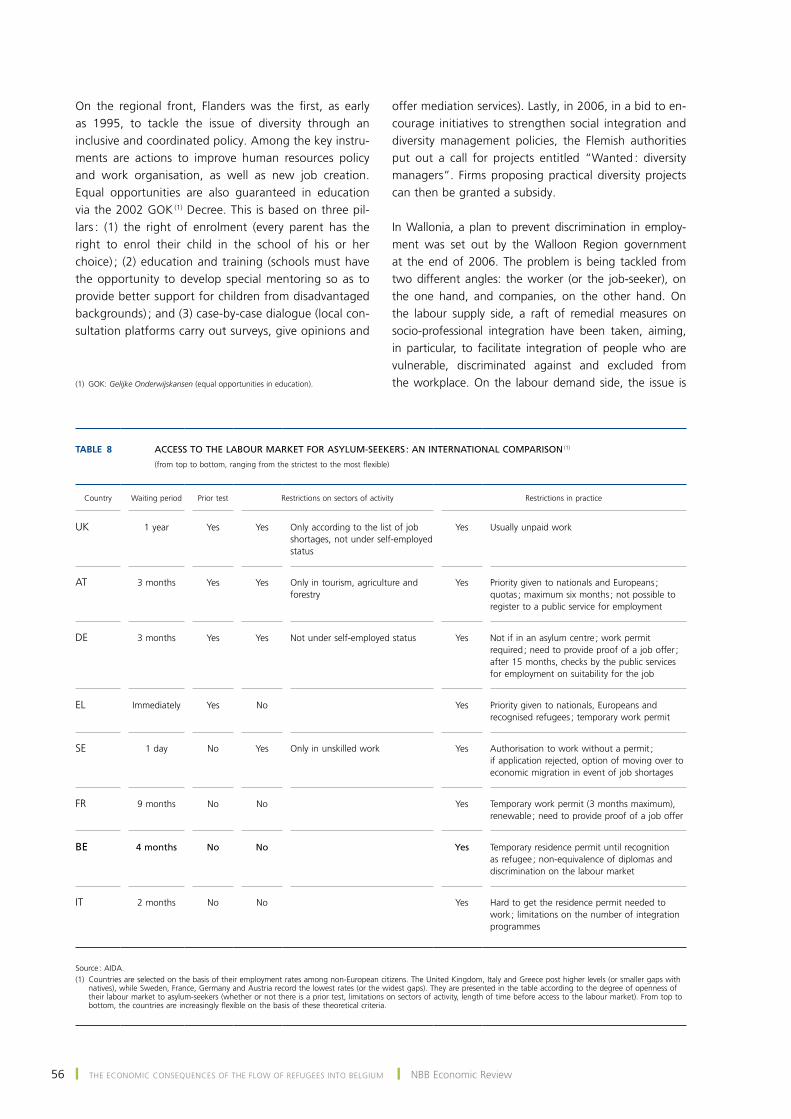
56 ❙ tHE Economic consEQuEncEs of tHE floW of rEfugEEs into BElgium ❙ nBB Economic review
On the regional front, Flanders was the first, as early as 1995, to tackle the issue of diversity through an inclusive and coordinated policy. Among the key instru-ments are actions to improve human resources policy and work organisation, as well as new job creation. Equal opportunities are also guaranteed in education via the 2002 goK (1) Decree. this is based on three pil-lars : (1) the right of enrolment (every parent has the right to enrol their child in the school of his or her choice) ; (2) education and training (schools must have the opportunity to develop special mentoring so as to provide better support for children from disadvantaged backgrounds) ; and (3) case-by-case dialogue (local con-sultation platforms carry out surveys, give opinions and
offer mediation services). Lastly, in 2006, in a bid to en-courage initiatives to strengthen social integration and diversity management policies, the flemish authorities put out a call for projects entitled “Wanted : diversity managers”. firms proposing practical diversity projects can then be granted a subsidy.
in Wallonia, a plan to prevent discrimination in employ-ment was set out by the Walloon region government at the end of 2006. The problem is being tackled from two different angles: the worker (or the job-seeker), on the one hand, and companies, on the other hand. on the labour supply side, a raft of remedial measures on socio-professional integration have been taken, aiming, in particular, to facilitate integration of people who are vulnerable, discriminated against and excluded from the workplace. On the labour demand side, the issue is (1) goK: Gelijke Onderwijskansen (equal opportunities in education).
Table 8 ACCESS TO THE LABOUR MARKET FOR ASYLUM‑SEEKERS : AN INTERNATIONAL COMPARISON (1)
(from top to bottom, ranging from the strictest to the most flexible)
Country
Waiting period
Prior test
Restrictions on sectors of activity
Restrictions in practice
UK 1 year Yes Yes Only according to the list of job shortages, not under self‑employed status
Yes Usually unpaid work
AT 3 months Yes Yes Only in tourism, agriculture and forestry
Yes Priority given to nationals and Europeans ; quotas ; maximum six months ; not possible to register to a public service for employment
DE 3 months Yes Yes Not under self‑employed status Yes Not if in an asylum centre ; work permit required ; need to provide proof of a job offer ; after 15 months, checks by the public services for employment on suitability for the job
EL Immediately Yes No Yes Priority given to nationals, Europeans and recognised refugees ; temporary work permit
SE 1 day No Yes Only in unskilled work Yes Authorisation to work without a permit ; if application rejected, option of moving over to economic migration in event of job shortages
FR 9 months No No Yes Temporary work permit (3 months maximum), renewable ; need to provide proof of a job offer
BE 4 months No No Yes Temporary residence permit until recognition as refugee ; non‑equivalence of diplomas and discrimination on the labour market
IT 2 months No No Yes Hard to get the residence permit needed to work ; limitations on the number of integration programmes
Source : AIDA.(1) Countries are selected on the basis of their employment rates among non‑European citizens. The United Kingdom, Italy and Greece post higher levels (or smaller gaps with
natives), while Sweden, France, Germany and Austria record the lowest rates (or the widest gaps). They are presented in the table according to the degree of openness of their labour market to asylum‑seekers (whether or not there is a prior test, limitations on sectors of activity, length of time before access to the labour market). From top to bottom, the countries are increasingly flexible on the basis of these theoretical criteria.
June 2016 ❙ tHE Economic consEQuEncEs of tHE floW of rEfugEEs into BElgium ❙ 57
being dealt with by policies of sanctions in cases of dis-crimination and by incentive measures intended to reward initiatives taken by firms and organisations in the field of diversity.
in the ministry of the Brussels-capital region, the Equal opportunities and Diversity unit is in charge of internal and external missions. the unit has put together an in-house diversity management plan for the staff and it organises awareness-raising, information and com-munication actions. Externally, it monitors award of grants from Brussels-based associations for funding diversity projects. the unit also helps apply the territo-rial employment pact for the Brussels-capital region, in coordination with Actiris. this pact covers the diversity plans, a charter on diversity and non-discrimination in hiring. The diversity plans imply that labour market participation is proportional to the composition of the labour force. Running for two years, they offer firms the possibility of receiving assistance in setting up a di-versity policy through a management tool and financial assistance.
As regards the more specific issue of asylum-seekers, the three regions have set up an integration programme with an induction module that they are required to fol-low within three months of their arrival in the country. Although these programmes have been available in flanders for ten years now, Brussels only set them up in July 2013 and Wallonia did not do so until February 2014. these are essential especially for learning one of the national languages. for instance, according to the 2014 survey data, 24 % of first-generation immigrant job-seekers considered the lack of language skills to be the main obstacle to getting a job.
Since September 2015, asylum-seekers have been able to get on the labour market four months after they have registered with the Belgian Immigration Office. The wait-ing period had previously been six months. following this reform, Belgium is now among the European countries with the shortest delay for obtaining a work permit. Only greece and sweden have shorter waiting periods, as they allow immediate entry, as well as Austria and germany, where workers have to wait three months. The maximum waiting period is a year, as is the case in Bulgaria, croatia, france, malta and the united Kingdom.
Unlike Belgium, some countries make work permits conditional on taking a test beforehand. The purpose of this test is not necessarily to assess the asylum-seeker’s skills, but rather to make sure that a national or European resident is not interested in the vacancy. other restric-tions that are quite common are limits on the duration
of employment contracts and on the sectors of activity where asylum-seekers are allowed to work. Added to all this are restrictions on access to self-employment, notably in germany and the united Kingdom. so, although it has the second biggest employment rate gap for non-Europeans, Belgium does show more openness when it comes to labour market access.
conclusion
for the moment, the current wave of refugees is still quite comparable to some past episodes of immigration and only makes up a small part of the migratory inflow into Belgium each year. the impact on the Belgian economy should therefore remain limited as these asylum-seekers only account for 0.36 % of the total population, or just 0.44 % of the population of working age and 0.52 % of the labour force. for the time being, these entries into the country do not imply any major shock for the labour market. Moreover, despite the high costs they can incur owing to expenditure on housing, food and equipment, reception centres, etc., our estimates point to a return to a balanced budget in the medium term, assuming there is no policy change.
To reap the advantages that these asylum-seekers can bring for the country from an economic point of view, it is essential that they can get into the labour market, failing which they run a higher risk of poverty and will be more dependent on social benefits, but it is also more likely that they will swell the ranks of the black market. To break down some of the obstacles that im-migrants come up against when looking for work, some avenues can be explored. firstly, systematic recognition of the qualification obtained in the country of origin would make it possible to better determine their level of qualification and their abilities that will be useful on the job market. In cases where it is impossible to provide the required documents, a standardised instrument for assessing qualifications and skills could be developed.
Next, knowledge of at least one of the national lan-guages is indispensable and the opportunity to learn a language should be given to everyone, whether in work or not. language training could be given as part of ini-tial work experience. Rapid integration into the labour market could also be encouraged through training that is better adapted to firms’ own needs, while taking ac-count of migrants’ capabilities. In this way, they could also be more evenly distributed across the country, in line with the requirements of local markets. Finally, there is a need to improve schooling trajectories of children from immigrant families by avoiding ghettoising them
58 ❙ tHE Economic consEQuEncEs of tHE floW of rEfugEEs into BElgium ❙ nBB Economic review
in establishments with disadvantaged socio-economic backgrounds.
Rapid integration into the labour market is beneficial for future participation throughout a career. it is therefore im-portant to give asylum-seekers the right to work as quickly as possible. setting up a targeted support policy during the asylum application process, and again once refugee status has been granted, remains an essential instrument for help-ing these people. for immigrants in general, employment needs to be promoted in public services, as well as through the various forms of temporary contracts, insofar as they act as a springboard to a more stable job.
And lastly, social and anti-discrimination policies could be expanded. Diversity plans should be drawn up more
systematically, in close cooperation with the social part-ners. in order to encourage female employment, and more specifically help working mothers, parents could be better informed about childcare structures available for young children.
Belgium is having more difficulty than other EU countries in integrating the non-European immigrant population into its labour market. The current inflow of refugees has propelled this issue to the heart of current affairs and provides an opportunity to start a global rethink about the best policies for raising labour market participation among this under-represented group, and also for other groups of society with excessively low participation or employment rates, such as unskilled and young people, or the over-55s.
June 2016 ❙ tHE Economic consEQuEncEs of tHE floW of rEfugEEs into BElgium ❙ 59
Bibliography
Akgunduz Y. E., M. Van Den Berg and W. Hassink (2015), The impact of refugee crises on host labor markets : The case of the Syrian refugee crisis in Turkey, IZA, Discussion Paper 8841.
Andriessen I., E. Nievers, J. Dagevos and L. Faulk (2012), “Ethnic discrimination in the Dutch labor market : its relationship with job characteristics and multiple group membership”, Work and Occupations, 39(3), 237-269.
Arbeit C. A. and J. R. Warren. (2013), “Labor market penalties for foreign degrees among college educated immigrants”, Social Science Research, 42(3), 852-871.
Aslund O., L. Hensvi and O. N. Skans (2014), “Seeking similarity: How immigrants and natives manage in the labor market”, Journal of Labor Economics, 32(3), 405-441.
Baert S., B. Cockx, N. Gheyle and C. Vandamme (2013), Do employers discriminate less if vacancies are difficult to fill ? Evidence from a field experiment, IZA, Discussion Paper 7145.
Barrett A. and B. maître (2011), Immigrant welfare receipt across Europe, IZA, Discussion Paper 5515.
Bauer T., R. Flake and M. G. Sinning. (2011), Labor market effects of immigration : Evidence from neighborhood data, IZA, Discussion Paper 5707.
Beerli A. and G. Peri (2015), The labor market effects of opening the border : New evidence from Switzerland, nBEr, Working Paper 21319.
Blau F.D., L. M. Kahn and K. L. Papps (2011), “Gender, source country characteristics, and labor market assimilation among immigrants”, The Review of Economics and Statistics, 93(1), 43-58.
Blau f. D. and l. m. Kahn (2012), Immigration and the distribution of incomes, NBER, Working Paper 18515.
Brucker H. and E. J. Jahn (2011), “Migration and wage-setting : Reassessing the labor market effects of migration”, The Scandinavian Journal of Economics, 113(2), 286-317.
Cadena B. C. and B. K. Kovak (2013), Immigrants equilibrate local labor markets: Evidence from the Great Recession, NBER, Working Paper 19272.
caritas international (2014), Réfugié ch. Travail : Résultats d’une étude sur la formation et l’emploi menée auprès de réfugiés.
carlsson m. and D. o. rooth. (2008), Is it your foreign name or foreign qualifications? An experimental study of ethnic discrimination in hiring, IZA, Discussion Paper 3810.
CGRS (2015), Asylum Statistics, Monthly Report, December.
cohen A. and A. razin (2008), The skill composition of immigrants and the generosity of the welfare state : free vs. policy-controlled migration, NBER, Working Paper 14459.
corluy V. and g. Verbist (2014), Can education bridge the gap ? Education and the employment position of immigrants in Belgium, improvE Discussion paper 14 / 02.
cortes K.E. (2004), “Are refugees different from economic immigrants ? some empirical evidence on the heterogeneity of immigrant groups in the united states”, The Review of Economics and Statistics, 86(2), 465-480.
60 ❙ tHE Economic consEQuEncEs of tHE floW of rEfugEEs into BElgium ❙ nBB Economic review
De la Rica S., A. Glitz and F. Ortega (2013), Immigration in Europe: Trends, policies and empirical evidence, IZA, Discussion paper 7778.
Del Carpio C. W. and M. Wagner (2015), The impact of Syrian refugees on the Turkish labor market, World Bank Group, Policy Research Working Paper 7402.
Docquier F., C. Ozden and G. Peri (2014), “The labor market impact of immigration and emigration in OECD countries”, The Economic Journal, 124(579), 1106-1145.
Docquier F. and J. Machado (2015), Crise des réfugiés: quelques clarifications s’imposent !, ucl, regards économiques 119.
Dustmann c., t. frattini and i. preston (2008), The effect of immigration along the distribution of wages, centre for research and Analysis of migration (creAm), Department of Economics, university college london, Discussion Paper 0803.
Dustmann C. and T. Frattini (2014), “The fiscal effects of immigration to the UK”, The Economic Journal, 124(580), F593-F643.
EC (2015), European Economic Forecast, institutional paper 011, november.
Esipova n., J. ray and r. srinivasan (2011), The world’s potential migrants. Who they are, where they want to go, and why it matters, gallup inc, Washington Dc.
federal planning Bureau (2016), Perspectives démographiques, Afflux de réfugiés: hausse de la croissance démographique à court terme, Analyses et Prévisions économiques, press release dated 14 march.
Federal Public Service Employment, Labour and Social Dialogue (2015), Monitoring socio-économique : Marché du travail et origine, Centre interfédéral pour l’égalité des chances, Brussels, November.
feld s., m. nantcho and s. perin (2006), Educational factors in the economic integration of the foreign population in Belgium, European population conference.
Friedberg R. M. (2001), “The impact of mass migration on the Israeli labor market”, Quarterly Journal of Economics, 116(4), 1373-1408.
giulietti c. (2014), The welfare magnet hypothesis and the welfare take-up of migrants, IZA, World of Labor.
Glitz A. (2012), “The labor market impact of immigration: A quasi-experiment exploiting immigrant location rules in germany”, Journal of Labor Economics, 30(1), 175-213.
IMF (2015a), International migration: recent trends, economic impacts, and policy implications, Staff Background Paper for g20 surveillance note.
IMF (2015b), The refugee surge in Europe: Economic challenges, staff Discussion note.
izquierdo m., J. f. Jimeno and J. A. rojas (2010), “on the aggregate effects of immigration in spain”, SERIEs, 1(4), 409-432.
Jeanfils Ph. and K. Burggraeve (2005), Noname – A new quarterly model for Belgium, NBB, Working Paper 68.
Kaas L. and Manger C. (2011), “Ethnic discrimination in Germany’s labour market: A field experiment”, German Economic Review, 13(1), 1-20.
June 2016 ❙ tHE Economic consEQuEncEs of tHE floW of rEfugEEs into BElgium ❙ 61
Kahanec M. and K. F. Zimmermann (2008), Migration in an Enlarged EU: A Challenging Solution ?, IZA, Discussion Paper 3913.
Kerr s. p. and W. r. Kerr (2011), Economic Impacts of Immigration : A Survey, NBER, Working Paper 16736.
lemos s. and J. portes (2008), The impact of migration from the new European Union Member States on native workers, Working Paper 52, London, Department of Work and Pensions, Working Paper 52, Leeds, June.
OECD (2013), The fiscal impact of immigration in OECD countries, International Migration Outlook.
OECD (2015a), Is this humanitarian migration crisis different ?, migration policy Debates 7.
OECD (2015b), Economic Outlook.
OECD (2015c), : Settling in : OECD Indicators of immigrant integration.
Okkerse L. (2008), “How to measure labour market effects of immigration: A review”, Journal of Economic Surveys, 22(1), 1-30.
Oreopoulos P. (2011), “Why do skilled immigrants struggle in the labor market ? A field experiment with thirteen thousand resumes”, American Economic Journal, Economic Policy 3, 148-171.
Ottaviano G.I.P. and G. Peri, (2005), Rethinking the gains from immigration : theory and evidence from the u.s., nBEr, Working Paper 11672.
Ottaviano G.I.P. and G. Peri, (2012), “Rethinking the effect of immigration on wages”, Journal of the European Economic Association, 10(1), 152-197, February.
piracha m. and f. Vadean (2012), Migrant educational mismatch and the labour market, IZA, Discussion Paper 6414, Forschungsinstitut zur Zukunft der Arbeit,.
rea A. and m. martiniello (2012), Brève histoire de l’immigration en Belgique, fédération Wallonie-Bruxelles,December.
Rea A. and J. Wets (2015), La longue et sinueuse route menant à l’emploi, European Migration Network.
Riphahn R. T., M. Sander and C. Wunder (2013), “The welfare use of immigrants and natives in Germany : the case of Turkish immigrants”, International Journal of Manpower, 34(1), 70-82.
Rowthorn R. (2008), “The fiscal impact of immigration on advanced economies”, Oxford Review of Economic Policy, 24(3), 560-580.
shapiro, r. and J. Vellucci, (2010), The impact of immigration and immigration reform on the wages of American workers, new policy institute.
Smith C. L. (2012), “The impact of low-skilled immigration on the youth labor market”, Journal of Labor Economics, 30(1), 55-89.
Vargas-Silva C. (2015), The fiscal impact of immigration in the UK, the migration observatory at the university of oxford, may.
Zavodny M., and P. M. Orrenius (2006), Does immigration affect wages ? A look at occupation-level evidence, IZA, Bonn, Discussion paper 2481.
June 2016 ❙ intErnAl rEsourcEs, BAnK crEDit AnD otHEr funDing sourcEs : WHAt ArE tHE AltErnAtiVEs for BusinEssEs in BElgium ? ❙ 63
Internal resources, bank credit and other funding sources : what are the alternatives for businesses in Belgium ?
Ch. PietteM.-D. Zachary
introduction
In Belgium as elsewhere, the banking system plays a vital role in financing businesses. The banks enable them to obtain additional liquidity if they have a shortage, and more importantly, they often provide firms with the necessary funds to invest in new production capacity. Although the various forms of credit which the banks offer meet most firms’ needs, businesses often resort to other sources of funds.
One such source comprises internal financing, i.e. the part of the profits allocated to the capital at the end of each financial year. Some firms which are linked to Belgian or foreign groups may also obtain funds in the form of equity capital or inter-company loans from their parent or sister companies. companies operating autonomously and wanting to strengthen their financial basis have fewer options, but they too have alternatives to bank finance.
one of those alternatives consists in using household savings. To that end, firms can in theory issue shares or bonds, but recourse to this type of funding – which mainly concerns the largest companies – is generally very limited (1), either because of difficult access to the capital markets or, more simply, because it is considered unneces-sary in most cases. it is more common to obtain private funding from family and friends.
Apart from banks and households, other institutional sectors may also contribute to the financing of busi-nesses, such as insurance corporations and other types of
financial intermediaries, including private equity and ven-ture capital companies, and business angels. these inves-tors generally have a greater appetite for risk, so that the funding they offer is more accessible to firms proposing innovative projects which, though potentially very profit-able, have a more uncertain prospect of success.
These alternatives to bank credit, whether arranged via the financial markets or by private investment, are also of some relevance for financial stability, because greater diversification of funding sources would boost the resilience of the financial sector in the event of a major macroeconomic or financial shock, by strengthening the sector’s ability to provide funding for businesses. Conversely, excessive dependence on bank finance, as is currently still the case in Belgium and in other European countries, could prove harmful if credit institutions were obliged to consolidate their balance sheet to the detri-ment of their lending activities. This diversification of fund-ing sources is also one of the main objectives of the capital Markets Union project which the European Commission is currently working on and which aims, more generally, to reduce the financing costs of resident firms by lowering the barriers to cross-border investment within the union.
That is the backdrop to this article’s account of the situ-ation regarding Belgian firms’ use of the various internal or external financing instruments, and the factors which could influence their decisions on the subject. The first part of the article presents an overview of the struc-ture and funding sources of non-financial corporations.
(1) By way of illustration, only 7 firms joined Euronext or Alternext in 2015.
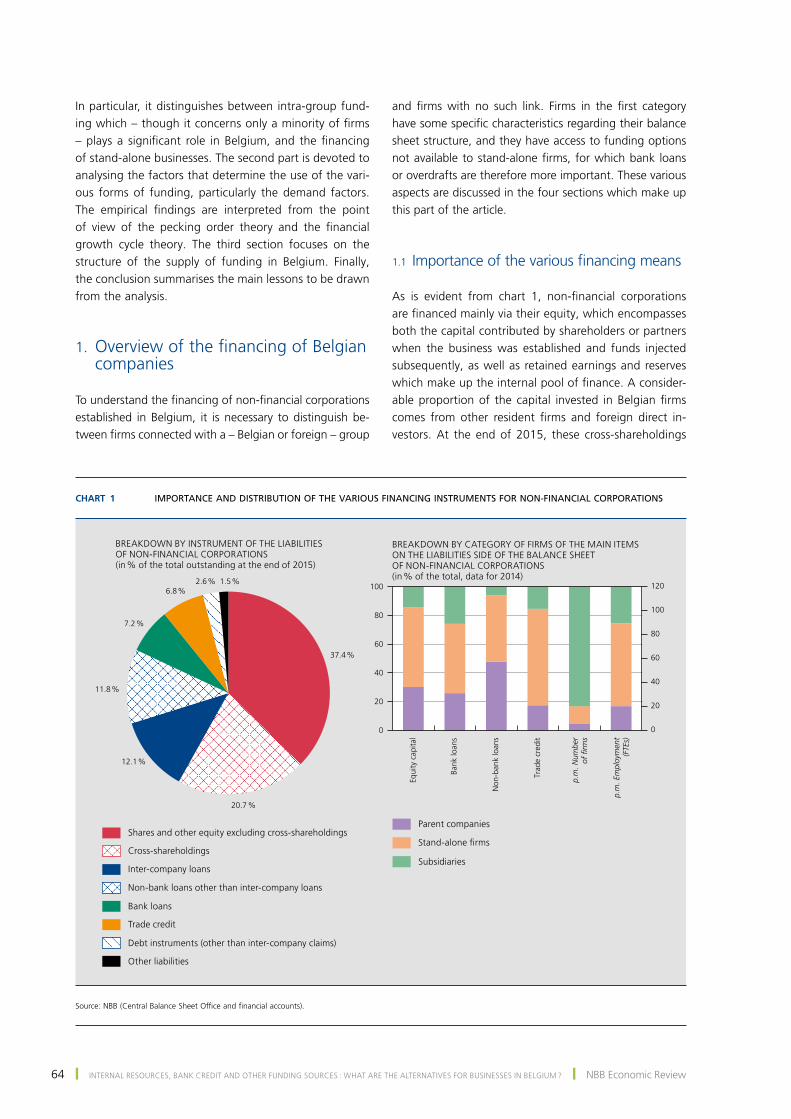
64 ❙ intErnAl rEsourcEs, BAnK crEDit AnD otHEr funDing sourcEs : WHAt ArE tHE AltErnAtiVEs for BusinEssEs in BElgium ? ❙ nBB Economic review
In particular, it distinguishes between intra-group fund-ing which – though it concerns only a minority of firms – plays a significant role in Belgium, and the financing of stand-alone businesses. the second part is devoted to analysing the factors that determine the use of the vari-ous forms of funding, particularly the demand factors. The empirical findings are interpreted from the point of view of the pecking order theory and the financial growth cycle theory. the third section focuses on the structure of the supply of funding in Belgium. finally, the conclusion summarises the main lessons to be drawn from the analysis.
1. Overview of the financing of Belgian companies
To understand the financing of non-financial corporations established in Belgium, it is necessary to distinguish be-tween firms connected with a – Belgian or foreign – group
and firms with no such link. Firms in the first category have some specific characteristics regarding their balance sheet structure, and they have access to funding options not available to stand-alone firms, for which bank loans or overdrafts are therefore more important. these various aspects are discussed in the four sections which make up this part of the article.
1.1 Importance of the various financing means
As is evident from chart 1, non-financial corporations are financed mainly via their equity, which encompasses both the capital contributed by shareholders or partners when the business was established and funds injected subsequently, as well as retained earnings and reserves which make up the internal pool of finance. A consider-able proportion of the capital invested in Belgian firms comes from other resident firms and foreign direct in-vestors. At the end of 2015, these cross-shareholdings
Chart 1 IMPORTANCE AND DISTRIBUTION OF THE VARIOUS FINANCING INSTRUMENTS FOR NON-FINANCIAL CORPORATIONS
0
20
40
60
80
100
0
20
40
60
80
100
120
Shares and other equity excluding cross‑shareholdings
Cross‑shareholdings
Inter‑company loans
Non‑bank loans other than inter‑company loans
Bank loans
BREAKDOWN BY INSTRUMENT OF THE LIABILITIES OF NON‑FINANCIAL CORPORATIONS(in % of the total outstanding at the end of 2015)
Trade credit
Debt instruments (other than inter-company claims)
Other liabilities
Equi
ty c
apita
l
Bank
loan
s
Non
‑ban
k lo
ans
Trad
e cr
edit
p.m
. Num
ber
of fi
rms
p.m
. Em
ploy
men
t(F
TEs)
BREAKDOWN BY CATEGORY OF FIRMS OF THE MAIN ITEMS ON THE LIABILITIES SIDE OF THE BALANCE SHEET OF NON‑FINANCIAL CORPORATIONS(in % of the total, data for 2014)
Parent companies
Stand-alone firms
Subsidiaries
37.4 %
20.7 %
12.1 %
11.8 %
7.2 %
6.8 %2.6 % 1.5 %
Source: NBB (Central Balance Sheet Office and financial accounts).
June 2016 ❙ intErnAl rEsourcEs, BAnK crEDit AnD otHEr funDing sourcEs : WHAt ArE tHE AltErnAtiVEs for BusinEssEs in BElgium ? ❙ 65
made up 20.7 % of the total liabilities of companies established in Belgium, while shares and other equity held directly by individuals or institutional investors rep-resented 37.4 %.
The other external funding consists largely of non-bank loans ; that also indicates the importance of intra-group financial links. Intra-group lending alone corresponds to 12.1 % of the total liabilities of non-financial corpora-tions. loans by other institutional sectors concern in particular subordinated or non-subordinated loans from insurance companies or specialist lenders (such as leas-ing companies), or advances received from individuals. in addition, there are trade debts which are equivalent to 6.8 % of the total liabilities. They relate mainly to the time allowed by suppliers for the payment of in-voices. For comparison, bank loans represented 7.2 % of firms’ liabilities.
1.2 firms forming part of a group and stand-alone firms : two different funding structures
The breakdown of the liabilities of non-financial cor-porations as represented in the left-hand panel of chart 1 conceals a very heavy concentration of amounts invested by means of these various instruments in a relatively small number of firms belonging to a group. It is estimated that those firms make up 17 % of the total number of non-financial corporations established in Belgium, concentrating 86 % of the total outstand-ing equity on the liabilities side of their balance sheet (1). Among firms belonging to a group, a distinction can be made between two categories, referred to in this article as “parent companies” and “subsidiaries”. parent companies are defined as Belgian firms with holdings in other firms, in Belgium itself or abroad, while not them-selves being owned, either directly or indirectly, by one or more other companies. Subsidiaries are firms owned (via direct or indirect shareholdings) either by parent companies established in Belgium or by foreign compa-nies (2). Other firms for which no shareholding link is re-corded are considered to be “stand-alone companies” (3). They make up the vast majority (83 %) of non-financial corporations established in Belgium.
parent companies and subsidiaries differ from stand-alone firms in their balance sheet structure – summarised in table 1 – which, in the case of the first two categories, re-flects the scale of the cross-shareholdings. From an overall perspective, the financial fixed assets of parent companies and subsidiaries – which include shareholdings in as-sociated firms and the loans made to them – represent
respectively 54.5 and 63.6 % of their assets. This balance sheet item corresponds to 15.2 % of the total assets of stand-alone companies ; it essentially concerns portfolio investments and miscellaneous claims. of course, cross-shareholding links within groups are also evident in the liabilities of the group companies, as the equity makes up 47.1 % of the balance sheet total of subsidiaries, com-pared to 39.1 % of the figure for stand-alone companies. The share of the equity is larger (52.2 %) in parent com-panies which, by definition, are positioned at the top of the ownership structures.
Another factor which makes the funding structure of groups different from that of stand-alone companies is the larger proportion of non-bank loans in the to-tal liabilities, that figure being higher for subsidiaries (21.3 %) than for parent companies (15.3 %). It is due mainly to inter-company loans received from parent companies or other subsidiaries in the same group, in some cases supplementing other types of non-bank loans such as subordinated loans or miscellaneous advances. The latter are likewise used by stand-alone firms, for which non-bank loans account for 8.8 % of the balance sheet total.
Despite the differences in funding structure, stand-alone companies are not necessarily less profitable than firms forming part of a group. they actually record a return on equity after tax (8.6 %) which is higher, on average, than the figures for parent companies (6.0 %) and subsidiaries (5.2 %). Moreover, their financial position is a little strong-er than that of subsidiaries. in particular, their liquidity ratio in the narrow sense is higher on average (1.3 com-pared to 1.1 for subsidiaries), and the same applies to the solvency ratio (40.5 % compared to 40.1 %). However, the solvency ratio of parent companies is stronger since it reflects their higher capitalisation.
The large proportion of equity and non-bank loans in firms belonging to a group, be they parent companies or subsidi-aries, may be due in part to the Belgian tax allowance for risk capital. Intended to replace the special scheme previ-ously applied to coordination centres, this scheme was first
(1) These estimates are based on annual accounts for 2014, the latest year covered by the Central Balance Sheet Office data at the time when this article was being prepared.
(2) Resident firms owned by foreign companies are identified via the results of the NBB’s direct investment survey.
(3) Certain firms which have received capital contributions from private equity or venture capital companies (including pricafs) or other investment companies are not regarded as part of a group. They are therefore classified as stand-alone companies (or as parent companies if they own shareholdings). the various investment companies are identified by the National Accounts Institute in its classification of institutional sectors. Also, some of the shares issued by certain listed companies may be owned by other companies without the latter holding a sufficient stake in their equity capital to control them. These shareholding links are also disregarded, and the listed companies concerned are included under parent companies or stand-alone companies, depending on whether or not they have subsidiaries.
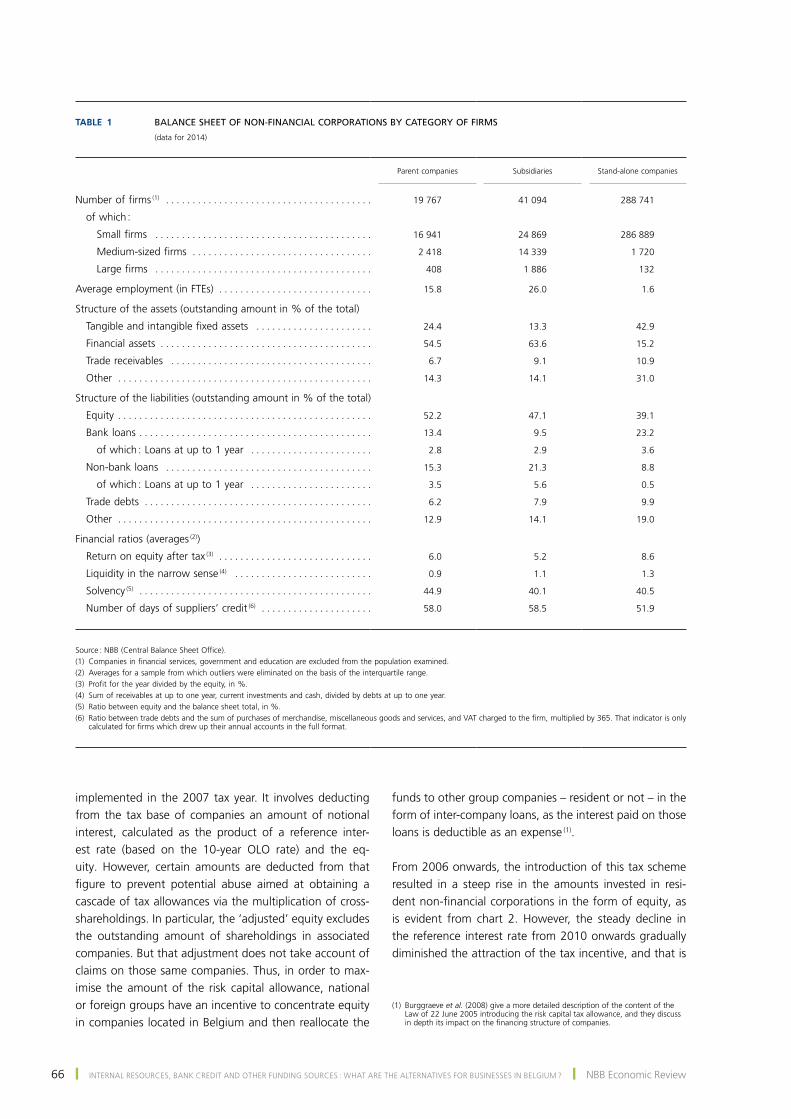
66 ❙ intErnAl rEsourcEs, BAnK crEDit AnD otHEr funDing sourcEs : WHAt ArE tHE AltErnAtiVEs for BusinEssEs in BElgium ? ❙ nBB Economic review
implemented in the 2007 tax year. It involves deducting from the tax base of companies an amount of notional interest, calculated as the product of a reference inter-est rate (based on the 10-year olo rate) and the eq-uity. However, certain amounts are deducted from that figure to prevent potential abuse aimed at obtaining a cascade of tax allowances via the multiplication of cross-shareholdings. In particular, the ‘adjusted’ equity excludes the outstanding amount of shareholdings in associated companies. But that adjustment does not take account of claims on those same companies. thus, in order to max-imise the amount of the risk capital allowance, national or foreign groups have an incentive to concentrate equity in companies located in Belgium and then reallocate the
funds to other group companies – resident or not – in the form of inter-company loans, as the interest paid on those loans is deductible as an expense (1).
From 2006 onwards, the introduction of this tax scheme resulted in a steep rise in the amounts invested in resi-dent non-financial corporations in the form of equity, as is evident from chart 2. However, the steady decline in the reference interest rate from 2010 onwards gradually diminished the attraction of the tax incentive, and that is
Table 1 BALANCE SHEET OF NON‑FINANCIAL CORPORATIONS BY CATEGORY OF FIRMS
(data for 2014)
Parent companies
Subsidiaries
Stand‑alone companies
Number of firms (1) . . . . . . . . . . . . . . . . . . . . . . . . . . . . . . . . . . . . . . . 19 767 41 094 288 741
of which :
Small firms . . . . . . . . . . . . . . . . . . . . . . . . . . . . . . . . . . . . . . . . . 16 941 24 869 286 889
Medium‑sized firms . . . . . . . . . . . . . . . . . . . . . . . . . . . . . . . . . . 2 418 14 339 1 720
Large firms . . . . . . . . . . . . . . . . . . . . . . . . . . . . . . . . . . . . . . . . . 408 1 886 132
Average employment (in FTEs) . . . . . . . . . . . . . . . . . . . . . . . . . . . . . 15.8 26.0 1.6
Structure of the assets (outstanding amount in % of the total)
Tangible and intangible fixed assets . . . . . . . . . . . . . . . . . . . . . . 24.4 13.3 42.9
Financial assets . . . . . . . . . . . . . . . . . . . . . . . . . . . . . . . . . . . . . . . . 54.5 63.6 15.2
Trade receivables . . . . . . . . . . . . . . . . . . . . . . . . . . . . . . . . . . . . . . 6.7 9.1 10.9
Other . . . . . . . . . . . . . . . . . . . . . . . . . . . . . . . . . . . . . . . . . . . . . . . . 14.3 14.1 31.0
Structure of the liabilities (outstanding amount in % of the total)
Equity . . . . . . . . . . . . . . . . . . . . . . . . . . . . . . . . . . . . . . . . . . . . . . . . 52.2 47.1 39.1
Bank loans . . . . . . . . . . . . . . . . . . . . . . . . . . . . . . . . . . . . . . . . . . . . 13.4 9.5 23.2
of which : Loans at up to 1 year . . . . . . . . . . . . . . . . . . . . . . . 2.8 2.9 3.6
Non‑bank loans . . . . . . . . . . . . . . . . . . . . . . . . . . . . . . . . . . . . . . . 15.3 21.3 8.8
of which : Loans at up to 1 year . . . . . . . . . . . . . . . . . . . . . . . 3.5 5.6 0.5
Trade debts . . . . . . . . . . . . . . . . . . . . . . . . . . . . . . . . . . . . . . . . . . . 6.2 7.9 9.9
Other . . . . . . . . . . . . . . . . . . . . . . . . . . . . . . . . . . . . . . . . . . . . . . . . 12.9 14.1 19.0
Financial ratios (averages (2))
Return on equity after tax (3) . . . . . . . . . . . . . . . . . . . . . . . . . . . . . 6.0 5.2 8.6
Liquidity in the narrow sense (4) . . . . . . . . . . . . . . . . . . . . . . . . . . 0.9 1.1 1.3
Solvency (5) . . . . . . . . . . . . . . . . . . . . . . . . . . . . . . . . . . . . . . . . . . . . 44.9 40.1 40.5
Number of days of suppliers’ credit (6) . . . . . . . . . . . . . . . . . . . . . 58.0 58.5 51.9
Source : NBB (Central Balance Sheet Office).(1) Companies in financial services, government and education are excluded from the population examined.(2) Averages for a sample from which outliers were eliminated on the basis of the interquartile range.(3) Profit for the year divided by the equity, in %.(4) Sum of receivables at up to one year, current investments and cash, divided by debts at up to one year.(5) Ratio between equity and the balance sheet total, in %.(6) Ratio between trade debts and the sum of purchases of merchandise, miscellaneous goods and services, and VAT charged to the firm, multiplied by 365. That indicator is only
calculated for firms which drew up their annual accounts in the full format.
(1) Burggraeve et al. (2008) give a more detailed description of the content of the Law of 22 June 2005 introducing the risk capital tax allowance, and they discuss in depth its impact on the financing structure of companies.
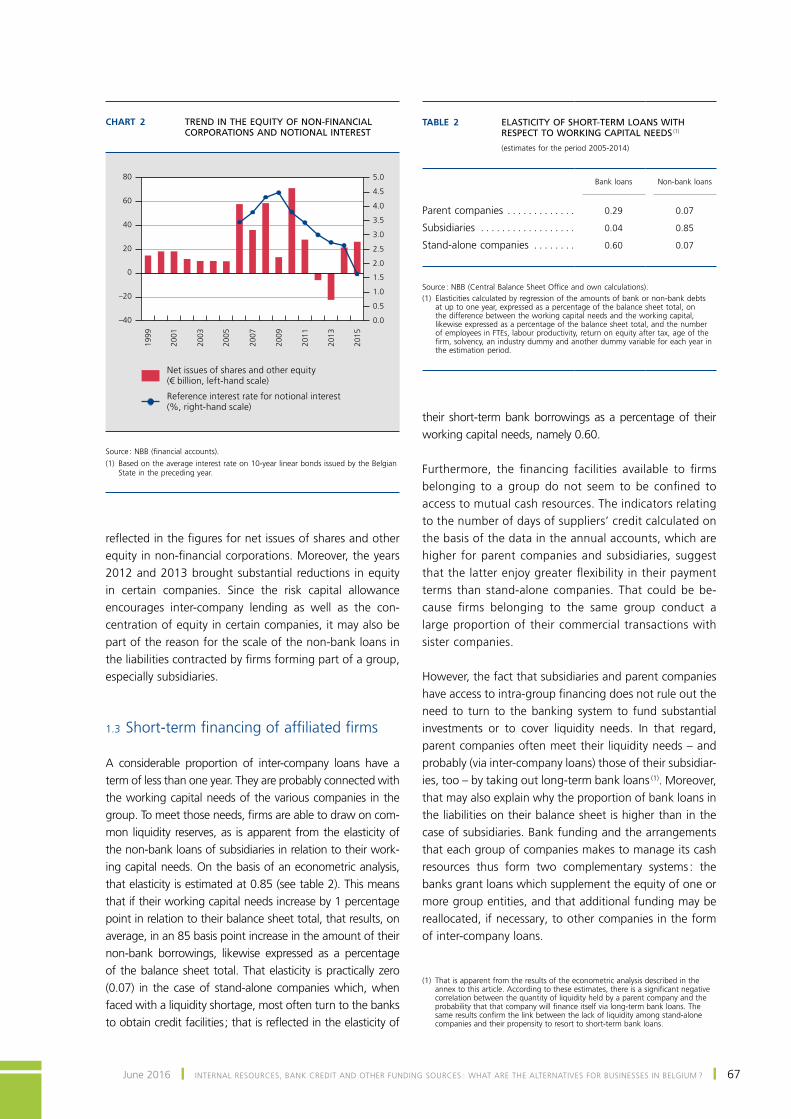
June 2016 ❙ intErnAl rEsourcEs, BAnK crEDit AnD otHEr funDing sourcEs : WHAt ArE tHE AltErnAtiVEs for BusinEssEs in BElgium ? ❙ 67
reflected in the figures for net issues of shares and other equity in non-financial corporations. Moreover, the years 2012 and 2013 brought substantial reductions in equity in certain companies. Since the risk capital allowance encourages inter-company lending as well as the con-centration of equity in certain companies, it may also be part of the reason for the scale of the non-bank loans in the liabilities contracted by firms forming part of a group, especially subsidiaries.
1.3 Short-term financing of affiliated firms
A considerable proportion of inter-company loans have a term of less than one year. they are probably connected with the working capital needs of the various companies in the group. To meet those needs, firms are able to draw on com-mon liquidity reserves, as is apparent from the elasticity of the non-bank loans of subsidiaries in relation to their work-ing capital needs. on the basis of an econometric analysis, that elasticity is estimated at 0.85 (see table 2). This means that if their working capital needs increase by 1 percentage point in relation to their balance sheet total, that results, on average, in an 85 basis point increase in the amount of their non-bank borrowings, likewise expressed as a percentage of the balance sheet total. that elasticity is practically zero (0.07) in the case of stand-alone companies which, when faced with a liquidity shortage, most often turn to the banks to obtain credit facilities ; that is reflected in the elasticity of
their short-term bank borrowings as a percentage of their working capital needs, namely 0.60.
Furthermore, the financing facilities available to firms belonging to a group do not seem to be confined to access to mutual cash resources. the indicators relating to the number of days of suppliers’ credit calculated on the basis of the data in the annual accounts, which are higher for parent companies and subsidiaries, suggest that the latter enjoy greater flexibility in their payment terms than stand-alone companies. that could be be-cause firms belonging to the same group conduct a large proportion of their commercial transactions with sister companies.
However, the fact that subsidiaries and parent companies have access to intra-group financing does not rule out the need to turn to the banking system to fund substantial investments or to cover liquidity needs. in that regard, parent companies often meet their liquidity needs – and probably (via inter-company loans) those of their subsidiar-ies, too – by taking out long-term bank loans (1). moreover, that may also explain why the proportion of bank loans in the liabilities on their balance sheet is higher than in the case of subsidiaries. Bank funding and the arrangements that each group of companies makes to manage its cash resources thus form two complementary systems : the banks grant loans which supplement the equity of one or more group entities, and that additional funding may be reallocated, if necessary, to other companies in the form of inter-company loans.
Chart 2 TREND IN THE EQUITY OF NON-FINANCIAL CORPORATIONS AND NOTIONAL INTEREST
1999
2001
2003
2005
2007
2009
2011
2013
2015
–40
–20
0
20
40
60
80
Net issues of shares and other equity (€ billion, left‑hand scale)
Reference interest rate for notional interest(%, right‑hand scale)
0.0
0.5
1.0
1.5
2.0
2.5
3.0
3.5
4.0
4.5
5.0
Source : NBB (financial accounts).(1) Based on the average interest rate on 10-year linear bonds issued by the Belgian
state in the preceding year.
Table 2 ELASTICITY OF SHORT‑TERM LOANS WITH RESPECT TO WORKING CAPITAL NEEDS (1)
(estimates for the period 2005‑2014)
Bank loans
Non‑bank loans
Parent companies . . . . . . . . . . . . . 0.29 0.07
Subsidiaries . . . . . . . . . . . . . . . . . . 0.04 0.85
Stand‑alone companies . . . . . . . . 0.60 0.07
Source : NBB (Central Balance Sheet Office and own calculations).(1) Elasticities calculated by regression of the amounts of bank or non‑bank debts
at up to one year, expressed as a percentage of the balance sheet total, on the difference between the working capital needs and the working capital, likewise expressed as a percentage of the balance sheet total, and the number of employees in FTEs, labour productivity, return on equity after tax, age of the firm, solvency, an industry dummy and another dummy variable for each year in the estimation period.
(1) that is apparent from the results of the econometric analysis described in the annex to this article. According to these estimates, there is a significant negative correlation between the quantity of liquidity held by a parent company and the probability that that company will finance itself via long-term bank loans. The same results confirm the link between the lack of liquidity among stand-alone companies and their propensity to resort to short-term bank loans.
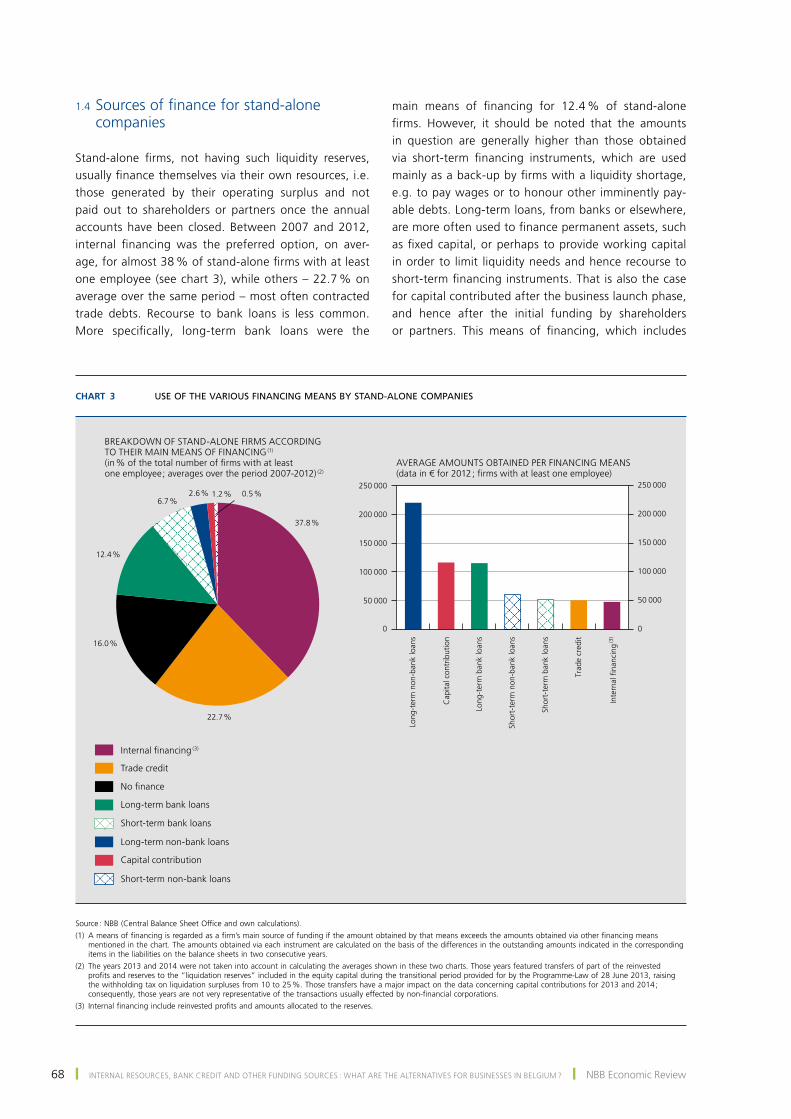
68 ❙ intErnAl rEsourcEs, BAnK crEDit AnD otHEr funDing sourcEs : WHAt ArE tHE AltErnAtiVEs for BusinEssEs in BElgium ? ❙ nBB Economic review
1.4 Sources of finance for stand-alone companies
Stand-alone firms, not having such liquidity reserves, usually finance themselves via their own resources, i.e. those generated by their operating surplus and not paid out to shareholders or partners once the annual accounts have been closed. Between 2007 and 2012, internal financing was the preferred option, on aver-age, for almost 38 % of stand-alone firms with at least one employee (see chart 3), while others – 22.7 % on average over the same period – most often contracted trade debts. Recourse to bank loans is less common. More specifically, long-term bank loans were the
main means of financing for 12.4 % of stand-alone firms. However, it should be noted that the amounts in question are generally higher than those obtained via short-term financing instruments, which are used mainly as a back-up by firms with a liquidity shortage, e.g. to pay wages or to honour other imminently pay-able debts. Long-term loans, from banks or elsewhere, are more often used to finance permanent assets, such as fixed capital, or perhaps to provide working capital in order to limit liquidity needs and hence recourse to short-term financing instruments. That is also the case for capital contributed after the business launch phase, and hence after the initial funding by shareholders or partners. This means of financing, which includes
Chart 3 USE OF THE VARIOUS FINANCING MEANS BY STAND-ALONE COMPANIES
0
50 000
100 000
150 000
200 000
250 000
0
50 000
100 000
150 000
200 000
250 000
Internal financing (3)
Trade credit
No finance
Long‑term bank loans
Short‑term bank loans
BREAKDOWN OF STAND‑ALONE FIRMS ACCORDING TO THEIR MAIN MEANS OF FINANCING
(1)
(in % of the total number of firms with at least one employee ; averages over the period 2007‑2012)
(2)
Long‑term non‑bank loans
Capital contribution
Short‑term non‑bank loans
Long
‑ter
m n
on‑b
ank
loan
s
Cap
ital c
ontr
ibut
ion
Long
‑ter
m b
ank
loan
s
Shor
t‑te
rm n
on‑b
ank
loan
s
Shor
t‑te
rm b
ank
loan
s
Trad
e cr
edit
Inte
rnal
fina
ncin
g (3
)
AVERAGE AMOUNTS OBTAINED PER FINANCING MEANS(data in € for 2012 ; firms with at least one employee)
37.8 %
22.7 %
16.0 %
12.4 %
6.7 %2.6 % 1.2 % 0.5 %
Source : NBB (Central Balance Sheet Office and own calculations).(1) A means of financing is regarded as a firm’s main source of funding if the amount obtained by that means exceeds the amounts obtained via other financing means
mentioned in the chart. the amounts obtained via each instrument are calculated on the basis of the differences in the outstanding amounts indicated in the corresponding items in the liabilities on the balance sheets in two consecutive years.
(2) The years 2013 and 2014 were not taken into account in calculating the averages shown in these two charts. Those years featured transfers of part of the reinvested profits and reserves to the “liquidation reserves” included in the equity capital during the transitional period provided for by the Programme-Law of 28 June 2013, raising the withholding tax on liquidation surpluses from 10 to 25 %. Those transfers have a major impact on the data concerning capital contributions for 2013 and 2014 ; consequently, those years are not very representative of the transactions usually effected by non-financial corporations.
(3) Internal financing include reinvested profits and amounts allocated to the reserves.
June 2016 ❙ intErnAl rEsourcEs, BAnK crEDit AnD otHEr funDing sourcEs : WHAt ArE tHE AltErnAtiVEs for BusinEssEs in BElgium ? ❙ 69
equity investment by private equity and venture capital companies to make up for any shortage of capital held by individuals, is nevertheless uncommon.
2. Determinants of the financing means used by firms
The data on stand-alone firms presented in the previous section suggest that there is a hierarchy among the vari-ous financing means used by firms, or at least a prefer-ence for some of them. the economic literature on the financing structure of firms may explain this picture and is briefly reviewed in the following sections. After that, the financing choices of stand-alone companies are examined in the light of the annual accounts data, with the aid of an econometric model.
2.1 Theoretical framework : pecking order and financial growth cycle
The hierarchy of financing instruments revealed by the data on stand-alone companies is very consistent with the pecking order theory pioneered by Myers (1984), which presents arguments for an order of preference for corpo-rate financing means on the basis of the agency theory, asymmetric information and the signalling theory (1). it also tallies particularly well with the financial growth cycle theory, which postulates that the financing means available to firms vary according to the firms’ stage of development. These two theoretical models are briefly described below.
2.1.1 Pecking order theory
The general idea of the pecking order theory is that firms prefer self-financing in order to avoid transferring or diluting the ownership of the business, divulging crucial information to third parties, having to be accountable to the market or pay excessive transaction costs. If the funding needed for profitable investments is beyond the scope of internal financing, they opt for external financ-ing. in that case, they prefer to use debt (bond issuance, or more generally, recourse to loans) rather than a capital increase, in view of the possible transfer of rights and information entailed in each of the two means, and the transaction costs.
The preference for internal financing is due primarily to the desire of entrepreneurs (especially owner / manag-ers) to keep control of their company. That is why they are very reluctant to accept new shareholders, and try to find the capital they need for their business from internal
funding. If that is insufficient, managers will tend to choose funding sources that do not entail any restriction on control : first, short-term debt requiring no collateral and not subject to any conditions, then longer-term debt and finally share issuance.
The economic literature confirms that the ownership structure influences the type of financing (Mac an Bhaird and lucey, 2010 ; ferrando and griesshaber, 2011). When business owners have family ties or similar connections, or where a sole proprietor is concerned, the company is less likely to choose external financing, particularly where the funding implies a loss of control of the business. Companies which are not part of a group likewise use more flexible instruments in general, in an effort to avoid any loss of control.
The use of internal financing also costs less than addi-tional debt, which is in turn less expensive than issuing new shares. the existence of transaction costs that vary according to the funding source used is another reason for the hierarchy in the financing choices of stand-alone companies. moreover, those costs reveal the limited ac-cess of SMEs to the capital markets, resulting in a funding gap for those firms. That funding gap can be divided into two components : a supply deficit (too little fund-ing or excessive costs) and a knowledge deficit, as SME managers are generally less aware of all the external financing options and their characteristics (Sánchez-Vidal and Martín-Ugedo, 2005). Consequently, the main source of long-term financing consists of internal funds and, if necessary, bank loans.
According to the pecking order, debt is preferred to a capital increase, not only because of the lower costs involved but also because recourse to borrowing is seen as indicating that the manager is confident of the company’s ability to honour its debts and avoid bankruptcy. The markets interpret that as a positive sign, so that it boosts the company’s share price or the value of the business. conversely, a capital increase triggers a fall in the share price or the value of the business because the information asymmetry between the managers – who act in the interest of the current shareholders (often the same people in the case of stand-alone smEs) – and external investors implies that the company arranging a capital increase has to pay a high enough risk premium to attract new capital and cope with the risks associated with funding industrial
(1) This theory drew on the work carried out by Jensen and Meckling (1976) on the agency theory, by myers and majluf (1984) on information asymmetries, and by ross (1977) on the signalling theory. Although the theory was originally developed for listed companies, it is also well documented for smEs in numerous international studies (for a review of this literature, see Domenichelli (2008), and Watson and Wilson (2002)).
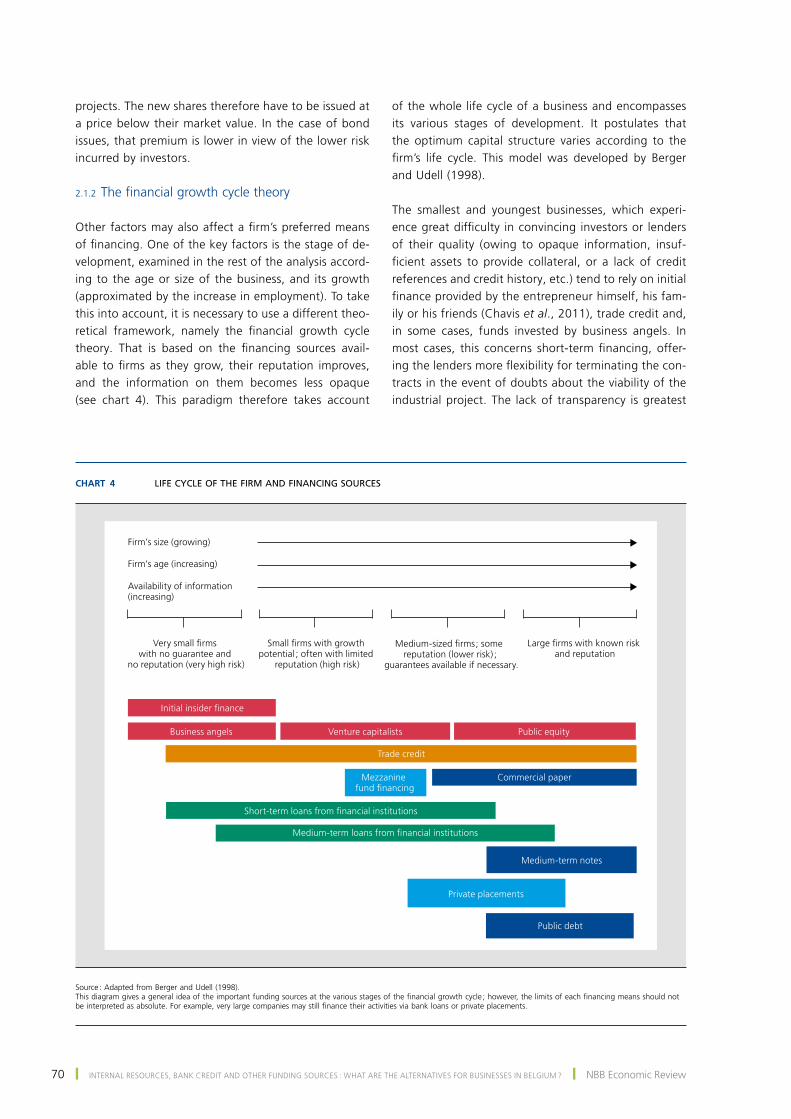
70 ❙ intErnAl rEsourcEs, BAnK crEDit AnD otHEr funDing sourcEs : WHAt ArE tHE AltErnAtiVEs for BusinEssEs in BElgium ? ❙ nBB Economic review
projects. the new shares therefore have to be issued at a price below their market value. In the case of bond issues, that premium is lower in view of the lower risk incurred by investors.
2.1.2 The financial growth cycle theory
Other factors may also affect a firm’s preferred means of financing. One of the key factors is the stage of de-velopment, examined in the rest of the analysis accord-ing to the age or size of the business, and its growth (approximated by the increase in employment). To take this into account, it is necessary to use a different theo-retical framework, namely the financial growth cycle theory. That is based on the financing sources avail-able to firms as they grow, their reputation improves, and the information on them becomes less opaque (see chart 4). This paradigm therefore takes account
of the whole life cycle of a business and encompasses its various stages of development. it postulates that the optimum capital structure varies according to the firm’s life cycle. This model was developed by Berger and udell (1998).
the smallest and youngest businesses, which experi-ence great difficulty in convincing investors or lenders of their quality (owing to opaque information, insuf-ficient assets to provide collateral, or a lack of credit references and credit history, etc.) tend to rely on initial finance provided by the entrepreneur himself, his fam-ily or his friends (chavis et al., 2011), trade credit and, in some cases, funds invested by business angels. in most cases, this concerns short-term financing, offer-ing the lenders more flexibility for terminating the con-tracts in the event of doubts about the viability of the industrial project. The lack of transparency is greatest
Chart 4 LIFE CYCLE OF THE FIRM AND FINANCING SOURCES
u
u
u
Firm’s size (growing)
Firm’s age (increasing)
Availability of information (increasing)
Very small firms with no guarantee and
no reputation (very high risk)
Small firms with growth potential ; often with limited
reputation (high risk)
Medium-sized firms ; some reputation (lower risk) ;
guarantees available if necessary.
Large firms with known risk and reputation
Initial insider finance
Business angels Venture capitalists Public equity
Trade credit
Mezzanine fund financing
Commercial paper
Short-term loans from financial institutions
Medium-term loans from financial institutions
Medium-term notes
Private placements
Public debt
source : Adapted from Berger and udell (1998). This diagram gives a general idea of the important funding sources at the various stages of the financial growth cycle ; however, the limits of each financing means should not be interpreted as absolute. For example, very large companies may still finance their activities via bank loans or private placements.
June 2016 ❙ intErnAl rEsourcEs, BAnK crEDit AnD otHEr funDing sourcEs : WHAt ArE tHE AltErnAtiVEs for BusinEssEs in BElgium ? ❙ 71
for small, young businesses, making lenders reluctant to grant them long-term financing. For that type of capital, smEs can turn to operators with expertise in private equity.
As the business grows and its reputation increases, it begins to gain access to medium-term financing sources (shares and debt). At this stage, financing via equity obtained from venture capitalists may become an op-tion, but in most cases the funds are supplied by banks or other types of financial intermediaries. In particular, fast-growing businesses whose internal resources are insufficient to fund their activities make proportionately greater use of external financing, though the type of financing will of course also depend on their age and size. They will also raise finance from a wider range of instruments than other firms, and will form a target group for venture capitalists, attracted by the prospect of healthy returns. As businesses grow older and expand, the accumulated retained earnings may also become a substantial source of funding (in particular, lópez-gracia and Aybar-Arias (2000) show that the largest firms have a higher level of self-financing), while providing a perfor-mance guarantee for any lenders. furthermore, if their profitability is increasing, firms have greater scope for internal financing. They can then replace long-term debt with self-financing, short-term debt and trade credit ; that enables them to reduce their debt leverage and make their financing more flexible.
For the biggest firms which are more mature and have an established reputation in terms of credit history or other forms of financing, participation in the capital markets (shares and bonds) becomes an option. These firms also retain the option of using financing sources which are likewise accessible to younger firms (except for business angels and venture capitalists, who specialise in the early stages of a firm’s development) and can therefore increase the diversity of their financing.
According to this typology, firms at a very early stage in their development (start-ups) therefore cannot gener-ally resort to bank financing. Only when their business has been properly launched and they have attained a certain level of tangible assets can companies gain access to external borrowing, particularly bank loans. During their growth phase, firms may make successive use of business angels, private equity and bank loans or other funding.
Finally, other factors influencing the financing struc-ture of firms, factors not directly mentioned in the two theories outlined above but often cited in the economic literature, are relevant variables. first, the sector in which
a firm operates has a direct influence on the accessible finance. Capital-intensive sectors have more fixed assets which can be used as collateral to obtain long-term fi-nance, such as bank loans or leasing. Conversely, sectors requiring substantial working capital will make more use of short-term financing and trade-related credit (Degryse et al., 2012).
next, it is appropriate to mention the special case of in-novative firms which, for investors, are associated with a higher risk and a greater lack of transparent informa-tion ; they therefore face tougher financing constraints. Furthermore, lending to such firms is also riskier in the absence of assets to be used as collateral. recourse to external capital is therefore more expensive, and they are generally more likely to opt for self-financing. If they need external funding, they can apply to specialist operators such as venture capitalists or private equity investors, who are better able to manage the risks as-sociated with information asymmetry and moral hazard (Cosh et al., 2009). Subsidised loans or loans backed by a government agency are also an option for them.
2.2 Empirical analysis : choice of financing means by stand-alone companies
the effects of these various determinants on the choice of financing means by Belgian firms were measured on the basis of an econometric analysis of the data available at the Central Balance Sheet Office. The methodology used for that purpose, based on the es-timation of a “multinomial logit” model, is described in detail in the annex to this article. in essence, the approach adopted permits assessment of the degree to which a firm’s particular characteristic may cause the firm to prefer a specific means of financing (1). Various characteristics were taken into account in the analysis provided they could be quantified by means of the information available in the annual accounts. some of the variables included in the model, namely the firms’ age, size and growth, are indicators of their stage of development, while others, such as profitability, liquid-ity, solvency or the presence of government guaran-tees covering part of the existing debts, were included to take account of effects relating to financial health and certain specific financing needs. That applies, for example to the liquidity ratio, which may reflect the existence of a short-term funding need. similarly, long-term funding needs are taken into account by means of dummy variables indicating whether, at a
(1) As in the previous section (see chart 3), this concerns the financing means by which the firm obtained the bulk of its funding in a given financial year.
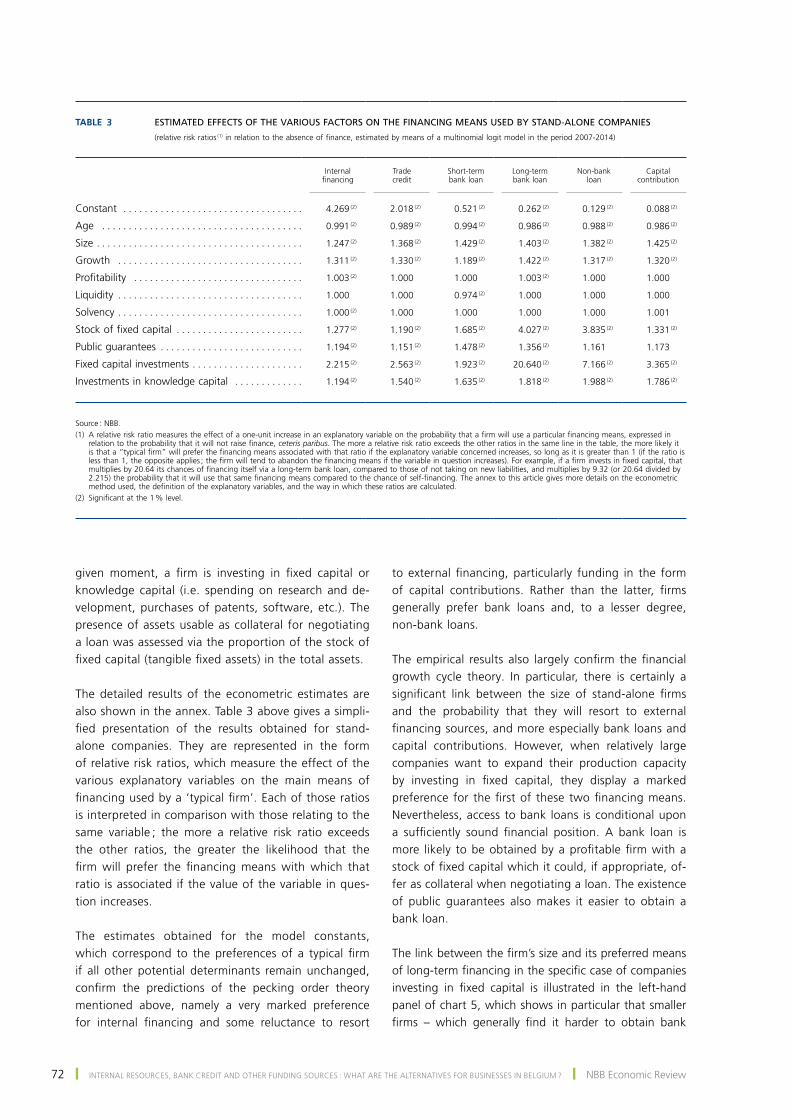
72 ❙ intErnAl rEsourcEs, BAnK crEDit AnD otHEr funDing sourcEs : WHAt ArE tHE AltErnAtiVEs for BusinEssEs in BElgium ? ❙ nBB Economic review
given moment, a firm is investing in fixed capital or knowledge capital (i.e. spending on research and de-velopment, purchases of patents, software, etc.). the presence of assets usable as collateral for negotiating a loan was assessed via the proportion of the stock of fixed capital (tangible fixed assets) in the total assets.
the detailed results of the econometric estimates are also shown in the annex. Table 3 above gives a simpli-fied presentation of the results obtained for stand-alone companies. they are represented in the form of relative risk ratios, which measure the effect of the various explanatory variables on the main means of financing used by a ‘typical firm’. Each of those ratios is interpreted in comparison with those relating to the same variable ; the more a relative risk ratio exceeds the other ratios, the greater the likelihood that the firm will prefer the financing means with which that ratio is associated if the value of the variable in ques-tion increases.
the estimates obtained for the model constants, which correspond to the preferences of a typical firm if all other potential determinants remain unchanged, confirm the predictions of the pecking order theory mentioned above, namely a very marked preference for internal financing and some reluctance to resort
to external financing, particularly funding in the form of capital contributions. Rather than the latter, firms generally prefer bank loans and, to a lesser degree, non-bank loans.
The empirical results also largely confirm the financial growth cycle theory. in particular, there is certainly a significant link between the size of stand-alone firms and the probability that they will resort to external financing sources, and more especially bank loans and capital contributions. However, when relatively large companies want to expand their production capacity by investing in fixed capital, they display a marked preference for the first of these two financing means. Nevertheless, access to bank loans is conditional upon a sufficiently sound financial position. A bank loan is more likely to be obtained by a profitable firm with a stock of fixed capital which it could, if appropriate, of-fer as collateral when negotiating a loan. the existence of public guarantees also makes it easier to obtain a bank loan.
The link between the firm’s size and its preferred means of long-term financing in the specific case of companies investing in fixed capital is illustrated in the left-hand panel of chart 5, which shows in particular that smaller firms – which generally find it harder to obtain bank
Table 3 ESTIMATED EFFECTS OF THE VARIOUS FACTORS ON THE FINANCING MEANS USED BY STAND‑ALONE COMPANIES
(relative risk ratios (1) in relation to the absence of finance, estimated by means of a multinomial logit model in the period 2007‑2014)
Internal financing
Trade credit
Short‑term bank loan
Long‑term bank loan
Non‑bank loan
Capital contribution
Constant . . . . . . . . . . . . . . . . . . . . . . . . . . . . . . . . . . 4.269 (2) 2.018 (2) 0.521 (2) 0.262 (2) 0.129 (2) 0.088 (2)
Age . . . . . . . . . . . . . . . . . . . . . . . . . . . . . . . . . . . . . . 0.991 (2) 0.989 (2) 0.994 (2) 0.986 (2) 0.988 (2) 0.986 (2)
Size . . . . . . . . . . . . . . . . . . . . . . . . . . . . . . . . . . . . . . . 1.247 (2) 1.368 (2) 1.429 (2) 1.403 (2) 1.382 (2) 1.425 (2)
Growth . . . . . . . . . . . . . . . . . . . . . . . . . . . . . . . . . . . 1.311 (2) 1.330 (2) 1.189 (2) 1.422 (2) 1.317 (2) 1.320 (2)
Profitability . . . . . . . . . . . . . . . . . . . . . . . . . . . . . . . . 1.003 (2) 1.000 1.000 1.003 (2) 1.000 1.000
Liquidity . . . . . . . . . . . . . . . . . . . . . . . . . . . . . . . . . . . 1.000 1.000 0.974 (2) 1.000 1.000 1.000
Solvency . . . . . . . . . . . . . . . . . . . . . . . . . . . . . . . . . . . 1.000 (2) 1.000 1.000 1.000 1.000 1.001
Stock of fixed capital . . . . . . . . . . . . . . . . . . . . . . . . 1.277 (2) 1.190 (2) 1.685 (2) 4.027 (2) 3.835 (2) 1.331 (2)
Public guarantees . . . . . . . . . . . . . . . . . . . . . . . . . . . 1.194 (2) 1.151 (2) 1.478 (2) 1.356 (2) 1.161 1.173
Fixed capital investments . . . . . . . . . . . . . . . . . . . . . 2.215 (2) 2.563 (2) 1.923 (2) 20.640 (2) 7.166 (2) 3.365 (2)
Investments in knowledge capital . . . . . . . . . . . . . 1.194 (2) 1.540 (2) 1.635 (2) 1.818 (2) 1.988 (2) 1.786 (2)
Source : NBB.(1) A relative risk ratio measures the effect of a one‑unit increase in an explanatory variable on the probability that a firm will use a particular financing means, expressed in
relation to the probability that it will not raise finance, ceteris paribus. The more a relative risk ratio exceeds the other ratios in the same line in the table, the more likely it is that a “typical firm” will prefer the financing means associated with that ratio if the explanatory variable concerned increases, so long as it is greater than 1 (if the ratio is less than 1, the opposite applies ; the firm will tend to abandon the financing means if the variable in question increases). For example, if a firm invests in fixed capital, that multiplies by 20.64 its chances of financing itself via a long‑term bank loan, compared to those of not taking on new liabilities, and multiplies by 9.32 (or 20.64 divided by 2.215) the probability that it will use that same financing means compared to the chance of self‑financing. The annex to this article gives more details on the econometric method used, the definition of the explanatory variables, and the way in which these ratios are calculated.
(2) Significant at the 1 % level.
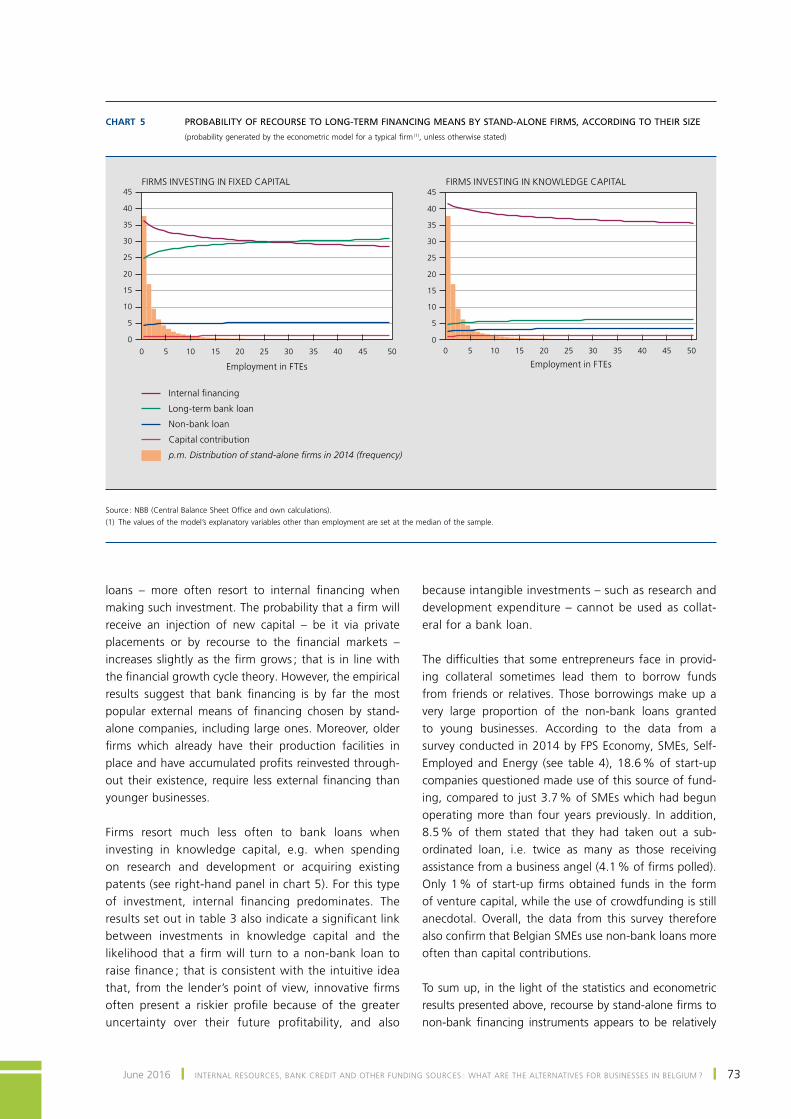
June 2016 ❙ intErnAl rEsourcEs, BAnK crEDit AnD otHEr funDing sourcEs : WHAt ArE tHE AltErnAtiVEs for BusinEssEs in BElgium ? ❙ 73
loans – more often resort to internal financing when making such investment. The probability that a firm will receive an injection of new capital – be it via private placements or by recourse to the financial markets – increases slightly as the firm grows ; that is in line with the financial growth cycle theory. However, the empirical results suggest that bank financing is by far the most popular external means of financing chosen by stand-alone companies, including large ones. moreover, older firms which already have their production facilities in place and have accumulated profits reinvested through-out their existence, require less external financing than younger businesses.
Firms resort much less often to bank loans when investing in knowledge capital, e.g. when spending on research and development or acquiring existing patents (see right-hand panel in chart 5). For this type of investment, internal financing predominates. The results set out in table 3 also indicate a significant link between investments in knowledge capital and the likelihood that a firm will turn to a non-bank loan to raise finance ; that is consistent with the intuitive idea that, from the lender’s point of view, innovative firms often present a riskier profile because of the greater uncertainty over their future profitability, and also
because intangible investments – such as research and development expenditure – cannot be used as collat-eral for a bank loan.
The difficulties that some entrepreneurs face in provid-ing collateral sometimes lead them to borrow funds from friends or relatives. Those borrowings make up a very large proportion of the non-bank loans granted to young businesses. According to the data from a survey conducted in 2014 by FPS Economy, SMEs, Self-Employed and Energy (see table 4), 18.6 % of start-up companies questioned made use of this source of fund-ing, compared to just 3.7 % of SMEs which had begun operating more than four years previously. in addition, 8.5 % of them stated that they had taken out a sub-ordinated loan, i.e. twice as many as those receiving assistance from a business angel (4.1 % of firms polled). Only 1 % of start-up firms obtained funds in the form of venture capital, while the use of crowdfunding is still anecdotal. overall, the data from this survey therefore also confirm that Belgian SMEs use non-bank loans more often than capital contributions.
to sum up, in the light of the statistics and econometric results presented above, recourse by stand-alone firms to non-bank financing instruments appears to be relatively
Chart 5 PROBABILITY OF RECOURSE TO LONG-TERM FINANCING MEANS BY STAND-ALONE FIRMS, ACCORDING TO THEIR SIZE
(probability generated by the econometric model for a typical firm (1), unless otherwise stated)
1050 15 20 25 30 35 40 45 500
5
10
15
20
25
30
35
40
45
1050 15 20 25 30 35 40 45 500
5
10
15
20
25
30
35
40
45
p.m. Distribution of stand-alone firms in 2014 (frequency)
Long‑term bank loan
Non‑bank loan
Internal financing
Capital contribution
FIRMS INVESTING IN FIXED CAPITAL
Employment in FTEs
FIRMS INVESTING IN KNOWLEDGE CAPITAL
Employment in FTEs
Source : NBB (Central Balance Sheet Office and own calculations).(1) The values of the model’s explanatory variables other than employment are set at the median of the sample.
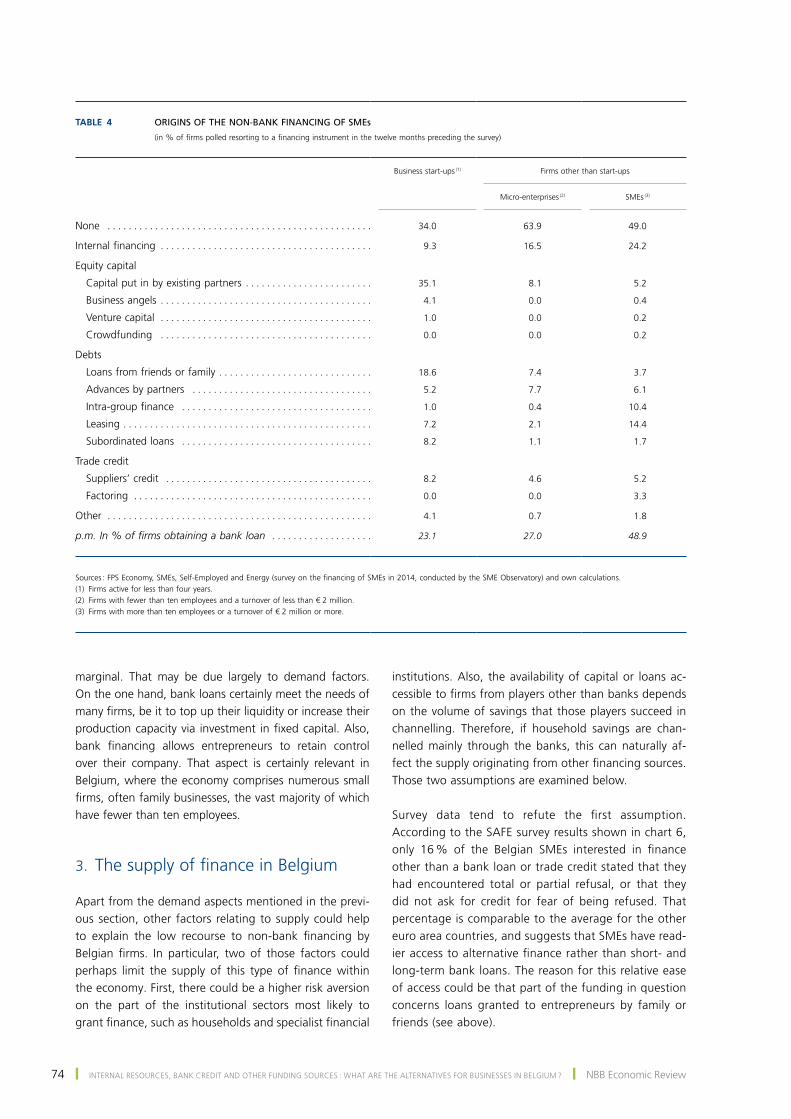
74 ❙ intErnAl rEsourcEs, BAnK crEDit AnD otHEr funDing sourcEs : WHAt ArE tHE AltErnAtiVEs for BusinEssEs in BElgium ? ❙ nBB Economic review
marginal. that may be due largely to demand factors. On the one hand, bank loans certainly meet the needs of many firms, be it to top up their liquidity or increase their production capacity via investment in fixed capital. Also, bank financing allows entrepreneurs to retain control over their company. that aspect is certainly relevant in Belgium, where the economy comprises numerous small firms, often family businesses, the vast majority of which have fewer than ten employees.
3. The supply of finance in Belgium
Apart from the demand aspects mentioned in the previ-ous section, other factors relating to supply could help to explain the low recourse to non-bank financing by Belgian firms. In particular, two of those factors could perhaps limit the supply of this type of finance within the economy. First, there could be a higher risk aversion on the part of the institutional sectors most likely to grant finance, such as households and specialist financial
institutions. Also, the availability of capital or loans ac-cessible to firms from players other than banks depends on the volume of savings that those players succeed in channelling. therefore, if household savings are chan-nelled mainly through the banks, this can naturally af-fect the supply originating from other financing sources. those two assumptions are examined below.
Survey data tend to refute the first assumption. According to the SAFE survey results shown in chart 6, only 16 % of the Belgian SMEs interested in finance other than a bank loan or trade credit stated that they had encountered total or partial refusal, or that they did not ask for credit for fear of being refused. That percentage is comparable to the average for the other euro area countries, and suggests that smEs have read-ier access to alternative finance rather than short- and long-term bank loans. The reason for this relative ease of access could be that part of the funding in question concerns loans granted to entrepreneurs by family or friends (see above).
Table 4 ORIGINS OF THE NON‑BANK FINANCING OF SMEs
(in % of firms polled resorting to a financing instrument in the twelve months preceding the survey)
Business start‑ups (1)
Firms other than start‑ups
Micro‑enterprises (2)
SMEs (3)
None . . . . . . . . . . . . . . . . . . . . . . . . . . . . . . . . . . . . . . . . . . . . . . . . . . 34.0 63.9 49.0
Internal financing . . . . . . . . . . . . . . . . . . . . . . . . . . . . . . . . . . . . . . . . 9.3 16.5 24.2
Equity capital
Capital put in by existing partners . . . . . . . . . . . . . . . . . . . . . . . . 35.1 8.1 5.2
Business angels . . . . . . . . . . . . . . . . . . . . . . . . . . . . . . . . . . . . . . . . 4.1 0.0 0.4
Venture capital . . . . . . . . . . . . . . . . . . . . . . . . . . . . . . . . . . . . . . . . 1.0 0.0 0.2
Crowdfunding . . . . . . . . . . . . . . . . . . . . . . . . . . . . . . . . . . . . . . . . 0.0 0.0 0.2
Debts
Loans from friends or family . . . . . . . . . . . . . . . . . . . . . . . . . . . . . 18.6 7.4 3.7
Advances by partners . . . . . . . . . . . . . . . . . . . . . . . . . . . . . . . . . . 5.2 7.7 6.1
Intra‑group finance . . . . . . . . . . . . . . . . . . . . . . . . . . . . . . . . . . . . 1.0 0.4 10.4
Leasing . . . . . . . . . . . . . . . . . . . . . . . . . . . . . . . . . . . . . . . . . . . . . . . 7.2 2.1 14.4
Subordinated loans . . . . . . . . . . . . . . . . . . . . . . . . . . . . . . . . . . . . 8.2 1.1 1.7
Trade credit
Suppliers’ credit . . . . . . . . . . . . . . . . . . . . . . . . . . . . . . . . . . . . . . . 8.2 4.6 5.2
Factoring . . . . . . . . . . . . . . . . . . . . . . . . . . . . . . . . . . . . . . . . . . . . . 0.0 0.0 3.3
Other . . . . . . . . . . . . . . . . . . . . . . . . . . . . . . . . . . . . . . . . . . . . . . . . . . 4.1 0.7 1.8
p.m. In % of firms obtaining a bank loan . . . . . . . . . . . . . . . . . . . 23.1 27.0 48.9
Sources : FPS Economy, SMEs, Self‑Employed and Energy (survey on the financing of SMEs in 2014, conducted by the SME Observatory) and own calculations.(1) Firms active for less than four years.(2) Firms with fewer than ten employees and a turnover of less than € 2 million.(3) Firms with more than ten employees or a turnover of € 2 million or more.
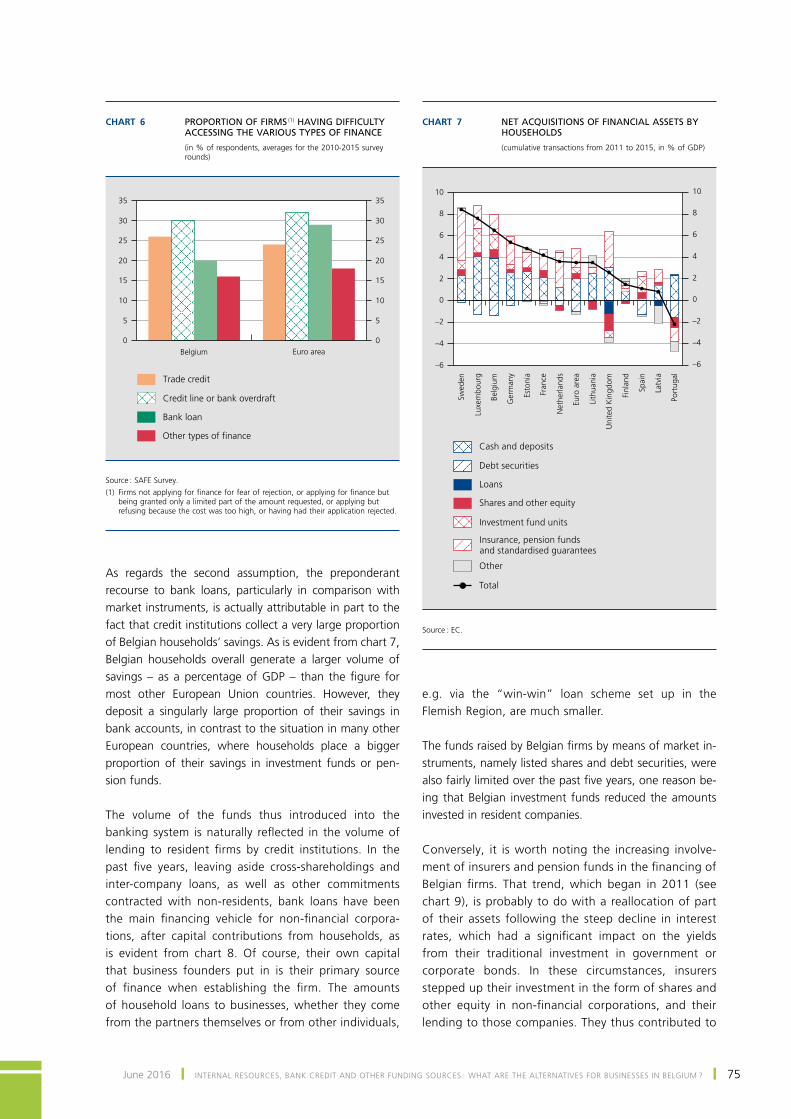
June 2016 ❙ intErnAl rEsourcEs, BAnK crEDit AnD otHEr funDing sourcEs : WHAt ArE tHE AltErnAtiVEs for BusinEssEs in BElgium ? ❙ 75
As regards the second assumption, the preponderant recourse to bank loans, particularly in comparison with market instruments, is actually attributable in part to the fact that credit institutions collect a very large proportion of Belgian households’ savings. As is evident from chart 7, Belgian households overall generate a larger volume of savings – as a percentage of GDP – than the figure for most other European union countries. However, they deposit a singularly large proportion of their savings in bank accounts, in contrast to the situation in many other European countries, where households place a bigger proportion of their savings in investment funds or pen-sion funds.
the volume of the funds thus introduced into the banking system is naturally reflected in the volume of lending to resident firms by credit institutions. In the past five years, leaving aside cross-shareholdings and inter-company loans, as well as other commitments contracted with non-residents, bank loans have been the main financing vehicle for non-financial corpora-tions, after capital contributions from households, as is evident from chart 8. of course, their own capital that business founders put in is their primary source of finance when establishing the firm. The amounts of household loans to businesses, whether they come from the partners themselves or from other individuals,
e.g. via the “win-win” loan scheme set up in the flemish region, are much smaller.
The funds raised by Belgian firms by means of market in-struments, namely listed shares and debt securities, were also fairly limited over the past five years, one reason be-ing that Belgian investment funds reduced the amounts invested in resident companies.
conversely, it is worth noting the increasing involve-ment of insurers and pension funds in the financing of Belgian firms. That trend, which began in 2011 (see chart 9), is probably to do with a reallocation of part of their assets following the steep decline in interest rates, which had a significant impact on the yields from their traditional investment in government or corporate bonds. in these circumstances, insurers stepped up their investment in the form of shares and other equity in non-financial corporations, and their lending to those companies. they thus contributed to
Chart 6 PROPORTION OF FIRMS (1) HAVING DIFFICULTY ACCESSING THE VARIOUS TYPES OF FINANCE
(in % of respondents, averages for the 2010-2015 survey rounds)
0
5
10
15
20
25
30
35
0
5
10
15
20
25
30
35
Belgium Euro area
Other types of finance
Credit line or bank overdraft
Bank loan
Trade credit
source : sAfE survey.(1) Firms not applying for finance for fear of rejection, or applying for finance but
being granted only a limited part of the amount requested, or applying but refusing because the cost was too high, or having had their application rejected.
Chart 7 NET ACQUISITIONS OF FINANCIAL ASSETS BY HOUSEHOLDS
(cumulative transactions from 2011 to 2015, in % of GDP)
–6
–4
–2
0
2
4
6
8
10
–6
–4
–2
0
2
4
6
8
10
Swed
en
Luxe
mbo
urg
Belg
ium
Ger
man
y
Esto
nia
Fran
ce
Net
herla
nds
Euro
are
a
Lith
uani
a
Uni
ted
Kin
gdom
Finl
and
Spai
n
Latv
ia
Port
ugal
Shares and other equity
Investment fund units
Loans
Cash and deposits
Other
Debt securities
Insurance, pension funds and standardised guarantees
Total
source : Ec.
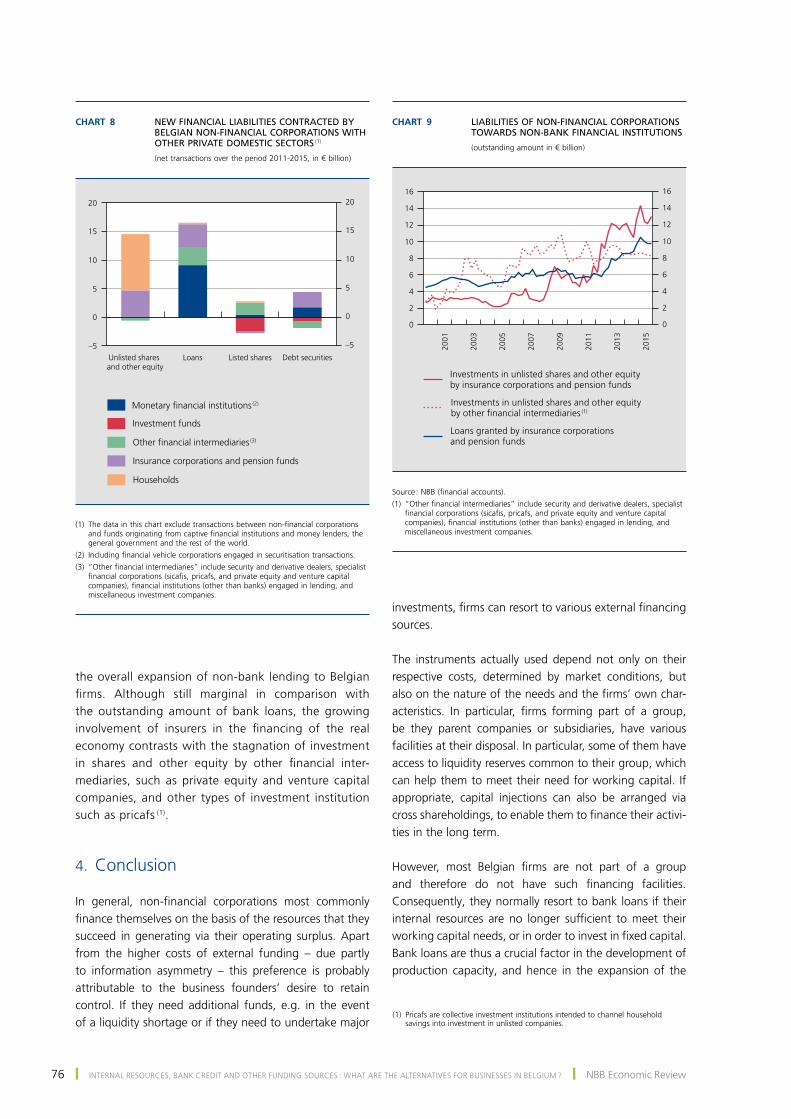
76 ❙ intErnAl rEsourcEs, BAnK crEDit AnD otHEr funDing sourcEs : WHAt ArE tHE AltErnAtiVEs for BusinEssEs in BElgium ? ❙ nBB Economic review
the overall expansion of non-bank lending to Belgian firms. Although still marginal in comparison with the outstanding amount of bank loans, the growing involvement of insurers in the financing of the real economy contrasts with the stagnation of investment in shares and other equity by other financial inter-mediaries, such as private equity and venture capital companies, and other types of investment institution such as pricafs (1).
4. conclusion
In general, non-financial corporations most commonly finance themselves on the basis of the resources that they succeed in generating via their operating surplus. Apart from the higher costs of external funding – due partly to information asymmetry – this preference is probably attributable to the business founders’ desire to retain control. if they need additional funds, e.g. in the event of a liquidity shortage or if they need to undertake major
investments, firms can resort to various external financing sources.
the instruments actually used depend not only on their respective costs, determined by market conditions, but also on the nature of the needs and the firms’ own char-acteristics. In particular, firms forming part of a group, be they parent companies or subsidiaries, have various facilities at their disposal. in particular, some of them have access to liquidity reserves common to their group, which can help them to meet their need for working capital. If appropriate, capital injections can also be arranged via cross shareholdings, to enable them to finance their activi-ties in the long term.
However, most Belgian firms are not part of a group and therefore do not have such financing facilities. Consequently, they normally resort to bank loans if their internal resources are no longer sufficient to meet their working capital needs, or in order to invest in fixed capital. Bank loans are thus a crucial factor in the development of production capacity, and hence in the expansion of the
Chart 8 NEW FINANCIAL LIABILITIES CONTRACTED BY BELGIAN NON-FINANCIAL CORPORATIONS WITH OTHER PRIVATE DOMESTIC SECTORS (1)
(net transactions over the period 2011-2015, in € billion)
–5
0
5
10
15
20
–5
0
5
10
15
20
Unlisted shares and other equity
Loans Listed shares Debt securities
Monetary financial institutions (2)
Investment funds
Other financial intermediaries (3)
Insurance corporations and pension funds
Households
(1) The data in this chart exclude transactions between non-financial corporations and funds originating from captive financial institutions and money lenders, the general government and the rest of the world.
(2) Including financial vehicle corporations engaged in securitisation transactions.(3) “Other financial intermediaries” include security and derivative dealers, specialist
financial corporations (sicafis, pricafs, and private equity and venture capital companies), financial institutions (other than banks) engaged in lending, and miscellaneous investment companies.
Chart 9 LIABILITIES OF NON-FINANCIAL CORPORATIONS TOWARDS NON-BANK FINANCIAL INSTITUTIONS
(outstanding amount in € billion)
2001
2003
2005
2007
2009
2011
2013
2015
0
2
4
6
8
10
12
14
16
0
2
4
6
8
10
12
14
16
Investments in unlisted shares and other equity by other financial intermediaries
(1)
Loans granted by insurance corporations and pension funds
Investments in unlisted shares and other equity by insurance corporations and pension funds
Source : NBB (financial accounts).(1) “Other financial intermediaries” include security and derivative dealers, specialist
financial corporations (sicafis, pricafs, and private equity and venture capital companies), financial institutions (other than banks) engaged in lending, and miscellaneous investment companies.
(1) pricafs are collective investment institutions intended to channel household savings into investment in unlisted companies.

June 2016 ❙ intErnAl rEsourcEs, BAnK crEDit AnD otHEr funDing sourcEs : WHAt ArE tHE AltErnAtiVEs for BusinEssEs in BElgium ? ❙ 77
economy’s growth potential. Nevertheless, their role in the financing of intangible fixed investments remains minor.
the empirical results presented in this article also sug-gest that innovative firms may exhibit some interest in non-bank loans, such as subordinated loans granted by individuals or by specialist financial institutions. Yet, the financing of these businesses, which are often young and not connected with a group, is not risk-free. That is prob-ably why many entrepreneurs depend on funds lent to them by friends or family.
Bank financing is also strongly supported by the structure of Belgian household savings. In recent years, the bulk of those savings has been placed in sight deposits or sav-ings accounts, i.e. on the liabilities side of the balance sheet of monetary financial institutions. Consequently, it is mainly those institutions that channel the funding resources generated by Belgians’ savings into productive investment. that may favour the allocation of resources to projects which are relatively safe but perhaps less in-novative, as the banks take account of the risk factor in their lending policy.
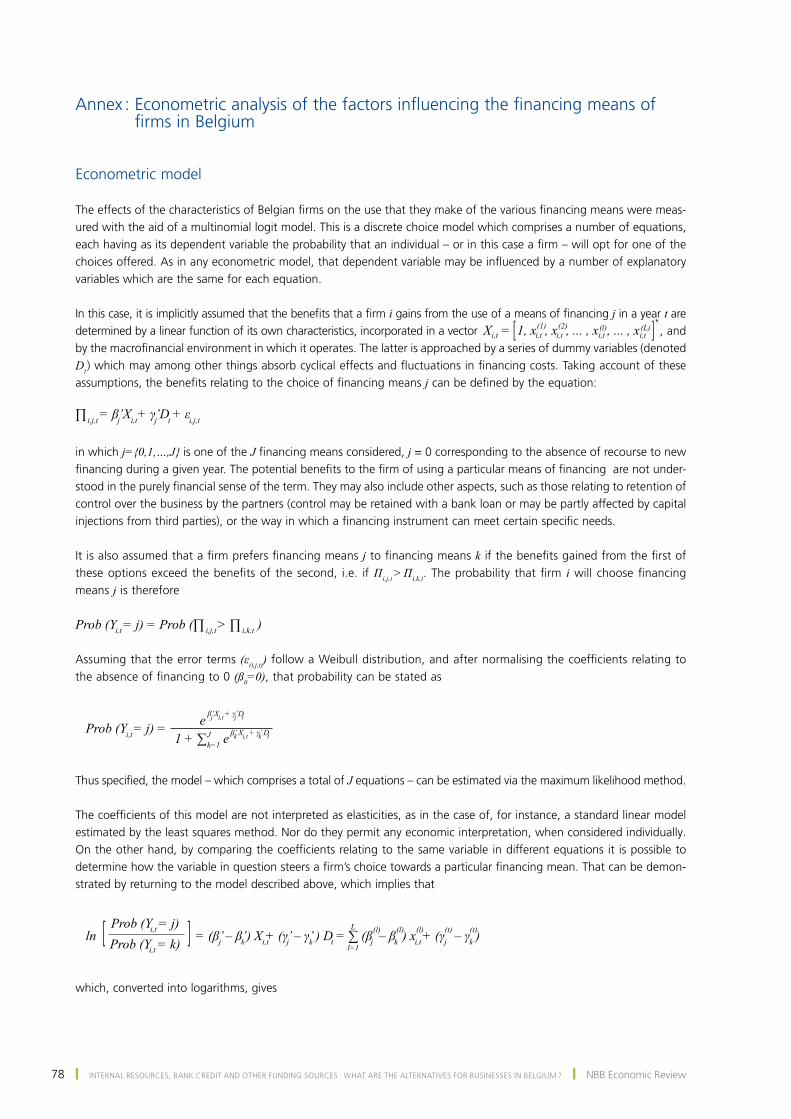
78 ❙ intErnAl rEsourcEs, BAnK crEDit AnD otHEr funDing sourcEs : WHAt ArE tHE AltErnAtiVEs for BusinEssEs in BElgium ? ❙ nBB Economic review
Annex : Econometric analysis of the factors influencing the financing means of firms in Belgium
Econometric model
The effects of the characteristics of Belgian firms on the use that they make of the various financing means were meas-ured with the aid of a multinomial logit model. this is a discrete choice model which comprises a number of equations, each having as its dependent variable the probability that an individual – or in this case a firm – will opt for one of the choices offered. As in any econometric model, that dependent variable may be influenced by a number of explanatory variables which are the same for each equation.
In this case, it is implicitly assumed that the benefits that a firm i gains from the use of a means of financing j in a year t are determined by a linear function of its own characteristics, incorporated in a vector X = 1, x , x , ... , x , ... , x[ [i,t i,t i,t i,t
(1) (2) (l)i,t(L) ’, and
by the macrofinancial environment in which it operates. The latter is approached by a series of dummy variables (denoted Dt ) which may among other things absorb cyclical effects and fluctuations in financing costs. Taking account of these assumptions, the benefits relating to the choice of financing means j can be defined by the equation:
∏ = β’X + γ’D + εi,j,t i,tj j t i,j,t
in which j={0,1,…,J} is one of the J financing means considered, j = 0 corresponding to the absence of recourse to new financing during a given year. The potential benefits to the firm of using a particular means of financing are not under-stood in the purely financial sense of the term. They may also include other aspects, such as those relating to retention of control over the business by the partners (control may be retained with a bank loan or may be partly affected by capital injections from third parties), or the way in which a financing instrument can meet certain specific needs.
It is also assumed that a firm prefers financing means j to financing means k if the benefits gained from the first of these options exceed the benefits of the second, i.e. if Πi,j,t > Πi,k,t. The probability that firm i will choose financing means j is therefore
Prob (Y = j) = Prob (∏ > ∏ )i,t i,j,t i,k,t
Assuming that the error terms (ε(i,j,t)) follow a Weibull distribution, and after normalising the coefficients relating to the absence of financing to 0 (ß0=0), that probability can be stated as
Prob (Y = j) =i,te j j ti,tβ’X + γ’D
1 + ∑ e k=1J k k ti,tβ’ X + γ’ D
Thus specified, the model – which comprises a total of J equations – can be estimated via the maximum likelihood method.
The coefficients of this model are not interpreted as elasticities, as in the case of, for instance, a standard linear model estimated by the least squares method. nor do they permit any economic interpretation, when considered individually. On the other hand, by comparing the coefficients relating to the same variable in different equations it is possible to determine how the variable in question steers a firm’s choice towards a particular financing mean. That can be demon-strated by returning to the model described above, which implies that
ln = (β’ – β’) X + (γ’ – γ’ ) D = ∑ (β – β ) x + (γ – γ )[ [ j ji,t i,tk kk ktl=1
L
j(l) (l) (l) (t) (t)
j
Prob (Y = j) i,t
Prob (Y = k) i,t
which, converted into logarithms, gives
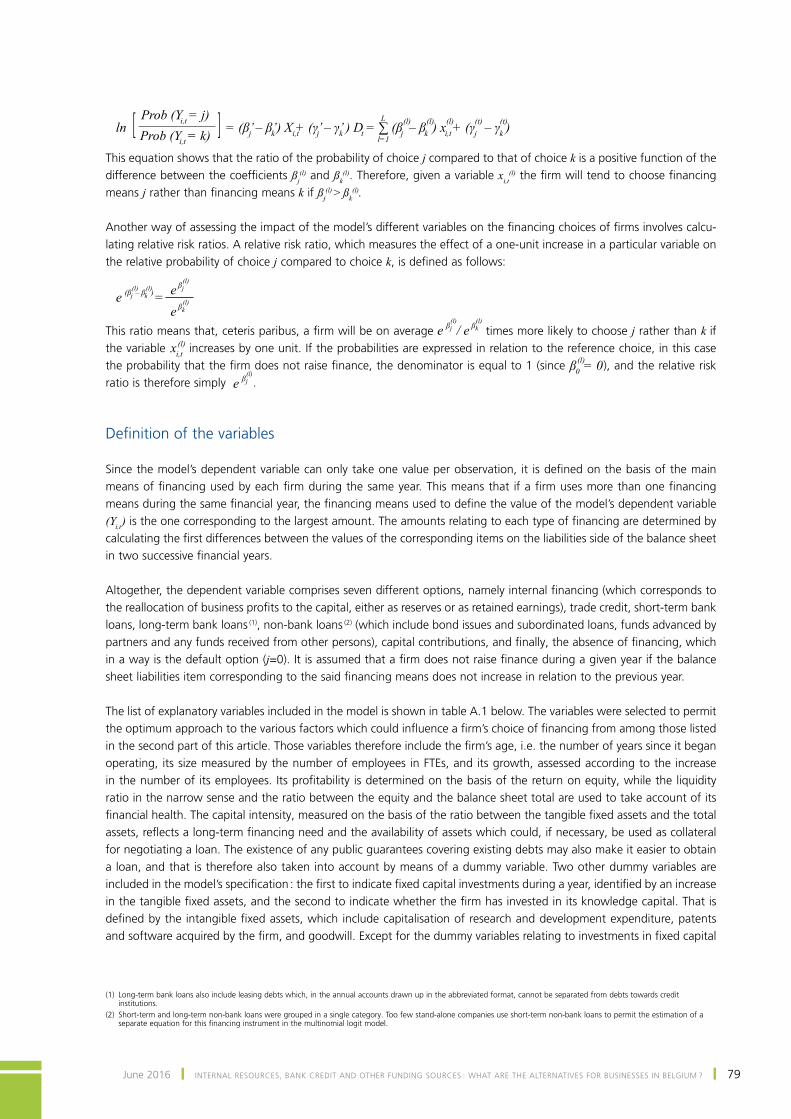
June 2016 ❙ intErnAl rEsourcEs, BAnK crEDit AnD otHEr funDing sourcEs : WHAt ArE tHE AltErnAtiVEs for BusinEssEs in BElgium ? ❙ 79
ln = (β’ – β’) X + (γ’ – γ’ ) D = ∑ (β – β ) x + (γ – γ )[ [ j ji,t i,tk kk ktl=1
L
j(l) (l) (l) (t) (t)
j
Prob (Y = j) i,t
Prob (Y = k) i,t
this equation shows that the ratio of the probability of choice j compared to that of choice k is a positive function of the difference between the coefficients ßj
(l) and ßk(l). therefore, given a variable xi,t
(l) the firm will tend to choose financing means j rather than financing means k if ßj
(l) > ßk(l).
Another way of assessing the impact of the model’s different variables on the financing choices of firms involves calcu-lating relative risk ratios. A relative risk ratio, which measures the effect of a one-unit increase in a particular variable on the relative probability of choice j compared to choice k, is defined as follows:
e = (β – β )j(l) (l)
k e βj(l)
e βk(l)
This ratio means that, ceteris paribus, a firm will be on average e / eβ j(l) β k
(l)
times more likely to choose j rather than k if the variable x (l)
i,t increases by one unit. if the probabilities are expressed in relation to the reference choice, in this case the probability that the firm does not raise finance, the denominator is equal to 1 (since β = 00
(l) ), and the relative risk ratio is therefore simply e β j
(l).
Definition of the variables
Since the model’s dependent variable can only take one value per observation, it is defined on the basis of the main means of financing used by each firm during the same year. This means that if a firm uses more than one financing means during the same financial year, the financing means used to define the value of the model’s dependent variable (Yi,t ) is the one corresponding to the largest amount. The amounts relating to each type of financing are determined by calculating the first differences between the values of the corresponding items on the liabilities side of the balance sheet in two successive financial years.
Altogether, the dependent variable comprises seven different options, namely internal financing (which corresponds to the reallocation of business profits to the capital, either as reserves or as retained earnings), trade credit, short-term bank loans, long-term bank loans (1), non-bank loans (2) (which include bond issues and subordinated loans, funds advanced by partners and any funds received from other persons), capital contributions, and finally, the absence of financing, which in a way is the default option (j=0). It is assumed that a firm does not raise finance during a given year if the balance sheet liabilities item corresponding to the said financing means does not increase in relation to the previous year.
The list of explanatory variables included in the model is shown in table A.1 below. The variables were selected to permit the optimum approach to the various factors which could influence a firm’s choice of financing from among those listed in the second part of this article. Those variables therefore include the firm’s age, i.e. the number of years since it began operating, its size measured by the number of employees in ftEs, and its growth, assessed according to the increase in the number of its employees. Its profitability is determined on the basis of the return on equity, while the liquidity ratio in the narrow sense and the ratio between the equity and the balance sheet total are used to take account of its financial health. The capital intensity, measured on the basis of the ratio between the tangible fixed assets and the total assets, reflects a long-term financing need and the availability of assets which could, if necessary, be used as collateral for negotiating a loan. The existence of any public guarantees covering existing debts may also make it easier to obtain a loan, and that is therefore also taken into account by means of a dummy variable. Two other dummy variables are included in the model’s specification : the first to indicate fixed capital investments during a year, identified by an increase in the tangible fixed assets, and the second to indicate whether the firm has invested in its knowledge capital. That is defined by the intangible fixed assets, which include capitalisation of research and development expenditure, patents and software acquired by the firm, and goodwill. Except for the dummy variables relating to investments in fixed capital
(1) Long-term bank loans also include leasing debts which, in the annual accounts drawn up in the abbreviated format, cannot be separated from debts towards credit institutions.
(2) Short-term and long-term non-bank loans were grouped in a single category. Too few stand-alone companies use short-term non-bank loans to permit the estimation of a separate equation for this financing instrument in the multinomial logit model.
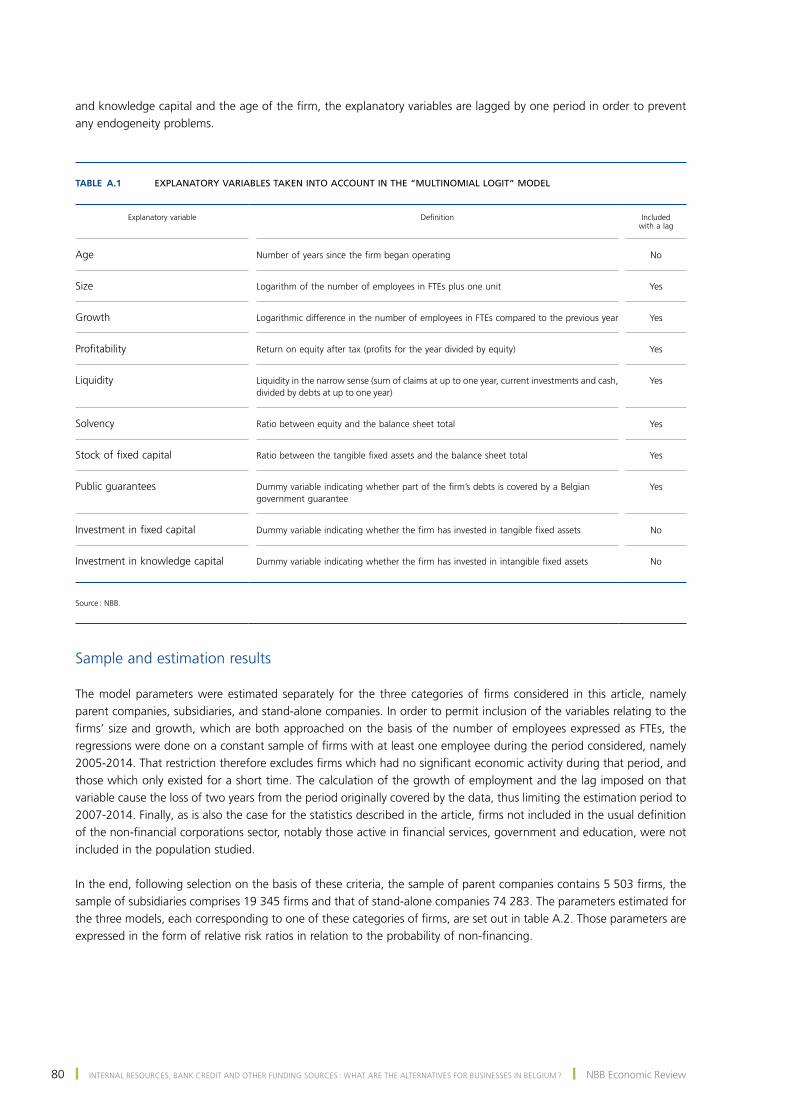
80 ❙ intErnAl rEsourcEs, BAnK crEDit AnD otHEr funDing sourcEs : WHAt ArE tHE AltErnAtiVEs for BusinEssEs in BElgium ? ❙ nBB Economic review
and knowledge capital and the age of the firm, the explanatory variables are lagged by one period in order to prevent any endogeneity problems.
sample and estimation results
The model parameters were estimated separately for the three categories of firms considered in this article, namely parent companies, subsidiaries, and stand-alone companies. in order to permit inclusion of the variables relating to the firms’ size and growth, which are both approached on the basis of the number of employees expressed as FTEs, the regressions were done on a constant sample of firms with at least one employee during the period considered, namely 2005-2014. That restriction therefore excludes firms which had no significant economic activity during that period, and those which only existed for a short time. the calculation of the growth of employment and the lag imposed on that variable cause the loss of two years from the period originally covered by the data, thus limiting the estimation period to 2007-2014. Finally, as is also the case for the statistics described in the article, firms not included in the usual definition of the non-financial corporations sector, notably those active in financial services, government and education, were not included in the population studied.
In the end, following selection on the basis of these criteria, the sample of parent companies contains 5 503 firms, the sample of subsidiaries comprises 19 345 firms and that of stand-alone companies 74 283. The parameters estimated for the three models, each corresponding to one of these categories of firms, are set out in table A.2. Those parameters are expressed in the form of relative risk ratios in relation to the probability of non-financing.
TABLE A.1 EXPLANATORY VARIABLES TAKEN INTO ACCOUNT IN THE “MULTINOMIAL LOGIT” MODEL
Explanatory variable
Definition
Included with a lag
Age Number of years since the firm began operating No
Size Logarithm of the number of employees in FTEs plus one unit Yes
Growth Logarithmic difference in the number of employees in FTEs compared to the previous year Yes
Profitability Return on equity after tax (profits for the year divided by equity) Yes
Liquidity Liquidity in the narrow sense (sum of claims at up to one year, current investments and cash, divided by debts at up to one year)
Yes
Solvency Ratio between equity and the balance sheet total Yes
Stock of fixed capital Ratio between the tangible fixed assets and the balance sheet total Yes
Public guarantees Dummy variable indicating whether part of the firm’s debts is covered by a Belgian government guarantee
Yes
Investment in fixed capital Dummy variable indicating whether the firm has invested in tangible fixed assets No
Investment in knowledge capital Dummy variable indicating whether the firm has invested in intangible fixed assets No
Source : NBB.
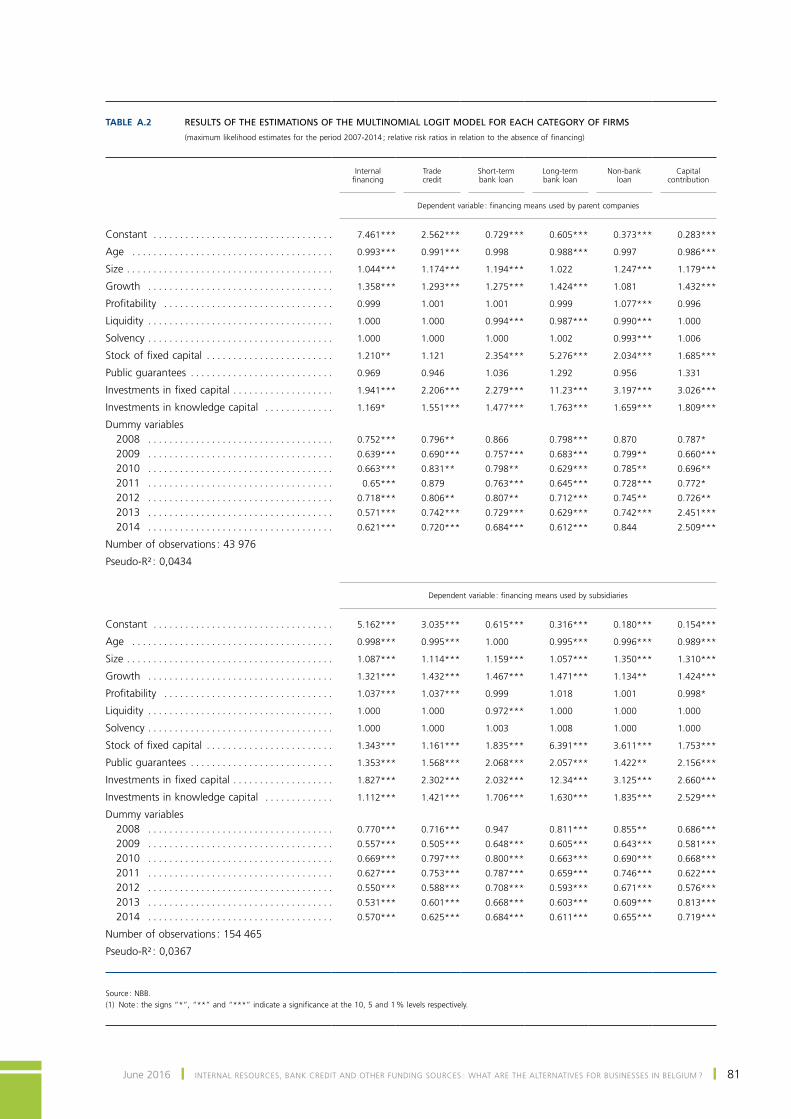
June 2016 ❙ intErnAl rEsourcEs, BAnK crEDit AnD otHEr funDing sourcEs : WHAt ArE tHE AltErnAtiVEs for BusinEssEs in BElgium ? ❙ 81
TABLE A.2 RESULTS OF THE ESTIMATIONS OF THE MULTINOMIAL LOGIT MODEL FOR EACH CATEGORY OF FIRMS
(maximum likelihood estimates for the period 2007-2014 ; relative risk ratios in relation to the absence of financing)
Internal financing
Trade credit
Short-term bank loan
Long-term bank loan
Non-bank loan
Capital contribution
Dependent variable : financing means used by parent companies
Constant . . . . . . . . . . . . . . . . . . . . . . . . . . . . . . . . . . 7.461*** 2.562*** 0.729*** 0.605*** 0.373*** 0.283***
Age . . . . . . . . . . . . . . . . . . . . . . . . . . . . . . . . . . . . . . 0.993*** 0.991*** 0.998 0.988*** 0.997 0.986***
Size . . . . . . . . . . . . . . . . . . . . . . . . . . . . . . . . . . . . . . . 1.044*** 1.174*** 1.194*** 1.022 1.247*** 1.179***
Growth . . . . . . . . . . . . . . . . . . . . . . . . . . . . . . . . . . . 1.358*** 1.293*** 1.275*** 1.424*** 1.081 1.432***
Profitability . . . . . . . . . . . . . . . . . . . . . . . . . . . . . . . . 0.999 1.001 1.001 0.999 1.077*** 0.996
Liquidity . . . . . . . . . . . . . . . . . . . . . . . . . . . . . . . . . . . 1.000 1.000 0.994*** 0.987*** 0.990*** 1.000
Solvency . . . . . . . . . . . . . . . . . . . . . . . . . . . . . . . . . . . 1.000 1.000 1.000 1.002 0.993*** 1.006
Stock of fixed capital . . . . . . . . . . . . . . . . . . . . . . . . 1.210** 1.121 2.354*** 5.276*** 2.034*** 1.685***
Public guarantees . . . . . . . . . . . . . . . . . . . . . . . . . . . 0.969 0.946 1.036 1.292 0.956 1.331
Investments in fixed capital . . . . . . . . . . . . . . . . . . . 1.941*** 2.206*** 2.279*** 11.23*** 3.197*** 3.026***
Investments in knowledge capital . . . . . . . . . . . . . 1.169* 1.551*** 1.477*** 1.763*** 1.659*** 1.809***
Dummy variables2008 . . . . . . . . . . . . . . . . . . . . . . . . . . . . . . . . . . . 0.752*** 0.796** 0.866 0.798*** 0.870 0.787*
2009 . . . . . . . . . . . . . . . . . . . . . . . . . . . . . . . . . . . 0.639*** 0.690*** 0.757*** 0.683*** 0.799** 0.660***
2010 . . . . . . . . . . . . . . . . . . . . . . . . . . . . . . . . . . . 0.663*** 0.831** 0.798** 0.629*** 0.785** 0.696**
2011 . . . . . . . . . . . . . . . . . . . . . . . . . . . . . . . . . . . 0.65*** 0.879 0.763*** 0.645*** 0.728*** 0.772*
2012 . . . . . . . . . . . . . . . . . . . . . . . . . . . . . . . . . . . 0.718*** 0.806** 0.807** 0.712*** 0.745** 0.726**
2013 . . . . . . . . . . . . . . . . . . . . . . . . . . . . . . . . . . . 0.571*** 0.742*** 0.729*** 0.629*** 0.742*** 2.451***
2014 . . . . . . . . . . . . . . . . . . . . . . . . . . . . . . . . . . . 0.621*** 0.720*** 0.684*** 0.612*** 0.844 2.509***
Number of observations : 43 976
Pseudo-R² : 0,0434
Dependent variable : financing means used by subsidiaries
Constant . . . . . . . . . . . . . . . . . . . . . . . . . . . . . . . . . . 5.162*** 3.035*** 0.615*** 0.316*** 0.180*** 0.154***
Age . . . . . . . . . . . . . . . . . . . . . . . . . . . . . . . . . . . . . . 0.998*** 0.995*** 1.000 0.995*** 0.996*** 0.989***
Size . . . . . . . . . . . . . . . . . . . . . . . . . . . . . . . . . . . . . . . 1.087*** 1.114*** 1.159*** 1.057*** 1.350*** 1.310***
Growth . . . . . . . . . . . . . . . . . . . . . . . . . . . . . . . . . . . 1.321*** 1.432*** 1.467*** 1.471*** 1.134** 1.424***
Profitability . . . . . . . . . . . . . . . . . . . . . . . . . . . . . . . . 1.037*** 1.037*** 0.999 1.018 1.001 0.998*
Liquidity . . . . . . . . . . . . . . . . . . . . . . . . . . . . . . . . . . . 1.000 1.000 0.972*** 1.000 1.000 1.000
Solvency . . . . . . . . . . . . . . . . . . . . . . . . . . . . . . . . . . . 1.000 1.000 1.003 1.008 1.000 1.000
Stock of fixed capital . . . . . . . . . . . . . . . . . . . . . . . . 1.343*** 1.161*** 1.835*** 6.391*** 3.611*** 1.753***
Public guarantees . . . . . . . . . . . . . . . . . . . . . . . . . . . 1.353*** 1.568*** 2.068*** 2.057*** 1.422** 2.156***
Investments in fixed capital . . . . . . . . . . . . . . . . . . . 1.827*** 2.302*** 2.032*** 12.34*** 3.125*** 2.660***
Investments in knowledge capital . . . . . . . . . . . . . 1.112*** 1.421*** 1.706*** 1.630*** 1.835*** 2.529***
Dummy variables2008 . . . . . . . . . . . . . . . . . . . . . . . . . . . . . . . . . . . 0.770*** 0.716*** 0.947 0.811*** 0.855** 0.686***
2009 . . . . . . . . . . . . . . . . . . . . . . . . . . . . . . . . . . . 0.557*** 0.505*** 0.648*** 0.605*** 0.643*** 0.581***
2010 . . . . . . . . . . . . . . . . . . . . . . . . . . . . . . . . . . . 0.669*** 0.797*** 0.800*** 0.663*** 0.690*** 0.668***
2011 . . . . . . . . . . . . . . . . . . . . . . . . . . . . . . . . . . . 0.627*** 0.753*** 0.787*** 0.659*** 0.746*** 0.622***
2012 . . . . . . . . . . . . . . . . . . . . . . . . . . . . . . . . . . . 0.550*** 0.588*** 0.708*** 0.593*** 0.671*** 0.576***
2013 . . . . . . . . . . . . . . . . . . . . . . . . . . . . . . . . . . . 0.531*** 0.601*** 0.668*** 0.603*** 0.609*** 0.813***
2014 . . . . . . . . . . . . . . . . . . . . . . . . . . . . . . . . . . . 0.570*** 0.625*** 0.684*** 0.611*** 0.655*** 0.719***
Number of observations : 154 465
Pseudo-R² : 0,0367
Source : NBB.(1) Note : the signs “*”, “**” and “***” indicate a significance at the 10, 5 and 1 % levels respectively.
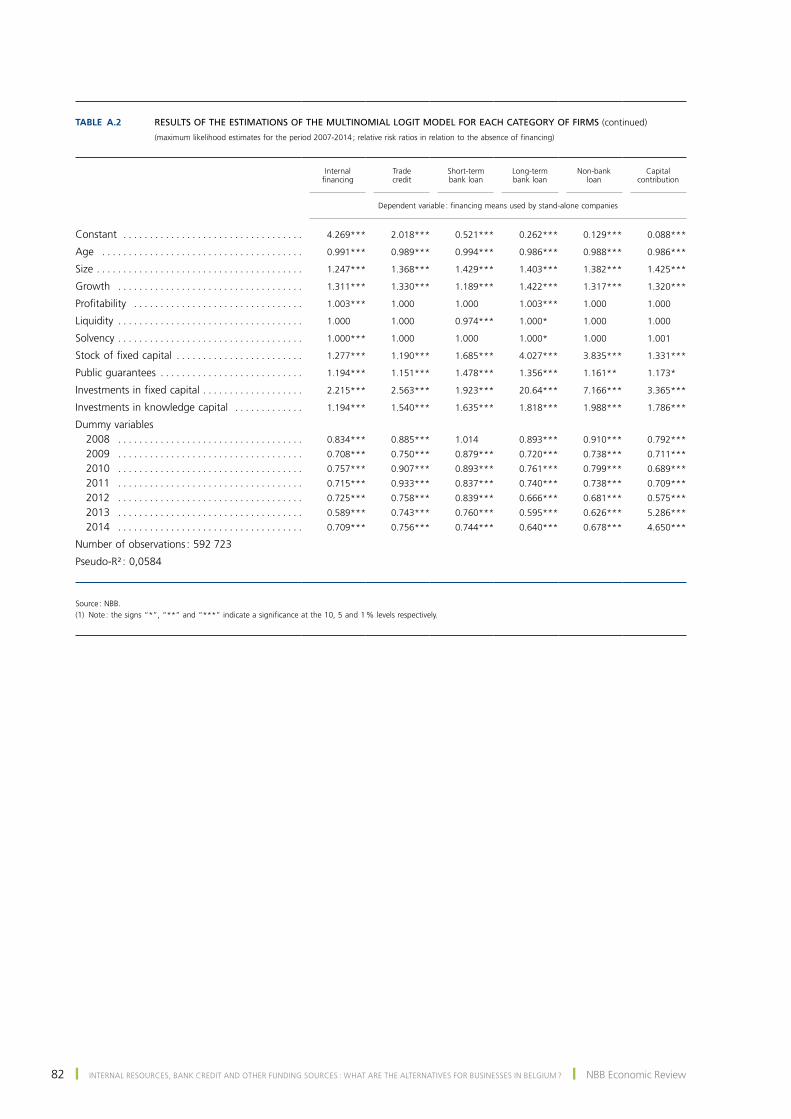
82 ❙ intErnAl rEsourcEs, BAnK crEDit AnD otHEr funDing sourcEs : WHAt ArE tHE AltErnAtiVEs for BusinEssEs in BElgium ? ❙ nBB Economic review
TABLE A.2 RESULTS OF THE ESTIMATIONS OF THE MULTINOMIAL LOGIT MODEL FOR EACH CATEGORY OF FIRMS (continued)
(maximum likelihood estimates for the period 2007-2014 ; relative risk ratios in relation to the absence of financing)
Internal financing
Trade credit
Short-term bank loan
Long-term bank loan
Non-bank loan
Capital contribution
Dependent variable : financing means used by stand-alone companies
Constant . . . . . . . . . . . . . . . . . . . . . . . . . . . . . . . . . . 4.269*** 2.018*** 0.521*** 0.262*** 0.129*** 0.088***
Age . . . . . . . . . . . . . . . . . . . . . . . . . . . . . . . . . . . . . . 0.991*** 0.989*** 0.994*** 0.986*** 0.988*** 0.986***
Size . . . . . . . . . . . . . . . . . . . . . . . . . . . . . . . . . . . . . . . 1.247*** 1.368*** 1.429*** 1.403*** 1.382*** 1.425***
Growth . . . . . . . . . . . . . . . . . . . . . . . . . . . . . . . . . . . 1.311*** 1.330*** 1.189*** 1.422*** 1.317*** 1.320***
Profitability . . . . . . . . . . . . . . . . . . . . . . . . . . . . . . . . 1.003*** 1.000 1.000 1.003*** 1.000 1.000
Liquidity . . . . . . . . . . . . . . . . . . . . . . . . . . . . . . . . . . . 1.000 1.000 0.974*** 1.000* 1.000 1.000
Solvency . . . . . . . . . . . . . . . . . . . . . . . . . . . . . . . . . . . 1.000*** 1.000 1.000 1.000* 1.000 1.001
Stock of fixed capital . . . . . . . . . . . . . . . . . . . . . . . . 1.277*** 1.190*** 1.685*** 4.027*** 3.835*** 1.331***
Public guarantees . . . . . . . . . . . . . . . . . . . . . . . . . . . 1.194*** 1.151*** 1.478*** 1.356*** 1.161** 1.173*
Investments in fixed capital . . . . . . . . . . . . . . . . . . . 2.215*** 2.563*** 1.923*** 20.64*** 7.166*** 3.365***
Investments in knowledge capital . . . . . . . . . . . . . 1.194*** 1.540*** 1.635*** 1.818*** 1.988*** 1.786***
Dummy variables2008 . . . . . . . . . . . . . . . . . . . . . . . . . . . . . . . . . . . 0.834*** 0.885*** 1.014 0.893*** 0.910*** 0.792***
2009 . . . . . . . . . . . . . . . . . . . . . . . . . . . . . . . . . . . 0.708*** 0.750*** 0.879*** 0.720*** 0.738*** 0.711***
2010 . . . . . . . . . . . . . . . . . . . . . . . . . . . . . . . . . . . 0.757*** 0.907*** 0.893*** 0.761*** 0.799*** 0.689***
2011 . . . . . . . . . . . . . . . . . . . . . . . . . . . . . . . . . . . 0.715*** 0.933*** 0.837*** 0.740*** 0.738*** 0.709***
2012 . . . . . . . . . . . . . . . . . . . . . . . . . . . . . . . . . . . 0.725*** 0.758*** 0.839*** 0.666*** 0.681*** 0.575***
2013 . . . . . . . . . . . . . . . . . . . . . . . . . . . . . . . . . . . 0.589*** 0.743*** 0.760*** 0.595*** 0.626*** 5.286***
2014 . . . . . . . . . . . . . . . . . . . . . . . . . . . . . . . . . . . 0.709*** 0.756*** 0.744*** 0.640*** 0.678*** 4.650***
Number of observations : 592 723
Pseudo-R² : 0,0584
Source : NBB.(1) Note : the signs “*”, “**” and “***” indicate a significance at the 10, 5 and 1 % levels respectively.
June 2016 ❙ intErnAl rEsourcEs, BAnK crEDit AnD otHEr funDing sourcEs : WHAt ArE tHE AltErnAtiVEs for BusinEssEs in BElgium ? ❙ 83
Bibliography
Berger A.n. and g.f. udell (1998), “the Economics of small Business finance: the roles of private Equity and Debt Markets in Financial Growth Cycle”, Journal of Banking & Finance, 22, 613-673.
Burggraeve K., Ph. Jeanfils, K. Van Cauter and L. Van Meensel (2008), “Macroeconomic and fiscal impact of the risk capital allowance”, nBB, Economic Review, september, 7-47.
Chavis L.W., L.F. Klapper and I. Love (2011), “The impact of the business environment on young firm financing”, The World Bank Economic Review, 25 (3), 486-507.
cosh A., D. coming and A. Hughes (2009), “outside Entrepreneurial capital”, The Economic Journal, 119, 1494-1533.
Degryse H., P. de Goeij and P. Kappert (2012), “The impact of firm and industry characteristics on small firms’ capital structure”, Small Business Economics, 38 (4), 431-447.
Domenichelli O. (2008), “The pecking order theory in the context of small and medium-sized enterprises: a note”, Rivista piccolo impresa / Small business, 2, 61-71.
ferrando A. and n. griesshaber (2011), Financing obstacles among euro area firms: Who suffers the most?, EcB, Working Paper 1293.
Jensen M.C. and W.H. Meckling (1976), “Theory of the Firm: Managerial Behavior, Agency Costs and Ownership structure”, Journal of Financial Management, 3 (4), 323-329.
lópez-gracia J. and c. Aybar-Arias (2000), “An Empirical Approach to the financial Behaviour of small and medium sized companies”, Small Business Economics, 14 (1), 55-63.
mac an Bhaird c. and B. lucey (2010), “Determinants of capital structure in irish smEs”, Small Business Economics, 35 (3), 357-375.
myers s.c. (1984), “the capital structure puzzle”, Journal of Finance, 39 (3), 575-592.
myers s.c. and n.s. majluf (1984), “corporate financing and investment Decisions When firms Have information that investors Do not Have”, Journal of Financial Economics, 13, 187-221.
ross s.A. (1977), “the Determination of financial structure: the incentive-signalling Approach”, The Bell Journal of Economics, 8, 23-40.
Sánchez-Vidal J. and J.F. Martín-Ugedo (2005), “Financing Preferences of Spanish Firms: Evidence on the Pecking order theory”, Review of Quantitative Finance and Accounting, 25, 341-355.
Watson r. and n. Wilson (2002), “small and medium size Enterprise financing: A note on some of the Empirical Implications of a Pecking Order”, Journal of Business Finance & Accounting, 29 (3/4), 557-578.
June 2016 ❙ THE 2014 SOCIAL BALANCE SHEET ❙ 85
The 2014 social balance sheet
P. Heuse
introduction
With the exception of non-profit organisations, founda-tions and other legal entities governed by private law em-ploying less than 20 FTE workers, all companies with staff and trading in Belgium are required to fill out a social bal-ance sheet. the information contained in this document make it possible to analyse the composition of the staff of companies that complete it, to measure the volume of hours worked and the amount spent on staff costs, as well as the extent of employee movements during the course of the year. the social balance sheet is also an im-portant source of statistics on the efforts that companies make each year to arrange training for their workers.
The first chapter of this article is devoted to changes in (the composition of) the volume of employment between 2000 and 2014. For the first time since the social bal-ance sheet findings have been published each year in the Economic review, the analysis covers all the social balance sheets filed – i.e. 85 572 companies for 2014 (1) –, which makes it possible to put the results for this year into their historical context, even though there were some breaks in the series during the period under review.
the second chapter returns to the question of wage gaps between men and women. it has become possible to measure this gap for firms filing a full format following the introduction, in the social balance sheet, of the break-down by gender of staff numbers, hours worked and staff costs for the financial years starting with effect from 1 January 2012. Results have now been available for three years, which has made it possible to measure changes
in the wage gap. the study is based on a sample popula-tion of just under 2 000 firms, while around 13 500 full formats were filed for the year 2014. Certain data are lacking because, for personal data privacy purposes, the legal framework gives firms the right not to fill out these headings when they only concern three or less workers. others cannot even be used because the quality of the reporting leaves much to be desired. the consequences are regrettable both for economic analysis – the results are not very representative – and for policy-making too, missing one of the points of the law which was to enable a comparison of the social profile of declarants.
The third and last chapter takes a brief look at the con-sequences, for the social balance sheet, of the law of 18 December 2015, which transposes into Belgian law the new Directive 2013 / 34 / EU of the European Parliament and the Council on the annual financial statements, consolidated financial statements and related reports of certain types of undertakings.
the article also includes a methodological annex which explains how the analysis populations are made up, as well as a series of tables showing historical trends in the most interesting variables and ratios calculated from the social balance sheets.
1. Volume of employment : main changes between 2000 and 2014 based on the social balance sheets
the social balance sheet enables us to gain an insight into the volume of employment in different ways.
the table referring to persons employed (2) during the ac-counting year includes two headings that measure the
(1) the analysis population comprises the social balance sheets meeting the quality criteria set out in Annex 1.
(2) Employed persons refer to workers for whom the firm has submitted a DIMONA declaration or who are recorded in the staff register.
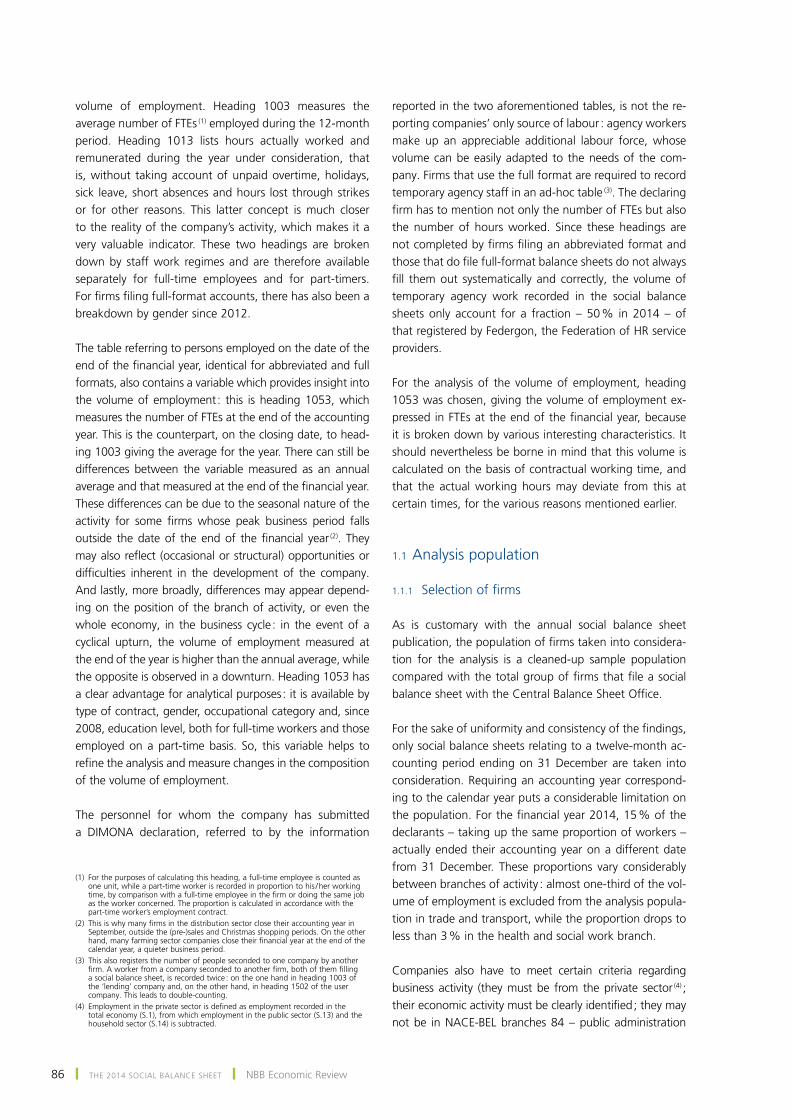
86 ❙ THE 2014 SOCIAL BALANCE SHEET ❙ nBB Economic review
volume of employment. Heading 1003 measures the average number of ftEs (1) employed during the 12-month period. Heading 1013 lists hours actually worked and remunerated during the year under consideration, that is, without taking account of unpaid overtime, holidays, sick leave, short absences and hours lost through strikes or for other reasons. this latter concept is much closer to the reality of the company’s activity, which makes it a very valuable indicator. These two headings are broken down by staff work regimes and are therefore available separately for full-time employees and for part-timers. For firms filing full-format accounts, there has also been a breakdown by gender since 2012.
the table referring to persons employed on the date of the end of the financial year, identical for abbreviated and full formats, also contains a variable which provides insight into the volume of employment : this is heading 1053, which measures the number of ftEs at the end of the accounting year. this is the counterpart, on the closing date, to head-ing 1003 giving the average for the year. There can still be differences between the variable measured as an annual average and that measured at the end of the financial year. these differences can be due to the seasonal nature of the activity for some firms whose peak business period falls outside the date of the end of the financial year (2). they may also reflect (occasional or structural) opportunities or difficulties inherent in the development of the company. And lastly, more broadly, differences may appear depend-ing on the position of the branch of activity, or even the whole economy, in the business cycle : in the event of a cyclical upturn, the volume of employment measured at the end of the year is higher than the annual average, while the opposite is observed in a downturn. Heading 1053 has a clear advantage for analytical purposes : it is available by type of contract, gender, occupational category and, since 2008, education level, both for full-time workers and those employed on a part-time basis. so, this variable helps to refine the analysis and measure changes in the composition of the volume of employment.
the personnel for whom the company has submitted a DimonA declaration, referred to by the information
reported in the two aforementioned tables, is not the re-porting companies’ only source of labour : agency workers make up an appreciable additional labour force, whose volume can be easily adapted to the needs of the com-pany. firms that use the full format are required to record temporary agency staff in an ad-hoc table (3). the declaring firm has to mention not only the number of FTEs but also the number of hours worked. Since these headings are not completed by firms filing an abbreviated format and those that do file full-format balance sheets do not always fill them out systematically and correctly, the volume of temporary agency work recorded in the social balance sheets only account for a fraction – 50 % in 2014 – of that registered by federgon, the federation of Hr service providers.
for the analysis of the volume of employment, heading 1053 was chosen, giving the volume of employment ex-pressed in FTEs at the end of the financial year, because it is broken down by various interesting characteristics. It should nevertheless be borne in mind that this volume is calculated on the basis of contractual working time, and that the actual working hours may deviate from this at certain times, for the various reasons mentioned earlier.
1.1 Analysis population
1.1.1 Selection of firms
As is customary with the annual social balance sheet publication, the population of firms taken into considera-tion for the analysis is a cleaned-up sample population compared with the total group of firms that file a social balance sheet with the Central Balance Sheet Office.
For the sake of uniformity and consistency of the findings, only social balance sheets relating to a twelve-month ac-counting period ending on 31 December are taken into consideration. requiring an accounting year correspond-ing to the calendar year puts a considerable limitation on the population. For the financial year 2014, 15 % of the declarants – taking up the same proportion of workers – actually ended their accounting year on a different date from 31 December. These proportions vary considerably between branches of activity : almost one-third of the vol-ume of employment is excluded from the analysis popula-tion in trade and transport, while the proportion drops to less than 3 % in the health and social work branch.
companies also have to meet certain criteria regarding business activity (they must be from the private sector (4) ; their economic activity must be clearly identified ; they may not be in nAcE-BEl branches 84 – public administration
(1) for the purposes of calculating this heading, a full-time employee is counted as one unit, while a part-time worker is recorded in proportion to his / her working time, by comparison with a full-time employee in the firm or doing the same job as the worker concerned. The proportion is calculated in accordance with the part-time worker’s employment contract.
(2) This is why many firms in the distribution sector close their accounting year in september, outside the (pre-)sales and christmas shopping periods. on the other hand, many farming sector companies close their financial year at the end of the calendar year, a quieter business period.
(3) this also registers the number of people seconded to one company by another firm. A worker from a company seconded to another firm, both of them filling a social balance sheet, is recorded twice : on the one hand in heading 1003 of the ‘lending’ company and, on the other hand, in heading 1502 of the user company. this leads to double-counting.
(4) Employment in the private sector is defined as employment recorded in the total economy (S.1), from which employment in the public sector (S.13) and the household sector (s.14) is subtracted.
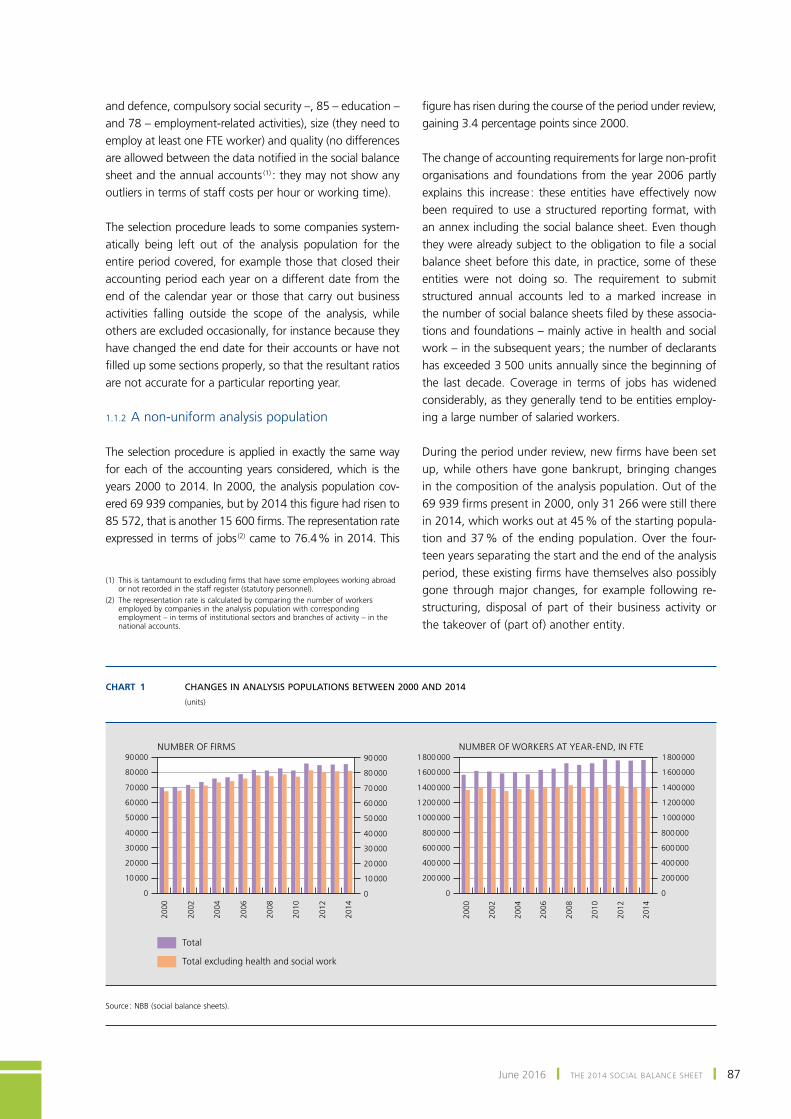
June 2016 ❙ THE 2014 SOCIAL BALANCE SHEET ❙ 87
and defence, compulsory social security –, 85 – education – and 78 – employment-related activities), size (they need to employ at least one FTE worker) and quality (no differences are allowed between the data notified in the social balance sheet and the annual accounts (1) : they may not show any outliers in terms of staff costs per hour or working time).
the selection procedure leads to some companies system-atically being left out of the analysis population for the entire period covered, for example those that closed their accounting period each year on a different date from the end of the calendar year or those that carry out business activities falling outside the scope of the analysis, while others are excluded occasionally, for instance because they have changed the end date for their accounts or have not filled up some sections properly, so that the resultant ratios are not accurate for a particular reporting year.
1.1.2 A non-uniform analysis population
the selection procedure is applied in exactly the same way for each of the accounting years considered, which is the years 2000 to 2014. In 2000, the analysis population cov-ered 69 939 companies, but by 2014 this figure had risen to 85 572, that is another 15 600 firms. The representation rate expressed in terms of jobs (2) came to 76.4 % in 2014. This
figure has risen during the course of the period under review, gaining 3.4 percentage points since 2000.
The change of accounting requirements for large non-profit organisations and foundations from the year 2006 partly explains this increase : these entities have effectively now been required to use a structured reporting format, with an annex including the social balance sheet. Even though they were already subject to the obligation to file a social balance sheet before this date, in practice, some of these entities were not doing so. the requirement to submit structured annual accounts led to a marked increase in the number of social balance sheets filed by these associa-tions and foundations – mainly active in health and social work – in the subsequent years ; the number of declarants has exceeded 3 500 units annually since the beginning of the last decade. coverage in terms of jobs has widened considerably, as they generally tend to be entities employ-ing a large number of salaried workers.
During the period under review, new firms have been set up, while others have gone bankrupt, bringing changes in the composition of the analysis population. out of the 69 939 firms present in 2000, only 31 266 were still there in 2014, which works out at 45 % of the starting popula-tion and 37 % of the ending population. Over the four-teen years separating the start and the end of the analysis period, these existing firms have themselves also possibly gone through major changes, for example following re-structuring, disposal of part of their business activity or the takeover of (part of) another entity.
(1) This is tantamount to excluding firms that have some employees working abroad or not recorded in the staff register (statutory personnel).
(2) The representation rate is calculated by comparing the number of workers employed by companies in the analysis population with corresponding employment – in terms of institutional sectors and branches of activity – in the national accounts.
Chart 1 CHANGES IN ANALYSIS POPULATIONS BETWEEN 2000 AND 2014
(units)
2000
2002
2004
2006
2008
2010
2012
2014
0
10 000
20 000
30 000
40 000
50 000
60 000
70 000
80 000
90 000
0
10 000
20 000
30 000
40 000
50 000
60 000
70 000
80 000
90 000
2000
2002
2004
2006
2008
2010
2012
2014
0
200 000
400 000
600 000
800 000
1 000 000
1 200 000
1 400 000
1 600 000
1 800 000
0
200 000
400 000
600 000
800 000
1 000 000
1 200 000
1 400 000
1 600 000
1 800 000
Total
Total excluding health and social work
NUMBER OF FIRMS NUMBER OF WORKERS AT YEAR-END, IN FTE
source : nBB (social balance sheets).
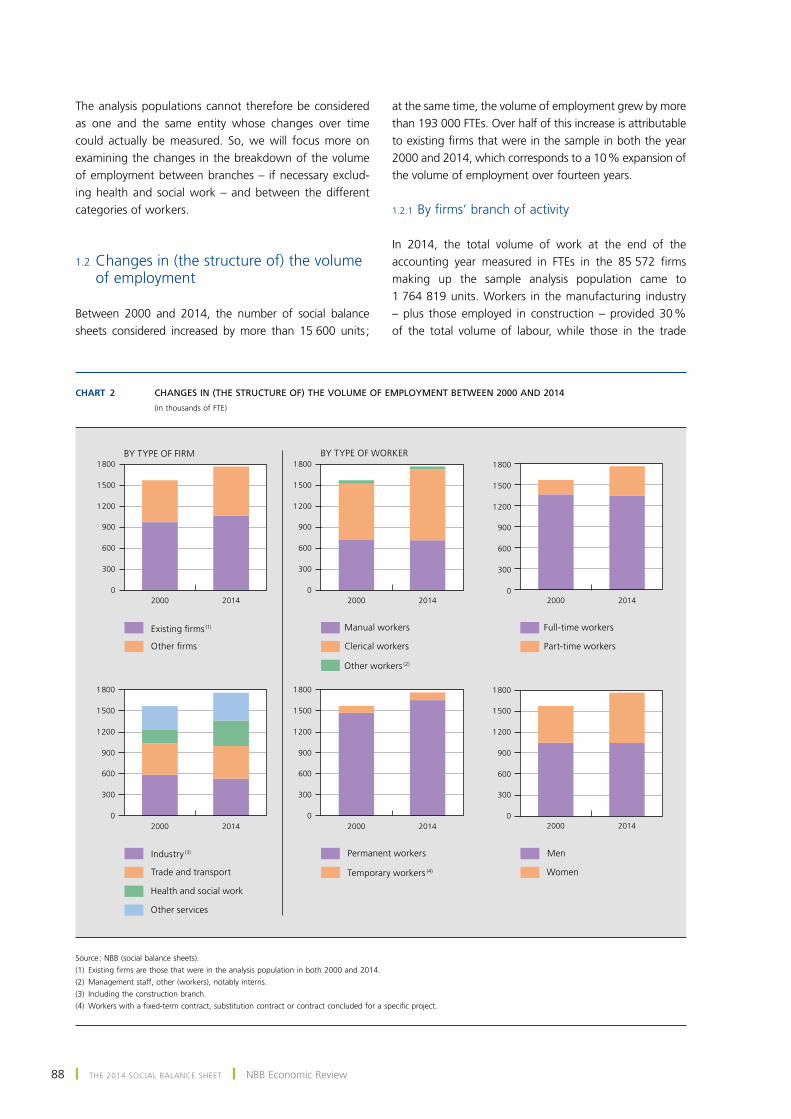
88 ❙ THE 2014 SOCIAL BALANCE SHEET ❙ nBB Economic review
the analysis populations cannot therefore be considered as one and the same entity whose changes over time could actually be measured. so, we will focus more on examining the changes in the breakdown of the volume of employment between branches – if necessary exclud-ing health and social work – and between the different categories of workers.
1.2 changes in (the structure of) the volume of employment
Between 2000 and 2014, the number of social balance sheets considered increased by more than 15 600 units ;
at the same time, the volume of employment grew by more than 193 000 FTEs. Over half of this increase is attributable to existing firms that were in the sample in both the year 2000 and 2014, which corresponds to a 10 % expansion of the volume of employment over fourteen years.
1.2.1 By firms’ branch of activity
In 2014, the total volume of work at the end of the accounting year measured in FTEs in the 85 572 firms making up the sample analysis population came to 1 764 819 units. Workers in the manufacturing industry – plus those employed in construction – provided 30 % of the total volume of labour, while those in the trade
Chart 2 CHANGES IN (THE STRUCTURE OF) THE VOLUME OF EMPLOYMENT BETWEEN 2000 AND 2014
(in thousands of FTE)
2000 20140
300
600
900
1 200
1 500
1 800
2000 20140
300
600
900
1 200
1 500
1 800
2000 20140
300
600
900
1 200
1 500
1 800
2000 20140
300
600
900
1 200
1 500
1 800
2000 20140
300
600
900
1 200
1 500
1 800
2000 20140
300
600
900
1 200
1 500
1 800
Other firms
Existing firms (1)
Industry (3)
Trade and transport
Manual workers
Clerical workers
Health and social work
Other services
Other workers (2)
Full-time workers
Part-time workers
Permanent workers
Temporary workers (4)
Men
Women
BY TYPE OF FIRM BY TYPE OF WORKER
source : nBB (social balance sheets).(1) Existing firms are those that were in the analysis population in both 2000 and 2014.(2) Management staff, other (workers), notably interns.(3) including the construction branch.(4) Workers with a fixed-term contract, substitution contract or contract concluded for a specific project.
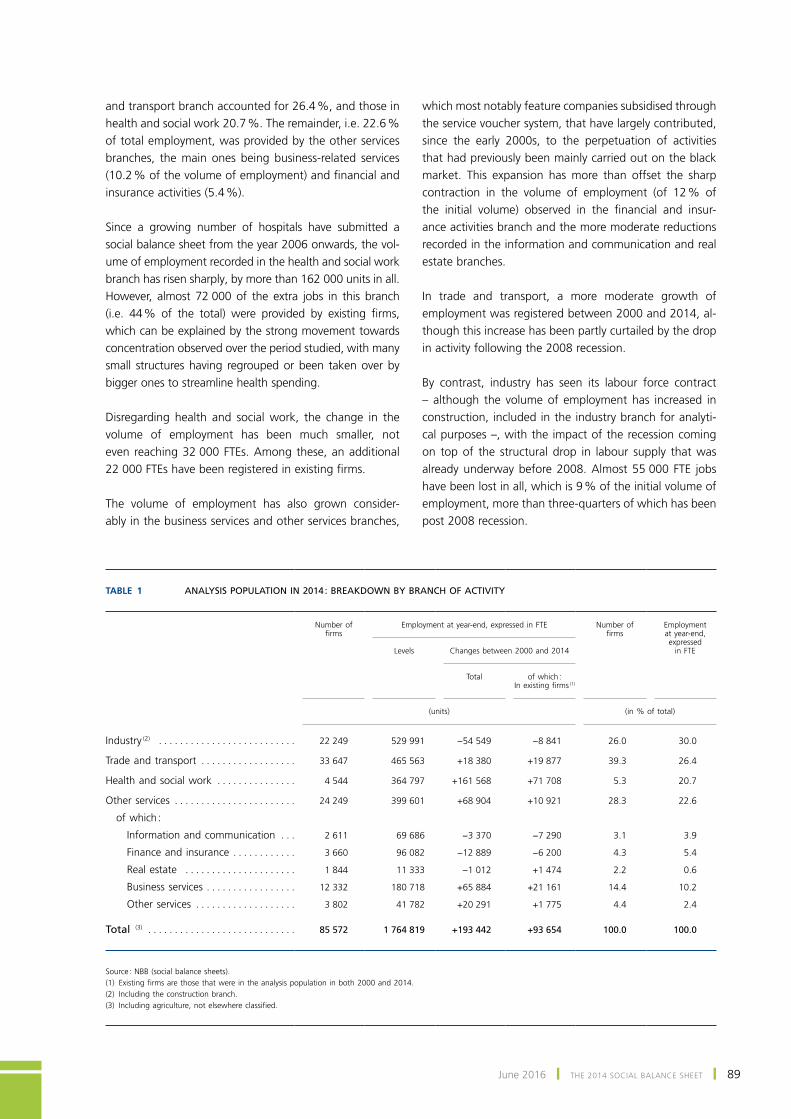
June 2016 ❙ THE 2014 SOCIAL BALANCE SHEET ❙ 89
and transport branch accounted for 26.4 %, and those in health and social work 20.7 %. The remainder, i.e. 22.6 % of total employment, was provided by the other services branches, the main ones being business-related services (10.2 % of the volume of employment) and financial and insurance activities (5.4 %).
since a growing number of hospitals have submitted a social balance sheet from the year 2006 onwards, the vol-ume of employment recorded in the health and social work branch has risen sharply, by more than 162 000 units in all. However, almost 72 000 of the extra jobs in this branch (i.e. 44 % of the total) were provided by existing firms, which can be explained by the strong movement towards concentration observed over the period studied, with many small structures having regrouped or been taken over by bigger ones to streamline health spending.
Disregarding health and social work, the change in the volume of employment has been much smaller, not even reaching 32 000 FTEs. Among these, an additional 22 000 FTEs have been registered in existing firms.
the volume of employment has also grown consider-ably in the business services and other services branches,
which most notably feature companies subsidised through the service voucher system, that have largely contributed, since the early 2000s, to the perpetuation of activities that had previously been mainly carried out on the black market. This expansion has more than offset the sharp contraction in the volume of employment (of 12 % of the initial volume) observed in the financial and insur-ance activities branch and the more moderate reductions recorded in the information and communication and real estate branches.
in trade and transport, a more moderate growth of employment was registered between 2000 and 2014, al-though this increase has been partly curtailed by the drop in activity following the 2008 recession.
By contrast, industry has seen its labour force contract – although the volume of employment has increased in construction, included in the industry branch for analyti-cal purposes –, with the impact of the recession coming on top of the structural drop in labour supply that was already underway before 2008. Almost 55 000 FTE jobs have been lost in all, which is 9 % of the initial volume of employment, more than three-quarters of which has been post 2008 recession.
TABLE 1 ANALYSIS POPULATION IN 2014 : BREAKDOWN BY BRANCH OF ACTIVITY
Number of firms
Employment at year-end, expressed in FTE
Number of firms
Employment at year-end, expressed
in FTE
Levels
Changes between 2000 and 2014
Total
of which : In existing firms (1)
(units)
(in % of total)
Industry (2) . . . . . . . . . . . . . . . . . . . . . . . . . . 22 249 529 991 −54 549 −8 841 26.0 30.0
Trade and transport . . . . . . . . . . . . . . . . . . 33 647 465 563 +18 380 +19 877 39.3 26.4
Health and social work . . . . . . . . . . . . . . . 4 544 364 797 +161 568 +71 708 5.3 20.7
Other services . . . . . . . . . . . . . . . . . . . . . . . 24 249 399 601 +68 904 +10 921 28.3 22.6
of which :
Information and communication . . . 2 611 69 686 −3 370 −7 290 3.1 3.9
Finance and insurance . . . . . . . . . . . . 3 660 96 082 −12 889 −6 200 4.3 5.4
Real estate . . . . . . . . . . . . . . . . . . . . . 1 844 11 333 −1 012 +1 474 2.2 0.6
Business services . . . . . . . . . . . . . . . . . 12 332 180 718 +65 884 +21 161 14.4 10.2
Other services . . . . . . . . . . . . . . . . . . . 3 802 41 782 +20 291 +1 775 4.4 2.4
Total (3) . . . . . . . . . . . . . . . . . . . . . . . . . . . . 85 572 1 764 819 +193 442 +93 654 100.0 100.0
Source : NBB (social balance sheets).(1) Existing firms are those that were in the analysis population in both 2000 and 2014.(2) Including the construction branch.(3) Including agriculture, not elsewhere classified.
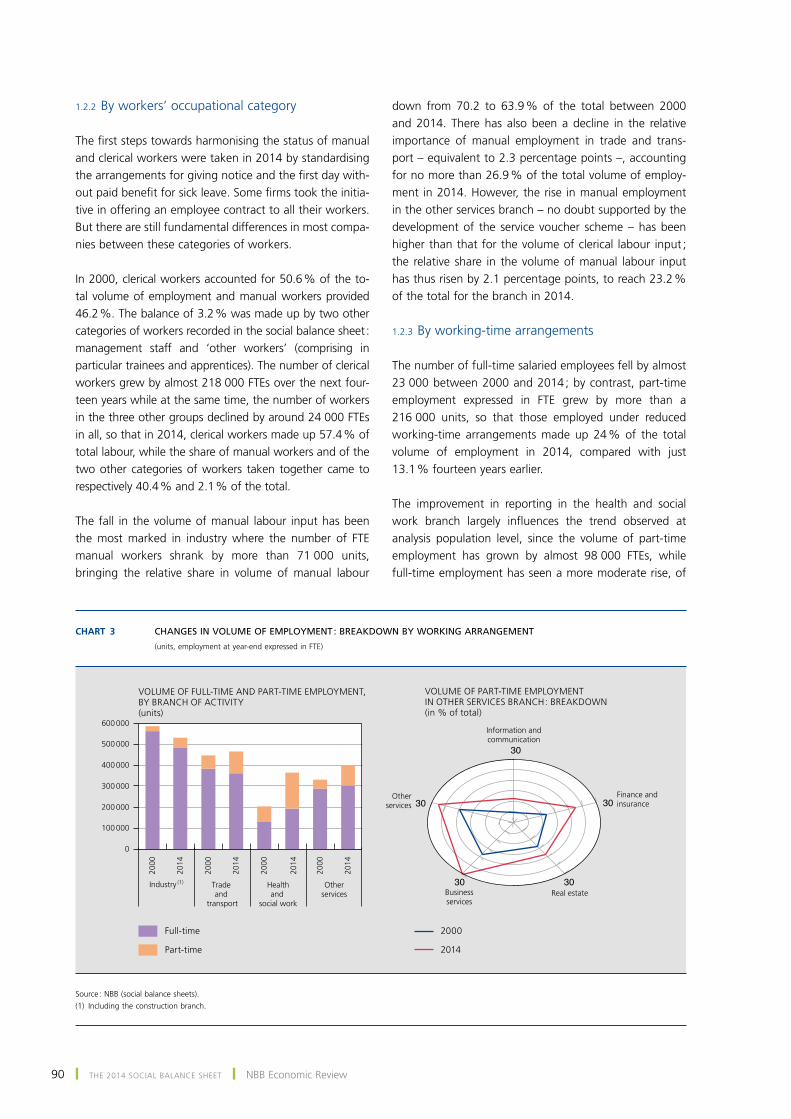
90 ❙ THE 2014 SOCIAL BALANCE SHEET ❙ nBB Economic review
1.2.2 By workers’ occupational category
The first steps towards harmonising the status of manual and clerical workers were taken in 2014 by standardising the arrangements for giving notice and the first day with-out paid benefit for sick leave. Some firms took the initia-tive in offering an employee contract to all their workers. But there are still fundamental differences in most compa-nies between these categories of workers.
In 2000, clerical workers accounted for 50.6 % of the to-tal volume of employment and manual workers provided 46.2 %. The balance of 3.2 % was made up by two other categories of workers recorded in the social balance sheet : management staff and ‘other workers’ (comprising in particular trainees and apprentices). the number of clerical workers grew by almost 218 000 FTEs over the next four-teen years while at the same time, the number of workers in the three other groups declined by around 24 000 FTEs in all, so that in 2014, clerical workers made up 57.4 % of total labour, while the share of manual workers and of the two other categories of workers taken together came to respectively 40.4 % and 2.1 % of the total.
the fall in the volume of manual labour input has been the most marked in industry where the number of FTE manual workers shrank by more than 71 000 units, bringing the relative share in volume of manual labour
down from 70.2 to 63.9 % of the total between 2000 and 2014. there has also been a decline in the relative importance of manual employment in trade and trans-port – equivalent to 2.3 percentage points –, accounting for no more than 26.9 % of the total volume of employ-ment in 2014. However, the rise in manual employment in the other services branch – no doubt supported by the development of the service voucher scheme – has been higher than that for the volume of clerical labour input ; the relative share in the volume of manual labour input has thus risen by 2.1 percentage points, to reach 23.2 % of the total for the branch in 2014.
1.2.3 By working-time arrangements
the number of full-time salaried employees fell by almost 23 000 between 2000 and 2014 ; by contrast, part-time employment expressed in ftE grew by more than a 216 000 units, so that those employed under reduced working-time arrangements made up 24 % of the total volume of employment in 2014, compared with just 13.1 % fourteen years earlier.
the improvement in reporting in the health and social work branch largely influences the trend observed at analysis population level, since the volume of part-time employment has grown by almost 98 000 FTEs, while full-time employment has seen a more moderate rise, of
Chart 3 CHANGES IN VOLUME OF EMPLOYMENT : BREAKDOWN BY WORKING ARRANGEMENT
(units, employment at year-end expressed in ftE)
2000
2014
2000
2014
2000
2014
2000
2014
0
100 000
200 000
300 000
400 000
500 000
600 000
30
30
3030
30
Full-time
Part-time
Industry (1) Trade
and transport
Healthand
social work
Otherservices
2014
2000
VOLUME OF PART-TIME EMPLOYMENTIN OTHER SERVICES BRANCH : BREAKDOWN(in % of total)
VOLUME OF FULL-TIME AND PART-TIME EMPLOYMENT,BY BRANCH OF ACTIVITY(units)
Information andcommunication
Finance andinsurance
Real estateBusinessservices
Otherservices
source : nBB (social balance sheets).(1) including the construction branch.
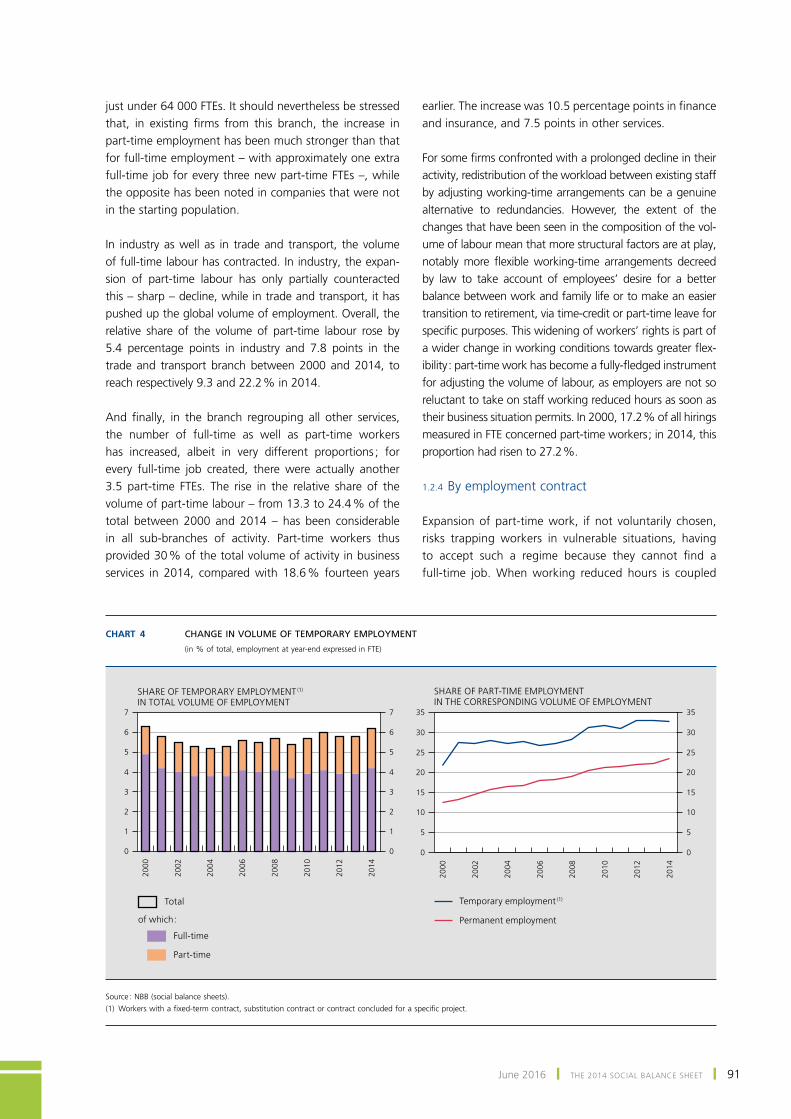
June 2016 ❙ THE 2014 SOCIAL BALANCE SHEET ❙ 91
just under 64 000 FTEs. It should nevertheless be stressed that, in existing firms from this branch, the increase in part-time employment has been much stronger than that for full-time employment – with approximately one extra full-time job for every three new part-time ftEs –, while the opposite has been noted in companies that were not in the starting population.
in industry as well as in trade and transport, the volume of full-time labour has contracted. in industry, the expan-sion of part-time labour has only partially counteracted this – sharp – decline, while in trade and transport, it has pushed up the global volume of employment. overall, the relative share of the volume of part-time labour rose by 5.4 percentage points in industry and 7.8 points in the trade and transport branch between 2000 and 2014, to reach respectively 9.3 and 22.2 % in 2014.
And finally, in the branch regrouping all other services, the number of full-time as well as part-time workers has increased, albeit in very different proportions ; for every full-time job created, there were actually another 3.5 part-time FTEs. The rise in the relative share of the volume of part-time labour – from 13.3 to 24.4 % of the total between 2000 and 2014 – has been considerable in all sub-branches of activity. Part-time workers thus provided 30 % of the total volume of activity in business services in 2014, compared with 18.6 % fourteen years
earlier. The increase was 10.5 percentage points in finance and insurance, and 7.5 points in other services.
For some firms confronted with a prolonged decline in their activity, redistribution of the workload between existing staff by adjusting working-time arrangements can be a genuine alternative to redundancies. However, the extent of the changes that have been seen in the composition of the vol-ume of labour mean that more structural factors are at play, notably more flexible working-time arrangements decreed by law to take account of employees’ desire for a better balance between work and family life or to make an easier transition to retirement, via time-credit or part-time leave for specific purposes. This widening of workers’ rights is part of a wider change in working conditions towards greater flex-ibility : part-time work has become a fully-fledged instrument for adjusting the volume of labour, as employers are not so reluctant to take on staff working reduced hours as soon as their business situation permits. In 2000, 17.2 % of all hirings measured in FTE concerned part-time workers ; in 2014, this proportion had risen to 27.2 %.
1.2.4 By employment contract
Expansion of part-time work, if not voluntarily chosen, risks trapping workers in vulnerable situations, having to accept such a regime because they cannot find a full-time job. When working reduced hours is coupled
Chart 4 CHANGE IN VOLUME OF TEMPORARY EMPLOYMENT
(in % of total, employment at year-end expressed in FTE)
2000
2002
2004
2006
2008
2010
2012
2014
0
1
2
3
4
5
6
7
0
1
2
3
4
5
6
7
2000
2002
2004
2006
2008
2010
2012
2014
0
5
10
15
20
25
30
35
0
5
10
15
20
25
30
35
Full-time
Part-time
SHARE OF TEMPORARY EMPLOYMENT (1)
IN TOTAL VOLUME OF EMPLOYMENT
Permanent employment
Temporary employment (1)
SHARE OF PART-TIME EMPLOYMENT IN THE CORRESPONDING VOLUME OF EMPLOYMENT
Total
of which :
source : nBB (social balance sheets).(1) Workers with a fixed-term contract, substitution contract or contract concluded for a specific project.
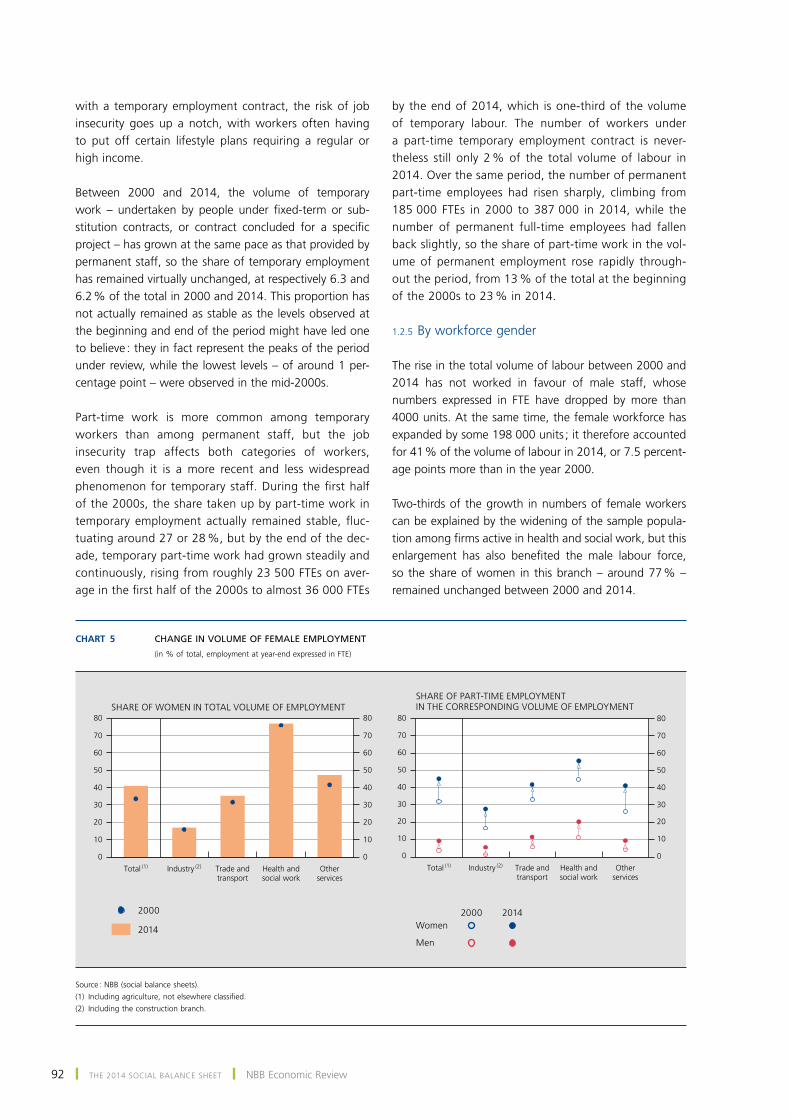
92 ❙ THE 2014 SOCIAL BALANCE SHEET ❙ nBB Economic review
with a temporary employment contract, the risk of job insecurity goes up a notch, with workers often having to put off certain lifestyle plans requiring a regular or high income.
Between 2000 and 2014, the volume of temporary work – undertaken by people under fixed-term or sub-stitution contracts, or contract concluded for a specific project – has grown at the same pace as that provided by permanent staff, so the share of temporary employment has remained virtually unchanged, at respectively 6.3 and 6.2 % of the total in 2000 and 2014. This proportion has not actually remained as stable as the levels observed at the beginning and end of the period might have led one to believe : they in fact represent the peaks of the period under review, while the lowest levels – of around 1 per-centage point – were observed in the mid-2000s.
Part-time work is more common among temporary workers than among permanent staff, but the job insecurity trap affects both categories of workers, even though it is a more recent and less widespread phenomenon for temporary staff. During the first half of the 2000s, the share taken up by part-time work in temporary employment actually remained stable, fluc-tuating around 27 or 28 %, but by the end of the dec-ade, temporary part-time work had grown steadily and continuously, rising from roughly 23 500 FTEs on aver-age in the first half of the 2000s to almost 36 000 FTEs
by the end of 2014, which is one-third of the volume of temporary labour. The number of workers under a part-time temporary employment contract is never-theless still only 2 % of the total volume of labour in 2014. over the same period, the number of permanent part-time employees had risen sharply, climbing from 185 000 FTEs in 2000 to 387 000 in 2014, while the number of permanent full-time employees had fallen back slightly, so the share of part-time work in the vol-ume of permanent employment rose rapidly through-out the period, from 13 % of the total at the beginning of the 2000s to 23 % in 2014.
1.2.5 By workforce gender
The rise in the total volume of labour between 2000 and 2014 has not worked in favour of male staff, whose numbers expressed in ftE have dropped by more than 4000 units. At the same time, the female workforce has expanded by some 198 000 units ; it therefore accounted for 41 % of the volume of labour in 2014, or 7.5 percent-age points more than in the year 2000.
Two-thirds of the growth in numbers of female workers can be explained by the widening of the sample popula-tion among firms active in health and social work, but this enlargement has also benefited the male labour force, so the share of women in this branch – around 77 % – remained unchanged between 2000 and 2014.
Chart 5 CHANGE IN VOLUME OF FEMALE EMPLOYMENT
(in % of total, employment at year-end expressed in FTE)
0
10
20
30
40
50
60
70
80
0
10
20
30
40
50
60
70
80
2014
0
10
20
30
40
50
60
70
80
0
10
20
30
40
50
60
70
80
201420002000
Total (1) Industry (2) Trade and
transportHealth andsocial work
Otherservices
SHARE OF WOMEN IN TOTAL VOLUME OF EMPLOYMENTSHARE OF PART-TIME EMPLOYMENT IN THE CORRESPONDING VOLUME OF EMPLOYMENT
Total (1) Industry (2) Trade and
transportHealth andsocial work
Otherservices
Women
Men
source : nBB (social balance sheets).(1) Including agriculture, not elsewhere classified.(2) including the construction branch.
June 2016 ❙ THE 2014 SOCIAL BALANCE SHEET ❙ 93
Outside health and social work, the volume of male labour has fallen by 39 000 FTEs. It has declined by 51 000 units in industry and by around 5 000 units in trade and transport, which is more than the increase of al-most 18 000 FTEs registered in other services. By contrast, a rise in employment among women has been observed, except in industry, where the decline has nevertheless remained fairly small (about –3 600 FTEs). In the latter branch, the female labour force provided 17 % of the to-tal volume of labour in 2014, which is barely more than in 2000. in trade and transport, the contribution of women rose from 31 to 35 % of the total and it grew from 42 to 47 % in other services.
The expansion of part-time work has above all helped limit job losses among male workforces. Among women, on the other hand, it has been a real vector of develop-ment, because 81 % of the growth in the volume of female labour is based on employees working reduced hours. All in all, in 2014, 9.3 % of the volume of male labour was accounted for by part-time workers (against 3.7 % in 2000), whereas the proportion for women was 45.1 % (13.3 percentage points more than in 2000).
in industry, the volume of employment is still predomi-nantly male-based : men provided 80 % of the volume of labour in 2014, a figure that has scarcely dipped since 2000. A structural change in the workforce profile can nevertheless be observed : the volume of full-time male employment has dropped, while that of part-time em-ployment has risen. Among the female workforce, also in decline, a shift from full-time employment towards reduced working time can also be seen. So, while 96.2 % of the volume of labour was still made up of full-time workers in 2000 (83 % of men and 13.2 % of women), 9.2 % of the volume of labour was provided by part-time workers fourteen years later, half of whom were men.
Employment of women in trade and transport was already a lot more widespread than in industry at the beginning of the period under review : 31.5 % of the volume of work was done by women in the year 2000, a third of whom were part-timers. By 2014, the share of women had grown even further, to reach 35.3 % of the total, largely attributable to sustained growth of part-time employment. Among the men, too, part-time work has expanded while full-time work has declined, so that, in 2014, the latter only accounted for 57.2 % of the volume of labour in this branch, compared with 64.5 % at the beginning of the period surveyed.
In the health and social work branch, the widening of the analysis population in the end had only very little impact on the breakdown by gender. Women provided roughly
three-quarters of the total volume of employment in 2000 as in 2014, and in existing firms from the starting population just as the others. However, the branch did not escape the trend towards substitution between full-time and part-time. In 2000, 63.3 % of the volume of em-ployment was provided by full-time workers, two-thirds of whom were women ; in 2014, barely more than half (52.7 %) of this volume was still based on full-time work-ers. the share of male part-timers almost doubled (up from 11.2 to 20.3 % of the male workforce), but was still lower than that observed for women (55.4 % in 2014).
The volume of part-time work by women has expanded most particularly in the other services branch, thanks to the development of jobs paid for by service vouchers, while among male workers, the increase has remained more modest. In this branch, 41 % of the volume of female labour was carried out by part-time workers (compared with just over a quarter of the total in 2000) ; for men, this proportion was still below 10 % in 2014.
1.2.6 By worker education level
The breakdown of workforces by educational level has only been available since the 2008 financial year. Moreover, data for the first year of reporting are hard to use, as is often the case with the introduction of a new statistic requiring com-panies to set up the necessary instruments for recording new information. it is therefore only possible to measure changes in (the structure of) employment by level of edu-cation over a five-year period, between 2009 and 2014, which is relatively short, especially for a variable that is not very likely to change over time, unlike the work regime or employment contract, the nature of which can vary even in the short term depending on cyclical (following hirings and firings) or structural factors (such as changes in the law).
The volume of labour provided by workers with qualifica-tions of at most a certificate of primary education – that are traditionally referred to as ‘low-skilled’, regardless of their actual competence level and the job they do – fell between 2009 and 2014, while the volume attributable to workers with secondary – so-called ‘medium-skilled’ – or higher education diplomas – the ‘highly-skilled’ – has risen. An increase in the volume of labour provided by part-time employees can be observed for all skill levels – with the rise being particularly strong for the medium-skilled –, while the volume of work by full-timers has only risen for highly-skilled employees.
these trends, although limited in scale, have led to a shift in the distribution of the volume of labour in favour of highly-skilled workers, as older workers – who gener-ally tend to be less skilled – were gradually replaced by
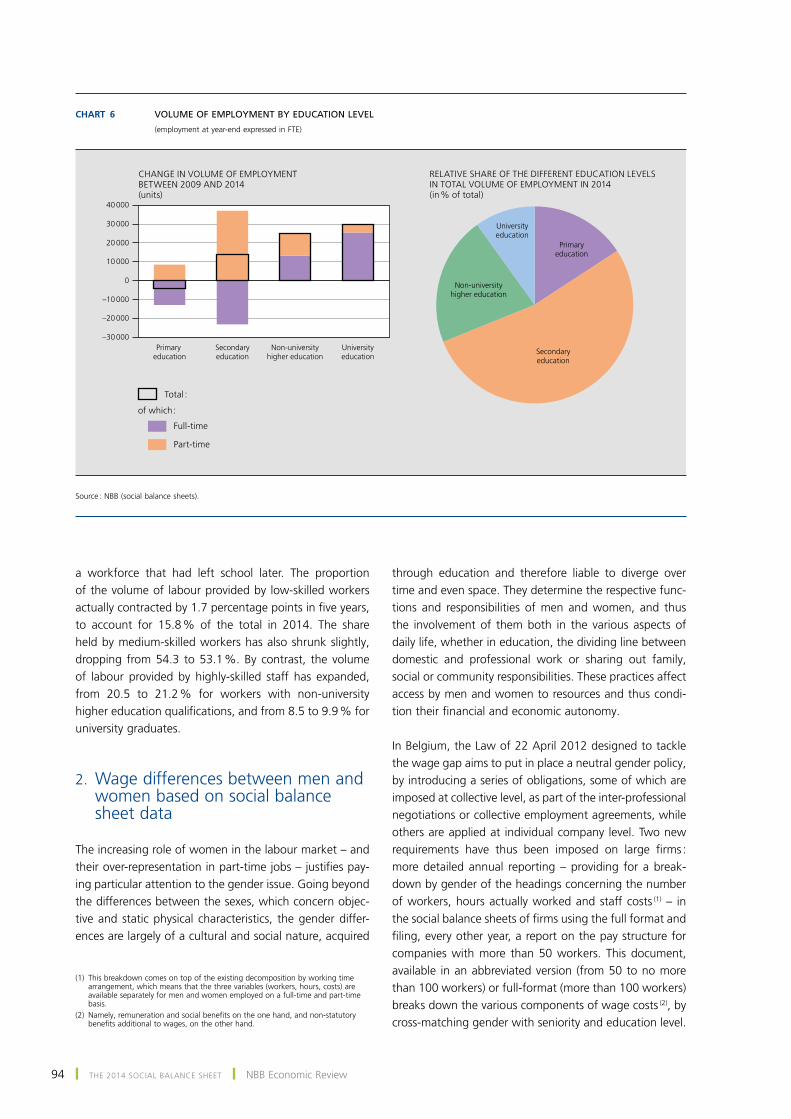
94 ❙ THE 2014 SOCIAL BALANCE SHEET ❙ nBB Economic review
a workforce that had left school later. The proportion of the volume of labour provided by low-skilled workers actually contracted by 1.7 percentage points in five years, to account for 15.8 % of the total in 2014. The share held by medium-skilled workers has also shrunk slightly, dropping from 54.3 to 53.1 %. By contrast, the volume of labour provided by highly-skilled staff has expanded, from 20.5 to 21.2 % for workers with non-university higher education qualifications, and from 8.5 to 9.9 % for university graduates.
2. Wage differences between men and women based on social balance sheet data
The increasing role of women in the labour market – and their over-representation in part-time jobs – justifies pay-ing particular attention to the gender issue. going beyond the differences between the sexes, which concern objec-tive and static physical characteristics, the gender differ-ences are largely of a cultural and social nature, acquired
through education and therefore liable to diverge over time and even space. they determine the respective func-tions and responsibilities of men and women, and thus the involvement of them both in the various aspects of daily life, whether in education, the dividing line between domestic and professional work or sharing out family, social or community responsibilities. these practices affect access by men and women to resources and thus condi-tion their financial and economic autonomy.
In Belgium, the Law of 22 April 2012 designed to tackle the wage gap aims to put in place a neutral gender policy, by introducing a series of obligations, some of which are imposed at collective level, as part of the inter-professional negotiations or collective employment agreements, while others are applied at individual company level. two new requirements have thus been imposed on large firms : more detailed annual reporting – providing for a break-down by gender of the headings concerning the number of workers, hours actually worked and staff costs (1) – in the social balance sheets of firms using the full format and filing, every other year, a report on the pay structure for companies with more than 50 workers. This document, available in an abbreviated version (from 50 to no more than 100 workers) or full-format (more than 100 workers) breaks down the various components of wage costs (2), by cross-matching gender with seniority and education level.
(1) This breakdown comes on top of the existing decomposition by working time arrangement, which means that the three variables (workers, hours, costs) are available separately for men and women employed on a full-time and part-time basis.
(2) Namely, remuneration and social benefits on the one hand, and non-statutory benefits additional to wages, on the other hand.
Chart 6 VOLUME OF EMPLOYMENT BY EDUCATION LEVEL
(employment at year-end expressed in ftE)
–30 000
–20 000
–10 000
0
10 000
20 000
30 000
40 000
Full-time
Part-time
CHANGE IN VOLUME OF EMPLOYMENT BETWEEN 2009 AND 2014(units)
Primaryeducation
Secondaryeducation
Non-universityhigher education
Universityeducation
RELATIVE SHARE OF THE DIFFERENT EDUCATION LEVELSIN TOTAL VOLUME OF EMPLOYMENT IN 2014(in % of total)
Primary education
Secondaryeducation
Non-universityhigher education
Universityeducation
Total :
of which :
source : nBB (social balance sheets).
June 2016 ❙ THE 2014 SOCIAL BALANCE SHEET ❙ 95
For the full-format forms, there is also a breakdown cross-checking gender and function. The companies must also state whether an action plan in favour of a gender-neutral remuneration policy has been put in place. if necessary, this plan must be annexed to the report and subject to an assessment in the next report.
the amendment of the full-format social balance sheets has applied from financial years approved after 7 September 2012. The first report on pay structure was introduced later : exceptionally, it can only cover one sin-gle accounting year, i.e. 2014. Unlike the report on pay structure, which is an internal document whose contents remain confidential even though it is submitted to the FPS Employment, labour and social Dialogue, the contents of the social balance sheet, filed with the Central Balance Sheet Office at the same time as the annual accounts, are made public, which enables it to be used for the analysis.
An examination of differences between staff costs in-curred for female staff and those related to the male workforce in large enterprises in Belgium in 2012 had been covered in a chapter of the article on "the 2012 social balance sheet", which appeared in the Bank’s December 2013 Economic Review. The following sections set out the findings for the year 2014. The chapter differs from the 2012 study on several points. As section 1 will show, the analysis population is much smaller, owing to the many reporting errors and approximations noted in the individual social balance sheets. the macroeconomic findings presented in section 2 concern all workers, re-gardless of their working arrangements, even if this in-formation is available, because the quality of the observa-tions is even less reliable when smaller groups of workers are concerned. Section 3 underlines the dispersion of the individual results and differences in behaviour observed on the basis of firm size and branch of activity.
the social balance sheet headings that are used to calcu-late the wage gap are respectively heading 1023 on staff costs and heading 1013 on hours actually worked, broken down by gender.
staff costs comprise not only remuneration and direct social benefits paid out (such as luncheon vouchers) but also em-ployers’ social security contributions, employers’ premium payments for non-statutory insurance (group insurance, hospital insurance, etc.), other staff costs (notably clothing
and food expenses, corporate gifts or staff parties) and em-ployers’ payments for retirement and survivors’ pensions, as well as supplementary occupational pensions (1). so, this variable covers a lot more than gross salaries paid out to staff. However, benefits additional to wages, included in heading 1033 of the social balance sheet, have not been taken into consideration here, because they are not sys-tematically reported by companies, making it difficult to estimate how representative they are.
The number of hours actually worked includes the total hours effectively worked and remunerated during the year, that is, without taking account of unpaid overtime, holidays, sick leave, short absences and hours lost through strikes or for other reasons.
there may be some deviations between staff costs borne by employers and hours actually worked by employees, for example when salaries continue to be paid to employ-ees on sick leave despite their absence from work. On the whole, these gaps are small, so the comparison between hours worked and expenses incurred is still valid.
the indicator used in this study measures the difference between the pay situation for the whole female workforce and for all male workers using the following formula :
hourly wage costs observed for women100 – hourly wage costs observed for men ( (x 100
A positive gap indicates that the figure observed for women is below that observed for men.
it should be noted that a gap, whether positive or negative, is not necessarily a sign of different treatment between men and women. At macroeonomic level, it in fact partly reflects structural differences, for instance, the fact that women are more often employed in branches of activity where wages are below average, or that they are more likely to opt for a part-time working arrangement, which could slow up their salary progression and their access to better paid, higher functions. At microeonomic level, it may simply reflect the fact that male and female staff are not on the same seniority or education scales or do not do the same jobs.
2.1 Analysis population
2.1.1 Selection of firms
In 2014, 13 547 firms had submitted a full-format bal-ance sheet of the quality required for inclusion in the population selected for analysis (see detailed meth-odology in Annex 1). However, the wage gap analysis
(1) Benefits paid out in addition to wages – which are included in heading 1033 and are also broken down by gender but not by work regime – are not taken into consideration in this analysis. These concern social benefits allocated for a specific social purpose or with a view to improving relations between staff members or strengthening their ties with the company. Among these benefits are, most notably, wedding and christening presents, services provided by a crèche or sports or cultural facilities, a medical centre or a central purchasing office.
96 ❙ THE 2014 SOCIAL BALANCE SHEET ❙ nBB Economic review
described here is based on a much smaller population totalling just under 2 000 firms. Various filters were used to obtain that selection.
The gender breakdown of the items relating to personnel, hours and costs is compulsory for all firms submitting a full-format balance sheet, but the Law of 2012 specifies that where the number of workers concerned is no more than three, the item need not be broken down, the pur-pose being to safeguard the privacy of the workers. The data from the many firms taking that option cannot be used for the analysis because the breakdown is missing or incomplete. Consequently, the analysis only took account of companies with at least three persons in each of the four groups of workers for which the gender breakdown is stipulated, namely full-time male employees, part-time male employees, full-time female employees and part-time female employees. As a result, the companies con-sidered have at least twelve workers.
the second selection criterion concerns reporting quality : the statistics are still relatively new and there are many errors in the gender breakdowns, leading to discrepancies between the reported totals and the sum of the individual items, or to anomalous results. firms exhibiting such prob-lems were discarded.
Finally, a great many firms – in this case around a quarter of them – used the same formula for the breakdown of hours worked and staff costs between the said four categories of workers, so that the average hourly costs are exactly the same for these four groups and the wage gap between women and men is zero. At individual level, the aim is to ensure "equal pay for equal work", but in practice that equality is likely to be found in only a very small number of companies. In the case of the firms se-lected – employing twelve or more workers –, it would in fact mean that the characteristics of the four groups of workers are exactly the same in terms of seniority, skills and functions, or that on average the results are down to luck. Firms reporting exactly the same staff costs per hour worked for the four groups of workers were therefore contacted by post (1). A few of them submitted revised data ; the rest were excluded.
On completion of this refinement process the analy-sis population comprised 1 959 companies for 2014. Together they employed 870 558 workers, or 43.1 % of the workforce of firms whose social balance sheets were used in the study presented in chapter 1.
2.1.2 characteristics of the analysis population
The firms selected were grouped according to their branch of activity and their size. firms in the industry branch, which also include those in the construction sector, are the most numerous (equivalent to 32.4 % of the total) while there are fewer firms in health and social work (barely 16.1 % of the total) ; trade and transport and the other services branch each account for just over 20 % of companies. Nonetheless, in terms of personnel employed, firms in the health and social work branch are larger on average than those in the other branches. in the analysis population they employ just under one in three of the workers (30.1 %), while industrial firms employ just over one in four of the workers (27.2 %) ; the other two branches each employ roughly one in five. Whatever their activity, "small" firms as defined for this analysis (i.e. those with fewer than 250 FTEs) are twice as numerous as "large" firms (employing 250 FTEs or more), but the latter account for approximately 80 % of workers in each branch. it should be noted that women predominate in health and social work, where they represent around 80 % of employees, while men make up the majority of the workforce in industry. In the other two branches, around four out of ten workers are women.
the analysis population varies from year to year, even over the brief 3-year period for which the gender break-down allowing to calculate the wage gap is available. in 2012, some firms did not fulfil their reporting obligations, while in other cases the quality of the gender break-downs proved inadequate, so that the coverage of the analysis population in terms of both firms and employ-ment improved considerably between 2012 and 2014. The 1 713 firms examined in 2012 employed around 735 000 workers, whereas the 1 959 firms selected in 2014 employed just over 870 000 people, an increase of 246 firms and 135 000 employees. Some very large companies – notably bpost and Delhaize, which together totalled around 47 000 jobs in 2014 – could not be taken into consideration in 2012.
to remove this bias, the results are also presented for a constant population, namely a total of just over a thousand firms which submitted social balance sheets meeting the selection criteria for all three years : 2012, 2013 and 2014. In 2014, they employed just under 530 000 workers.
2.2 Average wage gap : macroeconomic measurement
At macroeconomic level, the wage gap measures the difference between the average hourly labour cost
(1) More than 800 companies were thus contacted in order to improve the representativeness of the analysis. Fewer than 100 answered the letter sent to them. Around 60 firms sent revised data.
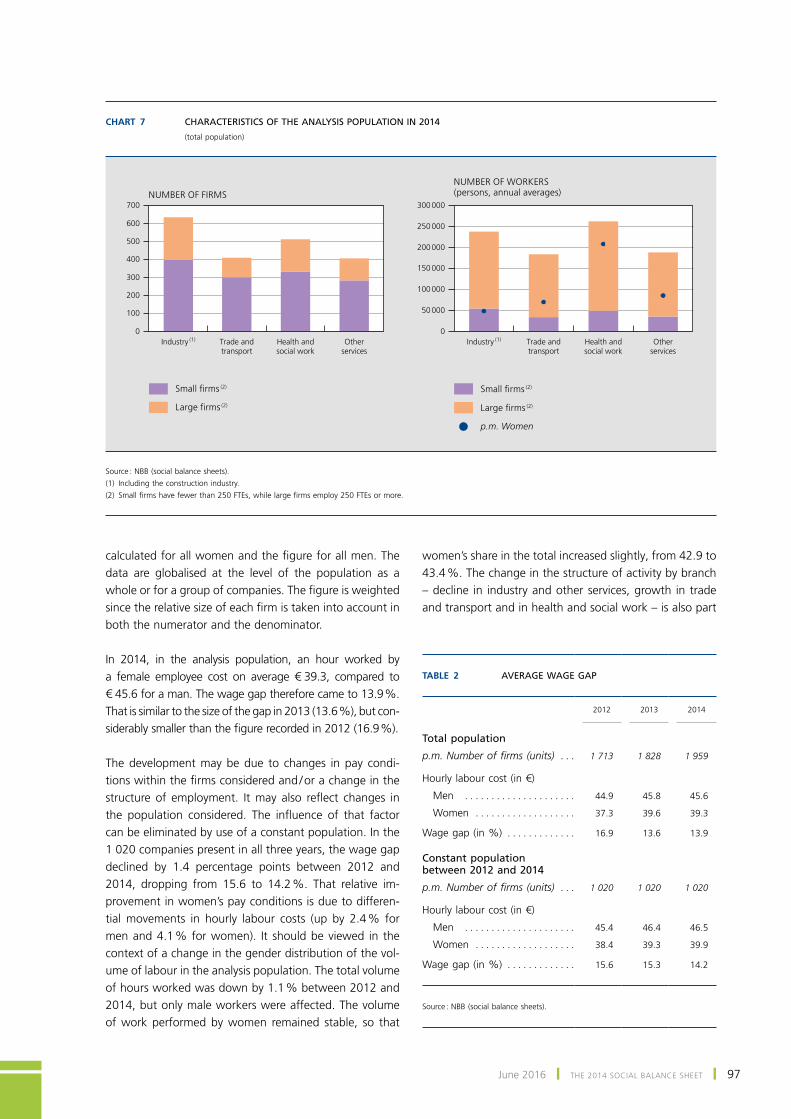
June 2016 ❙ THE 2014 SOCIAL BALANCE SHEET ❙ 97
calculated for all women and the figure for all men. The data are globalised at the level of the population as a whole or for a group of companies. The figure is weighted since the relative size of each firm is taken into account in both the numerator and the denominator.
In 2014, in the analysis population, an hour worked by a female employee cost on average € 39.3, compared to € 45.6 for a man. The wage gap therefore came to 13.9 %. That is similar to the size of the gap in 2013 (13.6 %), but con-siderably smaller than the figure recorded in 2012 (16.9 %).
the development may be due to changes in pay condi-tions within the firms considered and / or a change in the structure of employment. It may also reflect changes in the population considered. The influence of that factor can be eliminated by use of a constant population. in the 1 020 companies present in all three years, the wage gap declined by 1.4 percentage points between 2012 and 2014, dropping from 15.6 to 14.2 %. That relative im-provement in women’s pay conditions is due to differen-tial movements in hourly labour costs (up by 2.4 % for men and 4.1 % for women). It should be viewed in the context of a change in the gender distribution of the vol-ume of labour in the analysis population. the total volume of hours worked was down by 1.1 % between 2012 and 2014, but only male workers were affected. The volume of work performed by women remained stable, so that
Chart 7 CHARACTERISTICS OF THE ANALYSIS POPULATION IN 2014
(total population)
0
100
200
300
400
500
600
700
0
50 000
100 000
150 000
200 000
250 000
300 000
Industry (1) Trade and
transportHealth andsocial work
Otherservices
Small firms (2)
Large firms (2)
NUMBER OF FIRMSNUMBER OF WORKERS(persons, annual averages)
Industry (1) Trade and
transportHealth andsocial work
Otherservices
p.m. Women
Small firms (2)
Large firms (2)
source : nBB (social balance sheets).(1) including the construction industry.(2) Small firms have fewer than 250 FTEs, while large firms employ 250 FTEs or more.
TABLE 2 AVERAGE WAGE GAP
2012
2013
2014
Total population
p.m. Number of firms (units) . . . 1 713 1 828 1 959
Hourly labour cost (in €)
Men . . . . . . . . . . . . . . . . . . . . . 44.9 45.8 45.6
Women . . . . . . . . . . . . . . . . . . . 37.3 39.6 39.3
Wage gap (in %) . . . . . . . . . . . . . 16.9 13.6 13.9
Constant population between 2012 and 2014
p.m. Number of firms (units) . . . 1 020 1 020 1 020
Hourly labour cost (in €)
Men . . . . . . . . . . . . . . . . . . . . . 45.4 46.4 46.5
Women . . . . . . . . . . . . . . . . . . . 38.4 39.3 39.9
Wage gap (in %) . . . . . . . . . . . . . 15.6 15.3 14.2
Source : NBB (social balance sheets).
women’s share in the total increased slightly, from 42.9 to 43.4 %. The change in the structure of activity by branch – decline in industry and other services, growth in trade and transport and in health and social work – is also part
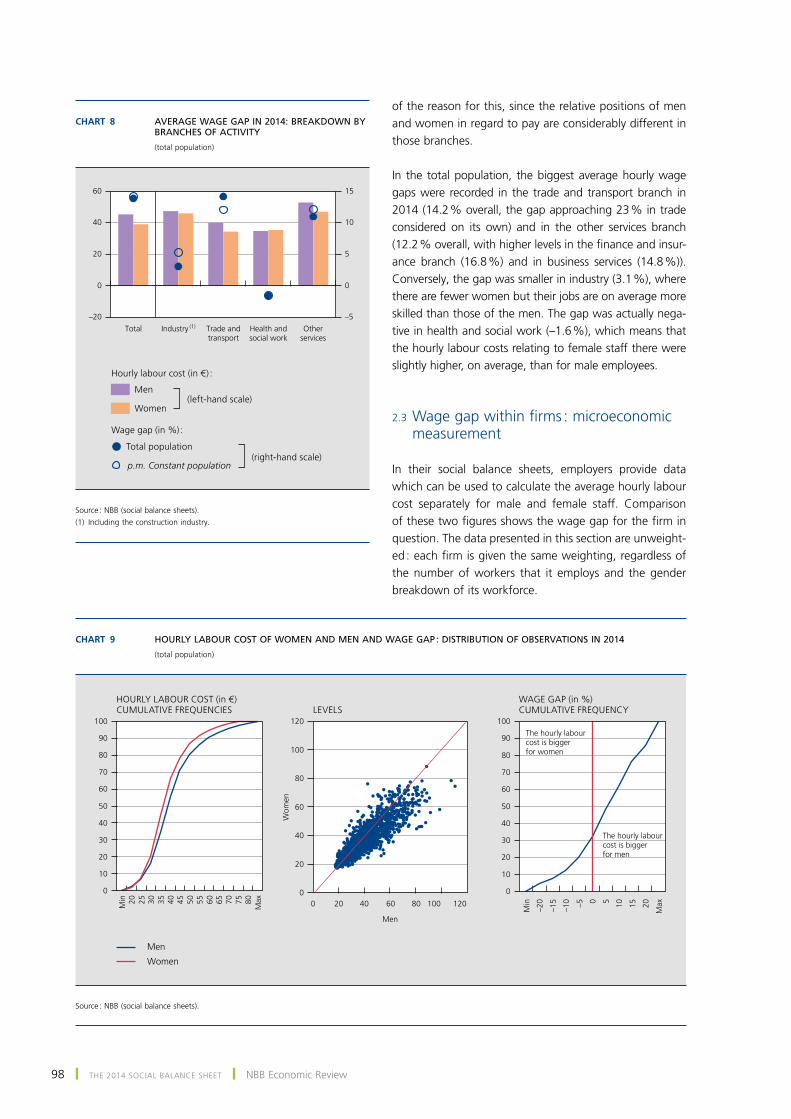
98 ❙ THE 2014 SOCIAL BALANCE SHEET ❙ nBB Economic review
of the reason for this, since the relative positions of men and women in regard to pay are considerably different in those branches.
in the total population, the biggest average hourly wage gaps were recorded in the trade and transport branch in 2014 (14.2 % overall, the gap approaching 23 % in trade considered on its own) and in the other services branch (12.2 % overall, with higher levels in the finance and insur-ance branch (16.8 %) and in business services (14.8 %)). Conversely, the gap was smaller in industry (3.1 %), where there are fewer women but their jobs are on average more skilled than those of the men. The gap was actually nega-tive in health and social work (–1.6 %), which means that the hourly labour costs relating to female staff there were slightly higher, on average, than for male employees.
2.3 Wage gap within firms : microeconomic measurement
in their social balance sheets, employers provide data which can be used to calculate the average hourly labour cost separately for male and female staff. comparison of these two figures shows the wage gap for the firm in question. the data presented in this section are unweight-ed : each firm is given the same weighting, regardless of the number of workers that it employs and the gender breakdown of its workforce.
Chart 8 AVERAGE WAGE GAP IN 2014: BREAKDOWN BY BRANCHES OF ACTIVITY
(total population)
–20
0
20
40
60
–5
0
5
10
15
Total Industry (1) Trade and
transportHealth andsocial work
Otherservices
Men
Women
Total population
p.m. Constant population
(left-hand scale)
(right-hand scale)
Hourly labour cost (in €) :
Wage gap (in %) :
source : nBB (social balance sheets).(1) including the construction industry.
Chart 9 HOURLY LABOUR COST OF WOMEN AND MEN AND WAGE GAP : DISTRIBUTION OF OBSERVATIONS IN 2014
(total population)
X
X
X
X
XX X
X
X
X
X
X
X
X
X
X
X
X
XX
X
XXXXXXXX
XXX
X
XXXXX
XX
X
XXXX
X
X
XXX
X
XXX
X
X
XX
X
X
XX
XX
X
XX
XXXXX
XX
X
X
X
X
XXX
X
X
X
XX
X
XX
XXXX
XXX
X
XXXXXX
XXXXX
XXXX
XX
X
X
XXX
X
XX
X
XX
X
XX
XX
X
XXXXX
X
X
X
X
X
XX XX
X
XX
X
X
X
XXXX
XX
X
X
X
X
XX
X
X
X
X
XX
XX X
X
XXXXXXX
X
X
XX
X
X
XXX
X
X
XX
XXX
XXXX XXXX
X
X
X
X
X
XX
XXXXXX
X
XXXX
XXXXX X
XXX X
X
XXX
XX
XX
X
X
XX X
X
XX
XXXXX
X
X
XXXX
X
X
XXXX
XXXX
X
X
XXX
X
X
XX
X
X
XX
XX X
X
XX
X
XXX
X
XX
X
X
X
X
XX
X X
X X
X
XXX
X
X
X
X
X
XXXXXXXX
X
XXXXXXXXX
X
X
X
X
X
XXX
X
XX
XXXXX
XX
X
X
XX
X
XX
XX
XXXXXX
XX
X
X XX
X
X
X
X
X
XXXXX
X
X
X
X
XX
X
X
XXX
XXXXXX
X
XX
X
X
X
X
X
XXX
X
XXX
XX
X
X
XX
X
XX
X
XXXX
XX X
X
X
X
X
X
X
XXX
X
XXX
X
XXX
X
X
X
XX
XX
XX
XXX
XXXXXX
X
X
X
X
XXX
X
XXX
XX
X
XX
X
X
X
XXXXX
X
X
XXX
X
X
X
XXX
X
X
XXX
XX
XX
XXXX
X
XX
X
X
X
X
X
X
X
X
X
X
XXXXXXX
X
XXX
XX
X
XX
X
X
X
X
XXX
X
X
XX
X
X
X
X
X
X
X
XX
X
X
X
XXX
X
X
XXX
XXXX
XX
XXX
X
XX
XX
X
X
XXXX
X
X
XXXX
X
X
X
XX XXXXX
X
XX
X
X
X
X
X
XXX
X
XX
X
XXX
XX
XXX
X
X
XX
XX
XXXX
X
XX
XX
X
X
X
X
X
X
X
XX
X
X
XX
XX
X
X
X
XXXX
X
X
X
X
X
X
X
X
XX
XXXXXX
XX X
XXX
X
X
X
X
X
X
XX
XX
XXX
XXX
X
X
XX
X
XXX
X
X
XX
X
X
X
X
X
X
X
X
X
X
XXX
X
X
X
X
XX
X
X
XX
XX
X
XX
X
X
XX
X
XX
X
XX
XX
X
XX
X
X
X
X
XXX
X
X
X
XX
X
X
XXX
X
X
X
X
X
X
X
XXX
X
XX
XX
X
XXXX
XXX
XXX
XX
XX
X
XXXX
X
XX
X
X
X
XX
X
X
X
X
X
X
X
X
X
X
XXXX
XX
X
XXXXXXX
XX
XXXX
X
X
XXX
X
X
X
XX
X
X
X
XX
X
XX
X
X
X
XX
XX
X
XXXX
XX
X
X
XX
X
XXX
X
X
X
XXXXXX
X
XXXXXX
X
XXX
X
XX
X
X
X
XX
X
X
XXX
XXXX
X
XX
X
X
X
X
X
X
XX
X
XX
X
X
X X
X
X
X
X
X
X
X
X
X
X
X
X
XXX
X
XXX
X
XX
XXX
X
X
X
X
XXX
X
XX
X
XX
X
X
X
X X
XXX
XX
X
XX
X
X
X
X
X
XX
XXXXXXX
XX
X
XXXX
XXXX
X
X
X
X
X
X
X
XX
X
XX
XXXXX
X
X
XX
X
XX
X
X
X
X
X
X
X
X
X
X
X
XX
X
XX
XX
XXXX
XX
XX
XX
X
X
X
X
X
XXX
X
X
X
X
XX
X
X
X
XXX
X
X
X
X
X
X
XX
X
X
X
XX
XX
X
XX
X
X XXXXX
XX
X
X
XX
X
X
XX
XXX
X
X
X
X
X
XX
X
XXXX
XXX
X
X
X
X
X
X
XX
XX
XXX
X
XXXXX
X
X
X
X
X
XXX
X
X
XXXX
X
X
X
X
X
X
X
X
X
X
X
XX
XXXX
X
X
X
X
XXX
X
X
X
X
X
XX
X
X
X
XX
X
XX
XX
X
X
X
X
XXX
X
XXX
X
X
X
X
XX
X
XX
X
XXX
X
XXX
X
X
X
X
XX
X
XX
X
X
XX
X
XXX
X
X
X
XX
XX
XXXX
XXX
XXX
X
X
X
X
X
XX
X
XX
X
XX
X
X
X
X
X
X
XXX
X
XX
XX
X
X
X
X
XX
X
X
X
XXX
X
XX
X
XX
X
X
X
XX
X
X
X
XX
X
XX
X
XX
X
XXX
X
X
X
X
XX
X
X
X
X
XX
XXX
X
X
X
X
X
XX
X
X
XXX
X
XX
X
X
X
X
XX
X
X
X
X
XX
X
XX
X
XX
X
X
X
XX
X
XXX
XX
X
XXXXX XXXXXXX
X
XX
X
XX
X
X
X
X
X
X
X
X
XX
X
XXXXXXXX
X
X
X
X
X
XXX
X
X
XXXX
XX
XX
X
X
X
XX
X
XX
X
X
X
XXXX
XX
XXX
X
X
XX X
X
X
XX
X
X
XXXX
X
XX
XXX
X
X
X
XX
X
X
X
X
X
X
XX
X
X
X
X
X
X
X
X
XX
X
X
X XX
X
X
X
X
X
X
X
XX
X
XXX
X
X
XX
X
XXX XX
X
X
X
X
X
X
XX
XX
XX
XX
X
X
X
X
XXX
X
X
X
X
X
X XX
X
X
X
X
X
X
X
X
X
X
X
X
X
XX
X
XX
X
X
XXX
X
XX
X
X
XXXX
X
X
X
X
X
X
XX
X
X
X
X
X
X
X
XXX
X
X
X
X
XX
XX
XXX
X
X
X
X
X
XX
X
X
X
X
X
XXX
X
XX
X
X
X
X
XX
X
XX
XX
X
X
X
X
X
XXX
X
X
X
XX
X
XX
X
X
X
XX
X
XXXX
X
XX
X
X
X
X
XXX
X
X
X
X
X
X
XX
XX
X
X
X
X
X
XX
X
X
XX
XX
XXX
X
XX
XXX
XX
XXXXX X
X
XX
XXXX
X
XX
X
X
XX
XX
XX
X
XXXX
X
X
X
X
X
X
X
X
XXX
XXXX
X
XX
X
X
XX
X
X
X
X
XX
X
X
X
X
X
X
X
XXX
X
X
XX
X
XXX
X
X
X
X
X
X
X
XX
X
X
X
X
X
XX
XX
XX
X
X
XX X
X
X
X
X
X
X
X
XXX
X
X
XXX
XX
X
X
X
X
X
X
X
X
XX
X
X
X XX
X
X
XX
XX
X
X
X
XX
X
X
XX
XX
X
X
X
XX
X
X
XXX
XX
XXX XX
X
XXXX
XXX
X
X
X
X
XXX
X
XXX
X
X
XX
X
X
X
X
X
X
XXX
XX
X
XXXXXXXX
X
X
X
X
X
0
20
40
60
80
100
120
80 100 120Min 20 25 30 35 40 45 50 55 60 65 70 75 80
Max
0
10
20
30
40
50
60
70
80
90
100
Min
–20
–15
–10 –5 0 5 10 15 20
Max
0
10
20
30
40
50
60
70
80
90
100
0 20 40 60
LEVELS
Men
Wom
en
WAGE GAP (in %)CUMULATIVE FREQUENCY
HOURLY LABOUR COST (in €)CUMULATIVE FREQUENCIES
Women
Men
The hourly labourcost is biggerfor men
The hourly labourcost is biggerfor women
source : nBB (social balance sheets).
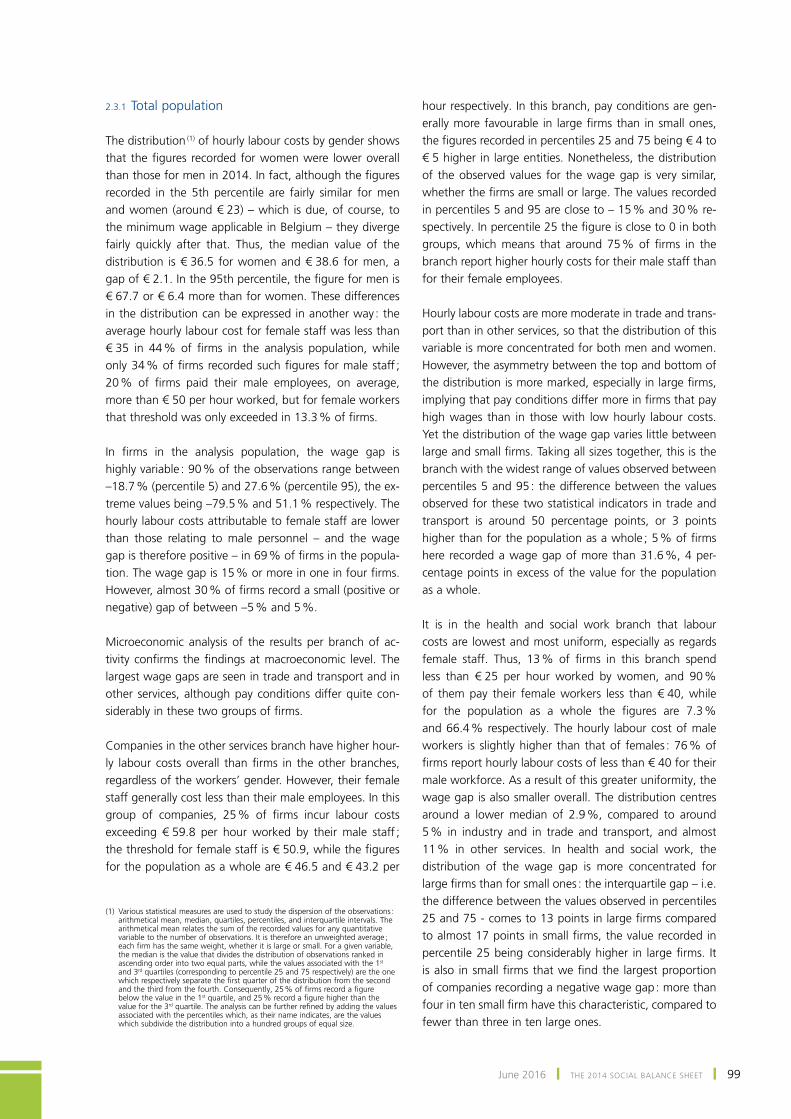
June 2016 ❙ THE 2014 SOCIAL BALANCE SHEET ❙ 99
2.3.1 total population
the distribution (1) of hourly labour costs by gender shows that the figures recorded for women were lower overall than those for men in 2014. In fact, although the figures recorded in the 5th percentile are fairly similar for men and women (around € 23) – which is due, of course, to the minimum wage applicable in Belgium – they diverge fairly quickly after that. Thus, the median value of the distribution is € 36.5 for women and € 38.6 for men, a gap of € 2.1. In the 95th percentile, the figure for men is € 67.7 or € 6.4 more than for women. These differences in the distribution can be expressed in another way : the average hourly labour cost for female staff was less than € 35 in 44 % of firms in the analysis population, while only 34 % of firms recorded such figures for male staff ; 20 % of firms paid their male employees, on average, more than € 50 per hour worked, but for female workers that threshold was only exceeded in 13.3 % of firms.
In firms in the analysis population, the wage gap is highly variable : 90 % of the observations range between –18.7 % (percentile 5) and 27.6 % (percentile 95), the ex-treme values being –79.5 % and 51.1 % respectively. The hourly labour costs attributable to female staff are lower than those relating to male personnel – and the wage gap is therefore positive – in 69 % of firms in the popula-tion. The wage gap is 15 % or more in one in four firms. However, almost 30 % of firms record a small (positive or negative) gap of between –5 % and 5 %.
microeconomic analysis of the results per branch of ac-tivity confirms the findings at macroeconomic level. The largest wage gaps are seen in trade and transport and in other services, although pay conditions differ quite con-siderably in these two groups of firms.
companies in the other services branch have higher hour-ly labour costs overall than firms in the other branches, regardless of the workers’ gender. However, their female staff generally cost less than their male employees. in this group of companies, 25 % of firms incur labour costs exceeding € 59.8 per hour worked by their male staff ; the threshold for female staff is € 50.9, while the figures for the population as a whole are € 46.5 and € 43.2 per
hour respectively. in this branch, pay conditions are gen-erally more favourable in large firms than in small ones, the figures recorded in percentiles 25 and 75 being € 4 to € 5 higher in large entities. Nonetheless, the distribution of the observed values for the wage gap is very similar, whether the firms are small or large. The values recorded in percentiles 5 and 95 are close to – 15 % and 30 % re-spectively. In percentile 25 the figure is close to 0 in both groups, which means that around 75 % of firms in the branch report higher hourly costs for their male staff than for their female employees.
Hourly labour costs are more moderate in trade and trans-port than in other services, so that the distribution of this variable is more concentrated for both men and women. However, the asymmetry between the top and bottom of the distribution is more marked, especially in large firms, implying that pay conditions differ more in firms that pay high wages than in those with low hourly labour costs. Yet the distribution of the wage gap varies little between large and small firms. Taking all sizes together, this is the branch with the widest range of values observed between percentiles 5 and 95 : the difference between the values observed for these two statistical indicators in trade and transport is around 50 percentage points, or 3 points higher than for the population as a whole ; 5 % of firms here recorded a wage gap of more than 31.6 %, 4 per-centage points in excess of the value for the population as a whole.
It is in the health and social work branch that labour costs are lowest and most uniform, especially as regards female staff. Thus, 13 % of firms in this branch spend less than € 25 per hour worked by women, and 90 % of them pay their female workers less than € 40, while for the population as a whole the figures are 7.3 % and 66.4 % respectively. The hourly labour cost of male workers is slightly higher than that of females : 76 % of firms report hourly labour costs of less than € 40 for their male workforce. As a result of this greater uniformity, the wage gap is also smaller overall. the distribution centres around a lower median of 2.9 %, compared to around 5 % in industry and in trade and transport, and almost 11 % in other services. In health and social work, the distribution of the wage gap is more concentrated for large firms than for small ones : the interquartile gap – i.e. the difference between the values observed in percentiles 25 and 75 - comes to 13 points in large firms compared to almost 17 points in small firms, the value recorded in percentile 25 being considerably higher in large firms. It is also in small firms that we find the largest proportion of companies recording a negative wage gap : more than four in ten small firm have this characteristic, compared to fewer than three in ten large ones.
(1) Various statistical measures are used to study the dispersion of the observations : arithmetical mean, median, quartiles, percentiles, and interquartile intervals. the arithmetical mean relates the sum of the recorded values for any quantitative variable to the number of observations. it is therefore an unweighted average ; each firm has the same weight, whether it is large or small. For a given variable, the median is the value that divides the distribution of observations ranked in ascending order into two equal parts, while the values associated with the 1st and 3rd quartiles (corresponding to percentile 25 and 75 respectively) are the one which respectively separate the first quarter of the distribution from the second and the third from the fourth. Consequently, 25 % of firms record a figure below the value in the 1st quartile, and 25 % record a figure higher than the value for the 3rd quartile. The analysis can be further refined by adding the values associated with the percentiles which, as their name indicates, are the values which subdivide the distribution into a hundred groups of equal size.
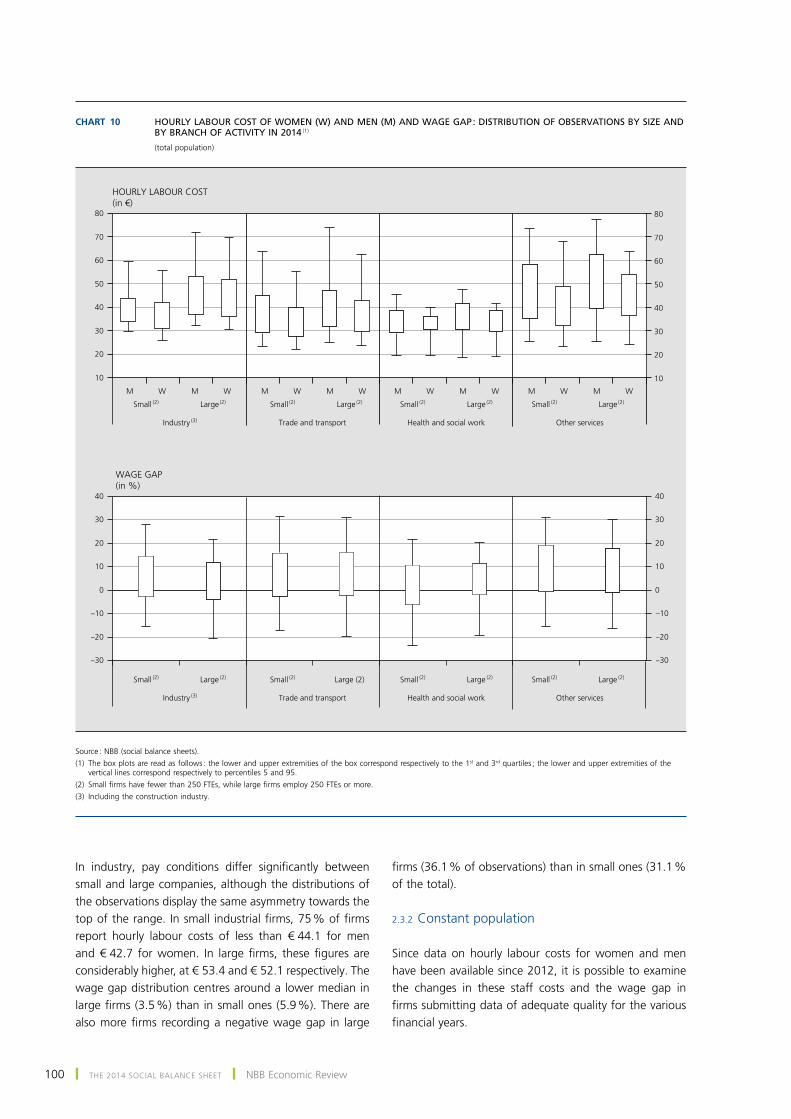
100 ❙ THE 2014 SOCIAL BALANCE SHEET ❙ nBB Economic review
In industry, pay conditions differ significantly between small and large companies, although the distributions of the observations display the same asymmetry towards the top of the range. In small industrial firms, 75 % of firms report hourly labour costs of less than € 44.1 for men and € 42.7 for women. In large firms, these figures are considerably higher, at € 53.4 and € 52.1 respectively. The wage gap distribution centres around a lower median in large firms (3.5 %) than in small ones (5.9 %). There are also more firms recording a negative wage gap in large
firms (36.1 % of observations) than in small ones (31.1 % of the total).
2.3.2 constant population
since data on hourly labour costs for women and men have been available since 2012, it is possible to examine the changes in these staff costs and the wage gap in firms submitting data of adequate quality for the various financial years.
Chart 10 HOURLY LABOUR COST OF WOMEN (W) AND MEN (M) AND WAGE GAP : DISTRIBUTION OF OBSERVATIONS BY SIZE AND BY BRANCH OF ACTIVITY IN 2014 (1)
(total population)
–30
–20
–10
0
10
20
30
40
–30
–20
–10
0
10
20
30
40
10
20
30
40
50
60
70
80
10
20
30
40
50
60
70
80
HOURLY LABOUR COST(in €)
WAGE GAP (in %)
M
Small (2) Large (2) Small (2) Large
(2) Small (2) Large (2) Small (2) Large
(2)
Industry (3) Trade and transport Health and social work Other services
Small (2) Large (2) Small (2) Large (2) Small (2) Large
(2) Small (2) Large (2)
Industry (3) Trade and transport Health and social work Other services
W M W M W M W M W M W M W M W
source : nBB (social balance sheets).(1) the box plots are read as follows : the lower and upper extremities of the box correspond respectively to the 1st and 3rd quartiles ; the lower and upper extremities of the
vertical lines correspond respectively to percentiles 5 and 95.(2) Small firms have fewer than 250 FTEs, while large firms employ 250 FTEs or more.(3) including the construction industry.
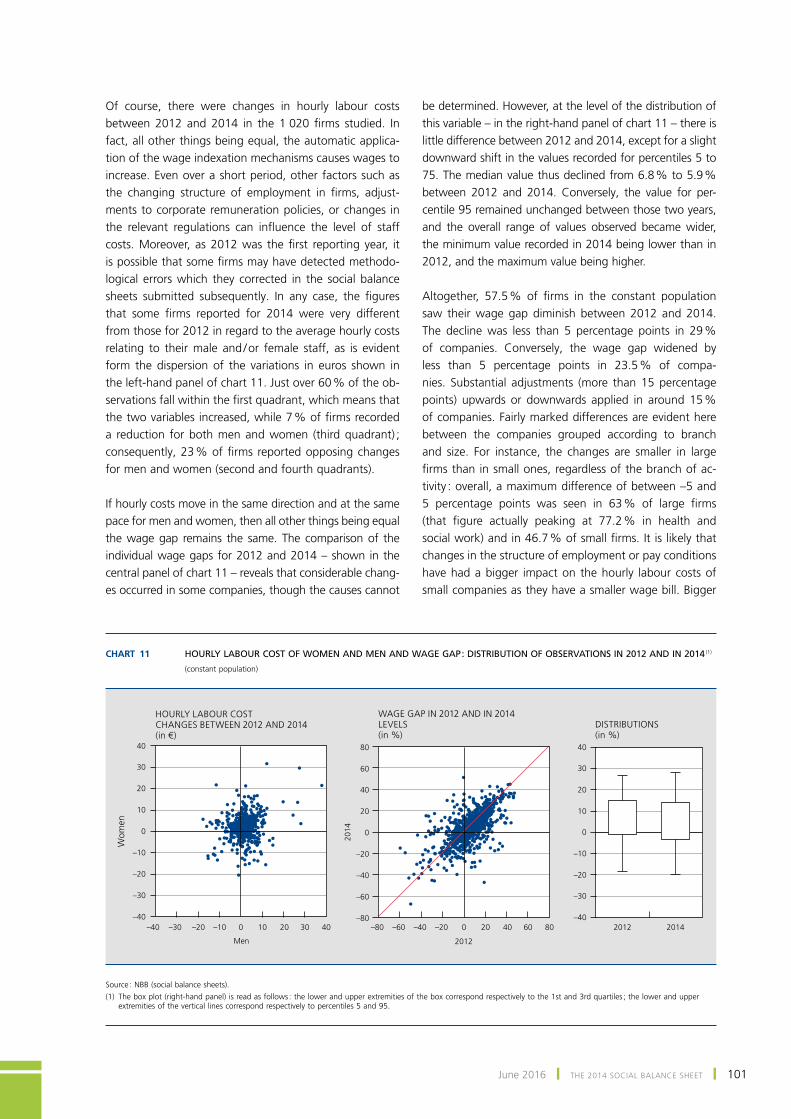
June 2016 ❙ THE 2014 SOCIAL BALANCE SHEET ❙ 101
of course, there were changes in hourly labour costs between 2012 and 2014 in the 1 020 firms studied. In fact, all other things being equal, the automatic applica-tion of the wage indexation mechanisms causes wages to increase. Even over a short period, other factors such as the changing structure of employment in firms, adjust-ments to corporate remuneration policies, or changes in the relevant regulations can influence the level of staff costs. Moreover, as 2012 was the first reporting year, it is possible that some firms may have detected methodo-logical errors which they corrected in the social balance sheets submitted subsequently. In any case, the figures that some firms reported for 2014 were very different from those for 2012 in regard to the average hourly costs relating to their male and / or female staff, as is evident form the dispersion of the variations in euros shown in the left-hand panel of chart 11. Just over 60 % of the ob-servations fall within the first quadrant, which means that the two variables increased, while 7 % of firms recorded a reduction for both men and women (third quadrant) ; consequently, 23 % of firms reported opposing changes for men and women (second and fourth quadrants).
if hourly costs move in the same direction and at the same pace for men and women, then all other things being equal the wage gap remains the same. the comparison of the individual wage gaps for 2012 and 2014 – shown in the central panel of chart 11 – reveals that considerable chang-es occurred in some companies, though the causes cannot
be determined. However, at the level of the distribution of this variable – in the right-hand panel of chart 11 – there is little difference between 2012 and 2014, except for a slight downward shift in the values recorded for percentiles 5 to 75. The median value thus declined from 6.8 % to 5.9 % between 2012 and 2014. Conversely, the value for per-centile 95 remained unchanged between those two years, and the overall range of values observed became wider, the minimum value recorded in 2014 being lower than in 2012, and the maximum value being higher.
Altogether, 57.5 % of firms in the constant population saw their wage gap diminish between 2012 and 2014. The decline was less than 5 percentage points in 29 % of companies. conversely, the wage gap widened by less than 5 percentage points in 23.5 % of compa-nies. Substantial adjustments (more than 15 percentage points) upwards or downwards applied in around 15 % of companies. Fairly marked differences are evident here between the companies grouped according to branch and size. for instance, the changes are smaller in large firms than in small ones, regardless of the branch of ac-tivity : overall, a maximum difference of between –5 and 5 percentage points was seen in 63 % of large firms (that figure actually peaking at 77.2 % in health and social work) and in 46.7 % of small firms. It is likely that changes in the structure of employment or pay conditions have had a bigger impact on the hourly labour costs of small companies as they have a smaller wage bill. Bigger
Chart 11 HOURLY LABOUR COST OF WOMEN AND MEN AND WAGE GAP : DISTRIBUTION OF OBSERVATIONS IN 2012 AND IN 2014 (1)
(constant population)
XXXXX
X
X
X
XXXXXXXXXXXXXXXXX
X
X
X
X
X
XX
XXX
XX
XX
X
XX
XXX
X
XXX
X
XX
X
X
X
XXXXX XXXXXXX
X
XXXXXXXX
X
X XX
X
X
X
XXX
XX
X
X
XXXXXXXXXXX
X
XXX
X
XXXX
XXXX
X
X
X
XXX
X
XXXXX
XX
X
X
X
X
X
X X
X
X
XXXXXXXX
X
XX
X
XXXXX
X
XXXXXXXXXXXXX
X
X
XXX
XX XXX
XXX
X
XXXXXX
X
XXXX
XX
X
X
XX
XXXX
X
X
X
X
X
XX
X
X
XXXXXXXXXX
X
X
X
X
X
XX
X
X
X
XXXXXXXX
X
XXXXX
X
XXX
X
XXXXXXXX
X
XXX
X
XXXX XXXX
XXXXXXXXXXXX
X
XXX
X
XXXXXX
XXXXXXXXXX
X
XXX
XXXXXXX
X
X
XXXXX XX
X
XXXXXXXXX XXXXXXXXX
X
XXXXXXXXXXXXXX
X
XXXXXXXX
XXXXXXXXX
X
XXXX
X
X
X
XXXXXX
X
X
X
X
X
XXX
X
XXX
XXXX
X X
XX
XXXXXXXXX
X XX
X
X
XXXXXXX
X
XX XXXX
XXX
X
XX
X
XXXXXXXXXXXXXXXXXXX
X
XXXXXXX
X
XXXXXXXXXXXX
X
XXX
X
X
X
XXXXXXXXXXXXXXXX
XX
X
XXXX
XXX
X
X
X
X
XXXXXXXXXXX
XX
X
XXXXXX
XX
X
X
X
X
XXXXX
XXXX
X
XXX
X
X XXXXXXXXXXXXX
XXXXXXX
XX
X X
X
XXXXX
X
XXXXXXXXXX
X
XXXXXXXXXXX
X
XX
XXXXXXXXXX
XXXX
X
X
XX
XXXXX X
X
XX
X
XXXX
XXXXXXXX X
X
X
XXXX X
X
X
X
XXXXXXXX
X
XXX
X
XX
X
XXXX XXX XXXXXXX
X
X
XXXXXXXXXXX
X
XX
XX
XXXXX
X X
XXXXXXXXXXXX
XXXXX
X
X
XX
XX
XXXX
X
XX
XX
X
XXX
XX
X
XXX
X
XXXXX XXXX
X XXXX
XX X
XXXX
X
XX
XX
XX
XXXXXXX
X
XXXX
X
XXXXXXXXXXXXXXXX
XX
XX
X
X
XXXXXXX
XX XXXX
X
X
X
XXXXXXXX
X
X
X
XXXXXX XXX
X
X
XX
XX
X
XXXXXXXXXX
XXXX
XXXXXXXXXXX
XXXXXXX
X
X
X
X
X
XX
XXXXXXXXX
X
XX
X XX XXX
X
X X
X
XXXXXXX
XX
X
X
XXXX
X
XXX XXXXXXX
XXXXXXXXXX
XXXXXXXXX
X
XX
X
X
XXX
XXXXXX
X
X
X
XX
XX
XXXXX
X
X
X
XXX
X
X
X
X
XX
X
–40
–30
–20
–10
0
10
20
30
40
–40 –30 –20 –10
X
XXXX
X
X
X
XXX
X
X
X
XX
XX
X
X
X
XX
X
X
XX
XX
X
X
XX
X
X
X
X
X
XX
XXX
X
XX
X
X
X X
XXX
XX
XX
XX
X
X
XX
X
X
XX
X
X
X
X
X
X
XXX
X
XXX
X
X
X
X
X
X
X
X
X
X
XX
X
XX
X
X
X
X
XX
X
XX
X
X
XX
X
X
X
XX
XX
X
X XX
XX
XXX
XXXX
XX
X
X
X
XX
X
X
X
X
XX
X
XXX
X
XX
X
X
X
XX
XXX
X
XXXXXXX
XXX
XX
XX
X
XXXXXX
X
XX
X
XXX
XX
XX
XX
X
XX
X
X
X
X
X
X
X
X
X
X
XX
X X
X
X
XX
XX
X
X
XXX
X
X
XXXX X
X
XX
X
XX
X
X
X
X
X
XXX
X
X
X
X
X
XX
XXX
X
X
X
X
XX
XX
XX
X
X
XXX
XX
X
X
X
X
XX
XXX
XX
X
XX
X
XX
X
X
X
X
X
X
XXXX
X XXXX
XXX
X
X
X
XX
X
X
XXX
X
XXXX
X
X
XXX
X
XX
XX
XX
XXXX
X X
XXX
XXXX
XX
X
X
X
XXX
XX
XXX
X
X
X
XX
X
XX
XX
XX
XXX
XXX
X
X
XX
X
XXXX
X
X
X
X
X
XX
XX
XX
XX
X
X
XX
X
X
X
X
X
X
X
X X
X
XX
X
X X
XX
XX
X
X
X
X
XX
XX X
X
X
X
X
X
X
XX
XXXX
X
X
X
X
X
X
X
X
XX
XX
X
X
X
XX
X
X
X
XX
X
X
XX
X
XXX
XX
X
XX X
X
X
XXX
XX
XX
XXX
XXXX
XX
XX
X
X
X
X
XXX
XX
XXX
XXXX
X
X
X
X
X
XX
XX
X
X
X
X
X
X
X
XXXX
X
X
X
X
X
X
XX
XX
XX
X
X
X
X
X
X
XX
X
XX
XXX
X
X
X
XX
X
XX
X
X
X
XX
X
X
X
X
X
XX
XX
X
XX
XX X
X
X
X
X
X
X
X
XX
X
XXX
XX
X
XXX
X
X
X
X
X
X
X
X X
X
X
XX
X
XXX
X
X
X
X
X
X
X
X
X
XX
XX
X X
X
XX
X
XX
X
X
X
XX
X
X
XX
XXXX
X
X
XX
X
XXX
X X
X
X
X
X
X
X
X XXX
XX
XX
X
X
X
X
XX
X
X
XX
X
XX
X
XX
XX
X
X
X
XX
X
X
XX
X
XXX
X
XXX X
X
X
X
X
XXX
XX
X
X
XXX
XX
X
X
X
X
X
X
XXX
X X
X
X
X
X
X
X
X
XXXX
X
X
X
XX
X
XXX
XX XX
X
X
X
X
X
XX
X
XX
X
X
X
X
X
X
XX
X
X
XXXX
X
XX
X
X
XX
X
X
X
XX
XX
X
X
XXX
XXX
X
X
XXX
X
XXX
XXXX
XX
XX
X
X
X
X
X X
X
X
X
XX XX
XXX
X
XX
X
X
X X
X
X
XXXX
X
XX XX
X
XX
X
X
X
X
X
XXX
X
XXXXXXX
X
XX
X
X
X
XX
XXXXX
XX
X
XXXX
X
X
X
X
X
X
X
X
XXXX
X
X
XX
XXX
X
X
XX X
X
X
XXX
XX
X
X
X
X
XX
XXX
X
XX
X
X
XXXXXXX
X
X
X
XXX
X
XX
XXXX
X
X
X
X
X
XXXXXX
XX
X
X
X
X
X
X
XX
XXX
XXX
X
X
X
X
X
X
X
X X
XX
X
XX
XXX
X
X
XX
XX
XX
X
–80
–60
–40
–20
0
20
40
60
80
–80 –60 –40 –20 2012 2014–40
–30
–20
–10
0
10
20
30
40
2012
2014
0 10 20 30 40 0 20 40 60 80
HOURLY LABOUR COSTCHANGES BETWEEN 2012 AND 2014(in €)
WAGE GAP IN 2012 AND IN 2014 LEVELS(in %)
DISTRIBUTIONS(in %)
Men
Wom
en
source : nBB (social balance sheets).(1) The box plot (right-hand panel) is read as follows : the lower and upper extremities of the box correspond respectively to the 1st and 3rd quartiles ; the lower and upper
extremities of the vertical lines correspond respectively to percentiles 5 and 95.
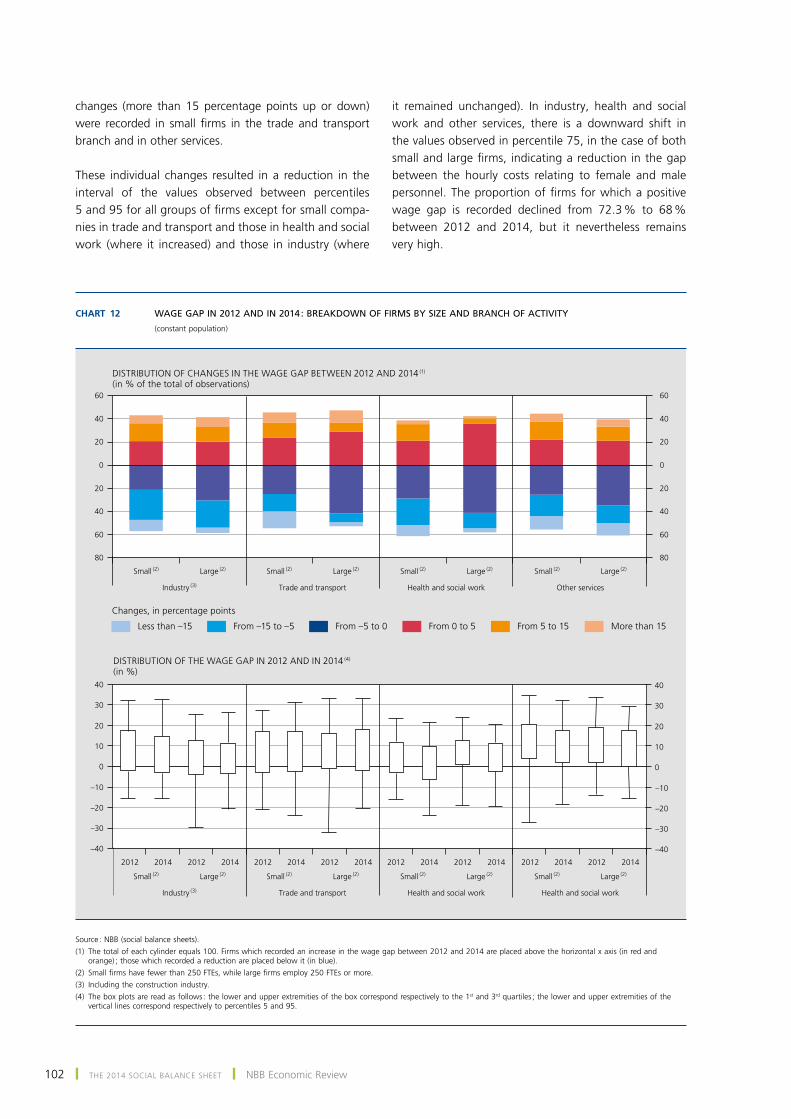
102 ❙ THE 2014 SOCIAL BALANCE SHEET ❙ nBB Economic review
changes (more than 15 percentage points up or down) were recorded in small firms in the trade and transport branch and in other services.
these individual changes resulted in a reduction in the interval of the values observed between percentiles 5 and 95 for all groups of firms except for small compa-nies in trade and transport and those in health and social work (where it increased) and those in industry (where
it remained unchanged). in industry, health and social work and other services, there is a downward shift in the values observed in percentile 75, in the case of both small and large firms, indicating a reduction in the gap between the hourly costs relating to female and male personnel. The proportion of firms for which a positive wage gap is recorded declined from 72.3 % to 68 % between 2012 and 2014, but it nevertheless remains very high.
Chart 12 WAGE GAP IN 2012 AND IN 2014 : BREAKDOWN OF FIRMS BY SIZE AND BRANCH OF ACTIVITY
(constant population)
80
60
40
20
0
20
40
60
80
60
40
20
0
20
40
60
2012 2014 2012 2014 2012 2014 2012 2014 2012 2014 2012 2014 2012 2014 2012 2014
–40
–30
–20
–10
0
10
20
30
40
–40
–30
–20
–10
0
10
20
30
40
Small (2) Large (2) Small (2) Large
(2) Small (2) Large (2) Small (2) Large
(2)
Less than –15 From –15 to –5 From –5 to 0 From 0 to 5 From 5 to 15 More than 15
Industry (3) Trade and transport Health and social work Other services
Small (2) Large (2) Small (2) Large
(2) Small (2) Large (2) Small (2) Large
(2)
Industry (3) Trade and transport Health and social work Health and social work
DISTRIBUTION OF CHANGES IN THE WAGE GAP BETWEEN 2012 AND 2014 (1)
(in % of the total of observations)
DISTRIBUTION OF THE WAGE GAP IN 2012 AND IN 2014 (4)
(in %)
Changes, in percentage points
source : nBB (social balance sheets).(1) The total of each cylinder equals 100. Firms which recorded an increase in the wage gap between 2012 and 2014 are placed above the horizontal x axis (in red and
orange) ; those which recorded a reduction are placed below it (in blue).(2) Small firms have fewer than 250 FTEs, while large firms employ 250 FTEs or more.(3) including the construction industry.(4) the box plots are read as follows : the lower and upper extremities of the box correspond respectively to the 1st and 3rd quartiles ; the lower and upper extremities of the
vertical lines correspond respectively to percentiles 5 and 95.
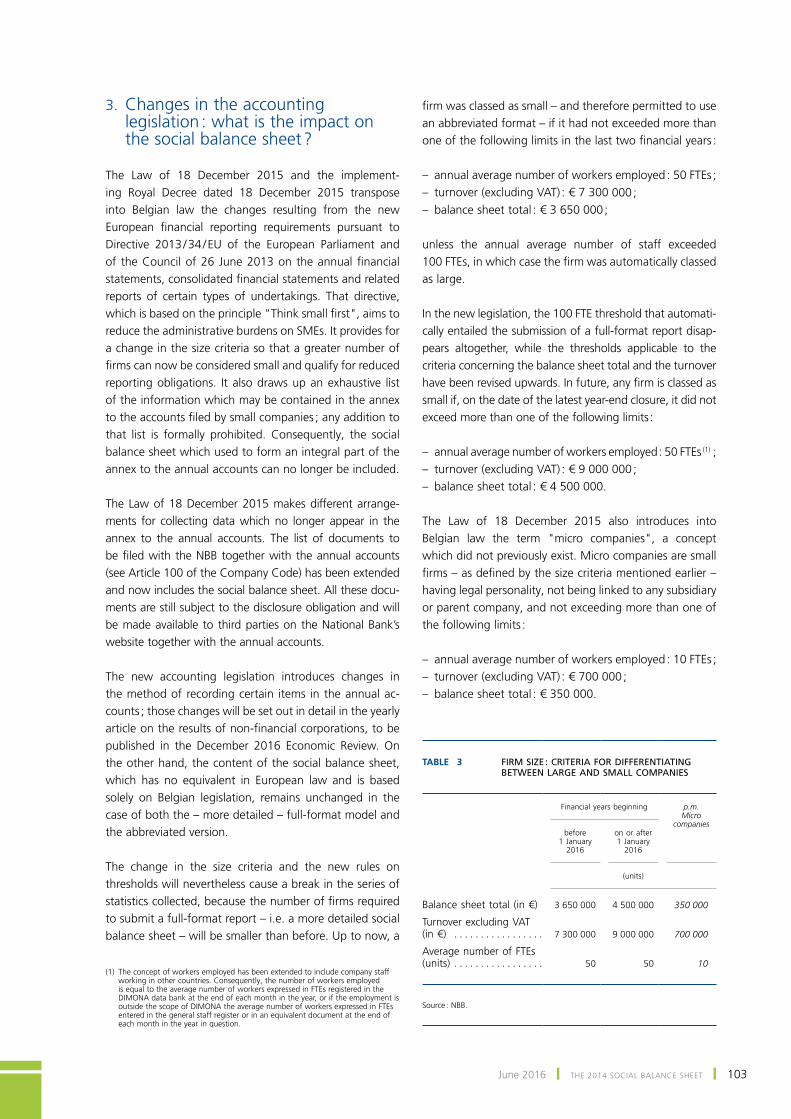
June 2016 ❙ THE 2014 SOCIAL BALANCE SHEET ❙ 103
3. changes in the accounting legislation : what is the impact on the social balance sheet ?
The Law of 18 December 2015 and the implement-ing Royal Decree dated 18 December 2015 transpose into Belgian law the changes resulting from the new European financial reporting requirements pursuant to Directive 2013 / 34 / EU of the European Parliament and of the Council of 26 June 2013 on the annual financial statements, consolidated financial statements and related reports of certain types of undertakings. That directive, which is based on the principle "Think small first", aims to reduce the administrative burdens on smEs. it provides for a change in the size criteria so that a greater number of firms can now be considered small and qualify for reduced reporting obligations. it also draws up an exhaustive list of the information which may be contained in the annex to the accounts filed by small companies ; any addition to that list is formally prohibited. consequently, the social balance sheet which used to form an integral part of the annex to the annual accounts can no longer be included.
The Law of 18 December 2015 makes different arrange-ments for collecting data which no longer appear in the annex to the annual accounts. the list of documents to be filed with the NBB together with the annual accounts (see Article 100 of the Company Code) has been extended and now includes the social balance sheet. All these docu-ments are still subject to the disclosure obligation and will be made available to third parties on the National Bank’s website together with the annual accounts.
the new accounting legislation introduces changes in the method of recording certain items in the annual ac-counts ; those changes will be set out in detail in the yearly article on the results of non-financial corporations, to be published in the December 2016 Economic Review. On the other hand, the content of the social balance sheet, which has no equivalent in European law and is based solely on Belgian legislation, remains unchanged in the case of both the – more detailed – full-format model and the abbreviated version.
the change in the size criteria and the new rules on thresholds will nevertheless cause a break in the series of statistics collected, because the number of firms required to submit a full-format report – i.e. a more detailed social balance sheet – will be smaller than before. up to now, a
firm was classed as small – and therefore permitted to use an abbreviated format – if it had not exceeded more than one of the following limits in the last two financial years :
– annual average number of workers employed : 50 FTEs ;– turnover (excluding VAT) : € 7 300 000 ;– balance sheet total : € 3 650 000 ;
unless the annual average number of staff exceeded 100 FTEs, in which case the firm was automatically classed as large.
In the new legislation, the 100 FTE threshold that automati-cally entailed the submission of a full-format report disap-pears altogether, while the thresholds applicable to the criteria concerning the balance sheet total and the turnover have been revised upwards. In future, any firm is classed as small if, on the date of the latest year-end closure, it did not exceed more than one of the following limits :
– annual average number of workers employed : 50 FTEs (1) ;– turnover (excluding VAt) : € 9 000 000 ;– balance sheet total : € 4 500 000.
The Law of 18 December 2015 also introduces into Belgian law the term "micro companies", a concept which did not previously exist. micro companies are small firms – as defined by the size criteria mentioned earlier – having legal personality, not being linked to any subsidiary or parent company, and not exceeding more than one of the following limits :
– annual average number of workers employed : 10 FTEs ;– turnover (excluding VAt) : € 700 000 ;– balance sheet total : € 350 000.
(1) The concept of workers employed has been extended to include company staff working in other countries. Consequently, the number of workers employed is equal to the average number of workers expressed in FTEs registered in the DIMONA data bank at the end of each month in the year, or if the employment is outside the scope of DIMONA the average number of workers expressed in FTEs entered in the general staff register or in an equivalent document at the end of each month in the year in question.
TABLE 3 FIRM SIZE : CRITERIA FOR DIFFERENTIATING BETWEEN LARGE AND SMALL COMPANIES
Financial years beginning
p.m. Micro
companies
before 1 January
2016
on or after 1 January
2016
(units)
Balance sheet total (in €) 3 650 000 4 500 000 350 000
Turnover excluding VAT (in €) . . . . . . . . . . . . . . . . . 7 300 000 9 000 000 700 000
Average number of FTEs (units) . . . . . . . . . . . . . . . . . 50 50 10
Source : NBB.

104 ❙ THE 2014 SOCIAL BALANCE SHEET ❙ nBB Economic review
micro companies can opt for a special "micro format" for submitting their annual accounts. this micro format comprises a balance sheet and profit and loss account identical with the ones filed by small firms, together with an annex which is even smaller than the one applicable to small companies. on the other hand, they are required to submit a social balance sheet in accordance with the same abbreviated format as other small firms.
if the thresholds are exceeded occasionally, that will not affect the model used : exceeding more than one of the criteria has implications only if the situation persists for two consecutive financial years. The obligation to submit a full-format balance sheet will therefore only apply from the year following two consecutive years in which at least two thresholds have been exceeded. Conversely, a firm cannot use the abbreviated format unless it has not ex-ceeded more than one of the three thresholds for at least two consecutive years.
The new accounting legislation applies to financial years beginning on or after 1 January 2016. Companies will be eligible for the new thresholds from the first financial year, as a transitional arrangement specifies that size will be de-termined on the basis of the data from the latest financial year beginning before 1 January 2016. Since any subse-quent change of size requires companies to fall below the thresholds or to exceed them in two consecutive years, the first changes of size compared to the 2016 financial year will not be apparent until the year 2018.
At the time of going to press, there had been no change in the case of large and very large npis and foundations, even though their accounting rules are based largely on the ones applicable to companies (1). the social balance sheet still forms an integral part of the annex to their accounts. The situation likewise remains unchanged for banks and insurance companies, and for companies filing a social balance sheet on its own.
it is hard to calculate how the application of the new thresholds and the ways in which they are exceeded will affect the collection of data. in a static situation, on the basis of the data for 2013, the Central Balance Sheet Office calculated that the number of non-financial companies required to submit their annual accounts in the full format could decline from around 24 000 large companies as defined by the old legislation to around 12 000 if the criteria of the new regulations are applied. That would reduce the proportion of large firms from 6 % to 3 % of the total declarants. Also, more than eight in ten small firms would be eligible to use the micro format for submitting their annual accounts. the impact on the submission of social balance sheets, which only
concerns companies employing staff in Belgium, was not estimated.
conclusion
Between 2000 and 2014, the volume of employment measured in FTEs increased significantly in firms submit-ting a social balance sheet. this rise was due largely to the greater number of social balance sheets filed by compa-nies in the health and social work branch as a result of the obligation to submit standardised accounts, imposed on large and very large npis and foundations with effect from 2006. the volume of employment also expanded in trade and transport, and to a greater extent in other services. conversely, it contracted in industry.
Apart from the overall increase in the volume of labour, the social balance sheet reveals substantial changes in the structure of employment. for instance, the contribution of personnel employed as clerical staff rose sharply between 2000 and 2014 (up from 50.6 to 57.4 % of the total) while that of manual workers declined. These develop-ments naturally originate from the change in the structure of activity per branch, since the decline in the volume of labour in industry is the outcome of an even steeper fall in manual jobs accompanied by a small rise in the number of clerical staff. in the other branches of activity, the volume of labour provided by clerical workers also increased.
Part-time workers now account for a larger proportion of the activity (24 % of the total volume of employment in 2014, as opposed to 13.1 % fourteen years ago). On the other hand, the number of permanent staff has grown at much the same rate as the number of temporary workers, so that the proportion of staff employed on temporary contracts stood at around 6.2 % of the volume of labour in both 2000 and 2014. Consequently, the decline in job security is attributable more to the type of working arrangement rather than the workers’ employment con-tracts. nonetheless, it should be noted that the percent-age of workers combining a temporary contract with re-duced hours is rising, although they still only represented a small proportion of the total volume of labour in 2014.
Women have become a major driving force in activity ; their contribution to the volume of labour increased from 33.5 % to 41 % of the total between 2000 and 2014. the relative proportion of female labour increased in all branches, but the growth is most evident in trade and transport and in the other services branch. the volume
(1) the fps Justice is responsible for transposing to npis and foundations the changes applicable to non-financial corporations.
June 2016 ❙ THE 2014 SOCIAL BALANCE SHEET ❙ 105
of employment represented by male workers was down slightly over that period, as the expansion in health and social work and in other services was insufficient to offset the decline in industry and in trade and transport.
the higher proportion of female labour explains the si-multaneous growth of part-time work. That is still largely the preserve of women, although it is a useful means of achieving a balance between work and family / social life for both men and women. that situation has an impact both on women’s career development and on their op-portunities for salary progression. the social balance sheet data show that, on average, female staff are less expen-sive than male employees, both in the analysis population as a whole and in the majority of firms, although the situ-ation is far from uniform.
The aggregate data for almost 2 000 firms submitting a full-format balance sheet show that the cost of an hour’s labour is 13.9 % higher, on average, for men than for women. there are wide variations in the respective situ-ations of women and men depending on the branch : a larger than average positive gap is recorded in trade and transport and in other services ; in industry, the gap is considerably smaller ; conversely, in health and social work the wage gap is negative.
The firms’ individual results show that, on average, hourly costs are higher for men than for women in 69 % of firms. The gap is 15 % or more in one in four firms. Analysis by branch of activity confirms that the wage gaps are larg-est in trade and transport and in other services, although the wage dispersion is narrower in the first branch than in the second.
the movement in the wage gap over time was measured on the basis of a constant population of just over a thou-sand firms which reported the data necessary for calculat-ing the wage gap for 2012, 2013 and 2014. Some compa-nies recorded wide individual variations in the hourly labour
costs of men and women and in the wage gap ; neverthe-less, there was little change in the dispersion of the wage gap observations between 2012 and 2014. Overall, the gap only increased moderately – by less than 5 percentage points – in 23.5 % of companies, while 57 % of firms saw a reduction in the wage gap. Consequently, firms recording a positive wage gap were proportionately fewer in 2014, though they still represent a large share of the total (68 % in 2014, compared to 72 % in 2012).
it is a great pity that the analysis of the wage gap is based on a very small number of firms compared to the potential population of firms submitting a full-format report. The legislation, whereby firms need not complete the ad-hoc data if they concern no more than three workers – in an understandable desire for privacy protection –, is partly responsible for this situation. But the data quality is often inadequate so that the wage gap cannot be calculated or is meaningless. However, the social balance sheet is not just a statistical obligation ; it is also a social policy tool in that it provides information on the real situation in firms and therefore offers a good guidance for policy decisions. All parties concerned have a responsibility to contribute actively towards improving the reporting on the subject.
The transposition into Belgian law of Directive 2013 / 34 / EU of the European parliament and of the council on the annual financial statements, consolidated financial state-ments and related reports of certain types of undertakings will lead to changes in reporting with effect from the 2016 financial year. However, there is no change in the social balance sheet : its content is completely preserved and it will still be filed together with the annual accounts. nevertheless, the new regulations do alter the thresholds determining the size of firms : in future, a larger number of companies should be classed as small firms, or even as micro companies, and will therefore use the abbreviated social balance sheet format, so that less detailed informa-tion will be available on staff for a larger proportion of the population of firms.

106 ❙ THE 2014 SOCIAL BALANCE SHEET ❙ nBB Economic review
Bibliography
Belgian Accounting standards commission (1997), Questions et réponses relatives au bilan social, Bulletin de la Commission des normes comptables, No. 39, April.
Delhez Ph. and P. Heuse (2006), “The social balance sheet 2005”, NBB, Economic Review, December, 55-86.
Heuse P. (2013), “The 2012 social balance sheet”, NBB, Economic Review, December, 101-137.
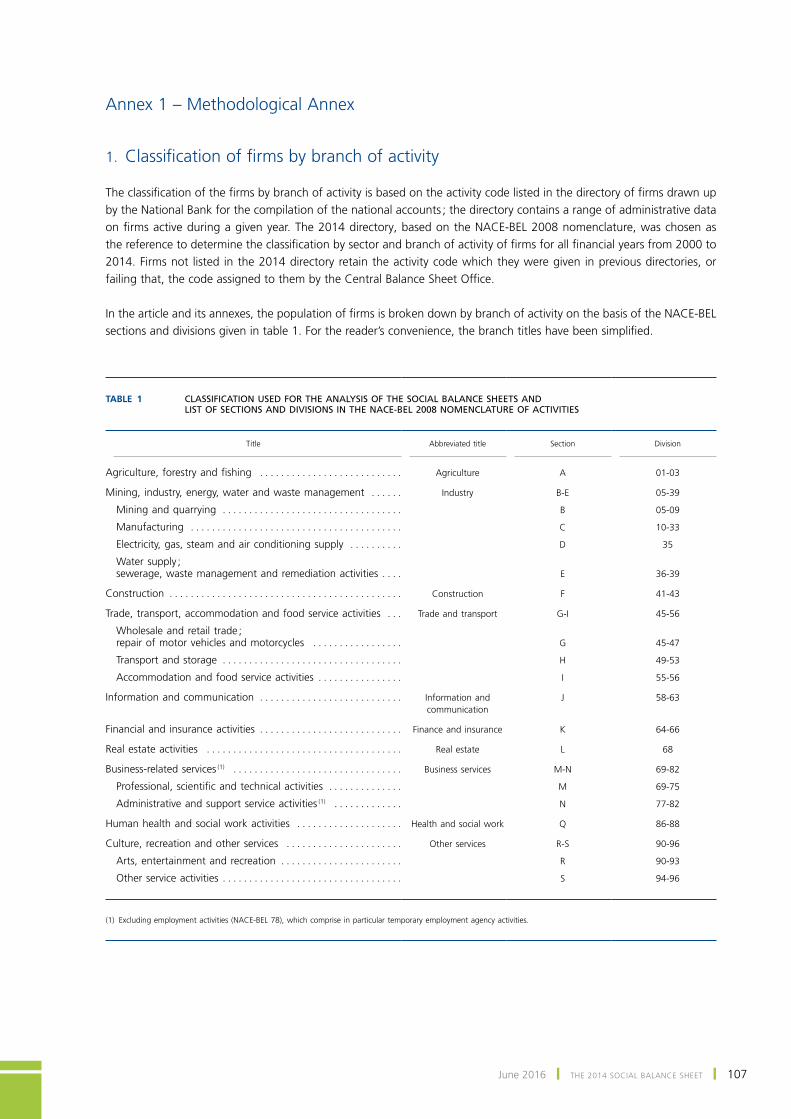
June 2016 ❙ THE 2014 SOCIAL BALANCE SHEET ❙ 107
Annex 1 – Methodological Annex
1. Classification of firms by branch of activity
The classification of the firms by branch of activity is based on the activity code listed in the directory of firms drawn up by the National Bank for the compilation of the national accounts ; the directory contains a range of administrative data on firms active during a given year. The 2014 directory, based on the NACE-BEL 2008 nomenclature, was chosen as the reference to determine the classification by sector and branch of activity of firms for all financial years from 2000 to 2014. Firms not listed in the 2014 directory retain the activity code which they were given in previous directories, or failing that, the code assigned to them by the Central Balance Sheet Office.
In the article and its annexes, the population of firms is broken down by branch of activity on the basis of the NACE-BEL sections and divisions given in table 1. For the reader’s convenience, the branch titles have been simplified.
TABLE 1 CLASSIFICATION USED FOR THE ANALYSIS OF THE SOCIAL BALANCE SHEETS AND LIST OF SECTIONS AND DIVISIONS IN THE NACE‑BEL 2008 NOMENCLATURE OF ACTIVITIES
Title
Abbreviated title
Section
Division
Agriculture, forestry and fishing . . . . . . . . . . . . . . . . . . . . . . . . . . . Agriculture A 01‑03
Mining, industry, energy, water and waste management . . . . . . Industry B‑E 05‑39
Mining and quarrying . . . . . . . . . . . . . . . . . . . . . . . . . . . . . . . . . . B 05‑09
Manufacturing . . . . . . . . . . . . . . . . . . . . . . . . . . . . . . . . . . . . . . . . C 10‑33
Electricity, gas, steam and air conditioning supply . . . . . . . . . . D 35
Water supply ; sewerage, waste management and remediation activities . . . . E 36‑39
Construction . . . . . . . . . . . . . . . . . . . . . . . . . . . . . . . . . . . . . . . . . . . . Construction F 41‑43
Trade, transport, accommodation and food service activities . . . Trade and transport G‑I 45‑56
Wholesale and retail trade ; repair of motor vehicles and motorcycles . . . . . . . . . . . . . . . . . G 45‑47
Transport and storage . . . . . . . . . . . . . . . . . . . . . . . . . . . . . . . . . . H 49‑53
Accommodation and food service activities . . . . . . . . . . . . . . . . I 55‑56
Information and communication . . . . . . . . . . . . . . . . . . . . . . . . . . . Information and communication
J 58‑63
Financial and insurance activities . . . . . . . . . . . . . . . . . . . . . . . . . . . Finance and insurance K 64‑66
Real estate activities . . . . . . . . . . . . . . . . . . . . . . . . . . . . . . . . . . . . . Real estate L 68
Business‑related services (1) . . . . . . . . . . . . . . . . . . . . . . . . . . . . . . . . Business services M‑N 69‑82
Professional, scientific and technical activities . . . . . . . . . . . . . . M 69‑75
Administrative and support service activities (1) . . . . . . . . . . . . . N 77‑82
Human health and social work activities . . . . . . . . . . . . . . . . . . . . Health and social work Q 86‑88
Culture, recreation and other services . . . . . . . . . . . . . . . . . . . . . . Other services R‑S 90‑96
Arts, entertainment and recreation . . . . . . . . . . . . . . . . . . . . . . . R 90‑93
Other service activities . . . . . . . . . . . . . . . . . . . . . . . . . . . . . . . . . . S 94‑96
(1) Excluding employment activities (NACE‑BEL 78), which comprise in particular temporary employment agency activities.
108 ❙ THE 2014 SOCIAL BALANCE SHEET ❙ nBB Economic review
2. composition of analysis populations
2.1 methodological principles
The methodological principles that governed the composition of the populations of firms used in the analysis of the social balance sheets are described in detail in Annex 1 to the article “The social balance sheet 2005”, which appeared in the December 2006 Economic Review and is available on the National Bank of Belgium’s website (www.nbb.be).
In order to have reliable and consistent data, the analysis only considers the social balance sheets of firms which meet a number of criteria. in particular :
– the financial year must comprise twelve months and end on 31 December ;– firms must be in the private sector (1), employ at least one full-time equivalent worker, and their economic activity and
location must be clearly identified (2) ;– the data reported in the social balance sheet must tally exactly with the data in the annual accounts (3) ;– firms submitting abnormal or mistaken figures for hourly staff costs or average working time are left out.
Application of these methodological principles means that the number of social balance sheets included in the analysis for the purposes of this article is considerably smaller, each year, than the total number of social balance sheets filed with the Central Balance Sheet Office. At the end of the selection process, the total population for 2014 comprised 85 572 firms employing an average of 2 018 700 salaried workers.
2.2 characteristics of the analysis population in 2014
In 2014, the number of workers employed in the firms in the analysis population came to 76.4 % of the corresponding private sector employment recorded in the national accounts.
representativeness according to the employment criterion varies from one branch of activity to another. in some branches, the end-date criterion for closing the accounts has a big influence on the representativeness rate. For instance, in trade and transport, this rate is 70.4 % if the sample is limited to those firms closing their accounts on 31 December, but it goes up to 93.5 % if all closing dates are considered (4).
Moreover, certain categories of firms or jobs do not appear in the analysis population. This is true of non-profit-making organisations employing fewer than 20 FTE workers, which are not required to file a social balance sheet. Similarly, employees working for an employer who is not incorporated as a company are not included since the obligation to file a social balance sheet only applies to companies. Consequently, the representativeness of the analysed population expressed as a percentage of the salaried employment recorded in the national accounts is particularly low in the branches where there are proportionally more of these firms or workers. This is the case in agriculture and in the other services branch (which covers for instance art, culture and recreational activities).
Overall, workers in the trade and transport branch represent 26.6 % of the staff in the sample population, those employed in health and social work 22.7 % and those in industry 20.6 %. The other branches are relatively less important, at 10.6 % for business services, 7.1 % for construction, and 5.2 % for the finance and insurance branch. The branches covering information and communication (3.6 %), other services (2.6 %) and especially agriculture (0.3 %) are more marginal.
(1) Private sector employment is defined as employment recorded in the total economy (S.1), less employment in the public sector (S.13) and in the household sector (S.14). This concept also excludes workers employed in NACE-BEL divisions 84 (public administration and defence ; compulsory social security) and 85 (education). NACE-BEL division 78 (employment activities), which includes in particular temporary employment agency activities, is also excluded.
(2) Firms whose activity or address is unknown are excluded from the population.(3) This amounts to excluding firms in which some of the employees work abroad or are not entered in the staff register (statutory staff).(4) For all branches taken together, the choice of just those firms that close their accounts at the end of the calendar year brings the representativeness rate back down from
90.3 % (all closing dates) to 76.4 % (31 December as end of the financial year).
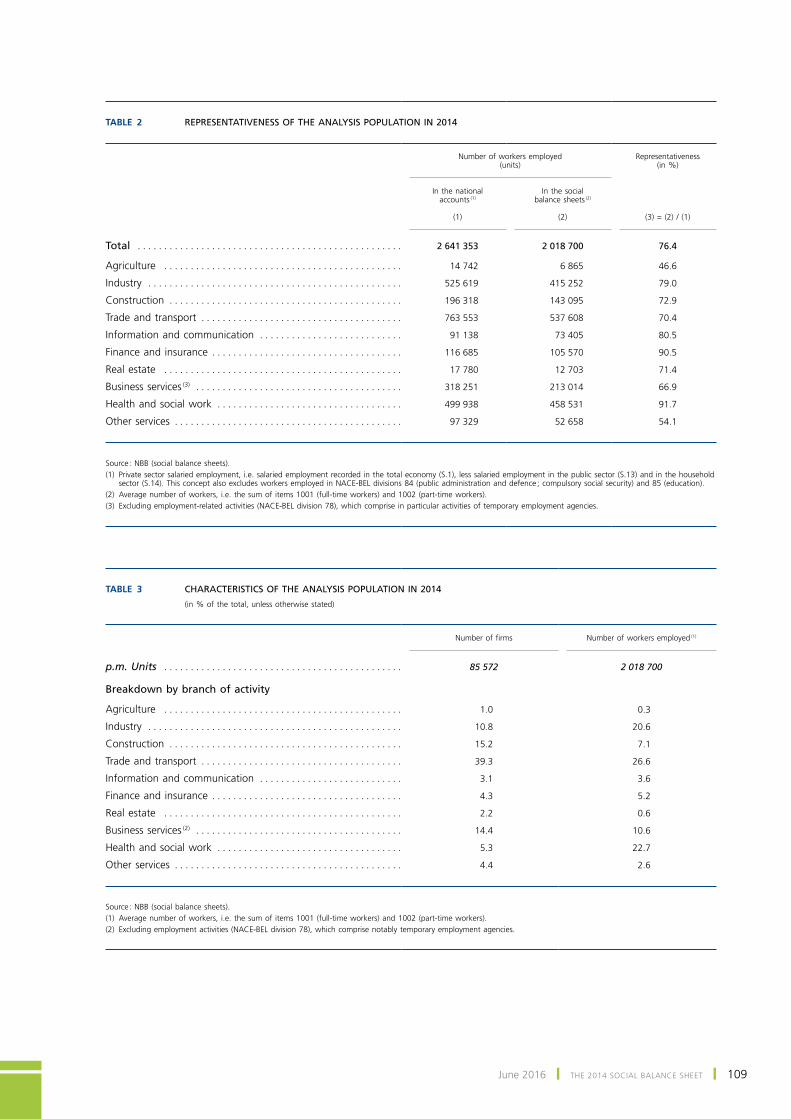
June 2016 ❙ THE 2014 SOCIAL BALANCE SHEET ❙ 109
TABLE 2 REPRESENTATIVENESS OF THE ANALYSIS POPULATION IN 2014
Number of workers employed (units)
Representativeness (in %)
In the national accounts (1)
In the social balance sheets (2)
(1)
(2)
(3) = (2) / (1)
Total . . . . . . . . . . . . . . . . . . . . . . . . . . . . . . . . . . . . . . . . . . . . . . . . . . 2 641 353 2 018 700 76.4
Agriculture . . . . . . . . . . . . . . . . . . . . . . . . . . . . . . . . . . . . . . . . . . . . . 14 742 6 865 46.6
Industry . . . . . . . . . . . . . . . . . . . . . . . . . . . . . . . . . . . . . . . . . . . . . . . . 525 619 415 252 79.0
Construction . . . . . . . . . . . . . . . . . . . . . . . . . . . . . . . . . . . . . . . . . . . . 196 318 143 095 72.9
Trade and transport . . . . . . . . . . . . . . . . . . . . . . . . . . . . . . . . . . . . . . 763 553 537 608 70.4
Information and communication . . . . . . . . . . . . . . . . . . . . . . . . . . . 91 138 73 405 80.5
Finance and insurance . . . . . . . . . . . . . . . . . . . . . . . . . . . . . . . . . . . . 116 685 105 570 90.5
Real estate . . . . . . . . . . . . . . . . . . . . . . . . . . . . . . . . . . . . . . . . . . . . . 17 780 12 703 71.4
Business services (3) . . . . . . . . . . . . . . . . . . . . . . . . . . . . . . . . . . . . . . . 318 251 213 014 66.9
Health and social work . . . . . . . . . . . . . . . . . . . . . . . . . . . . . . . . . . . 499 938 458 531 91.7
Other services . . . . . . . . . . . . . . . . . . . . . . . . . . . . . . . . . . . . . . . . . . . 97 329 52 658 54.1
Source : NBB (social balance sheets).(1) Private sector salaried employment, i.e. salaried employment recorded in the total economy (S.1), less salaried employment in the public sector (S.13) and in the household
sector (S.14). This concept also excludes workers employed in NACE‑BEL divisions 84 (public administration and defence ; compulsory social security) and 85 (education).(2) Average number of workers, i.e. the sum of items 1001 (full‑time workers) and 1002 (part‑time workers).(3) Excluding employment‑related activities (NACE‑BEL division 78), which comprise in particular activities of temporary employment agencies.
TABLE 3 CHARACTERISTICS OF THE ANALYSIS POPULATION IN 2014
(in % of the total, unless otherwise stated)
Number of firms
Number of workers employed (1)
p.m. Units . . . . . . . . . . . . . . . . . . . . . . . . . . . . . . . . . . . . . . . . . . . . . 85 572 2 018 700
Breakdown by branch of activity
Agriculture . . . . . . . . . . . . . . . . . . . . . . . . . . . . . . . . . . . . . . . . . . . . . 1.0 0.3
Industry . . . . . . . . . . . . . . . . . . . . . . . . . . . . . . . . . . . . . . . . . . . . . . . . 10.8 20.6
Construction . . . . . . . . . . . . . . . . . . . . . . . . . . . . . . . . . . . . . . . . . . . . 15.2 7.1
Trade and transport . . . . . . . . . . . . . . . . . . . . . . . . . . . . . . . . . . . . . . 39.3 26.6
Information and communication . . . . . . . . . . . . . . . . . . . . . . . . . . . 3.1 3.6
Finance and insurance . . . . . . . . . . . . . . . . . . . . . . . . . . . . . . . . . . . . 4.3 5.2
Real estate . . . . . . . . . . . . . . . . . . . . . . . . . . . . . . . . . . . . . . . . . . . . . 2.2 0.6
Business services (2) . . . . . . . . . . . . . . . . . . . . . . . . . . . . . . . . . . . . . . . 14.4 10.6
Health and social work . . . . . . . . . . . . . . . . . . . . . . . . . . . . . . . . . . . 5.3 22.7
Other services . . . . . . . . . . . . . . . . . . . . . . . . . . . . . . . . . . . . . . . . . . . 4.4 2.6
Source : NBB (social balance sheets).(1) Average number of workers, i.e. the sum of items 1001 (full-time workers) and 1002 (part-time workers).(2) Excluding employment activities (NACE-BEL division 78), which comprise notably temporary employment agencies.
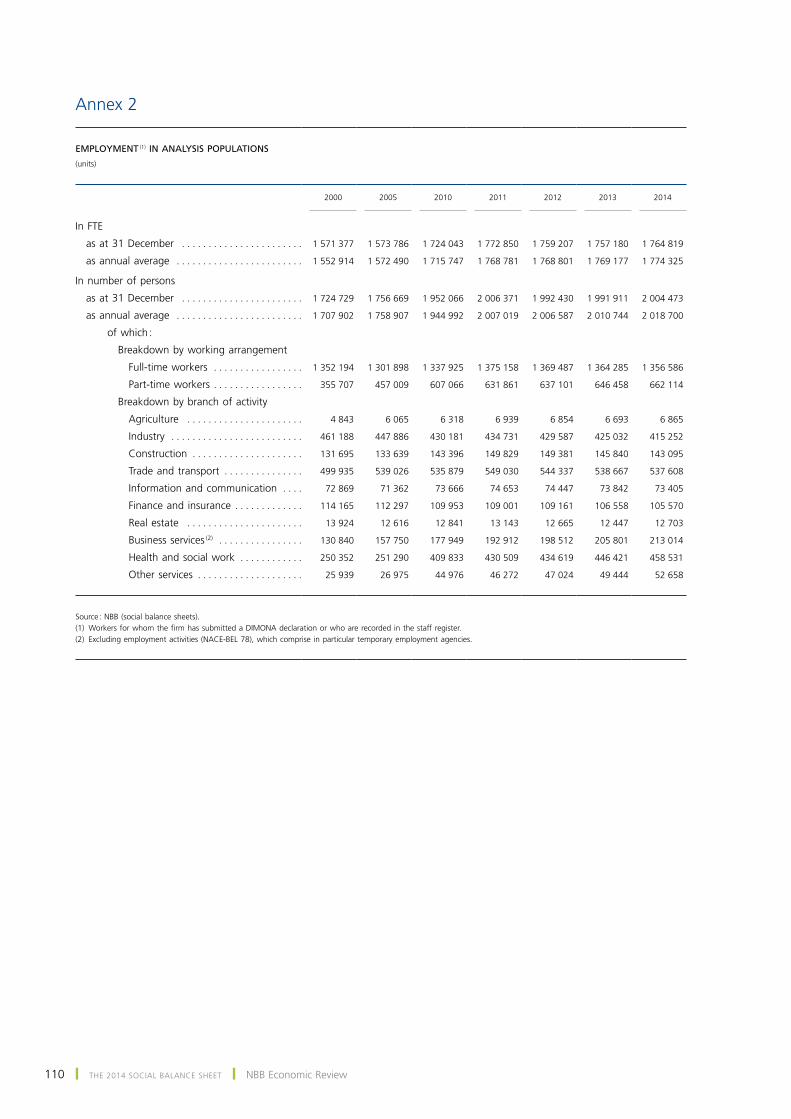
110 ❙ THE 2014 SOCIAL BALANCE SHEET ❙ nBB Economic review
Annex 2
EMPLOYMENT (1) IN ANALYSIS POPULATIONS
(units)
2000
2005
2010
2011
2012
2013
2014
In FTE
as at 31 December . . . . . . . . . . . . . . . . . . . . . . . 1 571 377 1 573 786 1 724 043 1 772 850 1 759 207 1 757 180 1 764 819
as annual average . . . . . . . . . . . . . . . . . . . . . . . . 1 552 914 1 572 490 1 715 747 1 768 781 1 768 801 1 769 177 1 774 325
In number of persons
as at 31 December . . . . . . . . . . . . . . . . . . . . . . . 1 724 729 1 756 669 1 952 066 2 006 371 1 992 430 1 991 911 2 004 473
as annual average . . . . . . . . . . . . . . . . . . . . . . . . 1 707 902 1 758 907 1 944 992 2 007 019 2 006 587 2 010 744 2 018 700
of which :
Breakdown by working arrangement
Full‑time workers . . . . . . . . . . . . . . . . . 1 352 194 1 301 898 1 337 925 1 375 158 1 369 487 1 364 285 1 356 586
Part‑time workers . . . . . . . . . . . . . . . . . 355 707 457 009 607 066 631 861 637 101 646 458 662 114
Breakdown by branch of activity
Agriculture . . . . . . . . . . . . . . . . . . . . . . 4 843 6 065 6 318 6 939 6 854 6 693 6 865
Industry . . . . . . . . . . . . . . . . . . . . . . . . . 461 188 447 886 430 181 434 731 429 587 425 032 415 252
Construction . . . . . . . . . . . . . . . . . . . . . 131 695 133 639 143 396 149 829 149 381 145 840 143 095
Trade and transport . . . . . . . . . . . . . . . 499 935 539 026 535 879 549 030 544 337 538 667 537 608
Information and communication . . . . 72 869 71 362 73 666 74 653 74 447 73 842 73 405
Finance and insurance . . . . . . . . . . . . . 114 165 112 297 109 953 109 001 109 161 106 558 105 570
Real estate . . . . . . . . . . . . . . . . . . . . . . 13 924 12 616 12 841 13 143 12 665 12 447 12 703
Business services (2) . . . . . . . . . . . . . . . . 130 840 157 750 177 949 192 912 198 512 205 801 213 014
Health and social work . . . . . . . . . . . . 250 352 251 290 409 833 430 509 434 619 446 421 458 531
Other services . . . . . . . . . . . . . . . . . . . . 25 939 26 975 44 976 46 272 47 024 49 444 52 658
Source : NBB (social balance sheets).(1) Workers for whom the firm has submitted a DIMONA declaration or who are recorded in the staff register.(2) Excluding employment activities (NACE‑BEL 78), which comprise in particular temporary employment agencies.
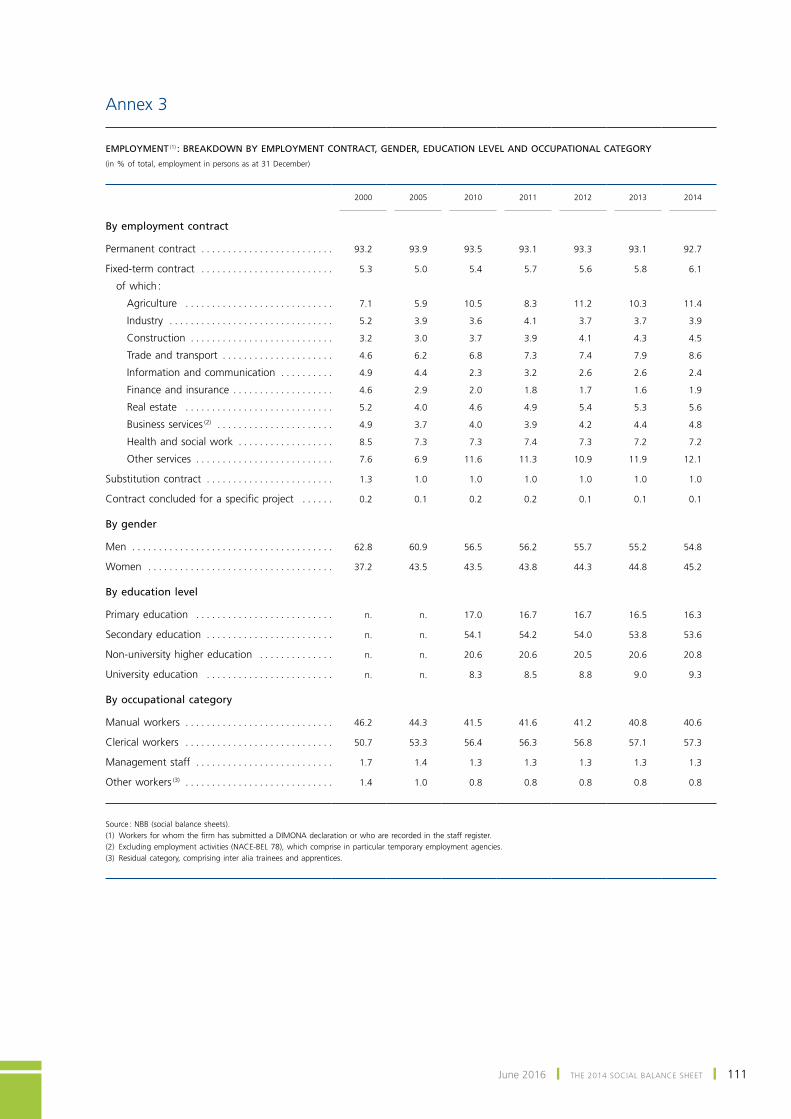
June 2016 ❙ THE 2014 SOCIAL BALANCE SHEET ❙ 111
Annex 3
EMPLOYMENT (1) : BREAKDOWN BY EMPLOYMENT CONTRACT, GENDER, EDUCATION LEVEL AND OCCUPATIONAL CATEGORY
(in % of total, employment in persons as at 31 December)
2000
2005
2010
2011
2012
2013
2014
By employment contract
Permanent contract . . . . . . . . . . . . . . . . . . . . . . . . . 93.2 93.9 93.5 93.1 93.3 93.1 92.7
Fixed‑term contract . . . . . . . . . . . . . . . . . . . . . . . . . 5.3 5.0 5.4 5.7 5.6 5.8 6.1
of which :
Agriculture . . . . . . . . . . . . . . . . . . . . . . . . . . . . 7.1 5.9 10.5 8.3 11.2 10.3 11.4
Industry . . . . . . . . . . . . . . . . . . . . . . . . . . . . . . . 5.2 3.9 3.6 4.1 3.7 3.7 3.9
Construction . . . . . . . . . . . . . . . . . . . . . . . . . . . 3.2 3.0 3.7 3.9 4.1 4.3 4.5
Trade and transport . . . . . . . . . . . . . . . . . . . . . 4.6 6.2 6.8 7.3 7.4 7.9 8.6
Information and communication . . . . . . . . . . 4.9 4.4 2.3 3.2 2.6 2.6 2.4
Finance and insurance . . . . . . . . . . . . . . . . . . . 4.6 2.9 2.0 1.8 1.7 1.6 1.9
Real estate . . . . . . . . . . . . . . . . . . . . . . . . . . . . 5.2 4.0 4.6 4.9 5.4 5.3 5.6
Business services (2) . . . . . . . . . . . . . . . . . . . . . . 4.9 3.7 4.0 3.9 4.2 4.4 4.8
Health and social work . . . . . . . . . . . . . . . . . . 8.5 7.3 7.3 7.4 7.3 7.2 7.2
Other services . . . . . . . . . . . . . . . . . . . . . . . . . . 7.6 6.9 11.6 11.3 10.9 11.9 12.1
Substitution contract . . . . . . . . . . . . . . . . . . . . . . . . 1.3 1.0 1.0 1.0 1.0 1.0 1.0
Contract concluded for a specific project . . . . . . 0.2 0.1 0.2 0.2 0.1 0.1 0.1
By gender
Men . . . . . . . . . . . . . . . . . . . . . . . . . . . . . . . . . . . . . . 62.8 60.9 56.5 56.2 55.7 55.2 54.8
Women . . . . . . . . . . . . . . . . . . . . . . . . . . . . . . . . . . . 37.2 43.5 43.5 43.8 44.3 44.8 45.2
By education level
Primary education . . . . . . . . . . . . . . . . . . . . . . . . . . n. n. 17.0 16.7 16.7 16.5 16.3
Secondary education . . . . . . . . . . . . . . . . . . . . . . . . n. n. 54.1 54.2 54.0 53.8 53.6
Non‑university higher education . . . . . . . . . . . . . . n. n. 20.6 20.6 20.5 20.6 20.8
University education . . . . . . . . . . . . . . . . . . . . . . . . n. n. 8.3 8.5 8.8 9.0 9.3
By occupational category
Manual workers . . . . . . . . . . . . . . . . . . . . . . . . . . . . 46.2 44.3 41.5 41.6 41.2 40.8 40.6
Clerical workers . . . . . . . . . . . . . . . . . . . . . . . . . . . . 50.7 53.3 56.4 56.3 56.8 57.1 57.3
Management staff . . . . . . . . . . . . . . . . . . . . . . . . . . 1.7 1.4 1.3 1.3 1.3 1.3 1.3
Other workers (3) . . . . . . . . . . . . . . . . . . . . . . . . . . . . 1.4 1.0 0.8 0.8 0.8 0.8 0.8
Source : NBB (social balance sheets).(1) Workers for whom the firm has submitted a DIMONA declaration or who are recorded in the staff register.(2) Excluding employment activities (NACE‑BEL 78), which comprise in particular temporary employment agencies.(3) Residual category, comprising inter alia trainees and apprentices.
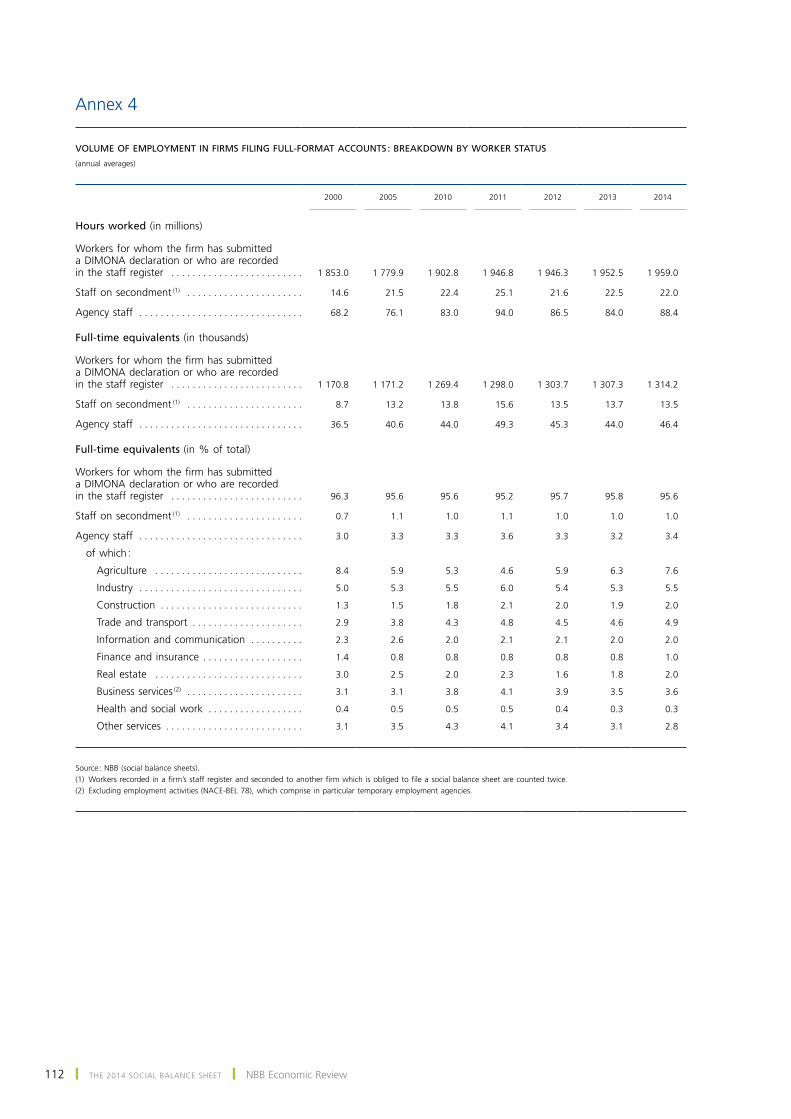
112 ❙ THE 2014 SOCIAL BALANCE SHEET ❙ nBB Economic review
Annex 4
VOLUME OF EMPLOYMENT IN FIRMS FILING FULL‑FORMAT ACCOUNTS : BREAKDOWN BY WORKER STATUS
(annual averages)
2000
2005
2010
2011
2012
2013
2014
Hours worked (in millions)
Workers for whom the firm has submitted a DIMONA declaration or who are recorded in the staff register . . . . . . . . . . . . . . . . . . . . . . . . . 1 853.0 1 779.9 1 902.8 1 946.8 1 946.3 1 952.5 1 959.0
Staff on secondment (1) . . . . . . . . . . . . . . . . . . . . . . 14.6 21.5 22.4 25.1 21.6 22.5 22.0
Agency staff . . . . . . . . . . . . . . . . . . . . . . . . . . . . . . . 68.2 76.1 83.0 94.0 86.5 84.0 88.4
Full‑time equivalents (in thousands)
Workers for whom the firm has submitted a DIMONA declaration or who are recorded in the staff register . . . . . . . . . . . . . . . . . . . . . . . . . 1 170.8 1 171.2 1 269.4 1 298.0 1 303.7 1 307.3 1 314.2
Staff on secondment (1) . . . . . . . . . . . . . . . . . . . . . . 8.7 13.2 13.8 15.6 13.5 13.7 13.5
Agency staff . . . . . . . . . . . . . . . . . . . . . . . . . . . . . . . 36.5 40.6 44.0 49.3 45.3 44.0 46.4
Full‑time equivalents (in % of total)
Workers for whom the firm has submitted a DIMONA declaration or who are recorded in the staff register . . . . . . . . . . . . . . . . . . . . . . . . . 96.3 95.6 95.6 95.2 95.7 95.8 95.6
Staff on secondment (1) . . . . . . . . . . . . . . . . . . . . . . 0.7 1.1 1.0 1.1 1.0 1.0 1.0
Agency staff . . . . . . . . . . . . . . . . . . . . . . . . . . . . . . . 3.0 3.3 3.3 3.6 3.3 3.2 3.4
of which :
Agriculture . . . . . . . . . . . . . . . . . . . . . . . . . . . . 8.4 5.9 5.3 4.6 5.9 6.3 7.6
Industry . . . . . . . . . . . . . . . . . . . . . . . . . . . . . . . 5.0 5.3 5.5 6.0 5.4 5.3 5.5
Construction . . . . . . . . . . . . . . . . . . . . . . . . . . . 1.3 1.5 1.8 2.1 2.0 1.9 2.0
Trade and transport . . . . . . . . . . . . . . . . . . . . . 2.9 3.8 4.3 4.8 4.5 4.6 4.9
Information and communication . . . . . . . . . . 2.3 2.6 2.0 2.1 2.1 2.0 2.0
Finance and insurance . . . . . . . . . . . . . . . . . . . 1.4 0.8 0.8 0.8 0.8 0.8 1.0
Real estate . . . . . . . . . . . . . . . . . . . . . . . . . . . . 3.0 2.5 2.0 2.3 1.6 1.8 2.0
Business services (2) . . . . . . . . . . . . . . . . . . . . . . 3.1 3.1 3.8 4.1 3.9 3.5 3.6
Health and social work . . . . . . . . . . . . . . . . . . 0.4 0.5 0.5 0.5 0.4 0.3 0.3
Other services . . . . . . . . . . . . . . . . . . . . . . . . . . 3.1 3.5 4.3 4.1 3.4 3.1 2.8
Source : NBB (social balance sheets).(1) Workers recorded in a firm’s staff register and seconded to another firm which is obliged to file a social balance sheet are counted twice.(2) Excluding employment activities (NACE‑BEL 78), which comprise in particular temporary employment agencies.
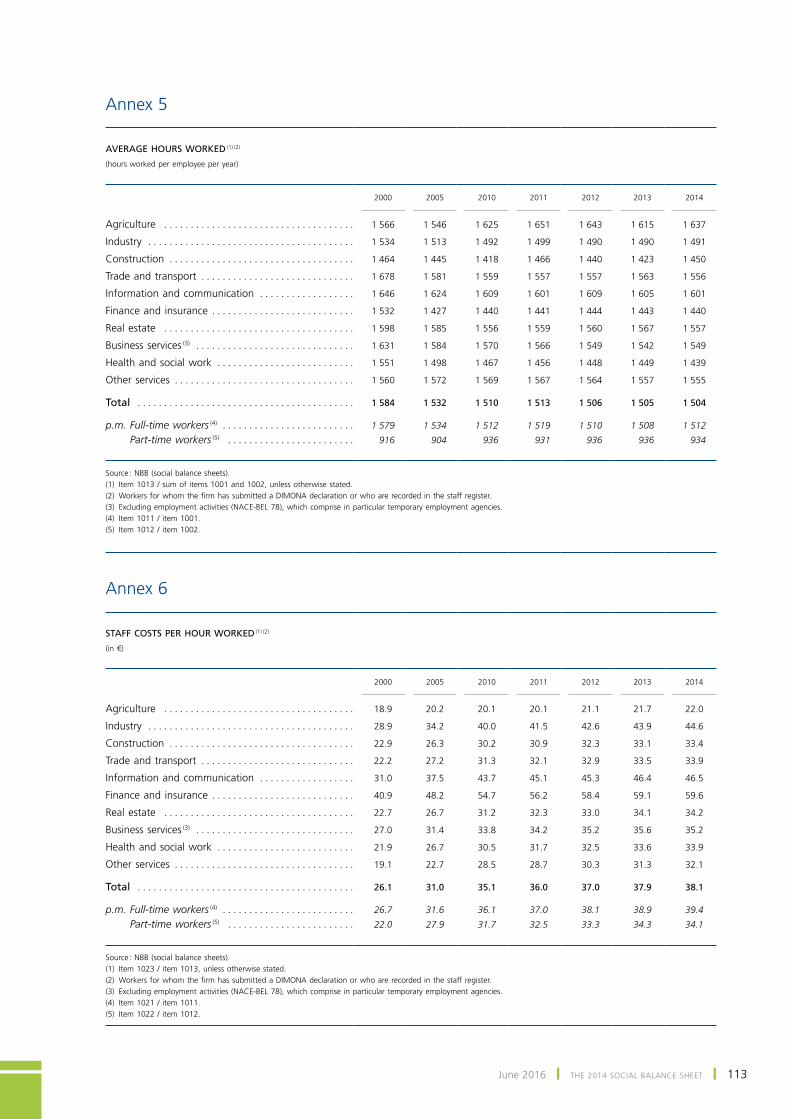
June 2016 ❙ THE 2014 SOCIAL BALANCE SHEET ❙ 113
Annex 5
AVERAGE HOURS WORKED (1) (2)
(hours worked per employee per year)
2000
2005
2010
2011
2012
2013
2014
Agriculture . . . . . . . . . . . . . . . . . . . . . . . . . . . . . . . . . . . . 1 566 1 546 1 625 1 651 1 643 1 615 1 637
Industry . . . . . . . . . . . . . . . . . . . . . . . . . . . . . . . . . . . . . . . 1 534 1 513 1 492 1 499 1 490 1 490 1 491
Construction . . . . . . . . . . . . . . . . . . . . . . . . . . . . . . . . . . . 1 464 1 445 1 418 1 466 1 440 1 423 1 450
Trade and transport . . . . . . . . . . . . . . . . . . . . . . . . . . . . . 1 678 1 581 1 559 1 557 1 557 1 563 1 556
Information and communication . . . . . . . . . . . . . . . . . . 1 646 1 624 1 609 1 601 1 609 1 605 1 601
Finance and insurance . . . . . . . . . . . . . . . . . . . . . . . . . . . 1 532 1 427 1 440 1 441 1 444 1 443 1 440
Real estate . . . . . . . . . . . . . . . . . . . . . . . . . . . . . . . . . . . . 1 598 1 585 1 556 1 559 1 560 1 567 1 557
Business services (3) . . . . . . . . . . . . . . . . . . . . . . . . . . . . . . 1 631 1 584 1 570 1 566 1 549 1 542 1 549
Health and social work . . . . . . . . . . . . . . . . . . . . . . . . . . 1 551 1 498 1 467 1 456 1 448 1 449 1 439
Other services . . . . . . . . . . . . . . . . . . . . . . . . . . . . . . . . . . 1 560 1 572 1 569 1 567 1 564 1 557 1 555
Total . . . . . . . . . . . . . . . . . . . . . . . . . . . . . . . . . . . . . . . . . 1 584 1 532 1 510 1 513 1 506 1 505 1 504
p.m. Full‑time workers (4) . . . . . . . . . . . . . . . . . . . . . . . . . 1 579 1 534 1 512 1 519 1 510 1 508 1 512
Part‑time workers (5) . . . . . . . . . . . . . . . . . . . . . . . . 916 904 936 931 936 936 934
Source : NBB (social balance sheets).(1) Item 1013 / sum of items 1001 and 1002, unless otherwise stated.(2) Workers for whom the firm has submitted a DIMONA declaration or who are recorded in the staff register.(3) Excluding employment activities (NACE‑BEL 78), which comprise in particular temporary employment agencies.(4) Item 1011 / item 1001.(5) Item 1012 / item 1002.
Annex 6
STAFF COSTS PER HOUR WORKED (1) (2)
(in €)
2000
2005
2010
2011
2012
2013
2014
Agriculture . . . . . . . . . . . . . . . . . . . . . . . . . . . . . . . . . . . . 18.9 20.2 20.1 20.1 21.1 21.7 22.0
Industry . . . . . . . . . . . . . . . . . . . . . . . . . . . . . . . . . . . . . . . 28.9 34.2 40.0 41.5 42.6 43.9 44.6
Construction . . . . . . . . . . . . . . . . . . . . . . . . . . . . . . . . . . . 22.9 26.3 30.2 30.9 32.3 33.1 33.4
Trade and transport . . . . . . . . . . . . . . . . . . . . . . . . . . . . . 22.2 27.2 31.3 32.1 32.9 33.5 33.9
Information and communication . . . . . . . . . . . . . . . . . . 31.0 37.5 43.7 45.1 45.3 46.4 46.5
Finance and insurance . . . . . . . . . . . . . . . . . . . . . . . . . . . 40.9 48.2 54.7 56.2 58.4 59.1 59.6
Real estate . . . . . . . . . . . . . . . . . . . . . . . . . . . . . . . . . . . . 22.7 26.7 31.2 32.3 33.0 34.1 34.2
Business services (3) . . . . . . . . . . . . . . . . . . . . . . . . . . . . . . 27.0 31.4 33.8 34.2 35.2 35.6 35.2
Health and social work . . . . . . . . . . . . . . . . . . . . . . . . . . 21.9 26.7 30.5 31.7 32.5 33.6 33.9
Other services . . . . . . . . . . . . . . . . . . . . . . . . . . . . . . . . . . 19.1 22.7 28.5 28.7 30.3 31.3 32.1
Total . . . . . . . . . . . . . . . . . . . . . . . . . . . . . . . . . . . . . . . . . 26.1 31.0 35.1 36.0 37.0 37.9 38.1
p.m. Full‑time workers (4) . . . . . . . . . . . . . . . . . . . . . . . . . 26.7 31.6 36.1 37.0 38.1 38.9 39.4
Part‑time workers (5) . . . . . . . . . . . . . . . . . . . . . . . . 22.0 27.9 31.7 32.5 33.3 34.3 34.1
Source : NBB (social balance sheets).(1) Item 1023 / item 1013, unless otherwise stated.(2) Workers for whom the firm has submitted a DIMONA declaration or who are recorded in the staff register.(3) Excluding employment activities (NACE‑BEL 78), which comprise in particular temporary employment agencies.(4) Item 1021 / item 1011.(5) Item 1022 / item 1012.
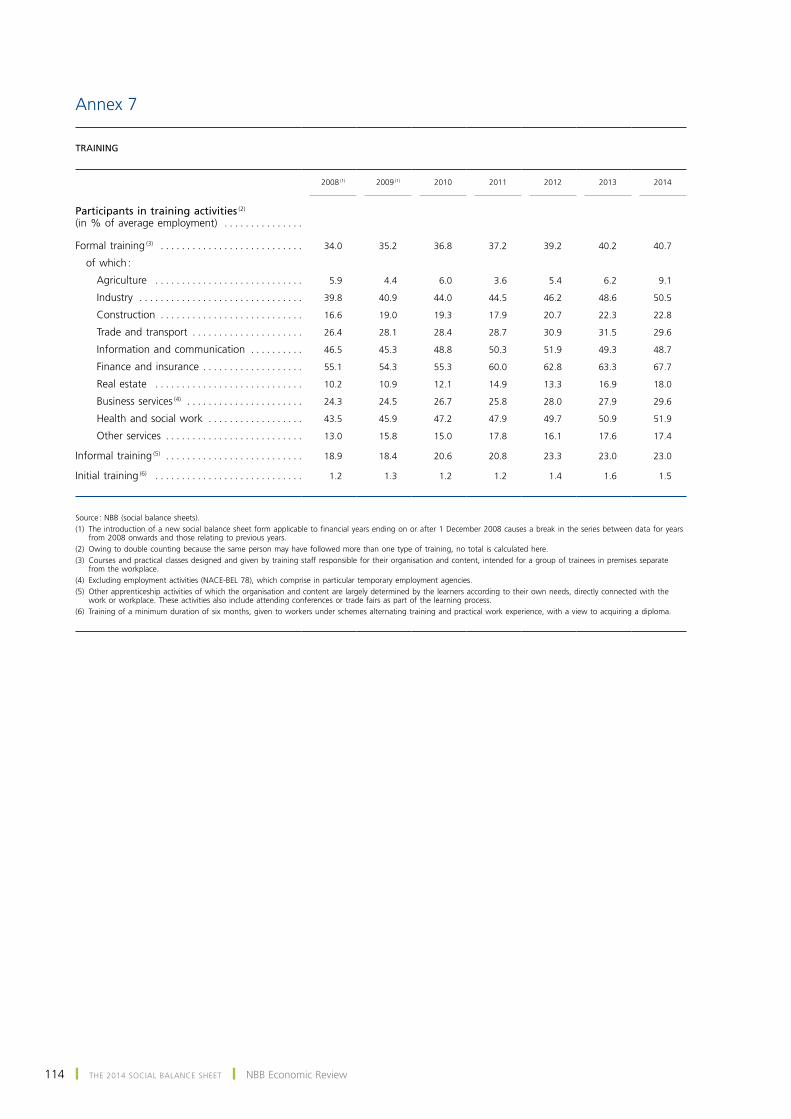
114 ❙ THE 2014 SOCIAL BALANCE SHEET ❙ nBB Economic review
Annex 7
TRAINING
2008 (1)
2009 (1)
2010
2011
2012
2013
2014
Participants in training activities (2) (in % of average employment) . . . . . . . . . . . . . . .
Formal training (3) . . . . . . . . . . . . . . . . . . . . . . . . . . . 34.0 35.2 36.8 37.2 39.2 40.2 40.7
of which :
Agriculture . . . . . . . . . . . . . . . . . . . . . . . . . . . . 5.9 4.4 6.0 3.6 5.4 6.2 9.1
Industry . . . . . . . . . . . . . . . . . . . . . . . . . . . . . . . 39.8 40.9 44.0 44.5 46.2 48.6 50.5
Construction . . . . . . . . . . . . . . . . . . . . . . . . . . . 16.6 19.0 19.3 17.9 20.7 22.3 22.8
Trade and transport . . . . . . . . . . . . . . . . . . . . . 26.4 28.1 28.4 28.7 30.9 31.5 29.6
Information and communication . . . . . . . . . . 46.5 45.3 48.8 50.3 51.9 49.3 48.7
Finance and insurance . . . . . . . . . . . . . . . . . . . 55.1 54.3 55.3 60.0 62.8 63.3 67.7
Real estate . . . . . . . . . . . . . . . . . . . . . . . . . . . . 10.2 10.9 12.1 14.9 13.3 16.9 18.0
Business services (4) . . . . . . . . . . . . . . . . . . . . . . 24.3 24.5 26.7 25.8 28.0 27.9 29.6
Health and social work . . . . . . . . . . . . . . . . . . 43.5 45.9 47.2 47.9 49.7 50.9 51.9
Other services . . . . . . . . . . . . . . . . . . . . . . . . . . 13.0 15.8 15.0 17.8 16.1 17.6 17.4
Informal training (5) . . . . . . . . . . . . . . . . . . . . . . . . . . 18.9 18.4 20.6 20.8 23.3 23.0 23.0
Initial training (6) . . . . . . . . . . . . . . . . . . . . . . . . . . . . 1.2 1.3 1.2 1.2 1.4 1.6 1.5
Source : NBB (social balance sheets).(1) The introduction of a new social balance sheet form applicable to financial years ending on or after 1 December 2008 causes a break in the series between data for years
from 2008 onwards and those relating to previous years.(2) Owing to double counting because the same person may have followed more than one type of training, no total is calculated here.(3) Courses and practical classes designed and given by training staff responsible for their organisation and content, intended for a group of trainees in premises separate
from the workplace.(4) Excluding employment activities (NACE‑BEL 78), which comprise in particular temporary employment agencies.(5) Other apprenticeship activities of which the organisation and content are largely determined by the learners according to their own needs, directly connected with the
work or workplace. These activities also include attending conferences or trade fairs as part of the learning process.(6) Training of a minimum duration of six months, given to workers under schemes alternating training and practical work experience, with a view to acquiring a diploma.
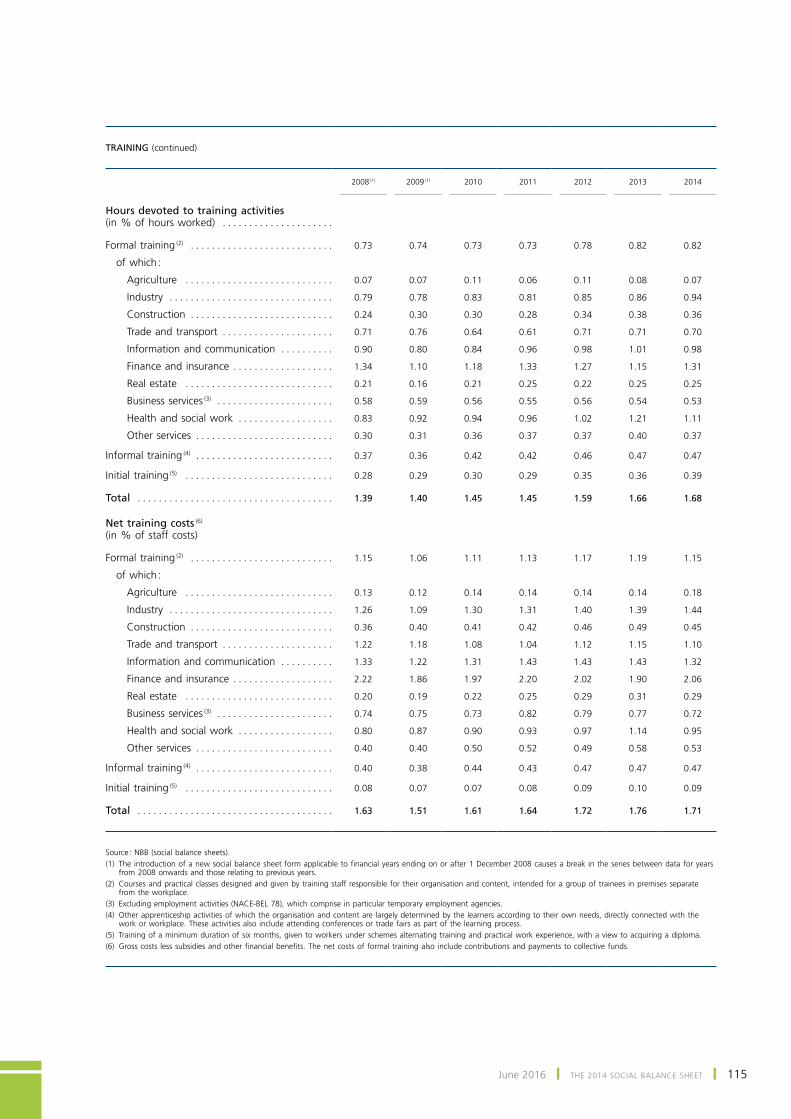
June 2016 ❙ THE 2014 SOCIAL BALANCE SHEET ❙ 115
TRAINING (continued)
2008 (1)
2009 (1)
2010
2011
2012
2013
2014
Hours devoted to training activities (in % of hours worked) . . . . . . . . . . . . . . . . . . . . .
Formal training (2) . . . . . . . . . . . . . . . . . . . . . . . . . . . 0.73 0.74 0.73 0.73 0.78 0.82 0.82
of which :
Agriculture . . . . . . . . . . . . . . . . . . . . . . . . . . . . 0.07 0.07 0.11 0.06 0.11 0.08 0.07
Industry . . . . . . . . . . . . . . . . . . . . . . . . . . . . . . . 0.79 0.78 0.83 0.81 0.85 0.86 0.94
Construction . . . . . . . . . . . . . . . . . . . . . . . . . . . 0.24 0.30 0.30 0.28 0.34 0.38 0.36
Trade and transport . . . . . . . . . . . . . . . . . . . . . 0.71 0.76 0.64 0.61 0.71 0.71 0.70
Information and communication . . . . . . . . . . 0.90 0.80 0.84 0.96 0.98 1.01 0.98
Finance and insurance . . . . . . . . . . . . . . . . . . . 1.34 1.10 1.18 1.33 1.27 1.15 1.31
Real estate . . . . . . . . . . . . . . . . . . . . . . . . . . . . 0.21 0.16 0.21 0.25 0.22 0.25 0.25
Business services (3) . . . . . . . . . . . . . . . . . . . . . . 0.58 0.59 0.56 0.55 0.56 0.54 0.53
Health and social work . . . . . . . . . . . . . . . . . . 0.83 0.92 0.94 0.96 1.02 1.21 1.11
Other services . . . . . . . . . . . . . . . . . . . . . . . . . . 0.30 0.31 0.36 0.37 0.37 0.40 0.37
Informal training (4) . . . . . . . . . . . . . . . . . . . . . . . . . . 0.37 0.36 0.42 0.42 0.46 0.47 0.47
Initial training (5) . . . . . . . . . . . . . . . . . . . . . . . . . . . . 0.28 0.29 0.30 0.29 0.35 0.36 0.39
Total . . . . . . . . . . . . . . . . . . . . . . . . . . . . . . . . . . . . . 1.39 1.40 1.45 1.45 1.59 1.66 1.68
Net training costs (6) (in % of staff costs)
Formal training (2) . . . . . . . . . . . . . . . . . . . . . . . . . . . 1.15 1.06 1.11 1.13 1.17 1.19 1.15
of which :
Agriculture . . . . . . . . . . . . . . . . . . . . . . . . . . . . 0.13 0.12 0.14 0.14 0.14 0.14 0.18
Industry . . . . . . . . . . . . . . . . . . . . . . . . . . . . . . . 1.26 1.09 1.30 1.31 1.40 1.39 1.44
Construction . . . . . . . . . . . . . . . . . . . . . . . . . . . 0.36 0.40 0.41 0.42 0.46 0.49 0.45
Trade and transport . . . . . . . . . . . . . . . . . . . . . 1.22 1.18 1.08 1.04 1.12 1.15 1.10
Information and communication . . . . . . . . . . 1.33 1.22 1.31 1.43 1.43 1.43 1.32
Finance and insurance . . . . . . . . . . . . . . . . . . . 2.22 1.86 1.97 2.20 2.02 1.90 2.06
Real estate . . . . . . . . . . . . . . . . . . . . . . . . . . . . 0.20 0.19 0.22 0.25 0.29 0.31 0.29
Business services (3) . . . . . . . . . . . . . . . . . . . . . . 0.74 0.75 0.73 0.82 0.79 0.77 0.72
Health and social work . . . . . . . . . . . . . . . . . . 0.80 0.87 0.90 0.93 0.97 1.14 0.95
Other services . . . . . . . . . . . . . . . . . . . . . . . . . . 0.40 0.40 0.50 0.52 0.49 0.58 0.53
Informal training (4) . . . . . . . . . . . . . . . . . . . . . . . . . . 0.40 0.38 0.44 0.43 0.47 0.47 0.47
Initial training (5) . . . . . . . . . . . . . . . . . . . . . . . . . . . . 0.08 0.07 0.07 0.08 0.09 0.10 0.09
Total . . . . . . . . . . . . . . . . . . . . . . . . . . . . . . . . . . . . . 1.63 1.51 1.61 1.64 1.72 1.76 1.71
Source : NBB (social balance sheets).(1) The introduction of a new social balance sheet form applicable to financial years ending on or after 1 December 2008 causes a break in the series between data for years
from 2008 onwards and those relating to previous years.(2) Courses and practical classes designed and given by training staff responsible for their organisation and content, intended for a group of trainees in premises separate
from the workplace.(3) Excluding employment activities (NACE‑BEL 78), which comprise in particular temporary employment agencies.(4) Other apprenticeship activities of which the organisation and content are largely determined by the learners according to their own needs, directly connected with the
work or workplace. These activities also include attending conferences or trade fairs as part of the learning process.(5) Training of a minimum duration of six months, given to workers under schemes alternating training and practical work experience, with a view to acquiring a diploma.(6) Gross costs less subsidies and other financial benefits. The net costs of formal training also include contributions and payments to collective funds.
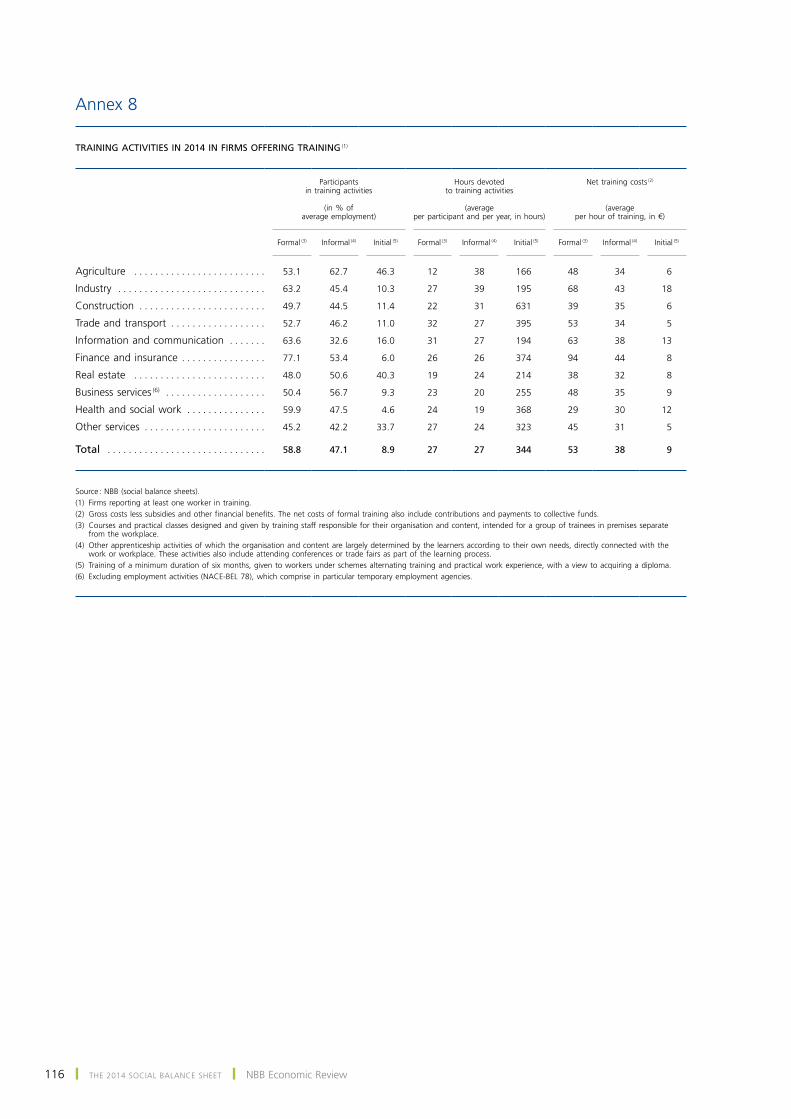
116 ❙ THE 2014 SOCIAL BALANCE SHEET ❙ nBB Economic review
Annex 8
TRAINING ACTIVITIES IN 2014 IN FIRMS OFFERING TRAINING (1)
Participants in training activities
(in % of
average employment)
Hours devoted to training activities
(average
per participant and per year, in hours)
Net training costs (2)
(average per hour of training, in €)
Formal (3)
Informal (4)
Initial (5)
Formal (3)
Informal (4)
Initial (5)
Formal (3)
Informal (4)
Initial (5)
Agriculture . . . . . . . . . . . . . . . . . . . . . . . . . 53.1 62.7 46.3 12 38 166 48 34 6
Industry . . . . . . . . . . . . . . . . . . . . . . . . . . . . 63.2 45.4 10.3 27 39 195 68 43 18
Construction . . . . . . . . . . . . . . . . . . . . . . . . 49.7 44.5 11.4 22 31 631 39 35 6
Trade and transport . . . . . . . . . . . . . . . . . . 52.7 46.2 11.0 32 27 395 53 34 5
Information and communication . . . . . . . 63.6 32.6 16.0 31 27 194 63 38 13
Finance and insurance . . . . . . . . . . . . . . . . 77.1 53.4 6.0 26 26 374 94 44 8
Real estate . . . . . . . . . . . . . . . . . . . . . . . . . 48.0 50.6 40.3 19 24 214 38 32 8
Business services (6) . . . . . . . . . . . . . . . . . . . 50.4 56.7 9.3 23 20 255 48 35 9
Health and social work . . . . . . . . . . . . . . . 59.9 47.5 4.6 24 19 368 29 30 12
Other services . . . . . . . . . . . . . . . . . . . . . . . 45.2 42.2 33.7 27 24 323 45 31 5
Total . . . . . . . . . . . . . . . . . . . . . . . . . . . . . . 58.8 47.1 8.9 27 27 344 53 38 9
Source : NBB (social balance sheets).(1) Firms reporting at least one worker in training.(2) Gross costs less subsidies and other financial benefits. The net costs of formal training also include contributions and payments to collective funds.(3) Courses and practical classes designed and given by training staff responsible for their organisation and content, intended for a group of trainees in premises separate
from the workplace.(4) Other apprenticeship activities of which the organisation and content are largely determined by the learners according to their own needs, directly connected with the
work or workplace. These activities also include attending conferences or trade fairs as part of the learning process.(5) Training of a minimum duration of six months, given to workers under schemes alternating training and practical work experience, with a view to acquiring a diploma.(6) Excluding employment activities (NACE‑BEL 78), which comprise in particular temporary employment agencies.
❙ 117June 2016 ❙ summAriEs of ArticlEs
summaries of articles
Economic projections for Belgium – spring 2016
The article presents the new macroeconomic projections for Belgium for the period 2016-2018, produced by the Bank as part of the Eurosystem’s projection exercises.
The global economy has slowed further in recent months, mainly influenced by adverse conditions emanating from the emerging economies. in the euro area, however, activity continued to expand at a fairly sustained rate, despite the gradual dissipation of two factors which had done much to stimulate growth last year, namely the fall in oil prices and the depreciation of the euro. According to the Eurosystem’s projections, real GDP in the euro area will rise by 1.6 % this year and 1.7 % in 2017 and 2018. Inflation will remain very low in the euro area this year, at 0.2 %, but is forecast to pick up subsequently to reach 1.3 % in 2017 and 1.6 % in 2018, as a result of rising commodity prices and strengthening activity.
In Belgium, activity grew at a slower pace at the beginning of the year, partly as a consequence of the terrorist attacks. Having reached 1.4 % in 2015, growth is expected to dip to 1.3 % in 2016 before strengthening slightly thereafter to 1.5 % in 2017 and 1.6 % in 2018. Domestic demand will be the main engine of growth in Belgium over the projection horizon. Labour market developments will remain dynamic : in cumulative terms, over the period 2016-2018, net job creations are expected to amount to 140 000 units, with the unemployment rate falling to 7.8 % of the labour force by 2018.
Inflation should average 1.6 % in 2016 in Belgium, 1.8 % in 2017 and 1.9 % in 2018. The increase in indirect taxes is likely to fuel inflation in 2016, while in 2017 and 2018 inflation will be driven more by higher commodity prices and by growing domestic cost pressures originating from wages.
Only taking account of the fiscal measures subject to the guidelines for the Eurosystem projections exercises, the public deficit will rise to 2.8 % in 2016, exacerbated by exceptional expenditure (security, migrant crisis) and by the reduction in the ratio of tax revenues to GDP, before declining to 2.4 % of GDP in 2017 and in 2018. Government debt is projected to stabilise at around 106 % of GDP in 2018.
JEL codes : E17, E25, E37, E66
Key words : Belgium, macroeconomic projections, Eurosystem
The ABC of quantitative easing or the basics of central bank asset purchases
The article explains the rationale and transmission mechanisms of a central bank asset purchase programme, with particular focus on the ECB’s own experience. The first part explains how the limits of traditional interest rate policies, in particular the lower bound on nominal interest rates, can complicate the central bank’s steering of longer-term real interest rates and hence jeopardise its primary objective of price stability. the second part explains how asset purchases
118 ❙ summAriEs of ArticlEs ❙ nBB Economic review
can help to circumvent that constraint and allow the central bank to continue to steer borrowing conditions in the economy. Asset purchases actually have an impact on financing conditions well beyond the direct effect they exert on the assets bought because expectations regarding the trajectory of policy rates, various risk premia, the exchange rate and inflation expectations are also affected. Asset purchases create base money and also support money creation, even if the latter impact is more indirect. Quantitative easing is a source of revenue for the Eurosystem today but the future trajectory of these revenues depends on future movements of policy rates. finally, the article explains how maturing bond holdings and a pick-up of nominal economic growth, supported by the asset purchases themselves, are natural mechanisms to exit the regime of abundant central bank liquidity.
JEL codes : E52, E58
Key words : euro area, EcB, Eurosystem, quantitative easing, asset purchase programme, unconventional monetary policy, lower bound
The economic consequences of the flow of refugees into Belgium
The article attempts to put into context and estimate the economic impact of the recent arrival of asylum-seekers in Belgium. Despite the wide media coverage, this wave of refugees only accounts for a very small proportion of the Belgian population and is still much the same as the numbers recorded in the 2000s. its economic impact should not be overestimated either. the authors' estimates point to a relatively limited but still positive effect on economic activity, of around 0.17 % by the year 2020, and, even though the resultant costs weigh heavily on public finances in the short term, a return to a balanced budget is expected in the medium term. it should be noted that better integration into the labour market could bring more positive results. Yet, the employment rate among immigrants is low, especially in Belgium, and the gap with respect to Belgians remains significant. Only part of this phenomenon can be explained by individual features of the foreign population. The problem of recognition of qualifications and skills, lack of human and cultural capital in the host country as well as some degree of discrimination also constitute barriers to immigrant employment. in spite of various policies that have already been put in place, a lot more effort still has to be made to improve the integration of foreigners on the labour market and their socio-economic status too. The country’s economy will then be able to take full advantage of the contribution from their labour force.
JEL codes : F22, J15, J21, J61, J71
Key words : international migration, refugee, labour market integration
Internal resources, bank credit and other funding sources : what are the alternatives for businesses in Belgium ?
Businesses are partly reliant on whatever sources of funding they can find for their activity and development. Quite independently of the resources they generate through retained earnings, the financing instruments actually used by firms depend on their respective costs, as well as on the nature of the funding requirements and the firms’ own characteristics. firms forming part of a group have certain facilities at their disposal, such as access to liquidity reserves common to their group. Other companies, which make up the lion’s share of Belgian firms, do not have such financing facilities and usually resort to bank credit which plays a predominant role in funding SMEs. However, some firms have more limited access to bank loans ; this is particularly true of innovative companies, that have a more risky profile, and, for this reason, are reliant on other sources of funding (non-bank loans in particular).
JEL codes : G32
Key words : corporate finance, corporate investment, firm level
❙ 119June 2016 ❙ summAriEs of ArticlEs
the 2014 social balance sheet
the article on the social balance sheet centres on two main themes : changes in the composition of the volume of labour on the one hand, and the level and movement in the wage gap between men and women on the other hand.
Between 2000 and 2014, the volume of labour measured in FTEs increased by around 193 000 units, or 12.3 % over 14 years. The number of firms analysed increased from 69 939 to 85 572 over the same period. The volume of labour expanded considerably in health and social work (following the increase in the number of balance sheets submitted), but also in other services, and more moderately in trade and transport. conversely, it contracted in industry. there were also substantial changes in the structure of the volume of labour broken down by type of workers. The contribution of personnel employed as clerical staff rose sharply while that of manual workers declined. Part-time workers accounted for a larger proportion of the labour force in 2014. finally, women have become a major driving force in activity, while the volume of labour represented by male workers has diminished.
The study of the results for just under 2 000 firms submitting a full balance sheet shows that, in 2014, the cost of an hour’s labour for male workforce was 13.9 % higher, on average, than for female workers. However, the situation is far from uniform as regards both the aggregate wage gap per branch and the results recorded at the level of the firms themselves. Analysis by branch of activity shows that the wage gap is larger than average in trade and transport and in other services, while it is more moderate in industry and slightly negative in health and social work. At the business level, average hourly costs are higher for men than for women in 69 % of firms. The wage gap is 15 % or larger in one in four firms.
The movement in the wage gap between 2012 and 2014 was measured on the basis of a constant population of just over a thousand firms. The gap narrowed in 57 % of firms, while it increased moderately in 23.5 % of companies. However, there was only little change in the dispersion of the wage gap observations between those two years. the firms in this constant population recording a positive wage gap still represented a large share of the total in 2014, even if they were proportionately fewer than two years ago.
JEL codes : D24, J21, J24, J31
Key words : production, cost, capital, total factor, and multifactor productivity, capacity, labour force and employment, size and structure, human capital, skills, occupational choice, labour productivity, wage level and structure, wage differentials
❙ 121June 2016 ❙ ABstrActs from tHE WorKing pApErs sEriEs
Abstracts from the Working Papers series
290. Predicting Belgium’s GDP using targeted bridge models, by Ch. Piette, January 2016
The paper investigates the usefulness, within the frameworks of the standard bridge model and the ‘bridging with factors’ approach, of a predictor selection procedure that builds on the elastic net algorithm. A pseudo real-time forecasting exercise is performed, in which estimates for Belgium’s quarterly GDP are generated using a monthly dataset of 93 potential predictors. While the simulation results indicate that specifying forecasting models using this procedure can lead to a slight improvement in terms of predictive accuracy over shorter horizons, the forecasting errors made by these ‘targeted’ models are not found to be significantly different from those based on the principal components extracted from the entire set of available indicators. in other words, the only advantage of following such an approach lies in the fact that it enables the forecaster to streamline the information set.
291. Did export promotion help firms weather the crisis ?, by J. Van Biesebroeck, J. Konings, ch. Volpe matincus, January 2016
In the global recession of 2009, exports declined precipitously in many countries. The authors illustrate with firm-level data for Belgium and peru that the decline was very sudden and almost entirely due to lower export sales by existing exporters. After the recession, exports rebounded almost equally quickly and they evaluate whether export promotion programs were an effective tool aiding this recovery. They show that firms taking advantage of this type of support did better during the crisis, controlling flexibly for systematic differences between supported and control firms. The primary mechanism they identify is that supported firms are generally more likely to survive on the export market and, in particular, are more likely to continue exporting to countries hit by the financial crisis.
292. on the role of public policies and wage formation for business investment in r&D : A long-run panel analysis, by T. Buyse, F. Heylen, R. Schoonackers, January 2016
The paper studies the drivers of business funded and performed R&D in a panel of 14 OECD countries since 1981. More specifically, the authors investigate the effects of public R&D related policies and wage formation. Following pesaran (Econometrica, 2006) and Kapetanios et al. (Journal of Econometrics, 2011), their empirical strategy allows for cross-sectionally correlated error terms due to the presence of unobserved common factors, which are potentially non-stationary. They find that tax incentives are effective. Public funding (subsidisation) of R&D performed by firms can also be effective if subsidies are not too low, neither too high. r&D performed within the government sector and within institutions of higher education is basically neutral with respect to business R&D. They find no evidence for crowding out, nor for complementarity. The higher education sector may, however, indirectly be of great significance. Their results reveal human capital accumulation at the tertiary level as a key driver of business R&D in the OECD during the last
122 ❙ ABstrActs from tHE WorKing pApErs sEriEs ❙ nBB Economic review
decades. As for the impact of wage formation, using an indicator for wage pressure developed by Blanchard (Economic Policy, 2006), they find that wage moderation may contribute to innovation, but only in fairly closed economies and in economies with flexible labour markets. In highly open economies and economies with rigid labour markets, rather the opposite holds. In these economies, high wage pressure may enhance creative destruction and force firms to innovate as a competitive strategy. their results show that careful treatment of the properties of the data is crucial.
293. Unraveling firms : Demand, productivity and markups heterogeneity, by E. Forlani, R. Martin, g. mion, m. muûls, february 2016
The authors develop a new econometric framework that simultaneously allows recovering heterogeneity in demand, TFP and markups across firms while leaving the correlation among the three unrestricted. They do this by systematically exploiting assumptions that are implicit in previous firm-level productivity estimation approaches. They use Belgian firms’ production data to quantify TFP, demand and markups and show how they are correlated among them, across time and with measures obtained from other approaches. they also show to what extent their three dimensions of heterogeneity allow us to gain deeper and sharper insight into two key firm-level outcomes : export status and size.
294. Unemployment risk and over-indebtedness : A micro-econometric perspective, by Ph. Du Caju, f. rycx, i. tojerow, february 2016
the authors study how unemployment effects the over-indebtedness of households using the new European Household Finance and Consumption Survey (HFCS). First, they assess the role of different labor market statuses (i.e. employed, unemployed, disabled, retired, etc.) and other household characteristics (i.e. demographics, housing status, household wealth and income, etc.) to determine the likelihood of over-indebtedness. They explore these relationships both at the Euro area level and through country-specific regressions. This approach captures country-specific institutional effects concerning all the different factors which can explain household indebtedness in its most severe form. they also examine the role that each country’s legal and economic institutions play in explaining these differences. The results of the regressions across all countries show that the odds of being over-indebted are much higher in households where the reference person is unemployed.
These odds ratios remain fairly stable across different over-indebtedness indicators and specifications. Interestingly, the authors find similar results for secured debt only. Turning to country-specific results, the role of unemployment varies widely across countries. in spain, france or portugal, for example, the odds ratio for the unemployed group is just below 2, whereas in Austria, Belgium, or italy the odds ratio is higher than 4. secondly, they situate the analysis in a macro-micro frame to identify households and countries that are especially vulnerable to adverse macroeconomic shocks in the labor market. For the Euro area, they find that the percentage of households plagued by overindebtedness increased by more than 10 %, suggesting that another unemployment shock could have a major impact on the financial solvency of Euro area households. Finally, the impact of this shock on single-headed households is much higher than on couple-headed ones.
295. International shocks and domestic prices : How large are strategic complementarities ?, by M. Amiti, O. Itskhoki, J. Konings, March 2016
How strong are strategic complementarities in price setting across firms ? The authors provide a direct empirical estimate of firm price responses to changes in prices of their competitors. They develop a general framework and an empirical identification strategy to estimate the elasticities of a firm’s price response to both its own cost shocks and to the price changes of its competitors. Their approach takes advantage of a new micro-level dataset for the Belgian manufacturing sector, which contains detailed information on firm domestic prices, marginal costs, and competitor prices. the rare features of these data enable them to construct instrumental variables to address the simultaneity of price setting by competing firms. They find strong evidence of strategic complementarities, with a typical firm adjusting its price with an elasticity of 35 % in response to the price changes of its competitors and with an elasticity of 65 % in response to its own cost shocks. Furthermore, they find substantial heterogeneity in these elasticities
❙ 123June 2016 ❙ ABstrActs from tHE WorKing pApErs sEriEs
across firms, with small firms showing no strategic complementarities and a complete cost pass-through, while large firms respond to their cost shocks and competitor price changes with roughly equal elasticities of around 50 %. Using a tightly calibrated quantitative model, they show that these findings have important implications for shaping the response of domestic prices to international shocks.
296. The supplier network of exporters : Connecting the dots, by E. Dhyne, S. Rubínová, May 2016
The ability of domestic firms to compete on foreign markets is an important indicator of a country’s economic strength and a target of many economic policies. The authors know that only a small share of producers sells on foreign markets and that these firms perform in many aspects differently from their purely domestic counterparts. Recent research, however, highlighted that many exporters are just trade intermediaries that do not produce the exported good and, importantly, the ability to export is supported by availability of cheap and high-quality inputs. this suggests that in order to understand an economy’s involvement in international trade and the characteristics of firms that produce for foreign markets they need to look beyond the firms that own a good when it crosses the border and acknowledge that many firms are engaged in international trade indirectly. The paper fills the gap by offering the first glimpse of the domestic supplier network that underpins exports production. For this purpose, the authors use a new and unique dataset of yearly transactions between all domestic firms in the Belgian economy and augment it with data on firms’ characteristics and their international transactions. They show that the current picture of firms in international trade does miss an important share of firms. While they confirm that direct exporters are the best-performing firms, they also show that they are supported by suppliers that are very good performers themselves.
In fact, the authors find evidence of a performance premium that is increasing in the proximity to foreign demand.
297. Does one size fit all at all times ? The role of country specificities and state dependencies in predicting banking crises, by S. Ferrari, M. Pirovano, May 2016
Given the indisputable cost of policy inaction in the run-up to banking crises as well as the negative side effects of unwarranted policy activation, policymakers would strongly benefit from earlywarning thresholds that more accurately predict crises and produce fewer false alarms. the paper presents a novel yet intuitive methodology to compute country-specific and state-dependent thresholds for early-warning indicators of banking crises. The results for a selection of early-warning indicators for banking crises in 14 EU countries show that the benefits of applying the conditional moments approach can be substantial. the methodology provides more robust signals and improves the early-warning performance at the country-specific level, by accounting for country idiosyncrasies and state dependencies, which play an important role in national supervisory authorities’ macroprudential surveillance.
298. competition and product mix adjustment of multi-product exporters : Evidence from Belgium, by K. Breemersch, June 2016
The paper studies the effects of competition in a destination market on the product sales distribution of Belgian multi-product firms using the framework of Mayer et al. (2014). The author shows that in high competition markets multi-product firms export relatively more of their core products thus skewing the sales distribution towards the best-performing varieties of the firm. A calibrated fit indicates that the general productivity effects that are associated with this skewness reaction are potentially large as firms adjust their production process to accommodate the increased demand for its core products. The skewness effect of high competition markets is only observed for products that the firm eventually drops, underlining the importance of the product extensive margin adjustment. The effect is not limited to manufacturing firms, but also extends to intermediaries in trade and is shown to depend on the type of good that is exported.

125June 2016 ❙ CoNvENtIoNAl SIgNS ❙
Conventional signs
% per cente estimatee.g. exempli gratia (for example)etc. et ceterai.e. id est (that is)n. not availablep.m. pro memoria
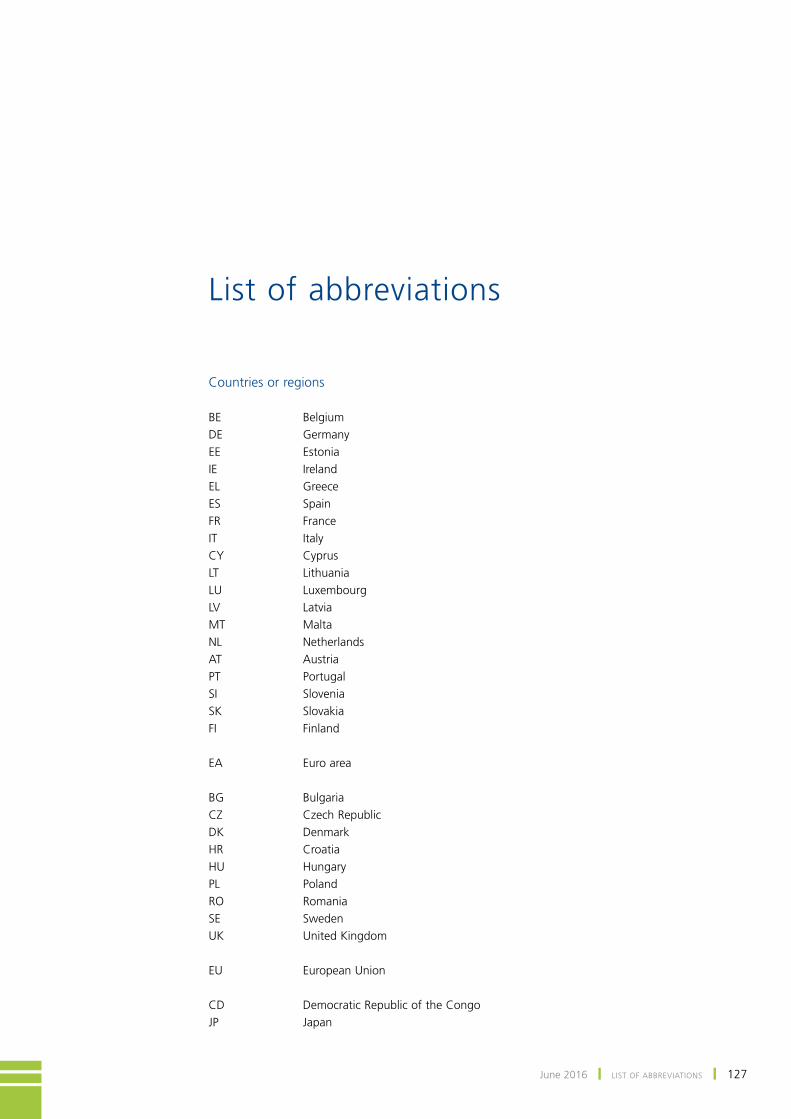
127June 2016 ❙ lISt of ABBREvIAtIoNS ❙
list of abbreviations
Countries or regions
BE BelgiumDE germanyEE EstoniaIE IrelandEl greeceES SpainfR franceIt ItalyCY Cypruslt lithuanialU luxembourglv latviaMt MaltaNl NetherlandsAt AustriaPt PortugalSI SloveniaSK SlovakiafI finland
EA Euro area
Bg BulgariaCZ Czech RepublicDK DenmarkHR CroatiaHU HungaryPl PolandRo RomaniaSE SwedenUK United Kingdom
EU European Union
CD Democratic Republic of the CongoJP Japan
128 ❙ lISt of ABBREvIAtIoNS ❙ NBB Economic Review
MA MoroccoRU RussiatR turkeyUS United States
other
ABSPP Asset‑backed securities purchase programmeActiris Brussels regional employment officeAIDA Asylum information databaseAPP Asset purchase programme
CBPP3 third covered bond purchase programmeCgRS office of the Commissioner general for Refugees and Stateless PersonsCISS Composite Indicator of Systemic StressCPB Centraal Planbureau (the Netherlands)CSPP Corporate sector purchase programme
DgS Directorate general Statistics Dimona Déclaration Immédiate/onmiddelijke Aangifte (electronic declaration for notifying hirings and departures to social security authorities)
EAPP Expanded asset purchase programmeEC European CommissionECB European Central BankEonia Euro overnight Index AverageESA European System of Accounts
fedasil federal agency for the reception of asylum‑seekersfPB federal Planning BureaufPS federal Public ServicefPS Economy federal Public Service Economy, SMEs, Self‑Employed and EnergyfPS Employment federal Public Service Employment, labour and Social DialogueftE full‑time equivalent
gDP gross domestic productgoK gelijke onderwijskansen (equal opportunities in education)
HICP Harmonised index of consumer pricesHR Human resources
IMf International Monetary fund
lfS labour force survey
MfI Monetary financial institutions
NACE‑BEl Nomenclature of economic activities in the European Community, Belgian version
NAI National Accounts InstituteNBB National Bank of BelgiumNCPI National consumer price indexNEEt Not in education, employment or training
129June 2016 ❙ lISt of ABBREvIAtIoNS ❙
NPI Non‑profit institution
oECD organisation for Economic Cooperation and DevelopmentoIS overnight Index Swapolo linear bondsoMt outright monetary transactionsoPEC organisation of the Petroleum Exporting Countries
PISA Program for International Student AssessmentPPS Public Planning ServicesPSPP Public sector purchase programme
QE Quantitative easing
SAfE Survey on the access to finance of SMEs in the euro areaSME Small and medium‑sized enterpriseSMP Securities Markets ProgrammeS&P Standard & Poor’s
tltRo targeted longer‑term refinancing operations
UN United NationsUNDP United Nations Development ProgrammeUNICEf United Nations Children’s Emergency fund
vAR vector autoregressive modelvAt value added tax
ZlB Zero lower bound

National Bank of Belgium limited liability company RlP Brussels – Company number : 0203.201.340 Registered office : boulevard de Berlaimont 14 – BE ‑1000 Brussels www.nbb.be
© Illustrations : National Bank of Belgium
Cover and layout : NBB Ag – Prepress & Image
Published in July 2016
Publisher
Jan Smets
governor
National Bank of Belgium Boulevard de Berlaimont 14 – BE ‑1000 Brussels
Contact for the Review
luc DufresneSecretary‑general
tel. +32 2 221 24 96 – fax +32 2 221 30 91 [email protected]
Related Documents