Economic Adviser's Wing Finance Division, Ministry of Finance Government of the People's Republic of Bangladesh June 2003 BANGLADESH ECONOMIC REVIEW 2003

Welcome message from author
This document is posted to help you gain knowledge. Please leave a comment to let me know what you think about it! Share it to your friends and learn new things together.
Transcript
Economic Adviser's Wing Finance Division, Ministry of Finance
Government of the People's Republic of Bangladesh June 2003
BANGLADESH ECONOMIC REVIEW
2003
PREFACE Bangladesh Economic Review 2003 is published as a regular annual publication of the Government. The Review reflecting the state of Bangladesh economy and its current trend, is placed before the Jatiya Sangsad (Parliament) during its Budget Session every year. 2. The present Government had to undertake the responsibility of steering a fragile and unstable economy caused by gross economic mismanagement of the past regime. The macroeconomic situation of the country was further aggravated due to the negative impact of 9/11 coupled with the then global economic recession. Against these stark realities, the new Government faced the formidable challenges of managing the economy with courage and sagacity. During the last one and a half year, the Government achieved commenable progress in implementing wide-ranging reforms and a set of emergency recovery programmes aimed at restoring macroeconomic stability. This resulted in restoration of macroeconomic stability at a satisfactory level. In the Bangladesh Development Forum meeting held in Dhaka, the representatives of development partners put on record their highest appreciation of the impressive achievements made by the Government. 3. Poverty is an endemic problem in a developing country like Bangladesh. Although there has been sustained progress in achieving growth and poverty reduction, which can be attributed to the wide ranging reforms introduced and implemented in the early nineties, the depth and dimension of poverty is still a continuing challenge. Against these imperatives, the Government has finalised the draft of a three-year 'National Strategy for Economic Growth, Poverty Reduction and Social Development' through extensive consultation with the concerned stakeholders. In the light of this strategy, a 'Three-year Rolling Investment Programme' is being formulated. 4. The data presented in the Review facilitate analysis of the fundamentals of the overall economy. The Review has made assessments of vital issues of macro economy and also shed light on important sectors of the economy. In tandem with this, other important priority sectors like human resource development, poverty reduction and private sector development have been reviewed as well. To provide a wider understanding of the progress made by Bangladesh, comparisons with regional and international economic situations on selected areas have been presented. 5. We appreciate the cooperation extended by the Ministries/Divisions/Agencies in preparation of this Review by providing latest valuable data and information. We shall feel our endeavors amply rewarded if the information presented in the Review serve the purpose of enthusiastic readers, researchers, academics, students and stakeholder organisations. I thank the officers and staff of the Economic Adviser's Wing who worked relentlessly in preparation of this document. (M. Saifur Rahman) Minister for Finance & Planning
INTRODUCTION ''Bangladesh Economic Review'' is published as a vital document with basic information of the macroeconomic situation of the country covering current and previous fiscal years. This document, presented before the Parliament as background information of the Budget, reflects the status of socio-economic progress of the country. The prime objective of the document, however, is to present and review data/statistics that facilitate analysis of the macroeconomic trends of the country. In the English version of the Review, most of the data/statistics have been updated up to June 2003 based on their availabity. These have been duly reflected in the text where relevant. 2. Bangladesh Economic Review 2003 contains fourteen chapters. Chapter One presents a brief review of the macroeconomic situation of the country and the development strategies pursued by the Government. An assessment of the country's macroeconomic fundamentals like Gross Domestic Product, Savings and Investments, Price, Wage and Employment, Fiscal Policy and Fiscal Management, Monetary Policy and Monetary Management and External Sector is incorporated in Chapters Two to Six. In the Sector-specific chapters (chapters Seven to Twelve) developments in major sectors of the economy like agriculture, industry, power and energy, transport and communication and human resource development have been discussed. Chapters Thirteen and Fourteen pertains to the analysis on the Thrust Sectors and present a brief account of the initiatives of the government towards poverty reduction and private sector development respectively. Coloured charts, graphs, statistical tables and boxes, where relevant, have been used for further enrichment of the analysis. 3. The overall responsibility of preparing this document rests with the Economic Adviser's Wing of the Finance Division. I would like to thank the officers and staff of the Wing who performed their duties with deep devotion in publishing this document. I congratulate the relevant Ministries/Divisions/Agencies, which extended cooperation in preparation of this document by providing useful information. 4. The Review has been prepared amidst a range of constraints that may have caused some errors and omissions. To make this document more up-to-date and qualitatively rich, valuable suggestions from the inquisitive readers/researchers as well as the concerned Ministries/Divisions/Agencies will be gratefully acknowledged. (Zakir Ahmed Khan) Secretary Finance Division
CONTENTS
Preface
Introduction
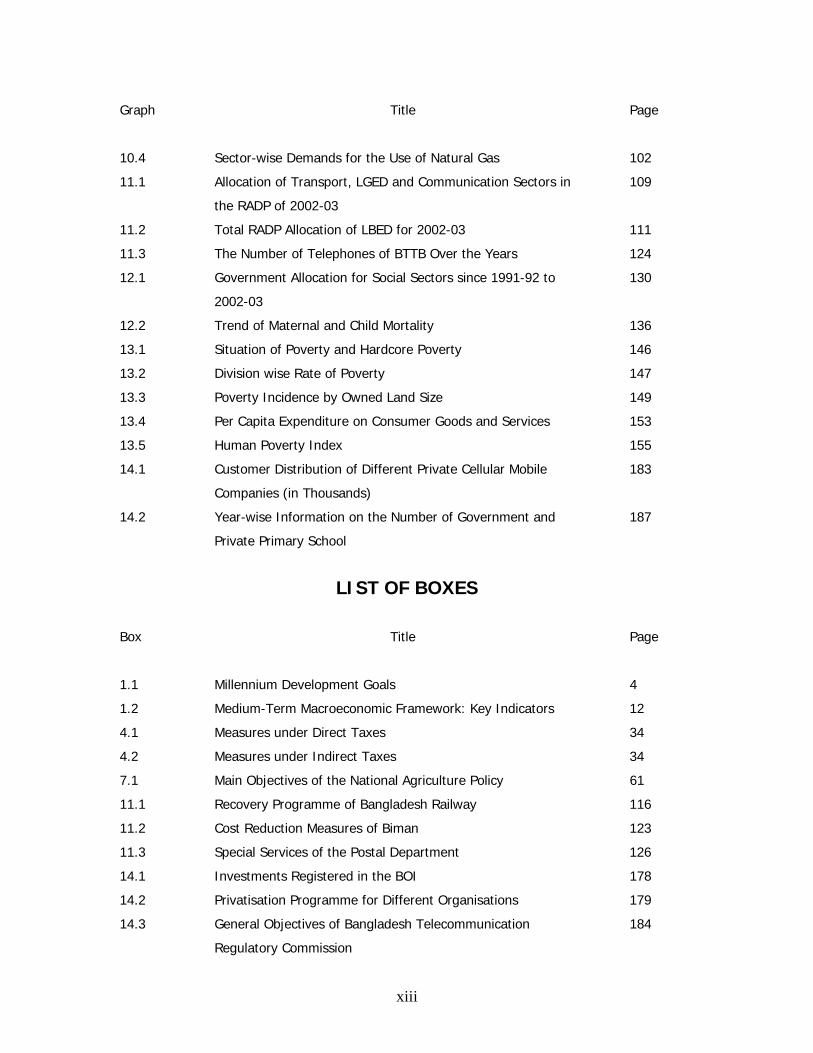
List of Tables
List of Graphs
List of Boxes
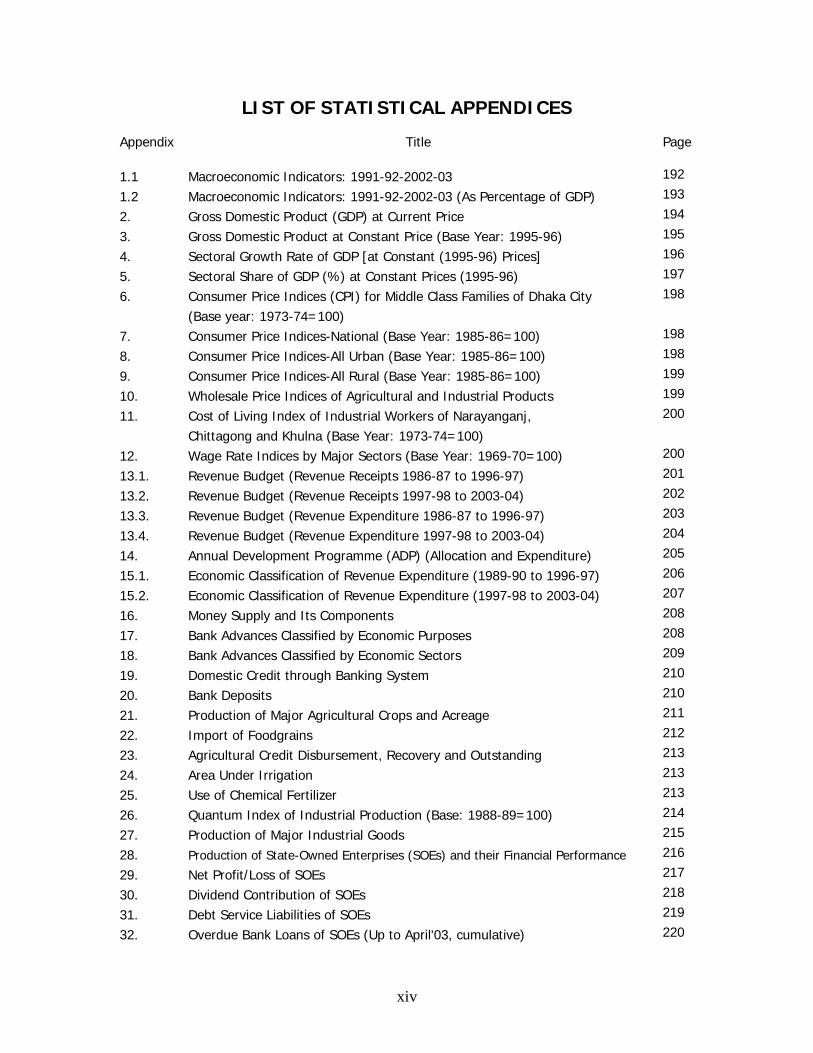
List of Statistical Appendices
Socio-Economic Indicators of Bangladesh
Macro Chapters
Chapter 1. Macroeconomic Review and Development Strategies 1-18
Chapter 2. GDP, Saving and Investment 19-25
Chapter 3. Prices, Wages and Employment 26-32
Chapter 4. Fiscal Policy and Fiscal Management 33-39
Chapter 5. Monetary Policy and Monetary Management 40-48
Chapter 6. Foreign Trade, Exchange Rate Management and External
Sector
49-60
Sectoral Chapters
Chapter 7. Agriculture 61-73
Chapter 8. Industry 74-86
Chapter 9. State Owned Enterprises 87-89
Chapter 10. Power and Energy 90-107
Chapter 11. Transport and Communication 108-128
Chapter 12. Human Resources Development
129-144
Thrust Area Chapters
Chapter 13. Poverty Alleviation 145-175
Chapter 14. Private Sector Development 176-190
vii
LIST OF TABLES Table Title Page
2.1 Per Capita GDP, GNI, NNI and National Savings and Investment (At
Market Prices)
19
2.2 Gross Domestic Product (GDP) at Current Prices 20
2.3 Sectoral Growth Rate of GDP at Constant Prices (Base: 1995-96) 21
2.4 Sectoral Share of GDP (%) at Constant Prices (1995-96) 22
2.5 Trends of Sectoral Contribution at Current Market Prices of Some Asian
Countries During the Last Two Decades.
23
2.6 Saving as Percentage of Gross Domestic Product (GDP) 24
2.7 Investment as Percentage of Gross Domestic Product (GDP) 25
3.1 Consumer Price Index and Inflation (Base year 1985-86=100) 26
3.2 Point-to-Point Rate of Inflation (National) (Base year 1985-86=100) 27
3.3 Rate of Increase in Wages (Base year 1969-70=100) 28
3.4 Share of Employed Labour Force by Sector 29
3.5 Number of Expatriate Bangladeshis and their Remittances 30
3.6 Number of Expatriates Classified by Skill 31
3.7 Number of Expatriate Bangladeshis by Country 32
4.1 Revenue Receipts 33
4.2 Public Expenditure 35
4.3 Revenue Outlays on Social Sectors 36
4.4 Implementation of Annual Development Programme (ADP) 37
4.5 ADP Expenditure and its Composition by Major Sectors (%) 37
4.6 ADP Expenditure on Social Sectors 38
4.7 Overall Budget Deficit 38
4.8 Domestic Resources for Financing Budget Deficit 39
4.9 Domestic Resources in Financing ADP (on the basis of RADP allocation) 39
5.1 Broad Money (M2) and Its Causative Factors 41
5.2 Reserve Money and Its Sources of Change 42
5.3 Summary of Trading Operations of Dhaka Stock Exchange 46
5.4 Summary of Trading Operations of Chittagong Stock Exchange 47
5.5 Important Regional and International Share Price Indices 48
6.1 Impact of Tariff Reforms on Average Rate of Customs Duty 51
6.2 Impact of Tariff Reforms on Average Rate of Customs Duty by Type of Commodities
51
6.3 Degree of International Openness for Bangladesh, Pakistan, Sri Lanka
and India.
55
6.4 Average Exchange Rate (Taka per US$) 56
6.5 Foreign Exchange Reserves 56
viii
Table Title Page
6.6 Import Growth and Composition 57
6.7 Export Growth and Composition 58
6.8 Annual Amount of Remittances 59
6.9 Balance of Payments 60
7.1 Growth Rate of Agriculture and its Sub-sectors including Fishery (Base year 1995-96)
62
7.2 Share of Agriculture and Fishery in GDP (Base year 1995-96) 62
7.3 Food Grain Production 63
7.4 Area Under Irrigation 66
7.5 Uses of Chemical Fertilizer 67
7.6 Agricultural Credit Disbursement, Recovery and Outstanding Balance 68
7.7 Fish Production (1994-95 through 2001-02) 69
7.8 Targets and Progress of Forestry Programme 71
8.1 Contribution of Manufacturing Sector in GDP and Growth Rate (at constant prices of 1995-96)
74
8.2 Quantum Index of Production for Medium to Large-scale Industries (1988-89=100)
75
8.3 Distribution of Private Investment Projects (Local and Foreign) Registered with the BOI from FY1991-92 to FY2002-03.
78
8.4 Country-wise Distribution of Foreign Private Investment Registered with BOI from FY1996-97 to FY2002-03.
79
8.5 Sector-wise Distribution of Foreign Private Investment Projects Registered with BOI from FY1996-97 to FY2002-03.
79
8.6 Comparative Statement of Sector-wise Distribution of Local Private Investment Registered with BOI from FY2001-02 to FY2002-03.
80
8.7 Number of Units, Investment and Employment in the Operational Units under EPZ (up to June, 2003)
85
8.8 Annual Investment and Export: Dhaka, Chittagong, Mongla, Comilla, Uttara and Iswardhi EPZs (1994-95 through 2002-03)
86
9.1 Government Grant/Subsidy to SOEs (1996-97 through 2002-03) 88
10.1 Power Sector Achievements of the Country (up to June 2003) 90
10.2 Installed Capacity, Dependable Production Capacity and Maximum
Production
91
10.3 Accounts Receivable and Payable of BPDB 92
10.4 Statement Showing Reduction of System Loss 95
10.5 Purchase and Sale of Electricity and Revenue Collection since the
Creation of the DESA
96
10.6 The Accounts Receivable and Payable of DESA 96
10.7 Commercial Statistics of DESCO 98
10.8 Physical Target and Achievement of REB (1991-92 to 2002-03) 99
ix
Table Title Page
10.9 Statistics of Purchase and Sale of Electricity by REB to Consumer 100
10.10 Accounts Receivable and Payable Amount of REB 100
10.11 Total Gas Reserve in the Country 101
10.12 Sector-wise Demands for Use of Natural Gas 102
10.13 Sector-wise Demand for Natural Gas 103
10.14 The Agreement for Gas Exploration under Production Sharing Contract 103
10.15 Import of Crude Petroleum Commodities (1991-2003) 105
10.16 Import of Refinery Petroleum Commodities 106
11.1 Road Network in Bangladesh 108
11.2 Trend in Transport Modal Shares 109
11.3 Various Categories of Roads under Roads and Highways Department 110
11.4 Programmes of LGDE for Infrastructure Development 111
11.5 Revenue Income by BRTA from Motor Vehicles Tax and Fees during 1991-92 to 2002-03
112
11.6 Toll Collected by JMBA 113
11.7 Income and Expenditure Status of BRTC during 1993-94 to 2002-03 115
11.8 Overall Activities of Bangladesh Railway 115
11.9 Income and Expenditure of CPA during 1991-92 to 2002-03 116
11.10 Revenue, Income and Expenditure of MPA during 1991-92 to 2002-03 117
11.11 Statement of Income-Expenditure and Profit-Loss of BSC since 1991-92 118
11.12 Income and Expenditure Statement of the Department of Shipping
during 1991-92 to 2002-03
119
11.13 Income and Expenditure Statement of BIWTC during 1992-93 to 2002-
03
120
11.14 Statistics on Movement of Aircrafts, Passengers and Cargoes in the Airports during 1993 to 2003.
122
11.15 Income/Expenditure of Biman Bangladesh Airlines during 1991-92 to
2002-03
123
11.16 Statement of the Number of Telephone, NWD Circuits and Foreign
Circuits of BTTB since 1991-92
124
11.17 Revenue Target, Collection, Expenditure and Surplus of BTTB during
1991-92 to 2002-2993
125
12.1 Rate of Generation of Value Addition in the Social Sectors 129
12.2 Allocation in Social Sectors under ADP 130
12.3 Allocation under Revenue Budget for Social Sectors 130
12.4 Student Enrolment at Primary Level (1990-2002) 133
12.5 Recent Trend in Literacy (15 years and above) 134
12.6 Recent Trends in Health Indices 136
x
Table Title Page
12.7 Estimated Expenditure of Health and Population Sector Programme (HPSP)
137
12.8 Progress of HPSP 138
12.9 Government Expenditure in Education, Health and Social Sectors in
1980 and 2000.
139
12.10 Allocations and Expenditures in RADP 140
12.11 Allocations and Expenditures in RADP 144
13.1 Poverty and Hard-core Poverty on the Basis of Calorie Intake (%) 146
13.2 Daily Per Capita Calorie Intake 146
13.3 Division-wise Rate of Poverty on the Basis of CBN Method (Head Count
Ratio)
147
13.4 Distribution of Poor by Residence in Percentage 148
13.5 Poverty Gap (P1), Squared Poverty Gap (P2) 148
13.6 Incidence of Poverty by Size of Household 149
13.7 Distribution of Land Ownership by Household (%) 149
13.8 Incidence of Poverty and Main Occupation of Household 150
13.9 Status of Division-wise Per Capita Income 151
13.10 Status of Division-wise Per Capita Expenditure 151
13.11 Percentage Share of Income of Household by Deciles Group 152
13.12 Per Capita Expenditure on Consumer Goods and Services 152
13.13 Simulating Trends in Poverty under Alternative Growth Scenario,
Bangladesh: 2000-2020
153
13.14 Major Goal Posts in Poverty and Social Targets Set against the 1990
Benchmark
154
13.15 Human Poverty Index (HPI) 155
13.16 Poverty Alleviation Effects by Sectors 156
13.17 Medium-Term Outlay for Poverty Reduction Programmes 157
13.18 Allocation in Social Sector in the Revenue and Annual Development
Programmes
158
13.19 Safety Net Programmes 159
13.20 Status of Grihayan Tahabil 162
13.21 Micro-credit Programme of Karmasangthan Bank 163
13.22 Rural Infrastructure Development Programme under LGED 165
13.23 Micro Credit Disbursement Programme of Four Major NGOs (up to June'
02)
168
13.24 Sources of Micro Credit and Revolving Loan Fund of NGOs 168
13.25 Status of Micro Credit Programmes of Major NGOs 169
13.26 Micro Credit Programme of three Specialised Institutions 172
13.27 Status of Micro Credit Disbursement of Nationalized (Scheduled) Banks 173
xi
Table Title Page
13.28 Micro Credit Programmes of other Commercial and Specialised Banks 174
13.29 Status of Micro Credit of Administrative Ministires/Divisions 175
14.1 Number of Primary Schools in the Government and Private Sector 187
LIST OF GRAPHS
Graph Title Page
2.1 Growth Rate of GDP at Constant Price 19
2.2.1 Contribution of Broad Sectors in GDP of 1991-92 23
2.2.2 Contribution of Broad Sectors in GDP of 2002-03 23
2.3 Saving as Percentage of GDP 24
2.4 Investment as Percentage of GDP 25
3.1 National Inflation Rate 26
3.2 Point-to-Point Rate of Inflation (National) 27
3.3 Wage Rate Index 28
3.4 Share of Employed Labour Force by Broad Sector in Bangladesh
Labour Force Survey, 1999-00
29
3.5 Number of Expatriates Bangladeshi and their Remittances 30
3.6 Number of Expatriates Classified by Skill 30
3.7 Rate of Expatriates Bangladeshi by Country in 2002 31
5.1 Trend of the Money Supply 43
5.2 Composition of the Money Supply 43
6.1 Foreign Exchange Reserve 56
6.2 Trade Deficit and Current Account Balance 59
7.1 Growth Rate of Agriculture Sector in GDP 62
7.2 Contribution of Agriculture and Fishery Sector in GDP of
2001-02
62
7.3 Contribution of Sub-sectors of Agriculture Sector in GDP of
2001-02
62
10.1 Capacity of Power Generation and Maximum Power Generation 92
10.2 System Loss of DESA 95
10.3 Target and Achievement of Distribution Line for Rural
Electrification
99
xii
Graph Title Page
10.4 Sector-wise Demands for the Use of Natural Gas 102
11.1 Allocation of Transport, LGED and Communication Sectors in
the RADP of 2002-03
109
11.2 Total RADP Allocation of LBED for 2002-03 111
11.3 The Number of Telephones of BTTB Over the Years 124
12.1 Government Allocation for Social Sectors since 1991-92 to
2002-03
130
12.2 Trend of Maternal and Child Mortality 136
13.1 Situation of Poverty and Hardcore Poverty 146
13.2 Division wise Rate of Poverty 147
13.3 Poverty Incidence by Owned Land Size 149
13.4 Per Capita Expenditure on Consumer Goods and Services 153
13.5 Human Poverty Index 155
14.1 Customer Distribution of Different Private Cellular Mobile
Companies (in Thousands)
183
14.2 Year-wise Information on the Number of Government and
Private Primary School
187
LIST OF BOXES
Box Title Page
1.1 Millennium Development Goals 4
1.2 Medium-Term Macroeconomic Framework: Key Indicators 12
4.1 Measures under Direct Taxes 34
4.2 Measures under Indirect Taxes 34
7.1 Main Objectives of the National Agriculture Policy 61
11.1 Recovery Programme of Bangladesh Railway 116
11.2 Cost Reduction Measures of Biman 123
11.3 Special Services of the Postal Department 126
14.1 Investments Registered in the BOI 178
14.2 Privatisation Programme for Different Organisations 179
14.3 General Objectives of Bangladesh Telecommunication
Regulatory Commission
184
xiii
LIST OF STATISTICAL APPENDICES
Appendix Title Page 1.1 Macroeconomic Indicators: 1991-92-2002-03 192
1.2 Macroeconomic Indicators: 1991-92-2002-03 (As Percentage of GDP) 193
2. Gross Domestic Product (GDP) at Current Price 194
3. Gross Domestic Product at Constant Price (Base Year: 1995-96) 195
4. Sectoral Growth Rate of GDP [at Constant (1995-96) Prices] 196
5. Sectoral Share of GDP (%) at Constant Prices (1995-96) 197
6. Consumer Price Indices (CPI) for Middle Class Families of Dhaka City (Base year: 1973-74=100)
198
7. Consumer Price Indices-National (Base Year: 1985-86=100) 198
8. Consumer Price Indices-All Urban (Base Year: 1985-86=100) 198
9. Consumer Price Indices-All Rural (Base Year: 1985-86=100) 199
10. Wholesale Price Indices of Agricultural and Industrial Products 199
11. Cost of Living Index of Industrial Workers of Narayanganj, Chittagong and Khulna (Base Year: 1973-74=100)
200
12. Wage Rate Indices by Major Sectors (Base Year: 1969-70=100) 200
13.1. Revenue Budget (Revenue Receipts 1986-87 to 1996-97) 201
13.2. Revenue Budget (Revenue Receipts 1997-98 to 2003-04) 202
13.3. Revenue Budget (Revenue Expenditure 1986-87 to 1996-97) 203
13.4. Revenue Budget (Revenue Expenditure 1997-98 to 2003-04) 204
14. Annual Development Programme (ADP) (Allocation and Expenditure) 205
15.1. Economic Classification of Revenue Expenditure (1989-90 to 1996-97) 206
15.2. Economic Classification of Revenue Expenditure (1997-98 to 2003-04) 207
16. Money Supply and Its Components 208
17. Bank Advances Classified by Economic Purposes 208
18. Bank Advances Classified by Economic Sectors 209
19. Domestic Credit through Banking System 210
20. Bank Deposits 210
21. Production of Major Agricultural Crops and Acreage 211
22. Import of Foodgrains 212
23. Agricultural Credit Disbursement, Recovery and Outstanding 213
24. Area Under Irrigation 213
25. Use of Chemical Fertilizer 213
26. Quantum Index of Industrial Production (Base: 1988-89=100) 214
27. Production of Major Industrial Goods 215
28. Production of State-Owned Enterprises (SOEs) and their Financial Performance 216
29. Net Profit/Loss of SOEs 217
30. Dividend Contribution of SOEs 218
31. Debt Service Liabilities of SOEs 219
32. Overdue Bank Loans of SOEs (Up to April'03, cumulative) 220
xiv
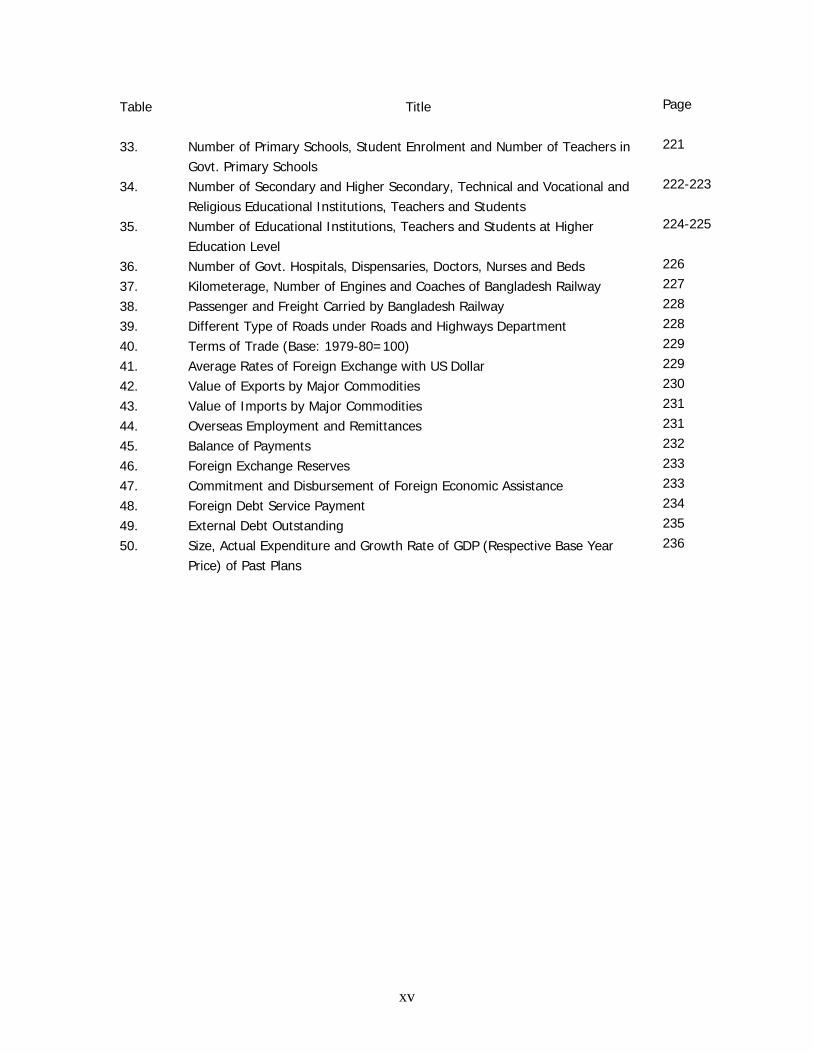
Table Title Page
33. Number of Primary Schools, Student Enrolment and Number of Teachers in Govt. Primary Schools
221
34. Number of Secondary and Higher Secondary, Technical and Vocational and Religious Educational Institutions, Teachers and Students
222-223
35. Number of Educational Institutions, Teachers and Students at Higher Education Level
224-225
36. Number of Govt. Hospitals, Dispensaries, Doctors, Nurses and Beds 226
37. Kilometerage, Number of Engines and Coaches of Bangladesh Railway 227
38. Passenger and Freight Carried by Bangladesh Railway 228
39. Different Type of Roads under Roads and Highways Department 228
40. Terms of Trade (Base: 1979-80=100) 229
41. Average Rates of Foreign Exchange with US Dollar 229
42. Value of Exports by Major Commodities 230
43. Value of Imports by Major Commodities 231
44. Overseas Employment and Remittances 231
45. Balance of Payments 232
46. Foreign Exchange Reserves 233
47. Commitment and Disbursement of Foreign Economic Assistance 233
48. Foreign Debt Service Payment 234
49. External Debt Outstanding 235
50. Size, Actual Expenditure and Growth Rate of GDP (Respective Base Year Price) of Past Plans
236
xv
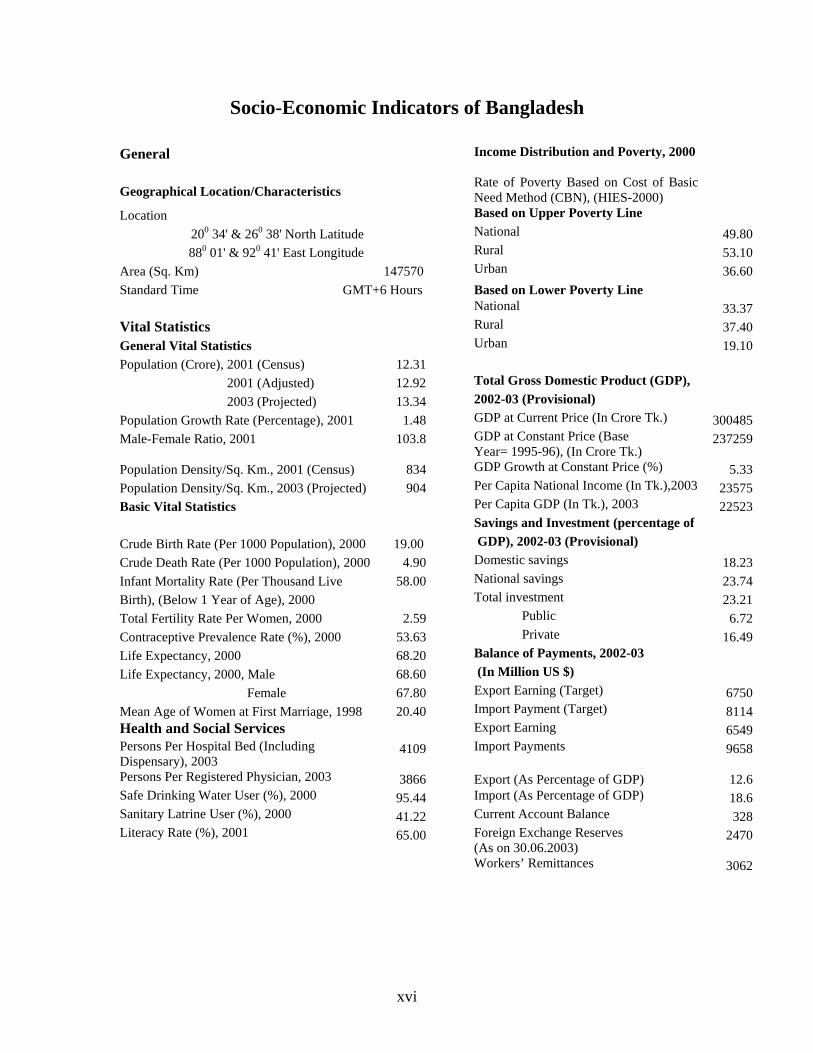
Socio-Economic Indicators of Bangladesh
General Geographical Location/Characteristics
Income Distribution and Poverty, 2000 Rate of Poverty Based on Cost of Basic Need Method (CBN), (HIES-2000)
Location Based on Upper Poverty Line 200 34' & 260 38' North Latitude National 49.80 880 01' & 920 41' East Longitude Rural 53.10
Area (Sq. Km) 147570 Urban 36.60 Standard Time GMT+6 Hours Based on Lower Poverty Line
National 33.37 Vital Statistics Rural 37.40 General Vital Statistics Population (Crore), 2001 (Census) 12.31
Urban 19.10
2001 (Adjusted) 12.92 Total Gross Domestic Product (GDP), 2003 (Projected) 13.34 2002-03 (Provisional) Population Growth Rate (Percentage), 2001 1.48 GDP at Current Price (In Crore Tk.) 300485 Male-Female Ratio, 2001 103.8 GDP at Constant Price (Base
Year= 1995-96), (In Crore Tk.) 237259
Population Density/Sq. Km., 2001 (Census) 834 GDP Growth at Constant Price (%) 5.33 Population Density/Sq. Km., 2003 (Projected) 904 Per Capita National Income (In Tk.),2003 23575 Basic Vital Statistics Per Capita GDP (In Tk.), 2003 22523 Savings and Investment (percentage of Crude Birth Rate (Per 1000 Population), 2000 19.00 GDP), 2002-03 (Provisional) Crude Death Rate (Per 1000 Population), 2000 4.90 Domestic savings 18.23 Infant Mortality Rate (Per Thousand Live 58.00 National savings 23.74 Birth), (Below 1 Year of Age), 2000 Total investment 23.21 Total Fertility Rate Per Women, 2000 2.59 Public 6.72 Contraceptive Prevalence Rate (%), 2000 53.63 Private 16.49 Life Expectancy, 2000 68.20 Balance of Payments, 2002-03 Life Expectancy, 2000, Male 68.60 (In Million US $) Female 67.80 Export Earning (Target) 6750 Mean Age of Women at First Marriage, 1998 20.40 Import Payment (Target) 8114 Health and Social Services Export Earning 6549 Persons Per Hospital Bed (Including Dispensary), 2003
4109 Import Payments 9658
Persons Per Registered Physician, 2003 3866 Export (As Percentage of GDP) 12.6 Safe Drinking Water User (%), 2000 95.44 Import (As Percentage of GDP) 18.6 Sanitary Latrine User (%), 2000 41.22 Current Account Balance 328 Literacy Rate (%), 2001 65.00 Foreign Exchange Reserves
(As on 30.06.2003) 2470
Workers’ Remittances 3062
xvi
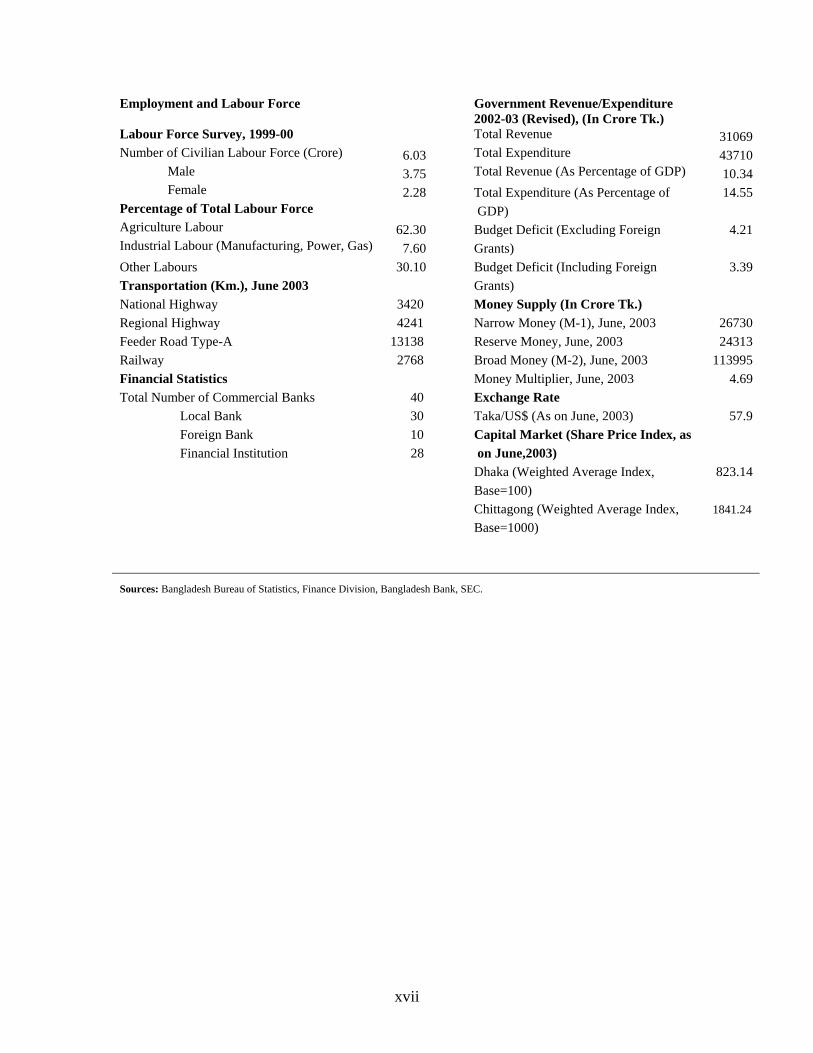
Employment and Labour Force Government Revenue/Expenditure 2002-03 (Revised), (In Crore Tk.)
Labour Force Survey, 1999-00 Total Revenue 31069 Number of Civilian Labour Force (Crore) 6.03 Total Expenditure 43710
Male 3.75 Total Revenue (As Percentage of GDP) 10.34 Female 2.28 Total Expenditure (As Percentage of 14.55
Percentage of Total Labour Force GDP) Agriculture Labour 62.30 Budget Deficit (Excluding Foreign 4.21 Industrial Labour (Manufacturing, Power, Gas) 7.60 Grants) Other Labours 30.10 Budget Deficit (Including Foreign 3.39 Transportation (Km.), June 2003 Grants) National Highway 3420 Money Supply (In Crore Tk.) Regional Highway 4241 Narrow Money (M-1), June, 2003 26730 Feeder Road Type-A 13138 Reserve Money, June, 2003 24313 Railway 2768 Broad Money (M-2), June, 2003 113995 Financial Statistics Money Multiplier, June, 2003 4.69 Total Number of Commercial Banks 40 Exchange Rate Local Bank 30 Taka/US$ (As on June, 2003) 57.9 Foreign Bank 10 Capital Market (Share Price Index, as Financial Institution 28 on June,2003) Dhaka (Weighted Average Index, 823.14 Base=100) Chittagong (Weighted Average Index, 1841.24 Base=1000) Sources: Bangladesh Bureau of Statistics, Finance Division, Bangladesh Bank, SEC.
xvii
CHAPTER-1
MACROECONOMIC REVIEW AND DEVELOPMENT STRATEGIES
In its journey towards prosperity Bangladesh economy passed a crucially important phase during FY 2001-02 and 2002-03. During this period the country's economy regained stability following a process of recovery. The present Government had to confront the onerous task of managing an economy that became increasingly fragile due to economic mismanagement of the previous regime. In addition, the faltering global economy and the adverse impact of the September 11 shock further deepened the economy's fragility and instability. Against this backdrop, the Government implemented a set of pragmatic recovery programmes and restored stability in the economy. Still the prevailing imperatives dictate the need for deepening and expanding the already initiated reforms for infusion of dynamism in the economy. In the socio-political context of Bangladesh, though implementation of these reforms presented a formidable challenge, the Government faced it successfully through its relentless efforts over the past one and a half year.
Economic Growth
Over the past two decades, particularly during the 1990's, the economic growth in Bangladesh registered a remarkable progress. The average growth rate of Gross Domestic Product (GDP) was around 5 percent in this decade. Implementation of a wide array of reforms during the early 1990s made it possible to achieve this higher rate of growth. Four percent growth rate on an average over a period of the last two decades brought an opportunity for transition to a higher growth path. Attaining of per capita GDP growth at 3.3 percent during the 1990's is an impressive achievement. This was possible due to a sharp fall in birth rate. Success in attaining such a higher growth, elevated Bangladesh's position among the developing countries. Infusion of further momentum in the economy in FY 2002-03, caused to make projection of GDP at 5.33 percent which is 0.91 percent higher than the growth rate of last fiscal year. In FY 2002-03, the growth in agriculture and industries (manufacturing) sectors has been projected at 3.59 and 6.62 percent respectively. Moreover, the current year's growth in all other sectors barring the construction sector has been projected to be higher than those of the previous fiscal year.
Saving and Investment
Based on provisional estimates, domestic and national savings during the current fiscal year have been projected at 18.23 and 23.74 percent of GDP. In FY 1991-92 the rates of savings stood at 13.86 and 19.30 percent reflecting a secular rise in savings over the decade. Provisional estimates show that the rate of investment in FY 2002-03 will be 23.22 percent of GDP consisting of shares of public and private sector at 6.72 percent and 16.49 percent respectively. The rate of investment too registered a rising trend over the past decade.
1
Inflation
According to consumer price index, constructed on the basis of 1985-86 as the base year, the rate of inflation in FY 2002-03 stood at 5.14 percent. In food and non-food sectors, inflation stood at 4.94 and 5.52 percent respectively. In a growing economy such inflationary trend is considered tolerable. It is however to be noted that, the rate of inflation remained low in Bangladesh since the 1990s. Maintaining this low rate of inflation has largely been possible due to rise in food production and downward trend in prices of consumer goods in the international market.
Fiscal policy and fiscal Management
Following restoration of stability in macroeconomic management of the country, the deficit in the last two fiscal years came down to a sustainable level. Whereas in FY 1999-2000 the budget deficit was 6.1 percent, it came down to 4.7 percent in the previous fiscal and 4.2 percent in the FY 2002-03. This has been achieved through a combination of policies aimed at rationalization of Government expenditure and augmentation of domestic resources mobilization. In the Government's efforts to establish macroeconomic stability in the economy, this achievement is a significant milestone. While announcing budget for FY2002-03, a number of steps were proposed to augment both tax and non-tax revenue. In the backdrop of declining foreign aid, enhanced domestic revenue mobilization was an imperative for our fiscal sustainability. NBR revenue has increased by 17.53 percent in FY 2003, which is much higher than the actual collection of the last year. The Government total revenue has exceeded Tk.31000 core which is the highest so far. This has raised the revenue-GDP ratio to 10.4 percent. It is to be noted that the growth of revenue was 7.0 percent during the 1990s while it was only 3 percent during the 1980s. In Bangladesh, expenditure-GDP rose to 15 percent FY03. In the 1980s, the growth of expenditure was 3.1 percent which rose to 6.6 percent during the 1990s. Despite saddled with resource constraints, the trend in Government spending in the priority social sectors like human development, building rural infrastructure and poverty reduction has been consistently on the increase. According to the revised ADP, the expenditure in social sector stands at 24.6 percent and the revenue outlays on social sector stands at 22.7 percent in FY03.
Monetary Policy and Monetary Management
Monetary policy for FY 2002-03 was formulated to accelerate the pace of economic activities of the country and to maintain the trend of economic growth. As the country's monetary management was steered in the light of a moderately expansionary monetary policy, the money supply and credit expansion remained slightly expansionary during FY2002-03. During this period the broad money supply registered 15.59 percent increase compared to that of the corresponding period of the previous fiscal year. On the other hand, the domestic credit expansion
2
registered a slightly lower increase by 9.48 percent compared to 12.92 percent increase during the corresponding period of the previous fiscal year. During this period credit flows to the public sector decreased (5.47%) while it registered an increase by 14.93 in the case of private sector. Because of the measures taken by the Government to improve revenue collection and to rationalize public expenditure, the rate of borrowing by the Government from the banking system reduced which had an important impact on the reduction of growth of domestic borrowing. This resulted in minimizing crowding out effect of public borrowing and caused increased flow of credit to the private sector that brought about expansion of trade and commerce and infused dynamism in the economic activities. Besides, a number of important steps were taken in the areas of banking and monetary and credit policy to ensure transparency in monetary and credit management. Several measures have been taken for development and expansion of capital market. This would result in restoration of investor's confidence in capital market.
External Sector
Despite prevailing adverse global economic situation, the current account balance of the balance of payment in Bangladesh registered a surplus of US$240 million in 2001-02, which was 0.5 percent of GDP. This trend continued in FY 2002-03 and the surplus stood at US$ 328 million, which was 0.63 percent of GDP. Notably, excepting India and Pakistan none of the least developed countries in South Asia achieved this surplus in the recent past. On the other hand, the trade-deficit situation is also improving gradually. According to available statistics, where the trade deficit in FY 1999-2000 and 2000-2001 stood at US$ 1865 and 2011 million respectively, it declined to US$ 1768 million in 2001-02. However the trade deficit in FY 2002-03 rose to US$ 2207 million, which is 24.83 percent higher than the deficit of the previous fiscal year. Because of the prudent and timely steps taken by the Government, the remittance flow of the expatriate Bangladeshi workers increased by 33 percent in FY 2001-02 and it increased from US$ 1.9 billion in FY 2000-01 to US$ 2.5 billion in the previous fiscal year. The trend continued during the current year. As a result, the remittance reached the US$3.06 billion mark in June 2003 and also the overall balance of payment situation improved further. It is to be noted that the foreign exchange reserve plummeted to US$ 1.09 billion when the present Government took office in October 2001.
3
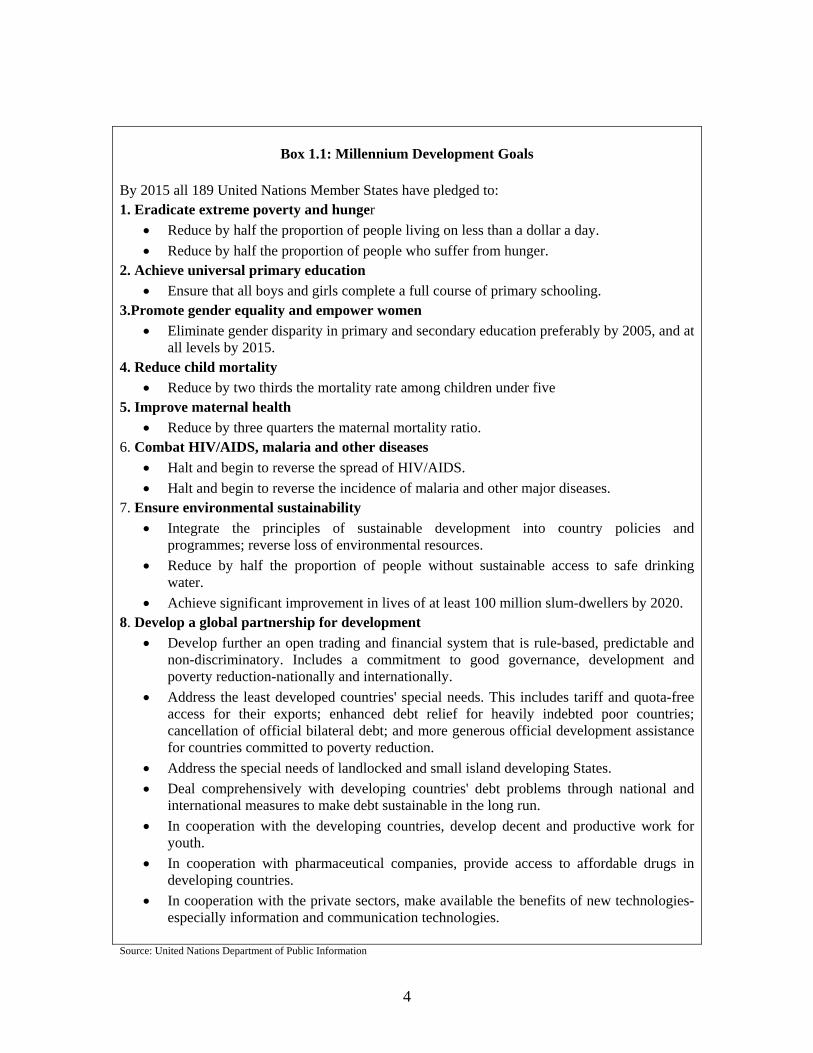
Box 1.1: Millennium Development Goals
By 2015 all 189 United Nations Member States have pledged to: 1. Eradicate extreme poverty and hunger
• Reduce by half the proportion of people living on less than a dollar a day. • Reduce by half the proportion of people who suffer from hunger.
2. Achieve universal primary education • Ensure that all boys and girls complete a full course of primary schooling.
3.Promote gender equality and empower women • Eliminate gender disparity in primary and secondary education preferably by 2005, and at
all levels by 2015. 4. Reduce child mortality
• Reduce by two thirds the mortality rate among children under five 5. Improve maternal health
• Reduce by three quarters the maternal mortality ratio. 6. Combat HIV/AIDS, malaria and other diseases
• Halt and begin to reverse the spread of HIV/AIDS. • Halt and begin to reverse the incidence of malaria and other major diseases.
7. Ensure environmental sustainability • Integrate the principles of sustainable development into country policies and
programmes; reverse loss of environmental resources. • Reduce by half the proportion of people without sustainable access to safe drinking
water. • Achieve significant improvement in lives of at least 100 million slum-dwellers by 2020.
8. Develop a global partnership for development • Develop further an open trading and financial system that is rule-based, predictable and
non-discriminatory. Includes a commitment to good governance, development and poverty reduction-nationally and internationally.
• Address the least developed countries' special needs. This includes tariff and quota-free access for their exports; enhanced debt relief for heavily indebted poor countries; cancellation of official bilateral debt; and more generous official development assistance for countries committed to poverty reduction.
• Address the special needs of landlocked and small island developing States. • Deal comprehensively with developing countries' debt problems through national and
international measures to make debt sustainable in the long run. • In cooperation with the developing countries, develop decent and productive work for
youth. • In cooperation with pharmaceutical companies, provide access to affordable drugs in
developing countries. • In cooperation with the private sectors, make available the benefits of new technologies-
especially information and communication technologies. Source: United Nations Department of Public Information
4
Reforms Initiatives
A Public Expenditure Review Commission and a Revenue Reforms Commission were constituted for streamlining and improving the effectiveness of public expenditures and enhancing revenue efforts. Their interim recommendations, already submitted, were taken into consideration in formulating budget for FY2003-04. For the first time, the Government carried out a mid-term review of the budget for FY2002-03 and the results of this review were incorporated in the revised budget for FY2002-03.
The Government has undertaken a series of reform measures in the energy and power sector in order to create an appropriate enabling environment for improved public sector performance, attract multi-lateral and private investment, rationalize tariff rates and improve collections, and the consumers get 'value for money'. In order to promote efficient energy use, the government is going to adopt an interim electricity, gas and petroleum pricing framework to ensure efficiency and financial viability of this sector.
The trade regime has been further liberalized by reducing the maximum tariff rate by 5 percent. Supplementary duty scheme has been rationalized by reducing the number of rates from 31 to 5. Import license fee on all imports has been withdrawn. Consequently, the average nominal tariff protection further declined. This liberalization trend was continued in the budget for 2003-04. The Government has designed an integrated policy framework for effective participation in globalisation process in the post -MFA period.
In view of the positive impact of telecommunication and the new information and communication technology on poverty alleviation and growth, the Government has been undertaking reforms in the telecommunication sector. Corporatization of BTTB is under active consideration of the Government. Moreover, the Bangladesh Telecommunication Act, 2001 has already been enacted and made operational to ensure fair play to multi- operators.
To bring more discipline in the financial sector and increase operational autonomy of the Bangladesh Bank necessary amendments to the Bangladesh Bank Order, Banking Companies Act and Banks (Nationalization) Order have been enacted by the Parliament. Several Task Forces have been set up to enforce the Money Laundering Prevention Act.
In order to develop capital market on a sound footing and to protect the interest of local investors a number of reforms has been introduced in current fiscal which include enactment of Central Depository System (CDS Amendment) Bill, 2002, introducing web-site of capital market and reduction of corporate tax rate. These reforms resulted in increase in average daily transactions in the capital market and rise in overall share price index in FY 2002-03 compared to 2001-02. In addition, there has been an investment to tune of Tk.1943.76 million up to June, 2003 through Initial Public Offer (IPO). There have been comprehensive reforms in foreign exchange management too. The Government has introduced floating exchange rate since 31 May, 2003. If
5
the newly introduced system brings in any instability, Bangladesh Bank will intervene through buying and selling of dollars directly to restore discipline.
The Government has passed a revised Privatisation Policy signalling its commitment to SOE reform. All SOEs have been put on hard budget constraint. In July, 2002, the Hon'ble Prime Minister took a politically bold decision and closed down the Adamjee Jute Mills, the largest jute mill of the World employing about 25,000 workers and accounting for about 10 percent of total annual SOE losses. Since then about 24 SOEs have already been either closed or downsized. They represent over 41 percent of aggregate SOE losses engaged in manufacturing. Employees retrenched from these SOEs have been reduced by 30 percent last year and we expect to reduce this loss further this year. The government is committed to continue reforms in the SOE sector keeping in view the interest of the economy; but this will have to be accompanied by satisfactory compensation and safety net programmes.
Adequate allocation has been made in the revised budget of FY 2002-03 to defray the severance benefits payable to the retrenched employees of the SOEs selected for privatization and to clear up arrears. More allocation is also being provided in the Revenue budget for FY 04 for operation and Maintenance expenditure. Recognizing the need to strengthen the governance of targeted food transfer programs, the Food for Education Program, and the Primary Education Stipends Program have been discontinued and have been replaced by a cash stipend program for primary school students. It may be noted here that to ensure transparency the government has already monetized most of its Food for Work (FFW) programs. The Government is determined to continue supporting the secondary education of girls and has decided to extend the Female stipends Program to Class 12. Controlling environmental pollution will get the priority it deserves for sustainable development. The Government has meanwhile banned the use and marketing of the polythene bags and has also phased out two stroke three wheelers from Dhaka city to eliminate one of the major sources of air pollution.
New incentive scheme has been introduced for improving performance of NCB's including collection of non-performing loans. Loan recovery departments have been strengthened. Necessary amendment to the Money Loan Courts have been enacted by the Parliament. Effective internal control is being set up in banks. To control default loan, Bangladesh Bank has issued necessary regulations. A Committee on default Loans was set up to suggest measures for reducing the burden of debt default and for improved loan management performance of the banking sector. A loan write off policy has been introduced by Bangladesh Bank for the first time.
Development Strategy
Since independence, the Government of Bangladesh has endeavoured to improve the quality of life of the people through planned development. Bangladesh has so far implemented 5 Five-Year
6
Plans including one Two-Year Plan. Allocation and expenditure of these plans together with the rate of growth achieved have been shown at Appendix-50.
The Plans could not achieve desired success against targeted objectives because of a host of factors including resource constraints. Bangladesh has, however, gained enviable success in terms of achieving improvements in most of the socio-economic indicators. Consistent with the market economy and the global context, required changes have been introduced in the development strategy of Bangladesh.
In the socio-economic realities of Bangladesh, the pursuit of medium-term development plan would be best suited for the desired growth of the country. Poverty reduction will be at the heart of such plan. The medium-term Plan will emphasise on detailed action plans against individual goals so that it can be achieved at the lowest level. If the medium-term plan is implemented within the vision of the long-term perspective, it would facilitate refixing of targets, inputs and objectives.
The Government has finalised a three-year 'National strategy for Economic Growth, Poverty Reduction and Social Development' to implement its medium-term plan. In the light of this strategy document, the Government will also prepare a three-year 'Rolling Investment Programme' which would form the basis of executing future plans.
National Strategy for Economic Growth, Poverty Reduction and Social Development
Immediately after taking office, the present Government, besides identifying the priority areas of reform, took up the task of preparing a 'National strategy for Economic Growth, Poverty Reduction and Social Development' in line with the UN Millennium Development Goals (MDG). In preparing this strategy document a wide consultation process was undertaken at the national level and local level including consultation with the experts and stakeholders. A preliminary draft of the document, was put in place in April, 2002. Based on this draft a comprehensive dialogue took place with the Government and non-government organisations, representatives from the civil society and the development partners. In the light of the feedback received a revised draft was prepared in January 2003. In March 2003, the draft was finalised after certain amendments.
The cardinal objective of the development strategy articulated in the document will be to make sure that benefits of growth are shared by the poor. The strategy document lays emphasis on the following five major strategies:
♦ Acceleration of pro-poor growth. ♦ Promotion of good governance ♦ Investment in human development ♦ Women development; and ♦ Ensuring social security.
7
Acceleration of Pro-poor Growth
In the strategy document, a target of raising economic growth from 5.0 percent to 6-7 percent has
been set so that the proportion of poor people can be reduced by half by 2015. The other
important segments of the strategy include:
♦ a stable macroeconomic framework
♦ development of private sector
♦ sound and effective financial systems
♦ strengthening institutional capacity
♦ rural development
♦ expansion of productive sectors
♦ improvement of existing capacity and quality of infrastructure development.
Promotion of Good Governance
The second important element of the strategy is establishing good governance in all spheres. With this end in view, the Government has planned to bring in judicial reforms to infuse dynamism in the judicial process, to bring about basic reforms in police administration and to ensure transparency and accountability in the use of public resources.
Investment in Human Development
As the development of human resources has strong poverty reducing effects, the Government lays special emphasis on enhancing the basic capacity of the poor by way of strengthening the health, education and nutrition programmes. To implement the strategy, the Government has already allocated substantial resources for expansion of education, particularly the primary education. As a result, there has been quantitative expansion in education but the health and nutrition programmes relatively lag behind. In the present strategy pursued by the Government, these two areas are having greater importance. Overall, the Government will divert and allocate more resources to all the programmes relating human resource development.
Women Development
The burden of poverty falls disproportionately on women due to a numbers of factors such as literacy rate, low nutrition, low and discriminatory wages and high mortality. Empowering women is critically important for socio-economic development. The degree of women empowerment is measured in terms of their access to education, participation in workforce, property rights, participation in politics and access to credit. Although Bangladesh has made much progress in this area, it leaves much to be desired. Against this backdrop, the strategy paper lays emphasis on:
♦ policies and institutional actions to close the gender gap
8
♦ reduce violence against women
♦ reduce high maternal mortality
♦ remove hindrances to women's employment and economic opportunities
♦ implement policies to ensure formal equality
♦ support affirmative actions at all levels and in all spheres
♦ create women-friendly institutional environment.
The Government in order to ensure greater participation of women in all spheres of development
within the framework of poverty reduction strategy, will actively promote appropriate policies
and programmes.
Ensuring Social Protection
Four sets of policies would be emphasised for the poor to cope better with various income shocks. These policies would increase the crisis -coping capacity of the poor. ♦ The first set of policies will focus on the social safety net for the poor through food for works
and income transfer programmes (e.g. VGD/IG-VGD, FFW/TR, old-age pension schemes in rural areas, support for the female destitutes and traditional relief programmes) to address the specific problems of chronic poverty and socially disadvantaged groups (e.g. street children, elderly poor, the disabled population etc.).
♦ The second set of policies will address the vulnerabilities of 'new poor' like the retrenched workers. This form an increasingly important component of the social protection policies in the backdrop of privatization, labour restructuring, market.
♦ The third set of policies will put emphasis on the development of social solidarity as an increasingly important route for social interventions. The newly set up umbrella support organization such as the Social Development Foundation (SDF) will play an important role in fostering social capital formation by promoting CBOs and local associations in building and maintenance of small-scale community infrastructures.
♦ The fourth set of policies will relate to risks insurance covering four categories: (a) providing access to credit to the poor in times of emergency to ease the burden of shocks; (b) ensuring good public health services to reduce health hazard related income and consumption shocks; (c) strengthening disaster preventing and mitigating mechanisms to enhance the coping capability of the poor in times of natural disasters; and (d) introducing effective measures to minimize suffering from violence and personal insecurity.
In the strategy document, there is an elaborate framework for monitoring and assessing the poverty reduction programmes. Within this framework a National Poverty Alleviation Council' headed by the Hon'ble Prime Minister has been formed. Besides this, a Focal Point has been
9
established in the General Economics Division of the Planning Commission which has been entrusted with the task of collecting all data and information on the progress of poverty reduction programmes.
Medium Term Macroeconomic Framework
To facilitate the implementation of the 'National Strategy for Economic Growth, Poverty Reduction and Social Development', a Medium Term Macroeconomic Framework (MTMF) has been specified. The framework has been worked out on the basis of the estimated values of FY 2002-03 as the benchmark. The purpose is to comprehend the dynamics of the economy identifying key macroeconomic fundamentals and formulate and implement realistic budgets.
The Framework envisages a stable macroeconomic environment during the period. It seeks to achieve an accelerated growth rate of GDP in real terms rising from 5.5 percent in FY2003- 04 to 6.5 percent in FY 06. The target rate of growth has been set to ensure a real breakthrough in poverty reduction in the medium term. The economy's average growth rate in the recent past, has been higher than the historic trend growth rate of 4 percent. Because of the adoptation and implementation of policies for structural reforms by the Government, it is expected that the growth momentum will be regained in FY 03, which will provide the basis for a new era of higher growth from FY 2003-04.
As high and variable inflation inhibits growth, worsens income distribution and the poverty situation, the framework envisages low and stable rate of inflation in the economy. A tight rein will be put on inflation so that the positive impact on poverty reduction achieved through higher growth is not frustrated. The rate of inflation is expected to be 4.0 percent in FY2004-05 and stable afterwards.
By the 1990s Bangladesh has made a transition from a situation of low saving and investment ratios to moderate saving and investment ratios. It is expected that the trend will continue and investment rates will increase further in the coming years. Moreover, the poverty reduction strategy would require higher growth which can be achieved through higher investment. Better management of public capital and more efficient provisioning of infrastructure leading to better utilization of private capital would be ensured such that the productivity of capital is enhanced and higher growth is achieved.
Accelerated poverty reduction would require higher amount of Government revenue which can be spent on programs benefiting the poor. The revenue-GDP ratio as well as the tax-GDP ratio are still low in Bangladesh compared with similar ratios in other developing countries. The Government plans to mobilize larger amount of domestic revenue so that the revenue-GDP ratio would rise from 10.6 percent in FY 2002-03 to 11.9 percent in FY 2005-06 and the tax GDP ratio from 8.3 percent to 9.7 percent during the same period. The government has already implemented some short term measures for increasing domestic resources in FY 2001-02. Several additional
10
measures have also been proposed in the FY2002-03 budget which have started to yield positive results. The government has also been rationalizing the prices of public goods and services to improve non-tax revenue collection. Future measures to increase revenue collections will focus on further reforms in the revenue system.
A significant increase in public expenditure is needed to reduce the incidence of poverty at a faster rate. Within the medium term framework, total government expenditure as a proportion of GDP will increase from 15.2 per cent in FY 2002-03 to 16.4 per cent in FY 2005-06. The rise in expenditure-GDP ratio would largely reflect the additional public expenditures required to finance new poverty reduction projects. The size of ADP will grow from 5.8 per cent of GDP in FY 2002-03 to 6.9 per cent in FY 2005-06 indicating expanded and improved absorption capacity of the key sectors in utilizing additional development resources.
The budget deficit will be kept under control in the neighborhood of 3.8 to 4.0 per cent (4.5 to 4.7 per cent excluding grants) of GDP and will be financed by both domestic and foreign resources. To avoid pressure on scarce budgetary resources it would be expedient to rely on foreign loans at concessionary interest rates to finance deficit. It is expected that increased volume of foreign resources will be forthcoming to finance the poverty reduction agenda under the strategy. Consequently, net foreign financing (excluding grants) as proportion of GDP would increase from 1.6 percent in FY 2002-03 to 1.8 percent in FY 2005-06. Net domestic financing has been projected at 1.9 per cent of GDP in FY 2005-06. The monetary and credit program for the medium term has been designed to ensure higher growth of GDP as well as price stability. Broad money growth rate would decline from 12.5 per cent in FY 2002-03 to 11.9 per cent in FY 2005-06. The reserves money will be used as an operating target to keep broad money growth within reasonable limit.
The balance of payments (BOP) situation would also improve during the program period. The assumption underlying the projected behavior is the steady growth of exports along with enhanced inflow of multilateral and bilateral inflows to finance new poverty reduction programs. The gross official reserves would increase to US$ 3.3 billion (3.2 months import equivalence) in FY 2005-06.
11
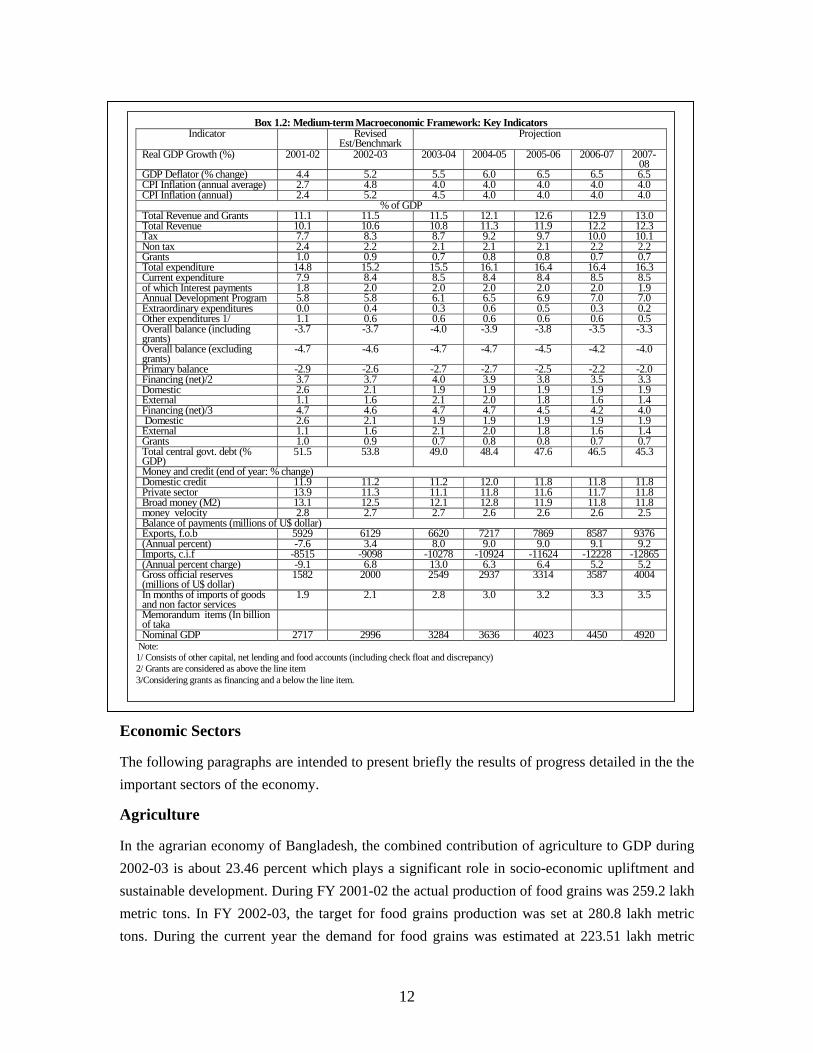
Box 1.2: Medium-term Macroeconomic Framework: Key Indicators
Indicator Revised Est/Benchmark
Projection
Real GDP Growth (%) 2001-02 2002-03 2003-04 2004-05 2005-06 2006-07 2007-08
GDP Deflator (% change) 4.4 5.2 5.5 6.0 6.5 6.5 6.5 CPI Inflation (annual average) 2.7 4.8 4.0 4.0 4.0 4.0 4.0 CPI Inflation (annual) 2.4 5.2 4.5 4.0 4.0 4.0 4.0
% of GDP Total Revenue and Grants 11.1 11.5 11.5 12.1 12.6 12.9 13.0 Total Revenue 10.1 10.6 10.8 11.3 11.9 12.2 12.3 Tax 7.7 8.3 8.7 9.2 9.7 10.0 10.1 Non tax 2.4 2.2 2.1 2.1 2.1 2.2 2.2 Grants 1.0 0.9 0.7 0.8 0.8 0.7 0.7 Total expenditure 14.8 15.2 15.5 16.1 16.4 16.4 16.3 Current expenditure 7.9 8.4 8.5 8.4 8.4 8.5 8.5 of which Interest payments 1.8 2.0 2.0 2.0 2.0 2.0 1.9 Annual Development Program 5.8 5.8 6.1 6.5 6.9 7.0 7.0 Extraordinary expenditures 0.0 0.4 0.3 0.6 0.5 0.3 0.2 Other expenditures 1/ 1.1 0.6 0.6 0.6 0.6 0.6 0.5 Overall balance (including grants)
-3.7 -3.7 -4.0 -3.9 -3.8 -3.5 -3.3
Overall balance (excluding grants)
-4.7 -4.6 -4.7 -4.7 -4.5 -4.2 -4.0
Primary balance -2.9 -2.6 -2.7 -2.7 -2.5 -2.2 -2.0 Financing (net)/2 3.7 3.7 4.0 3.9 3.8 3.5 3.3 Domestic 2.6 2.1 1.9 1.9 1.9 1.9 1.9 External 1.1 1.6 2.1 2.0 1.8 1.6 1.4 Financing (net)/3 4.7 4.6 4.7 4.7 4.5 4.2 4.0 Domestic 2.6 2.1 1.9 1.9 1.9 1.9 1.9 External 1.1 1.6 2.1 2.0 1.8 1.6 1.4 Grants 1.0 0.9 0.7 0.8 0.8 0.7 0.7 Total central govt. debt (% GDP)
51.5 53.8 49.0 48.4 47.6 46.5 45.3
Money and credit (end of year: % change) Domestic credit 11.9 11.2 11.2 12.0 11.8 11.8 11.8 Private sector 13.9 11.3 11.1 11.8 11.6 11.7 11.8 Broad money (M2) 13.1 12.5 12.1 12.8 11.9 11.8 11.8 money velocity 2.8 2.7 2.7 2.6 2.6 2.6 2.5 Balance of payments (millions of U$ dollar) Exports, f.o.b 5929 6129 6620 7217 7869 8587 9376 (Annual percent) -7.6 3.4 8.0 9.0 9.0 9.1 9.2 Imports, c.i.f -8515 -9098 -10278 -10924 -11624 -12228 -12865 (Annual percent charge) -9.1 6.8 13.0 6.3 6.4 5.2 5.2 Gross official reserves (millions of U$ dollar)
1582 2000 2549 2937 3314 3587 4004
In months of imports of goods and non factor services
1.9 2.1 2.8 3.0 3.2 3.3 3.5
Memorandum items (In billion of taka
Nominal GDP 2717 2996 3284 3636 4023 4450 4920 Note: 1/ Consists of other capital, net lending and food accounts (including check float and discrepancy) 2/ Grants are considered as above the line item 3/Considering grants as financing and a below the line item.
Economic Sectors
The following paragraphs are intended to present briefly the results of progress detailed in the the important sectors of the economy.
Agriculture
In the agrarian economy of Bangladesh, the combined contribution of agriculture to GDP during 2002-03 is about 23.46 percent which plays a significant role in socio-economic upliftment and sustainable development. During FY 2001-02 the actual production of food grains was 259.2 lakh metric tons. In FY 2002-03, the target for food grains production was set at 280.8 lakh metric tons. During the current year the demand for food grains was estimated at 223.51 lakh metric
12
tons. During this year the growth in agriculture and fisheries sectors has been projected at 3.6 and 2.3 percent respectively. As agriculture is the mainstay of the economy, besides reducing poverty it contributes significantly to ensuring food security for a vast population, together with improving their standard of living and augmenting employment opportunities. There have been continued efforts from Government for development of agriculture. Included among them are management of irrigation water, availability of fertilizer, introducing commercial orientation to livestock sub-sector, massive afforestation throughout the country and preservation of forest, meeting the deficiencies in forest resources, ensuring supply of raw materials for forest-based industries, conservation of bio-diversity and wild-life and protection of environment and control of air-pollution for sustainable development.
Industry
The role of industry (manufacturing) sector is central to the economic development of a country. During FY 2002-03, the contribution of this sector to GDP has been estimated at 15.91 percent while its growth has been projected at 6.62 percent. All industries excepting those relate to national security have been made open for local and foreign investors. An inspired and dynamic private sector's role will be critical for industrialisation of Bangladesh. And this should be made competitive in a deregulated domestic and international market. Included in the vision of industrialisation, there is a goal of having 25 percent contribution of manufacturing sector to GDP. It has also been envisioned that this sector will absorb 20 percent of workforce. In order to encourage industrial growth, the rate of interest for all industries under the thrust sector have been reduced from 10-12.5 percent to 9 percent. The interest rate of shipment and packing credit has also been reduced from 8-10 percent to 7 percent. In addition, the bank rate has been reduced from 7 percent to 6 percent to reduce the interest rate of bank loan. Since establishment of Privatisation Board (Now Privatisation Commission), up to June, 2003 a total of 42 industrial entities have been privatised. Much wider initiatives are in place to accelerate the pace of privatisation. In FY 2001-02 the net loss of 44 SOEs amounted to Tk.1533.56 crore. In FY 2002-03, the net loss has been estimated at Tk.1026.81 crore. Foreign Direct Investment in the country has now increased substantially. In FY 1991-92 the foreign investment stood at US$ 25 million. In FY 2002-03 it stood at US$368 million. The Government has already declared a range of facilities for foreign investment. Currently, six Export Processing Zones (EPZs) are operating in the country. Up to June 2003, 180 industries were operational in these zones which had a total investment to the tune of US$ 634.04 million.
Power and Energy
During the current year, the total power generation capacity increased to 4680 mw following commercial operation of the 450 mw Combined Cycle Power Plant set up under the private sector initiative since October, 2002. Against this installed capacity, 3622 mw power is being generated.
13
The present Government has taken up a set of comprehensive development and reform programmes to attract private sector investment to supplement the Government investment to increase power generation. In the current year, out of the total power generated, the public sector's share is 78.38 percent while the private sector accounts for 21.26 percent share. Of the total power generated, 90.66 percent is gas-based, 3.88 percent is hydraulic and 5.46 percent is oil-based. Bangladesh Power Development Board (BPDB) is playing one of the major roles in power generation. Besides, Bangladesh Rural Electrification Board (BREB), Dhaka Electric Supply Company (DESCO) and Power Grid Company of Bangladesh (PGCB) are also working for managing transmission and distribution system of power. Through the PDB system, power is distributed through 33 kv and 11 kv lines. Power generated in different plants is distributed through 230 kv and 123 kv lines. A total of 22 gas fields has been discovered in the country so far. Out of the total extractable reserve of gas, 391.53 billion cft have been extracted during FY 2001-02. The whole country has been divided into 23 blocs for special exploration of gas resources and also for expansion of the use of gas. So far Production Sharing Contract (PSC) has been concluded for 12 blocs. In order to meet the increasing demand for gas, the private sector is coming up side by side with the public sector. In order to contain environment pollution, the process of converting vehicles into CNG is under way. Under the 'Dhaka Clean Fuel Project' the petrol-driven auto rickshaws and cars are being converted into CNG at both public and private sector levels. Bangladesh Petroleum Corporation has taken measures to make the storage facilities at different sites in Bangladesh developed, expanded and also internationally acceptable in terms of quality and standard. The companies under Petrobangla are being awarded administrative and financial autonomy for exercising more powers.
Transport and Communication
The system of transport and communication is of immense importance for development of Bangladesh. The contribution of this sector to GDP at constant price is 9.78 percent (provisional). The transport and communication network in Bangladesh consists of road transport, railways, water and airways, post and telecommunication and information technology. Although immediately after independence there was a road network of 4000 kilometres only; it increased, according to the estimates of 1998, to a huge road network of 2 lakh 23 thousand kilometres with national highways, regional highways, feeder roads and rural roads. Bangladesh Road Transport Authority was set up to take care of overall supervision, management and supervision of the transport sector. As a cheap mode of transportation, the importance of Bangladesh Railway is immense. Despite the fact that Bangladesh Railway had been a loss-making entity for many years, it has introduced recently a set of reform programmes that aim to reduce the deficit of Railway, abolish the system of open ended subsidy and rationalise manpower, among others. In maritime-trade of the country, Chittagong and Mongla Port Authorities play critical role. A small part of the remaining external trade is performed through land ports and air routes. Bangladesh
14
Shipping Corporation has built-up a mixed fleet of 13 vessels in order to provide efficient shipping services as well as to perform properly most of the external trade activities linked to international maritime trade. In addition, there is a Directorate of Shipping to ensure accident-free movements of all kinds of ships that include ships operating in inland waterways, coastal fishing trawlers, ships bound for foreign destination and ships coming into Bangladesh ports and also to protect commercial interests of Bangladeshi ships. Bangladesh Inland Water Transport Corporation is a service-oriented organisation. This entity, as a public utility service, is playing an important role in transporting commodities, passengers and vehicles. In order to enhance trade activies with the neighbouring countries, 13 land ports have been established at the Bangladesh-India border under Bangladesh Land Port Authority. Biman Bangladesh Airlines is the only public sector organisation engaged in the task of managing air travels. Amidst global recession in aviation business, Biman is continuing its operational activities in the competitive market with its limited resources. In the socio-economic development of Bangladesh, the role of telecommunication is significant. In view of the increasing public demand, as the number of telephones, NWD circuits and overseas circuits increased, so the revenue augmented over the last ten years. Opening up of cellular phones to private sector has increased teledensity significantly. Bangladesh Postal Department is a service-oriented organisation. The department makes arrangements for speedy dispatch of mails throughout the country through Biman, Railway, Bus and Launch. In addition, the department provides quite a few special services through which valuable articles, documents etc. can be sent to and from the country. In the current context of globalisation and market economy, economic development is not possible without achieving progress in information technology. In order to bring about improvement in this sector, the Government has taken up a comprehensive development programme.
Poverty Reduction
Poverty is a multi-faceted problem. The primary goal of the overall development efforts of Bangladesh government is the reduction of poverty. Poverty reduction, has, therefore, been given the top-most priority in the development plans of the country and a range of programmes are being implemented. According to the report on Household Income and Expenditure Survey 2000, (HIES) published by Bangladesh Bureau of Statistics (BBS), the absolute poverty at national level on the basis of daily calorie intake of 2122 k. cal. was 47.75 percent in 1998-99 and 44.33 percent in 2000. During the same period the hardcore poverty measured against 1805 k. cal was 28.36 and 19.98 percent. The poverty trend has been calculated according to Cost of Basic Needs (CBN) methodology introduced in 1995-96. According to this methodology, using high and low poverty lines the impact of poverty at national level are 49.8 percent and 33.7 percent. According to Bangladesh Human Development Report 2000, Human Development Index was 16.3 percent in 1981-83 and 34.8 percent in 1998-2000. In a recent meeting with the Secretaries, the Hon'ble Prime Minister emphasised the need for implementing programmes having poverty reducing
15
effects on a priority basis. Included among them are plantation of trees, fish cultivation, goat rearing, primary and women education, information and communication technology, library development, children's right, vocational and technical education and housing for the poor. In addition, a project has been taken up at the initiative of the Hon'ble Prime Minister at a cost of Tk. 447.00 crore for reduction of poverty. The implementation of the project will be completed by June, 2006. The role of micro-credit in reducing poverty is widely recognised. Bangladesh Rural Development Board (BRDB), Palli Karma Shahayask Foundation (PKSF) and a number of Government Agencies are engaged in distributing micro credit. Besides Grameen Bank, the scheduled banks are also participating in micro-credit distribution programme. Alongside the Government organisations, the Non-government organizations (NGOs) are also carrying out micro-credit operations. Among the NGOs, ASA, BRAC, PROSHIKA and SWANIRVHAR are playing significant role in this area.
Human Resource Development
The fundamental objective of economic upliftment is human development. The role of literate, healthy and efficient human resources is critical to the intended development of a country by achieving sustainable and higher growth. Education training, health and social services as tools for human resources development are gaining increasing importance. Realising this importance, the government in response is channeling increased resources to social sectors for human resource development. In FY 2002-03, the share of social sector in total public outlay has been estimated at 24 percent. The primary education has been made compulsory since 1990. Stipends for female students have been introduced to promote women education. A system of informal education for adult and illiterate learners has also been introduced. The outcome of these initiatives is that the current rate of literacy now rises to 62.66 percent. In order to build a system of quality education, a number of programmes has been introduced including teachers' training, revision of curriculum and infrastructure development. Greater emphasis has been laid on science & technology and vocational education. Efforts are under way to build an effective and sound health services to ensure sound public health alongside education. The Five-Year Health and Population Sector Programme (HPSP) was scheduled to be terminated in June 2003 but eventually completed in December 2003. A Health, Nutrition and Population Sector Programme (HNPSP) will commence from January 2004. Government is taking a range of measures through the Ministry of Women and Children's Affairs for women and children development. With a view to removing the gender inequality and to involve women with the mainstream of development activities, a variety of programmes has been adopted at governmental level. Elaborate programmes are being implemented to convert the youth force of the country into a productive force. In order to ensure utilisation of youth force in the developmental pursuit of the Government, adequate provisions have been made for training and efficiency enhancement of the unemployed youth, credit support, motivation and grants. To ensure welfare for the landless,
16
destitute, vagabonds, orphans, retarded and other disadvantaged classes, a variety of development programmes has been adopted. In addition a number of programmes aimed to develop sports and culture are being implemented. Implementation of these programmes are resulting in gradual development of human resources.
Private Sector Development
In market economy, private sector is the main engine of growth and development. The present Government continues its efforts for increased participation of private sector in the overall development activities of the country. It is trying to create an investment-friendly environment in the one hand, and taking initiatives for involving private sector for sustainable development on the other. Among the many initiatives of the Government, significant ones are formulation of different policies, reform of industrial policies, setting up Bangladesh Investment Board, (BOI) constituting Privatization Commission and strengthening of capital market. Private initiatives in the power and energy sector are being particularly encouraged. In FY2002-03, with the commissioning of two power plants under the private sector, the total power generation increased to 3622mw from 3218mw earlier. In telecommunication sector, two private companies are making significant contribution. Up to June 2003, 4 private companies provided 13 lakh 79 thousand cellular mobile connections which was 7 lakh in the previous year. In addition, 2 private companies have installed 25,348 fixed lines. Because of a range of initiatives in the transport sector, involvement of private sector is increasing in air-transport, water-transport and railway. GMG Air Lines are now operating in domestic and international air-routes. In construction and operation of container terminal for water-transport, in development and operation of landing station, private sector initiatives are being encouraged. In addition, decision has been taken to place different land ports under the private sector. Currently 40 banks, 60 insurance companies and 28 other financial institutions are operating under the private sector. These institutions, besides providing sound and efficient services, are supporting to make investment easy and competitive. Up to 2002 a total 24736 registered non-government primary schools has been established under the private initiative. In addition, a significant number of secondary schools, colleges and universities has also been established. In the health sector currently 642 private hospitals and clinics are operating. It has been made possible to save valuable foreign currencies by way of providing higher education and specialised health services. A comprehensive programme is in existence under the private sector initiative in the agriculture sector. The private sector is making special contributions in the areas of selling of shallow tube-wells, production and marketing of quality seeds, improvement of irrigation systems etc. Private initiatives are making special contributions to the jute and textile sectors too. Currently there are as many as 182 cotton mills in the country of which 156 cotton mills are under private sector. There are 3800 export-oriented garment industries that absorb a work force of 1.8 million. Consequent on a range of measures taken by the Government, private sector investment increased gradually which now
17
accounts for 71 percent of the total investment. During July 2002 to June 2003, the total number of industries registered with the Board of Investment stood at 2200 and the total investment proposed amounted to Tk.137,711 million. During the corresponding period of the previous year, the proposed investment of the registered industries amounted to Tk.105,400 million. As the rise in private investment will contribute to rise in production and attaining efficiency, so will it contribute to reduction of revenue expenditure for infrastructure and human resource development.
World Economic Outlook
In 2002 the world economy started recovering from the ills of severe recession in 2001. As a result, in the early part of 2002, the signs of achieving higher growth became evident in the global economy. But amidst continuation of adverse impact of the bursting of equity market bubble, rising political uncertainty, low market confidence and the escalation of oil prices, the pace of recovery slowed towards the end of 2002. Despite that the world output grew by 3.3 percent in 2002 from its dismal 2.3 percent registered in 2001. However, consistent monetary and fiscal policy pursued by the industrialised developed countries, improved macroeconomic management with accelerated structural reform in developing countries were the major contributing factors for the growth recovery. As the two major economic blocs, the Euro area and Japan remained relatively weak, a faster global recovery during the year was stalled. Due to the economic uncertainty throughout the world and the Iraq war, the projection of global economic growth for 2003 had to be adjusted. According to the IMF projection as presented in 'World Economic Outlook' published in February this year, the world output was estimated at 3.3 percent. But in the changed scenario, this projection has been revised to 3.2 percent in April 2003. In this projection, the rate of growth in developed countries has been estimated at 1.9 percent. In the case of the developing countries, this has been projected at 5.0 percent. Again among the developing countries, the growth of the developing Asia might be around 6.3 percent. According to revised projection of IMF, the growth of world trade in 2003 would be 4.3 percent which is 0.3 percent less than the projection of February 2003. But the impact of the realities emerging during post-Iraq war would call for a fresh projection of world economic growth in 2003.
18
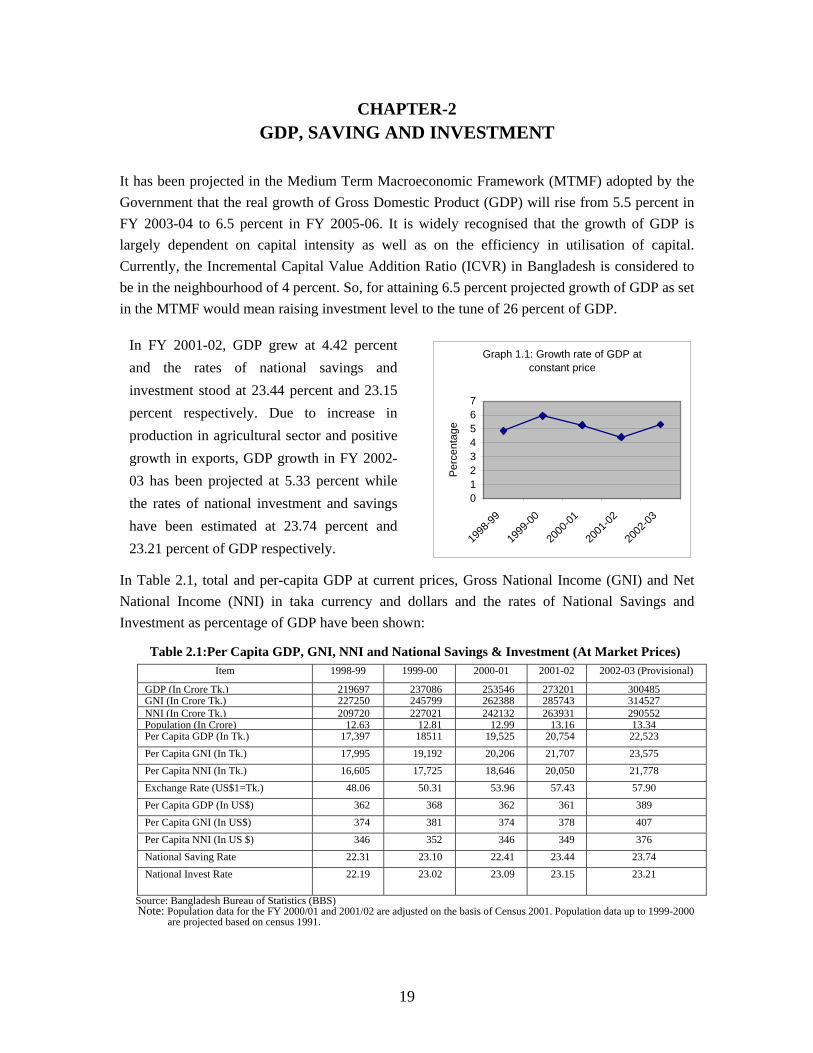
CHAPTER-2 GDP, SAVING AND INVESTMENT
It has been projected in the Medium Term Macroeconomic Framework (MTMF) adopted by the Government that the real growth of Gross Domestic Product (GDP) will rise from 5.5 percent in FY 2003-04 to 6.5 percent in FY 2005-06. It is widely recognised that the growth of GDP is largely dependent on capital intensity as well as on the efficiency in utilisation of capital. Currently, the Incremental Capital Value Addition Ratio (ICVR) in Bangladesh is considered to be in the neighbourhood of 4 percent. So, for attaining 6.5 percent projected growth of GDP as set in the MTMF would mean raising investment level to the tune of 26 percent of GDP.
In Table 2.1, total and per-capita GDP at current pNational Income (NNI) in taka currency and doInvestment as percentage of GDP have been shown
Table 2.1:Per Capita GDP, GNI, NNI and Natio
Item 1998-99 1999
GDP (In Crore Tk.) 219697 23GNI (In Crore Tk.) 227250 24NNI (In Crore Tk.) 209720 22Population (In Crore) 12.63 1Per Capita GDP (In Tk.) 17,397 1Per Capita GNI (In Tk.) 17,995 19Per Capita NNI (In Tk.) 16,605 17Exchange Rate (US$1=Tk.) 48.06 5Per Capita GDP (In US$) 362 Per Capita GNI (In US$) 374 Per Capita NNI (In US $) 346 National Saving Rate 22.31 2National Invest Rate 22.19 2
Source: Bangladesh Bureau of Statistics (BBS) Note: Population data for the FY 2000/01 and 2001/02 are adjuste
are projected based on census 1991.
19
Graph 1.1: Growth rate of GDP at constant price
01234567
1998
-99
1999
-00
2000
-01
2001
-02
2002
-03
Perc
enta
ge
In FY 2001-02, GDP grew at 4.42 percentand the rates of national savings andinvestment stood at 23.44 percent and 23.15percent respectively. Due to increase inproduction in agricultural sector and positivegrowth in exports, GDP growth in FY 2002-03 has been projected at 5.33 percent whilethe rates of national investment and savingshave been estimated at 23.74 percent and23.21 percent of GDP respectively.
rices, Gross National Income (GNI) and Net llars and the rates of National Savings and :
nal Savings & Investment (At Market Prices) -00 2000-01 2001-02 2002-03 (Provisional)
7086 253546 273201 3004855799 262388 285743 314527 7021 242132 263931 2905522.81 12.99 13.16 13.348511 19,525 20,754 22,523 ,192 20,206 21,707 23,575 ,725 18,646 20,050 21,778 0.31 53.96 57.43 57.90 368 362 361 389 381 374 378 407 352 346 349 376 3.10 22.41 23.44 23.74 3.02 23.09 23.15 23.21
d on the basis of Census 2001. Population data up to 1999-2000
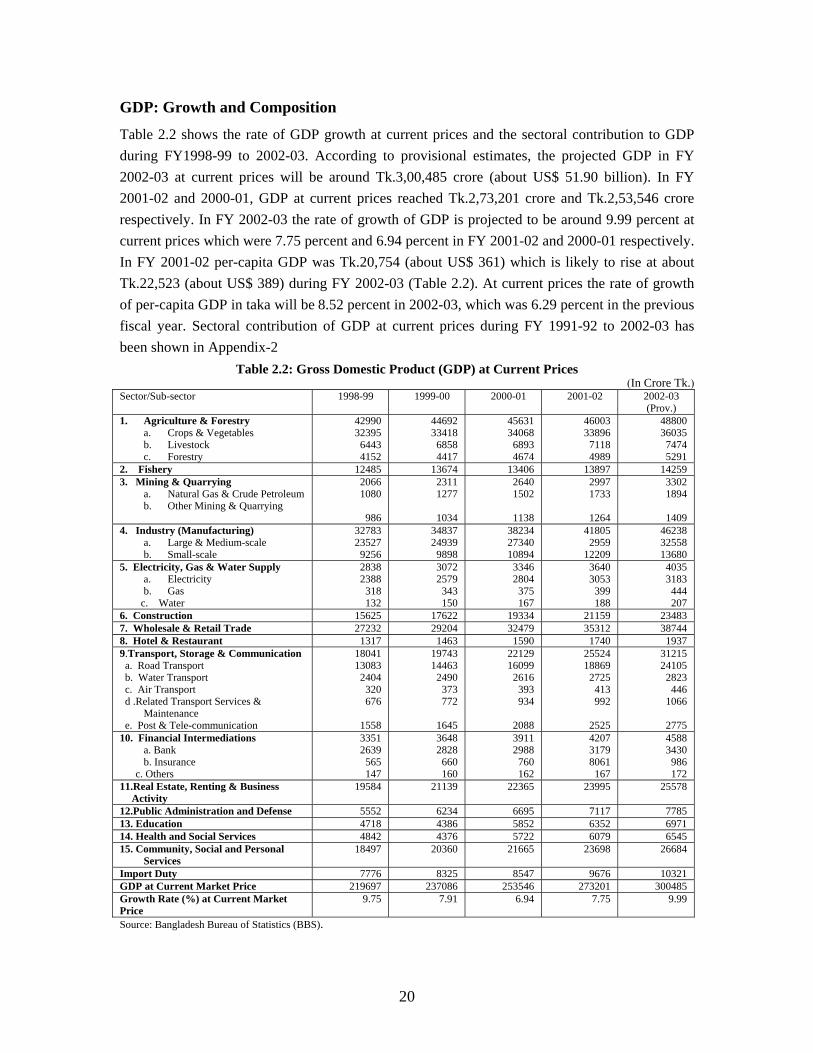
GDP: Growth and Composition
Table 2.2 shows the rate of GDP growth at current prices and the sectoral contribution to GDP during FY1998-99 to 2002-03. According to provisional estimates, the projected GDP in FY 2002-03 at current prices will be around Tk.3,00,485 crore (about US$ 51.90 billion). In FY 2001-02 and 2000-01, GDP at current prices reached Tk.2,73,201 crore and Tk.2,53,546 crore respectively. In FY 2002-03 the rate of growth of GDP is projected to be around 9.99 percent at current prices which were 7.75 percent and 6.94 percent in FY 2001-02 and 2000-01 respectively. In FY 2001-02 per-capita GDP was Tk.20,754 (about US$ 361) which is likely to rise at about Tk.22,523 (about US$ 389) during FY 2002-03 (Table 2.2). At current prices the rate of growth of per-capita GDP in taka will be 8.52 percent in 2002-03, which was 6.29 percent in the previous fiscal year. Sectoral contribution of GDP at current prices during FY 1991-92 to 2002-03 has been shown in Appendix-2
Table 2.2: Gross Domestic Product (GDP) at Current Prices (In Crore Tk.)
Sector/Sub-sector 1998-99 1999-00 2000-01 2001-02 2002-03 (Prov.)
1. Agriculture & Forestry a. Crops & Vegetables b. Livestock c. Forestry
42990 32395
6443 4152
44692 33418
6858 4417
45631 34068
6893 4674
46003 33896
7118 4989
48800 36035
7474 5291
2. Fishery 12485 13674 13406 13897 14259 3. Mining & Quarrying
a. Natural Gas & Crude Petroleum b. Other Mining & Quarrying
2066 1080
986
2311 1277
1034
2640 1502
1138
2997 1733
1264
3302 1894
1409
4. Industry (Manufacturing) a. Large & Medium-scale b. Small-scale
32783 23527
9256
34837 24939
9898
38234 27340 10894
41805 2959
12209
46238 32558 13680
5. Electricity, Gas & Water Supply a. Electricity b. Gas c. Water
2838 2388
318 132
3072 2579
343 150
3346 2804
375 167
3640 3053
399 188
4035 3183
444 207
6. Construction 15625 17622 19334 21159 23483 7. Wholesale & Retail Trade 27232 29204 32479 35312 38744 8. Hotel & Restaurant 1317 1463 1590 1740 1937 9.Transport, Storage & Communication a. Road Transport b. Water Transport c. Air Transport d .Related Transport Services &
Maintenance e. Post & Tele-communication
18041 13083
2404 320 676
1558
19743 14463
2490 373 772
1645
22129 16099
2616 393 934
2088
25524 18869
2725 413 992
2525
31215 24105
2823 446
1066
2775 10. Financial Intermediations a. Bank b. Insurance c. Others
3351 2639
565 147
3648 2828
660 160
3911 2988
760 162
4207 3179 8061
167
4588 3430
986 172
11.Real Estate, Renting & Business Activity
19584 21139 22365 23995 25578
12.Public Administration and Defense 5552 6234 6695 7117 7785 13. Education 4718 4386 5852 6352 6971 14. Health and Social Services 4842 4376 5722 6079 6545 15. Community, Social and Personal
Services 18497 20360 21665 23698 26684
Import Duty 7776 8325 8547 9676 10321 GDP at Current Market Price 219697 237086 253546 273201 300485 Growth Rate (%) at Current Market Price
9.75 7.91 6.94 7.75 9.99
Source: Bangladesh Bureau of Statistics (BBS).
20
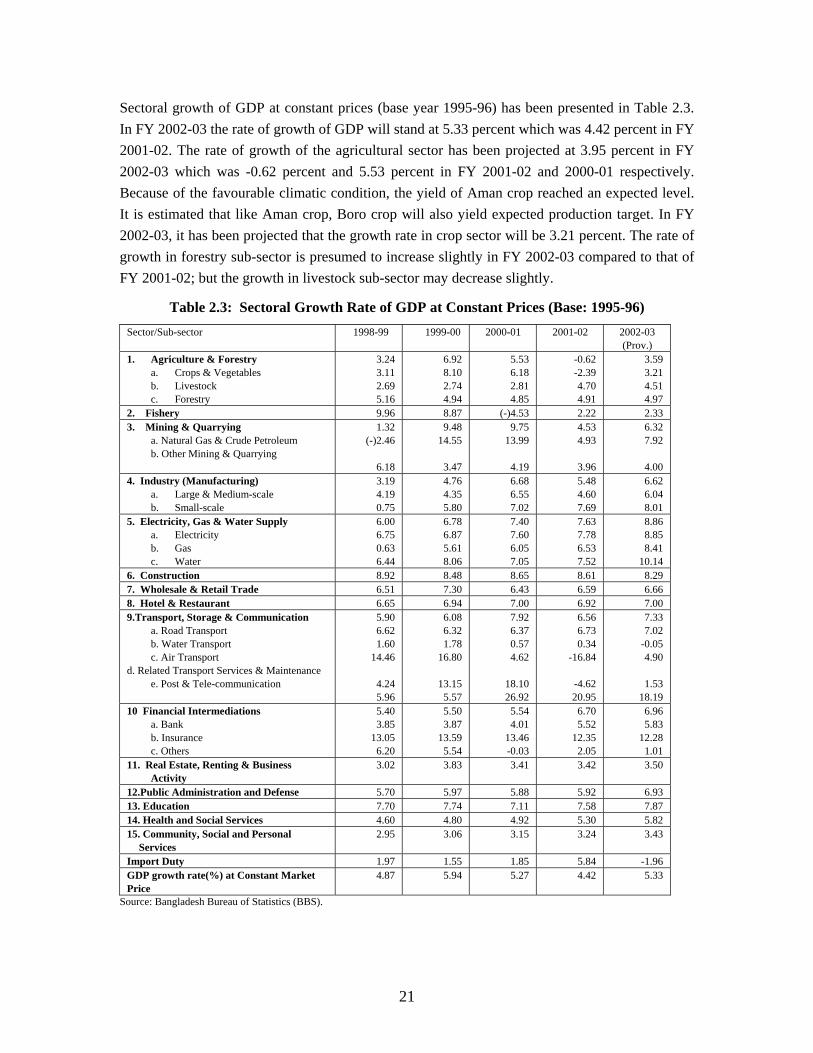
Sectoral growth of GDP at constant prices (base year 1995-96) has been presented in Table 2.3. In FY 2002-03 the rate of growth of GDP will stand at 5.33 percent which was 4.42 percent in FY 2001-02. The rate of growth of the agricultural sector has been projected at 3.95 percent in FY 2002-03 which was -0.62 percent and 5.53 percent in FY 2001-02 and 2000-01 respectively. Because of the favourable climatic condition, the yield of Aman crop reached an expected level. It is estimated that like Aman crop, Boro crop will also yield expected production target. In FY 2002-03, it has been projected that the growth rate in crop sector will be 3.21 percent. The rate of growth in forestry sub-sector is presumed to increase slightly in FY 2002-03 compared to that of FY 2001-02; but the growth in livestock sub-sector may decrease slightly.
Table 2.3: Sectoral Growth Rate of GDP at Constant Prices (Base: 1995-96) Sector/Sub-sector 1998-99 1999-00 2000-01 2001-02 2002-03
(Prov.) 1. Agriculture & Forestry
a. Crops & Vegetables b. Livestock c. Forestry
3.24 3.11 2.69 5.16
6.92 8.10 2.74 4.94
5.53 6.18 2.81 4.85
-0.62 -2.39 4.70 4.91
3.59 3.21 4.51 4.97
2. Fishery 9.96 8.87 (-)4.53 2.22 2.33 3. Mining & Quarrying
a. Natural Gas & Crude Petroleum b. Other Mining & Quarrying
1.32 (-)2.46
6.18
9.48 14.55
3.47
9.75 13.99
4.19
4.53 4.93
3.96
6.32 7.92
4.00
4. Industry (Manufacturing) a. Large & Medium-scale b. Small-scale
3.19 4.19 0.75
4.76 4.35 5.80
6.68 6.55 7.02
5.48 4.60 7.69
6.62 6.04 8.01
5. Electricity, Gas & Water Supply a. Electricity b. Gas c. Water
6.00 6.75 0.63 6.44
6.78 6.87 5.61 8.06
7.40 7.60 6.05 7.05
7.63 7.78 6.53 7.52
8.86 8.85 8.41
10.14 6. Construction 8.92 8.48 8.65 8.61 8.29 7. Wholesale & Retail Trade 6.51 7.30 6.43 6.59 6.66 8. Hotel & Restaurant 6.65 6.94 7.00 6.92 7.00 9.Transport, Storage & Communication
a. Road Transport b. Water Transport c. Air Transport
d. Related Transport Services & Maintenance e. Post & Tele-communication
5.90 6.62 1.60
14.46
4.24 5.96
6.08 6.32 1.78
16.80
13.15 5.57
7.92 6.37 0.57 4.62
18.10 26.92
6.56 6.73 0.34
-16.84
-4.62 20.95
7.33 7.02
-0.05 4.90
1.53
18.19 10 Financial Intermediations a. Bank b. Insurance c. Others
5.40 3.85
13.05 6.20
5.50 3.87
13.59 5.54
5.54 4.01
13.46 -0.03
6.70 5.52
12.35 2.05
6.96 5.83
12.28 1.01
11. Real Estate, Renting & Business Activity
3.02 3.83 3.41 3.42 3.50
12.Public Administration and Defense 5.70 5.97 5.88 5.92 6.93 13. Education 7.70 7.74 7.11 7.58 7.87 14. Health and Social Services 4.60 4.80 4.92 5.30 5.82 15. Community, Social and Personal
Services 2.95 3.06 3.15 3.24 3.43
Import Duty 1.97 1.55 1.85 5.84 -1.96 GDP growth rate(%) at Constant Market Price
4.87 5.94 5.27 4.42 5.33
Source: Bangladesh Bureau of Statistics (BBS).
21
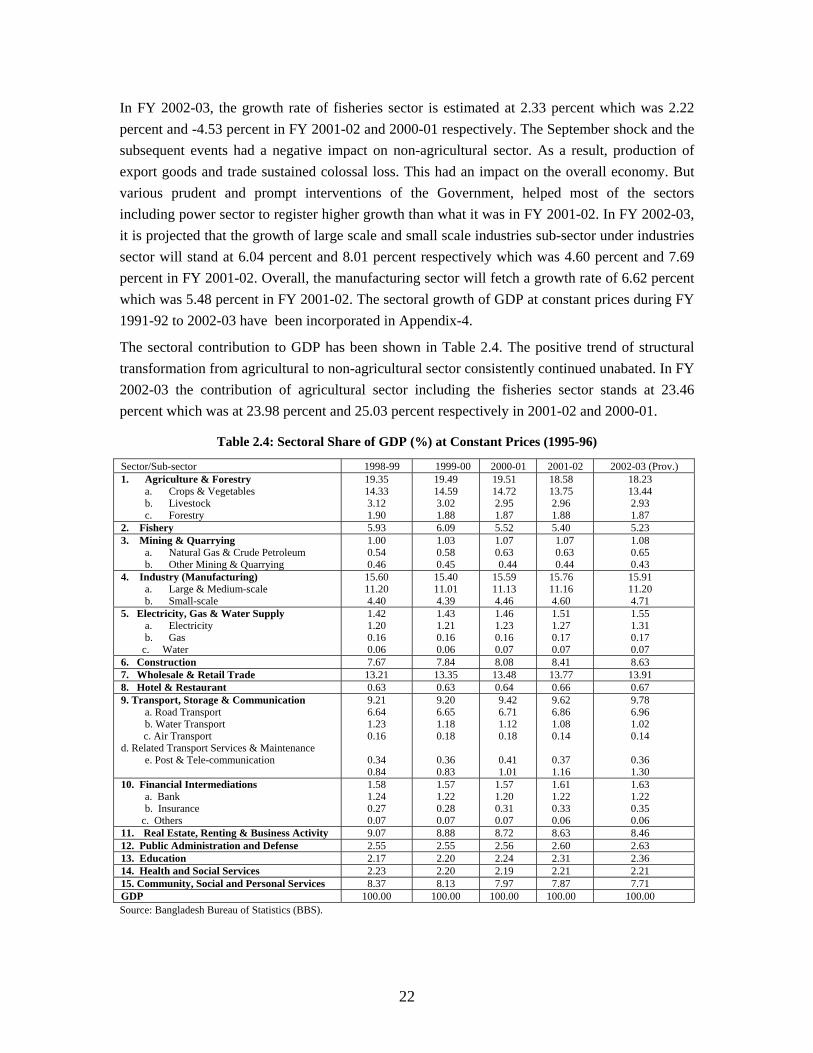
In FY 2002-03, the growth rate of fisheries sector is estimated at 2.33 percent which was 2.22 percent and -4.53 percent in FY 2001-02 and 2000-01 respectively. The September shock and the subsequent events had a negative impact on non-agricultural sector. As a result, production of export goods and trade sustained colossal loss. This had an impact on the overall economy. But various prudent and prompt interventions of the Government, helped most of the sectors including power sector to register higher growth than what it was in FY 2001-02. In FY 2002-03, it is projected that the growth of large scale and small scale industries sub-sector under industries sector will stand at 6.04 percent and 8.01 percent respectively which was 4.60 percent and 7.69 percent in FY 2001-02. Overall, the manufacturing sector will fetch a growth rate of 6.62 percent which was 5.48 percent in FY 2001-02. The sectoral growth of GDP at constant prices during FY 1991-92 to 2002-03 have been incorporated in Appendix-4.
The sectoral contribution to GDP has been shown in Table 2.4. The positive trend of structural transformation from agricultural to non-agricultural sector consistently continued unabated. In FY 2002-03 the contribution of agricultural sector including the fisheries sector stands at 23.46 percent which was at 23.98 percent and 25.03 percent respectively in 2001-02 and 2000-01.
Table 2.4: Sectoral Share of GDP (%) at Constant Prices (1995-96) Sector/Sub-sector 1998-99 1999-00 2000-01 2001-02 2002-03 (Prov.) 1. Agriculture & Forestry
a. Crops & Vegetables b. Livestock c. Forestry
19.35 14.33 3.12 1.90
19.49 14.59 3.02 1.88
19.51 14.72 2.95 1.87
18.58 13.75 2.96 1.88
18.23 13.44 2.93 1.87
2. Fishery 5.93 6.09 5.52 5.40 5.23 3. Mining & Quarrying
a. Natural Gas & Crude Petroleum b. Other Mining & Quarrying
1.00 0.54 0.46
1.03 0.58 0.45
1.07 0.63 0.44
1.07 0.63 0.44
1.08 0.65 0.43
4. Industry (Manufacturing) a. Large & Medium-scale b. Small-scale
15.60 11.20 4.40
15.40 11.01 4.39
15.59 11.13 4.46
15.76 11.16 4.60
15.91 11.20 4.71
5. Electricity, Gas & Water Supply a. Electricity b. Gas c. Water
1.42 1.20 0.16 0.06
1.43 1.21 0.16 0.06
1.46 1.23 0.16 0.07
1.51 1.27 0.17 0.07
1.55 1.31 0.17 0.07
6. Construction 7.67 7.84 8.08 8.41 8.63 7. Wholesale & Retail Trade 13.21 13.35 13.48 13.77 13.91 8. Hotel & Restaurant 0.63 0.63 0.64 0.66 0.67 9. Transport, Storage & Communication
a. Road Transport b. Water Transport c. Air Transport
d. Related Transport Services & Maintenance e. Post & Tele-communication
9.21 6.64 1.23 0.16
0.34 0.84
9.20 6.65 1.18 0.18
0.36 0.83
9.42 6.71 1.12 0.18
0.41 1.01
9.62 6.86 1.08 0.14
0.37 1.16
9.78 6.96 1.02 0.14
0.36 1.30
10. Financial Intermediations a. Bank b. Insurance c. Others
1.58 1.24 0.27 0.07
1.57 1.22 0.28 0.07
1.57 1.20 0.31 0.07
1.61 1.22 0.33 0.06
1.63 1.22 0.35 0.06
11. Real Estate, Renting & Business Activity 9.07 8.88 8.72 8.63 8.46 12. Public Administration and Defense 2.55 2.55 2.56 2.60 2.63 13. Education 2.17 2.20 2.24 2.31 2.36 14. Health and Social Services 2.23 2.20 2.19 2.21 2.21 15. Community, Social and Personal Services 8.37 8.13 7.97 7.87 7.71 GDP 100.00 100.00 100.00 100.00 100.00 Source: Bangladesh Bureau of Statistics (BBS).
22
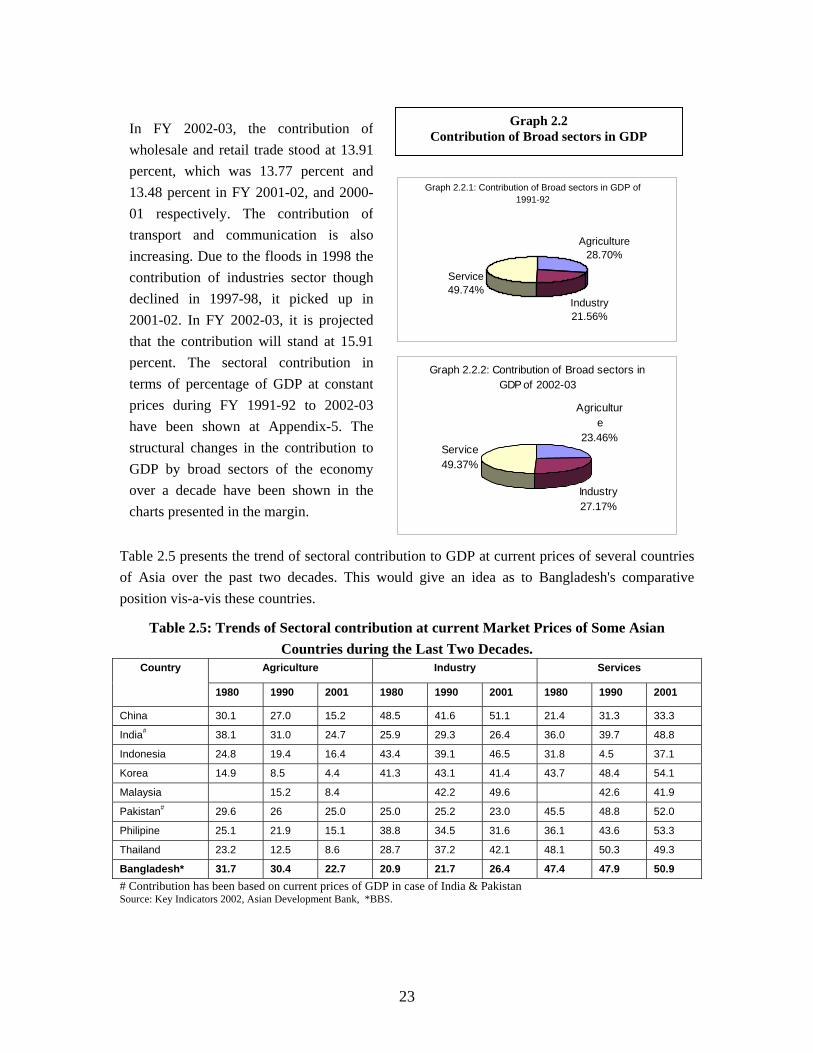
0
Table 2.5 presents the trend of sectoral controf Asia over the past two decades. This wposition vis-a-vis these countries.
Table 2.5: Trends of Sectoral contribuCountries during
Agriculture Country
1980 1990 2001 1
China 30.1 27.0 15.2 4
India# 38.1 31.0 24.7 2
Indonesia 24.8 19.4 16.4 4
Korea 14.9 8.5 4.4 4
Malaysia 15.2 8.4
Pakistan# 29.6 26 25.0 2
Philipine 25.1 21.9 15.1 3
Thailand 23.2 12.5 8.6 2
Bangladesh* 31.7 30.4 22.7 2# Contribution has been based on current prices of GDPSource: Key Indicators 2002, Asian Development Bank, *BBS
Graph 2.2 Contribution of Broad sectors in GDP
Graph 2.2.1: Contribution of Broad sectors in GDP of 1991-92
Agriculture28.70%
Industry21.56%
Service49.74%
Graph 2.2.2: Contribution of Broad sectors in GDP of 2002-03
Agriculture
23.46%
Industry27.17%
Service49.37%
In FY 2002-03, the contribution ofwholesale and retail trade stood at 13.91percent, which was 13.77 percent and13.48 percent in FY 2001-02, and 2000-01 respectively. The contribution oftransport and communication is alsoincreasing. Due to the floods in 1998 thecontribution of industries sector thoughdeclined in 1997-98, it picked up in2001-02. In FY 2002-03, it is projectedthat the contribution will stand at 15.91percent. The sectoral contribution interms of percentage of GDP at constantprices during FY 1991-92 to 2002-03have been shown at Appendix-5. Thestructural changes in the contribution toGDP by broad sectors of the economyover a decade have been shown in thecharts presented in the margin.
ibution to GDP at current prices of several countries ould give an idea as to Bangladesh's comparative
tion at current Market Prices of Some Asian the Last Two Decades.
Industry Services
980 1990 2001 1980 1990 2001
8.5 41.6 51.1 21.4 31.3 33.3
5.9 29.3 26.4 36.0 39.7 48.8
3.4 39.1 46.5 31.8 4.5 37.1
1.3 43.1 41.4 43.7 48.4 54.1
42.2 49.6 42.6 41.9
5.0 25.2 23.0 45.5 48.8 52.0
8.8 34.5 31.6 36.1 43.6 53.3
8.7 37.2 42.1 48.1 50.3 49.3
0.9 21.7 26.4 47.4 47.9 50.9 in case of India & Pakistan .
23
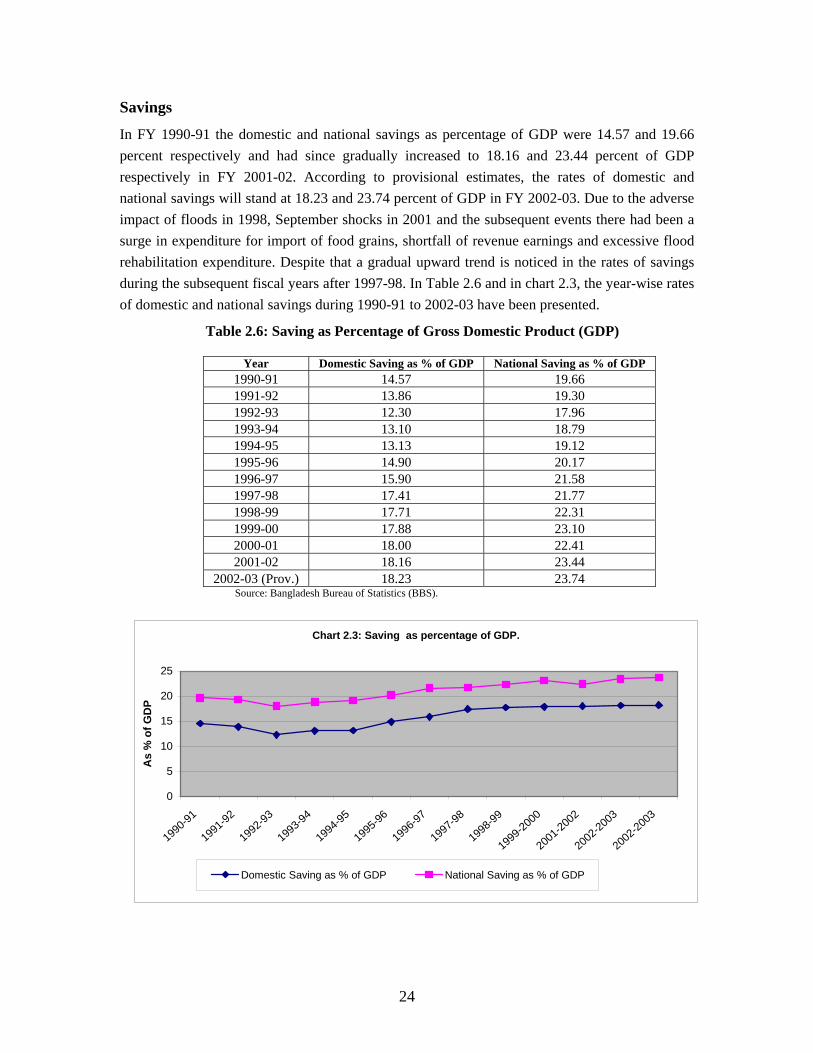
Savings
In FY 1990-91 the domestic and national savings as percentage of GDP were 14.57 and 19.66 percent respectively and had since gradually increased to 18.16 and 23.44 percent of GDP respectively in FY 2001-02. According to provisional estimates, the rates of domestic and national savings will stand at 18.23 and 23.74 percent of GDP in FY 2002-03. Due to the adverse impact of floods in 1998, September shocks in 2001 and the subsequent events there had been a surge in expenditure for import of food grains, shortfall of revenue earnings and excessive flood rehabilitation expenditure. Despite that a gradual upward trend is noticed in the rates of savings during the subsequent fiscal years after 1997-98. In Table 2.6 and in chart 2.3, the year-wise rates of domestic and national savings during 1990-91 to 2002-03 have been presented.
Table 2.6: Saving as Percentage of Gross Domestic Product (GDP)
Year Domestic Saving as % of GDP National Saving as % of GDP 1990-91 14.57 19.66 1991-92 13.86 19.30 1992-93 12.30 17.96 1993-94 13.10 18.79 1994-95 13.13 19.12 1995-96 14.90 20.17 1996-97 15.90 21.58 1997-98 17.41 21.77 1998-99 17.71 22.31 1999-00 17.88 23.10 2000-01 18.00 22.41 2001-02 18.16 23.44
2002-03 (Prov.) 18.23 23.74 Source: Bangladesh Bureau of Statistics (BBS).
Chart 2.3: Saving as percentage of GDP.
0
5
10
15
20
25
1990-9
1
1991-9
2
1992-9
3
1993-9
4
1994-9
5
1995-9
6
1996-9
7
1997-9
8
1998-9
9
1999-2
000
2001-2
002
2002-2
003
2002-2
003
As
% o
f GD
P
Domestic Saving as % of GDP National Saving as % of GDP
24
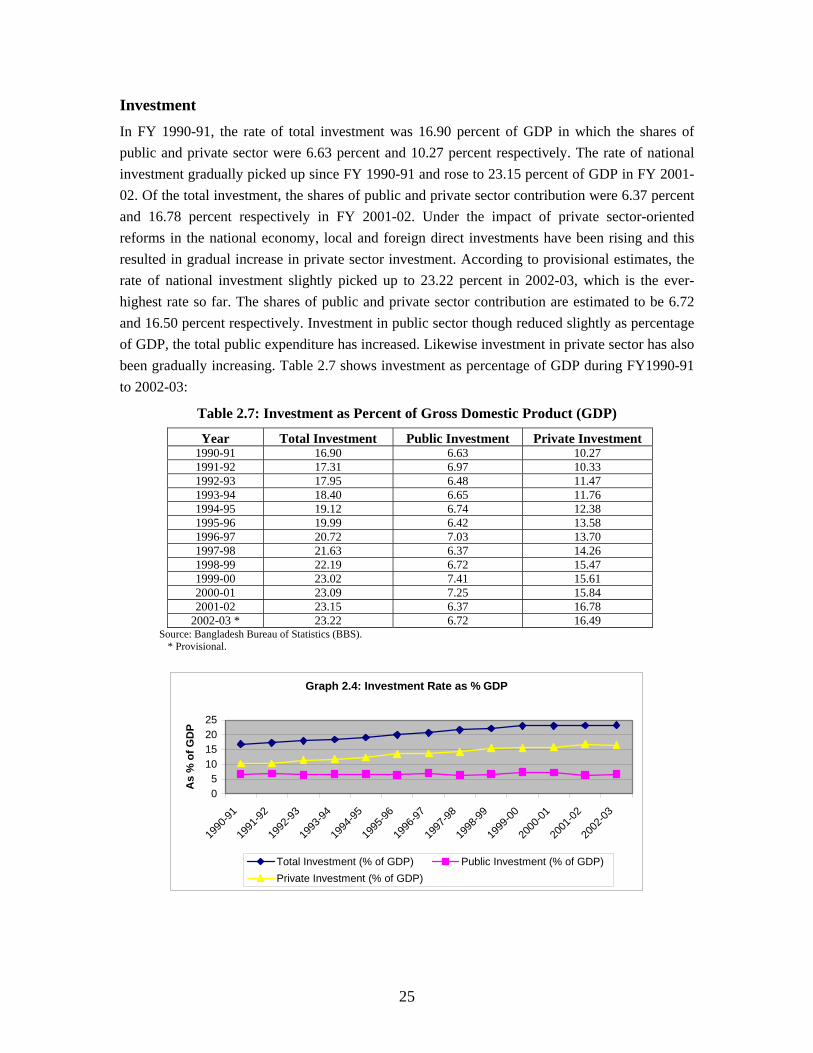
Investment In FY 1990-91, the rate of total investment was 16.90 percent of GDP in which the shares of public and private sector were 6.63 percent and 10.27 percent respectively. The rate of national investment gradually picked up since FY 1990-91 and rose to 23.15 percent of GDP in FY 2001-02. Of the total investment, the shares of public and private sector contribution were 6.37 percent and 16.78 percent respectively in FY 2001-02. Under the impact of private sector-oriented reforms in the national economy, local and foreign direct investments have been rising and this resulted in gradual increase in private sector investment. According to provisional estimates, the rate of national investment slightly picked up to 23.22 percent in 2002-03, which is the ever-highest rate so far. The shares of public and private sector contribution are estimated to be 6.72 and 16.50 percent respectively. Investment in public sector though reduced slightly as percentage of GDP, the total public expenditure has increased. Likewise investment in private sector has also been gradually increasing. Table 2.7 shows investment as percentage of GDP during FY1990-91 to 2002-03:
Table 2.7: Investment as Percent of Gross Domestic Product (GDP)
Year Total Investment Public Investment Private Investment 1990-91 16.90 6.63 10.27 1991-92 17.31 6.97 10.33 1992-93 17.95 6.48 11.47 1993-94 18.40 6.65 11.76 1994-95 19.12 6.74 12.38 1995-96 19.99 6.42 13.58 1996-97 20.72 7.03 13.70 1997-98 21.63 6.37 14.26 1998-99 22.19 6.72 15.47 1999-00 23.02 7.41 15.61 2000-01 23.09 7.25 15.84 2001-02 23.15 6.37 16.78
2002-03 * 23.22 6.72 16.49 Source: Bangladesh Bureau of Statistics (BBS). * Provisional.
Graph 2.4: Investment Rate as % GDP
05
10152025
1990
-91
1991
-92
1992
-93
1993
-94
1994
-95
1995
-96
1996
-97
1997
-98
1998
-99
1999
-00
2000
-01
2001
-02
2002
-03
As
% o
f GD
P
Total Investment (% of GDP) Public Investment (% of GDP)Private Investment (% of GDP)
25
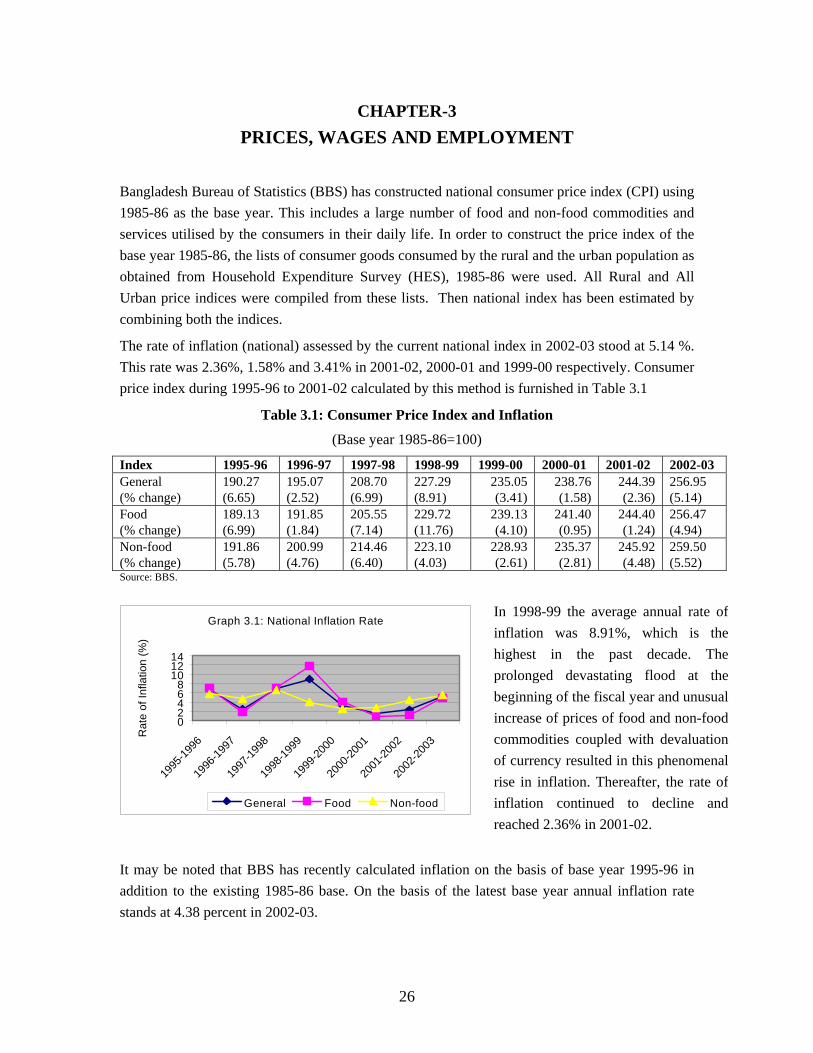
CHAPTER-3 PRICES, WAGES AND EMPLOYMENT
Bangladesh Bureau of Statistics (BBS) has constructed national consumer price index (CPI) using 1985-86 as the base year. This includes a large number of food and non-food commodities and services utilised by the consumers in their daily life. In order to construct the price index of the base year 1985-86, the lists of consumer goods consumed by the rural and the urban population as obtained from Household Expenditure Survey (HES), 1985-86 were used. All Rural and All Urban price indices were compiled from these lists. Then national index has been estimated by combining both the indices.
The rate of inflation (national) assessed by the current national index in 2002-03 stood at 5.14 %. This rate was 2.36%, 1.58% and 3.41% in 2001-02, 2000-01 and 1999-00 respectively. Consumer price index during 1995-96 to 2001-02 calculated by this method is furnished in Table 3.1
Table 3.1: Consumer Price Index and Inflation
(Base year 1985-86=100)
Index 1995-96 1996-97 1997-98 1998-99 1999-00 2000-01 2001-02 2002-03 General (% change)
190.27 (6.65)
195.07 (2.52)
208.70 (6.99)
227.29 (8.91)
235.05 (3.41)
238.76 (1.58)
244.39 (2.36)
256.95 (5.14)
Food (% change)
189.13 (6.99)
191.85 (1.84)
205.55 (7.14)
229.72 (11.76)
239.13 (4.10)
241.40 (0.95)
244.40 (1.24)
256.47 (4.94)
Non-food (% change)
191.86 (5.78)
200.99 (4.76)
214.46 (6.40)
223.10 (4.03)
228.93 (2.61)
235.37 (2.81)
245.92 (4.48)
259.50 (5.52)
Source: BBS.
Graph 3.1: National Inflation Rate
02468
101214
1995
-1996
1996
-1997
1997
-1998
1998
-1999
1999
-2000
2000
-2001
2001
-2002
2002
-2003
Rat
e of
Infla
tion
(%)
General Food Non-food
It may be noted that BBS has recently calculated inflation onaddition to the existing 1985-86 base. On the basis of the lastands at 4.38 percent in 2002-03.
26
In 1998-99 the average annual rate ofinflation was 8.91%, which is thehighest in the past decade. Theprolonged devastating flood at thebeginning of the fiscal year and unusualincrease of prices of food and non-foodcommodities coupled with devaluationof currency resulted in this phenomenalrise in inflation. Thereafter, the rate ofinflation continued to decline andreached 2.36% in 2001-02.
the basis of base year 1995-96 in test base year annual inflation rate
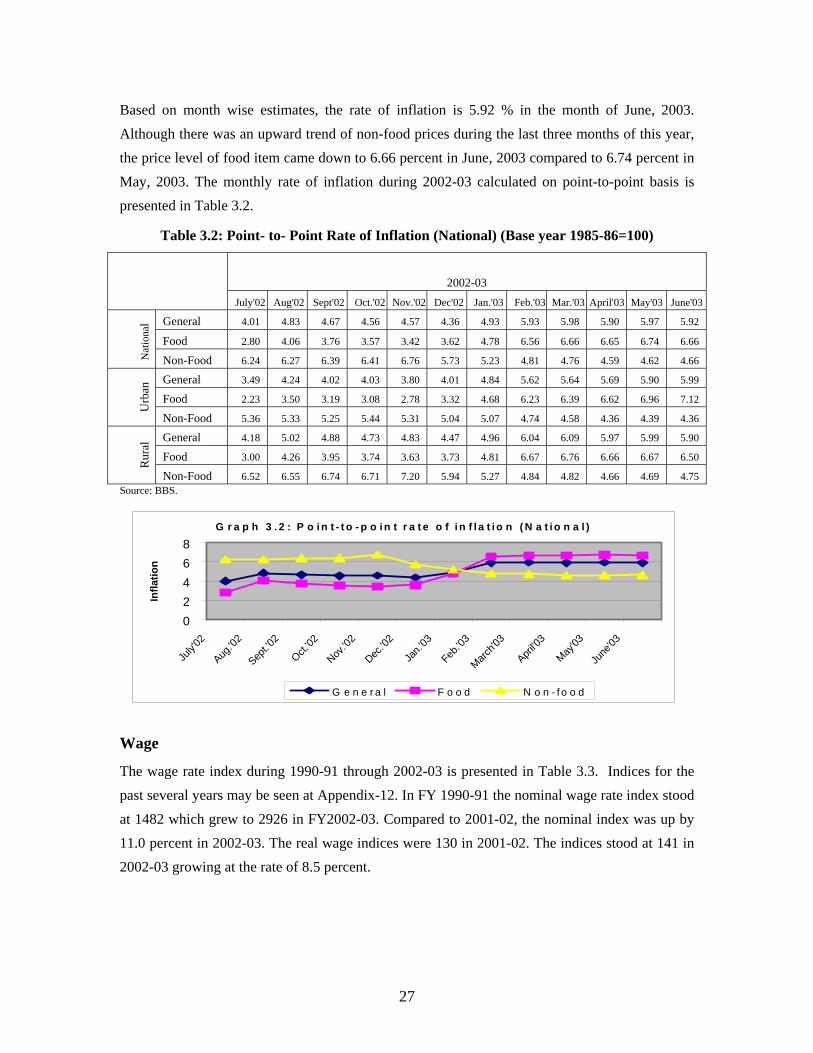
Based on month wise estimates, the rate of inflation is 5.92 % in the month of June, 2003. Although there was an upward trend of non-food prices during the last three months of this year, the price level of food item came down to 6.66 percent in June, 2003 compared to 6.74 percent in May, 2003. The monthly rate of inflation during 2002-03 calculated on point-to-point basis is presented in Table 3.2.
Table 3.2: Point- to- Point Rate of Inflation (National) (Base year 1985-86=100)
2002-03
July'02 Aug'02 Sept'02 Oct.'02 Nov.'02 Dec'02 Jan.'03 Feb.'03 Mar.'03 April'03 May'03 June'03
General 4.01 4.83 4.67 4.56 4.57 4.36 4.93 5.93 5.98 5.90 5.97 5.92
Food 2.80 4.06 3.76 3.57 3.42 3.62 4.78 6.56 6.66 6.65 6.74 6.66
Nat
iona
l
Non-Food 6.24 6.27 6.39 6.41 6.76 5.73 5.23 4.81 4.76 4.59 4.62 4.66
General 3.49 4.24 4.02 4.03 3.80 4.01 4.84 5.62 5.64 5.69 5.90 5.99
Food 2.23 3.50 3.19 3.08 2.78 3.32 4.68 6.23 6.39 6.62 6.96 7.12 U
rban
Non-Food 5.36 5.33 5.25 5.44 5.31 5.04 5.07 4.74 4.58 4.36 4.39 4.36
General 4.18 5.02 4.88 4.73 4.83 4.47 4.96 6.04 6.09 5.97 5.99 5.90
Food 3.00 4.26 3.95 3.74 3.63 3.73 4.81 6.67 6.76 6.66 6.67 6.50 R
ural
Non-Food 6.52 6.55 6.74 6.71 7.20 5.94 5.27 4.84 4.82 4.66 4.69 4.75 Source: BBS.
G r a p h 3 . 2 : P o i n t - t o - p o i n t r a t e o f i n f l a t i o n ( N a t i o n a l )
02468
July'0
2
Aug.'0
2
Sept.'0
2
Oct.'02
Nov.'0
2
Dec.'0
2
Jan.'
03
Feb.'0
3
March'0
3
April'0
3
May'03
June
'03
Infla
tion
G e n e r a l F o o d N o n - f o o d
Wage The wage rate index during 1990-91 through 2002-03 is presented in Table 3.3. Indices for the past several years may be seen at Appendix-12. In FY 1990-91 the nominal wage rate index stood at 1482 which grew to 2926 in FY2002-03. Compared to 2001-02, the nominal index was up by 11.0 percent in 2002-03. The real wage indices were 130 in 2001-02. The indices stood at 141 in 2002-03 growing at the rate of 8.5 percent.
27
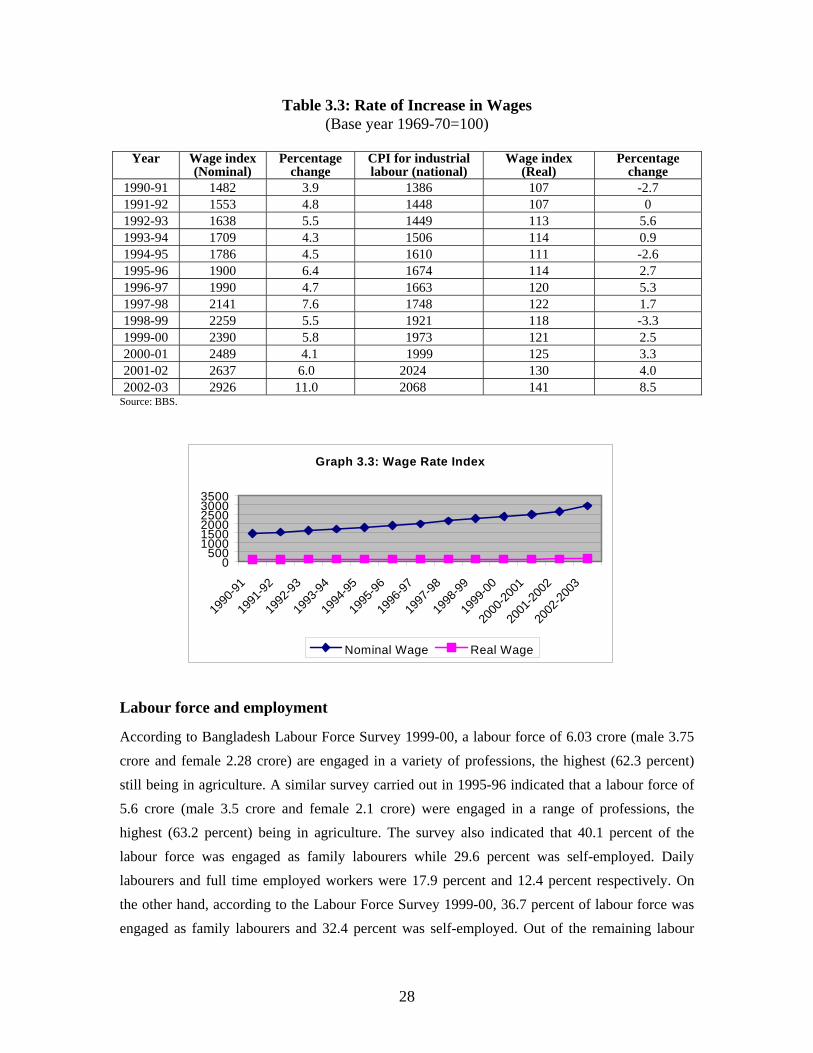
Table 3.3: Rate of Increase in Wages (Base year 1969-70=100)
Year Wage index
(Nominal) Percentage
change CPI for industrial labour (national)
Wage index (Real)
Percentage change
1990-91 1482 3.9 1386 107 -2.7 1991-92 1553 4.8 1448 107 0 1992-93 1638 5.5 1449 113 5.6 1993-94 1709 4.3 1506 114 0.9 1994-95 1786 4.5 1610 111 -2.6 1995-96 1900 6.4 1674 114 2.7 1996-97 1990 4.7 1663 120 5.3 1997-98 2141 7.6 1748 122 1.7 1998-99 2259 5.5 1921 118 -3.3 1999-00 2390 5.8 1973 121 2.5 2000-01 2489 4.1 1999 125 3.3 2001-02 2637 6.0 2024 130 4.0 2002-03 2926 11.0 2068 141 8.5
Source: BBS.
Graph 3.3: Wage Rate Index
0500
100015002000250030003500
1990
-91
1991
-92
1992
-93
1993
-94
1994
-95
1995
-96
1996
-97
1997
-98
1998
-99
1999
-00
2000
-2001
2001
-2002
2002
-2003
Nominal Wage Real Wage
Labour force and employment According to Bangladesh Labour Force Survey 1999-00, a labour force of 6.03 crore (male 3.75
crore and female 2.28 crore) are engaged in a variety of professions, the highest (62.3 percent) still being in agriculture. A similar survey carried out in 1995-96 indicated that a labour force of 5.6 crore (male 3.5 crore and female 2.1 crore) were engaged in a range of professions, the highest (63.2 percent) being in agriculture. The survey also indicated that 40.1 percent of the labour force was engaged as family labourers while 29.6 percent was self-employed. Daily labourers and full time employed workers were 17.9 percent and 12.4 percent respectively. On the other hand, according to the Labour Force Survey 1999-00, 36.7 percent of labour force was engaged as family labourers and 32.4 percent was self-employed. Out of the remaining labour
28
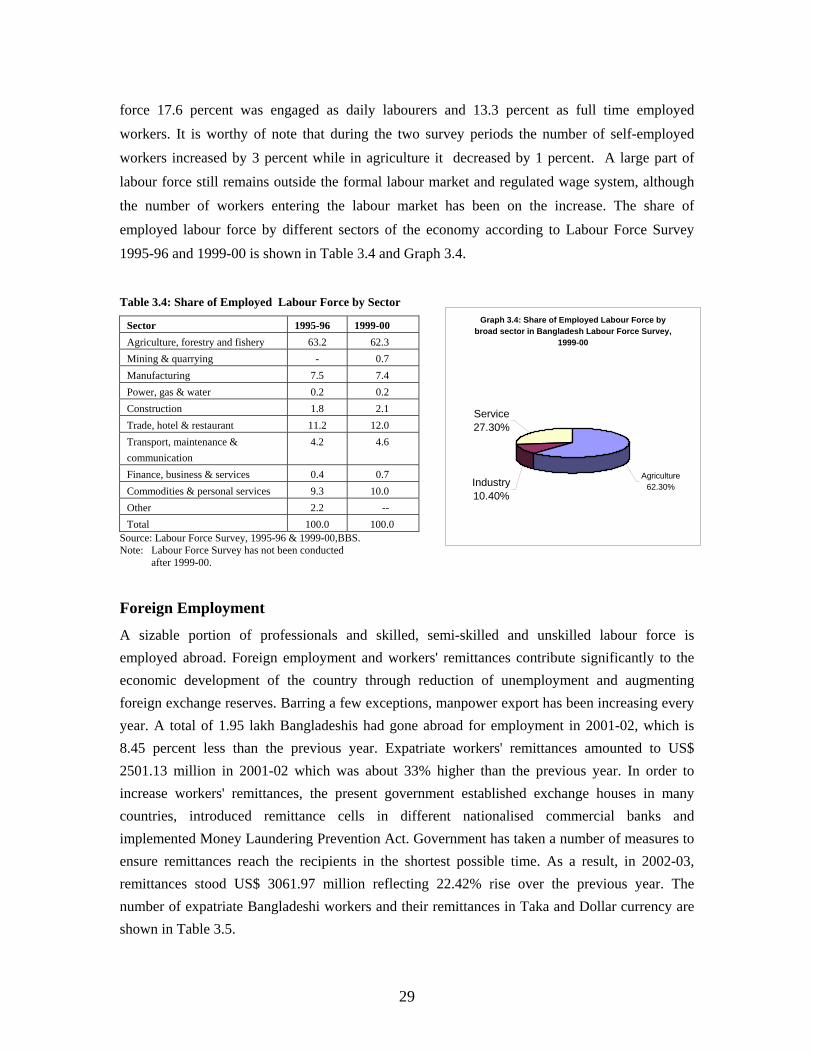
force 17.6 percent was engaged as daily labourers and 13.3 percent as full time employed workers. It is worthy of note that during the two survey periods the number of self-employed workers increased by 3 percent while in agriculture it decreased by 1 percent. A large part of labour force still remains outside the formal labour market and regulated wage system, although the number of workers entering the labour market has been on the increase. The share of employed labour force by different sectors of the economy according to Labour Force Survey 1995-96 and 1999-00 is shown in Table 3.4 and Graph 3.4.
Table 3.4: Share of Employed Labour Force by Sector
Sector 1995-96 1999-00 Agriculture, forestry and fishery 63.2 62.3 Mining & quarrying - 0.7 Manufacturing 7.5 7.4 Power, gas & water 0.2 0.2 Construction 1.8 2.1 Trade, hotel & restaurant 11.2 12.0 Transport, maintenance & communication
4.2 4.6
Finance, business & services 0.4 0.7 Commodities & personal services 9.3 10.0 Other 2.2 -- Total 100.0 100.0
Graph 3.4: Share of Employed Labour Force by
Source: Labour Force Survey, 1995-96 & 1999-00,BBS. Note: Labour Force Survey has not been conducted after 1999-00.
Foreign Employment A sizable portion of professionals and skilled, semployed abroad. Foreign employment and workerseconomic development of the country through redforeign exchange reserves. Barring a few exceptions, year. A total of 1.95 lakh Bangladeshis had gone ab8.45 percent less than the previous year. Expatria2501.13 million in 2001-02 which was about 33% increase workers' remittances, the present governmcountries, introduced remittance cells in differimplemented Money Laundering Prevention Act. Govensure remittances reach the recipients in the shortremittances stood US$ 3061.97 million reflecting number of expatriate Bangladeshi workers and their shown in Table 3.5.
29
broad sector in Bangladesh Labour Force Survey, 1999-00
Service27.30%
Industry10.40%
Agriculture62.30%
emi-skilled and unskilled labour force is ' remittances contribute significantly to the uction of unemployment and augmenting manpower export has been increasing every road for employment in 2001-02, which is te workers' remittances amounted to US$ higher than the previous year. In order to ent established exchange houses in many ent nationalised commercial banks and ernment has taken a number of measures to
est possible time. As a result, in 2002-03, 22.42% rise over the previous year. The
remittances in Taka and Dollar currency are
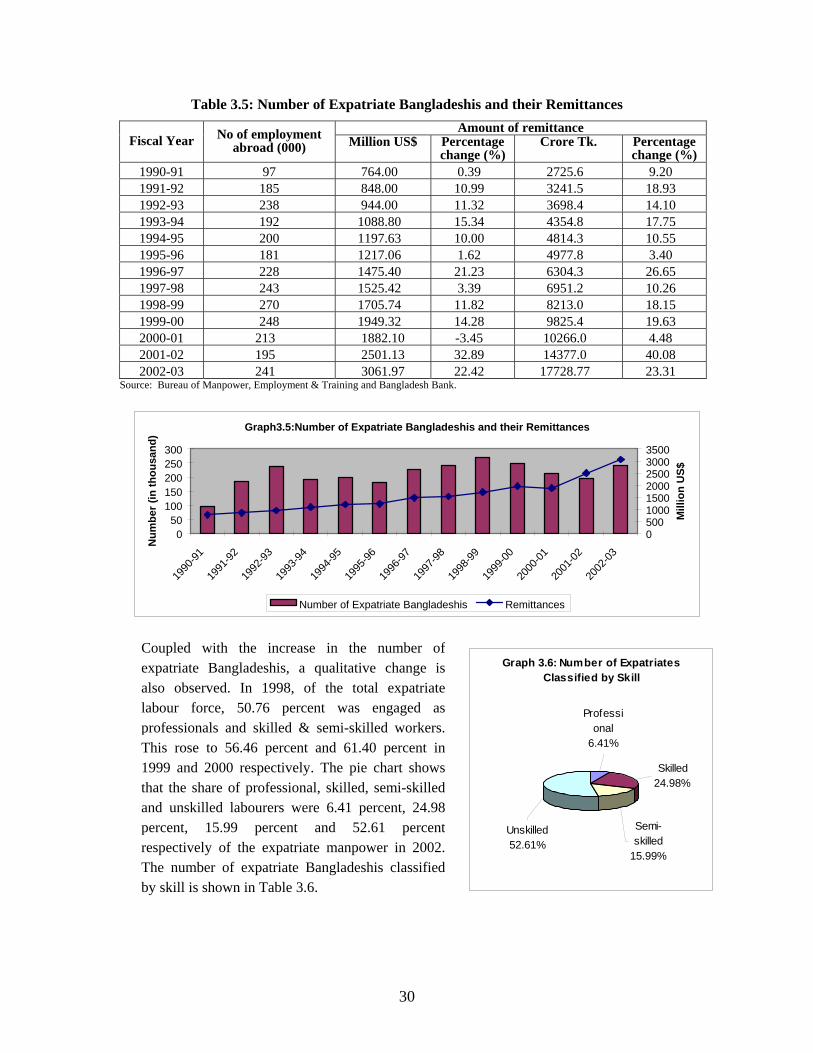
Table 3.5: Number of Expatriate Bangladeshis and their Remittances Amount of remittance
Fiscal Year No of employment abroad (000) Million US$ Percentage
change (%) Crore Tk. Percentage
change (%) 1990-91 97 764.00 0.39 2725.6 9.20 1991-92 185 848.00 10.99 3241.5 18.93 1992-93 238 944.00 11.32 3698.4 14.10 1993-94 192 1088.80 15.34 4354.8 17.75 1994-95 200 1197.63 10.00 4814.3 10.55 1995-96 181 1217.06 1.62 4977.8 3.40 1996-97 228 1475.40 21.23 6304.3 26.65 1997-98 243 1525.42 3.39 6951.2 10.26 1998-99 270 1705.74 11.82 8213.0 18.15 1999-00 248 1949.32 14.28 9825.4 19.63 2000-01 213 1882.10 -3.45 10266.0 4.48 2001-02 195 2501.13 32.89 14377.0 40.08 2002-03 241 3061.97 22.42 17728.77 23.31
Source: Bureau of Manpower, Employment & Training and Bangladesh Bank.
Graph3.5:Number of Expatriate Bangladeshis and their Remittances
050
100150200250300
1990
-9119
91-92
1992
-9319
93-94
1994
-9519
95-96
1996
-9719
97-98
1998
-9919
99-00
2000
-0120
01-02
2002
-03
Num
ber (
in th
ousa
nd)
0500100015002000250030003500
Mill
ion
US$
Number of Expatriate Bangladeshis Remittances
Graph 3.6: Number of Expatriates Classified by Skill
Unskilled52.61%
Semi-skilled
15.99%
Skilled24.98%
Professional
6.41%
Coupled with the increase in the number ofexpatriate Bangladeshis, a qualitative change isalso observed. In 1998, of the total expatriatelabour force, 50.76 percent was engaged asprofessionals and skilled & semi-skilled workers.This rose to 56.46 percent and 61.40 percent in1999 and 2000 respectively. The pie chart showsthat the share of professional, skilled, semi-skilledand unskilled labourers were 6.41 percent, 24.98percent, 15.99 percent and 52.61 percentrespectively of the expatriate manpower in 2002.The number of expatriate Bangladeshis classifiedby skill is shown in Table 3.6.
30
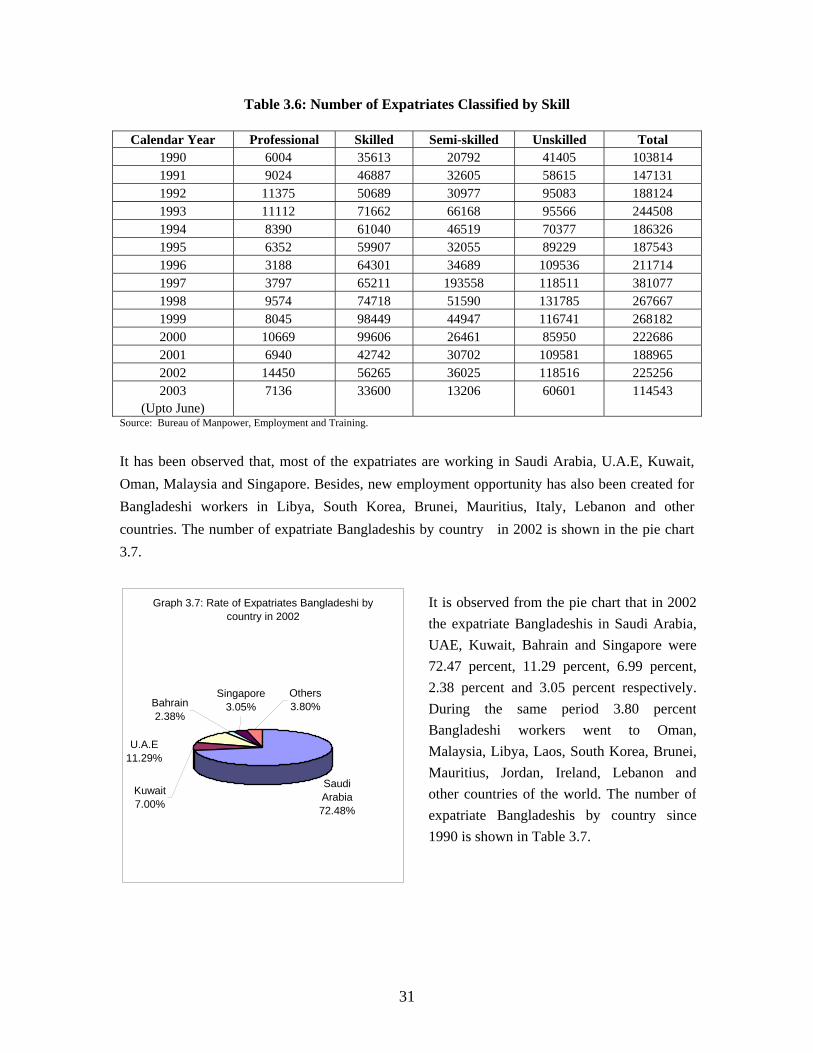
Table 3.6: Number of Expatriates Classified by Skill
Calendar Year Professional Skilled Semi-skilled Unskilled Total 1990 6004 35613 20792 41405 103814 1991 9024 46887 32605 58615 147131 1992 11375 50689 30977 95083 188124 1993 11112 71662 66168 95566 244508 1994 8390 61040 46519 70377 186326 1995 6352 59907 32055 89229 187543 1996 3188 64301 34689 109536 211714 1997 3797 65211 193558 118511 381077 1998 9574 74718 51590 131785 267667 1999 8045 98449 44947 116741 268182 2000 10669 99606 26461 85950 222686 2001 6940 42742 30702 109581 188965 2002 14450 56265 36025 118516 225256 2003
(Upto June) 7136 33600 13206 60601 114543
Source: Bureau of Manpower, Employment and Training.
It has been observed that, most of the expatriates are working in Saudi Arabia, U.A.E, Kuwait, Oman, Malaysia and Singapore. Besides, new employment opportunity has also been created for Bangladeshi workers in Libya, South Korea, Brunei, Mauritius, Italy, Lebanon and other countries. The number of expatriate Bangladeshis by country in 2002 is shown in the pie chart 3.7.
Graph 3.7: Rate of Expatriates Bangladeshi by country in 2002
Saudi Arabia72.48%
Others3.80%
Singapore3.05%Bahrain
2.38%
Kuwait7.00%
U.A.E11.29%
It is observed from the pie chart that in 2002the expatriate Bangladeshis in Saudi Arabia,UAE, Kuwait, Bahrain and Singapore were72.47 percent, 11.29 percent, 6.99 percent,2.38 percent and 3.05 percent respectively.During the same period 3.80 percentBangladeshi workers went to Oman,Malaysia, Libya, Laos, South Korea, Brunei,Mauritius, Jordan, Ireland, Lebanon andother countries of the world. The number ofexpatriate Bangladeshis by country since1990 is shown in Table 3.7.
31
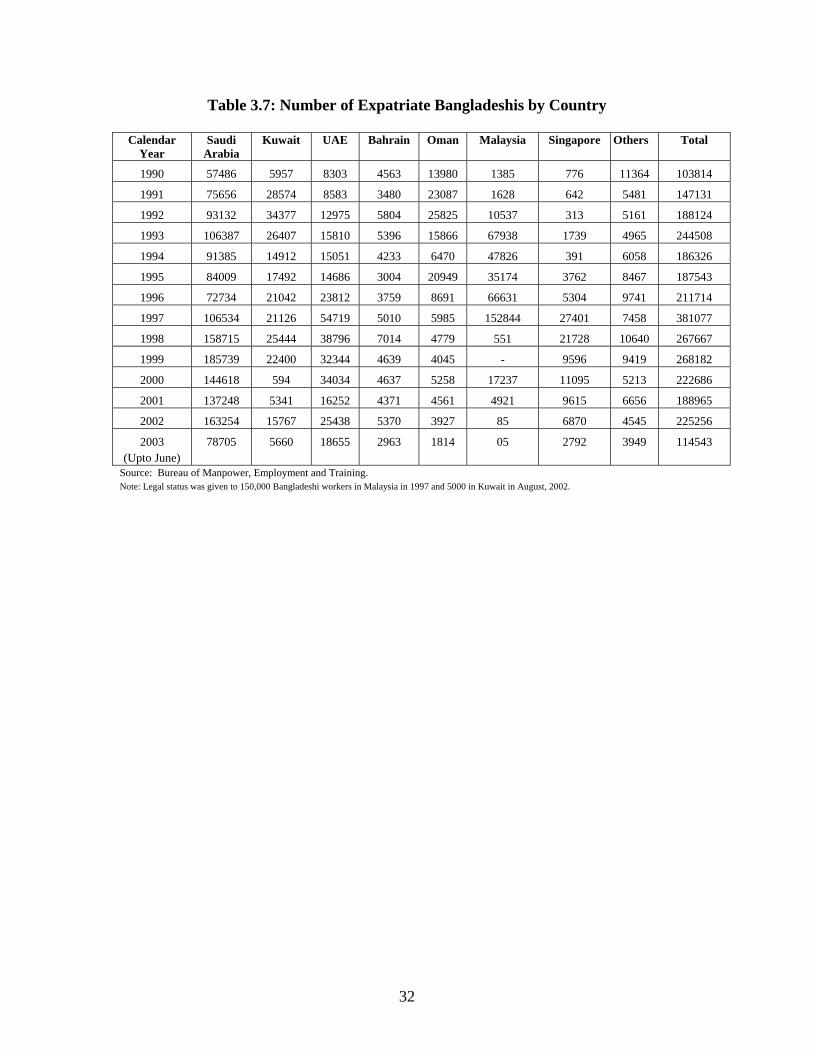
Table 3.7: Number of Expatriate Bangladeshis by Country
Calendar Year
Saudi Arabia
Kuwait UAE Bahrain Oman Malaysia Singapore Others Total
1990 57486 5957 8303 4563 13980 1385 776 11364 103814
1991 75656 28574 8583 3480 23087 1628 642 5481 147131
1992 93132 34377 12975 5804 25825 10537 313 5161 188124
1993 106387 26407 15810 5396 15866 67938 1739 4965 244508
1994 91385 14912 15051 4233 6470 47826 391 6058 186326
1995 84009 17492 14686 3004 20949 35174 3762 8467 187543
1996 72734 21042 23812 3759 8691 66631 5304 9741 211714
1997 106534 21126 54719 5010 5985 152844 27401 7458 381077
1998 158715 25444 38796 7014 4779 551 21728 10640 267667
1999 185739 22400 32344 4639 4045 - 9596 9419 268182
2000 144618 594 34034 4637 5258 17237 11095 5213 222686
2001 137248 5341 16252 4371 4561 4921 9615 6656 188965
2002 163254 15767 25438 5370 3927 85 6870 4545 225256
2003 (Upto June)
78705 5660 18655 2963 1814 05 2792 3949 114543
Source: Bureau of Manpower, Employment and Training. Note: Legal status was given to 150,000 Bangladeshi workers in Malaysia in 1997 and 5000 in Kuwait in August, 2002.
32
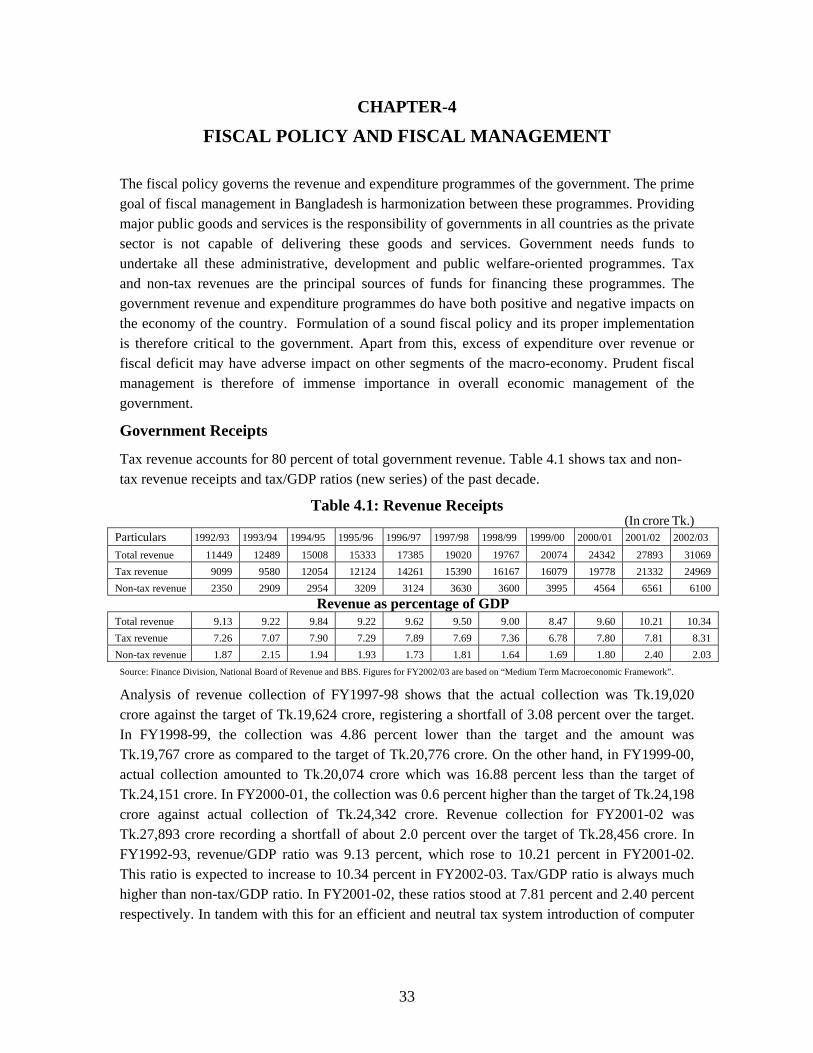
CHAPTER-4
FISCAL POLICY AND FISCAL MANAGEMENT
The fiscal policy governs the revenue and expenditure programmes of the government. The prime goal of fiscal management in Bangladesh is harmonization between these programmes. Providing major public goods and services is the responsibility of governments in all countries as the private sector is not capable of delivering these goods and services. Government needs funds to undertake all these administrative, development and public welfare-oriented programmes. Tax and non-tax revenues are the principal sources of funds for financing these programmes. The government revenue and expenditure programmes do have both positive and negative impacts on the economy of the country. Formulation of a sound fiscal policy and its proper implementation is therefore critical to the government. Apart from this, excess of expenditure over revenue or fiscal deficit may have adverse impact on other segments of the macro-economy. Prudent fiscal management is therefore of immense importance in overall economic management of the government.
Government Receipts
Tax revenue accounts for 80 percent of total government revenue. Table 4.1 shows tax and non-tax revenue receipts and tax/GDP ratios (new series) of the past decade.
Table 4.1: Revenue Receipts (In crore Tk.)
Particulars 1992/93 1993/94 1994/95 1995/96 1996/97 1997/98 1998/99 1999/00 2000/01 2001/02 2002/03
Total revenue 11449 12489 15008 15333 17385 19020 19767 20074 24342 27893 31069 Tax revenue 9099 9580 12054 12124 14261 15390 16167 16079 19778 21332 24969 Non-tax revenue 2350 2909 2954 3209 3124 3630 3600 3995 4564 6561 6100
Revenue as percentage of GDP Total revenue 9.13 9.22 9.84 9.22 9.62 9.50 9.00 8.47 9.60 10.21 10.34 Tax revenue 7.26 7.07 7.90 7.29 7.89 7.69 7.36 6.78 7.80 7.81 8.31 Non-tax revenue 1.87 2.15 1.94 1.93 1.73 1.81 1.64 1.69 1.80 2.40 2.03
Source: Finance Division, National Board of Revenue and BBS. Figures for FY2002/03 are based on “Medium Term Macroeconomic Framework”.
Analysis of revenue collection of FY1997-98 shows that the actual collection was Tk.19,020 crore against the target of Tk.19,624 crore, registering a shortfall of 3.08 percent over the target. In FY1998-99, the collection was 4.86 percent lower than the target and the amount was Tk.19,767 crore as compared to the target of Tk.20,776 crore. On the other hand, in FY1999-00, actual collection amounted to Tk.20,074 crore which was 16.88 percent less than the target of Tk.24,151 crore. In FY2000-01, the collection was 0.6 percent higher than the target of Tk.24,198 crore against actual collection of Tk.24,342 crore. Revenue collection for FY2001-02 was Tk.27,893 crore recording a shortfall of about 2.0 percent over the target of Tk.28,456 crore. In FY1992-93, revenue/GDP ratio was 9.13 percent, which rose to 10.21 percent in FY2001-02. This ratio is expected to increase to 10.34 percent in FY2002-03. Tax/GDP ratio is always much higher than non-tax/GDP ratio. In FY2001-02, these ratios stood at 7.81 percent and 2.40 percent respectively. In tandem with this for an efficient and neutral tax system introduction of computer
33
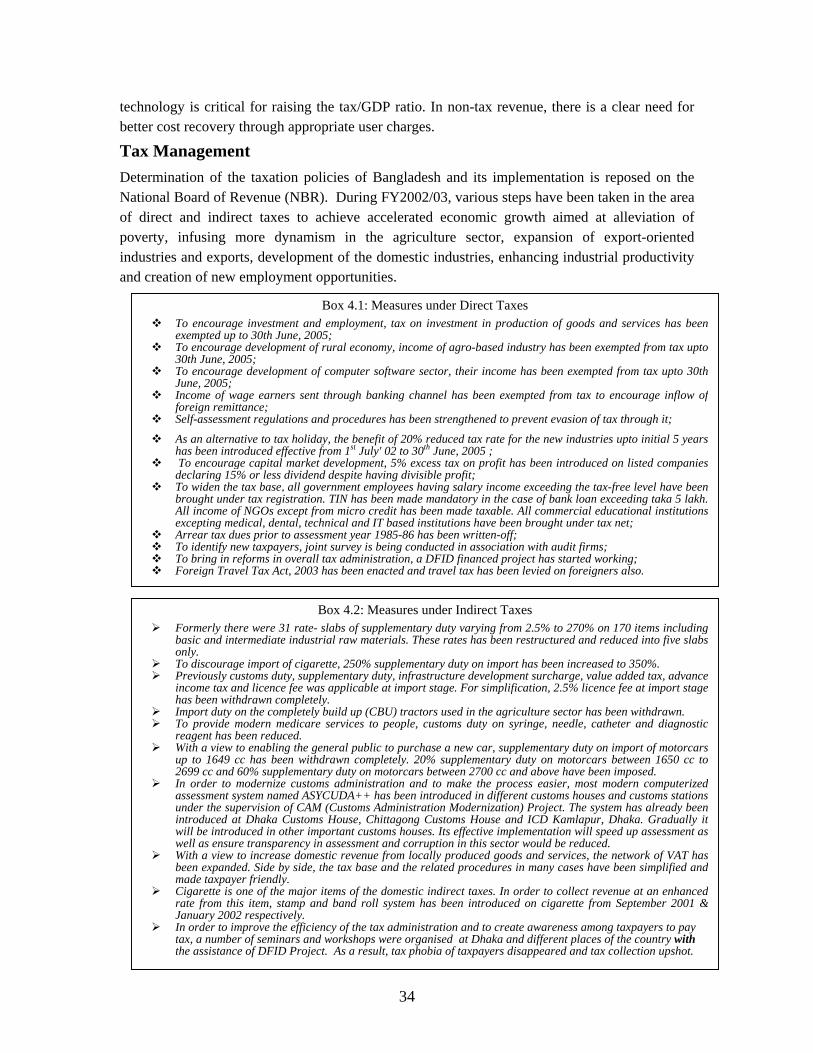
technology is critical for raising the tax/GDP ratio. In non-tax revenue, there is a clear need for better cost recovery through appropriate user charges.
Tax Management Determination of the taxation policies of Bangladesh and its implementation is reposed on the National Board of Revenue (NBR). During FY2002/03, various steps have been taken in the area of direct and indirect taxes to achieve accelerated economic growth aimed at alleviation of poverty, infusing more dynamism in the agriculture sector, expansion of export-oriented industries and exports, development of the domestic industries, enhancing industrial productivity and creation of new employment opportunities.
Box 4.1: Measures under Direct Taxes To encourage investment and employment, tax on investment in production of goods and services has been
exempted up to 30th June, 2005; To encourage development of rural economy, income of agro-based industry has been exempted from tax upto
30th June, 2005; To encourage development of computer software sector, their income has been exempted from tax upto 30th
June, 2005; Income of wage earners sent through banking channel has been exempted from tax to encourage inflow of
foreign remittance; Self-assessment regulations and procedures has been strengthened to prevent evasion of tax through it;
As an alternative to tax holiday, the benefit of 20% reduced tax rate for the new industries upto initial 5 yearshas been introduced effective from 1st July' 02 to 30th June, 2005 ;
To encourage capital market development, 5% excess tax on profit has been introduced on listed companiesdeclaring 15% or less dividend despite having divisible profit;
To widen the tax base, all government employees having salary income exceeding the tax-free level have beenbrought under tax registration. TIN has been made mandatory in the case of bank loan exceeding taka 5 lakh.All income of NGOs except from micro credit has been made taxable. All commercial educational institutionsexcepting medical, dental, technical and IT based institutions have been brought under tax net;
Arrear tax dues prior to assessment year 1985-86 has been written-off; To identify new taxpayers, joint survey is being conducted in association with audit firms; To bring in reforms in overall tax administration, a DFID financed project has started working; Foreign Travel Tax Act, 2003 has been enacted and travel tax has been levied on foreigners also.
Box 4.2: Measures under Indirect Taxes Formerly there were 31 rate- slabs of supplementary duty varying from 2.5% to 270% on 170 items including
basic and intermediate industrial raw materials. These rates has been restructured and reduced into five slabsonly.
To discourage import of cigarette, 250% supplementary duty on import has been increased to 350%. Previously customs duty, supplementary duty, infrastructure development surcharge, value added tax, advance
income tax and licence fee was applicable at import stage. For simplification, 2.5% licence fee at import stagehas been withdrawn completely.
Import duty on the completely build up (CBU) tractors used in the agriculture sector has been withdrawn. To provide modern medicare services to people, customs duty on syringe, needle, catheter and diagnostic
reagent has been reduced. With a view to enabling the general public to purchase a new car, supplementary duty on import of motorcars
up to 1649 cc has been withdrawn completely. 20% supplementary duty on motorcars between 1650 cc to2699 cc and 60% supplementary duty on motorcars between 2700 cc and above have been imposed.
In order to modernize customs administration and to make the process easier, most modern computerizedassessment system named ASYCUDA++ has been introduced in different customs houses and customs stationsunder the supervision of CAM (Customs Administration Modernization) Project. The system has already beenintroduced at Dhaka Customs House, Chittagong Customs House and ICD Kamlapur, Dhaka. Gradually itwill be introduced in other important customs houses. Its effective implementation will speed up assessment aswell as ensure transparency in assessment and corruption in this sector would be reduced.
With a view to increase domestic revenue from locally produced goods and services, the network of VAT hasbeen expanded. Side by side, the tax base and the related procedures in many cases have been simplified andmade taxpayer friendly.
Cigarette is one of the major items of the domestic indirect taxes. In order to collect revenue at an enhancedrate from this item, stamp and band roll system has been introduced on cigarette from September 2001 &January 2002 respectively.
In order to improve the efficiency of the tax administration and to create awareness among taxpayers to pay tax, a number of seminars and workshops were organised at Dhaka and different places of the country with the assistance of DFID Project. As a result, tax phobia of taxpayers disappeared and tax collection upshot.
34
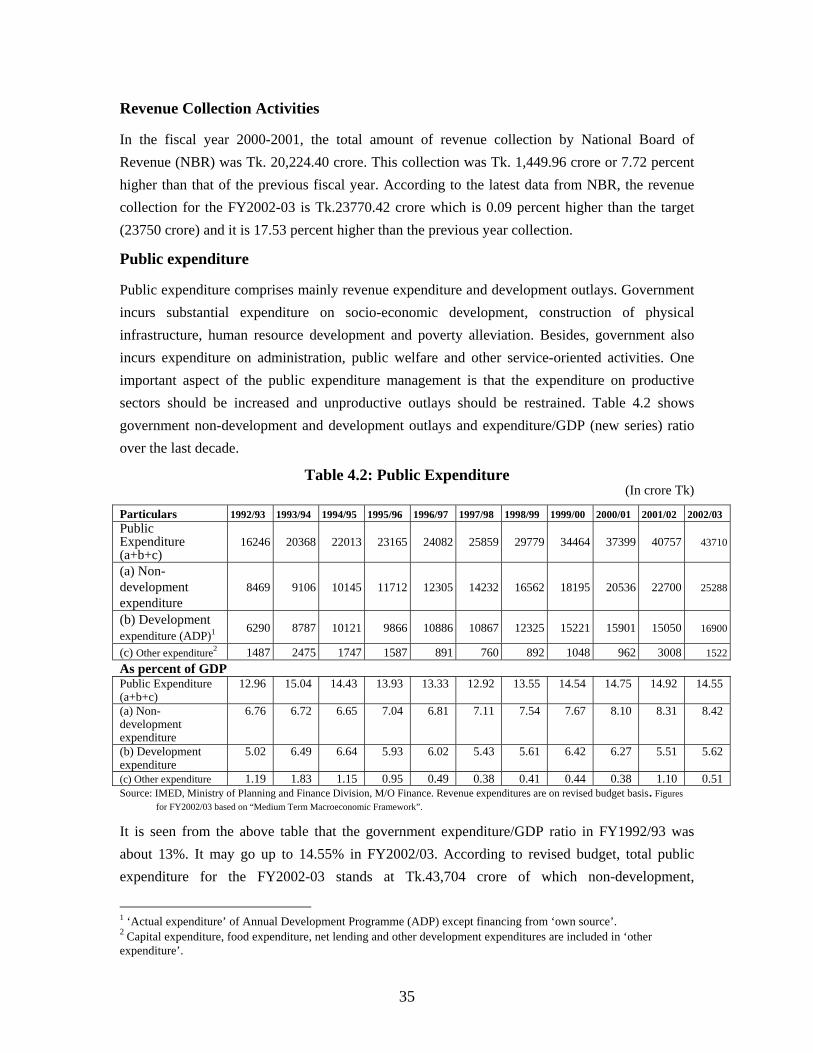
Revenue Collection Activities
In the fiscal year 2000-2001, the total amount of revenue collection by National Board of Revenue (NBR) was Tk. 20,224.40 crore. This collection was Tk. 1,449.96 crore or 7.72 percent higher than that of the previous fiscal year. According to the latest data from NBR, the revenue collection for the FY2002-03 is Tk.23770.42 crore which is 0.09 percent higher than the target (23750 crore) and it is 17.53 percent higher than the previous year collection.
Public expenditure
Public expenditure comprises mainly revenue expenditure and development outlays. Government incurs substantial expenditure on socio-economic development, construction of physical infrastructure, human resource development and poverty alleviation. Besides, government also incurs expenditure on administration, public welfare and other service-oriented activities. One important aspect of the public expenditure management is that the expenditure on productive sectors should be increased and unproductive outlays should be restrained. Table 4.2 shows government non-development and development outlays and expenditure/GDP (new series) ratio over the last decade.
Table 4.2: Public Expenditure (In crore Tk)
Source: IMED, Ministry of Planning and Finance Division, M/O Finance. Revenue expenditures are on revised budget basis. Figures for FY2002/03 based on “Medium Term Macroeconomic Framework”.
Particulars 1992/93 1993/94 1994/95 1995/96 1996/97 1997/98 1998/99 1999/00 2000/01 2001/02 2002/03 Public Expenditure (a+b+c)
16246 20368 22013 23165 24082 25859 29779 34464 37399 40757 43710
(a) Non-development expenditure
8469 9106 10145 11712 12305 14232 16562 18195 20536 22700 25288
(b) Development expenditure (ADP)1 6290 8787 10121 9866 10886 10867 12325 15221 15901 15050 16900
(c) Other expenditure2 1487 2475 1747 1587 891 760 892 1048 962 3008 1522As percent of GDP Public Expenditure (a+b+c)
12.96 15.04 14.43 13.93 13.33 12.92 13.55 14.54 14.75 14.92 14.55
(a) Non-development expenditure
6.76 6.72 6.65 7.04 6.81 7.11 7.54 7.67 8.10 8.31 8.42
(b) Development expenditure
5.02 6.49 6.64 5.93 6.02 5.43 5.61 6.42 6.27 5.51 5.62
(c) Other expenditure 1.19 1.83 1.15 0.95 0.49 0.38 0.41 0.44 0.38 1.10 0.51
It is seen from the above table that the government expenditure/GDP ratio in FY1992/93 was about 13%. It may go up to 14.55% in FY2002/03. According to revised budget, total public expenditure for the FY2002-03 stands at Tk.43,704 crore of which non-development,
1 ‘Actual expenditure’ of Annual Development Programme (ADP) except financing from ‘own source’. 2 Capital expenditure, food expenditure, net lending and other development expenditures are included in ‘other expenditure’.
35
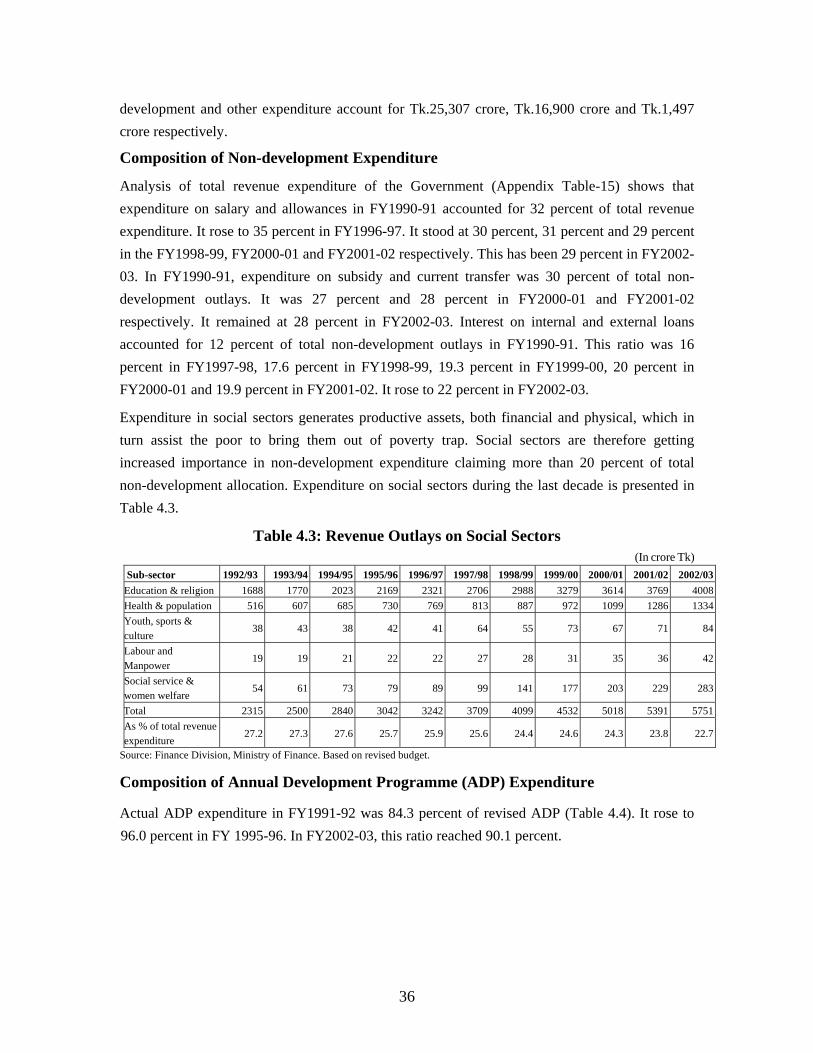
development and other expenditure account for Tk.25,307 crore, Tk.16,900 crore and Tk.1,497 crore respectively.
Composition of Non-development Expenditure Analysis of total revenue expenditure of the Government (Appendix Table-15) shows that expenditure on salary and allowances in FY1990-91 accounted for 32 percent of total revenue expenditure. It rose to 35 percent in FY1996-97. It stood at 30 percent, 31 percent and 29 percent in the FY1998-99, FY2000-01 and FY2001-02 respectively. This has been 29 percent in FY2002-03. In FY1990-91, expenditure on subsidy and current transfer was 30 percent of total non-development outlays. It was 27 percent and 28 percent in FY2000-01 and FY2001-02 respectively. It remained at 28 percent in FY2002-03. Interest on internal and external loans accounted for 12 percent of total non-development outlays in FY1990-91. This ratio was 16 percent in FY1997-98, 17.6 percent in FY1998-99, 19.3 percent in FY1999-00, 20 percent in FY2000-01 and 19.9 percent in FY2001-02. It rose to 22 percent in FY2002-03.
Expenditure in social sectors generates productive assets, both financial and physical, which in turn assist the poor to bring them out of poverty trap. Social sectors are therefore getting increased importance in non-development expenditure claiming more than 20 percent of total non-development allocation. Expenditure on social sectors during the last decade is presented in Table 4.3.
Table 4.3: Revenue Outlays on Social Sectors (In crore Tk)
Sub-sector 1992/93 1993/94 1994/95 1995/96 1996/97 1997/98 1998/99 1999/00 2000/01 2001/02 2002/03Education & religion 1688 1770 2023 2169 2321 2706 2988 3279 3614 3769 4008Health & population 516 607 685 730 769 813 887 972 1099 1286 1334Youth, sports & culture
38 43 38 42 41 64 55 73 67 71 84
Labour and Manpower
19 19 21 22 22 27 28 31 35 36 42
Social service & women welfare
54 61 73 79 89 99 141 177 203 229 283
Total 2315 2500 2840 3042 3242 3709 4099 4532 5018 5391 5751As % of total revenue expenditure
27.2 27.3 27.6 25.7 25.9 25.6 24.4 24.6 24.3 23.8 22.7
Source: Finance Division, Ministry of Finance. Based on revised budget.
Composition of Annual Development Programme (ADP) Expenditure
Actual ADP expenditure in FY1991-92 was 84.3 percent of revised ADP (Table 4.4). It rose to 96.0 percent in FY 1995-96. In FY2002-03, this ratio reached 90.1 percent.
36
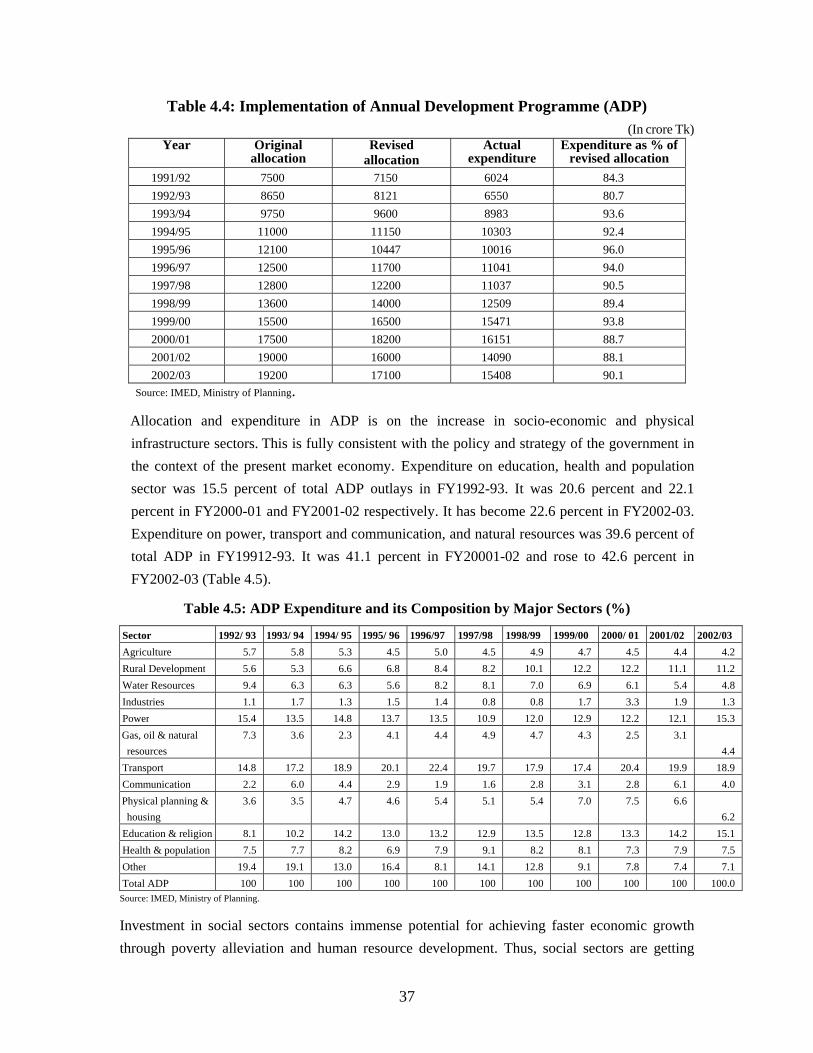
Table 4.4: Implementation of Annual Development Programme (ADP) (In crore Tk)
Year Original allocation
Revised allocation
Actual expenditure
Expenditure as % of revised allocation
1991/92 7500 7150 6024 84.3 1992/93 8650 8121 6550 80.7 1993/94 9750 9600 8983 93.6 1994/95 11000 11150 10303 92.4 1995/96 12100 10447 10016 96.0 1996/97 12500 11700 11041 94.0 1997/98 12800 12200 11037 90.5 1998/99 13600 14000 12509 89.4 1999/00 15500 16500 15471 93.8 2000/01 17500 18200 16151 88.7 2001/02 19000 16000 14090 88.1 2002/03 19200 17100 15408 90.1
Source: IMED, Ministry of Planning.
Allocation and expenditure in ADP is on the increase in socio-economic and physical infrastructure sectors. This is fully consistent with the policy and strategy of the government in the context of the present market economy. Expenditure on education, health and population sector was 15.5 percent of total ADP outlays in FY1992-93. It was 20.6 percent and 22.1 percent in FY2000-01 and FY2001-02 respectively. It has become 22.6 percent in FY2002-03. Expenditure on power, transport and communication, and natural resources was 39.6 percent of total ADP in FY19912-93. It was 41.1 percent in FY20001-02 and rose to 42.6 percent in FY2002-03 (Table 4.5).
Table 4.5: ADP Expenditure and its Composition by Major Sectors (%)
Sector 1992/ 93 1993/ 94 1994/ 95 1995/ 96 1996/97 1997/98 1998/99 1999/00 2000/ 01 2001/02 2002/03 Agriculture 5.7 5.8 5.3 4.5 5.0 4.5 4.9 4.7 4.5 4.4 4.2 Rural Development 5.6 5.3 6.6 6.8 8.4 8.2 10.1 12.2 12.2 11.1 11.2 Water Resources 9.4 6.3 6.3 5.6 8.2 8.1 7.0 6.9 6.1 5.4 4.8 Industries 1.1 1.7 1.3 1.5 1.4 0.8 0.8 1.7 3.3 1.9 1.3 Power 15.4 13.5 14.8 13.7 13.5 10.9 12.0 12.9 12.2 12.1 15.3 Gas, oil & natural resources
7.3 3.6 2.3 4.1 4.4 4.9 4.7 4.3 2.5 3.1 4.4
Transport 14.8 17.2 18.9 20.1 22.4 19.7 17.9 17.4 20.4 19.9 18.9 Communication 2.2 6.0 4.4 2.9 1.9 1.6 2.8 3.1 2.8 6.1 4.0 Physical planning & housing
3.6 3.5 4.7 4.6 5.4 5.1 5.4 7.0 7.5 6.6 6.2
Education & religion 8.1 10.2 14.2 13.0 13.2 12.9 13.5 12.8 13.3 14.2 15.1 Health & population 7.5 7.7 8.2 6.9 7.9 9.1 8.2 8.1 7.3 7.9 7.5 Other 19.4 19.1 13.0 16.4 8.1 14.1 12.8 9.1 7.8 7.4 7.1 Total ADP 100 100 100 100 100 100 100 100 100 100 100.0
Source: IMED, Ministry of Planning.
Investment in social sectors contains immense potential for achieving faster economic growth through poverty alleviation and human resource development. Thus, social sectors are getting
37
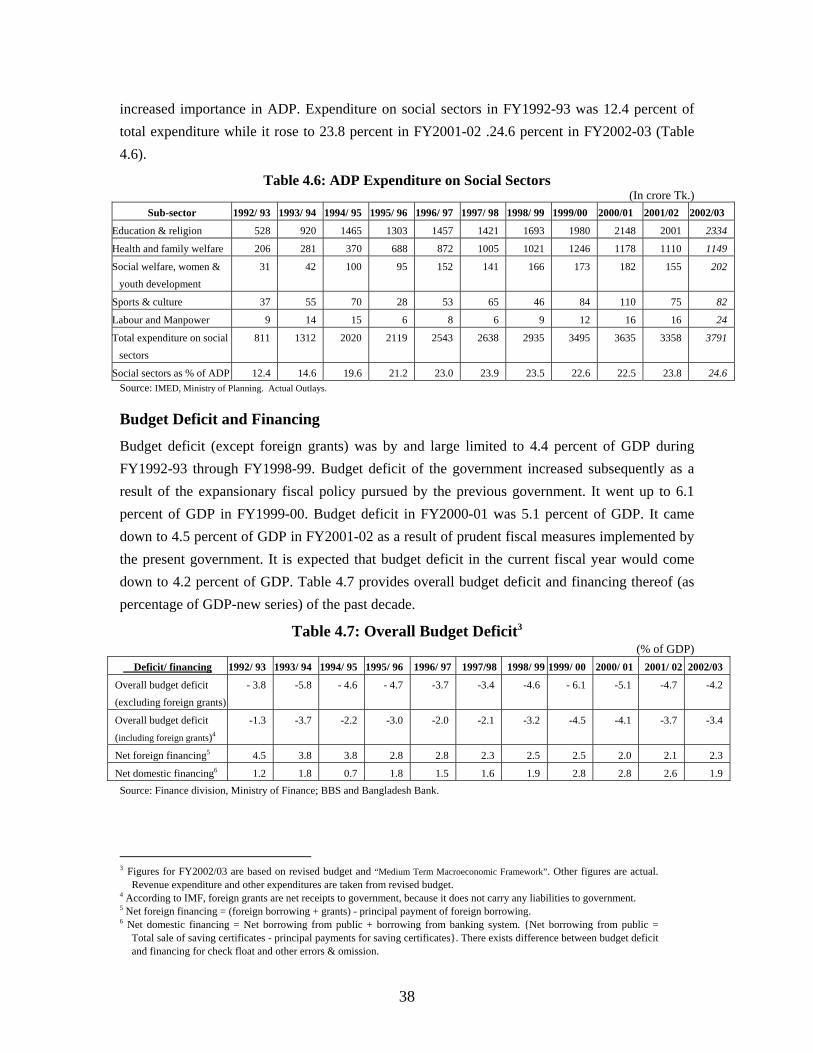
increased importance in ADP. Expenditure on social sectors in FY1992-93 was 12.4 percent of total expenditure while it rose to 23.8 percent in FY2001-02 .24.6 percent in FY2002-03 (Table 4.6).
Table 4.6: ADP Expenditure on Social Sectors (In crore Tk.)
Sub-sector 1992/ 93 1993/ 94 1994/ 95 1995/ 96 1996/ 97 1997/ 98 1998/ 99 1999/00 2000/01 2001/02 2002/03
Education & religion 528 920 1465 1303 1457 1421 1693 1980 2148 2001 2334
Health and family welfare 206 281 370 688 872 1005 1021 1246 1178 1110 1149
Social welfare, women & youth development
31 42 100 95 152 141 166 173 182 155 202
Sports & culture 37 55 70 28 53 65 46 84 110 75 82
Labour and Manpower 9 14 15 6 8 6 9 12 16 16 24
Total expenditure on social sectors
811 1312 2020 2119 2543 2638 2935 3495 3635 3358 3791
Social sectors as % of ADP 12.4 14.6 19.6 21.2 23.0 23.9 23.5 22.6 22.5 23.8 24.6 Source: IMED, Ministry of Planning. Actual Outlays.
Budget Deficit and Financing
Budget deficit (except foreign grants) was by and large limited to 4.4 percent of GDP during FY1992-93 through FY1998-99. Budget deficit of the government increased subsequently as a result of the expansionary fiscal policy pursued by the previous government. It went up to 6.1 percent of GDP in FY1999-00. Budget deficit in FY2000-01 was 5.1 percent of GDP. It came down to 4.5 percent of GDP in FY2001-02 as a result of prudent fiscal measures implemented by the present government. It is expected that budget deficit in the current fiscal year would come down to 4.2 percent of GDP. Table 4.7 provides overall budget deficit and financing thereof (as percentage of GDP-new series) of the past decade.
Table 4.7: Overall Budget Deficit3
(% of GDP) Deficit/ financing 1992/ 93 1993/ 94 1994/ 95 1995/ 96 1996/ 97 1997/98 1998/ 99 1999/ 00 2000/ 01 2001/ 02 2002/03
Overall budget deficit (excluding foreign grants)
- 3.8 -5.8 - 4.6 - 4.7 -3.7 -3.4 -4.6 - 6.1 -5.1 -4.7 -4.2
Overall budget deficit (including foreign grants)4
-1.3 -3.7 -2.2 -3.0 -2.0 -2.1 -3.2 -4.5 -4.1 -3.7 -3.4
Net foreign financing5 4.5 3.8 3.8 2.8 2.8 2.3 2.5 2.5 2.0 2.1 2.3
Net domestic financing6 1.2 1.8 0.7 1.8 1.5 1.6 1.9 2.8 2.8 2.6 1.9 Source: Finance division, Ministry of Finance; BBS and Bangladesh Bank.
3 Figures for FY2002/03 are based on revised budget and “Medium Term Macroeconomic Framework”. Other figures are actual.
Revenue expenditure and other expenditures are taken from revised budget. 4 According to IMF, foreign grants are net receipts to government, because it does not carry any liabilities to government. 5 Net foreign financing = (foreign borrowing + grants) - principal payment of foreign borrowing. 6 Net domestic financing = Net borrowing from public + borrowing from banking system. {Net borrowing from public =
Total sale of saving certificates - principal payments for saving certificates}. There exists difference between budget deficit and financing for check float and other errors & omission.
38
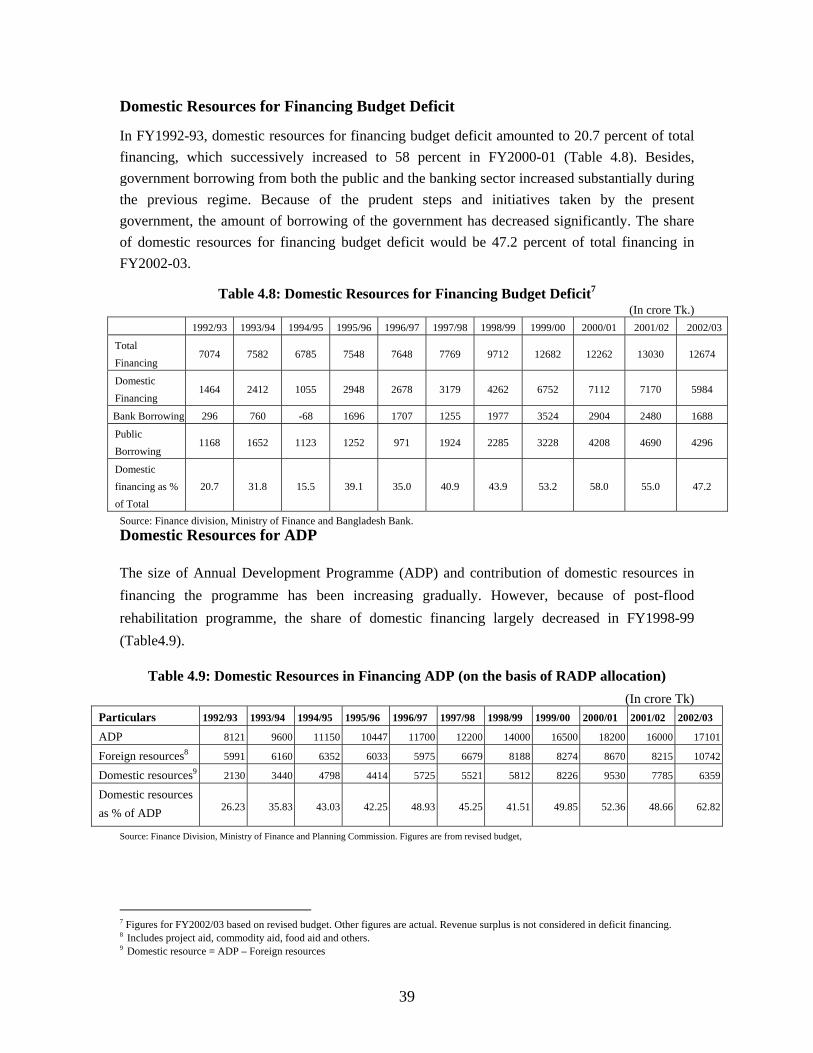
Domestic Resources for Financing Budget Deficit
In FY1992-93, domestic resources for financing budget deficit amounted to 20.7 percent of total financing, which successively increased to 58 percent in FY2000-01 (Table 4.8). Besides, government borrowing from both the public and the banking sector increased substantially during the previous regime. Because of the prudent steps and initiatives taken by the present government, the amount of borrowing of the government has decreased significantly. The share of domestic resources for financing budget deficit would be 47.2 percent of total financing in FY2002-03.
Table 4.8: Domestic Resources for Financing Budget Deficit7
(In crore Tk.) 1992/93 1993/94 1994/95 1995/96 1996/97 1997/98 1998/99 1999/00 2000/01 2001/02 2002/03
Total Financing
7074 7582 6785 7548 7648 7769 9712 12682 12262 13030 12674
Domestic Financing
1464 2412 1055 2948 2678 3179 4262 6752 7112 7170 5984
Bank Borrowing 296 760 -68 1696 1707 1255 1977 3524 2904 2480 1688
Public Borrowing
1168 1652 1123 1252 971 1924 2285 3228 4208 4690 4296
Domestic financing as % of Total
20.7 31.8 15.5 39.1 35.0 40.9 43.9 53.2 58.0 55.0 47.2
Source: Finance division, Ministry of Finance and Bangladesh Bank. Domestic Resources for ADP
The size of Annual Development Programme (ADP) and contribution of domestic resources in financing the programme has been increasing gradually. However, because of post-flood rehabilitation programme, the share of domestic financing largely decreased in FY1998-99 (Table4.9).
Table 4.9: Domestic Resources in Financing ADP (on the basis of RADP allocation) (In crore Tk)
Particulars 1992/93 1993/94 1994/95 1995/96 1996/97 1997/98 1998/99 1999/00 2000/01 2001/02 2002/03
ADP 8121 9600 11150 10447 11700 12200 14000 16500 18200 16000 17101
Foreign resources8 5991 6160 6352 6033 5975 6679 8188 8274 8670 8215 10742
Domestic resources9 2130 3440 4798 4414 5725 5521 5812 8226 9530 7785 6359
Domestic resources as % of ADP 26.23 35.83 43.03 42.25 48.93 45.25 41.51 49.85 52.36 48.66 62.82
Source: Finance Division, Ministry of Finance and Planning Commission. Figures are from revised budget, 7 Figures for FY2002/03 based on revised budget. Other figures are actual. Revenue surplus is not considered in deficit financing. 8 Includes project aid, commodity aid, food aid and others. 9 Domestic resource = ADP – Foreign resources
39
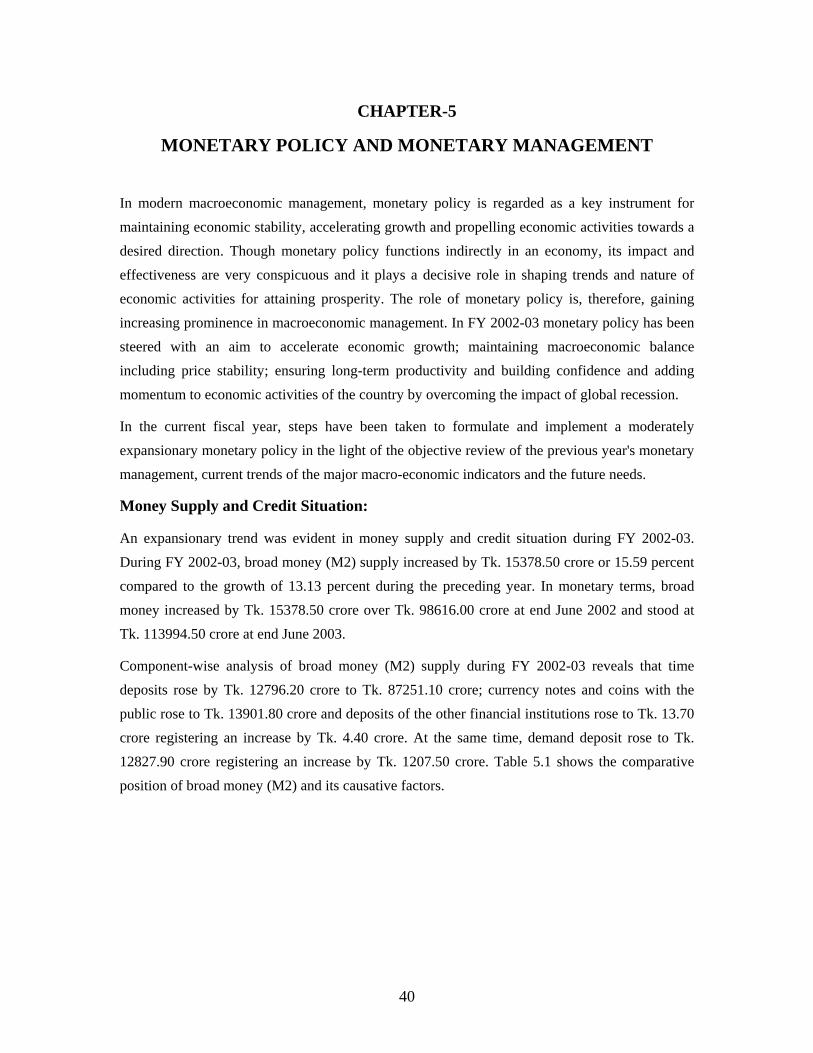
CHAPTER-5
MONETARY POLICY AND MONETARY MANAGEMENT
In modern macroeconomic management, monetary policy is regarded as a key instrument for maintaining economic stability, accelerating growth and propelling economic activities towards a desired direction. Though monetary policy functions indirectly in an economy, its impact and effectiveness are very conspicuous and it plays a decisive role in shaping trends and nature of economic activities for attaining prosperity. The role of monetary policy is, therefore, gaining increasing prominence in macroeconomic management. In FY 2002-03 monetary policy has been steered with an aim to accelerate economic growth; maintaining macroeconomic balance including price stability; ensuring long-term productivity and building confidence and adding momentum to economic activities of the country by overcoming the impact of global recession.
In the current fiscal year, steps have been taken to formulate and implement a moderately expansionary monetary policy in the light of the objective review of the previous year's monetary management, current trends of the major macro-economic indicators and the future needs.
Money Supply and Credit Situation:
An expansionary trend was evident in money supply and credit situation during FY 2002-03. During FY 2002-03, broad money (M2) supply increased by Tk. 15378.50 crore or 15.59 percent compared to the growth of 13.13 percent during the preceding year. In monetary terms, broad money increased by Tk. 15378.50 crore over Tk. 98616.00 crore at end June 2002 and stood at Tk. 113994.50 crore at end June 2003.
Component-wise analysis of broad money (M2) supply during FY 2002-03 reveals that time deposits rose by Tk. 12796.20 crore to Tk. 87251.10 crore; currency notes and coins with the public rose to Tk. 13901.80 crore and deposits of the other financial institutions rose to Tk. 13.70 crore registering an increase by Tk. 4.40 crore. At the same time, demand deposit rose to Tk. 12827.90 crore registering an increase by Tk. 1207.50 crore. Table 5.1 shows the comparative position of broad money (M2) and its causative factors.
40
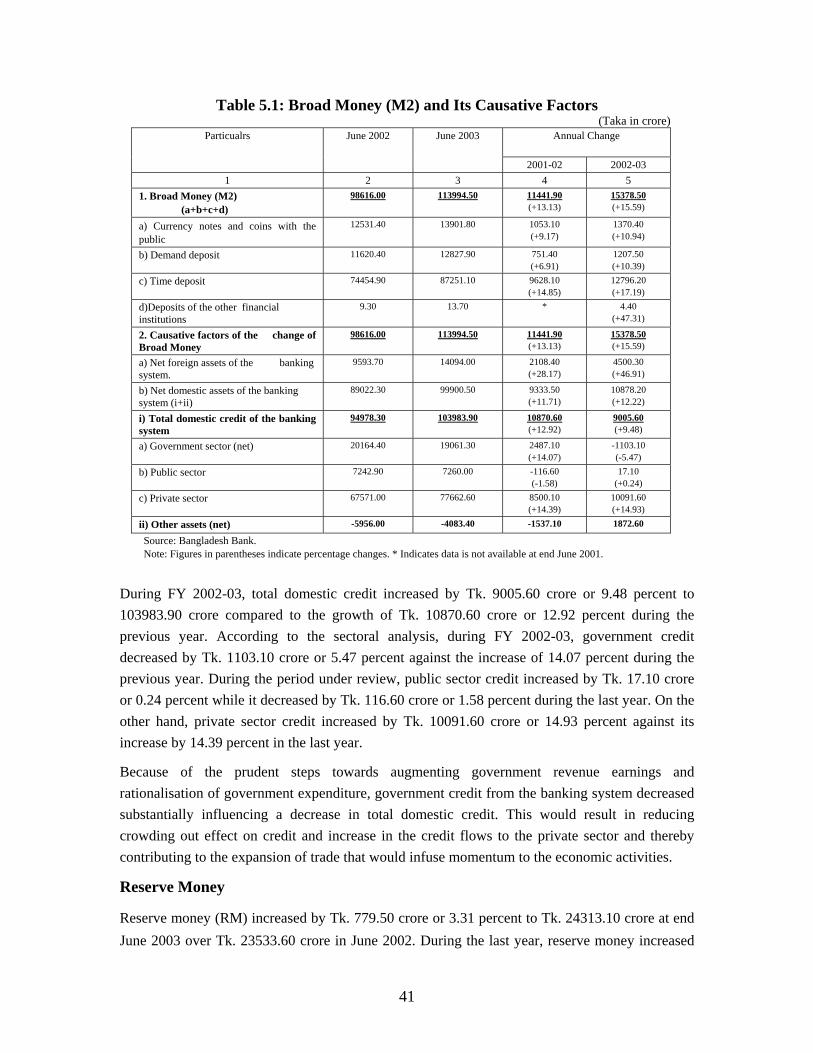
Table 5.1: Broad Money (M2) and Its Causative Factors (Taka in crore)
June 2003 Annual Change
Particualrs June 2002
2001-02 2002-03 1 2 3 4 5
1. Broad Money (M2) (a+b+c+d)
98616.00 113994.50 11441.90 (+13.13)
15378.50 (+15.59)
a) Currency notes and coins with the public
12531.40 13901.80 1053.10 (+9.17)
1370.40 (+10.94)
b) Demand deposit 11620.40 12827.90 751.40 (+6.91)
1207.50 (+10.39)
c) Time deposit 74454.90 87251.10 9628.10 (+14.85)
12796.20 (+17.19)
d)Deposits of the other financial institutions
9.30 13.70 * 4.40 (+47.31)
2. Causative factors of the change of Broad Money
98616.00 113994.50 11441.90 (+13.13)
15378.50 (+15.59)
a) Net foreign assets of the banking system.
9593.70 14094.00 2108.40 (+28.17)
4500.30 (+46.91)
b) Net domestic assets of the banking system (i+ii)
89022.30 99900.50 9333.50 (+11.71)
10878.20 (+12.22)
i) Total domestic credit of the banking system
94978.30 103983.90 10870.60 (+12.92)
9005.60 (+9.48)
a) Government sector (net) 20164.40 19061.30 2487.10 (+14.07)
-1103.10 (-5.47)
b) Public sector 7242.90 7260.00 -116.60 (-1.58)
17.10 (+0.24)
c) Private sector 67571.00 77662.60 8500.10 (+14.39)
10091.60 (+14.93)
ii) Other assets (net) -5956.00 -4083.40 -1537.10 1872.60
Source: Bangladesh Bank. Note: Figures in parentheses indicate percentage changes. * Indicates data is not available at end June 2001.
During FY 2002-03, total domestic credit increased by Tk. 9005.60 crore or 9.48 percent to 103983.90 crore compared to the growth of Tk. 10870.60 crore or 12.92 percent during the previous year. According to the sectoral analysis, during FY 2002-03, government credit decreased by Tk. 1103.10 crore or 5.47 percent against the increase of 14.07 percent during the previous year. During the period under review, public sector credit increased by Tk. 17.10 crore or 0.24 percent while it decreased by Tk. 116.60 crore or 1.58 percent during the last year. On the other hand, private sector credit increased by Tk. 10091.60 crore or 14.93 percent against its increase by 14.39 percent in the last year.
Because of the prudent steps towards augmenting government revenue earnings and rationalisation of government expenditure, government credit from the banking system decreased substantially influencing a decrease in total domestic credit. This would result in reducing crowding out effect on credit and increase in the credit flows to the private sector and thereby contributing to the expansion of trade that would infuse momentum to the economic activities.
Reserve Money
Reserve money (RM) increased by Tk. 779.50 crore or 3.31 percent to Tk. 24313.10 crore at end June 2003 over Tk. 23533.60 crore in June 2002. During the last year, reserve money increased
41
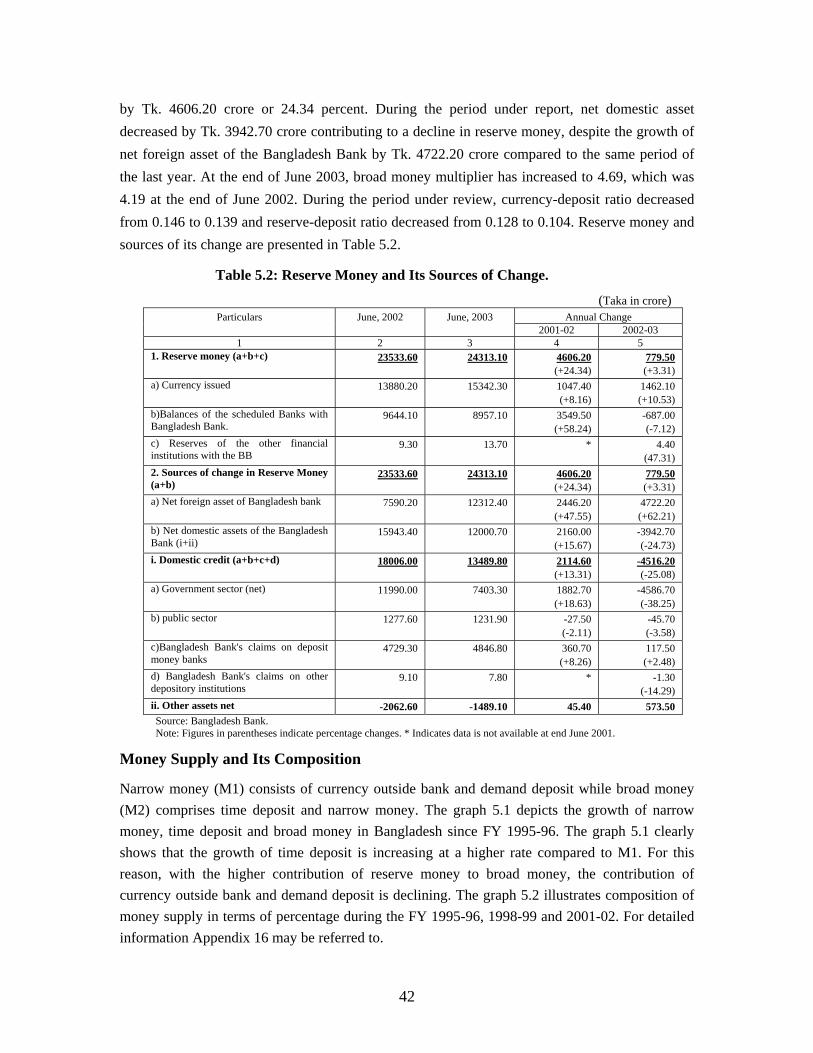
by Tk. 4606.20 crore or 24.34 percent. During the period under report, net domestic asset decreased by Tk. 3942.70 crore contributing to a decline in reserve money, despite the growth of net foreign asset of the Bangladesh Bank by Tk. 4722.20 crore compared to the same period of the last year. At the end of June 2003, broad money multiplier has increased to 4.69, which was 4.19 at the end of June 2002. During the period under review, currency-deposit ratio decreased from 0.146 to 0.139 and reserve-deposit ratio decreased from 0.128 to 0.104. Reserve money and sources of its change are presented in Table 5.2.
Table 5.2: Reserve Money and Its Sources of Change.
(Taka in crore) Annual Change Particulars June, 2002 June, 2003
2001-02 2002-03 1 2 3 4 5
1. Reserve money (a+b+c) 23533.60 24313.10 4606.20 (+24.34)
779.50 (+3.31)
a) Currency issued 13880.20 15342.30 1047.40 (+8.16)
1462.10 (+10.53)
b)Balances of the scheduled Banks with Bangladesh Bank.
9644.10 8957.10 3549.50 (+58.24)
-687.00 (-7.12)
c) Reserves of the other financial institutions with the BB
9.30 13.70 * 4.40 (47.31)
2. Sources of change in Reserve Money (a+b)
23533.60 24313.10 4606.20 (+24.34)
779.50 (+3.31)
a) Net foreign asset of Bangladesh bank 7590.20 12312.40 2446.20 (+47.55)
4722.20 (+62.21)
b) Net domestic assets of the Bangladesh Bank (i+ii)
15943.40 12000.70 2160.00 (+15.67)
-3942.70 (-24.73)
i. Domestic credit (a+b+c+d) 18006.00 13489.80 2114.60 (+13.31)
-4516.20 (-25.08)
a) Government sector (net) 11990.00 7403.30 1882.70 (+18.63)
-4586.70 (-38.25)
b) public sector 1277.60 1231.90 -27.50 (-2.11)
-45.70 (-3.58)
c)Bangladesh Bank's claims on deposit money banks
4729.30 4846.80 360.70 (+8.26)
117.50 (+2.48)
d) Bangladesh Bank's claims on other depository institutions
9.10 7.80 * -1.30 (-14.29)
ii. Other assets net -2062.60 -1489.10 45.40 573.50 Source: Bangladesh Bank. Note: Figures in parentheses indicate percentage changes. * Indicates data is not available at end June 2001.
Money Supply and Its Composition
Narrow money (M1) consists of currency outside bank and demand deposit while broad money (M2) comprises time deposit and narrow money. The graph 5.1 depicts the growth of narrow money, time deposit and broad money in Bangladesh since FY 1995-96. The graph 5.1 clearly shows that the growth of time deposit is increasing at a higher rate compared to M1. For this reason, with the higher contribution of reserve money to broad money, the contribution of currency outside bank and demand deposit is declining. The graph 5.2 illustrates composition of money supply in terms of percentage during the FY 1995-96, 1998-99 and 2001-02. For detailed information Appendix 16 may be referred to.
42
Fig 5.1: Trend of the money supply
0,0
5,0
10,0
15,0
20,0
25,0
95-96 96-97 97-98 98-99 99-2000
2000-2001
2001-2002
M1 Time Deposit M2
Fig 5.2: Composition of money supply
0,0
20,0
40,0
60,0
80,0
95-96 98-99 2001-2002
Cur, outside banks, Demand deposit Time deposit
Reform Measures in respect of Monetary, Credit and Banking Policies
The reform measures adopted in FY 2002-03, in monetary, credit and banking policies are stated below:
1. Bangladesh Bank (Amendment) Act 2003, and Bangladesh Bank (Nationalisation) Order (Amendment) Act 2003 have been enacted in current fiscal year.
2. a. The compulsion of taking prior-approval of Bangladesh Bank before granting large loan has been withdrawn by deleting section 27(3) of the Bank Company Act, 1991 through enactment of the Bank Company (Amendment) Act, 2003.
b. Paid-up capital and reserve fund of all banks operating in Bangladesh has been re-fixed at minimum Tk. 100 crore by amending the section 13 of the Bank Company Act, 1991 through enactment of the Bank Company (Amendment) Act, 2003 (Act 11, 2003) and
c. Decision has been taken to allow the banks to declare their dividends subject to the availability of capital and fulfilment of other relevant conditions without having no-objection certificate from Bangladesh Bank.
3. In order to ensure good governance in bank management, to strengthen the bank's financial footing and to regain the confidence of depositors, it has been decided that while appointing the chief executive emphasis should be given on the appointee's experience, competence and financial integrity. Also in this kind of selection the decision of Bangladesh Bank would be final.
4. The banks have to deposit at a rate of 9 percent in place of 8 percent against their risk based assets and this directive has to the executed by 30th June 2003.
5. In order to reduce the risk of providing large loans Bangladesh Bank has introduced a Large Loan Restructuring Scheme (LLRS) for rescheduling and reconstructing large loan. The objectives of the scheme are to involve all banks in loan rescheduling and restructuring and to bring transparency.
6. In supersession of the previous directives on loan rescheduling the following directives have been issued with a view to eliminating impediments in rescheduling and recovering default loan:
43
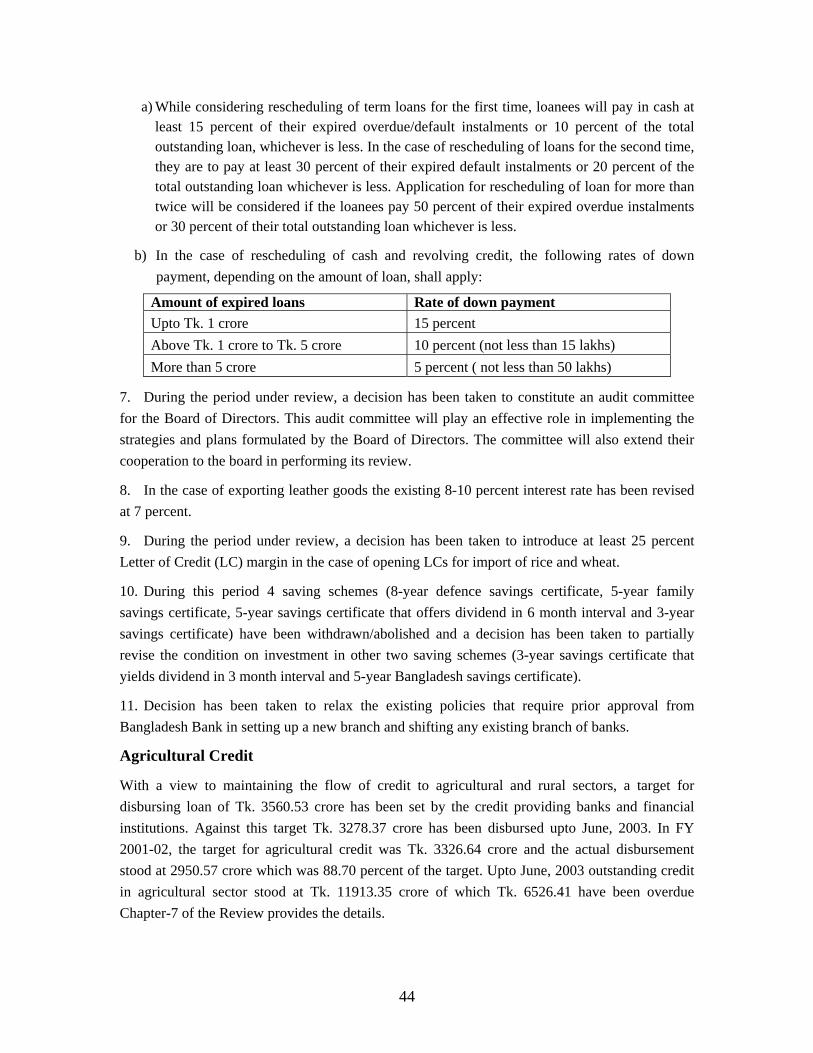
a) While considering rescheduling of term loans for the first time, loanees will pay in cash at least 15 percent of their expired overdue/default instalments or 10 percent of the total outstanding loan, whichever is less. In the case of rescheduling of loans for the second time, they are to pay at least 30 percent of their expired default instalments or 20 percent of the total outstanding loan whichever is less. Application for rescheduling of loan for more than twice will be considered if the loanees pay 50 percent of their expired overdue instalments or 30 percent of their total outstanding loan whichever is less.
b) In the case of rescheduling of cash and revolving credit, the following rates of down payment, depending on the amount of loan, shall apply:
Amount of expired loans Rate of down payment Upto Tk. 1 crore 15 percent Above Tk. 1 crore to Tk. 5 crore 10 percent (not less than 15 lakhs) More than 5 crore 5 percent ( not less than 50 lakhs)
7. During the period under review, a decision has been taken to constitute an audit committee for the Board of Directors. This audit committee will play an effective role in implementing the strategies and plans formulated by the Board of Directors. The committee will also extend their cooperation to the board in performing its review.
8. In the case of exporting leather goods the existing 8-10 percent interest rate has been revised at 7 percent.
9. During the period under review, a decision has been taken to introduce at least 25 percent Letter of Credit (LC) margin in the case of opening LCs for import of rice and wheat.
10. During this period 4 saving schemes (8-year defence savings certificate, 5-year family savings certificate, 5-year savings certificate that offers dividend in 6 month interval and 3-year savings certificate) have been withdrawn/abolished and a decision has been taken to partially revise the condition on investment in other two saving schemes (3-year savings certificate that yields dividend in 3 month interval and 5-year Bangladesh savings certificate).
11. Decision has been taken to relax the existing policies that require prior approval from Bangladesh Bank in setting up a new branch and shifting any existing branch of banks.
Agricultural Credit
With a view to maintaining the flow of credit to agricultural and rural sectors, a target for disbursing loan of Tk. 3560.53 crore has been set by the credit providing banks and financial institutions. Against this target Tk. 3278.37 crore has been disbursed upto June, 2003. In FY 2001-02, the target for agricultural credit was Tk. 3326.64 crore and the actual disbursement stood at 2950.57 crore which was 88.70 percent of the target. Upto June, 2003 outstanding credit in agricultural sector stood at Tk. 11913.35 crore of which Tk. 6526.41 have been overdue Chapter-7 of the Review provides the details.
44
Exchange Rate
Bangladesh has been pursuing a flexible exchange rate policy for more than a decade. With a view to maintaining competitiveness of Bangladesh Taka, exchange rate is adjusted by taking into account the trade-weighted Real Effective Exchange Rate (REER). To enhance export competitiveness of Bangladesh goods in the world market, Taka was devalued by 10.5 percent in FY 2000-01. On January 6, 2002, the exchange rate of Tk. was set in a band 57.40-58.40 by devaluing Taka by 1.55 percent. As a result, at the end of June 2001 and June 2002 Taka/Dollar exchange rate stood at Tk. 57.00 and 57.90 (mid value) respectively. The Government of Bangladesh has introduced floating exchange rate for the first time since 31 May, 2003.
Capital Market Development
Consistent with the gradual adoption of market oriented economic policies by the Government, an active capital market started functioning since the early 1990s. The new wave gained momentum especially after the establishment of Securities and Exchange Commission (SEC) in 1993. In the 1990s the prominent tasks of the capital market were to develop a control structure and to adopt international standard and practice. At the beginning of the new millennium issues like corporate governance, internet trading etc. come into the picture. Investor protection is however, always getting preference.
The capital market reform measures continued in FY 2001-02. An inevitable outcome of these reforms shows remarkable rise in average turnover and share price index during FY 2002-03. In FY 2002-03 a number of steps were taken for the expansion and development of the capital market which includes:
• The Securities and Exchange Commission (SEC) has issued an order for regulation of portfolio investment in the secondary market with a view to protect the interest of the local investors. As per Securities and Exchange Commission (Merchant Banker and Portfolio Manager) Rules, 1996, all transactions of the foreign portfolio investors in the secondary market are henceforth made either through portfolio accounts opened with a portfolio manager registered with a merchant bank or recognised custodial bank.
• A three-year lock-in condition shall work on the shares of foreign investors while investing in any IPO shares issued by public limited companies. A one-year lock-in has also been enforced on foreign investors in the case of private placements.
• The National Parliament has enacted the Central Depository System (CDS) Amendment Bill 2002. The CDS Act was earlier passed in 1999 for 'scrip-less trading' in stocks. The purpose of this transformation is to create confidence among investors in the capital market, abolishing kerb market and eliminating the existence of fake share certificates. The validity of section 23 of the Depository Act expired on July 31, 2002. Through this amendment the validity of section 23 of the Depository Act has been extended by another three years.
45
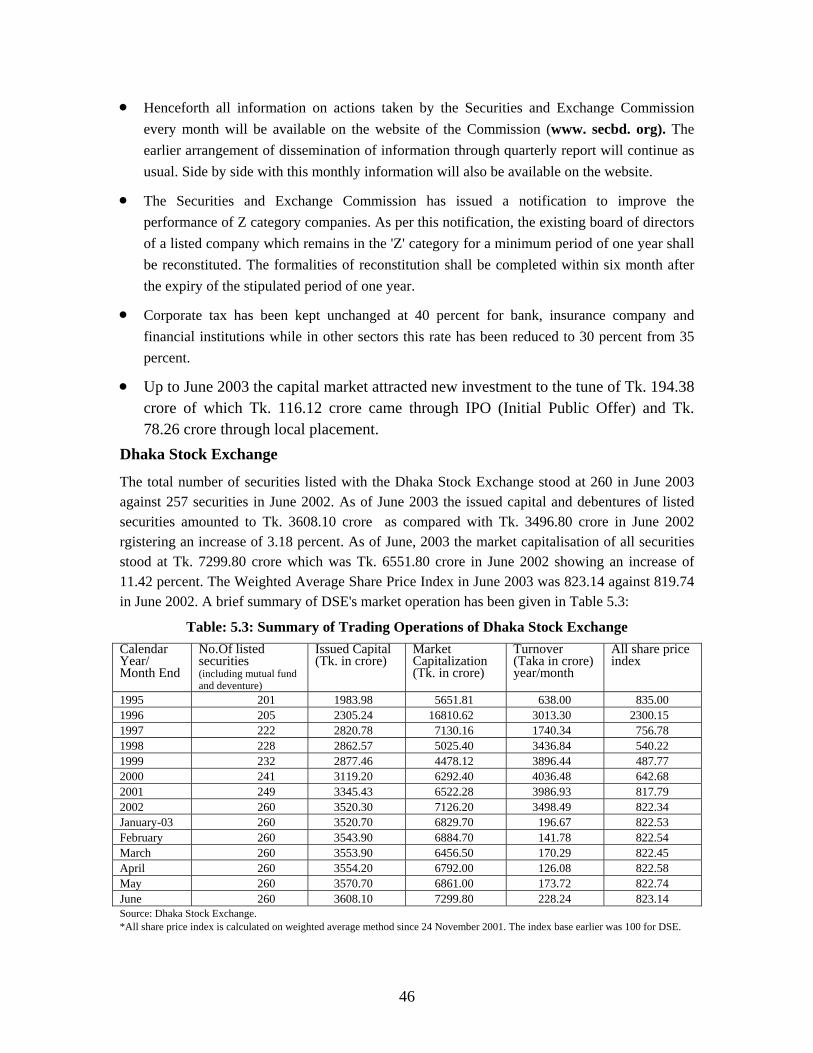
• Henceforth all information on actions taken by the Securities and Exchange Commission every month will be available on the website of the Commission (www. secbd. org). The earlier arrangement of dissemination of information through quarterly report will continue as usual. Side by side with this monthly information will also be available on the website.
• The Securities and Exchange Commission has issued a notification to improve the performance of Z category companies. As per this notification, the existing board of directors of a listed company which remains in the 'Z' category for a minimum period of one year shall be reconstituted. The formalities of reconstitution shall be completed within six month after the expiry of the stipulated period of one year.
• Corporate tax has been kept unchanged at 40 percent for bank, insurance company and financial institutions while in other sectors this rate has been reduced to 30 percent from 35 percent.
• Up to June 2003 the capital market attracted new investment to the tune of Tk. 194.38 crore of which Tk. 116.12 crore came through IPO (Initial Public Offer) and Tk. 78.26 crore through local placement.
Dhaka Stock Exchange
The total number of securities listed with the Dhaka Stock Exchange stood at 260 in June 2003 against 257 securities in June 2002. As of June 2003 the issued capital and debentures of listed securities amounted to Tk. 3608.10 crore as compared with Tk. 3496.80 crore in June 2002 rgistering an increase of 3.18 percent. As of June, 2003 the market capitalisation of all securities stood at Tk. 7299.80 crore which was Tk. 6551.80 crore in June 2002 showing an increase of 11.42 percent. The Weighted Average Share Price Index in June 2003 was 823.14 against 819.74 in June 2002. A brief summary of DSE's market operation has been given in Table 5.3:
Table: 5.3: Summary of Trading Operations of Dhaka Stock Exchange Calendar Year/ Month End
No.Of listed securities (including mutual fund and deventure)
Issued Capital (Tk. in crore)
Market Capitalization (Tk. in crore)
Turnover (Taka in crore) year/month
All share price index
1995 201 1983.98 5651.81 638.00 835.00 1996 205 2305.24 16810.62 3013.30 2300.15 1997 222 2820.78 7130.16 1740.34 756.78 1998 228 2862.57 5025.40 3436.84 540.22 1999 232 2877.46 4478.12 3896.44 487.77 2000 241 3119.20 6292.40 4036.48 642.68 2001 249 3345.43 6522.28 3986.93 817.79 2002 260 3520.30 7126.20 3498.49 822.34 January-03 260 3520.70 6829.70 196.67 822.53 February 260 3543.90 6884.70 141.78 822.54 March 260 3553.90 6456.50 170.29 822.45 April 260 3554.20 6792.00 126.08 822.58 May 260 3570.70 6861.00 173.72 822.74 June 260 3608.10 7299.80 228.24 823.14 Source: Dhaka Stock Exchange. *All share price index is calculated on weighted average method since 24 November 2001. The index base earlier was 100 for DSE.
46
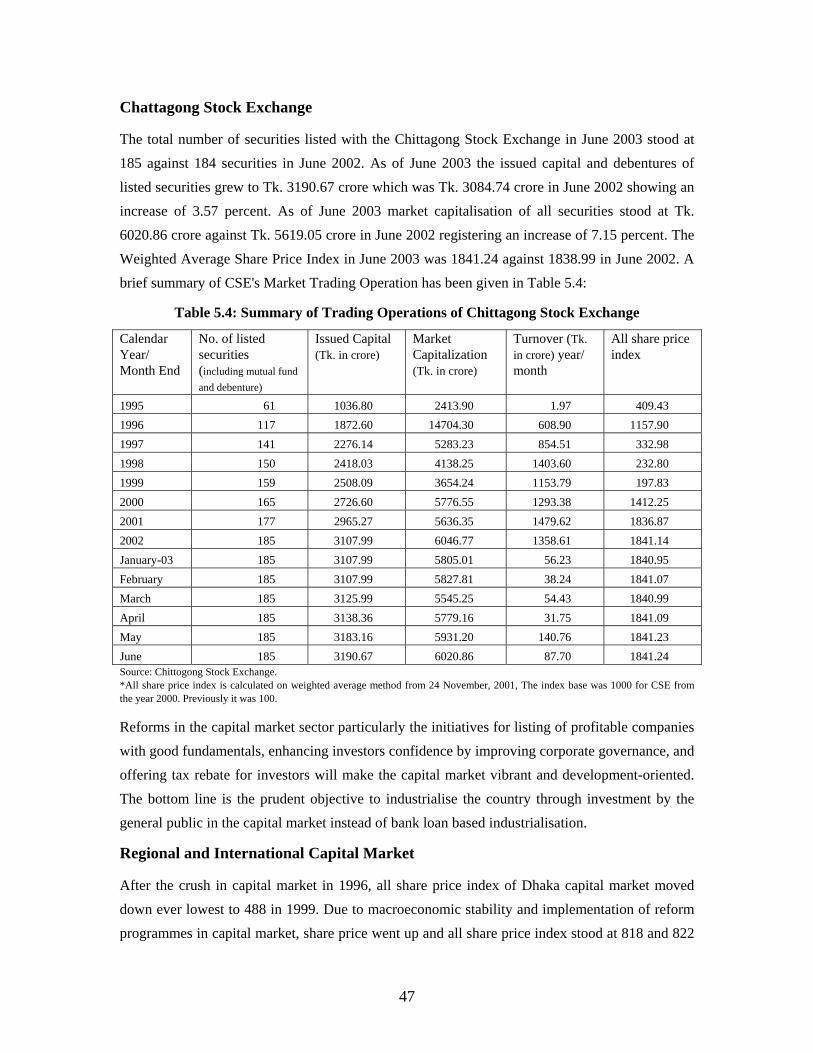
Chattagong Stock Exchange
The total number of securities listed with the Chittagong Stock Exchange in June 2003 stood at 185 against 184 securities in June 2002. As of June 2003 the issued capital and debentures of listed securities grew to Tk. 3190.67 crore which was Tk. 3084.74 crore in June 2002 showing an increase of 3.57 percent. As of June 2003 market capitalisation of all securities stood at Tk. 6020.86 crore against Tk. 5619.05 crore in June 2002 registering an increase of 7.15 percent. The Weighted Average Share Price Index in June 2003 was 1841.24 against 1838.99 in June 2002. A brief summary of CSE's Market Trading Operation has been given in Table 5.4:
Table 5.4: Summary of Trading Operations of Chittagong Stock Exchange
Calendar Year/ Month End
No. of listed securities (including mutual fund and debenture)
Issued Capital (Tk. in crore)
Market Capitalization (Tk. in crore)
Turnover (Tk. in crore) year/ month
All share price index
1995 61 1036.80 2413.90 1.97 409.43 1996 117 1872.60 14704.30 608.90 1157.90 1997 141 2276.14 5283.23 854.51 332.98 1998 150 2418.03 4138.25 1403.60 232.80 1999 159 2508.09 3654.24 1153.79 197.83 2000 165 2726.60 5776.55 1293.38 1412.25 2001 177 2965.27 5636.35 1479.62 1836.87 2002 185 3107.99 6046.77 1358.61 1841.14 January-03 185 3107.99 5805.01 56.23 1840.95 February 185 3107.99 5827.81 38.24 1841.07 March 185 3125.99 5545.25 54.43 1840.99 April 185 3138.36 5779.16 31.75 1841.09 May 185 3183.16 5931.20 140.76 1841.23 June 185 3190.67 6020.86 87.70 1841.24 Source: Chittogong Stock Exchange. *All share price index is calculated on weighted average method from 24 November, 2001, The index base was 1000 for CSE from the year 2000. Previously it was 100.
Reforms in the capital market sector particularly the initiatives for listing of profitable companies with good fundamentals, enhancing investors confidence by improving corporate governance, and offering tax rebate for investors will make the capital market vibrant and development-oriented. The bottom line is the prudent objective to industrialise the country through investment by the general public in the capital market instead of bank loan based industrialisation.
Regional and International Capital Market
After the crush in capital market in 1996, all share price index of Dhaka capital market moved down ever lowest to 488 in 1999. Due to macroeconomic stability and implementation of reform programmes in capital market, share price went up and all share price index stood at 818 and 822
47
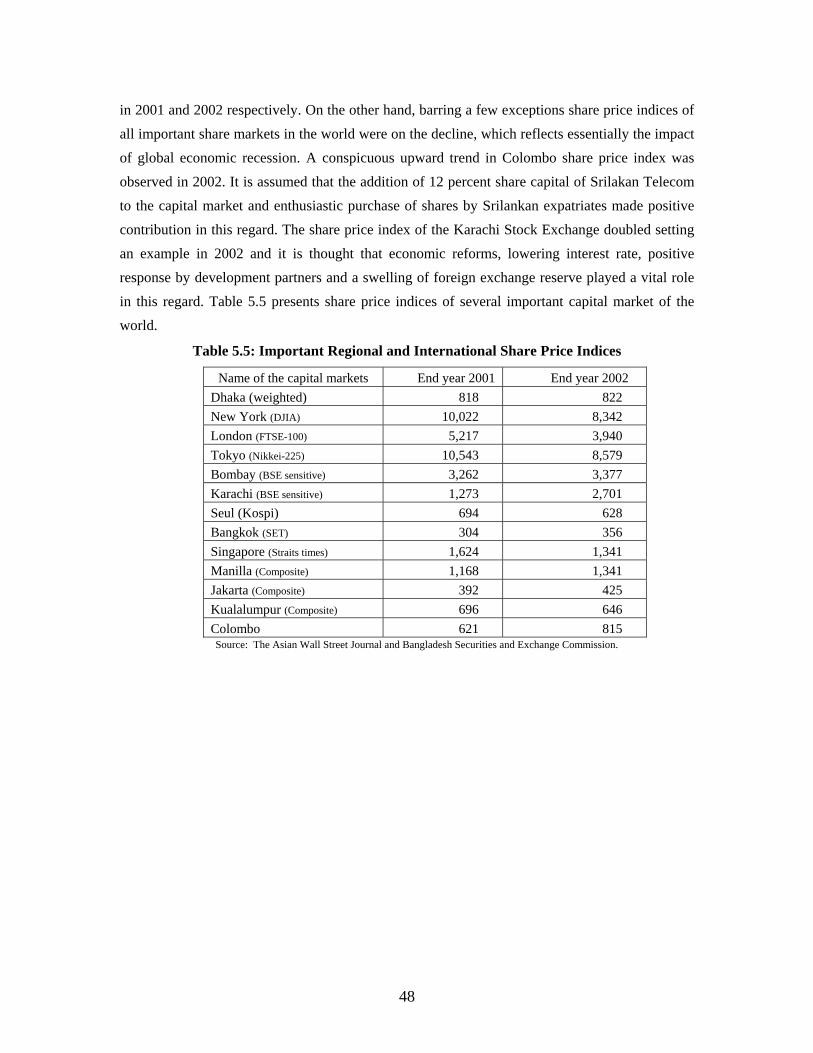
in 2001 and 2002 respectively. On the other hand, barring a few exceptions share price indices of all important share markets in the world were on the decline, which reflects essentially the impact of global economic recession. A conspicuous upward trend in Colombo share price index was observed in 2002. It is assumed that the addition of 12 percent share capital of Srilakan Telecom to the capital market and enthusiastic purchase of shares by Srilankan expatriates made positive contribution in this regard. The share price index of the Karachi Stock Exchange doubled setting an example in 2002 and it is thought that economic reforms, lowering interest rate, positive response by development partners and a swelling of foreign exchange reserve played a vital role in this regard. Table 5.5 presents share price indices of several important capital market of the world.
Table 5.5: Important Regional and International Share Price Indices
Name of the capital markets End year 2001 End year 2002 Dhaka (weighted) 818 822 New York (DJIA) 10,022 8,342 London (FTSE-100) 5,217 3,940 Tokyo (Nikkei-225) 10,543 8,579 Bombay (BSE sensitive) 3,262 3,377 Karachi (BSE sensitive) 1,273 2,701 Seul (Kospi) 694 628 Bangkok (SET) 304 356 Singapore (Straits times) 1,624 1,341 Manilla (Composite) 1,168 1,341 Jakarta (Composite) 392 425 Kualalumpur (Composite) 696 646 Colombo 621 815 Source: The Asian Wall Street Journal and Bangladesh Securities and Exchange Commission.
48
CHAPTER-6
FOREIGN TRADE, EXCHANGE RATE MANAGEMENT AND EXTERNAL SECTOR
Foreign Trade
Consistent with the trends of the market economy, Uruguay Round Accord and Agreement with World Trade Organisation (WTO) Bangladesh has been pursuing a liberal trade policy since 1990s. An increase or decrease of foreign exchange reserve is closely linked to foreign trade. Bangladesh declared a set of five-year term liberal export and import policies at the end of FY 1997-98 to attain a favourable trade balance along with consistent improvement in foreign exchange reserve situation.
The terrorist incident of September 11, 2001 in the USA and subsequent events of the world, caused to make the export sector of Bangladesh suffer a serious setback at the beginning of FY 2001-02. In spite of the increased flow of remittances by the expatriate Bangladeshis, the foreign currency reserve continued to fall as the exports suffered severe loss. To tide over this adverse situation, government adopted pragmatic export and import policies coupled with necessary fiscal and monetary policies. Consequently, the export sector demonstrated a remarkable growth in the current fiscal year. At the beginning of Iraq war, export showed slight stagnation, but after the end of the war export growth recovered steadily. If there is any impact on the movement of the buyers of Bangladeshi garments due to the onslaught of Severe Acute Respiratory Syndrome (SARS) in East Asia, there may be some adverse affect on export trade.
Trade Policy and Reform Programme
The trade policy of Bangladesh is now more open compared to the previous decade of 1980s. Extensive reform programmes have been implemented in trade regime during the last two decades. Reforms have been initiated to dismantle both tariff and non-tariff barriers. With regards to steps towards trade liberalisation government has been pursuing a moderate protective policy only in consideration of certain sensitive issues like public health, security and religious bindings. Simultaneously, more liberal import and export policies and programmes have been adopted including reduction in tariff slabs. Bangladesh pursued one-year export and import policies in the eighties and two-year policies in the first half of nineties. But now five-year export and import policies are formulated and implemented. These policies, are consistent with the agreement under Uruguay Round Accord, WTO and the principles of market economy on one hand and maintaining favourable balance between exports and imports of the country on the other.
49
Import Policy and Reform Programme
The Government five-year import policy (1997-2002) had been made consistent with the industrial policy. As a result, administrative complexities for obtaining prior approval from different ministries, a requirement for establishing industries, has largely been reduced. In the new import policy, quality control mechanism of imported goods has also been strengthened. Requirement for declaring country of origin for import of raw materials has been withdrawn for export-oriented industries enjoying bonded warehouse facility. Consequently, raw materials import has been made easier for 100 percent export oriented industries that will accelerate expansion of export industries. Import of gold and silver has been made consistent with the Exchange Control Regulations of Bangladesh Bank. Under the new import policy, expatriate Bangladeshis can import capital machinery and raw materials in any quantity while the foreign investors, as part of their equity share, can import the same on cost insurance and freight (c.i.f.) basis. Insurance cover from Bangladeshi insurance companies has been made mandatory like L/C in the case of imports. Besides, provision has been made for Tax Identification Number (TIN) for all importers except for individuals. This has made trade and revenue administration simple and transparent. Import of vehicles with 2/3 stroke engines has gradually been banned for protection of environment. In order to infuse dynamism and to accelerate development, procedures for import of fertilizer, gray cloth, standardisation of detra-methene cement, ethylene gas, and raw materials for 100 percent export oriented garment industries have been simplified and, in special cases, requirement of L/C opening has been withdrawn. In addition, some of the directives of 1995-96 Import Policy still hold good in the current five-year import policy as well.
The import policy 1997-2002 was scheduled to terminate by June 30, 2002, but the government has decided to continue to pursue the policy until a new import policy is approved. The preparation of new import policy 2002-2007 is at the final stage. Government has taken initiatives to rationalise this new import policy to confront the challenges of the emerging changes and expansion of world trade, free access of commodities worldwide by the gradual expansion of globalisation and free market economy. According to the trend of world market economy and the obligation of WTO, Bangladesh has been adopting the method of simplifying trade policy. But considering public health, security, social, cultural and religious bindings, very nominal protection policy has been followed. Some of the important objectives of new import policy are:
- Import policy will be further simplified in the light of the change due to globalisation and gradual development of free market economy under WTO;
- Facilities will be provided to import technology for the widespread dissemination of modern technology;
- By providing simplified import facilities for the export oriented industries a strong export base will be built up. For this reasons, import policy will be integrated with industrial policy, export policy and other development activities; and
50
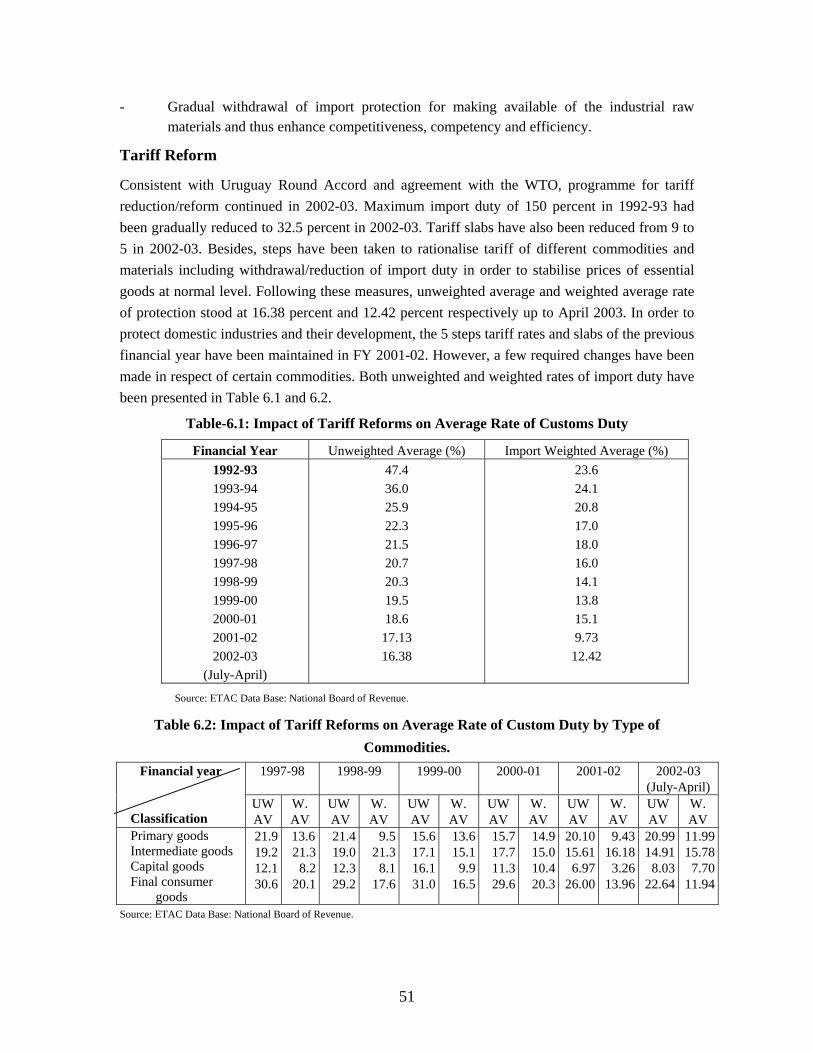
- Gradual withdrawal of import protection for making available of the industrial raw materials and thus enhance competitiveness, competency and efficiency.
Tariff Reform
Consistent with Uruguay Round Accord and agreement with the WTO, programme for tariff reduction/reform continued in 2002-03. Maximum import duty of 150 percent in 1992-93 had been gradually reduced to 32.5 percent in 2002-03. Tariff slabs have also been reduced from 9 to 5 in 2002-03. Besides, steps have been taken to rationalise tariff of different commodities and materials including withdrawal/reduction of import duty in order to stabilise prices of essential goods at normal level. Following these measures, unweighted average and weighted average rate of protection stood at 16.38 percent and 12.42 percent respectively up to April 2003. In order to protect domestic industries and their development, the 5 steps tariff rates and slabs of the previous financial year have been maintained in FY 2001-02. However, a few required changes have been made in respect of certain commodities. Both unweighted and weighted rates of import duty have been presented in Table 6.1 and 6.2.
Table-6.1: Impact of Tariff Reforms on Average Rate of Customs Duty
Financial Year Unweighted Average (%) Import Weighted Average (%) 1992-93 1993-94 1994-95 1995-96 1996-97 1997-98 1998-99 1999-00 2000-01 2001-02 2002-03
(July-April)
47.4 36.0 25.9 22.3 21.5 20.7 20.3 19.5 18.6
17.13 16.38
23.6 24.1 20.8 17.0 18.0 16.0 14.1 13.8 15.1 9.73
12.42
Source: ETAC Data Base: National Board of Revenue.
Table 6.2: Impact of Tariff Reforms on Average Rate of Custom Duty by Type of Commodities.
Financial year 1997-98 1998-99 1999-00
2000-01
2001-02
2002-03 (July-April)
Classification
UW AV
W. AV
UW AV
W. AV
UW AV
W. AV
UW AV
W. AV
UW AV
W. AV
UW AV
W. AV
Primary goods Intermediate goods Capital goods Final consumer
goods
21.9 19.2 12.1 30.6
13.6 21.3
8.2 20.1
21.419.012.329.2
9.521.3
8.117.6
15.617.116.131.0
13.615.1
9.916.5
15.717.711.329.6
14.915.010.420.3
20.10 15.61
6.97 26.00
9.43 16.18
3.26 13.96
20.9914.91
8.0322.64
11.9915.78
7.7011.94
Source: ETAC Data Base: National Board of Revenue.
51
Export Policy and Programme Expanding global market economy and agreement with the WTO have opened up enormous opportunities for exports, on one hand, and has posed a great challenge for a poor country like Bangladesh with underdeveloped technology and low capital base on the other. In the case of import, following gradual reduction of duty rates, domestic import-substitute industries have been facing increasing competition. On the contrary, export industries have to survive and expand by competing with other countries. Keeping this unfavourable situation in mind, a five-year (1997-2002) Export Policy has been formulated and implemented.
Presently, three-fourths of the export earnings of Bangladesh come from ready-made garments. The garments sector might face a drastic unexpected change during the post MFN period i.e. at the beginning of 2005. To achieve the objective of putting our economy on a stronger foundation, this change should have to be made favourable for Bangladesh. The government has taken various initiatives to create markets of Bangladeshi commodities abroad. In the meantime, duty free access in the market of European Union, Canada and Norway has been obtained for Bangladeshi commodities and this facility is now available for Australia from July 1, 2003. Reduced duty facilities on few Bangladeshi commodities are ensured for Thailand, India and Pakistan. Negotiations are going on with China, Russia, Malaysia and other neighboring countries for duty free access of Bangladeshi commodities. This would result in a positive outcome very soon. To boost export, facilities should be provided for the importers to make payment both on LC and contract basis and also current Value Added Tax, custom duties should be made rational. Against this backdrop, the Export Policy 2002-2007 is being formulated which is now at the final stage for approval.
South Asian Regional Trade Agreement (SAPTA)
South Asian Preferential Trade Agreement (SAPTA) came into effect on December 7, 1995. Under this agreement, prescribed Rules of Origin of the signatory countries have been relaxed. Three rounds of negotiation meeting have been held so far under SAPTA. Under SAPTA agreement although there is an opportunity to take some alternative approach of trade liberalisation, but most restrictive and potentially most trade-distortion method of product-by-product approach was adopted in all three rounds of negotiations, which baffles or frustrates the main objective of the creation of SAPTA. In these negotiation rounds the coverage of different commodities and reduction of duties were considered. Meanwhile, they have also mutually exchanged concessionary duty ranging between 7.5 percent and 100 percent for about 2,100 commodities on the basis of 6 digit Harmonized System (HS) Code. Besides, non-tariff restrictions have been removed from 180 commodities and in the case of export from less developed countries, the local value added rate has been refixed at 30 percent in place of 40 percent. Initiative has been taken to sign an “Agreement on Promotion and Protection of Investment” with a view to expanding trade and investment among South Asian Association for Regional Cooperation (SAARC) countries. A committee of experts of SAARC countries is engaged in formulating plans for graduating from SAPTA to South Asian Free Trade Area
52
(SAFTA). The principal objective of this forum is to form a ‘Free Trade Zone’ in South Asia. In the meantime, a feasibility study report has been prepared which is awaiting finalisation. In the next SAARC Summit the formation of SAFTA may be finalised.
Regional Trade Creation The regional trade situation of South East Asian countries reveals that the total export was US$ 28.3 billion in 1991 that reached at US$ 51 billion in 1997. The average growth rate was 10.3 per cent annually. In 1999, the total export of South East Asian countries was US$ 57.14 billion. The total imports of these countries were US$ 35 billion in 1991 and in 1997 total import reached US$ 63.6 billion. In 1999 total import reached US$ 71.73 billion. The trade deficit of these countries were US$ 6.6 billion in 1991 and in 1999 deficit reached US$ 14.51 billion which was approximately 25 percent of total export. The average annual increase in the rate of import was 13.3 percent compared to 1991 and this growth is twice the overall trade deficit. This external trade scenario reflects unstable import-export condition of South Asian countries.
Trade Situation of Several SAARC Countries*
Among the SAARC countries, the export growth of Pakistan fell from 19 percent in 1990-91 to 9 percent in 2000-01. During that period import growth fell from 13.1 percent to 5.9 percent. Per capita income decreased from US$ 509 in 1990-91 to US$ 427 in 2000-01. During the period the growth in agriculture sector decreased from 5 percent to 2.6 percent. Industrial production decreased from 6.3 percent in 1990-91 to 1.5 percent in 1999-00. The fragility of Pakistan's economy throughout the decade also had negative impact on external trade. But following trade liberalisation (custom duty decreased from 200 percent to 25 percent in 2000) and the implementation of massive reform programmes, the economy has begun to regain stability from the beginning of 2003.
During 1990's the trend of external trade of Bangladesh reflects an unstable condition. The export growth increased from 12.7 percent in 1991 to 37.1 percent in 1995 and in 1999 it fell at 2.9 percent and after that export growth reached at 8.03 percent in 2000. In 2001, export showed negative growth (-7 percent) and in the FY 2002-03 export increased by 9.39 percent. It reveals that, there is no specific trend of our export. Similarly import showed negative growth (-8.5 percent) in 2002. On the other hand, import growth stood at the height 39.2 percent in 1995 and in 1996 growth fell to 19.1 percent. It is evident that, trade deficit of Bangladesh has been staggering over the period of nineties and the highest trade deficit reached US$ 3.06 billion in 1996.
Among the South Asian countries, the economy of India is the largest and has, therefore a strong influence over regional trade. But like other SAARC countries the trade pattern of India showed
* Information are taken from Economic Survey, 2002-03, Government of India, Economic Survey of Pakistan, 2001-02 and the country paper presented in the workshop held on 29-30 March, 2003 organized by BIDS.
53
similar fluctuations. In 1991 it witnessed the lowest export growth of 0.3 percent and the highest export growth of 26.2 percent in 1995 and after that export growth fell to 7 percent in 1999. Similar trend was also observed in the case of import. Like other SAARC countries, India experienced trade deficit over the nineties. In 1999 the export earnings of India was US$ 39 billion and the trade deficit was US$ 5.6 billion that is the deficit stood at 14.3 percent. The trade deficit stood at US$ 8.3 billion in the year 2000.
The trade pattern of Sri Lanka is similar to other SAARC countries. Export showed negative growth (-8 percent) in 1999. Over the nineties, the average export growth was 5 percent and the highest export growth reached 16 percent in 1991. Sri Lanka experienced the trade deficit over the 1990s and in 1999 trade deficit reached US$ 2.3 billion.
Degree of Openness of the Economy of Several SAARC Countries
The implication of the removal of restrictions on both exports and imports would be to enhance external trade. One of the measurements of the international openness of the economy is the Trade Ratio, which is the ratio of sum of exports of goods and services and imports of goods and services to GDP. Another measurement of international openness is Import Penetration. Import Penetration is estimated as the percentage of imports of goods and services to domestic demand (GDP + trade surplus or deficit). The third measurement is Export Propensity. Export Propensity is defined as the ratio of exports of goods and services to GDP. In the case of other measurements, some experts consider the relative share of customs duty to total tax revenue. Others consider the influence of tariff and non-tariff barriers on imports to measure international openness.
Table-6.3 indicates the changes in the degree of international openness of Bangladesh, Pakistan, Sri Lanka and India during 1990-2000. The table shows that all the indicators move in the same direction over the period for Bangladesh, Sri Lanka and India. The external trade ratio of Bangladesh, Sri Lanka and India rose from 26.7 percent, 68.2 percent and 15.7 percent in 1991 to 42.1 percent, 88.8 percent and 19.41 percent respectively in 2000. However, the external trade ratio increased from 35.1 percent in 1990 to 38.8 percent in 1993 and gradually fell to 34.5 percent in 2000 for Pakistan. Thus it appears that the process of opening up of the economy faltered for Pakistan since the mid-nineties while it continued uninterrupted for Bangladesh, Sri Lanka and India for the 1990s. It may further be noted that in 1990 Sri Lanka was the most open economy according to external trade share, Pakistan was the second, Bangladesh stood third and India was the least open economy. Sri Lanka continued to remain the most open economy in 2000 while India was the least open Economy. The trade ratio of Bangladesh (26.7 percent) was lower than that of Pakistan (35.1 percent) in 1990 but rose rapidly to reach a higher level of 42.1 percent compared to that of Pakistan (34.5 percent) in 2000. Most importantly we may note that export growth, relative to GDP, was considerably higher in Bangladesh than in the other South Asian economies. In Bangladesh, the contribution to its increased openness came primarily from exports, in contrast to the other South Asian economies.
54
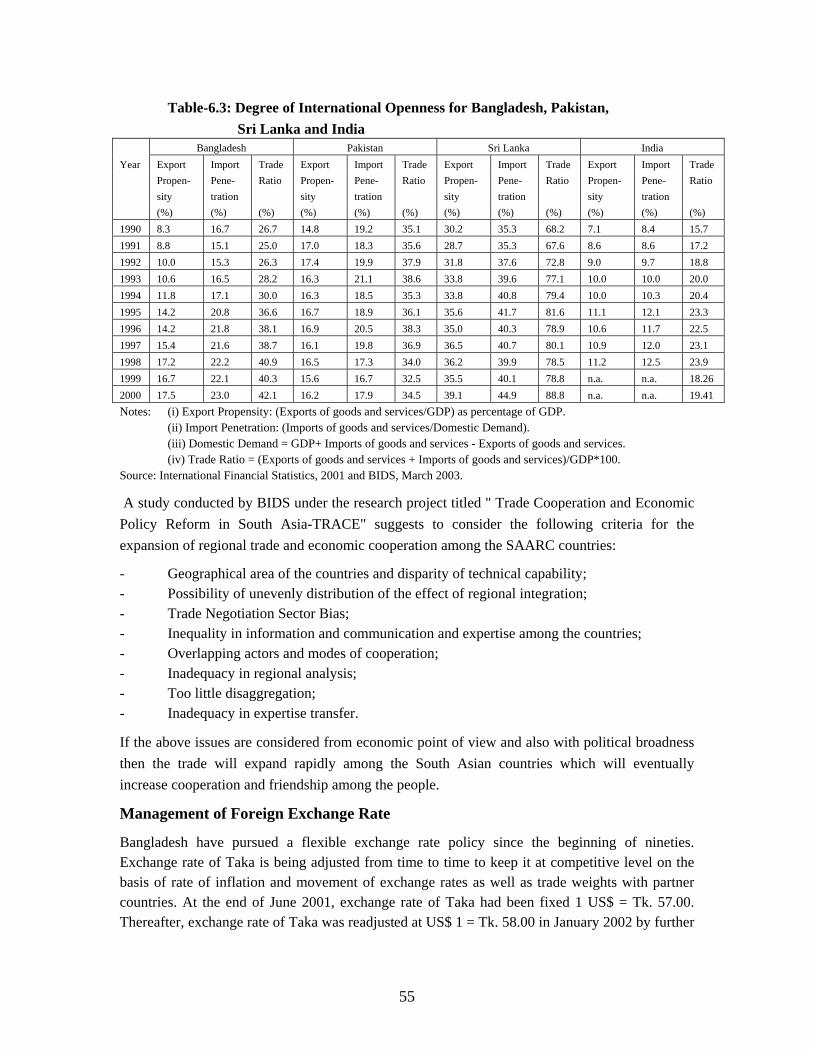
Table-6.3: Degree of International Openness for Bangladesh, Pakistan, Sri Lanka and India
Bangladesh Pakistan Sri Lanka India Year Export Import Trade Export Import Trade Export Import Trade Export Import Trade Propen-
sity Pene-tration
Ratio Propen-sity
Pene-tration
Ratio Propen-sity
Pene-tration
Ratio Propen-sity
Pene-tration
Ratio
(%) (%) (%) (%) (%) (%) (%) (%) (%) (%) (%) (%) 1990 8.3 16.7 26.7 14.8 19.2 35.1 30.2 35.3 68.2 7.1 8.4 15.7 1991 8.8 15.1 25.0 17.0 18.3 35.6 28.7 35.3 67.6 8.6 8.6 17.2 1992 10.0 15.3 26.3 17.4 19.9 37.9 31.8 37.6 72.8 9.0 9.7 18.8 1993 10.6 16.5 28.2 16.3 21.1 38.6 33.8 39.6 77.1 10.0 10.0 20.0 1994 11.8 17.1 30.0 16.3 18.5 35.3 33.8 40.8 79.4 10.0 10.3 20.4 1995 14.2 20.8 36.6 16.7 18.9 36.1 35.6 41.7 81.6 11.1 12.1 23.3 1996 14.2 21.8 38.1 16.9 20.5 38.3 35.0 40.3 78.9 10.6 11.7 22.5 1997 15.4 21.6 38.7 16.1 19.8 36.9 36.5 40.7 80.1 10.9 12.0 23.1 1998 17.2 22.2 40.9 16.5 17.3 34.0 36.2 39.9 78.5 11.2 12.5 23.9 1999 16.7 22.1 40.3 15.6 16.7 32.5 35.5 40.1 78.8 n.a. n.a. 18.26 2000 17.5 23.0 42.1 16.2 17.9 34.5 39.1 44.9 88.8 n.a. n.a. 19.41 Notes: (i) Export Propensity: (Exports of goods and services/GDP) as percentage of GDP. (ii) Import Penetration: (Imports of goods and services/Domestic Demand). (iii) Domestic Demand = GDP+ Imports of goods and services - Exports of goods and services. (iv) Trade Ratio = (Exports of goods and services + Imports of goods and services)/GDP*100. Source: International Financial Statistics, 2001 and BIDS, March 2003.
A study conducted by BIDS under the research project titled " Trade Cooperation and Economic Policy Reform in South Asia-TRACE" suggests to consider the following criteria for the expansion of regional trade and economic cooperation among the SAARC countries:
- Geographical area of the countries and disparity of technical capability; - Possibility of unevenly distribution of the effect of regional integration; - Trade Negotiation Sector Bias; - Inequality in information and communication and expertise among the countries; - Overlapping actors and modes of cooperation; - Inadequacy in regional analysis; - Too little disaggregation; - Inadequacy in expertise transfer.
If the above issues are considered from economic point of view and also with political broadness then the trade will expand rapidly among the South Asian countries which will eventually increase cooperation and friendship among the people.
Management of Foreign Exchange Rate Bangladesh have pursued a flexible exchange rate policy since the beginning of nineties. Exchange rate of Taka is being adjusted from time to time to keep it at competitive level on the basis of rate of inflation and movement of exchange rates as well as trade weights with partner countries. At the end of June 2001, exchange rate of Taka had been fixed 1 US$ = Tk. 57.00. Thereafter, exchange rate of Taka was readjusted at US$ 1 = Tk. 58.00 in January 2002 by further
55
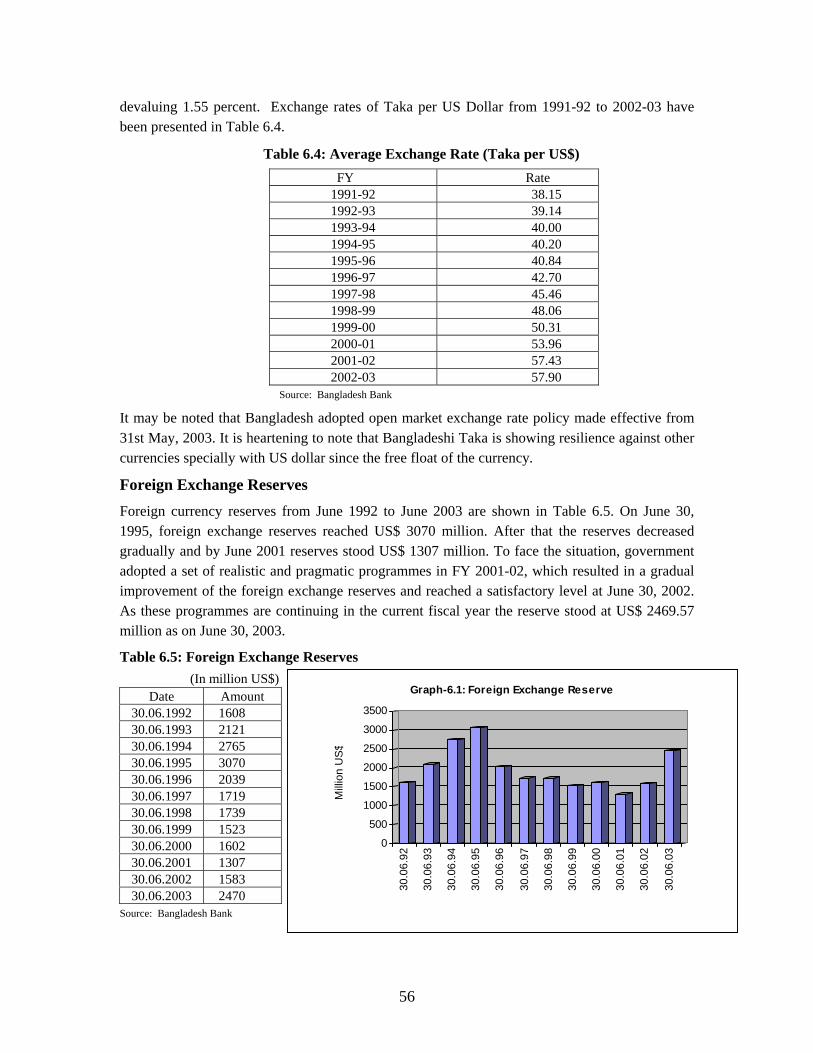
devaluing 1.55 percent. Exchange rates of Taka per US Dollar from 1991-92 to 2002-03 have been presented in Table 6.4.
Table 6.4: Average Exchange Rate (Taka per US$) FY Rate
1991-92 38.15 1992-93 39.14 1993-94 40.00 1994-95 40.20 1995-96 40.84 1996-97 42.70 1997-98 45.46 1998-99 48.06 1999-00 50.31 2000-01 53.96 2001-02 57.43 2002-03 57.90
Source: Bangladesh Bank It may be noted that Bangladesh adopted open market exchange rate policy made effective from 31st May, 2003. It is heartening to note that Bangladeshi Taka is showing resilience against other currencies specially with US dollar since the free float of the currency.
Foreign Exchange Reserves Foreign currency reserves from June 1992 to June 2003 are shown in Table 6.5. On June 30, 1995, foreign exchange reserves reached US$ 3070 million. After that the reserves decreased gradually and by June 2001 reserves stood US$ 1307 million. To face the situation, government adopted a set of realistic and pragmatic programmes in FY 2001-02, which resulted in a gradual improvement of the foreign exchange reserves and reached a satisfactory level at June 30, 2002. As these programmes are continuing in the current fiscal year the reserve stood at US$ 2469.57 million as on June 30, 2003.
Table 6.5: Foreign Exchange Reserves (In million US$)
Date Amount 30.06.1992 1608 30.06.1993 2121 30.06.1994 2765 30.06.1995 3070 30.06.1996 2039 30.06.1997 1719 30.06.1998 1739 30.06.1999 1523 30.06.2000 1602 30.06.2001 1307 30.06.2002 1583 30.06.2003 2470
0
500
1000
1500
2000
2500
3000
3500
Mill
ion
US
$
30.0
6.92
30.0
6.93
30.0
6.94
30.0
6.95
30.0
6.96
30.0
6.97
30.0
6.98
30.0
6.99
30.0
6.00
30.0
6.01
30.0
6.02
30.0
6.03
Graph-6.1: Foreign Exchange Reserve
Source: Bangladesh Bank
56
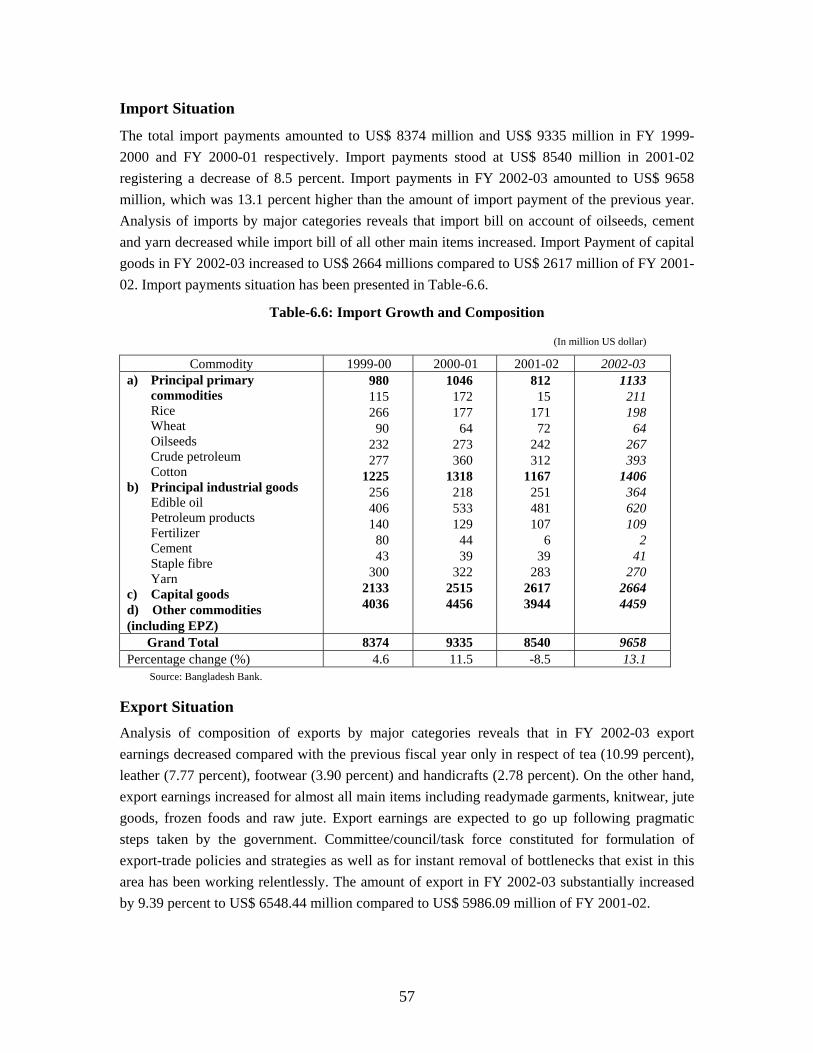
Import Situation The total import payments amounted to US$ 8374 million and US$ 9335 million in FY 1999-2000 and FY 2000-01 respectively. Import payments stood at US$ 8540 million in 2001-02 registering a decrease of 8.5 percent. Import payments in FY 2002-03 amounted to US$ 9658 million, which was 13.1 percent higher than the amount of import payment of the previous year. Analysis of imports by major categories reveals that import bill on account of oilseeds, cement and yarn decreased while import bill of all other main items increased. Import Payment of capital goods in FY 2002-03 increased to US$ 2664 millions compared to US$ 2617 million of FY 2001-02. Import payments situation has been presented in Table-6.6.
Table-6.6: Import Growth and Composition
(In million US dollar)
Commodity 1999-00 2000-01 2001-02 2002-03 a) Principal primary
commodities Rice Wheat Oilseeds Crude petroleum Cotton
b) Principal industrial goods Edible oil Petroleum products Fertilizer Cement Staple fibre Yarn
c) Capital goods d) Other commodities (including EPZ)
980 115 266
90 232 277
1225 256 406 140
80 43
300 2133 4036
1046 172 177
64 273 360
1318 218 533 129
44 39
322 2515 4456
812 15
171 72
242 312
1167 251 481 107
6 39
283 2617 3944
1133 211 198
64 267 393
1406 364 620 109
2 41
270 2664 4459
Grand Total 8374 9335 8540 9658 Percentage change (%) 4.6 11.5 -8.5 13.1
Source: Bangladesh Bank. Export Situation Analysis of composition of exports by major categories reveals that in FY 2002-03 export earnings decreased compared with the previous fiscal year only in respect of tea (10.99 percent), leather (7.77 percent), footwear (3.90 percent) and handicrafts (2.78 percent). On the other hand, export earnings increased for almost all main items including readymade garments, knitwear, jute goods, frozen foods and raw jute. Export earnings are expected to go up following pragmatic steps taken by the government. Committee/council/task force constituted for formulation of export-trade policies and strategies as well as for instant removal of bottlenecks that exist in this area has been working relentlessly. The amount of export in FY 2002-03 substantially increased by 9.39 percent to US$ 6548.44 million compared to US$ 5986.09 million of FY 2001-02.
57
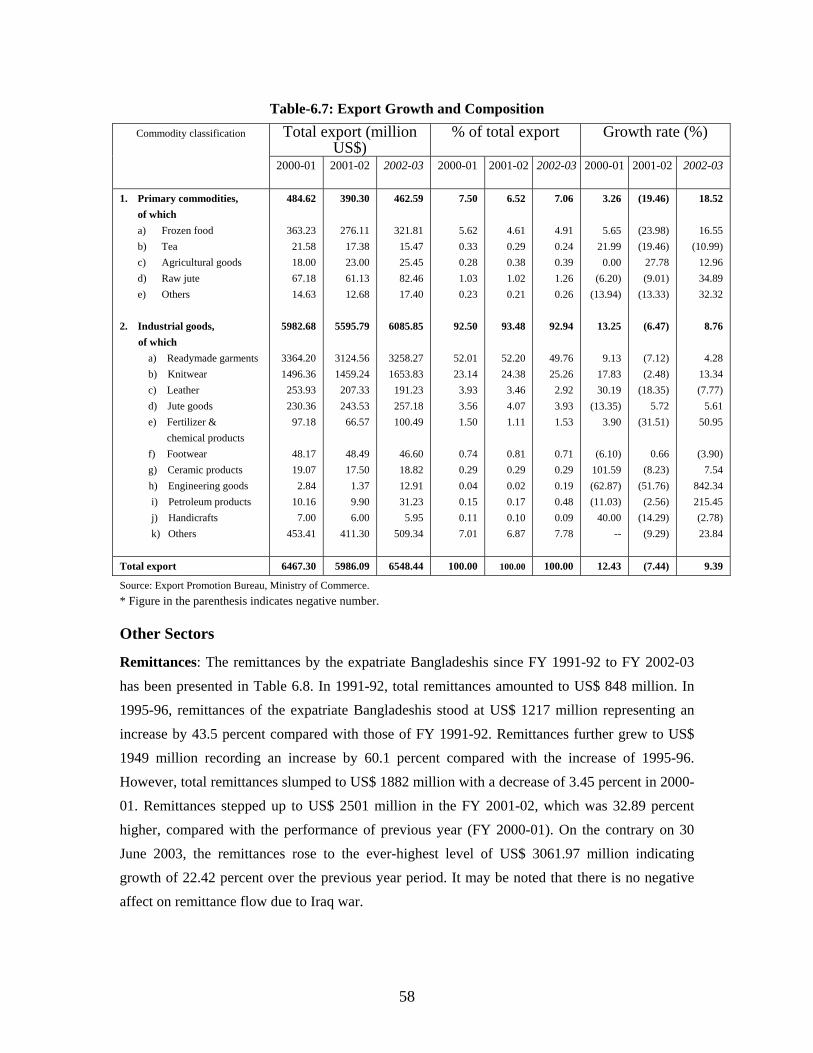
Table-6.7: Export Growth and Composition Commodity classification Total export (million
US$) % of total export Growth rate (%)
2000-01 2001-02 2002-03 2000-01 2001-02 2002-03 2000-01 2001-02 2002-03
1. Primary commodities, of which a) Frozen food b) Tea c) Agricultural goods d) Raw jute e) Others
2. Industrial goods, of which
a) Readymade garments b) Knitwear c) Leather d) Jute goods e) Fertilizer & chemical products f) Footwear g) Ceramic products
h) Engineering goods i) Petroleum products j) Handicrafts k) Others
484.62
363.23 21.58 18.00 67.18 14.63
5982.68
3364.20 1496.36
253.93 230.36
97.18
48.17 19.07
2.84 10.16
7.00 453.41
390.30
276.11 17.38 23.00 61.13 12.68
5595.79
3124.56 1459.24
207.33 243.53
66.57
48.49 17.50
1.37 9.90 6.00
411.30
462.59
321.81 15.47 25.45 82.46 17.40
6085.85
3258.27 1653.83
191.23 257.18 100.49
46.60 18.82 12.91 31.23
5.95 509.34
7.50
5.62 0.33 0.28 1.03 0.23
92.50
52.01 23.14
3.93 3.56 1.50
0.74 0.29 0.04 0.15 0.11 7.01
6.52
4.61 0.29 0.38 1.02 0.21
93.48
52.20 24.38
3.46 4.07 1.11
0.81 0.29 0.02 0.17 0.10 6.87
7.06
4.91 0.24 0.39 1.26 0.26
92.94
49.76 25.26
2.92 3.93 1.53
0.71 0.29 0.19 0.48 0.09 7.78
3.26
5.65 21.99
0.00 (6.20)
(13.94)
13.25
9.13 17.83 30.19
(13.35) 3.90
(6.10)
101.59 (62.87) (11.03)
40.00 --
(19.46)
(23.98) (19.46)
27.78 (9.01)
(13.33)
(6.47)
(7.12) (2.48)
(18.35) 5.72
(31.51)
0.66 (8.23)
(51.76) (2.56)
(14.29) (9.29)
18.52
16.55 (10.99)
12.96 34.89 32.32
8.76
4.28
13.34 (7.77)
5.61 50.95
(3.90)
7.54 842.34 215.45 (2.78) 23.84
Total export 6467.30 5986.09 6548.44 100.00 100.00 100.00 12.43 (7.44) 9.39
Source: Export Promotion Bureau, Ministry of Commerce. * Figure in the parenthesis indicates negative number. Other Sectors
Remittances: The remittances by the expatriate Bangladeshis since FY 1991-92 to FY 2002-03
has been presented in Table 6.8. In 1991-92, total remittances amounted to US$ 848 million. In 1995-96, remittances of the expatriate Bangladeshis stood at US$ 1217 million representing an increase by 43.5 percent compared with those of FY 1991-92. Remittances further grew to US$ 1949 million recording an increase by 60.1 percent compared with the increase of 1995-96. However, total remittances slumped to US$ 1882 million with a decrease of 3.45 percent in 2000-01. Remittances stepped up to US$ 2501 million in the FY 2001-02, which was 32.89 percent higher, compared with the performance of previous year (FY 2000-01). On the contrary on 30 June 2003, the remittances rose to the ever-highest level of US$ 3061.97 million indicating growth of 22.42 percent over the previous year period. It may be noted that there is no negative affect on remittance flow due to Iraq war.
58
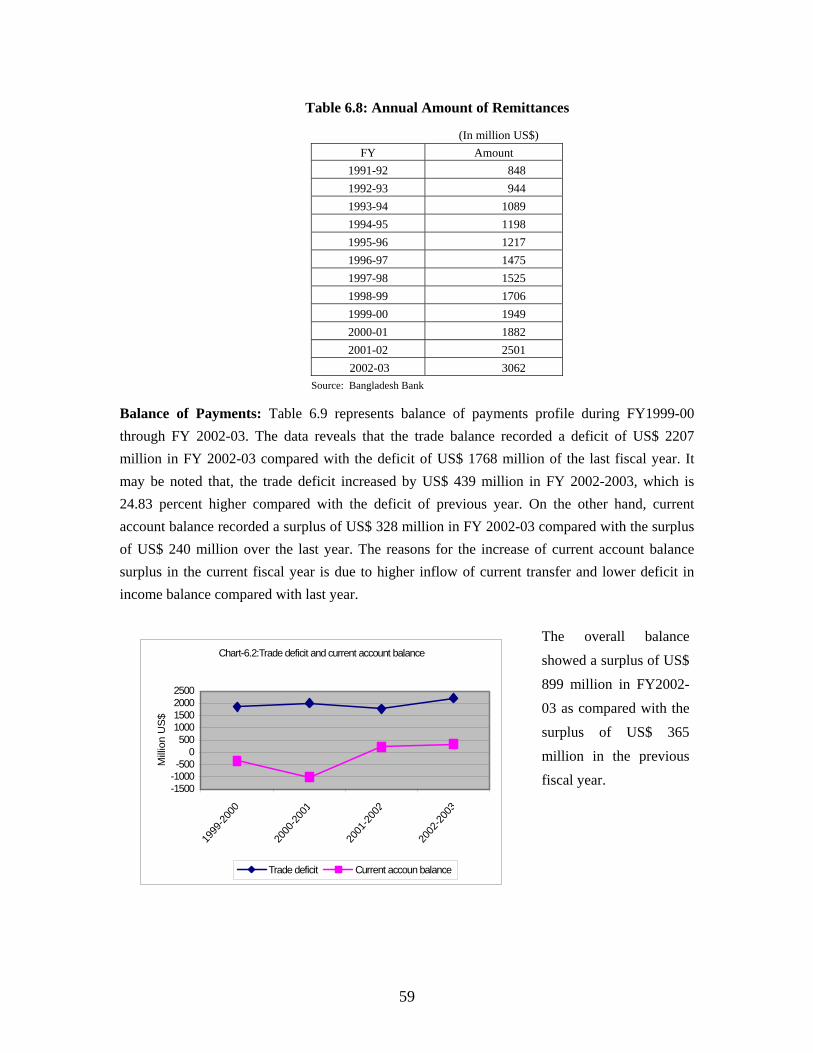
Table 6.8: Annual Amount of Remittances
(In million US$) FY Amount
1991-92 848 1992-93 944 1993-94 1089 1994-95 1198 1995-96 1217 1996-97 1475 1997-98 1525 1998-99 1706 1999-00 1949 2000-01 1882 2001-02 2501 2002-03 3062
Source: Bangladesh Bank
Balance of Payments: Table 6.9 represents balance of payments profile during FY1999-00 through FY 2002-03. The data reveals that the trade balance recorded a deficit of US$ 2207 million in FY 2002-03 compared with the deficit of US$ 1768 million of the last fiscal year. It may be noted that, the trade deficit increased by US$ 439 million in FY 2002-2003, which is 24.83 percent higher compared with the deficit of previous year. On the other hand, current account balance recorded a surplus of US$ 328 million in FY 2002-03 compared with the surplus of US$ 240 million over the last year. The reasons for the increase of current account balance surplus in the current fiscal year is due to higher inflow of current transfer and lower deficit in income balance compared with last year.
The overall balance
showed a surplus of US$899 million in FY2002-03 as compared with thesurplus of US$ 365million in the previousfiscal year.
Chart-6.2:Trade deficit and current account balance
-1500-1000-500
0500
1000150020002500
1999
-2000
2000
-2001
2001
-2002
2002
-2003
Milli
on U
S$
Trade deficit Current accoun balance
59
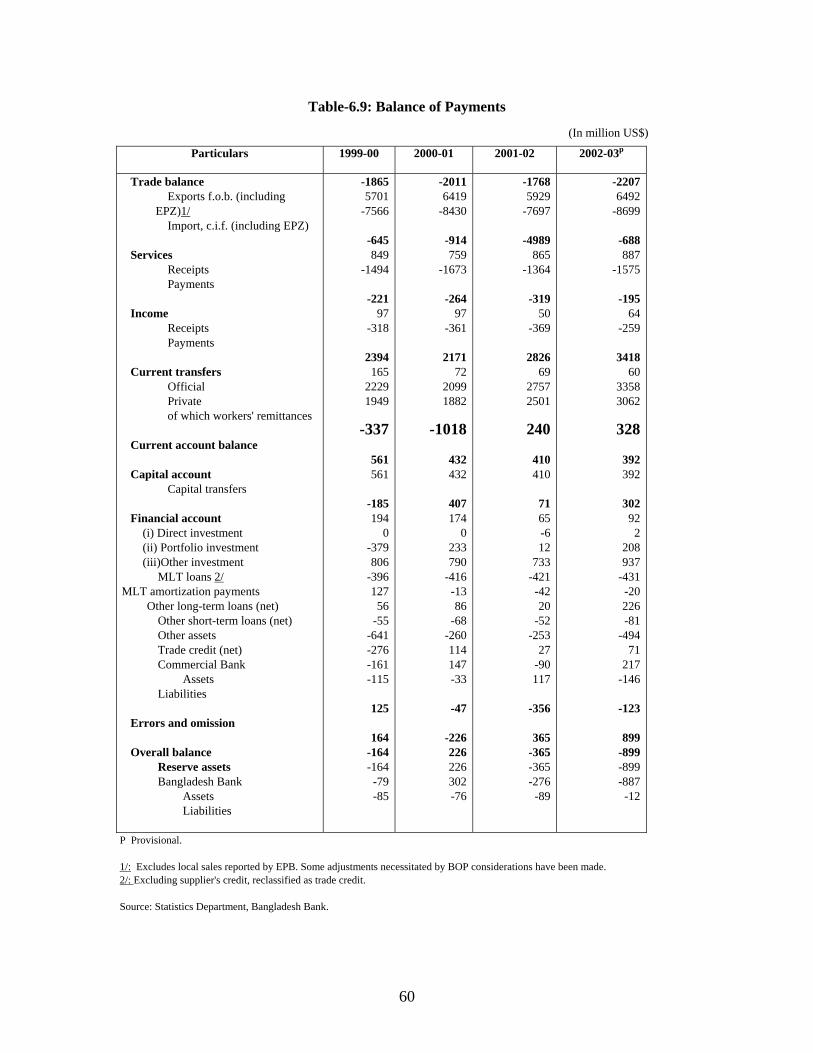
Table-6.9: Balance of Payments
(In million US$)
Particulars 1999-00 2000-01 2001-02 2002-03p
Trade balance Exports f.o.b. (including
EPZ)1/
Import, c.i.f. (including EPZ)
Services Receipts Payments
Income
Receipts Payments
Current transfers
Official Private of which workers' remittances
Current account balance
Capital account
Capital transfers
Financial account (i) Direct investment (ii) Portfolio investment (iii)Other investment MLT loans 2/
MLT amortization payments Other long-term loans (net) Other short-term loans (net) Other assets Trade credit (net) Commercial Bank
Assets Liabilities Errors and omission Overall balance Reserve assets Bangladesh Bank
Assets Liabilities
-18655701
-7566
-645849
-1494
-22197
-318
2394165
2229 1949
-337
561 561
-185194
0 -379 806
-396 127 56
-55 -641 -276 -161 -115
125
164-164-164 -79 -85
-20116419
-8430
-914759
-1673
-26497
-361
217172
2099 1882
-1018
432432
407174
0 233 790
-416 -13 86
-68 -260 114 147 -33
-47
-226226226 302 -76
-17685929
-7697
-4989865
-1364
-31950
-369
282669
2757 2501
240
410 410
7165 -6 12
733 -421 -42 20
-52 -253
27 -90 117
-356
365-365-365 -276 -89
-2207 6492
-8699
-688 887
-1575
-195 64
-259
3418 60
3358 3062
328
392 392
302 92 2
208 937
-431 -20 226 -81
-494 71
217 -146
-123
899
-899 -899 -887 -12
P Provisional. 1/: Excludes local sales reported by EPB. Some adjustments necessitated by BOP considerations have been made. 2/: Excluding supplier's credit, reclassified as trade credit. Source: Statistics Department, Bangladesh Bank.
60
CHAPTER-7
AGRICULTURE
Agriculture is one of the largest sectors of Bangladesh economy. The economic structure of Bangladesh has evolved around agricultural activities. Combined contribution of all sub-sectors (crop, livestock, forestry) of agriculture including fisheries sector was around 23.46 percent of GDP in 2002-03 (Table 7.2) of which fisheries sector accounts for 5.23 percent. The crop sub-sector alone contributes for 13.44 percent of GDP. Of the total labour force in Bangladesh 62.3 percent are engaged in agriculture (Bangladesh Labour Force Survey, 1999-2000,BBS). Agricultural products (including raw jute, jute goods and tea) account for 5.76 percent 1 (2001-02) of total exports. In order of importance, the contribution of agriculture is only after knitwear and ready made garments (RMG) exports. Agriculture has been playing a crucial role in socio-economic progress and sustainable development through upliftment of rural economy, ensuring food security, by, attaining autarky in food grains production, alleviation of poverty and so on.
Box 7.1: Main Objectives of the National Agriculture Policy
• Ensure a profitable and sustainable agricultural production system and raise the purchasing power by increasing real income of the farmers;
• Increase production and supplies of more nutritious food crops and thereby ensuring food security and improving nutritional status;
• Produce and supply agricultural commodities required as input by the industrial sector; • Reduce imports of agricultural commodities and open newer opportunities for increasing
exports as well; • Create opportunities for establishing agro-processing and agro-based industries; • Protect interests of the small and marginal farmers and share-croppers; • Update the agricultural system in the light of the Agreement on Agriculture under WTO,
SAPTA and other international treaties by protecting the national interests. Source: Ministry of Agriculture.
Agricultural Growth According to FY 2002-03 projections, the growth rate of agriculture and forestry would be 3.6 percent and 2.3 percent respectively. The growth of agriculture sector was -0.6 percent in FY 2001-02, (Base year 1995-96=100) of which growth rates in crop, livestock and forestry sub-sectors were -2.4 percent, 4.7 percent and 4.9 percent respectively. The fisheries sector recorded a growth rate of 2.2 percent. Table 7.1 presents growth rates of agriculture and fisheries sectors during FY1992-93 to 2002-2003.
1 According to data of Export Promotion Bureau (EPB).
61
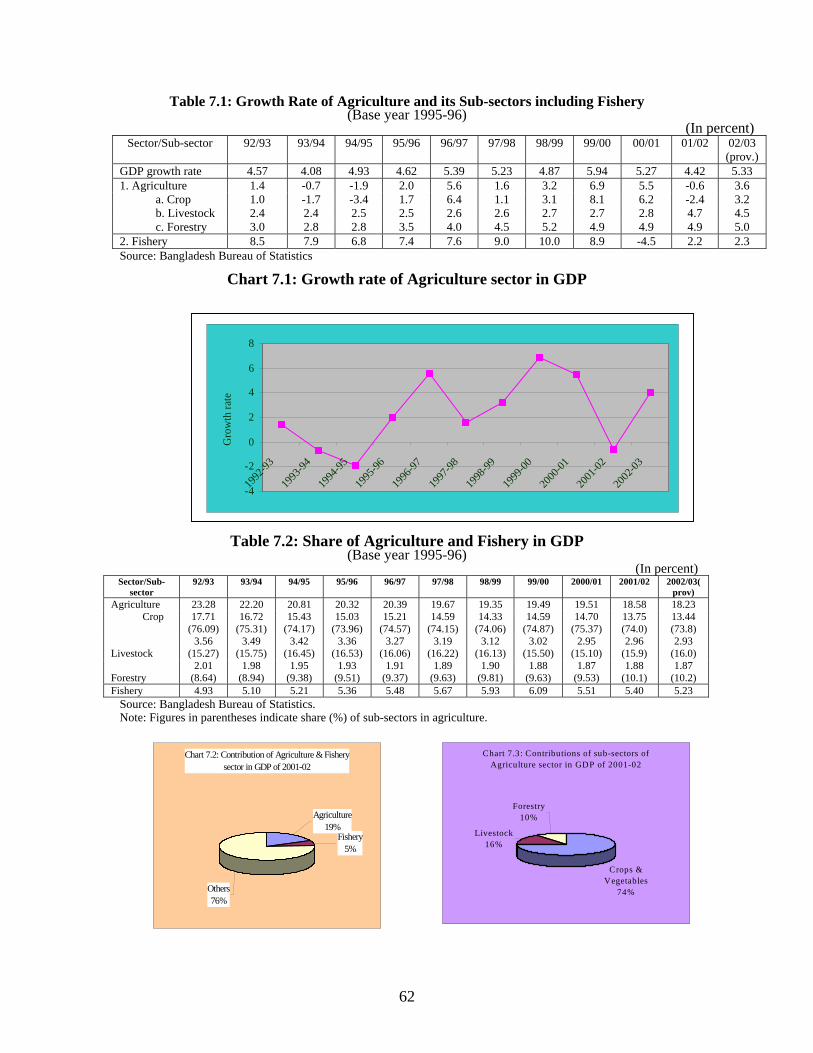
Table 7.1: Growth Rate of Agriculture and its Sub-sectors including Fishery (Base year 1995-96)
(In percent) Sector/Sub-sector 92/93 93/94 94/95 95/96 96/97 97/98 98/99 99/00 00/01 01/02 02/03
(prov.) GDP growth rate 4.57 4.08 4.93 4.62 5.39 5.23 4.87 5.94 5.27 4.42 5.33 1. Agriculture 1.4 -0.7 -1.9 2.0 5.6 1.6 3.2 6.9 5.5 -0.6 3.6
a. Crop 1.0 -1.7 -3.4 1.7 6.4 1.1 3.1 8.1 6.2 -2.4 3.2 b. Livestock 2.4 2.4 2.5 2.5 2.6 2.6 2.7 2.7 2.8 4.7 4.5 c. Forestry 3.0 2.8 2.8 3.5 4.0 4.5 5.2 4.9 4.9 4.9 5.0
2. Fishery 8.5 7.9 6.8 7.4 7.6 9.0 10.0 8.9 -4.5 2.2 2.3 Source: Bangladesh Bureau of Statistics
Chart 7.1: Growth rate of Agriculture sector in GDP
Sector/Sub-sector
9
Agriculture 2 Crop 1
(7 Livestock (1 Forestry (Fishery
Source: BanglaNote: Figures in
Ch
-4
-2
0
2
4
6
8
1992
-9319
93-94
1994
-9519
95-96
1996
-9719
97-98
1998
-9919
99-00
2000
-0120
01-02
2002
-03
Gro
wth
rate
Table 7.2: Share of Agriculture and Fishery in GDP (Base year 1995-96)
(In percent) 2/93 93/94 94/95 95/96 96/97 97/98 98/99 99/00 2000/01 2001/02
2002/03(
prov) 3.28 22.20 20.81 20.32 20.39 19.67 19.35 19.49 19.51 18.58 18.23 7.71 6.09)
16.72 (75.31)
15.43 (74.17)
15.03 (73.96)
15.21 (74.57)
14.59 (74.15)
14.33 (74.06)
14.59 (74.87)
14.70 (75.37)
13.75 (74.0)
13.44 (73.8)
3.56 5.27)
3.49 (15.75)
3.42 (16.45)
3.36 (16.53)
3.27 (16.06)
3.19 (16.22)
3.12 (16.13)
3.02 (15.50)
2.95 (15.10)
2.96 (15.9)
2.93 (16.0)
2.01 8.64)
1.98 (8.94)
1.95 (9.38)
1.93 (9.51)
1.91 (9.37)
1.89 (9.63)
1.90 (9.81)
1.88 (9.63)
1.87 (9.53)
1.88 (10.1)
1.87 (10.2)
4.93 5.10 5.21 5.36 5.48 5.67 5.93 6.09 5.51 5.40 5.23 desh Bureau of Statistics. parentheses indicate share (%) of sub-sectors in agriculture.
Chart 7.3: Contributions of sub-sectors of Agriculture sector in GDP of 2001-02
Forestry10%
Livestock16%
Crops & Vegetables
74%
art 7.2: Contribution of Agriculture & Fishery sector in GDP of 2001-02
Fishery5%
Agriculture19%
Others76%
62
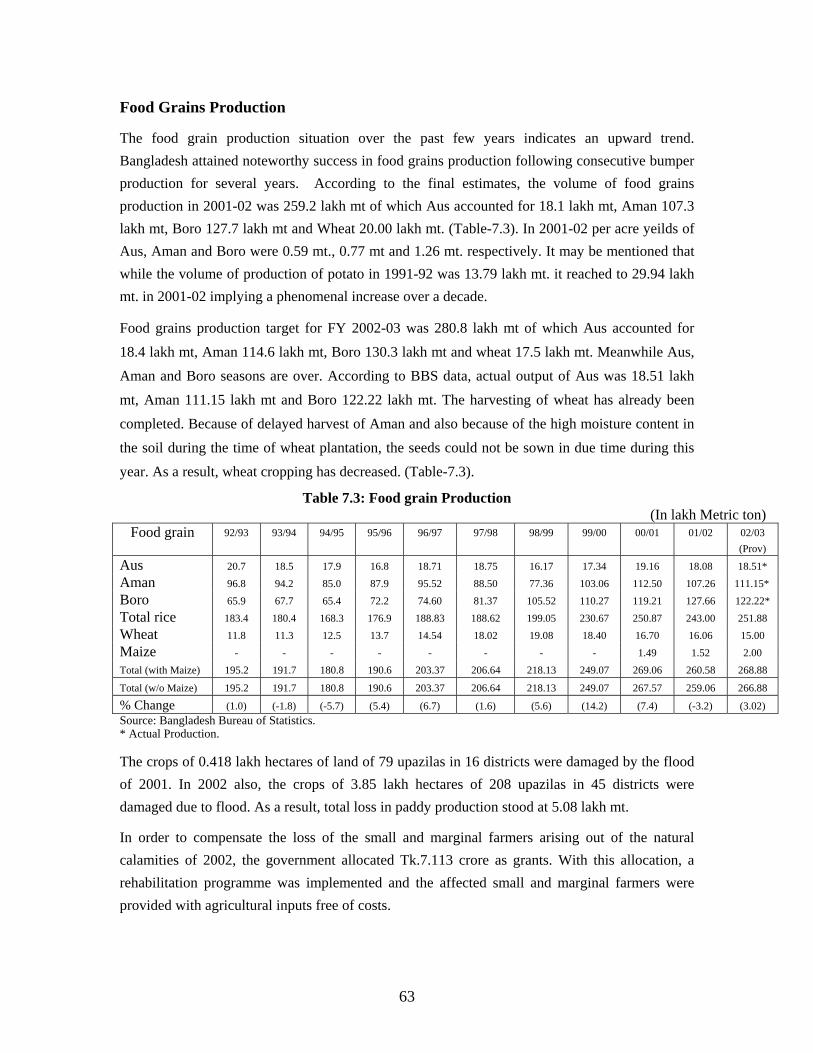
Food Grains Production The food grain production situation over the past few years indicates an upward trend. Bangladesh attained noteworthy success in food grains production following consecutive bumper production for several years. According to the final estimates, the volume of food grains production in 2001-02 was 259.2 lakh mt of which Aus accounted for 18.1 lakh mt, Aman 107.3 lakh mt, Boro 127.7 lakh mt and Wheat 20.00 lakh mt. (Table-7.3). In 2001-02 per acre yeilds of Aus, Aman and Boro were 0.59 mt., 0.77 mt and 1.26 mt. respectively. It may be mentioned that while the volume of production of potato in 1991-92 was 13.79 lakh mt. it reached to 29.94 lakh mt. in 2001-02 implying a phenomenal increase over a decade.
Food grains production target for FY 2002-03 was 280.8 lakh mt of which Aus accounted for 18.4 lakh mt, Aman 114.6 lakh mt, Boro 130.3 lakh mt and wheat 17.5 lakh mt. Meanwhile Aus, Aman and Boro seasons are over. According to BBS data, actual output of Aus was 18.51 lakh mt, Aman 111.15 lakh mt and Boro 122.22 lakh mt. The harvesting of wheat has already been completed. Because of delayed harvest of Aman and also because of the high moisture content in the soil during the time of wheat plantation, the seeds could not be sown in due time during this year. As a result, wheat cropping has decreased. (Table-7.3).
Table 7.3: Food grain Production (In lakh Metric ton)
Food grain 92/93 93/94 94/95 95/96 96/97 97/98 98/99 99/00 00/01 01/02
02/03 (Prov)
Aus 20.7 18.5 17.9 16.8 18.71 18.75 16.17 17.34 19.16 18.08 18.51* Aman 96.8 94.2 85.0 87.9 95.52 88.50 77.36 103.06 112.50 107.26 111.15* Boro 65.9 67.7 65.4 72.2 74.60 81.37 105.52 110.27 119.21 127.66 122.22* Total rice 183.4 180.4 168.3 176.9 188.83 188.62 199.05 230.67 250.87 243.00 251.88 Wheat 11.8 11.3 12.5 13.7 14.54 18.02 19.08 18.40 16.70 16.06 15.00 Maize - - - - - - - - 1.49 1.52 2.00 Total (with Maize) 195.2 191.7 180.8 190.6 203.37 206.64 218.13 249.07 269.06 260.58 268.88
Total (w/o Maize) 195.2 191.7 180.8 190.6 203.37 206.64 218.13 249.07 267.57 259.06 266.88
% Change (1.0) (-1.8) (-5.7) (5.4) (6.7) (1.6) (5.6) (14.2) (7.4) (-3.2) (3.02) Source: Bangladesh Bureau of Statistics. * Actual Production.
The crops of 0.418 lakh hectares of land of 79 upazilas in 16 districts were damaged by the flood of 2001. In 2002 also, the crops of 3.85 lakh hectares of 208 upazilas in 45 districts were damaged due to flood. As a result, total loss in paddy production stood at 5.08 lakh mt.
In order to compensate the loss of the small and marginal farmers arising out of the natural calamities of 2002, the government allocated Tk.7.113 crore as grants. With this allocation, a rehabilitation programme was implemented and the affected small and marginal farmers were provided with agricultural inputs free of costs.
63
Food Budget
Food grains (rice and wheat) production target during 2002-03 was set at 280.8 lakh mt and the net food grain production (after adjustment of 10% for seed, animal feed and wastage) stood at 252.72 lakh mt. According to data of Food Planning & Monitoring Unit (FPMU), Ministry of Food, demand for food grain in the country was projected at 223.51 lakh mt. in the FY2002-03. The government internal procurement of food grains stood at 10.53 lakh mt. (rice 7.26 lakh mt. and wheat 3.27 lakh mt.) in 2001-02. It was decided to procure 9.03 lakh mt (rice 6.36 lakh mt. and wheat 2.67 lakh mt.) internally during the FY2002-03. Up to June'03, 9.52 lakh mt (rice 8.16 lakh mt & wheat 1.36 lakh mt) were procured through public internal procurement drive. Food grain import was 5.09 lakh mt. in 2001-02 as food aid. Up to June'03, 29.66 lakh mt of food grain (rice 15.52 lakh mt & wheat 14.14 lakh mt) were imported by private sector. Food import figure stood at 32.20 lakh mt in June'03. Food grain import during FY1980-81 to 2002-03 is shown at Appendix Table 22.
Management of Agriculture
Bangladesh is predominantly an agricultural country. Agriculture being the engine of growth of the economy, we have no other alternative but to develop agriculture sector for alleviation of poverty by attaining accelerated economic growth. Since provision of food security, improvement of the living standard and generation of employment opportunities of the huge population of the country are directly linked to the development of agriculture, there has been continued efforts by the government for the overall development of this sector. To fulfill the food and nutritional demand of the growing population of the country and to ensure and sustain dependable food security, special emphasis has been laid on building up a modern agricultural system based on appropriate technology. In this regard, various reform measures have been taken which include ensuring the availability of agricultural inputs including fertilizer at the door-steps of the farmers, implementation of the agricultural extension policy, simplification of the disbursement procedures of agricultural credit, creating opportunities for investment in agriculture, modernisation of research system for quality improvement of agro-products, the utilisation and extension of the integrated technologies derived from research.
Because of the regular monitoring of fertilizer distribution situation and adopting timely measures, fertilizer supply and distribution across the country has improved. The measures for the improvement of fertilizer distribution include inter alia setting up monitoring system in the Ministry of Agriculture, extension of the dealership system up to upazila level, increasing the number of buffer stock centres, strengthening the monitoring system both at the district and upazila level, motivating the farmers to use super quality fertilizers like DAP/NPKS, using granular urea for transplanted paddy cultivation, prohibiting import of granular and coloured SSP fertilizer, withdrawal of advance income tax and development surcharge from TSP, DAP, MOP and NPKS fertilizers to encourage the farmers to use nutrient rich phosphatic fertilizers, etc. These steps resulted in steady and smooth supply of fertilizers throughout the country.
64
For the development of agriculture and for achieving the target of crop production with success, programmes have been undertaken for intensive seasonal crop production, strengthening activities of agricultural extension at field level and other supportive activities through 99 ADP projects of the previous year and 108 ongoing projects of the current fiscal year with an allocation of Tk.468.76 crore by different Departments/Directorates/Agencies of the Ministry of Agriculture. Crop diversification programmes have been taken up to retain the soil fertility. The development of 19 wholesale markets is now under implementation to strengthen agricultural marketing system and ensure fair price of agro-commodities. The seed certification agency tested 1800 hectares of crop land last year and 1393 sample seeds were tested at the farm level. Besides, the various research institutes like Bangladesh Agricultural Research Institute (BARI), Bangladesh Rice Research Institute (BRRI), Bangladesh Institute of Nuclear Agriculture (BINA) and other associated institutes have been developing new technologies, HYVs, in their respective fields. Application of newly developed technologies are ultimately contributing to enrich the country through increased agricultural production. Despite significant achievement in food grains production, we have much potential to increase crop production through the application of biotechnology and this potentiality is now being explored.
Irrigation
Irrigation is considered as the critical input for sustaining the increasing trend in yield and production of food grains and other crops. Since inception of minor irrigation projects (power pump, DTW, STW and floating pump etc.) implemented by the government in early sixties, area under irrigation i.e. irrigated area has been expanding. Area under irrigation, however, has not been increasing commensurate with expansion of irrigation equipment. Irrigation water is not being utilised economically for augmenting agricultural production because of inefficiency and mismanagement in its use at the field level. Much fuel cost could have been saved and more area could have been brought under irrigation with better irrigation water management. Keeping this in view, farm water management has been given top priority in the National Agricultural Policy. There are continued efforts to intensify crop production and crop diversification and increase crop production by ensuring well-integrated and planned use of both surface and under-ground water. There were 16 ongoing projects in FY2002-03 in different places of the country for the development of the irrigation. The following among them are the notable ones; (1) Survey and Monitoring project for Minor Irrigation Development; (2) Prevention of intrusion of saline water and the development of drainage system in Kumira-Sonai Chari region of Sitakunda upazila and the construction of water reservoir in Guptakhali and irrigation project (3) Project for the development of irrigation area (Barendra project); (4) Project for installation of deep tube-wells in Barendra area; (5) Ashugonj Palash agro-irrigation project etc. The overall objectives of these projects are to develop minor irrigation, proper use of the surface water, extension of irrigation facilities in draught prone areas and poverty reduction through command area development.
65
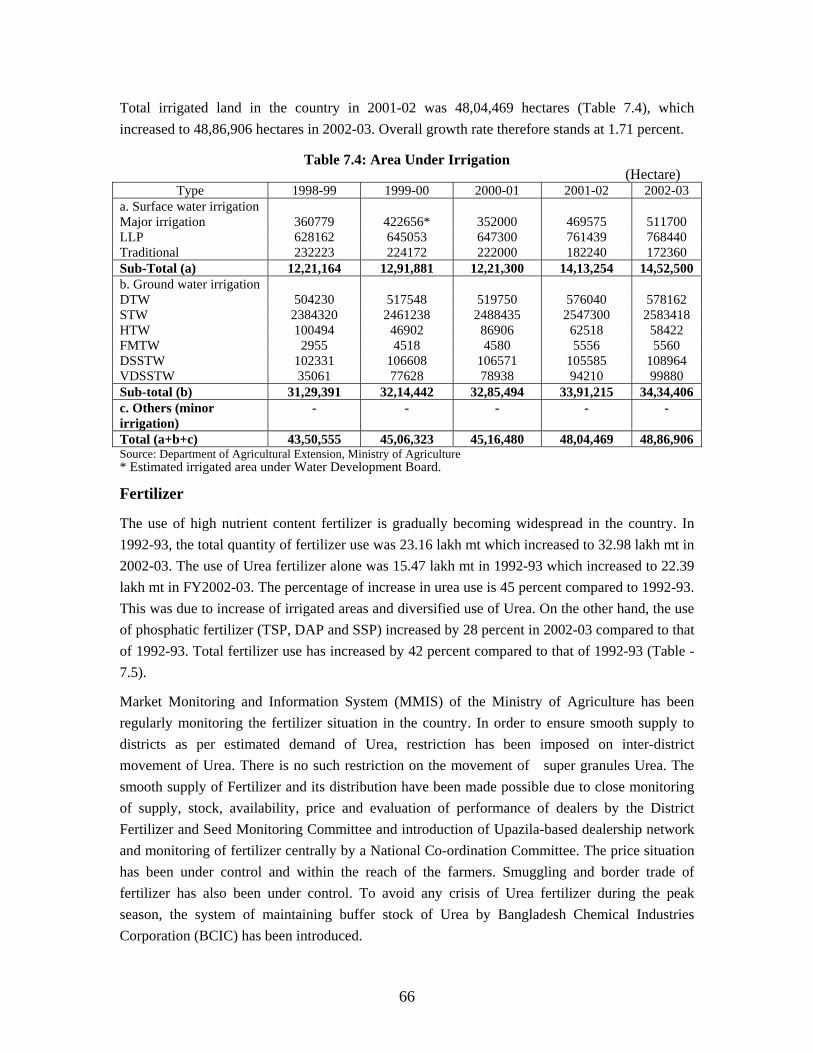
Total irrigated land in the country in 2001-02 was 48,04,469 hectares (Table 7.4), which increased to 48,86,906 hectares in 2002-03. Overall growth rate therefore stands at 1.71 percent.
Table 7.4: Area Under Irrigation
(Hectare) Type 1998-99 1999-00 2000-01 2001-02 2002-03
a. Surface water irrigation Major irrigation
360779
422656*
352000
469575
511700
LLP 628162 645053 647300 761439 768440 Traditional 232223 224172 222000 182240 172360 Sub-Total (a) 12,21,164 12,91,881 12,21,300 14,13,254 14,52,500 b. Ground water irrigation DTW 504230 517548 519750 576040 578162 STW 2384320 2461238 2488435 2547300 2583418 HTW 100494 46902 86906 62518 58422 FMTW 2955 4518 4580 5556 5560 DSSTW 102331 106608 106571 105585 108964 VDSSTW 35061 77628 78938 94210 99880 Sub-total (b) 31,29,391 32,14,442 32,85,494 33,91,215 34,34,406 c. Others (minor irrigation)
- - - - -
Total (a+b+c) 43,50,555 45,06,323 45,16,480 48,04,469 48,86,906 Source: Department of Agricultural Extension, Ministry of Agriculture * Estimated irrigated area under Water Development Board.
Fertilizer
The use of high nutrient content fertilizer is gradually becoming widespread in the country. In 1992-93, the total quantity of fertilizer use was 23.16 lakh mt which increased to 32.98 lakh mt in 2002-03. The use of Urea fertilizer alone was 15.47 lakh mt in 1992-93 which increased to 22.39 lakh mt in FY2002-03. The percentage of increase in urea use is 45 percent compared to 1992-93. This was due to increase of irrigated areas and diversified use of Urea. On the other hand, the use of phosphatic fertilizer (TSP, DAP and SSP) increased by 28 percent in 2002-03 compared to that of 1992-93. Total fertilizer use has increased by 42 percent compared to that of 1992-93 (Table -7.5).
Market Monitoring and Information System (MMIS) of the Ministry of Agriculture has been regularly monitoring the fertilizer situation in the country. In order to ensure smooth supply to districts as per estimated demand of Urea, restriction has been imposed on inter-district movement of Urea. There is no such restriction on the movement of super granules Urea. The smooth supply of Fertilizer and its distribution have been made possible due to close monitoring of supply, stock, availability, price and evaluation of performance of dealers by the District Fertilizer and Seed Monitoring Committee and introduction of Upazila-based dealership network and monitoring of fertilizer centrally by a National Co-ordination Committee. The price situation has been under control and within the reach of the farmers. Smuggling and border trade of fertilizer has also been under control. To avoid any crisis of Urea fertilizer during the peak season, the system of maintaining buffer stock of Urea by Bangladesh Chemical Industries Corporation (BCIC) has been introduced.
66

Since 1995-96 Urea super/mega granules are being manufactured and marketed through private sector. This has resulted in reduction of the misuse of Urea, saving of 30 to 35 percent of Urea and 20 to 25 percent increase in yield and also employment opportunities in the rural areas. The number of machines for manufacturing Urea super granules has increased to 860 (838 super + 22 mega granules) in 54 districts till February 2003. It has been planned to use super/mega granules in 7.50 lakh hectares of Transplanted Paddy (Aman 81,250 hectares, Boro 6,31,250 hectares and Aus 37,500 hectares) during 2002-03. Super/mega-granules are also being used in other Rabi crops. In order to implement this plan, 1.25 lakh mt of urea is being specially allotted among the manufacturers for Aman and transplanted Aus. Besides, use of different types of mixed fertilizer is being encouraged for balanced use of fertilizer. Programmes for production and marketing of NPKS fertilizer have been undertaken locally by BCIC at Chittagong TSP Complex, Northern Agro-Services Ltd., Dinajpur and Aftab Fertilizers & Chemicals Ltd., Narayangonj under private sector. Import of NPKS is also being encouraged under private sector.
Import of more nutrient content DAP, TSP, NPKS and potash, instead of low nutrient content SSP fertilizer is being encouraged and farmers are also being motivated to use such fertilizer. In order to maintain the quality of fertilizer and also to control production, import and marketing of adulterated/low quality fertilizer, steps are being taken to enforce Fertilizer (Control) order, 1999. Post-landing inspection has been strengthened in the case of imported fertilizer in the private sector. Compilation of Manuals for fertilizer inspection and fertilizer analysis is now under process.
Table 7.5: Use of Chemical Fertilizer ('000' metric ton)
Type 92/93 93/94 94/95 95/96 96/97 97/98 98/99 99/00 00/01 01/02 02/03 (prov.)
Urea 1547.4 1579.0 1748.5 2045.5 2141.0 1867.0 1902.0 2151.1 2121.0 2247.42 2239.0 TSP 407.0 234.2 122.9 111.1 72.6 62.4 170.2 259.3 399.5 401.46 405.0 DAP 2.0 28.7 1.8 0 0 6.8 38.6 109.2 90.1 127.03 112.0 MP 126.1 103.9 154.2 155.9 219.3 193.5 210.8 239.5 139.8 233.25 250.0 SSP NPKS
119.8 0
170.6 0
533.5 0
596.9 0
525.3 0
473.3 0
362.4 0
237.2 0
138.6 10.2
127.13 12.87
130.0 30.0
AS 5.0 10.0 2.5 8.7 11.7 9.7 12.4 26.0 13.0 20.19 10.0 Zinc 0.7 5.2 0 1.0 1.2 0.7 0.3 1.2 3.0 0.24 2.0 Gypsum 108.2 86.1 77.2 103.6 86.6 113.4 128.2 189.4 102.3 115.58 120.0 Others 0 0.1 0 0 0 0 0 0 0 0 0 Total 2316.2 2217.8 2640.6 3022.7 3057.7 2726.8 2824.9 3212.9 3017.5 3285.07 3298.0 Source: Ministry of Agriculture
Agricultural credit
Disbursement of agricultural credit rose from Tk.794.59 crore in 1991-92 to Tk.2954.91 crore in 2001-02. During FY 2002-03 disbursement stood at Tk. 3278.37 crore. The overall situation of agricultural credit during FY1990-91 to 2002-03 is presented in Table 7.6.
67
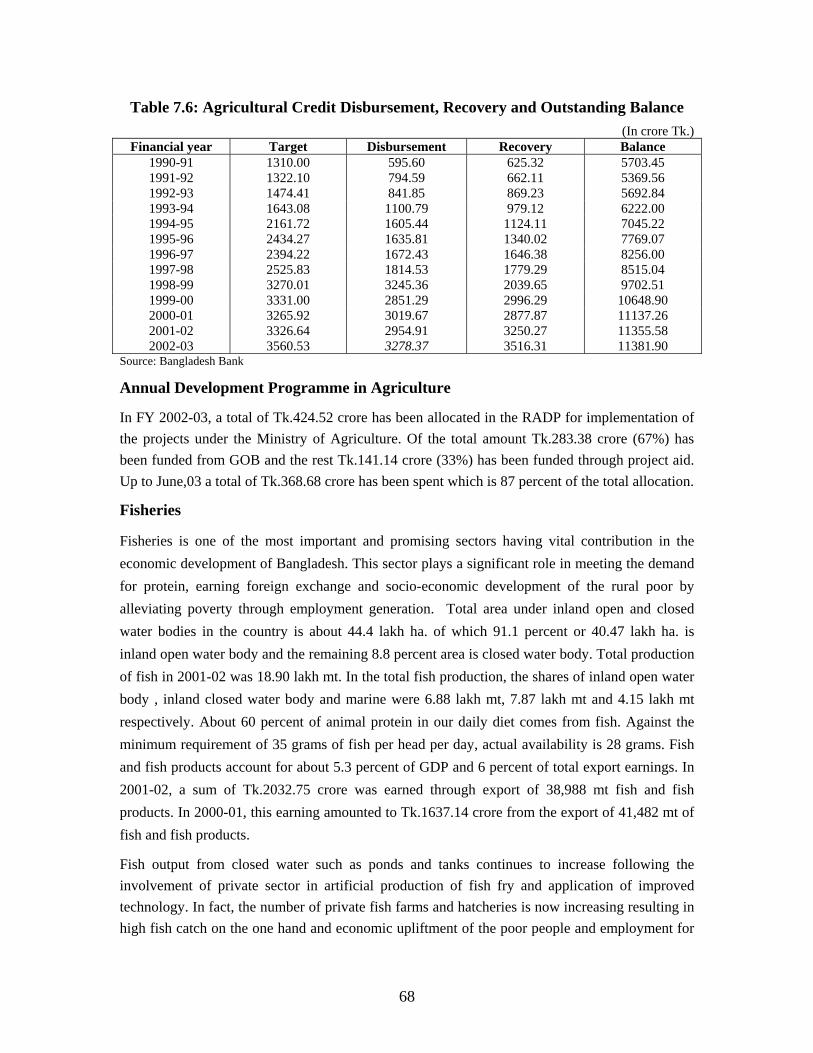
Table 7.6: Agricultural Credit Disbursement, Recovery and Outstanding Balance (In crore Tk.)
Financial year Target Disbursement Recovery Balance 1990-91 1991-92
1310.00 1322.10
595.60 794.59
625.32 662.11
5703.45 5369.56
1992-93 1474.41 841.85 869.23 5692.84 1993-94 1643.08 1100.79 979.12 6222.00 1994-95 2161.72 1605.44 1124.11 7045.22 1995-96 2434.27 1635.81 1340.02 7769.07 1996-97 2394.22 1672.43 1646.38 8256.00 1997-98 2525.83 1814.53 1779.29 8515.04 1998-99 3270.01 3245.36 2039.65 9702.51 1999-00 3331.00 2851.29 2996.29 10648.90 2000-01 2001-02 2002-03
3265.92 3326.64 3560.53
3019.67 2954.91 3278.37
2877.87 3250.27 3516.31
11137.26 11355.58 11381.90
Source: Bangladesh Bank
Annual Development Programme in Agriculture
In FY 2002-03, a total of Tk.424.52 crore has been allocated in the RADP for implementation of the projects under the Ministry of Agriculture. Of the total amount Tk.283.38 crore (67%) has been funded from GOB and the rest Tk.141.14 crore (33%) has been funded through project aid. Up to June,03 a total of Tk.368.68 crore has been spent which is 87 percent of the total allocation.
Fisheries
Fisheries is one of the most important and promising sectors having vital contribution in the economic development of Bangladesh. This sector plays a significant role in meeting the demand for protein, earning foreign exchange and socio-economic development of the rural poor by alleviating poverty through employment generation. Total area under inland open and closed water bodies in the country is about 44.4 lakh ha. of which 91.1 percent or 40.47 lakh ha. is inland open water body and the remaining 8.8 percent area is closed water body. Total production of fish in 2001-02 was 18.90 lakh mt. In the total fish production, the shares of inland open water body , inland closed water body and marine were 6.88 lakh mt, 7.87 lakh mt and 4.15 lakh mt respectively. About 60 percent of animal protein in our daily diet comes from fish. Against the minimum requirement of 35 grams of fish per head per day, actual availability is 28 grams. Fish and fish products account for about 5.3 percent of GDP and 6 percent of total export earnings. In 2001-02, a sum of Tk.2032.75 crore was earned through export of 38,988 mt fish and fish products. In 2000-01, this earning amounted to Tk.1637.14 crore from the export of 41,482 mt of fish and fish products.
Fish output from closed water such as ponds and tanks continues to increase following the involvement of private sector in artificial production of fish fry and application of improved technology. In fact, the number of private fish farms and hatcheries is now increasing resulting in high fish catch on the one hand and economic upliftment of the poor people and employment for
68
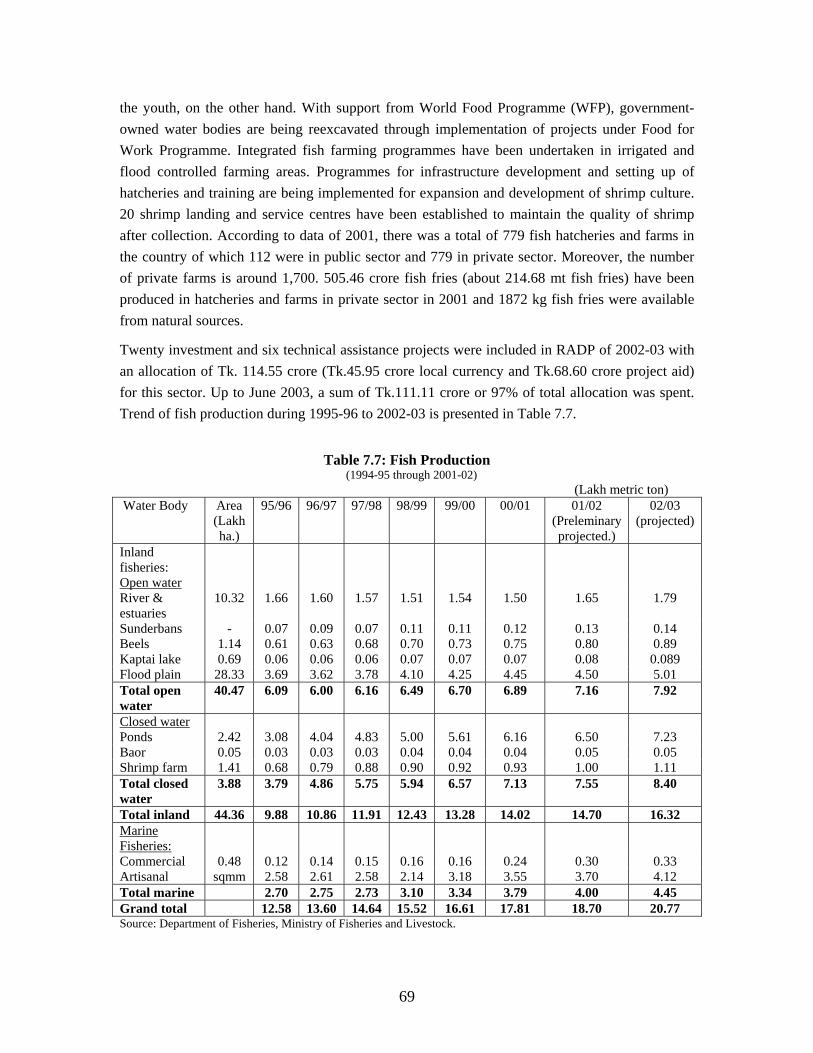
the youth, on the other hand. With support from World Food Programme (WFP), government-owned water bodies are being reexcavated through implementation of projects under Food for Work Programme. Integrated fish farming programmes have been undertaken in irrigated and flood controlled farming areas. Programmes for infrastructure development and setting up of hatcheries and training are being implemented for expansion and development of shrimp culture. 20 shrimp landing and service centres have been established to maintain the quality of shrimp after collection. According to data of 2001, there was a total of 779 fish hatcheries and farms in the country of which 112 were in public sector and 779 in private sector. Moreover, the number of private farms is around 1,700. 505.46 crore fish fries (about 214.68 mt fish fries) have been produced in hatcheries and farms in private sector in 2001 and 1872 kg fish fries were available from natural sources.
Twenty investment and six technical assistance projects were included in RADP of 2002-03 with an allocation of Tk. 114.55 crore (Tk.45.95 crore local currency and Tk.68.60 crore project aid) for this sector. Up to June 2003, a sum of Tk.111.11 crore or 97% of total allocation was spent. Trend of fish production during 1995-96 to 2002-03 is presented in Table 7.7.
Table 7.7: Fish Production
(1994-95 through 2001-02) (Lakh metric ton)
Water Body Area (Lakh ha.)
95/96 96/97 97/98 98/99 99/00 00/01 01/02 (Preleminary projected.)
02/03 (projected)
Inland fisheries: Open water
River & estuaries
10.32 1.66 1.60 1.57 1.51 1.54 1.50
1.65 1.79
Sunderbans - 0.07 0.09 0.07 0.11 0.11 0.12 0.13 0.14 Beels 1.14 0.61 0.63 0.68 0.70 0.73 0.75 0.80 0.89 Kaptai lake 0.69 0.06 0.06 0.06 0.07 0.07 0.07 0.08 0.089 Flood plain 28.33 3.69 3.62 3.78 4.10 4.25 4.45 4.50 5.01 Total open water
40.47 6.09 6.00 6.16 6.49 6.70 6.89 7.16 7.92
Closed water Ponds 2.42 3.08 4.04 4.83 5.00 5.61 6.16 6.50 7.23 Baor 0.05 0.03 0.03 0.03 0.04 0.04 0.04 0.05 0.05 Shrimp farm 1.41 0.68 0.79 0.88 0.90 0.92 0.93 1.00 1.11 Total closed water
3.88 3.79 4.86 5.75 5.94 6.57 7.13 7.55 8.40
Total inland 44.36 9.88 10.86 11.91 12.43 13.28 14.02 14.70 16.32 Marine Fisheries:
Commercial 0.48 0.12 0.14 0.15 0.16 0.16 0.24 0.30 0.33 Artisanal sqmm 2.58 2.61 2.58 2.14 3.18 3.55 3.70 4.12 Total marine 2.70 2.75 2.73 3.10 3.34 3.79 4.00 4.45 Grand total 12.58 13.60 14.64 15.52 16.61 17.81 18.70 20.77 Source: Department of Fisheries, Ministry of Fisheries and Livestock.
69
Livestock
Livestock plays an important role in the agrarian economy of Bangladesh. It has been considered as one of the important sectors for creating jobs and alleviation of poverty. The role of this sub-sector in earning foreign exchange through export of livestock products like leather, feather, wool, bone etc. is quite important. This sub-sector accounted for 3.12 percent of GDP in 2001-02 and the growth rate of this sub-sector was about 3.20 percent. In tandem with mechanized cultivation, 95 percent of tilling is done by bullock. Nearly twenty-five percent of population is dependent on this sub-sector on full time basis and 50 percent on part time basis. As a result of involvement of private sector and NGOs, the opportunity of managing this sector on commercial basis has been opened.
Data from Ministry of Fisheries and Livestock indicate that the number of cattle and poultry population in 1991-92 were 4.19 crore and 11.05 crore respectively. In 2001-02, these number increased to 8.17 crore and 16.35 crore respectively. Production of eggs (hen and duck) stood at 379 crore in 1999-2000. In 2001-02, this figure increased to 389 crore. Milk and meat output grew from 13.52 lakh mt and 4.60 lakh mt respectively in 1991-92 to 17.5 lakh mt and 7.8 mt in 2001-02.
In a bid to develop livestock resources, the government has set up a large number of livestock and poultry farms through implementation of ADP. Also in order to alleviate poverty, the Government implemented goat rearing projects throughout the country on priority basis.
A total of twenty-two projects including four technical assistance projects have been undertaken by the Department of Livestock in 2002-03. A total of Tk. 96.43 crore has been allocated in the RADP of FY2002-03. Up to June, 2003, 90 percent of the allocation amounting Tk. 86.75 crore has been utilized. It may be mentioned that self-employed youths both male and female trained by the Department of Youth play a major role for the establishment of livestock and poultry farms on commercial basis.
Forestry
Forestry sub-sector, besides making substantial contribution to national economy, plays a predominant role in maintaining ecological balance. According to preliminary estimates the sub-sector accounts for 1.86 percent of total GDP and 10.2 percent of agricultural income in 2002-03. At present, the growth rate of this sub-sector is 5.0 percent (at constant prices of 1995-96). Total area under forest in the country is 25 lakh ha. which is about 17 percent of total land area. Only 45 percent has tree coverage. Two percent of total labour force in the country is engaged in forestry sub-sector. Increasing growth of population, trespassing in forests, large-scale felling of trees for use as fuel, have had adverse impact on environment.
Government has undertaken a comprehensive forest development programme aimed at large-scale afforestation and preservation of forests in the country, offsetting depletion of forest
70
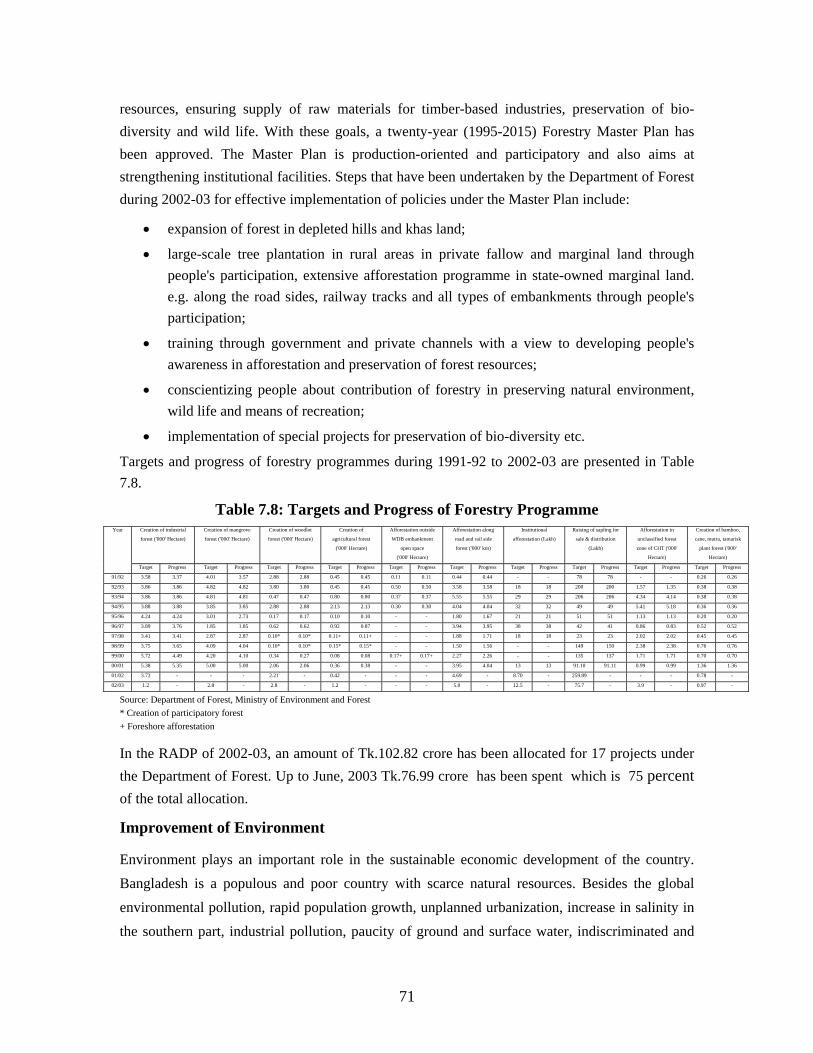
resources, ensuring supply of raw materials for timber-based industries, preservation of bio-diversity and wild life. With these goals, a twenty-year (1995-2015) Forestry Master Plan has been approved. The Master Plan is production-oriented and participatory and also aims at strengthening institutional facilities. Steps that have been undertaken by the Department of Forest during 2002-03 for effective implementation of policies under the Master Plan include:
• expansion of forest in depleted hills and khas land;
• large-scale tree plantation in rural areas in private fallow and marginal land through people's participation, extensive afforestation programme in state-owned marginal land. e.g. along the road sides, railway tracks and all types of embankments through people's participation;
• training through government and private channels with a view to developing people's awareness in afforestation and preservation of forest resources;
• conscientizing people about contribution of forestry in preserving natural environment, wild life and means of recreation;
• implementation of special projects for preservation of bio-diversity etc.
Targets and progress of forestry programmes during 1991-92 to 2002-03 are presented in Table 7.8.
Table 7.8: Targets and Progress of Forestry Programme Creation of industrial
forest ('000' Hectare)
Creation of mangrove
forest ('000' Hectare)
Creation of woodlot
forest ('000' Hectare)
Creation of
agricultural forest
('000' Hectare)
Afforestation outside
WDB embankment
open space
('000' Hectare)
Afforestation along
road and rail side
forest ('000' km)
Institutional
afforestation (Lakh)
Raising of sapling for
sale & distribution
(Lakh)
Afforestation in
unclassified forest
zone of CHT ('000'
Hectare)
Creation of bamboo,
cane, mutra, tamarisk
plant forest ('000'
Hectare)
Year
Target Progress Target Progress Target Progress Target Progress Target Progress Target Progress Target Progress Target Progress Target Progress Target Progress
91/92 3.58 3.37 4.01 3.57 2.88 2.88 0.45 0.45 0.11 0.11 0.44 0.44 - - 78 78 - - 0.26 0.26
92/93 3.86 3.86 4.82 4.82 3.80 3.80 0.45 0.45 0.50 0.50 3.58 3.58 18 18 200 200 1.57 1.35 0.38 0.38
93/94 3.86 3.86 4.81 4.81 0.47 0.47 0.80 0.80 0.37 0.37 5.55 5.55 0.38 29 29 206 206 4.34 4.14 0.38
94/95 3.88 3.88 3.85 3.85 2.88 2.88 4.04 5.18 2.13 2.13 0.30 0.30 4.04 32 32 49 49 5.41 0.36 0.36
95/96 4.24 4.24 3.01 2.73 0.17 0.17 0.10 0.10 - - 1.80 1.67 21 21 51 51 1.13 1.13 0.20 0.20
96/97 3.89 3.76 1.85 1.85 0.62 0.62 0.92 0.87 - - 3.94 3.95 38 38 42 41 0.86 0.83 0.52 0.52
97/98 3.41 3.41 2.87 2.87 0.10* 0.10* 0.11+ 0.11+ - - 1.88 1.71 18 18 23 23 2.02 2.02 0.45 0.45
98/99 3.75 3.65 4.09 4.04 0.10* 0.10* 0.15* 0.15* - - 1.50 1.56 - - 149 150 2.38 2.38 0.76 0.76
99/00 5.72 4.49 4.20 4.10 0.34 0.27 0.08 0.08 0.17+ 0.17+ 2.27 2.26 - - 135 137 1.71 1.71 0.70 0.70
00/01 5.38 5.35 5.00 5.00 2.06 2.06 0.36 0.38 - - 3.95 4.04 13 13 91.10 91.11 0.99 0.99 1.36 1.36
01/02 3.73 - - - 2.21 - 0.42 - - - 4.69 - 8.70 - 259.89 - - - 0.78 -
02/03 1.2 - 2.8 - 2.8 - 1.2 - - - 5.0 - 12.5 - 75.7 - 3.9 - 0.97 -
Source: Department of Forest, Ministry of Environment and Forest * Creation of participatory forest + Foreshore afforestation
In the RADP of 2002-03, an amount of Tk.102.82 crore has been allocated for 17 projects under the Department of Forest. Up to June, 2003 Tk.76.99 crore has been spent which is 75 percent of the total allocation.
Improvement of Environment
Environment plays an important role in the sustainable economic development of the country. Bangladesh is a populous and poor country with scarce natural resources. Besides the global environmental pollution, rapid population growth, unplanned urbanization, increase in salinity in the southern part, industrial pollution, paucity of ground and surface water, indiscriminated and
71
imprudent extraction of ground water, arsenic contamination and air pollution etc. are posing serious environmental threats to the country. Present government has undertaken many initiatives for attaining sustainable development and the abatement of pollution. Of these, the notable ones are as follows:
Air Pollution control: The main source of air pollution in Dhaka city is exhaust of poisonous vehicles. To contain and curb air pollution the government has imposed ban on the import of the most air polluting vehicles, two-stroke three wheelers chassis and two-stroke three-wheelers vehicles. Besides, the Government has imposed ban on plying of two-stroke three-wheeler in Dhaka city from 1 January, 2003. Restriction has been imposed on the plying of older buses and trucks in Dhaka city which cause pollution. The Environment Conservation Rules 1997 has been revised making the use of Catalytic Converter and Diesel Particulate filter compulsory in the petrol and diesel run vehicles respectively. Catalytic Converter and Diesel particulate filter have been formally introduced in Dhaka city on 7 August 2002. At present, instead of two stroke three wheelers, four stroke CNG run auto-rickshaws are plying in Dhaka city.
Initiatives to Control Production and Use of Polythene Bags: Widespread use of polythene shopping bags brought about massive socio-economic and environmental disaster. Government has banned the use of polythene and its marketing in Dhaka city since 1st January, 2002 to prevent such disaster. Later, since 1st March 2002, the ban has been extended throughout Bangladesh. In order to implement legally the declaration of ban on production, use and marketing of all kinds of polythene shopping bags, the Environmental Conservation Act (Amendment) 2002 has been passed by amending the Environmental Conservation Act, 1997.
Environmental Court Act, 2002 and Establishment of Environmental Court:
First of its kind in the country, the Environmental Court has been set up to facilitate the quick trial of all environmental offences. To run the Environmental Courts, the Government has promulgated the Environment Court Act. The court has already started functioning in Dhaka and Chittagong. Special magistrates have been appointed in each district to ensure lawful prosecution of environmental offences.
Initiative taken to control burning of wood in the brickfields and steps taken for the Environment Clearance Certificate:
According to Brick Burning (Control) (Amendment) Act, 2001, issuance of license from the Deputy Commissioner (DC) is mandatory. Under this Act, using tree as fuel wood for burning of bricks is prohibited. Initiative has been taken to manufacture environment friendly "Block Brick" instead of traditional brick. Use of low sulphur content coal as fuel and installing Chimney with the height of 120 ft. have been made mandatory for brick field.
72
Save Buriganga programme: Hazaribagh tannery is one of the major sources of pollution of the Buriganga River. To protect the inhabitants of Dhaka city and to save the Buriganga River, Government has planned to shift the existing Tanneries of Hazaribagh to Horindhara, a place in between Savar and Keranigonj Upazila. For this purpose, 200 acres of land have been acquired and further 200 acres of land to be demarcated for future expansion. Bangladesh Inland Water Transport Authority (BIWTA), with the help of law enforcing agency removed substantial numbers of illegal structures and the process is still going on.
Conservation of Environmental System:
Effective measures have been taken to protect Gulshan-Baridhara lake, wet land of Ashulia and other ecosystems of the country. The hills have been contributing significantly to protect the environment and eco-system of the country. But indiscriminate cutting of hills is causing environmental degradation and imbalance. Necessary circulars have been issued to stop cutting of hills. Significant success has been achieved in stopping hill cutting through organizing mass consultation in different parts of the country. Bangladesh has achieved substantial success in protecting ozone layer. Lack of environmentally sound disposal of solid waste is one of the major causes of environmental pollution in cities and towns including Dhaka city. Initiative has been taken to generate electricity and organic fertilizer using all these solid wastes. Bangladesh is a member country of United Nations Environment Programme (UNEP) and South Asia Cooperation for Environmental Problems (SACEP). It has signed 28 treaties, conventions and protocols. Besides, three more projects have also been implemented in the light of Agenda-21, Montreal Protocol and Bio-diversity Convention and one project was implemented earlier in the context of Brussels Convention for Control of Trans-boundary Movement of Hazardous Waste. Government has been observing various International Days relating to environment declared by the United Nations, such as World Environment Day, World Desertification Day, International Ozone Day etc.
Integrated policies, development of organisational structure, introduction of environmentally sustainable system and implementation of programmes are required to ensure sustainable development of the country and set right the environmental imbalance. Achievement of this goal requires a strong national commitment and an active participation of the Government and the people.
For the overall environmental development an amount of Tk.16.37 crore has been spent by the Ministry of Environment and Forestry for implementation of development projects which represents 89 percent of the allocation.
73
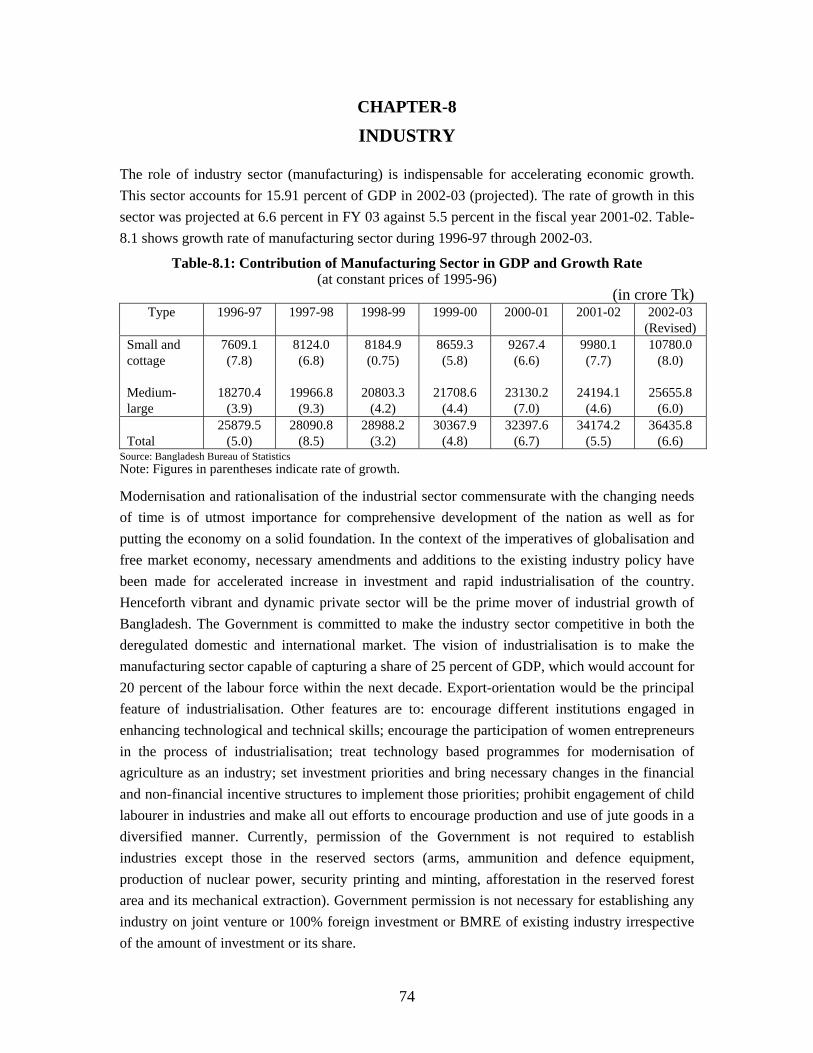
CHAPTER-8
(at constant prices of 1995-96)
1997-98 2001-02
INDUSTRY
The role of industry sector (manufacturing) is indispensable for accelerating economic growth. This sector accounts for 15.91 percent of GDP in 2002-03 (projected). The rate of growth in this sector was projected at 6.6 percent in FY 03 against 5.5 percent in the fiscal year 2001-02. Table-8.1 shows growth rate of manufacturing sector during 1996-97 through 2002-03.
Table-8.1: Contribution of Manufacturing Sector in GDP and Growth Rate
(in crore Tk) Type 1996-97 1998-99 1999-00 2000-01 2002-03
(Revised) Small and cottage Medium-large
7609.1 (7.8)
18270.4
(3.9)
8124.0 (6.8)
19966.8
(9.3)
8184.9 (0.75)
20803.3
(4.2)
8659.3 (5.8)
21708.6 25655.8
(4.4)
9267.4 (6.6)
23130.2
(7.0)
9980.1 (7.7)
24194.1
(4.6)
10780.0 (8.0)
(6.0) Total
25879.5 (3.2) (5.0)
28090.8 (8.5)
28988.2 30367.9 (4.8)
32397.6 (6.7)
34174.2 (5.5)
36435.8 (6.6)
Source: Bangladesh Bureau of Statistics Note: Figures in parentheses indicate rate of growth.
Modernisation and rationalisation of the industrial sector commensurate with the changing needs of time is of utmost importance for comprehensive development of the nation as well as for putting the economy on a solid foundation. In the context of the imperatives of globalisation and free market economy, necessary amendments and additions to the existing industry policy have been made for accelerated increase in investment and rapid industrialisation of the country. Henceforth vibrant and dynamic private sector will be the prime mover of industrial growth of Bangladesh. The Government is committed to make the industry sector competitive in both the deregulated domestic and international market. The vision of industrialisation is to make the manufacturing sector capable of capturing a share of 25 percent of GDP, which would account for 20 percent of the labour force within the next decade. Export-orientation would be the principal feature of industrialisation. Other features are to: encourage different institutions engaged in enhancing technological and technical skills; encourage the participation of women entrepreneurs in the process of industrialisation; treat technology based programmes for modernisation of agriculture as an industry; set investment priorities and bring necessary changes in the financial and non-financial incentive structures to implement those priorities; prohibit engagement of child labourer in industries and make all out efforts to encourage production and use of jute goods in a diversified manner. Currently, permission of the Government is not required to establish industries except those in the reserved sectors (arms, ammunition and defence equipment, production of nuclear power, security printing and minting, afforestation in the reserved forest area and its mechanical extraction). Government permission is not necessary for establishing any industry on joint venture or 100% foreign investment or BMRE of existing industry irrespective of the amount of investment or its share.
74
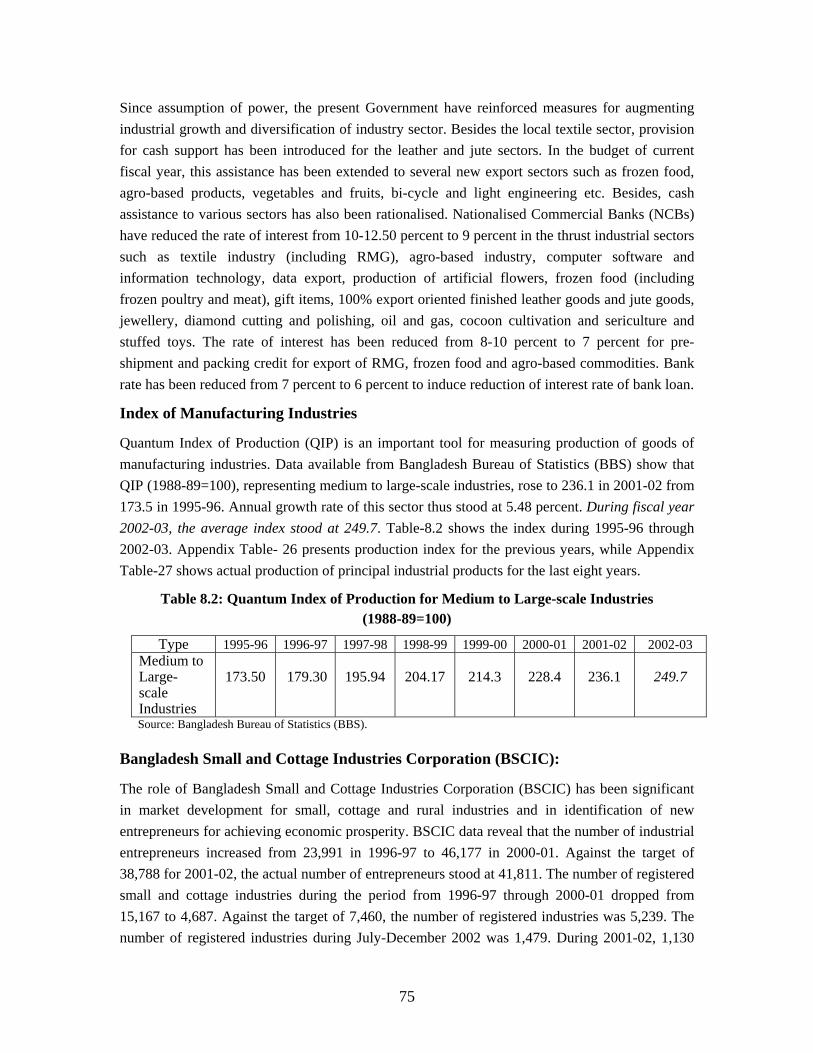
Since assumption of power, the present Government have reinforced measures for augmenting industrial growth and diversification of industry sector. Besides the local textile sector, provision for cash support has been introduced for the leather and jute sectors. In the budget of current fiscal year, this assistance has been extended to several new export sectors such as frozen food, agro-based products, vegetables and fruits, bi-cycle and light engineering etc. Besides, cash assistance to various sectors has also been rationalised. Nationalised Commercial Banks (NCBs) have reduced the rate of interest from 10-12.50 percent to 9 percent in the thrust industrial sectors such as textile industry (including RMG), agro-based industry, computer software and information technology, data export, production of artificial flowers, frozen food (including frozen poultry and meat), gift items, 100% export oriented finished leather goods and jute goods, jewellery, diamond cutting and polishing, oil and gas, cocoon cultivation and sericulture and stuffed toys. The rate of interest has been reduced from 8-10 percent to 7 percent for pre-shipment and packing credit for export of RMG, frozen food and agro-based commodities. Bank rate has been reduced from 7 percent to 6 percent to induce reduction of interest rate of bank loan.
Index of Manufacturing Industries Quantum Index of Production (QIP) is an important tool for measuring production of goods of manufacturing industries. Data available from Bangladesh Bureau of Statistics (BBS) show that QIP (1988-89=100), representing medium to large-scale industries, rose to 236.1 in 2001-02 from 173.5 in 1995-96. Annual growth rate of this sector thus stood at 5.48 percent. During fiscal year 2002-03, the average index stood at 249.7. Table-8.2 shows the index during 1995-96 through 2002-03. Appendix Table- 26 presents production index for the previous years, while Appendix Table-27 shows actual production of principal industrial products for the last eight years.
Table 8.2: Quantum Index of Production for Medium to Large-scale Industries (1988-89=100)
Type 1995-96 1996-97 1997-98 1998-99 1999-00 2000-01 2001-02 2002-03 Medium to Large- scale Industries
173.50
179.30
195.94
204.17
214.3
228.4
236.1
249.7
Source: Bangladesh Bureau of Statistics (BBS).
Bangladesh Small and Cottage Industries Corporation (BSCIC):
The role of Bangladesh Small and Cottage Industries Corporation (BSCIC) has been significant in market development for small, cottage and rural industries and in identification of new entrepreneurs for achieving economic prosperity. BSCIC data reveal that the number of industrial entrepreneurs increased from 23,991 in 1996-97 to 46,177 in 2000-01. Against the target of 38,788 for 2001-02, the actual number of entrepreneurs stood at 41,811. The number of registered small and cottage industries during the period from 1996-97 through 2000-01 dropped from 15,167 to 4,687. Against the target of 7,460, the number of registered industries was 5,239. The number of registered industries during July-December 2002 was 1,479. During 2001-02, 1,130
75
small and 4,109 cottage industries were registered with BSCIC. Besides, in FY 2001-02, credit support was provided to 423 new small industrial units along with 1,791 old units. During the same year 16,215 new cottage industries along with 12,016 old cottage industries were provided with credit facilities. In the industrial units registered with BSCIC, the number of persons employed increased from 68,983 in 1996-97 to 83,416 in 2001-02. During 2002-03, the number of persons employed was 97,957.
Production Performance of SOEs
Bangladesh Chemical Industries Corporation (BCIC)
Production of urea in the factories under BCIC was 19.40 lakh mt. in 2002-2003. During the same period the production of TSP was 1.94 lakh mt and the production of paper reached 32,000 mt. Output of cement has fallen from1.68 lakh mt in 1996-97 to 1.60 lakh mt in 2002-03. Total sales revenue of BCIC increased by 15 percent in 2002-03 compared to 1996-97 and cost of sale increased by 5 percent during the same period. In consequence, operational loss of Tk. 200.68 crore in 1996-97 decreased to Tk. 96.68 crore in 2002-03. Net loss came down from Tk. 237.92 crore in 1996-97 to Tk. 86.05 crore in 2002-03. (Appendix Table 28 presents output statistics and financial statements of state owned industrial units).
Bangladesh Textile Mills Corporation (BTMC):
The mills under BTMC meet working capital crisis as they suffered continuous loss. As the entities failed to procure raw materials from their own resources, an alternative system of 'service' charge was introduced to continue production of yarn in the mills since 1996-97. BTMC has also stopped producing fabrics since 1997-98 as it has closed down all of its weaving units of composite mills since then. Currently 13 units belonging to 10 mills are operating production activities under the ''service charge'' system. Production of yarn in mills under BTMC increased to 106.85 lakh kg. in 2002-03 from 67.77 lakh kg in 1996-97. During the period, total sales revenue declined from Tk. 81.57 crore to Tk. 56.18 crore, while the cost of sales dropped from Tk. 211.80 crore to Tk. 77.47 crore. As a result, operational loss declined to Tk. 21.29 core in 2002-03 from Tk. 130.23 crore in 1996-97. Net loss incurred in 1996-97 amounted to Tk. 163.26 crore. As the number of mills had reduced subsequently, losses gradually declined to Tk. 37.21 crore in 2002-03 (Appendix Table 28).
Bangladesh Sugar and Food Industries Corporation (BSFIC):
Production of sugar in the mills under BSFIC increased to 204,000 mt. in 2001-02 from 1,35,000 mt in 1996-97. Production target of sugar has been fixed at 181,000 mt. in 2002-03. Operational loss rose to Tk. 98.19 crore in 2001-02 from Tk. 54.46 crore in 1996-97. Operational loss has been estimated at Tk. 48.86 crore in 2002-03. During this period, net loss decreased from Tk. 65.29 crore to Tk. 63.54 crore (Appendix-28).
76
Bangladesh Jute Mills Corporation (BJMC):
With a view to increasing export of jute products in global market, the government has decided to provide subsidy at the rate of 5 percent of FOB price to both public and private mills effective from 2002-03. Accordingly, a sum of Tk 85 crore has been provided as subsidy in the budget of FY 2002-03. As a result, export of jute is expected to increase in the world market. Total sales revenue of the corporation increased by 15 percent during 2002-03 as compared with that of 1996-97 while the cost of sales fell by 5 percent in the same period. As a result, operating loss decreased from Tk. 199.45 crore in 1996-97 to Tk 59.16 crore in 2002-03. The net loss during the same period decreased from Tk. 251.71 crore to Tk. 147.38 crore (Appendix Table 28).
Bangladesh Steel and Engineering Corporation (BSEC):
Under the influence of free market economy the industrial units under BSEC faced stiff competition with the private sector industries and the imported goods this resulted in declined output in a number of cases. Total sales revenue increased by 14 percent in 2002-03 as compared with that of 1996-97. The cost of sales increased by 1 percent during the same period. Consequently, the net loss of Tk 103.28 crore in 1996-97 turned into a net profit of Tk 13.43 crore in 2002-03 (Appendix Table-28).
Overall Status of SOEs:
Total investment of 44 non-financial State-owned Enterprises amounted to Tk 89,920 crore as of June 2001. This investment was financed through government equity of Tk. 22,493 crore, government loan of Tk. 9,247 crore, loan from NCBs of Tk. 6,017 crore and government guaranteed foreign loan of Tk. 21,182 crore. Total investment under these corporations accounted for 36 percent of GDP. Unfortunately, the nation is deprived of due returns from these huge investments. The rate of dividend on equity in FY 2001-02 was 1 percent, which, by any standard, is extremely poor. Against the backdrop of gross inefficiency of the SOEs, there is an urgent need for comprehensive reforms/ rehabilitation in this area.
On going Reform Programms for SOEs
The following programmes are under implementation for accelerated and extensive reforms of the SOEs:
a) Continuous privatisation/closure of financially insolvent SOEs;
b) Payment of short term and long term liabilities of closed or privatisaed SOEs;
c) Reduction of losses through curtailing non-essential expenditures;
d) Ensuring annual audit and record keeping of assets and liabilities of SOEs;
e) Enhancement of reward/punishment scheme for ensuring accountability at every stage on SOE sector;
f) Rationalisation of prices of goods/services consistent with market demand and cost of production.
77
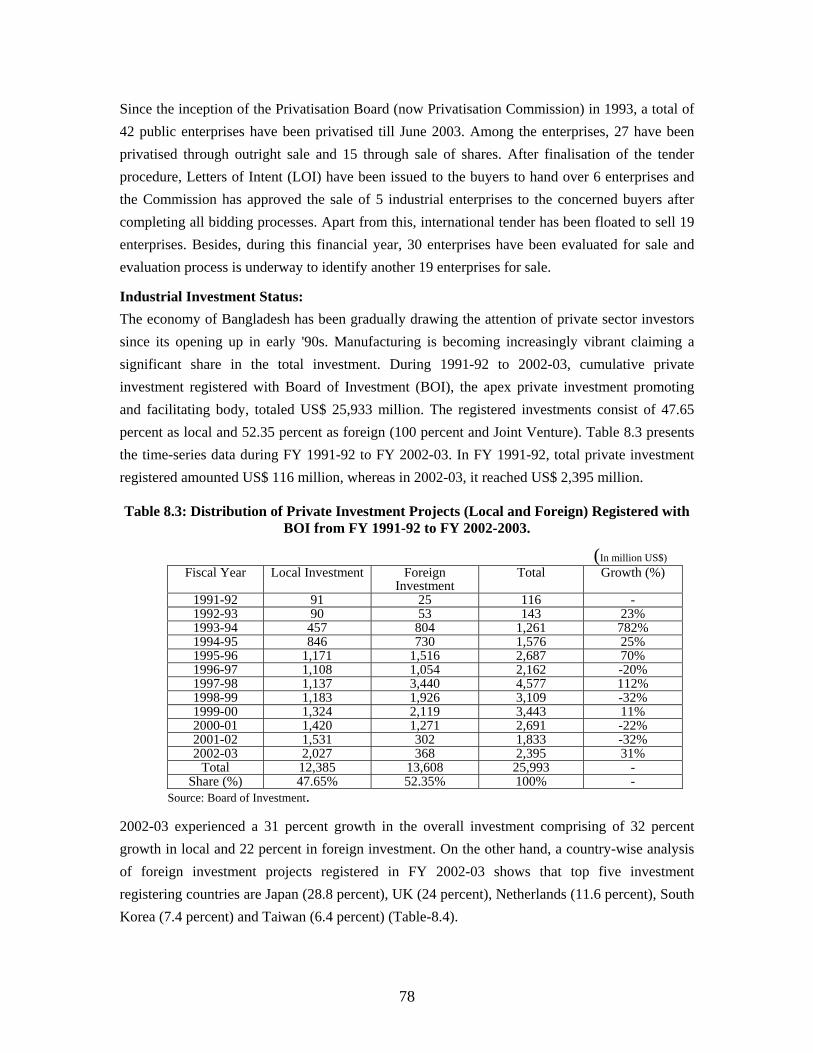
Since the inception of the Privatisation Board (now Privatisation Commission) in 1993, a total of 42 public enterprises have been privatised till June 2003. Among the enterprises, 27 have been privatised through outright sale and 15 through sale of shares. After finalisation of the tender procedure, Letters of Intent (LOI) have been issued to the buyers to hand over 6 enterprises and the Commission has approved the sale of 5 industrial enterprises to the concerned buyers after completing all bidding processes. Apart from this, international tender has been floated to sell 19 enterprises. Besides, during this financial year, 30 enterprises have been evaluated for sale and evaluation process is underway to identify another 19 enterprises for sale.
Industrial Investment Status: The economy of Bangladesh has been gradually drawing the attention of private sector investors since its opening up in early '90s. Manufacturing is becoming increasingly vibrant claiming a significant share in the total investment. During 1991-92 to 2002-03, cumulative private investment registered with Board of Investment (BOI), the apex private investment promoting and facilitating body, totaled US$ 25,933 million. The registered investments consist of 47.65 percent as local and 52.35 percent as foreign (100 percent and Joint Venture). Table 8.3 presents the time-series data during FY 1991-92 to FY 2002-03. In FY 1991-92, total private investment registered amounted US$ 116 million, whereas in 2002-03, it reached US$ 2,395 million.
Table 8.3: Distribution of Private Investment Projects (Local and Foreign) Registered with BOI from FY 1991-92 to FY 2002-2003.
(In million US$) Fiscal Year Local Investment Foreign
Investment Total Growth (%)
1991-92 91 25 116 - 1992-93 90 53 143 23% 1993-94 457 804 1,261 782% 1994-95 846 730 1,576 25% 1995-96 1,171 1,516 2,687 70% 1996-97 1,108 1,054 2,162 -20% 1997-98 1,137 3,440 4,577 112% 1998-99 1,183 1,926 3,109 -32% 1999-00 1,324 2,119 3,443 11% 2000-01 1,420 1,271 2,691 -22% 2001-02 1,531 302 1,833 -32% 2002-03 2,027 368 2,395 31%
Total 12,385 13,608 25,993 - Share (%) 47.65% 52.35% 100% -
Source: Board of Investment.
2002-03 experienced a 31 percent growth in the overall investment comprising of 32 percent growth in local and 22 percent in foreign investment. On the other hand, a country-wise analysis of foreign investment projects registered in FY 2002-03 shows that top five investment registering countries are Japan (28.8 percent), UK (24 percent), Netherlands (11.6 percent), South Korea (7.4 percent) and Taiwan (6.4 percent) (Table-8.4).
78
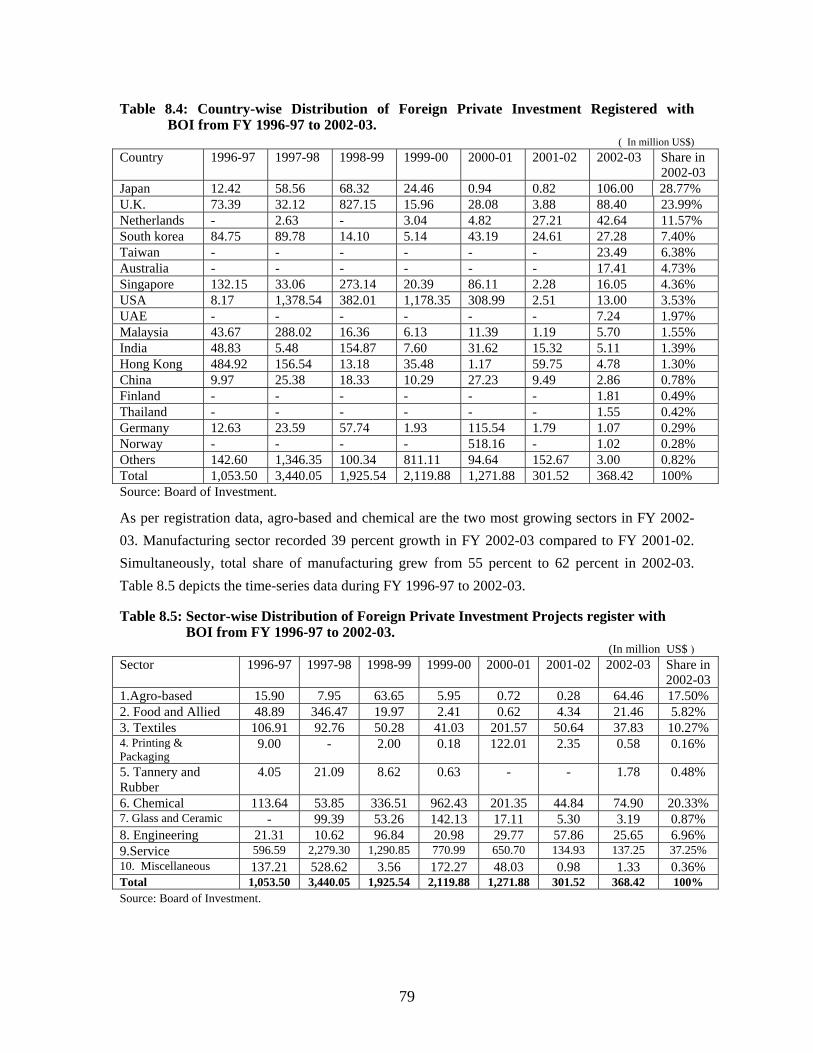
Table 8.4: Country-wise Distribution of Foreign Private Investment Registered with BOI from FY 1996-97 to 2002-03.
( In million US$) Country 1996-97 1997-98 1998-99 1999-00
2000-01
2001-02
2002-03 Share in 2002-03
Japan 12.42 58.56 68.32 24.46 0.94 0.82 106.00 28.77% U.K. 73.39 32.12 827.15 15.96 28.08 3.88 88.40 23.99% Netherlands - 2.63 - 3.04 4.82 27.21 42.64 11.57% South korea 84.75 89.78 14.10 5.14 43.19 24.61 27.28 7.40% Taiwan - - - - - - 23.49 6.38% Australia - - - - - - 17.41 4.73% Singapore 132.15 33.06 273.14 20.39 86.11 2.28 16.05 4.36% USA 8.17 1,378.54 382.01 1,178.35 308.99 2.51 13.00 3.53% UAE - - - - - - 7.24 1.97% Malaysia 43.67 288.02 16.36 6.13 11.39 1.19 5.70 1.55% India 48.83 5.48 154.87 7.60 31.62 15.32 5.11 1.39% Hong Kong 484.92 156.54 13.18 35.48 1.17 59.75 4.78 1.30% China 9.97 25.38 18.33 10.29 27.23 9.49 2.86 0.78% Finland - - - - - - 1.81 0.49% Thailand - - - - - - 1.55 0.42% Germany 12.63 23.59 57.74 1.93 115.54 1.79 1.07 0.29% Norway - - - - 518.16 - 1.02 0.28% Others 142.60 1,346.35 100.34 811.11 94.64 152.67 3.00 0.82% Total 1,053.50 3,440.05 1,925.54 2,119.88 1,271.88 301.52 368.42 100% Source: Board of Investment.
As per registration data, agro-based and chemical are the two most growing sectors in FY 2002-03. Manufacturing sector recorded 39 percent growth in FY 2002-03 compared to FY 2001-02. Simultaneously, total share of manufacturing grew from 55 percent to 62 percent in 2002-03. Table 8.5 depicts the time-series data during FY 1996-97 to 2002-03. Table 8.5: Sector-wise Distribution of Foreign Private Investment Projects register with BOI from FY 1996-97 to 2002-03.
(In million US$ ) Sector 1996-97 1997-98 1998-99 1999-00 2000-01 2001-02 2002-03 Share in
2002-03 1.Agro-based 15.90 7.95 63.65 5.95 0.72 0.28 64.46 17.50% 2. Food and Allied 48.89 346.47 19.97 2.41 0.62 4.34 21.46 5.82% 3. Textiles 106.91 92.76 50.28 41.03 201.57 50.64 37.83 10.27% 4. Printing & Packaging
9.00 - 2.00 0.18 122.01 2.35 0.58 0.16%
5. Tannery and Rubber
4.05 21.09 8.62 0.63 - - 1.78 0.48%
6. Chemical 113.64 53.85 336.51 962.43 201.35 44.84 74.90 20.33% 7. Glass and Ceramic - 99.39 0.87% 53.26 142.13 17.11 5.30 3.19 8. Engineering 21.31 10.62 96.84 20.98 29.77 57.86 25.65 6.96% 9.Service 596.59 2,279.30 1,290.85 770.99 650.70 134.93 137.25 37.25% 10. Miscellaneous 137.21 528.62 3.56 172.27 48.03 0.98 1.33 0.36% Total 1,053.50 3,440.05 1,925.54 2,119.88 1,271.88 301.52 368.42 100% Source: Board of Investment.
79
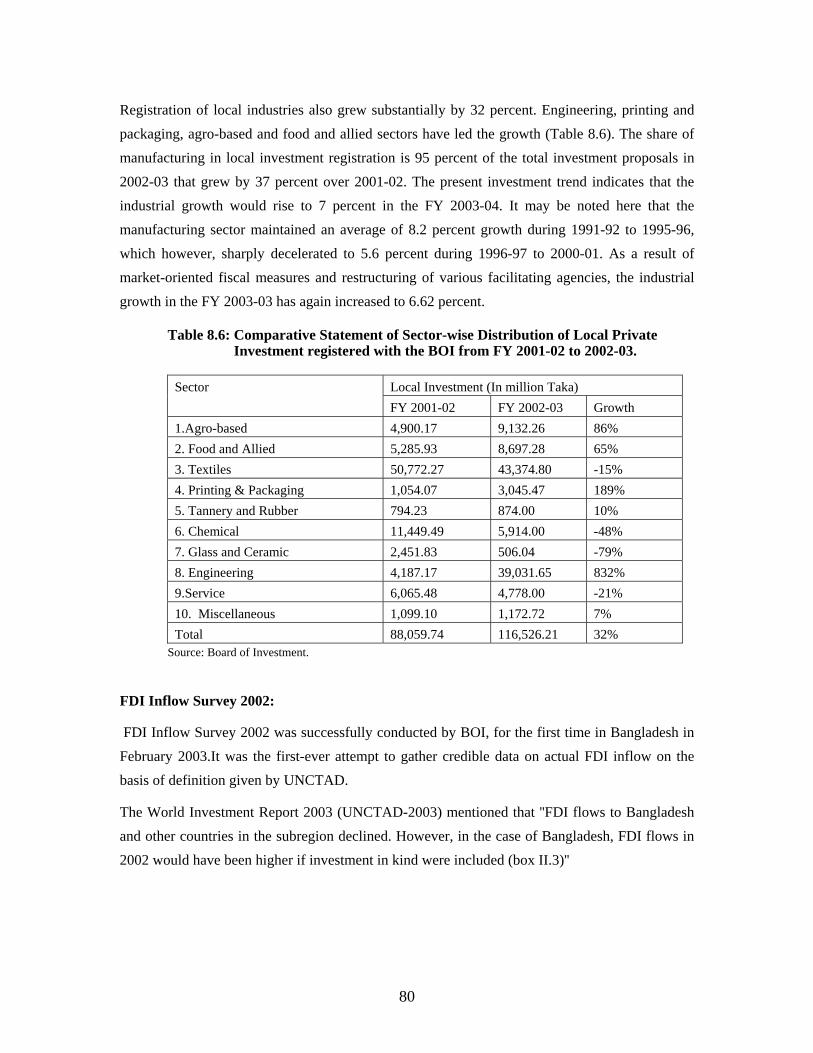
Registration of local industries also grew substantially by 32 percent. Engineering, printing and packaging, agro-based and food and allied sectors have led the growth (Table 8.6). The share of manufacturing in local investment registration is 95 percent of the total investment proposals in 2002-03 that grew by 37 percent over 2001-02. The present investment trend indicates that the industrial growth would rise to 7 percent in the FY 2003-04. It may be noted here that the manufacturing sector maintained an average of 8.2 percent growth during 1991-92 to 1995-96, which however, sharply decelerated to 5.6 percent during 1996-97 to 2000-01. As a result of market-oriented fiscal measures and restructuring of various facilitating agencies, the industrial growth in the FY 2003-03 has again increased to 6.62 percent.
Table 8.6: Comparative Statement of Sector-wise Distribution of Local Private Investment registered with the BOI from FY 2001-02 to 2002-03.
Sector Local Investment (In million Taka) FY 2001-02 FY 2002-03 Growth 1.Agro-based 4,900.17 9,132.26 86% 2. Food and Allied 5,285.93 8,697.28 65% 3. Textiles 50,772.27 43,374.80 -15% 4. Printing & Packaging 1,054.07 3,045.47 189% 5. Tannery and Rubber 794.23 874.00 10% 6. Chemical 11,449.49 5,914.00 -48% 7. Glass and Ceramic 2,451.83 506.04 -79% 8. Engineering 4,187.17 39,031.65 832% 9.Service 6,065.48 4,778.00 -21% 10. Miscellaneous 1,099.10 1,172.72 7% Total 88,059.74 116,526.21 32%
Source: Board of Investment.
FDI Inflow Survey 2002:
FDI Inflow Survey 2002 was successfully conducted by BOI, for the first time in Bangladesh in February 2003.It was the first-ever attempt to gather credible data on actual FDI inflow on the basis of definition given by UNCTAD.
The World Investment Report 2003 (UNCTAD-2003) mentioned that ''FDI flows to Bangladesh and other countries in the subregion declined. However, in the case of Bangladesh, FDI flows in 2002 would have been higher if investment in kind were included (box II.3)''
80
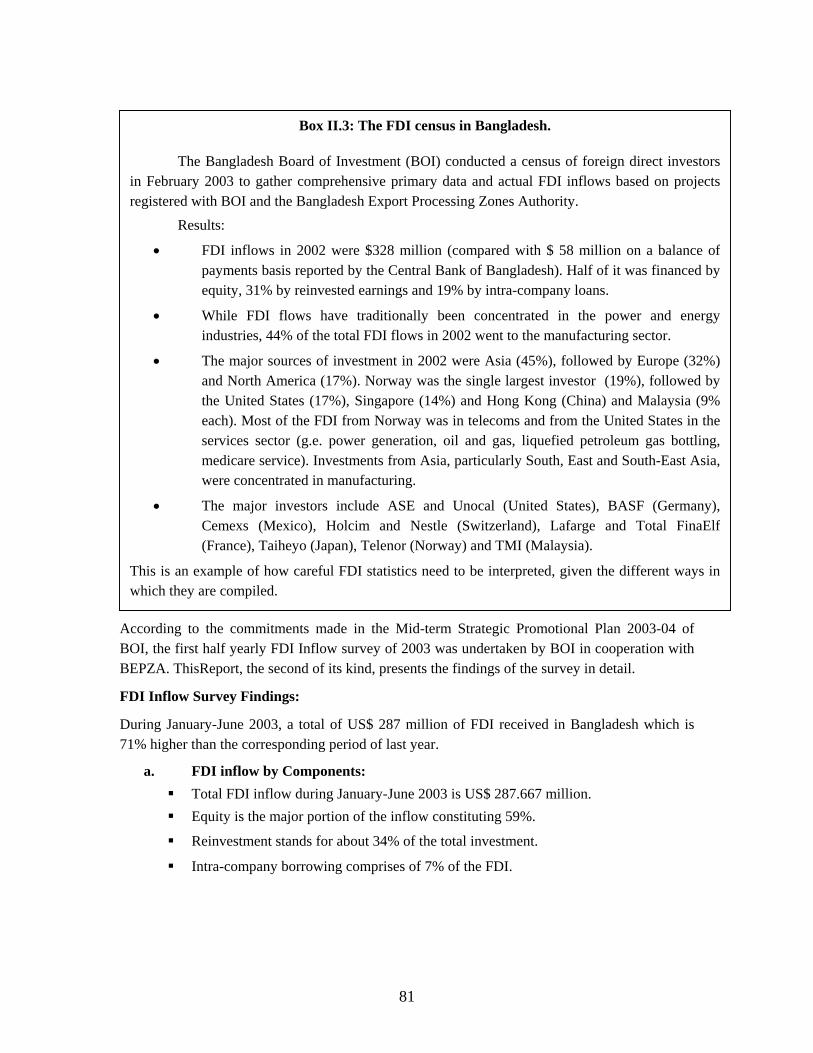
Box II.3: The FDI census in Bangladesh. The Bangladesh Board of Investment (BOI) conducted a census of foreign direct investorsin February 2003 to gather comprehensive primary data and actual FDI inflows based on projectsregistered with BOI and the Bangladesh Export Processing Zones Authority. Results:
• FDI inflows in 2002 were $328 million (compared with $ 58 million on a balance ofpayments basis reported by the Central Bank of Bangladesh). Half of it was financed byequity, 31% by reinvested earnings and 19% by intra-company loans.
• While FDI flows have traditionally been concentrated in the power and energyindustries, 44% of the total FDI flows in 2002 went to the manufacturing sector.
• The major sources of investment in 2002 were Asia (45%), followed by Europe (32%)and North America (17%). Norway was the single largest investor (19%), followed bythe United States (17%), Singapore (14%) and Hong Kong (China) and Malaysia (9%each). Most of the FDI from Norway was in telecoms and from the United States in theservices sector (g.e. power generation, oil and gas, liquefied petroleum gas bottling,medicare service). Investments from Asia, particularly South, East and South-East Asia,were concentrated in manufacturing.
• The major investors include ASE and Unocal (United States), BASF (Germany),Cemexs (Mexico), Holcim and Nestle (Switzerland), Lafarge and Total FinaElf(France), Taiheyo (Japan), Telenor (Norway) and TMI (Malaysia).
This is an example of how careful FDI statistics need to be interpreted, given the different ways inwhich they are compiled.
According to the commitments made in the Mid-term Strategic Promotional Plan 2003-04 of BOI, the first half yearly FDI Inflow survey of 2003 was undertaken by BOI in cooperation with BEPZA. ThisReport, the second of its kind, presents the findings of the survey in detail.
FDI Inflow Survey Findings:
During January-June 2003, a total of US$ 287 million of FDI received in Bangladesh which is 71% higher than the corresponding period of last year.
a. FDI inflow by Components: Total FDI inflow during January-June 2003 is US$ 287.667 million. Equity is the major portion of the inflow constituting 59%.
Reinvestment stands for about 34% of the total investment.
Intra-company borrowing comprises of 7% of the FDI.
81
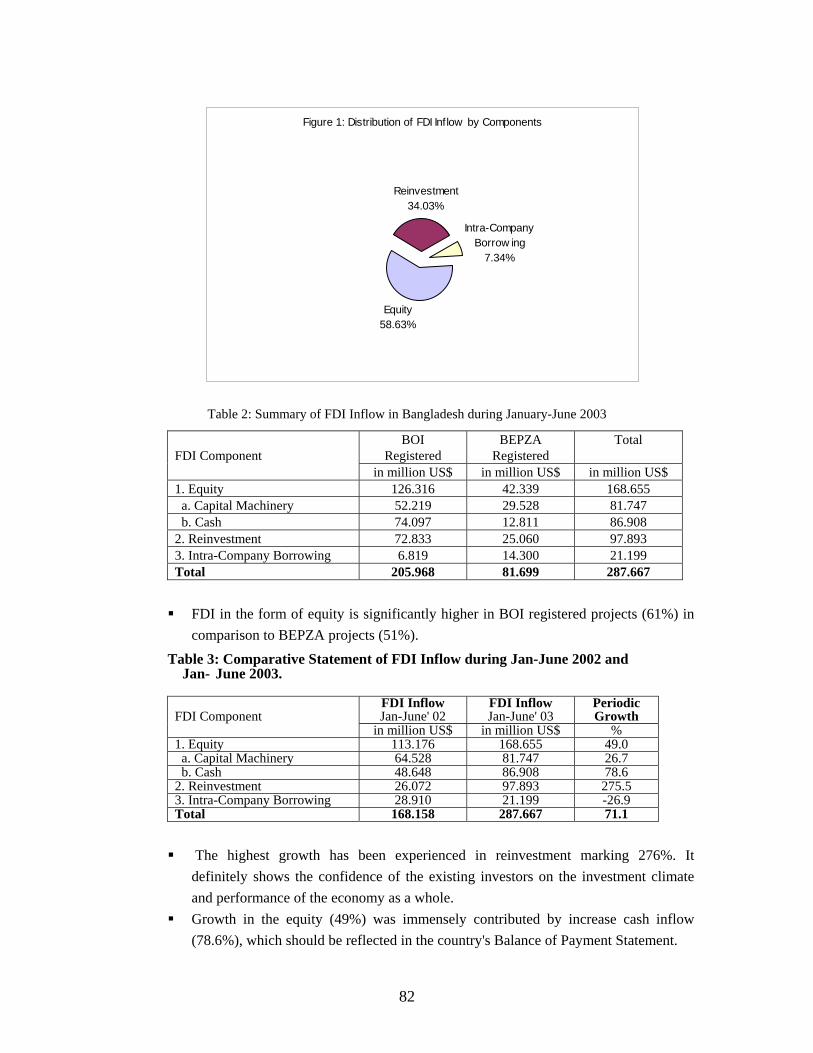
FDI
1. E a. b. 2. R3. InTot
F
c
Tabl Ja
FDI
1. E a. b. 2. R3. InTot
da
G(
Figure 1: Distribution of FDI Inflow by Components
Reinvestment34.03%
Intra-Company Borrow ing
7.34%
Equity58.63%
Table 2: Summary of FDI Inflow in Bangladesh during January-June 2003
BOI Registered
BEPZA Registered
Total Component
in million US$ in million US$ in million US$ quity 126.316 42.339 168.655 Capital Machinery 52.219 29.528 81.747 Cash 74.097 12.811 86.908 einvestment 72.833 25.060 97.893 tra-Company Borrowing 6.819 14.300 21.199
al 205.968 81.699 287.667
FDI Inflow
DI in the form of equity is significantly higher in BOI registered projects (61%) in omparison to BEPZA projects (51%).
e 3: Comparative Statement of FDI Inflow during Jan-June 2002 and n- June 2003.
Jan-June' 02 FDI Inflow Jan-June' 03
Periodic Growth Component
in million US$ in million US$ % quity 113.176 168.655 49.0 Capital Machinery 64.528 81.747 26.7 Cash 48.648 86.908 78.6 einvestment 26.072 97.893 275.5 tra-Company Borrowing 28.910 21.199 -26.9
al 168.158 287.667 71.1
The highest growth has been experienced in reinvestment marking 276%. It efinitely shows the confidence of the existing investors on the investment climate nd performance of the economy as a whole. rowth in the equity (49%) was immensely contributed by increase cash inflow
78.6%), which should be reflected in the country's Balance of Payment Statement.
82
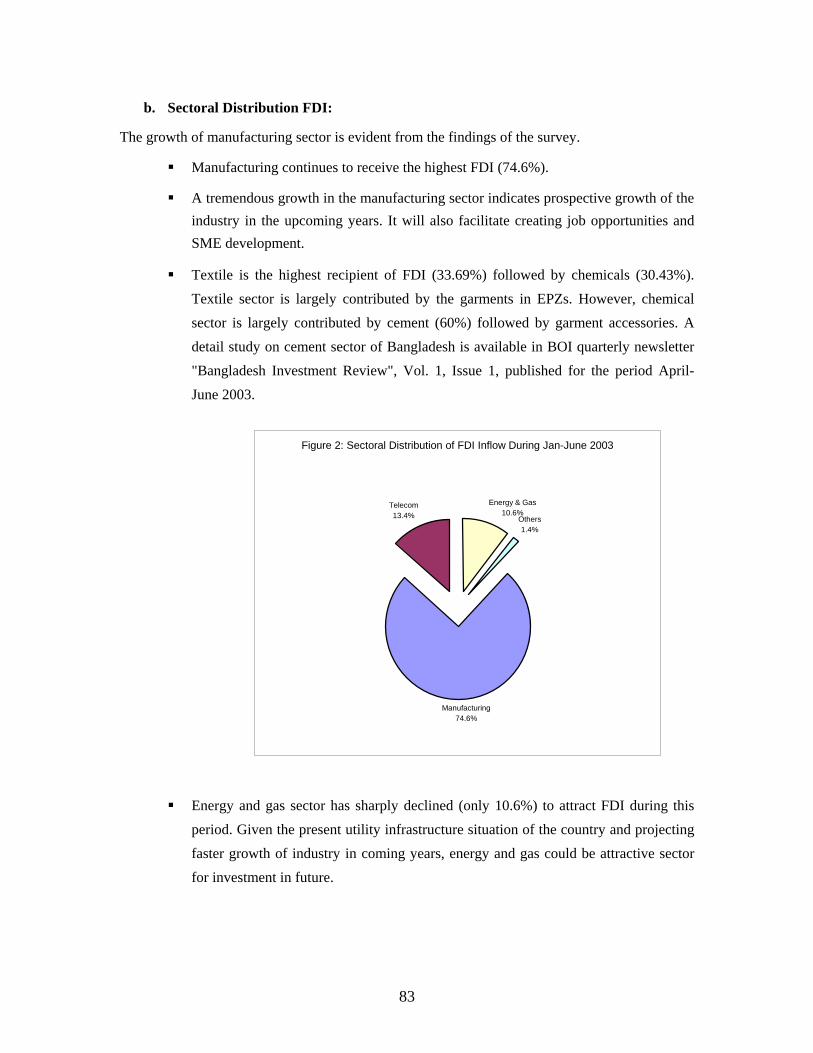
b. Sectoral Distribution FDI:
The growth of manufacturing sector is evident from the findings of the survey.
Manufacturing continues to receive the highest FDI (74.6%).
A tremendous growth in the manufacturing sector indicates prospective growth of the industry in the upcoming years. It will also facilitate creating job opportunities and SME development.
Textile is the highest recipient of FDI (33.69%) followed by chemicals (30.43%). Textile sector is largely contributed by the garments in EPZs. However, chemical sector is largely contributed by cement (60%) followed by garment accessories. A detail study on cement sector of Bangladesh is available in BOI quarterly newsletter "Bangladesh Investment Review", Vol. 1, Issue 1, published for the period April-June 2003.
Energy aperiod. Gfaster grfor inves
Figure 2: Sectoral Distribution of FDI Inflow During Jan-June 2003
Energy & Gas10.6%
Manufacturing74.6%
Telecom13.4% Others
1.4%
nd gas sector has sharply declined (only 10.6%) to attract FDI during this iven the present utility infrastructure situation of the country and projecting
owth of industry in coming years, energy and gas could be attractive sector tment in future.
83
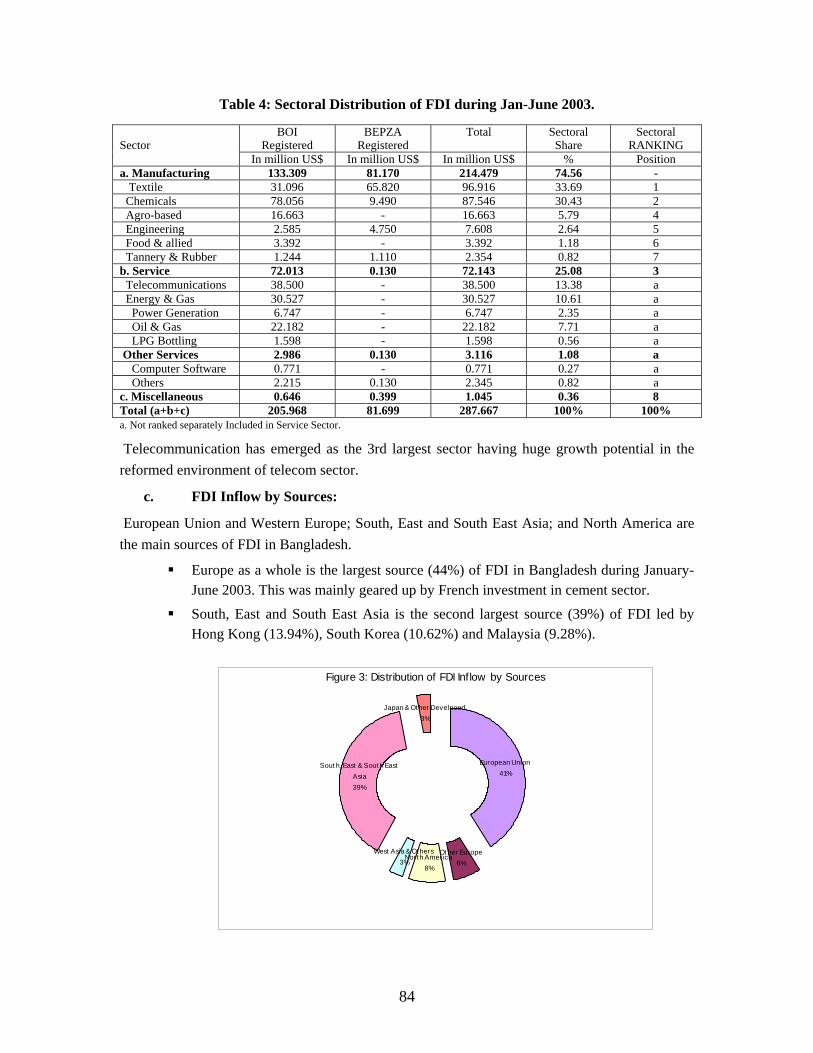
Table 4: Sectoral Distribution of FDI during Jan-June 2003.
BOI Registered
BEPZA Registered
Total Sectoral Share
Sectoral RANKING
Sector
In million US$ In million US$ In million US$ % Position a. Manufacturing 133.309 81.170 214.479 74.56 - Textile 31.096 65.820 96.916 33.69 1 Chemicals 78.056 9.490 87.546 30.43 2 Agro-based 16.663 - 16.663 5.79 4 Engineering 2.585 4.750 7.608 2.64 5 Food & allied 3.392 - 3.392 1.18 6 Tannery & Rubber 1.244 1.110 2.354 0.82 7 b. Service 72.013 0.130 72.143 25.08 3 Telecommunications 38.500 - 38.500 13.38 a Energy & Gas 30.527 - 30.527 10.61 a Power Generation 6.747 - 6.747 2.35 a Oil & Gas 22.182 - 22.182 7.71 a LPG Bottling 1.598 - 1.598 0.56 a Other Services 2.986 0.130 3.116 1.08 a Computer Software 0.771 - 0.771 0.27 a Others 2.215 0.130 2.345 0.82 a c. Miscellaneous 0.646 0.399 1.045 0.36 8 Total (a+b+c) 205.968 81.699 287.667 100% 100% a. Not ranked separately Included in Service Sector. Telecommunication has emerged as the 3rd largest sector having huge growth potential in the reformed environment of telecom sector.
c. FDI Inflow by Sources:
European Union and Western Europe; South, East and South East Asia; and North America are the main sources of FDI in Bangladesh.
Europe as a whole is the largest source (44%) of FDI in Bangladesh during January-June 2003. This was mainly geared up by French investment in cement sector.
South, East and South East Asia is the second largest source (39%) of FDI led by Hong Kong (13.94%), South Korea (10.62%) and Malaysia (9.28%).
Figure 3: Distribution of FDI Inflow by Sources
European Union41%
Nort h America8%
Ot her Europe6%
West Asia & Ot hers3%
Japan & Ot her Develpoed3%
Sout h, East & Sout h East Asia39%
84
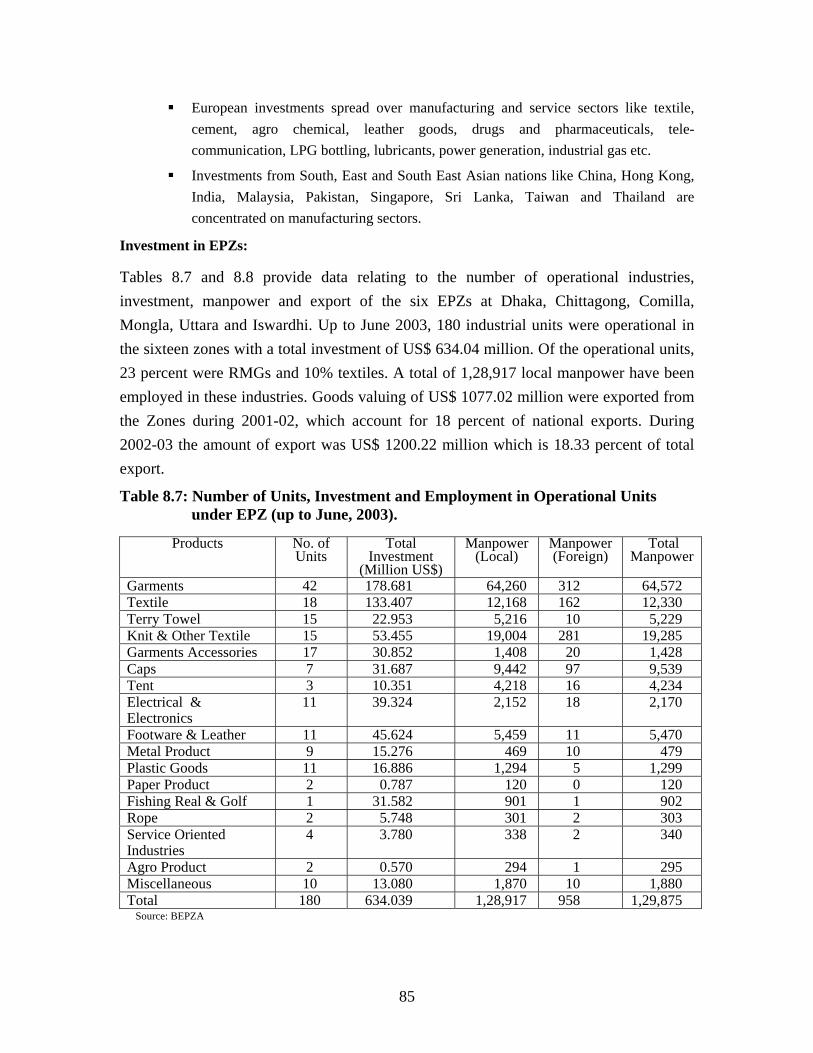
European investments spread over manufacturing and service sectors like textile, cement, agro chemical, leather goods, drugs and pharmaceuticals, tele-communication, LPG bottling, lubricants, power generation, industrial gas etc.
Investments from South, East and South East Asian nations like China, Hong Kong, India, Malaysia, Pakistan, Singapore, Sri Lanka, Taiwan and Thailand are concentrated on manufacturing sectors.
Investment in EPZs:
Tables 8.7 and 8.8 provide data relating to the number of operational industries, investment, manpower and export of the six EPZs at Dhaka, Chittagong, Comilla, Mongla, Uttara and Iswardhi. Up to June 2003, 180 industrial units were operational in the sixteen zones with a total investment of US$ 634.04 million. Of the operational units, 23 percent were RMGs and 10% textiles. A total of 1,28,917 local manpower have been employed in these industries. Goods valuing of US$ 1077.02 million were exported from the Zones during 2001-02, which account for 18 percent of national exports. During 2002-03 the amount of export was US$ 1200.22 million which is 18.33 percent of total export.
Table 8.7: Number of Units, Investment and Employment in Operational Units under EPZ (up to June, 2003).
Products No. of
Units Total
Investment (Million US$)
Manpower (Local)
Manpower (Foreign)
Total Manpower
Garments 42 178.681 64,260 312 64,572 Textile 18 133.407 12,168 162 12,330 Terry Towel 15 22.953 5,216 10 5,229 Knit & Other Textile 15 53.455 19,004 281 19,285 Garments Accessories 17 30.852 1,408 20 1,428 Caps 7 31.687 9,442 97 9,539 Tent 3 10.351 4,218 16 4,234 Electrical & Electronics
11 39.324 2,152 18 2,170
Footware & Leather 11 45.624 5,459 11 5,470 Metal Product 9 15.276 469 10 479 Plastic Goods 16.886 11 1,294 5 1,299 Paper Product 2 0.787 120 0 120 Fishing Real & Golf 1 902 31.582 901 1 Rope 2 5.748 301 303 2 Service Oriented Industries
4 3.780 338 2 340
Agro Product 2 0.570 294 1 295 Miscellaneous 10 13.080 1,870 10 1,880 Total 180 634.039 1,28,917 958 1,29,875
Source: BEPZA
85
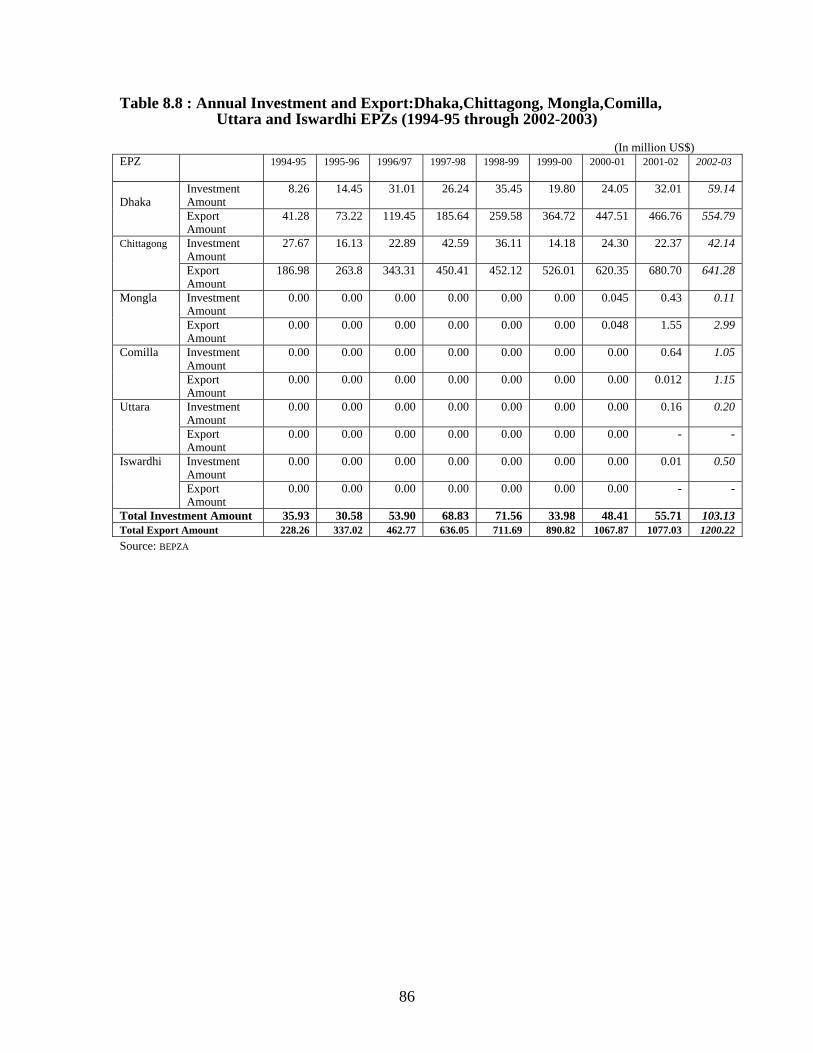
Table 8.8 : Annual Investment and Export:Dhaka,Chittagong, Mongla,Comilla, Uttara and Iswardhi EPZs (1994-95 through 2002-2003)
(In million US$)
EPZ 1994-95 1995-96 1996/97 1997-98 1998-99 1999-00 2000-01 2001-02 2002-03
Investment Amount
8.26 14.45 31.01 26.24 35.45 19.80 24.05 32.01 59.14 Dhaka
Export Amount
41.28 73.22 119.45 185.64 259.58 364.72 447.51 466.76 554.79
Investment Amount
27.67 16.13 22.89 42.59 36.11 14.18 24.30 22.37 42.14 Chittagong
Export Amount
186.98 263.8 343.31 450.41 452.12 526.01 620.35 680.70 641.28
Investment Amount
0.00 0.00 0.00 0.00 0.00 0.00 0.045 0.43 0.11 Mongla
Export Amount
0.00 0.00 0.00 0.00 0.00 0.00 0.048 1.55 2.99
Investment Amount
0.00 0.00 0.00 0.00 0.00 0.00 0.00 0.64 1.05 Comilla
Export Amount
0.00 0.00 0.00 0.00 0.00 0.00 0.00 0.012 1.15
Investment Amount
0.00 0.00 0.00 0.00 0.00 0.00 0.00 0.16 0.20 Uttara
Export Amount
0.00 0.00 0.00 0.00 0.00 0.00 0.00 - -
Investment Amount
0.00 0.00 0.00 0.00 0.00 0.00 0.00 0.01 0.50 Iswardhi
Export Amount
0.00 0.00 0.00 0.00 0.00 0.00 0.00 - -
Total Investment Amount 35.93 30.58 53.90 68.83 71.56 33.98 48.41 55.71 103.13 Total Export Amount 228.26 337.02 462.77 636.05 711.69 890.82 1067.87 1077.03 1200.22 Source: BEPZA
86
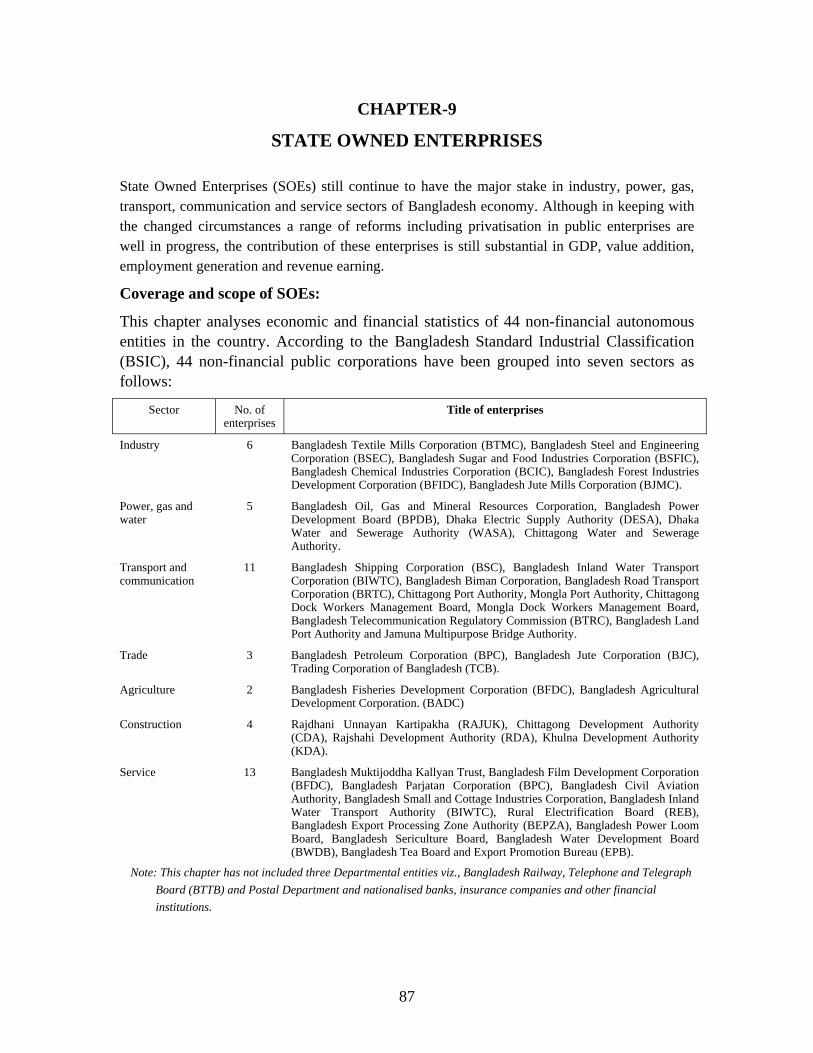
CHAPTER-9
STATE OWNED ENTERPRISES
State Owned Enterprises (SOEs) still continue to have the major stake in industry, power, gas, transport, communication and service sectors of Bangladesh economy. Although in keeping with the changed circumstances a range of reforms including privatisation in public enterprises are well in progress, the contribution of these enterprises is still substantial in GDP, value addition, employment generation and revenue earning.
Coverage and scope of SOEs:
This chapter analyses economic and financial statistics of 44 non-financial autonomous entities in the country. According to the Bangladesh Standard Industrial Classification (BSIC), 44 non-financial public corporations have been grouped into seven sectors as follows:
Sector No. of enterprises
Title of enterprises
Industry 6 Bangladesh Textile Mills Corporation (BTMC), Bangladesh Steel and Engineering Corporation (BSEC), Bangladesh Sugar and Food Industries Corporation (BSFIC), Bangladesh Chemical Industries Corporation (BCIC), Bangladesh Forest Industries Development Corporation (BFIDC), Bangladesh Jute Mills Corporation (BJMC).
Power, gas and water
5 Bangladesh Oil, Gas and Mineral Resources Corporation, Bangladesh Power Development Board (BPDB), Dhaka Electric Supply Authority (DESA), Dhaka Water and Sewerage Authority (WASA), Chittagong Water and Sewerage Authority.
Transport and communication
11 Bangladesh Shipping Corporation (BSC), Bangladesh Inland Water Transport Corporation (BIWTC), Bangladesh Biman Corporation, Bangladesh Road Transport Corporation (BRTC), Chittagong Port Authority, Mongla Port Authority, Chittagong Dock Workers Management Board, Mongla Dock Workers Management Board, Bangladesh Telecommunication Regulatory Commission (BTRC), Bangladesh Land Port Authority and Jamuna Multipurpose Bridge Authority.
Trade 3 Bangladesh Petroleum Corporation (BPC), Bangladesh Jute Corporation (BJC), Trading Corporation of Bangladesh (TCB).
Agriculture 2 Bangladesh Fisheries Development Corporation (BFDC), Bangladesh Agricultural Development Corporation. (BADC)
Construction 4 Rajdhani Unnayan Kartipakha (RAJUK), Chittagong Development Authority (CDA), Rajshahi Development Authority (RDA), Khulna Development Authority (KDA).
Service 13 Bangladesh Muktijoddha Kallyan Trust, Bangladesh Film Development Corporation (BFDC), Bangladesh Parjatan Corporation (BPC), Bangladesh Civil Aviation Authority, Bangladesh Small and Cottage Industries Corporation, Bangladesh Inland Water Transport Authority (BIWTC), Rural Electrification Board (REB), Bangladesh Export Processing Zone Authority (BEPZA), Bangladesh Power Loom Board, Bangladesh Sericulture Board, Bangladesh Water Development Board (BWDB), Bangladesh Tea Board and Export Promotion Bureau (EPB).
Note: This chapter has not included three Departmental entities viz., Bangladesh Railway, Telephone and Telegraph Board (BTTB) and Postal Department and nationalised banks, insurance companies and other financial institutions.
87
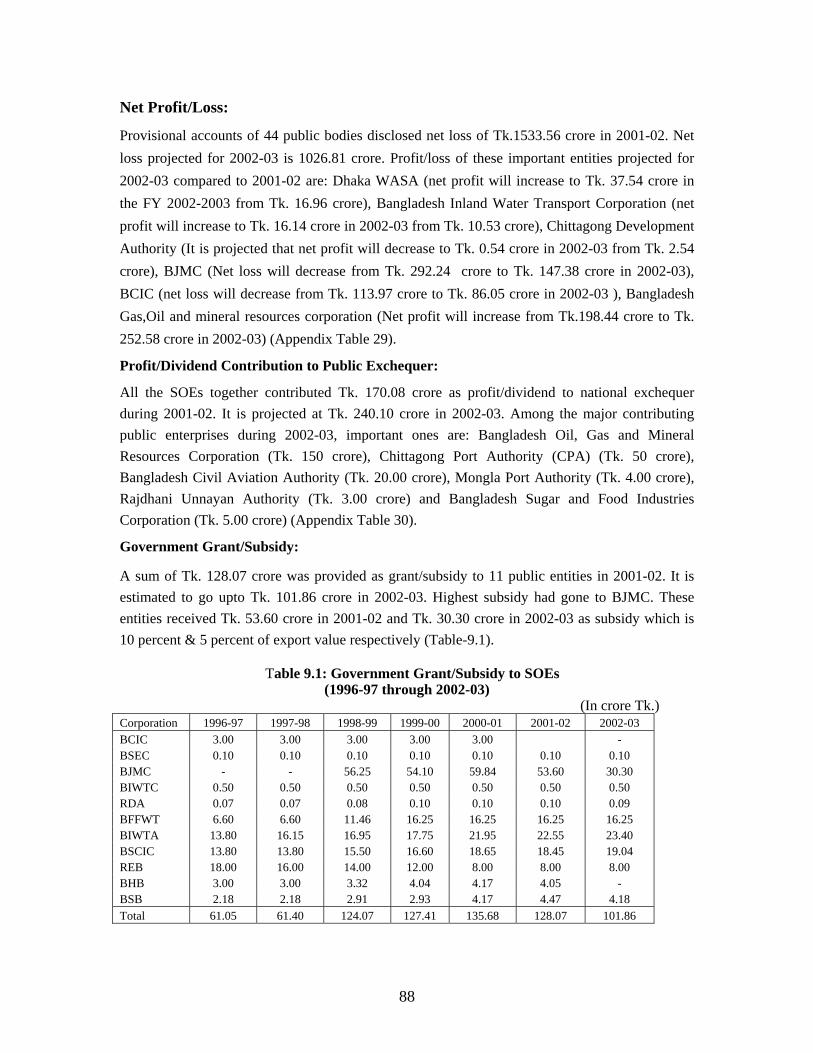
Net Profit/Loss:
Provisional accounts of 44 public bodies disclosed net loss of Tk.1533.56 crore in 2001-02. Net loss projected for 2002-03 is 1026.81 crore. Profit/loss of these important entities projected for 2002-03 compared to 2001-02 are: Dhaka WASA (net profit will increase to Tk. 37.54 crore in the FY 2002-2003 from Tk. 16.96 crore), Bangladesh Inland Water Transport Corporation (net profit will increase to Tk. 16.14 crore in 2002-03 from Tk. 10.53 crore), Chittagong Development Authority (It is projected that net profit will decrease to Tk. 0.54 crore in 2002-03 from Tk. 2.54 crore), BJMC (Net loss will decrease from Tk. 292.24 crore to Tk. 147.38 crore in 2002-03), BCIC (net loss will decrease from Tk. 113.97 crore to Tk. 86.05 crore in 2002-03 ), Bangladesh Gas,Oil and mineral resources corporation (Net profit will increase from Tk.198.44 crore to Tk. 252.58 crore in 2002-03) (Appendix Table 29).
Profit/Dividend Contribution to Public Exchequer:
All the SOEs together contributed Tk. 170.08 crore as profit/dividend to national exchequer during 2001-02. It is projected at Tk. 240.10 crore in 2002-03. Among the major contributing public enterprises during 2002-03, important ones are: Bangladesh Oil, Gas and Mineral Resources Corporation (Tk. 150 crore), Chittagong Port Authority (CPA) (Tk. 50 crore), Bangladesh Civil Aviation Authority (Tk. 20.00 crore), Mongla Port Authority (Tk. 4.00 crore), Rajdhani Unnayan Authority (Tk. 3.00 crore) and Bangladesh Sugar and Food Industries Corporation (Tk. 5.00 crore) (Appendix Table 30).
Government Grant/Subsidy:
A sum of Tk. 128.07 crore was provided as grant/subsidy to 11 public entities in 2001-02. It is estimated to go upto Tk. 101.86 crore in 2002-03. Highest subsidy had gone to BJMC. These entities received Tk. 53.60 crore in 2001-02 and Tk. 30.30 crore in 2002-03 as subsidy which is 10 percent & 5 percent of export value respectively (Table-9.1).
Table 9.1: Government Grant/Subsidy to SOEs (1996-97 through 2002-03)
(In crore Tk.) Corporation 1996-97 1997-98 1998-99 1999-00 2000-01 2001-02 2002-03 BCIC 3.00 3.00 3.00 3.00 3.00 - BSEC 0.10 0.10 0.10 0.10 0.10 0.10 0.10 BJMC - - 56.25 54.10 59.84 53.60 30.30 BIWTC 0.50 0.50 0.50 0.50 0.50 0.50 0.50 RDA 0.07 0.07 0.08 0.10 0.10 0.10 0.09 BFFWT 6.60 6.60 11.46 16.25 16.25 16.25 16.25 BIWTA 13.80 16.15 16.95 17.75 21.95 22.55 23.40 BSCIC 13.80 13.80 15.50 16.60 18.65 18.45 19.04 REB 18.00 16.00 14.00 12.00 8.00 8.00 8.00 BHB 3.00 3.00 3.32 4.04 4.17 4.05 - BSB 2.18 2.18 2.91 2.93 4.17 4.47 4.18 Total 61.05 61.40 124.07 127.41 135.68 128.07 101.86
88
Debt Service Liabilities (DSL):
Recovery of DSL from 44 SOEs in 2001-02 amounted to Tk 1021.43 crore which is 45 percent of total DSL of Tk 2271.02 crore. Total DSL of 44 SOEs for 2002-03 is Tk 2725.01 crore. Out of which Tk.976.40 crore has been recovered up to June, 2003. DSL liabilities in respect of Bangladesh Inland Water Transport Corporation, Chittagong Port Authority, Bangladesh Oil, Gas & Mineral resources etc. are estimated to be higher in 2002-03 compared to 2001-02 (Appendix Table-31).
Bank Credit:
The total outstanding credit of the 44 SOEs owed to public sector commercial banks as of April 2003 stood at Tk. 7539.36 crore of which Tk. 995.00 crore (13 percent) is over due loan. SOEs with largest outstanding credit are: BPC (Tk. 3216.87 crore), BJMC (Tk 2343.33 crore), BTMC (Tk.456.53 crore), BSFIC (Tk. 422.49 crore), PDB (Tk. 331.47 crore), BCIC (Tk. 212.60 crore), BSEC (Tk. 198.61 crore) and RUJUK ( Tk. 162.47 crore). The entities with largest amount of overdue loans are: BTMC (Tk. 446.85 crore), BSEC (Tk.118.28 crore), BCIC ( Tk. 111.15 crore) and BJMC (Tk. 108.62 crore).
89
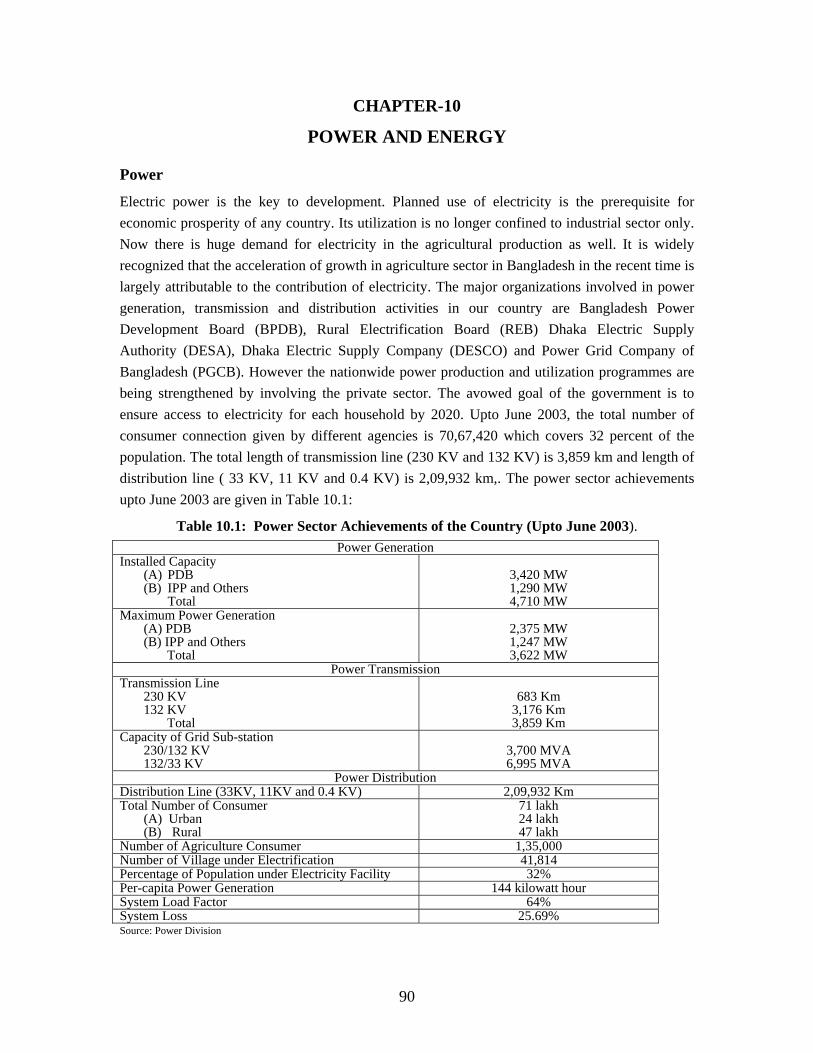
CHAPTER-10
POWER AND ENERGY
Power
Electric power is the key to development. Planned use of electricity is the prerequisite for economic prosperity of any country. Its utilization is no longer confined to industrial sector only. Now there is huge demand for electricity in the agricultural production as well. It is widely recognized that the acceleration of growth in agriculture sector in Bangladesh in the recent time is largely attributable to the contribution of electricity. The major organizations involved in power generation, transmission and distribution activities in our country are Bangladesh Power Development Board (BPDB), Rural Electrification Board (REB) Dhaka Electric Supply Authority (DESA), Dhaka Electric Supply Company (DESCO) and Power Grid Company of Bangladesh (PGCB). However the nationwide power production and utilization programmes are being strengthened by involving the private sector. The avowed goal of the government is to ensure access to electricity for each household by 2020. Upto June 2003, the total number of consumer connection given by different agencies is 70,67,420 which covers 32 percent of the population. The total length of transmission line (230 KV and 132 KV) is 3,859 km and length of distribution line ( 33 KV, 11 KV and 0.4 KV) is 2,09,932 km,. The power sector achievements upto June 2003 are given in Table 10.1:
Table 10.1: Power Sector Achievements of the Country (Upto June 2003). Power Generation
Installed Capacity (A) PDB (B) IPP and Others
Total
3,420 MW 1,290 MW 4,710 MW
Maximum Power Generation (A) PDB (B) IPP and Others Total
2,375 MW 1,247 MW 3,622 MW
Power Transmission Transmission Line
230 KV 132 KV Total
683 Km
3,176 Km 3,859 Km
Capacity of Grid Sub-station 230/132 KV 132/33 KV
3,700 MVA 6,995 MVA
Power Distribution Distribution Line (33KV, 11KV and 0.4 KV) 2,09,932 Km Total Number of Consumer
(A) Urban (B) Rural
71 lakh 24 lakh 47 lakh
Number of Agriculture Consumer 1,35,000 Number of Village under Electrification 41,814 Percentage of Population under Electricity Facility 32% Per-capita Power Generation 144 kilowatt hour System Load Factor 64% System Loss 25.69% Source: Power Division
90
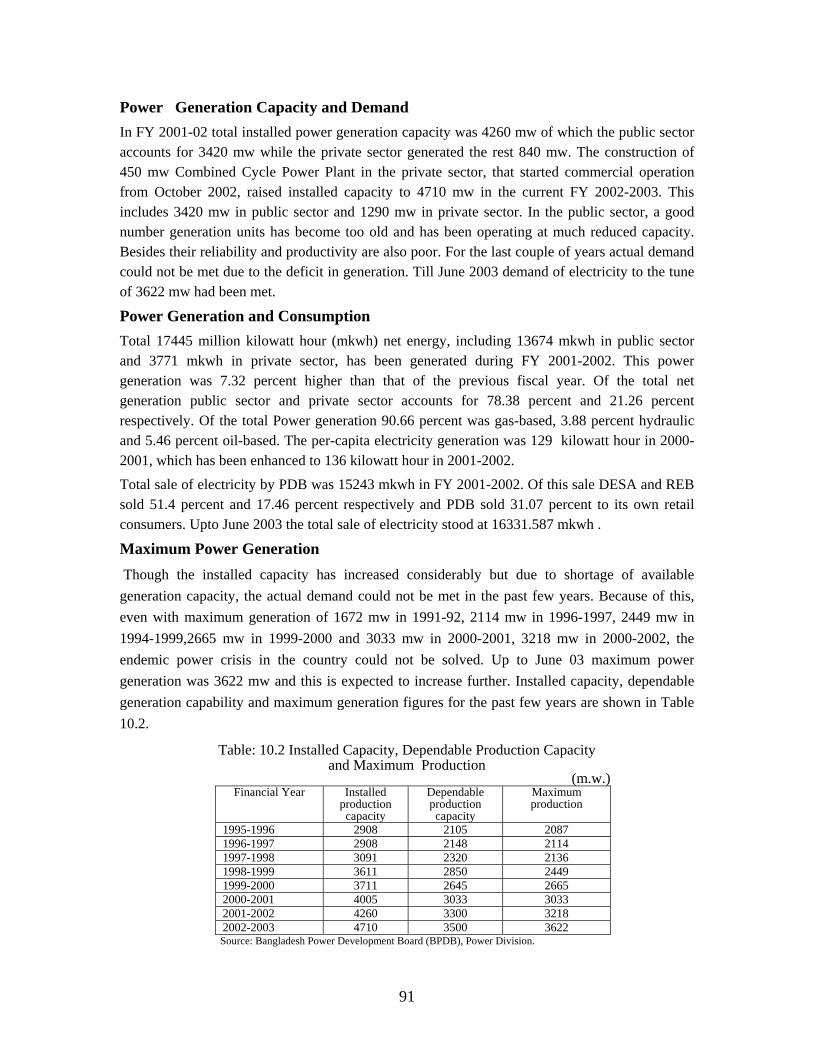
Power Generation Capacity and Demand
In FY 2001-02 total installed power generation capacity was 4260 mw of which the public sector accounts for 3420 mw while the private sector generated the rest 840 mw. The construction of 450 mw Combined Cycle Power Plant in the private sector, that started commercial operation from October 2002, raised installed capacity to 4710 mw in the current FY 2002-2003. This includes 3420 mw in public sector and 1290 mw in private sector. In the public sector, a good number generation units has become too old and has been operating at much reduced capacity. Besides their reliability and productivity are also poor. For the last couple of years actual demand could not be met due to the deficit in generation. Till June 2003 demand of electricity to the tune of 3622 mw had been met.
Power Generation and Consumption
Total 17445 million kilowatt hour (mkwh) net energy, including 13674 mkwh in public sector and 3771 mkwh in private sector, has been generated during FY 2001-2002. This power generation was 7.32 percent higher than that of the previous fiscal year. Of the total net generation public sector and private sector accounts for 78.38 percent and 21.26 percent respectively. Of the total Power generation 90.66 percent was gas-based, 3.88 percent hydraulic and 5.46 percent oil-based. The per-capita electricity generation was 129 kilowatt hour in 2000-2001, which has been enhanced to 136 kilowatt hour in 2001-2002. Total sale of electricity by PDB was 15243 mkwh in FY 2001-2002. Of this sale DESA and REB sold 51.4 percent and 17.46 percent respectively and PDB sold 31.07 percent to its own retail consumers. Upto June 2003 the total sale of electricity stood at 16331.587 mkwh .
Maximum Power Generation
Though the installed capacity has increased considerably but due to shortage of available generation capacity, the actual demand could not be met in the past few years. Because of this, even with maximum generation of 1672 mw in 1991-92, 2114 mw in 1996-1997, 2449 mw in 1994-1999,2665 mw in 1999-2000 and 3033 mw in 2000-2001, 3218 mw in 2000-2002, the endemic power crisis in the country could not be solved. Up to June 03 maximum power generation was 3622 mw and this is expected to increase further. Installed capacity, dependable generation capability and maximum generation figures for the past few years are shown in Table 10.2.
Table: 10.2 Installed Capacity, Dependable Production Capacity and Maximum Production
(m.w.) Financial Year Installed
production capacity
Dependable production capacity
Maximum production
1995-1996 2908 2105 2087 1996-1997 2908 2148 2114 1997-1998 3091 2320 2136 1998-1999 3611 2850 2449 1999-2000 3711 2645 2665 2000-2001 4005 3033 3033 2001-2002 4260 3300 3218 2002-2003 4710 3500 3622
Source: Bangladesh Power Development Board (BPDB), Power Division.
91
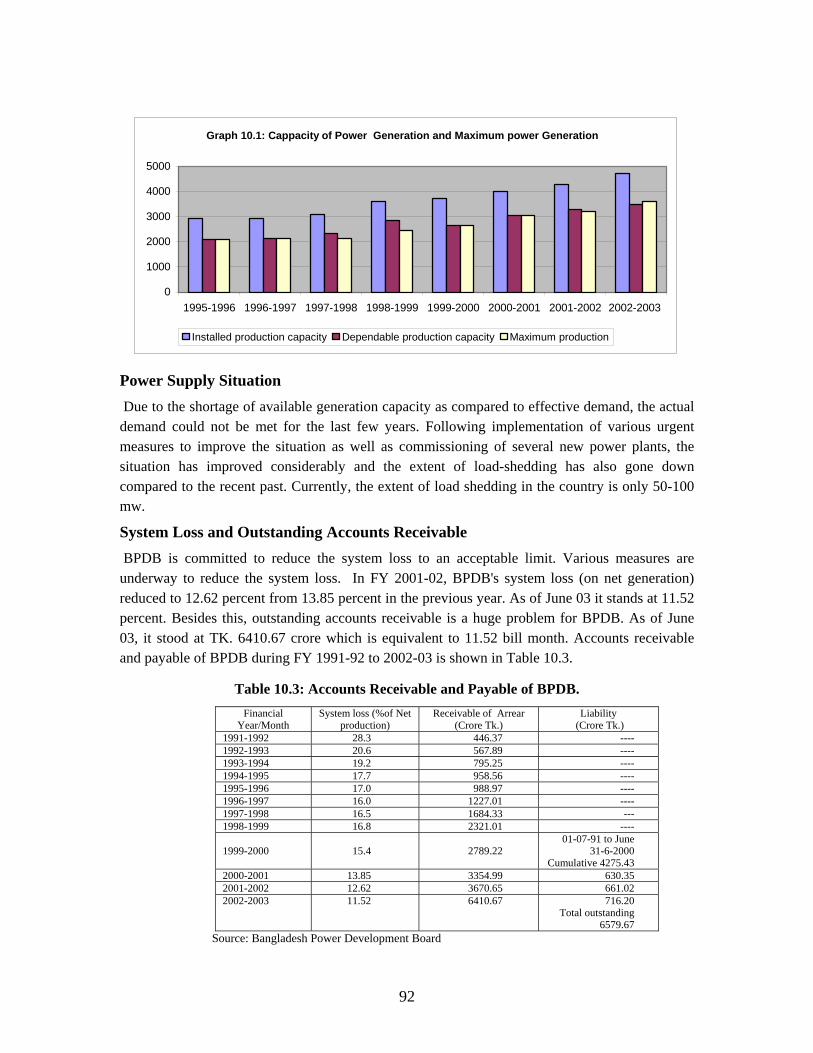
P dmscm
S urp0a
Graph 10.1: Cappacity of Power Generation and Maximum power Generation
0
1000
2000
3000
4000
5000
1995-1996 1996-1997 1997-1998 1998-1999 1999-2000 2000-2001 2001-2002 2002-2003
Installed production capacity Dependable production capacity Maximum production
ower Supply Situation Due to the shortage of available generation capacity as compared to effective demand, the actual emand could not be met for the last few years. Following implementation of various urgent easures to improve the situation as well as commissioning of several new power plants, the
ituation has improved considerably and the extent of load-shedding has also gone down ompared to the recent past. Currently, the extent of load shedding in the country is only 50-100 w.
ystem Loss and Outstanding Accounts Receivable BPDB is committed to reduce the system loss to an acceptable limit. Various measures are nderway to reduce the system loss. In FY 2001-02, BPDB's system loss (on net generation) educed to 12.62 percent from 13.85 percent in the previous year. As of June 03 it stands at 11.52 ercent. Besides this, outstanding accounts receivable is a huge problem for BPDB. As of June 3, it stood at TK. 6410.67 crore which is equivalent to 11.52 bill month. Accounts receivable nd payable of BPDB during FY 1991-92 to 2002-03 is shown in Table 10.3.
Table 10.3: Accounts Receivable and Payable of BPDB. Financial
Year/Month System loss (%of Net
production) Receivable of Arrear
(Crore Tk.) Liability
(Crore Tk.) 1991-1992 28.3 446.37 ---- 1992-1993 20.6 567.89 ---- 1993-1994 19.2 795.25 ---- 1994-1995 17.7 958.56 ---- 1995-1996 17.0 988.97 ---- 1996-1997 16.0 1227.01 ---- 1997-1998 16.5 1684.33 --- 1998-1999 16.8 2321.01 ---- 1999-2000
15.4
2789.22
01-07-91 to June 31-6-2000
Cumulative 4275.43 2000-2001 13.85 3354.99 630.35 2001-2002 12.62 3670.65 661.02 2002-2003
11.52 6410.67 716.20 Total outstanding
6579.67 Source: Bangladesh Power Development Board
92
The above table depicts that up to June, 2003 BPDB's total receivable for electric bill was Tk. 6410.67 crore and liability for DSL stood at Tk. 6579.67 crore.
Present Status of Power Transmission and Distribution
Transmission: Electricity generated from different power plants are transmitted through 230 kv and 123 kv lines. Upto June, 1996 the lengths of 230 kv and 132 kv transmission lines were 419 kv and 2691 km respectively. In FY 2001-02, the lengths of 230 kv and 132 transmission lines increased to 598 km and 3201 km respectively. In FY 2001-02, the number of 230/132 kv and 132/33 kv sub-stations stood at 9 and 75 respectively.
Distribution
Electricity is distributed in the country through 33 kv and 11 kv lines. In 1991-92 the length of BPDB distribution lines was 32780 km which has been increased to 41656 km in 2001-02. The length of distribution lines reached 43,059 km in June-03 (3.37 percent rise). The number BPDB, of consumers increased from 1223964 to 1644755 (a rise of 34.37%) during the same period and it rose to 16,95,416 (3.08 percent growth) in June -03.
Programmes Initiated for the Improvement of Power Supply Situation and Overall Efficiency
A. Reform Programmes: Government is committed to implement reform programmes for the overall improvement in the power sector. For the improvement of efficiency in generation, transmission and distribution management, reform programmes have been taken up. Some of them have already been implemented. At present the implementation status of reforms are as follows:
1. Under the reform programmes of the government, Power Grid Company of Bangladesh (PGCB) and Dhaka Electric Supply Company (DESCO) were created in 1996 under the Company Act 1994. PGCB has taken over the total transmission system from BPDB in December 2002.
2. Strategic Business Unit (SBU) programme have been brought under 47 distribution divisions of BPDB and DESA. Following introduction of SBU programme, the system loss has reduced and revenue collection has increased considerably.
3. Various actions are underway for the formation of 'West Zone Power Distribution Company' under BPDB.
4. In order to improve the efficiency in the distribution sector, BPDB's 4 distribution zones have been reorganized in to 8 zones. Besides, in order to increase the efficiency of the distribution management, distribution circles are reorganised into Strategic Business Units (SBUs) along with introduction of modern management. SBU system has already been introduced at Sherpur, Jamalpur & Bogra. The performance of these units has been found satisfactory.
5. As part of the reform and restructuring of the power sector, the Cabinet has approved the formation of the ''West Zone Power Distribution Company'' under BPDB in September 2002.
93
6. Programmes have been taken to introduce pre-paid metering system in BPDB at Chittagong and Sylhet and in DESA at Lalbag to ensure an increase in revenue collection.
Future Programmes for Power Sector Reform
The long term goals to be achieved in the approved policy for power sector reforms are as follows:
• To ensure electricity for all by the year 2020; • To commercialise the power sector utilities in order to make them financially viable; • To follow single buyer model for sale of electricity; • To establish an independent Energy Regulatory Commission.
B. Development Programmes
As per the reference forecast of the Power System Master Plan prepared in 1995, the maximum demand of electricity in 2005 & 2007 would be about 4595 mw and 5368 mw respectively. The government has taken initiatives to install necessary new power plants gradually to meet the projected demand along with achieving a reasonable reserve margin by FY 2007. In the mean time, construction of Siddirgonj thermal power station and Barapukuria coal-based power plant is under way.
Besides, "Bangladesh Energy Regulatory Commission Law 2002'' has been enacted to regulate Power, Gas and Petrolium sector. The Government is implementing a range of programmes for power generation and distribution which include, among others, conversion of BPDB into separate companies under the Company Act, taking joint venture commercial loans alongside Independent Power Producer (IPP), establishing power plants through self financing and through collection of funds from public via stock exchange, continuing the expansion of electricity distribution system through ''Palli Bidyut Samity'' under REB.
Regulatory Functions of Electrical Adviser And Chief Electric Inspector
The office of the Electrical Adviser and Chief Electric Inspector has been established under section 36 of the Indian Electricity Act, 1910 for ensuring proper control in each level of power generation, transmission, distribution, supply and use and safety of life and property. This office plays active roles as specified in the Electricity Act and Electricity Rules, Films Act and Rules as well as in revenue earnings.
Dhaka Electric Supply Authority (DESA) To bring dynamism and establish transparency in the power sector DESA has been established covering greater Dhaka in pursuance of the section-36 of article 4 of DESA Act, 1990.
DESA commenced its operation on 1st October 1991. The performance of electric distribution of Dhaka has improved after the establishment of DESA. Before the creation of DESA, the system loss of electric supply was 38.26 percent which decreased to 21.24 percent on an average during the last fiscal year. Set out below is a table that shows system loss during pre-DESA and post-DESA days.
94
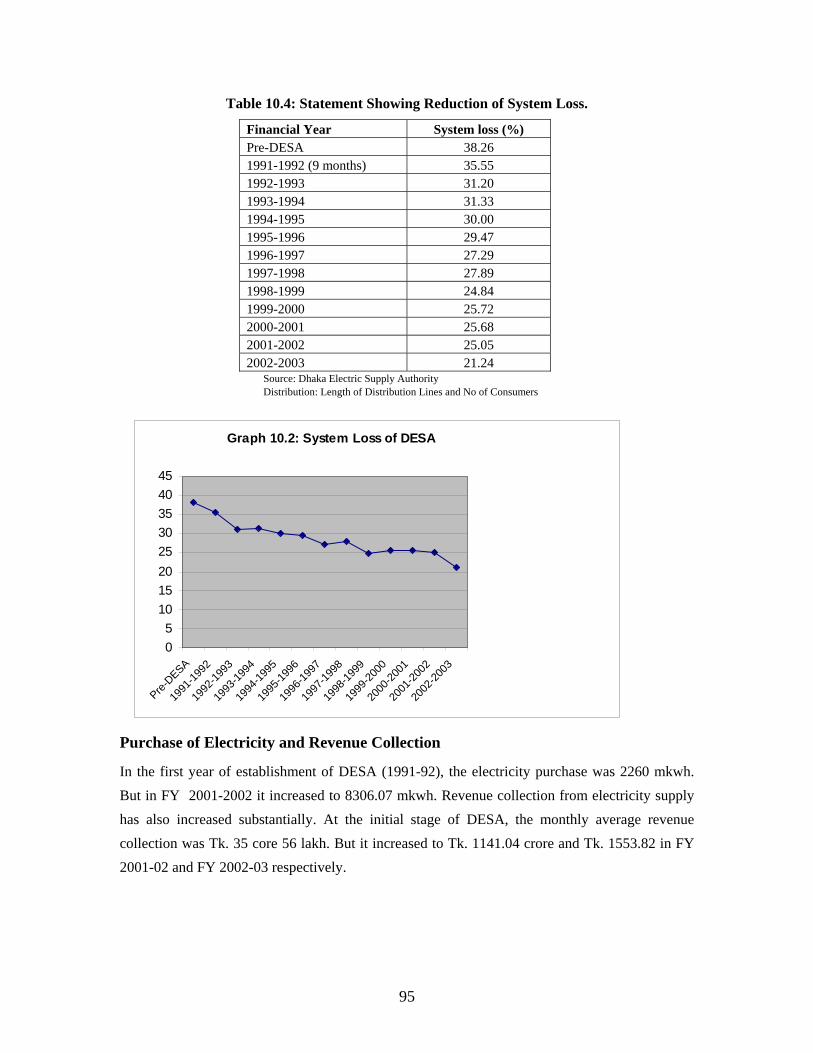
Table 10.4: Statement Showing Reduction of System Loss. Financial Year System loss (%) Pre-DESA 38.26 1991-1992 (9 months) 35.55 1992-1993 31.20 1993-1994 31.33 1994-1995 30.00 1995-1996 29.47 1996-1997 27.29 1997-1998 27.89 1998-1999 24.84 1999-2000 25.72 2000-2001 25.68 2001-2002 25.05 2002-2003 21.24
Source: Dhaka Electric Supply Authority Distribution: Length of Distribution Lines and No of Consumers
P
IBhc2
Graph 10.2: System Loss of DESA
05
1015202530354045
Pre-DESA
1991
-1992
1992
-1993
1993
-1994
1994
-1995
1995
-1996
1996
-1997
1997
-1998
1998
-1999
1999
-2000
2000
-2001
2001
-2002
2002
-2003
urchase of Electricity and Revenue Collection
n the first year of establishment of DESA (1991-92), the electricity purchase was 2260 mkwh. ut in FY 2001-2002 it increased to 8306.07 mkwh. Revenue collection from electricity supply as also increased substantially. At the initial stage of DESA, the monthly average revenue ollection was Tk. 35 core 56 lakh. But it increased to Tk. 1141.04 crore and Tk. 1553.82 in FY 001-02 and FY 2002-03 respectively.
95
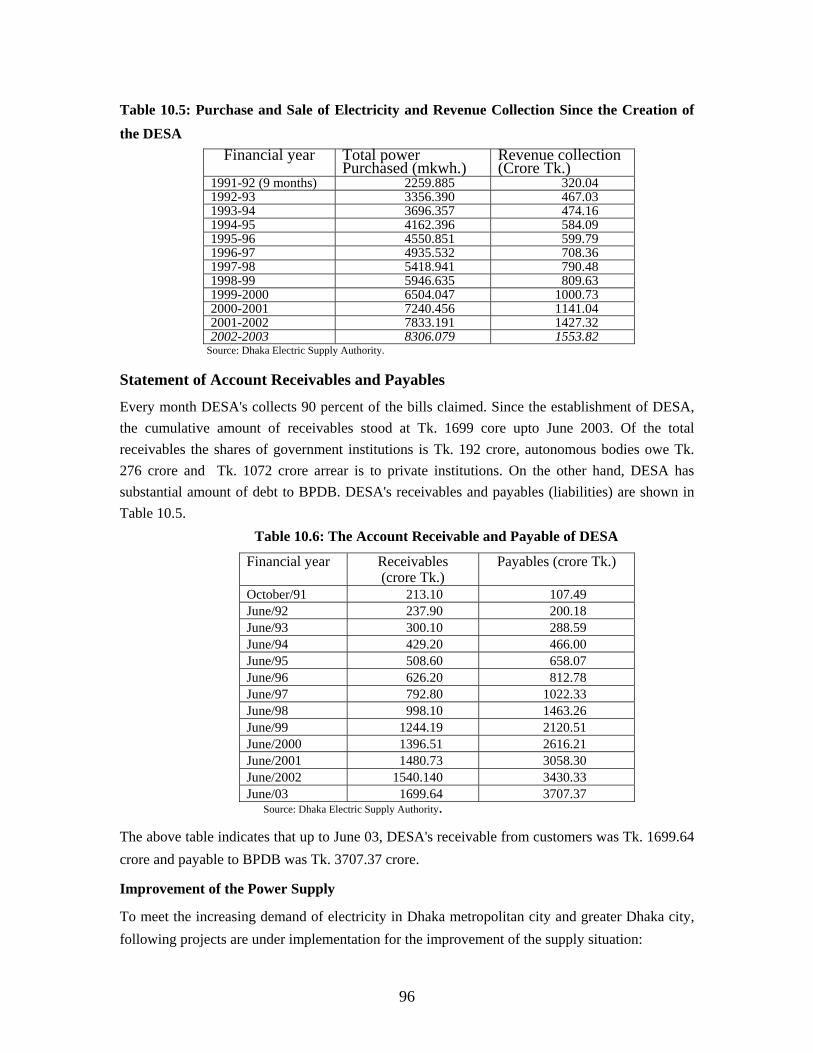
Table 10.5: Purchase and Sale of Electricity and Revenue Collection Since the Creation of the DESA
Financial year Total power Purchased (mkwh.)
Revenue collection (Crore Tk.)
1991-92 (9 months) 2259.885 320.04 1992-93 3356.390 467.03 1993-94 3696.357 474.16 1994-95 4162.396 584.09 1995-96 4550.851 599.79 1996-97 4935.532 708.36 1997-98 5418.941 790.48 1998-99 5946.635 809.63 1999-2000 6504.047 1000.73 2000-2001 7240.456 1141.04 2001-2002 7833.191 1427.32 2002-2003 8306.079 1553.82
Source: Dhaka Electric Supply Authority.
Statement of Account Receivables and Payables
Every month DESA's collects 90 percent of the bills claimed. Since the establishment of DESA, the cumulative amount of receivables stood at Tk. 1699 core upto June 2003. Of the total receivables the shares of government institutions is Tk. 192 crore, autonomous bodies owe Tk. 276 crore and Tk. 1072 crore arrear is to private institutions. On the other hand, DESA has substantial amount of debt to BPDB. DESA's receivables and payables (liabilities) are shown in Table 10.5.
Table 10.6: The Account Receivable and Payable of DESA
Financial year Receivables (crore Tk.)
Payables (crore Tk.)
October/91 213.10 107.49 June/92 237.90 200.18 June/93 300.10 288.59 June/94 429.20 466.00 June/95 508.60 658.07 June/96 626.20 812.78 June/97 792.80 1022.33 June/98 998.10 1463.26 June/99 1244.19 2120.51 June/2000 1396.51 2616.21 June/2001 1480.73 3058.30 June/2002 1540.140 3430.33 June/03 1699.64 3707.37
Source: Dhaka Electric Supply Authority.
The above table indicates that up to June 03, DESA's receivable from customers was Tk. 1699.64 crore and payable to BPDB was Tk. 3707.37 crore.
Improvement of the Power Supply
To meet the increasing demand of electricity in Dhaka metropolitan city and greater Dhaka city, following projects are under implementation for the improvement of the supply situation:
96
1. Greater Dhaka Power Distribution Project, Phase-IV. Under this Project, 45 km 132 kv, transmission line would be installed.
2. 132 kv Siddirgonj-Maniknagar Transmission line 9.5 km;
3. 132 kv Haripur Ullon Transmission line 60 km.
4. Turn-in-off 132 kv Tongi-Ullon second circuit into Bashundhara, 132/33 kv substation.
Besides the above projects, several other projects are planned for implementation to meet the
increasing demand for electricity in the, Dhaka city, which include:
a) 132 kv Joydebpur-Kabirpur double circuit transmission line 15 km.
b) 132 kv Mirpur-Dhanmondi new double circuit underground line 15 km;
c) 132 kv Shampur -Maniknagar double circuit transmission line 24 km.
Apart from these, one consumer service desk in each division has been in place for the improvement of consumer service. Besides, 4 vigilance teams have been working under the supervision of the Chairman, DESA. To mitigate low voltage problem, 1337 set capacitor banks have been installed in the system and installation of 250 set switch type capacitor banks is under way.
In order to augment revenue collection, disconnection campaign is being conducted effectively
and for this purpose 4 Magistracy courts are running Mobile courts under DESA. Following these
measures, revenue collection has increased and if this trend continues, in near future DESA
would appear as a profitable organisation.
Dhaka Electric Supply Company (DESCO)
In order to lay greater emphasis on distribution management of electricity in the metropolitan city
of Dhaka, to enhance reliability of electricity supply, to improve customer service, to reduce
system loss to a reasonable level, to augment revenue collection and above all to bring dynamism
in the distribution and to run it commercially DESCO was formed on 3rd November, 1996
covering the areas like Mirpur, Pallabi, Gulshan, and North region of Dhaka. The company has
launched its operation since 24th of September, 1998 in the above mentioned areas. Relevant
statistics on the commercial activities of DESCO are presented below:
97
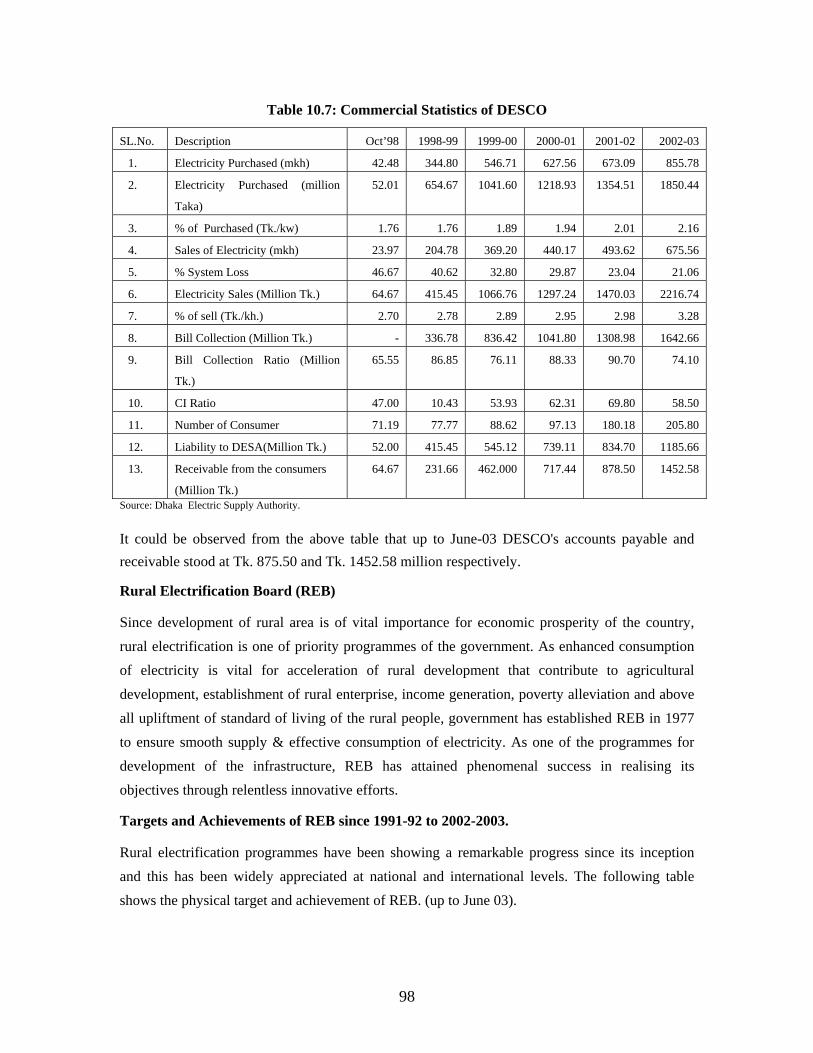
Table 10.7: Commercial Statistics of DESCO
SL.No. Description Oct’98 1998-99 1999-00 2000-01 2001-02 2002-03
1. Electricity Purchased (mkh) 42.48 344.80 546.71 627.56 673.09 855.78
2. Electricity Purchased (million
Taka)
52.01 654.67 1041.60 1218.93 1354.51 1850.44
3. % of Purchased (Tk./kw) 1.76 1.76 1.89 1.94 2.01 2.16
4. Sales of Electricity (mkh) 23.97 204.78 369.20 440.17 493.62 675.56
5. % System Loss 46.67 40.62 32.80 29.87 23.04 21.06
6. Electricity Sales (Million Tk.) 64.67 415.45 1066.76 1297.24 1470.03 2216.74
7. % of sell (Tk./kh.) 2.70 2.78 2.89 2.95 2.98 3.28
8. Bill Collection (Million Tk.) - 336.78 836.42 1041.80 1308.98 1642.66
9. Bill Collection Ratio (Million
Tk.)
65.55 86.85 76.11 88.33 90.70 74.10
10. CI Ratio 47.00 10.43 53.93 62.31 69.80 58.50
11. Number of Consumer 71.19 77.77 88.62 97.13 180.18 205.80
12. Liability to DESA(Million Tk.) 52.00 415.45 545.12 739.11 834.70 1185.66
13. Receivable from the consumers
(Million Tk.)
64.67 231.66 462.000 717.44 878.50 1452.58
Source: Dhaka Electric Supply Authority.
It could be observed from the above table that up to June-03 DESCO's accounts payable and receivable stood at Tk. 875.50 and Tk. 1452.58 million respectively.
Rural Electrification Board (REB)
Since development of rural area is of vital importance for economic prosperity of the country, rural electrification is one of priority programmes of the government. As enhanced consumption of electricity is vital for acceleration of rural development that contribute to agricultural development, establishment of rural enterprise, income generation, poverty alleviation and above all upliftment of standard of living of the rural people, government has established REB in 1977 to ensure smooth supply & effective consumption of electricity. As one of the programmes for development of the infrastructure, REB has attained phenomenal success in realising its objectives through relentless innovative efforts.
Targets and Achievements of REB since 1991-92 to 2002-2003.
Rural electrification programmes have been showing a remarkable progress since its inception and this has been widely appreciated at national and international levels. The following table shows the physical target and achievement of REB. (up to June 03).
98
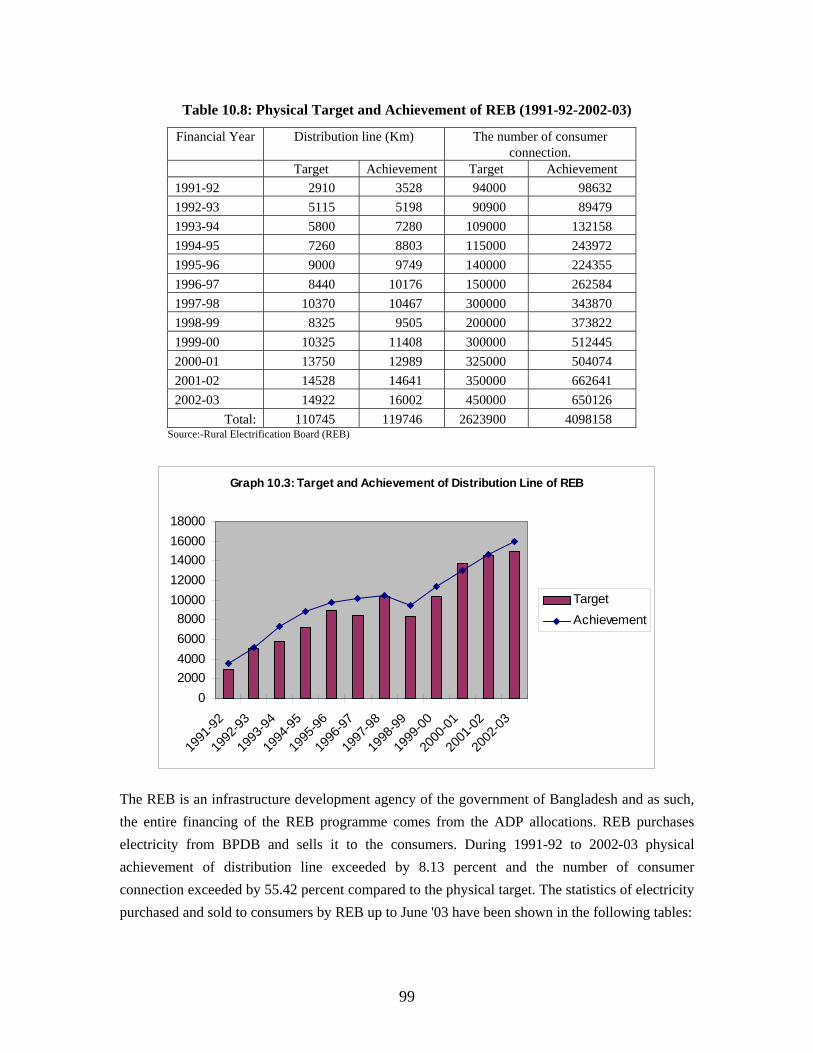
Table 10.8: Physical Target and Achievement of REB (1991-92-2002-03)
Financial Year Distribution line (Km) The number of consumer connection.
Target Achievement Target Achievement 1991-92 2910 3528 94000 98632 1992-93 5115 5198 90900 89479 1993-94 5800 7280 109000 132158 1994-95 7260 8803 115000 243972 1995-96 9000 9749 140000 224355 1996-97 8440 10176 150000 262584 1997-98 10370 10467 300000 343870 1998-99 8325 9505 200000 373822 1999-00 10325 11408 300000 512445 2000-01 13750 12989 325000 504074 2001-02 14528 14641 350000 662641 2002-03 14922 16002 450000 650126
Total: 110745 119746 2623900 4098158 Source:-Rural Electrification Board (REB)
Graph 10.3: Target and Achievement of Distribution Line of REB
02000400060008000
1000012000140001600018000
1991
-92
1992
-93
1993
-94
1994
-95
1995
-96
1996
-97
1997
-98
1998
-99
1999
-00
2000
-01
2001
-02
2002
-03
TargetAchievement
The REB is an infrastructure development agency of the government of Bangladesh and as such, the entire financing of the REB programme comes from the ADP allocations. REB purchases electricity from BPDB and sells it to the consumers. During 1991-92 to 2002-03 physical achievement of distribution line exceeded by 8.13 percent and the number of consumer connection exceeded by 55.42 percent compared to the physical target. The statistics of electricity purchased and sold to consumers by REB up to June '03 have been shown in the following tables:
99
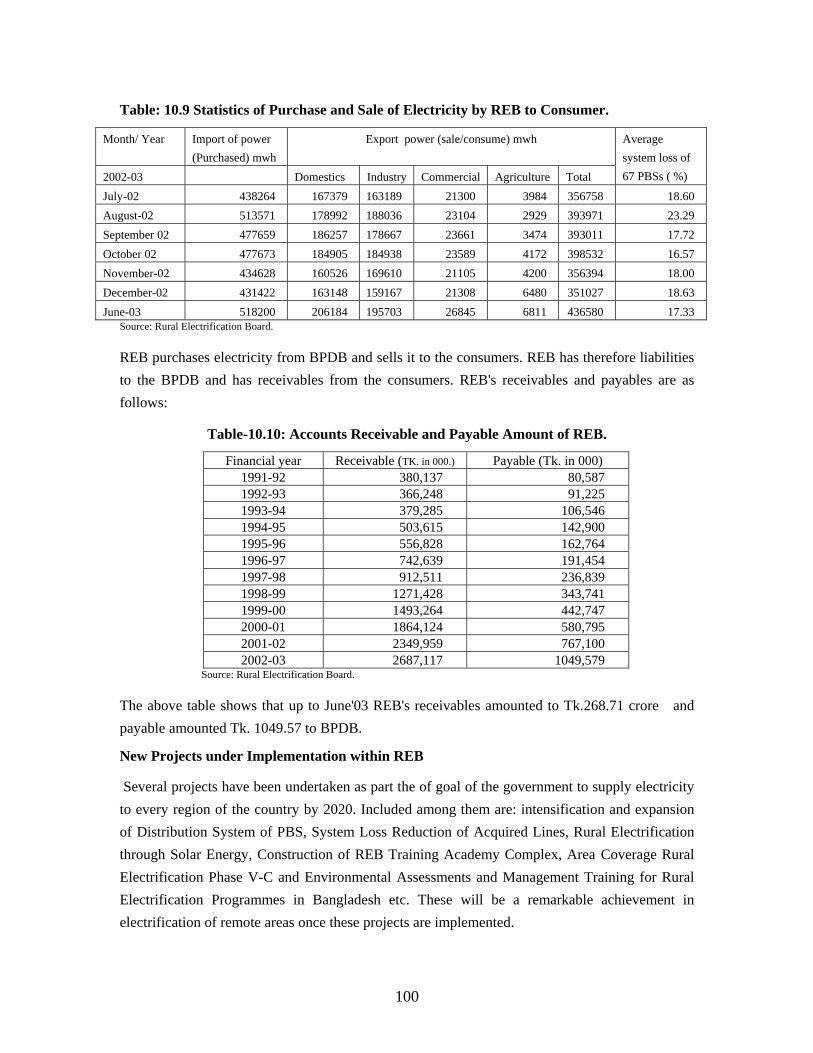
Table: 10.9 Statistics of Purchase and Sale of Electricity by REB to Consumer.
Month/ Year Import of power (Purchased) mwh
Export power (sale/consume) mwh
2002-03 Domestics Industry Commercial Agriculture Total
Average system loss of 67 PBSs ( %)
July-02 438264 167379 163189 21300 3984 356758 18.60 August-02 513571 178992 188036 23104 2929 393971 23.29 September 02 477659 186257 178667 23661 3474 393011 17.72 October 02 477673 184905 184938 23589 4172 398532 16.57 November-02 434628 160526 169610 21105 4200 356394 18.00 December-02 431422 163148 159167 21308 6480 351027 18.63 June-03 518200 206184 195703 26845 6811 436580 17.33
Source: Rural Electrification Board.
REB purchases electricity from BPDB and sells it to the consumers. REB has therefore liabilities to the BPDB and has receivables from the consumers. REB's receivables and payables are as follows:
Table-10.10: Accounts Receivable and Payable Amount of REB.
Financial year Receivable (TK. in 000.) Payable (Tk. in 000) 1991-92 380,137 80,587 1992-93 366,248 91,225 1993-94 379,285 106,546 1994-95 503,615 142,900 1995-96 556,828 162,764 1996-97 742,639 191,454 1997-98 912,511 236,839 1998-99 1271,428 343,741 1999-00 1493,264 442,747 2000-01 1864,124 580,795 2001-02 2349,959 767,100 2002-03 2687,117 1049,579
Source: Rural Electrification Board.
The above table shows that up to June'03 REB's receivables amounted to Tk.268.71 crore and payable amounted Tk. 1049.57 to BPDB.
New Projects under Implementation within REB
Several projects have been undertaken as part the of goal of the government to supply electricity to every region of the country by 2020. Included among them are: intensification and expansion of Distribution System of PBS, System Loss Reduction of Acquired Lines, Rural Electrification through Solar Energy, Construction of REB Training Academy Complex, Area Coverage Rural Electrification Phase V-C and Environmental Assessments and Management Training for Rural Electrification Programmes in Bangladesh etc. These will be a remarkable achievement in electrification of remote areas once these projects are implemented.
100
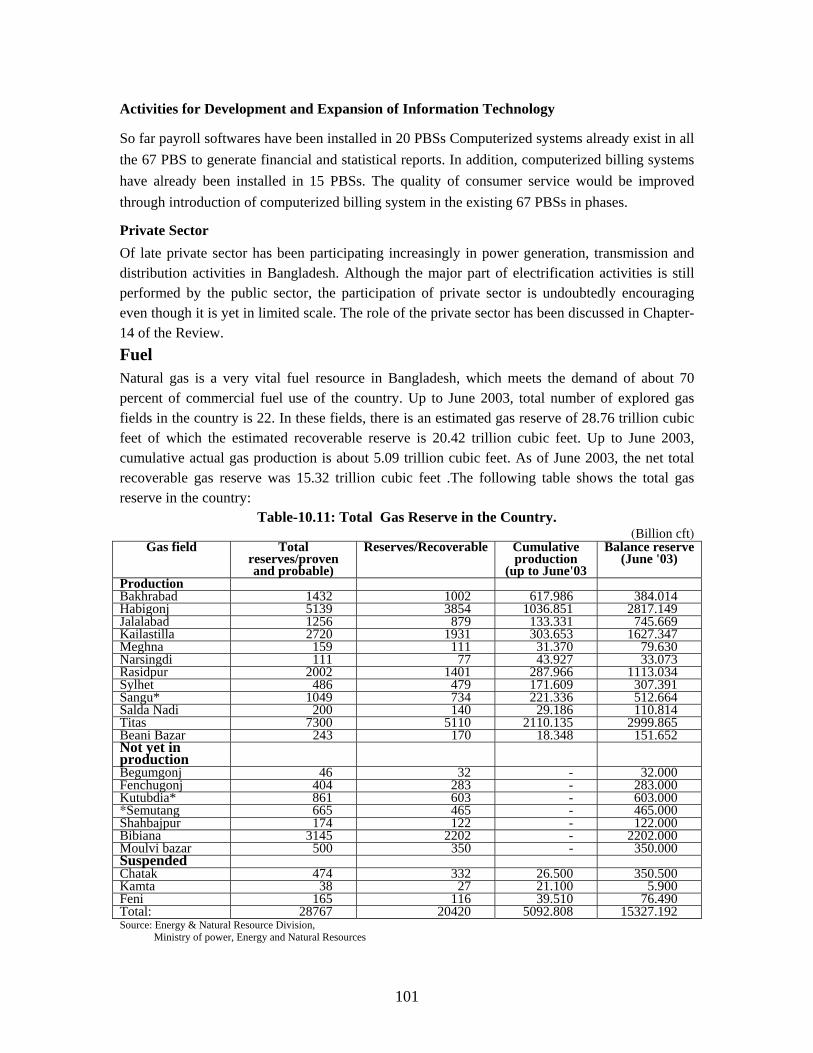
Activities for Development and Expansion of Information Technology
So far payroll softwares have been installed in 20 PBSs Computerized systems already exist in all the 67 PBS to generate financial and statistical reports. In addition, computerized billing systems have already been installed in 15 PBSs. The quality of consumer service would be improved through introduction of computerized billing system in the existing 67 PBSs in phases.
Private Sector Of late private sector has been participating increasingly in power generation, transmission and distribution activities in Bangladesh. Although the major part of electrification activities is still performed by the public sector, the participation of private sector is undoubtedly encouraging even though it is yet in limited scale. The role of the private sector has been discussed in Chapter-14 of the Review. Fuel
Cumulative
Natural gas is a very vital fuel resource in Bangladesh, which meets the demand of about 70 percent of commercial fuel use of the country. Up to June 2003, total number of explored gas fields in the country is 22. In these fields, there is an estimated gas reserve of 28.76 trillion cubic feet of which the estimated recoverable reserve is 20.42 trillion cubic feet. Up to June 2003, cumulative actual gas production is about 5.09 trillion cubic feet. As of June 2003, the net total recoverable gas reserve was 15.32 trillion cubic feet .The following table shows the total gas reserve in the country:
Table-10.11: Total Gas Reserve in the Country. (Billion cft)
Gas field Total reserves/proven and probable)
Reserves/Recoverable production
(up to June'03
Balance reserve(June '03)
Production Bakhrabad 1432 1002 617.986 384.014 Habigonj 5139 3854 1036.851 2817.149 Jalalabad 1256 879 133.331 745.669 Kailastilla 2720 1931 303.653 1627.347 Meghna 159 111 31.370 79.630 Narsingdi 111 77 43.927 33.073 Rasidpur 2002 1401 287.966 1113.034 Sylhet 486 479 171.609 307.391 Sangu* 1049 734 221.336 512.664 Salda Nadi 200 140 29.186 110.814 Titas 7300 5110 2110.135 2999.865 Beani Bazar 243 170 18.348 151.652 Not yet in production
Begumgonj 46 32 - 32.000 Fenchugonj 404 283 - 283.000 Kutubdia* 861 603 - 603.000 *Semutang 665 465 - 465.000 Shahbajpur 174 122 - 122.000 Bibiana 3145 2202 - 2202.000 Moulvi bazar 500 350 - 350.000 Suspended Chatak 474 332 26.500 350.500 Kamta 38 27 21.100 5.900 Feni 165 116 39.510 76.490 Total: 28767 20420 5092.808 15327.192 Source: Energy & Natural Resource Division, Ministry of power, Energy and Natural Resources
101
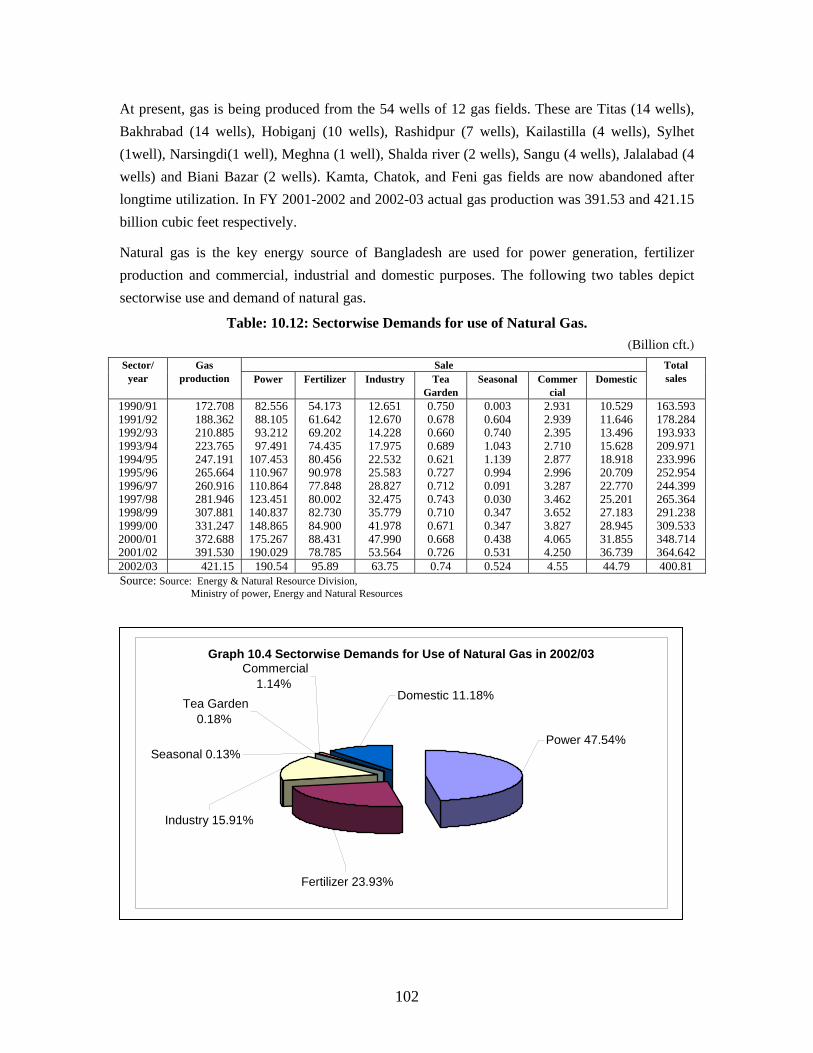
At present, gas is being produced from the 54 wells of 12 gas fields. These are Titas (14 wells), Bakhrabad (14 wells), Hobiganj (10 wells), Rashidpur (7 wells), Kailastilla (4 wells), Sylhet (1well), Narsingdi(1 well), Meghna (1 well), Shalda river (2 wells), Sangu (4 wells), Jalalabad (4 wells) and Biani Bazar (2 wells). Kamta, Chatok, and Feni gas fields are now abandoned after longtime utilization. In FY 2001-2002 and 2002-03 actual gas production was 391.53 and 421.15 billion cubic feet respectively.
Natural gas is the key energy source of Bangladesh are used for power generation, fertilizer production and commercial, industrial and domestic purposes. The following two tables depict sectorwise use and demand of natural gas.
Table: 10.12: Sectorwise Demands for use of Natural Gas. (Billion cft.)
Sale Sector/ year
Gas production Power Fertilizer Industry Tea
Garden Seasonal Commer
cial Domestic
Total sales
1990/91 1991/92 1992/93 1993/94 1994/95 1995/96 1996/97 1997/98 1998/99 1999/00 2000/01
210.885
260.916
372.688
93.212 14.228
0.727
0.668
1.043
2001/02
172.708 188.362
223.765 247.191 265.664
281.946 307.881 331.247
391.530
82.556 88.105
97.491 107.453 110.967 110.864 123.451 140.837 148.865 175.267 190.029
54.173 61.642 69.202 74.435 80.456 90.978 77.848 80.002 82.730 84.900 88.431 78.785
12.651 12.670
17.975 22.532 25.583 28.827 32.475 35.779 41.978 47.990 53.564
0.750 0.678 0.660 0.689 0.621
0.712 0.743 0.710 0.671
0.726
0.003 0.604 0.740
1.139 0.994 0.091 0.030 0.347 0.347 0.438 0.531
2.931 2.939 2.395 2.710 2.877 2.996 3.287 3.462 3.652 3.827 4.065 4.250
10.529 11.646 13.496 15.628 18.918 20.709 22.770 25.201 27.183 28.945 31.855 36.739
163.593 178.284 193.933 209.971 233.996 252.954 244.399 265.364 291.238 309.533 348.714 364.642
2002/03 421.15 190.54 95.89 63.75 0.74 0.524 4.55 44.79 400.81 Source: Source: Energy & Natural Resource Division, Ministry of power, Energy and Natural Resources
Graph 10.4 Sectorwise Demands for Use of Natural Gas in 2002/03
Industry 15.91%
Power 47.54%
Domestic 11.18%
Commercial 1.14%
Seasonal 0.13%
Tea Garden 0.18%
Fertilizer 23.93%
102
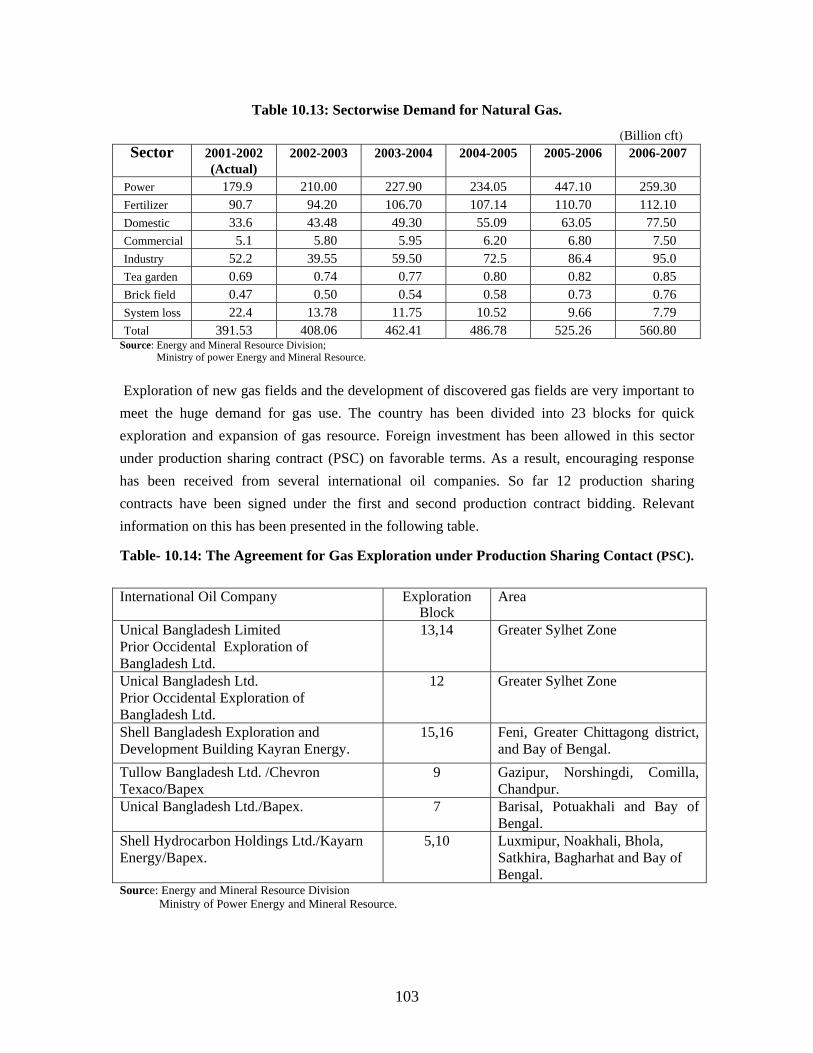
Table 10.13: Sectorwise Demand for Natural Gas.
(Billion cft) Sector 2001-2002
(Actual) 2002-2003 2003-2004 2004-2005 2005-2006 2006-2007
Power 179.9 210.00 227.90 234.05 447.10 259.30 Fertilizer 90.7 94.20 106.70 107.14 110.70 112.10 Domestic 33.6 43.48 49.30 55.09 63.05 77.50 Commercial 5.1 5.80 5.95 6.20 6.80 7.50 Industry 52.2 39.55 59.50 72.5 86.4 95.0 Tea garden 0.69 0.74 0.77 0.80 0.82 0.85 Brick field 0.47 0.50 0.54 0.58 0.73 0.76 System loss 22.4 13.78 11.75 10.52 9.66 7.79 Total 391.53 408.06 462.41 486.78 525.26 560.80
Source: Energy and Mineral Resource Division; Ministry of power Energy and Mineral Resource.
Exploration of new gas fields and the development of discovered gas fields are very important to meet the huge demand for gas use. The country has been divided into 23 blocks for quick exploration and expansion of gas resource. Foreign investment has been allowed in this sector under production sharing contract (PSC) on favorable terms. As a result, encouraging response has been received from several international oil companies. So far 12 production sharing contracts have been signed under the first and second production contract bidding. Relevant information on this has been presented in the following table.
Table- 10.14: The Agreement for Gas Exploration under Production Sharing Contact (PSC).
International Oil Company
Exploration Block
Area
Unical Bangladesh Limited Prior Occidental Exploration of Bangladesh Ltd.
13,14 Greater Sylhet Zone
Unical Bangladesh Ltd. Prior Occidental Exploration of Bangladesh Ltd.
12 Greater Sylhet Zone
Shell Bangladesh Exploration and Development Building Kayran Energy.
15,16 Feni, Greater Chittagong district, and Bay of Bengal.
Tullow Bangladesh Ltd. /Chevron Texaco/Bapex
9 Gazipur, Norshingdi, Comilla, Chandpur.
Unical Bangladesh Ltd./Bapex. 7 Barisal, Potuakhali and Bay of Bengal.
Shell Hydrocarbon Holdings Ltd./Kayarn Energy/Bapex.
5,10 Luxmipur, Noakhali, Bhola, Satkhira, Bagharhat and Bay of Bengal.
Source: Energy and Mineral Resource Division Ministry of Power Energy and Mineral Resource.
103
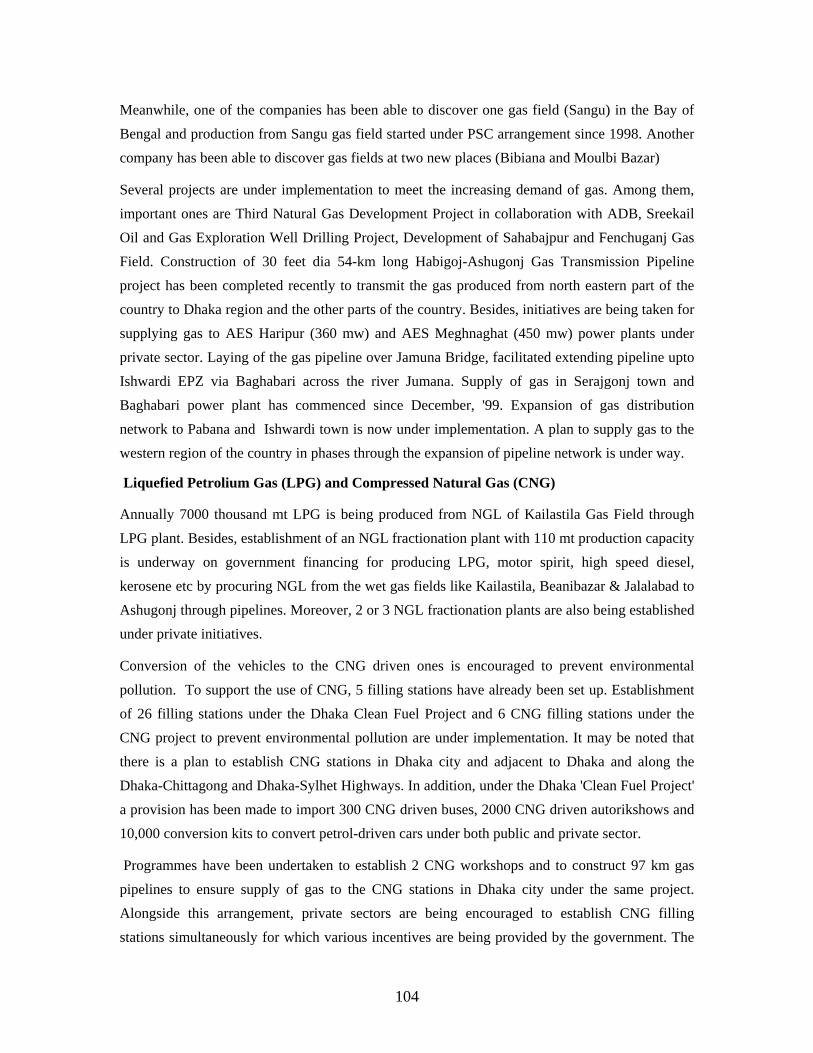
Meanwhile, one of the companies has been able to discover one gas field (Sangu) in the Bay of Bengal and production from Sangu gas field started under PSC arrangement since 1998. Another company has been able to discover gas fields at two new places (Bibiana and Moulbi Bazar)
Several projects are under implementation to meet the increasing demand of gas. Among them, important ones are Third Natural Gas Development Project in collaboration with ADB, Sreekail Oil and Gas Exploration Well Drilling Project, Development of Sahabajpur and Fenchuganj Gas Field. Construction of 30 feet dia 54-km long Habigoj-Ashugonj Gas Transmission Pipeline project has been completed recently to transmit the gas produced from north eastern part of the country to Dhaka region and the other parts of the country. Besides, initiatives are being taken for supplying gas to AES Haripur (360 mw) and AES Meghnaghat (450 mw) power plants under private sector. Laying of the gas pipeline over Jamuna Bridge, facilitated extending pipeline upto Ishwardi EPZ via Baghabari across the river Jumana. Supply of gas in Serajgonj town and Baghabari power plant has commenced since December, '99. Expansion of gas distribution network to Pabana and Ishwardi town is now under implementation. A plan to supply gas to the western region of the country in phases through the expansion of pipeline network is under way.
Liquefied Petrolium Gas (LPG) and Compressed Natural Gas (CNG)
Annually 7000 thousand mt LPG is being produced from NGL of Kailastila Gas Field through LPG plant. Besides, establishment of an NGL fractionation plant with 110 mt production capacity is underway on government financing for producing LPG, motor spirit, high speed diesel, kerosene etc by procuring NGL from the wet gas fields like Kailastila, Beanibazar & Jalalabad to Ashugonj through pipelines. Moreover, 2 or 3 NGL fractionation plants are also being established under private initiatives.
Conversion of the vehicles to the CNG driven ones is encouraged to prevent environmental
pollution. To support the use of CNG, 5 filling stations have already been set up. Establishment of 26 filling stations under the Dhaka Clean Fuel Project and 6 CNG filling stations under the CNG project to prevent environmental pollution are under implementation. It may be noted that there is a plan to establish CNG stations in Dhaka city and adjacent to Dhaka and along the Dhaka-Chittagong and Dhaka-Sylhet Highways. In addition, under the Dhaka 'Clean Fuel Project' a provision has been made to import 300 CNG driven buses, 2000 CNG driven autorikshows and 10,000 conversion kits to convert petrol-driven cars under both public and private sector.
Programmes have been undertaken to establish 2 CNG workshops and to construct 97 km gas pipelines to ensure supply of gas to the CNG stations in Dhaka city under the same project. Alongside this arrangement, private sectors are being encouraged to establish CNG filling stations simultaneously for which various incentives are being provided by the government. The
104
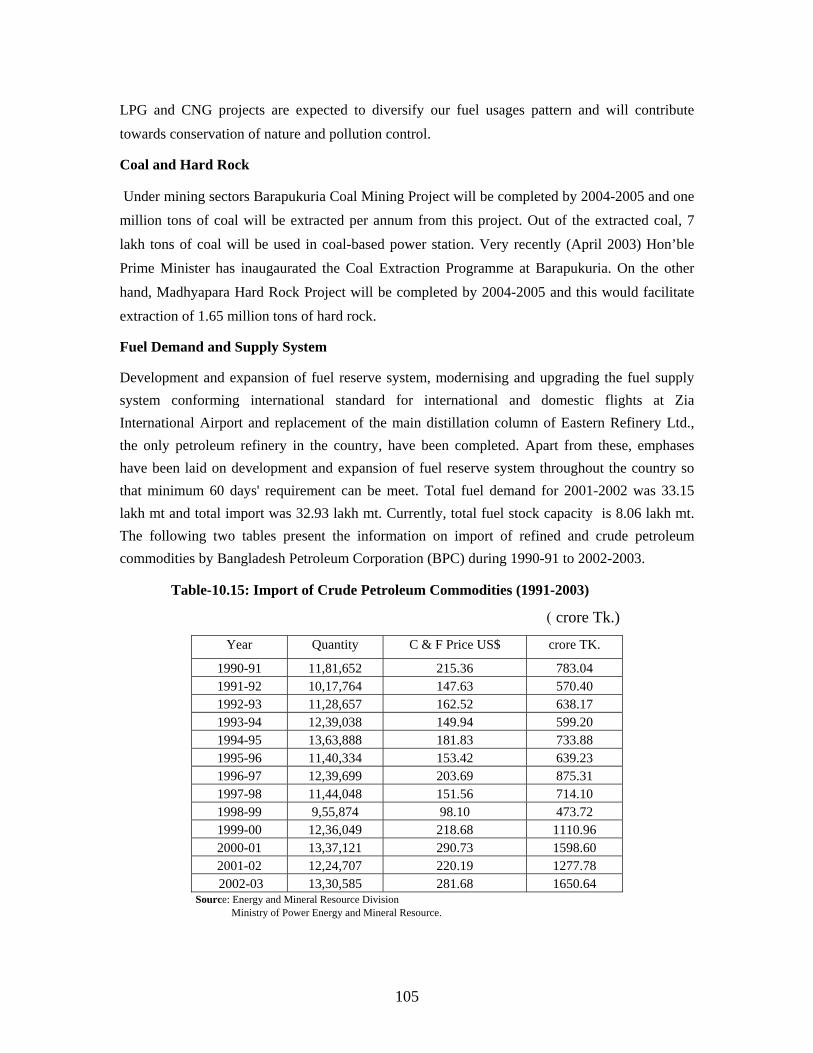
LPG and CNG projects are expected to diversify our fuel usages pattern and will contribute towards conservation of nature and pollution control.
Coal and Hard Rock
Under mining sectors Barapukuria Coal Mining Project will be completed by 2004-2005 and one million tons of coal will be extracted per annum from this project. Out of the extracted coal, 7 lakh tons of coal will be used in coal-based power station. Very recently (April 2003) Hon’ble Prime Minister has inaugaurated the Coal Extraction Programme at Barapukuria. On the other hand, Madhyapara Hard Rock Project will be completed by 2004-2005 and this would facilitate extraction of 1.65 million tons of hard rock.
Fuel Demand and Supply System
Development and expansion of fuel reserve system, modernising and upgrading the fuel supply system conforming international standard for international and domestic flights at Zia International Airport and replacement of the main distillation column of Eastern Refinery Ltd., the only petroleum refinery in the country, have been completed. Apart from these, emphases have been laid on development and expansion of fuel reserve system throughout the country so that minimum 60 days' requirement can be meet. Total fuel demand for 2001-2002 was 33.15 lakh mt and total import was 32.93 lakh mt. Currently, total fuel stock capacity is 8.06 lakh mt. The following two tables present the information on import of refined and crude petroleum commodities by Bangladesh Petroleum Corporation (BPC) during 1990-91 to 2002-2003.
Table-10.15: Import of Crude Petroleum Commodities (1991-2003)
( crore Tk.)
Year Quantity C & F Price US$ crore TK.
1990-91 11,81,652 215.36 783.04 1991-92 10,17,764 147.63 570.40 1992-93 11,28,657 162.52 638.17 1993-94 12,39,038 149.94 599.20 1994-95 13,63,888 181.83 733.88 1995-96 11,40,334 153.42 639.23 1996-97 12,39,699 203.69 875.31 1997-98 11,44,048 151.56 714.10 1998-99 9,55,874 98.10 473.72 1999-00 12,36,049 218.68 1110.96 2000-01 13,37,121 290.73 1598.60 2001-02 12,24,707 220.19 1277.78 2002-03 13,30,585 281.68 1650.64
Energy and Mineral Resource Division Source: Ministry of Power Energy and Mineral Resource.
105
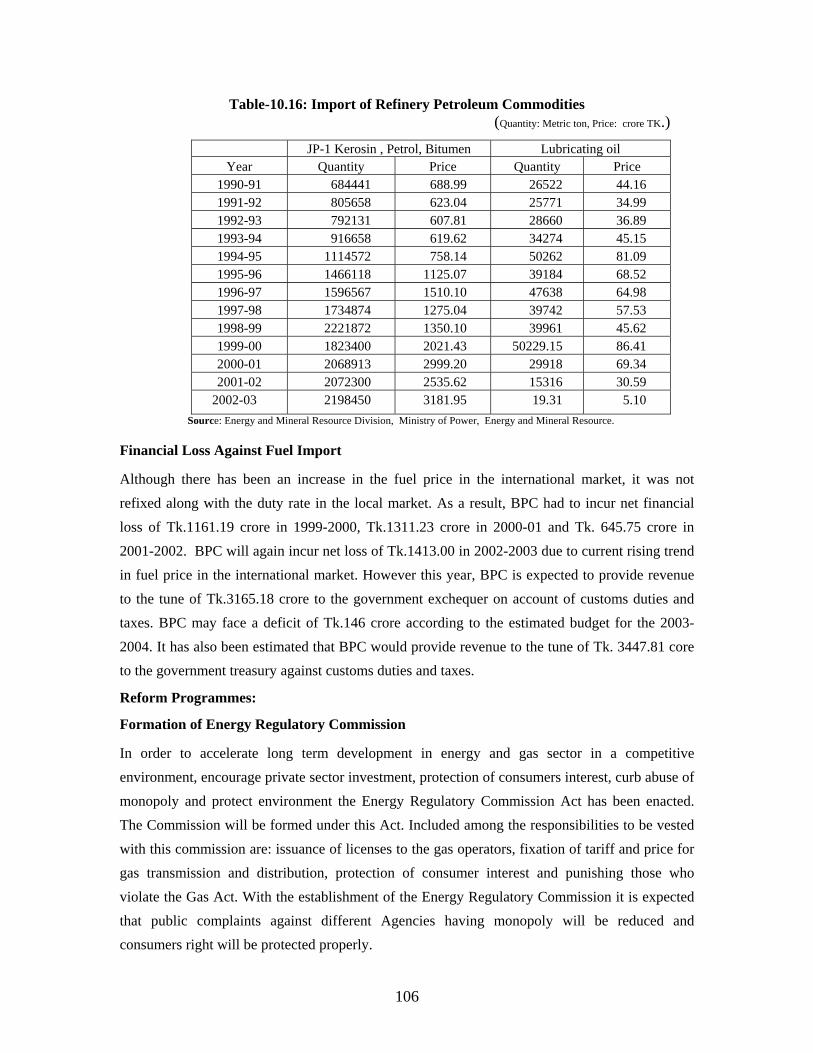
Table-10.16: Import of Refinery Petroleum Commodities (Quantity: Metric ton, Price: crore TK.)
JP-1 Kerosin , Petrol, Bitumen Lubricating oil Year Quantity Price Quantity Price
1990-91 684441 688.99 26522 44.16 1991-92 805658 623.04 25771 34.99 1992-93 792131 607.81 28660 36.89 1993-94 916658 619.62 34274 45.15 1994-95 1114572 758.14 50262 81.09 1995-96 1466118 1125.07 39184 68.52 1996-97 1596567 1510.10 47638 64.98 1997-98 1734874 1275.04 39742 57.53 1998-99 2221872 1350.10 39961 45.62 1999-00 1823400 2021.43 50229.15 86.41 2000-01 2068913 2999.20 29918 69.34 2001-02 2072300 2535.62 15316 30.59
2002-03 2198450 3181.95 19.31 5.10 Source: Energy and Mineral Resource Division, Ministry of Power, Energy and Mineral Resource.
Financial Loss Against Fuel Import
Although there has been an increase in the fuel price in the international market, it was not refixed along with the duty rate in the local market. As a result, BPC had to incur net financial loss of Tk.1161.19 crore in 1999-2000, Tk.1311.23 crore in 2000-01 and Tk. 645.75 crore in 2001-2002. BPC will again incur net loss of Tk.1413.00 in 2002-2003 due to current rising trend in fuel price in the international market. However this year, BPC is expected to provide revenue to the tune of Tk.3165.18 crore to the government exchequer on account of customs duties and taxes. BPC may face a deficit of Tk.146 crore according to the estimated budget for the 2003-2004. It has also been estimated that BPC would provide revenue to the tune of Tk. 3447.81 core to the government treasury against customs duties and taxes.
Reform Programmes:
Formation of Energy Regulatory Commission
In order to accelerate long term development in energy and gas sector in a competitive environment, encourage private sector investment, protection of consumers interest, curb abuse of monopoly and protect environment the Energy Regulatory Commission Act has been enacted. The Commission will be formed under this Act. Included among the responsibilities to be vested with this commission are: issuance of licenses to the gas operators, fixation of tariff and price for gas transmission and distribution, protection of consumer interest and punishing those who violate the Gas Act. With the establishment of the Energy Regulatory Commission it is expected that public complaints against different Agencies having monopoly will be reduced and consumers right will be protected properly.
106
Simplification of the Gas Connection Method
Previously the consumer had to submit 20 types of documents to get gas connection and had to wait months after months. To eliminate the consumers sufferings, the existing gas connection system has been simplified by the government.
Strengthening the Commercial Activities in Oil and Gas Sector
The present government has been opened import of lubricating oil, LPG, and transformer oil to encourage participation of private and foreign investment in fuel sector. So lubricating oil from world famous companies are being imported in the country now. Apart from this, many entrepreneurs have come up to produce lubricating oil, through establishment of Lube Blending Plant, establishment of LPG bottling plant and transformer oil production plants. Meanwhile under the private sector initiative, 5 LP gas bottling and several transformer oil producing factories have been set up. This has resulted in the savings of foreign currencies, capital investment and creation of employment opportunities.
Autonomy, Transparency and Accountability
Administrative and financial autonomy has been granted to the three companies of Petrobangla Titas Gas Transmission and Distribution Company Ltd., Compressed Natural Gas Company Ltd. and Gas Transmission Company Ltd so that they can exercise all powers under the Companies Act, 1994. Granting autonomy to other six companies is in progress. The Boards of Director of these companies are being restructured by accommodating representatives from the private sector, so that the representation from the consumers are ensured. The manpower of Petrobangla and its subsidiary companies are being rationalised. Constant supervision and monitoring by the task force formed to reduce system loss, disconnection of illegal lines, declaration of gas company services as essential service, settlement of liabilities through courts and introduction of proper billing system have brought remarkable successes. The top management of above 3 autonomous companies will be appointed through competition.
Private sector
Private sector has also come up in the field of fuel supply. The role of this sector has been discussed in Chapter-14 of the Review.
Conclusion
By 2050 the world energy usage will be doubled. Most of the growth would be in the developing countries whose billions of people would escape from poverty. Despite the attainment of greater efficiencies, demand from developed nations will continue unabated. Against this backdrop, we have to prepare ourselves in advance and formulate long-term perspective plan and programme to meet the future energy demand of the country.
107
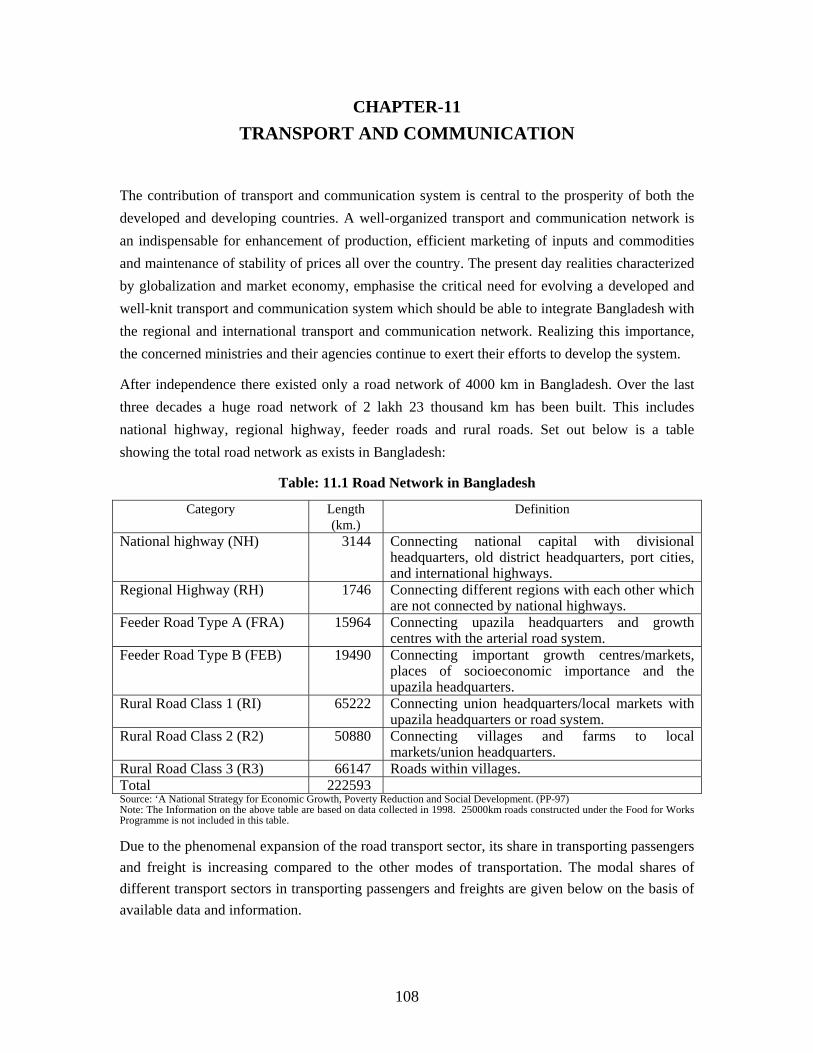
CHAPTER-11 TRANSPORT AND COMMUNICATION
The contribution of transport and communication system is central to the prosperity of both the developed and developing countries. A well-organized transport and communication network is an indispensable for enhancement of production, efficient marketing of inputs and commodities and maintenance of stability of prices all over the country. The present day realities characterized by globalization and market economy, emphasise the critical need for evolving a developed and well-knit transport and communication system which should be able to integrate Bangladesh with the regional and international transport and communication network. Realizing this importance, the concerned ministries and their agencies continue to exert their efforts to develop the system.
After independence there existed only a road network of 4000 km in Bangladesh. Over the last three decades a huge road network of 2 lakh 23 thousand km has been built. This includes national highway, regional highway, feeder roads and rural roads. Set out below is a table showing the total road network as exists in Bangladesh:
Table: 11.1 Road Network in Bangladesh
Category Length (km.)
Definition
National highway (NH) 3144 Connecting national capital with divisional headquarters, old district headquarters, port cities, and international highways.
Regional Highway (RH) 1746 Connecting different regions with each other which are not connected by national highways.
Feeder Road Type A (FRA) 15964 Connecting upazila headquarters and growth centres with the arterial road system.
Feeder Road Type B (FEB) 19490 Connecting important growth centres/markets, places of socioeconomic importance and the upazila headquarters.
Rural Road Class 1 (RI) 65222 Connecting union headquarters/local markets with upazila headquarters or road system.
Rural Road Class 2 (R2) 50880 Connecting villages and farms to local markets/union headquarters.
Rural Road Class 3 (R3) 66147 Roads within villages. Total 222593 Source: ‘A National Strategy for Economic Growth, Poverty Reduction and Social Development. (PP-97) Note: The Information on the above table are based on data collected in 1998. 25000km roads constructed under the Food for Works Programme is not included in this table.
Due to the phenomenal expansion of the road transport sector, its share in transporting passengers and freight is increasing compared to the other modes of transportation. The modal shares of different transport sectors in transporting passengers and freights are given below on the basis of available data and information.
108
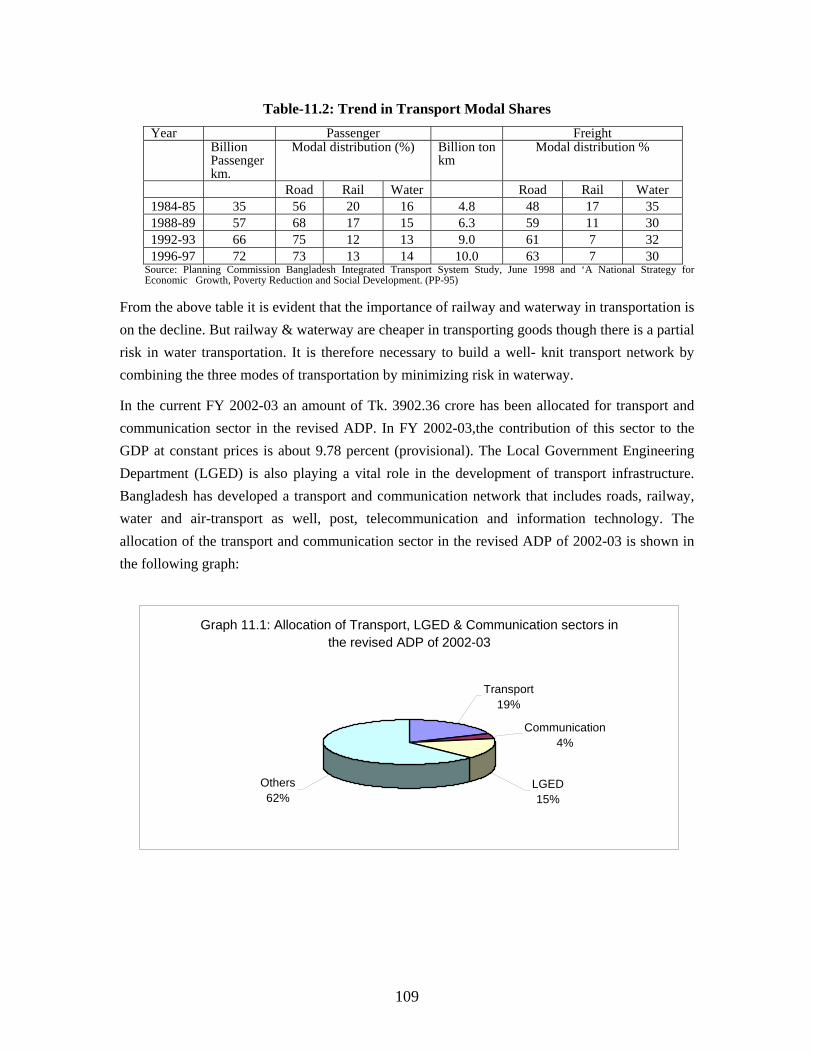
Table-11.2: Trend in Transport Modal Shares Year Passenger Freight Billion
Passenger km.
Modal distribution (%) Billion ton km
Modal distribution %
Road Rail Water Road Rail Water 1984-85 35 56 20 16 4.8 48 17 35 1988-89 57 68 17 15 6.3 59 11 30 1992-93 66 75 12 13 9.0 61 7 32 1996-97 72 73 13 14 10.0 63 7 30
Source: Planning Commission Bangladesh Integrated Transport System Study, June 1998 and ‘A National Strategy for Economic Growth, Poverty Reduction and Social Development. (PP-95)
From the above table it is evident that the importance of railway and waterway in transportation is on the decline. But railway & waterway are cheaper in transporting goods though there is a partial risk in water transportation. It is therefore necessary to build a well- knit transport network by combining the three modes of transportation by minimizing risk in waterway.
In the current FY 2002-03 an amount of Tk. 3902.36 crore has been allocated for transport and communication sector in the revised ADP. In FY 2002-03,the contribution of this sector to the GDP at constant prices is about 9.78 percent (provisional). The Local Government Engineering Department (LGED) is also playing a vital role in the development of transport infrastructure. Bangladesh has developed a transport and communication network that includes roads, railway, water and air-transport as well, post, telecommunication and information technology. The allocation of the transport and communication sector in the revised ADP of 2002-03 is shown in the following graph:
Graph 11.1: Allocation of Transport, LGED & Communication sectors in the revised ADP of 2002-03
Communication4%
LGED15%
Others62%
Transport19%
109
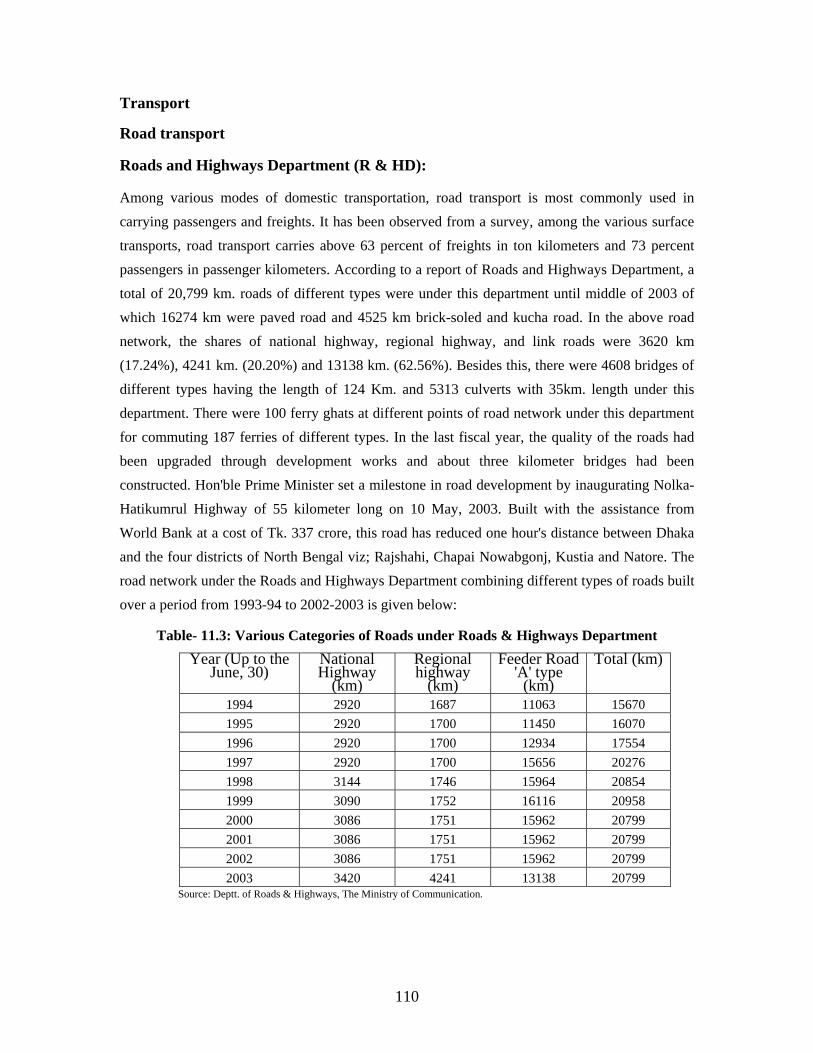
Transport
Road transport
Roads and Highways Department (R & HD):
Among various modes of domestic transportation, road transport is most commonly used in carrying passengers and freights. It has been observed from a survey, among the various surface transports, road transport carries above 63 percent of freights in ton kilometers and 73 percent passengers in passenger kilometers. According to a report of Roads and Highways Department, a total of 20,799 km. roads of different types were under this department until middle of 2003 of which 16274 km were paved road and 4525 km brick-soled and kucha road. In the above road network, the shares of national highway, regional highway, and link roads were 3620 km (17.24%), 4241 km. (20.20%) and 13138 km. (62.56%). Besides this, there were 4608 bridges of different types having the length of 124 Km. and 5313 culverts with 35km. length under this department. There were 100 ferry ghats at different points of road network under this department for commuting 187 ferries of different types. In the last fiscal year, the quality of the roads had been upgraded through development works and about three kilometer bridges had been constructed. Hon'ble Prime Minister set a milestone in road development by inaugurating Nolka-Hatikumrul Highway of 55 kilometer long on 10 May, 2003. Built with the assistance from World Bank at a cost of Tk. 337 crore, this road has reduced one hour's distance between Dhaka and the four districts of North Bengal viz; Rajshahi, Chapai Nowabgonj, Kustia and Natore. The road network under the Roads and Highways Department combining different types of roads built over a period from 1993-94 to 2002-2003 is given below:
Table- 11.3: Various Categories of Roads under Roads & Highways Department Year (Up to the
June, 30) National Highway
(km)
Regional highway
(km)
Feeder Road 'A' type
(km)
Total (km)
1994 2920 1687 11063 15670 1995 2920 1700 11450 16070 1996 2920 1700 12934 17554 1997 2920 1700 15656 20276 1998 3144 1746 15964 20854 1999 3090 1752 16116 20958 2000 3086 1751 15962 20799 2001 3086 1751 15962 20799 2002 3086 1751 15962 20799 2003 3420 4241 13138 20799
Source: Deptt. of Roads & Highways, The Ministry of Communication.
110
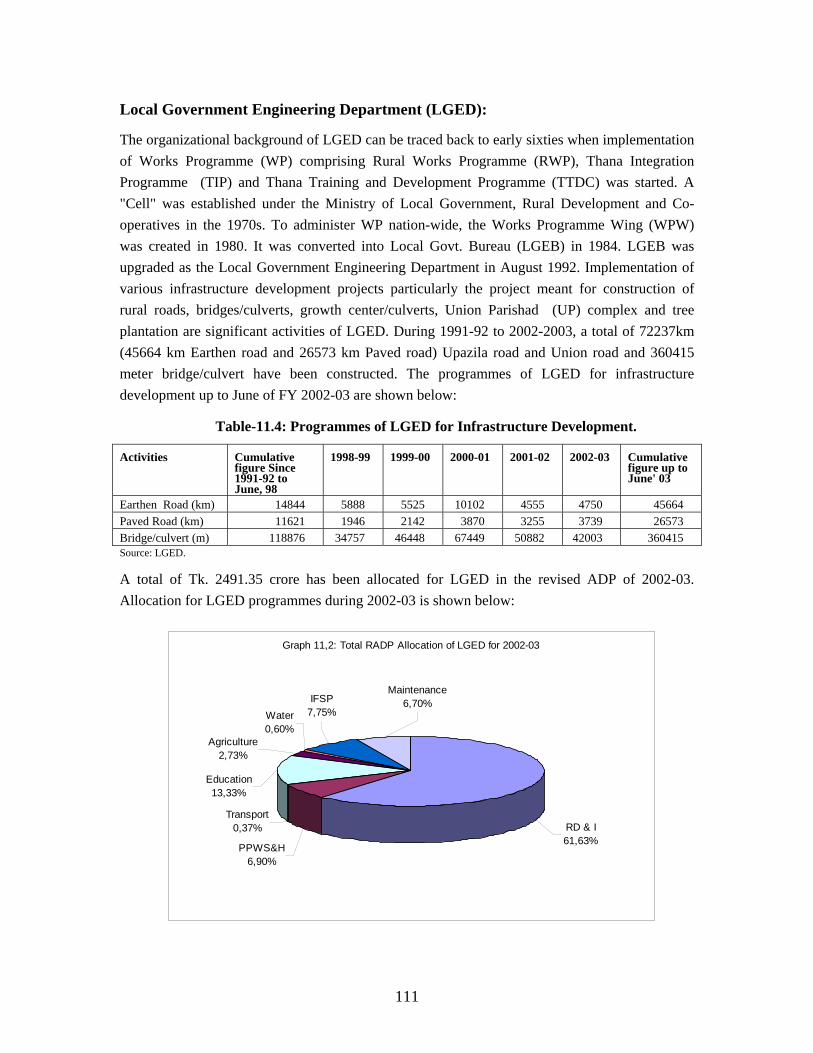
Local Government Engineering Department (LGED):
The organizational background of LGED can be traced back to early sixties when implementation of Works Programme (WP) comprising Rural Works Programme (RWP), Thana Integration Programme (TIP) and Thana Training and Development Programme (TTDC) was started. A "Cell" was established under the Ministry of Local Government, Rural Development and Co-operatives in the 1970s. To administer WP nation-wide, the Works Programme Wing (WPW) was created in 1980. It was converted into Local Govt. Bureau (LGEB) in 1984. LGEB was upgraded as the Local Government Engineering Department in August 1992. Implementation of various infrastructure development projects particularly the project meant for construction of rural roads, bridges/culverts, growth center/culverts, Union Parishad (UP) complex and tree plantation are significant activities of LGED. During 1991-92 to 2002-2003, a total of 72237km (45664 km Earthen road and 26573 km Paved road) Upazila road and Union road and 360415 meter bridge/culvert have been constructed. The programmes of LGED for infrastructure development up to June of FY 2002-03 are shown below:
Table-11.4: Programmes of LGED for Infrastructure Development.
Activities Cumulative figure Since 1991-92 to June, 98
1998-99 1999-00 2000-01 2001-02 2002-03
Cumulative figure up to June' 03
Earthen Road (km) 14844 5888 5525 10102 4555 4750 45664 Paved Road (km) 11621 1946 2142 3870 3255 3739 26573 Bridge/culvert (m) 118876 34757 46448 67449 50882 42003 360415 Source: LGED.
A total of Tk. 2491.35 crore has been allocated for LGED in the revised ADP of 2002-03. Allocation for LGED programmes during 2002-03 is shown below:
Graph 11,2: Total RADP Allocation of LGED for 2002-03
PPWS&H6,90%
Transport0,37% RD & I
61,63%
Education13,33%
Agriculture2,73%
Maintenance6,70%
Water0,60%
IFSP7,75%
111
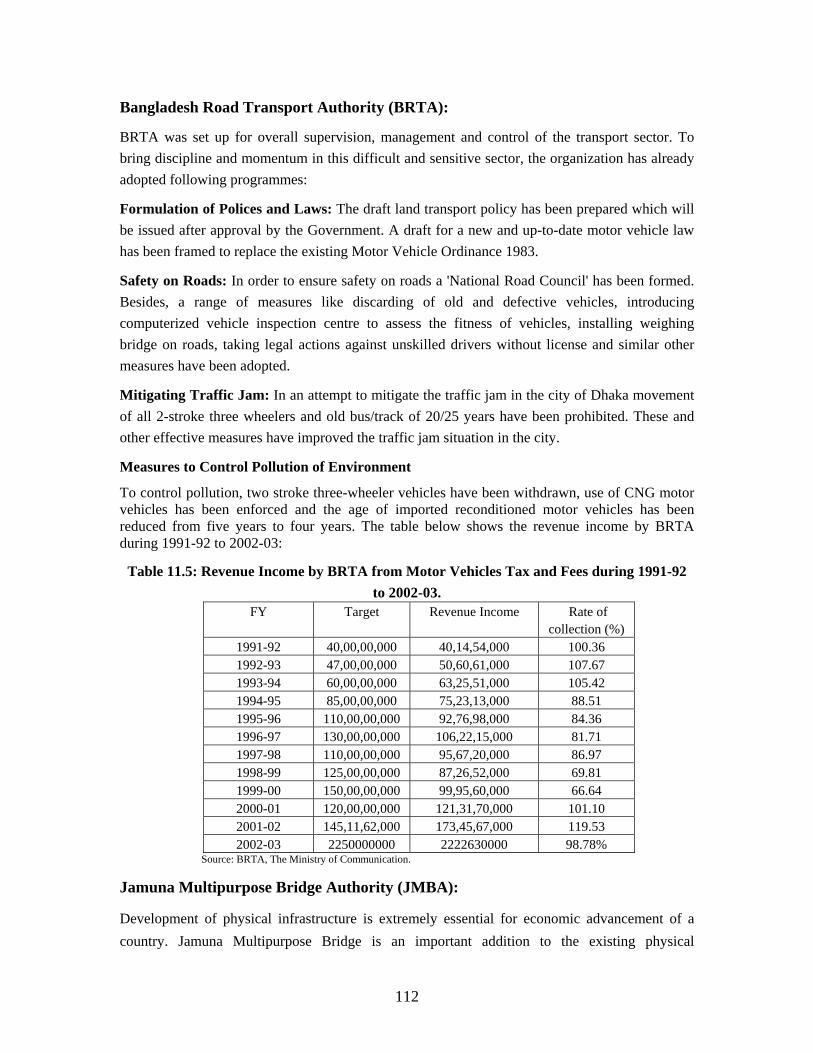
Bangladesh Road Transport Authority (BRTA):
BRTA was set up for overall supervision, management and control of the transport sector. To bring discipline and momentum in this difficult and sensitive sector, the organization has already adopted following programmes:
Formulation of Polices and Laws: The draft land transport policy has been prepared which will be issued after approval by the Government. A draft for a new and up-to-date motor vehicle law has been framed to replace the existing Motor Vehicle Ordinance 1983.
Safety on Roads: In order to ensure safety on roads a 'National Road Council' has been formed. Besides, a range of measures like discarding of old and defective vehicles, introducing computerized vehicle inspection centre to assess the fitness of vehicles, installing weighing bridge on roads, taking legal actions against unskilled drivers without license and similar other measures have been adopted.
Mitigating Traffic Jam: In an attempt to mitigate the traffic jam in the city of Dhaka movement of all 2-stroke three wheelers and old bus/track of 20/25 years have been prohibited. These and other effective measures have improved the traffic jam situation in the city.
Measures to Control Pollution of Environment
To control pollution, two stroke three-wheeler vehicles have been withdrawn, use of CNG motor vehicles has been enforced and the age of imported reconditioned motor vehicles has been reduced from five years to four years. The table below shows the revenue income by BRTA during 1991-92 to 2002-03:
Table 11.5: Revenue Income by BRTA from Motor Vehicles Tax and Fees during 1991-92 to 2002-03.
FY Target Revenue Income Rate of collection (%)
1991-92 40,00,00,000 40,14,54,000 100.36 1992-93 47,00,00,000 50,60,61,000 107.67 1993-94 60,00,00,000 63,25,51,000 105.42 1994-95 85,00,00,000 75,23,13,000 88.51 1995-96 110,00,00,000 92,76,98,000 84.36 1996-97 130,00,00,000 106,22,15,000 81.71 1997-98 110,00,00,000 95,67,20,000 86.97 1998-99 125,00,00,000 87,26,52,000 69.81 1999-00 150,00,00,000 99,95,60,000 66.64 2000-01 120,00,00,000 121,31,70,000 101.10 2001-02 145,11,62,000 173,45,67,000 119.53 2002-03 2250000000 2222630000 98.78%
Source: BRTA, The Ministry of Communication.
Jamuna Multipurpose Bridge Authority (JMBA):
Development of physical infrastructure is extremely essential for economic advancement of a country. Jamuna Multipurpose Bridge is an important addition to the existing physical
112
infrastructure of the country. With the opening of the bridge for traffic on 23 June, 1998 link between the northwestern part of the country and the capital has become much closer. This bridge is playing an important role in the economic development of the country. Currently, the rate of vehicular movement through this bridge is higher than predicted. As the rate of traffic movement is increasing, so is income augmenting from the bridge. Toll collected by Jamuna Multipurpose Bridge Authority (JMBA) during 1997-98 to 2002-03 is given below:
Table-11.6 Toll Collected by JMBA
FY Target Collection Rate of Collection (%) 1997-98 1,06,88,720 99,68,555 93.26 1998-99 54,17,35,660 58,81,37,280 108.56 1999-00 66,03,35,860 64,77,30,388 98.09 2000-01 78,09,55,120 81,14,89,160 103.91 2001-02 84,94,54,160 91,99,89,952 108.30 2002-03 95,03,39,120 107,02,26,067 122.62
Source: Jamuna Multipurpose Bridge Authority .
Ongoing work of setting up rail line on both sides of Jamuna Bridge is scheduled to be completed. Once completed, the capital city of Dhaka will be connected with northwestern region of the country through direct rail link. Alongside setting up rail and electricity line, gas line has also been setup over the bridge. Gas is currently being supplied at Sirajgonj town and work on laying of gas pipeline to Baghabari Power Plant has been completed. As gas and electricity are supplied to northern region of the country, fuel crisis has been partially solved which in turn is helping to maintain environmental balance. Furthermore, if gas is supplied to these areas it will facilitate conversion of oil based power plants into gas based system and thus reducing cost of production of electricity. It may be mentioned here that the Planning Commission has conducted a study entitled "Study on Northwest Region" to bring about overall economic development of the northwestern region of the country. The study has made several important recommendations. Once these are implemented, this will hold out the opportunities for massive development of agricultural and industrial sector in the backward northwest region. Besides reducing unemployment, this would play a greater supportive role in bringing overall economic development.
Other Initiatives for Buildings Bridges:
It is necessary to construct a bridge over the river Padma as the latest step of establishing direct and systematic communication link between southern region of the country and the capital city of Dhaka. The government has therefore taken a decision to build a bridge over the river Padma through a project. Before implementing the project, a primary techno-financial study was initiated in November 2001. Following this a detailed study has begun in full swing since 18 April this year. With the inauguration of Shikerpur-Dohareka Bridge on 8 April this year, communication between Barisal- Jahalokathi and Khulna has improved.
113
With the gradual increase of developmental work in Dhaka and expansion of the city, the present government, in order to establish better communication link with the adjoining areas has decided to build Mukterpur Bridge over the river Dhaleshwari on Dhaka- Munshigonj road with the financial assistance from the Chinese Government. The Mukterpur Bridge will be a remarkable addition to physical infrastructure of Bangladesh. The project, if implemented by 2006-07, will improve the quality of life and the socio-economic condition of the people which will eventually help reduce poverty.
Dhaka Transport Co-ordination Board (DTCB):
In the absence of a separate organisation for transport development work in the Dhaka Metropolitan area, no notable improvement took place in the transport sub-sector. Development partners also did not come forward to assist in development of transport infrastructure of the city. Today, traffic jam in Dhaka is alarmingly dangerous by any standard. The Government has set up "Dhaka Transport Co-ordination Board (DTCB) " by an Act of Parliament in 2001 to overcome the situation. Its fundamental objective is to develop a planned and environment- friendly transport system in close cooperation between the public and private sector. To achieve its objectives, the institutional capability of the organisation will be strengthened and a long-term transport plan will be prepared.
The ongoing "Dhaka Urban Transport Project" is being implemented by DTCB. It is the only major aided project for Dhaka Metropolitan area. The World Bank funded US$ 177 million for this project. The total cost of the project is estimated at Tk. 942 crore. The project commenced in 1998-99 and is expected to be completed by June 2004.
The principal objectives of the project include among others increasing speed of the vehicles by improving arterial roads and 40 other intersections, construction of Tongi bypass as well as 80 km main roads, construction of Gabtoli, Mohakhali and Sayedabad bus terminals, development of 40 km footpaths for the pedestrians, construction of under pass and development of signalling system and improvement of flood damaged roads.
Bangladesh Road Transport Corporation (BRTC):
To establish a sound transport system, BRTC was established in 1961 by an Ordinance. Its main objectives are:
(a) To ensure a cheap, speedy, secured, comfortable and modern transportation system; (b) To help develop non-government transport system; (c) To play an important role in controlling the transport quality and transport fare; (d) To develop skilled manpower in transport sector through training; (e) To play a strategic interventional role for a sound and organised transport system.
Although this organisation remained a losing concern for many years, it has now been able to infuse dynamism, skill and discipline in management and other areas following several reforms. Income and expenditure statement of BRTC during 1997-98 to 2002-03 are shown below:-
114
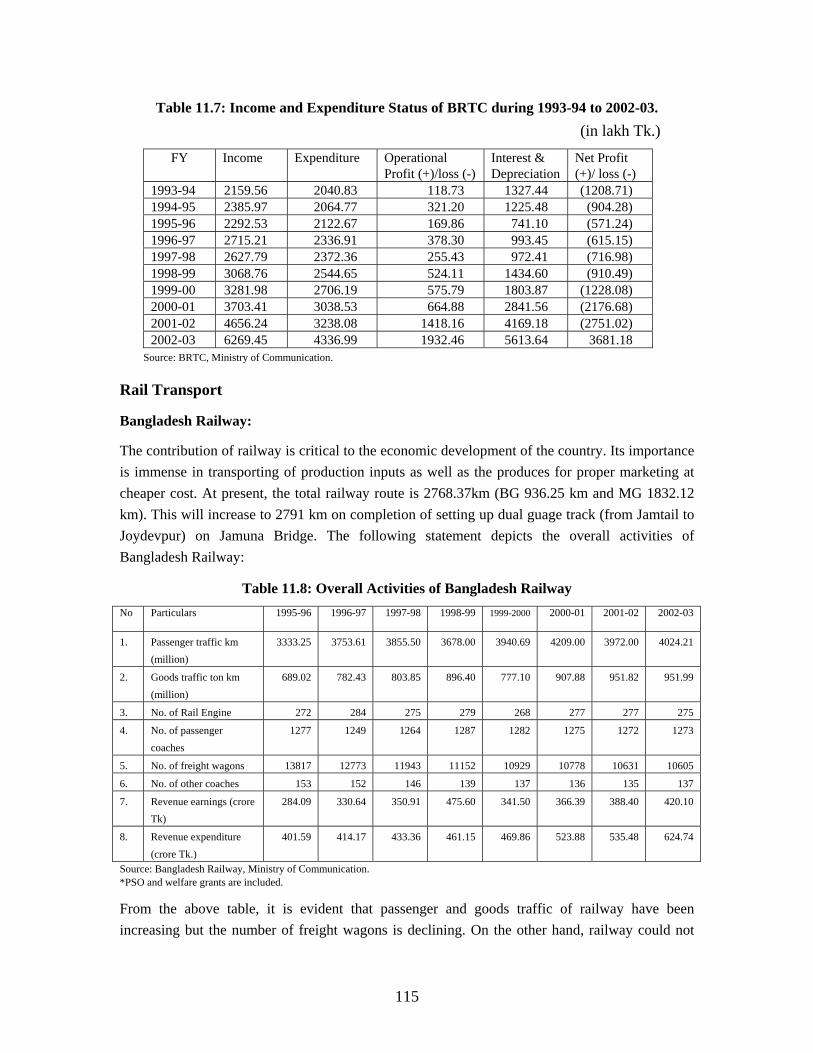
Table 11.7: Income and Expenditure Status of BRTC during 1993-94 to 2002-03. (in lakh Tk.)
FY Income Expenditure Operational Profit (+)/loss (-)
Interest & Depreciation
Net Profit (+)/ loss (-)
1993-94 2159.56 2040.83 118.73 1327.44 (1208.71) 1994-95 2385.97 2064.77 321.20 1225.48 (904.28) 1995-96 2292.53 2122.67 169.86 741.10 (571.24) 1996-97 2715.21 2336.91 378.30 993.45 (615.15) 1997-98 2627.79 2372.36 255.43 972.41 (716.98) 1998-99 3068.76 2544.65 524.11 1434.60 (910.49) 1999-00 3281.98 2706.19 575.79 1803.87 (1228.08) 2000-01 3703.41 3038.53 664.88 2841.56 (2176.68) 2001-02 4656.24 3238.08 1418.16 4169.18 (2751.02) 2002-03 6269.45 4336.99 1932.46 5613.64 3681.18
Source: BRTC, Ministry of Communication.
Rail Transport
Bangladesh Railway:
The contribution of railway is critical to the economic development of the country. Its importance is immense in transporting of production inputs as well as the produces for proper marketing at cheaper cost. At present, the total railway route is 2768.37km (BG 936.25 km and MG 1832.12 km). This will increase to 2791 km on completion of setting up dual guage track (from Jamtail to Joydevpur) on Jamuna Bridge. The following statement depicts the overall activities of Bangladesh Railway:
Table 11.8: Overall Activities of Bangladesh Railway No Particulars 1995-96 1996-97 1997-98 1998-99 1999-2000 2000-01 2001-02 2002-03
1. Passenger traffic km (million)
3333.25 3753.61 3855.50 3678.00 3940.69 4209.00 3972.00 4024.21
2. Goods traffic ton km (million)
689.02 782.43 803.85 896.40 777.10 907.88 951.82 951.99
3. 268 277 275 No. of Rail Engine 272 284 275 279 277
4. 1264 1272 1273 No. of passenger coaches
1277 1249 1287 1282 1275
5. No. of freight wagons 13817 12773 11943 11152 10929 10778 10631 10605
6. No. of other coaches 153 152 146 139 137 136 135 137
7. Revenue earnings (crore Tk)
284.09 330.64 350.91 475.60 341.50 366.39 388.40 420.10
8. Revenue expenditure (crore Tk.)
401.59 414.17 433.36 461.15 469.86 523.88 535.48 624.74
Source: Bangladesh Railway, Ministry of Communication. *PSO and welfare grants are included.
From the above table, it is evident that passenger and goods traffic of railway have been increasing but the number of freight wagons is declining. On the other hand, railway could not
115
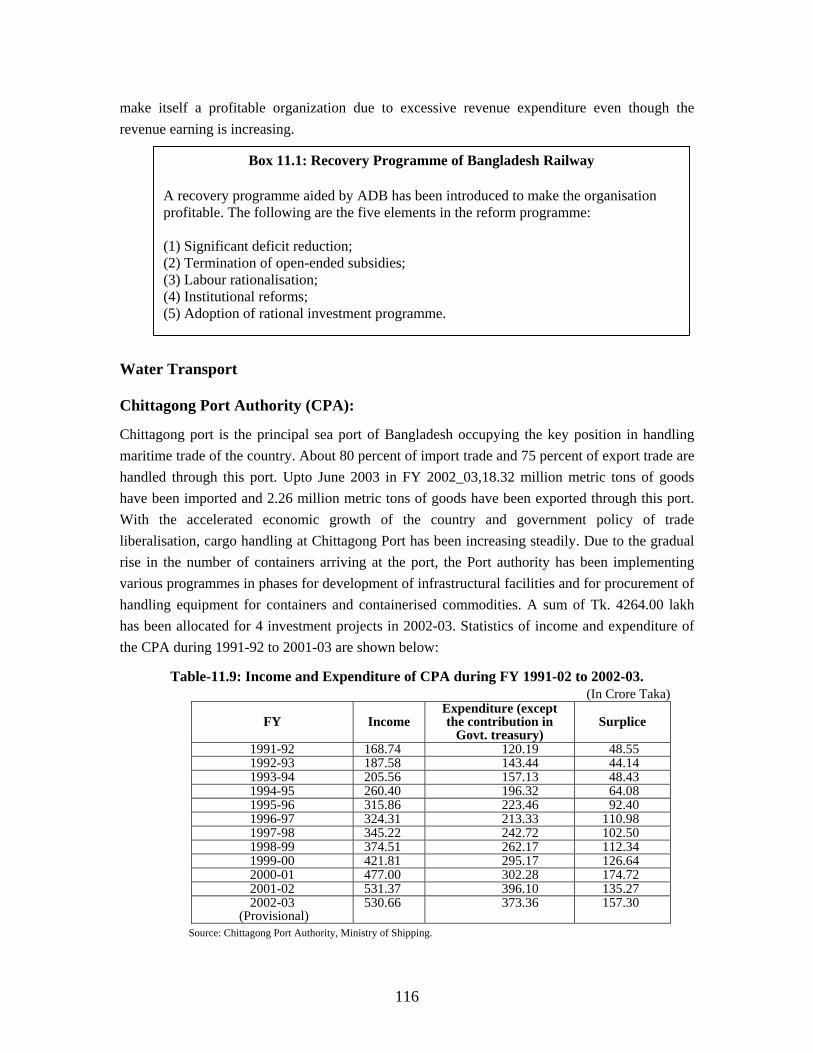
make itself a profitable organization due to excessive revenue expenditure even though the revenue earning is increasing.
Box 11.1: Recovery Programme of Bangladesh Railway A recovery programme aided by ADB has been introduced to make the organisation profitable. The following are the five elements in the reform programme: (1) Significant deficit reduction; (2) Termination of open-ended subsidies; (3) Labour rationalisation; (4) Institutional reforms; (5) Adoption of rational investment programme.
Water Transport Chittagong Port Authority (CPA):
Chittagong port is the principal sea port of Bangladesh occupying the key position in handling maritime trade of the country. About 80 percent of import trade and 75 percent of export trade are handled through this port. Upto June 2003 in FY 2002_03,18.32 million metric tons of goods have been imported and 2.26 million metric tons of goods have been exported through this port. With the accelerated economic growth of the country and government policy of trade liberalisation, cargo handling at Chittagong Port has been increasing steadily. Due to the gradual rise in the number of containers arriving at the port, the Port authority has been implementing various programmes in phases for development of infrastructural facilities and for procurement of handling equipment for containers and containerised commodities. A sum of Tk. 4264.00 lakh has been allocated for 4 investment projects in 2002-03. Statistics of income and expenditure of the CPA during 1991-92 to 2001-03 are shown below:
Table-11.9: Income and Expenditure of CPA during FY 1991-02 to 2002-03. (In Crore Taka)
FY
Income
Expenditure (except the contribution in
Govt. treasury)
Surplice
1991-92 168.74 120.19 48.55 1992-93 187.58 143.44 44.14 1993-94 205.56 157.13 48.43 1994-95 260.40 196.32 64.08 1995-96 315.86 223.46 92.40 1996-97 324.31 213.33 110.98 1997-98 345.22 242.72 102.50 1998-99 374.51 262.17 112.34 1999-00 421.81 295.17 126.64 2000-01 477.00 302.28 174.72 2001-02 531.37 396.10 135.27 2002-03
(Provisional) 530.66 373.36 157.30
Source: Chittagong Port Authority, Ministry of Shipping.
116
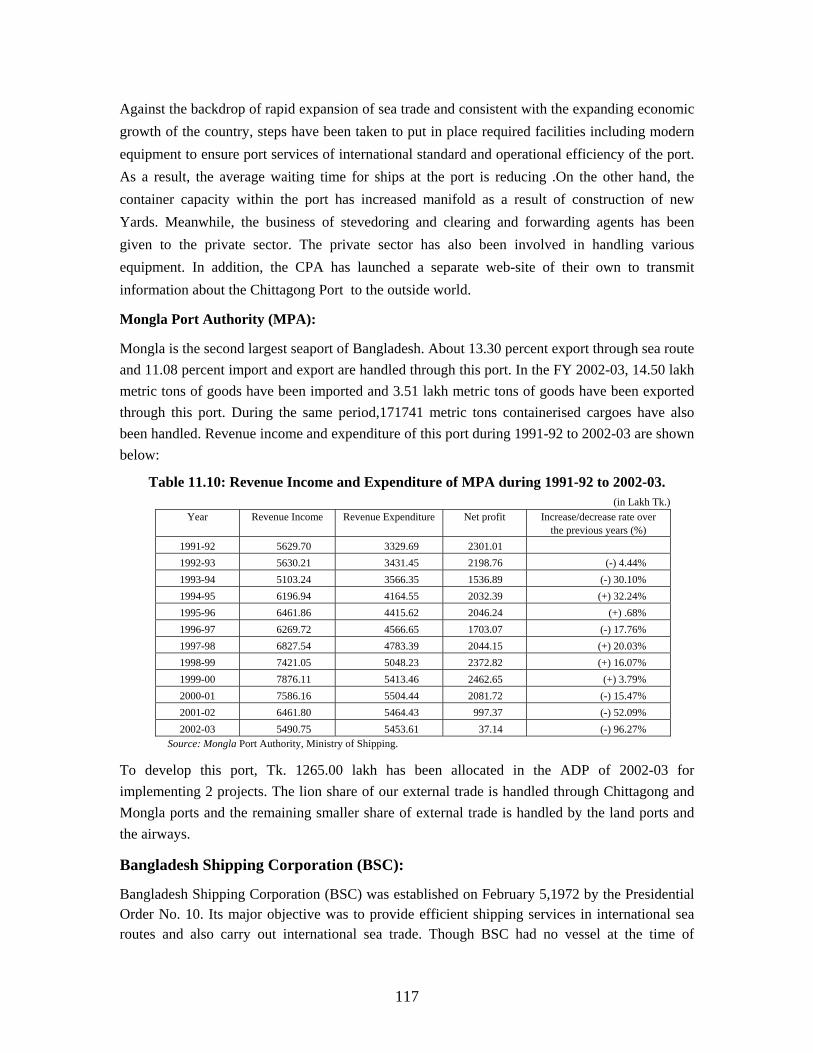
Against the backdrop of rapid expansion of sea trade and consistent with the expanding economic growth of the country, steps have been taken to put in place required facilities including modern equipment to ensure port services of international standard and operational efficiency of the port. As a result, the average waiting time for ships at the port is reducing .On the other hand, the container capacity within the port has increased manifold as a result of construction of new Yards. Meanwhile, the business of stevedoring and clearing and forwarding agents has been given to the private sector. The private sector has also been involved in handling various equipment. In addition, the CPA has launched a separate web-site of their own to transmit information about the Chittagong Port to the outside world.
Year Revenue Expenditure
Mongla Port Authority (MPA):
Mongla is the second largest seaport of Bangladesh. About 13.30 percent export through sea route and 11.08 percent import and export are handled through this port. In the FY 2002-03, 14.50 lakh metric tons of goods have been imported and 3.51 lakh metric tons of goods have been exported through this port. During the same period,171741 metric tons containerised cargoes have also been handled. Revenue income and expenditure of this port during 1991-92 to 2002-03 are shown below:
Table 11.10: Revenue Income and Expenditure of MPA during 1991-92 to 2002-03. (in Lakh Tk.)
Revenue Income Net profit Increase/decrease rate over the previous years (%)
1991-92 5629.70 3329.69 2301.01 1992-93 5630.21 3431.45 2198.76 (-) 4.44% 1993-94 5103.24 3566.35 1536.89 (-) 30.10% 1994-95 6196.94 4164.55 2032.39 (+) 32.24% 1995-96 6461.86 4415.62 2046.24 (+) .68% 1996-97 6269.72 4566.65 1703.07 (-) 17.76% 1997-98 6827.54 4783.39 2044.15 (+) 20.03% 1998-99 7421.05 5048.23 2372.82 (+) 16.07% 1999-00 7876.11 5413.46 2462.65 (+) 3.79% 2000-01 7586.16 5504.44 2081.72 (-) 15.47% 2001-02 6461.80 5464.43 997.37 (-) 52.09% 2002-03 5490.75 5453.61 37.14 (-) 96.27%
Source: Mongla Port Authority, Ministry of Shipping.
To develop this port, Tk. 1265.00 lakh has been allocated in the ADP of 2002-03 for implementing 2 projects. The lion share of our external trade is handled through Chittagong and Mongla ports and the remaining smaller share of external trade is handled by the land ports and the airways.
Bangladesh Shipping Corporation (BSC):
Bangladesh Shipping Corporation (BSC) was established on February 5,1972 by the Presidential Order No. 10. Its major objective was to provide efficient shipping services in international sea routes and also carry out international sea trade. Though BSC had no vessel at the time of
117
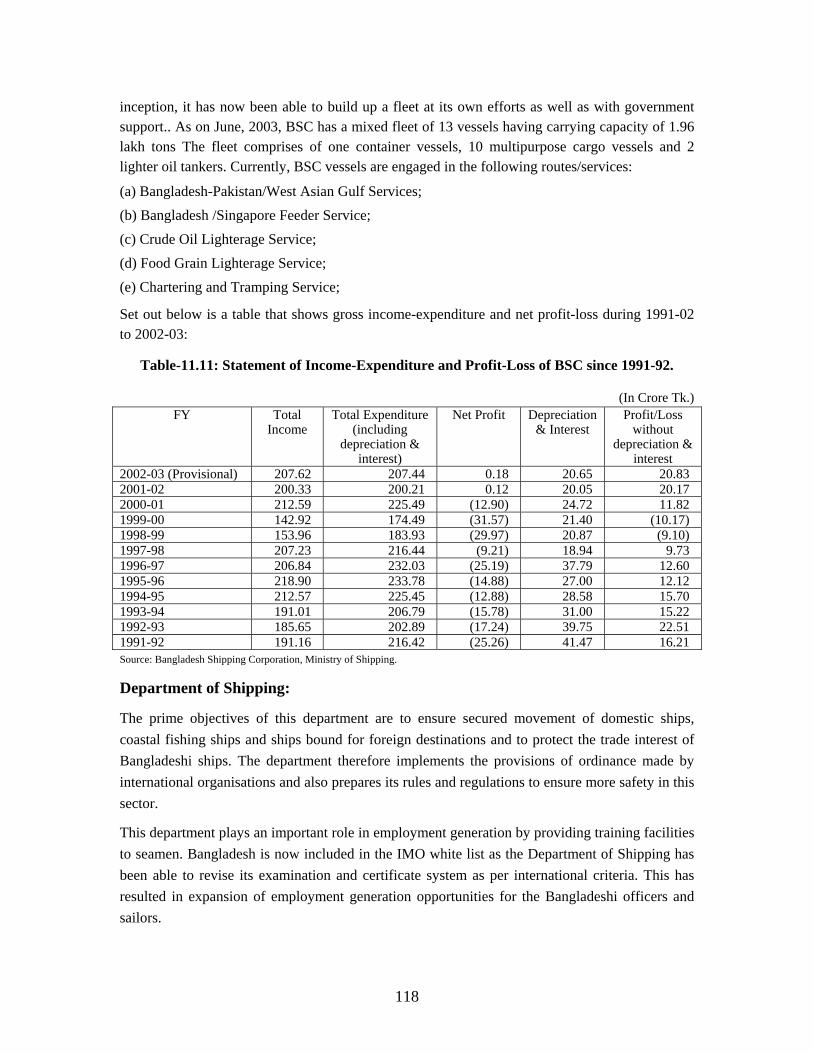
inception, it has now been able to build up a fleet at its own efforts as well as with government support.. As on June, 2003, BSC has a mixed fleet of 13 vessels having carrying capacity of 1.96 lakh tons The fleet comprises of one container vessels, 10 multipurpose cargo vessels and 2 lighter oil tankers. Currently, BSC vessels are engaged in the following routes/services:
(a) Bangladesh-Pakistan/West Asian Gulf Services; (b) Bangladesh /Singapore Feeder Service; (c) Crude Oil Lighterage Service; (d) Food Grain Lighterage Service; (e) Chartering and Tramping Service;
Set out below is a table that shows gross income-expenditure and net profit-loss during 1991-02 to 2002-03:
Table-11.11: Statement of Income-Expenditure and Profit-Loss of BSC since 1991-92.
(In Crore Tk.) FY Total
Income Total Expenditure
(including depreciation &
interest)
Net Profit Depreciation & Interest
Profit/Loss without
depreciation & interest
2002-03 (Provisional) 207.62 207.44 0.18 20.65 20.83 2001-02 200.33 200.21 0.12 20.05 20.17 2000-01 212.59 225.49 (12.90) 24.72 11.82 1999-00 142.92 174.49 (31.57) 21.40 (10.17) 1998-99 153.96 183.93 (29.97) 20.87 (9.10) 1997-98 207.23 216.44 (9.21) 18.94 9.73 1996-97 206.84 232.03 (25.19) 37.79 12.60 1995-96 218.90 233.78 (14.88) 27.00 12.12 1994-95 212.57 225.45 (12.88) 28.58 15.70 1993-94 191.01 206.79 (15.78) 31.00 15.22 1992-93 185.65 202.89 (17.24) 39.75 22.51 1991-92 191.16 216.42 (25.26) 41.47 16.21 Source: Bangladesh Shipping Corporation, Ministry of Shipping.
Department of Shipping:
The prime objectives of this department are to ensure secured movement of domestic ships, coastal fishing ships and ships bound for foreign destinations and to protect the trade interest of Bangladeshi ships. The department therefore implements the provisions of ordinance made by international organisations and also prepares its rules and regulations to ensure more safety in this sector.
This department plays an important role in employment generation by providing training facilities to seamen. Bangladesh is now included in the IMO white list as the Department of Shipping has been able to revise its examination and certificate system as per international criteria. This has resulted in expansion of employment generation opportunities for the Bangladeshi officers and sailors.
118
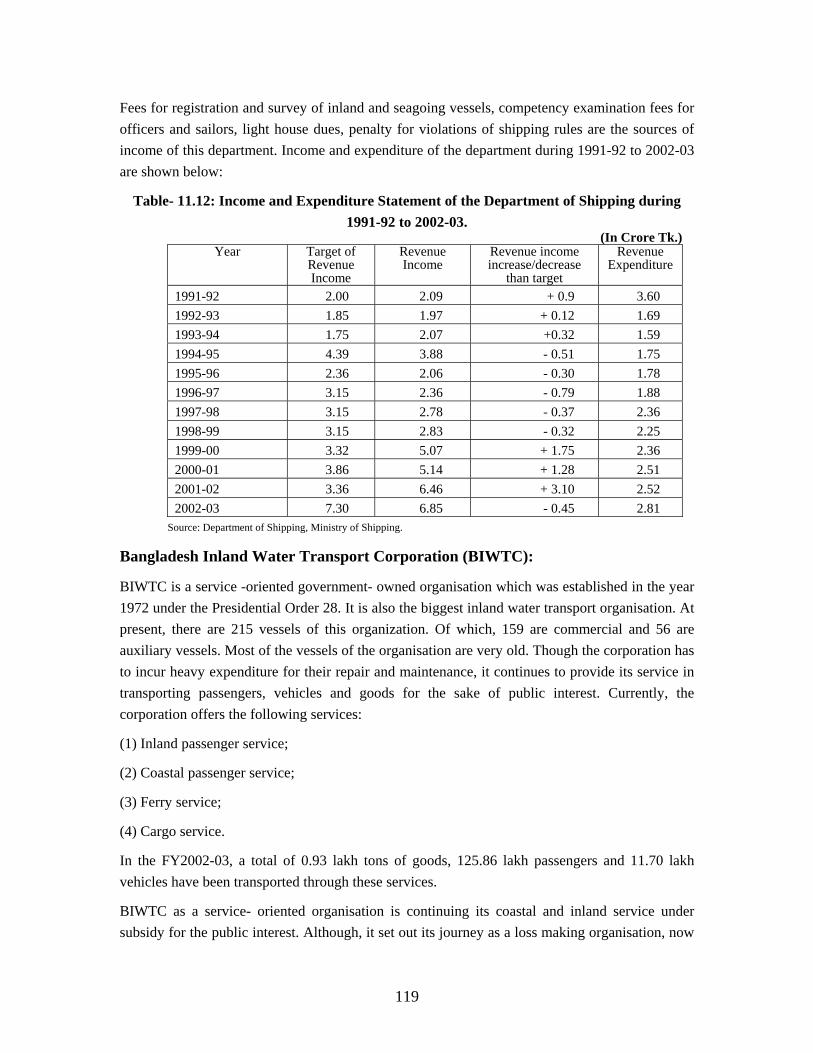
Fees for registration and survey of inland and seagoing vessels, competency examination fees for officers and sailors, light house dues, penalty for violations of shipping rules are the sources of income of this department. Income and expenditure of the department during 1991-92 to 2002-03 are shown below:
Table- 11.12: Income and Expenditure Statement of the Department of Shipping during 1991-92 to 2002-03.
(In Crore Tk.) Year Target of
Revenue Income
Revenue Income
Revenue income increase/decrease
than target
Revenue Expenditure
1991-92 2.00 2.09 + 0.9 3.60 1992-93 1.85 1.97 + 0.12 1.69 1993-94 1.75 2.07 +0.32 1.59 1994-95 4.39 3.88 - 0.51 1.75 1995-96 2.36 2.06 - 0.30 1.78 1996-97 3.15 2.36 - 0.79 1.88 1997-98 3.15 2.78 - 0.37 2.36 1998-99 3.15 2.83 - 0.32 2.25 1999-00 3.32 5.07 + 1.75 2.36 2000-01 3.86 5.14 + 1.28 2.51 2001-02 3.36 6.46 + 3.10 2.52 2002-03 7.30 6.85 - 0.45 2.81
Source: Department of Shipping, Ministry of Shipping.
Bangladesh Inland Water Transport Corporation (BIWTC):
BIWTC is a service -oriented government- owned organisation which was established in the year 1972 under the Presidential Order 28. It is also the biggest inland water transport organisation. At present, there are 215 vessels of this organization. Of which, 159 are commercial and 56 are auxiliary vessels. Most of the vessels of the organisation are very old. Though the corporation has to incur heavy expenditure for their repair and maintenance, it continues to provide its service in transporting passengers, vehicles and goods for the sake of public interest. Currently, the corporation offers the following services:
(1) Inland passenger service;
(2) Coastal passenger service;
(3) Ferry service;
(4) Cargo service.
In the FY2002-03, a total of 0.93 lakh tons of goods, 125.86 lakh passengers and 11.70 lakh vehicles have been transported through these services.
BIWTC as a service- oriented organisation is continuing its coastal and inland service under subsidy for the public interest. Although, it set out its journey as a loss making organisation, now
119
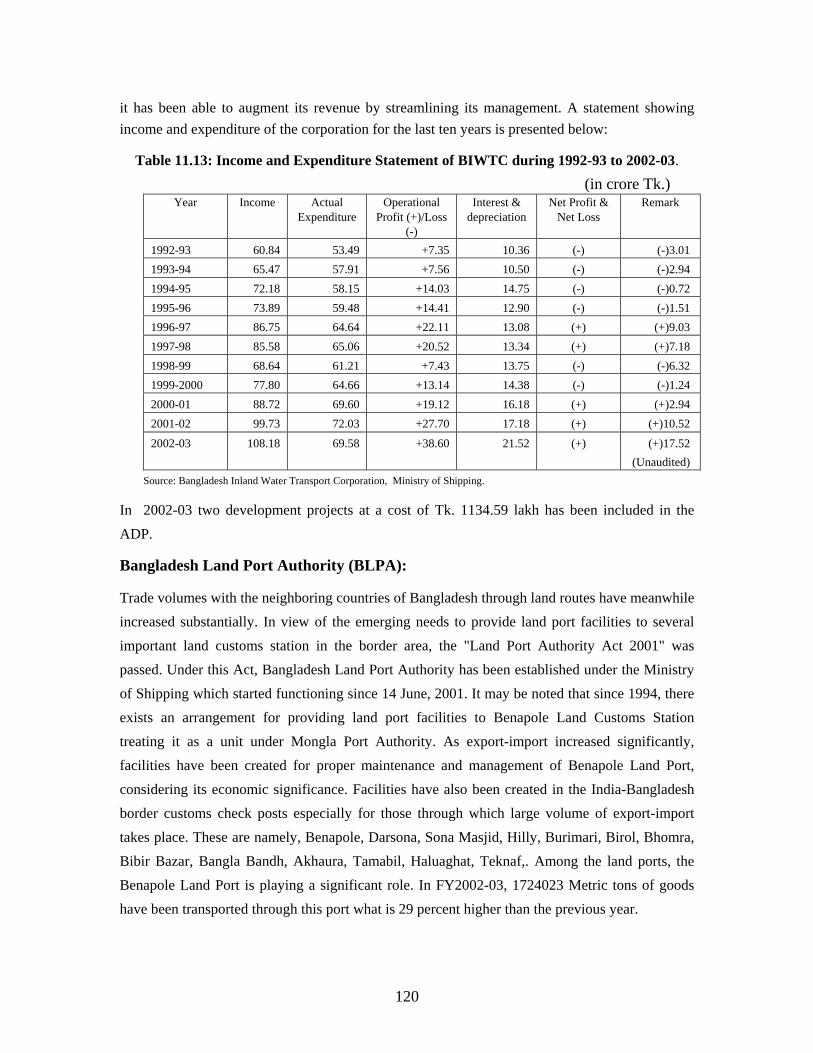
it has been able to augment its revenue by streamlining its management. A statement showing income and expenditure of the corporation for the last ten years is presented below:
Table 11.13: Income and Expenditure Statement of BIWTC during 1992-93 to 2002-03. (in crore Tk.)
Year Income Actual Expenditure
Operational Profit (+)/Loss
(-)
Interest & depreciation
Net Profit & Net Loss
Remark
1992-93 60.84 53.49 +7.35 10.36 (-) (-)3.01 1993-94 65.47 57.91 +7.56 10.50 (-) (-)2.94 1994-95 72.18 58.15 +14.03 14.75 (-) (-)0.72 1995-96 73.89 59.48 +14.41 12.90 (-) (-)1.51 1996-97 86.75 64.64 +22.11 13.08 (+) (+)9.03 1997-98 85.58 65.06 +20.52 13.34 (+) (+)7.18 1998-99 68.64 61.21 +7.43 13.75 (-) (-)6.32 1999-2000 77.80 64.66 +13.14 14.38 (-) (-)1.24 2000-01 88.72 69.60 +19.12 16.18 (+) (+)2.94 2001-02 99.73 72.03 +27.70 17.18 (+) (+)10.52
2002-03 108.18 69.58 +38.60 21.52 (+) (+)17.52 (Unaudited)
Source: Bangladesh Inland Water Transport Corporation, Ministry of Shipping.
In 2002-03 two development projects at a cost of Tk. 1134.59 lakh has been included in the ADP.
Bangladesh Land Port Authority (BLPA):
Trade volumes with the neighboring countries of Bangladesh through land routes have meanwhile increased substantially. In view of the emerging needs to provide land port facilities to several important land customs station in the border area, the "Land Port Authority Act 2001" was passed. Under this Act, Bangladesh Land Port Authority has been established under the Ministry of Shipping which started functioning since 14 June, 2001. It may be noted that since 1994, there exists an arrangement for providing land port facilities to Benapole Land Customs Station treating it as a unit under Mongla Port Authority. As export-import increased significantly, facilities have been created for proper maintenance and management of Benapole Land Port, considering its economic significance. Facilities have also been created in the India-Bangladesh border customs check posts especially for those through which large volume of export-import takes place. These are namely, Benapole, Darsona, Sona Masjid, Hilly, Burimari, Birol, Bhomra, Bibir Bazar, Bangla Bandh, Akhaura, Tamabil, Haluaghat, Teknaf,. Among the land ports, the Benapole Land Port is playing a significant role. In FY2002-03, 1724023 Metric tons of goods have been transported through this port what is 29 percent higher than the previous year.
120
Once Bangladesh Land Port Authority becomes fully functional, regional and international trade among Bangladesh, India, Myanmar, Nepal and Bhutan would be expanded. Improvement of land ports will result in increase of trade volume, prevention of smuggling and reduction of evasion of customs duty. It would also promote co-operation between government and private sector in different areas of development. Private investment in the peripheral area of the country will increase which will also augment Government revenue income. It has been decided that the above 12 ports will be built and directed on BOT basis through private initiatives. A study has been conducted upon the proposed activities of land ports by utilising TK 16.00 lakh allocated by the government. A feasibility study about establishing Teknaf land port has also been initiated by TK 16.00 lakh. Besides, construction of physical infrastructure along with land acquisition for Bangla Bandh land port are going on by involving own resources of land port authority. Two proposals for the expansion of infrastructure of Benapole land port has been placed under Government finance.
Air Transport
Civil Aviation Authority (CAA):
To ensure quick and secured movement of foreign and domestic aircrafts in the Bangladeshi sky territory, the CAA builds and maintains airports, air traffic, air navigation and installs telecommunication services and provides other facilities for the passengers. As a member state of the International Civil Aviation Organization (ICAO), the CAA as part of its responsibility is putting in place necessary infrastructural facilities for movement of domestic and international aircrafts. As the operation of the CAA is essentially technical in nature, it requires trained manpower having special skills.
This authority is engaged in construction, direction and maintenance of airports to meet the
operational demand of domestic and international airlines. It is now maintaining 3 international
airports and 5 domestic airports. Apart from this, 1 domestic airport and 5 STOL ports have been
built for the convenience of airlines. Currently, Biman Bangladesh Airlines and GMG airlines are
operating their domestic flights on schedule. GMG airlines are operating in all domestic and
international airports. Biman Bangladesh Airlines are operating their flights in all domestic
airports except Barisal. Air Parabat is operating its seasonal flights in the southwestern airports.
Bismillah and Best Aviation are operating their cargo flights. Other than these, several private
airlines are planning to operate their flights in the STOL ports. Statistics on movement of
aircrafts, passengers and cargoes in the airports during 1993 to 2003 are presented below:
121
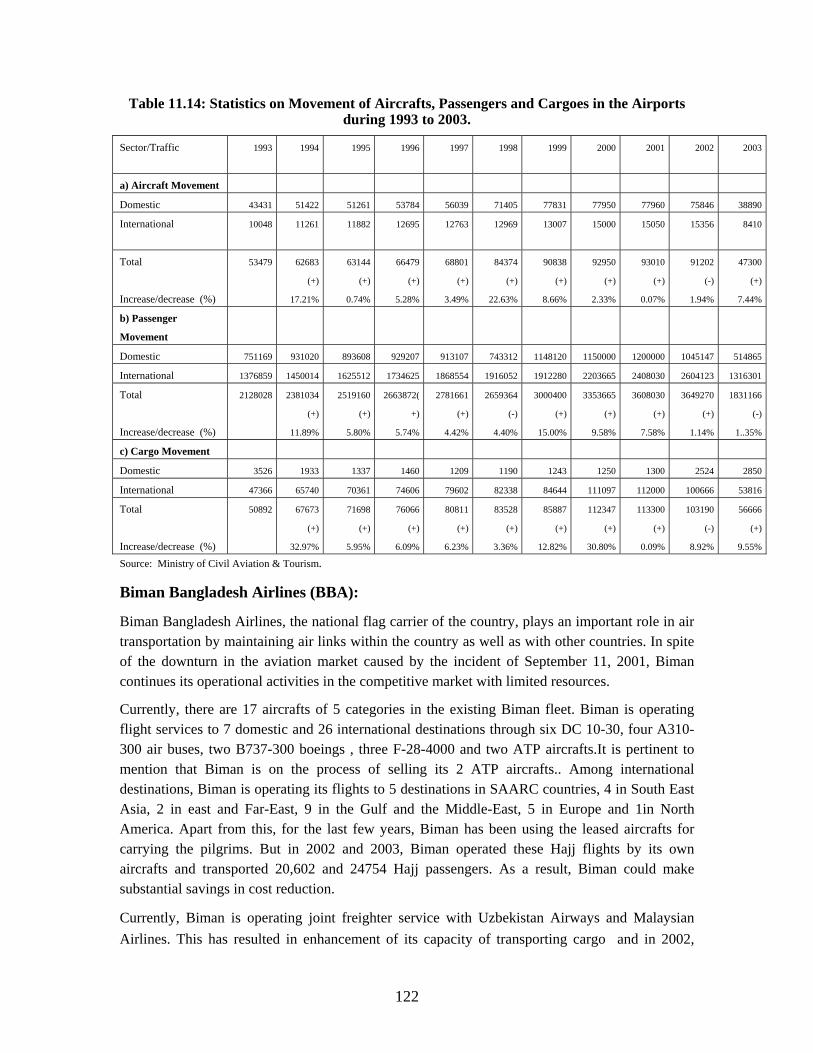
Table 11.14: Statistics on Movement of Aircrafts, Passengers and Cargoes in the Airports during 1993 to 2003.
Sector/Traffic 1993 1994 1995 1996 1997 1998 1999 2000 2001 2002 2003
a) Aircraft Movement
Domestic 43431 51422 51261 53784 56039 71405 77831 77950 77960 75846 38890
International 10048 11261
11882 12695 12763 12969 13007 15000
15050 15356 8410
Total
Increase/decrease (%)
53479 62683
(+)
17.21%
63144
(+)
0.74%
66479
(+)
5.28%
68801
(+)
3.49%
84374
(+)
22.63%
90838
(+)
8.66%
92950
(+)
2.33%
93010
(+)
0.07%
91202
(-)
1.94%
47300
(+)
7.44%
b) Passenger
Movement
Domestic 751169 931020 893608 929207 913107 743312 1148120 1150000 1200000 1045147 514865
International 1376859 1450014 1625512 1734625 1868554 1916052 1912280 2203665 2408030 2604123 1316301
Total
Increase/decrease (%)
2128028 2381034
(+)
11.89%
2519160
(+)
5.80%
2663872(
+)
5.74%
2781661
(+)
4.42%
2659364
(-)
4.40%
3000400
(+)
15.00%
3353665
(+)
9.58%
3608030
(+)
7.58%
3649270
(+)
1.14%
1831166
(-)
1..35%
c) Cargo Movement
Domestic 3526 1933 1337 1460 1209 1190 1243 1250 1300 2524 2850
International 47366 65740 70361 74606 79602 82338 84644 111097 112000 100666 53816
Total
Increase/decrease (%)
50892 67673
(+)
32.97%
71698
(+)
5.95%
76066
(+)
6.09%
80811
(+)
6.23%
83528
(+)
3.36%
85887
(+)
12.82%
112347
(+)
30.80%
113300
(+)
0.09%
103190
(-)
8.92%
56666
(+)
9.55%
Source: Ministry of Civil Aviation & Tourism.
Biman Bangladesh Airlines (BBA):
Biman Bangladesh Airlines, the national flag carrier of the country, plays an important role in air transportation by maintaining air links within the country as well as with other countries. In spite of the downturn in the aviation market caused by the incident of September 11, 2001, Biman continues its operational activities in the competitive market with limited resources.
Currently, there are 17 aircrafts of 5 categories in the existing Biman fleet. Biman is operating flight services to 7 domestic and 26 international destinations through six DC 10-30, four A310-300 air buses, two B737-300 boeings , three F-28-4000 and two ATP aircrafts.It is pertinent to mention that Biman is on the process of selling its 2 ATP aircrafts.. Among international destinations, Biman is operating its flights to 5 destinations in SAARC countries, 4 in South East Asia, 2 in east and Far-East, 9 in the Gulf and the Middle-East, 5 in Europe and 1in North America. Apart from this, for the last few years, Biman has been using the leased aircrafts for carrying the pilgrims. But in 2002 and 2003, Biman operated these Hajj flights by its own aircrafts and transported 20,602 and 24754 Hajj passengers. As a result, Biman could make substantial savings in cost reduction.
Currently, Biman is operating joint freighter service with Uzbekistan Airways and Malaysian Airlines. This has resulted in enhancement of its capacity of transporting cargo and in 2002,
122
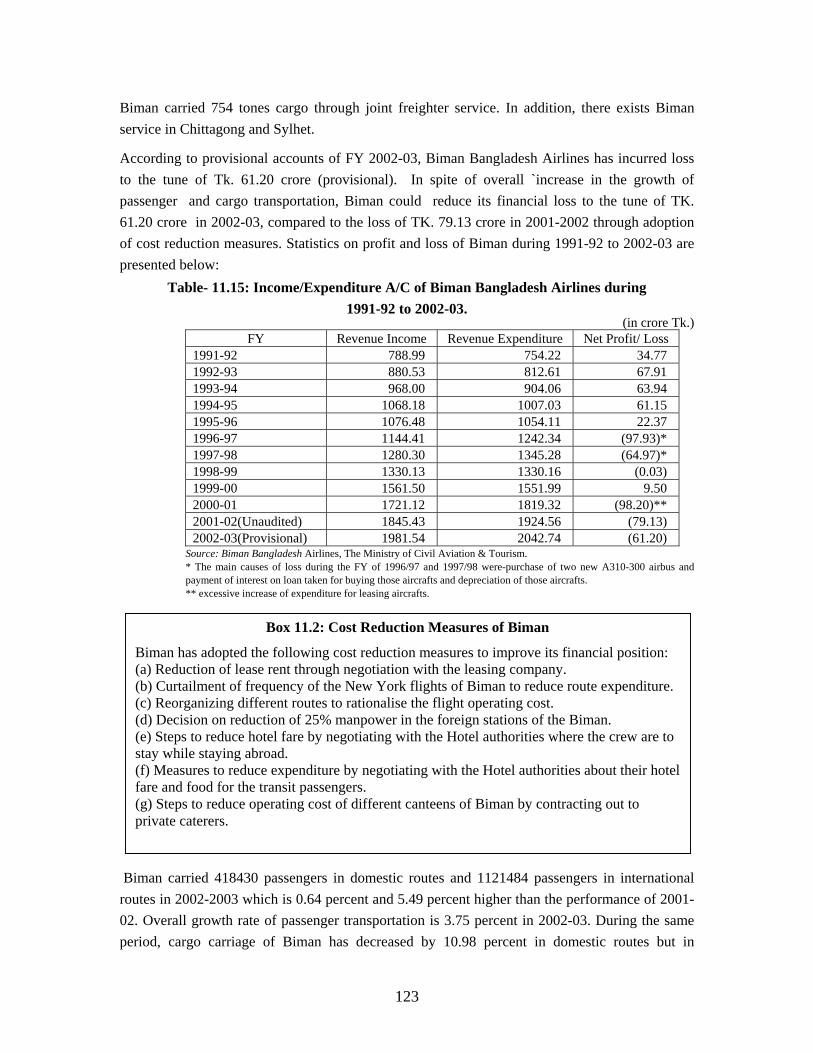
Biman carried 754 tones cargo through joint freighter service. In addition, there exists Biman service in Chittagong and Sylhet.
According to provisional accounts of FY 2002-03, Biman Bangladesh Airlines has incurred loss to the tune of Tk. 61.20 crore (provisional). In spite of overall `increase in the growth of passenger and cargo transportation, Biman could reduce its financial loss to the tune of TK. 61.20 crore in 2002-03, compared to the loss of TK. 79.13 crore in 2001-2002 through adoption of cost reduction measures. Statistics on profit and loss of Biman during 1991-92 to 2002-03 are presented below:
Table- 11.15: Income/Expenditure A/C of Biman Bangladesh Airlines during 1991-92 to 2002-03.
(in crore Tk.) FY Revenue Income Revenue Expenditure Net Profit/ Loss
1991-92 788.99 754.22 34.77 1992-93 880.53 812.61 67.91 1993-94 968.00 904.06 63.94 1994-95 1068.18 1007.03 61.15 1995-96 1076.48 1054.11 22.37 1996-97 1144.41 1242.34 (97.93)* 1997-98 1280.30 1345.28 (64.97)* 1998-99 1330.13 1330.16 (0.03) 1999-00 1561.50 1551.99 9.50 2000-01 1721.12 1819.32 (98.20)** 2001-02(Unaudited) 1845.43 1924.56 (79.13) 2002-03(Provisional) 1981.54 2042.74 (61.20)
Source: Biman Bangladesh Airlines, The Ministry of Civil Aviation & Tourism. * The main causes of loss during the FY of 1996/97 and 1997/98 were-purchase of two new A310-300 airbus and payment of interest on loan taken for buying those aircrafts and depreciation of those aircrafts. ** excessive increase of expenditure for leasing aircrafts.
Box 11.2: Cost Reduction Measures of Biman
Biman has adopted the following cost reduction measures to improve its financial position: (a) Reduction of lease rent through negotiation with the leasing company. (b) Curtailment of frequency of the New York flights of Biman to reduce route expenditure.
manpower in the foreign stations of the Biman. (e) Steps to reduce hotel fare by negotiating with the Hotel authorities where the crew are to stay while staying abroad. (f) Measures to reduce expenditure by negotiating with the Hotel authorities about their hotel fare and food for the transit passengers. (g) Steps to reduce operating cost of different canteens of Biman by contracting out to
(c) Reorganizing different routes to rationalise the flight operating cost. (d) Decision on reduction of 25%
private caterers.
Biman carried 418430 passengers in domestic routes and 1121484 passengers in international routes in 2002-2003 which is 0.64 percent and 5.49 percent higher than the performance of 2001-02. Overall growth rate of passenger transportation is 3.75 percent in 2002-03. During the same period, cargo carriage of Biman has decreased by 10.98 percent in domestic routes but in
123
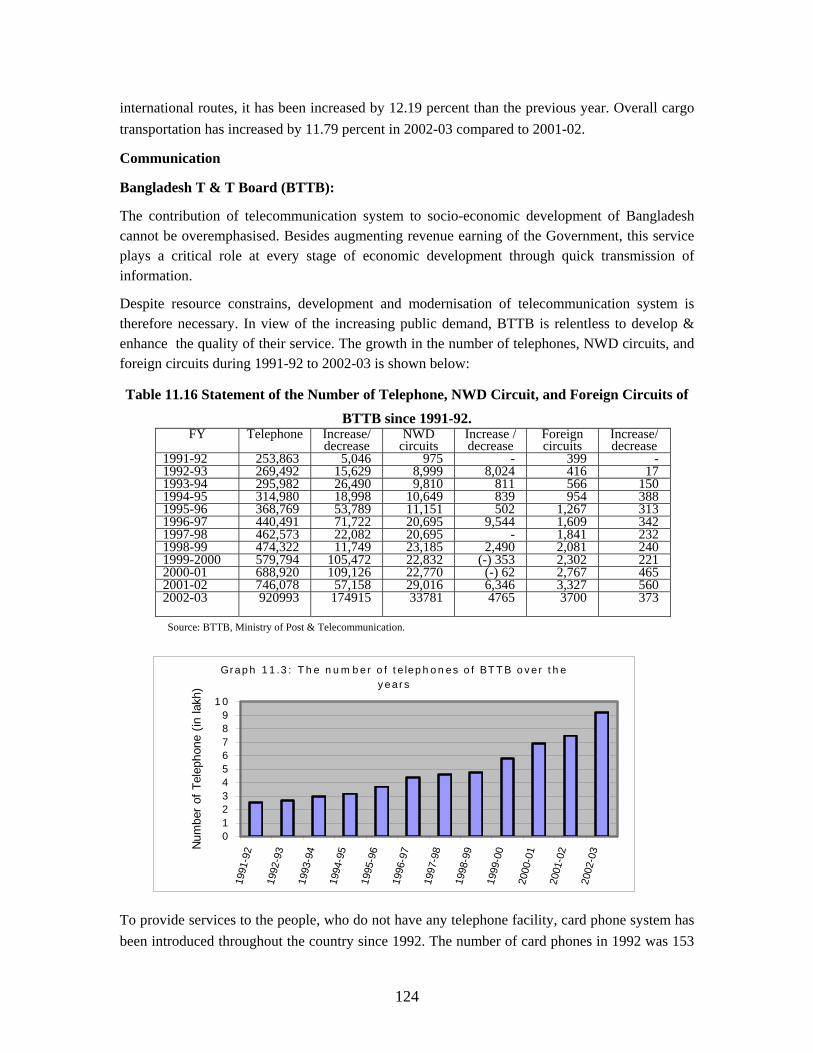
international routes, it has been increased by 12.19 percent than the previous year. Overall cargo transportation has increased by 11.79 percent in 2002-03 compared to 2001-02.
Communication
Bangladesh T & T Board (BTTB):
The contribution of telecommunication system to socio-economic development of Bangladesh cannot be overemphasised. Besides augmenting revenue earning of the Government, this service plays a critical role at every stage of economic development through quick transmission of information.
Despite resource constrains, development and modernisation of telecommunication system is therefore necessary. In view of the increasing public demand, BTTB is relentless to develop & enhance the quality of their service. The growth in the number of telephones, NWD circuits, and foreign circuits during 1991-92 to 2002-03 is shown below:
Table 11.16 Statement of the Number of Telephone, NWD Circuit, and Foreign Circuits of BTTB since 1991-92.
FY Telephone Increase/ decrease
NWD circuits
Increase / decrease
Foreign circuits
Increase/ decrease
1991-92 253,863 5,046 975 - 399 - 1992-93 269,492 15,629 8,999 8,024 416 17 1993-94 295,982 26,490 9,810 811 566 150 1994-95 314,980 18,998 10,649 839 954 388 1995-96 368,769 53,789 11,151 502 1,267 313 1996-97 440,491 71,722 20,695 9,544 1,609 342 1997-98 462,573 22,082 20,695 - 1,841 232 1998-99 474,322 11,749 23,185 2,490 2,081 240 1999-2000 579,794 105,472 22,832 (-) 353 2,302 221 2000-01 688,920 109,126 22,770 (-) 62 2,767 465 2001-02 746,078 57,158 29,016 6,346 3,327 560 2002-03
920993 174915 33781 4765 3700 373
Source: BTTB, Ministry of Post & Telecommunication.
G ra p h 1 1 .3 : T h e n u m b e r o f te le p h o n e s o f B T T B o v e r th e y e a rs
0123456789
1 0
1991
-92
1992
-93
1993
-94
1994
-95
1995
-96
1996
-97
1997
-98
1998
-99
1999
-00
2000
-01
2001
-02
2002
-03N
umbe
r of
Tel
epho
ne (
in la
kh)
To provide services to the people, who do not have any telephone facility, card phone system has been introduced throughout the country since 1992. The number of card phones in 1992 was 153
124
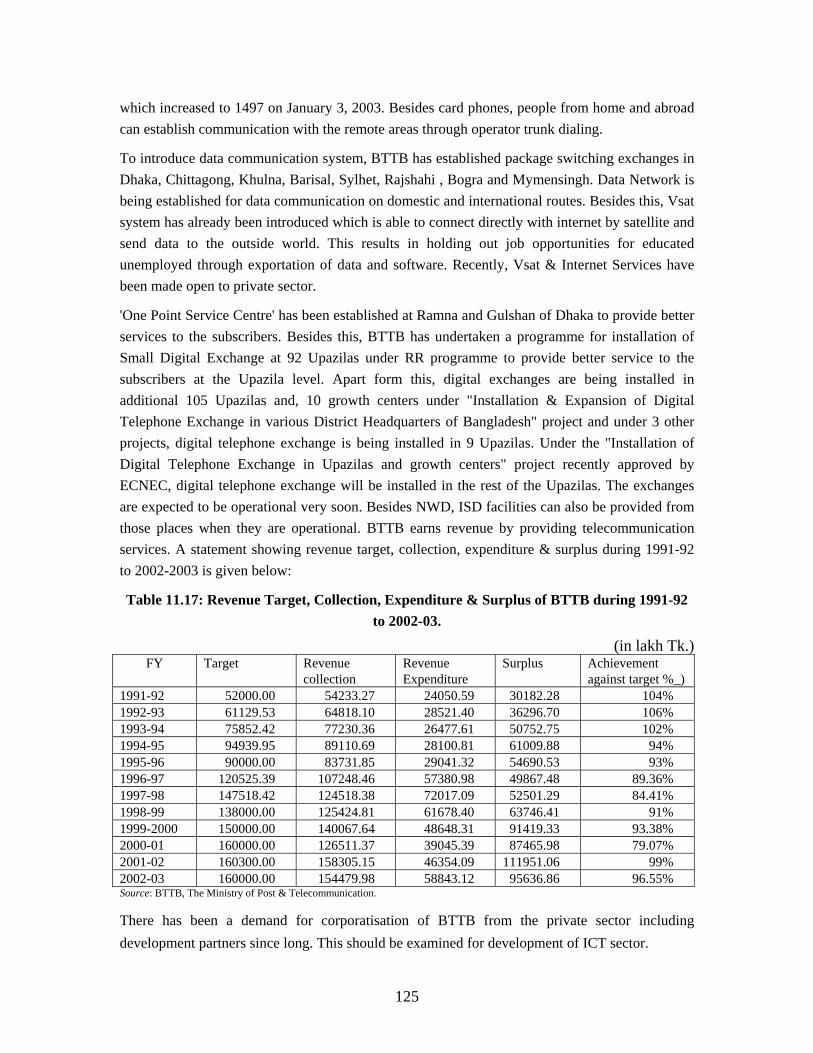
which increased to 1497 on January 3, 2003. Besides card phones, people from home and abroad can establish communication with the remote areas through operator trunk dialing.
To introduce data communication system, BTTB has established package switching exchanges in Dhaka, Chittagong, Khulna, Barisal, Sylhet, Rajshahi , Bogra and Mymensingh. Data Network is being established for data communication on domestic and international routes. Besides this, Vsat system has already been introduced which is able to connect directly with internet by satellite and send data to the outside world. This results in holding out job opportunities for educated unemployed through exportation of data and software. Recently, Vsat & Internet Services have been made open to private sector.
'One Point Service Centre' has been established at Ramna and Gulshan of Dhaka to provide better services to the subscribers. Besides this, BTTB has undertaken a programme for installation of Small Digital Exchange at 92 Upazilas under RR programme to provide better service to the subscribers at the Upazila level. Apart form this, digital exchanges are being installed in additional 105 Upazilas and, 10 growth centers under "Installation & Expansion of Digital Telephone Exchange in various District Headquarters of Bangladesh" project and under 3 other projects, digital telephone exchange is being installed in 9 Upazilas. Under the "Installation of Digital Telephone Exchange in Upazilas and growth centers" project recently approved by ECNEC, digital telephone exchange will be installed in the rest of the Upazilas. The exchanges are expected to be operational very soon. Besides NWD, ISD facilities can also be provided from those places when they are operational. BTTB earns revenue by providing telecommunication services. A statement showing revenue target, collection, expenditure & surplus during 1991-92 to 2002-2003 is given below:
Table 11.17: Revenue Target, Collection, Expenditure & Surplus of BTTB during 1991-92 to 2002-03.
(in lakh Tk.) FY Target Revenue
collection Revenue Expenditure
Surplus Achievement against target %_)
1991-92 52000.00 54233.27 24050.59 30182.28 104% 1992-93 61129.53 64818.10 28521.40 36296.70 106% 1993-94 75852.42 77230.36 26477.61 50752.75 102% 1994-95 94939.95 89110.69 28100.81 61009.88 94% 1995-96 90000.00 83731.85 29041.32 54690.53 93% 1996-97 120525.39 107248.46 57380.98 49867.48 89.36% 1997-98 147518.42 124518.38 72017.09 52501.29 84.41% 1998-99 138000.00 125424.81 61678.40 63746.41 91% 1999-2000 150000.00 140067.64 48648.31 91419.33 93.38% 2000-01 160000.00 126511.37 39045.39 87465.98 79.07% 2001-02 160300.00 158305.15 46354.09 111951.06 99% 2002-03 160000.00 154479.98 58843.12 95636.86 96.55% Source: BTTB, The Ministry of Post & Telecommunication.
There has been a demand for corporatisation of BTTB from the private sector including development partners since long. This should be examined for development of ICT sector.
125
Postal service Bangladesh Postal Department (BPD):
Bangladesh Postal Department is one of the service-oriented departments of the Government. There are 9859 post offices throughout the country. Of them 794 post offices are located in urban areas while 9061 post offices in rural areas. Of the total number, 7 new post offices have been established in 2002-03 throughout the country.
Internal mail
For quicker transmission of mail, post office has direct mail service between capital city and district headquarters, between district headquarters and Upazilla headquarters. There exists arrangements for carrying mails by air, railway, launches, boats, departmental runners and extra departmental runners. Mails are also carried by departmental Mail Motor Service and by mail contractors. Arrangements are there to deliver postal articles from capital city to district headquarters and from district headquarter to Upazilla headquarters and to important post offices on the second and third day. Mails are also carried by departmental mail vans. With the infrastructure development and opening of Jamuna Bridge, exchange of mail with northern areas has become quicker. New transports have been added to the departmental mail motor fleet. Measures are being taken to carry mail quickly through departmental mail motors. Introduction of Add mails, Bulk -mail service is under active consideration. Apart from this, several special services have been introduced to meet the increasing demand of the clienteles.
Box: 11.3 Special Services of the Postal Department
Express Parcel Post (E.P.P.) Goods are transmitted within the country. Granted Express Post (G.E.P.) Goods are carried and mailed by special arrangement. Internal money order. Money is sent within the country. Commemorative Stamp. On special days of the year stamps on different themes are released. International Mail. An arrangement for exchange of general and registered letters withall countries of the world except Israel. E-Post Service. A kind of E-mail service both within and outside the country. Express Mail service. This service provides for very quick transportation of international mail. Intel Post Service. Messages, documents, letters, business documents are sent within the country as well as 19 countries of the world with the help of facsimile machine. International Money Order. The expatriate Bangladeshis can send money to Bangladesh through this service.
126
Development of Postal Service
Despite resource constrains, the government is determined to develop and modernise the postal department. Savings account and life insurance account of postal service have already been computerised. Apart from this, the area of operation of every service is being expanded gradually. Ten development projects of the postal department will be implemented in FY 2002-03.
Information and Communication Technology (ICT):
Information technology has revolutionised communication. In the current context of globalisation and market economy, economic development is not possible without any substantial progress in this sector. Against this background, "National Information and Communication Technology Policies" have been declared in October 2002. Also to ensure smooth marketing of IT products and services and to encourage foreign investment in IT sector formulation of an ICT Act is in progress. By this time, the first ICT incubator in Bangladesh has been set up. E-governance/E- government is inextricably linked to modern government activities. The Government of Bangladesh has also taken initiative to introduce e-governance in order to establish transparency and accountability. There is no alternative to computer literate skilled people in developing information and communication technology in the country. Keeping this objective in view, Bangladesh Computer Council provided 690 computers to the high schools and implemented training programmes for the schoolteachers. In addition, the concerned Ministry has also arranged a separate computer training programme for the teachers of secondary schools.
A project proposal is being prepared to build a high tech park on 231.68 acres government land near Dhaka. All relevant infrastructure of information technology including transmission of high-speed data will be developed here. This Ministry has set up an ICT Incubator in the BSRS Bhaban at Kawran Bazar ,Dhaka. This area is being exclusively allocated to the ICT related organizations in the Private Sector and entrepreneurs involved in software and IT enabled services working for the markets both in home and abroad. High speed data communication and dedicated power supply have been ensured in the incubator.
There are about 1500 private institutions all over the country providing computer education. But the standard of computer education of these institutions has raised many questions. The Ministry of Information and Communication Technology is going to assess the quality of education delivered by these institutions in the light of the close dialogues with the representatives of different organisations engaged in this sector. The objective of this assessment is to know the level of competence of these institutions (in terns of skilled manpower, teaching staff, up to date syllabus, appropriate education materials, appropriate environment etc.). Apart from this, an expert committee has been formed to determine the ranking of these institutions comprising Bangladesh Computer Council, BUET and Dhaka University. Once this is done, a list of the
127
institutions capable of imparting computer education will be published in different newspapers & news media. As a result, the interested students and young people would be in a position to select appropriate institution that suits their needs. Like other countries, information technology is being considered as a potential economic sector in Bangladesh. Realising its importance, the Government has declared it as a thrust sector. Government is, there fore, attaching top priority to the computer education service. A work plan has been formulated to establish full-fledged computer laboratories in 128 educational centers of 64 districts on the basis of 'one school one computer' and 'one college one computer' in each district together with curriculum development and implementation of training programmes. This plan is now under consideration of IT Task Force. A total of Tk. 12.00 crore has been sanctioned in the current fiscal year as grants to the scientists of the universities and Government research and development organisations for the development of science and technology. In addition, Tk. 27.50 lakh has been sanctioned as grants in the ADP of current fiscal year for innovation of small technologies , research and development projects. Besides, in the current fiscal year, a programme of awarding fellowship to the researchers of different universities including meritorious students under National Science and Technology Fellowship Programme is under implementation and Tk. 45.00 lakh has been allocated for this purpose.
The process of establishing an IT center in Bangladesh Computer Council has been initiated under the financial assistance from the Government of Korea where the students will be awarded Vendors Certificate. The Government of Japan has also agreed to provide necessary support to this project. Besides this, a proposal for a survey programme on "IT Enabled services" with the assistance from the German government is under consideration at Economic Relations Division (ERD) and there is an initiative to hold discussion with the European Commission in order to have European assistance in ICT sector of the country. After completing a survey on "IT Enabled services in Bangladesh" through the JOBS project, USAID recently sent a report to the Ministry of Science & Information and Communication Technology. There is an initiative to take necessary actions after reviewing the report. Moreover, to meet the challenges of the 21st century a project titled" Strengthening of Bangladesh Computer Council" has been taken up for necessary infrastructure building. The second phase of "Establishment of Information Expansion Cell" in the Ministry of Science & Information and Communication (MOSICT) is under implementation.
The Ministry has also allocated TK.150.00 million for 5 (five) public Universities (Dhaka University, Rajshahi University, Khulna University,Bangladesh University of Engineering &Technology and Shahjalal Science &Tecnology University of Sylhet).These Universities will produce 900 Post Graduates (PDG) on ICT within three years (300 each year).A standard syllabus for this PDG programme has been prepared by the ICT experts of these Universities under the guidance and support of Bangladesh Computer Council (BCC) and MOSICT.
128
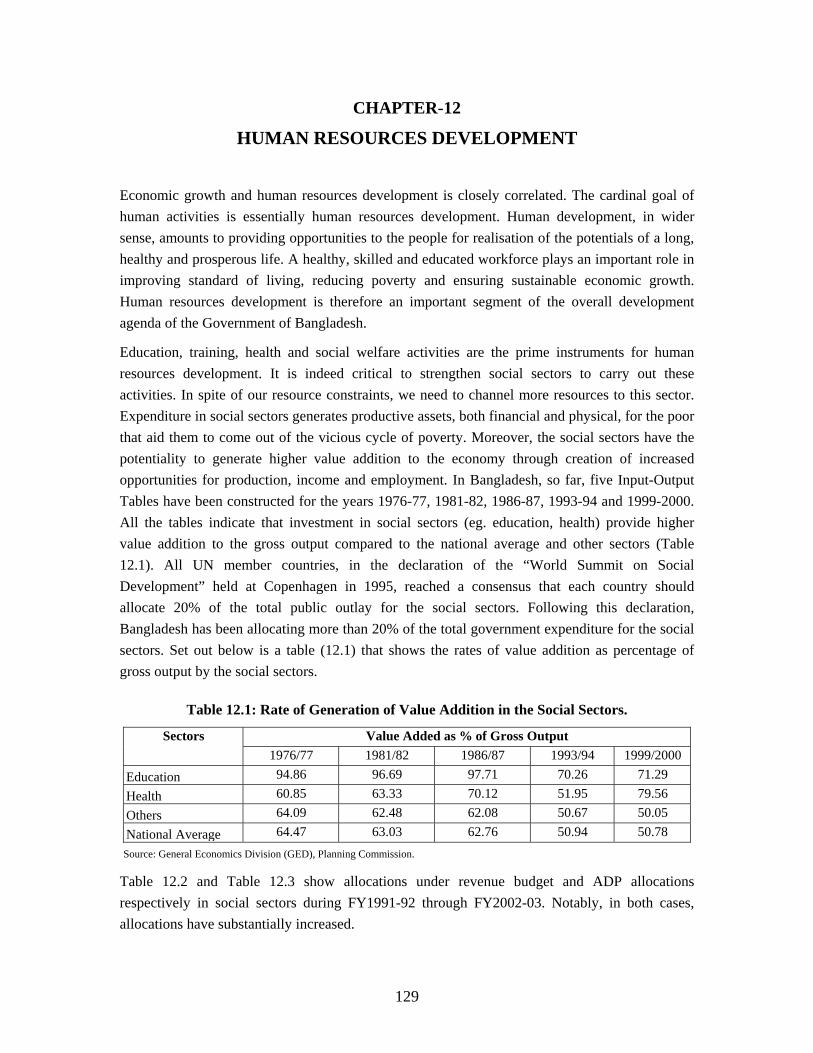
CHAPTER-12 HUMAN RESOURCES DEVELOPMENT
Economic growth and human resources development is closely correlated. The cardinal goal of human activities is essentially human resources development. Human development, in wider sense, amounts to providing opportunities to the people for realisation of the potentials of a long, healthy and prosperous life. A healthy, skilled and educated workforce plays an important role in improving standard of living, reducing poverty and ensuring sustainable economic growth. Human resources development is therefore an important segment of the overall development agenda of the Government of Bangladesh.
Education, training, health and social welfare activities are the prime instruments for human resources development. It is indeed critical to strengthen social sectors to carry out these activities. In spite of our resource constraints, we need to channel more resources to this sector. Expenditure in social sectors generates productive assets, both financial and physical, for the poor that aid them to come out of the vicious cycle of poverty. Moreover, the social sectors have the potentiality to generate higher value addition to the economy through creation of increased opportunities for production, income and employment. In Bangladesh, so far, five Input-Output Tables have been constructed for the years 1976-77, 1981-82, 1986-87, 1993-94 and 1999-2000. All the tables indicate that investment in social sectors (eg. education, health) provide higher value addition to the gross output compared to the national average and other sectors (Table 12.1). All UN member countries, in the declaration of the “World Summit on Social Development” held at Copenhagen in 1995, reached a consensus that each country should allocate 20% of the total public outlay for the social sectors. Following this declaration, Bangladesh has been allocating more than 20% of the total government expenditure for the social sectors. Set out below is a table (12.1) that shows the rates of value addition as percentage of gross output by the social sectors.
Table 12.1: Rate of Generation of Value Addition in the Social Sectors. Value Added as % of Gross Output Sectors
1976/77 1981/82 1986/87 1993/94 1999/2000 Education 94.86 96.69 97.71 70.26 71.29 Health 60.85 63.33 70.12 51.95 79.56 Others 64.09 62.48 62.08 50.67 50.05 National Average 64.47 63.03 62.76 50.94 50.78
Source: General Economics Division (GED), Planning Commission.
Table 12.2 and Table 12.3 show allocations under revenue budget and ADP allocations respectively in social sectors during FY1991-92 through FY2002-03. Notably, in both cases, allocations have substantially increased.
129
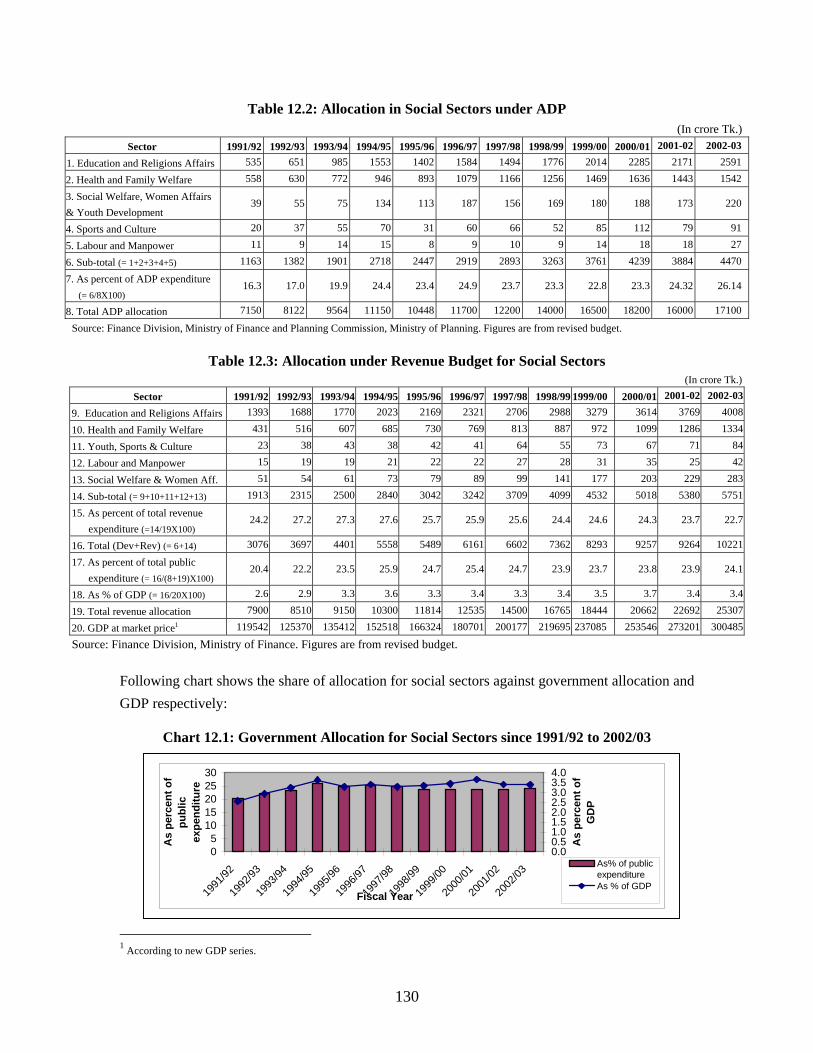
Table 12.2: Allocation in Social Sectors under ADP (In crore Tk.)
Sector 1991/92 1992/93 1993/94 1994/95 1995/96 1996/97 1997/98 1998/99 1999/00 2000/01 2001-02 2002-03
1. Education and Religions Affairs 535 651 985 1553 1402 1584 1494 1776 2014 2285 2171 2591
2. Health and Family Welfare 558 630 772 946 893 1079 1166 1256 1469 1636 1443 1542
3. Social Welfare, Women Affairs & Youth Development
39 55 75 134 113 187 156 169 180 188 173 220
4. Sports and Culture 20 37 55 70 31 60 66 52 85 112 79 91
5. Labour and Manpower 11 9 14 15 8 9 10 9 14 18 18 27
6. Sub-total (= 1+2+3+4+5) 1163 1382 1901 2718 2447 2919 2893 3263 3761 4239 3884 4470
7. As percent of ADP expenditure (= 6/8X100)
16.3 17.0 19.9 24.4 23.4 24.9 23.7 23.3 22.8 23.3 24.32 26.14
8. Total ADP allocation 7150 8122 9564 11150 10448 11700 12200 14000 16500 18200 16000 17100
Source: Finance Division, Ministry of Finance and Planning Commission, Ministry of Planning. Figures are from revised budget.
Table 12.3: Allocation under Revenue Budget for Social Sectors (In crore Tk.)
Sector 1991/92 1992/93 1993/94 1994/95 1995/96 1996/97 1997/98 1998/99 1999/00 2000/01 2001-02 2002-03
9. Education and Religions Affairs 1393 1688 1770 2023 2169 2321 2706 2988 3279 3614 3769 4008
10. Health and Family Welfare 431 516 607 685 730 769 813 887 972 1099 1286 1334
11. Youth, Sports & Culture 23 38 43 38 42 41 64 55 73 67 71 84
12. Labour and Manpower 15 19 31 19 21 22 22 27 28 35 25 42
13. Social Welfare & Women Aff. 51 54 177 61 73 79 89 99 141 203 229 283
14. Sub-total (= 9+10+11+12+13) 1913 2315 4532 2500 2840 3042 3242 3709 4099 5018 5380 5751
15. As percent of total revenue expenditure (=14/19X100)
24.2 27.2 27.3 27.6 25.7 25.9 25.6 24.4 24.6 24.3 23.7 22.7
16. Total (Dev+Rev) (= 6+14) 3076 3697 4401 5558 5489 6161 6602 7362 8293 9257 9264 10221
17. As percent of total public expenditure (= 16/(8+19)X100)
20.4 22.2 23.5 25.9 24.7 25.4 24.7 23.9 23.7 23.8 23.9 24.1
18. As % of GDP (= 16/20X100) 2.6 2.9 3.3 3.6 3.3 3.4 3.3 3.4 3.5 3.7 3.4 3.4
19. Total revenue allocation 7900 8510 9150 10300 11814 12535 14500 16765 18444 20662 22692 25307
20. GDP at market price1 119542 125370 135412 152518 166324 180701 200177 219695 237085 253546 273201 300485
Source: Finance Division, Ministry of Finance. Figures are from revised budget.
Following chart shows the share of allocation for social sectors against government allocation and GDP respectively:
Chart 12.1: Government Allocation for Social Sectors since 1991/92 to 2002/03
1 According to new GDP series.
05
1015202530
1991
/92
1992
/93
1993
/94
1994
/95
1995
/96
1996
/97
1997
/98
1998
/99
1999
/00
2000
/01
2001
/02
2002
/03
Fiscal Year
As
perc
ent o
f pu
blic
ex
pend
iture
0.00.51.01.52.02.53.03.54.0
As
perc
ent o
f G
DP
As% of publicexpenditureAs % of GDP
130
In the remainder part of this chapter Government’s programmes and achievements in the sectors associated with human resources development have been reviewed.
Education
Education is one of the fundamental rights of every citizen of Bangladesh. It is also the principal element of human resources development. Therefore, it is of immense importance to develop human resources trained in science and technology through building up a universal and people-oriented education system. Education sector, therefore, receives priority in the budgetary allocation. But currently the lion's share of education expenditure incurred is on salary and development of infrastructure. In order to ensure quality education, there should be proportionate allocation for educational research and logistics in future. Considering investment in education as one of the main strategies of national poverty reduction and socio-economic development, steps have been undertaken to create equal access for all at all stages of education and improve the quality of education. To this end, priority has been attached to primary and mass-education on the one hand and appropriate programmes have been undertaken for the development of secondary and higher education on the other.
With a view to maintaining and ensuring overall quality in education, various steps and programmes have been formulated and executed. A Commission has been formed to formulate national education policy. Grade system, has been introduced replacing Division system so that students concentrate more on acquiring knowledge rather than competing for scores. Training on educational research and educational management is being imparted through National Academy for Educational Management (NAEM). In order to establish discipline in private sector of education, initiatives are underway to form a Teachers Recruitment Authority similar to Public Service Commission (PSC) for appointment, transfer, promotion, etc. of teachers of all schools and colleges under Monthly Payment Order (MPO) scheme. Besides, among the schools under MPO scheme, the government is duly reviewing the standard/quality of education of those schools where majority of the students fail in the public examination. Initiatives have been taken to amend the Private Universities Act 1992. Various measures have been undertaken to implement different reform programmes supporting improvement of education. Programmes that deserve to be mentioned include establishment of education training authority, establishment of separate curriculum development board, decentralization of educational administration, expansion and qualitative improvement of job-oriented education through providing more autonomy to vocational and technical educational institutions, etc. In addition, meritorious students are being provided with general scholarships while the students of vocational-technical education are getting stipend. Department of Education Engineering is constructing new buildings along with reconstruction and renovations of existing buildings of schools, colleges, madrashas, universities and technical educational institutions for creating an improved educational environment.
131
The present education system of Bangladesh may broadly be classified into two stages, viz. primary and post-primary. The post primary education is further categorised into secondary, higher secondary and tertiary education. These streams consist of general, technical and religious education. Secondary level is of five years and higher secondary level is of two years duration. After completing higher secondary level, students enter into colleges and universities for higher education. Post-primary education is managed by a number of agencies, such as, Directorate of Secondary and Higher Education, Directorate of Technical Education, University Grants Commission (UGC), etc. under the administrative control and supervision of the Ministry of Education.
Primary education: Primary education is the first step in the education ladder. Realizing the extreme importance of primary education, the government has attached highest priority to primary and mass education. Primary education was made compulsory with the enactment of Primary Education (Compulsory) Act in 1990. A programme for compulsory primary education was launched all over the country since 1993. In order to universalise primary education, “Primary and Mass Education Division” was established in 1992, which has been elevated as the Ministry of Primary and Mass Education in January 2003. A variety of development programmes in the primary and non-formal education sector have been undertaken to improve the quality of education as well as to extend education at the doorstep of every citizen.
The government is committed to implement the programme to emancipate the country from the curse of illiteracy by 2006. With a view to increase enrolment rate of children at the primary level and to reduce dropout rate, Food for Education programme was launched in FY1993/94 in 460 unions of 460 upazillas (completed in June 2002). A programme for providing stipends to poor students of the remaining 3,208 unions was introduced in April 2000. Stipend project for primary education has been undertaken throughout the country for five years. About 55 lakh students from all the unions of the country are now offered a stipend in lieu of food for education. Under this programme, poor families are getting a stipend of Tk.100 and Tk.125 per month for sending to school one and more than one child respectively. Besides, up to December 2002, construction of 4,040 community primary schools, reconstruction of 37,441 schools and repair works of 16,749 schools were completed. 3,299 community schools are now running and the rest 741 are awaiting commencement.
The number of primary schools (government, registered non-government, non-registered non-government and community schools) was 49,539 in 1991. It has increased to 62,116 in 2002. Though the number of government primary schools remains nearly the same in number (about 37,700) during this time, the number of non-government primary level increased to 24,416 from 11,845. Besides, there are other types of schools such as Experimental, Ebtedaee Madrasa, Kindergarten, NGO, Satellite and primary schools attached to High School and Madrasa. Including all these types of primary schools the number increased to 78,363 in June 2002. The number of female students in primary level has been increasing gradually. Enrolment ratio of female/male student was 45:55 in 1991, which rose to 50:50 in 2002. The ratio of female/male teachers is also increasing due to implementation of teachers recruitment rule provision of
132
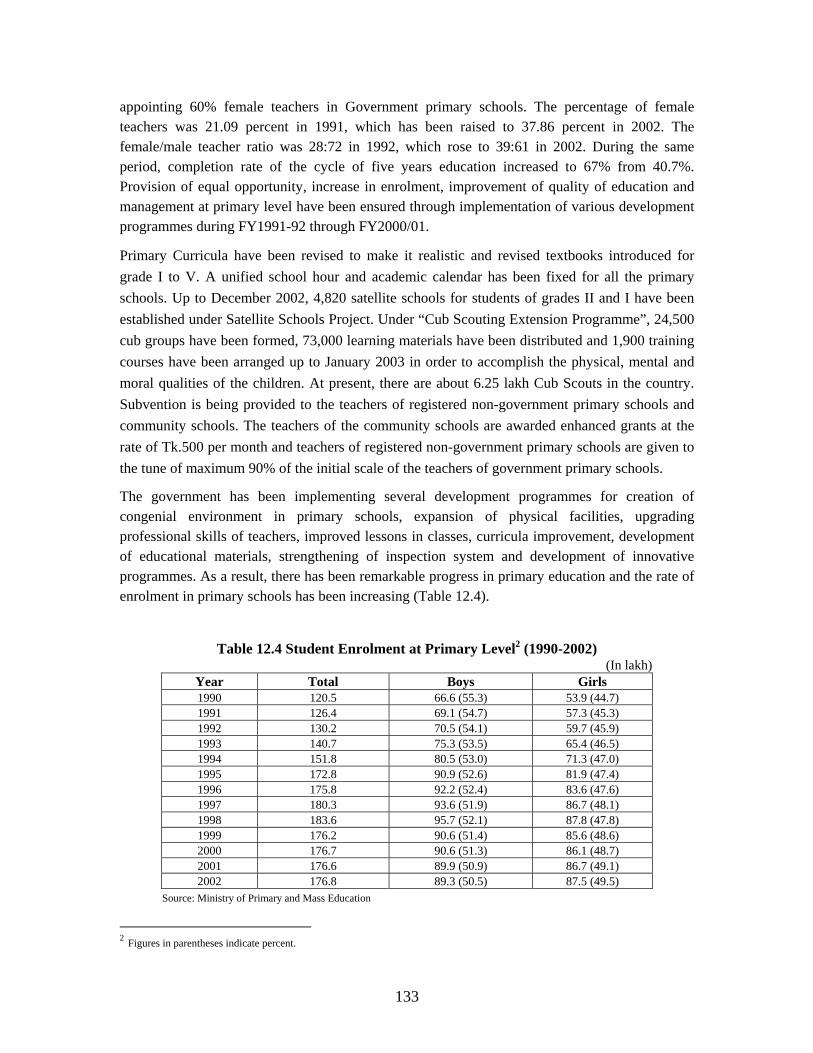
appointing 60% female teachers in Government primary schools. The percentage of female teachers was 21.09 percent in 1991, which has been raised to 37.86 percent in 2002. The female/male teacher ratio was 28:72 in 1992, which rose to 39:61 in 2002. During the same period, completion rate of the cycle of five years education increased to 67% from 40.7%. Provision of equal opportunity, increase in enrolment, improvement of quality of education and management at primary level have been ensured through implementation of various development programmes during FY1991-92 through FY2000/01.
Primary Curricula have been revised to make it realistic and revised textbooks introduced for grade I to V. A unified school hour and academic calendar has been fixed for all the primary schools. Up to December 2002, 4,820 satellite schools for students of grades II and I have been established under Satellite Schools Project. Under “Cub Scouting Extension Programme”, 24,500 cub groups have been formed, 73,000 learning materials have been distributed and 1,900 training courses have been arranged up to January 2003 in order to accomplish the physical, mental and moral qualities of the children. At present, there are about 6.25 lakh Cub Scouts in the country. Subvention is being provided to the teachers of registered non-government primary schools and community schools. The teachers of the community schools are awarded enhanced grants at the rate of Tk.500 per month and teachers of registered non-government primary schools are given to the tune of maximum 90% of the initial scale of the teachers of government primary schools.
The government has been implementing several development programmes for creation of congenial environment in primary schools, expansion of physical facilities, upgrading professional skills of teachers, improved lessons in classes, curricula improvement, development of educational materials, strengthening of inspection system and development of innovative programmes. As a result, there has been remarkable progress in primary education and the rate of enrolment in primary schools has been increasing (Table 12.4).
Table 12.4 Student Enrolment at Primary Level2 (1990-2002) (In lakh)
Year Total Boys Girls 1990 120.5 66.6 (55.3) 53.9 (44.7) 1991 126.4 69.1 (54.7) 57.3 (45.3) 1992 130.2 70.5 (54.1) 59.7 (45.9) 1993 140.7 75.3 (53.5) 65.4 (46.5) 1994 151.8 80.5 (53.0) 71.3 (47.0) 1995 172.8 90.9 (52.6) 81.9 (47.4) 1996 175.8 92.2 (52.4) 83.6 (47.6) 1997 180.3 93.6 (51.9) 86.7 (48.1) 1998 183.6 95.7 (52.1) 87.8 (47.8) 1999 176.2 90.6 (51.4) 85.6 (48.6) 2000 176.7 90.6 (51.3) 86.1 (48.7) 2001 176.6 89.9 (50.9) 86.7 (49.1) 2002 176.8 89.3 (50.5) 87.5 (49.5)
Source: Ministry of Primary and Mass Education
2 Figures in parentheses indicate percent.
133
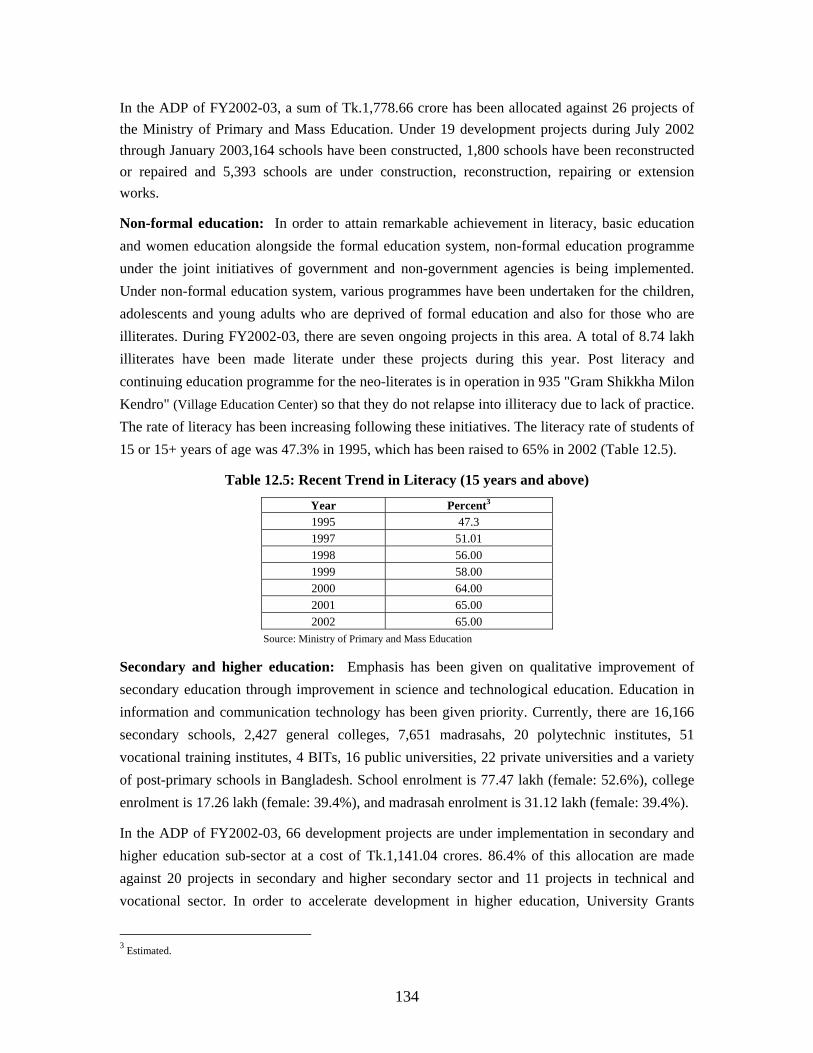
In the ADP of FY2002-03, a sum of Tk.1,778.66 crore has been allocated against 26 projects of the Ministry of Primary and Mass Education. Under 19 development projects during July 2002 through January 2003,164 schools have been constructed, 1,800 schools have been reconstructed or repaired and 5,393 schools are under construction, reconstruction, repairing or extension works.
Non-formal education: In order to attain remarkable achievement in literacy, basic education and women education alongside the formal education system, non-formal education programme under the joint initiatives of government and non-government agencies is being implemented. Under non-formal education system, various programmes have been undertaken for the children, adolescents and young adults who are deprived of formal education and also for those who are illiterates. During FY2002-03, there are seven ongoing projects in this area. A total of 8.74 lakh illiterates have been made literate under these projects during this year. Post literacy and continuing education programme for the neo-literates is in operation in 935 "Gram Shikkha Milon Kendro" (Village Education Center) so that they do not relapse into illiteracy due to lack of practice. The rate of literacy has been increasing following these initiatives. The literacy rate of students of 15 or 15+ years of age was 47.3% in 1995, which has been raised to 65% in 2002 (Table 12.5).
Table 12.5: Recent Trend in Literacy (15 years and above)
Year Percent3
1995 47.3 1997 51.01 1998 56.00 1999 58.00 2000 64.00 2001 65.00 2002 65.00
Source: Ministry of Primary and Mass Education
Secondary and higher education: Emphasis has been given on qualitative improvement of secondary education through improvement in science and technological education. Education in information and communication technology has been given priority. Currently, there are 16,166 secondary schools, 2,427 general colleges, 7,651 madrasahs, 20 polytechnic institutes, 51 vocational training institutes, 4 BITs, 16 public universities, 22 private universities and a variety of post-primary schools in Bangladesh. School enrolment is 77.47 lakh (female: 52.6%), college enrolment is 17.26 lakh (female: 39.4%), and madrasah enrolment is 31.12 lakh (female: 39.4%).
In the ADP of FY2002-03, 66 development projects are under implementation in secondary and higher education sub-sector at a cost of Tk.1,141.04 crores. 86.4% of this allocation are made against 20 projects in secondary and higher secondary sector and 11 projects in technical and vocational sector. In order to accelerate development in higher education, University Grants
3 Estimated.
134
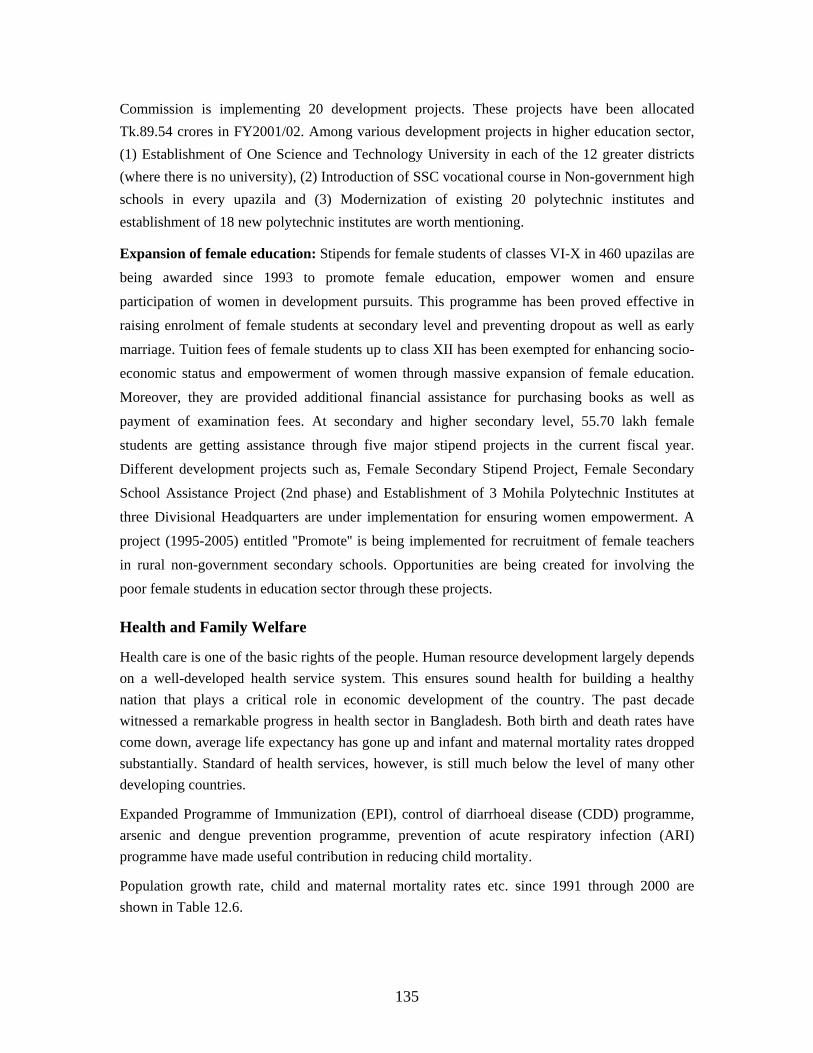
Commission is implementing 20 development projects. These projects have been allocated Tk.89.54 crores in FY2001/02. Among various development projects in higher education sector, (1) Establishment of One Science and Technology University in each of the 12 greater districts (where there is no university), (2) Introduction of SSC vocational course in Non-government high schools in every upazila and (3) Modernization of existing 20 polytechnic institutes and establishment of 18 new polytechnic institutes are worth mentioning.
Expansion of female education: Stipends for female students of classes VI-X in 460 upazilas are being awarded since 1993 to promote female education, empower women and ensure participation of women in development pursuits. This programme has been proved effective in raising enrolment of female students at secondary level and preventing dropout as well as early marriage. Tuition fees of female students up to class XII has been exempted for enhancing socio-economic status and empowerment of women through massive expansion of female education. Moreover, they are provided additional financial assistance for purchasing books as well as payment of examination fees. At secondary and higher secondary level, 55.70 lakh female students are getting assistance through five major stipend projects in the current fiscal year. Different development projects such as, Female Secondary Stipend Project, Female Secondary School Assistance Project (2nd phase) and Establishment of 3 Mohila Polytechnic Institutes at three Divisional Headquarters are under implementation for ensuring women empowerment. A project (1995-2005) entitled ''Promote'' is being implemented for recruitment of female teachers in rural non-government secondary schools. Opportunities are being created for involving the poor female students in education sector through these projects.
Health and Family Welfare
Health care is one of the basic rights of the people. Human resource development largely depends on a well-developed health service system. This ensures sound health for building a healthy nation that plays a critical role in economic development of the country. The past decade witnessed a remarkable progress in health sector in Bangladesh. Both birth and death rates have come down, average life expectancy has gone up and infant and maternal mortality rates dropped substantially. Standard of health services, however, is still much below the level of many other developing countries.
Expanded Programme of Immunization (EPI), control of diarrhoeal disease (CDD) programme, arsenic and dengue prevention programme, prevention of acute respiratory infection (ARI) programme have made useful contribution in reducing child mortality.
Population growth rate, child and maternal mortality rates etc. since 1991 through 2000 are shown in Table 12.6.
135
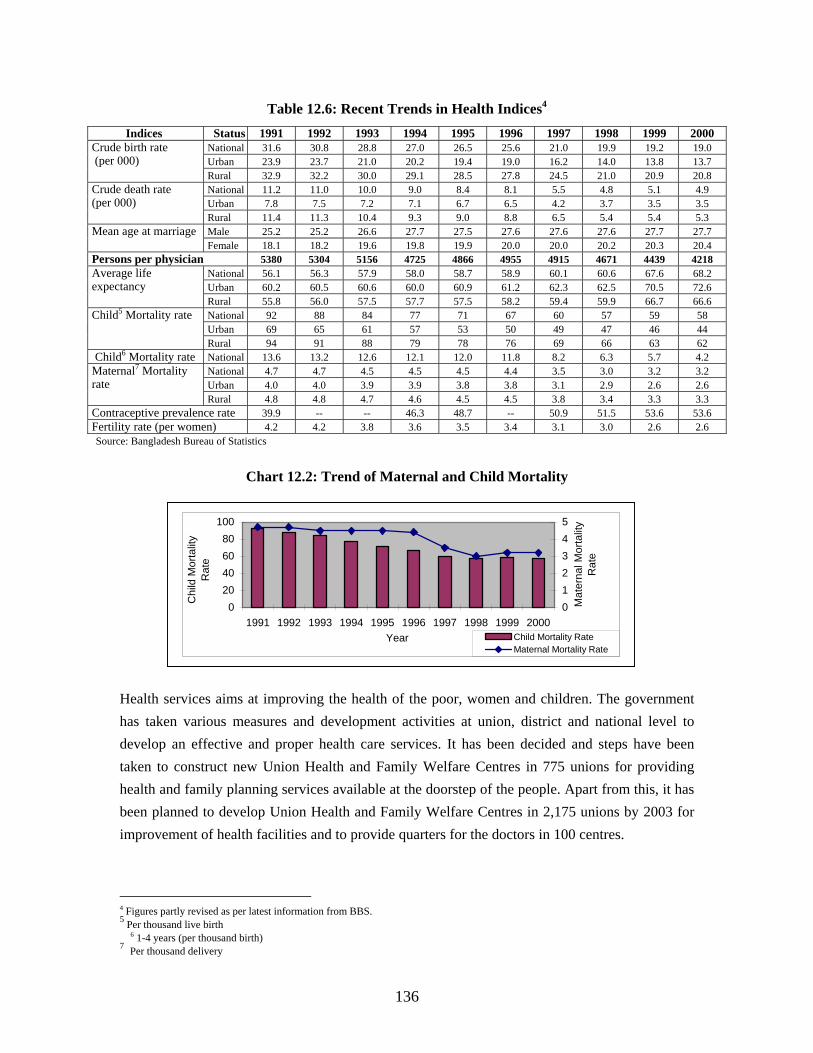
Table 12.6: Recent Trends in Health Indices4
Indices Status 1991 1992 1993 1994 1995 1996 1997 1998 1999 2000 National 31.6 30.8 28.8 27.0 26.5 25.6 21.0 19.9 19.2 19.0 Urban 23.9 19.0 23.7 21.0 20.2 19.4 16.2 14.0 13.8 13.7
Crude birth rate (per 000)
Rural 32.9 32.2 30.0 29.1 28.5 27.8 24.5 21.0 20.9 20.8 National 11.2 11.0 10.0 9.0 8.4 8.1 5.5 4.8 5.1 4.9 Urban 7.8 7.5 7.2 7.1 6.7 6.5 4.2 3.7 3.5 3.5
Crude death rate (per 000)
Rural 11.4 11.3 10.4 9.3 9.0 8.8 6.5 5.4 5.4 5.3 Male 25.2 25.2 26.6 27.7 27.5 27.6 27.6 27.6 27.7 27.7 Mean age at marriage Female 18.1 18.2 19.6 19.8 19.9 20.0 20.0 20.2 20.3 20.4
Persons per physician 5380 5304 5156 4725 4866 4955 4915 4671 4439 4218 National 56.1 56.3 57.9 58.0 58.7 58.9 60.1 60.6 67.6 68.2 Urban 60.2 60.5 60.6 60.0 60.9 61.2 62.3 62.5 70.5 72.6
Average life expectancy
Rural 55.8 56.0 57.5 57.7 57.5 58.2 59.4 59.9 66.7 66.6 National 92 88 84 77 71 67 60 57 59 58 Urban 69 65 61 57 53 50 49 47 46 44
Child5 Mortality rate
Rural 94 91 88 79 78 76 69 66 63 62 Child6 Mortality rate National 13.6 13.2 12.6 12.1 12.0 11.8 8.2 6.3 5.7 4.2
National 4.7 4.7 4.5 4.5 4.5 4.4 3.5 3.0 3.2 3.2 Urban 4.0 4.0 3.9 3.9 3.8 3.8 3.1 2.9 2.6 2.6
Maternal7 Mortality rate
Rural 4.8 4.8 4.7 4.6 4.5 4.5 3.8 3.4 3.3 3.3 Contraceptive prevalence rate 39.9 -- -- 46.3 48.7 -- 50.9 51.5 53.6 53.6 Fertility rate (per women) 4.2 4.2 3.8 3.6 3.5 3.4 3.1 3.0 2.6 2.6 Source: Bangladesh Bureau of Statistics
Chart 12.2: Trend of Maternal and Child Mortality
Health services aims at improving the health of the poor, women and children. The government has taken various measures and development activities at union, district and national level to develop an effective and proper health care services. It has been decided and steps have been taken to construct new Union Health and Family Welfare Centres in 775 unions for providing health and family planning services available at the doorstep of the people. Apart from this, it has been planned to develop Union Health and Family Welfare Centres in 2,175 unions by 2003 for improvement of health facilities and to provide quarters for the doctors in 100 centres.
4 Figures partly revised as per latest information from BBS. 5 Per thousand live birth
6 1-4 years (per thousand birth) 7 Per thousand delivery
020406080
100
1991 1992 1993 1994 1995 1996 1997 1998 1999 2000Year
Chi
ld M
orta
lity
Rat
e
012345
Mat
erna
l Mor
talit
y R
ate
Child Mortality RateMaternal Mortality Rate
136
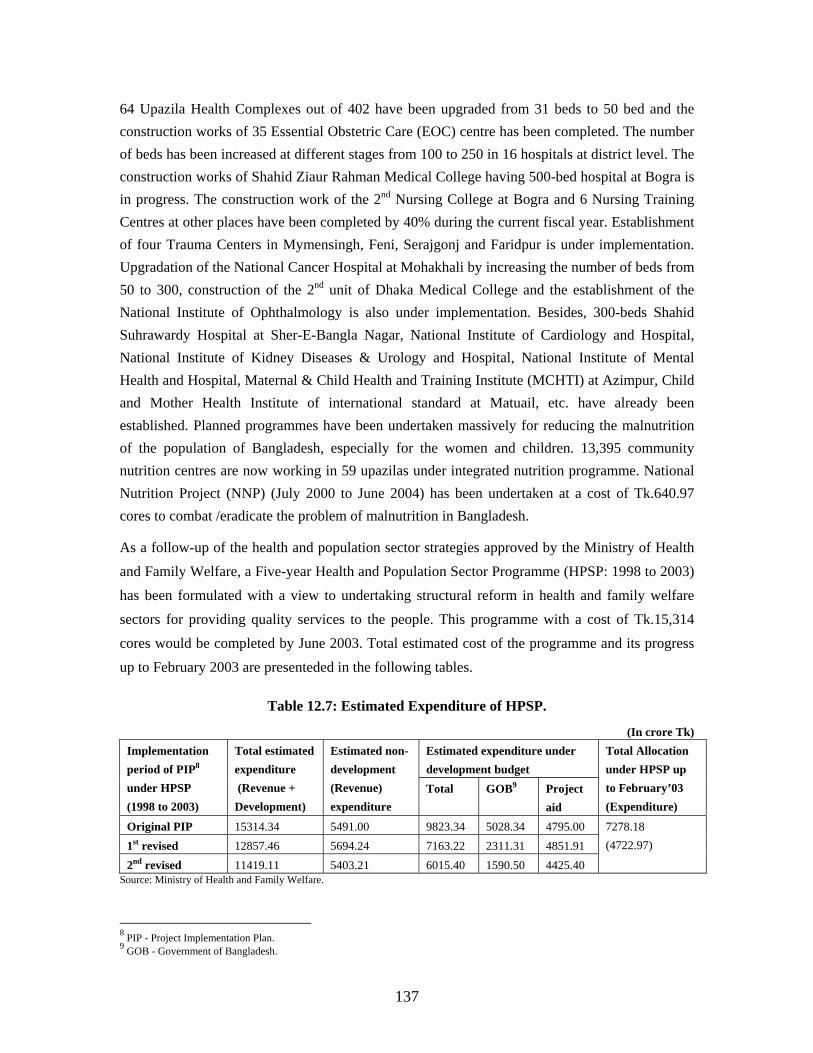
64 Upazila Health Complexes out of 402 have been upgraded from 31 beds to 50 bed and the construction works of 35 Essential Obstetric Care (EOC) centre has been completed. The number of beds has been increased at different stages from 100 to 250 in 16 hospitals at district level. The construction works of Shahid Ziaur Rahman Medical College having 500-bed hospital at Bogra is in progress. The construction work of the 2nd Nursing College at Bogra and 6 Nursing Training Centres at other places have been completed by 40% during the current fiscal year. Establishment of four Trauma Centers in Mymensingh, Feni, Serajgonj and Faridpur is under implementation. Upgradation of the National Cancer Hospital at Mohakhali by increasing the number of beds from 50 to 300, construction of the 2nd unit of Dhaka Medical College and the establishment of the National Institute of Ophthalmology is also under implementation. Besides, 300-beds Shahid Suhrawardy Hospital at Sher-E-Bangla Nagar, National Institute of Cardiology and Hospital, National Institute of Kidney Diseases & Urology and Hospital, National Institute of Mental Health and Hospital, Maternal & Child Health and Training Institute (MCHTI) at Azimpur, Child and Mother Health Institute of international standard at Matuail, etc. have already been established. Planned programmes have been undertaken massively for reducing the malnutrition of the population of Bangladesh, especially for the women and children. 13,395 community nutrition centres are now working in 59 upazilas under integrated nutrition programme. National Nutrition Project (NNP) (July 2000 to June 2004) has been undertaken at a cost of Tk.640.97 cores to combat /eradicate the problem of malnutrition in Bangladesh.
As a follow-up of the health and population sector strategies approved by the Ministry of Health and Family Welfare, a Five-year Health and Population Sector Programme (HPSP: 1998 to 2003) has been formulated with a view to undertaking structural reform in health and family welfare sectors for providing quality services to the people. This programme with a cost of Tk.15,314 cores would be completed by June 2003. Total estimated cost of the programme and its progress up to February 2003 are presenteded in the following tables.
Table 12.7: Estimated Expenditure of HPSP.
(In crore Tk) Estimated expenditure under development budget
Implementation period of PIP8 under HPSP (1998 to 2003)
Total estimated expenditure (Revenue + Development)
Estimated non-development (Revenue) expenditure
Total GOB9 Project aid
Total Allocation under HPSP up to February’03 (Expenditure)
Original PIP 15314.34 5491.00 9823.34 5028.34 4795.00 1st revised 12857.46 5694.24 7163.22 2311.31 4851.91 2nd revised 11419.11 5403.21 6015.40 1590.50 4425.40
7278.18 (4722.97)
Source: Ministry of Health and Family Welfare.
8 PIP - Project Implementation Plan. 9 GOB - Government of Bangladesh.
137
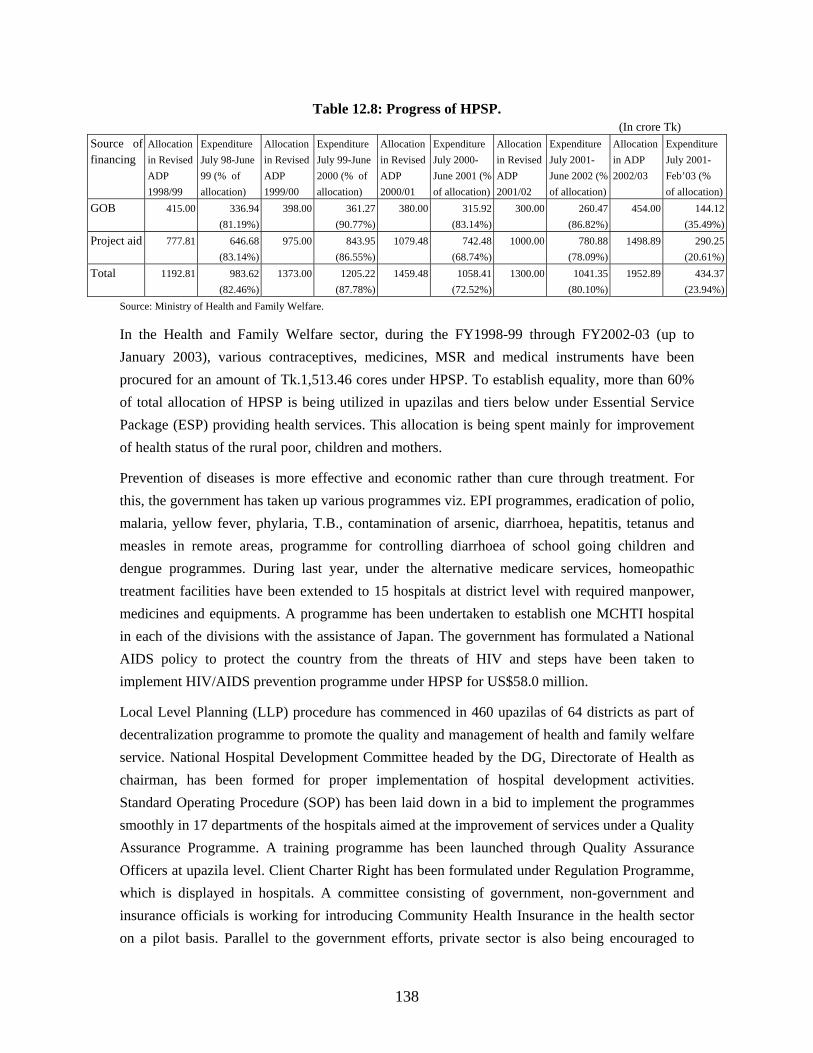
Table 12.8: Progress of HPSP. (In crore Tk)
Source of financing
Allocation in Revised ADP 1998/99
Expenditure July 98-June 99 (% of allocation)
Allocation in Revised ADP 1999/00
Expenditure July 99-June 2000 (% of allocation)
Allocation in Revised ADP 2000/01
Expenditure July 2000-June 2001 (% of allocation)
Allocation in Revised ADP 2001/02
Expenditure July 2001- June 2002 (% of allocation)
Allocation in ADP 2002/03
Expenditure July 2001-Feb’03 (% of allocation)
GOB 415.00 336.94 (81.19%)
398.00 361.27 (90.77%)
380.00 315.92 (83.14%)
300.00 260.47 (86.82%)
454.00 144.12(35.49%)
Project aid 777.81 646.68 (83.14%)
975.00 843.95 (86.55%)
1079.48 742.48 (68.74%)
1000.00 780.88 (78.09%)
1498.89 290.25(20.61%)
Total 1192.81 983.62 (82.46%)
1373.00 1205.22 (87.78%)
1459.48 1058.41(72.52%)
1300.00 1041.35 (80.10%)
1952.89 434.37(23.94%)
Source: Ministry of Health and Family Welfare.
In the Health and Family Welfare sector, during the FY1998-99 through FY2002-03 (up to January 2003), various contraceptives, medicines, MSR and medical instruments have been procured for an amount of Tk.1,513.46 cores under HPSP. To establish equality, more than 60% of total allocation of HPSP is being utilized in upazilas and tiers below under Essential Service Package (ESP) providing health services. This allocation is being spent mainly for improvement of health status of the rural poor, children and mothers.
Prevention of diseases is more effective and economic rather than cure through treatment. For this, the government has taken up various programmes viz. EPI programmes, eradication of polio, malaria, yellow fever, phylaria, T.B., contamination of arsenic, diarrhoea, hepatitis, tetanus and measles in remote areas, programme for controlling diarrhoea of school going children and dengue programmes. During last year, under the alternative medicare services, homeopathic treatment facilities have been extended to 15 hospitals at district level with required manpower, medicines and equipments. A programme has been undertaken to establish one MCHTI hospital in each of the divisions with the assistance of Japan. The government has formulated a National AIDS policy to protect the country from the threats of HIV and steps have been taken to implement HIV/AIDS prevention programme under HPSP for US$58.0 million.
Local Level Planning (LLP) procedure has commenced in 460 upazilas of 64 districts as part of decentralization programme to promote the quality and management of health and family welfare service. National Hospital Development Committee headed by the DG, Directorate of Health as chairman, has been formed for proper implementation of hospital development activities. Standard Operating Procedure (SOP) has been laid down in a bid to implement the programmes smoothly in 17 departments of the hospitals aimed at the improvement of services under a Quality Assurance Programme. A training programme has been launched through Quality Assurance Officers at upazila level. Client Charter Right has been formulated under Regulation Programme, which is displayed in hospitals. A committee consisting of government, non-government and insurance officials is working for introducing Community Health Insurance in the health sector on a pilot basis. Parallel to the government efforts, private sector is also being encouraged to
138
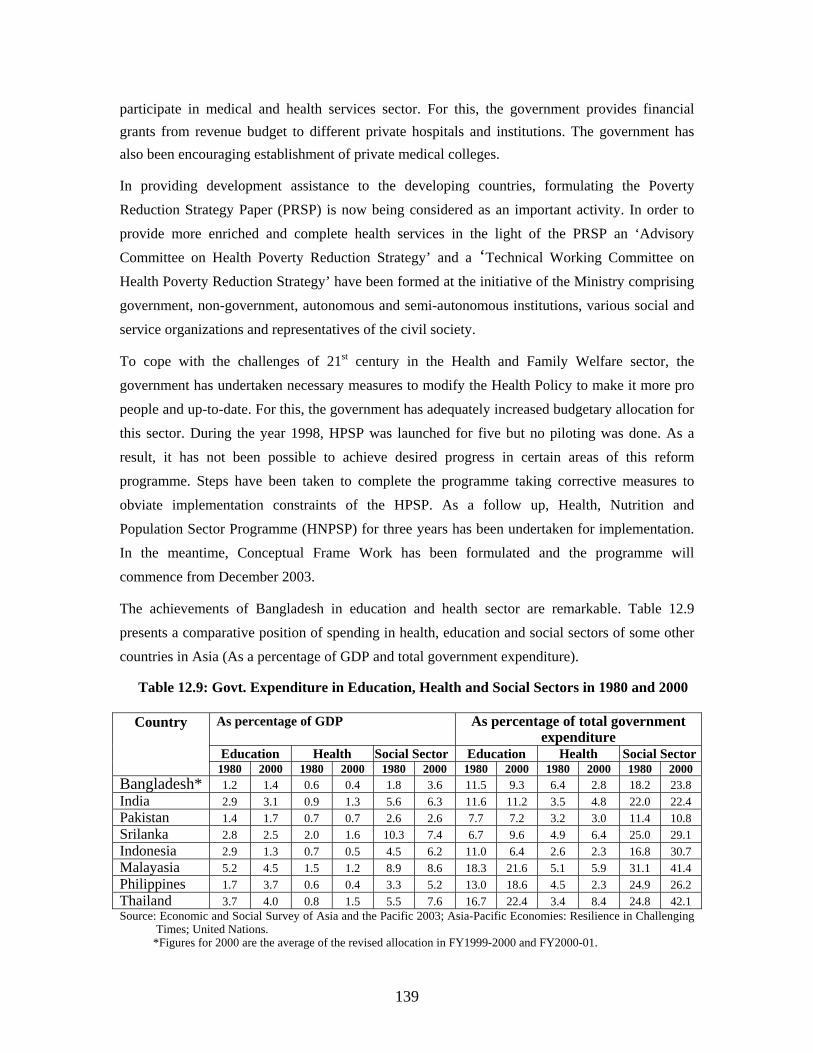
participate in medical and health services sector. For this, the government provides financial grants from revenue budget to different private hospitals and institutions. The government has also been encouraging establishment of private medical colleges.
In providing development assistance to the developing countries, formulating the Poverty Reduction Strategy Paper (PRSP) is now being considered as an important activity. In order to provide more enriched and complete health services in the light of the PRSP an ‘Advisory Committee on Health Poverty Reduction Strategy’ and a ‘Technical Working Committee on Health Poverty Reduction Strategy’ have been formed at the initiative of the Ministry comprising government, non-government, autonomous and semi-autonomous institutions, various social and service organizations and representatives of the civil society.
To cope with the challenges of 21st century in the Health and Family Welfare sector, the government has undertaken necessary measures to modify the Health Policy to make it more pro people and up-to-date. For this, the government has adequately increased budgetary allocation for this sector. During the year 1998, HPSP was launched for five but no piloting was done. As a result, it has not been possible to achieve desired progress in certain areas of this reform programme. Steps have been taken to complete the programme taking corrective measures to obviate implementation constraints of the HPSP. As a follow up, Health, Nutrition and Population Sector Programme (HNPSP) for three years has been undertaken for implementation. In the meantime, Conceptual Frame Work has been formulated and the programme will commence from December 2003.
The achievements of Bangladesh in education and health sector are remarkable. Table 12.9 presents a comparative position of spending in health, education and social sectors of some other countries in Asia (As a percentage of GDP and total government expenditure).
Table 12.9: Govt. Expenditure in Education, Health and Social Sectors in 1980 and 2000
As percentage of GDP As percentage of total government expenditure
Education Health Social Sector Education Health Social Sector
Country
1980 2000 1980 2000 1980 2000 1980 2000 1980 2000 1980 2000 Bangladesh* 1.2 1.4 0.6 0.4 1.8 3.6 11.5 9.3 6.4 2.8 18.2 23.8 India 2.9 3.1 0.9 1.3 5.6 6.3 11.6 11.2 3.5 4.8 22.0 22.4 Pakistan 1.4 1.7 0.7 0.7 2.6 2.6 7.7 7.2 3.2 3.0 11.4 10.8 Srilanka 2.8 2.5 2.0 1.6 10.3 7.4 6.7 9.6 4.9 6.4 25.0 29.1 Indonesia 6.2 2.9 1.3 0.7 0.5 4.5 11.0 6.4 2.6 2.3 16.8 30.7 Malayasia 5.2 4.5 1.5 1.2 8.9 8.6 18.3 21.6 5.1 5.9 31.1 41.4 Philippines 1.7 3.7 0.6 0.4 3.3 5.2 13.0 18.6 4.5 2.3 24.9 26.2 Thailand 3.7 4.0 0.8 1.5 5.5 7.6 16.7 22.4 3.4 8.4 24.8 42.1 Source: Economic and Social Survey of Asia and the Pacific 2003; Asia-Pacific Economies: Resilience in Challenging
Times; United Nations. *Figures for 2000 are the average of the revised allocation in FY1999-2000 and FY2000-01.
139
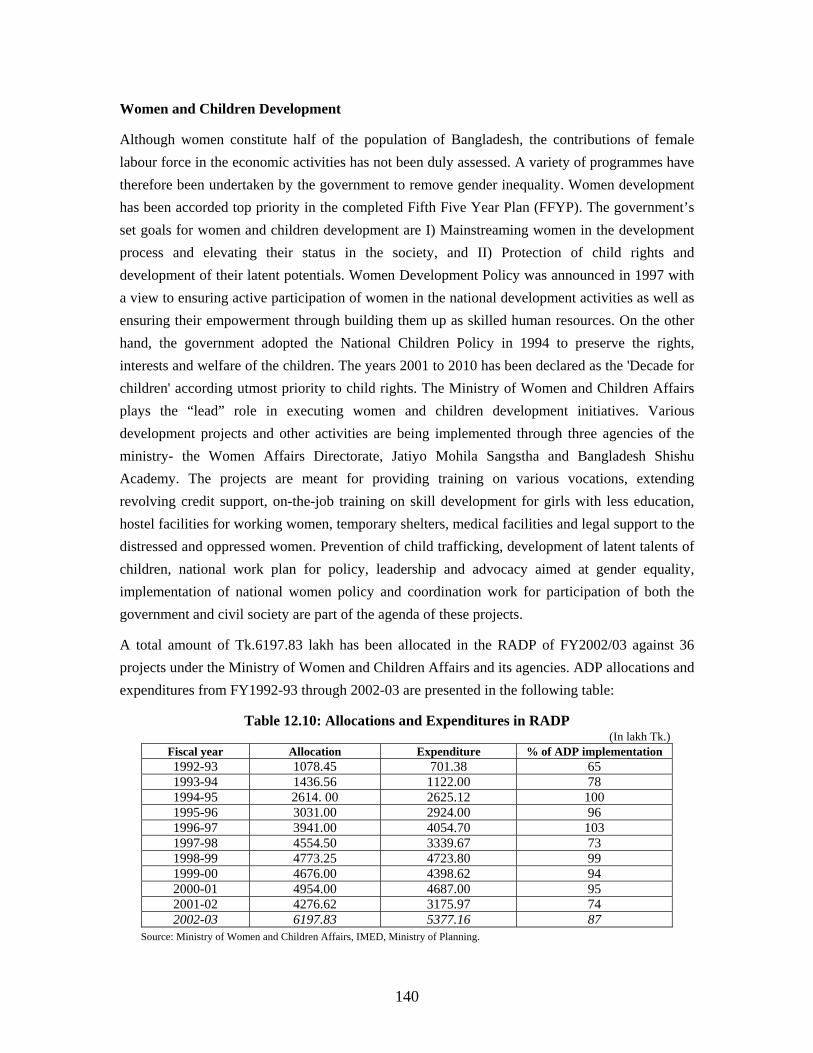
Women and Children Development
Although women constitute half of the population of Bangladesh, the contributions of female labour force in the economic activities has not been duly assessed. A variety of programmes have therefore been undertaken by the government to remove gender inequality. Women development has been accorded top priority in the completed Fifth Five Year Plan (FFYP). The government’s set goals for women and children development are I) Mainstreaming women in the development process and elevating their status in the society, and II) Protection of child rights and development of their latent potentials. Women Development Policy was announced in 1997 with a view to ensuring active participation of women in the national development activities as well as ensuring their empowerment through building them up as skilled human resources. On the other hand, the government adopted the National Children Policy in 1994 to preserve the rights, interests and welfare of the children. The years 2001 to 2010 has been declared as the 'Decade for children' according utmost priority to child rights. The Ministry of Women and Children Affairs plays the “lead” role in executing women and children development initiatives. Various development projects and other activities are being implemented through three agencies of the ministry- the Women Affairs Directorate, Jatiyo Mohila Sangstha and Bangladesh Shishu Academy. The projects are meant for providing training on various vocations, extending revolving credit support, on-the-job training on skill development for girls with less education, hostel facilities for working women, temporary shelters, medical facilities and legal support to the distressed and oppressed women. Prevention of child trafficking, development of latent talents of children, national work plan for policy, leadership and advocacy aimed at gender equality, implementation of national women policy and coordination work for participation of both the government and civil society are part of the agenda of these projects.
A total amount of Tk.6197.83 lakh has been allocated in the RADP of FY2002/03 against 36 projects under the Ministry of Women and Children Affairs and its agencies. ADP allocations and expenditures from FY1992-93 through 2002-03 are presented in the following table:
Table 12.10: Allocations and Expenditures in RADP (In lakh Tk.)
Fiscal year Allocation Expenditure % of ADP implementation 1992-93 1078.45 701.38 65 1993-94 1436.56 1122.00 78 1994-95 2614. 00 2625.12 100 1995-96 3031.00 2924.00 96 1996-97 3941.00 4054.70 103 1997-98 4554.50 3339.67 73 1998-99 4773.25 4723.80 99 1999-00 4676.00 4398.62 94 2000-01 4954.00 4687.00 95 2001-02 4276.62 3175.97 74 2002-03 6197.83 5377.16 87
Source: Ministry of Women and Children Affairs, IMED, Ministry of Planning.
140
Social welfare
The Ministry of Social Welfare plays a vital role for the socio-economic development of the poor, distressed and other backward segments of the population. As poverty is the main impediment to overall development of the society, the Ministry has been implementing is launching various poverty alleviation programmes as a major endeavor. This Ministry has also taken the responsibility of providing education, training and rehabilitation of a large number of disabled persons. In addition, the Ministry runs the programmes on Correctional Services for Juvenile Delinquents, Care and Protection for Abandoned Children, Rehabilitation of Vagrants, Safe Home, etc. and the other programmes all over the country. Besides, the Ministry has been implementing 29 development projects successfully.
The Department of Social Services (DSS) implements poverty alleviation programmes in all towns and cities, upazilas and rural areas through Rural Social Services (RSS), Urban Community Development (UCD) and Rural Mother’s Centre (RMC) programmes. Under these programmes, revolving funds are disbursed as initial investment and reinvestment for elimination of poverty. With an initial total investment of Tk.15,240.66 lakh under these programmes, the cumulative investment has stood at Tk.52,078.11 lakh up to June 2003. Similarly, the cumulative collection is Tk.47,458.80 lakh while the average rate of recovery is 91 percent. The total number of beneficiary families is 23,58,033 up to June 2003. The number of person benefited through vocational training is 12,65,623, through literacy programme is 14,67,905 and through social activities is 2,46,573. Awareness on primary health care has been disseminated to 5,76,300 persons. 11,39,606 persons have been motivated for maintaining small size family. 11,22,578 seedlings have been distributed for social forestry.
The government has allocated a total amount of Tk.40 cores under revenue budget in FY2002/03 for programmes including Mitigating Risk for Natural Disaster and Rehabilitation of Acid-burnt Women and the Physically Handicapped having allocation of Tk.25 cores and Tk.15 cores respectively. Under these programmes, 22,000 persons affected by natural calamities and 15,000 acid-burnt and physically handicapped persons will be benefited. The present government has decided to establish six Safe Homes in each of the six divisions for women, children and girls who are presently under the custody of Thana Hazat and Jail. Youth and Sports Development
Youth: Youth are the most promising as well as productive segment of the population of Bangladesh. Our national development entirely depends on the working spirit and initiatives of the youth force. Realizing the significance of involving the youth force in national development process, the government has taken massive programmes through the Department of Youth Development (DYD) under the Ministry of Youth and Sports for transforming them as most productive work force. At present, youth programmes have been extended to 64 districts and all the upazillas of the country. To infuse dynamism and to reinforce the youth development work, the government has been allocating additional funds every year for the youth sector. During the
141
FY1991-92 through FY2001-02, under different training programmes being implemented by the DYD, 19,18,300 young men and women (99.30% of the target) have been trained up. During the same period 10,50,049 young men and women (86.76% of the target) could be self-employed. Up to February 2003, a total number of 1,44,584 young men and women (64.26% of the target) have been trained and 75,700 young men and women (53.79% of the target) have been self-employed. "Family Based Employment Programme" is under implementation in 82 selected upazilas for the purpose of reducing poverty of the poor and landless youth. Under this programme, up to February 2003, a total number of 4,77,151 persons have been trained towards self-employment. During the FY1995-96 through FY2000-01, motivational training on reproductive health and gender issues has been imparted to 1,76,863 young men and women (116.97% of the target) under the project "Advocacy on Reproductive Health and Gender Issues through Youth Clubs". And in the current fiscal year, up to February 2003, a total number of 14,806 young men and women have been trained. An UNDP assisted technical assistance project namely, "Proactive Involvement of Rural Youth in Participatory Development" at Laksham of Comilla district and Boalkhali of Chittagong district through 40 youth clubs has been completed in December 2002. Under this project, 14,906 young men and women have been trained during the FY1997-98 through FY2000-01 and 560 have been trained up to December 2002 in the FY2002-03. Besides, Tk.192.77 lakh have been provided as grants to 4,576 members of these 40 youth clubs. In order to involve youth organisations in socio-economic development of the country through various development programmes, 6092 youth organisations have been enlisted with the DYD. From youth welfare fund and non-development budget, Tk.50 lakh and Tk.4.83 lakh have been sanctioned as project grants to 497 youth clubs and 69 youth organisations respectively in FY2001-02. Micro-credit programme is one of the major programmes being implemented by the DYD. The contribution of micro-credit programme towards eradication of rural poverty and self-employment projects is gaining importance. Up to December 2002, a total amount of Tk.50,119.28 lakh, including revolving fund, has been sanctioned to 5,81,885 beneficiaries as micro-credit. Average rate of recovery is 88.82%. Sports: In achieving physical and mental excellence of the people and youth force as well as for human resource development, games and sports have no other alternative. They play a very prominent role in creating mutual amity and harmony in the youth force of the society. Given this importance, the government is relentless in raising the standard of sports and games of the country. An appropriate sports policy consistent with the present status, potentials and future prospects of sports in the country has been formulated. Sports infrastructures and sports facilities are the pre-requisites for the development of games and sports. During the previous ‘Five-year’ plans governments have taken up and implemented various development projects for creation, extension and development of sports facilities in the country. Since FY1996-97 through FY2001-02, a total amount of Tk.10,825.32 lakh has been spent through 19 development projects. Against a total allocation of Tk.3955 lakh in FY2002-03, up to December 2003, Tk.1,927.5 lakh has been allocated for 17 projects.
142
Adequate infrastructure facilities and appropriate coaching are indispensable for the development and promotion of sports in any country. In order to meet the above demand, the necessity of establishing a sports institute which would take the responsibility of identifying and nurturing talented sports persons and producing efficient coaches and technical experts was felt. To achieve this goal, a plan was undertaken in 1974 to establish “Bangladesh Institute of Sports (BIS)” as a project under the National Sports Council. Subsequently, the institute was renamed as Bangladesh Krira Shiksha Protishtan (BKSP) in 1983 as an autonomous, statutory organisation. At present, sports coaching and academic programmes are run as regular activities of the institute. Total revised ADP allocation against the projects under the Directorate of Sports, during the FY1991-92 through FY2002-03 (up to March 2003), amounts to Tk.7,067.45 lakh of which actual spending stands at Tk.4,773.05 lakh (67.04%).
Cultural Development
There is a very close relationship between cultural development and human resource development. A nation, well acquainted with its own cultural heritage, feels motivated to participate on the nation building efforts. History, civilisation, national heritage and identity of a nation are reflected through its culture. Cultural institutions & activities very truly project the direction of its culture. To keep pace with the ongoing trend of world culture, the agencies under the Ministry of Cultural Affairs, like Shilpakala Academy, Bangla Acadamy, National Museum, Department of Archaeology, Department of Public Library, National Archives, National Book
Centre, Nazrul Institute, Folk and Crafts Foundation, Copy Right Office, Cultural Centre at Cox's Bazar and Tribal Cultural Institutes at Rangamati, Bandarban and Birishiri are making relentless efforts to put in place cultural development infrastructure throughout the country. In the meantime, the cultural identity of Bangladesh is widely known around the world. So far, cultural agreements have been concluded with about 39 countries of the world in a bid to promote mutual understanding and amity. Exchange visits of our cultural representatives, students, teachers, scholars and cultural personalities take place under these cultural exchange programmes. After the assumption of power, the present democratic government has been laying much emphasis on cultural programmes covering music, dances, fine arts, exhibition of handicrafts and books.
With a view to bring in professional excellence in drama, music and dance the government has already taken up infrastructure development initiatives including 'Construction of National Theatre' and 'National Music and Art Centre'. To revamp traditional rural arts and culture, Folk Art Fairs for a month are organised every year. In order to nurture and improve the tribal culture, development works for Tribal Cultural Academy at the Divisional town of Rajshahi, Tribal Cultural Institute at Khagrachari and Monipur Lalit Kola Academy at Moulvibazar have already been completed. Tribal Museum-cum-Library has been established at Rangamati. The works for development of Tribal Institute (2nd phase) at Bandarban has been undertaken. The construction of Training Centre on Fine and Performing Arts (1st phase) at Rajbari has been completed. Shilpokala Academy Development projects have been undertaken in 28 districts to develop
143
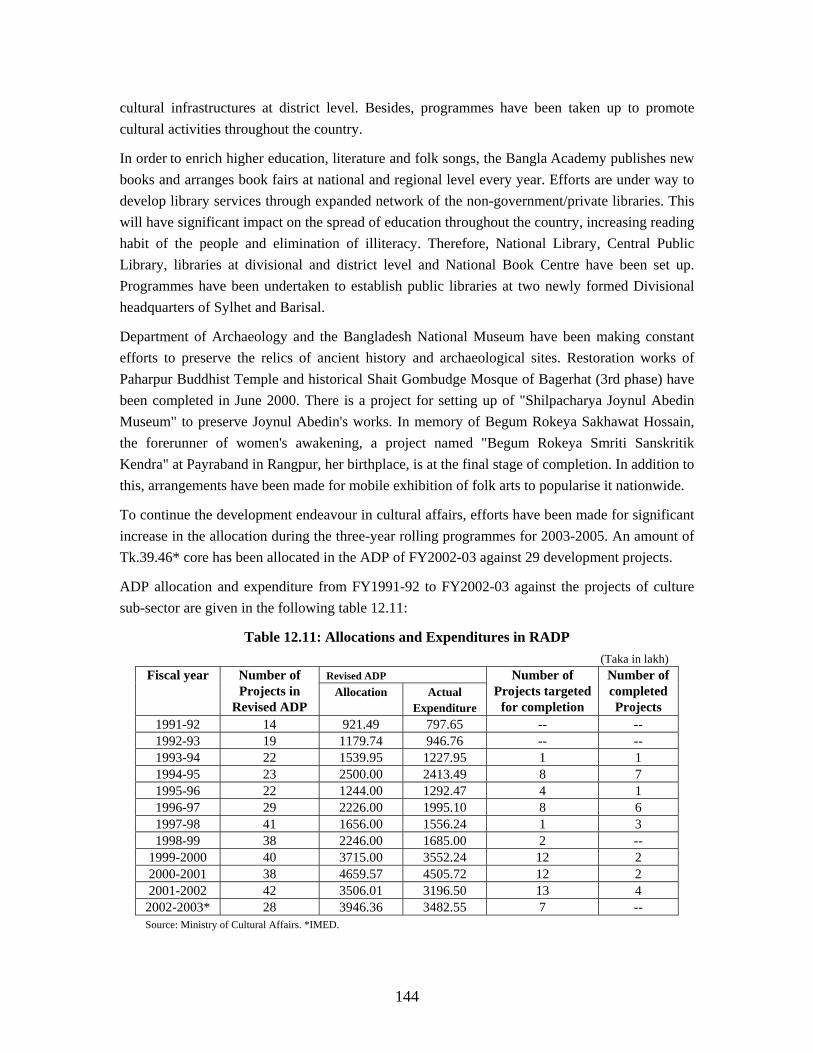
cultural infrastructures at district level. Besides, programmes have been taken up to promote cultural activities throughout the country.
In order to enrich higher education, literature and folk songs, the Bangla Academy publishes new books and arranges book fairs at national and regional level every year. Efforts are under way to develop library services through expanded network of the non-government/private libraries. This will have significant impact on the spread of education throughout the country, increasing reading habit of the people and elimination of illiteracy. Therefore, National Library, Central Public Library, libraries at divisional and district level and National Book Centre have been set up. Programmes have been undertaken to establish public libraries at two newly formed Divisional headquarters of Sylhet and Barisal.
Department of Archaeology and the Bangladesh National Museum have been making constant efforts to preserve the relics of ancient history and archaeological sites. Restoration works of Paharpur Buddhist Temple and historical Shait Gombudge Mosque of Bagerhat (3rd phase) have been completed in June 2000. There is a project for setting up of "Shilpacharya Joynul Abedin Museum" to preserve Joynul Abedin's works. In memory of Begum Rokeya Sakhawat Hossain, the forerunner of women's awakening, a project named "Begum Rokeya Smriti Sanskritik Kendra" at Payraband in Rangpur, her birthplace, is at the final stage of completion. In addition to this, arrangements have been made for mobile exhibition of folk arts to popularise it nationwide.
To continue the development endeavour in cultural affairs, efforts have been made for significant increase in the allocation during the three-year rolling programmes for 2003-2005. An amount of Tk.39.46* core has been allocated in the ADP of FY2002-03 against 29 development projects.
ADP allocation and expenditure from FY1991-92 to FY2002-03 against the projects of culture sub-sector are given in the following table 12.11:
Table 12.11: Allocations and Expenditures in RADP (Taka in lakh)
Revised ADP Fiscal year Number of Projects in
Revised ADP Allocation Actual
Expenditure
Number of Projects targeted
for completion
Number of completed Projects
1991-92 14 921.49 797.65 -- -- 1992-93 19 1179.74 946.76 -- -- 1993-94 22 1539.95 1227.95 1 1 1994-95 23 2500.00 2413.49 8 7 1995-96 22 1244.00 1292.47 4 1 1996-97 29 2226.00 1995.10 8 6 1997-98 41 1656.00 1556.24 1 3 1998-99 38 2246.00 1685.00 2 --
1999-2000 40 3715.00 3552.24 12 2 2000-2001 38 4659.57 4505.72 12 2 2001-2002 42 3506.01 3196.50 13 4
2002-2003* 28 3946.36 3482.55 7 -- Source: Ministry of Cultural Affairs. *IMED.
144
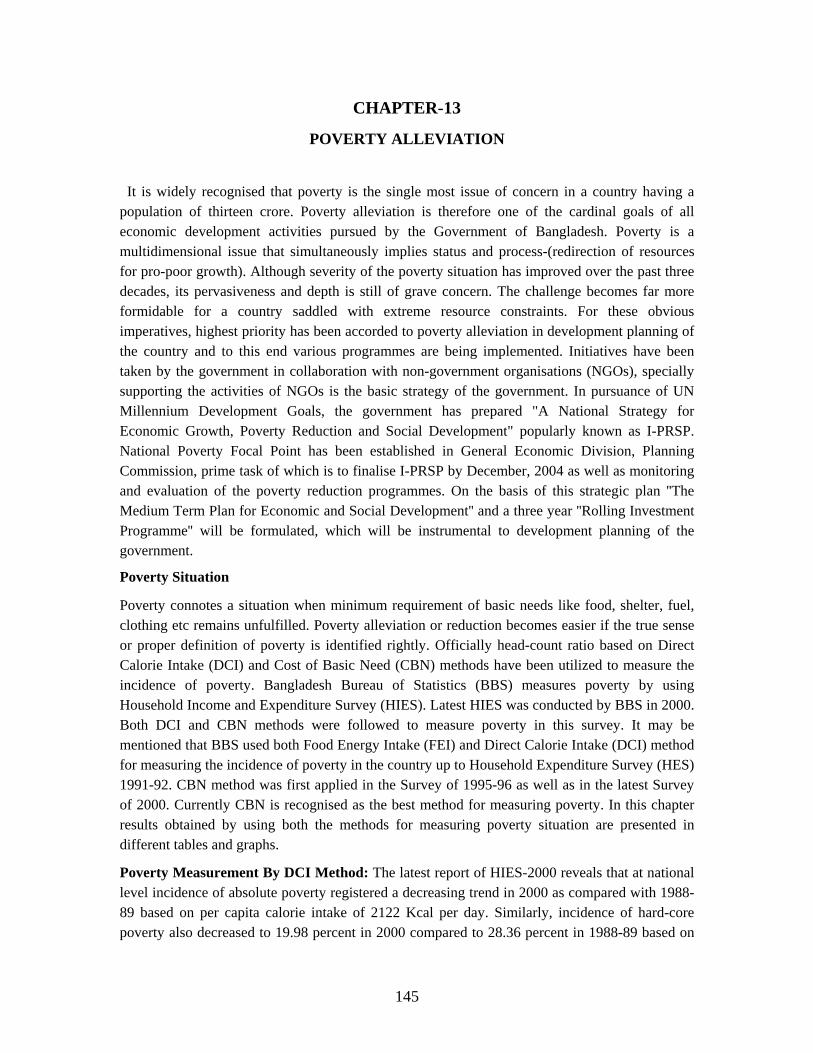
CHAPTER-13
POVERTY ALLEVIATION It is widely recognised that poverty is the single most issue of concern in a country having a population of thirteen crore. Poverty alleviation is therefore one of the cardinal goals of all economic development activities pursued by the Government of Bangladesh. Poverty is a multidimensional issue that simultaneously implies status and process-(redirection of resources for pro-poor growth). Although severity of the poverty situation has improved over the past three decades, its pervasiveness and depth is still of grave concern. The challenge becomes far more formidable for a country saddled with extreme resource constraints. For these obvious imperatives, highest priority has been accorded to poverty alleviation in development planning of the country and to this end various programmes are being implemented. Initiatives have been taken by the government in collaboration with non-government organisations (NGOs), specially supporting the activities of NGOs is the basic strategy of the government. In pursuance of UN Millennium Development Goals, the government has prepared "A National Strategy for Economic Growth, Poverty Reduction and Social Development" popularly known as I-PRSP. National Poverty Focal Point has been established in General Economic Division, Planning Commission, prime task of which is to finalise I-PRSP by December, 2004 as well as monitoring and evaluation of the poverty reduction programmes. On the basis of this strategic plan ''The Medium Term Plan for Economic and Social Development'' and a three year ''Rolling Investment Programme'' will be formulated, which will be instrumental to development planning of the government.
Poverty Situation
Poverty connotes a situation when minimum requirement of basic needs like food, shelter, fuel, clothing etc remains unfulfilled. Poverty alleviation or reduction becomes easier if the true sense or proper definition of poverty is identified rightly. Officially head-count ratio based on Direct Calorie Intake (DCI) and Cost of Basic Need (CBN) methods have been utilized to measure the incidence of poverty. Bangladesh Bureau of Statistics (BBS) measures poverty by using Household Income and Expenditure Survey (HIES). Latest HIES was conducted by BBS in 2000. Both DCI and CBN methods were followed to measure poverty in this survey. It may be mentioned that BBS used both Food Energy Intake (FEI) and Direct Calorie Intake (DCI) method for measuring the incidence of poverty in the country up to Household Expenditure Survey (HES) 1991-92. CBN method was first applied in the Survey of 1995-96 as well as in the latest Survey of 2000. Currently CBN is recognised as the best method for measuring poverty. In this chapter results obtained by using both the methods for measuring poverty situation are presented in different tables and graphs.
Poverty Measurement By DCI Method: The latest report of HIES-2000 reveals that at national level incidence of absolute poverty registered a decreasing trend in 2000 as compared with 1988-89 based on per capita calorie intake of 2122 Kcal per day. Similarly, incidence of hard-core poverty also decreased to 19.98 percent in 2000 compared to 28.36 percent in 1988-89 based on
145
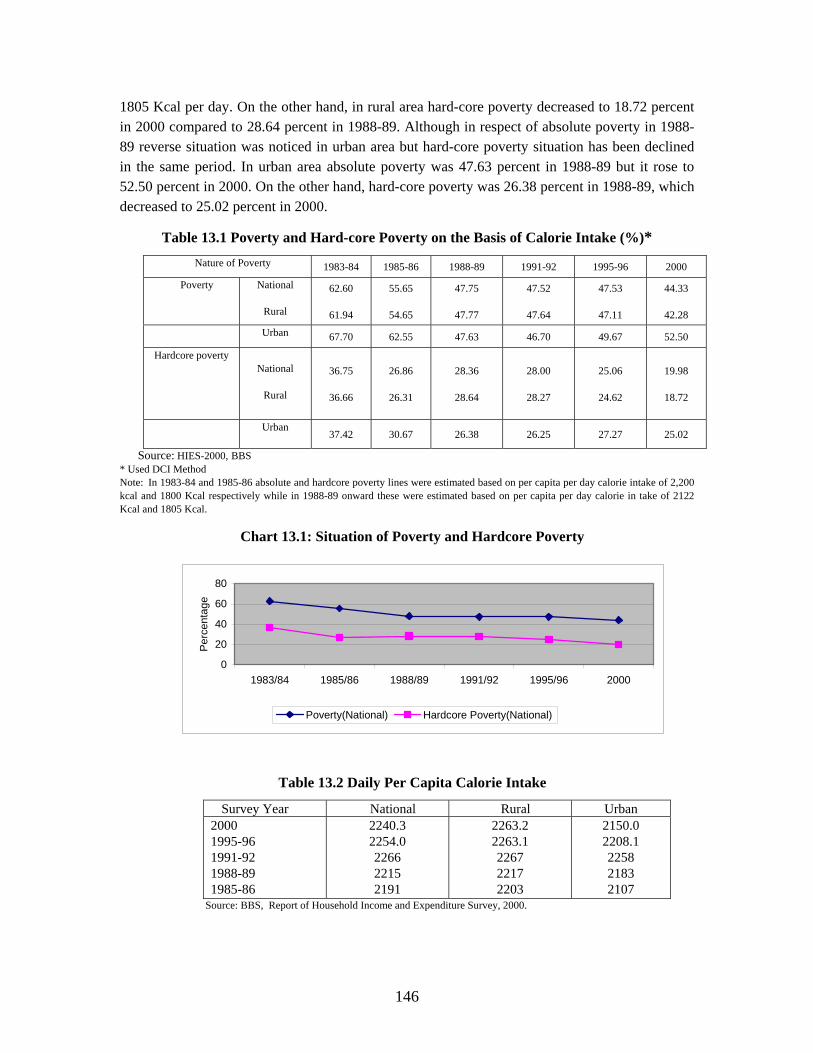
1805 Kcal per day. On the other hand, in rural area hard-core poverty decreased to 18.72 percent in 2000 compared to 28.64 percent in 1988-89. Although in respect of absolute poverty in 1988-89 reverse situation was noticed in urban area but hard-core poverty situation has been declined in the same period. In urban area absolute poverty was 47.63 percent in 1988-89 but it rose to 52.50 percent in 2000. On the other hand, hard-core poverty was 26.38 percent in 1988-89, which decreased to 25.02 percent in 2000.
Table 13.1 Poverty and Hard-core Poverty on the Basis of Calorie Intake (%)* Nature of Poverty 1983-84 1985-86 1988-89 1991-92 1995-96 2000
Poverty National
Rural
62.60
61.94
55.65
54.65
47.75
47.77
47.52
47.64
47.53
47.11
44.33
42.28
Urban 67.70 62.55 47.63 46.70 49.67 52.50
Hardcore poverty
National
Rural
36.75
36.66
26.86
26.31
28.36
28.64
28.00
28.27
25.06
24.62
19.98
18.72
Urban
37.42 30.67 26.38 26.25 27.27 25.02
Source: HIES-2000, BBS * Used DCI Method Note: In 1983-84 and 1985-86 absolute and hardcore poverty lines were estimated based on per capita per day calorie intake of 2,200 kcal and 1800 Kcal respectively while in 1988-89 onward these were estimated based on per capita per day calorie in take of 2122 Kcal and 1805 Kcal.
Chart 13.1: Situation of Poverty and Hardcore Poverty
0
20
40
60
80
1983/84 1985/86 1988/89 1991/92 1995/96 2000
Perc
enta
ge
Poverty(National) Hardcore Poverty(National)
Table 13.2 Daily Per Capita Calorie Intake Survey Year National Rural Urban
2000 1995-96 1991-92 1988-89 1985-86
2240.3 2254.0 2266 2215 2191
2263.2 2263.1 2267 2217 2203
2150.0 2208.1 2258 2183 2107
Source: BBS, Report of Household Income and Expenditure Survey, 2000.
146
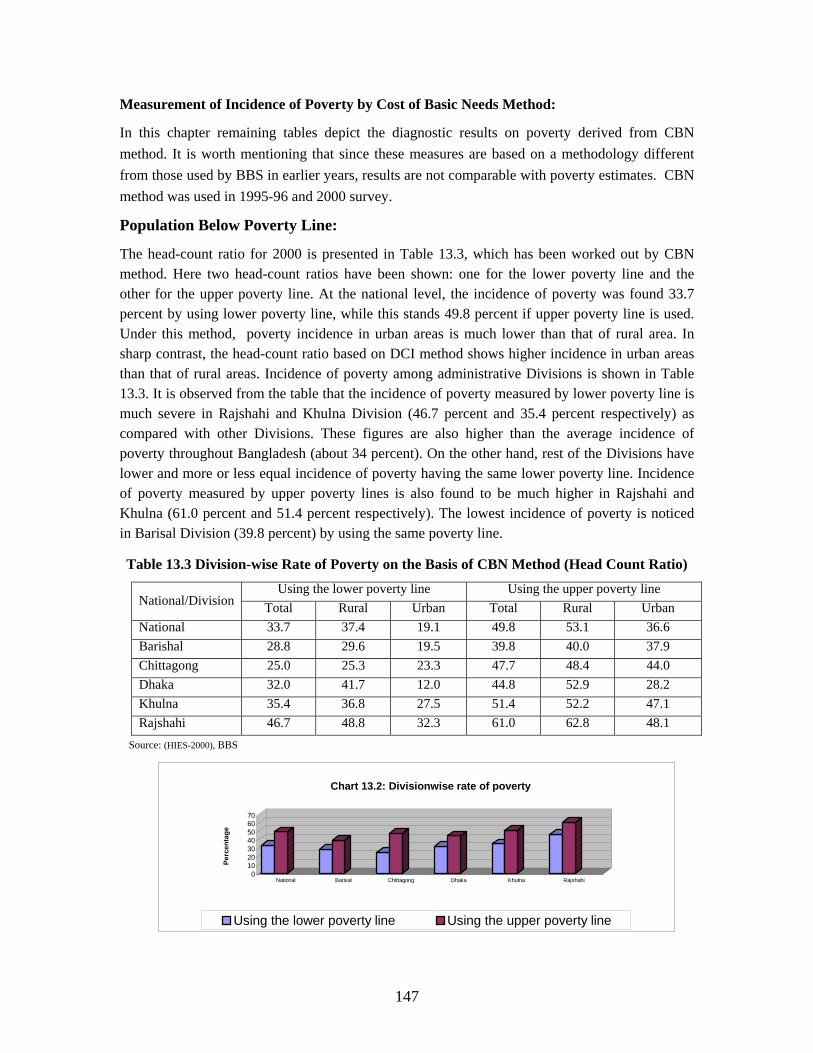
Measurement of Incidence of Poverty by Cost of Basic Needs Method:
In this chapter remaining tables depict the diagnostic results on poverty derived from CBN method. It is worth mentioning that since these measures are based on a methodology different from those used by BBS in earlier years, results are not comparable with poverty estimates. CBN method was used in 1995-96 and 2000 survey.
Population Below Poverty Line:
The head-count ratio for 2000 is presented in Table 13.3, which has been worked out by CBN method. Here two head-count ratios have been shown: one for the lower poverty line and the other for the upper poverty line. At the national level, the incidence of poverty was found 33.7 percent by using lower poverty line, while this stands 49.8 percent if upper poverty line is used. Under this method, poverty incidence in urban areas is much lower than that of rural area. In sharp contrast, the head-count ratio based on DCI method shows higher incidence in urban areas than that of rural areas. Incidence of poverty among administrative Divisions is shown in Table 13.3. It is observed from the table that the incidence of poverty measured by lower poverty line is much severe in Rajshahi and Khulna Division (46.7 percent and 35.4 percent respectively) as compared with other Divisions. These figures are also higher than the average incidence of poverty throughout Bangladesh (about 34 percent). On the other hand, rest of the Divisions have lower and more or less equal incidence of poverty having the same lower poverty line. Incidence of poverty measured by upper poverty lines is also found to be much higher in Rajshahi and Khulna (61.0 percent and 51.4 percent respectively). The lowest incidence of poverty is noticed in Barisal Division (39.8 percent) by using the same poverty line.
Table 13.3 Division-wise Rate of Poverty on the Basis of CBN Method (Head Count Ratio)
Using the lower poverty line Using the upper poverty line National/Division Total Rural Urban Total Rural Urban National 33.7 37.4 19.1 49.8 53.1 36.6 Barishal 28.8 29.6 19.5 39.8 40.0 37.9 Chittagong 25.0 25.3 23.3 47.7 48.4 44.0 Dhaka 32.0 41.7 12.0 44.8 52.9 28.2 Khulna 35.4 36.8 27.5 51.4 52.2 47.1 Rajshahi 46.7 48.8 48.1 32.3 61.0 62.8
Sou : (HIES-2000), BBS
rce
010203040506070
Perc
enta
ge
National Barisal Chittagong Dhaka Khulna Rajshahi
Chart 13.2: Divisionwise rate of poverty
Using the lower poverty line Using the upper poverty line
147
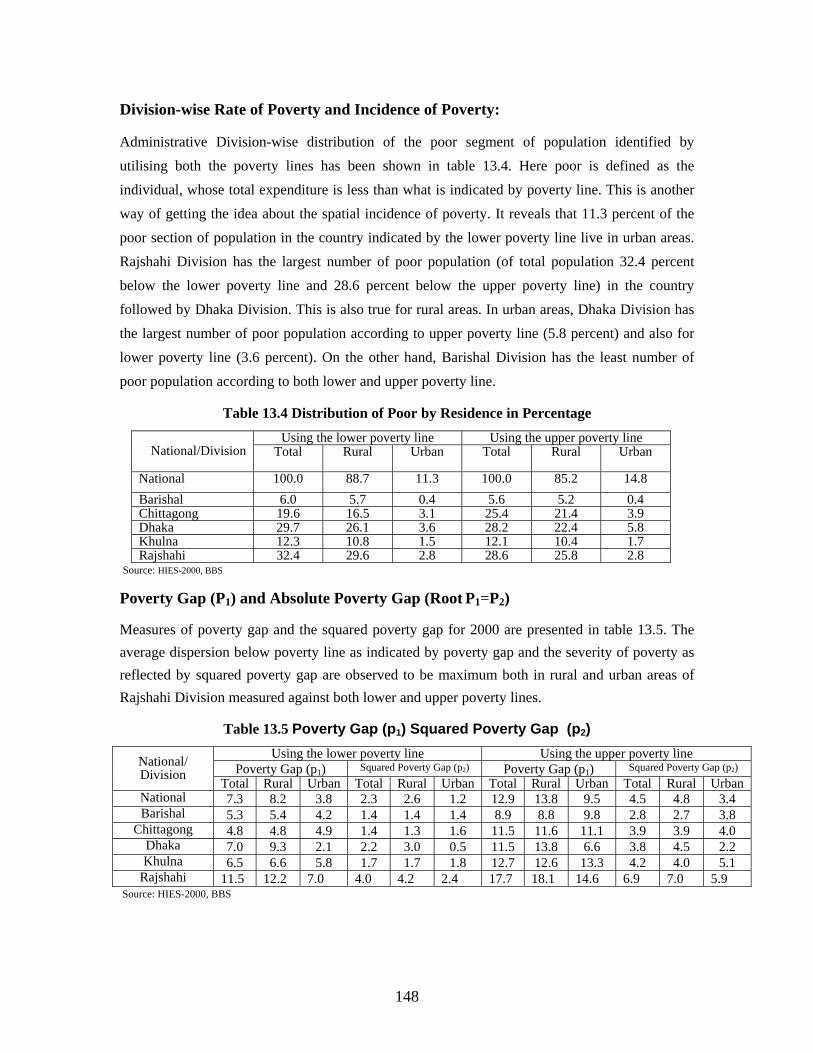
Division-wise Rate of Poverty and Incidence of Poverty:
Administrative Division-wise distribution of the poor segment of population identified by utilising both the poverty lines has been shown in table 13.4. Here poor is defined as the individual, whose total expenditure is less than what is indicated by poverty line. This is another way of getting the idea about the spatial incidence of poverty. It reveals that 11.3 percent of the poor section of population in the country indicated by the lower poverty line live in urban areas. Rajshahi Division has the largest number of poor population (of total population 32.4 percent below the lower poverty line and 28.6 percent below the upper poverty line) in the country followed by Dhaka Division. This is also true for rural areas. In urban areas, Dhaka Division has the largest number of poor population according to upper poverty line (5.8 percent) and also for lower poverty line (3.6 percent). On the other hand, Barishal Division has the least number of poor population according to both lower and upper poverty line.
Table 13.4 Distribution of Poor by Residence in Percentage
Using the lower poverty line Using the upper poverty line National/Division Total Rural Urban Total Rural Urban
National 100.0 88.7 11.3 100.0 85.2 14.8 Barishal 6.0 5.7 0.4 5.6 5.2 0.4 Chittagong 19.6 16.5 3.1 25.4 21.4 3.9 Dhaka 29.7 26.1 3.6 28.2 22.4 5.8 Khulna 12.3 10.8 1.5 12.1 10.4 1.7 Rajshahi 32.4 29.6 2.8 28.6 25.8 2.8
Source: HIES-2000, BBS
Poverty Gap (P1) and Absolute Poverty Gap (Root P1=P2)
Measures of poverty gap and the squared poverty gap for 2000 are presented in table 13.5. The average dispersion below poverty line as indicated by poverty gap and the severity of poverty as reflected by squared poverty gap are observed to be maximum both in rural and urban areas of Rajshahi Division measured against both lower and upper poverty lines.
Table 13.5 Poverty Gap (p1) Squared Poverty Gap (p2) Using the lower poverty line Using the upper poverty line
Poverty Gap (p1) Squared Poverty Gap (p2) Poverty Gap (p1) Squared Poverty Gap (p2) National/ Division Total Rural Urban Total Rural Urban Total Rural Urban Total Rural Urban National 7.3 8.2 3.8 2.3 2.6 1.2 12.9 13.8 9.5 4.5 4.8 3.4 Barishal 5.3 5.4 4.2 1.4 1.4 1.4 8.9 8.8 9.8 2.8 2.7 3.8
Chittagong 4.8 4.8 4.9 11.5 4.0 1.4 1.3 1.6 11.6 11.1 3.9 3.9 Dhaka 7.0 9.3 2.1 2.2 3.0 0.5 11.5 13.8 6.6 3.8 4.5 2.2 Khulna 6.5 6.6 5.8 1.7 1.7 1.8 12.7 12.6 13.3 4.2 4.0 5.1
Rajshahi 11.5 12.2 7.0 4.0 4.2 2.4 17.7 18.1 14.6 6.9 7.0 5.9 Source: HIES-2000, BBS
148
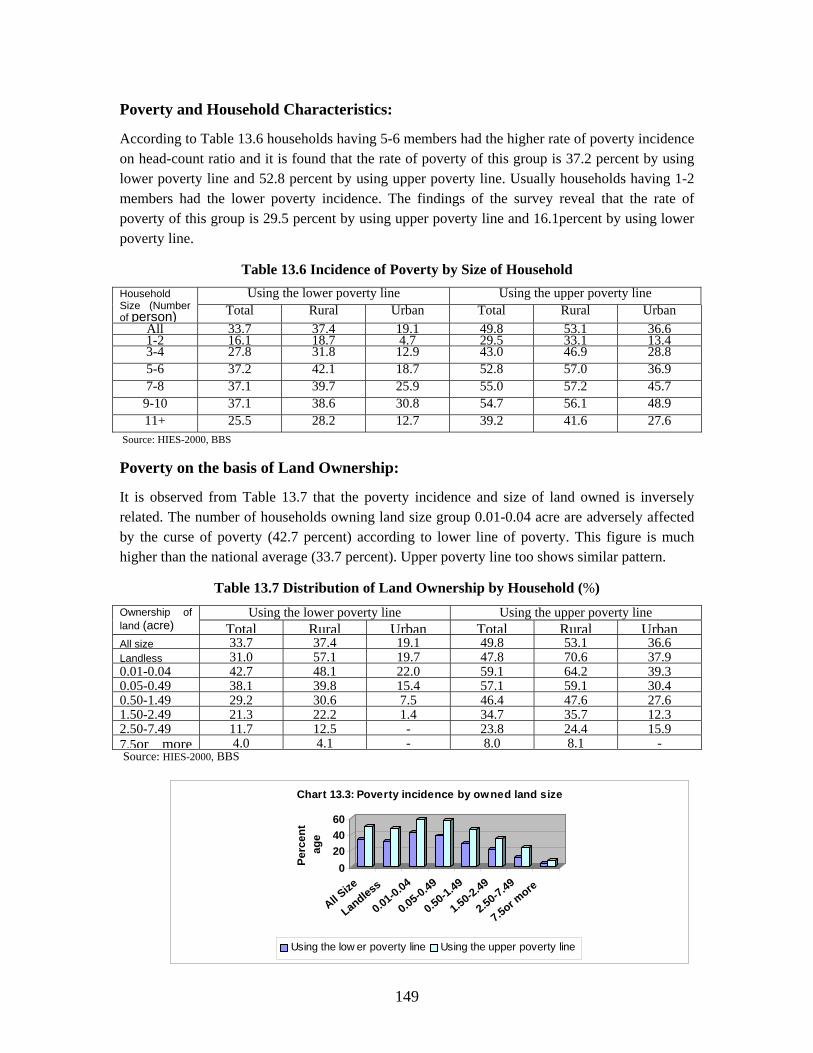
Poverty and Household Characteristics:
According to Table 13.6 households having 5-6 members had the higher rate of poverty incidence on head-count ratio and it is found that the rate of poverty of this group is 37.2 percent by using lower poverty line and 52.8 percent by using upper poverty line. Usually households having 1-2 members had the lower poverty incidence. The findings of the survey reveal that the rate of poverty of this group is 29.5 percent by using upper poverty line and 16.1percent by using lower poverty line.
Table 13.6 Incidence of Poverty by Size of Household Using the lower poverty line Using the upper poverty line Household
Size (Number of person) Total Rural Urban Total Rural Urban
All 33.7 37.4 19.1 49.8 53.1 36.61-2 16.1 18.7 4.7 29.5 33.1 13.43-4 27.8 31.8 12.9 43.0 46.9 28.8 5-6 37.2 42.1 18.7 52.8 57.0 36.9 7-8 37.1 39.7 25.9 55.0 57.2 45.7
9-10 37.1 38.6 30.8 54.7 56.1 48.9 11+ 25.5 28.2 12.7 39.2 41.6 27.6
Source: HIES-2000, BBS
Poverty on the basis of Land Ownership:
It is observed from Table 13.7 that the poverty incidence and size of land owned is inversely related. The number of households owning land size group 0.01-0.04 acre are adversely affected by the curse of poverty (42.7 percent) according to lower line of poverty. This figure is much higher than the national average (33.7 percent). Upper poverty line too shows similar pattern.
Table 13.7 Distribution of Land Ownership by Household (%)
Using the lower poverty line Using the upper poverty line Ownership of land (acre) Total Rural Urban Total Rural UrbanAll size 33.7 37.4 19.1 49.8 53.1 36.6Landless 31.0 57.1 19.7 47.8 70.6 37.90.01-0.04 42.7 48.1 22.0 59.1 64.2 39.30.05-0.49 38.1 39.8 15.4 57.1 59.1 30.40.50-1.49 29.2 30.6 7.5 46.4 47.6 27.61.50-2.49 21.3 22.2 1.4 34.7 35.7 12.32.50-7.49 11.7 12.5 - 23.8 24.4 15.97.5or more 4.0 4.1 - 8.0 8.1 - Source: HIES-2000, BBS
0204060
Perc
ent
age
All Size
Landless
0.01-0.04
0.05-0.49
0.50-1.49
1.50-2.49
2.50-7.49
7.5or more
Chart 13.3: Poverty incidence by owned land size
Using the low er poverty line Using the upper poverty line
149
Incidence of Poverty According to Occupation:
Incidence of poverty by main occupation of head of households has been presented in Table 13.8. It is observed from the table that at the national level, by using the lower poverty line, the highest incidence of poverty (39.9 percent) exists in the households where the occupation of the head relates to agriculture, forest and fisheries. To the contrary, the lowest incidence of poverty (4.9 percent) was observed in households with head in administrative and managerial work. On the other hand, for urban areas using the upper poverty line the highest incidence (55.2 percent) of poverty was observed in the case of service sector workers, and lowest (7.7 percent) for households with head in administrative and managerial works. There exists rural and urban variation in incidence of poverty by occupation. In the rural area (using the upper poverty line), the highest incidence (56.3 percent) was observed in households belonging to agriculture, forest and fisheries and the lowest in the households with head in administrative and managerial works (23.0 percent). On the other hand, using the same poverty line, the highest incidence was observed in the case of service workers (53.5 percent) and lowest for households with head in administrative and managerial works (1.9 percent) in the urban areas.
Table 13.8 Incidence of Poverty and Main Occupation of Household
Using the lower poverty line Using the upper poverty line Occupation National Rural Urban National Rural Urban Total 33.7 37.4 19.1 49.8 53.1 36.6 Professional, Technical and Related 18.8 21.9 12.0 32.7 35.5 26.6 Administration and Managerial Work 4.9 12.7 1.9 7.7 23.0 1.9
Clinical Related Works & Govt. 33.1 40.5 22.0 48.6 54.8 39.2
Sales Worker 22.6 27.3 14.6 39.4 45.2 29.4
Service Workers 35.9 39.4 29.6 55.2 56.2 53.5
Agri., Forestry and Fisheries 39.9 40.6 25.0 56.0 56.3 49.3
Production,Trans. & Related Works 31.2 37.2 20.0 48.5 53.4 39.1
Head not Working 22.2 26.5 10.7 31.3 36.1 18.2
Source: HIES-2000, BBS
Per Capita Income:
As shown in Table 13.9, the per capita income of the poor below poverty line is the highest in Barisal division (Tk. 545.32), which is slightly above the national average. Considering upper poverty line, it is the highest in Khulna division (Tk. 641.07). Per capita income of the poor is found lowest in Rajshahi division (Tk. 468.89 and Tk. 526.44 respectively) measured against both lower and upper poverty line.
150
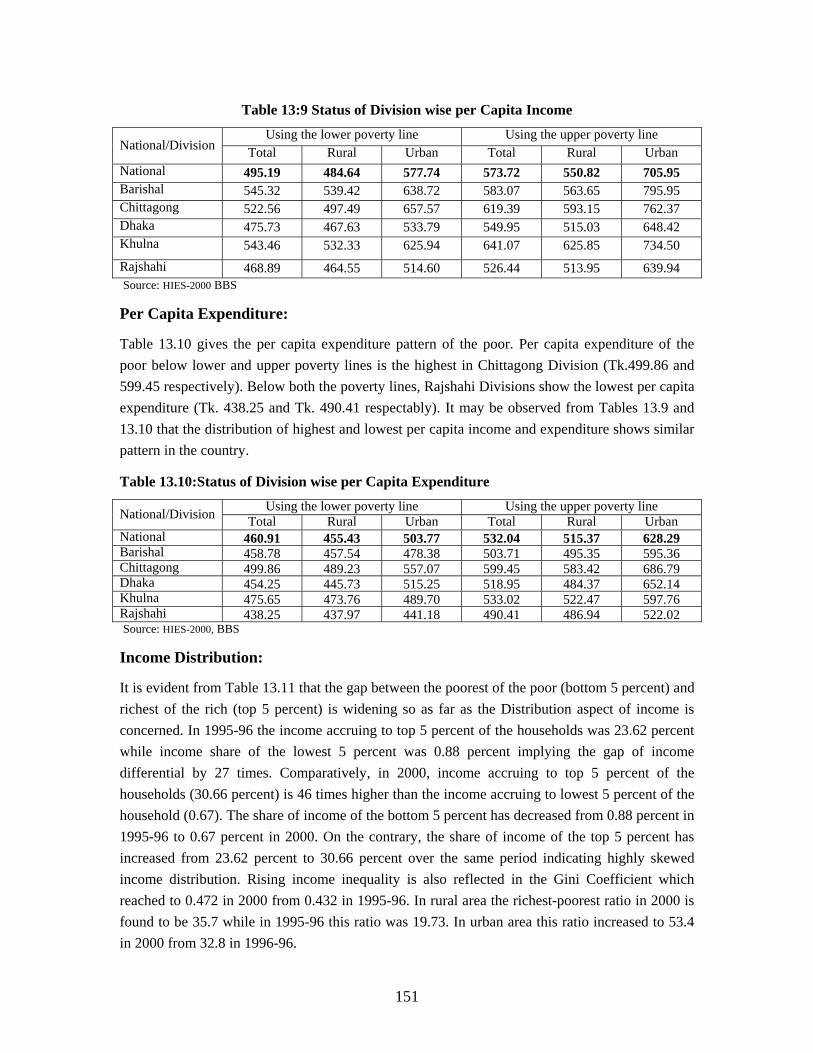
Table 13:9 Status of Division wise per Capita Income
Using the lower poverty line Using the upper poverty line National/Division Total Rural Urban Total Rural Urban National 495.19 484.64 577.74 573.72 550.82 705.95 Barishal 545.32 539.42 638.72 583.07 563.65 795.95 Chittagong 522.56 497.49 657.57 619.39 593.15 762.37 Dhaka 475.73 467.63 533.79 549.95 515.03 648.42 Khulna 543.46 532.33 625.94 641.07 625.85 734.50 Rajshahi 468.89 464.55 514.60 526.44 513.95 639.94 Source: HIES-2000 BBS
Per Capita Expenditure:
Table 13.10 gives the per capita expenditure pattern of the poor. Per capita expenditure of the poor below lower and upper poverty lines is the highest in Chittagong Division (Tk.499.86 and 599.45 respectively). Below both the poverty lines, Rajshahi Divisions show the lowest per capita expenditure (Tk. 438.25 and Tk. 490.41 respectably). It may be observed from Tables 13.9 and 13.10 that the distribution of highest and lowest per capita income and expenditure shows similar pattern in the country.
Table 13.10:Status of Division wise per Capita Expenditure
Using the lower poverty line Using the upper poverty line National/Division Total Rural Urban Total Rural Urban National 460.91 455.43 503.77 532.04 515.37 628.29Barishal 458.78 457.54 478.38 503.71 495.35 595.36Chittagong 499.86 489.23 557.07 599.45 583.42 686.79Dhaka 454.25 445.73 515.25 518.95 484.37 652.14Khulna 475.65 473.76 489.70 533.02 522.47 597.76Rajshahi 438.25 437.97 441.18 490.41 486.94 522.02 Source: HIES-2000, BBS
Income Distribution:
It is evident from Table 13.11 that the gap between the poorest of the poor (bottom 5 percent) and richest of the rich (top 5 percent) is widening so as far as the Distribution aspect of income is concerned. In 1995-96 the income accruing to top 5 percent of the households was 23.62 percent while income share of the lowest 5 percent was 0.88 percent implying the gap of income differential by 27 times. Comparatively, in 2000, income accruing to top 5 percent of the households (30.66 percent) is 46 times higher than the income accruing to lowest 5 percent of the household (0.67). The share of income of the bottom 5 percent has decreased from 0.88 percent in 1995-96 to 0.67 percent in 2000. On the contrary, the share of income of the top 5 percent has increased from 23.62 percent to 30.66 percent over the same period indicating highly skewed income distribution. Rising income inequality is also reflected in the Gini Coefficient which reached to 0.472 in 2000 from 0.432 in 1995-96. In rural area the richest-poorest ratio in 2000 is found to be 35.7 while in 1995-96 this ratio was 19.73. In urban area this ratio increased to 53.4 in 2000 from 32.8 in 1996-96.
151
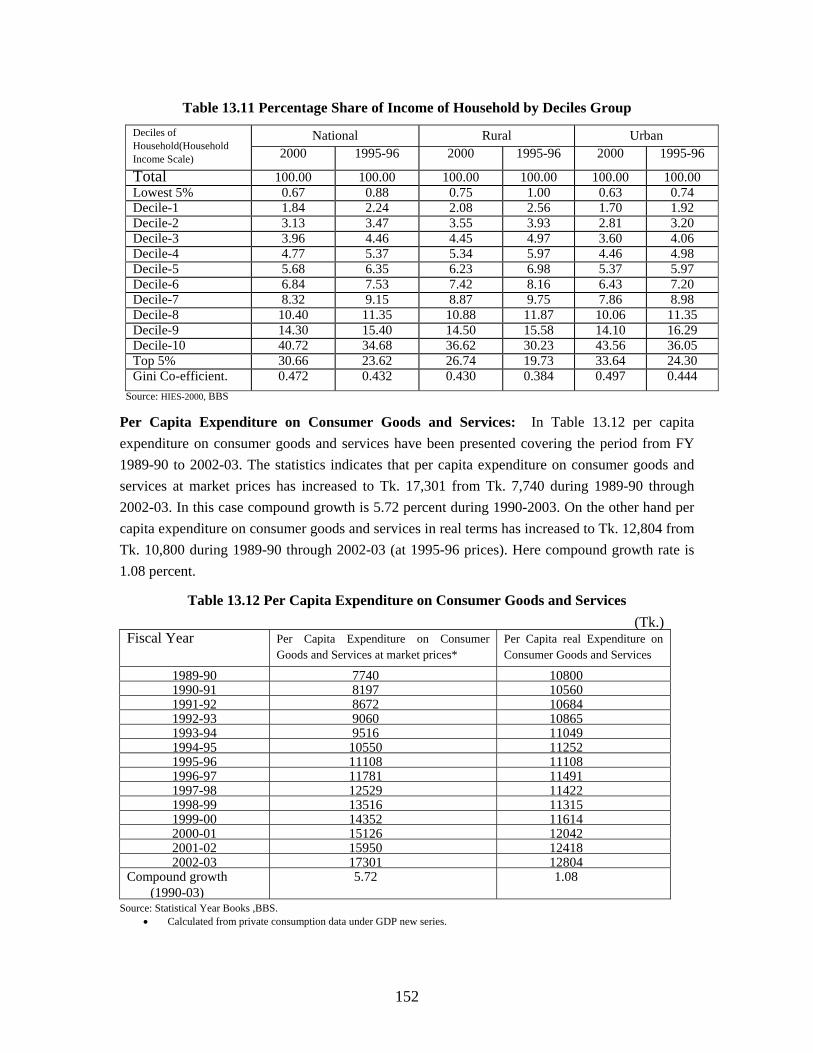
Table 13.11 Percentage Share of Income of Household by Deciles Group
National Rural Urban Deciles of Household(Household Income Scale) 2000 1995-96 2000 1995-96 2000 1995-96
Total 100.00 100.00 100.00 100.00 100.00 100.00 Lowest 5% 0.67 0.88 0.75 1.00 0.63 0.74 Decile-1 1.84 2.24 2.08 2.56 1.70 1.92 Decile-2 3.13 3.47 3.55 3.93 2.81 3.20 Decile-3 3.96 4.46 4.45 4.97 3.60 4.06 Decile-4 4.77 5.37 5.34 5.97 4.46 4.98 Decile-5 5.68 6.35 6.23 6.98 5.37 5.97 Decile-6 6.84 7.53 7.42 8.16 6.43 7.20 Decile-7 8.32 9.15 8.87 9.75 7.86 8.98 Decile-8 10.40 11.35 10.88 11.87 10.06 11.35 Decile-9 14.30 15.40 14.50 15.58 14.10 16.29 Decile-10 40.72 34.68 36.62 30.23 43.56 36.05 Top 5% 30.66 23.62 26.74 19.73 33.64 24.30 Gini Co-efficient. 0.472 0.432 0.430 0.384 0.497 0.444
Source: HIES-2000, BBS
Per Capita Expenditure on Consumer Goods and Services: In Table 13.12 per capita expenditure on consumer goods and services have been presented covering the period from FY 1989-90 to 2002-03. The statistics indicates that per capita expenditure on consumer goods and services at market prices has increased to Tk. 17,301 from Tk. 7,740 during 1989-90 through 2002-03. In this case compound growth is 5.72 percent during 1990-2003. On the other hand per capita expenditure on consumer goods and services in real terms has increased to Tk. 12,804 from Tk. 10,800 during 1989-90 through 2002-03 (at 1995-96 prices). Here compound growth rate is 1.08 percent.
Table 13.12 Per Capita Expenditure on Consumer Goods and Services (Tk.) Fiscal Year Per Capita Expenditure on Consumer
Goods and Services at market prices* Per Capita real Expenditure on Consumer Goods and Services
1989-90 7740 10800 1990-91 8197 10560 1991-92 8672 10684 1992-93 9060 10865 1993-94 9516 11049 1994-95 10550 11252 1995-96 11108 11108 1996-97 11781 11491 1997-98 12529 11422 1998-99 13516 11315 1999-00 14352 11614 2000-01 15126 12042 2001-02 15950 12418 2002-03 17301 12804
Compound growth (1990-03)
5.72 1.08
Source: Statistical Year Books ,BBS. • Calculated from private consumption data under GDP new series.
152
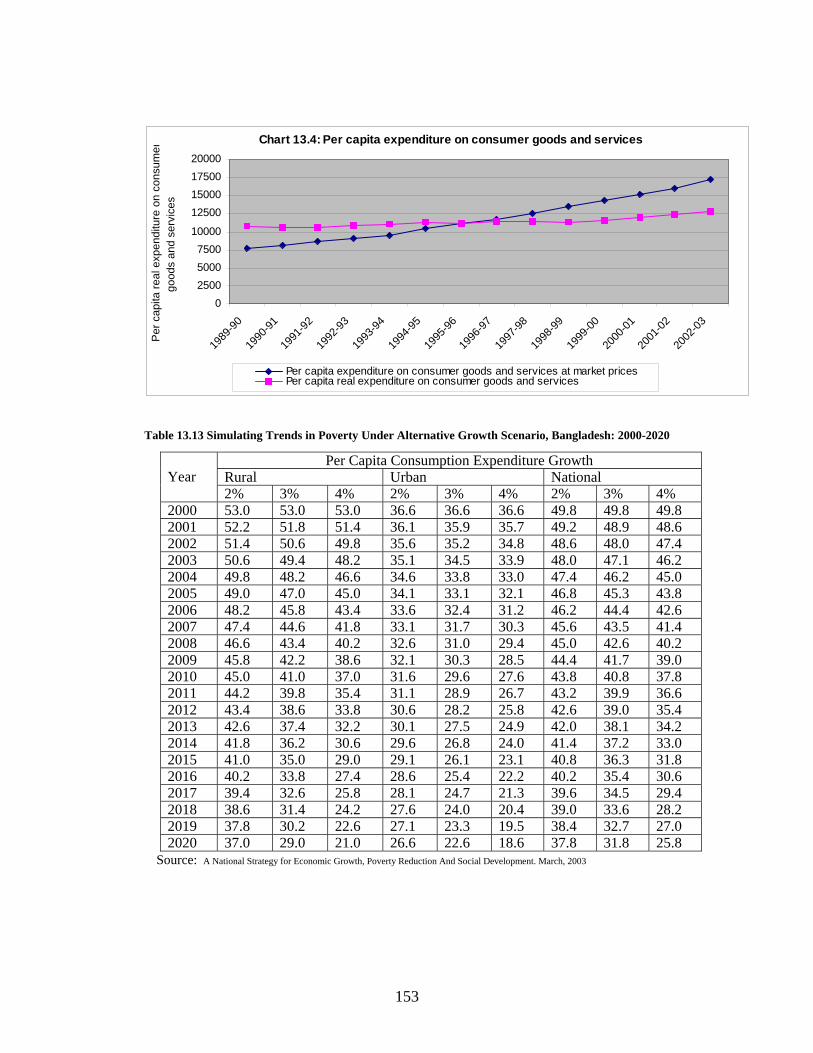
Chart 13.4: Per capita expenditure on consumer goods and services
0250050007500
10000
12500150001750020000
1989
-90
1990
-91
1991
-92
1992
-93
1993
-94
1994
-95
1995
-96
1996
-97
1997
-98
1998
-99
1999
-00
2000
-01
2001
-02
2002
-03
Per
cap
ita re
al e
xpen
ditu
re o
n co
nsum
ergo
ods
and
serv
ices
Per capita expenditure on consumer goods and services at market pricesPer capita real expenditure on consumer goods and services
Table 13.13 Simulating Trends in Poverty Under Alternative Growth Scenario, Bangladesh: 2000-2020
Per Capita Consumption Expenditure Growth Rural Urban National Year 2% 3% 4% 2% 3% 4% 2% 3% 4%
2000 53.0 53.0 53.0 36.6 36.6 36.6 49.8 49.8 49.8 2001 52.2 51.8 51.4 36.1 35.9 35.7 49.2 48.9 48.6 2002 51.4 50.6 49.8 35.6 35.2 34.8 48.6 48.0 47.4 2003 50.6 49.4 48.2 35.1 34.5 33.9 48.0 47.1 46.2 2004 49.8 48.2 46.6 34.6 33.8 33.0 47.4 46.2 45.0 2005 49.0 47.0 45.0 34.1 33.1 32.1 46.8 45.3 43.8 2006 48.2 45.8 43.4 33.6 32.4 31.2 46.2 44.4 42.6 2007 47.4 44.6 41.8 33.1 31.7 30.3 45.6 43.5 41.4 2008 46.6 43.4 40.2 32.6 31.0 29.4 45.0 42.6 40.2 2009 45.8 42.2 38.6 32.1 30.3 28.5 44.4 41.7 39.0 2010 45.0 41.0 37.0 31.6 29.6 27.6 43.8 40.8 37.8 2011 44.2 39.8 35.4 31.1 28.9 26.7 43.2 39.9 36.6 2012 43.4 38.6 33.8 30.6 28.2 25.8 42.6 39.0 35.4 2013 42.6 37.4 32.2 30.1 27.5 24.9 42.0 38.1 34.2 2014 41.8 36.2 30.6 29.6 26.8 24.0 41.4 37.2 33.0 2015 41.0 35.0 29.0 29.1 26.1 23.1 40.8 36.3 31.8 2016 40.2 33.8 27.4 28.6 25.4 22.2 40.2 35.4 30.6 2017 39.4 32.6 25.8 28.1 24.7 21.3 39.6 34.5 29.4 2018 38.6 31.4 24.2 27.6 24.0 20.4 39.0 33.6 28.2 2019 37.8 30.2 22.6 27.1 23.3 19.5 38.4 32.7 27.0 2020 37.0 29.0 21.0 26.6 22.6 18.6 37.8 31.8 25.8
Source: A National Strategy for Economic Growth, Poverty Reduction And Social Development. March, 2003
153
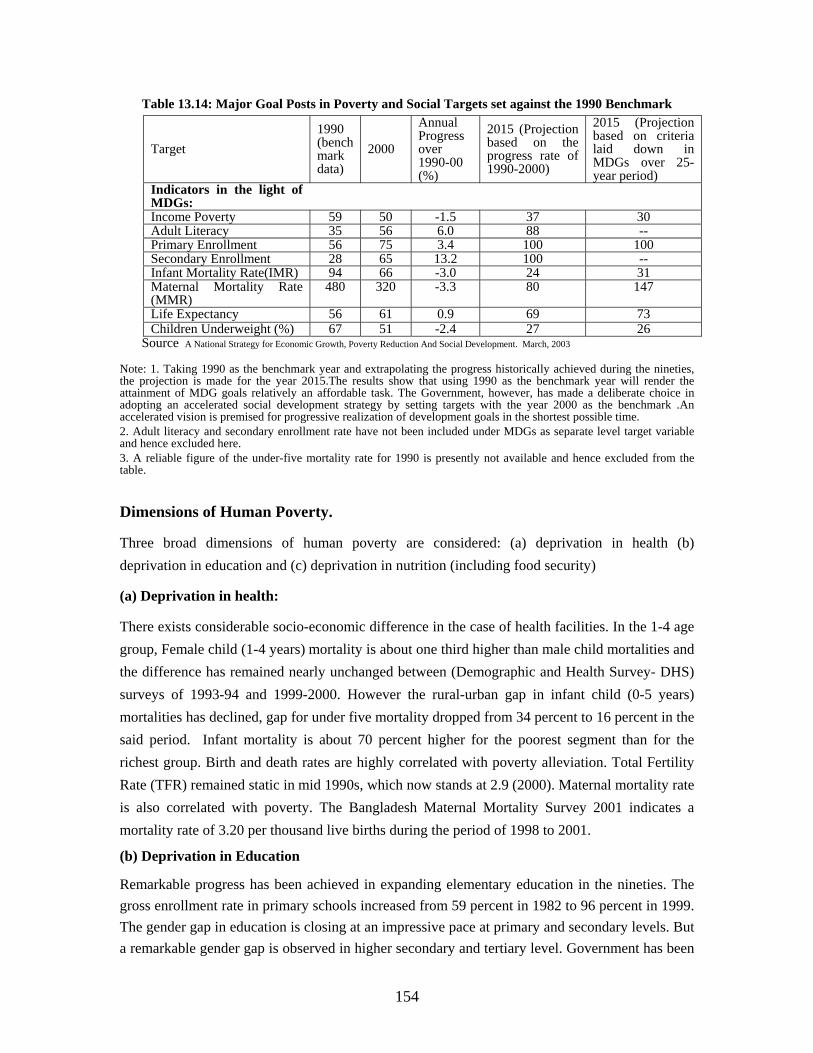
Table 13.14: Major Goal Posts in Poverty and Social Targets set against the 1990 Benchmark
Target 1990 (bench mark data)
2000
Annual Progress over 1990-00 (%)
2015 (Projection based on the progress rate of 1990-2000)
2015 (Projection based on criteria laid down in MDGs over 25-year period)
Indicators in the light of MDGs:
Income Poverty 59 50 -1.5 37 30 Adult Literacy 35 56 6.0 88 -- Primary Enrollment 56 75 3.4 100 100 Secondary Enrollment 28 65 13.2 100 -- Infant Mortality Rate(IMR) 94 66 -3.0 24 31 Maternal Mortality Rate (MMR)
480 320 -3.3 80 147
Life Expectancy 56 61 0.9 69 73 Children Underweight (%) 67 51 -2.4 27 26
Source A National Strategy for Economic Growth, Poverty Reduction And Social Development. March, 2003
Note: 1. Taking 1990 as the benchmark year and extrapolating the progress historically achieved during the nineties, the projection is made for the year 2015.The results show that using 1990 as the benchmark year will render the attainment of MDG goals relatively an affordable task. The Government, however, has made a deliberate choice in adopting an accelerated social development strategy by setting targets with the year 2000 as the benchmark .An accelerated vision is premised for progressive realization of development goals in the shortest possible time. 2. Adult literacy and secondary enrollment rate have not been included under MDGs as separate level target variable and hence excluded here. 3. A reliable figure of the under-five mortality rate for 1990 is presently not available and hence excluded from the table.
Dimensions of Human Poverty.
Three broad dimensions of human poverty are considered: (a) deprivation in health (b) deprivation in education and (c) deprivation in nutrition (including food security)
(a) Deprivation in health:
There exists considerable socio-economic difference in the case of health facilities. In the 1-4 age group, Female child (1-4 years) mortality is about one third higher than male child mortalities and the difference has remained nearly unchanged between (Demographic and Health Survey- DHS) surveys of 1993-94 and 1999-2000. However the rural-urban gap in infant child (0-5 years) mortalities has declined, gap for under five mortality dropped from 34 percent to 16 percent in the said period. Infant mortality is about 70 percent higher for the poorest segment than for the richest group. Birth and death rates are highly correlated with poverty alleviation. Total Fertility Rate (TFR) remained static in mid 1990s, which now stands at 2.9 (2000). Maternal mortality rate is also correlated with poverty. The Bangladesh Maternal Mortality Survey 2001 indicates a mortality rate of 3.20 per thousand live births during the period of 1998 to 2001.
(b) Deprivation in Education
Remarkable progress has been achieved in expanding elementary education in the nineties. The gross enrollment rate in primary schools increased from 59 percent in 1982 to 96 percent in 1999. The gender gap in education is closing at an impressive pace at primary and secondary levels. But a remarkable gender gap is observed in higher secondary and tertiary level. Government has been
154
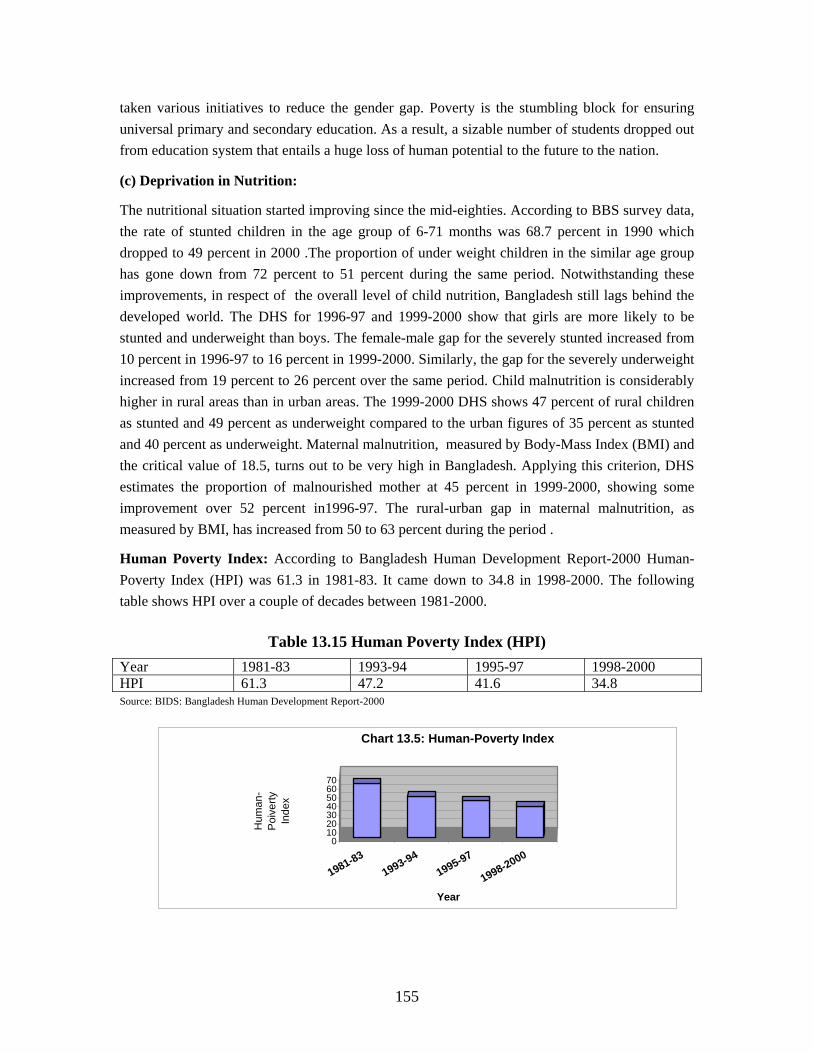
taken various initiatives to reduce the gender gap. Poverty is the stumbling block for ensuring universal primary and secondary education. As a result, a sizable number of students dropped out from education system that entails a huge loss of human potential to the future to the nation.
(c) Deprivation in Nutrition:
The nutritional situation started improving since the mid-eighties. According to BBS survey data, the rate of stunted children in the age group of 6-71 months was 68.7 percent in 1990 which dropped to 49 percent in 2000 .The proportion of under weight children in the similar age group has gone down from 72 percent to 51 percent during the same period. Notwithstanding these improvements, in respect of the overall level of child nutrition, Bangladesh still lags behind the developed world. The DHS for 1996-97 and 1999-2000 show that girls are more likely to be stunted and underweight than boys. The female-male gap for the severely stunted increased from 10 percent in 1996-97 to 16 percent in 1999-2000. Similarly, the gap for the severely underweight increased from 19 percent to 26 percent over the same period. Child malnutrition is considerably higher in rural areas than in urban areas. The 1999-2000 DHS shows 47 percent of rural children as stunted and 49 percent as underweight compared to the urban figures of 35 percent as stunted and 40 percent as underweight. Maternal malnutrition, measured by Body-Mass Index (BMI) and the critical value of 18.5, turns out to be very high in Bangladesh. Applying this criterion, DHS estimates the proportion of malnourished mother at 45 percent in 1999-2000, showing some improvement over 52 percent in1996-97. The rural-urban gap in maternal malnutrition, as measured by BMI, has increased from 50 to 63 percent during the period .
Human Poverty Index: According to Bangladesh Human Development Report-2000 Human- Poverty Index (HPI) was 61.3 in 1981-83. It came down to 34.8 in 1998-2000. The following table shows HPI over a couple of decades between 1981-2000.
Table 13.15 Human Poverty Index (HPI)
Year 1981-83 1993-94 1995-97 1998-2000 HPI 61.3 47.2 41.6 34.8 Source: BIDS: Bangladesh Human Development Report-2000
Chart 13.5: Human-Poverty Index
010203040506070
Hum
an-
Poi
verty
In
dex
1981-831993-94
1995-97
1998-2000
Year
155
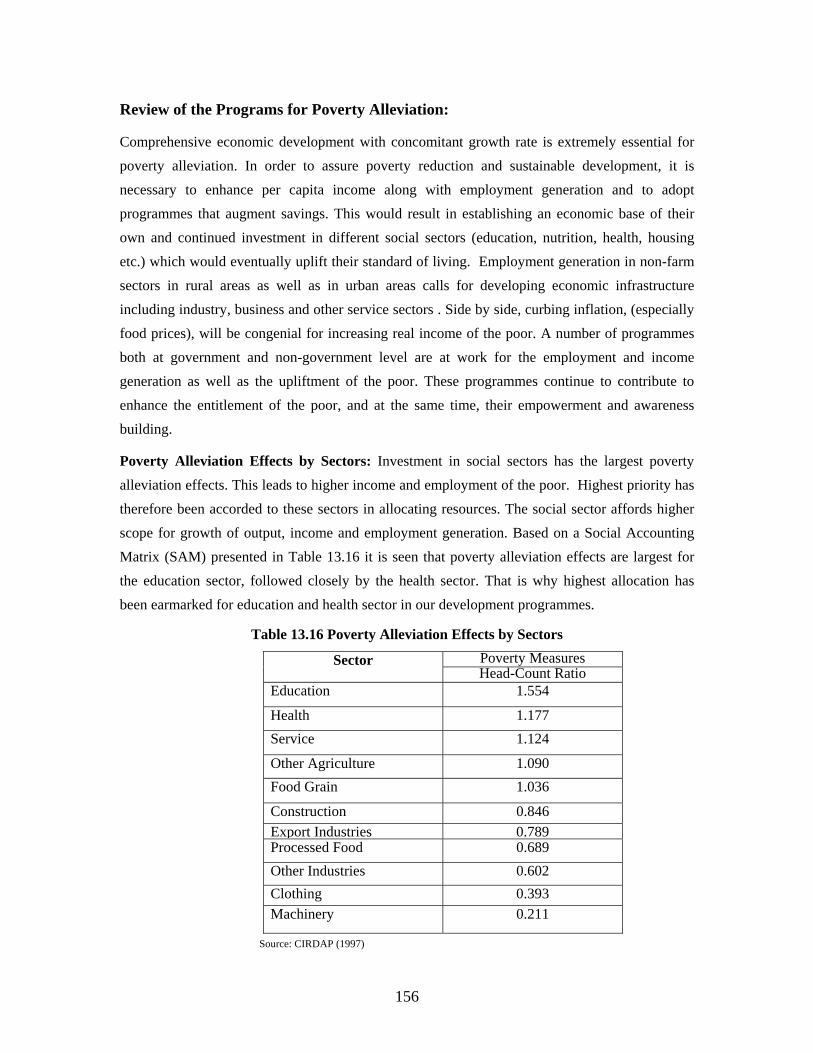
Review of the Programs for Poverty Alleviation:
Comprehensive economic development with concomitant growth rate is extremely essential for poverty alleviation. In order to assure poverty reduction and sustainable development, it is necessary to enhance per capita income along with employment generation and to adopt programmes that augment savings. This would result in establishing an economic base of their own and continued investment in different social sectors (education, nutrition, health, housing etc.) which would eventually uplift their standard of living. Employment generation in non-farm sectors in rural areas as well as in urban areas calls for developing economic infrastructure including industry, business and other service sectors . Side by side, curbing inflation, (especially food prices), will be congenial for increasing real income of the poor. A number of programmes both at government and non-government level are at work for the employment and income generation as well as the upliftment of the poor. These programmes continue to contribute to enhance the entitlement of the poor, and at the same time, their empowerment and awareness building.
Poverty Alleviation Effects by Sectors: Investment in social sectors has the largest poverty alleviation effects. This leads to higher income and employment of the poor. Highest priority has therefore been accorded to these sectors in allocating resources. The social sector affords higher scope for growth of output, income and employment generation. Based on a Social Accounting Matrix (SAM) presented in Table 13.16 it is seen that poverty alleviation effects are largest for the education sector, followed closely by the health sector. That is why highest allocation has been earmarked for education and health sector in our development programmes.
Table 13.16 Poverty Alleviation Effects by Sectors Poverty Measures Sector Head-Count Ratio
Education 1.554
Health 1.177 Service 1.124
Other Agriculture 1.090 Food Grain 1.036
Construction 0.846 Export Industries 0.789Processed Food 0.689 Other Industries 0.602 Clothing 0.393 Machinery 0.211
Source: CIRDAP (1997)
156
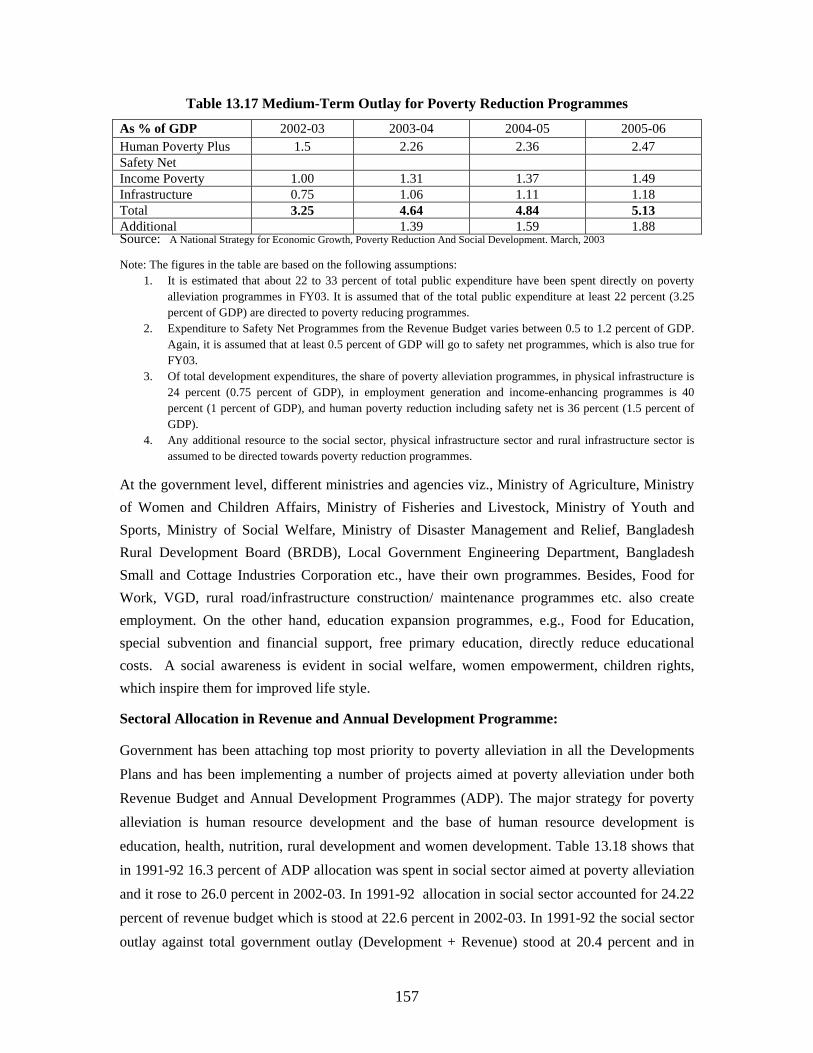
Table 13.17 Medium-Term Outlay for Poverty Reduction Programmes
As % of GDP 2002-03 2003-04 2004-05 2005-06 Human Poverty Plus 1.5 2.26 2.36 2.47 Safety Net Income Poverty 1.00 1.31 1.37 1.49 Infrastructure 0.75 1.06 1.11 1.18 Total 3.25 4.64 4.84 5.13 Additional 1.39 1.59 1.88 Source: A National Strategy for Economic Growth, Poverty Reduction And Social Development. March, 2003 Note: The figures in the table are based on the following assumptions:
1. It is estimated that about 22 to 33 percent of total public expenditure have been spent directly on poverty alleviation programmes in FY03. It is assumed that of the total public expenditure at least 22 percent (3.25 percent of GDP) are directed to poverty reducing programmes.
2. Expenditure to Safety Net Programmes from the Revenue Budget varies between 0.5 to 1.2 percent of GDP. Again, it is assumed that at least 0.5 percent of GDP will go to safety net programmes, which is also true for FY03.
3. Of total development expenditures, the share of poverty alleviation programmes, in physical infrastructure is 24 percent (0.75 percent of GDP), in employment generation and income-enhancing programmes is 40 percent (1 percent of GDP), and human poverty reduction including safety net is 36 percent (1.5 percent of GDP).
4. Any additional resource to the social sector, physical infrastructure sector and rural infrastructure sector is assumed to be directed towards poverty reduction programmes.
At the government level, different ministries and agencies viz., Ministry of Agriculture, Ministry of Women and Children Affairs, Ministry of Fisheries and Livestock, Ministry of Youth and Sports, Ministry of Social Welfare, Ministry of Disaster Management and Relief, Bangladesh Rural Development Board (BRDB), Local Government Engineering Department, Bangladesh Small and Cottage Industries Corporation etc., have their own programmes. Besides, Food for Work, VGD, rural road/infrastructure construction/ maintenance programmes etc. also create employment. On the other hand, education expansion programmes, e.g., Food for Education, special subvention and financial support, free primary education, directly reduce educational costs. A social awareness is evident in social welfare, women empowerment, children rights, which inspire them for improved life style.
Sectoral Allocation in Revenue and Annual Development Programme:
Government has been attaching top most priority to poverty alleviation in all the Developments Plans and has been implementing a number of projects aimed at poverty alleviation under both Revenue Budget and Annual Development Programmes (ADP). The major strategy for poverty alleviation is human resource development and the base of human resource development is education, health, nutrition, rural development and women development. Table 13.18 shows that in 1991-92 16.3 percent of ADP allocation was spent in social sector aimed at poverty alleviation and it rose to 26.0 percent in 2002-03. In 1991-92 allocation in social sector accounted for 24.22 percent of revenue budget which is stood at 22.6 percent in 2002-03. In 1991-92 the social sector outlay against total government outlay (Development + Revenue) stood at 20.4 percent and in
157
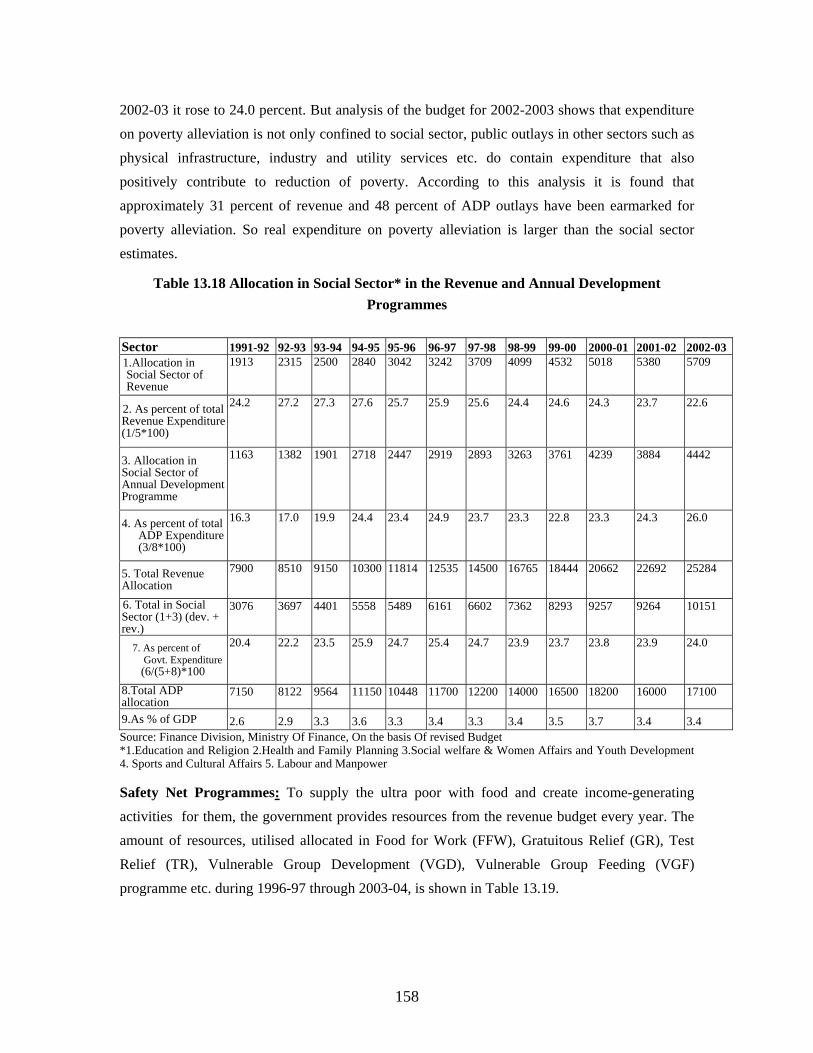
2002-03 it rose to 24.0 percent. But analysis of the budget for 2002-2003 shows that expenditure on poverty alleviation is not only confined to social sector, public outlays in other sectors such as physical infrastructure, industry and utility services etc. do contain expenditure that also positively contribute to reduction of poverty. According to this analysis it is found that approximately 31 percent of revenue and 48 percent of ADP outlays have been earmarked for poverty alleviation. So real expenditure on poverty alleviation is larger than the social sector estimates.
Table 13.18 Allocation in Social Sector* in the Revenue and Annual Development Programmes
Sector 1991-92 92-93 93-94 94-95 95-96 96-97 97-98 98-99 99-00 2000-01 2001-02 2002-031.Allocation in Social Sector of Revenue
1913 2315 2500 2840 3042 3242 3709 4099 4532 5018 5380 5709
2. As percent of total Revenue Expenditure (1/5*100)
24.2 27.2 27.3 27.6 25.7 25.9 25.6 24.4 24.6 24.3 23.7 22.6
3. Allocation in Social Sector of Annual Development Programme
1163 1382 1901 2718 2447 2919 2893 3263 3761 4239 3884 4442
4. As percent of total ADP Expenditure (3/8*100)
16.3 17.0 19.9 24.4 23.4 24.9 23.7 23.3 22.8 23.3 24.3 26.0
5. Total Revenue Allocation
7900 8510 9150 10300 11814 12535 14500 16765 18444 20662 22692 25284
6. Total in Social Sector (1+3) (dev. + rev.)
3076 3697 4401 5558 5489 9264 6161 6602 7362 8293 9257 10151
7. As percent of Govt. Expenditure
(6/(5+8)*100
20.4 22.2 23.5 23.8 25.9 24.7 25.4 24.7 23.9 23.7 23.9 24.0
8.Total ADP allocation
7150 8122 9564 11150 10448 11700 12200 14000 16500 18200 16000 17100
9.As % of GDP 2.6 2.9 3.3 3.6 3.3 3.4 3.3 3.4 3.5 3.7 3.4 3.4 Source: Finance Division, Ministry Of Finance, On the basis Of revised Budget *1.Education and Religion 2.Health and Family Planning 3.Social welfare & Women Affairs and Youth Development 4. Sports and Cultural Affairs 5. Labour and Manpower
Safety Net Programmes: To supply the ultra poor with food and create income-generating activities for them, the government provides resources from the revenue budget every year. The amount of resources, utilised allocated in Food for Work (FFW), Gratuitous Relief (GR), Test Relief (TR), Vulnerable Group Development (VGD), Vulnerable Group Feeding (VGF) programme etc. during 1996-97 through 2003-04, is shown in Table 13.19.
158
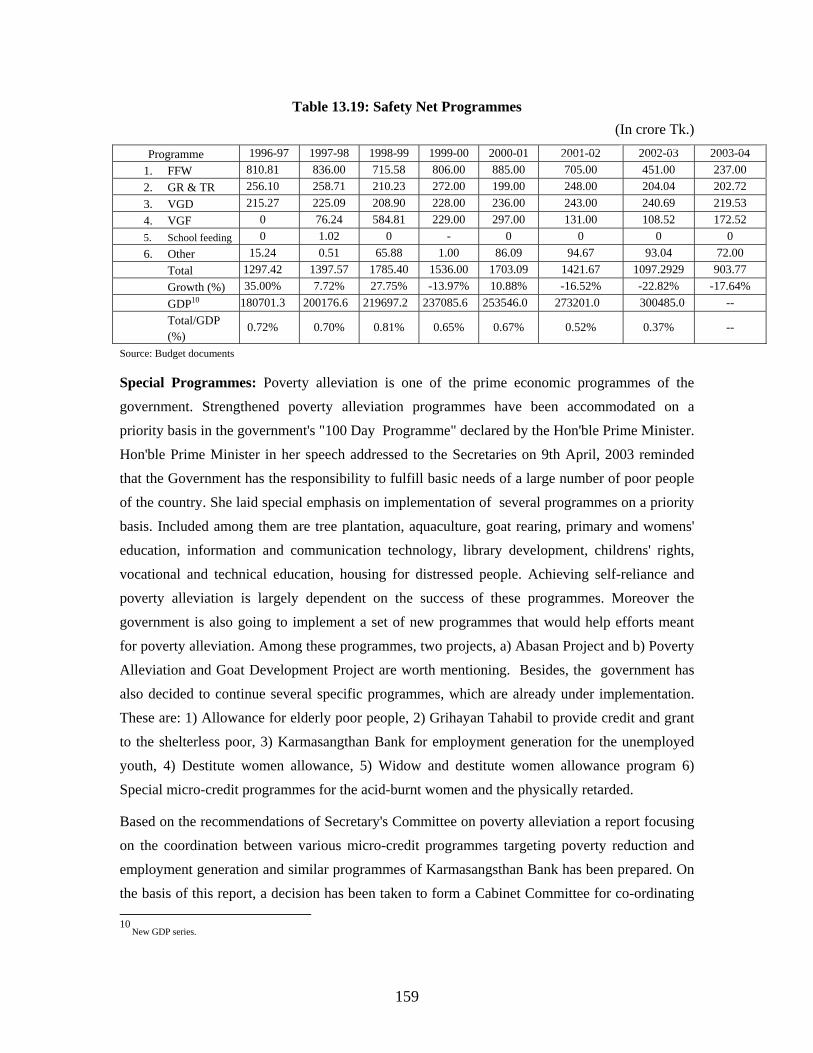
Table 13.19: Safety Net Programmes (In crore Tk.)
Programme 1996-97 1997-98 1998-99 1999-00 2000-01 2001-02 2002-03 2003-04 810.81 836.00 715.58 806.00 885.00 705.00 451.00 237.00 1. FFW 256.10 258.71 210.23 272.00 199.00 248.00 204.04 202.72 2. GR & TR 215.27 225.09 208.90 228.00 236.00 243.00 240.69 219.53 3. VGD
0 76.24 584.81 229.00 297.00 131.00 108.52 172.52 4. VGF 0 1.02 0 - 0 0 0 0 5. School feeding
6. Other 15.24 0.51 65.88 1.00 86.09 94.67 93.04 72.00 Total 1297.42 1397.57 1785.40 1536.00 1703.09 1421.67 1097.2929 903.77 Growth (%) 35.00% 7.72% 27.75% -13.97% 10.88% -16.52% -22.82% -17.64% GDP10 180701.3 200176.6 219697.2 237085.6 253546.0 273201.0 300485.0 -- Total/GDP (%)
0.72% 0.70% 0.81% 0.65% 0.67% 0.52% 0.37% --
Source: Budget documents
Special Programmes: Poverty alleviation is one of the prime economic programmes of the government. Strengthened poverty alleviation programmes have been accommodated on a priority basis in the government's "100 Day Programme" declared by the Hon'ble Prime Minister. Hon'ble Prime Minister in her speech addressed to the Secretaries on 9th April, 2003 reminded that the Government has the responsibility to fulfill basic needs of a large number of poor people of the country. She laid special emphasis on implementation of several programmes on a priority basis. Included among them are tree plantation, aquaculture, goat rearing, primary and womens' education, information and communication technology, library development, childrens' rights, vocational and technical education, housing for distressed people. Achieving self-reliance and poverty alleviation is largely dependent on the success of these programmes. Moreover the government is also going to implement a set of new programmes that would help efforts meant for poverty alleviation. Among these programmes, two projects, a) Abasan Project and b) Poverty Alleviation and Goat Development Project are worth mentioning. Besides, the government has also decided to continue several specific programmes, which are already under implementation. These are: 1) Allowance for elderly poor people, 2) Grihayan Tahabil to provide credit and grant to the shelterless poor, 3) Karmasangthan Bank for employment generation for the unemployed youth, 4) Destitute women allowance, 5) Widow and destitute women allowance program 6) Special micro-credit programmes for the acid-burnt women and the physically retarded.
Based on the recommendations of Secretary's Committee on poverty alleviation a report focusing on the coordination between various micro-credit programmes targeting poverty reduction and employment generation and similar programmes of Karmasangsthan Bank has been prepared. On the basis of this report, a decision has been taken to form a Cabinet Committee for co-ordinating 10 New GDP series.
159
the micro-credit programmes at government and non-government levels. Besides, a decision has also been taken to examine the feasibility of initiating micro-credit programmes in other scheduled commercial banks for Small Enterprises Development similar to those undertaken by Agrani Bank.
Poverty alleviation and Goat Development Project:
Local Black Bengal goat is one of the most important animal resources. Eighty percent of the total goat population in the country are reared by the rural poor. Government has taken a national programme on ''poverty alleviation by goat rearing'' in consideration of its economic and social importance for poverty alleviation, self-employment, enhancing supply of nutritions and expanding export industries on leather and meat processing. Five-Year (2002-03 to 2006-07) Action Plan has been formulated by a task force comprising representative from both government and non-government organisations for implementation of this program all over the country. It is noteworthy that the contribution of this animal resource to our national economy is about Tk.500 crore per year. Consequently, the existing number of 14.8 million goat population is expected to increase to 53.33 million during next five years according to Action Plan target. In order to increase the goat population 20,000 small farmrs (2-5 goat) and 4,000 intensive farmers (>25 goat) will be provided support during 2003. The number of farmers will increase to 1,00,000 and 12,000 respectively during the five years. 10,000 goats will be distributed as donation among rural distressed women and poor farmer. On the basis of number of goats each farmer will get Tk.5000 to Tk.15, 000 as micro-credit from government organisation and farmers having a number of goats above 25 will get Tk.50,000 from bank as credit with lower interest rate. The total project expenditure has been estimated at Tk.208.41 crore and the number of beneficiaries of the projects will be 2.6 lakh.
Widow and Distressed Women Allowance Programme:
There is an ongoing programme for providing allowance to the helpless and the distressed women. Under this program, 4 lakh distressed women have been provided with such allowance in 4,479 unions of 461 upazilas during the period from 1998 to 1999. In July 2002 the number of unions had been increased to 4,488. Similarly the number of 'C' category Pourashavas had been increased to 152. Besides, 62 'A' and 40 'B' category Pourashavas have been included in the allowance programme. In 2002-03 the number of beneficiaries per ward has been increased to 6 from 5 persons. In the case of 'C' category Pourashava the number of beneficiaries is 11 per ward while in 'A' & 'B' category Pourashava the number is 10 per ward and the total number of beneficiaries is 2,66,580. To accommodate, these beneficiaries the allocation has been raised to Tk. 40 crore from 25 crore in the budget of FY 2002-03.
160
Old age allowance:
An old age allowance is being provided to 10 oldest poor persons of whom at least 5 must be women from each ward of every union in the country. In this way more than 4 lakh poor elderly people are being benefited in 4,479 unions of 461 upzilas and 135 municipalties of 'C' category. Ministry of Social Welfare/ Department of Social Services is responsible for implementation of the programme. There were provisions of Tk. 26 crore and Tk. 49 crore for this purpose in the budget of FY1997-98 and 1998-99 respectively. From July 2002 the number beneficiary unions has been increased to 4488. Similarly the number of beneficiaries under "C' category Pourashava has been increased to 152. Besides 62 'A' category 40 'B' category Pourashavas have been are brought under this programme. The number of beneficiaries increased has been to 12 from 10 per ward in FY 2002-03. This year the number of total beneficiaries is 4,99,662. Out of the total number of beneficiaries, 10 beneficiaries have been drawn from each ward under 'C' category pourasavas, 2 beneficiaries have been drawn from each ward under 'B' category pourasavas, 1 beneficiary has been drawn from each ward under 'A' category pourasava. In the current year, budget allocation has been raised to Tk.75 crore from Tk.50 crore.
Special Micro credit Programmes for Acid-burn and the Physically disabled:
Government has allocated a total of Tk. 40 crores for implementation of the programme for Mitigation of Risk of Natural Disaster and the programme on Rehabilitation of Acid-burnt Women and the physically handicapped during FY 2002-03 under Revenue Budget. Of the total allocation the programme on Mitigation of Risk of Natural Disaster accounts Tk. 25.00 crore while Tk. 15.00 crore goes to the programme on Rehabilitation of Acid-burnt Women and the physically handicapped. Under this programme 22,000 persons affected by natural calamities and 15,000 Acid-burnt and physically handicapped persons will be benefited. Present government has decided to establish safe home in each of the 6 Divisions as custodian of women, children and girl who are presently under custody of Thana Hazat and Jail. Under the Hon'ble Prime Minister's directive special Micro credit programme for the development of disabled has been introduced. Disabled persons will be selected by the DSS/Disabled Foundation, each will be provided with maximum credit up to Tk. 50,000 under this programme without collateral security for their self employment creation and raising the standard of living.
Grihayan Tahabil (Housing Fund): Grihayan Tahabil, a specific programme for poverty alleviation, has been introduced to solve the housing problem of the homeless, poor and low-income people in the country. The government allocated an initial amount of Tk.50.00 crore in the budget of FY 1997-98. By now, the amount of the Tahabil has been raised to Tk. 98.00 crore. As of June, 2003 an allocation to the tune of Tk. 83.70 crore was made to finance the rural
161
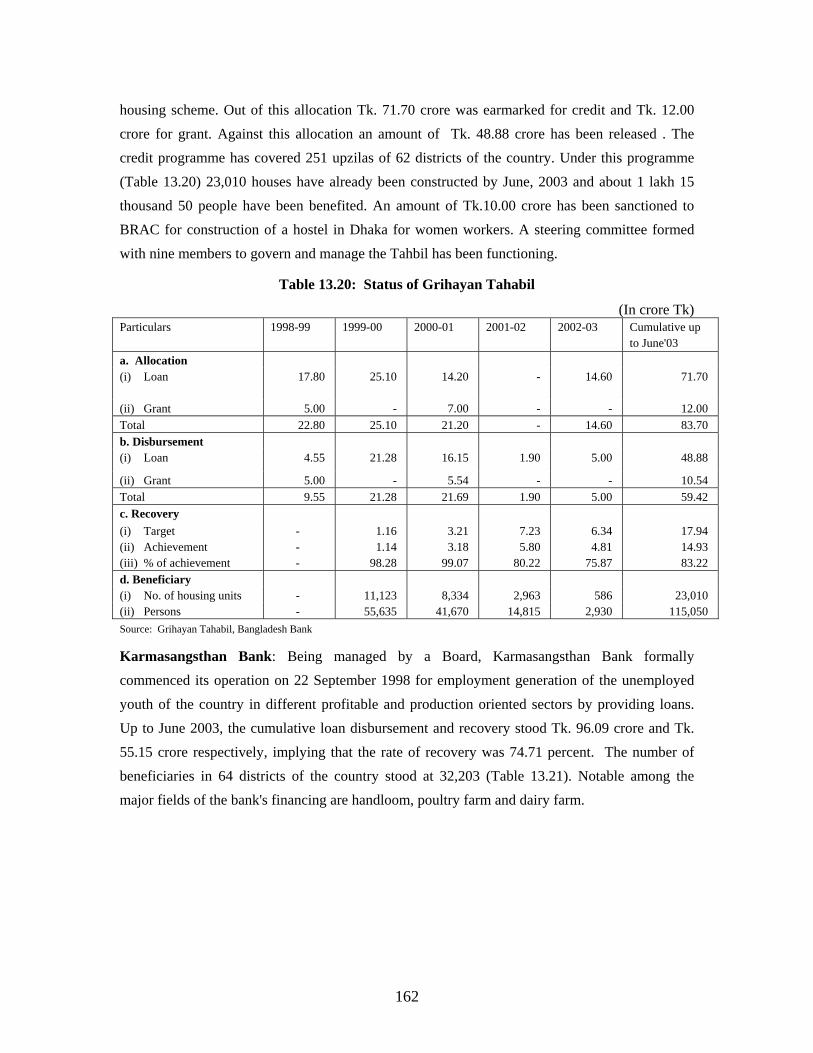
housing scheme. Out of this allocation Tk. 71.70 crore was earmarked for credit and Tk. 12.00 crore for grant. Against this allocation an amount of Tk. 48.88 crore has been released . The credit programme has covered 251 upzilas of 62 districts of the country. Under this programme (Table 13.20) 23,010 houses have already been constructed by June, 2003 and about 1 lakh 15 thousand 50 people have been benefited. An amount of Tk.10.00 crore has been sanctioned to BRAC for construction of a hostel in Dhaka for women workers. A steering committee formed with nine members to govern and manage the Tahbil has been functioning.
Table 13.20: Status of Grihayan Tahabil
(In crore Tk) Particulars 1998-99 1999-00 2000-01
2001-02 2002-03
Cumulative up to June'03
a. Allocation (i) Loan 17.80 25.10 14.20 - 14.60 71.70
(ii) Grant 5.00 - 7.00 - - 12.00 Total 22.80 25.10 21.20 - 14.60 83.70 b. Disbursement (i) Loan 4.55 21.28 16.15 1.90 5.00 48.88
(ii) Grant 5.00 - 5.54 - - 10.54 Total 9.55 21.28 21.69 1.90 5.00 59.42 c. Recovery (i) Target - 1.16 3.21 7.23 6.34 17.94 (ii) Achievement - 1.14 3.18 5.80 4.81 14.93 (iii) % of achievement - 98.28 99.07 80.22 75.87 83.22 d. Beneficiary (i) No. of housing units - 11,123 8,334 2,963 586 23,010 (ii) Persons - 55,635 41,670 14,815 2,930 115,050 Source: Grihayan Tahabil, Bangladesh Bank
Karmasangsthan Bank: Being managed by a Board, Karmasangsthan Bank formally commenced its operation on 22 September 1998 for employment generation of the unemployed youth of the country in different profitable and production oriented sectors by providing loans. Up to June 2003, the cumulative loan disbursement and recovery stood Tk. 96.09 crore and Tk. 55.15 crore respectively, implying that the rate of recovery was 74.71 percent. The number of beneficiaries in 64 districts of the country stood at 32,203 (Table 13.21). Notable among the major fields of the bank's financing are handloom, poultry farm and dairy farm.
162
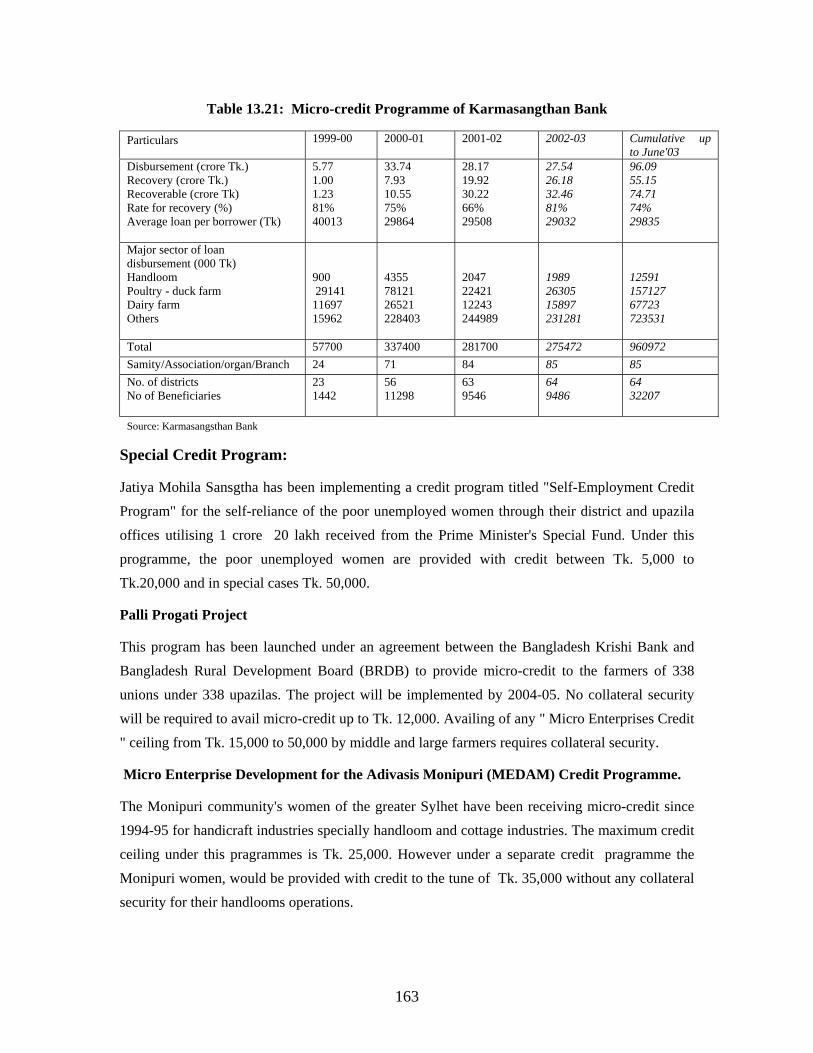
Table 13.21: Micro-credit Programme of Karmasangthan Bank
Particulars 1999-00 2000-01
2001-02
2002-03
Cumulative up to June'03
Disbursement (crore Tk.) Recovery (crore Tk.) Recoverable (crore Tk) Rate for recovery (%) Average loan per borrower (Tk)
5.77 1.00 1.23 81% 40013
33.74 7.93 10.55 75% 29864
28.17 19.92 30.22 66% 29508
27.54 26.18 32.46 81% 29032
96.09 55.15 74.71 74% 29835
Major sector of loan disbursement (000 Tk) Handloom Poultry - duck farm Dairy farm Others
900 29141 11697 15962
4355 78121 26521 228403
2047 22421 12243 244989
1989 26305 15897 231281
12591 157127 67723 723531
Total 57700 337400 281700 275472 960972 Samity/Association/organ/Branch 24 71 84 85 85 No. of districts No of Beneficiaries
23 1442
56 11298
63 9546
64 9486
64 32207
Source: Karmasangsthan Bank
Special Credit Program:
Jatiya Mohila Sansgtha has been implementing a credit program titled "Self-Employment Credit Program" for the self-reliance of the poor unemployed women through their district and upazila offices utilising 1 crore 20 lakh received from the Prime Minister's Special Fund. Under this programme, the poor unemployed women are provided with credit between Tk. 5,000 to Tk.20,000 and in special cases Tk. 50,000.
Palli Progati Project
This program has been launched under an agreement between the Bangladesh Krishi Bank and Bangladesh Rural Development Board (BRDB) to provide micro-credit to the farmers of 338 unions under 338 upazilas. The project will be implemented by 2004-05. No collateral security will be required to avail micro-credit up to Tk. 12,000. Availing of any " Micro Enterprises Credit " ceiling from Tk. 15,000 to 50,000 by middle and large farmers requires collateral security.
Micro Enterprise Development for the Adivasis Monipuri (MEDAM) Credit Programme.
The Monipuri community's women of the greater Sylhet have been receiving micro-credit since 1994-95 for handicraft industries specially handloom and cottage industries. The maximum credit ceiling under this pragrammes is Tk. 25,000. However under a separate credit pragramme the Monipuri women, would be provided with credit to the tune of Tk. 35,000 without any collateral security for their handlooms operations.
163
Special Credit Programme for the Rakhain Community of Cox's Bazar.
A good number of people from the Rakhain Community produce and sell different handicrafts and products of cottage industry. They have been availing maximum credit facilities up to Tk. 25,000 per person under landless and marginal farmers credit programme operated by bank. Under a separate credit programme, however, they will be provided with credit up to a maximum limit of Tk. 30,000 without collateral security.
ABASHAN (Poverty Alleviation & Rehabilitation) PROJECT:
This project has been launched by the Prime Minister's Office for poverty alleviation as part of the electoral commitment of the Government. This is being implemented under the direct supervision & guidance of the Hon'ble Prime Minister. This project will be implemented over a period of four years (July 2002- June 2006) at a cost of Tk. 447 crore. Abasan project aims to alleviate poverty by providing land accommodation, training, credit, education, health service, family planning, income-generating activities, pure drinking water, electricity, improved transportation system, facilities for tree plantation to 65,000 landless, homeless and destitute families. Under this project , the adult members of 65,000 families will be provided training for skill development, human development and awareness building at a cost of Tk. 15 crore. Again these families will be provided with a credit of Tk. 15,000 per family. An allocation of Tk. 35 crore has been made for the propose. In the current fiscal year this project will rehabilitate 25,000 families. Already a proposals for establishing 127 Abasan villages has been approved by the Hon'ble Prime Minister. Once these villages are established 7,663 families will be rehabilitated. Armed Forces Division 'in aid of civil power' will implement the construction work of this project. Once implemented at the joint initiative of both the civil administration and armed forces, above three lakh people of 65 thousand families will be directly benefited. They will get their own accommodation and employment, which in the process, will augment their income and improve their living standard. Above all, if the project is implemented successfully by June 2006, this will greatly contribute to the reduction of rural poverty.
Rural Infrastructure Development Programme:
Local Government Engineering Department (LGED): This Department under the Ministry of Local Government, Rural Development and Cooperatives has been implementing various infrastructure projects, especially rural roads, bridges/culverts, growth centres, construction of embankment project etc., for employment generation in the rural areas. Thus employment for about 89.52 crore man days has been created during 1991-92 through 2002-03. During this period, a total of 72,237 km (earth road 45,664 km and paved road 26,573 km) B-type feeder road and rural road and 3,60,415 m bridges/culverts have been constructed. Besides, 1,549 growth centres have been developed. 640 UP complexes have been constructed and plantation has been carried out along 11,304 km roadside. These programmes have generated employment for 7.50 crore man days up to June, 2003 of FY 2002-03 (Table 13.22).
164
Table 13.22: Rural Infrastructure Development Programme under LGED
Activities Cumulative up to June '98
1998-99 1999-00 2000-01 2001-02
2002-03
Cumulative (up to J une '03)
Earth Road (km) 14844 5888 5525 10102 4555 4,750 45,664
Paved road (km) 11621 1946 2142 3870 3255 3,739 26,573
Bridge/Culvert (metre) 118876 34757 46448 67449 50882 42,003 3,60,415
Growth Centre (no) 693 213 176 225 124 118 1549
Employment Generation (lakh man days)
3464.31 1141.34 1565.95 1173.00 856.68 750 8951.87
Source: LGED
Urban Poverty Reduction Programme: The government has been implementing Urban Infrastructure Development Programme for urban poverty alleviation, and simultaneously continuing the micro-credit programme too. To increase the family income of the selected slum dwellers in 4 city corporations and 21 municipalities, LGED has disbursed about Tk. 2.50 crore as revolving loan under Slum Development Project assisted by United Nations Children's Emergency Fund (UNICEF). The revolving loan fund provided from this project later increased to Tk. 3.22 crore, which is again utilised as revolving loan fund in 'Urban Basic Service Delivery' Project supervised by the relevant city corporations and municipalities. In the light of the experiences gained from the above-mentioned projects, the relevant city corporations and municipalities have been managing revolving loan fund activities for poverty alleviation . Besides, LGED has been disbursing micro-credit for self-employment generation through Secondary Town Infrastructure Development Project-2, Urban Poverty Alleviation Project through Local Partnership and Integrated Food Security Programme aided by United States Agency for International Development (USAID). An amount of Tk. 4.88 crore has been disbursed as micro-credit to 14,061 families of 119 slums in 22 municipalities since 1995-96 under Secondary Town Infrastructure Development Project-2 and Tk. 19.61 crore has been disbursed as revolving loan to 33,243 families in the slum areas under Jessore, Tongi, Dinajpur and Mymensingh municipalities since 1999-00 under the said Integrated Food Security Programme.
Palli Daridrya Bimochan Foundation (PDBF): The objectives of the Palli Daridro Bimochon Foundation are to alleviate poverty and promote social and economic development of the poor and the disadvantaged. This foundation was established in April 30, 2000 with all assets and man-power of 139 Thana Assetless Central Cooperative Societies under Rural Development-12 Project of BRDB. Its goal was to strengthen economic and social development of the rural poor and disadvantaged people and promote gender equality. Currently the foundation is carrying out its operating in 149 upazilas of 21 districts where 3,31,397 assetless women and men have been organised into 66,279 groups. These upazilas constitute about one third of the geographical area of the country with the highest incidence of rural poverty. About 90 percent of the beneficiaries are women. PDBF disbursed successfully a total amount of Tk.149 crore among the members of
165
the societies during FY 2002-2003 under micro-credit program. Besides, the total amount of the savings of the beneficiaries is Tk. 46.45 crore and the recovery rate is 98 percent. To achieve PDBF's objectives, training has been imparted for human resource development for about 50 lakh mandays.
Bangladesh Rural Development Academy (BARD): BARD, Comilla has been implementing a project entitled “Small Farmers and Landless Labourers Development” in 30 upazilas of 8 districts in the country. Under the project, small farmers, landless labourers and poor women are being organised into non-formal groups. In addition the project provided training for skill development and credit support for income generation and capital formation. In total 82,396 members were enrolled in the project upto June, 2002 in 12,771 groups. Another project titled Comprehensive Village Development Program (CVDP) has been under implementation. Under this project 15,586 members have been enlisted upto January, 2003. BARD disbursed loan to the tune of Tk.82.26 crore up to June 2003 and the rate of recovery stood at 76.72 percent.
Rural Development Academy (Bogra): RDA, Bogra has been implementing Comprehensive Rural Development Project, and Primary Afforestation and Empowerment Project for poverty alleviation. The cumulative disbursement and recovery of credit under these projects stood at Tk. 8.68 crore and Tk. 8.54 crore respectively up to June, 2003.
Social Services Activities:
The Department of Social Services (DSS), has been implementing poverty reduction programmes through Rural Social Services (RSS), Urban Community Development (UCD) programme and Rural Maternity Center (RMC) in all upazilas and towns & thus making important contribution to the overall development of the country. Under these programmes revolving funds are used for initial investment and reinvestment. The initial total investment for these three programmes amounted to Tk.152.40 crore. The cumulative disbursement of these three programmes stood at Tk. 520.78 crore up to June, 2003, and the cumulative recovery was Tk. 474.59 crore implying that the rate of recovery stood at 91 percent. The total number of beneficiary families through these three programmes was 23,58,003. The number of beneficiaries through vocational training was 12,65,623 persons, through social activities was 2,46,573 persons and through literacy programmes was 14,67,905 persons. 5,76,300 persons have been imparted awareness on primary health care. 11,39,606 persons have been motivated to have small family 11,22,578 seedlings have been distributed for successful social forestry programmes.
Self-Employment of the Youth:
The Department of Youth Development (DYD) trained 21,14,939 young men and women during 1991-92 to FY 2002-03 under different programmes. Of the total trained youth 11,80,798 have got self-employed. A programme is being implemented for reducing poverty of rural landless and
166
poor people under the title "Family Based Employment Programme" in 82 upazilas under revenue budget. Since the commencement of the programme and up to June, 2003 a total number of 5,00,293 youth has been trained for the purpose of self-employment. Since the inception of the credit programme of the DYD till June, 2003 Tk.515.86 crore has been disbursed to 5,91,638 beneficiaries as credit. Average recovery rate of credit disbursed is 89.72 percent.
Activities of the Co-operative Department:
In order to improve the poverty situation of the country Co-operative Department with the spontaneous participation of the rural and urban lower and lower middle class people organised a total number of 1,40,927 societies up to June, 2003 and got them registrated. Among these 52,234 societies, the Cooperative Department through its direct supervision organised 43,87,636 individual cooperators. These societies have accumulated a fund amounting 351.13 crore through collection of shares, savings deposits from the members. The department has launched a project titled ''Strengthening of Co-operative Department and Development of Entrepreneurs through cooperative to create income generating employment for poverty alleviation". An amount of Tk.4.00 crore has been allocated during FY 2002-03 for this project and Tk.1.00 crore has been spent against various professional co-operative organisations from the allocation. The department has implemented ''Emergency Rehabilitation Project of Bangladesh National Fishermen Co-operative Society Ltd" to rehabilitate the cyclone and tidal bore affected poor fisherman of 14 coastal areas at a cost of Tk. 107.11 crore. The project provided 600 fishing boats and other fishing equipments to the fisherman. The recovery of loan disbursed by the project stood at Tk. 48.40 lakh.
Micro Credit Programmes
NGO Activities: In FY2001-02 the total number of NGOs registered with NGO Affairs Bureau for receiving foreign assistance were 1671 and the number of projects were 746. According to CDF statistics up to June, 2002 a total of 681 NGOs have been operating micro-finance programmes. The total number of beneficiaries are 1.27 crore with male and female 0.18 crore and 1.09 crore respectively. During the period cumulative disbursement among members was Tk. 18,733.92 crore. Rate of recovery was 97.17 percent. Total net savings was Tk. 1197.80 crore. Of the total disbursement 41.79 percent was invested in small business, 17.64 percent in livestock 12.31 percent in agriculture and 7.39 percent in fisheries. Six NGOs namely BRAC, ASA, Proshika, TMSS, Swanivar Bangladesh, CARITAS disbursed 80.67 percent of the total micro-credit. Out of this credit, 23.64 percent and 8.99 percent were received from Palli Karma Sahayak Foundation and local banks respectively (Table 13.23 and 13.24).
167
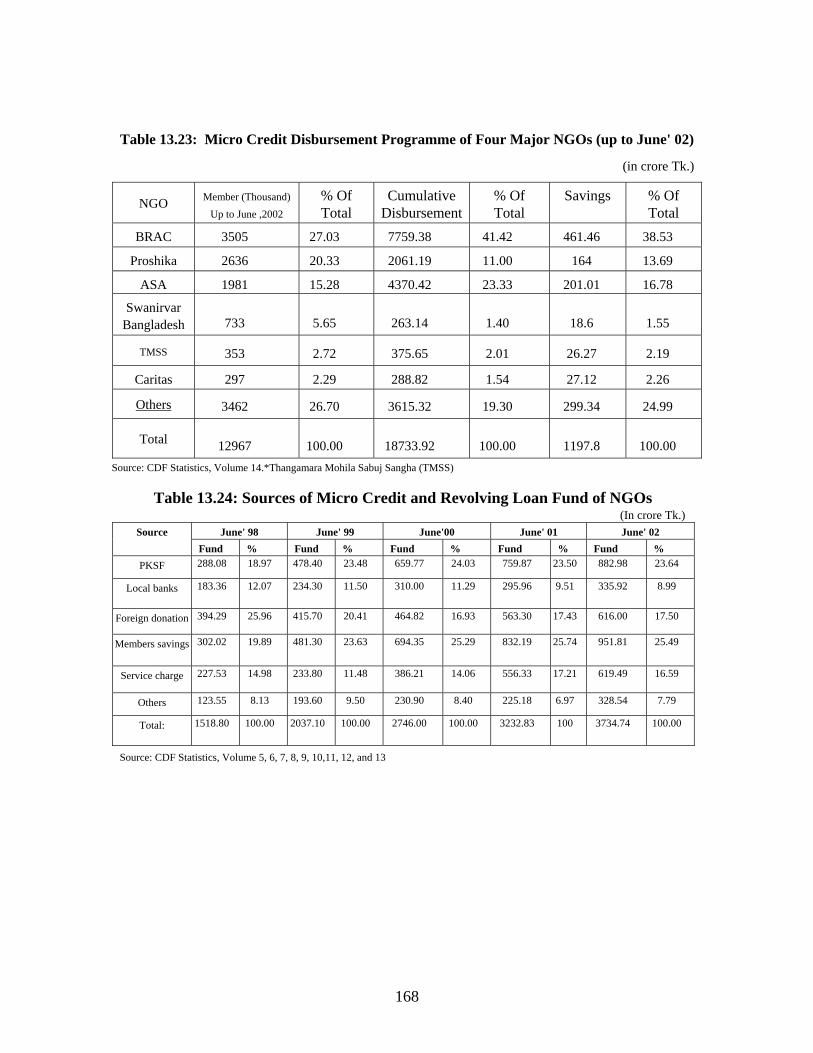
Table 13.23: Micro Credit Disbursement Programme of Four Major NGOs (up to June' 02)
(in crore Tk.)
NGO Member (Thousand) Up to June ,2002
% Of Total
Cumulative Disbursement
% Of Total
Savings % Of Total
BRAC 3505 27.03 7759.38 41.42 461.46 38.53
Proshika 2636 20.33 2061.19 11.00 164 13.69
ASA 1981 15.28 4370.42 23.33 201.01 16.78
Swanirvar Bangladesh 733 5.65 263.14 1.40 18.6 1.55
TMSS 353 2.72 375.65 2.01 26.27 2.19
Caritas 297 2.29 288.82 1.54 27.12 2.26
Others 3462 26.70 3615.32 19.30 299.34 24.99
Total 12967 100.00 18733.92 100.00 1197.8 100.00 Source: CDF Statistics, Volume 14.*Thangamara Mohila Sabuj Sangha (TMSS)
Table 13.24: Sources of Micro Credit and Revolving Loan Fund of NGOs (In crore Tk.)
June' 98 June' 99 June'00 June' 01 June' 02 Source Fund % Fund % Fund % Fund % Fund %
PKSF 288.08 18.97 478.40 23.48 659.77 24.03 759.87 23.50 882.98 23.64
Local banks 183.36 12.07 234.30 11.50 310.00 11.29 295.96 9.51 335.92 8.99
Foreign donation 394.29 25.96 415.70 20.41 464.82 16.93 563.30 17.43 616.00 17.50
Members savings 302.02 19.89 481.30 23.63 694.35 25.29 832.19 25.74 951.81 25.49
Service charge 227.53 14.98 233.80 11.48 386.21 14.06 556.33 17.21 619.49 16.59
Others 123.55 8.13 193.60 9.50 230.90 8.40 225.18 6.97 328.54 7.79
Total: 1518.80 100.00 2037.10 100.00 2746.00 100.00 3232.83 100 3734.74 100.00
Source: CDF Statistics, Volume 5, 6, 7, 8, 9, 10,11, 12, and 13
168
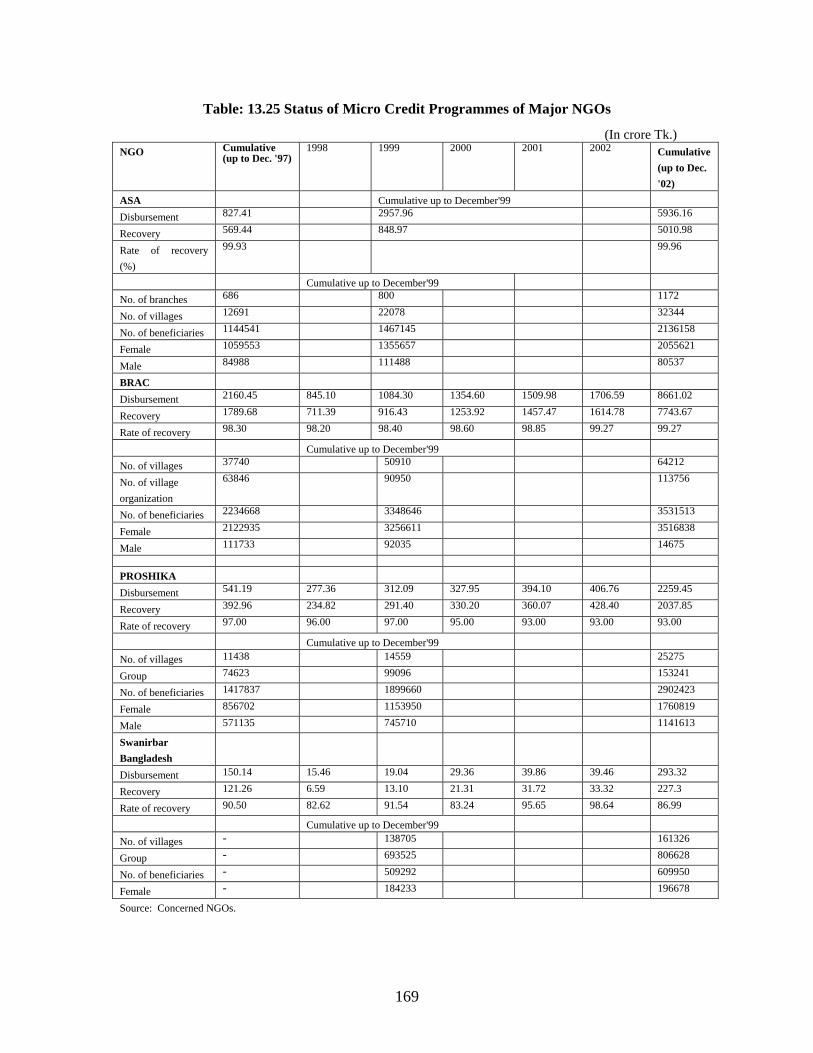
Table: 13.25 Status of Micro Credit Programmes of Major NGOs (In crore Tk.) NGO Cumulative
(up to Dec. '97) 1998 1999 2000 2001 2002 Cumulative
(up to Dec. '02)
ASA Cumulative up to December'99
Disbursement 827.41 2957.96 5936.16
Recovery 569.44 848.97 5010.98
Rate of recovery (%)
99.93 99.96
Cumulative up to December'99
No. of branches 686 800 1172
No. of villages 12691 22078 32344
No. of beneficiaries 1144541 1467145 2136158
Female 1059553 1355657 2055621
Male 84988 111488 80537
BRAC
Disbursement 2160.45 845.10 1084.30 1354.60 1509.98 1706.59 8661.02
Recovery 1789.68 711.39 916.43 1253.92 1457.47 1614.78 7743.67
Rate of recovery 98.30 98.20 98.40 98.60 98.85 99.27 99.27 Cumulative up to December'99
No. of villages 37740 50910 64212
No. of village organization
63846 90950 113756
No. of beneficiaries 2234668 3348646 3531513
Female 2122935 3256611 3516838
Male 111733 92035 14675 PROSHIKA
Disbursement 541.19 277.36 312.09 327.95 394.10 406.76 2259.45
Recovery 392.96 234.82 291.40 330.20 360.07 428.40 2037.85
Rate of recovery 97.00 96.00 97.00 95.00 93.00 93.00 93.00
Cumulative up to December'99
No. of villages 11438 14559 25275
Group 74623 99096 153241
No. of beneficiaries 1417837 1899660 2902423
Female 856702 1153950 1760819
Male 571135 745710 1141613
Swanirbar Bangladesh
Disbursement 150.14 15.46 19.04 29.36 39.86 39.46 293.32
Recovery 121.26 6.59 13.10 21.31 31.72 33.32 227.3
Rate of recovery 90.50 82.62 91.54 83.24 95.65 98.64 86.99 Cumulative up to December'99
No. of villages - 138705 161326
Group - 693525 806628
No. of beneficiaries - 509292 609950
Female - 184233 196678
Source: Concerned NGOs.
169
Bangladesh Rural Advancement Committee (BRAC): Established mainly for relief and rehabilitation activities in 1972, BRAC is, at present, operating in a range of areas such as credit disbursement, non-formal education for both children and adults, primary health care, legal counselling on women rights and so on. Up to December 2002, a total amount of Tk. 8861.02 crore has been disbursed as microcredit to about 35.31 lac beneficiaries (female 99 percent) in 460 upazilas of 64 districts, and the recovery rate is 99.27 percent (Table 13.25). The amount of savings of the beneficiary groups is Tk. 529.40 crore up to December 2002.
ASA: ASA has been operating micro credit programme since 1992. The cumulative credit disbursement and recovery are Tk. 5936.16 crore and Tk. 5010.98 crore respectively up to December, 2002. The recovery rate is 99.96 percent. The number of beneficiaries is 21.36 lakh of which 95.71 percent are women (Table 13.25). In 2002 the average loan disbursed per member was Tk.7507.00.
PROSHIKA: Established in 1976, PROSHIKA has been carrying out a range of activities like, credit support, fisheries and livestock development, sericulture development, irrigation, health and nutrition, installation and distribution of tube wells, eco-friendly agriculture, social forestry, housing programme etc. A total of Tk. 2259.45 crore has been disbursed as credit till December 2002 to 29.02 lakh members in 23,219 villages and 2,056 slums under 57 districts. The recovery rate is 93 percent (Table 13.25).
Swanirvar Bangladesh: Established in 1975, this organisation has been carrying out its operation in the field of family planning and mother-child care activities alongside micro credit programme. At present, its activities have been expanded to 13,051 villages of 170 upazilas. Up to December 2002, a total of Tk. 293.32 crore has been disbursed to 8.06 lac borrowers of which about 6.09 lakh (75 percent) are women. The rate of recovery is 86.99 percent (Table 13.25).
Micro Credit Programme of Three Specialised Institutions
Grameen Bank: Though this bank was established in 1983 by an ordinance, it started its activities in 1976 as an experimental project. Later it expanded the operation by organising the asset less people and providing them credit support for income generation and capital and asset building. An amount of Tk. 18,020.93 crore has been disbursed as credit by June, 2003 to about 27.87 lakh members in 390 upazillas of 60 districts through 1,182 branches. The amount of recovery is Tk. 16,595.58 crore during this period. The bank's operation reached 42,611 villages in the country. Grameen Bank members had saved more than Tk. 843.84 crore in their savings accounts. A total of Tk. 778.97 crore for housing loan has been disbursed up to June 2003. With these housing loans Grameen borrowers have built 5,69,690 houses.
170
Palli Karma Sahayak Foundation (PKSF): Established in 1990, this institution has been
providing micro-credit to the targeted poor people (people having ownership up to 0.50 acre of
land and assetless people) through partner organisations (NGOs). Among the credit activities,
paddy husking, nursery, cane work, cow fattening, poultry rearing, rickshaw and van procurement
and other small business etc are notable. Up to June 2003, PKSF has disbursed a credit of Tk.
1,50,695.11 lakh to about 41,72,595 borrowers through its 213 partner organisations which
include small organisations as well as big organisations like BRAC, ASA, Proshika and Ansar
VDP Bank. Ninety percent of PKSF beneficiaries are female and the rate of credit recovery is 98
percent.
Bangladesh Rural Development Board (BRDB): BRDB has been working in the field of rural
development, especially, towards poverty alleviation through cooperatives and non-formal group
network throughout the country with the financial and technical support of the Government of
Bangladesh and development partners. The target groups of the programme include small farmers
(holding up to 0.50 acre of land), and assetless women and men. Family planning, health and
education programmes are also included in the credit and training activities. During the period
from 1990-91 to 2002-03 ( up to June,2003), 15.95 lakh members under 58,389 societies of 449
upazilas have borrowed Tk. 2430.29 crore, of which, Tk. 2171.08 crore has been recovered.
Among the projects implemented for poverty alleviation the notable ones are: Rural
Development-5 in 27 upazilas, Rural Livelihood Project in 152 upazilas, Rural Poverty
Alleviation Project in 123 upazilas, Self-employment Project for Women in 21 upazilas of Jessore
District, Integrated Women Development Project in 200 upazilas, Social Development Project
through the Participation of Local People for Poverty Alleviation in 7 upazilas of Sylhet, Rajshahi
and Patuakhali Districts aided by UNDP.
171
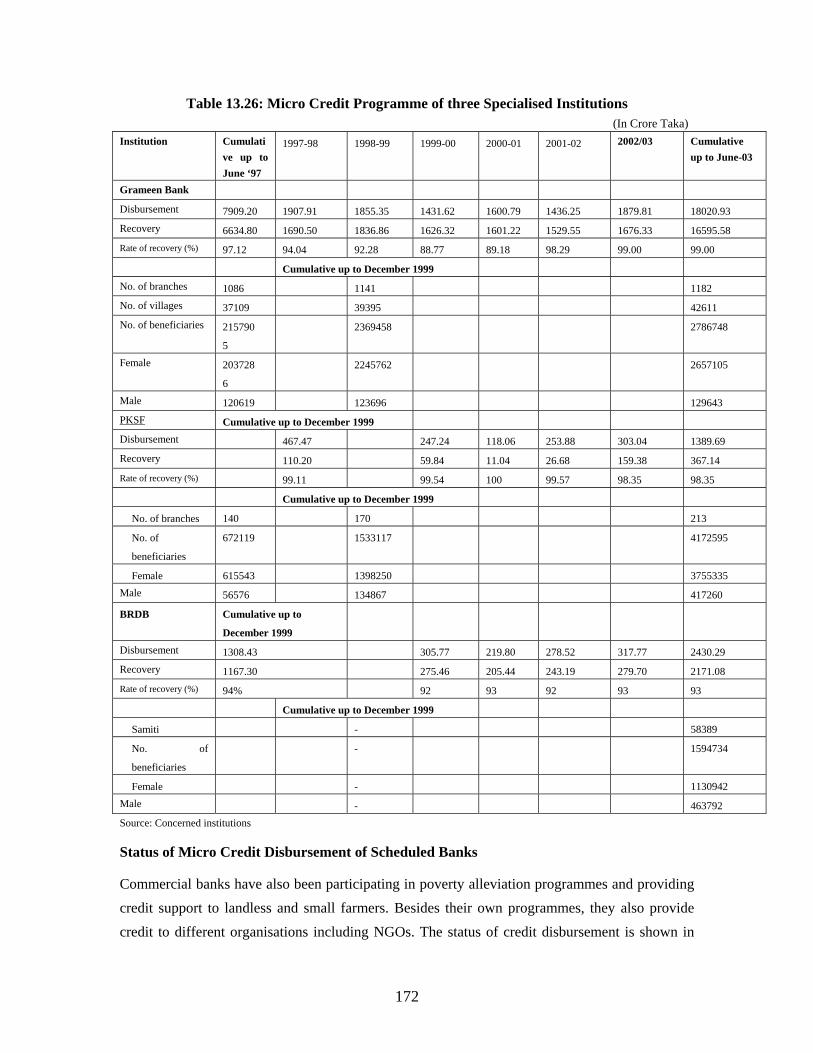
Table 13.26: Micro Credit Programme of three Specialised Institutions (In Crore Taka)
Institution Cumulative up to June ‘97
1997-98 1998-99 1999-00 2000-01
2001-02 2002/03
Cumulative up to June-03
Grameen Bank Disbursement 7909.20 1907.91 1855.35 1431.62 1600.79 1436.25 1879.81 18020.93 Recovery 6634.80 1690.50 1836.86 1626.32 1601.22 1529.55 1676.33 16595.58 Rate of recovery (%) 97.12 94.04 92.28 88.77 89.18 98.29 99.00 99.00
Cumulative up to December 1999 No. of branches 1182 1086 1141 No. of villages 37109 39395 42611 No. of beneficiaries 215790
5
2369458 2786748
Female 203728
6
2245762 2657105
Male 120619 123696 129643 PKSF Cumulative up to December 1999 Disbursement 467.47 247.24 118.06 253.88 303.04 1389.69 Recovery 110.20 59.84 11.04 26.68 159.38 367.14 Rate of recovery (%) 99.11 99.54 100 99.57 98.35 98.35 Cumulative up to December 1999
No. of branches 140 170 213
No. of
beneficiaries
672119 1533117 4172595
Female 615543 1398250 3755335 Male 56576 134867 417260
BRDB Cumulative up to
December 1999
Disbursement 1308.43 305.77 2430.29 219.80 278.52 317.77 Recovery 1167.30 275.46 243.19 205.44 279.70 2171.08 Rate of recovery (%) 94% 92 93 92 93 93
Cumulative up to December 1999
Samiti - 58389
No. of
beneficiaries
- 1594734
Female - 1130942 Male - 463792 Source: Concerned institutions
Status of Micro Credit Disbursement of Scheduled Banks
Commercial banks have also been participating in poverty alleviation programmes and providing credit support to landless and small farmers. Besides their own programmes, they also provide credit to different organisations including NGOs. The status of credit disbursement is shown in
172
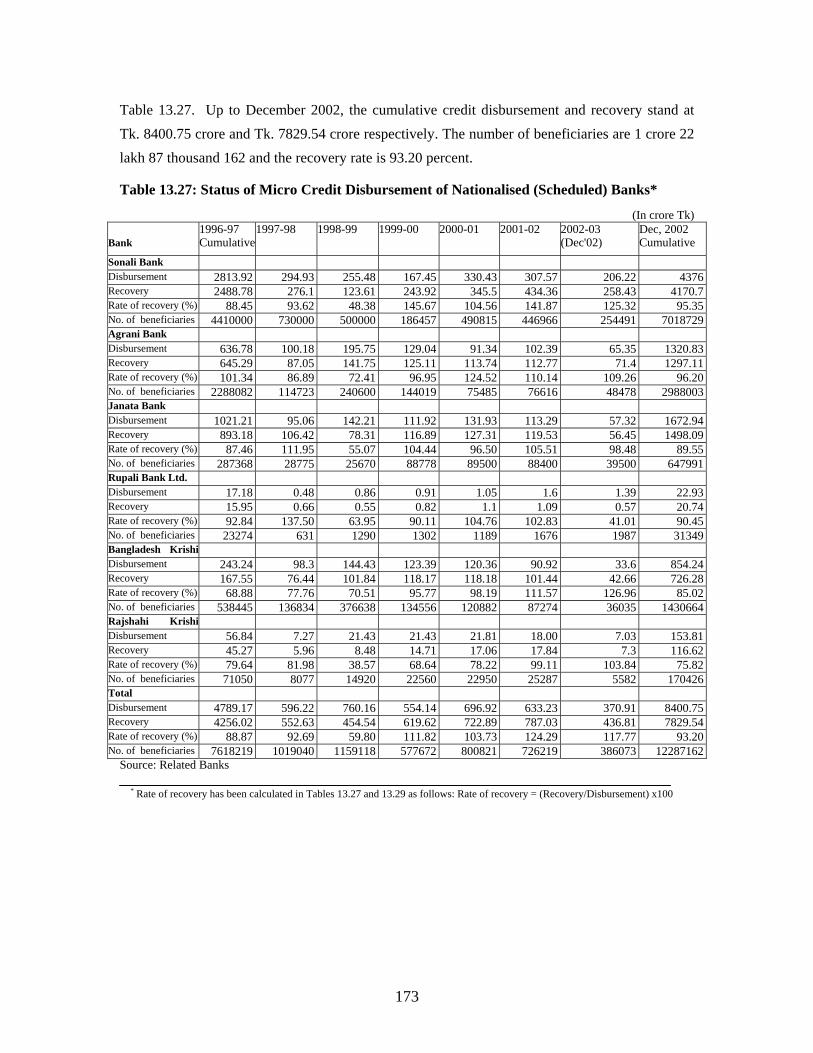
Table 13.27. Up to December 2002, the cumulative credit disbursement and recovery stand at Tk. 8400.75 crore and Tk. 7829.54 crore respectively. The number of beneficiaries are 1 crore 22 lakh 87 thousand 162 and the recovery rate is 93.20 percent.
Table 13.27: Status of Micro Credit Disbursement of Nationalised (Scheduled) Banks*
(In crore Tk) Bank
1996-97 Cumulative
1997-98 1998-99 1999-00 2000-01 2001-02 2002-03 (Dec'02)
Dec, 2002 Cumulative
Sonali Bank Disbursement 2813.92 294.93 255.48 167.45 330.43 307.57 206.22 4376Recovery 2488.78 276.1 123.61 243.92 345.5 434.36 258.43 4170.7Rate of recovery (%) 88.45 93.62 48.38 145.67 104.56 141.87 125.32 95.35No. of beneficiaries 4410000 730000 500000 186457 490815 446966 254491 7018729Agrani Bank Disbursement 636.78 100.18 195.75 129.04 91.34 102.39 65.35 1320.83Recovery 645.29 87.05 141.75 125.11 113.74 112.77 71.4 1297.11Rate of recovery (%) 101.34 86.89 72.41 96.95 124.52 110.14 109.26 96.20No. of beneficiaries 2288082 114723 240600 144019 75485 76616 48478 2988003Janata Bank Disbursement 1021.21 95.06 142.21 111.92 131.93 113.29 57.32 1672.94Recovery 893.18 106.42 78.31 116.89 127.31 119.53 56.45 1498.09Rate of recovery (%) 87.46 111.95 55.07 104.44 96.50 105.51 98.48 89.55No. of beneficiaries 287368 28775 25670 88778 89500 88400 39500 647991Rupali Bank Ltd. Disbursement 17.18 0.48 0.86 0.91 1.05 1.6 1.39 22.93Recovery 15.95 0.66 0.55 0.82 1.1 1.09 0.57 20.74Rate of recovery (%) 92.84 137.50 63.95 90.11 104.76 102.83 41.01 90.45No. of beneficiaries 23274 631 1290 1302 1189 1676 1987 31349Bangladesh Krishi Disbursement 243.24 98.3 144.43 123.39 120.36 90.92 33.6 854.24Recovery 167.55 76.44 101.84 118.17 118.18 101.44 42.66 726.28Rate of recovery (%) 68.88 77.76 70.51 95.77 98.19 111.57 126.96 85.02No. of beneficiaries 538445 136834 376638 134556 120882 87274 36035 1430664Rajshahi Krishi Disbursement 56.84 7.27 21.43 21.43 21.81 18.00 7.03 153.81Recovery 45.27 5.96 8.48 14.71 17.06 17.84 7.3 116.62Rate of recovery (%) 79.64 81.98 38.57 68.64 78.22 99.11 103.84 75.82No. of beneficiaries 71050 8077 14920 22560 22950 25287 5582 170426Total Disbursement 4789.17 596.22 760.16 554.14 696.92 633.23 370.91 8400.75Recovery 4256.02 552.63 454.54 619.62 722.89 787.03 436.81 7829.54Rate of recovery (%) 88.87 92.69 59.80 111.82 103.73 124.29 117.77 93.20No. of beneficiaries 7618219 1019040 1159118 577672 800821 726219 386073 12287162
Source: Related Banks
* Rate of recovery has been calculated in Tables 13.27 and 13.29 as follows: Rate of recovery = (Recovery/Disbursement) x100
173
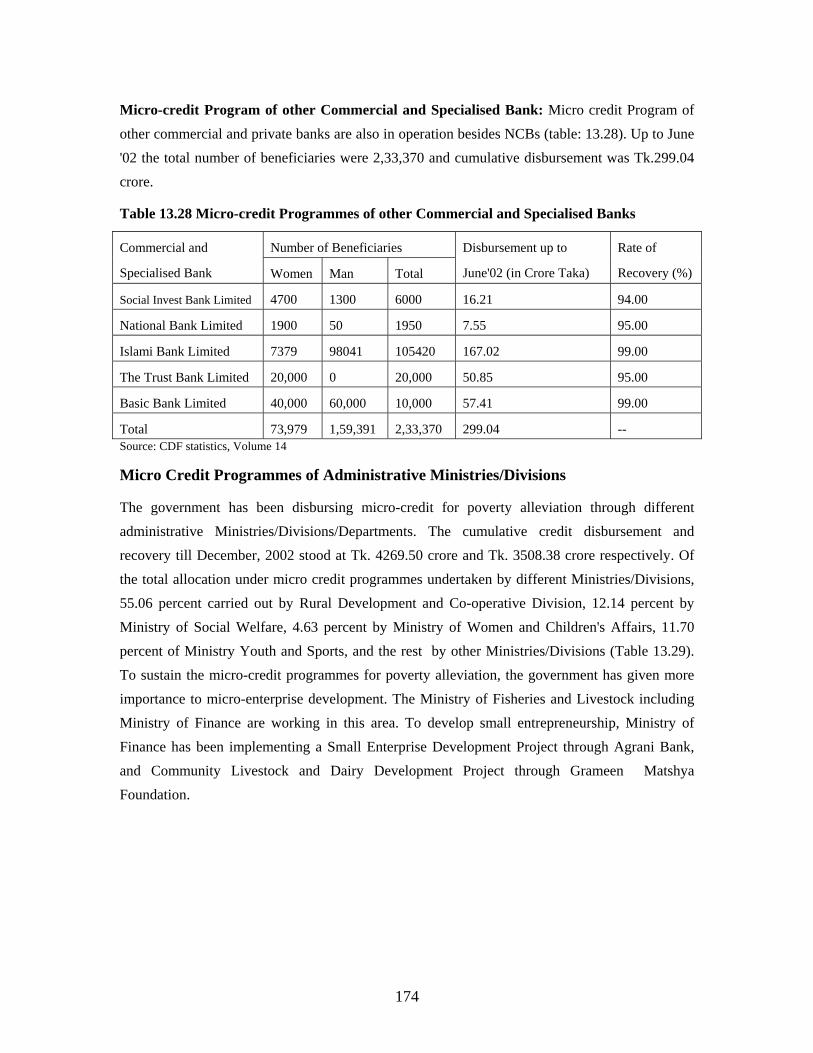
Micro-credit Program of other Commercial and Specialised Bank: Micro credit Program of other commercial and private banks are also in operation besides NCBs (table: 13.28). Up to June '02 the total number of beneficiaries were 2,33,370 and cumulative disbursement was Tk.299.04 crore.
Table 13.28 Micro-credit Programmes of other Commercial and Specialised Banks
Number of Beneficiaries Commercial and
Specialised Bank Women Man Total
Disbursement up to
June'02 (in Crore Taka)
Rate of
Recovery (%)
Social Invest Bank Limited 4700 1300 6000 16.21 94.00
National Bank Limited 1900 50 1950 7.55 95.00
Islami Bank Limited 7379 98041 105420 167.02 99.00
The Trust Bank Limited 20,000 0 20,000 50.85 95.00
Basic Bank Limited 40,000 60,000 10,000 57.41 99.00
Total 73,979 1,59,391 2,33,370 299.04 -- Source: CDF statistics, Volume 14
Micro Credit Programmes of Administrative Ministries/Divisions
The government has been disbursing micro-credit for poverty alleviation through different administrative Ministries/Divisions/Departments. The cumulative credit disbursement and recovery till December, 2002 stood at Tk. 4269.50 crore and Tk. 3508.38 crore respectively. Of the total allocation under micro credit programmes undertaken by different Ministries/Divisions, 55.06 percent carried out by Rural Development and Co-operative Division, 12.14 percent by Ministry of Social Welfare, 4.63 percent by Ministry of Women and Children's Affairs, 11.70 percent of Ministry Youth and Sports, and the rest by other Ministries/Divisions (Table 13.29). To sustain the micro-credit programmes for poverty alleviation, the government has given more importance to micro-enterprise development. The Ministry of Fisheries and Livestock including Ministry of Finance are working in this area. To develop small entrepreneurship, Ministry of Finance has been implementing a Small Enterprise Development Project through Agrani Bank, and Community Livestock and Dairy Development Project through Grameen Matshya Foundation.
174
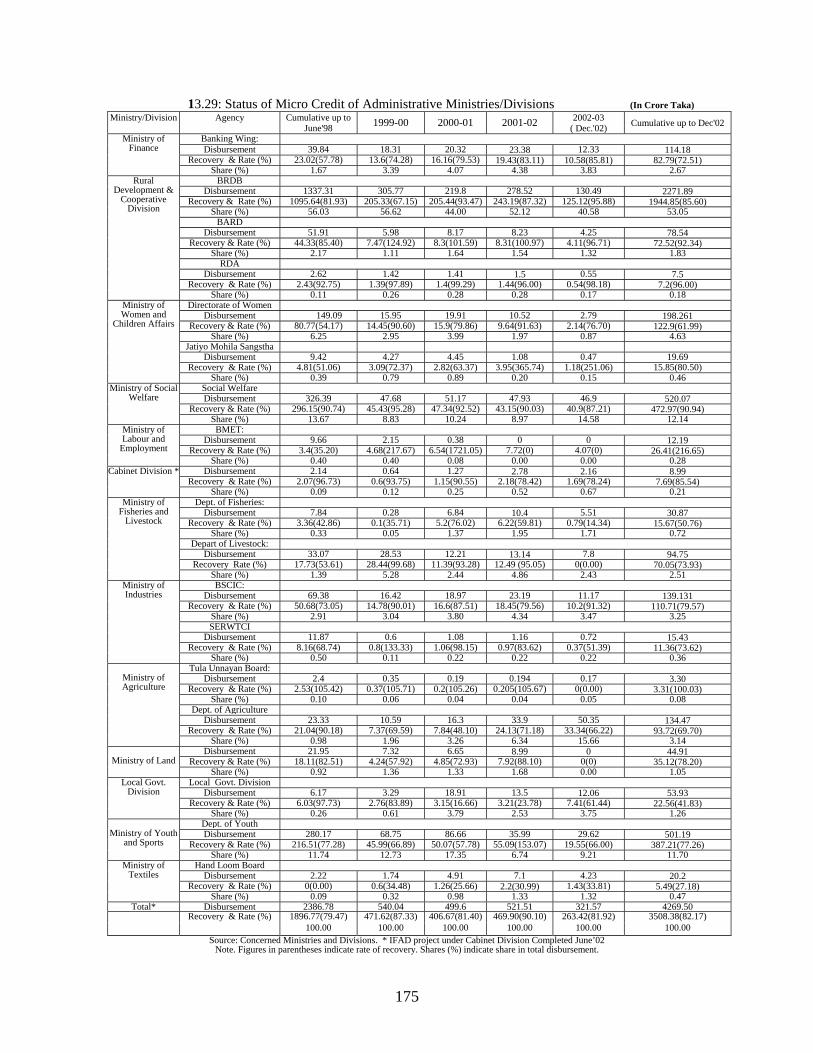
13.29: Status of Micro Credit of Administrative Ministries/Divisions (In Crore Taka) Ministry/Division Agency Cumulative up to
June'98 1999-00 2000-01 2001-02 2002-03 ( Dec.'02) Cumulative up to Dec'02
Banking Wing: Disbursement 39.84 18.31 20.32 23.38 12.33 114.18
Recovery & Rate (%) 23.02(57.78) 13.6(74.28) 16.16(79.53) 19.43(83.11) 10.58(85.81) 82.79(72.51)
Ministry of Finance
Share (%) 1.67 3.39 4.07 4.38 3.83 2.67 BRDB
Disbursement 1337.31 305.77 219.8 278.52 130.49 2271.89 Recovery & Rate (%) 1095.64(81.93) 205.33(67.15) 205.44(93.47) 243.19(87.32) 125.12(95.88) 1944.85(85.60)
Share (%) 56.03 56.62 44.00 52.12 40.58 53.05 BARD
Disbursement 51.91 5.98 8.17 8.23 4.25 78.54 Recovery & Rate (%) 44.33(85.40) 7.47(124.92) 8.3(101.59) 8.31(100.97) 4.11(96.71) 72.52(92.34)
Share (%) 2.17 1.11 1.64 1.54 1.32 1.83 RDA
Disbursement 2.62 1.42 1.41 1.5 0.55 7.5 Recovery & Rate (%) 2.43(92.75) 1.39(97.89) 1.4(99.29) 1.44(96.00) 0.54(98.18) 7.2(96.00)
Rural Development &
Cooperative Division
Share (%) 0.11 0.26 0.28 0.28 0.17 0.18 Directorate of Women
Disbursement 149.09 15.95 19.91 10.52 2.79 198.261 Recovery & Rate (%) 80.77(54.17) 14.45(90.60) 15.9(79.86) 9.64(91.63) 2.14(76.70) 122.9(61.99)
Share (%) 6.25 2.95 3.99 1.97 0.87 4.63 Jatiyo Mohila Sangstha
Disbursement 9.42 4.27 4.45 1.08 0.47 19.69 Recovery & Rate (%) 4.81(51.06) 3.09(72.37) 2.82(63.37) 3.95(365.74) 1.18(251.06) 15.85(80.50)
Ministry of Women and
Children Affairs
Share (%) 0.39 0.79 0.89 0.20 0.15 0.46 Social Welfare Disbursement 326.39 47.68 51.17 47.93 46.9 520.07
Recovery & Rate (%) 296.15(90.74) 45.43(95.28) 47.34(92.52) 43.15(90.03) 40.9(87.21) 472.97(90.94)
Ministry of Social Welfare
Share (%) 13.67 8.83 10.24 8.97 14.58 12.14 BMET:
Disbursement 9.66 2.15 0.38 0 0 12.19 Recovery & Rate (%) 3.4(35.20) 4.68(217.67) 6.54(1721.05) 7.72(0) 4.07(0) 26.41(216.65)
Ministry of Labour and
Employment Share (%) 0.40 0.40 0.08 0.00 0.00 0.28
Disbursement 2.14 0.64 1.27 2.78 2.16 8.99 Recovery & Rate (%) 2.07(96.73) 0.6(93.75) 1.15(90.55) 2.18(78.42) 1.69(78.24) 7.69(85.54)
Cabinet Division *
Share (%) 0.09 0.12 0.25 0.52 0.67 0.21 Dept. of Fisheries:
Disbursement 7.84 0.28 6.84 10.4 5.51 30.87 Recovery & Rate (%) 3.36(42.86) 0.1(35.71) 5.2(76.02) 6.22(59.81) 0.79(14.34) 15.67(50.76)
Share (%) 0.33 0.05 1.37 1.95 1.71 0.72 Depart of Livestock:
Disbursement 33.07 28.53 12.21 13.14 7.8 94.75 Recovery Rate (%) 17.73(53.61) 28.44(99.68) 11.39(93.28) 12.49 (95.05) 0(0.00) 70.05(73.93)
Ministry of Fisheries and
Livestock
Share (%) 1.39 5.28 2.44 4.86 2.43 2.51 BSCIC:
Disbursement 69.38 16.42 18.97 23.19 11.17 139.131 Recovery & Rate (%) 50.68(73.05) 14.78(90.01) 16.6(87.51) 18.45(79.56) 10.2(91.32) 110.71(79.57)
Share (%) 2.91 3.04 3.80 4.34 3.47 3.25 SERWTCI
Disbursement 11.87 0.6 1.08 1.16 0.72 15.43 Recovery & Rate (%) 8.16(68.74) 0.8(133.33) 1.06(98.15) 0.97(83.62) 0.37(51.39) 11.36(73.62)
Ministry of Industries
Share (%) 0.50 0.11 0.22 0.22 0.22 0.36 Tula Unnayan Board:
Disbursement 2.4 0.35 0.19 0.194 0.17 3.30 Recovery & Rate (%) 2.53(105.42) 0.37(105.71) 0.2(105.26) 0.205(105.67) 0(0.00) 3.31(100.03)
Share (%) 0.10 0.06 0.04 0.04 0.05 0.08 Dept. of Agriculture
Disbursement 23.33 10.59 16.3 33.9 50.35 134.47 Recovery & Rate (%) 21.04(90.18) 7.37(69.59) 7.84(48.10) 24.13(71.18) 33.34(66.22) 93.72(69.70)
Ministry of Agriculture
Share (%) 0.98 1.96 3.26 6.34 15.66 3.14 Disbursement 21.95 7.32 6.65 8.99 0 44.91
Recovery & Rate (%) 18.11(82.51) 4.24(57.92) 4.85(72.93) 7.92(88.10) 0(0) 35.12(78.20)
Ministry of Land Share (%) 0.92 1.36 1.33 1.68 0.00 1.05
Local Govt. Division Disbursement 6.17 3.29 18.91 13.5 12.06 53.93
Recovery & Rate (%) 6.03(97.73) 2.76(83.89) 3.15(16.66) 3.21(23.78) 7.41(61.44) 22.56(41.83)
Local Govt. Division
Share (%) 0.26 0.61 3.79 2.53 3.75 1.26 Dept. of Youth Disbursement 280.17 68.75 86.66 35.99 29.62 501.19
Recovery & Rate (%) 216.51(77.28) 45.99(66.89) 50.07(57.78) 55.09(153.07) 19.55(66.00) 387.21(77.26)
Ministry of Youth
and Sports Share (%) 11.74 12.73 17.35 6.74 9.21 11.70
Hand Loom Board Disbursement 2.22 1.74 4.91 7.1 4.23 20.2
Recovery & Rate (%) 0(0.00) 0.6(34.48) 1.26(25.66) 2.2(30.99) 1.43(33.81) 5.49(27.18)
Ministry of Textiles
Share (%) 0.09 0.32 0.98 1.33 1.32 0.47 Total* Disbursement 2386.78 540.04 499.6 521.51 321.57 4269.50
Recovery & Rate (%) 1896.77(79.47) 471.62(87.33) 406.67(81.40) 469.90(90.10) 263.42(81.92) 3508.38(82.17) 100.00 100.00 100.00 100.00 100.00 100.00
Source: Concerned Ministries and Divisions. * IFAD project under Cabinet Division Completed June’02 Note. Figures in parentheses indicate rate of recovery. Shares (%) indicate share in total disbursement.
175
CHAPTER-14
PRIVATE SECTOR DEVELOPMENT
The present government, recognising the private sector as the major driving force of the market economy, is committed to take supportive steps towards enhancing the involvement and active participation of the private sector in the overall development activities of the country. Consequently, reform and liberalisation programmes have been made more functional and effective to strengthen the structure of the market economy as well as to develop an efficient private sector. Government is now changing its stand from the role of a regulator to that of a facilitator and partner. Besides privatising the state owned enterprises (SOEs) and investment in the traditional sectors, similar initiatives are also there to encourage private entrepreneurs in different service sectors like power and gas, mineral resources, transportation and communication, education and health. The initiatives taken under various policies that have been formulated and implemented to support this goal are yielding substantial positive results towards the overall development of the country.
Slowdown of the world economy along with the political unrest in the international arena had its adverse impact on Bangladesh economy too. In particular, the export of ready-made garments and knitwear suffered a serious set back. In spite of that, the multifaceted measures of the government for stimulating investment, production and export as well as for infusing dynamism in the stock market were successful to boost up the faltering economy. In this recovery process, private sector has made its mark.
Developing a Private Investment Friendly Environment
Government has been striving for ensuring the much-desired private-investment-friendly environment for achieving the coveted investment goal in the private sector. Various government policies, specially the National Industrial Policy had its reflection. Moreover, several institutions have been established to provide all out support to private investments. Establishment of the Board of Investment and Privatization Commission, and development of the Capital Market are three important ones among other such bold steps.
Industrial Policy Reform
The principal objective of the present Industrial Policy is to gear up the process of industrialisation by attaching topmost priority on the private sector. With this end in view, all the procedural and institutional processes required in establishing private industries have been made simpler and unregulated. Under the current Industrial Policy, all the industries, except four reserve sectors, have been made open for private investment. Moreover, foreign investors require no permission for investing in any sectors, excluding the reserve ones. Irrespective of the amount of investment and limit of equity share, joint venture or 100% foreign investment to set up new industries or BMRE (Balancing, Modernisation, Replacement & Extension) of any existing
176
industry does not require permission from the government. Besides, many other facilities have been offered to encourage investments in private sector which include: relaxing the Foreign Exchange Control Act, increased tariff rebate, tariff rebate on imported capital machinery for 100% export-oriented industries, tax holiday, protection of industrial goods through tariff rationalisation, simplification of the raw material import policy and reduction of tariff rate etc.
To attract foreign direct investment and private investment in Bangladesh, several steps have been taken. Among these steps some important ones are:
• Enactment of the law regarding establishment of Export Processing Zone in private sectors;
• Adopting policies for establishment of Power Generation Plants in private sector;
• Amendment of the Petroleum Act for encouraging private entrepreneurs in the Petroleum sector;
• Opening up the telecommunication sector for foreign as well as local private investors;
• Encouraging private investments in infrastructure development as well as service sector.
Role of the Board of Investment*
The ‘Board of Investment' (BOI) is the apex body of the Government to support and facilitate accelerated development of private industrial sector and placed under the Prime Minister's office. The activities of BOI have again been reorganised in order to provide the local as well as foreign private investors all out support and improved services. BOI has improved its courtesy services at Zia International Airport, Dhaka to assist the prospective foreign investors on their coming to Bangladesh and set up a Utility Service Centre at its HQ to render all sorts of counseling and advice regarding required utility services to investors in setting up of their industries.
A database has been set up in BOI which would be able to provide necessary information to meet demand of investors at home and abroad and thus, contributes not only to saving time significantly but also to establish transparency. To provide rapid information-service to foreign investors BOI has updated its interactive website. With introduction of e-governance soon, foreign investors will be able to apply electronically for setting up of an industry from abroad and can see for themselves the latest status of their applications by tracking down the file through website. By providing these services, BOI endeavors to transform itself into a pro-active organization that caters to the need of investors. A congenial atmosphere has already been created for private investment and to gain confidence of investors.
177
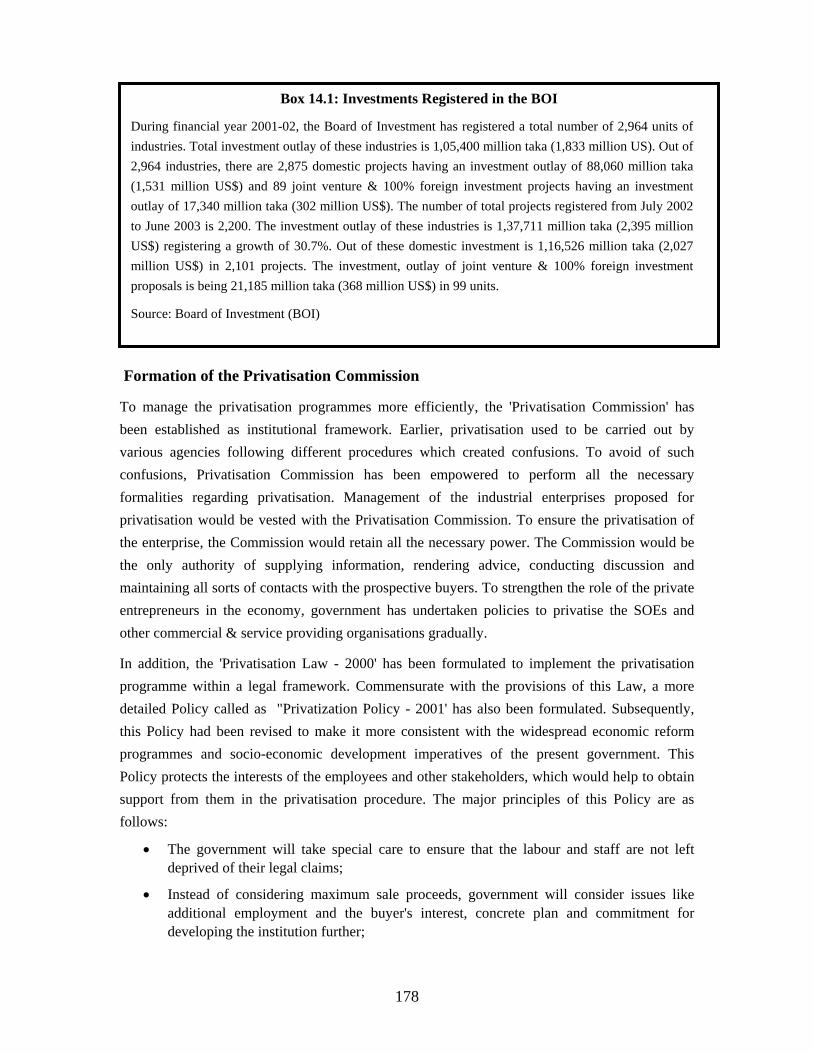
* This section has been rewritten based on the latest information provided by BIO.
Box 14.1: Investments Registered in the BOI
During financial year 2001-02, the Board of Investment has registered a total number of 2,964 units of industries. Total investment outlay of these industries is 1,05,400 million taka (1,833 million US). Out of 2,964 industries, there are 2,875 domestic projects having an investment outlay of 88,060 million taka (1,531 million US$) and 89 joint venture & 100% foreign investment projects having an investment outlay of 17,340 million taka (302 million US$). The number of total projects registered from July 2002 to June 2003 is 2,200. The investment outlay of these industries is 1,37,711 million taka (2,395 million US$) registering a growth of 30.7%. Out of these domestic investment is 1,16,526 million taka (2,027 million US$) in 2,101 projects. The investment, outlay of joint venture & 100% foreign investment proposals is being 21,185 million taka (368 million US$) in 99 units.
Source: Board of Investment (BOI)
Formation of the Privatisation Commission
To manage the privatisation programmes more efficiently, the 'Privatisation Commission' has been established as institutional framework. Earlier, privatisation used to be carried out by various agencies following different procedures which created confusions. To avoid of such confusions, Privatisation Commission has been empowered to perform all the necessary formalities regarding privatisation. Management of the industrial enterprises proposed for privatisation would be vested with the Privatisation Commission. To ensure the privatisation of the enterprise, the Commission would retain all the necessary power. The Commission would be the only authority of supplying information, rendering advice, conducting discussion and maintaining all sorts of contacts with the prospective buyers. To strengthen the role of the private entrepreneurs in the economy, government has undertaken policies to privatise the SOEs and other commercial & service providing organisations gradually.
In addition, the 'Privatisation Law - 2000' has been formulated to implement the privatisation programme within a legal framework. Commensurate with the provisions of this Law, a more detailed Policy called as "Privatization Policy - 2001' has also been formulated. Subsequently, this Policy had been revised to make it more consistent with the widespread economic reform programmes and socio-economic development imperatives of the present government. This Policy protects the interests of the employees and other stakeholders, which would help to obtain support from them in the privatisation procedure. The major principles of this Policy are as follows:
• The government will take special care to ensure that the labour and staff are not left deprived of their legal claims;
• Instead of considering maximum sale proceeds, government will consider issues like additional employment and the buyer's interest, concrete plan and commitment for developing the institution further;
178
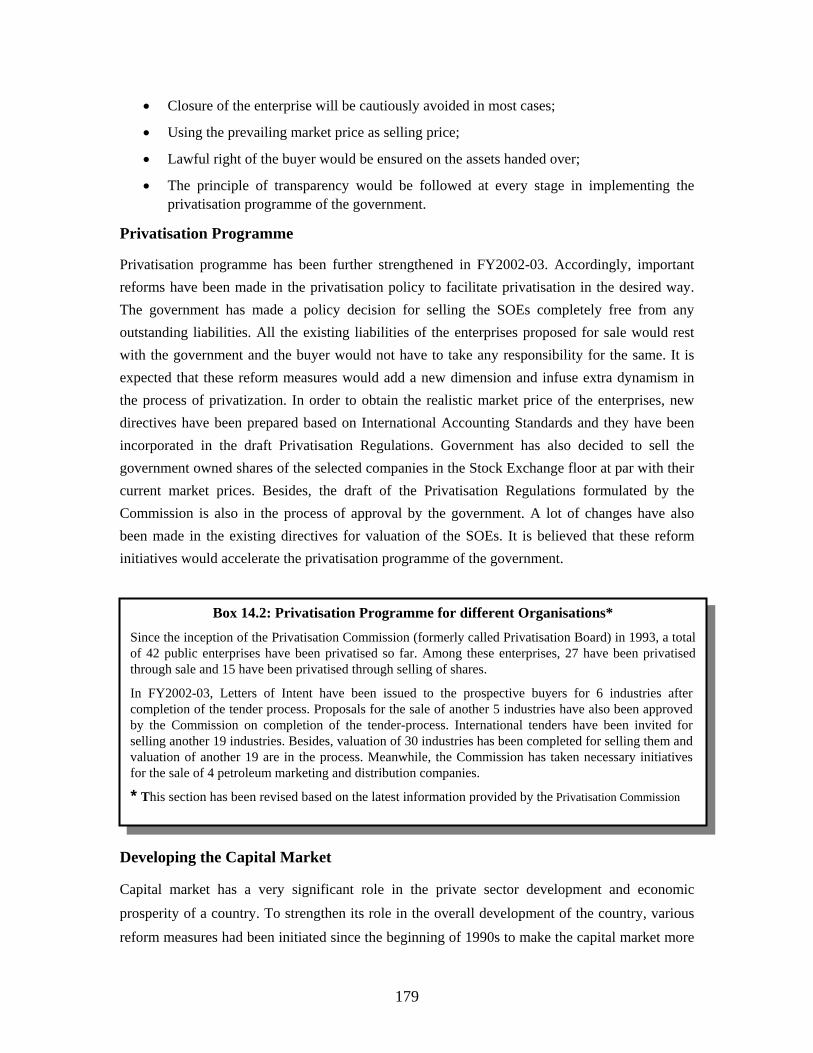
• Closure of the enterprise will be cautiously avoided in most cases;
• Using the prevailing market price as selling price;
• Lawful right of the buyer would be ensured on the assets handed over;
• The principle of transparency would be followed at every stage in implementing the privatisation programme of the government.
Privatisation Programme
Capital market has a very significant role in the private sector development and economic prosperity of a country. To strengthen its role in the overall development of the country, various reform measures had been initiated since the beginning of 1990s to make the capital market more
Privatisation programme has been further strengthened in FY2002-03. Accordingly, important reforms have been made in the privatisation policy to facilitate privatisation in the desired way. The government has made a policy decision for selling the SOEs completely free from any outstanding liabilities. All the existing liabilities of the enterprises proposed for sale would rest with the government and the buyer would not have to take any responsibility for the same. It is expected that these reform measures would add a new dimension and infuse extra dynamism in the process of privatization. In order to obtain the realistic market price of the enterprises, new directives have been prepared based on International Accounting Standards and they have been incorporated in the draft Privatisation Regulations. Government has also decided to sell the government owned shares of the selected companies in the Stock Exchange floor at par with their current market prices. Besides, the draft of the Privatisation Regulations formulated by the Commission is also in the process of approval by the government. A lot of changes have also been made in the existing directives for valuation of the SOEs. It is believed that these reform initiatives would accelerate the privatisation programme of the government.
Box 14.2: Privatisation Programme for different Organisations* Since the inception of the Privatisation Commission (formerly called Privatisation Board) in 1993, a totalof 42 public enterprises have been privatised so far. Among these enterprises, 27 have been privatised through sale and 15 have been privatised through selling of shares.
In FY2002-03, Letters of Intent have been issued to the prospective buyers for 6 industries after completion of the tender process. Proposals for the sale of another 5 industries have also been approved by the Commission on completion of the tender-process. International tenders have been invited for selling another 19 industries. Besides, valuation of 30 industries has been completed for selling them and valuation of another 19 are in the process. Meanwhile, the Commission has taken necessary initiatives for the sale of 4 petroleum marketing and distribution companies. * This section has been revised based on the latest information provided by the Privatisation Commission
Developing the Capital Market
179
efficient, effective and reliable. Consequently, in 1993 the Securities and Exchange Commission (SEC) had been established in Bangladesh. Later on, alongside the ongoing reforms, the government took various initiatives for keeping the reform programme ongoing. Among them the major ones are: structural development, modernisation of the programmes related to capital market and adopting and using the international standards and procedures. In this regard Asian Development Bank (ADB), World Bank and International Monetary Fund (IMF) have extended valuable assistance. Besides, in order to enhance transparency in foreign investment in the capital market, SEC made necessary rules for bringing the Securities Custodian within the scope of registration. Included among the several initiatives under consideration are:
• Ensuring effective governance in the capital market, particularly for the listed companies;
• Preparing the financial statements according to the international standards and ensuring transparency in the accounts by using the International Auditing Standards;
• Encouraging bond-issue and buying and selling of bonds by adopting the 'Securities and Bond Issue Rules '.
• Helping public to invest in the capital market more prudently by providing them with the credit rating services.
Along with a range of endeavours put in to inject dynamism and transparency in the capital market, initiatives to enhance participation of the private sector continued unabated. 'Securities and Exchange Commission (Mutual Fund) Regulations, 1997' has been adopted. A mutual fund amounting five crore taka has already been formed. SEC has approved this fund under the Mutual Fund Regulations. This mutual fund in the private sector would be considered as a milestone in the capital market of the country. Moreover, a depository company has been established under private initiatives to provide depository services.
To facilitate asset management, merchant banking and securities broking, the Investment Corporation of Bangladesh (ICB) has been thoroughly reorganised and registered as three subsidiary companies for simplifying institutional investments. To enhance institutional investment further, the Commission (SEC) has arranged to provide the commercial banks registration for doing the merchant banking activities by opening a separate wing without a subsidiary company. Following this, the Prime Bank Ltd. has already received the license as a merchant banker. Shares with fundamental base would increase in the capital market if shares of SOEs, particularly from gas, power, fuel and communication sectors are transacted through the stock exchange. Along with many other steps, the commission has therefore taken steps to float government shares in the multinational companies and other companies through the stock exchange.
180
Privatisation Activities in Various Sectors of the Economy
Infrastructure: Oil and Gas
Exploration of new gas fields and their development is of great significance for the economy. Foreign investors have been permitted on attractive terms under Production Sharing Contracts (PSC) for quick exploration and expansion of the gas resources. Consequently, a number of multinational oil companies have responded positively. Under the first and second round bidding, PSC has been signed for 12 blocks so far. The oil companies are: Occidental Exploration of Bangladesh limited, UNOCAL, Cairn Energy and Holland Sea Search JV, Rexwood Okland JV, United Meridian Corporation, UNOCAL/BAPEX, Chevron, Tallow, Texaco, BAPEX and Shell Bangladesh Exploration and Development B.V. Meanwhile, one of these companies has discovered a gas field, named Sangu, on the Bay of Bengal. Production from this gas field has commenced since 1998 according to the PSC arrangement. Besides, another company has explored two new gas fields in Bibiyana and Moulvibazar.
Government has taken initiatives for privatising six enterprises including three oil-marketing companies of the Bangladesh Petroleum Corporation (BPC). Besides, the imports of lubricating oil, LPG and transformer oil have been made open in consideration of the fact that the participation of private fuel import and marketing companies would create a competitive market.
Power
The government has pledged to make electricity available to everybody by the year 2020. As a policy to realise this vision, private sector participation is being encouraged in power sector. Formerly, production, transmission and distribution of electricity were vested with the Bangladesh Power Development Board (PDB). Government took initiative to change this situation gradually. As a result, the private sector's role to power generation is enhancing. In recognition of the need for private investment in the power sector, the government has formulated the Private Sector Power Generation Policy in 1996.
Besides, policy has also been formulated in 1998 to facilitate private investments in small-scale power generation plant (of 10 MW capacity). Under this policy, the investors have been allowed to sell the surplus power after meeting their own need to the local consumers. Investors are also allowed to set up power generation plants beyond 10 MW capacity, if necessary. In FY2002-03, two power generation plants, AES Haripur 360 MW and AES Meghnaghat 450 MW, started power generation. As a result of these initiatives, total power generation capacity rose to 3500 MW which was 2650 MW previously.
The reform programmes initiated for enhancing overall efficiency in the power sector, coupled with the policies for encouraging private sector investment, have started yielding positive results. The notable ones among these achievements are:
181
• Under the adopted 'Private Sector Power Generation Policy of Bangladesh', approved for power generation and distribution in the private sector, 1290 MW capacity power plants has been established so far.
• Under the policies enunciated in 'Policy Guideline for Small Power Plants in Private Sector', one 10 MW power plant has already been set up and some more are in the progress.
• Along with Independent Power Providers (IPPs) in private sector, government has also taken steps to install power plants in future with different mode of financing including joint venture, commercial bank loan, self-financing. Under these initiatives, establishment of three 450 MW power plants at Sirajgonj, Bheramara and Meghnaghat are in progress.
Reform programmes have also been taken up to privatise some activities relating to the transmission and distribution in the power sector. As part of this reform programme, Power Grid Company of Bangladesh (PGCB) and Dhaka Electricity Company (DESCO) have been established in 1996 under the provision of the Companies Act, 1994 for the separation of the transmission system. PGCB has already acquired all the transmission assets of PDB.
Information and Communication Technology
Developing a reliable information system has become highly essential for the efficient and effective management system in both the public and private sector. Information and communication sector has already been declared as the thrust sector in Bangladesh. Moreover, in October 2002, the present government has formulated the 'National Policy on Information and Communication Technology (ICT)'. Alongside the government sector, the participation of the private sector in the development of ICT has highly been emphasized in this policy. The major issues highlighted in this policy involving the private sector are:
• To develop skilled ICT manpower, ICT education would be introduced widely in public and private educational institutions;
• To support the growing demand of the ICT sector, appropriate ICT infrastructure would be established immediately both in public and private sector.
• To ensure public access to information, Cyber Kiosks would be set up in all post offices, Union and Upazila complexes. Private sector participation would be encouraged to set up these facilities.
• High speed gateway facilities would be provided for Internet Service Providers (ISPs) on commercial basis.
• National Information Infrastructure (NII) would be developed and it would be directly connected to Global Information Infrastructure through information superhighway to create, collect and sell software and provide ICT enabled services to the world market through involvement of both the public and private sectors.
182
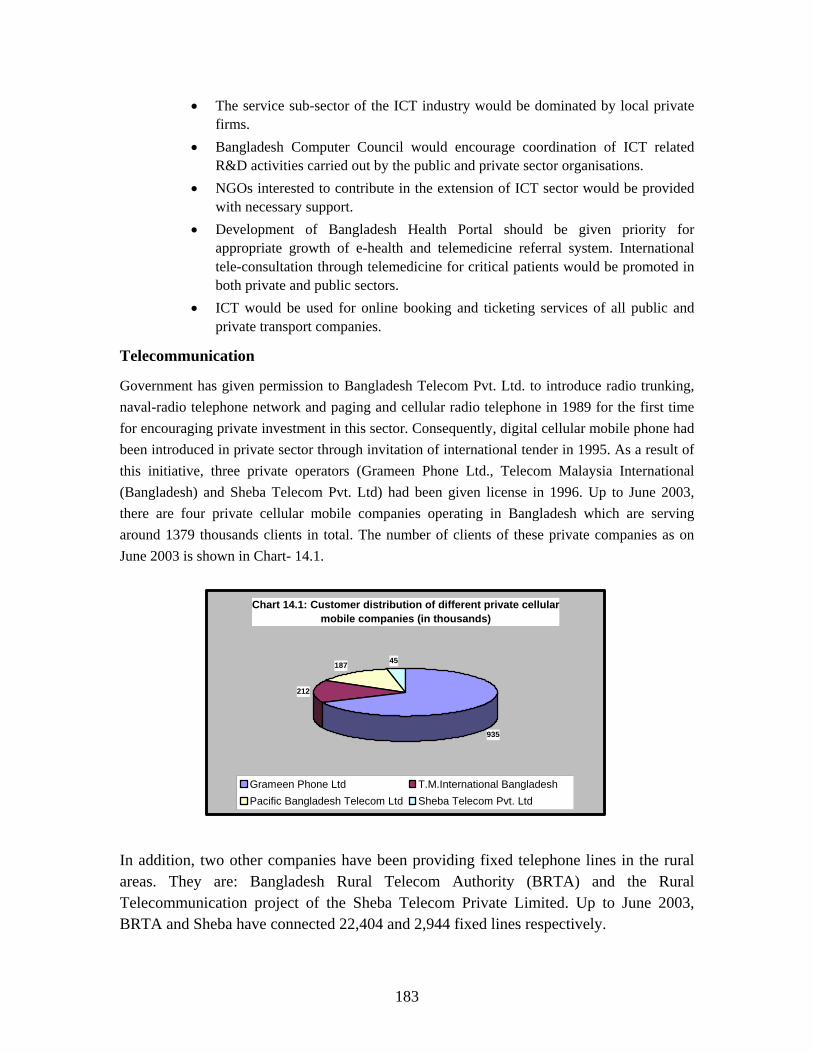
• The service sub-sector of the ICT industry would be dominated by local private firms.
• Bangladesh Computer Council would encourage coordination of ICT related R&D activities carried out by the public and private sector organisations.
• NGOs interested to contribute in the extension of ICT sector would be provided with necessary support.
• Development of Bangladesh Health Portal should be given priority for appropriate growth of e-health and telemedicine referral system. International tele-consultation through telemedicine for critical patients would be promoted in both private and public sectors.
• ICT would be used for online booking and ticketing services of all public and private transport companies.
Telecommunication
Government has given permission to Bangladesh Telecom Pvt. Ltd. to introduce radio trunking, naval-radio telephone network and paging and cellular radio telephone in 1989 for the first time for encouraging private investment in this sector. Consequently, digital cellular mobile phone had been introduced in private sector through invitation of international tender in 1995. As a result of this initiative, three private operators (Grameen Phone Ltd., Telecom Malaysia International (Bangladesh) and Sheba Telecom Pvt. Ltd) had been given license in 1996. Up to June 2003, there are four private cellular mobile companies operating in Bangladesh which are serving around 1379 thousands clients in total. The number of clients of these private companies as on June 2003 is shown in Chart- 14.1.
In addition,areas. TheTelecommuBRTA and
Chart 14.1: Customer distribution of different private cellular mobile companies (in thousands)
935
212
187 45
Grameen Phone Ltd T.M.International BangladeshPacific Bangladesh Telecom Ltd Sheba Telecom Pvt. Ltd
two other companies have been providing fixed telephone lines in the rural y are: Bangladesh Rural Telecom Authority (BRTA) and the Rural nication project of the Sheba Telecom Private Limited. Up to June 2003, Sheba have connected 22,404 and 2,944 fixed lines respectively.
183
Box 14.3: General Objectives of Bangladesh Telecommunication Regulatory Commission Formerly, Ministry of Post and Telecommunication used to play the regulatory role in telecommunicationsector. With the enforcement of Telecommunication Act, 2001, Bangladesh Telecommunication RegulatoryCommission has assumed that role. General objectives of the Commission are:
• To encourage and develop a well disciplined telecommunication system capable of expediting and integrating socio-economic development of Bangladesh.
• To ensure a reliable, reasonably priced and modern telecom and internet service for the majority ofthe people keeping in view of the prevailing socio-economic condition of Bangladesh.
• Enhancing the efficiency and capacity of competitiveness of local telecommunication system atnational and international level.
• Prevention and abolition of existing discriminatory system in telecom services, gradually attainingdependency on competitive market system and for that purpose, ensuring an effective regulationconsistent with the aims of the Commission.
• Introducing new telecom service and conducive environment for investment in telecommunicationsector for domestic and foreign investors and for expatriate Bangladeshis, etc.
To utilise ICT in the socio-economic development of the country and to meet the growing demand in this sector, adequate and appropriate ICT infrastructure needs to be set up. Telecommunication sector is an important infrastructure for ICT. Considering that, government is committed to open the telecommunication sector for private entrepreneurs and investors. Government is also committed to extend basic telecommunication facilities to the rural and underdeveloped areas of the country to bring the greater mass into the stream of ICT activities by involving both the public and private sector.
Transport Sector
Air Transport Sector: To make the domestic airlines internally competitive, Bangladesh government approved private airlines in the domestic sector in the early nineties. Government has opened air cargo for the private sector since 1996. Three private organisations have been permitted so far for operating commercial flights in different domestic routes. These are: GMG Airlines Ltd., Aero-Bengal Airlines and Air Parabat Ltd. Currently, GMG is operating in the domestic routes on regular schedule. It has been flying to different local and international airports. Air Parabat is operating seasonal flights to the southern and southwestern airports of the country. Best Aviation and Bismillah Airlines are delivering private cargo service for the first time. Moreover, some private airlines are planning to operate flights in the Short Take-off and Landing (STOL) ports.
The effort initiated in 1999 for restructuring and commercialisation of Biman (Bangladesh Airlines) through strategic partnerships with an established Airlines and/or financial institution also continued in 2001. Though the consulting firm has completed its study, the recommendations could not be implemented due to depressed condition in the aviation market. According to the Privatisation Policy of the government, civil aviation authority has planned to privatise the non-
184
regulatory activities in the airport. In the meantime, initiative has been taken to employ private companies for the operation and maintenance activities, except the regulatory ones, of the Shah Amanat Airport. Besides, plan for privatising the 'cargo handling' in Zia International Airport is under consideration.
Tourism: To attract and increase private investment in the tourism sector, government has started privatising operations and managements of some of the commercial ventures of the Bangladesh Tourism Corporation (Parjatan Corporation of Bangladesh). In the meantime, the management of the following projects has already been privatised: Motel Probal (Cox's Bazaar); Motel Upol (Cox's Bazaar) and Parjatan Restaurant (Madhobkunda). Besides, privatising the management of several others are in progress. These are: Sylhet Parjatan Motel, Parjaton Motel Laboni (Cox's Bazaar); Ruchita Restora and Bar (Dhaka) and Parjatan Motel (Bandarban and Khagrachari). Moreover, PCB has undertaken several other projects for setting up new tourist's spot/points/resorts on its own property either on Build, Operate and Transfer (BOT) basis or on direct private investment. These projects are:
• Sylhet Amusement Shishu Park; • A modern tourist spot with various facilities like, food village, auditorium, book shop and
amusement-point, in the vacant land of PCB's Head Office; • A modern tourist resort in the vacant land of PCB's in Cox's Bazaar; • A shopping complex cum international Hotel in the premises of the Parjatan Motel Soikat
in Chittagong; • An international-standard tourist resort in Foy's lake in Chittagong; • An international-standard Hotel in the premises of the Fairly House in Dhaka; • A modern tourist complex in Muzgunni, Khulna; and • Setting up a tourist's point at Mahastan Garh, Bogra;
It is believed that these undertakings in the tourism sector would increase private investments in this sector encouraging the private entrepreneurs to invest more and more.
Bangladesh Railway (BR):
The process of involving private sector in the Railway sector has started since 1987. To improve the quality of passenger-service, commercial activities of the train-service in different routes have been privatised. Up to June 2003, operations of 46 trains, which include mail-train, express-train and local-train, have been privatised. Privatisation of another 26 mail, express and local trains are in the process. Moreover, on-board services of 16 inter-city trains have been outsourced to private sector. The participation of private operators has raised the standard of services in this sector and ensured comfortable and pleasant journey for long distance passengers.
185
Water Transport
The water transport policy of the government has encouraged the participation of private entrepreneurs in this sector. At present private contactors are operating in all the terminals (Ghats) of Bangladesh Inland Water Transport Authority (BIWTA) through leasing system. Similarly, all the tankers of Bangladesh Inland Water Transport Corporation (BIWTC) are being operated by the private operators. Stevedoring of the Chittagong and Mongla port are fully in the hand of private entrepreneurs. Besides, container handling in Chittagong Port to some extent and all containers of Inland Container Depot are being operated by private sector.
BIWTA has taken an initiative to install one inland container terminal in Khanpur of Nawabganj and one in Pangaon of Dhaka by the private sector on the BOT basis. Chittagong Port Authority is going to employ private operator to operate and manage the container terminal under construction in the New Mooring area soon. Besides, BIWTA is planning to involve private entrepreneurs in the development and management of nearly 400 landing stations. Mongla Port Authority (MPA) has entered into contracts with 10 industries to operate its activities on its own land under BOOT system on a 30-years' Lease Contract basis. Moreover, MPA is now attempting to engage private operators to complete the 4 jetties under construction and operate them on commercial basis. The Ministry of Shipping has recently established 'Bangladesh Land Port Authority' that has decided to privatise the infrastructure development and operation of several land ports. These are: Bhomra, Darsana, Sonamasjid, Hilli, Birol, Banglabandh, Burimari, Haluaghat, Tamabil, Akhaura and Bibirbazaar.
The government has drafted the policies regarding participation of the private sector with the assistance of Infrastructure Investment Facilitation Centre (IIFC). Necessary measures would be taken to finalise this draft in 2003-04.
Financial Sector
Banking and Insurance: In the field of banking and insurance, private sector has a very active and boisterous presence. Now, there are 40 private banks (30 domestic and 10 foreign) operating in Bangladesh. 60 private insurance companies (43 domestic and 17 foreign) have got approval to operate commercially. In addition to these banks and insurance companies, currently there are 28 financial institutions in the private sector. The existence of banks, insurance companies and other financial institutions in the private sector has created a competitive environment in the financial sector and that has remarkably improved the quality of services in this sector. Government is now considering the privatisation of one of the nationalised commercial banks.
Education
Private sector is being encouraged in the education sector, particularly to reduce the pressure on the revenue expenditure as well as to diminish our dependence on foreign countries for education.
186
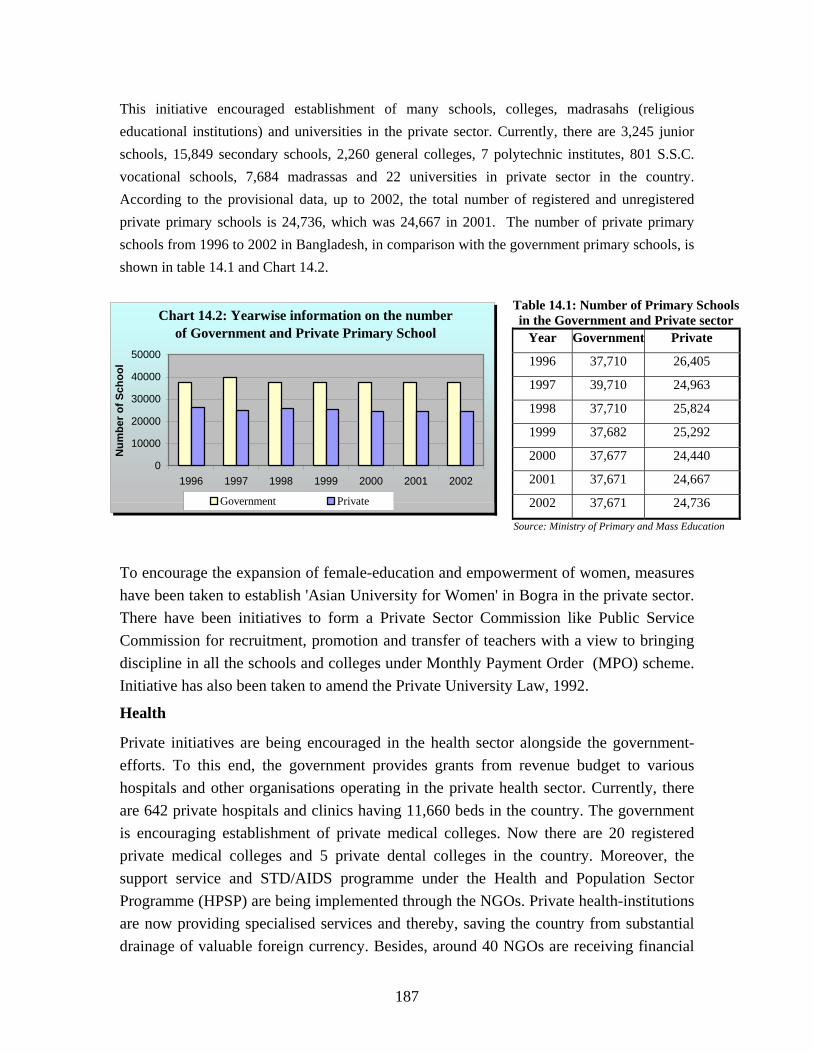
This initiative encouraged establishment of many schools, colleges, madrasahs (religious educational institutions) and universities in the private sector. Currently, there are 3,245 junior schools, 15,849 secondary schools, 2,260 general colleges, 7 polytechnic institutes, 801 S.S.C. vocational schools, 7,684 madrassas and 22 universities in private sector in the country. According to the provisional data, up to 2002, the total number of registered and unregistered private primary schools is 24,736, which was 24,667 in 2001. The number of private primary schools from 1996 to 2002 in Bangladesh, in comparison with the government primary schools, is shown in table 14.1 and Chart 14.2.
Table 14.1: Number of Primary Schools
in the Government and Private sectorYear Government Private
1996 37,710 26,405
1997 39,710 24,963
1998 37,710 25,824
1999 37,682 25,292
2000 37,677 24,440
2001 37,671 24,667
2002 37,671 24,736
Source: Ministry of Primary and Mass Education
Chart 14.2: Yearwise information on the number of Government and Private Primary School
0
10000
20000
30000
40000
50000
1996 1997 1998 1999 2000 2001 2002
Num
ber o
f Sch
ool
Government Private
To encourage the expansion of female-education and empowerment of women, measures have been taken to establish 'Asian University for Women' in Bogra in the private sector. There have been initiatives to form a Private Sector Commission like Public Service Commission for recruitment, promotion and transfer of teachers with a view to bringing discipline in all the schools and colleges under Monthly Payment Order (MPO) scheme. Initiative has also been taken to amend the Private University Law, 1992.
Health
Private initiatives are being encouraged in the health sector alongside the government-efforts. To this end, the government provides grants from revenue budget to various hospitals and other organisations operating in the private health sector. Currently, there are 642 private hospitals and clinics having 11,660 beds in the country. The government is encouraging establishment of private medical colleges. Now there are 20 registered private medical colleges and 5 private dental colleges in the country. Moreover, the support service and STD/AIDS programme under the Health and Population Sector Programme (HPSP) are being implemented through the NGOs. Private health-institutions are now providing specialised services and thereby, saving the country from substantial drainage of valuable foreign currency. Besides, around 40 NGOs are receiving financial
187
supports for providing health services under the HPSP in collaboration with DFID. This is being implemented by involving the NGOs under a programme named Bangladesh Integrated Nutrition Programme.
Agriculture
Substantial changes have been made in the Agricultural Policy of Bangladesh to make it consistent with market-oriented reforms. Various steps have been undertaken to encourage private initiatives and to ensure an investment-friendly environment. Existing policy-structure limits the role of the government in providing a set of public goods and services vital for the sectoral growth of agriculture. These include: research, extension, large-scale irrigation, land protection management, supplying of market-information etc. In all other scopes of agricultural sector, private initiatives are being encouraged.
Selling shallow tube-well initiated the privatisation process in the agricultural sector in 1970-71, which accelerated the expansion of irrigation network. The privatisation process of deep tube-well and low-lift pump started in 1979-80. Side by side, by the end of 1980s, substantial reforms took place in the small-scale irrigation development policy for the development and privatisation of irrigation. Consequently, many small agricultural-equipment had become available to the farmers. The irrigation system is now fully privatised.
Special emphasis has been laid on the participation of the private entrepreneurs in the production, processing and marketing of high quality seeds. The import of germplasm in private sector is permitted for research, development and production of mother seeds. Import and sale of seeds of all type of crops, except paddy, wheat, sugarcane, potato and jute are open for the private sector. Moreover, private entrepreneurs have been allowed to collect breeder seeds from various research organisations for the production and distribution of mother seeds and others.
Fertilizer distribution through private sector started experimentally in one administrative division in 1979. Later, in 1980, it was extended to all over Bangladesh. To encourage wholesale business, relevant business people were allowed to sell fertilizers at any place in the country after collecting them directly from the factories and ports (in case of imported fertilizer). The network in the private sector is now managing the import and distribution of fertilizer at the market price. Jute Industry
Raw Jute: Production of raw jute, its domestic use and export are in the private sector. Jute is exported to 40/42 countries around the world. The continued effort of Bangladesh Jute Association (BJA) for developing and maintaining foreign markets for raw jute as well as ensuring its uninterrupted export is yielding into an earning of about Tk.350-400 crore worth of foreign exchange every year from raw jute.
188
Jute Goods: In private sector, production and export of jute goods are being carried out by Bangladesh Jute Mills Association (BJMA) and Bangladesh Jute Spinners Association (BJSA). There are 99 jute mills in private sector (49 under BJMA and 50 under BJSA), among which 73 are in operation. In the FY2002-03, a target has been set for earning Tk.680 crore (Tk.68 billion) from 2.25 lakh metric tons of jute goods.
Privatisation Process: In 1980 Bangladesh government decided to privatise the jute mills gradually. In 80s, ownership of 35 mills had been transferred to the previous owners. In 1997, one mill had been privatised and currently, another five are in the process of privatization. However, the privatisation programme has become more active since the present government took office. Adamjee Jute Mills has already been closed down.
Diversified Uses of Jute: Continuous efforts through private entrepreneurs is there to increase diversified uses of jute. As part of this effort, in November 1999, an 'Investors Forum' was formed in coordination with Ministry of Jute, Board of Investment, International Jute Organization (IJO), EC delegation, Dhaka and Dhaka Chamber of Commerce & Industries. So far, 15 projects have been identified for implementing in the private sector. An institutional set up named Jute Diversification Promotion Centre (JDPC) is in place to extend assistance for implementing these projects. Among the projects identified by the JDPC, implementations of two have already started. One project would start commercial production soon. Moreover, another project for producing pulp from jute, named 'Biotechnological Application of Enzyme for Making Paper Pulp from Green Jute', is under implementation by International Jute Study Group (IJSG) (former IJO).
Textile
There are more than 182 cotton-spinning mills in Bangladesh, of which 156 belong to the private sector. In the spinning sub-sector, a quantity of about 32 crore kgs of cotton and artificial fibre is being used every year. In the weaving sub-sector about 2.12 lakh out of 5.12 lakh handlooms are in operation. There are 43 thousand looms comprised of specialised textile mills, powers looms and weaving mills almost all of which are in private hands. There are about 178 semi-mechanised and 115 mechanised dyeing and finishing units in the country producing 70 and 550 million meters of textiles respectively. Production from these dyeing, printing and finishing factories meet the export demand along with meeting most of the domestic demand. Among these privately managed units, few units are engaged in supplying fabric for export oriented garments industry.
Readymade garments, operating in private sector, constitute the most important sub-sector of the textile sector. There are about 3800 export-oriented garments industry in the country with a production capacity of 180 million dozens of dresses. About 1.8 million people are employed in this sector.
189
For the development of private sector, a number of projects has been undertaken. Notable among them are: operation of public sector mills under service charge system; encouraging the private entrepreneurs for setting up backward linkage industry; privatisation of the state owned textiles; establishing garments-village; implementing the project 'Rajshahi Silk Industrial Estate' in the silk producing area of Rajshahi; distribution of 906 plots at section-17, Mirpur, Dhaka to the Benarashi weavers of Mirpur for setting up factory-cum-residences, show rooms and sales-centre for production and marketing of handloom products; small credit programme costing Tk.50 crore for the development of handloom in private sector etc.
The present government aims to develop a private sector led sustainable industrial-base to accelerate the economic growth of the country. This has been reflected in the government's undertaking to adopt a range programmes designed to support those goals. The timely and appropriate strategies of the government resulted in acceleration of the desired momentum in the private industrialisation in 2002-03. Private investment is increasing on a desired scale. According to BOI statistics, during the first half of the current fiscal year (July-December, 2002) the import of capital machinery by industrial undertakings has increased by 48.23% compared to the import of the same period of FY2001-02. The commencement of production in these industries would result in a substantial growth in the industrial sector.
190
STATISTICAL APPENDICES
191
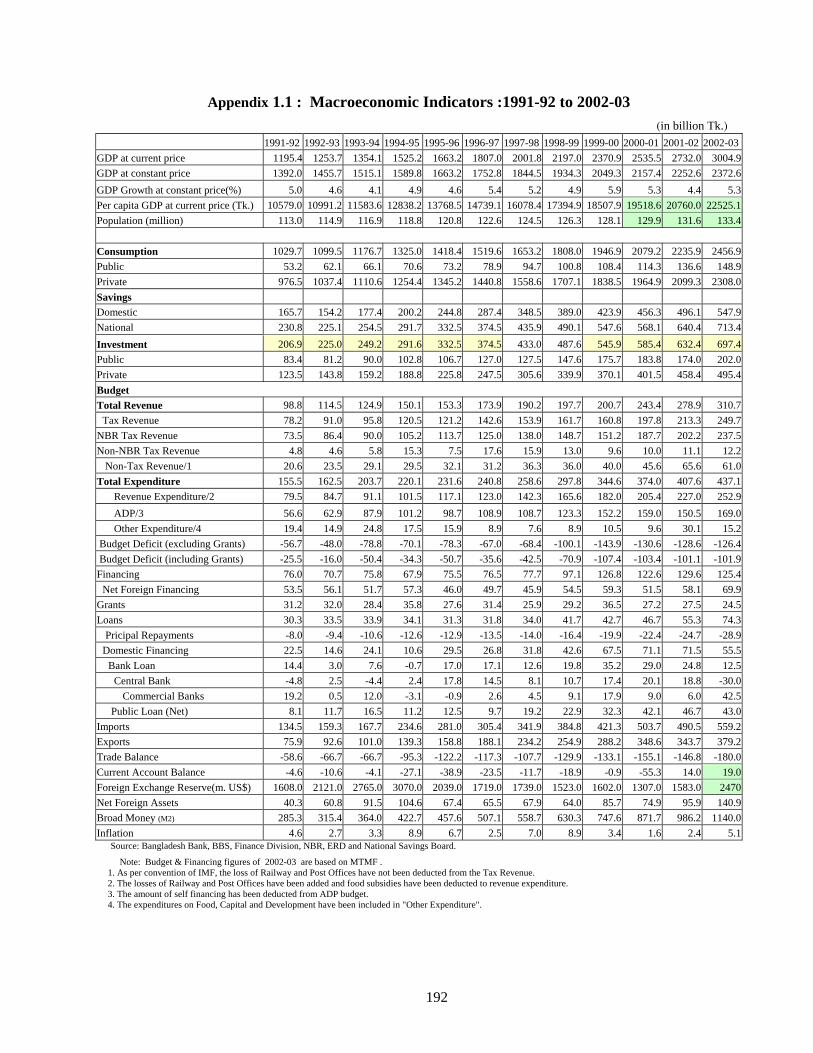
Appendix 1.1 : Macroeconomic Indicators :1991-92 to 2002-03 (in billion Tk.) 1991-92 1992-93 1993-94 1994-95 1995-96 1996-97 1997-98 1998-99 1999-00 2000-01 2001-02 2002-03GDP at current price 1195.4 1253.7 1354.1 1525.2 1663.2 1807.0 2001.8 2197.0 2370.9 2535.5 2732.0 3004.9GDP at constant price 1392.0 1455.7 1515.1 1589.8 1663.2 1752.8 1844.5 1934.3 2049.3 2157.4 2252.6 2372.6GDP Growth at constant price(%) 5.0 4.6 4.1 4.9 4.6 5.4 5.2 4.9 5.9 5.3 4.4 5.3Per capita GDP at current price (Tk.) 10579.0 10991.2 11583.6 12838.2 13768.5 14739.1 16078.4 17394.9 18507.9 19518.6 20760.0 22525.1Population (million) 113.0 114.9 116.9 118.8 120.8 122.6 124.5 126.3 128.1 129.9 131.6 133.4 Consumption 1029.7 1099.5 1176.7 1325.0 1418.4 1519.6 1653.2 1808.0 1946.9 2079.2 2235.9 2456.9Public 53.2 62.1 66.1 70.6 73.2 78.9 94.7 100.8 108.4 114.3 136.6 148.9Private 976.5 1037.4 1110.6 1254.4 1345.2 1440.8 1558.6 1707.1 1838.5 1964.9 2099.3 2308.0Savings Domestic 165.7 154.2 177.4 200.2 244.8 287.4 348.5 389.0 423.9 456.3 496.1 547.9National 230.8 225.1 254.5 291.7 332.5 374.5 435.9 490.1 547.6 568.1 640.4 713.4Investment 206.9 225.0 249.2 291.6 332.5 374.5 433.0 487.6 545.9 585.4 632.4 697.4Public 83.4 81.2 90.0 102.8 106.7 127.0 127.5 147.6 175.7 183.8 174.0 202.0Private 123.5 143.8 159.2 188.8 225.8 247.5 305.6 339.9 370.1 401.5 458.4 495.4Budget Total Revenue 98.8 114.5 124.9 150.1 153.3 173.9 190.2 197.7 200.7 243.4 278.9 310.7 Tax Revenue 78.2 91.0 95.8 120.5 121.2 142.6 153.9 161.7 160.8 197.8 213.3 249.7NBR Tax Revenue 73.5 86.4 90.0 105.2 113.7 125.0 138.0 148.7 151.2 187.7 202.2 237.5Non-NBR Tax Revenue 4.8 4.6 5.8 15.3 7.5 17.6 15.9 13.0 9.6 10.0 11.1 12.2 Non-Tax Revenue/1 20.6 23.5 29.1 29.5 32.1 31.2 36.3 36.0 40.0 45.6 65.6 61.0Total Expenditure 155.5 162.5 203.7 220.1 231.6 240.8 258.6 297.8 344.6 374.0 407.6 437.1 Revenue Expenditure/2 79.5 84.7 91.1 101.5 117.1 123.0 142.3 165.6 182.0 205.4 227.0 252.9 ADP/3 56.6 62.9 87.9 101.2 98.7 108.9 108.7 123.3 152.2 159.0 150.5 169.0 Other Expenditure/4 19.4 14.9 24.8 17.5 15.9 8.9 7.6 8.9 10.5 9.6 30.1 15.2 Budget Deficit (excluding Grants) -56.7 -48.0 -78.8 -70.1 -78.3 -67.0 -68.4 -100.1 -143.9 -130.6 -128.6 -126.4 Budget Deficit (including Grants) -25.5 -16.0 -50.4 -34.3 -50.7 -35.6 -42.5 -70.9 -107.4 -103.4 -101.1 -101.9Financing 76.0 70.7 75.8 67.9 75.5 76.5 77.7 97.1 126.8 122.6 129.6 125.4 Net Foreign Financing 53.5 56.1 51.7 57.3 46.0 49.7 45.9 54.5 59.3 51.5 58.1 69.9Grants 31.2 32.0 28.4 35.8 27.6 31.4 25.9 29.2 36.5 27.2 27.5 24.5Loans 30.3 33.5 33.9 34.1 31.3 31.8 34.0 41.7 42.7 46.7 55.3 74.3 Pricipal Repayments -8.0 -9.4 -10.6 -12.6 -12.9 -13.5 -14.0 -16.4 -19.9 -22.4 -24.7 -28.9 Domestic Financing 22.5 14.6 24.1 10.6 29.5 26.8 31.8 42.6 67.5 71.1 71.5 55.5 Bank Loan 14.4 3.0 7.6 -0.7 17.0 17.1 12.6 19.8 35.2 29.0 24.8 12.5 Central Bank -4.8 2.5 -4.4 2.4 17.8 14.5 8.1 10.7 17.4 20.1 18.8 -30.0 Commercial Banks 19.2 0.5 12.0 -3.1 -0.9 2.6 4.5 9.1 17.9 9.0 6.0 42.5 Public Loan (Net) 8.1 11.7 16.5 11.2 12.5 9.7 19.2 22.9 32.3 42.1 46.7 43.0Imports 134.5 159.3 167.7 234.6 281.0 305.4 341.9 384.8 421.3 503.7 490.5 559.2Exports 75.9 92.6 101.0 139.3 158.8 188.1 234.2 254.9 288.2 348.6 343.7 379.2Trade Balance -58.6 -66.7 -66.7 -95.3 -122.2 -117.3 -107.7 -129.9 -133.1 -155.1 -146.8 -180.0Current Account Balance -4.6 -10.6 -4.1 -27.1 -38.9 -23.5 -11.7 -18.9 -0.9 -55.3 14.0 19.0Foreign Exchange Reserve(m. US$) 1608.0 2121.0 2765.0 3070.0 2039.0 1719.0 1739.0 1523.0 1602.0 1307.0 1583.0 2470Net Foreign Assets 40.3 60.8 91.5 104.6 67.4 65.5 67.9 64.0 85.7 74.9 95.9 140.9Broad Money (M2) 285.3 315.4 364.0 422.7 457.6 507.1 558.7 630.3 747.6 871.7 986.2 1140.0Inflation 4.6 2.7 3.3 8.9 6.7 2.5 7.0 8.9 3.4 1.6 2.4 5.1
Source: Bangladesh Bank, BBS, Finance Division, NBR, ERD and National Savings Board.
Note: Budget & Financing figures of 2002-03 are based on MTMF . 1. As per convention of IMF, the loss of Railway and Post Offices have not been deducted from the Tax Revenue. 2. The losses of Railway and Post Offices have been added and food subsidies have been deducted to revenue expenditure. 3. The amount of self financing has been deducted from ADP budget. 4. The expenditures on Food, Capital and Development have been included in "Other Expenditure".
192
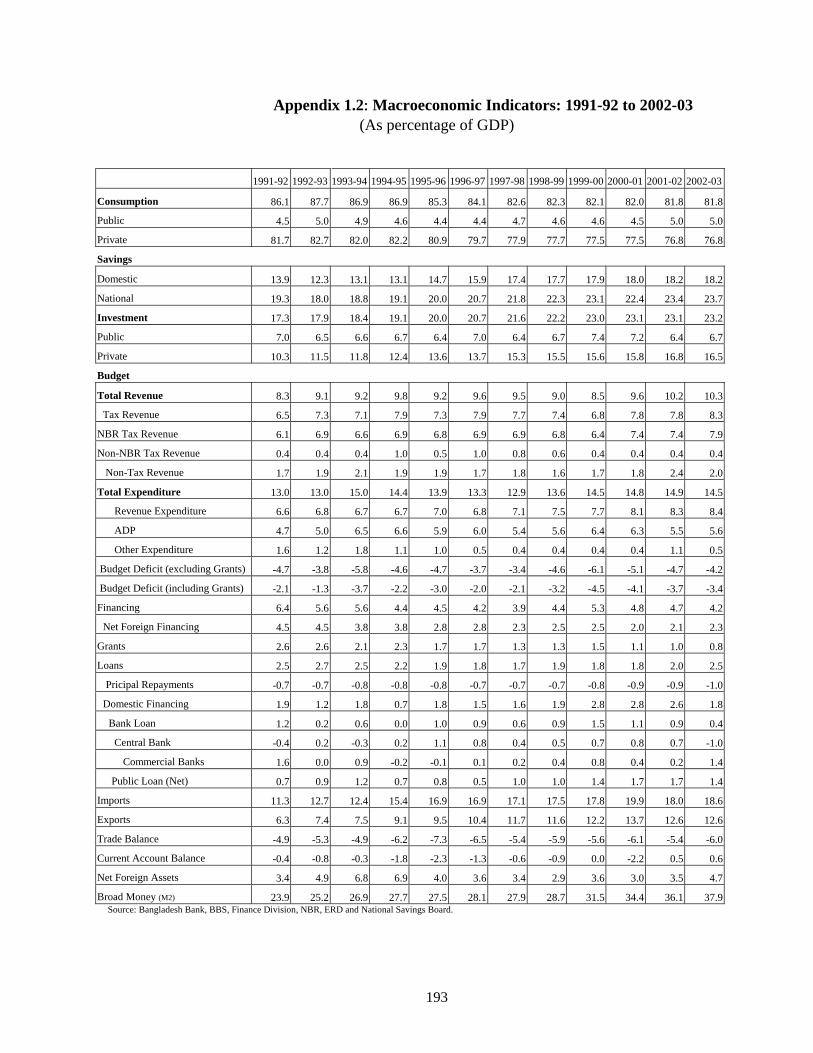
Appendix 1.2: Macroeconomic Indicators: 1991-92 to 2002-03 (As percentage of GDP)
1991-92 1992-93 1993-94 1994-95 1995-96 1996-97 1997-98 1998-99 1999-00 2000-01 2001-02 2002-03
Consumption 86.1 87.7 86.9 86.9 85.3 84.1 82.6 82.3 82.1 82.0 81.8 81.8
Public 4.5 5.0 4.9 4.6 4.4 4.4 4.7 4.6 4.6 4.5 5.0 5.0
Private 81.7 82.7 82.0 82.2 80.9 79.7 77.9 77.7 77.5 77.5 76.8 76.8
Savings
Domestic 13.9 12.3 13.1 13.1 14.7 15.9 17.4 17.7 17.9 18.0 18.2 18.2
National 19.3 18.0 18.8 19.1 20.0 20.7 21.8 22.3 23.1 22.4 23.4 23.7
Investment 17.3 17.9 18.4 19.1 20.0 20.7 21.6 22.2 23.0 23.1 23.1 23.2
Public 7.0 6.5 6.6 6.7 6.4 7.0 6.4 6.7 7.4 7.2 6.4 6.7
Private 10.3 11.5 11.8 12.4 13.6 13.7 15.3 15.5 15.6 15.8 16.8 16.5
Budget
Total Revenue 8.3 9.1 9.2 9.8 9.2 9.6 9.5 9.0 8.5 9.6 10.2 10.3
Tax Revenue 6.5 7.3 7.1 7.9 7.3 7.9 7.7 7.4 6.8 7.8 7.8 8.3
NBR Tax Revenue 6.1 6.9 6.6 6.9 6.8 6.9 6.9 6.8 6.4 7.4 7.4 7.9
Non-NBR Tax Revenue 0.4 0.4 0.4 1.0 0.5 1.0 0.8 0.6 0.4 0.4 0.4 0.4
Non-Tax Revenue 1.7 1.9 2.1 1.9 1.9 1.7 1.8 1.6 1.7 1.8 2.4 2.0
Total Expenditure 13.0 13.0 15.0 14.4 13.9 13.3 12.9 13.6 14.5 14.8 14.9 14.5
Revenue Expenditure 6.6 6.8 6.7 6.7 7.0 6.8 7.1 7.5 7.7 8.1 8.3 8.4
ADP 4.7 5.0 6.5 6.6 5.9 6.0 5.4 5.6 6.4 6.3 5.5 5.6
Other Expenditure 1.6 1.2 1.8 1.1 1.0 0.5 0.4 0.4 0.4 0.4 1.1 0.5
Budget Deficit (excluding Grants) -4.7 -3.8 -5.8 -4.6 -4.7 -3.7 -3.4 -4.6 -6.1 -5.1 -4.7 -4.2
Budget Deficit (including Grants) -2.1 -1.3 -3.7 -2.2 -3.0 -2.0 -2.1 -3.2 -4.5 -4.1 -3.7 -3.4
Financing 6.4 5.6 5.6 4.4 4.5 4.2 3.9 4.4 5.3 4.8 4.7 4.2
Net Foreign Financing 4.5 4.5 3.8 3.8 2.8 2.8 2.3 2.5 2.5 2.0 2.1 2.3
Grants 2.6 2.6 2.1 2.3 1.7 1.7 1.3 1.3 1.5 1.1 1.0 0.8
Loans 2.5 2.7 2.5 2.2 1.9 1.8 1.7 1.9 1.8 1.8 2.0 2.5
Pricipal Repayments -0.7 -0.7 -0.8 -0.8 -0.8 -0.7 -0.7 -0.7 -0.8 -0.9 -0.9 -1.0
Domestic Financing 1.9 1.2 1.8 0.7 1.8 1.5 1.6 1.9 2.8 2.8 2.6 1.8
Bank Loan 1.2 0.2 0.6 0.0 1.0 0.9 0.6 0.9 1.5 1.1 0.9 0.4
Central Bank -0.4 0.2 -0.3 0.2 1.1 0.8 0.4 0.5 0.7 0.8 0.7 -1.0
Commercial Banks 1.6 0.0 0.9 -0.2 -0.1 0.1 0.2 0.4 0.8 0.4 0.2 1.4
Public Loan (Net) 0.7 0.9 1.2 0.7 0.8 0.5 1.0 1.0 1.4 1.7 1.7 1.4
Imports 11.3 12.7 12.4 15.4 16.9 16.9 17.1 17.5 17.8 19.9 18.0 18.6
Exports 6.3 7.4 7.5 9.1 9.5 10.4 11.7 11.6 12.2 13.7 12.6 12.6
Trade Balance -4.9 -5.3 -4.9 -6.2 -7.3 -6.5 -5.4 -5.9 -5.6 -6.1 -5.4 -6.0
Current Account Balance -0.4 -0.8 -0.3 -1.8 -2.3 -1.3 -0.6 -0.9 0.0 -2.2 0.5 0.6
Net Foreign Assets 3.4 4.9 6.8 6.9 4.0 3.6 3.4 2.9 3.6 3.0 3.5 4.7
Broad Money (M2) 23.9 25.2 26.9 27.7 27.5 28.1 27.9 28.7 31.5 34.4 36.1 37.9Source: Bangladesh Bank, BBS, Finance Division, NBR, ERD and National Savings Board.
193
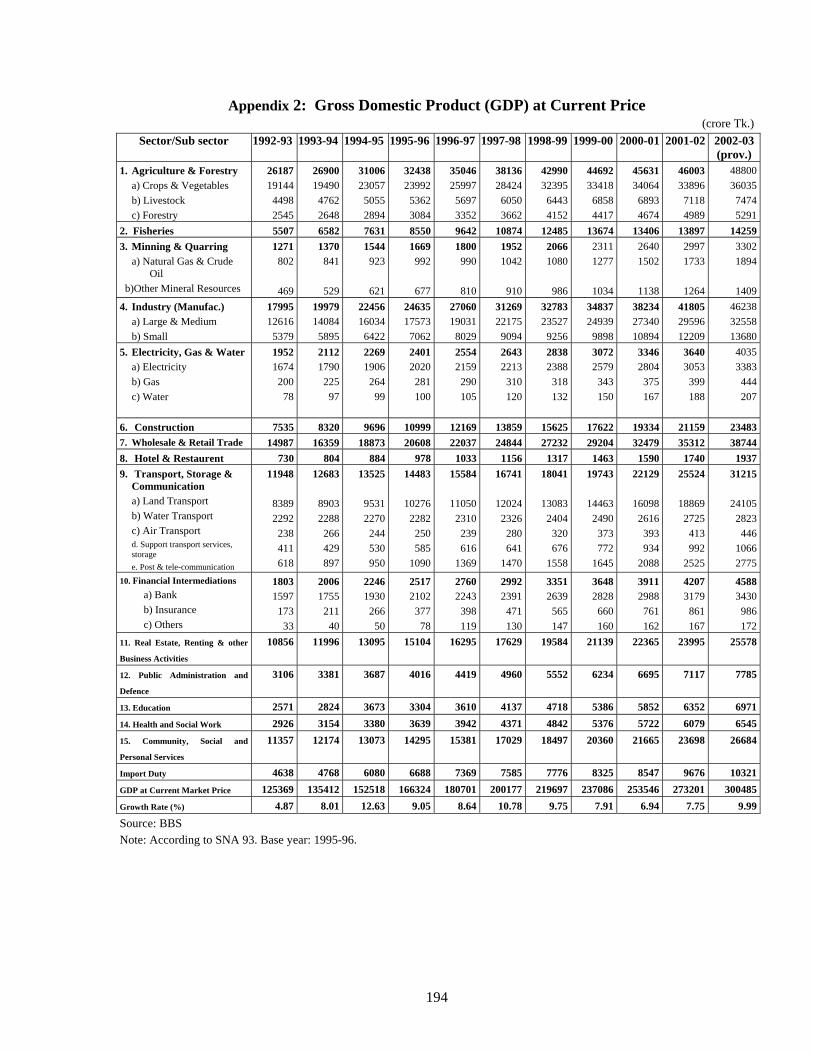
Appendix 2: Gross Domestic Product (GDP) at Current Price (crore Tk.)
Sector/Sub sector 1992-93 1993-94 1994-95 1995-96 1996-97 1997-98 1998-99
1999-00 2000-01
2001-02
2002-03 (prov.)
1. Agriculture & Forestry a) Crops & Vegetables b) Livestock c) Forestry
26187 19144
4498 2545
2690019490
47622648
3100623057
50552894
3243823992
53623084
3504625997
56973352
3813628424
60503662
4299032395
64434152
44692 33418
6858 4417
4563134064
68934674
4600333896
71184989
4880036035
74745291
2. Fisheries 5507 6582 7631 8550 9642 10874 12485 13674 13406 13897 142593. Minning & Quarring
a) Natural Gas & Crude Oil
b)Other Mineral Resources
1271 802
469
1370841
529
1544923
621
1669992
677
1800990
810
19521042
910
20661080
986
2311 1277
1034
26401502
1138
29971733
1264
33021894
14094. Industry (Manufac.)
a) Large & Medium b) Small
17995 12616
5379
1997914084
5895
2245616034
6422
2463517573
7062
2706019031
8029
3126922175
9094
3278323527
9256
34837 24939
9898
382342734010894
418052959612209
462383255813680
5. Electricity, Gas & Water a) Electricity b) Gas c) Water
1952 1674
200 78
21121790
22597
22691906
26499
24012020
281100
25542159
290105
26432213
310120
28382388
318132
3072 2579
343 150
33462804
375167
36403053
399188
40353383
444207
6. Construction 7535 8320 9696 10999 12169 13859 15625 17622 19334 21159 234837. Wholesale & Retail Trade 14987 16359 18873 20608 22037 24844 27232 29204 32479 35312 387448. Hotel & Restaurent 730 804 884 978 1033 1156 1317 1463 1590 1740 19379. Transport, Storage &
Communication a) Land Transport b) Water Transport c) Air Transport d. Support transport services, storage e. Post & tele-communication
11948
8389 2292
238 411 618
12683
89032288
266429897
13525
95312270
244530950
14483
102762282
250585
1090
15584
110502310
239616
1369
16741
120242326
280641
1470
18041
130832404
320676
1558
19743
14463 2490
373 772
1645
22129
160982616
393934
2088
25524
188692725
413992
2525
31215
241052823
44610662775
10. Financial Intermediations a) Bank b) Insurance c) Others
1803 1597
173 33
20061755
21140
22461930
26650
25172102
37778
27602243
398119
29922391
471130
33512639
565147
3648 2828
660 160
39112988
761162
42073179
861167
45883430
986172
11. Real Estate, Renting & other
Business Activities
10856 11996 13095 15104 16295 17629 19584 21139 22365 23995 25578
12. Public Administration and
Defence
3106 3381 3687 4016 4419 4960 5552 6234 6695 7117 7785
13. Education 2571 2824 3673 3304 3610 4137 4718 5386 5852 6352 697114. Health and Social Work 2926 3154 3380 3639 3942 4371 4842 5376 5722 6079 654515. Community, Social and
Personal Services
11357 12174 13073 14295 15381 17029 18497 20360 21665 23698 26684
Import Duty 4638 4768 6080 6688 7369 7585 7776 8325 8547 9676 10321GDP at Current Market Price 125369 135412 152518 166324 180701 200177 219697 237086 253546 273201 300485Growth Rate (%) 4.87 8.01 12.63 9.05 8.64 10.78 9.75 7.91 6.94 7.75 9.99
Source: BBS Note: According to SNA 93. Base year: 1995-96.
194
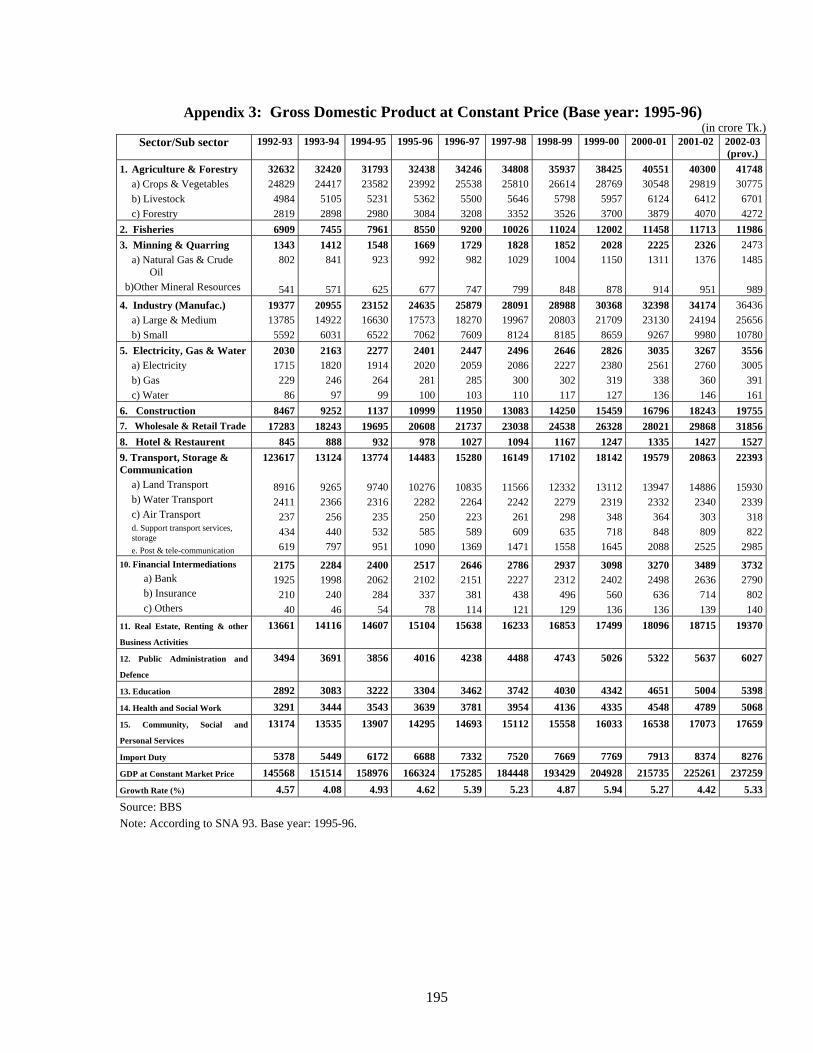
Appendix 3: Gross Domestic Product at Constant Price (Base year: 1995-96) (in crore Tk.)
Sector/Sub sector 1992-93 1993-94 1994-95 1995-96 1996-97 1997-98 1998-99
1999-00 2000-01
2001-02
2002-03 (prov.)
1. Agriculture & Forestry a) Crops & Vegetables b) Livestock c) Forestry
32632 24829
4984 2819
3242024417
51052898
3179323582
52312980
3243823992
53623084
3424625538
55003208
3480825810
56463352
35937 26614
5798 3526
38425 28769
5957 3700
4055130548
61243879
4030029819
64124070
4174830775
67014272
2. Fisheries 6909 7455 7961 8550 9200 10026 11024 12002 11458 11713 119863. Minning & Quarring
a) Natural Gas & Crude Oil
b)Other Mineral Resources
1343 802
541
1412841
571
1548923
625
1669992
677
1729982
747
18281029
799
1852 1004
848
2028 1150
878
22251311
914
23261376
951
24731485
9894. Industry (Manufac.)
a) Large & Medium b) Small
19377 13785
5592
2095514922
6031
2315216630
6522
2463517573
7062
2587918270
7609
2809119967
8124
28988 20803
8185
30368 21709
8659
3239823130
9267
3417424194
9980
364362565610780
5. Electricity, Gas & Water a) Electricity b) Gas c) Water
2030 1715
229 86
21631820
24697
22771914
26499
24012020
281100
24472059
285103
24962086
300110
2646 2227
302 117
2826 2380
319 127
30352561
338136
32672760
360146
35563005
391161
6. Construction 8467 9252 1137 10999 11950 13083 14250 15459 16796 18243 197557. Wholesale & Retail Trade 17283 18243 19695 20608 21737 23038 24538 26328 28021 29868 318568. Hotel & Restaurent 845 888 932 978 1027 1094 1167 1247 1335 1427 15279. Transport, Storage & Communication
a) Land Transport b) Water Transport c) Air Transport d. Support transport services, storage e. Post & tele-communication
123617
8916 2411
237 434 619
13124
92652366
256440797
13774
97402316
235532951
14483
102762282
250585
1090
15280
108352264
223589
1369
16149
115662242
261609
1471
17102
12332 2279
298 635
1558
18142
13112 2319
348 718
1645
19579
139472332
364848
2088
20863
148862340
303809
2525
22393
159302339
318822
298510. Financial Intermediations
a) Bank b) Insurance c) Others
2175 1925
210 40
22841998
24046
24002062
28454
25172102
33778
26462151
381114
27862227
438121
2937 2312
496 129
3098 2402
560 136
32702498
636136
34892636
714139
37322790
802140
11. Real Estate, Renting & other
Business Activities
13661 14116 14607 15104 15638 16233 16853 17499 18096 18715 19370
12. Public Administration and
Defence
3494 3691 3856 4016 4238 4488 4743 5026 5322 5637 6027
13. Education 2892 3083 3222 3304 3462 3742 4030 4342 4651 5004 539814. Health and Social Work 3291 3444 3543 3639 3781 3954 4136 4335 4548 4789 506815. Community, Social and
Personal Services
13174 13535 13907 14295 14693 15112 15558 16033 16538 17073 17659
Import Duty 5378 5449 6172 6688 7332 7520 7669 7769 7913 8374 8276GDP at Constant Market Price 145568 151514 158976 166324 175285 184448 193429 204928 215735 225261 237259Growth Rate (%) 4.57 4.08 4.93 4.62 5.39 5.23 4.87 5.94 5.27 4.42 5.33
Source: BBS Note: According to SNA 93. Base year: 1995-96.
195
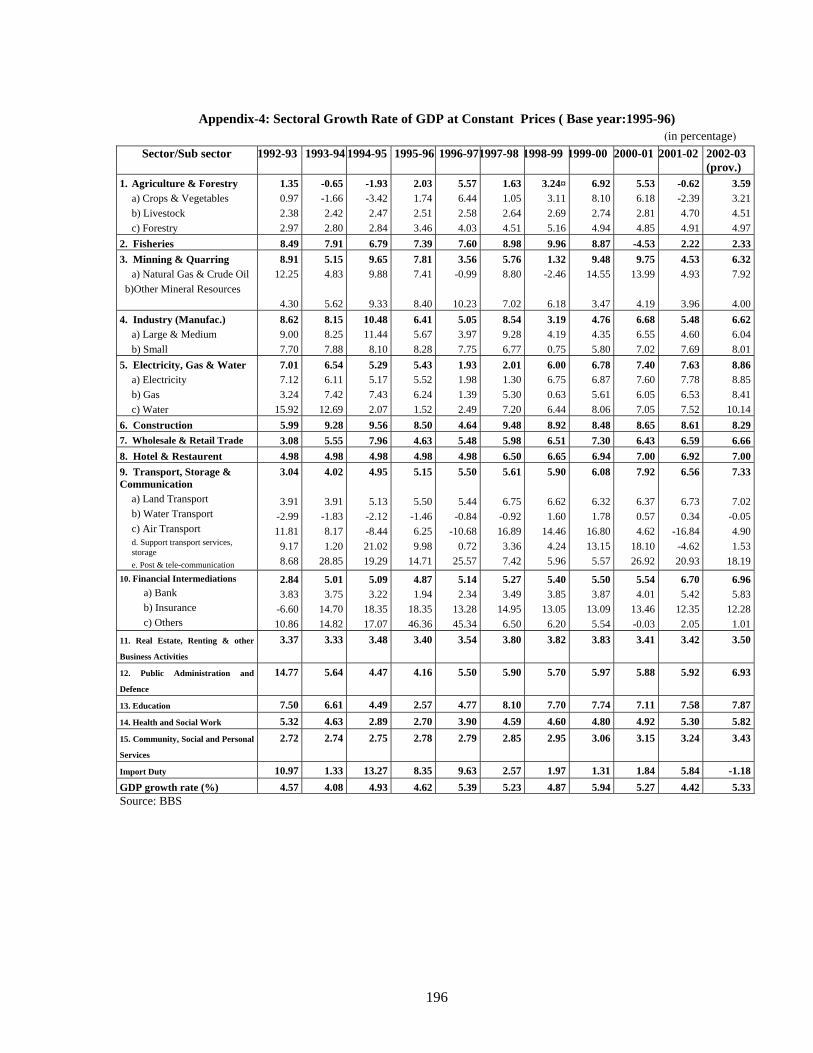
Appendix-4: Sectoral Growth Rate of GDP at Constant Prices ( Base year:1995-96)
(in percentage) Sector/Sub sector 1992-93 1993-94 1994-95 1995-96 1996-971997-98 1998-99 1999-00 2000-01 2001-02 2002-03
(prov.) 1. Agriculture & Forestry a) Crops & Vegetables b) Livestock c) Forestry
1.35 0.97 2.38 2.97
-0.65-1.662.422.80
-1.93-3.422.472.84
2.031.742.513.46
5.576.442.584.03
1.631.052.64
3.24¤3.112.695.16
6.92 8.10 2.74 4.94
5.536.182.814.85
-0.62
4.51
-2.394.704.91
3.593.214.514.97
2. Fisheries 8.49 7.91 6.79 7.39 7.60 8.98 9.96 8.87 -4.53 2.22 2.333. Minning & Quarring
a) Natural Gas & Crude Oil b)Other Mineral Resources
8.91 12.25
4.30
5.154.83
5.62
9.659.88
9.33
7.817.41
8.40
3.56-0.99
10.23
5.768.80
7.02
1.32-2.46
9.48 14.55
3.47
9.7513.99
4.19
4.534.93
3.96
6.32
6.18
7.92
4.004. Industry (Manufac.)
a) Large & Medium b) Small
8.62 9.00 7.70
8.158.25
10.4811.44
8.10
6.415.678.28
5.053.977.75
8.549.286.77
3.194.190.75
4.76 4.35 5.80
6.686.557.02
5.484.607.69
6.626.04
7.88 8.015. Electricity, Gas & Water
a) Electricity b) Gas c) Water
7.01 7.12 3.24
15.92
6.546.11
7.407.606.057.05
7.637.786.537.52
8.868.858.41
10.14
2.011.305.307.20
6.006.750.636.44
6.78 6.87 5.61 8.06
7.4212.69
5.295.177.432.07
5.435.526.241.52
1.931.981.392.49
6. Construction 5.99 9.28 9.56 8.50 4.64 9.48 8.92 8.48 8.65 8.61 8.293.08 5.55 7.96 4.63 5.48 5.98 6.51 7.30 6.43 6.59 6.667. Wholesale & Retail Trade
8. Hotel & Restaurent 4.98 4.98 4.98 4.98 4.98 6.50 6.65 6.94 7.00 6.92 7.009. Transport, Storage & Communication
a) Land Transport b) Water Transport c) Air Transport d. Support transport services, storage e. Post & tele-communication
3.04
3.91 -2.99 11.81
9.17 8.68
4.02
3.91-1.838.171.20
28.85
4.95
5.13-2.12-8.4421.0219.29
5.15
5.50-1.466.259.98
14.71
5.50
5.44-0.84
-10.680.72
25.57
5.61
6.75-0.9216.89
3.367.42
5.90
6.621.60
14.464.245.96
6.08
6.32 1.78
16.80 13.15
5.57
7.92
6.370.574.62
18.1026.92
6.56
6.730.34
-16.84-4.6220.93
7.33
7.02-0.054.901.53
18.1910. Financial Intermediations
a) Bank b) Insurance c) Others
2.84 3.83
-6.60 10.86
5.013.75
14.7014.82
5.093.22
18.3517.07
4.871.94
18.3546.36
5.142.34
13.2845.34
5.273.49
14.956.50
5.403.85
13.056.20
5.50 3.87
13.09 5.54
5.544.01
13.46-0.03
6.705.42
12.352.05
6.965.83
12.281.01
11. Real Estate, Renting & other
Business Activities
3.37 3.33 3.48 3.40 3.54 3.80 3.82 3.83 3.41 3.42 3.50
12. Public Administration and
Defence
14.77 5.64 4.47 4.16 5.50 5.90 5.70 5.97 5.88 5.92 6.93
13. Education 7.50 6.61 4.49 2.57 4.77 8.10 7.70 7.74 7.11 7.58 7.8714. Health and Social Work 5.32 4.63 2.89 2.70 3.90 4.59 4.60 4.80 4.92 5.30 5.8215. Community, Social and Personal
Services
2.72 2.74 2.75 2.78 2.79 2.85 2.95 3.06 3.15 3.24 3.43
Import Duty 10.97 1.33 13.27 8.35 9.63 2.57 1.97 1.31 1.84 5.84 -1.18GDP growth rate (%) 4.57 4.08 4.93 4.62 5.39 5.23 4.87 5.94 5.27 4.42 5.33Source: BBS
196
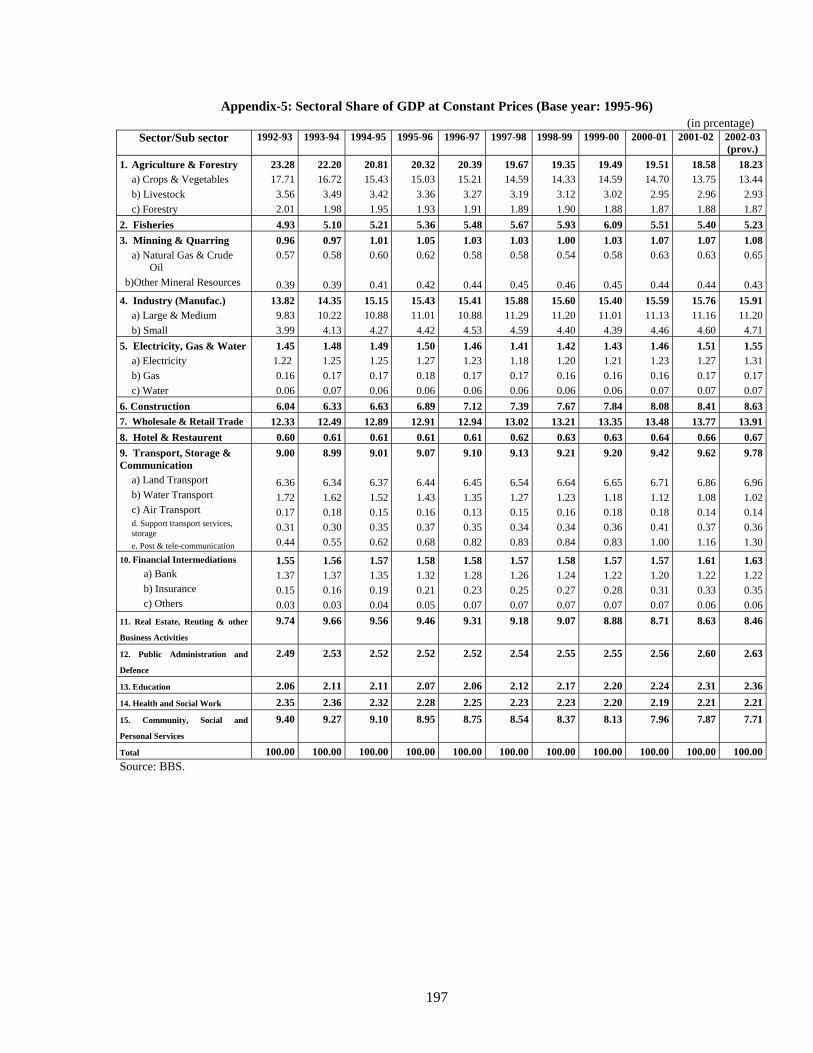
Appendix-5: Sectoral Share of GDP at Constant Prices (Base year: 1995-96) (in prcentage)
Sector/Sub sector 1992-93 1993-94 1994-95 1995-96 1996-97 1997-98 1998-99
1999-00 2000-01
2001-02
2002-03 (prov.)
1. Agriculture & Forestry a) Crops & Vegetables b) Livestock c) Forestry
23.28 17.71
3.56 2.01
22.2016.72
3.491.98
20.8115.43
3.421.95
20.3215.03
3.361.93
20.3915.21
3.271.91
19.6714.59
3.191.89
19.35 14.33
3.12 1.90
19.49 14.59
3.02 1.88
19.5114.70
2.951.87
18.5813.75
2.961.88
18.2313.44
2.931.87
2. Fisheries 4.93 5.10 5.21 5.36 5.48 5.67 5.93 6.09 5.51 5.40 5.233. Minning & Quarring
a) Natural Gas & Crude Oil
b)Other Mineral Resources
0.96 0.57
0.39
0.970.58
0.39
1.010.60
0.41
1.050.62
0.42
1.030.58
0.44
1.030.58
0.45
1.00 0.54
0.46
1.03 0.58
0.45
1.070.63
0.44
1.070.63
0.44
1.080.65
0.434. Industry (Manufac.)
a) Large & Medium b) Small
13.82 9.83 3.99
14.3510.22
4.13
15.1510.88
4.27
15.4311.01
4.42
15.4110.88
4.53
15.8811.29
4.59
15.60 11.20
4.40
15.40 11.01
4.39
15.5911.13
4.46
15.7611.16
4.60
15.9111.20
4.715. Electricity, Gas & Water
a) Electricity b) Gas c) Water
1.45 1.22
0.16 0.06
1.48 1.25
0.170.07
1.491.250.170.06
1.501.270.180.06
1.461.230.170.06
1.411.180.170.06
1.42 1.20 0.16 0.06
1.43 1.21 0.16 0.06
1.461.230.160.07
1.511.270.170.07
1.551.310.170.07
6. Construction 6.04 6.33 6.63 6.89 7.12 7.39 7.67 7.84 8.08 8.41 8.637. Wholesale & Retail Trade 12.33 12.49 12.89 12.91 12.94 13.02 13.21 13.35 13.48 13.77 13.918. Hotel & Restaurent 0.60 0.61 0.61 0.61 0.61 0.62 0.63 0.63 0.64 0.66 0.679. Transport, Storage & Communication
a) Land Transport b) Water Transport c) Air Transport d. Support transport services, storage e. Post & tele-communication
9.00
6.36 1.72 0.17 0.31 0.44
8.99
6.341.620.180.300.55
9.01
6.371.520.150.350.62
9.07
6.441.430.160.370.68
9.10
6.451.350.130.350.82
9.13
6.541.270.150.340.83
9.21
6.64 1.23 0.16 0.34 0.84
9.20
6.65 1.18 0.18 0.36 0.83
9.42
6.711.120.180.411.00
9.62
6.861.080.140.371.16
9.78
6.961.020.140.361.30
10. Financial Intermediations a) Bank b) Insurance c) Others
1.55 1.37 0.15 0.03
1.561.370.160.03
1.571.350.190.04
1.581.320.210.05
1.581.280.230.07
1.571.260.250.07
1.58 1.24 0.27 0.07
1.57 1.22 0.28 0.07
1.571.200.310.07
1.611.220.330.06
1.631.220.350.06
11. Real Estate, Renting & other
Business Activities
9.74 9.66 9.56 9.46 9.31 9.18 9.07 8.88 8.71 8.63 8.46
12. Public Administration and
Defence
2.49 2.53 2.52 2.52 2.52 2.54 2.55 2.55 2.56 2.60 2.63
13. Education 2.06 2.11 2.11 2.07 2.06 2.12 2.17 2.20 2.24 2.31 2.3614. Health and Social Work 2.35 2.36 2.32 2.28 2.25 2.23 2.23 2.20 2.19 2.21 2.2115. Community, Social and
Personal Services
9.40 9.27 9.10 8.95 8.75 8.54 8.37 8.13 7.96 7.87 7.71
Total 100.00 100.00 100.00 100.00 100.00 100.00 100.00 100.00 100.00 100.00 100.00Source: BBS.
197
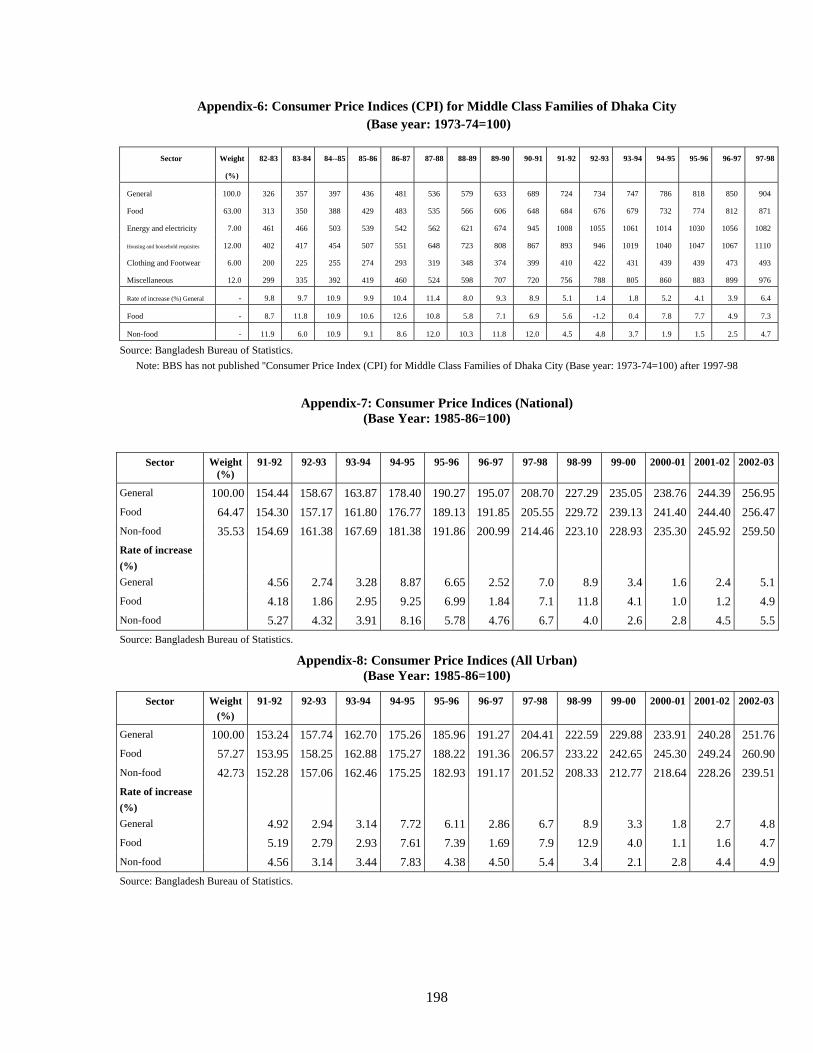
Appendix-6: Consumer Price Indices (CPI) for Middle Class Families of Dhaka City (Base year: 1973-74=100)
Sector Weight
(%)
82-83 83-84 84--85 85-86 86-87 87-88 88-89 89-90 90-91 91-92 92-93 93-94 94-95 95-96 96-97 97-98
General 100.0 326 357 397 436 481 536 579 633 689 724 734 747 786 818 850 904
Food 63.00 313 350 388 429 483 535 566 606 648 684 676 679 732 774 812 871
Energy and electricity 7.00 461 466 503 539 542 562 621 674 945 1008 1055 1061 1014 1030 1056 1082
Housing and household requisites 12.00 402 417 454 507 551 648 723 808 867 893 946 1019 1040 1047 1067 1110
Clothing and Footwear 6.00 200 225 255 274 293 319 348 374 399 410 422 431 439 439 473 493
Miscellaneous 12.0 299 335 392 419 460 524 598 707 720 756 788 805 860 883 899 976
Rate of increase (%) General - 9.8 9.7 10.9 9.9 10.4 11.4 8.0 9.3 8.9 5.1 1.4 1.8 5.2 4.1 3.9 6.4
Food - 8.7 11.8 10.9 10.6 12.6 10.8 5.8 7.1 6.9 5.6 -1.2 0.4 7.8 7.7 4.9 7.3
Non-food - 11.9 6.0 10.9 9.1 8.6 12.0 10.3 11.8 12.0 4.5 4.8 3.7 1.9 1.5 2.5 4.7
Source: Bangladesh Bureau of Statistics. Note: BBS has not published ''Consumer Price Index (CPI) for Middle Class Families of Dhaka City (Base year: 1973-74=100) after 1997-98
Appendix-7: Consumer Price Indices (National) (Base Year: 1985-86=100)
Sector Weight (%)
91-92 92-93 93-94 94-95 95-96 96-97 97-98 98-99 99-00 2000-01 2001-02 2002-03
General 100.00 154.44 158.67 163.87 178.40 190.27 195.07 208.70 227.29 235.05 238.76 244.39 256.95Food 64.47 154.30 157.17 161.80 176.77 189.13 191.85 205.55 229.72 239.13 241.40 244.40 256.47Non-food 35.53 154.69 161.38 167.69 181.38 191.86 200.99 214.46 223.10 228.93 235.30 245.92 259.50Rate of increase (%)
General 4.56 2.74 3.28 8.87 6.65 2.52 7.0 8.9 3.4 1.6 2.4 5.1Food 4.18 1.86 2.95 9.25 6.99 1.84 7.1 11.8 4.1 1.0 1.2 4.9Non-food 5.27 4.32 3.91 8.16 5.78 4.76 6.7 4.0 2.6 2.8 4.5 5.5Source: Bangladesh Bureau of Statistics.
Appendix-8: Consumer Price Indices (All Urban) (Base Year: 1985-86=100)
Sector Weight (%)
91-92 92-93 93-94 94-95 95-96 96-97 97-98 98-99 99-00 2000-01 2001-02 2002-03
General 100.00 153.24 157.74 162.70 175.26 185.96 191.27 204.41 222.59 229.88 233.91 240.28 251.76Food 57.27 153.95 158.25 162.88 175.27 188.22 191.36 206.57 233.22 242.65 245.30 249.24 260.90Non-food 42.73 152.28 157.06 162.46 175.25 182.93 191.17 201.52 208.33 212.77 218.64 228.26 239.51Rate of increase (%)
General 4.92 2.94 3.14 7.72 6.11 2.86 6.7 8.9 3.3 1.8 2.7 4.8Food 5.19 2.79 2.93 7.61 7.39 1.69 7.9 12.9 4.0 1.1 1.6 4.7Non-food 4.56 3.14 3.44 7.83 4.38 4.50 5.4 3.4 2.1 2.8 4.4 4.9Source: Bangladesh Bureau of Statistics.
198
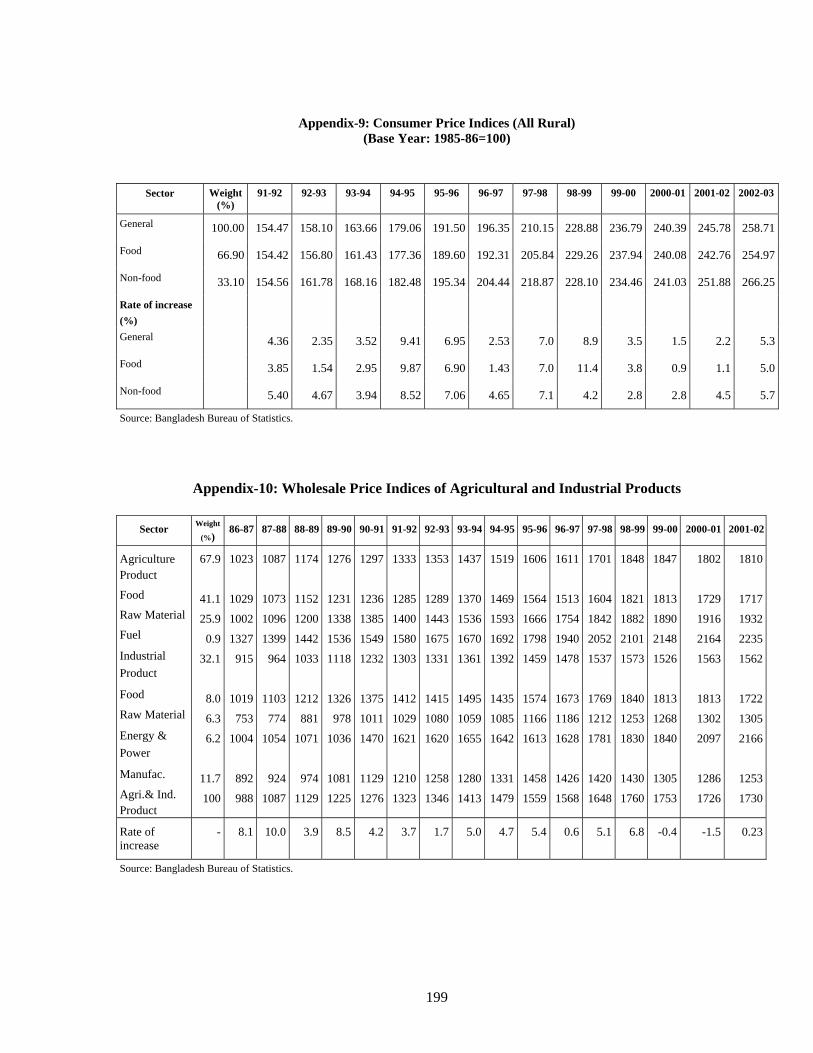
Appendix-9: Consumer Price Indices (All Rural)
(Base Year: 1985-86=100)
Sector Weight (%)
91-92 92-93 93-94 94-95 95-96 96-97 97-98 98-99 99-00 2000-01 2001-02 2002-03
General 100.00 154.47 158.10 163.66 179.06 191.50 196.35 210.15 228.88 236.79 240.39 245.78 258.71
Food 66.90 154.42 156.80 161.43 177.36 189.60 192.31 205.84 229.26 237.94 240.08 242.76 254.97
Non-food 33.10 154.56 161.78 168.16 182.48 195.34 204.44 218.87 228.10 234.46 241.03 251.88 266.25
Rate of increase (%)
General 4.36 2.35 3.52 9.41 6.95 2.53 7.0 8.9 3.5 1.5 2.2 5.3
Food 3.85 1.54 2.95 9.87 6.90 1.43 7.0 11.4 3.8 0.9 1.1 5.0
Non-food 5.40 4.67 3.94 8.52 7.06 4.65 7.1 4.2 2.8 2.8 4.5 5.7
Source: Bangladesh Bureau of Statistics.
Appendix-10: Wholesale Price Indices of Agricultural and Industrial Products
Sector Weight
(%) 86-87 87-88 88-89 89-90 90-91 91-92 92-93 93-94 94-95 95-96 96-97 97-98 98-99 99-00 2000-01 2001-02
Agriculture Product
Food
Raw Material
Fuel
Industrial Product
Food
Raw Material
Energy & Power
Manufac.
Agri.& Ind. Product
67.9
41.1
25.9
0.9
32.1
8.0
6.3
6.2
11.7
100
1023
1029
1002
1327
915
1019
753
1004
892
988
1087
1073
1096
1399
964
1103
774
1054
924
1087
1174
1152
1200
1442
1033
1212
881
1071
974
1129
1276
1231
1338
1536
1118
1326
978
1036
1081
1225
1297
1236
1385
1549
1232
1375
1011
1470
1129
1276
1333
1285
1400
1580
1303
1412
1029
1621
1210
1323
1353
1289
1443
1675
1331
1415
1080
1620
1258
1346
1437
1370
1536
1670
1361
1495
1059
1655
1280
1413
1519
1469
1593
1692
1392
1435
1085
1642
1331
1479
1606
1564
1666
1798
1459
1574
1166
1613
1458
1559
1611
1513
1754
1940
1478
1673
1186
1628
1426
1568
1701
1604
1842
2052
1537
1769
1212
1781
1420
1648
1848
1821
1882
2101
1573
1840
1253
1830
1430
1760
1847
1813
1890
2148
1526
1813
1268
1840
1305
1753
1802
1729
1916
2164
1563
1813
1302
2097
1286
1726
1810
1717
1932
2235
1562
1722
1305
2166
1253
1730
Rate of increase
- 8.1 10.0 3.9 8.5 4.2 3.7 1.7 5.0 4.7 5.4 0.6 5.1 6.8 -0.4 -1.5 0.23
Source: Bangladesh Bureau of Statistics.
199
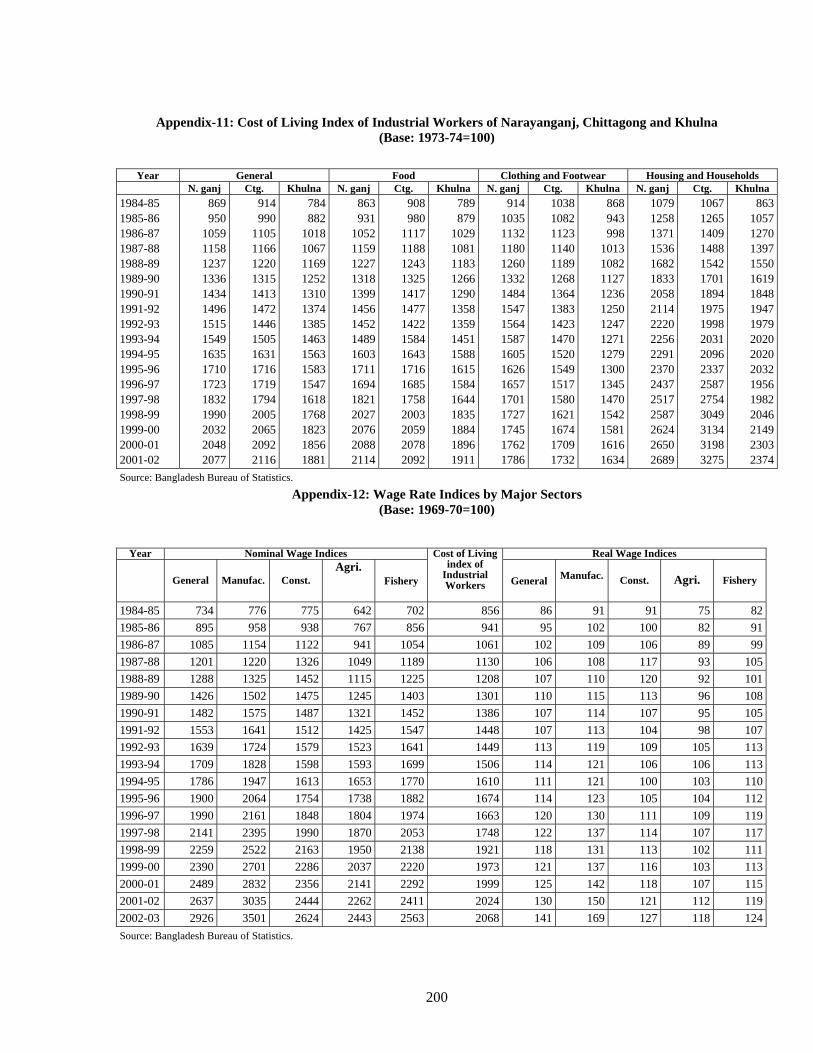
Appendix-11: Cost of Living Index of Industrial Workers of Narayanganj, Chittagong and Khulna
(Base: 1973-74=100)
Year General Food Clothing and Footwear Housing and Households N. ganj Ctg. Khulna N. ganj Ctg. Khulna N. ganj Ctg. Khulna N. ganj Ctg. Khulna
1984-85 1985-86 1986-87 1987-88 1988-89 1989-90 1990-91 1991-92 1992-93 1993-94 1994-95 1995-96 1996-97 1997-98 1998-99 1999-00 2000-01 2001-02
869 950
1059 1158 1237 1336 1434 1496 1515 1549 1635 1710 1723 1832 1990 2032 2048 2077
914 990
1105 1166 1220 1315 1413 1472 1446 1505 1631 1716 1719 1794 2005 2065 2092 2116
784 882
1018 1067 1169 1252 1310 1374 1385 1463 1563 1583 1547 1618 1768 1823 1856 1881
863931
1052115912271318139914561452148916031711169418212027207620882114
908980
1117118812431325141714771422158416431716168517582003205920782092
789879
1029108111831266129013581359145115881615158416441835188418961911
91410351132118012601332148415471564158716051626165717011727174517621786
1038 1082 1123 1140 1189 1268 1364 1383 1423 1470 1520 1549 1517 1580 1621 1674 1709 1732
868 943 998
1013 1082 1127 1236 1250 1247 1271 1279 1300 1345 1470 1542 1581 1616 1634
107912581371153616821833205821142220225622912370243725172587262426502689
106712651409148815421701189419751998203120962337258727543049313431983275
86310571270139715501619184819471979202020202032195619822046214923032374
Source: Bangladesh Bureau of Statistics.
Appendix-12: Wage Rate Indices by Major Sectors (Base: 1969-70=100)
Year Nominal Wage Indices Real Wage Indices
General Manufac. Const. Agri.
Fishery
Cost of Living index of
Industrial Workers
General
Manufac. Const. Agri. Fishery
1984-85 734 776 775 642 702 856 86 91 91 75 821985-86 895 958 938 767 856 941 95 102 100 82 911986-87 1085 1154 1122 941 1054 1061 102 109 106 89 991987-88 1201 1220 1326 1049 1189 1130 106 108 117 93 1051988-89 1288 1325 1452 1115 1225 1208 107 110 120 92 1011989-90 1426 1502 1475 1245 1403 1301 110 115 113 96 1081990-91 1482 1575 1487 1321 1452 1386 107 114 107 95 1051991-92 1553 1641 1512 1425 1547 1448 107 113 104 98 1071992-93 1639 1724 1579 1523 1641 1449 113 119 109 105 1131993-94 1709 1828 1598 1593 1699 1506 114 121 106 106 1131994-95 1786 1947 1613 1653 1770 1610 111 121 100 103 1101995-96 1900 2064 1754 1738 1882 1674 114 123 105 104 1121996-97 1990 2161 1848 1804 1974 1663 120 130 111 109 1191997-98 2141 2395 1990 1870 2053 1748 122 137 114 107 1171998-99 2259 2522 2163 1950 2138 1921 118 131 113 102 1111999-00 2390 2701 2286 2037 2220 1973 121 137 116 103 1132000-01 2489 2832 2356 2141 2292 1999 125 142 118 107 1152001-02 2637 3035 2444 2262 2411 2024 130 150 121 112 1192002-03 2926 3501 2624 2443 2563 2068 141 169 127 118 124Source: Bangladesh Bureau of Statistics.
200
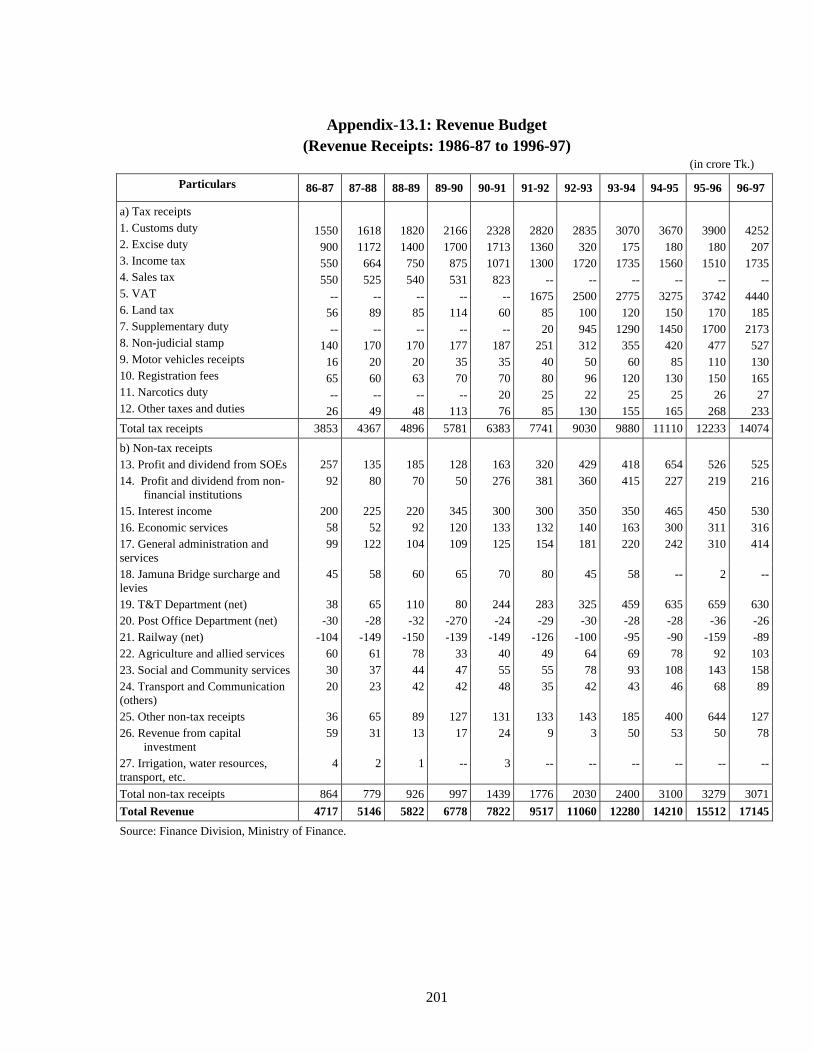
Appendix-13.1: Revenue Budget (Revenue Receipts: 1986-87 to 1996-97)
(in crore Tk.)
Particulars 86-87 87-88 88-89 89-90 90-91 91-92 92-93 93-94 94-95 95-96 96-97
a) Tax receipts 1. Customs duty 2. Excise duty 3. Income tax 4. Sales tax 5. VAT 6. Land tax 7. Supplementary duty 8. Non-judicial stamp 9. Motor vehicles receipts 10. Registration fees 11. Narcotics duty 12. Other taxes and duties
1550900550550
--56--
1401665--
26
16181172664525
--89--
1702060--
49
18201400750540
--85--
1702063--
48
21661700875531
--114
--1773570--
113
232817131071823
--60--
18735702076
282013601300
--1675
8520
25140802585
2835 320
1720 --
2500 100 945 312 50 96 22
130
3070 175
1735 --
2775 120
1290 355 60
120 25
155
3670180
1560--
3275150
145042085
13025
165
3900180
1510--
3742170
170047711015026
268
4252207
1735--
4440185
217352713016527
233Total tax receipts 3853 4367 4896 5781 6383 7741 9030 9880 11110 12233 14074
b) Non-tax receipts 13. Profit and dividend from SOEs 257 135 185 128 163 320 429 418 654 526 52514. Profit and dividend from non-
financial institutions 92 80 70 50 276 381 360 415 227 219 216
15. Interest income 200 225 220 345 300 300 350 350 465 450 53016. Economic services 58 52 92 120 133 132 140 163 300 311 31617. General administration and services
99 122 104 109 125 154 181 220 242 310 414
18. Jamuna Bridge surcharge and levies
45 58 60 65 70 80 45 58 -- 2 --
19. T&T Department (net) 38 65 110 80 244 283 325 459 635 659 63020. Post Office Department (net) -30 -28 -32 -270 -24 -29 -30 -28 -28 -36 -2621. Railway (net) -104 -149 -150 -139 -149 -126 -100 -95 -90 -159 -8922. Agriculture and allied services 60 61 78 33 40 49 64 69 78 92 10323. Social and Community services 30 37 44 47 55 55 78 93 108 143 15824. Transport and Communication (others)
20 23 42 42 48 35 42 43 46 68 89
25. Other non-tax receipts 36 65 89 127 131 133 143 185 400 644 12726. Revenue from capital
investment 59 31 13 17 24 9 3 50 53 50 78
27. Irrigation, water resources, transport, etc.
4 2 1 -- 3 -- -- -- -- -- --
Total non-tax receipts 864 779 926 997 1439 1776 2030 2400 3100 3279 3071Total Revenue 4717 5146 5822 6778 7822 9517 11060 12280 14210 15512 17145Source: Finance Division, Ministry of Finance.
201
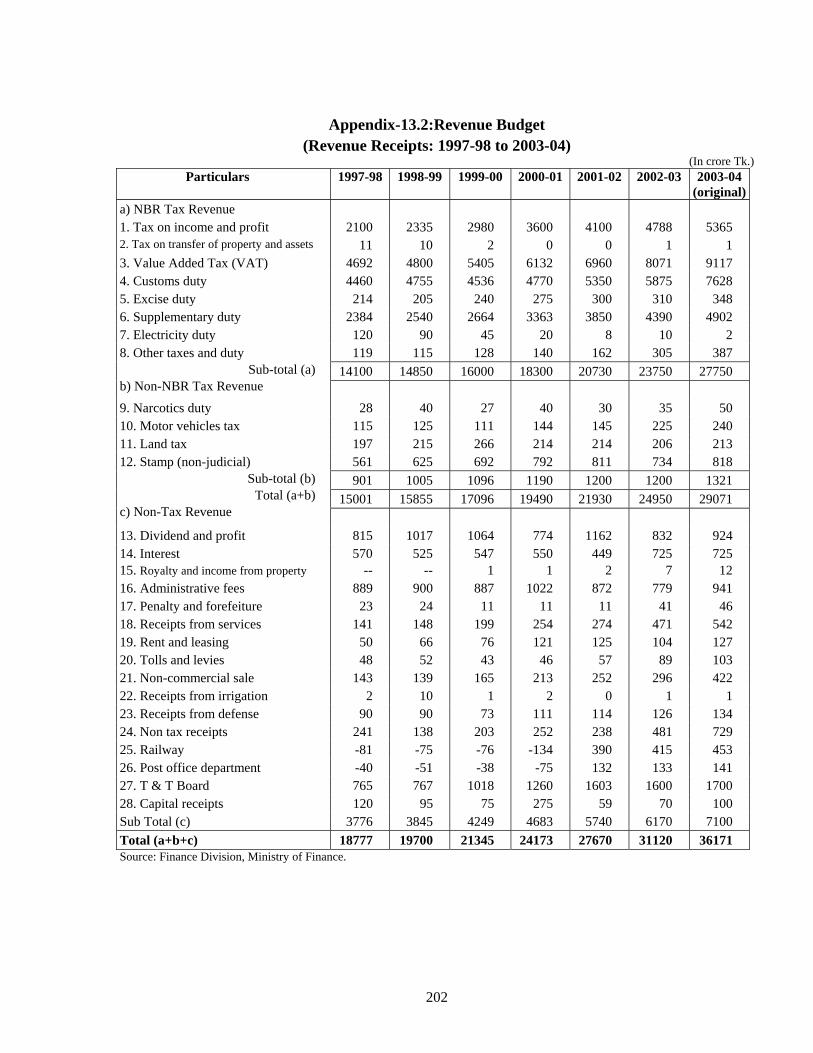
Appendix-13.2:Revenue Budget
(Revenue Receipts: 1997-98 to 2003-04) (In crore Tk.)
Particulars 1997-98
1998-99
1999-00 2000-01
2001-02
2002-03 2003-04 (original)
a) NBR Tax Revenue 1. Tax on income and profit 2100 2335 2980 3600 4100 4788 5365 2. Tax on transfer of property and assets 11 10 2 0 0 1 1 3. Value Added Tax (VAT) 4692 4800 5405 6132 6960 8071 9117 4. Customs duty 4460 4755 4536 4770 5350 5875 7628 5. Excise duty 214 205 240 275 300 310 348 6. Supplementary duty 2384 2540 2664 3363 3850 4390 4902 7. Electricity duty 120 90 45 20 8 10 2
119 115 128 140 162 305 387 14100 14850 16000 18300 20730 23750 27750
8. Other taxes and duty Sub-total (a)
b) Non-NBR Tax Revenue 9. Narcotics duty 28 40 27 40 30 35 50 10. Motor vehicles tax 115 125 111 144 145 225 240 11. Land tax 197 215 266 214 214 206 213
561 625 692 792 811 734 818 901 1005 1096 1190 1200 1200 1321
15001 15855 17096 19490 21930 24950 29071
12. Stamp (non-judicial) Sub-total (b)
Total (a+b) c) Non-Tax Revenue 13. Dividend and profit 815 1017 1064 774 1162 832 924 14. Interest 15. Royalty and income from property
570 --
525 --
547 1
550 1
449 2
725 7
725 12
16. Administrative fees 889 900 887 1022 872 779 941 17. Penalty and forefeiture 23 24 11 11 11 41 46 18. Receipts from services 141 148 199 254 274 471 542 19. Rent and leasing 50 66 76 121 125 104 127 20. Tolls and levies 48 52 43 46 57 89 103 21. Non-commercial sale 143 139 165 213 252 296 422 22. Receipts from irrigation 2 10 1 2 0 1 1 23. Receipts from defense 90 90 73 111 114 126 134 24. Non tax receipts 241 138 203 252 238 481 729 25. Railway -81 -75 -76 -134 390 415 453 26. Post office department -40 -51 -38 -75 132 133 141 27. T & T Board 765 767 1018 1260 1603 1600 1700 28. Capital receipts 120 95 75 275 59 70 100 Sub Total (c) 3776 3845 4249 4683 5740 6170 7100 Total (a+b+c) 18777 19700 21345 24173 27670 31120 36171 Source: Finance Division, Ministry of Finance.
202
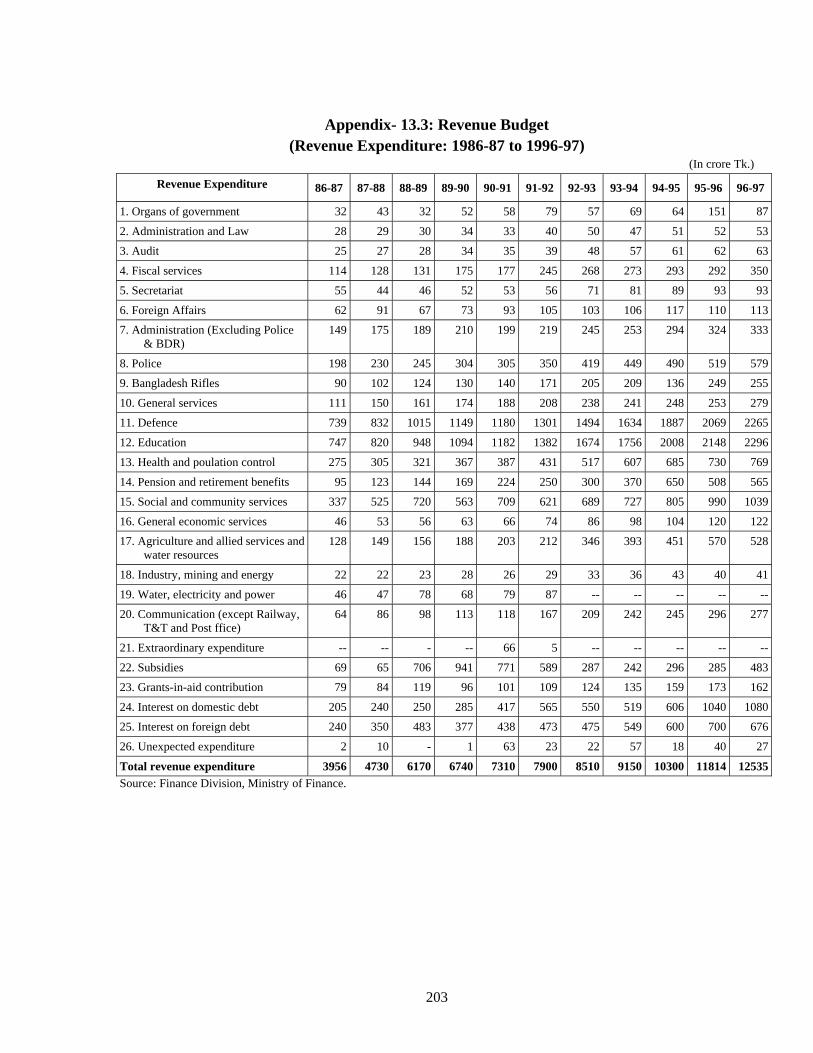
Appendix- 13.3: Revenue Budget
(Revenue Expenditure: 1986-87 to 1996-97) (In crore Tk.)
Revenue Expenditure 86-87 87-88 88-89 89-90 90-91 91-92 92-93 93-94 94-95 95-96 96-97
1. Organs of government 32 43 32 52 58 79 57 69 64 151 87
2. Administration and Law 28 29 30 34 33 40 50 47 51 52 53
3. Audit 25 27 28 34 35 39 48 57 61 62 63
4. Fiscal services 114 128 131 175 177 245 268 273 293 292 350
5. Secretariat 55 44 46 52 53 56 71 81 89 93 93
6. Foreign Affairs 62 91 67 73 93 105 103 106 117 110 113
7. Administration (Excluding Police & BDR)
149 175 189 210 199 219 245 253 294 324 333
8. Police 198 230 245 304 305 350 419 449 490 519 579
9. Bangladesh Rifles 90 102 124 130 140 171 205 209 136 249 255
10. General services 111 150 161 174 188 208 238 241 248 253 279
11. Defence 739 832 1015 1149 1180 1301 1494 1634 1887 2069 2265
12. Education 747 820 948 1094 1182 1382 1674 1756 2008 2148 2296
13. Health and poulation control 275 305 321 367 387 431 517 607 685 730 769
14. Pension and retirement benefits 95 123 144 169 224 250 300 370 650 508 565
15. Social and community services 337 525 720 563 709 621 689 727 805 990 1039
16. General economic services 46 53 56 63 66 74 86 98 104 120 122
17. Agriculture and allied services and water resources
128 149 156 188 203 212 346 393 451 570 528
18. Industry, mining and energy 22 22 23 28 26 29 33 36 43 40 41
19. Water, electricity and power 46 47 78 68 79 87 -- -- -- -- --
20. Communication (except Railway, T&T and Post ffice)
64 86 98 113 118 167 209 242 245 296 277
21. Extraordinary expenditure -- -- - -- 66 5 -- -- -- -- --
22. Subsidies 69 65 706 941 771 589 287 242 296 285 483
23. Grants-in-aid contribution 79 84 119 96 101 109 124 135 159 173 162
24. Interest on domestic debt 205 240 250 285 417 565 550 519 606 1040 1080
25. Interest on foreign debt 240 350 483 377 438 473 475 549 600 700 676
26. Unexpected expenditure 2 10 - 1 63 23 22 57 18 40 27
Total revenue expenditure 3956 4730 6170 6740 7310 7900 8510 9150 10300 11814 12535Source: Finance Division, Ministry of Finance.
203
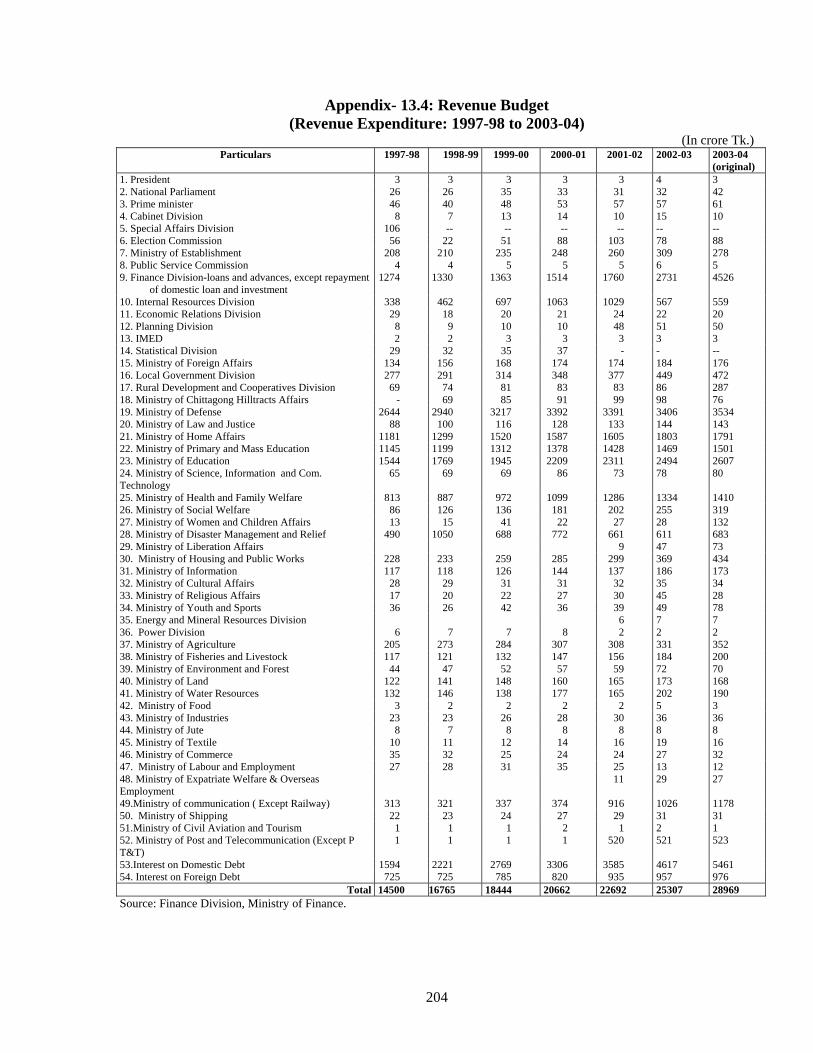
Appendix- 13.4: Revenue Budget (Revenue Expenditure: 1997-98 to 2003-04)
(In crore Tk.) Particulars 1997-98 1998-99 1999-00 2000-01 2001-02 2002-03 2003-04
(original) 1. President 3 3 3 3 3 4 3 2. National Parliament 26 26 35 33 31 32 42 3. Prime minister 46 40 48 53 57 57 61 4. Cabinet Division 8 7 13 14 10 15 10 5. Special Affairs Division 106 -- -- -- -- -- -- 6. Election Commission 56 22 51 88 103 78 88 7. Ministry of Establishment 208 210 235 248 260 309 278 8. Public Service Commission 4 4 5 5 5 6 5 9. Finance Division-loans and advances, except repayment
of domestic loan and investment 1274 1330 1363 1514 1760 2731 4526
10. Internal Resources Division 338 462 697 1063 1029 567 559 11. Economic Relations Division 29 18 20 21 24 22 20 12. Planning Division 8 9 10 10 48 51 50 13. IMED 2 2 3 3 3 3 3 14. Statistical Division 29 32 35 37 - - -- 15. Ministry of Foreign Affairs 134 156 168 174 174 184 176 16. Local Government Division 277 291 314 348 377 449 472 17. Rural Development and Cooperatives Division 18. Ministry of Chittagong Hilltracts Affairs
69 -
74 69
81 85
83 91
83 99
86 98
287 76
19. Ministry of Defense 2644 2940 3217 3392 3391 3406 3534 20. Ministry of Law and Justice 88 100 116 128 133 144 143 21. Ministry of Home Affairs 1181 1299 1520 1587 1605 1803 1791 22. Ministry of Primary and Mass Education 1145 1199 1312 1378 1428 1469 1501 23. Ministry of Education 1544 1769 1945 2209 2311 2494 2607 24. Ministry of Science, Information and Com. Technology
65 69 69 86 73 78 80
25. Ministry of Health and Family Welfare 813 887 972 1099 1286 1334 1410 26. Ministry of Social Welfare 86 126 136 181 202 255 319 27. Ministry of Women and Children Affairs 13 15 41 22 27 28 132 28. Ministry of Disaster Management and Relief 490 1050 688 772 661 611 683 29. Ministry of Liberation Affairs 9 47 73 30. Ministry of Housing and Public Works 228 233 259 285 299 369 434 31. Ministry of Information 117 118 126 144 137 186 173 32. Ministry of Cultural Affairs 28 29 31 31 32 35 34 33. Ministry of Religious Affairs 17 20 22 27 30 45 28 34. Ministry of Youth and Sports 36 26 42 36 39 49 78 35. Energy and Mineral Resources Division 6 7 7 36. Power Division 6 7 7 8 2 2 2 37. Ministry of Agriculture 205 273 284 307 308 331 352 38. Ministry of Fisheries and Livestock 39. Ministry of Environment and Forest
117 44
121 47
132 52
147 57
156 59
184 72
200 70
40. Ministry of Land 122 141 148 160 165 173 168 41. Ministry of Water Resources 132 146 138 177 165 202 190 42. Ministry of Food 3 2 2 2 2 5 3 43. Ministry of Industries 23 23 26 28 30 36 36 44. Ministry of Jute 8 7 8 8 8 8 8 45. Ministry of Textile 10 11 12 14 16 19 16 46. Ministry of Commerce 35 32 25 24 24 27 32 47. Ministry of Labour and Employment 27 28 31 35 25 13 12 48. Ministry of Expatriate Welfare & Overseas Employment
11 29 27
49.Ministry of communication ( Except Railway) 313 321 337 374 916 1026 1178 50. Ministry of Shipping 22 23 24 27 29 31 31 51.Ministry of Civil Aviation and Tourism 1 1 1 2 1 2 1 52. Ministry of Post and Telecommunication (Except P T&T)
1 1 1 1 520 521 523
53.Interest on Domestic Debt 1594 2221 2769 3306 3585 4617 5461 54. Interest on Foreign Debt 725 725 785 820 935 957 976
Total 14500 16765 18444 20662 22692 25307 28969 Source: Finance Division, Ministry of Finance.
204
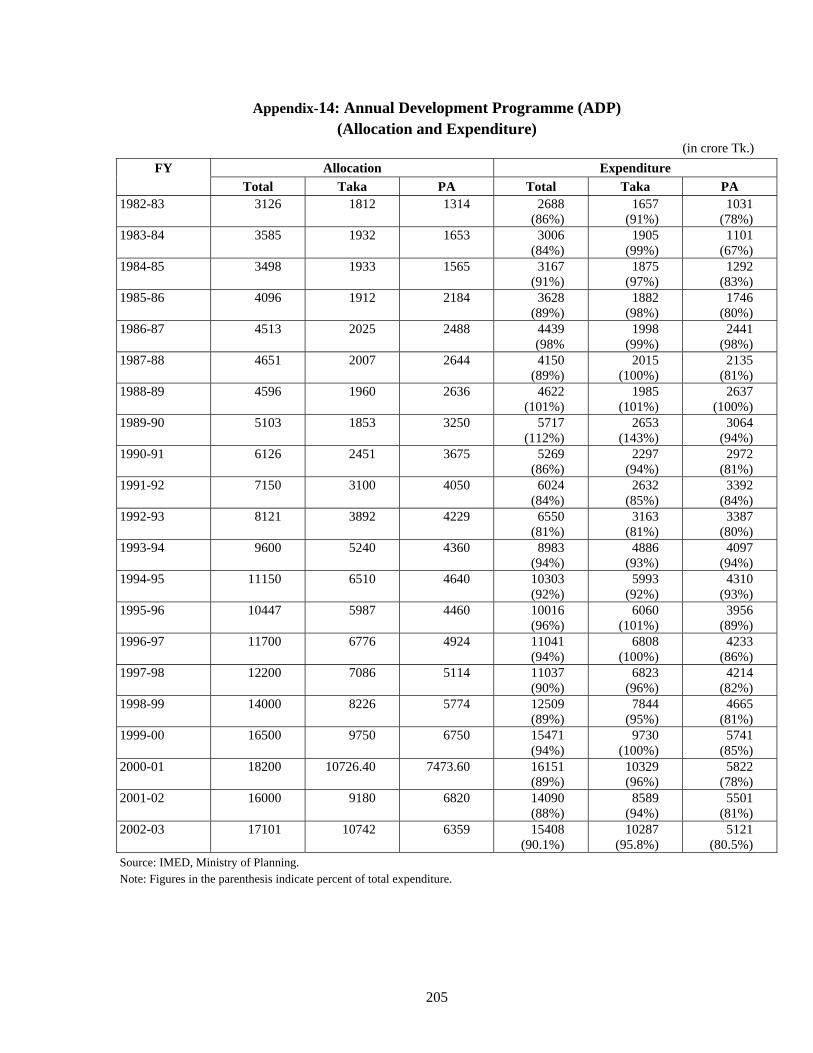
Appendix-14: Annual Development Programme (ADP) (Allocation and Expenditure)
(in crore Tk.) Allocation Expenditure FY
Total Taka PA Total Taka PA 1982-83 3126 1812 1314 2688
(86%) 1657
(91%) 1031
(78%) 1983-84 3585 1932 1653 3006
(84%) 1905
(99%) 1101
(67%) 1984-85 3498 1933 1565 3167
(91%) 1875
(97%) 1292
(83%) 1985-86 4096 1912 2184 3628
(89%) 1882
(98%) 1746
(80%) 1986-87 4513 2025 2488 4439
(98% 1998
(99%) 2441
(98%) 1987-88 4651 2007 2644 4150
(89%) 2015
(100%) 2135
(81%) 1988-89 4596 1960 2636 4622
(101%) 1985
(101%) 2637
(100%) 1989-90 5103 1853 3250 5717
(112%) 2653
(143%) 3064
(94%) 1990-91 6126 2451 3675 5269
(86%) 2297
(94%) 2972
(81%) 1991-92 7150 3100 4050 6024
(84%) 2632
(85%) 3392
(84%) 1992-93 6550 8121 3892 4229
(81%) 3163
(81%) 3387
(80%) 1993-94 9600 5240 4360 8983
(94%) 4886
(93%) 4097
(94%) 1994-95 11150 6510 4640 10303
(92%) 5993
(92%) 4310
(93%) 1995-96 10447 5987 4460 10016
(96%) 6060
(101%) 3956
(89%) 1996-97 11700 6776 4924 11041
(94%) 6808
(100%) 4233
(86%) 1997-98 12200 7086 5114 11037
(90%) 6823
(96%) 4214
(82%) 1998-99 14000 8226 5774 12509
(89%) 7844
(95%) 4665
(81%) 1999-00 16500 9750 6750 15471
(94%) 9730
(100%) 5741
(85%) 2000-01 18200 10726.40 7473.60 16151
(89%) 10329 (96%)
5822 (78%)
2001-02 16000 9180 6820 14090 (88%)
8589 (94%)
5501 (81%)
2002-03 17101 10742 6359 15408 (90.1%)
10287 (95.8%)
5121 (80.5%)
Source: IMED, Ministry of Planning. Note: Figures in the parenthesis indicate percent of total expenditure.
205
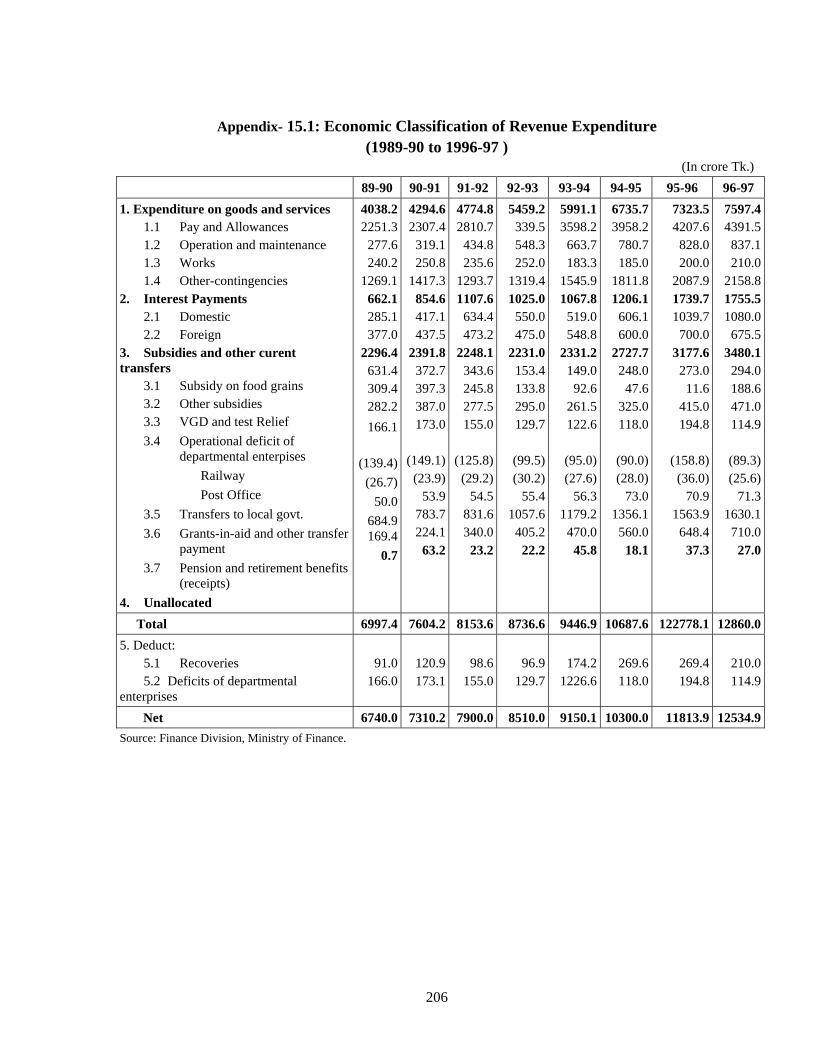
Appendix- 15.1: Economic Classification of Revenue Expenditure
(1989-90 to 1996-97 ) (In crore Tk.)
89-90 90-91 91-92 92-93 93-94 94-95 95-96 96-97 1. Expenditure on goods and services 1.1 Pay and Allowances 1.2 Operation and maintenance 1.3 Works 1.4 Other-contingencies 2. Interest Payments 2.1 Domestic 2.2 Foreign 3. Subsidies and other curent transfers 3.1 Subsidy on food grains 3.2 Other subsidies 3.3 VGD and test Relief
3.4 Operational deficit of departmental enterpises
Railway Post Office
3.5 Transfers to local govt. 3.6 Grants-in-aid and other transfer payment 3.7 Pension and retirement benefits (receipts) 4. Unallocated
4038.22251.3
277.6240.2
1269.1662.1285.1377.0
2296.4631.4309.4282.2166.1
(139.4)(26.7)
50.0684.9169.4
0.7
4294.62307.4
319.1250.8
1417.3854.6417.1437.5
2391.8372.7397.3387.0173.0
(149.1)(23.9)
53.9783.7224.1
63.2
4774.82810.7
434.8235.6
1293.71107.6
634.4473.2
2248.1343.6245.8277.5155.0
(125.8)(29.2)
54.5831.6340.0
23.2
5459.2339.5548.3252.0
1319.41025.0
550.0475.0
2231.0153.4133.8295.0129.7
(99.5)(30.2)
55.41057.6
405.222.2
5991.1 3598.2
663.7 183.3
1545.9 1067.8
519.0 548.8
2331.2 149.0
92.6 261.5 122.6
(95.0) (27.6)
56.3 1179.2
470.0 45.8
6735.7 3958.2
780.7 185.0
1811.8 1206.1
606.1 600.0
2727.7 248.0
47.6 325.0 118.0
(90.0) (28.0)
73.0 1356.1
560.0 18.1
7323.54207.6
828.0200.0
2087.91739.71039.7
700.03177.6
273.011.6
415.0194.8
(158.8)(36.0)
70.91563.9
648.437.3
7597.44391.5
837.1210.0
2158.81755.51080.0
675.53480.1
294.0188.6471.0114.9
(89.3)(25.6)
71.31630.1
710.027.0
Total 6997.4 7604.2 8153.6 8736.6 9446.9 10687.6 122778.1 12860.05. Deduct: 5.1 Recoveries 5.2 Deficits of departmental enterprises
91.0166.0
120.9173.1
98.6155.0
96.9129.7
174.2
1226.6
269.6 118.0
269.4194.8
210.0114.9
Net 6740.0 7310.2 7900.0 8510.0 9150.1 10300.0 11813.9 12534.9Source: Finance Division, Ministry of Finance.
206
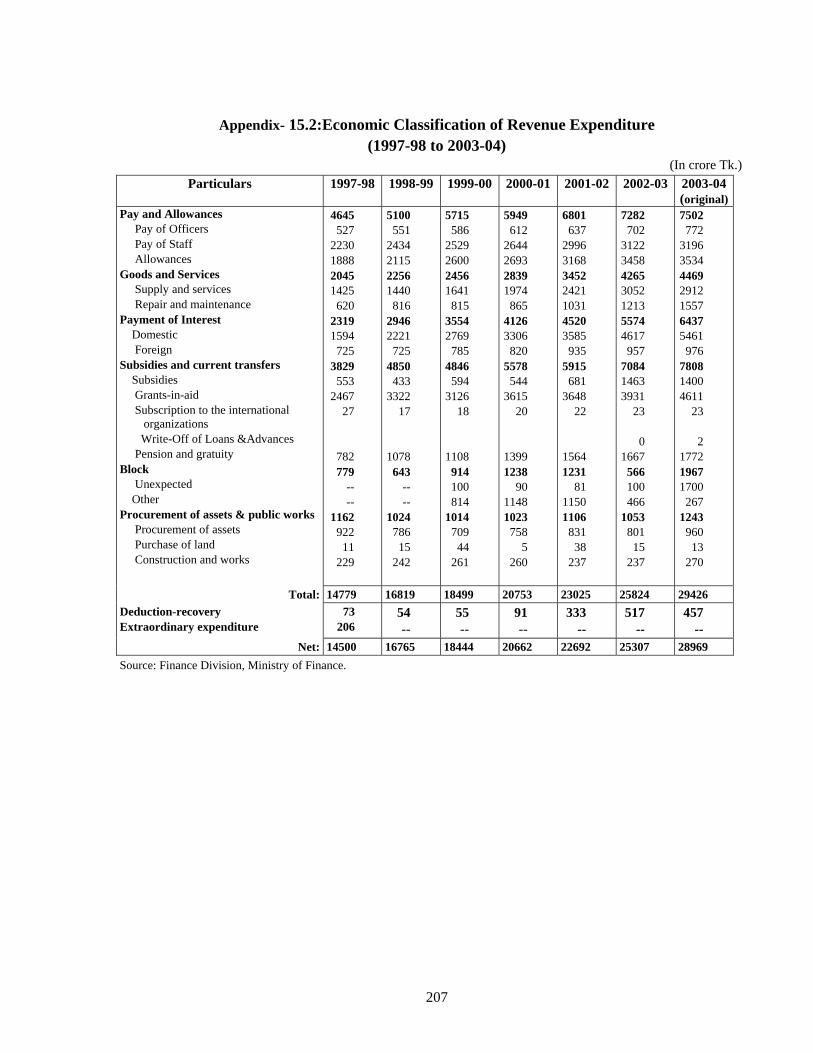
Appendix- 15.2:Economic Classification of Revenue Expenditure
(1997-98 to 2003-04) (In crore Tk.)
Particulars 1997-98
1998-99
1999-00 2000-01
2001-02
2002-03 2003-04(original)
Pay and Allowances Pay of Officers Pay of Staff Allowances Goods and Services Supply and services Repair and maintenance Payment of Interest Domestic Foreign Subsidies and current transfers Subsidies Grants-in-aid Subscription to the international
organizations Write-Off of Loans &Advances Pension and gratuity Block Unexpected Other Procurement of assets & public works Procurement of assets Purchase of land Construction and works
4645 527
2230 1888 2045 1425 620
2319 1594 725
3829 553
2467 27
782 779
-- --
1162 922 11
229
5100 551
2434 2115 2256 1440 816
2946 2221 725
4850 433
3322 17
1078 643
-- --
1024 786 15
242
5715 586
2529 2600 2456 1641 815
3554 2769 785
4846 594
3126 18
1108 914 100 814
1014 709 44
261
5949 612
2644 2693 2839 1974 865
4126 3306 820
5578 544
3615 20
1399 1238
90 1148 1023 758
5 260
6801 637
2996 3168 3452 2421 1031 4520 3585 935
5915 681
3648 22
1564 1231
81 1150 1106 831 38
237
7282 702
3122 3458 4265 3052 1213 5574 4617 957
7084 1463 3931
23
0 1667 566 100 466
1053 801 15
237
7502 772
3196 3534 4469 2912 1557 6437 5461 976
7808 1400 4611
23
2 1772 1967 1700 267
1243 960 13
270
Total: 14779 16819 18499 20753 23025 25824 29426 Deduction-recovery Extraordinary expenditure
73 206
54 --
55 --
91 --
333 --
517 --
457 --
Net: 14500 16765 18444 20662 22692 25307 28969 Source: Finance Division, Ministry of Finance.
207
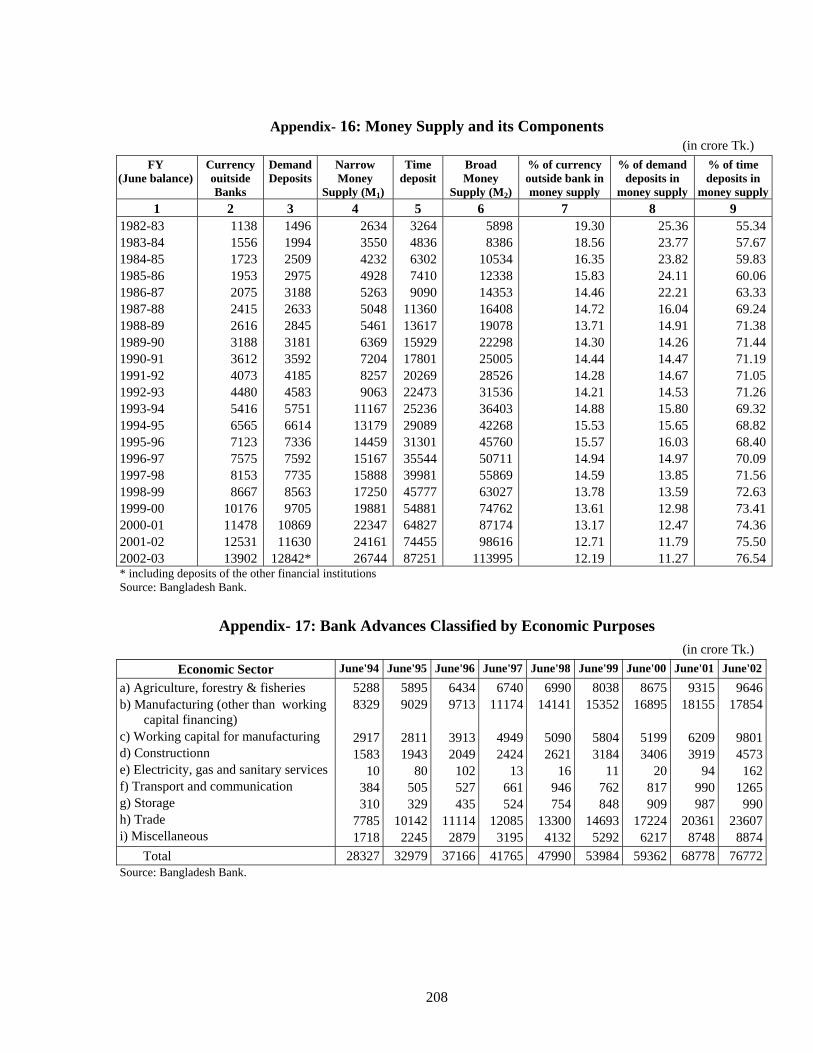
Appendix- 16: Money Supply and its Components
(in crore Tk.) FY
(June balance) Currency ouitside Banks
Demand Deposits
Narrow Money
Supply (M1)
Time deposit
Broad Money
Supply (M2)
% of currency outside bank in money supply
% of demand deposits in
money supply
% of time deposits in
money supply1 2 3 4 5 6 7 8 9
1982-83 1983-84 1984-85 1985-86 1986-87 1987-88 1988-89 1989-90 1990-91 1991-92 1992-93 1993-94 1994-95 1995-96 1996-97 1997-98 1998-99 1999-00 2000-01 2001-02 2002-03
1138 1556 1723 1953 2075 2415 2616 3188 3612 4073 4480 5416 6565 7123 7575 8153 8667
10176 11478 12531 13902
1496 1994 2509 2975 3188 2633 2845 3181 3592 4185 4583 5751 6614 7336 7592 7735 8563 9705
10869 11630
12842*
26343550423249285263504854616369720482579063
11167131791445915167158881725019881223472416126744
32644836630274109090
11360136171592917801202692247325236290893130135544399814577754881648277445587251
58988386
105341233814353164081907822298250052852631536364034226845760507115586963027747628717498616
113995
19.30 18.56 16.35 15.83 14.46 14.72 13.71 14.30 14.44 14.28 14.21 14.88 15.53 15.57 14.94 14.59 13.78 13.61 13.17 12.71 12.19
25.3623.7723.8224.1122.2116.0414.9114.2614.4714.6714.5315.8015.6516.0314.9713.8513.5912.9812.4711.7911.27
55.3457.6759.8360.0663.3369.2471.3871.4471.1971.0571.2669.3268.8268.4070.0971.5672.6373.4174.3675.5076.54
* including deposits of the other financial institutions Source: Bangladesh Bank.
Appendix- 17: Bank Advances Classified by Economic Purposes
(in crore Tk.) Economic Sector June'94 June'95 June'96 June'97 June'98 June'99 June'00 June'01 June'02
a) Agriculture, forestry & fisheries b) Manufacturing (other than working
capital financing) c) Working capital for manufacturing d) Constructionn e) Electricity, gas and sanitary services f) Transport and communication g) Storage h) Trade i) Miscellaneous
52888329
29171583
10384310
77851718
58959029
28111943
80505329
101422245
64349713
39132049
102527435
111142879
674011174
49492424
13661524
120853195
6990 14141
5090 2621
16 946 754
13300 4132
8038 15352
5804 3184
11 762 848
14693 5292
867516895
51993406
20817909
172246217
931518155
62093919
94990987
203618748
964617854
98014573
1621265
99023607
8874 Total 28327 32979 37166 41765 47990 53984 59362 68778 76772Source: Bangladesh Bank.
208
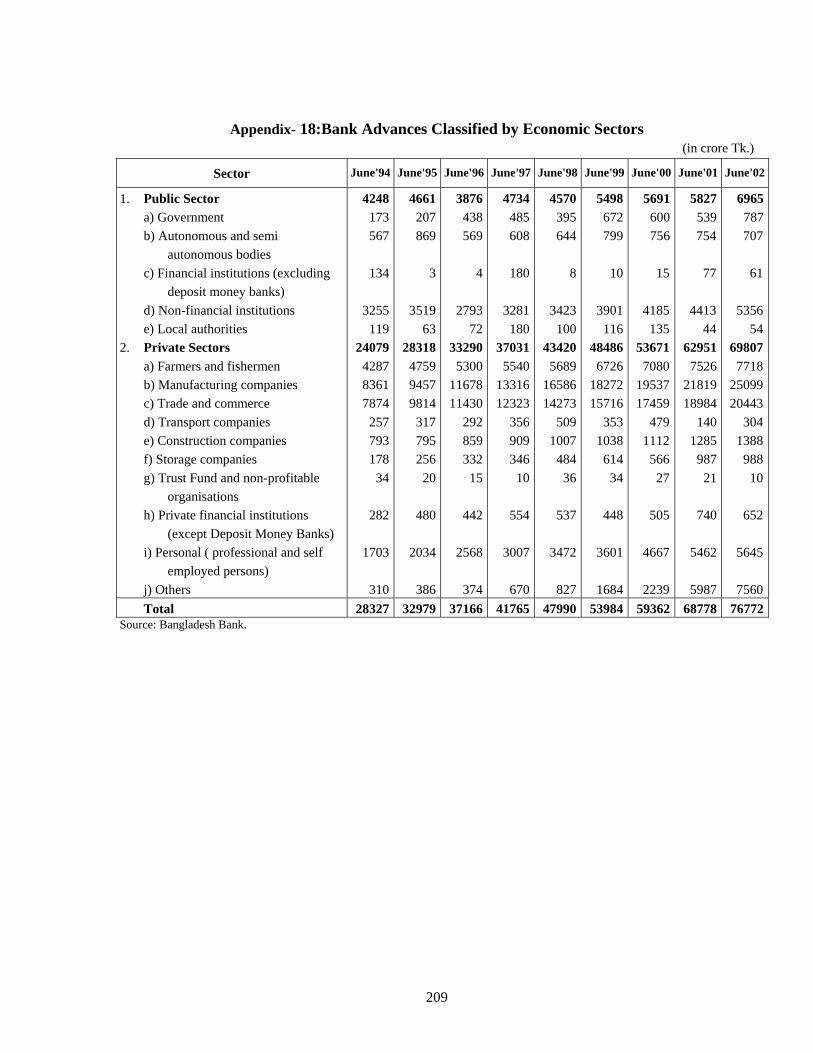
Appendix- 18:Bank Advances Classified by Economic Sectors
(in crore Tk.)
Sector June'94 June'95 June'96 June'97 June'98 June'99 June'00 June'01 June'02
1. Public Sector a) Government b) Autonomous and semi
autonomous bodies c) Financial institutions (excluding
deposit money banks) d) Non-financial institutions e) Local authorities 2. Private Sectors a) Farmers and fishermen b) Manufacturing companies c) Trade and commerce d) Transport companies e) Construction companies f) Storage companies g) Trust Fund and non-profitable
organisations h) Private financial institutions
(except Deposit Money Banks) i) Personal ( professional and self
employed persons) j) Others
4248173567
134
3255119
24079428783617874
257793178
34
282
1703
310
4661207869
3
351963
28318475994579814
317795256
20
480
2034
386
3876438569
4
279372
332905300
1167811430
292859332
15
442
2568
374
4734485608
180
3281180
370315540
1331612323
356909346
10
554
3007
670
4570 395 644
8
3423
100 43420
5689 16586 14273
509 1007
484 36
537
3472
827
5498 672 799
10
3901
116 48486
6726 18272 15716
353 1038
614 34
448
3601
1684
5691600756
15
4185135
536717080
1953717459
4791112
56627
505
4667
2239
5827
707539754
77
4413
4462951
75262181918984
1401285
98721
740
5462
5987
6965787
61
535654
698077718
2509920443
3041388
98810
652
5645
7560 Total 28327 32979 37166 41765 47990 53984 59362 68778 76772Source: Bangladesh Bank.
209
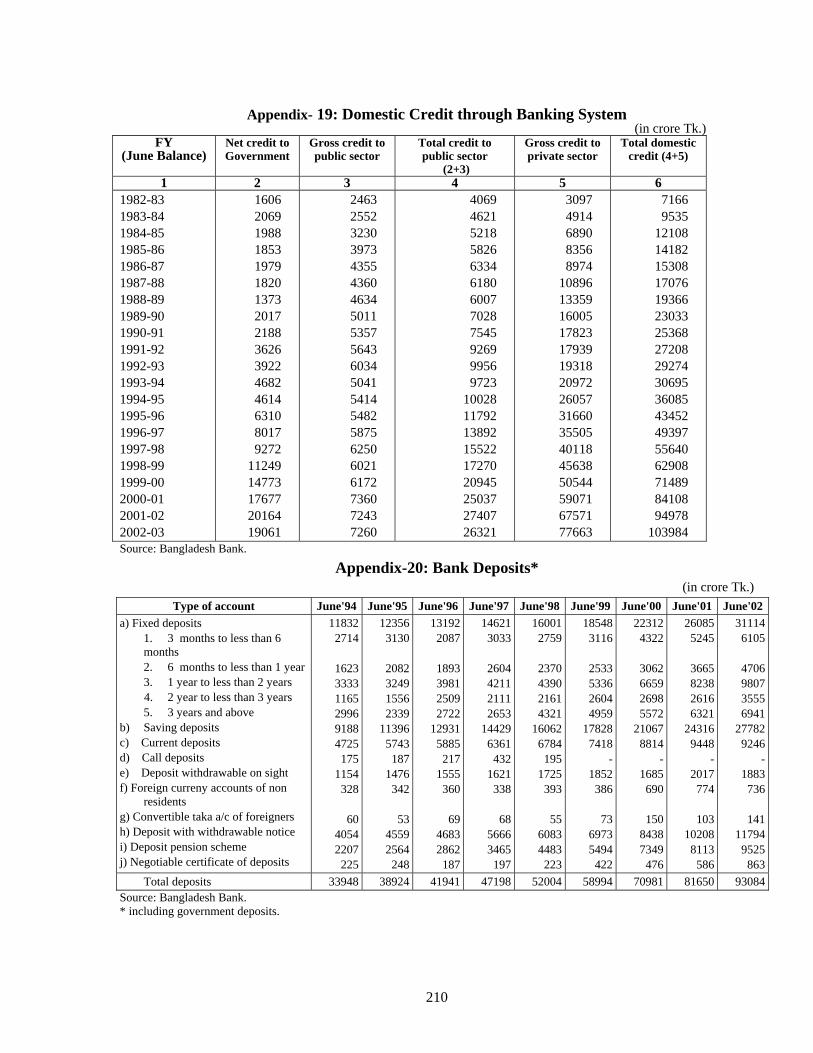
Appendix- 19: Domestic Credit through Banking System
(in crore Tk.) FY
(June Balance) Net credit to Government
Gross credit to public sector
Total credit to public sector
(2+3)
Gross credit to private sector
Total domestic credit (4+5)
1 2 3 4 5 6 1982-83 1983-84 1984-85 1985-86 1986-87 1987-88 1988-89 1989-90 1990-91 1991-92 1992-93 1993-94 1994-95 1995-96 1996-97 1997-98 1998-99 1999-00 2000-01 2001-02 2002-03
1606 2069 1988 1853 1979 1820 1373 2017 2188 3626 3922 4682 4614 6310 8017 9272
11249 14773 17677 20164 19061
2463 2552 3230 3973 4355 4360 4634 5011 5357 5643 6034 5041 5414 5482 5875 6250 6021 6172 7360 7243 7260
4069 4621 5218 5826 6334 6180 6007 7028 7545 9269 9956 9723
10028 11792 13892 15522 17270 20945 25037 27407 26321
3097 4914 6890 8356 8974
10896 13359 16005 17823 17939 19318 20972 26057 31660 35505 40118 45638 50544 59071 67571 77663
7166 9535
12108 14182 15308 17076 19366 23033 25368 27208 29274 30695 36085 43452 49397 55640 62908 71489 84108 94978
103984 Source: Bangladesh Bank.
Appendix-20: Bank Deposits* (in crore Tk.)
Type of account June'94 June'95 June'96 June'97 June'98 June'99 June'00 June'01 June'02a) Fixed deposits 1. 3 months to less than 6
months 2. 6 months to less than 1 year 3. 1 year to less than 2 years 4. 2 year to less than 3 years 5. 3 years and above b) Saving deposits c) Current deposits d) Call deposits e) Deposit withdrawable on sight f) Foreign curreny accounts of non
residents g) Convertible taka a/c of foreigners h) Deposit with withdrawable notice i) Deposit pension scheme j) Negotiable certificate of deposits
118322714
162333331165299691884725175
1154328
6040542207225
123563130
2082324915562339
113965743187
1476342
5345592564248
131922087
1893398125092722
129315885217
1555360
6946832862187
146213033
2604421121112653
144296361432
1621338
6856663465197
160012759
2370439021614321
160626784195
1725393
5560834483223
18548 3116
2533 5336 2604 4959
17828 7418
- 1852 386
73
6973 5494 422
223124322
3062665926985572
210678814
-1685690
15084387349476
260855245
3665823826166321
243169448
-2017774
103102088113586
311146105
4706980735556941
277829246
-1883736
141117949525863
Total deposits 33948 38924 41941 47198 52004 58994 70981 81650 93084Source: Bangladesh Bank. * including government deposits.
210
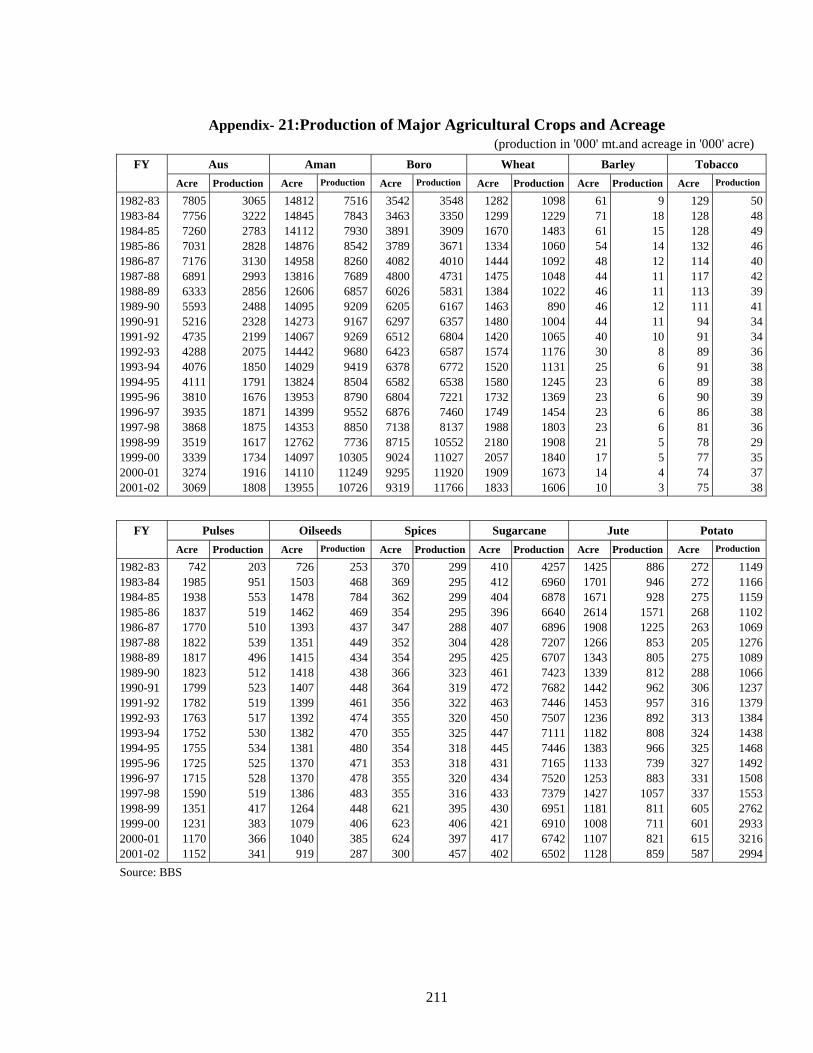
Appendix- 21:Production of Major Agricultural Crops and Acreage
(production in '000' mt.and acreage in '000' acre) FY Aus Aman Boro Wheat Barley Tobacco
Acre Production Acre Production Acre Production Acre Production Acre Production Acre Production
1982-83 1983-84 1984-85 1985-86 1986-87 1987-88 1988-89 1989-90 1990-91 1991-92 1992-93 1993-94 1994-95 1995-96 1996-97 1997-98 1998-99 1999-00 2000-01 2001-02
7805 7756 7260 7031 7176 6891 6333 5593 5216 4735 4288 4076 4111 3810 3935 3868 3519 3339 3274 3069
3065 3222 2783 2828 3130 2993 2856 2488 2328 2199 2075 1850 1791 1676 1871 1875 1617 1734 1916 1808
14812 14845 14112 14876 14958 13816 12606 14095 14273 14067 14442 14029 13824 13953 14399 14353 12762 14097 14110 13955
75167843793085428260768968579209916792699680941985048790955288507736
103051124910726
35423463389137894082480060266205629765126423637865826804687671388715902492959319
3548335039093671401047315831616763576804658767726538722174608137
10552110271192011766
12821299167013341444147513841463148014201574152015801732174919882180205719091833
1098122914831060109210481022890
100410651176113112451369145418031908184016731606
61 71 61 54 48 44 46 46 44 40 30 25 23 23 23 23 21 17 14 10
91815141211111211108666665543
129128128132114117113111949189918990868178777475
5048494640423941343436383839383629353738
FY Pulses Oilseeds Spices Sugarcane Jute Potato
Acre Production Acre Production Acre Production Acre Production Acre Production Acre Production
1982-83 1983-84 1984-85 1985-86 1986-87 1987-88 1988-89 1989-90 1990-91 1991-92 1992-93 1993-94 1994-95 1995-96 1996-97 1997-98 1998-99 1999-00 2000-01 2001-02
742 1985 1938 1837 1770 1822 1817 1823 1799 1782 1763 1752 1755 1725 1715 1590 1351 1231 1170 1152
203 951 553 519 510 539 496 512 523 519 517 530 534 525 528 519 417 383 366 341
726 1503 1478 1462 1393 1351 1415 1418 1407 1399 1392
7207
337
1382 1381 1370 1370 1386 1264 1079 1040 919
253468784469437449434438448461474470480471478483448406385287
370369362354347352354366364356355355354353355355621623624300
299295299295288304295323319322320325318318320316395406397457
410412404396407428425461472463450447445431434433430421417402
42576960687866406896
67077423768274467507711174467165752073796951691067426502
1425 1701 1671 2614 1908 1266 1343 1339 1442 1453 1236 1182 1383 1133 1253 1427 1181 1008 1107 1128
886946928
15711225853805812962957892808966739883
1057811711821859
272272275268263205275288306316313324325327331
605601615587
11491166115911021069127610891066123713791384143814681492150815532762293332162994
Source: BBS
211
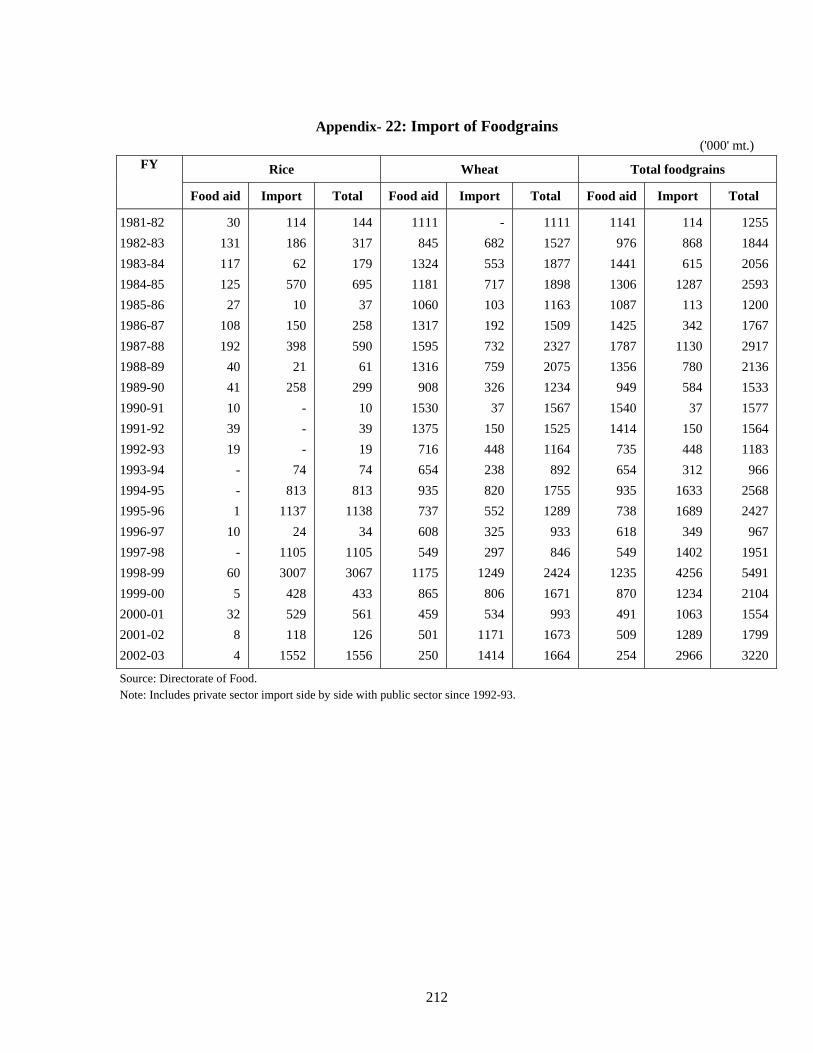
Appendix- 22: Import of Foodgrains
('000' mt.) Rice Wheat Total foodgrains FY
Food aid Import Total Food aid Import Total Food aid Import Total
1981-82 1982-83 1983-84 1984-85 1985-86 1986-87 1987-88 1988-89 1989-90 1990-91 1991-92 1992-93 1993-94 1994-95 1995-96 1996-97 1997-98 1998-99 1999-00 2000-01 2001-02 2002-03
30 131 117 125
27 108 192
40 41 10 39 19
- - 1
10 -
60 5
32 8 4
114 186
62 570
10 150 398
21 258
- - -
74 813
1137 24
1105 3007
428 529 118
1552
144 317 179 695
37 258 590
61 299
10 39 19 74
813 1138
501
34 1105 3067
433 561 126
1556
1111 845
1324 1181 1060 1317 1595 1316
908 1530 1375
716 654 935 737 608 549
1175 865 459
250
- 682 553 717 103 192 732 759 326
37 150 448 238 820 552 325 297
1249 806 534
1171 1414
1111 1527 1877 1898 1163 1509 2327 2075 1234 1567 1525 1164
892 1755 1289
933 846
2424 1671
993 1673 1664
1141 976
1441 1306 1087 1425 1787 1356
949 1540 1414
735 654 935 738 618 549
1235 870 491 509 254
114 868 615
1287 113 342
1130 780 584
37 150 448 312
1633 1689
349 1402 4256 1234 1063 1289 2966
1255 1844 2056 2593 1200 1767 2917 2136 1533 1577 1564 1183
966 2568 2427
967 1951 5491 2104 1554 1799 3220
Source: Directorate of Food. Note: Includes private sector import side by side with public sector since 1992-93.
212
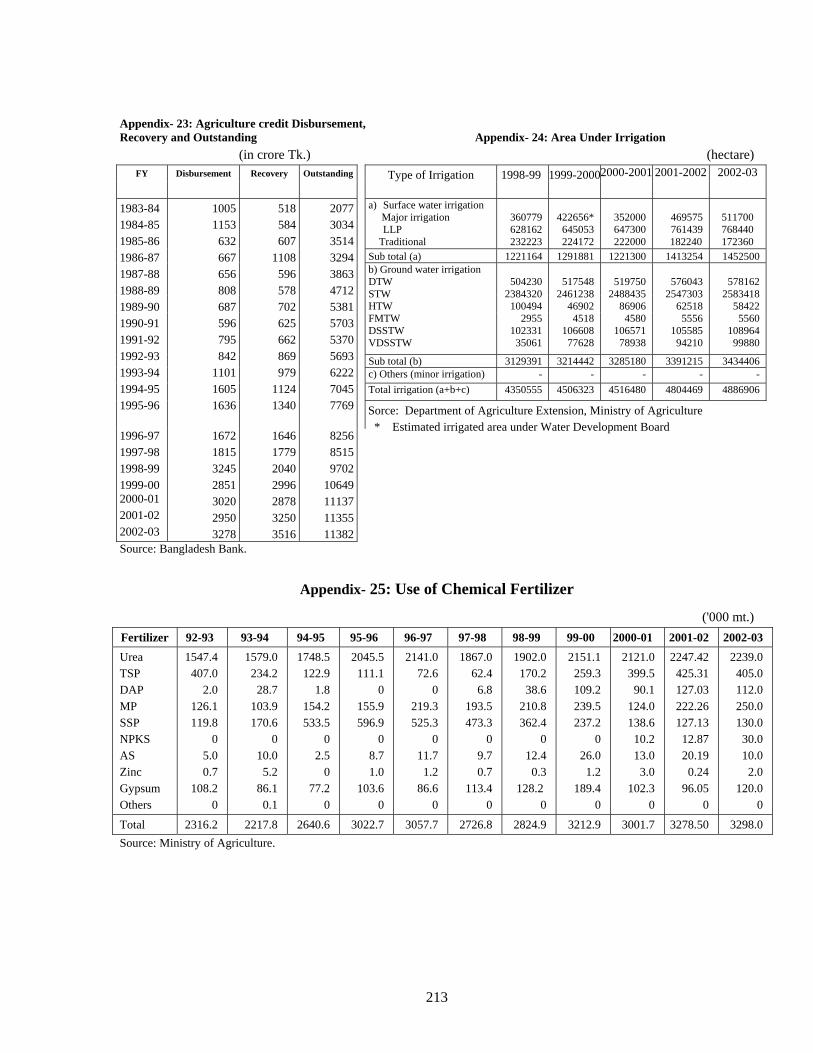
Appendix- 23: Agriculture credit Disbursement, Recovery and Outstanding Appendix- 24: Area Under Irrigation
(in crore Tk.) (hectare) FY Disbursement Recovery Outstanding Type of Irrigation 1998-99
1999-20002000-2001
2001-2002
2002-03
a) Surface water irrigation Major irrigation
LLP Traditional
360779 628162 232223
422656*
645053 224172
352000 647300 222000
469575 761439
182240
511700 768440 172360
Sub total (a) 1221164 1291881 1221300 1413254 1452500 b) Ground water irrigation DTW STW HTW FMTW DSSTW VDSSTW
504230
2384320 100494
2955 102331
35061
517548
2461238 46902
4518 106608
77628
519750
2488435 86906
4580 106571
78938
576043
2547303 62518
5556 105585
94210
578162
2583418 58422
5560 108964
99880
Sub total (b) 3129391 3214442 3285180 3391215 3434406 c) Others (minor irrigation) - - - - - Total irrigation (a+b+c) 4350555 4506323 4516480 4804469 4886906
1983-84 1984-85 1985-86 1986-87 1987-88 1988-89 1989-90 1990-91 1991-92 1992-93 1993-94 1994-95 1995-96
1005 1153 632 667 656 808 687 596 795 842
1101 1605 1636
518 584 607
1108 596 578 702 625 662 869 979
1124 1340
2077303435143294386347125381570353705693622270457769
1996-97 1997-98 1998-99 1999-00 2000-01 2001-02 2002-03
1672 1815 3245 2851 3020 2950 3278
1646 1779 2040 2996 2878 3250 3516
825685159702
10649111371135511382
Sorce: Department of Agriculture Extension, Ministry of Agriculture * Estimated irrigated area under Water Development Board
Source: Bangladesh Bank.
Appendix- 25: Use of Chemical Fertilizer
('000 mt.) Fertilizer 92-93 93-94 94-95 95-96 96-97 97-98 98-99 99-00 2000-01 2001-02 2002-03 Urea TSP DAP MP SSP NPKS AS Zinc Gypsum Others
1547.4 407.0
2.0 126.1 119.8
0 5.0 0.7
108.2 0
1579.0 234.2 28.7
103.9 170.6
0 10.0 5.2
86.1 0.1
1748.5 122.9
1.8 154.2 533.5
0 2.5
0 77.2
0
2045.5 111.1
0 155.9 596.9
0 8.7 1.0
103.6 0
2141.0 72.6
0 219.3 525.3
0 11.7 1.2
86.6 0
1867.0 62.4 6.8
193.5 473.3
0 9.7 0.7
113.4 0
1902.0 170.2 38.6
210.8 362.4
0 12.4 0.3
128.2 0
2151.1 259.3 109.2 239.5 237.2
0 26.0 1.2
189.4 0
2121.0 399.5 90.1
124.0 138.6 10.2 13.0 3.0
102.3 0
2247.42 425.31 127.03 222.26 127.13
12.87 20.19 0.24
96.05 0
2239.0 405.0 112.0 250.0 130.0 30.0 10.0 2.0
120.0 0
Total 2316.2 2217.8 2640.6 3022.7 3057.7 2726.8 2824.9 3212.9 3001.7 3278.50 3298.0 Source: Ministry of Agriculture.
213
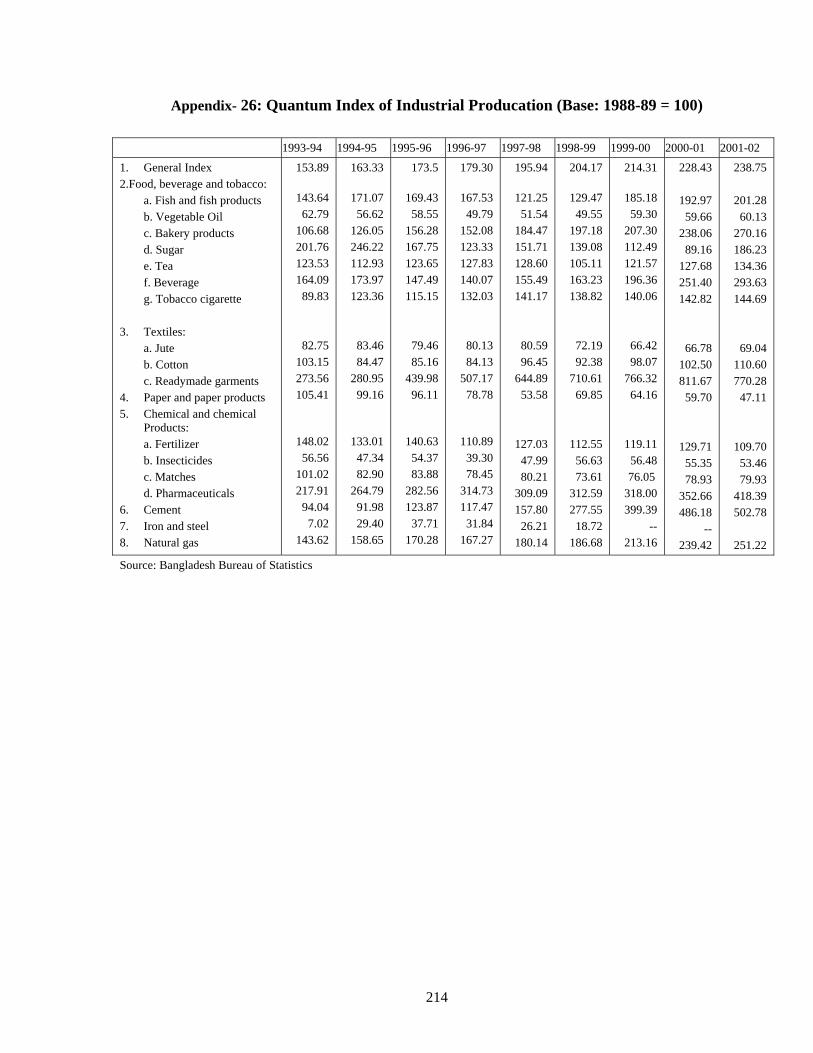
Appendix- 26: Quantum Index of Industrial Producation (Base: 1988-89 = 100)
1993-94 1994-95 1995-96 1996-97 1997-98 1998-99 1999-00 2000-01 2001-02
1. General Index 2.Food, beverage and tobacco: a. Fish and fish products b. Vegetable Oil c. Bakery products d. Sugar e. Tea f. Beverage g. Tobacco cigarette 3. Textiles: a. Jute b. Cotton c. Readymade garments 4. Paper and paper products 5. Chemical and chemical
Products: a. Fertilizer b. Insecticides c. Matches d. Pharmaceuticals 6. Cement 7. Iron and steel 8. Natural gas
153.89
143.64 62.79
106.68 201.76 123.53 164.09 89.83
82.75 103.15 273.56 105.41
148.02 56.56
101.02 217.91 94.04 7.02
143.62
163.33
171.07 56.62
126.05 246.22 112.93 173.97 123.36
83.46 84.47
280.95 99.16
133.01 47.34 82.90
264.79 91.98 29.40
158.65
173.5
169.43 58.55
156.28 167.75 123.65 147.49 115.15
79.46 85.16
439.98 96.11
140.63 54.37 83.88
282.56 123.87 37.71
170.28
179.30
167.53 49.79
152.08 123.33 127.83 140.07 132.03
80.13 84.13
507.17 78.78
110.89 39.30 78.45
314.73 117.47 31.84
167.27
195.94
121.25 51.54
184.47 151.71 128.60 155.49 141.17
80.59 96.45
644.89 53.58
127.03 47.99 80.21
309.09 157.80 26.21
180.14
204.17
129.47 49.55
197.18 139.08 105.11 163.23 138.82
72.19 92.38
710.61 69.85
112.55 56.63 73.61
312.59 277.55 18.72
186.68
214.31
185.18 59.30
207.30 112.49 121.57 196.36 140.06
66.42 98.07
766.32 64.16
119.11 56.48
76.05 318.00 399.39
-- 213.16
228.43
192.97 59.66
238.06 89.16
127.68 251.40 142.82
66.78 102.50 811.67
59.70
129.71 55.35 78.93
352.66 486.18
-- 239.42
238.75
201.28 60.13
270.16 186.23 134.36 293.63 144.69
69.04 110.60 770.28 47.11
109.70 53.46 79.93
418.39 502.78
251.22
Source: Bangladesh Bureau of Statistics
214
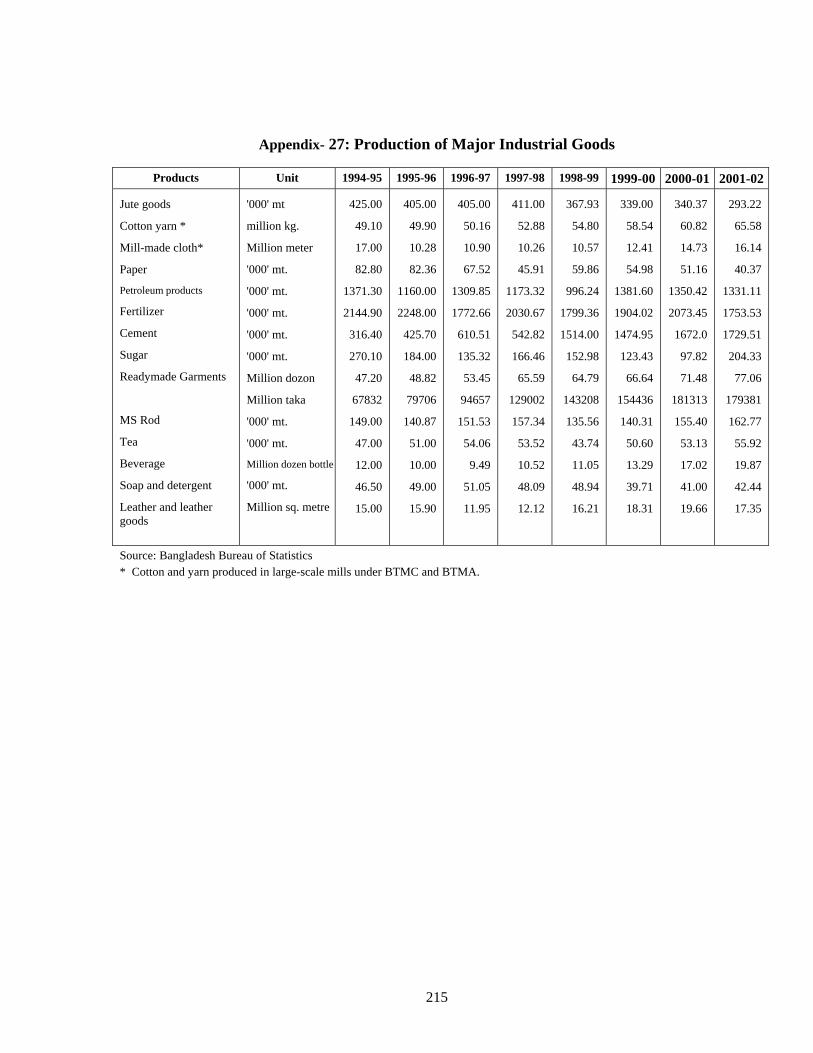
Appendix- 27: Production of Major Industrial Goods
Products Unit 1994-95 1995-96 1996-97 1997-98 1998-99 1999-00 2000-01 2001-02
Jute goods
Cotton yarn *
Mill-made cloth*
Paper
Petroleum products
Fertilizer
Cement
Sugar
Readymade Garments
MS Rod
Tea
Beverage
Soap and detergent
Leather and leather goods
'000' mt
million kg.
Million meter
'000' mt.
'000' mt.
'000' mt.
'000' mt.
'000' mt.
Million dozon
Million taka
'000' mt.
'000' mt.
Million dozen bottle
'000' mt.
Million sq. metre
425.00
49.10
17.00
82.80
1371.30
2144.90
316.40
270.10
47.20
67832
149.00
47.00
12.00
46.50
15.00
405.00
49.90
10.28
82.36
1160.00
2248.00
425.70
184.00
48.82
79706
140.87
51.00
10.00
49.00
15.90
405.00
50.16
10.90
67.52
1309.85
1772.66
610.51
135.32
53.45
94657
151.53
54.06
9.49
51.05
11.95
411.00
52.88
10.26
45.91
1173.32
2030.67
542.82
166.46
65.59
129002
157.34
53.52
10.52
48.09
12.12
367.93
54.80
10.57
59.86
996.24
1799.36
1514.00
152.98
64.79
143208
135.56
43.74
11.05
48.94
16.21
339.00
58.54
12.41
54.98
1381.60
1904.02
1474.95
123.43
66.64
154436
140.31
50.60
13.29
39.71
18.31
340.37
60.82
14.73
51.16
1350.42
2073.45
1672.0
97.82
71.48
181313
155.40
53.13
17.02
41.00
19.66
293.22
65.58
16.14
40.37
1331.11
1753.53
1729.51
204.33
77.06
179381
162.77
55.92
19.87
42.44
17.35
Source: Bangladesh Bureau of Statistics * Cotton and yarn produced in large-scale mills under BTMC and BTMA.
215
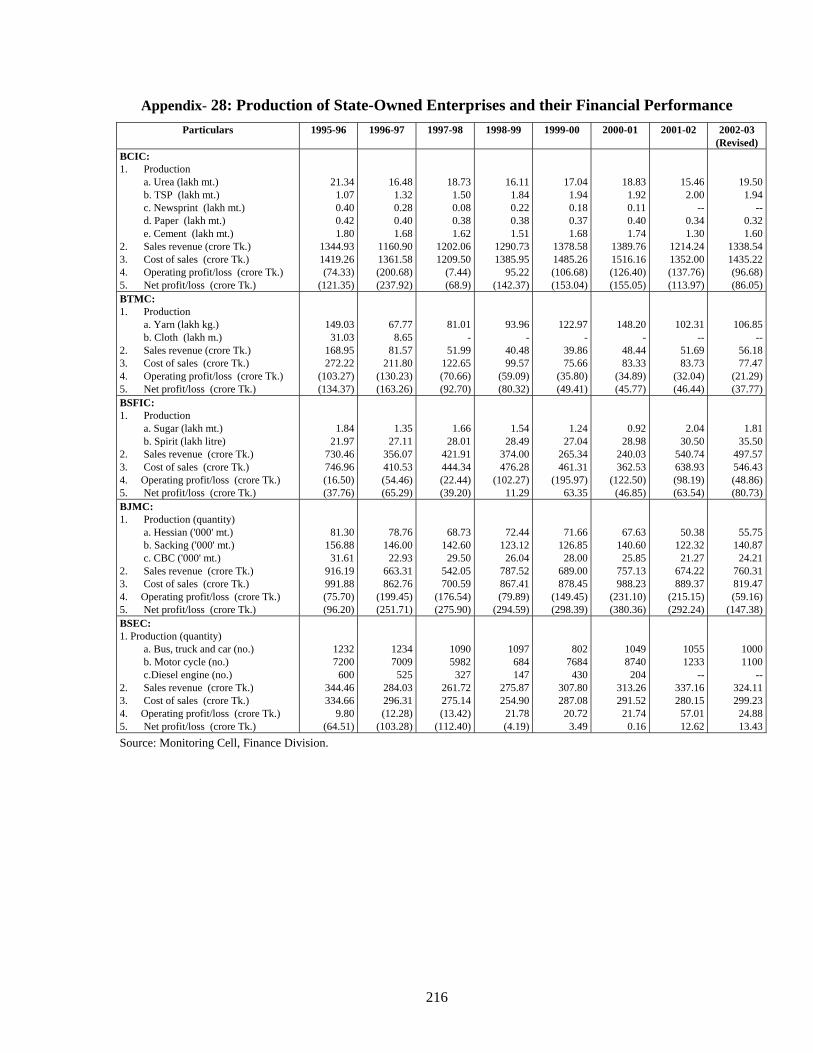
Appendix- 28: Production of State-Owned Enterprises and their Financial Performance
Particulars 1995-96
1996-97
1997-98
1998-99
1999-00 2000-01
2001-02
2002-03 (Revised)
BCIC: 1. Production a. Urea (lakh mt.) b. TSP (lakh mt.) c. Newsprint (lakh mt.) d. Paper (lakh mt.) e. Cement (lakh mt.) 2. Sales revenue (crore Tk.) 3. Cost of sales (crore Tk.) 4. Operating profit/loss (crore Tk.) 5. Net profit/loss (crore Tk.)
21.341.070.400.421.80
1344.931419.26(74.33)
(121.35)
16.481.320.280.401.68
1160.901361.58(200.68)(237.92)
18.731.500.080.381.62
1202.061209.50
(7.44)(68.9)
16.111.840.220.381.51
1290.731385.95
95.22(142.37)
17.04 1.94 0.18 0.37 1.68
1378.58 1485.26 (106.68) (153.04)
18.83 1.92 0.11 0.40 1.74
1389.76 1516.16 (126.40) (155.05)
15.462.00
--0.341.30
1214.241352.00(137.76)(113.97)
19.501.94
--0.321.60
1338.541435.22(96.68)(86.05)
BTMC: 1. Production a. Yarn (lakh kg.) b. Cloth (lakh m.) 2. Sales revenue (crore Tk.) 3. Cost of sales (crore Tk.) 4. Operating profit/loss (crore Tk.) 5. Net profit/loss (crore Tk.)
149.0331.03
168.95272.22
(103.27)(134.37)
67.778.65
81.57211.80
(130.23)(163.26)
81.01-
51.99122.65(70.66)(92.70)
93.96-
40.4899.57
(59.09)(80.32)
122.97 -
39.86 75.66
(35.80) (49.41)
148.20 -
48.44 83.33
(34.89) (45.77)
102.31--
51.6983.73
(32.04)(46.44)
106.85--
56.1877.47
(21.29)(37.77)
BSFIC: 1. Production a. Sugar (lakh mt.) b. Spirit (lakh litre) 2. Sales revenue (crore Tk.) 3. Cost of sales (crore Tk.) 4. Operating profit/loss (crore Tk.) 5. Net profit/loss (crore Tk.)
1.8421.97
730.46746.96(16.50)(37.76)
1.3527.11
356.07410.53(54.46)(65.29)
1.6628.01
421.91444.34(22.44)(39.20)
1.5428.49
374.00476.28
(102.27)11.29
1.24 27.04
265.34 461.31
(195.97) 63.35
0.92 28.98
240.03 362.53
(122.50) (46.85)
2.0430.50
540.74638.93(98.19)(63.54)
1.8135.50
497.57546.43(48.86)(80.73)
BJMC: 1. Production (quantity) a. Hessian ('000' mt.) b. Sacking ('000' mt.) c. CBC ('000' mt.) 2. Sales revenue (crore Tk.) 3. Cost of sales (crore Tk.) 4. Operating profit/loss (crore Tk.) 5. Net profit/loss (crore Tk.)
81.30156.88
31.61916.19991.88(75.70)(96.20)
78.76146.00
22.93663.31862.76
(199.45)(251.71)
68.73142.60
29.50542.05700.59
(176.54)(275.90)
72.44123.12
26.04787.52867.41(79.89)
(294.59)
71.66 126.85
28.00 689.00 878.45
(149.45) (298.39)
67.63 140.60
25.85 757.13 988.23
(231.10) (380.36)
50.38122.32
21.27674.22889.37
(215.15)(292.24)
55.75140.87
24.21760.31819.47(59.16)
(147.38)BSEC: 1. Production (quantity) a. Bus, truck and car (no.) b. Motor cycle (no.) c.Diesel engine (no.) 2. Sales revenue (crore Tk.) 3. Cost of sales (crore Tk.) 4. Operating profit/loss (crore Tk.) 5. Net profit/loss (crore Tk.)
12327200
600344.46334.66
9.80(64.51)
12347009
525284.03296.31(12.28)
(103.28)
10905982
327261.72275.14(13.42)
(112.40)
1097684147
275.87254.90
21.78(4.19)
802 7684
430 307.80 287.08
20.72 3.49
1049 8740
204 313.26 291.52
21.74 0.16
10551233
--337.16280.15
57.0112.62
10001100
--324.11299.23
24.8813.43
Source: Monitoring Cell, Finance Division.
216
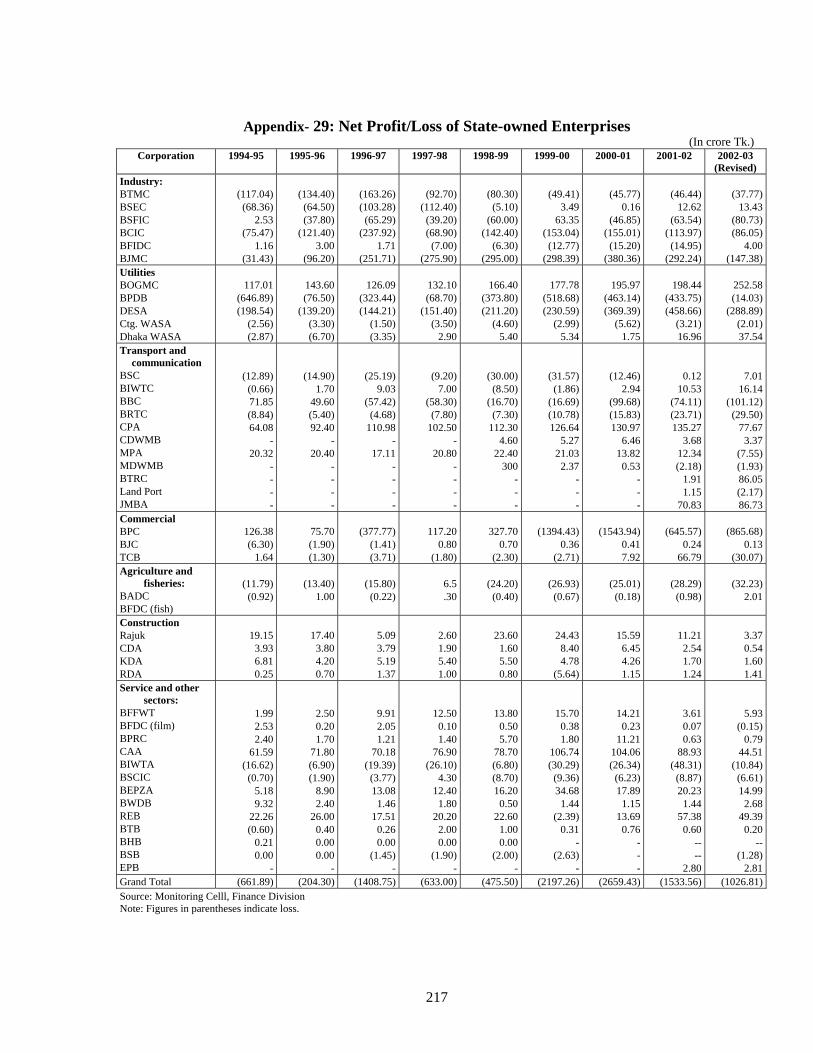
Appendix- 29: Net Profit/Loss of State-owned Enterprises
(In crore Tk.) Corporation 1994-95
1995-96
1996-97
1997-98
1998-99
1999-00
2000-01
2001-02
2002-03
(Revised) Industry: BTMC BSEC BSFIC (37.80) (65.29)BCIC BFIDC BJMC
(117.04)
(68.36) 2.53
(75.47) 1.16
(31.43)
(134.40)(64.50)
(121.40)3.00
(96.20)
(163.26)(103.28)
(237.92)1.71
(251.71)
(92.70)(112.40)
(39.20)(68.90)
(7.00)(275.90)
(80.30)(5.10)
(60.00)(142.40)
(6.30)(295.00)
(49.41)
3.49 63.35
(153.04) (12.77)
(298.39)
(45.77)
0.16 (46.85)
(155.01) (15.20)
(380.36)
(46.44)12.62
(63.54)(113.97)
(14.95)(292.24)
(37.77)13.43
(80.73)(86.05)
4.00(147.38)
Utilities BOGMC BPDB DESA Ctg. WASA Dhaka WASA
117.01
(646.89) (198.54)
(2.56) (2.87)
143.60(76.50)
(139.20)(3.30)(6.70)
126.09(323.44)(144.21)
(1.50)(3.35)
132.10(68.70)
(151.40)(3.50)
2.90
166.40(373.80)(211.20)
(4.60)5.40
177.78
(518.68) (230.59)
(2.99) 5.34
195.97
(463.14) (369.39)
(5.62) 1.75
198.44(433.75)(458.66)
(3.21)16.96
252.58(14.03)
(288.89)(2.01)37.54
Transport and communication
BSC BIWTC BBC BRTC CPA CDWMB MPA MDWMB BTRC Land Port JMBA
(12.89) (0.66) 71.85 (8.84) 64.08
- 20.32
- - - -
(14.90)1.70
49.60(5.40)92.40
-20.40
----
(25.19)9.03
(57.42)(4.68)
110.98-
17.11----
(9.20)7.00
(58.30)(7.80)
102.50-
20.80----
(30.00)(8.50)
(16.70)(7.30)
112.304.60
22.40300
---
(31.57) (1.86)
(16.69) (10.78) 126.64
5.27 21.03
2.37 - - -
(12.46) 2.94
(99.68) (15.83) 130.97
6.46 13.82
0.53 - - -
0.1210.53
(74.11)(23.71)135.27
3.6812.34(2.18)
1.911.15
70.83
7.0116.14
(101.12)(29.50)
77.673.37
(7.55)(1.93)86.05(2.17)86.73
Commercial BPC BJC TCB
126.38 (6.30)
1.64
75.70(1.90)(1.30)
(377.77)(1.41)(3.71)
117.200.80
(1.80)
327.700.70
(2.30)
(1394.43)
0.36 (2.71)
(1543.94)
0.41 7.92
(645.57)0.24
66.79
(865.68)0.13
(30.07)Agriculture and
fisheries: BADC BFDC (fish)
(11.79)
(0.92) (13.40)
1.00(15.80)
(0.22)6.5.30
(24.20)(0.40)
(26.93)
(0.67)
(25.01)
(0.18) (28.29)
(0.98)(32.23)
2.01
Construction Rajuk CDA KDA RDA
19.15
3.93 6.81 0.25
17.403.804.200.70
5.093.795.191.37
2.601.905.401.00
23.601.605.500.80
24.43
8.40 4.78
(5.64)
15.59
6.45 4.26 1.15
11.212.541.701.24
3.370.541.601.41
Service and other sectors:
BFFWT BFDC (film) BPRC CAA BIWTA BSCIC BEPZA BWDB REB BTB BHB BSB EPB
1.99 2.53 2.40
61.59 (16.62)
(0.70) 5.18 9.32
22.26 (0.60)
0.21 0.00
-
2.500.201.70
71.80(6.90)(1.90)
8.902.40
26.000.400.000.00
-
9.912.051.21
70.18(19.39)
(3.77)13.08
1.4617.51
0.260.00
(1.45)-
12.500.101.40
76.90(26.10)
4.3012.40
1.8020.20
2.000.00
(1.90)-
13.800.505.70
78.70(6.80)(8.70)16.20
0.5022.60
1.000.00
(2.00)-
15.70 0.38 1.80
106.74 (30.29)
(9.36) 34.68
1.44 (2.39)
0.31 -
(2.63) -
14.21 0.23
11.21 104.06 (26.34)
(6.23) 17.89
1.15 13.69
0.76 - - -
3.610.070.63
88.93(48.31)
(8.87)20.23
1.4457.38
0.60----
2.80
5.93(0.15)
0.7944.51
(10.84)(6.61)14.99
2.6849.39
0.20--
(1.28)2.81
Grand Total (661.89) (204.30) (1408.75) (633.00) (475.50) (2197.26) (2659.43) (1533.56) (1026.81)
Source: Monitoring Celll, Finance Division Note: Figures in parentheses indicate loss.
217
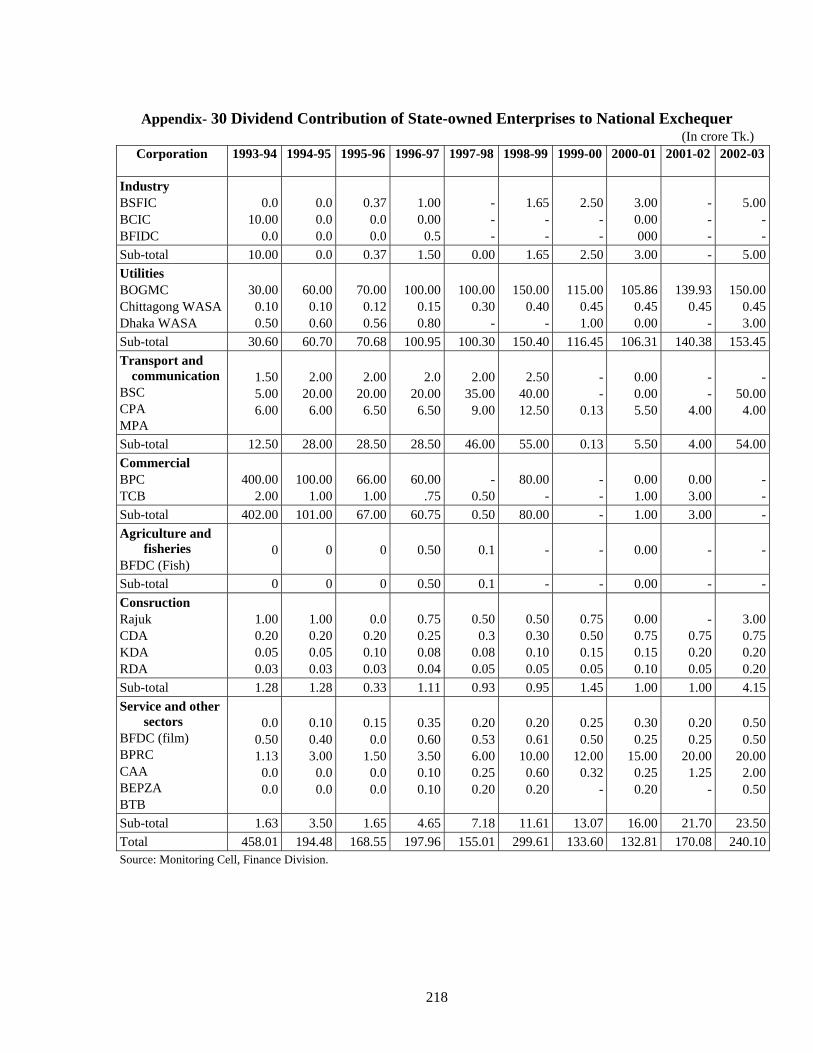
Appendix- 30 Dividend Contribution of State-owned Enterprises to National Exchequer
(In crore Tk.) Corporation 1993-94 1994-95 1995-96 1996-97 1997-98 1998-99 1999-00
2000-01
2001-02
2002-03
Industry BSFIC BCIC BFIDC
0.0
10.00 0.0
0.00.00.0
0.370.00.0
1.000.00
0.5
---
1.65--
2.50
- -
3.000.00000
---
5.00--
Sub-total 10.00 0.0 0.37 1.50 0.00 1.65 2.50 3.00 - 5.00Utilities BOGMC Chittagong WASA Dhaka WASA
30.00
0.10 0.50
60.000.100.60
70.000.120.56
100.000.150.80
100.000.30
-
150.000.40
-
115.00
0.45 1.00
105.860.450.00
139.930.45
-
150.000.453.00
Sub-total 30.60 60.70 70.68 100.95 100.30 150.40 116.45 106.31 140.38 153.45Transport and
communication BSC CPA MPA
1.50 5.00 6.00
2.0020.00
6.00
2.0020.00
6.50
2.020.00
6.50
2.0035.00
9.00
2.5040.0012.50
- -
0.13
0.000.005.50
--
4.00
-50.00
4.00
Sub-total 12.50 28.00 28.50 28.50 46.00 55.00 0.13 5.50 4.00 54.00Commercial BPC TCB
400.00
2.00 100.00
1.0066.00
1.0060.00
.75-
0.5080.00
-
- -
0.001.00
0.003.00
--
Sub-total 402.00 101.00 67.00 60.75 0.50 80.00 - 1.00 3.00 -Agriculture and
fisheries BFDC (Fish)
0 0 0 0.50 0.1 -
- 0.00 - -
Sub-total 0 0 0 0.50 0.1 - - 0.00 - -Consruction Rajuk CDA KDA RDA
1.00 0.20 0.05 0.03
1.000.200.050.03
0.00.200.100.03
0.750.250.080.04
0.500.3
0.080.05
0.500.300.100.05
0.75 0.50 0.15 0.05
0.000.750.150.10
-0.750.200.05
3.000.750.200.20
Sub-total 1.28 1.28 0.33 1.11 0.93 0.95 1.45 1.00 1.00 4.15Service and other
sectors BFDC (film) BPRC CAA BEPZA BTB
0.0
0.50 1.13
0.0 0.0
0.100.403.00
0.00.0
0.150.0
1.500.00.0
0.350.603.500.100.10
0.200.536.000.250.20
0.200.61
10.000.600.20
0.25 0.50
12.00 0.32
-
0.300.25
15.000.250.20
0.200.25
20.001.25
-
0.500.50
20.002.000.50
Sub-total 1.63 3.50 1.65 4.65 7.18 11.61 13.07 16.00 21.70 23.50Total 458.01 194.48 168.55 197.96 155.01 299.61 133.60 132.81 170.08 240.10Source: Monitoring Cell, Finance Division.
218
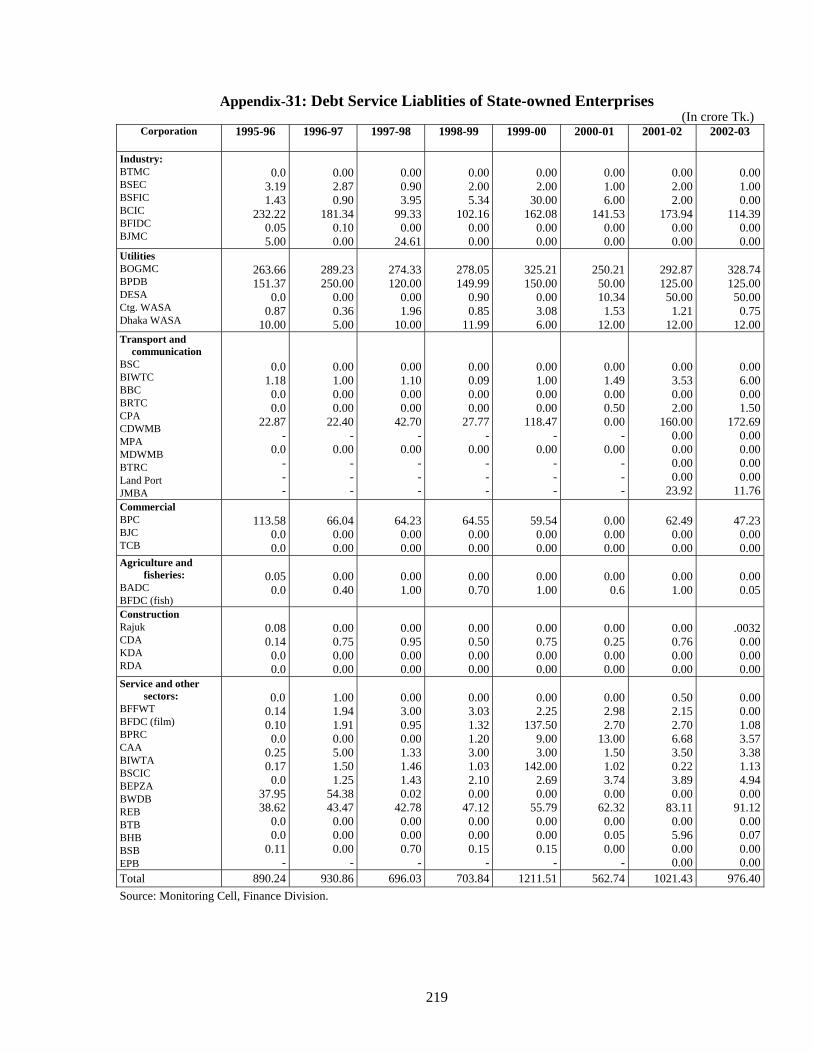
Appendix-31: Debt Service Liablities of State-owned Enterprises (In crore Tk.)
Corporation 1995-96
1996-97
1997-98
1998-99
1999-00
2000-01
2001-02
2002-03
Industry: BTMC BSEC BSFIC BCIC BFIDC BJMC
0.0
3.19 1.43
232.22 0.05 5.00
0.002.870.90
181.340.100.00
0.000.903.95
99.330.00
24.61
0.002.005.34
102.160.000.00
0.002.00
30.00162.08
0.000.00
0.00 1.00 6.00
141.53 0.00 0.00
0.002.002.00
173.940.000.00
0.001.000.00
114.390.000.00
Utilities BOGMC BPDB DESA Ctg. WASA Dhaka WASA
263.66 151.37
0.0 0.87
50.00
10.00
289.23250.00
0.000.365.00
274.33120.00
0.001.96
10.00
278.05149.99
0.900.85
11.99
325.21150.00
0.003.086.00
250.21
10.34 1.53
12.00
292.87125.0050.001.21
12.00
328.74125.0050.000.75
12.00Transport and
communication BSC BIWTC BBC BRTC CPA CDWMB MPA MDWMB BTRC Land Port JMBA
0.0 1.18 0.0 0.0
22.87 -
0.0 - - -
0.001.000.000.00
22.40-
0.00---
0.001.100.000.00
42.70-
0.00---
0.000.090.000.00
27.77-
0.00---
0.001.000.000.00
118.47-
0.00---
0.00 1.49 0.00 0.50 0.00
- 0.00
- - -
0.003.530.002.00
160.000.000.000.000.00
23.92
0.006.000.001.50
172.690.000.000.000.00
11.76Commercial BPC BJC TCB
113.58
0.0 0.0
66.040.000.00
64.230.000.00
64.550.000.00
59.540.000.00
0.00 0.00 0.00
62.490.000.00
47.230.000.00
Agriculture and fisheries:
BADC BFDC (fish)
0.05 0.0
0.000.40
0.001.00
0.000.70
0.001.00
0.00 0.6
0.001.00
0.000.05
Construction Rajuk CDA KDA RDA
0.08 0.14 0.0 0.0
0.000.750.000.00
0.000.950.000.00
0.000.500.000.00
0.000.750.000.00
0.00 0.25 0.00 0.00
0.000.760.000.00
.00320.000.000.00
Service and other sectors:
BFFWT BFDC (film) BPRC CAA BIWTA BSCIC BEPZA BWDB REB BTB BHB BSB EPB
0.0
0.14 0.10 0.0
0.25 0.17 0.0
37.95 38.62
0.0 0.0
0.11 -
1.001.941.910.005.001.501.25
54.3843.470.000.000.00
-
0.95
0.003.00
0.001.331.461.430.02
42.780.000.000.70
-
0.003.031.321.203.001.032.100.00
47.120.000.000.15
-
0.002.25
137.509.003.00
142.002.690.00
55.790.000.000.15
-
0.00 2.98 2.70
13.00 1.50 1.02 3.74 0.00
62.32 0.00 0.05 0.00
-
0.502.152.706.683.500.223.890.00
83.110.005.960.000.00
0.000.001.083.573.381.134.940.00
91.120.000.070.000.00
Total 890.24 930.86 696.03 703.84 1211.51 562.74 1021.43 976.40
Source: Monitoring Cell, Finance Division.
219
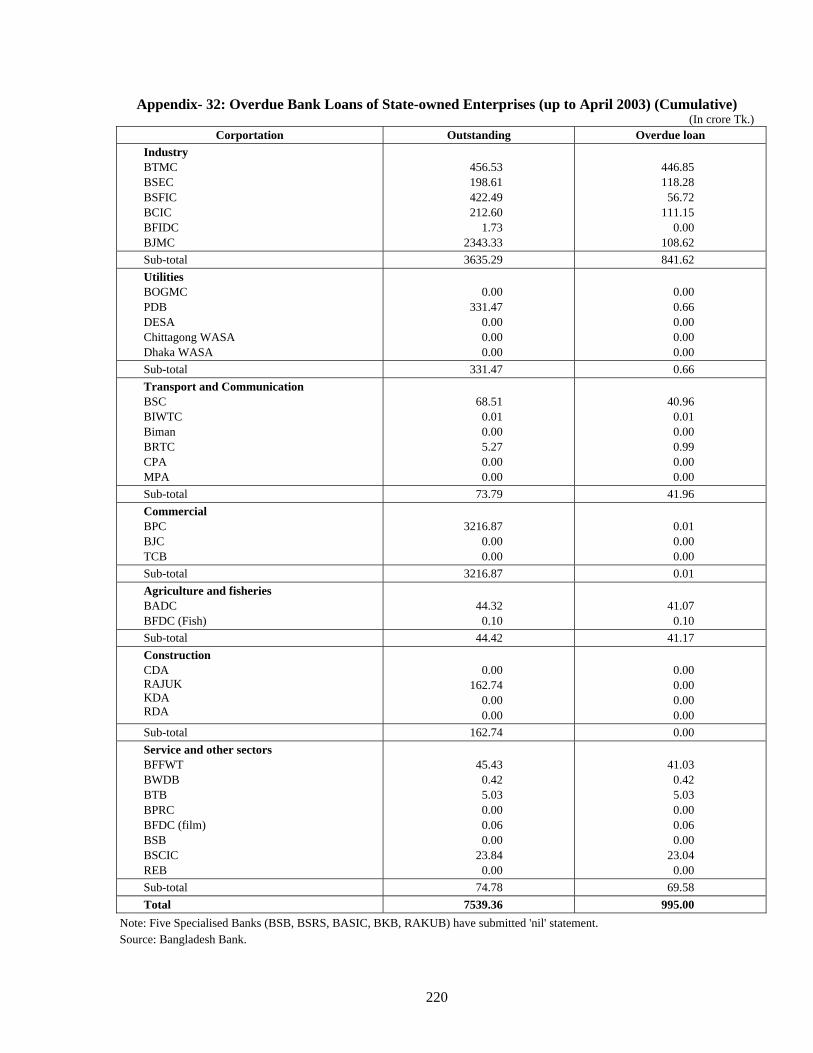
Appendix- 32: Overdue Bank Loans of State-owned Enterprises (up to April 2003) (Cumulative) (In crore Tk.)
Corportation Outstanding Overdue loan Industry BTMC BSEC BSFIC BCIC BFIDC BJMC
456.53 198.61 422.49 212.60
1.73 2343.33
446.85 118.28 56.72
111.15 0.00
108.62 Sub-total 3635.29 841.62 Utilities BOGMC PDB DESA Chittagong WASA Dhaka WASA
0.00
331.47 0.00 0.00 0.00
0.00 0.66 0.00 0.00 0.00
Sub-total 331.47 0.66 Transport and Communication BSC BIWTC Biman BRTC CPA MPA
68.51 0.01 0.00 5.27 0.00 0.00
40.96 0.01 0.00 0.99 0.00 0.00
Sub-total 73.79 41.96 Commercial BPC BJC TCB
3216.87
0.00 0.00
0.01 0.00 0.00
Sub-total 3216.87 0.01 Agriculture and fisheries BADC BFDC (Fish)
44.32 0.10
41.07 0.10
Sub-total 44.42 41.17 Construction CDA RAJUK KDA RDA
0.00
162.74 0.00 0.00
0.00 0.00 0.00 0.00
Sub-total 162.74 0.00 Service and other sectors BFFWT BWDB BTB BPRC BFDC (film) BSB BSCIC REB
45.43 0.42 5.03 0.00 0.06 0.00
23.84 0.00
41.03 0.42 5.03 0.00 0.06 0.00
23.04 0.00
Sub-total 74.78 69.58 Total 7539.36 995.00
Note: Five Specialised Banks (BSB, BSRS, BASIC, BKB, RAKUB) have submitted 'nil' statement. Source: Bangladesh Bank.
220
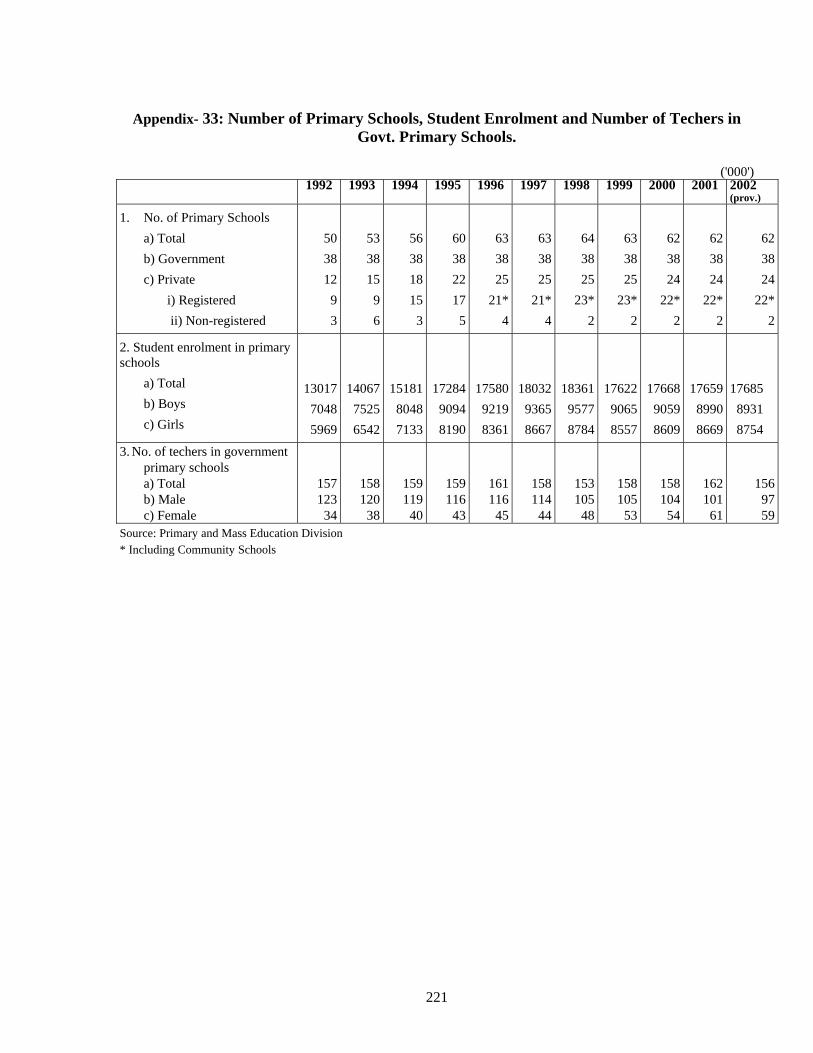
Appendix- 33: Number of Primary Schools, Student Enrolment and Number of Techers in
Govt. Primary Schools.
('000') 1992 1993 1994 1995 1996 1997 1998 1999 2000 2001 2002
(prov.)
1. No. of Primary Schools a) Total b) Government c) Private i) Registered ii) Non-registered
503812
93
533815
96
56381815
3
60382217
5
633825
21*4
633825
21*4
64 38 25
23* 2
63 38 25
23* 2
623824
22*2
623824
22*2
623824
22*2
2. Student enrolment in primary schools a) Total
b) Boys c) Girls
1301770485969
1406775256542
1518180487133
1728490948190
1758092198361
1803293658667
18361 9577 8784
17622 9065 8557
1766890598609
1765989908669
17685 8931 8754
3. No. of techers in government primary schools
157123
34
158120
38
159119
40
159116
43
161116
45
158114
44
153 105
48
158 105
53
158104
54
162101
61
1569759
a) Total b) Male c) Female
Source: Primary and Mass Education Division * Including Community Schools
221
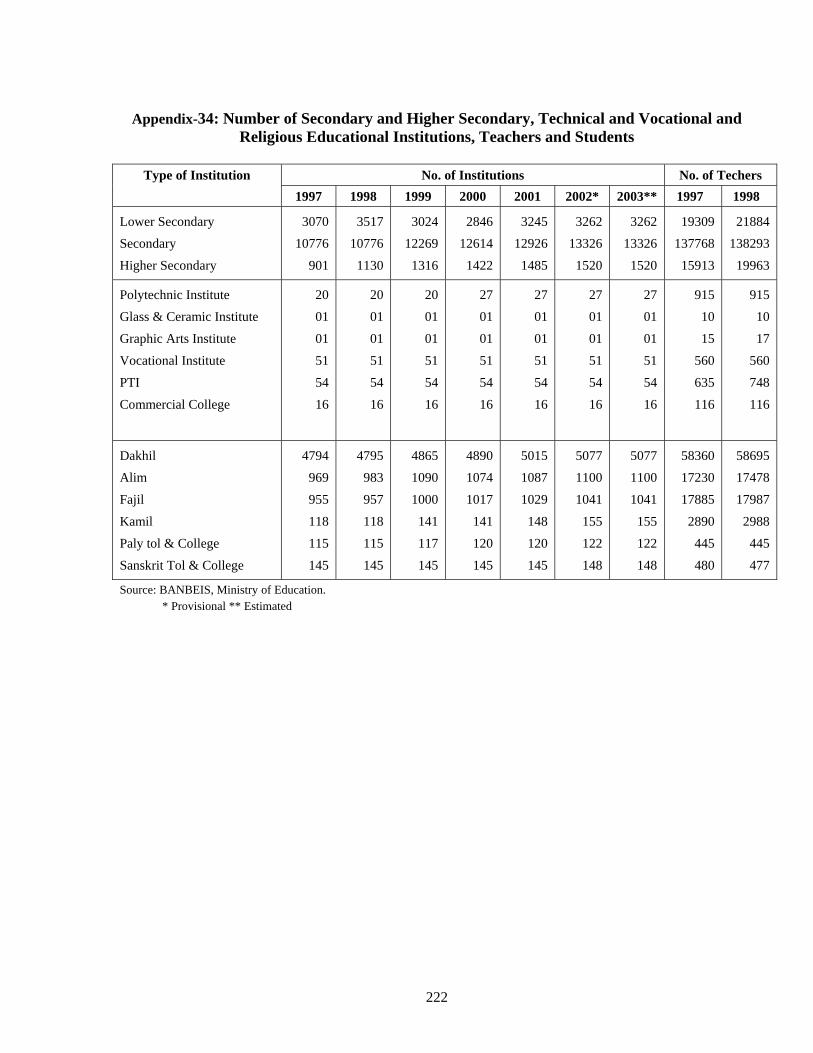
Appendix-34: Number of Secondary and Higher Secondary, Technical and Vocational and
Religious Educational Institutions, Teachers and Students
Type of Institution No. of Institutions No. of Techers 1997 1998 1999 2000 2001 2002* 2003** 1997 1998
Lower Secondary
Secondary
Higher Secondary
3070
10776
901
3517
10776
1130
3024
12269
1316
2846
12614
1422
3245
12926
1485
3262
13326
1520
3262
13326
1520
19309
137768
15913
21884
138293
19963
Polytechnic Institute
Glass & Ceramic Institute
Graphic Arts Institute
Vocational Institute
PTI
Commercial College
20
01
01
51
54
16
20
01
01
51
54
16
20
01
01
51
54
16
27
01
01
51
54
16
27
01
01
51
54
16
27
01
01
51
54
16
27
01
01
51
54
16
915
10
15
560
635
116
915
10
17
560
748
116
Dakhil
Alim
Fajil
Kamil
Paly tol & College
Sanskrit Tol & College
4794
969
955
118
115
145
4795
983
957
118
115
145
4865
1090
1000
141
117
145
4890
1074
1017
141
120
145
5015
1087
1029
148
120
145
5077
1100
1041
155
122
148
5077
1100
1041
155
122
148
58360
17230
17885
2890
445
480
58695
17478
17987
2988
445
477
Source: BANBEIS, Ministry of Education. * Provisional ** Estimated
222
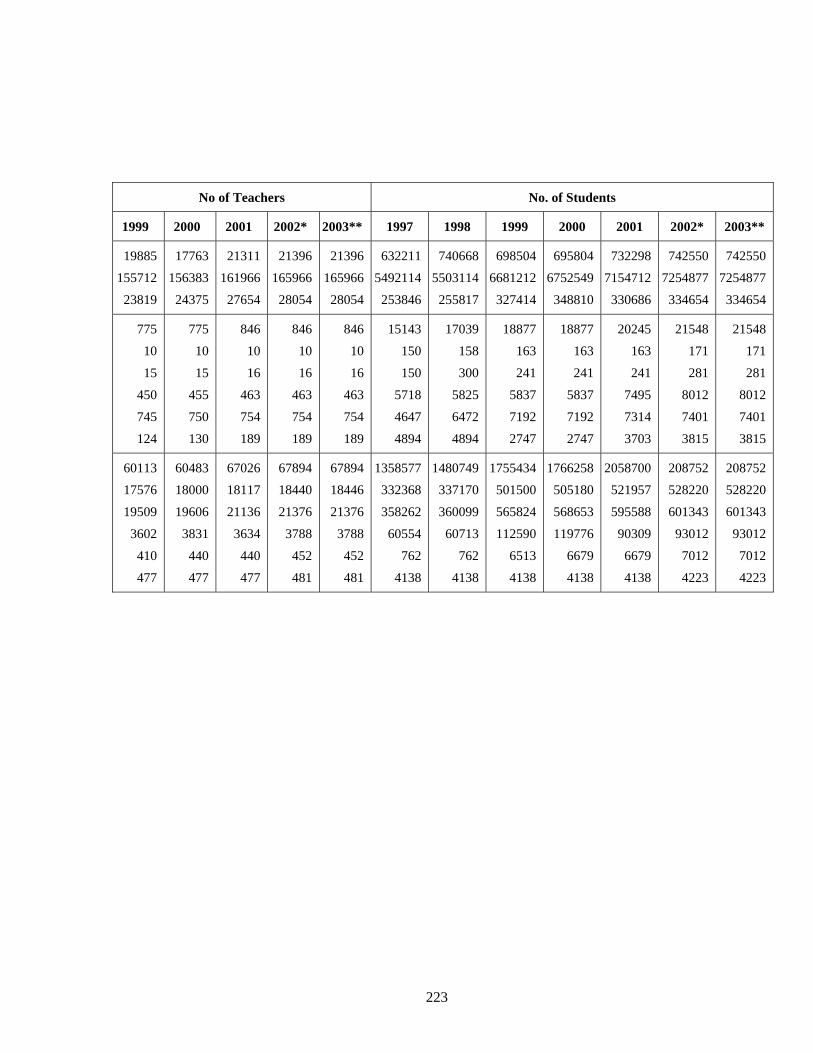
No of Teachers No. of Students
1999 2000 2001 2002* 2003** 1997 1998 1999 2000 2001 2002* 2003**
19885
155712
23819
17763
156383
24375
21311
161966
27654
21396
165966
28054
21396
165966
28054
632211
5492114
253846
740668
5503114
255817
698504
6681212
327414
695804
6752549
348810
732298
7154712
330686
742550
7254877
334654
742550
7254877
334654
775
10
15
450
745
124
775
10
15
455
750
130
846
10
16
463
754
189
846
10
16
463
754
189
846
10
16
463
754
189
15143
150
150
5718
4647
4894
17039
158
300
5825
6472
4894
18877
163
241
5837
7192
2747
18877
163
241
5837
7192
2747
20245
163
241
7495
7314
3703
21548
171
281
8012
7401
3815
21548
171
281
8012
7401
3815
60113
17576
19509
3602
410
477
60483
18000
19606
3831
440
477
67026
18117
21136
3634
440
477
67894
18440
21376
3788
452
481
67894
18446
21376
3788
452
481
1358577
332368
358262
60554
762
4138
1480749
337170
360099
60713
762
4138
1755434
501500
565824
112590
6513
4138
1766258
505180
568653
119776
6679
4138
2058700
521957
595588
90309
6679
4138
208752
528220
601343
93012
7012
4223
208752
528220
601343
93012
7012
4223
223
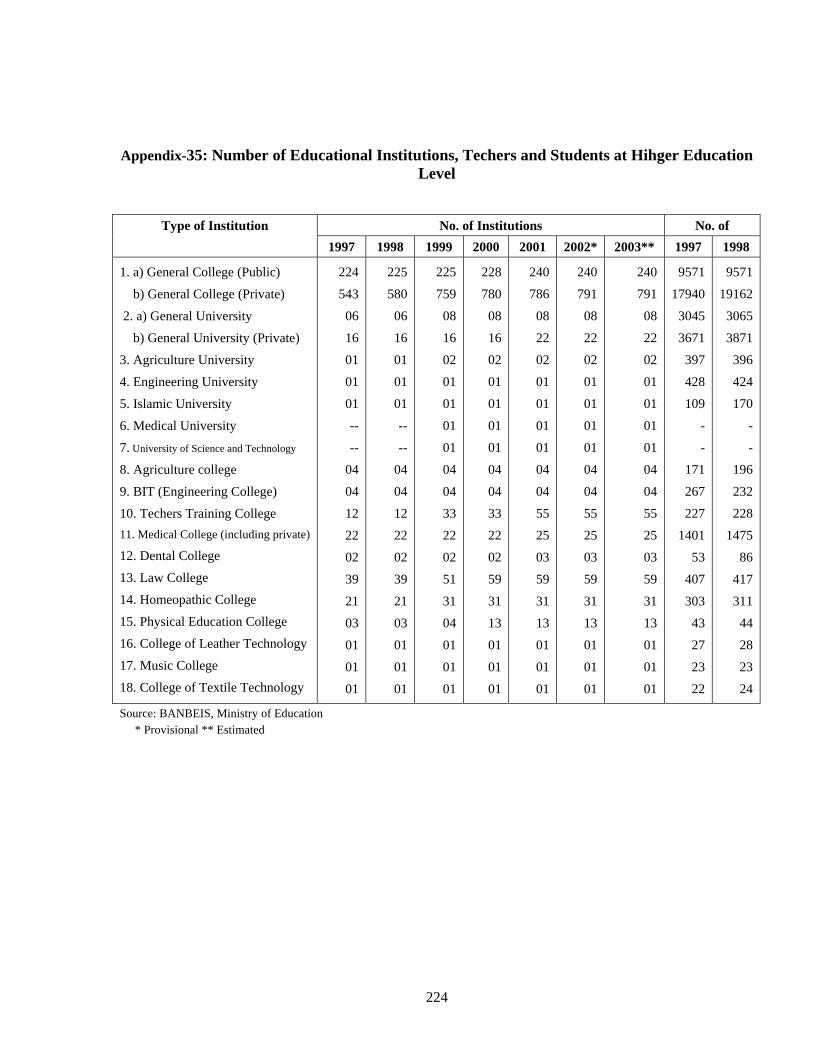
Appendix-35: Number of Educational Institutions, Techers and Students at Hihger Education Level
Type of Institution No. of Institutions No. of 1997 1998 1999 2000 2001 2002* 2003** 1997 1998
1. a) General College (Public)
b) General College (Private)
2. a) General University
b) General University (Private)
3. Agriculture University
4. Engineering University
5. Islamic University
6. Medical University
7. University of Science and Technology
8. Agriculture college
9. BIT (Engineering College)
10. Techers Training College 11. Medical College (including private)
12. Dental College
13. Law College
14. Homeopathic College
15. Physical Education College
16. College of Leather Technology
17. Music College
18. College of Textile Technology
224
543
06
16
01
01
01
--
--
04
04
12
22
02
39
21
03
01
01
01
225
580
06
16
01
01
01
--
--
04
04
12
22
02
39
21
03
01
01
01
225
759
08
16
02
01
01
01
01
04
04
33
22
02
51
31
04
01
01
01
228
780
08
16
02
01
01
01
01
04
04
33
22
02
59
31
13
01
01
01
240
786
08
22
02
01
01
01
01
04
04
55
25
03
59
31
13
01
01
01
240
791
08
22
02
01
01
01
01
04
04
55
25
03
59
31
13
01
01
01
240
791
08
22
02
01
01
01
01
04
04
55
25
03
59
31
13
01
01
01
9571
17940
3045
3671
397
428
109
-
-
171
267
227
1401
53
407
303
43
27
23
22
9571
19162
3065
3871
396
424
170
-
-
196
232
228
1475
86
417
311
44
28
23
24
Source: BANBEIS, Ministry of Education * Provisional ** Estimated
224
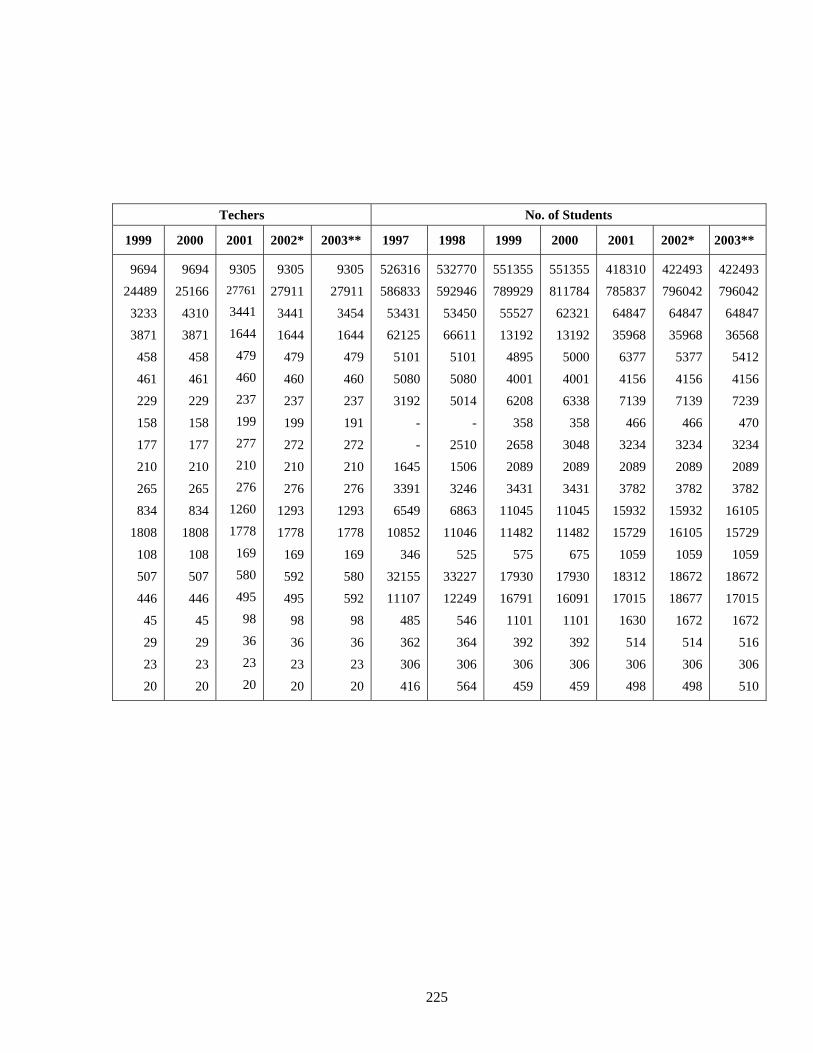
Techers No. of Students
1999 2000 2001 2002* 2003** 1997 1998 1999 2000 2001 2002* 2003**
9694
24489
3233
3871
458
461
229
158
177
210
265
834
1808
108
507
446
45
29
23
20
9694
25166
446
3441 4310
3871
458
461
229
158
177
210
265
834
1808
108
507
45
29
23
20
9305 27761
1644
479
460
237
199
277
210
276
1260
1778
169
580
495
98
36
23
20
9305
27911
3441
1644
479
460
237
199
272
210
276
1293
1778
169
592
495
98
36
23
20
9305
27911
3454
1644
479
460
237
191
272
210
276
1293
1778
169
580
592
98
36
23
20
526316
586833
53431
62125
5101
5080
3192
-
-
1645
3391
6549
10852
346
32155
11107
485
362
306
416
532770
592946
53450
66611
5101
5080
5014
-
2510
1506
3246
6863
11046
525
33227
12249
546
364
306
564
551355
789929
55527
13192
4895
4001
6208
358
2658
2089
3431
11045
11482
575
17930
16791
1101
392
306
459
551355
811784
62321
13192
5000
4001
6338
358
3048
2089
3431
11045
11482
675
17930
16091
1101
392
306
459
418310
785837
64847
35968
6377
4156
7139
466
3234
2089
3782
15932
15729
1059
18312
17015
1630
514
306
498
422493
796042
64847
35968
5377
4156
7139
466
3234
2089
3782
15932
16105
1059
18672
18677
1672
514
306
498
422493
796042
64847
36568
5412
4156
7239
470
3234
2089
3782
16105
15729
1059
18672
17015
1672
516
306
510
225
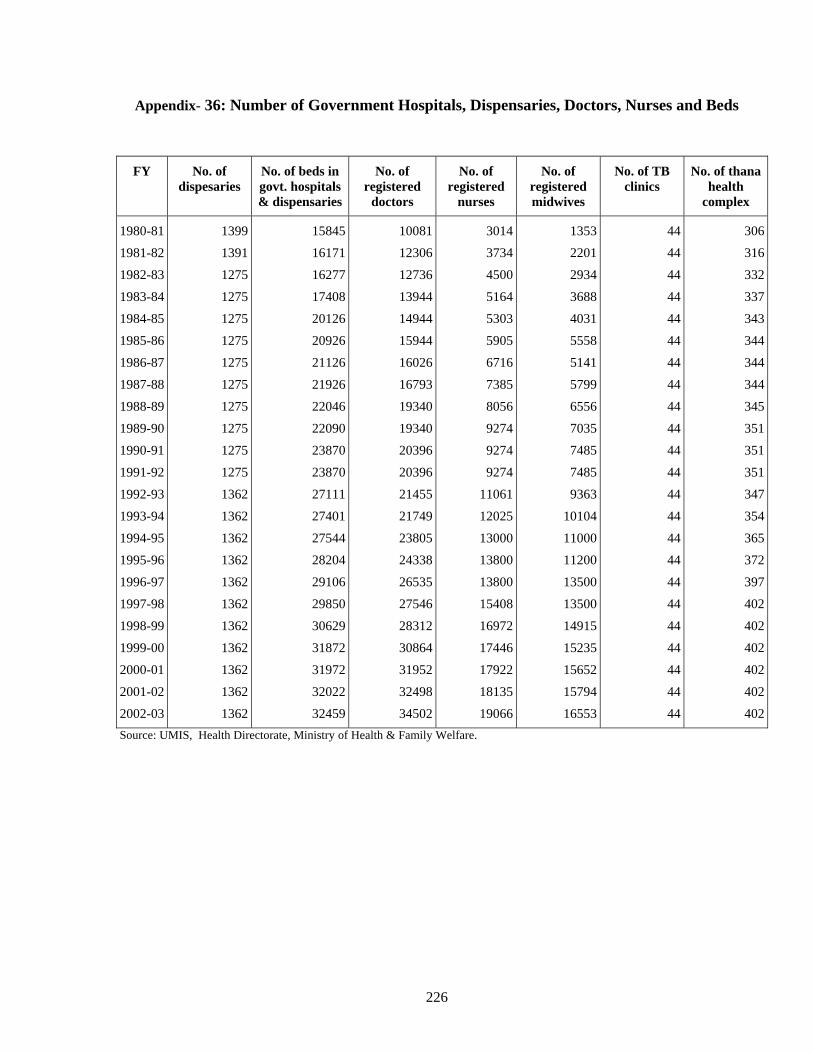
Appendix- 36: Number of Government Hospitals, Dispensaries, Doctors, Nurses and Beds
FY No. of dispesaries
No. of beds in govt. hospitals & dispensaries
No. of registered
doctors
No. of registered
nurses
No. of registered midwives
No. of TB clinics
No. of thana health
complex
1980-81
1981-82
1982-83
1983-84
1984-85
1985-86
1986-87
1987-88
1988-89
1989-90
1990-91
1991-92
1992-93
1993-94
1994-95
1995-96
1996-97
1997-98
1998-99
1999-00
2000-01
2001-02
2002-03
1399
1391
1275
1275
1275
1275
1275
1275
1275
1275
1275
1275
1362
1362
1362
1362
1362
1362
1362
1362
1362
1362
1362
15845
16171
16277
17408
20126
20926
21126
21926
22046
22090
23870
23870
27111
27401
27544
28204
29106
29850
30629
31872
31972
32022
32459
10081
12306
12736
13944
14944
15944
16026
16793
19340
19340
20396
20396
21455
21749
23805
24338
26535
27546
28312
30864
31952
32498
34502
3014
3734
4500
5164
5303
5905
6716
7385
8056
9274
9274
9274
11061
12025
13000
13800
13800
15408
16972
17446
17922
18135
19066
1353
2201
2934
3688
4031
5558
5141
5799
6556
7035
7485
7485
9363
10104
11000
11200
13500
13500
14915
15235
15652
15794
16553
44
44
44
44
44
44
44
44
44
44
44
44
44
44
44
44
44
44
44
44
44
44
44
306
316
332
337
343
344
344
344
345
351
351
351
347
354
365
372
397
402
402
402
402
402
402Source: UMIS, Health Directorate, Ministry of Health & Family Welfare.
226
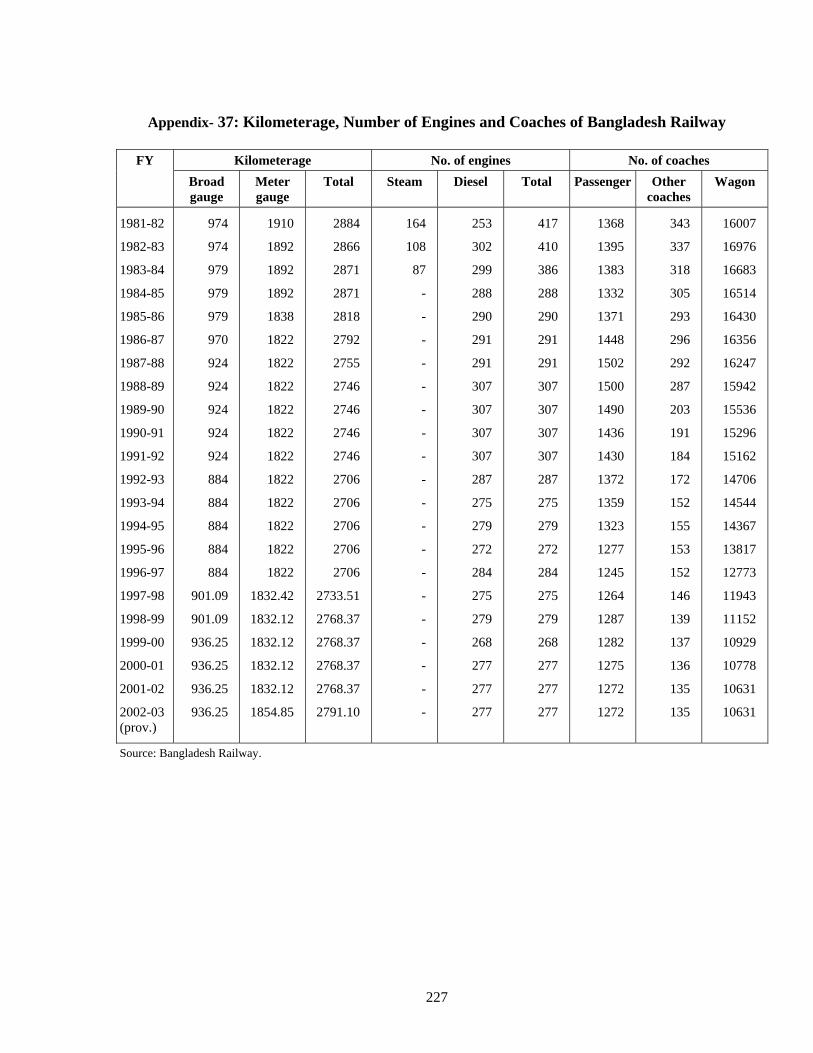
Appendix- 37: Kilometerage, Number of Engines and Coaches of Bangladesh Railway
Kilometerage No. of engines No. of coaches FY
Broad gauge
Meter gauge
Total Steam Diesel Total Passenger Other coaches
Wagon
1981-82
1982-83
1983-84
1984-85
1985-86
1986-87
1987-88
1988-89
1989-90
1990-91
1991-92
1992-93
1993-94
1994-95
1995-96
1996-97
1997-98
1998-99
1999-00
2000-01
2001-02
2002-03 (prov.)
974
974
979
979
979
970
924
924
924
924
924
884
884
884
884
884
901.09
901.09
936.25
936.25
936.25
936.25
1910
1892
1892
1892
1838
1822
1822
1822
1822
1822
1822
1822
1822
1822
1822
1822
1832.42
1832.12
1832.12
1832.12
1832.12
1854.85
2884
2866
2871
2871
2818
2792
2755
2746
2746
2746
2746
2706
2706
2706
2706
2706
2733.51
2768.37
2768.37
2768.37
2768.37
2791.10
164
108
87
-
-
-
-
-
-
-
-
-
-
-
-
-
-
-
-
-
-
-
253
302
299
288
290
291
291
307
307
307
307
287
275
279
272
284
275
279
268
277
277
277
417
410
386
288
290
291
291
307
307
307
307
287
275
279
272
284
275
279
268
277
277
277
1368
1395
1383
1332
1371
1448
1502
1500
1490
1436
1430
1372
1359
1323
1277
1245
1264
1287
1282
1275
1272
1272
343
337
318
305
293
296
292
287
203
191
184
172
152
155
153
152
146
139
137
136
135
135
16007
16976
16683
16514
16430
16356
16247
15942
15536
15296
15162
14706
14544
14367
13817
12773
11943
11152
10929
10778
10631
10631
Source: Bangladesh Railway.
227
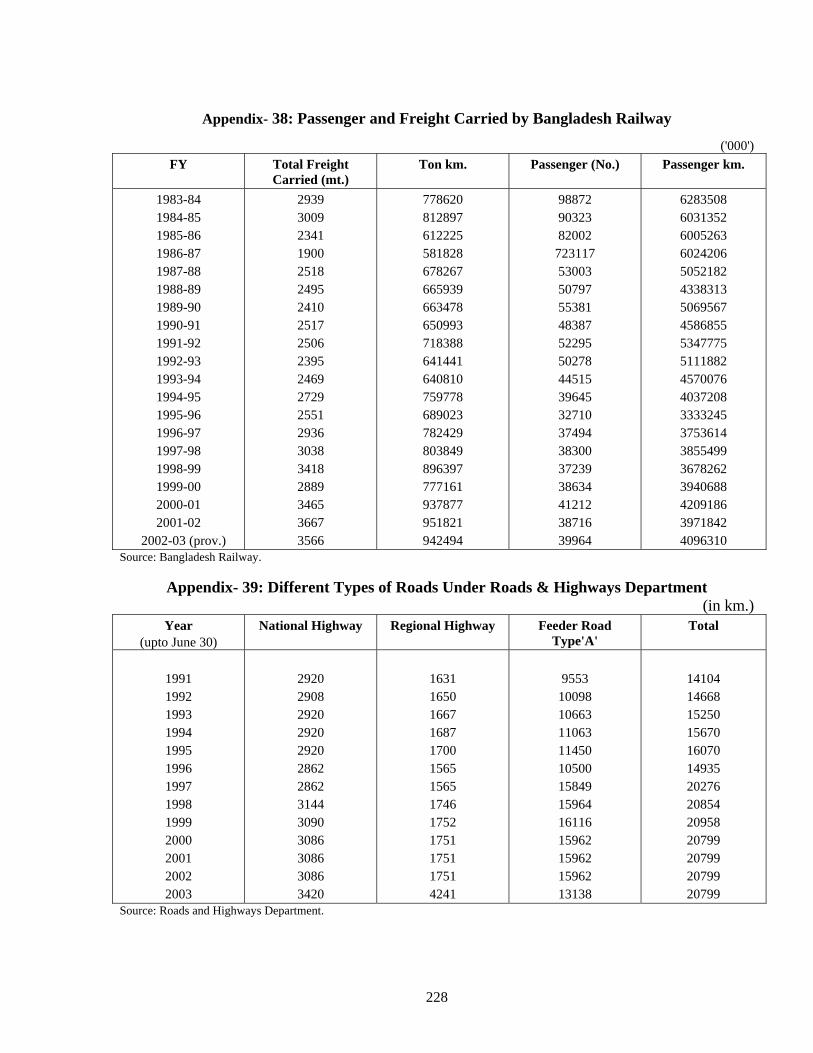
Appendix- 38: Passenger and Freight Carried by Bangladesh Railway
('000')
FY Total Freight Carried (mt.)
Ton km. Passenger (No.) Passenger km.
1983-84 1984-85 1985-86 1986-87 1987-88 1988-89 1989-90 1990-91 1991-92 1992-93 1993-94 1994-95 1995-96 1996-97 1997-98 1998-99 1999-00 2000-01 2001-02
2002-03 (prov.)
2939 3009 2341 1900 2518 2495 2410 2517 2506 2395 2469 2729 2551 2936 3038 3418 2889 3465 3667 3566
778620 812897 612225 581828 678267 665939 663478 650993 718388 641441 640810 759778 689023 782429 803849 896397 777161 937877 951821 942494
98872 90323 82002
723117 53003 50797 55381 48387 52295 50278 44515 39645 32710 37494 38300 37239 38634 41212 38716 39964
6283508 6031352 6005263 6024206 5052182 4338313 5069567 4586855 5347775 5111882 4570076 4037208 3333245 3753614 3855499 3678262 3940688 4209186 3971842 4096310
Source: Bangladesh Railway.
Appendix- 39: Different Types of Roads Under Roads & Highways Department
(in km.) Year
(upto June 30) National Highway Regional Highway Feeder Road
Type'A' Total
1991 1992 1993 1994 1995 1996 1997 1998 1999 2000 2001 2002 2003
2920 2908 2920 2920 2920 2862 2862 3144 3090 3086 3086 3086 3420
1631 1650 1667 1687 1700 1565 1565 1746 1752 1751 1751 1751 4241
9553
10098 10663 11063 11450 10500 15849 15964 16116 15962 15962 15962 13138
14104 14668 15250 15670 16070 14935 20276 20854 20958 20799 20799 20799 20799
Source: Roads and Highways Department.
228
Appendix- 40: Terms of Trade (1979-80=100) Appendix- 41:Average Rate of Foreign Exchange with US$
FY Export price indices
Import price indices
Terms of trade
FY Taka-Dollar average exchange rate
1981-82
1982-83
1983-84
1984-85
1985-86
1986-87
1987-88
1988-89
1989-90
1990-91
1991-92
1992-93
1993-94
1994-95 1995-96
1996-97
1997-98
1998-99 (esimated) 1999-2000 (estimated)
74.7 (-13.9)
76.1 (1.9) 89.8
(18.0) 108.8 (21.2) 78.9
(-27.5) 81.8 (3.7) 95.7
(17.0) 92.6
(-3.2) 95.6 (3.2) 101.9 (6.6) 100.4 (-1.5) 107.3 (6.9) 113.3 (5.6) 120.8 (6.6)
128.9 (6.7)
135.0 (4.8) 140.2 (3.8) 140.6 (0.3) 141.3 (0.5)
118.7 (4.6) 112.5 (-5.2) 110.9 (-1.4) 110.8 (-0.1) 98.5
(-11.1) 89.9
(-8.7) 91.4 (1.7) 97.2 (6.3) 103.0 (6.0) 107.4 (4.3) 104.4 (-2.8) 107.8 (3.2) 110.8 (3.0) 120.7 (8.9)
129.5 (7.3)
133.4 (3.0) 137.9 (3.4) 145.0
1972-73
(5.1) 158.0 (9.0)
62.9
(-17.8) 67.6 (7.5) 81.0
(19.8) 98.2
(21.2) 80.1
(-18.4) 91.0
(13.6) 104.7 (15.1) 95.3
(-9.0) 92.8
(-2.6) 94.9 (2.3) 96.2 (1.4) 99.6 (3.5) 102.3 (2.6) 100.1 (-2.2)
99.5 (-0.6)
101.2 (-1.7) 101.7 (0.5) 97.0
(-4.6) 89.4
(-7.8)
1971-72
1973-74 1974-75 1975-76 1976-77 1977-78 1978-79 1979-80 1980-81 1981-82
1982-83 1983-84 1984-85 1985-86 1986-87 1987-88 1988-89 1989-90
1990-91 1991-92 1992-93 1993-94 1994-95 1995-96
1996-97 1997-98 1998-99 1999-00 2000-01 2001-02 2002-03
7.3000 7.8763 7.9664 8.8752
15.0541 15.4260 15.1168 15.2231 15.4900 16.2586 20.0652
23.7953 24.9437 25.9634 29.8861 30.6294 31.2422 32.1399 32.9214
35.6752 38.1453 39.1395 40.0009 40.2005 40.8365
42.7008 45.4563 48.0644 50.3112 53.9592 57.4347 57.9000
Source: Planning Commission. Source: Statistics Department, Bangladesh Bank. Note: Figures in parenthesis indicate annual percentage change. Data is not available after FY 1999-2000.
229
Appendix-42: Value of Export by Major Commodities
(in million US$)
Commodity 91-92 92-93 93-94 94-95 95-96 96-97 97-98 98-99
99-00 2000-01
2001-02
2002-03
a) Primary commodities 1. Raw Jute
21
2. Tea 3. Frozen Food 4. Agriculture Product 5. Other primary
commodities
85 32
131 10 10
7441
1651519
5738
2111526
7933
30613
9133
3142216
11638
3212922
10847
2943914
72 39
274 22 15
72 18
344 18 17
6722
3631814
6117
2762313
8316
3222517
Total Primary Commodities (1-5)
268 314 347 452 476 526 502 422 469 484 390 463
b) Manufactures goods 1. Raw Jute 2. Leather 3. Naptha, furnace oil and
bitumen 4. Readymade Garments 5. Knitwear 6. Chemical products 7. Paper and allied products 8. Handicrafts 9. Engineering products 10. Other mfg. products
301 144
8
1064 119 25 6 9 9
41
29214837
12402055535
1866
28416816
129226454
-74
98
31920214
18351035 393
108-6
10134
32921211
194959898
-6
13191
31819516
2238763108
-6
16241
28119011
284394074
-6
20305
304 168
5
2985
79 - 8
11 307
266 195 11
3083 1270
94 - 5 8
351
23025410
33641496
97173
521
24420710
31251459
67-61
477
25719131
32581654101
-6
13575
Total mfg. products (6-15) 1726 2069 2187 3021 3408 3901 4670 4902 5283 5983 5596 6086Grand total (a+b) 1994 2383 2534 3473 3884 4427 5172 5324 5752 6467 5986 6549Annual change (%) 16.1 19.5 6.3 37.1 11.8 14.0 16.8 2.9 8.03 12.43 -7.44 9.39Source: Export Promotion Bureau and Bangladesh Bank.
230
Appendix- 43: Value of Imports by Major Commodities
(in million US$) Commodity 91-92 92-93 93-94 94-95 95-96 96-97 97-98 98-99
99-00 2000-01
2001-02
2002-03
a) Major primary goods Rice Wheat
b) Major intermediate goods
1346
273 Oilseeds Crude petroleum Raw cotton
Edible oil Petroleum products Fertilizer Cements Stple fibre Yarn c) Capital goods d) Other goods
532 4
251 30
152 95
679
185 168 114 110 16 86
1289 1016
465 0
176 35
163 91
638
113 165 131 130 18 81
1622
461 23
145 65
157 71
713
140 166 135 129 31
112 13001717
868 220 256 80
177 135 924
220 206 142 116 40
200 16882354
1026358 228 89
166 185 1076
179 290 97
171 43
296 19682877
615 28
156 62
174 195 1303
216 341 150 156 45
395 19373297
809 247 122 93
140 207 1146
216 295 108 152 48
327 20723493
1448680 317 100 118 233 1104
287 270 120 105 39
283 19693485
980 115 266 90
232 277 1225
256 406 140 80 43
300 2133 4036
1046 172 177 64
360 1318
218 566 129 44 39 322
2515 4456
812 15 171 72 242 312
1167
251 481 107 6
39 283
2617 3944
1133 211 198 64
267 393 1406
364 620 109 2 41
270 2664 4459
Total imports 3516 4071 4191 5834 6947 7152 7520 8006 8374 9335 8540 9658 Annual change (%) 1.3 15.8 2.9 39.2 19.1 3.0 5.1 6.5 4.6 11.50 -8.5 13.1 Source: Bangladesh Bank
Appendix- 44: Overseas Employment and Remittances
FY Number of expatriats ('000')
Remittances
million US$ crore Taka 1983-84 1984-85 1985-86 1986-87 1987-88 1988-89 1989-90 1990-91 1991-92 1992-93 1993-94 1994-95 1995-96 1996-97 1997-98 1998-99 1999-00 2000-01 2001-02 2002-03
50 69 78 61 74 87
110 97
185 238 192 200 181 228 243 270 248 213 195 241
596 439 555 696 737 771 761 764 848 947
1089 1198 1217 1475 1525 1706 1949 1882 2501 3062
1491 1146 1661 2136 2304 2477 2496 2726 3242 3710 4355 4814 4978 6304 6951 8213 9825
10266 14377 17729
Source: Bureau of Manpower, Employment & Training and Bangladesh Bank
231
Appendix-45: Banlance of Payments (In million US dollar)
Transactions 1996-97 1997-98 1998-99
1999-00 2000-01 2001--02 2002-03p
Trade Balance Export, fob. (including EPZ)1/
Import, c.i.f. (including EPZ) Services (net) Receipts Payments Income (net) Receipts Payments Current transfers Official Private Of which: workers' remittances Current account balance Capital account (net) Capital transers5
Financial account i) Direct investment ii) Portfolio investments iii) Other investments MLT toans2/
MLT amortization payments Other long-term loan (net) Other short-term loan (net) Other assets Trade credit (net) Commercial Bank Assets Liabilities
Errors and omissions Overall balance Reserve assets
Bangladesh Bank Assets Liabilities
-21134334
-6447 -552657
-1207 -107
89 -196
1907137
1770 1475 -865
598 598
-11016
-132 6
734 -316
57 -58 -69
-365 23
-28 51
180-197
197197 325
-128
-16695103
-6772 -570707
-1277 -100
91 -191
1876126
1750 1525 -463
445 445 237249
3 -15 706
-308 -47 168 -41
-522 29
-19 48
-88131-131-131 -14
-117
-19345283
-7217 -603707
-1310 -135
91 -226
2195220
1975 1706 -477
387 387
-395198
-6 -587 821
-341 -41 -78 -58
-829 -61 -31 -30 267
-218218218 205 13
-18655701
-7566 -645849
-1494 -221
97 -318
2394165
2229 1949 -337
561 561
-185194
0 -379 806
-396 127 56
-55 -641 -276 -161 -115 125
164-164-164 -79 -85
-2011 6419
-8430 -914 759
-1673 -264
97 -361
2171
72 2099 1882
-1018 432 432 407 174
0 233 790
-416 -13 86
-68 -260 114 147 -33 -47
-226 226 226 302 -76
-17685929
-7697 -499865
-1364 -319
50 -369
2826
69 2757 2501 240410 410 7165 -6 12
733 -421 -42 20
-52 -253
27 -90 117
-356365-365-365 -276 -89
-22076492
-8699 -688887
-1575 -195
64 -259
3418
60 3358 3062 328392 392 30292 2
208 937
-431 -20 226 -81
-494 71
217 -146 -123899-899-899 -887 -12
p Provisional 1/. Excludes local sales reported by EPB. Some adjustment necessitated by BOP cosiderations has been made. 2/. Excludes suppliers credit, reclassified as trade cedit Source: Statistics Department, Bangladesh Bank.
232
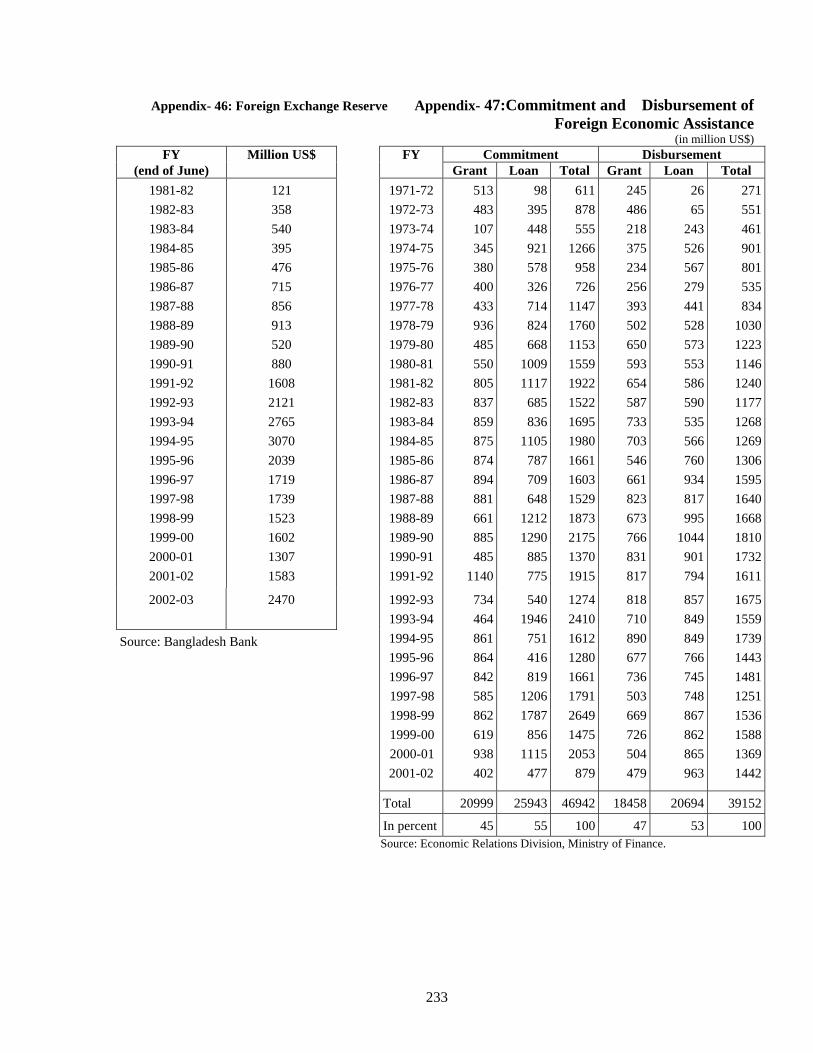
Appendix- 46: Foreign Exchange Reserve Appendix- 47:Commitment and Disbursement of Foreign Economic Assistance
(in million US$) FY Million US$ FY Commitment Disbursement
(end of June) Grant Loan Total Grant Loan Total 1981-82 1982-83 1983-84 1984-85 1985-86 1986-87 1987-88 1988-89 1989-90 1990-91 1991-92 1992-93 1993-94 1994-95 1995-96 1996-97 1997-98 1998-99 1999-00 2000-01 2001-02
121 358 540 395 476 715 856 913 520 880
1608 2121 2765 3070 2039 1719 1739 1523 1602 1307 1583
1971-72 1972-73 1973-74 1974-75 1975-76 1976-77 1977-78 1978-79 1979-80 1980-81 1981-82 1982-83 1983-84 1984-85 1985-86 1986-87 1987-88 1988-89 1989-90 1990-91 1991-92
513483107345380400433936485550805837859875874894881661885485
1140
98395448921578326714824668
10091117
685836
1105787709648
12121290
885775
611 878 555
1266 958 726
1147 1760 1153 1559 1922 1522 1695 1980 1661 1603 1529 1873 2175 1370 1915
245 486 218 375 234 256 393 502 650 593 654 587 733 703 546 661 823 673 766 831 817
2665
243526567279441528573553586590535566760934817995
1044901794
271551461901801535834
10301223114612401177126812691306159516401668181017321611
2002-03
2470
Source: Bangladesh Bank
1992-93 1993-94 1994-95 1995-96 1996-97
1997-98 1998-99 1999-00 2000-01 2001-02
734464861864842585862619938402
5401946
751416819
12061787
8561115
477
1274 2410 1612 1280 1661 1791 2649 1475 2053
879
818 710 890 677 736 503 669 726 504 479
857849849766745748867862865963
1675155917391443148112511536158813691442
Total 20999 25943 46942 18458 20694 39152
In percent 45 55 100 47 53 100 Source: Economic Relations Division, Ministry of Finance.
233
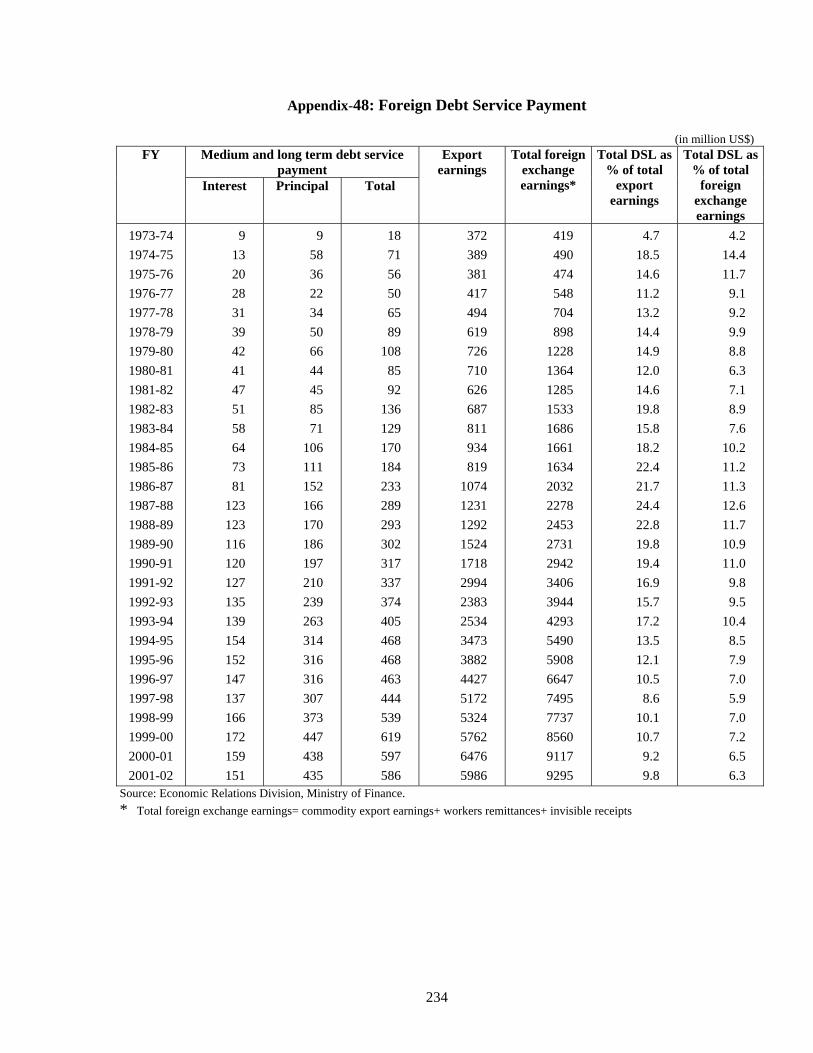
Appendix-48: Foreign Debt Service Payment
(in million US$) Medium and long term debt service
payment FY
Interest Principal Total
Export earnings
Total foreign exchange earnings*
Total DSL as % of total
export earnings
Total DSL as % of total
foreign exchange earnings
1973-74 1974-75 1975-76 1976-77 1977-78 1978-79 1979-80 1980-81 1981-82 1982-83 1983-84 1984-85 1985-86 1986-87 1987-88 1988-89 1989-90 1990-91 1991-92 1992-93 1993-94 1994-95 1995-96 1996-97 1997-98 1998-99 1999-00 2000-01 2001-02
9 13 20 28 31 39 42 41 47 51 58 64 73 81
123 123 116 120 127 135 139 154 152 147 137 166 172 159 151
9 58 36 22 34 50 66 44 45 85 71
106 111 152 166 170 186 197 210 239 263 314 316 316 307 373 447 438 435
18 71 56 50 65 89
108 85 92
136 129 170 184 233 289 293 302 317 337 374 405 468 468 463 444 539 619 597 586
372 389 381 417 494 619 726 710 626
3882
419
687 811 934 819
1074 1231 1292 1524 1718 2994 2383 2534 3473
4427 5172 5324 5762 6476 5986
490 474 548 704 898
1228 1364 1285 1533 1686 1661 1634 2032 2278 2453 2731 2942 3406 3944 4293 5490 5908 6647 7495 7737 8560 9117 9295
4.7 18.5 14.6 11.2 13.2 14.4 14.9 12.0 14.6 19.8 15.8 18.2 22.4 21.7 24.4 22.8 19.8 19.4 16.9 15.7 17.2 13.5 12.1 10.5
8.6 10.1 10.7
9.2 9.8
4.2 14.4 11.7
9.1 9.2 9.9 8.8 6.3 7.1 8.9 7.6
10.2 11.2 11.3 12.6 11.7 10.9 11.0
9.8 9.5
10.4 8.5 7.9 7.0 5.9 7.0 7.2 6.5 6.3
Source: Economic Relations Division, Ministry of Finance. * Total foreign exchange earnings= commodity export earnings+ workers remittances+ invisible receipts
234
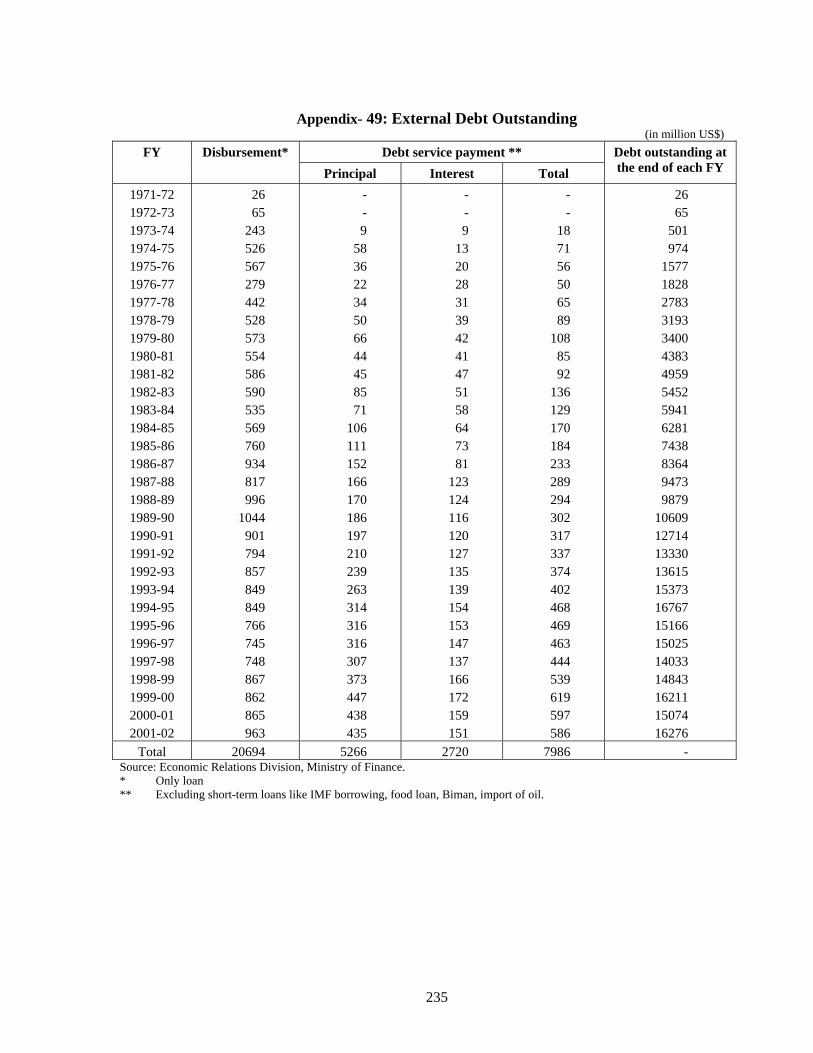
Appendix- 49: External Debt Outstanding
(in million US$) FY Disbursement* Debt service payment **
Principal Interest Total Debt outstanding at the end of each FY
1971-72 1972-73 1973-74 1974-75 1975-76 1976-77 1977-78 1978-79 1979-80 1980-81 1981-82 1982-83 1983-84 1984-85 1985-86 1986-87 1987-88 1988-89 1989-90 1990-91 1991-92 1992-93 1993-94 1994-95 1995-96 1996-97 1997-98 1998-99 1999-00 2000-01 2001-02
26 65
243 526 567 279 442 528 573 554 586 590 535 569 760 934 817 996
1044 901 794 857 849 849 766 745 748 867 862 865 963
- - 9
58 36 22 34 50 66 44 45 85 71
106 111 152 166 170 186 197 210 239 263 314 316 316 307 373 447 438 435
- - 9
13 20 28 31 39 42 41 47 51 58 64 73 81
123 124 116 120 127 135 139 154 153 147 137 166 172 159 151
- -
18 71 56 50 65 89
108 85 92
136 129 170 184 233 289 294 302 317 337 374 402 468 469 463 444 539 619 597 586
26 65
501 974
1577 1828 2783 3193 3400 4383 4959 5452 5941 6281 7438 8364 9473 9879
10609 12714 13330 13615 15373 16767 15166 15025 14033 14843 16211 15074 16276
Total 20694 5266 2720 7986 - Source: Economic Relations Division, Ministry of Finance. * Only loan ** Excluding short-term loans like IMF borrowing, food loan, Biman, import of oil.
235
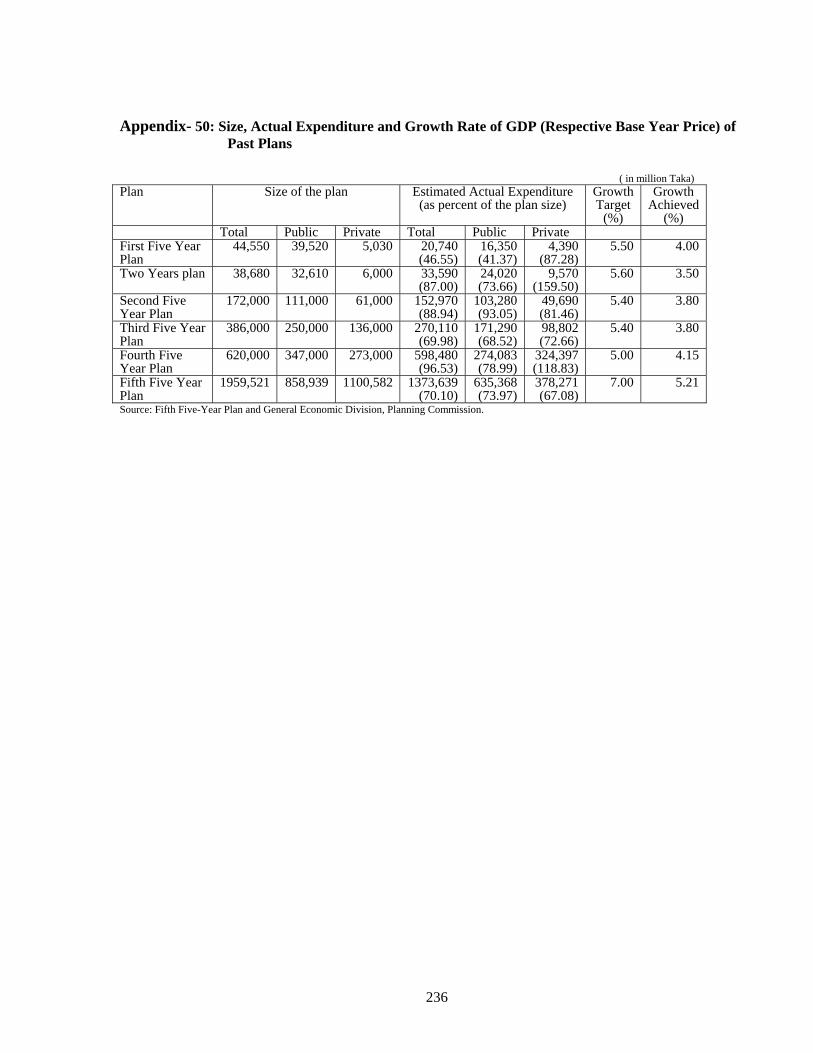
Appendix- 50: Size, Actual Expenditure and Growth Rate of GDP (Respective Base Year Price) of
Past Plans
( in million Taka) Plan Size of the plan Estimated Actual Expenditure
(as percent of the plan size) Growth Target
(%)
Growth Achieved
(%) Total Public Private Total Public Private First Five Year Plan
44,550 39,520 5,030 20,740 (46.55)
16,350 (41.37)
4,390 (87.28)
5.50 4.00
Two Years plan 38,680 32,610 6,000 33,590 (87.00)
24,020 (73.66)
9,570 (159.50)
5.60 3.50
Second Five Year Plan
172,000 111,000 61,000 152,970 (88.94)
103,280 (93.05)
49,690 (81.46)
5.40 3.80
Third Five Year Plan
386,000 250,000 136,000 270,110 (69.98)
171,290 (68.52)
98,802 (72.66)
5.40 3.80
Fourth Five Year Plan
620,000 347,000 273,000 598,480 (96.53)
274,083 (78.99)
324,397 (118.83)
5.00 4.15
Fifth Five Year Plan
1959,521 858,939 1100,582 1373,639 (70.10)
635,368 (73.97)
378,271 (67.08)
7.00 5.21
Source: Fifth Five-Year Plan and General Economic Division, Planning Commission.
236
Related Documents