ECONOMIC REVIEW Digitized for FRASER http://fraser.stlouisfed.org/ Federal Reserve Bank of St. Louis

Welcome message from author
This document is posted to help you gain knowledge. Please leave a comment to let me know what you think about it! Share it to your friends and learn new things together.
Transcript
ECONOMIC REVIEW
Digitized for FRASER http://fraser.stlouisfed.org/ Federal Reserve Bank of St. Louis

Additional copies of the ECONOMIC REVIEW may be obtained from the Research Department, Federal Reserve Bank of Cleveland, P. 0 . Box 6387, Cleveland, Ohio 44101. Permission is granted to reproduce any material in this publication providing credit is given.
Digitized for FRASER http://fraser.stlouisfed.org/ Federal Reserve Bank of St. Louis
T HE ST. L A W R E N C E
S E A W A Y A N D THE
F O U RT H DISTRICT
IN THIS ISSUE
The St. Lawrence Seaway and the Fourth District . 3
Capital Spending in Major Metropolitan Areas of the Fourth District . . . .17
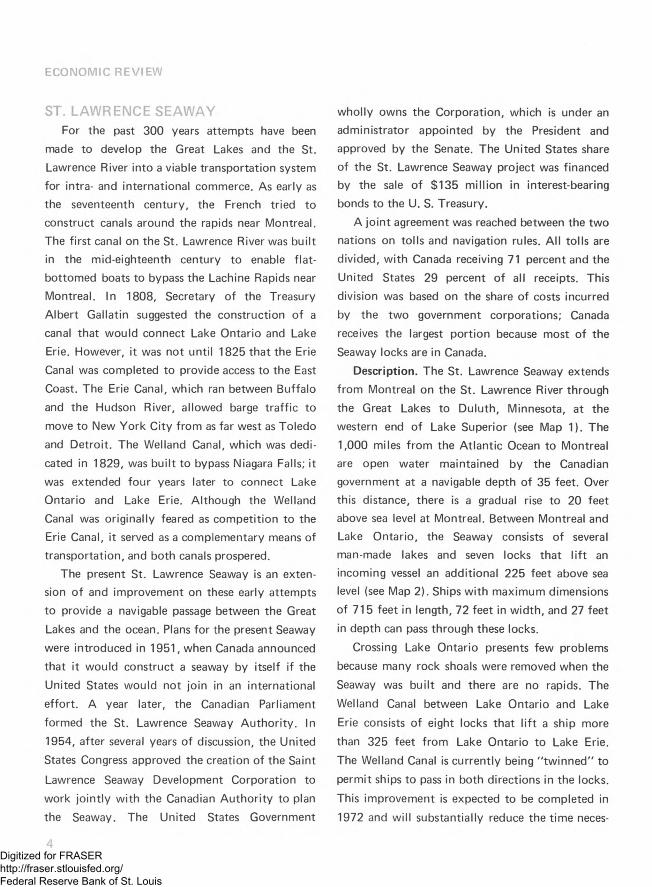
The opening of the St. Lawrence Seaway in 1959 provided Ohio and other midwestern states with direct access to ocean shipping. Although use of the Seaway has grown rapidly since its opening, competition from other modes of transportation and from other ports may lim it further expansion. The Seaway has contributed to economic growth in the Fourth District by providing raw materials as well as the least costly movement of finished goods to and from foreign markets. Future growth of the Seaway is, therefore, directly related to continued economic expansion of the area it serves.
This article discusses the historical context of the
development of the St. Lawrence Seaway and the types of
cargo shipped through the Seaway and reviews the Fourth
District ports on the Seaway and the various cargoes handled by each port. Competition from other modes of
transportation, competition from other ports, and problems
experienced with the Seaway are also examined.
3Digitized for FRASER http://fraser.stlouisfed.org/ Federal Reserve Bank of St. Louis
ECONOMIC REVIEW
ST. LAWRENCE SEAWAYFor the past 300 years attempts have been
made to develop the Great Lakes and the St. Lawrence River into a viable transportation system for intra- and international commerce. As early as the seventeenth century, the French tried to construct canals around the rapids near Montreal. The first canal on the St. Lawrence River was built in the mid-eighteenth century to enable flat- bottomed boats to bypass the Lachine Rapids near Montreal. In 1808, Secretary of the Treasury Albert Gallatin suggested the construction of a canal that would connect Lake Ontario and Lake Erie. However, it was not until 1825 that the Erie Canal was completed to provide access to the East Coast. The Erie Canal, which ran between Buffalo and the Hudson River, allowed barge traffic to move to New York City from as far west as Toledo and Detroit. The Welland Canal, which was dedicated in 1829, was built to bypass Niagara Falls; it was extended four years later to connect Lake Ontario and Lake Erie. Although the Welland Canal was originally feared as competition to the Erie Canal, it served as a complementary means of transportation, and both canals prospered.
The present St. Lawrence Seaway is an extension of and improvement on these early attempts to provide a navigable passage between the Great Lakes and the ocean. Plans for the present Seaway were introduced in 1951, when Canada announced that it would construct a seaway by itself if the United States would not join in an international effort. A year later, the Canadian Parliament formed the St. Lawrence Seaway Authority. In 1954, after several years of discussion, the United States Congress approved the creation of the Saint
Lawrence Seaway Development Corporation to work jo in tly w ith the Canadian Authority to plan the Seaway. The United States Government
wholly owns the Corporation, which is under an administrator appointed by the President and approved by the Senate. The United States share of the St. Lawrence Seaway project was financed by the sale of $135 million in interest-bearing bonds to the U. S. Treasury.
A jo in t agreement was reached between the two nations on tolls and navigation rules. A ll tolls are divided, w ith Canada receiving 71 percent and the United States 29 percent of all receipts. This division was based on the share of costs incurred
by the two government corporations; Canada receives the largest portion because most of the Seaway locks are in Canada.
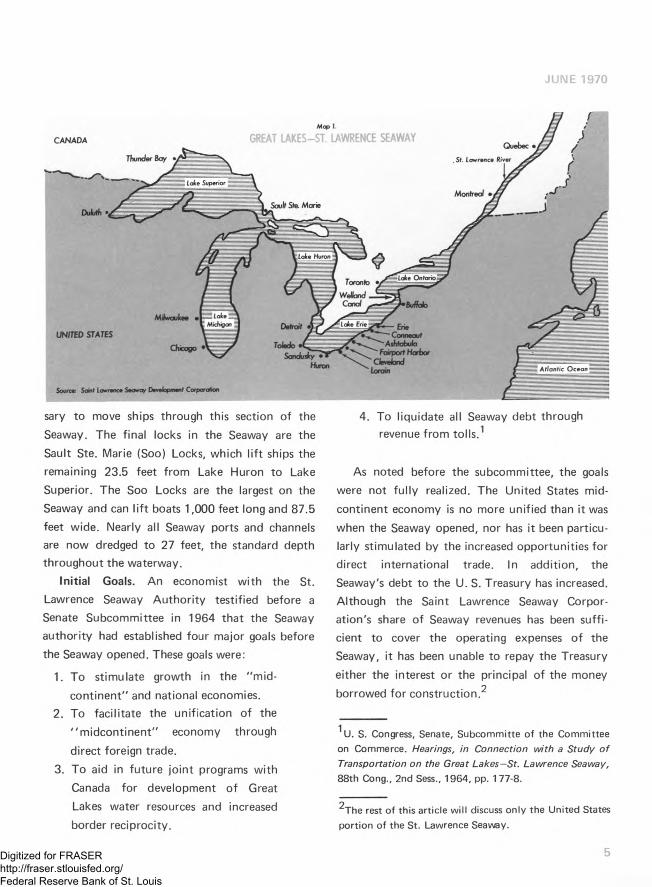
Description. The St. Lawrence Seaway extends from Montreal on the St. Lawrence River through
the Great Lakes to Duluth, Minnesota, at the western end of Lake Superior (see Map 1). The1,000 miles from the Atlantic Ocean to Montreal are open water maintained by the Canadian government at a navigable depth of 35 feet. Over this distance, there is a gradual rise to 20 feet above sea level at Montreal. Between Montreal and Lake Ontario, the Seaway consists of several man-made lakes and seven locks that lif t an incoming vessel an additional 225 feet above sea level (see Map 2). Ships with maximum dimensions of 715 feet in length, 72 feet in width, and 27 feet in depth can pass through these locks.
Crossing Lake Ontario presents few problems because many rock shoals were removed when the
Seaway was built and there are no rapids. The Welland Canal between Lake Ontario and Lake
Erie consists of eight locks that lif t a ship more than 325 feet from Lake Ontario to Lake Erie.
The Welland Canal is currently being “ tw inned" to permit ships to pass in both directions in the locks.
This improvement is expected to be completed in
1972 and w ill substantially reduce the time neces
4Digitized for FRASER http://fraser.stlouisfed.org/ Federal Reserve Bank of St. Louis
JUNE 1970
CANADA GREAT LAKES-ST. LAWRENCE SEAWAY
UNITED STATES
Chicago
Source Scarf Lawrence Seaway Development Corporation
sary to move ships through this section of the Seaway. The final locks in the Seaway are the Sault Ste. Marie (Soo) Locks, which lif t ships the remaining 23.5 feet from Lake Huron to Lake Superior. The Soo Locks are the largest on the Seaway and can lif t boats 1,000 feet long and 87.5
feet wide. Nearly all Seaway ports and channels are now dredged to 27 feet, the standard depth throughout the waterway.
Initial Goals. An economist w ith the St. Lawrence Seaway Authority testified before a Senate Subcommittee in 1964 that the Seaway authority had established four major goals before the Seaway opened. These goals were:
1. To stimulate growth in the "mid-
continent” and national economies.2. To facilitate the unification of the
"m idcontinent” economy through
direct foreign trade.
3. To aid in future jo in t programs with Canada for development of Great Lakes water resources and increased border reciprocity.
4. To liquidate all Seaway debt through revenue from to lls.1
As noted before the subcommittee, the goals were not fu lly realized. The United States midcontinent economy is no more unified than it was
when the Seaway opened, nor has it been particularly stimulated by the increased opportunities for direct international trade. In addition, the Seaway's debt to the U. S. Treasury has increased. Although the Saint Lawrence Seaway Corporation's share of Seaway revenues has been sufficient to cover the operating expenses of the Seaway, it has been unable to repay the Treasury
either the interest or the principal of the money
borrowed for construction.
1U. S. Congress, Senate, Subcommitte o f the Committee on Commerce. Hearings, in Connection w ith a Study o f Transportation on the Great Lakes—St. Lawrence Seaway, 88th Cong., 2nd SeSs., 1964, pp. 177-8.
The rest o f this article w ill discuss only the United States portion of the St. Lawrence Seaway.
5Digitized for FRASER http://fraser.stlouisfed.org/ Federal Reserve Bank of St. Louis

ECONOMIC REVIEW
M a p 2 .
PROFILE VIEW of GREAT LAKES and ST. LAWRENCE SEAWAY
ST. CLAIR RIVER WELLAND CANAL
THOUSAND ISLANDS SECTION
LACHINESECTION
LAKE SUPERIOR W LAKE ST. LAWRENCE
SOO'LOCKS INTERNATIONAL RAPIDS SECTION
SOULANGESSECTION
LAKE HURON and LAKE MICHIGAN
Source: Saint Lawrence Seaway Development Corporation
LAKE ST. LOUIS
LAKE ST. FRANCIS
LAKE ONTARIO TIDE WATER SECTION
The initial traffic goals of the Seaway Corporation were more realistic than some of its other goals, although traffic in the first several seasons was far lower than originally anticipated. The original estimate of Seaway traffic in 1968 was for 50 million cargo tons.3 The Corporation reported that, in 1968, 48 million cargo tons passed through the Montreal-Lake Ontario section; with the addition of the Welland Canal, Seaway traffic amounted to 66.4 million cargo tons in 1968.4
Types of Shipping. Two types of shipping are
transferred through the St. Lawrence Seaway:
bulk and general cargo. The most important in
terms of tonnage is bulk shipping, which includes
coal, iron ore, and farm products, particularly
grain. However, a large amount of bulk shipping is
3U. S. Congress, op. cit., p. 178.
4The St. Lawrence Seaway A u tho rity and the Saint
Lawrence Seaway Development Corporation, Traffic Report o f the St. Lawrence Seaway, 1968, (Ottawa, Queen's Printer, 1969), p. 12, p. 2.
carried out within the Great Lakes and does not reach the St. Lawrence River. For example, iron ore is shipped between Minnesota and Cleveland, and coal goes from Toledo to power plants in Michigan and Canada. Moreover, a large share of bulk shipping is done on specialized boats that cannot leave the Great Lakes because they are not ocean worthy or because they are too large to pass through the Welland Canal.
Although it is sometimes d ifficu lt to differen
tiate general cargo from bulk shipping, general
cargo usually includes all items that can be lifted
into ships as a unit or in some type of container,
such as a box or barrel. General cargo includes such diversified items as automobiles and automobile parts, glassware, and iron and steel products. (Iron and steel products are the most important general cargo items shipped through Fourth District ports.) The value per ton is usually much higher on general cargo than on bulk shipping, and a major share of general cargo tends to be destined for international ports.
6Digitized for FRASER http://fraser.stlouisfed.org/ Federal Reserve Bank of St. Louis
JUNE 1970
FOURTH DISTRICT PORTSThere are nine Great Lakes ports in the Fourth
Federal Reserve District: Ashtabula, Cleveland, Conneaut, Fairport Harbor, Huron, Lorain, Sandusky, and Toledo, Ohio, and Erie, Pennsyl
vania (see Map 1). Cleveland and Toledo are the largest ports in terms of tonnage, while Erie, Fairport Harbor, and Huron are the smallest.
Cleveland. The Port of Cleveland is primarily a bulk cargo port, although in recent years the proportion of general cargo has increased. Iron ore, stone, limestone, and sand and gravel are the major bulk commodities shipped through the Port of Cleveland. All of these bulk goods, except stone, are imported from other ports on the Great Lakes. Iron ore is the most important commodity.
The docks for bulk cargo extend down the Cuyahoga River, and most are privately owned by the industries that use these materials. The major hazard in the Port of Cleveland for ships moving bulk goods is the Cuyahoga River, which is only 21 feet deep and has many sharp bends that prohibit the passage of ships more than 600 feet long. A planned bridge widening will permit ships 625 feet long to pass; however, new ore boats under construction that are 800 to 1,000 feet long will not be able to use the Cuyahoga River even with this improvement. If the steel companies anticipate using these longer ore boats, it would seem that some method of unloading the ore at
the lakefront and transporting it to the mills will
have to be devised. (A conveyor system has been
suggested.) The alternate solution of straightening
the Cuyahoga River appears to be virtually impossible.
Cleveland's general cargo docks are on the lakefront east of the Cuyahoga River. Nearly all of the docks for general cargo are owned by the
Cleveland-Cuyahoga County Port Authority and
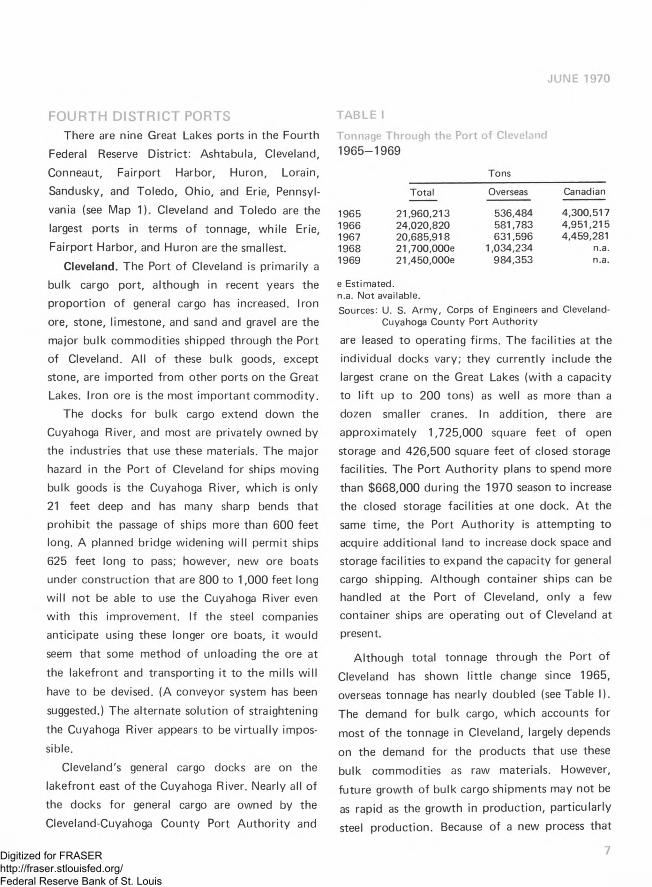
Tonnage Through the Port of Cleveland 1965-1969
TABLE I
Tons
Total Overseas Canadian
1965 21,960,213 536,484 4,300,5171966 24,020,820 581,783 4,951,2151967 20,685,918 631,596 4,459,2811968 21,700,000e 1,034,234 n.a.1969 21,450,000e 984,353 n.a.
e Estimated, n.a. Not available.Sources: U. S. A rm y, Corps of Engineers and Cleveland-
Cuyahoga County Port A u tho rity
are leased to operating firms. The facilities at theindividual docks vary; they currently include thelargest crane on the Great Lakes (with a capacityto lif t up to 200 tons) as well as more than adozen smaller cranes. In addition, there areapproximately 1,725,000 square feet of openstorage and 426,500 square feet of closed storagefacilities. The Port Authority plans to spend morethan $668,000 during the 1970 season to increasethe closed storage facilities at one dock. A t thesame time, the Port Authority is attempting toacquire additional land to increase dock space andstorage facilities to expand the capacity for generalcargo shipping. Although container ships can behandled at the Port of Cleveland, only a fewcontainer ships are operating out of Cleveland atpresent.
Although total tonnage through the Port of Cleveland has shown little change since 1965, overseas tonnage has nearly doubled (see Table I).
The demand for bulk cargo, which accounts for
most of the tonnage in Cleveland, largely depends
on the demand for the products that use these bulk commodities as raw materials. However,
future growth of bulk cargo shipments may not be
as rapid as the growth in production, particularly steel production. Because of a new process that
7Digitized for FRASER http://fraser.stlouisfed.org/ Federal Reserve Bank of St. Louis

ECONOMIC REVIEW
removes much of the extraneous materials from iron ore at the mines, the ore that is shipped is of a higher grade and more steel can be produced per ton of ore.
The Port of Cleveland has actively sought new markets for general cargo in the past few years, and as a result, most of the recent expansion in the volume of shipping at Cleveland has been due to general cargo. The growth in general cargo traffic continued through 1968 but declined in 1969, reflecting the overall decline in Seaway traffic in1969.
As shown in Table II, the major import into the Port of Cleveland in 1969 was iron ore from the Quebec-Labrador range in Canada; an additional small amount of ore came from Liberia and Chile. (However, imported ore accounts for only a small portion of the iron ore coming through the Port of Cleveland; most ore is shipped from the Mesabi range in Minnesota. Data are not shown in Table II.)
The volume of iron and steel products imported during 1969 was 476,000 tons, compared with855,000 tons in 1968. The decline in imports of iron and steel products at the Port of Cleveland reflects the overall decline in imports of such products to the United States. Iron and steel products accounted for 10.3 percent of imports at
the Port in 1969. Six commodity groups accounted for nearly 97 percent of all imports from foreign countries, although more than 100
different commodities were imported through Cleveland.
Exports through Cleveland to foreign countries increased by more than 200 percent between 1968 and 1969, w ith most of the growth coming in iron
and steel products. Exports of iron and steel products rose from 6,000 tons in 1968 to 219,000 tons in 1969. This sharp and sudden increase was caused by a substantial rise in the demand for
these products in western Europe. The other leading exports through the Port of Cleveland were all bulk commodities: crude materials (primarily limestone); coal, coke, and briquets; stone, sand, and gravel; and petroleum and byproducts. In previous years, shipments of bulk commodities to Canada accounted for most of the exports from Cleveland. In 1969, however, shipments of general cargo to western Europe surpassed bulk cargo shipments to Canada in both dollar value and tonnage.
Toledo. The Port of Toledo is located on the Maumee River and has a channel depth of 28 feet, allowing the largest lake boats to be docked. The
Port of Toledo is the largest bulk cargo port on Lake Erie. The major bulk commodities that are moved through this port include coal, iron ore,
agricultural products, and petroleum products, while the general cargoes include iron and steel
products and automobiles.The bulk docks are privately owned and include
specialized docks for coal, petroleum, and grain. The coal docks have automatic loaders that can fill lake boats at the rate of 6,000 tons an hour. Sevenoil companies maintain refineries at the Port of Toledo, where crude oil that is piped in from Texas and Oklahoma oilfields is refined into gasoline and shipped by tanker to other Great Lakes ports. Four large grain elevators at the Port,
as well as back-up elevators w ithin railroad
switching distance, have a capacity of 37.5 million bushels of grain.
Nearly all of the general cargo docks are owned
by the Toledo-Lucas County Port Authority and are leased to private stevedoring companies. Stor
age space, which has been increased by 25 percent
in the past five years, consists of 4.3 million square
feet of open storage space (2.5 times more than in
Cleveland) and 270,000 square feet of closed
8Digitized for FRASER http://fraser.stlouisfed.org/ Federal Reserve Bank of St. Louis

TABLE II
Overseas and Canadian Waterborne TrafficPort of Cleveland1969*
Imports Exports
Percent PercentTons of Total Tons of Total
Iron ore 2,876,080 62.6% Iron and steel primary forms 144,726 31.4%Stone, sand, and gravel 1,003,217 21.8 Crude materials, not elsewhere classified 136,103 29.5Iron and steel plates and sheets 285,368 6.2 Iron and steel plates and sheets 58,237 12.6Iron and steel bars, rods, angles, and shapes 152,672 3.3 Coal, coke, and briquets 30,131 6.5Crude materials, not elsewhere classified 74,679 1.6 Iron and steel hoop and strip 13,365 2.9Paper, paperboard, and wood pulp 56,348 1.2 Stone, sand, and gravel 11,762 2.6A ll other commodities 148,398 3.3 Petroleum and byproducts 9,796 2.1
Animal oils 8,988 1.9TO TAL 4,596,762 100.0% A ll other commodities 47,918 10.5
TO TAL 461,026 100.0%
* First 11 months.
Source: U. S. Department o f Commerce, Bureau of the Census, Foreign Trade Division
Digitized for FRASER http://fraser.stlouisfed.org/ Federal Reserve Bank of St. Louis
ECONOMIC REVIEW
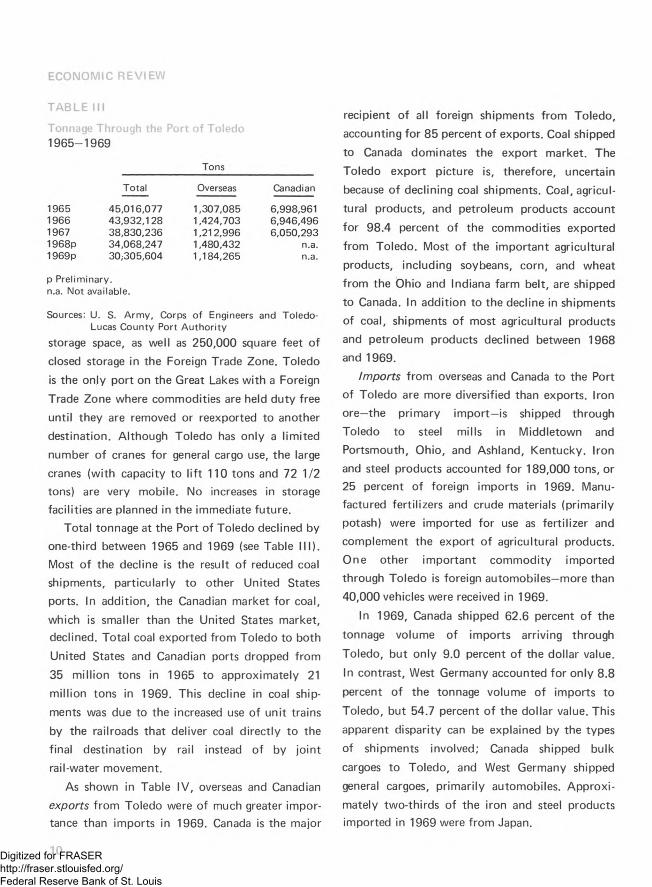
TABLE III
Tonnage Through the Port of Toledo 1965-1969
Tons
Total Overseas Canadian
1965 45,016,077 1,307,085 6,998,9611966 43,932,128 1,424,703 6,946,4961967 38,830,236 1,212,996 6,050,2931968p 34,068,247 1,480,432 n.a.1969p 30,305,604 1,184,265 n.a.
p Preliminary, n.a. Not available.
Sources: U. S. A rm y, Corps o f Engineers and Toledo- Lucas County Port A u tho rity
storage space, as well as 250,000 square feet ofclosed storage in the Foreign Trade Zone. Toledois the only port on the Great Lakes with a Foreign
Trade Zone where commodities are held duty freeuntil they are removed or reexported to anotherdestination. Although Toledo has only a limitednumber of cranes for general cargo use, the large
cranes (with capacity to lif t 110 tons and 72 1/2tons) are very mobile. No increases in storagefacilities are planned in the immediate future.
Total tonnage at the Port of Toledo declined by one-third between 1965 and 1969 (see Table III). Most of the decline is the result of reduced coal shipments, particularly to other United States ports. In addition, the Canadian market for coal,
which is smaller than the United States market, declined. Total coal exported from Toledo to both United States and Canadian ports dropped from 35 million tons in 1965 to approximately 21
million tons in 1969. This decline in coal shipments was due to the increased use of unit trains by the railroads that deliver coal directly to the final destination by rail instead of by joint rail-water movement.
As shown in Table IV, overseas and Canadian exports from Toledo were of much greater importance than imports in 1969. Canada is the major
recipient of all foreign shipments from Toledo, accounting for 85 percent of exports. Coal shipped to Canada dominates the export market. The
Toledo export picture is, therefore, uncertain because of declining coal shipments. Coal, agricultural products, and petroleum products account
for 98.4 percent of the commodities exported
from Toledo. Most of the important agricultural products, including soybeans, corn, and wheat from the Ohio and Indiana farm belt, are shipped to Canada. In addition to the decline in shipments of coal, shipments of most agricultural products and petroleum products declined between 1968 and 1969.
Imports from overseas and Canada to the Port of Toledo are more diversified than exports. Iron ore—the primary import—is shipped through Toledo to steel mills in Middletown and Portsmouth, Ohio, and Ashland, Kentucky. Iron and steel products accounted for 189,000 tons, or 25 percent of foreign imports in 1969. Manufactured fertilizers and crude materials (primarily potash) were imported for use as fertilizer and complement the export of agricultural products. One other important commodity imported through Toledo is foreign automobiles—more than
40,000 vehicles were received in 1969.
In 1969, Canada shipped 62.6 percent of the
tonnage volume of imports arriving through
Toledo, but only 9.0 percent of the dollar value.
In contrast, West Germany accounted for only 8.8
percent of the tonnage volume of imports to
Toledo, but 54.7 percent of the dollar value. This apparent disparity can be explained by the types
of shipments involved; Canada shipped bulk
cargoes to Toledo, and West Germany shipped general cargoes, primarily automobiles. Approximately two-thirds of the iron and steel products imported in 1969 were from Japan.
10Digitized for FRASER http://fraser.stlouisfed.org/ Federal Reserve Bank of St. Louis
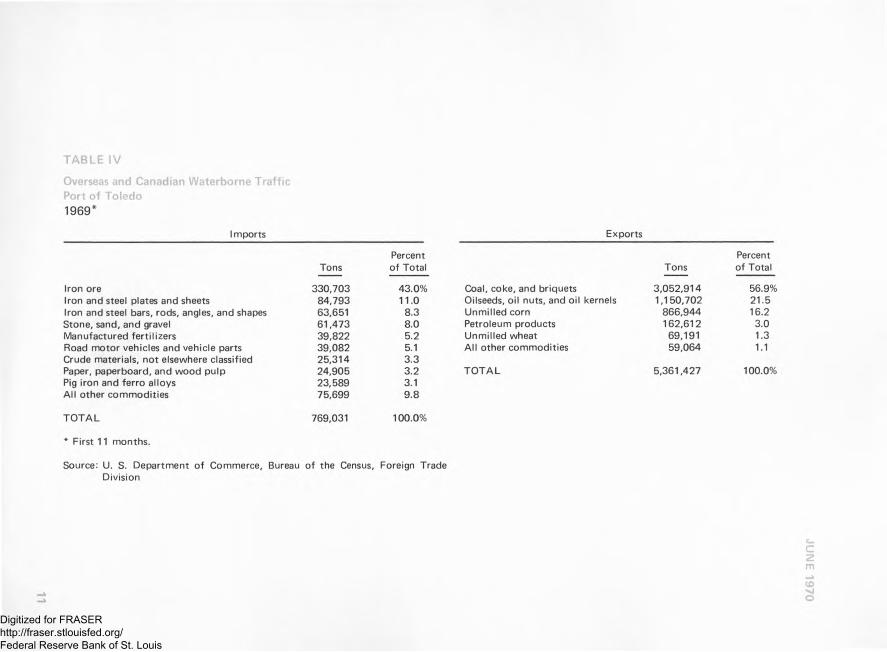
TABLE IV
Overseas and Canadian Waterborne TrafficPort of Toledo1969*
Imports
PercentTons o f Total
Iron ore 330,703 43.0%Iron and steel plates and sheets 84,793 11.0Iron and steel bars, rods, angles, and shapes 63,651 8.3Stone, sand, and gravel 61,473 8.0Manufactured fertilizers 39,822 5.2Road m otor vehicles and vehicle parts 39,082 5.1Crude materials, not elsewhere classified 25,314 3.3Paper, paperboard, and wood pulp 24,905 3.2Pig iron and ferro alloys 23,589 3.1A ll other commodities 75,699 9.8
TO TAL 769,031 100.0%
* First 11 months.
Source: U. S. Department o f Commerce, Bureau o f the Census, Foreign Trade Division
Exports
PercentTons of Total
Coal, coke, and briquets 3,052,914 56.9%Oilseeds, oil nuts, and oil kernels 1,150,702 21.5Unmilled corn 866,944 16.2Petroleum products 162,612 3.0Unmilled wheat 69,191 1.3All other commodities 59,064 1.1
TO TA L 5,361,427 100.0%
Digitized for FRASER http://fraser.stlouisfed.org/ Federal Reserve Bank of St. Louis
ECONOMIC REVIEW
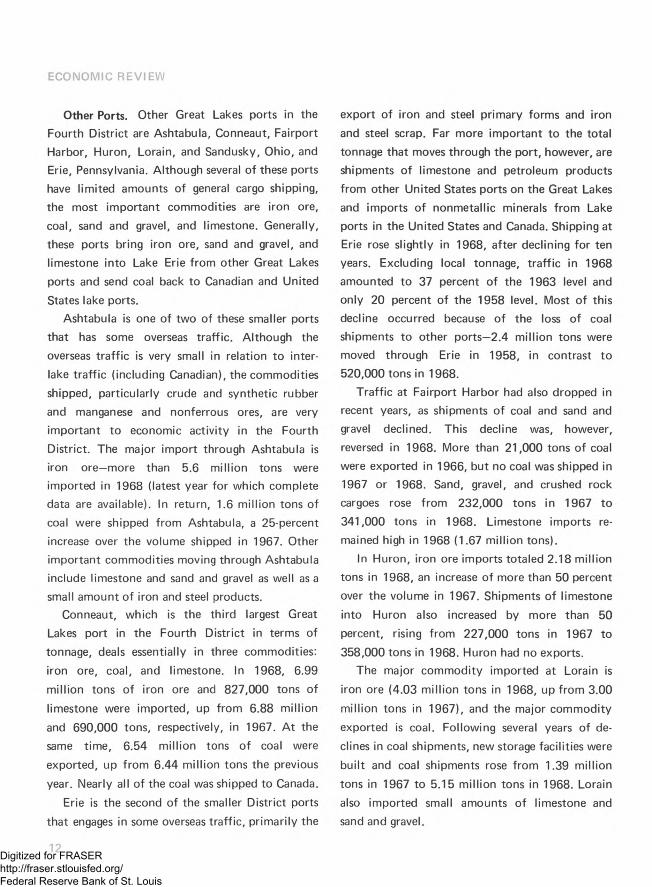
Other Ports. Other Great Lakes ports in the Fourth District are Ashtabula, Conneaut, Fairport Harbor, Huron, Lorain, and Sandusky, Ohio, and Erie, Pennsylvania. Although several of these ports have limited amounts of general cargo shipping, the most important commodities are iron ore, coal, sand and gravel, and limestone. Generally, these ports bring iron ore, sand and gravel, and limestone into Lake Erie from other Great Lakes ports and send coal back to Canadian and United
States lake ports.Ashtabula is one of two of these smaller ports
that has some overseas traffic. Although the overseas traffic is very small in relation to inter
lake traffic (including Canadian), the commodities shipped, particularly crude and synthetic rubber and manganese and nonferrous ores, are very important to economic activity in the Fourth District. The major import through Ashtabula is iron ore—more than 5.6 million tons were imported in 1968 (latest year for which complete data are available). In return, 1.6 million tons of
coal were shipped from Ashtabula, a 25-percent increase over the volume shipped in 1967. Other important commodities moving through Ashtabula include limestone and sand and gravel as well as a
small amount of iron and steel products.Conneaut, which is the third largest Great
Lakes port in the Fourth District in terms of tonnage, deals essentially in three commodities:
iron ore, coal, and limestone. In 1968, 6.99
million tons of iron ore and 827,000 tons of
limestone were imported, up from 6.88 million and 690,000 tons, respectively, in 1967. A t the same time, 6.54 million tons of coal were
exported, up from 6.44 million tons the previous
year. Nearly all of the coal was shipped to Canada.
Erie is the second of the smaller District ports
that engages in some overseas traffic, primarily the
12
export of iron and steel primary forms and iron and steel scrap. Far more important to the total
tonnage that moves through the port, however, are shipments of limestone and petroleum products from other United States ports on the Great Lakes and imports of nonmetallic minerals from Lake ports in the United States and Canada. Shipping at Erie rose slightly in 1968, after declining for ten years. Excluding local tonnage, traffic in 1968 amounted to 37 percent of the 1963 level and only 20 percent of the 1958 level. Most of this decline occurred because of the loss of coal shipments to other ports—2.4 million tons were moved through Erie in 1958, in contrast to520.000 tons in 1968.
Traffic at Fairport Harbor had also dropped in recent years, as shipments of coal and sand and gravel declined. This decline was, however,
reversed in 1968. More than 21,000 tons of coal were exported in 1966, but no coal was shipped in 1967 or 1968. Sand, gravel, and crushed rock cargoes rose from 232,000 tons in 1967 to341.000 tons in 1968. Limestone imports remained high in 1968 (1.67 million tons).
In Huron, iron ore imports totaled 2.18 million tons in 1968, an increase of more than 50 percent over the volume in 1967. Shipments of limestone
into Huron also increased by more than 50
percent, rising from 227,000 tons in 1967 to
358.000 tons in 1968. Huron had no exports.The major commodity imported at Lorain is
iron ore (4.03 million tons in 1968, up from 3.00
million tons in 1967), and the major commodity exported is coal. Following several years of de
clines in coal shipments, new storage facilities were
built and coal shipments rose from 1.39 million
tons in 1967 to 5.15 million tons in 1968. Lorain also imported small amounts of limestone and sand and gravel.
Digitized for FRASER http://fraser.stlouisfed.org/ Federal Reserve Bank of St. Louis
JUNE 1970
Sandusky exports coal to ports in Canada and the United States and imports some sand and gravel. Coal exports rose from 5.70 million tons in 1967 to 6.83 million tons in 1968. Only 11,000 tons of sand and gravel were received in 1968, down from 82,000 tons in 1967.
Five of these seven small ports suffered declines in traffic between 1966 and 1967, but all had an increase in traffic between 1967 and 1968. Increased coal traffic contributed to the gains in traffic in 1968. Most of these small ports installed special loading devices and increased their storage space. As a result, the railroads could bring coal in throughout the winter for shipment during the summer to Canada. Surprisingly, the unit train has
not been detrimental to these ports, because unit trains can also ship coal to the ports. Toledo is the only port on Lake Erie that is losing large amounts of coal traffic. These smaller ports are very dependent upon coal traffic, and any shift in the method of shipping would have an important impact on the volume of traffic through these ports.
FACTORS INFLUENCING THE SEAWAYFour factors have a major influence on traffic
on the St. Lawrence Seaway: (1) the age of the boats that are used; (2) competing forms of transportation; (3) the competition offered by other ports; and (4) a new form of ocean shipping
(containers) that the Seaway ports have not been able to utilize effectively. A brief look at these
factors may help to clarify some unresolved
questions.
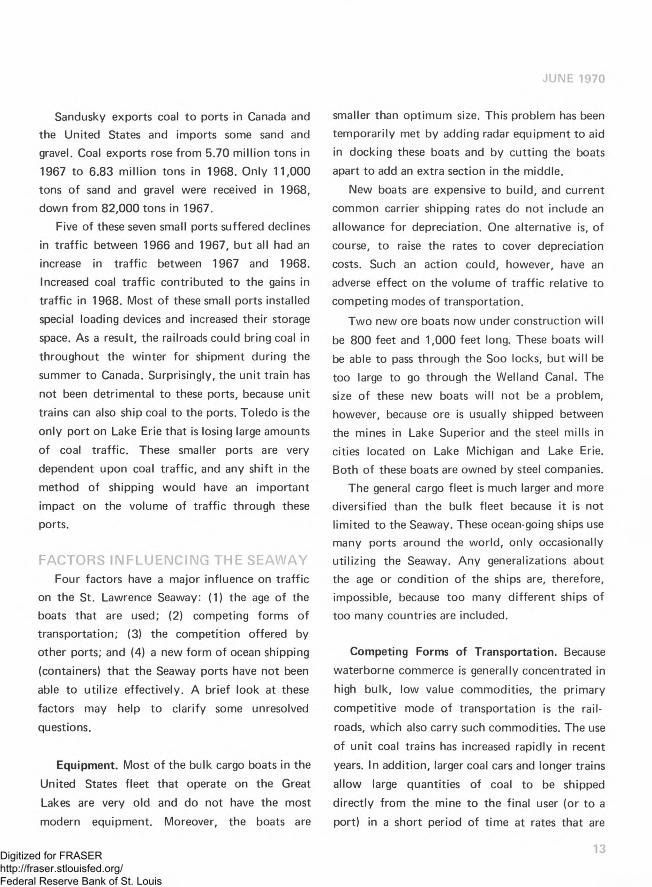
Equipment. Most of the bulk cargo boats in the
United States fleet that operate on the Great Lakes are very old and do not have the most
modern equipment. Moreover, the boats are
smaller than optimum size. This problem has been temporarily met by adding radar equipment to aid in docking these boats and by cutting the boats
apart to add an extra section in the middle.New boats are expensive to build, and current
common carrier shipping rates do not include an allowance for depreciation. One alternative is, of course, to raise the rates to cover depreciation costs. Such an action could, however, have an adverse effect on the volume of traffic relative to competing modes of transportation.
Two new ore boats now under construction will
be 800 feet and 1,000 feet long. These boats will be able to pass through the Soo locks, but w ill be too large to go through the Welland Canal. The size of these new boats will not be a problem, however, because ore is usually shipped between the mines in Lake Superior and the steel mills in cities located on Lake Michigan and Lake Erie. Both of these boats are owned by steel companies.
The general cargo fleet is much larger and more diversified than the bulk fleet because it is not limited to the Seaway. These ocean-going ships use many ports around the world, only occasionally utilizing the Seaway. Any generalizations about the age or condition of the ships are, therefore, impossible, because too many different ships of too many countries are included.
Competing Forms of Transportation. Because
waterborne commerce is generally concentrated in high bulk, low value commodities, the primary
competitive mode of transportation is the rail
roads, which also carry such commodities. The use
of unit coal trains has increased rapidly in recent
years. In addition, larger coal cars and longer trains
allow large quantities of coal to be shipped
directly from the mine to the final user (or to a
port) in a short period of time at rates that are
13Digitized for FRASER http://fraser.stlouisfed.org/ Federal Reserve Bank of St. Louis

ECONOMIC REVIEW
competitive with jo in t rail-water costs. Because shippers have no reason to prefer a specific port or mode of transportation and because the railroads usually provide the coal loading facilities at the docks, the railroads generally determine which port to use in jo in t rail-water movement of coal.
Like coal, grain is often hauled several hundred miles to a lake port for shipment. Most grain shipped through the Great Lakes ports is exported to foreign ports. A large amount of the grain for domestic users is already being moved by railroads, and the use of unit trains to move grain to East Coast and Gulf ports is increasing.
The other major bulk commodities are primarily shipped by water with little jo in t rail-water movement. A t present, it does not appear that the use of unit trains for other bulk commodities w ill
have a substantial effect on Seaway traffic. Toledo and Chicago would be affected most in terms of tonnage if the use of unit coal and grain trains were to continue to increase. However, the
smaller, less diversified ports in the Fourth District could feel the relative loss more sharply, particu- larly with respect to coal shipments.
Other Ports. There are two major influences on the competitive position of the Seaway relative to other major ports in the United States. In view of the distances involved, it would seem that most of
more complete discussion o f regulatory decisions and regulations on rate structure is beyond the scope o f this
article.
Preliminary data indicate that coal shipped out o f Toledo dropped from 24 m illion tons in 1968 to 21 m illion tons in 1969; in Lorain, tonnage dropped from 5.1 m illion tons in 1968 to 3.3 m illion tons in 1969; but in Ashtabula, tonnage rose from 1.6 m illion tons to 3.4 m illion tons in 1969. Other coal shipping ports showed little change.
the bulk and general cargo originating in the region
supporting the Seaway could be shipped at the lowest cost via the Seaway. There are, however,
other factors that must be considered, such as the pricing practices of other competing forms of transportation. Common carrier rates are regulated, and it is possible that other common carriers may be able to charge lower rates to other ports because of certain economies of scale.
The second influence on the competitive position of the Seaway is the length of the shipping season on the St. Lawrence Seaway. The shipping season extends roughly from the first of April until the middle of December, depending on weather conditions. Therefore, customers who normally use the Seaway must either anticipate their off-season needs and stockpile goods during the season or turn to alternative modes of transportation during the winter. The short shipping season discourages potential shippers who would prefer to use one means of transportation year- round. Although there have been proposals to extend the season by two to six weeks through the increased use of icebreakers, the St. Lawrence Seaway Authority has not indicated whether such a plan w ill take effect in the near future.
Another factor that is discouraging to Seaway
shippers, particularly general cargo shippers, is the
irregularity of ship arrivals. A ship w ill not stop at
a lake port unless there is sufficient cargo to
warrant the expense; therefore, general cargo destined for the Seaway may have to wait several weeks at the dock before it is loaded on a ship bound for the correct destination. By sending
cargo to an East Coast or Gulf port w ith ships that stop regularly, a shipper is more assured of quicker overseas delivery. A t the same time, ocean ships are always available because these ports are open year-round.
14Digitized for FRASER http://fraser.stlouisfed.org/ Federal Reserve Bank of St. Louis
JUNE 1970
Container Competition. One of the most important trends in transportation in the past decade has been the growing use o f container shipping. Containers simplify handling procedures at the initial loading point, at the docks, and at the final destination by requiring only one standard size container to be loaded instead of many smaller
packages. General cargo has historically been more d ifficu lt to load than bulk cargo, because it is packaged in many different sizes and shapes. International general cargo shipping is becoming increasingly containerized, as specialized ships are
built to hold containers and specialized docks are constructed to provide storage space.
In the United States, container shipping is used primarily on the East and West Coasts, w ith very little container traffic on the St. Lawrence Seaway. Two reasons for the limited use of containers on the Seaway are the number of ports on the Seaway and the relatively small volume of general cargo shipped. The most expensive part of water shipping is docking the ships; therefore, stopping at many ports to load containers is not economically feasible. A t present, no Seaway port generates enough container traffic to fill a container ship. One transportation expert has, however, suggested that a barge that stopped at many ports and took containers to one central point, perhaps Montreal, would increase the economic feasibility, and as a result lead to increased use of containers on the Seaway.7 The relatively small volume of general cargo shipping, compared with bulk cargo, however, would seem to impede initiation of this service.
7 Lecture by Carl Snavely, Project Director o f Transportation Studies, EBS Management Consultants, Inc., April24, 1969.
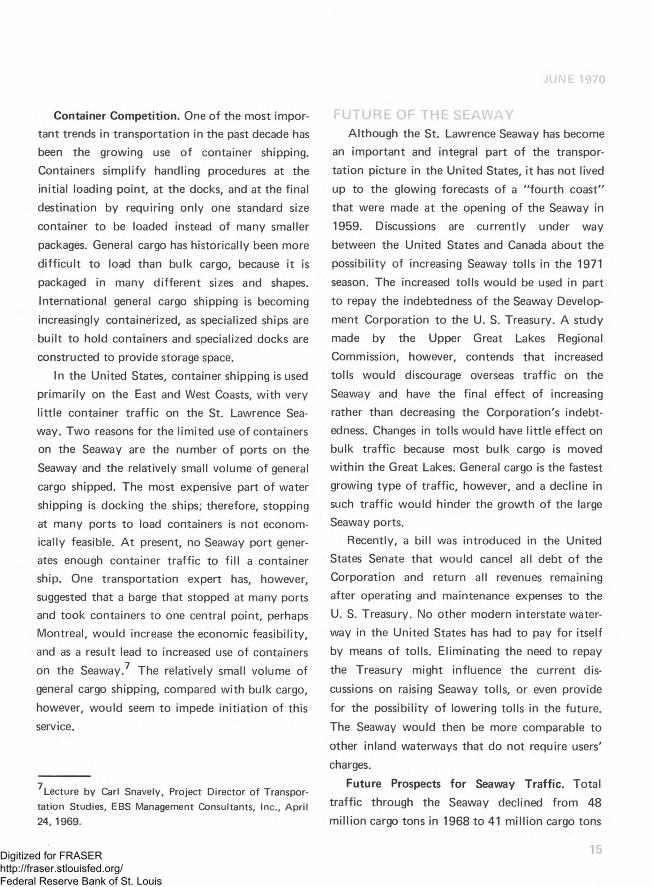
FUTURE OF THE SEAWAYAlthough the St. Lawrence Seaway has become
an important and integral part of the transportation picture in the United States, it has not lived up to the glowing forecasts of a "fourth coast" that were made at the opening of the Seaway in 1959. Discussions are currently under way between the United States and Canada about the possibility of increasing Seaway tolls in the 1971 season. The increased tolls would be used in part to repay the indebtedness of the Seaway Development Corporation to the U. S. Treasury. A study made by the Upper Great Lakes Regional Commission, however, contends that increased tolls would discourage overseas traffic on the Seaway and have the final effect of increasing rather than decreasing the Corporation's indebtedness. Changes in tolls would have little effect on bulk traffic because most bulk cargo is moved within the Great Lakes. General cargo is the fastest growing type of traffic, however, and a decline in such traffic would hinder the growth of the large Seaway ports.
Recently, a bill was introduced in the United States Senate that would cancel all debt of the Corporation and return all revenues remaining after operating and maintenance expenses to the U. S. Treasury. No other modern interstate waterway in the United States has had to pay for itself by means of tolls. Eliminating the need to repay
the Treasury might influence the current dis
cussions on raising Seaway tolls, or even provide
for the possibility of lowering tolls in the future.
The Seaway would then be more comparable to
other inland waterways that do not require users' charges.
Future Prospects for Seaway Traffic. Total traffic through the Seaway declined from 48 million cargo tons in 1968 to 41 million cargo tons
15Digitized for FRASER http://fraser.stlouisfed.org/ Federal Reserve Bank of St. Louis

ECONOMIC REVIEW
in 1969, a drop o f 14.5 percent.8 A large share of the decline was caused by a four-month strike of
iron ore workers in Labrador that limited shipments of this commodity. More importantly, overseas traffic through the Montreal-Lake Ontario section declined by 3.3 percent to nearly 15 million tons in 1969.9 These losses were reflected in lessened activity at the Fourth District ports. Although Lake Superior iron ore shipments counteracted most of the losses from Labrador and iron and steel exports rose last season, total traffic dropped.
The Lake Erie ports with large trade in coal may be adversely affected if unit train usage increases. Because the coal, limestone, and iron ore traffic has traditionally helped to subsidize each other by providing complementary backhaul
g
Charles F. Davis, “ Cargo Moved Through Seaway Declines in 1969," Journal o f Commerce, April 14, 1970.
9lbid.
traffic, the loss of coal traffic could force an increase in rates on iron ore and limestone movements. However, because water transport is the least expensive way of shipping these commodities, a further loss of traffic in these goods is not expected.
A recent study indicated that physical improve
ments to the Seaway would not attract new shippers; however, a longer shipping season couldincrease tonnage because present shippers could
1 0use the Seaway for a longer period each year.
The growth of the general economy in the regions served by the Seaway could also have a positive effect on traffic. Although the future of the St. Lawrence Seaway is somewhat uncertain at present, several very important decisions that w ill apparently be made within the next six months, particularly concerning tolls, could exert a strong influence on the future growth of the Seaway.
10EBS Management Consultants, Inc., A n Economic Analysis o f Improvement Alternatives to the St. Lawrence Seaway System, Washington, D. C., 1969.
16Digitized for FRASER http://fraser.stlouisfed.org/ Federal Reserve Bank of St. Louis

JUNE 1970
CA P I T A L S P E N D I N G IN M A J O R M E T R O P O L I T A N
A R E A S O F THE F O U R T H DISTRICT
The most recent semiannual survey of capital spending plans of manufacturing and selected other business concerns in the Cleveland, Pittsburgh, and Cincinnati metropolitan areas that was conducted in the spring of 1970 by the FederalReserve Bank of Cleveland showed different
1
patterns of spending among the three areas. In
the Cleveland and Cincinnati areas, spending for new plant and equipment by manufacturing firms in 1970 is expected to be less than actual outlays in 1969, while in the Pittsburgh area such spending is expected to exceed the actual level of spending in 1969. For the Cincinnati area, the overall results of the most recent survey confirm the findings of the fall 1969 survey. In the case of the Cleveland and Pittsburgh areas, however, the latest survey revealed that spending plans have been revised since the fall of 1969.
CLEVELAND AREAMore than one-half of the manufacturing con
cerns that participated in the spring survey of capital spending in the four-county Cleveland metropolitan area currently plan to spend less for
iThe survey in Cincinnati was undertaken w ith the
cooperation o f the Greater Cincinnati Chamber o f Commerce; the Pittsburgh survey was conducted fo r the Federal Reserve Bank o f Cleveland by the University of Pittsburgh.
new plant and equipment in 1970 than they spent in 1969. As a result, capital spending in 1970 by the entire group of manufacturing firms is expected to be 21 percent below the level of
actual spending in 1969 (see Table I). This exceeds the 15-percent reduction in capital spending plans
for 1970 indicated in a similar survey in the fall of
1969. Less than one-half of the firms participating in both surveys actually scaled down their spend
ing plans for 1970 between the two survey dates; however, the downward revisions outweighed the upward revisions.
All but one of the manufacturing industries listed in Table I plan to reduce their capital spending in 1970; reductions are greater among the durable goods manufacturers than among the nondurable goods manufacturers. Firms in the electrical machinery industry, the sole exception to the general pattern of reductions in Cleveland, are planning to increase capital spending by a small margin. The substantial cuts planned in the primary metal and transportation equipment industries—the two industries which account for
well over one-half of the capital spending by all
manufacturers in the Cleveland area—were major
factors in determining the size of the reduction in
planned capital expenditures for both the durable goods group and for all manufacturing industries
combined.
17Digitized for FRASER http://fraser.stlouisfed.org/ Federal Reserve Bank of St. Louis

ECONOMIC REVIEW
TABLE I
Capital Spending by Cleveland Area Firms (Spring 1970 Survey)Year—to—Year Percent Changes
1969 (actual) 1970 (planned)to to
1970 (planned) 1971 (planned)
MANUFACTURING -2 1 % -17%Durable goods* -2 2 -1 7
Primary metals -3 0 -1 1Fabricated
metals -1 7 +21Machinery - 1 4 -3 0Electrical
equipment + 2 - 1 3Transportation
equipment - 2 5 -3 4Nondurable goods* - 1 3 -1 8
Printing andpublishing - 3 6 -3 5
Chemicals - 1 5 - 4Rubber and
plastics -3 0 -1 6PUBLIC U TILIT IES +15 - 4
TO TAL -1 2 % -12%
* Includes smaller industries not listed separately.
Source: Federal Reserve Bank o f Cleveland
An additional 17-percent cut in capital spending is planned by manufacturers in the Cleveland area for 1971, w ith virtually no difference between the durable goods group and the nondurable goods group. As in the case of spending plans for1970, only one industry plans to increase spending
in 1971; namely, fabricated metals. Six of the eight industries listed in the table indicate back-
to-back reductions in total outlays in 1970 and1971. However, individual responses indicate that
consecutive spending cuts for both years are
anticipated by only one out of every six manufacturing firms participating in the survey. One
firm out of every nine plans to increase capital
investment in both 1970 and 1971.In contrast to the spending plans of the
participating manufacturing firms, expected 1970
outlays for plant and equipment by public utilities in the Cleveland area exceed actual 1969 outlays by 15 percent. Furthermore, the planned increase in capital expenditures by the public utilities that was reported in the most recent survey is slightly larger than indicated in the fall 1969 survey. In 1971, however, capital spending by the utilities is expected to fall 4 percent short of the level of such spending in 1970. As a result, there would be a net gain of 11 percent in capital expenditures by the public utilities over the two-year period, reflecting an anticipation of continued increases in demand for the various services of the utilities in the near future.
The survey results also provide some indications of the division of planned capital spending by Cleveland area manufacturing firms and public utilities between structures and equipment and between modernization and expansion. Only 14
percent of the spending planned for 1970 by manufacturers is earmarked for structures, compared with 22 percent in 1969 (see Table II). The cutback in spending for structures had already been indicated in the fall 1969 survey. All durable goods industries listed in the table and all but one of the nondurable goods industries show a smaller share of total spending for structures in 1970 than
in 1969, w ith unusually small shares in the primary metal, fabricated metal, and electrical equipment industries. The exception is the rubber and plastics group, where spending for structures is expected to rise appreciably. Very few individual firms in any industry plan to spend as much as $1 million for structures in 1970. Although neither the number nor the dollar total o f construction
projects of at least $1 million is expected to increase in 1971, the share of spending allocated
for construction in 1971 should increase because of the anticipated reduction in the amount of total
18Digitized for FRASER http://fraser.stlouisfed.org/ Federal Reserve Bank of St. Louis

JUNE 1970
Capital Spending by Cleveland Area Firms (Spring 1970 Survey)Percent Distribution of Total Spending by Type* (Between Structures and Equipment and Between Expansion and Modernization)
TABLE II
Structures! Expansion J
1969 1970 1971 1969 1970 1971
MANUFACTURING 22% 14% 18% 53% 54% 46%Durable goods § 21 12 17 51 52 44
Primary metals Fabricated
9 4 3 73 65 62
metals 52 1 34 14 15 22MachineryElectrical
39 23 29 59 60 44
equipmentTransportation
31 9 10 68 45 35
equipment 23 19 27 23 50 54Nondurable goods §
Printing and28 30 23 59 63 58
publishing 28 25 14 26 50 26Chemicals Rubber and
39 33 29 77 69 57
plastics 11 21 25 28 41 39PUBLIC U T ILIT IES 22 28 30 73 86 81
TO TAL 22% 19% 23% 57% 63% 59%
* Based only upon returns in which these breakdowns were supplied.
t Spending fo r equipment equals 100 percent less the percent shown fo r structures.
J Spending fo r modernization equals 100 percent less the percent shown fo r expansion.
§ Includes smaller industries not listed separately.
Source: Federal Reserve Bank o f Cleveland
capital spending for the year. The public utilities plan to spend a larger share of their to ta l-
increased—investment for structures in 1970 than in 1969 and expect a small further increase in that share in 1971.
More than one-half of the capital spending by
manufacturing firms in the Cleveland area in 1970
w ill be used for expansion of production capacity,
while slightly less than one-half w ill be used to modernize present facilities (see Table II). A l
though those proportions are virtually the same as
they were in 1969, they represent a smaller share for expansion than indicated by the fall 1969 survey. For 1971, the proportions of spending for expansion and for modernization w ill be reversed, w ith the larger share designated for modernization. Public utilities in the Cleveland area also expect a rise in the share of spending for expansion in1970, to be followed by a decline in 1971. In both years, outlays designated for expansion are substantially higher among public utilities than among manufacturing firms.
Firms participating in the spring 1970 survey also provided some judgment about the current adequacy of their production facilities: 66 percent of the responding manufacturing firms reported "adequate” facilities, compared with 60 percent in
the fall 1969 survey. "Less than adequate" capacity was indicated in only 14 percent of the reports, down from 20 percent last fall. This shift appears to be in line with the recent nationwide decline in capacity utilization rates.
Manufacturing concerns that supplied information on methods of financing their capital investments indicated that they expect to finance about 85 percent of their spending in 1970 and 1971 from internal sources. This proportion is the same as for actual spending in 1969, but somewhat less than had been expected for 1970 in the fall1969 survey. About three out of every four firms plan to rely solely on internal sources of funds to finance capital investments in both 1970 and
1971, the same proportion as in 1969.
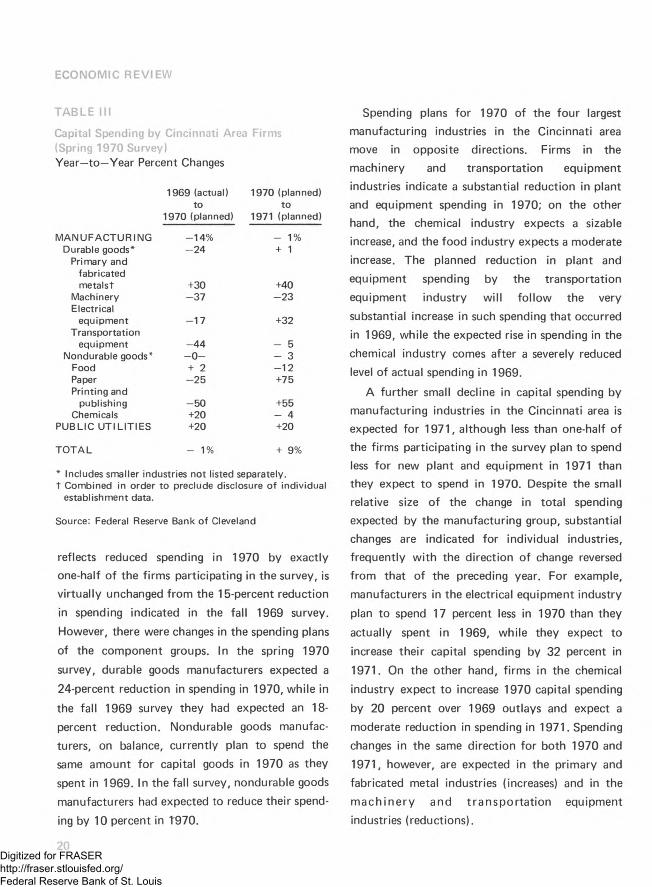
CINCINNATI AREAThe spring 1970 survey indicated that plant and
equipment spending by manufacturing concerns in
the seven-county Cincinnati metropolitan area should be 14 percent lower in 1970 than it was in1969 (see Table III). This overall figure, which
19Digitized for FRASER http://fraser.stlouisfed.org/ Federal Reserve Bank of St. Louis
ECONOMIC REVIEW
TABLE III
Capital Spending by Cincinnati Area Firms (Spring 1970 Survey)Year—to—Year Percent Changes
1969 (actual) 1970 (planned) to to
1970 (planned) 1971 (planned)
M ANUFACTURING -14 % - 1%Durable goods* —24 + 1
Primary and fabricatedm etalst +30 +40
Machinery —37 —23 Electrical
equipment —17 +32 Transportation
equipment —44 — 5Nondurable goods* —0— — 3
Food + 2 -1 2Paper —25 +75 Printing and
publishing —50 +55Chemicals +20 — 4
PUBLIC U T ILIT IES +20 +20
TO TA L - 1% + 9%
* Includes smaller industries not listed separately, t Combined in order to preclude disclosure o f individual
establishment data.
Source: Federal Reserve Bank o f Cleveland
reflects reduced spending in 1970 by exactly one-half of the firms participating in the survey, is virtually unchanged from the 15-percent reduction
in spending indicated in the fall 1969 survey.
However, there were changes in the spending plans
of the component groups. In the spring 1970
survey, durable goods manufacturers expected a
24-percent reduction in spending in 1970, while in
the fall 1969 survey they had expected an 18- percent reduction. Nondurable goods manufacturers, on balance, currently plan to spend the same amount for capital goods in 1970 as they spent in 1969. In the fall survey, nondurable goods manufacturers had expected to reduce their spend
ing by 10 percent in T970.
Spending plans for 1970 of the four largest manufacturing industries in the Cincinnati area move in opposite directions. Firms in the machinery and transportation equipment industries indicate a substantial reduction in plant and equipment spending in 1970; on the other hand, the chemical industry expects a sizable increase, and the food industry expects a moderate increase. The planned reduction in plant and equipment spending by the transportation equipment industry w ill follow the very
substantial increase in such spending that occurred in 1969, while the expected rise in spending in the
chemical industry comes after a severely reduced level of actual spending in 1969.
A further small decline in capital spending by manufacturing industries in the Cincinnati area is expected for 1971, although less than one-half of the firms participating in the survey plan to spend less for new plant and equipment in 1971 than they expect to spend in 1970. Despite the small relative size of the change in total spending expected by the manufacturing group, substantial changes are indicated for individual industries, frequently with the direction of change reversed from that of the preceding year. For example, manufacturers in the electrical equipment industry
plan to spend 17 percent less in 1970 than they
actually spent in 1969, while they expect to
increase their capital spending by 32 percent in
1971. On the other hand, firms in the chemical
industry expect to increase 1970 capital spending
by 20 percent over 1969 outlays and expect a moderate reduction in spending in 1971. Spending changes in the same direction for both 1970 and1971, however, are expected in the primary and
fabricated metal industries (increases) and in the m ach inery and transporta tion equipment
industries (reductions).
20Digitized for FRASER http://fraser.stlouisfed.org/ Federal Reserve Bank of St. Louis
JUNE 1970
The Cincinnati area public utilities, which had expected a small reduction in spending for 1970 at the time of the fall 1969 survey, now plan to spend 20 percent more in 1970 than in 1969 and to increase capital outlays by an additional 20 percent in 1971.
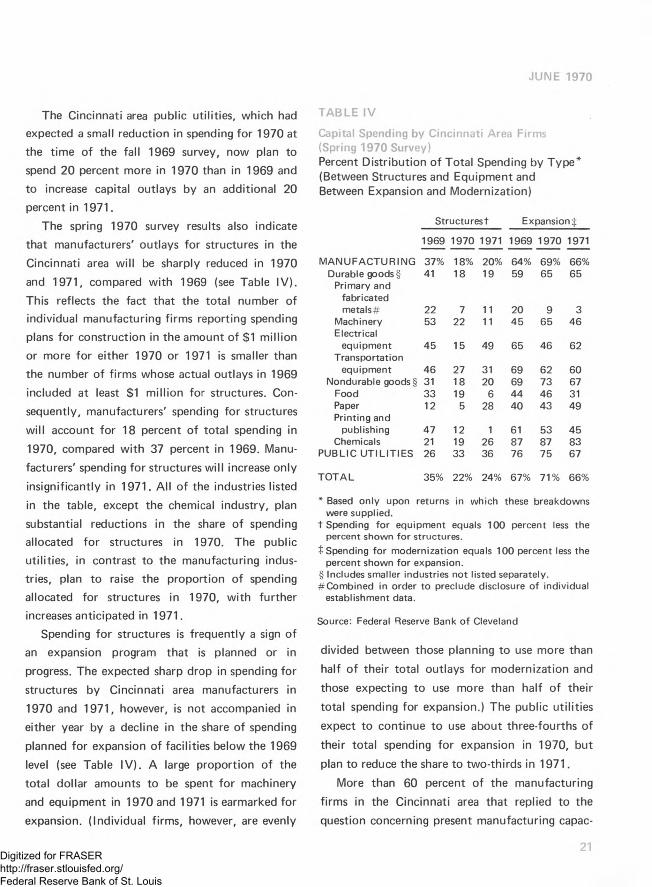
The spring 1970 survey results also indicate that manufacturers' outlays for structures in the Cincinnati area will be sharply reduced in 1970
and 1971, compared with 1969 (see Table IV). This reflects the fact that the total number of individual manufacturing firms reporting spending plans for construction in the amount of $1 million or more for either 1970 or 1971 is smaller than the number of firms whose actual outlays in 1969 included at least $1 million for structures. Consequently, manufacturers' spending for structures w ill account for 18 percent of total spending in
1970, compared w ith 37 percent in 1969. Manufacturers' spending for structures w ill increase only
insignificantly in 1971. All of the industries listed in the table, except the chemical industry, plan substantial reductions in the share of spending allocated for structures in 1970. The public utilities, in contrast to the manufacturing industries, plan to raise the proportion of spending allocated for structures in 1970, with further increases anticipated in 1971.
Spending for structures is frequently a sign of an expansion program that is planned or in progress. The expected sharp drop in spending for
structures by Cincinnati area manufacturers in 1970 and 1971, however, is not accompanied in either year by a decline in the share of spending
planned for expansion of facilities below the 1969 level (see Table IV). A large proportion of the total dollar amounts to be spent for machinery and equipment in 1970 and 1971 is earmarked for
expansion. (Individual firms, however, are evenly
Capital Spending by Cincinnati Area Firms (Spring 1970 Survey)Percent Distribution of Total Spending by Type* (Between Structures and Equipment and Between Expansion and Modernization)
TABLE IV
Structures! Expansion $
1969 1970 1971 1969 1970 1971
M ANUFACTURING 37% 18% 20% 64% 69% 66%Durable goods §
Primary and fabricated
41 18 19 59 65 65
metals# 22 7 11 20 9 3MachineryElectrical
53 22 11 45 65 46
equipmentTransportation
45 15 49 65 46 62
equipment 46 27 31 69 62 60Nondurable goods § 31 18 20 69 73 67
Food 33 19 6 44 46 31PaperPrinting and
12 5 28 40 43 49
publishing 47 12 1 61 53 45Chemicals 21 19 26 87 87 83
PUBLIC U TILIT IES 26 33 36 76 75 67
TO TAL 35% 22% 24% 67% 71% 66%
* Based only upon returns in which these breakdowns were supplied.
t Spending fo r equipment equals 100 percent less the percent shown fo r structures,
t Spending fo r modernization equals 100 percent less the percent shown fo r expansion.
§ Includes smaller industries not listed separately. #Combined in order to preclude disclosure o f individual
establishment data.
Source: Federal Reserve Bank o f Cleveland
divided between those planning to use more than
half of their total outlays for modernization and
those expecting to use more than half of their
total spending for expansion.) The public utilities
expect to continue to use about three-fourths of
their total spending for expansion in 1970, but
plan to reduce the share to two-thirds in 1971.
More than 60 percent of the manufacturing
firms in the Cincinnati area that replied to the question concerning present manufacturing capac
21Digitized for FRASER http://fraser.stlouisfed.org/ Federal Reserve Bank of St. Louis

ECONOMIC REVIEW
ity reported "adequate" facilities, while more than 20 percent considered their facilities "less than adequate." These are virtually the same proportions reported in the fall 1969 survey.
Among manufacturers reporting on methods of financing their capital investments, more than eight out of every ten expect to use only internal sources of funds to finance capital spending in 1970 and 1971, which is slightly more than the proportion of those who actually relied entirely on
internal sources of funds in 1969. Almost 90 percent of the amount that all responding manufacturing firms in the Cincinnati area plan to spend on capital goods in 1970, and an even larger share of the 1971 total, is scheduled to be financed with internally generated funds, compared with just over 80 percent of total spending that was financed from internal sources in 1969. PITTSBURGH AREA
In contrast to firms in the Cleveland and Cincinnati metropolitan areas, manufacturing firms participating in the spring 1970 survey of capital spending in the four-county Pittsburgh metropolitan area expect to spend 4 percent more for new plant and equipment in 1970 than in 1969 (see Table V). Firms in selected nonmanufacturing industries (transportation, public utilities, and
retail trade) plan to spend almost twice as much in
1970 as in 1969. For both the manufacturing and
the nonmanufacturing group, the results of the
spring survey represent an upgrading of spending
plans for 1970 reported in a similar survey
conducted in the fall of 1969. A t that time, surveyed nonmanufacturing firms expected to spend only 5 percent more in 1970 than in 1969, while manufacturing firms anticipated a 6-percent reduction in spending from 1969 to 1970.
Plans for 1971 indicate a sharp reduction in capital spending below the expected level of
22
Capital Spending by Pittsburgh Area Firms (Spring 1970 Survey)Year—to —Year Percent Changes
TABLE V
1969 (actual) 1970 (planned)to to
1970 (planned) 1971 (planned)
M ANUFACTURING + 4% -35%Durable goods* t - 3 7
Stone, clay.and glass +41 -3 9
Primary metals -2 0 -5 2Fabricated
metals +83 -51Machinery - 4 - 1 9Electrical
equipment - 7 +59Nondurable goods* +43 -2 6
Chemicals +88 - 3 3NONMANUFAC-TURING$ +98 -6 4
Public utilities + 8 -1 8
TO TAL +55% -55%
* Includes smaller industries not listed separately, t Less than 1 percent.X Includes data for transportation and retail trade, in
addition to public utilities.
Sources: University o f Pittsburgh and Federal Reserve Bank of Cleveland
spending in 1970. Manufacturing firms in the Pittsburgh area plan to reduce their spending in
1971 by 35 percent, while nonmanufacturing
firms expect to spend 64 percent less. As a result, the amount of spending in 1971 should be
one-fourth lower than the amount actually spent
in 1969 by each of the two groups of firms.
In the manufacturing group, the nondurable
goods industries expect to increase their capital spending by 43 percent in 1970, while firms in the
durable goods industries only plan to match the
amount spent in 1969. There are, however, marked differences among the spending plans of
the component industries. Much of the additional
Digitized for FRASER http://fraser.stlouisfed.org/ Federal Reserve Bank of St. Louis
JUNE 1970
spending by the nondurable goods industries in the Pittsburgh area in 1970 reflects capital investments in the chemical industry, where the level of capital spending is expected to be substantially higher than the severely reduced level of actual spending in 1969. In the durable goods group, the fabricated metal and the stone, clay, and glass industries indicate that spending in 1970 w ill be much higher than in 1969. Those increases will be offset, however, by a sizable reduction in spending in the primary metal industries and by moderate cutbacks in spending planned by firms in the machinery and electrical equipment industries.
In 1971, capital spending is expected to decline by 37 percent in the durable goods industries and by 26 percent in the nondurable goods industries in the Pittsburgh area. Sizable reductions in outlays for new plant and equipment are indicated in all but one of the major industries in both the durable and the nondurable goods sector of
manufacturing. Only the electrical equipment industry indicates increased spending for 1971. One electrical equipment manufacturer's m ultimillion dollar expansion project is expected to more than outweigh spending cuts planned by other firms in the industry. In the primary metal and the machinery industries, reductions in capital outlays are expected in both 1970 and 1971.
Spending plans of nonmanufacturing industries represented in the survey reflect extreme fluc tuations from year to year. The substantial increase
in capital spending that is planned by firms in the
transportation industry2 in 1970 largely accounts
for the near doubling in spending by nonmanu
facturing industries between 1969 and 1970.
However, the public utilities, which account for
2Not shown separately in Table V in order to preclude disclosure.
the largest total amount of new capital investment by any industry in the area, plan to raise their total outlays in 1970 by only 8 percent.
The steep drop in the amount nonmanufacturing firms plan to spend in 1971 again shows the effect of extreme shifts in spending by firms in the transportation industry in the Pittsburgh area. The indicated 64-percent reduction in outlays combines an 18-percent cut in capital spending by the public utilities and almost no anticipated spending by the transportation firms in 1971.
One out of every five dollars that manufacturing industries plan to invest in 1970, and almost the same proportion in 1971, is earmarked for new structures (see Table VI). The increase from the smaller proportion shown for 1969
reflects sizable construction projects scheduled in the fabricated metal and the chemical industries in
1970 and in the electrical equipment industry in1971. Among the nonmanufacturing industries,
the public utilities report that a fairly consistent proportion of total capital spending w ill be used for structures (between one-fourth and one-fifth) in both 1970 and 1971. For the entire nonmanufacturing group, however, the proportion of spending for structures is expected to dip sharply in1970, because only a small portion of the greatly increased amount of total spending planned by the transportation industry in 1970 w ill be used for structures.
Almost 40 percent of expected total capital outlays by manufacturing firms in the Pittsburgh area in 1970 is designated for expansion of present
facilities (see Table VI). This represents a substantial increase in 1970 in the share of spending for expansion that is distributed among most of the manufacturing industries. The machinery and electrical equipment industries are particular
exceptions. Slightly more than one-half of total
23Digitized for FRASER http://fraser.stlouisfed.org/ Federal Reserve Bank of St. Louis
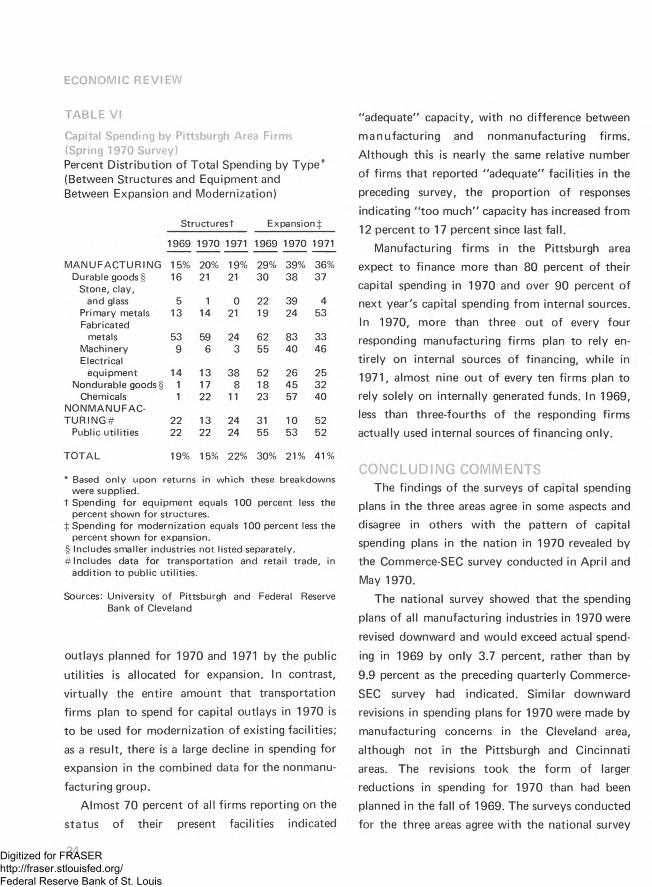
ECONOMIC REVIEW
TABLE VI
Capital Spending by Pittsburgh Area Firms (Spring 1970 Survey)Percent Distribution of Total Spending by Type' (Between Structures and Equipment and Between Expansion and Modernization)
Structurest Expansion^:
1969 1970 1971 1969 1970 1971
M ANUFACTURING 15% 20% 19% 29% 39% 36%Durable goods § 16 21 21 30 38 37
Stone, clay.and glass 5 1 0 22 39 4
Primary metals 13 14 21 19 24 53Fabricated
metals 53 59 24 62 83 33Machinery 9 6 3 55 40 46Electrical
equipment 14 13 38 52 26 25Nondurable goods § 1 17 8 18 45 32
Chemicals 1 22 11 23 57 40NONM ANUFACTU R IN G # 22 13 24 31 10 52
Public utilities 22 22 24 55 53 52
TO TAL 19% 15% 22% 30% 21% 41%
* Based only upon returns in which these breakdownswere supplied.
t Spending fo r equipment equals 100 percent less the percent shown fo r structures.
% Spending for modernization equals 100 percent less the percent shown fo r expansion.
§ Includes smaller industries not listed separately.# Includes data fo r transportation and retail trade, in
addition to public utilities.
Sources: University o f Pittsburgh and Federal Reserve Bank o f Cleveland
outlays planned for 1970 and 1971 by the public utilities is allocated for expansion. In contrast, virtually the entire amount that transportation firms plan to spend for capital outlays in 1970 is to be used for modernization of existing facilities; as a result, there is a large decline in spending for expansion in the combined data for the nonmanu
facturing group.Almost 70 percent of all firms reporting on the
status of their present facilities indicated
"adequate" capacity, w ith no difference between manufacturing and nonmanufacturing firms. Although this is nearly the same relative number
of firms that reported "adequate" facilities in the preceding survey, the proportion of responses
indicating "too much" capacity has increased from12 percent to 17 percent since last fall.
Manufacturing firms in the Pittsburgh area expect to finance more than 80 percent of their capital spending in 1970 and over 90 percent of next year's capital spending from internal sources. In 1970, more than three out of every four responding manufacturing firms plan to rely entirely on internal sources of financing, while in1971, almost nine out of every ten firms plan to rely solely on internally generated funds. In 1969, less than three-fourths of the responding firms actually used internal sources of financing only.
CONCLUDING COMMENTSThe findings of the surveys of capital spending
plans in the three areas agree in some aspects and disagree in others w ith the pattern of capital spending plans in the nation in 1970 revealed by the Commerce-SEC survey conducted in April and May 1970.
The national survey showed that the spending
plans of all manufacturing industries in 1970 were
revised downward and would exceed actual spend
ing in 1969 by only 3.7 percent, rather than by
9.9 percent as the preceding quarterly Commerce-
SEC survey had indicated. Similar downward
revisions in spending plans for 1970 were made by manufacturing concerns in the Cleveland area,
although not in the Pittsburgh and Cincinnati areas. The revisions took the form of larger reductions in spending for 1970 than had been planned in the fall of 1969. The surveys conducted for the three areas agree with the national survey
24Digitized for FRASER http://fraser.stlouisfed.org/ Federal Reserve Bank of St. Louis
JUNE 1970
in that they anticipate further sizable increases in capital investments by the public utilities in 1971.
On the other hand, the area surveys depart from the national pattern by indicating a decline
in capital outlays of manufacturing industries for1970 in two of the three areas, while the national survey expects a continued, if small, increase in such investments in the nation in 1970.
SPECIAL ANNOUNCEMENT
A lim ited number of reprints are available o f the three-part article "The Eurodollar Market," which appeared in the March, April, and May 1970 issues of Economic Review. Requests fo r copies should be directed to the Research Department, Federal Reserve Bank of Cleveland, P. O. Box 6387, Cleveland, Ohio 44101.
25Digitized for FRASER http://fraser.stlouisfed.org/ Federal Reserve Bank of St. Louis

Digitized for FRASER http://fraser.stlouisfed.org/ Federal Reserve Bank of St. Louis
R E C E N T L Y P U B L I S H E D E C O N O M I C C O M M E N T A R I E S
O F T H E F E D E R A L R E S E R V E B A N K O F C L E V E L A N D
"Unemployment on the Rise"
May 25, 1970
JUNE 1970
"A Re-Examination of the Outlook for 1970"
June 1, 1970
"Dimensions of Recent Economic Activity"
June 8, 1970
"Whither Bank Commercial Paper?"
June 15, 1970
"Bank Credit — 1970"
June 22, 1970
Economic Commentary is published weekly and is available w ithout charge. Requests to be added to
the mailing list or for additional copies of any issue should be sent to the Research Department,
Federal Reserve Bank of Cleveland, P. O. Box 6387, Cleveland, Ohio 44101.
27Digitized for FRASER http://fraser.stlouisfed.org/ Federal Reserve Bank of St. Louis
Related Documents